UNITED STATES
SECURITIES AND EXCHANGE COMMISSION
Washington, D.C. 20549
FORM N-CSR
CERTIFIED SHAREHOLDER REPORT OF REGISTERED MANAGEMENT INVESTMENT COMPANIES
Investment Company Act file number
Delaware Group® Equity Funds II
(Exact name of registrant as specified in charter)
610 Market Street
Philadelphia, PA 19106
Registrant's telephone number, including area code:
Date of reporting period:
Item 1. Report to Stockholders.
(a) The registrant’s annual report transmitted to shareholders pursuant to Rule 30e-1 under the Investment Company Act of 1940 is as follows:
Macquarie Value® Fund
(formerly, Delaware Value® Fund)
Class A : DDVAX
Annual shareholder report | November 30, 2024
This annual shareholder report contains important information about Macquarie Value® Fund (Fund) for the period of December 1, 2023, to November 30, 2024. You can find additional information about the Fund at macquarie.com/mam/literature. You can also request this information by contacting us at 800 523-1918, weekdays from 8:30am to 6:00pm ET.
This report describes changes to the Fund that occurred during the reporting period except as otherwise noted in the Material Fund changes section.
What were the Fund's costs for the last 12 months ?
(Based on a hypothetical $10,000 investment)
| Class | Costs of a $10,000 investment | Costs paid as a percentage of a $10,000 investment |
| Class A | $108 | 0.98% |
Management's discussion of Fund performance
Performance highlights
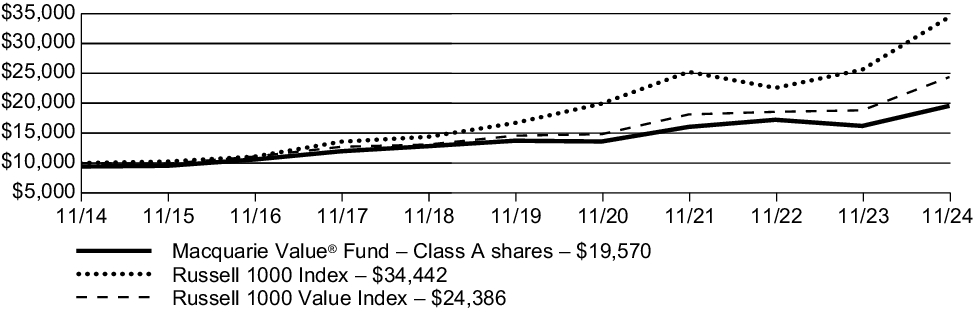
Macquarie Value® Fund (Class A) returned 20.77% (excluding sales charge) for the 12 months ended November 30, 2024. During the same period, the Russell 1000® Index, the Fund's broad-based securities market index, returned 34.40%, while the Russell 1000® Value Index, the Fund's narrowly based securities market index, returned 29.56%.
Top contributors to performance:
Holdings in the information technology sector outperformed, specifically positions in the software and communications equipment industries.
In the real estate sector, the Fund’s residential real estate investment trust (REIT) holding outperformed the sector more broadly, benefiting from ongoing demand for rental apartments.
Strong stock selection in addition to an underweight allocation in the materials sector contributed to performance over the reporting period.
The Fund’s underweight allocation in the energy sector compared to its narrowly based index also contributed to performance over the reporting period.
Top detractors from performance:
Stock selection was the lead detractor from the Fund’s performance over the 12-month reporting period.
In the consumer staples sector, the Fund’s holdings underperformed those in the Fund’s narrowly based index in the food products and consumer staples distribution & retail industries.
Holdings in the industrials sector underperformed the sector more broadly, especially those with defense industry exposure, which tend to have lower economic sensitivity.
Stock selection in the healthcare sector was weak as holdings in the healthcare equipment & supplies and pharmaceutical industries lagged the stronger returns of those in the Fund’s narrowly based index.
Frank Russell Company is the source and owner of the trademarks, service marks and copyrights related to the Russell Indexes. Russell® is a trademark of Frank Russell Company.
Fund performance
The following graph compares the initial and subsequent account values at the end of each of the most recently completed 10 fiscal years of the Class. It also assumes a $10,000 initial investment at the beginning of the first full fiscal year in a broad-based securities market index and an additional narrowly based securities market index for the same period and the deduction of the maximum applicable sales charge for Class A shares.
Growth of $10,000 investment
For the period November 30, 2014, through November 30, 2024
| Average annual total returns (as of November 30, 2024) | 1 year | 5 year | 10 year |
| Macquarie Value® Fund (Class A) – including sales charge | 13.84 | % | 6.08 | % | 6.94 | % |
| Macquarie Value® Fund (Class A) – excluding sales charge | 20.77 | % | 7.34 | % | 7.58 | % |
| Russell 1000 Index | 34.40 | % | 15.58 | % | 13.16 | % |
| Russell 1000 Value Index | 29.56 | % | 10.84 | % | 9.32 | % |
Keep in mind that the Fund's past performance is not a good predictor of how the Fund will perform in the future.
Visit macquarie.com/mam/performance for the most recent performance information. The graph and table do not reflect the deduction of taxes that a shareholder would pay on Fund distributions or redemption of Fund shares. Performance results reflect any expense caps in effect during these periods. All results shown assume reinvestment of distributions.
In connection with new regulatory requirements, effective the date of this report, the Fund changed its broad-based securities market benchmark index to the Russell 1000 Index. Although the Russell 1000 Index can be considered broadly representative of the overall securities market applicable to the Fund, the Fund will continue to show the performance of the Russell 1000 Value Index for comparative purposes because Delaware Management Company, the Fund's manager, believes it is more representative of the Fund's investment universe.
Fund statistics (as of November 30, 2024)
| Fund net assets | $3,369,288,370 |
| Total number of portfolio holdings | 33 |
| Total advisory fees paid | $20,821,474 |
| Portfolio turnover rate | 31% |
Fund holdings (as of November 30, 2024)
The tables below show the investment makeup of the Fund, with each category representing a percentage of the total net assets of the Fund.
| Financials | 20.34% |
| Information Technology | 19.09% |
| Healthcare | 15.27% |
| Industrials | 13.30% |
| Consumer Discretionary | 7.25% |
| Communication Services | 5.63% |
| Energy | 5.28% |
| Real Estate | 3.48% |
| Materials | 3.38% |
| Consumer Staples | 3.37% |
| Utilities | 3.32% |
| |
| |
| |
| Cisco Systems | 4.03% |
| Travelers | 4.01% |
| Oracle | 3.98% |
| US Bancorp | 3.94% |
| Motorola Solutions | 3.93% |
| Allstate | 3.86% |
| Honeywell International | 3.67% |
| Dover | 3.65% |
| Teledyne Technologies | 3.62% |
| Lowe's | 3.61% |
On December 31, 2024, Delaware Value® Fund will be renamed Macquarie Value® Fund.
This is a summary of certain changes to the Fund that occurred during the reporting period except as otherwise noted. For more complete information, you may review the Fund's next prospectus, which we expect to be available by April 1, 2025, at macquarie.com/mam/literature or upon request at 800 523-1918, weekdays from 8:30am to 6:00pm ET.
Availability of additional information
You can access additional information about the Fund, such as the prospectus, financial information, holdings, and proxy voting information, at macquarie.com/mam/literature. You can also request this information by contacting us at 800 523-1918, weekdays from 8:30am to 6:00pm ET, or by contacting your financial intermediary.
Householding
In order to reduce expenses, we will deliver a single copy of prospectuses, proxies, financial reports, and other communication to shareholders with the same residential address, provided they have the same last name or we reasonably believe them to be members of the same family. Unless we are notified otherwise, we will continue to send recipients only one copy of these materials for as long as they remain shareholders of the Fund. If you would like to receive individual mailings, please call 800 523-1918 or contact your financial intermediary. Your instructions will typically be effective within 30 days after we receive them from you or your financial intermediary. If you choose, you may receive these documents through electronic delivery.
For more information, please scan the QR code at left to navigate to additional hosted material at macquarie.com/mam/literature.
Macquarie Value® Fund
(formerly, Delaware Value® Fund)
Class C : DDVCX
Annual shareholder report | November 30, 2024
This annual shareholder report contains important information about Macquarie Value® Fund (Fund) for the period of December 1, 2023, to November 30, 2024. You can find additional information about the Fund at macquarie.com/mam/literature. You can also request this information by contacting us at 800 523-1918, weekdays from 8:30am to 6:00pm ET.
This report describes changes to the Fund that occurred during the reporting period except as otherwise noted in the Material Fund changes section.
What were the Fund's costs for the last 12 months ?
(Based on a hypothetical $10,000 investment)
| Class | Costs of a $10,000 investment | Costs paid as a percentage of a $10,000 investment |
| Class C | $190 | 1.73% |
Management's discussion of Fund performance
Performance highlights
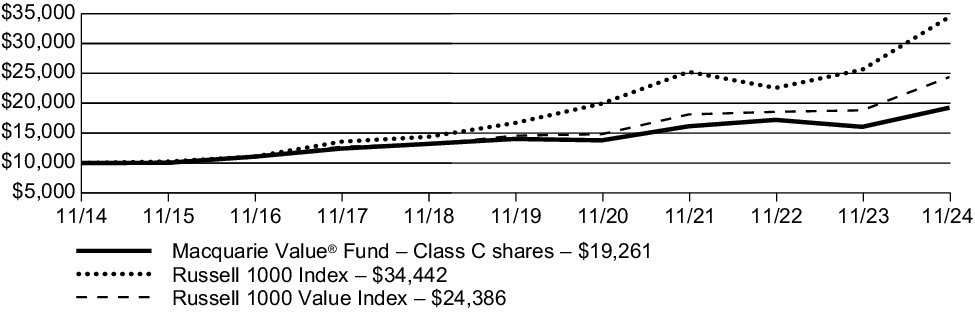
Macquarie Value® Fund (Class C) returned 19.96% (excluding sales charge) for the 12 months ended November 30, 2024. During the same period, the Russell 1000® Index, the Fund's broad-based securities market index, returned 34.40%, while the Russell 1000® Value Index, the Fund's narrowly based securities market index, returned 29.56%.
Top contributors to performance:
Holdings in the information technology sector outperformed, specifically positions in the software and communications equipment industries.
In the real estate sector, the Fund’s residential real estate investment trust (REIT) holding outperformed the sector more broadly, benefiting from ongoing demand for rental apartments.
Strong stock selection in addition to an underweight allocation in the materials sector contributed to performance over the reporting period.
The Fund’s underweight allocation in the energy sector compared to its narrowly based index also contributed to performance over the reporting period.
Top detractors from performance:
Stock selection was the lead detractor from the Fund’s performance over the 12-month reporting period.
In the consumer staples sector, the Fund’s holdings underperformed those in the Fund’s narrowly based index in the food products and consumer staples distribution & retail industries.
Holdings in the industrials sector underperformed the sector more broadly, especially those with defense industry exposure, which tend to have lower economic sensitivity.
Stock selection in the healthcare sector was weak as holdings in the healthcare equipment & supplies and pharmaceutical industries lagged the stronger returns of those in the Fund’s narrowly based index.
Frank Russell Company is the source and owner of the trademarks, service marks and copyrights related to the Russell Indexes. Russell® is a trademark of Frank Russell Company.
Fund performance
The following graph compares the initial and subsequent account values at the end of each of the most recently completed 10 fiscal years of the Class. It also assumes a $10,000 initial investment at the beginning of the first full fiscal year in a broad-based securities market index and an additional narrowly based securities market index for the same period.
Growth of $10,000 investment
For the period November 30, 2014, through November 30, 2024
| Average annual total returns (as of November 30, 2024) | 1 year | 5 year | 10 year |
| Macquarie Value® Fund (Class C) – including sales charge | 18.96 | % | 6.53 | % | 6.77 | % |
| Macquarie Value® Fund (Class C) – excluding sales charge | 19.96 | % | 6.53 | % | 6.77 | % |
| Russell 1000 Index | 34.40 | % | 15.58 | % | 13.16 | % |
| Russell 1000 Value Index | 29.56 | % | 10.84 | % | 9.32 | % |
Keep in mind that the Fund's past performance is not a good predictor of how the Fund will perform in the future.
Visit macquarie.com/mam/performance for the most recent performance information. The graph and table do not reflect the deduction of taxes that a shareholder would pay on Fund distributions or redemption of Fund shares. Performance results reflect any expense caps in effect during these periods. All results shown assume reinvestment of distributions.
In connection with new regulatory requirements, effective the date of this report, the Fund changed its broad-based securities market benchmark index to the Russell 1000 Index. Although the Russell 1000 Index can be considered broadly representative of the overall securities market applicable to the Fund, the Fund will continue to show the performance of the Russell 1000 Value Index for comparative purposes because Delaware Management Company, the Fund's manager, believes it is more representative of the Fund's investment universe.
Fund statistics (as of November 30, 2024)
| Fund net assets | $3,369,288,370 |
| Total number of portfolio holdings | 33 |
| Total advisory fees paid | $20,821,474 |
| Portfolio turnover rate | 31% |
Fund holdings (as of November 30, 2024)
The tables below show the investment makeup of the Fund, with each category representing a percentage of the total net assets of the Fund.
| Financials | 20.34% |
| Information Technology | 19.09% |
| Healthcare | 15.27% |
| Industrials | 13.30% |
| Consumer Discretionary | 7.25% |
| Communication Services | 5.63% |
| Energy | 5.28% |
| Real Estate | 3.48% |
| Materials | 3.38% |
| Consumer Staples | 3.37% |
| Utilities | 3.32% |
| |
| |
| |
| Cisco Systems | 4.03% |
| Travelers | 4.01% |
| Oracle | 3.98% |
| US Bancorp | 3.94% |
| Motorola Solutions | 3.93% |
| Allstate | 3.86% |
| Honeywell International | 3.67% |
| Dover | 3.65% |
| Teledyne Technologies | 3.62% |
| Lowe's | 3.61% |
On December 31, 2024, Delaware Value® Fund will be renamed Macquarie Value® Fund.
This is a summary of certain changes to the Fund that occurred during the reporting period except as otherwise noted. For more complete information, you may review the Fund's next prospectus, which we expect to be available by April 1, 2025, at macquarie.com/mam/literature or upon request at 800 523-1918, weekdays from 8:30am to 6:00pm ET.
Availability of additional information
You can access additional information about the Fund, such as the prospectus, financial information, holdings, and proxy voting information, at macquarie.com/mam/literature. You can also request this information by contacting us at 800 523-1918, weekdays from 8:30am to 6:00pm ET, or by contacting your financial intermediary.
Householding
In order to reduce expenses, we will deliver a single copy of prospectuses, proxies, financial reports, and other communication to shareholders with the same residential address, provided they have the same last name or we reasonably believe them to be members of the same family. Unless we are notified otherwise, we will continue to send recipients only one copy of these materials for as long as they remain shareholders of the Fund. If you would like to receive individual mailings, please call 800 523-1918 or contact your financial intermediary. Your instructions will typically be effective within 30 days after we receive them from you or your financial intermediary. If you choose, you may receive these documents through electronic delivery.
For more information, please scan the QR code at left to navigate to additional hosted material at macquarie.com/mam/literature.
Macquarie Value® Fund
(formerly, Delaware Value® Fund)
Class R : DDVRX
Annual shareholder report | November 30, 2024
This annual shareholder report contains important information about Macquarie Value® Fund (Fund) for the period of December 1, 2023, to November 30, 2024. You can find additional information about the Fund at macquarie.com/mam/literature. You can also request this information by contacting us at 800 523-1918, weekdays from 8:30am to 6:00pm ET.
This report describes changes to the Fund that occurred during the reporting period except as otherwise noted in the Material Fund changes section.
What were the Fund's costs for the last 12 months ?
(Based on a hypothetical $10,000 investment)
| Class | Costs of a $10,000 investment | Costs paid as a percentage of a $10,000 investment |
| Class R | $136 | 1.23% |
Management's discussion of Fund performance
Performance highlights
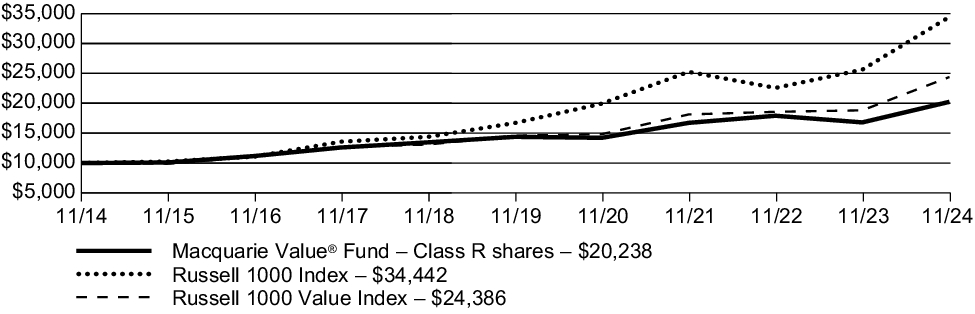
Macquarie Value® Fund (Class R) returned 20.46% (excluding sales charge) for the 12 months ended November 30, 2024. During the same period, the Russell 1000® Index, the Fund's broad-based securities market index, returned 34.40%, while the Russell 1000® Value Index, the Fund's narrowly based securities market index, returned 29.56%.
Top contributors to performance:
Holdings in the information technology sector outperformed, specifically positions in the software and communications equipment industries.
In the real estate sector, the Fund’s residential real estate investment trust (REIT) holding outperformed the sector more broadly, benefiting from ongoing demand for rental apartments.
Strong stock selection in addition to an underweight allocation in the materials sector contributed to performance over the reporting period.
The Fund’s underweight allocation in the energy sector compared to its narrowly based index also contributed to performance over the reporting period.
Top detractors from performance:
Stock selection was the lead detractor from the Fund’s performance over the 12-month reporting period.
In the consumer staples sector, the Fund’s holdings underperformed those in the Fund’s narrowly based index in the food products and consumer staples distribution & retail industries.
Holdings in the industrials sector underperformed the sector more broadly, especially those with defense industry exposure, which tend to have lower economic sensitivity.
Stock selection in the healthcare sector was weak as holdings in the healthcare equipment & supplies and pharmaceutical industries lagged the stronger returns of those in the Fund’s narrowly based index.
Frank Russell Company is the source and owner of the trademarks, service marks and copyrights related to the Russell Indexes. Russell® is a trademark of Frank Russell Company.
Fund performance
The following graph compares the initial and subsequent account values at the end of each of the most recently completed 10 fiscal years of the Class. It also assumes a $10,000 initial investment at the beginning of the first full fiscal year in a broad-based securities market index and an additional narrowly based securities market index for the same period.
Growth of $10,000 investment
For the period November 30, 2014, through November 30, 2024
| Average annual total returns (as of November 30, 2024) | 1 year | 5 year | 10 year |
| Macquarie Value® Fund (Class R) – including sales charge | 20.46 | % | 7.07 | % | 7.30 | % |
| Macquarie Value® Fund (Class R) – excluding sales charge | 20.46 | % | 7.07 | % | 7.30 | % |
| Russell 1000 Index | 34.40 | % | 15.58 | % | 13.16 | % |
| Russell 1000 Value Index | 29.56 | % | 10.84 | % | 9.32 | % |
Keep in mind that the Fund's past performance is not a good predictor of how the Fund will perform in the future.
Visit macquarie.com/mam/performance for the most recent performance information. The graph and table do not reflect the deduction of taxes that a shareholder would pay on Fund distributions or redemption of Fund shares. Performance results reflect any expense caps in effect during these periods. All results shown assume reinvestment of distributions.
In connection with new regulatory requirements, effective the date of this report, the Fund changed its broad-based securities market benchmark index to the Russell 1000 Index. Although the Russell 1000 Index can be considered broadly representative of the overall securities market applicable to the Fund, the Fund will continue to show the performance of the Russell 1000 Value Index for comparative purposes because Delaware Management Company, the Fund's manager, believes it is more representative of the Fund's investment universe.
Fund statistics (as of November 30, 2024)
| Fund net assets | $3,369,288,370 |
| Total number of portfolio holdings | 33 |
| Total advisory fees paid | $20,821,474 |
| Portfolio turnover rate | 31% |
Fund holdings (as of November 30, 2024)
The tables below show the investment makeup of the Fund, with each category representing a percentage of the total net assets of the Fund.
| Financials | 20.34% |
| Information Technology | 19.09% |
| Healthcare | 15.27% |
| Industrials | 13.30% |
| Consumer Discretionary | 7.25% |
| Communication Services | 5.63% |
| Energy | 5.28% |
| Real Estate | 3.48% |
| Materials | 3.38% |
| Consumer Staples | 3.37% |
| Utilities | 3.32% |
| |
| |
| |
| Cisco Systems | 4.03% |
| Travelers | 4.01% |
| Oracle | 3.98% |
| US Bancorp | 3.94% |
| Motorola Solutions | 3.93% |
| Allstate | 3.86% |
| Honeywell International | 3.67% |
| Dover | 3.65% |
| Teledyne Technologies | 3.62% |
| Lowe's | 3.61% |
On December 31, 2024, Delaware Value® Fund will be renamed Macquarie Value® Fund.
This is a summary of certain changes to the Fund that occurred during the reporting period except as otherwise noted. For more complete information, you may review the Fund's next prospectus, which we expect to be available by April 1, 2025, at macquarie.com/mam/literature or upon request at 800 523-1918, weekdays from 8:30am to 6:00pm ET.
Availability of additional information
You can access additional information about the Fund, such as the prospectus, financial information, holdings, and proxy voting information, at macquarie.com/mam/literature. You can also request this information by contacting us at 800 523-1918, weekdays from 8:30am to 6:00pm ET, or by contacting your financial intermediary.
Householding
In order to reduce expenses, we will deliver a single copy of prospectuses, proxies, financial reports, and other communication to shareholders with the same residential address, provided they have the same last name or we reasonably believe them to be members of the same family. Unless we are notified otherwise, we will continue to send recipients only one copy of these materials for as long as they remain shareholders of the Fund. If you would like to receive individual mailings, please call 800 523-1918 or contact your financial intermediary. Your instructions will typically be effective within 30 days after we receive them from you or your financial intermediary. If you choose, you may receive these documents through electronic delivery.
For more information, please scan the QR code at left to navigate to additional hosted material at macquarie.com/mam/literature.
Macquarie Value® Fund
(formerly, Delaware Value® Fund)
Institutional Class : DDVIX
Annual shareholder report | November 30, 2024
This annual shareholder report contains important information about Macquarie Value® Fund (Fund) for the period of December 1, 2023, to November 30, 2024. You can find additional information about the Fund at macquarie.com/mam/literature. You can also request this information by contacting us at 800 523-1918, weekdays from 8:30am to 6:00pm ET.
This report describes changes to the Fund that occurred during the reporting period except as otherwise noted in the Material Fund changes section.
What were the Fund's costs for the last 12 months ?
(Based on a hypothetical $10,000 investment)
| Class | Costs of a $10,000 investment | Costs paid as a percentage of a $10,000 investment |
| Institutional Class | $81 | 0.73% |
Management's discussion of Fund performance
Performance highlights
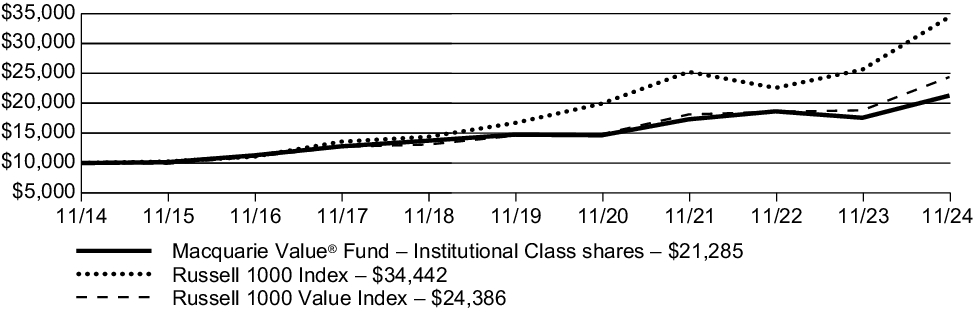
Macquarie Value® Fund (Institutional Class) returned 21.14% (excluding sales charge) for the 12 months ended November 30, 2024. During the same period, the Russell 1000® Index, the Fund's broad-based securities market index, returned 34.40%, while the Russell 1000® Value Index, the Fund's narrowly based securities market index, returned 29.56%.
Top contributors to performance:
Holdings in the information technology sector outperformed, specifically positions in the software and communications equipment industries.
In the real estate sector, the Fund’s residential real estate investment trust (REIT) holding outperformed the sector more broadly, benefiting from ongoing demand for rental apartments.
Strong stock selection in addition to an underweight allocation in the materials sector contributed to performance over the reporting period.
The Fund’s underweight allocation in the energy sector compared to its narrowly based index also contributed to performance over the reporting period.
Top detractors from performance:
Stock selection was the lead detractor from the Fund’s performance over the 12-month reporting period.
In the consumer staples sector, the Fund’s holdings underperformed those in the Fund’s narrowly based index in the food products and consumer staples distribution & retail industries.
Holdings in the industrials sector underperformed the sector more broadly, especially those with defense industry exposure, which tend to have lower economic sensitivity.
Stock selection in the healthcare sector was weak as holdings in the healthcare equipment & supplies and pharmaceutical industries lagged the stronger returns of those in the Fund’s narrowly based index.
Frank Russell Company is the source and owner of the trademarks, service marks and copyrights related to the Russell Indexes. Russell® is a trademark of Frank Russell Company.
Fund performance
The following graph compares the initial and subsequent account values at the end of each of the most recently completed 10 fiscal years of the Class. It also assumes a $10,000 initial investment at the beginning of the first full fiscal year in a broad-based securities market index and an additional narrowly based securities market index for the same period.
Growth of $10,000 investment
For the period November 30, 2014, through November 30, 2024
| Average annual total returns (as of November 30, 2024) | 1 year | 5 year | 10 year |
| Macquarie Value® Fund (Institutional Class) – including sales charge | 21.14 | % | 7.61 | % | 7.85 | % |
| Macquarie Value® Fund (Institutional Class) – excluding sales charge | 21.14 | % | 7.61 | % | 7.85 | % |
| Russell 1000 Index | 34.40 | % | 15.58 | % | 13.16 | % |
| Russell 1000 Value Index | 29.56 | % | 10.84 | % | 9.32 | % |
Keep in mind that the Fund's past performance is not a good predictor of how the Fund will perform in the future.
Visit macquarie.com/mam/performance for the most recent performance information. The graph and table do not reflect the deduction of taxes that a shareholder would pay on Fund distributions or redemption of Fund shares. Performance results reflect any expense caps in effect during these periods. All results shown assume reinvestment of distributions.
In connection with new regulatory requirements, effective the date of this report, the Fund changed its broad-based securities market benchmark index to the Russell 1000 Index. Although the Russell 1000 Index can be considered broadly representative of the overall securities market applicable to the Fund, the Fund will continue to show the performance of the Russell 1000 Value Index for comparative purposes because Delaware Management Company, the Fund's manager, believes it is more representative of the Fund's investment universe.
Fund statistics (as of November 30, 2024)
| Fund net assets | $3,369,288,370 |
| Total number of portfolio holdings | 33 |
| Total advisory fees paid | $20,821,474 |
| Portfolio turnover rate | 31% |
Fund holdings (as of November 30, 2024)
The tables below show the investment makeup of the Fund, with each category representing a percentage of the total net assets of the Fund.
| Financials | 20.34% |
| Information Technology | 19.09% |
| Healthcare | 15.27% |
| Industrials | 13.30% |
| Consumer Discretionary | 7.25% |
| Communication Services | 5.63% |
| Energy | 5.28% |
| Real Estate | 3.48% |
| Materials | 3.38% |
| Consumer Staples | 3.37% |
| Utilities | 3.32% |
| |
| |
| |
| Cisco Systems | 4.03% |
| Travelers | 4.01% |
| Oracle | 3.98% |
| US Bancorp | 3.94% |
| Motorola Solutions | 3.93% |
| Allstate | 3.86% |
| Honeywell International | 3.67% |
| Dover | 3.65% |
| Teledyne Technologies | 3.62% |
| Lowe's | 3.61% |
On December 31, 2024, Delaware Value® Fund will be renamed Macquarie Value® Fund.
This is a summary of certain changes to the Fund that occurred during the reporting period except as otherwise noted. For more complete information, you may review the Fund's next prospectus, which we expect to be available by April 1, 2025, at macquarie.com/mam/literature or upon request at 800 523-1918, weekdays from 8:30am to 6:00pm ET.
Availability of additional information
You can access additional information about the Fund, such as the prospectus, financial information, holdings, and proxy voting information, at macquarie.com/mam/literature. You can also request this information by contacting us at 800 523-1918, weekdays from 8:30am to 6:00pm ET, or by contacting your financial intermediary.
Householding
In order to reduce expenses, we will deliver a single copy of prospectuses, proxies, financial reports, and other communication to shareholders with the same residential address, provided they have the same last name or we reasonably believe them to be members of the same family. Unless we are notified otherwise, we will continue to send recipients only one copy of these materials for as long as they remain shareholders of the Fund. If you would like to receive individual mailings, please call 800 523-1918 or contact your financial intermediary. Your instructions will typically be effective within 30 days after we receive them from you or your financial intermediary. If you choose, you may receive these documents through electronic delivery.
For more information, please scan the QR code at left to navigate to additional hosted material at macquarie.com/mam/literature.
Macquarie Value® Fund
(formerly, Delaware Value® Fund)
Class R6 : DDZRX
Annual shareholder report | November 30, 2024
This annual shareholder report contains important information about Macquarie Value® Fund (Fund) for the period of December 1, 2023, to November 30, 2024. You can find additional information about the Fund at macquarie.com/mam/literature. You can also request this information by contacting us at 800 523-1918, weekdays from 8:30am to 6:00pm ET.
This report describes changes to the Fund that occurred during the reporting period except as otherwise noted in the Material Fund changes section.
What were the Fund's costs for the last 12 months ?
(Based on a hypothetical $10,000 investment)
| Class | Costs of a $10,000 investment | Costs paid as a percentage of a $10,000 investment |
| Class R6 | $69 | 0.62% |
Management's discussion of Fund performance
Performance highlights
Macquarie Value® Fund (Class R6) returned 21.22% (excluding sales charge) for the 12 months ended November 30, 2024. During the same period, the Russell 1000® Index, the Fund's broad-based securities market index, returned 34.40%, while the Russell 1000® Value Index, the Fund's narrowly based securities market index, returned 29.56%.
Top contributors to performance:
Holdings in the information technology sector outperformed, specifically positions in the software and communications equipment industries.
In the real estate sector, the Fund’s residential real estate investment trust (REIT) holding outperformed the sector more broadly, benefiting from ongoing demand for rental apartments.
Strong stock selection in addition to an underweight allocation in the materials sector contributed to performance over the reporting period.
The Fund’s underweight allocation in the energy sector compared to its narrowly based index also contributed to performance over the reporting period.
Top detractors from performance:
Stock selection was the lead detractor from the Fund’s performance over the 12-month reporting period.
In the consumer staples sector, the Fund’s holdings underperformed those in the Fund’s narrowly based index in the food products and consumer staples distribution & retail industries.
Holdings in the industrials sector underperformed the sector more broadly, especially those with defense industry exposure, which tend to have lower economic sensitivity.
Stock selection in the healthcare sector was weak as holdings in the healthcare equipment & supplies and pharmaceutical industries lagged the stronger returns of those in the Fund’s narrowly based index.
Frank Russell Company is the source and owner of the trademarks, service marks and copyrights related to the Russell Indexes. Russell® is a trademark of Frank Russell Company.
Fund performance
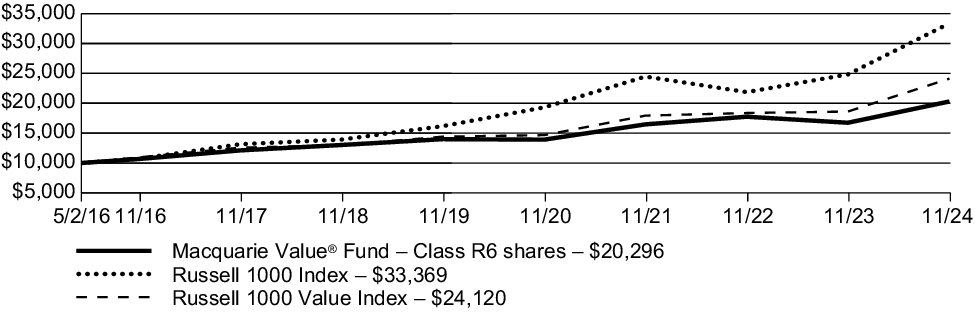
The following graph compares the initial and subsequent account values at the end of each of the most recently completed fiscal years (or period) of the Class for the life of the Class. It also assumes a $10,000 initial investment at the Class's inception date in a broad-based securities market index and an additional narrowly based securities market index for the same period.
Growth of $10,000 investment
For the period May 2, 2016 (Class R6's inception), through November 30, 2024
| Average annual total returns (as of November 30, 2024) | 1 year | 5 year | Since inception
(5/2/16) |
| Macquarie Value® Fund (Class R6) – including sales charge | 21.22 | % | 7.71 | % | 8.60 | % |
| Macquarie Value® Fund (Class R6) – excluding sales charge | 21.22 | % | 7.71 | % | 8.60 | % |
| Russell 1000 Index | 34.40 | % | 15.58 | % | 15.07 | % |
| Russell 1000 Value Index | 29.56 | % | 10.84 | % | 10.80 | % |
Keep in mind that the Fund's past performance is not a good predictor of how the Fund will perform in the future.
Visit macquarie.com/mam/performance for the most recent performance information. The graph and table do not reflect the deduction of taxes that a shareholder would pay on Fund distributions or redemption of Fund shares. Performance results reflect any expense caps in effect during these periods. All results shown assume reinvestment of distributions.
In connection with new regulatory requirements, effective the date of this report, the Fund changed its broad-based securities market benchmark index to the Russell 1000 Index. Although the Russell 1000 Index can be considered broadly representative of the overall securities market applicable to the Fund, the Fund will continue to show the performance of the Russell 1000 Value Index for comparative purposes because Delaware Management Company, the Fund's manager, believes it is more representative of the Fund's investment universe.
Fund statistics (as of November 30, 2024)
| Fund net assets | $3,369,288,370 |
| Total number of portfolio holdings | 33 |
| Total advisory fees paid | $20,821,474 |
| Portfolio turnover rate | 31% |
Fund holdings (as of November 30, 2024)
The tables below show the investment makeup of the Fund, with each category representing a percentage of the total net assets of the Fund.
| Financials | 20.34% |
| Information Technology | 19.09% |
| Healthcare | 15.27% |
| Industrials | 13.30% |
| Consumer Discretionary | 7.25% |
| Communication Services | 5.63% |
| Energy | 5.28% |
| Real Estate | 3.48% |
| Materials | 3.38% |
| Consumer Staples | 3.37% |
| Utilities | 3.32% |
| |
| |
| |
| Cisco Systems | 4.03% |
| Travelers | 4.01% |
| Oracle | 3.98% |
| US Bancorp | 3.94% |
| Motorola Solutions | 3.93% |
| Allstate | 3.86% |
| Honeywell International | 3.67% |
| Dover | 3.65% |
| Teledyne Technologies | 3.62% |
| Lowe's | 3.61% |
On December 31, 2024, Delaware Value® Fund will be renamed Macquarie Value® Fund.
This is a summary of certain changes to the Fund that occurred during the reporting period except as otherwise noted. For more complete information, you may review the Fund's next prospectus, which we expect to be available by April 1, 2025, at macquarie.com/mam/literature or upon request at 800 523-1918, weekdays from 8:30am to 6:00pm ET.
Availability of additional information
You can access additional information about the Fund, such as the prospectus, financial information, holdings, and proxy voting information, at macquarie.com/mam/literature. You can also request this information by contacting us at 800 523-1918, weekdays from 8:30am to 6:00pm ET, or by contacting your financial intermediary.
Householding
In order to reduce expenses, we will deliver a single copy of prospectuses, proxies, financial reports, and other communication to shareholders with the same residential address, provided they have the same last name or we reasonably believe them to be members of the same family. Unless we are notified otherwise, we will continue to send recipients only one copy of these materials for as long as they remain shareholders of the Fund. If you would like to receive individual mailings, please call 800 523-1918 or contact your financial intermediary. Your instructions will typically be effective within 30 days after we receive them from you or your financial intermediary. If you choose, you may receive these documents through electronic delivery.
For more information, please scan the QR code at left to navigate to additional hosted material at macquarie.com/mam/literature.
| | (a) | The registrant has adopted a code of ethics that applies to the registrant’s principal executive officer, principal financial officer, principal accounting officer or controller, or persons performing similar functions, regardless of whether these individuals are employed by the registrant or a third party. A copy of the registrant’s Code of Business Ethics has been posted on the Macquarie Funds Internet Web site at www.macquarie.com/USfunds. Any amendments to the Code of Business Ethics, and information on any waiver from its provisions granted by the registrant, will also be posted on this Web site within five business days of such amendment or waiver and will remain on the Web site for at least 12 months. |
| Item 3. | Audit Committee Financial Expert. |
The registrant’s Board of Trustees has determined that certain members of the registrant’s Audit Committee are audit committee financial experts, as defined below. For purposes of this item, an “audit committee financial expert” is a person who has the following attributes:
| | a. | An understanding of generally accepted accounting principles and financial statements; |
| | b. | The ability to assess the general application of such principles in connection with the accounting for estimates, accruals, and reserves; |
| | c. | Experience preparing, auditing, analyzing, or evaluating financial statements that present a breadth and level of complexity of accounting issues that are generally comparable to the breadth and complexity of issues that can reasonably be expected to be raised by the registrant’s financial statements, or experience actively supervising one or more persons engaged in such activities; |
| | d. | An understanding of internal controls and procedures for financial reporting; and |
| | e. | An understanding of audit committee functions. |
An “audit committee financial expert” shall have acquired such attributes through:
| | a. | Education and experience as a principal financial officer, principal accounting officer, controller, public accountant, or auditor or experience in one or more positions that involve the performance of similar functions; |
| | b. | Experience actively supervising a principal financial officer, principal accounting officer, controller, public accountant, auditor, or person performing similar functions; |
| | c. | Experience overseeing or assessing the performance of companies or public accountants with respect to the preparation, auditing, or evaluation of financial statements; or |
| | d. | Other relevant experience. |
The registrant’s Board of Trustees has also determined that each member of the registrant’s Audit Committee is independent. In order to be “independent” for purposes of this item, the Audit Committee member may not, other than in his or her capacity as a member of the Board of Trustees or any committee thereof, (i) accept directly or indirectly any consulting, advisory or other compensatory fee from the issuer; or (ii) be an “interested person” of the registrant as defined in Section 2(a)(19) of the Investment Company Act of 1940.
The names of the audit committee financial experts on the registrant’s Audit Committee are set forth below:
Ann Borowiec
H. Jeffrey Dobbs
Frances Sevilla-Sacasa, Chair
Christianna Wood
| Item 4. | Principal Accountant Fees and Services. |
Audit Fees
| | (a) | The aggregate fees billed for each of the last two fiscal years for professional services rendered by the principal accountant for the audit of the registrant’s annual financial statements or services that are normally provided by the accountant in connection with statutory and regulatory filings or engagements for those fiscal years are $35,000 for 2024 and $30,323 for 2023. |
Audit-Related Fees
| | (b) | The aggregate fees billed in each of the last two fiscal years for assurance and related services by the principal accountant that are reasonably related to the performance of the audit of the registrant’s financial statements and are not reported under paragraph (a) of this Item are $1,374,878 for 2024 and $1,362,878 for 2023. These audit-related services were as follows: year end audit procedures; group reporting and subsidiary statutory audits. |
Tax Fees
| | (c) | The aggregate fees billed in each of the last two fiscal years for professional services rendered by the principal accountant for tax compliance, tax advice, and tax planning are $5,171 for 2024 and $4,671 for 2023. These tax-related services were as follows: review of income tax returns and review of annual excise distribution calculations. |
All Other Fees
| | (d) | The aggregate fees billed in each of the last two fiscal years for products and services provided by the principal accountant, other than the services reported in paragraphs (a) through (c) of this Item are $0 for 2024 and $7,250 for 2023. |
| | (e)(1) | The registrant’s Audit Committee has established pre-approval policies and procedures as permitted by Rule 2-01(c)(7)(i)(B) of Regulation S-X (the “Pre-Approval Policy”) with respect to services provided by the registrant’s independent auditors. Pursuant to the Pre-Approval Policy, the Audit Committee has pre-approved the services set forth in the table below with respect to the registrant up to the specified fee limits. Certain fee limits are based on aggregate fees to the registrant and other registrants within the Macquarie Funds. |
| | |
Service | | Range of Fees |
Audit Services | | |
Statutory audits or financial audits for new Funds | | up to $50,000 per Fund |
Services associated with SEC registration statements (e.g., Form N-1A, Form N-14, etc.), periodic reports and other documents filed with the SEC or other documents issued in connection with securities offerings (e.g., comfort letters for closed-end Fund offerings, consents), and assistance in responding to SEC comment letters | | up to $10,000 per Fund |
Consultations by Fund management as to the accounting or disclosure treatment of transactions or events and/or the actual or potential impact of final or proposed rules, standards or interpretations by the SEC, FASB, or other regulatory or standard-setting bodies (Note: Under SEC rules, some consultations may be considered “audit-related services” rather than “audit services”) | | up to $25,000 in the aggregate |
Audit-Related Services | | |
Consultations by Fund management as to the accounting or disclosure treatment of transactions or events and /or the actual or potential impact of final or proposed rules, standards or interpretations by the SEC, FASB, or other regulatory or standard-setting bodies (Note: Under SEC rules, some consultations may be considered “audit services” rather than “audit-related services”) | | up to $25,000 in the aggregate |
Tax Services | | |
U.S. federal, state and local and international tax planning and advice (e.g., consulting on statutory, regulatory or administrative developments, evaluation of Funds’ tax compliance function, etc.) | | up to $25,000 in the aggregate |
U.S. federal, state and local tax compliance (e.g., excise distribution reviews, etc.) | | up to $5,000 per Fund |
Review of federal, state, local and international income, franchise and other tax returns | | up to $5,000 per Fund |
Under the Pre-Approval Policy, the Audit Committee has also pre-approved the services set forth in the table below with respect to the registrant’s investment adviser and other entities controlling, controlled by or under common control with the investment adviser that provide ongoing services to the registrant (the “Control Affiliates”) up to the specified fee limit. This fee limit is based on aggregate fees to the investment adviser and its Control Affiliates.
| | |
Service | | Range of Fees |
Non-Audit Services | | |
Services associated with periodic reports and other documents filed with the SEC and assistance in responding to SEC comment letters | | up to $10,000 in the aggregate |
The Pre-Approval Policy requires the registrant’s independent auditors to report to the Audit Committee at each of its regular meetings regarding all services initiated since the last such report was rendered, including those services authorized by the Pre-Approval Policy.
| | (e)(2) | The percentage of services described in each of paragraphs (b) through (d) of this Item that were approved by the audit committee pursuant to paragraph (c)(7)(i)(C) of Rule 2-01 of Regulation S-X are as follows: |
(b) 0%
(c) 0%
(d) 0%
| | (g) | The aggregate non-audit fees billed by the registrant’s accountant for services rendered to the registrant, and rendered to the registrant’s investment adviser (not including any sub-adviser whose role is primarily portfolio management and is subcontracted with or overseen by another investment adviser), and any entity controlling, controlled by, or under common control with the adviser that provides ongoing services to the registrant for each of the last two fiscal years of the registrant was $9,688,403 for 2024 and $24,428,000 for 2023. |
| | (h) | The audit committee of the registrant’s board of trustees has considered whether the provision of non-audit services that were rendered to the registrant’s investment adviser (not including any sub-adviser whose role is primarily portfolio management and is subcontracted with or overseen by another investment adviser), and any entity controlling, controlled by, or under common control with the investment adviser that provides ongoing services to the registrant that were not pre-approved pursuant to paragraph (c)(7)(ii) of Rule 2-01 of Regulation S-X is compatible with maintaining the principal accountant’s independence. |
| Item 5. | Audit Committee of Listed Registrants. |
Not applicable.
| (a) | Schedule of Investments in securities of unaffiliated issuers as of the close of the reporting period is included as part of the Financial Statements filed under Item 7 of this form. |
| Item 7. | Financial Statements and Financial Highlights for Open-End Management Investment Companies. |
| | (a) | An open-end management investment company registered on Form N-1A [17 CFR 239.15A and 17 CFR 274.11A] must file its most recent annual or semi-annual financial statements required, and for the periods specified, by Regulation S-X. |
The annual financial statements are attached herewith.
| | (b) | An open-end management investment company registered on Form N-1A [17 CFR 239.15A and 17 CFR 274.11A] must file the information required by Item 13 of Form N-1A. |
US equity mutual fund
Macquarie Value® Fund
(formerly, Delaware Value® Fund)
Financial statements and other information
For the year ended November 30, 2024
This report and the financial statements contained herein are submitted for the general information of the shareholders of the Fund. This report is not authorized for distribution to prospective investors in the Fund unless preceded or accompanied by an effective prospectus.
Form N-PORT and proxy voting information
The Fund files its complete schedule of portfolio holdings with the Securities and Exchange Commission (SEC) for the first and third quarters of each fiscal year on Form N-PORT. The Fund’s Form N-PORT, as well as a description of the policies and procedures that the Fund uses to determine how to vote proxies (if any) relating to portfolio securities, is available without charge (i) upon request, by calling 800 523-1918; and (ii) on the SEC’s website at sec.gov. In addition, a description of the policies and procedures that the Fund uses to determine how to vote proxies (if any) relating to portfolio securities and the Schedule of Investments included in the Fund’s most recent Form N-PORT are available without charge on the Fund’s website at macquarie.com/mam/literature.
Information (if any) regarding how the Fund voted proxies relating to portfolio securities during the most recently disclosed 12-month period ended June 30 is available without charge (i) through the Fund’s website at macquarie.com/mam/proxy; and (ii) on the SEC’s website at sec.gov.
Schedule of investments
| Macquarie Value® Fund | November 30, 2024 |
| | | Number of
shares | Value (US $) |
| Common Stocks — 99.71% |
| Communication Services — 5.63% |
| Electronic Arts | | 660,767 | $ 108,147,735 |
| Walt Disney | | 694,990 | 81,640,475 |
| | 189,788,210 |
| Consumer Discretionary — 7.25% |
| Genuine Parts | | 442,027 | 56,018,082 |
| Lowe's | | 447,067 | 121,794,463 |
| NIKE Class B | | 845,859 | 66,628,313 |
| | 244,440,858 |
| Consumer Staples — 3.37% |
| Conagra Brands | | 1,976,798 | 54,460,785 |
| Hershey | | 335,504 | 59,092,319 |
| | 113,553,104 |
| Energy — 5.28% |
| Chevron | | 436,100 | 70,617,673 |
| Exxon Mobil | | 908,500 | 107,166,660 |
| | 177,784,333 |
| Financials — 20.34% |
| Allstate | | 626,857 | 130,003,873 |
| Bank of America | | 960,400 | 45,628,604 |
| Fidelity National Information Services | | 1,420,824 | 121,196,287 |
| Travelers | | 507,933 | 135,130,496 |
| Truist Financial | | 2,529,356 | 120,599,694 |
| US Bancorp | | 2,491,292 | 132,760,951 |
| | 685,319,905 |
| Healthcare — 15.27% |
| Baxter International | | 1,628,059 | 54,881,869 |
| Cigna Group | | 325,301 | 109,886,678 |
| CVS Health | | 1,522,088 | 91,096,967 |
| Hologic † | | 848,029 | 67,418,305 |
| Johnson & Johnson | | 657,084 | 101,854,591 |
| Merck & Co. | | 877,542 | 89,193,369 |
| | 514,331,779 |
| Industrials — 13.30% |
| Dover | | 596,685 | 122,857,441 |
| Honeywell International | | 530,576 | 123,587,068 |
| Jacobs Solutions | | 681,591 | 96,261,097 |
| Northrop Grumman | | 215,032 | 105,290,419 |
| | 447,996,025 |
Schedule of investments
Macquarie Value® Fund
| | | Number of
shares | Value (US $) |
| Common Stocks (continued) |
| Information Technology — 19.09% |
| Cisco Systems | | 2,293,793 | $ 135,815,484 |
| Cognizant Technology Solutions Class A | | 1,477,139 | 118,894,918 |
| Motorola Solutions | | 265,112 | 132,476,466 |
| Oracle | | 725,377 | 134,078,685 |
| Teledyne Technologies † | | 251,554 | 122,069,094 |
| | 643,334,647 |
| Materials — 3.38% |
| DuPont de Nemours | | 1,361,131 | 113,776,940 |
| | 113,776,940 |
| Real Estate — 3.48% |
| Equity Residential | | 1,531,746 | 117,423,648 |
| | 117,423,648 |
| Utilities — 3.32% |
| Duke Energy | | 954,478 | 111,721,650 |
| | 111,721,650 |
| Total Common Stocks (cost $2,188,156,326) | 3,359,471,099 |
|
|
|
| Short-Term Investments — 0.31% |
| Money Market Mutual Funds — 0.31% |
| BlackRock Liquidity FedFund – Institutional Shares (seven-day effective yield 4.53%) | | 2,605,258 | 2,605,258 |
| Fidelity Investments Money Market Government Portfolio – Class I (seven-day effective yield 4.51%) | | 2,605,258 | 2,605,258 |
| Goldman Sachs Financial Square Government Fund – Institutional Shares (seven-day effective yield 4.59%) | | 2,605,258 | 2,605,258 |
| Morgan Stanley Institutional Liquidity Funds Government Portfolio – Institutional Class (seven-day effective yield 4.58%) | | 2,605,258 | 2,605,258 |
| Total Short-Term Investments (cost $10,421,032) | 10,421,032 |
Total Value of Securities—100.02%
(cost $2,198,577,358) | | | $3,369,892,131 |
| † | Non-income producing security. |
See accompanying notes, which are an integral part of the financial statements.
Statement of assets and liabilities
| Macquarie Value® Fund | November 30, 2024 |
| Assets: | |
| Investments, at value* | $3,369,892,131 |
| Dividends receivable | 7,741,017 |
| Receivable for fund shares sold | 5,610,198 |
| Prepaid expenses | 51,294 |
| Other assets | 68,875 |
| Total Assets | 3,383,363,515 |
| Liabilities: | |
| Payable for fund shares redeemed | 10,233,266 |
| Investment management fees payable to affiliates | 1,543,820 |
| Sub-transfer agent fees and expenses payable | 1,497,127 |
| Other accrued expenses | 474,107 |
| Distribution fees payable to affiliates | 326,825 |
| Total Liabilities | 14,075,145 |
| Total Net Assets | $3,369,288,370 |
|
| Net Assets Consist of: | |
| Paid-in capital | $1,481,797,781 |
| Total distributable earnings (loss) | 1,887,490,589 |
| Total Net Assets | $3,369,288,370 |
Statement of assets and liabilities
Macquarie Value® Fund
|
| Net Asset Value | |
|
| Class A: | |
| Net assets | $1,339,263,900 |
| Shares of beneficial interest outstanding, unlimited authorization, no par | 69,857,410 |
| Net asset value per share | $19.17 |
| Sales charge | 5.75% |
| Offering price per share, equal to net asset value per share / (1 - sales charge) | $20.34 |
|
| Class C: | |
| Net assets | $55,754,776 |
| Shares of beneficial interest outstanding, unlimited authorization, no par | 2,904,510 |
| Net asset value per share | $19.20 |
|
| Class R: | |
| Net assets | $29,164,448 |
| Shares of beneficial interest outstanding, unlimited authorization, no par | 1,521,831 |
| Net asset value per share | $19.16 |
|
| Institutional Class: | |
| Net assets | $1,711,694,427 |
| Shares of beneficial interest outstanding, unlimited authorization, no par | 89,227,352 |
| Net asset value per share | $19.18 |
|
| Class R6: | |
| Net assets | $233,410,819 |
| Shares of beneficial interest outstanding, unlimited authorization, no par | 12,169,498 |
| Net asset value per share | $19.18 |
*Investments, at cost | $2,198,577,358 |
See accompanying notes, which are an integral part of the financial statements.
Statement of operations
| Macquarie Value® Fund | Year ended November 30, 2024 |
| Investment Income: | |
| Dividends | $88,650,915 |
|
| Expenses: | |
| Management fees | 20,821,474 |
| Distribution expenses — Class A | 2,929,892 |
| Distribution expenses — Class C | 735,568 |
| Distribution expenses — Class R | 154,028 |
| Dividend disbursing and transfer agent fees and expenses | 4,261,784 |
| Accounting and administration expenses | 534,632 |
| Reports and statements to shareholders expenses | 244,950 |
| Legal fees | 234,002 |
| Trustees’ fees | 168,647 |
| Registration fees | 145,942 |
| Custodian fees | 144,779 |
| Audit and tax fees | 34,764 |
| Other | 385,356 |
| | 30,795,818 |
| Less expenses paid indirectly | (5,675) |
| Total operating expenses | 30,790,143 |
| Net Investment Income (Loss) | 57,860,772 |
|
| Net Realized and Unrealized Gain (Loss): | |
| Net realized gain (loss) on: | |
| Investments | 1,052,188,894 |
| Net increase from payment by affiliates1 | 13,022 |
| Net realized gain (loss) | 1,052,201,916 |
| Net change in unrealized appreciation (depreciation) on investments | (390,824,444) |
| Net Realized and Unrealized Gain (Loss) | 661,377,472 |
| Net Increase (Decrease) in Net Assets Resulting from Operations | $719,238,244 |
| 1 | See Note 2 in “Notes to financial statements.” |
See accompanying notes, which are an integral part of the financial statements.
Statements of changes in net assets
Macquarie Value® Fund
| | Year ended |
| | 11/30/24 | | 11/30/23 |
| Increase (Decrease) in Net Assets from Operations: | | | |
| Net investment income (loss) | $57,860,772 | | $100,135,974 |
| Net realized gain (loss) | 1,052,188,894 | | 559,733,471 |
| Net increase from payment by affiliates1 | 13,022 | | — |
| Net change in unrealized appreciation (depreciation) | (390,824,444) | | (1,087,908,502) |
| Net increase (decrease) in net assets resulting from operations | 719,238,244 | | (428,039,057) |
|
| Dividends and Distributions to Shareholders from: | | | |
| Distributable earnings: | | | |
| Class A | (119,132,101) | | (126,001,032) |
| Class C | (9,479,006) | | (15,496,831) |
| Class R | (3,263,732) | | (3,709,932) |
| Institutional Class | (275,541,119) | | (440,580,280) |
| Class R6 | (39,911,230) | | (69,494,119) |
| | (447,327,188) | | (655,282,194) |
|
| Capital Share Transactions (See Note 6): | | | |
| Proceeds from shares sold: | | | |
| Class A | 75,748,098 | | 98,871,662 |
| Class C | 2,873,052 | | 6,984,482 |
| Class R | 2,574,502 | | 4,689,030 |
| Institutional Class | 280,006,599 | | 464,021,717 |
| Class R6 | 41,397,495 | | 244,151,209 |
|
| Net assets from reorganization:2 | | | |
| Class A | 228,581,211 | | — |
| Class C | 4,298,190 | | — |
| Class R | 7,243 | | — |
| Institutional Class | 153,474,813 | | — |
| Class R6 | 1,596,951 | | — |
|
| Net asset value of shares issued upon reinvestment of dividends and distributions: | | | |
| Class A | 113,638,582 | | 119,476,302 |
| Class C | 9,284,477 | | 15,198,012 |
| Class R | 3,260,876 | | 3,702,997 |
| Institutional Class | 259,508,136 | | 418,003,861 |
| Class R6 | 33,627,416 | | 54,575,685 |
| | 1,209,877,641 | | 1,429,674,957 |
| | Year ended |
| | 11/30/24 | | 11/30/23 |
| Capital Share Transactions (continued): | | | |
| Cost of shares redeemed: | | | |
| Class A | $(303,908,803) | | $(275,426,702) |
| Class C | (66,542,267) | | (80,521,880) |
| Class R | (10,147,052) | | (12,094,170) |
| Institutional Class | (2,038,974,854) | | (2,143,262,685) |
| Class R6 | (243,384,329) | | (553,088,150) |
| | (2,662,957,305) | | (3,064,393,587) |
| Decrease in net assets derived from capital share transactions | (1,453,079,664) | | (1,634,718,630) |
| Net Decrease in Net Assets | (1,181,168,608) | | (2,718,039,881) |
|
| Net Assets: | | | |
| Beginning of year | 4,550,456,978 | | 7,268,496,859 |
| End of year | $3,369,288,370 | | $4,550,456,978 |
| 1 | See Note 2 in “Notes to financial statements.” |
| 2 | See Note 7 in “Notes to financial statements.” |
See accompanying notes, which are an integral part of the financial statements.
Financial highlights
Macquarie Value® Fund Class A
Selected data for each share of the Fund outstanding throughout each period were as follows:
| |
| |
Net asset value, beginning of period
|
| |
| Income (loss) from investment operations: |
Net investment income1
|
Net realized and unrealized gain (loss)
|
Payment by affiliates
|
Total from investment operations
|
| |
| Less dividends and distributions from: |
Net investment income
|
Net realized gain
|
Total dividends and distributions
|
| |
Net asset value, end of period
|
| |
Total return4
|
| |
| Ratios and supplemental data: |
Net assets, end of period (000 omitted)
|
Ratio of expenses to average net assets6
|
Ratio of expenses to average net assets prior to fees waived6
|
Ratio of net investment income to average net assets
|
Ratio of net investment income to average net assets prior to fees waived
|
Portfolio turnover
|
| 1 | Calculated using average shares outstanding. |
| 2 | Amount is less than $0.005 per share. |
| 3 | See Note 2 in “Notes to financial statements.” |
| 4 | Total return is based on the change in net asset value of a share during the period and assumes reinvestment of dividends and distributions at net asset value and does not reflect the impact of a sales charge. |
| 5 | The impact of payments by affiliates are less than $0.005 per share and 0.005% on net asset value and total return, respectively. |
| 6 | Expense ratios do not include expenses of any investment companies in which the Fund invests. |
| 7 | Includes non-recurring expenses of 0.01% for the year ended November 30, 2024. |
See accompanying notes, which are an integral part of the financial statements.
| Year ended |
| 11/30/24 | | 11/30/23 | | 11/30/22 | | 11/30/21 | | 11/30/20 |
| $17.71 | | $20.86 | | $24.41 | | $21.14 | | $22.44 |
| |
| | | | | | | | | |
| 0.25 | | 0.28 | | 0.27 | | 0.31 | | 0.38 |
| 3.12 | | (1.52) | | 1.40 | | 3.45 | | (0.63) |
| —2,3 | | — | | — | | — | | — |
| 3.37 | | (1.24) | | 1.67 | | 3.76 | | (0.25) |
| |
| | | | | | | | | |
| (0.25) | | (0.31) | | (0.28) | | (0.35) | | (0.38) |
| (1.66) | | (1.60) | | (4.94) | | (0.14) | | (0.67) |
| (1.91) | | (1.91) | | (5.22) | | (0.49) | | (1.05) |
| |
| $19.17 | | $17.71 | | $20.86 | | $24.41 | | $21.14 |
| |
| 20.77%5 | | (6.00%) | | 7.40% | | 17.94% | | (0.90%) |
| |
| | | | | | | | | |
| $1,339,264 | | $1,117,813 | | $1,383,399 | | $1,542,371 | | $1,505,191 |
| 0.98%7 | | 0.94% | | 0.93% | | 0.93% | | 0.93% |
| 0.98%7 | | 0.94% | | 0.93% | | 0.93% | | 0.93% |
| 1.40% | | 1.54% | | 1.33% | | 1.32% | | 1.93% |
| 1.40% | | 1.54% | | 1.33% | | 1.32% | | 1.93% |
| 31% | | 19% | | 11% | | 22% | | 25% |
Financial highlights
Macquarie Value® Fund Class C
Selected data for each share of the Fund outstanding throughout each period were as follows:
| |
| |
Net asset value, beginning of period
|
| |
| Income (loss) from investment operations: |
Net investment income1
|
Net realized and unrealized gain (loss)
|
Payment by affiliates
|
Total from investment operations
|
| |
| Less dividends and distributions from: |
Net investment income
|
Net realized gain
|
Total dividends and distributions
|
| |
Net asset value, end of period
|
| |
Total return4
|
| |
| Ratios and supplemental data: |
Net assets, end of period (000 omitted)
|
Ratio of expenses to average net assets6
|
Ratio of expenses to average net assets prior to fees waived6
|
Ratio of net investment income to average net assets
|
Ratio of net investment income to average net assets prior to fees waived
|
Portfolio turnover
|
| 1 | Calculated using average shares outstanding. |
| 2 | Amount is less than $0.005 per share. |
| 3 | See Note 2 in “Notes to financial statements.” |
| 4 | Total return is based on the change in net asset value of a share during the period and assumes reinvestment of dividends and distributions at net asset value and does not reflect the impact of a sales charge. |
| 5 | The impact of payments by affiliates are less than $0.005 per share and 0.005% on net asset value and total return, respectively. |
| 6 | Expense ratios do not include expenses of any investment companies in which the Fund invests. |
| 7 | Includes non-recurring expenses of 0.01% for the year ended November 30, 2024. |
See accompanying notes, which are an integral part of the financial statements.
| Year ended |
| 11/30/24 | | 11/30/23 | | 11/30/22 | | 11/30/21 | | 11/30/20 |
| $17.70 | | $20.83 | | $24.37 | | $21.10 | | $22.38 |
| |
| | | | | | | | | |
| 0.11 | | 0.14 | | 0.12 | | 0.13 | | 0.23 |
| 3.14 | | (1.51) | | 1.39 | | 3.44 | | (0.62) |
| —2,3 | | — | | — | | — | | — |
| 3.25 | | (1.37) | | 1.51 | | 3.57 | | (0.39) |
| |
| | | | | | | | | |
| (0.09) | | (0.16) | | (0.11) | | (0.16) | | (0.22) |
| (1.66) | | (1.60) | | (4.94) | | (0.14) | | (0.67) |
| (1.75) | | (1.76) | | (5.05) | | (0.30) | | (0.89) |
| |
| $19.20 | | $17.70 | | $20.83 | | $24.37 | | $21.10 |
| |
| 19.96%5 | | (6.71%) | | 6.57% | | 17.04% | | (1.68%) |
| |
| | | | | | | | | |
| $55,755 | | $101,616 | | $187,592 | | $253,333 | | $319,180 |
| 1.73%7 | | 1.69% | | 1.68% | | 1.68% | | 1.68% |
| 1.73%7 | | 1.69% | | 1.68% | | 1.68% | | 1.68% |
| 0.62% | | 0.79% | | 0.57% | | 0.57% | | 1.18% |
| 0.62% | | 0.79% | | 0.57% | | 0.56% | | 1.18% |
| 31% | | 19% | | 11% | | 22% | | 25% |
Financial highlights
Macquarie Value® Fund Class R
Selected data for each share of the Fund outstanding throughout each period were as follows:
| |
| |
Net asset value, beginning of period
|
| |
| Income (loss) from investment operations: |
Net investment income1
|
Net realized and unrealized gain (loss)
|
Payment by affiliates
|
Total from investment operations
|
| |
| Less dividends and distributions from: |
Net investment income
|
Net realized gain
|
Total dividends and distributions
|
| |
Net asset value, end of period
|
| |
Total return4
|
| |
| Ratios and supplemental data: |
Net assets, end of period (000 omitted)
|
Ratio of expenses to average net assets6
|
Ratio of expenses to average net assets prior to fees waived6
|
Ratio of net investment income to average net assets
|
Ratio of net investment income to average net assets prior to fees waived
|
Portfolio turnover
|
| 1 | Calculated using average shares outstanding. |
| 2 | Amount is less than $0.005 per share. |
| 3 | See Note 2 in “Notes to financial statements.” |
| 4 | Total return is based on the change in net asset value of a share during the period and assumes reinvestment of dividends and distributions at net asset value. |
| 5 | The impact of payments by affiliates are less than $0.005 per share and 0.005% on net asset value and total return, respectively. |
| 6 | Expense ratios do not include expenses of any investment companies in which the Fund invests. |
| 7 | Includes non-recurring expenses of 0.01% for the year ended November 30, 2024. |
See accompanying notes, which are an integral part of the financial statements.
| Year ended |
| 11/30/24 | | 11/30/23 | | 11/30/22 | | 11/30/21 | | 11/30/20 |
| $17.70 | | $20.84 | | $24.39 | | $21.13 | | $22.43 |
| |
| | | | | | | | | |
| 0.20 | | 0.23 | | 0.22 | | 0.25 | | 0.33 |
| 3.12 | | (1.50) | | 1.40 | | 3.44 | | (0.62) |
| —2,3 | | — | | — | | — | | — |
| 3.32 | | (1.27) | | 1.62 | | 3.69 | | (0.29) |
| |
| | | | | | | | | |
| (0.20) | | (0.27) | | (0.23) | | (0.29) | | (0.34) |
| (1.66) | | (1.60) | | (4.94) | | (0.14) | | (0.67) |
| (1.86) | | (1.87) | | (5.17) | | (0.43) | | (1.01) |
| |
| $19.16 | | $17.70 | | $20.84 | | $24.39 | | $21.13 |
| |
| 20.46%5 | | (6.21%) | | 7.11% | | 17.61% | | (1.16%) |
| |
| | | | | | | | | |
| $29,164 | | $31,008 | | $40,863 | | $48,382 | | $52,840 |
| 1.23%7 | | 1.19% | | 1.18% | | 1.18% | | 1.18% |
| 1.23%7 | | 1.19% | | 1.18% | | 1.18% | | 1.18% |
| 1.14% | | 1.29% | | 1.07% | | 1.07% | | 1.68% |
| 1.14% | | 1.29% | | 1.07% | | 1.06% | | 1.68% |
| 31% | | 19% | | 11% | | 22% | | 25% |
Financial highlights
Macquarie Value® Fund Institutional Class
Selected data for each share of the Fund outstanding throughout each period were as follows:
| |
| |
Net asset value, beginning of period
|
| |
| Income (loss) from investment operations: |
Net investment income1
|
Net realized and unrealized gain (loss)
|
Payment by affiliates
|
Total from investment operations
|
| |
| Less dividends and distributions from: |
Net investment income
|
Net realized gain
|
Total dividends and distributions
|
| |
Net asset value, end of period
|
| |
Total return4
|
| |
| Ratios and supplemental data: |
Net assets, end of period (000 omitted)
|
Ratio of expenses to average net assets6
|
Ratio of expenses to average net assets prior to fees waived6
|
Ratio of net investment income to average net assets
|
Ratio of net investment income to average net assets prior to fees waived
|
Portfolio turnover
|
| 1 | Calculated using average shares outstanding. |
| 2 | Amount is less than $0.005 per share. |
| 3 | See Note 2 in “Notes to financial statements.” |
| 4 | Total return is based on the change in net asset value of a share during the period and assumes reinvestment of dividends and distributions at net asset value. |
| 5 | The impact of payments by affiliates are less than $0.005 per share and 0.005% on net asset value and total return, respectively. |
| 6 | Expense ratios do not include expenses of any investment companies in which the Fund invests. |
| 7 | Includes non-recurring expenses of 0.01% for the year ended November 30, 2024. |
See accompanying notes, which are an integral part of the financial statements.
| Year ended |
| 11/30/24 | | 11/30/23 | | 11/30/22 | | 11/30/21 | | 11/30/20 |
| $17.70 | | $20.85 | | $24.40 | | $21.14 | | $22.45 |
| |
| | | | | | | | | |
| 0.29 | | 0.32 | | 0.32 | | 0.37 | | 0.43 |
| 3.13 | | (1.51) | | 1.41 | | 3.43 | | (0.64) |
| —2, 3 | | — | | — | | — | | — |
| 3.42 | | (1.19) | | 1.73 | | 3.80 | | (0.21) |
| |
| | | | | | | | | |
| (0.28) | | (0.36) | | (0.34) | | (0.40) | | (0.43) |
| (1.66) | | (1.60) | | (4.94) | | (0.14) | | (0.67) |
| (1.94) | | (1.96) | | (5.28) | | (0.54) | | (1.10) |
| |
| $19.18 | | $17.70 | | $20.85 | | $24.40 | | $21.14 |
| |
| 21.14%5 | | (5.77%) | | 7.69% | | 18.19% | | (0.68%) |
| |
| | | | | | | | | |
| $1,711,694 | | $2,917,872 | | $4,903,817 | | $6,216,726 | | $7,427,159 |
| 0.73%7 | | 0.69% | | 0.68% | | 0.68% | | 0.68% |
| 0.73%7 | | 0.69% | | 0.68% | | 0.68% | | 0.68% |
| 1.62% | | 1.79% | | 1.57% | | 1.57% | | 2.18% |
| 1.62% | | 1.79% | | 1.57% | | 1.56% | | 2.18% |
| 31% | | 19% | | 11% | | 22% | | 25% |
Financial highlights
Macquarie Value® Fund Class R6
Selected data for each share of the Fund outstanding throughout each period were as follows:
| |
| |
Net asset value, beginning of period
|
| |
| Income (loss) from investment operations: |
Net investment income1
|
Net realized and unrealized gain (loss)
|
Payment by affiliates
|
Total from investment operations
|
| |
| Less dividends and distributions from: |
Net investment income
|
Net realized gain
|
Total dividends and distributions
|
| |
Net asset value, end of period
|
| |
Total return4
|
| |
| Ratios and supplemental data: |
Net assets, end of period (000 omitted)
|
Ratio of expenses to average net assets6
|
Ratio of expenses to average net assets prior to fees waived6
|
Ratio of net investment income to average net assets
|
Ratio of net investment income to average net assets prior to fees waived
|
Portfolio turnover
|
| 1 | Calculated using average shares outstanding. |
| 2 | Amount is less than $0.005 per share. |
| 3 | See Note 2 in “Notes to financial statements.” |
| 4 | Total return is based on the change in net asset value of a share during the period and assumes reinvestment of dividends and distributions at net asset value. |
| 5 | The impact of payments by affiliates are less than $0.005 per share and 0.005% on net asset value and total return, respectively. |
| 6 | Expense ratios do not include expenses of any investment companies in which the Fund invests. |
| 7 | Includes non-recurring expenses of 0.01% for the year ended November 30, 2024. |
See accompanying notes, which are an integral part of the financial statements.
| Year ended |
| 11/30/24 | | 11/30/23 | | 11/30/22 | | 11/30/21 | | 11/30/20 |
| $17.71 | | $20.85 | | $24.41 | | $21.14 | | $22.45 |
| |
| | | | | | | | | |
| 0.30 | | 0.34 | | 0.34 | | 0.40 | | 0.45 |
| 3.13 | | (1.52) | | 1.40 | | 3.44 | | (0.64) |
| —2,3 | | — | | — | | — | | — |
| 3.43 | | (1.18) | | 1.74 | | 3.84 | | (0.19) |
| |
| | | | | | | | | |
| (0.30) | | (0.36) | | (0.36) | | (0.43) | | (0.45) |
| (1.66) | | (1.60) | | (4.94) | | (0.14) | | (0.67) |
| (1.96) | | (1.96) | | (5.30) | | (0.57) | | (1.12) |
| |
| $19.18 | | $17.71 | | $20.85 | | $24.41 | | $21.14 |
| |
| 21.22%5 | | (5.68%) | | 7.77% | | 18.36% | | (0.57%) |
| |
| | | | | | | | | |
| $233,411 | | $382,148 | | $752,826 | | $1,028,424 | | $1,121,302 |
| 0.62%7 | | 0.61% | | 0.59% | | 0.58% | | 0.58% |
| 0.62%7 | | 0.61% | | 0.59% | | 0.58% | | 0.58% |
| 1.72% | | 1.87% | | 1.67% | | 1.67% | | 2.28% |
| 1.72% | | 1.87% | | 1.67% | | 1.67% | | 2.28% |
| 31% | | 19% | | 11% | | 22% | | 25% |
Notes to financial statements
| Macquarie Value® Fund | November 30, 2024 |
Delaware Group® Equity Funds II (Trust) is organized as a Delaware statutory trust and offers one series: Macquarie Value Fund (formerly, Delaware Value Fund through December 31, 2024) (Fund). The Trust is an open-end investment company. The Fund is considered diversified under the Investment Company Act of 1940, as amended (1940 Act), and offers Class A, Class C, Class R, Institutional Class, and Class R6 shares. Class A shares are sold with a maximum front-end sales charge of 5.75%. There is no front-end sales charge when you purchase $1 million or more of Class A shares. However, if Delaware Distributors, L.P. (DDLP) paid your financial intermediary a commission on your purchase of $1 million or more of Class A shares, you will have to pay a limited contingent deferred sales charge (Limited CDSC) of 1.00% if you redeem these shares within the first 18 months after your purchase, unless a specific waiver of the Limited CDSC applies. Class C shares have no upfront sales charge, but are sold with a contingent deferred sales charge (CDSC) of 1.00%, which will be incurred if redeemed during the first 12 months. Class R, Institutional Class, and Class R6 shares are not subject to a sales charge and are offered for sale exclusively to certain eligible investors. In addition, Class R6 shares do not pay any service fees, sub-accounting fees, and/or sub-transfer agency fees to any brokers, dealers, or other financial intermediaries.
1. Significant Accounting Policies
The Fund follows accounting and reporting guidance under Financial Accounting Standards Board (FASB) Accounting Standards Codification Topic 946, Financial Services — Investment Companies. The following accounting policies are in accordance with US generally accepted accounting principles (US GAAP) and are consistently followed by the Fund.
Security Valuation — Equity securities and exchange-traded funds (ETFs), except those traded on the Nasdaq Stock Market LLC (Nasdaq), are valued at the last quoted sales price as of the time of the regular close of the New York Stock Exchange (NYSE) on the valuation date. Equity securities and ETFs traded on the Nasdaq are valued in accordance with the Nasdaq Official Closing Price, which may not be the last sales price. If, on a particular day, an equity security or ETF does not trade, the mean between the bid and the ask prices will be used, which approximates fair value. Open-end investment companies, other than ETFs, are valued at their published net asset value (NAV). Investments for which market quotations are not readily available are valued at fair value as determined in good faith pursuant to Rule 2a-5 under the 1940 Act (Rule 2a-5). As a general principle, the fair value of a security or other asset is the price that would be received to sell an asset or paid to transfer a liability in an orderly transaction between market participants at the measurement date. Pursuant to Rule 2a-5, the Board of Trustees (Board) has designated Delaware Management Company (DMC) as the valuation designee (Valuation Designee) for the Fund to perform the fair value determination relating to all applicable Fund investments. DMC has established a Pricing Committee to assist with its designated responsibilities as Valuation Designee, and DMC may carry out its designated responsibilities as Valuation Designee through the Pricing Committee and other teams and committees, which operate under policies and procedures approved by the Board and subject to the Board’s oversight. Fair value pricing may be used more frequently for securities traded
primarily in non-US markets. In considering whether fair valuation is required and in determining fair values, the Valuation Designee may, among other things, consider significant events (which may be considered to include changes in the value of US securities or securities indexes) that occur after the close of the relevant market and before the close of the NYSE. The Valuation Designee may utilize modeling tools provided by third-party vendors to determine fair values of non-US securities.
Federal Income Taxes — No provision for federal income taxes has been made as the Fund intends to continue to qualify for federal income tax purposes as a regulated investment company under Subchapter M of the Internal Revenue Code of 1986, as amended, and make the requisite distributions to shareholders. The Fund evaluates tax positions taken or expected to be taken in the course of preparing the Fund’s tax returns to determine whether the tax positions are “more-likely-than-not” of being sustained by the applicable tax authority. Tax positions not deemed to meet the “more-likely-than-not” threshold are recorded as a tax benefit or expense in the current year. Management has analyzed the Fund’s tax positions taken or expected to be taken on the Fund’s federal income tax returns through the year ended November 30, 2024, and for all open tax years (years ended November 30, 2021–November 30, 2023), and has concluded that no provision for federal income tax is required in the Fund’s financial statements. If applicable, the Fund recognizes interest accrued on unrecognized tax benefits in interest expense and penalties in “Other” on the “Statement of operations.” During the year ended November 30, 2024, the Fund did not incur any interest or tax penalties.
Class Accounting — Investment income, common expenses, and realized and unrealized gain (loss) on investments are allocated to the various classes of the Fund on the basis of daily net assets of each class. Distribution expenses relating to a specific class are charged directly to that class. Class R6 shares will not be allocated any expenses related to service fees, sub-accounting fees, and/or sub-transfer agency fees paid to brokers, dealers, or other financial intermediaries.
Use of Estimates — The preparation of financial statements in conformity with US GAAP requires management to make estimates and assumptions that affect the fair value of investments, the reported amounts of assets and liabilities and disclosure of contingent assets and liabilities at the date of the financial statements, and the reported amounts of revenues and expenses during the reporting period. Actual results could differ from those estimates and the differences could be material.
Other — Expenses directly attributable to the Fund are charged directly to the Fund. Other expenses common to various funds within the Macquarie Funds (formerly, Delaware Funds by Macquarie®) are generally allocated among such funds on the basis of average net assets. Management fees and certain other expenses are paid monthly. Security transactions are recorded on the date the securities are purchased or sold (trade date) for financial reporting purposes. Costs used in calculating realized gains and losses on the sale of investment securities are those of the specific securities sold. Dividend income is recorded on the ex-dividend date. Income and capital gain distributions from any investment companies
Notes to financial statements
Macquarie Value® Fund
1. Significant Accounting Policies (continued)
(Underlying Funds), in which the Fund invests are recorded on the ex-dividend date. The Fund declares and pays dividends from net investment income quarterly and distributions from net realized gain on investments, if any, at least annually. The Fund may distribute more frequently, if necessary for tax purposes. Dividends and distributions, if any, are recorded on the ex-dividend date.
The Fund receives earnings credits from its custodian when positive cash balances are maintained, which may be used to offset custody fees. The expenses paid under this arrangement are included on the “Statement of operations” under “Custodian fees” with the corresponding expenses offset included under “Less expenses paid indirectly.” For the year ended November 30, 2024, the Fund earned $2,095 under this arrangement.
The Fund receives earnings credits from its transfer agent when positive cash balances are maintained, which may be used to offset transfer agent fees. If the amount earned is greater than $1, the expenses paid under this arrangement are included on the “Statement of operations” under “Dividend disbursing and transfer agent fees and expenses” with the corresponding expenses offset included under “Less expenses paid indirectly.” For the year ended November 30, 2024, the Fund earned $3,580 under this arrangement.
2. Investment Management, Administration Agreements, and Other Transactions with Affiliates
In accordance with the terms of its investment management agreement, the Fund pays DMC, a series of Macquarie Investment Management Business Trust (MIMBT) and the investment manager, an annual fee which is calculated daily and paid monthly at the rates of 0.65% on the first $500 million of average daily net assets of the Fund, 0.60% on the next $500 million, 0.55% on the next $1.5 billion, 0.50% on the next $7.5 billion, and 0.475% on average daily net assets in excess of $10 billion.
DMC entered into Sub-Advisory Agreement on behalf of the Fund with Macquarie Investment Management Global Limited, which is an affiliate of DMC (Affiliated Sub-Advisor). Pursuant to the terms of the Sub-Advisory Agreement, the investment sub-advisory fee is paid by DMC to the Affiliated Sub-Advisor based on the extent to which the Affiliated Sub-Advisor provides services to the Fund.
Delaware Investments Fund Services Company (DIFSC), an affiliate of DMC, provides fund accounting and financial administrative oversight services to the Fund. For these services, DIFSC’s fees are calculated daily and paid monthly, based on the aggregate daily net assets of all funds within the Macquarie Funds at the following annual rates: 0.0050% of the first $60 billion; 0.00475% of the next $30 billion; and 0.0015% of aggregate average daily net assets in excess of $90 billion (Total Fee). Each fund in the Macquarie Funds pays a minimum of $4,000, which, in aggregate, is subtracted from the Total Fee. Each fund then pays its portion of the remainder of the Total Fee on a relative NAV basis. This amount is included on the
“Statement of operations” under “Accounting and administration expenses.” For the year ended November 30, 2024, the Fund paid $173,083 for these services.
DIFSC is also the transfer agent and dividend disbursing agent of the Fund. For these services, DIFSC’s fees are calculated daily and paid monthly, based on the aggregate daily net assets of the retail funds within the Macquarie Funds at the following annual rates: 0.014% of the first $20 billion; 0.011% of the next $5 billion; 0.007% of the next $5 billion; 0.004% of the next $20 billion; 0.002% of the next $25 billion; and 0.0015% of average daily net assets in excess of $75 billion. The fees payable to DIFSC under the shareholder services agreement described above are allocated among all retail funds in the Macquarie Funds on a relative NAV basis. This amount is included on the “Statement of operations” under “Dividend disbursing and transfer agent fees and expenses.” For the year ended November 30, 2024, the Fund paid $243,848 for these services. Pursuant to a sub-transfer agency agreement between DIFSC and BNY Mellon Investment Servicing (US) Inc. (BNYIS), BNYIS provides certain sub-transfer agency services to the Fund. Sub-transfer agency fees are paid by the Fund and are also included on the “Statement of operations” under “Dividend disbursing and transfer agent fees and expenses.” The fees are calculated daily and paid as invoices on a monthly or quarterly basis.
Pursuant to a distribution agreement and distribution plan, the Fund pays DDLP, the distributor and an affiliate of DMC, an annual distribution and service (12b-1) fee of 0.25%, 1.00%, and 0.50% of the average daily net assets of the Class A, Class C, and Class R shares, respectively. The Board has adopted a formula for calculating 12b-1 plan fees for the Fund’s Class A shares. The total 12b-1 fees to be paid by Class A shareholders of the Fund will be the sum of: (i) 0.10% of the average daily net assets representing shares that were acquired prior to May 2, 1994 and (ii) 0.25% of the average daily net assets representing shares that were acquired on or after May 2, 1994. All Class A shareholders will bear 12b-1 fees at the same rate, the blended rate, based upon the allocation of the rates described above. This method of calculating Class A 12b-1 fees may be discontinued at the sole discretion of the Board. The fees are calculated daily and paid monthly. Institutional Class and Class R6 shares do not pay 12b-1 fees.
As provided in the investment management agreement, the Fund bears a portion of the cost of certain resources shared with DMC, including the cost of internal personnel of DMC and/or its affiliates that provide legal and regulatory reporting services to the Fund. For the year ended November 30, 2024, the Fund paid $108,494 for internal legal and regulatory reporting services provided by DMC and/or its affiliates’ employees. This amount is included on the “Statement of operations” under “Legal fees.”
For the year ended November 30, 2024, DDLP earned $20,208 for commissions on sales of the Fund’s Class A shares. For the year ended November 30, 2024, DDLP received gross CDSC commissions of $2,855 and $4,129 on redemptions of the Fund’s Class A and Class C shares, respectively, and these commissions were entirely used to offset upfront commissions previously paid by DDLP to broker/dealers on sales of those shares.
Notes to financial statements
Macquarie Value® Fund
2. Investment Management, Administration Agreements, and Other Transactions with Affiliates (continued)
Trustees’ fees include expenses accrued by the Fund for each Trustee’s retainer and meeting fees. Certain officers of DMC, DIFSC, and DDLP are officers and/or Trustees of the Trust. These officers and Trustees are paid no compensation by the Fund.
In addition to the management fees and other expenses of the Fund, the Fund indirectly bears the investment management fees and other expenses of any Underlying Funds, including ETFs, in which it invests. The amount of these fees and expenses incurred indirectly by the Fund will vary based upon the expense and fee levels of any Underlying Funds, and the number of shares that are owned of any Underlying Funds at different times.
During the year ended November 30, 2024, DMC reimbursed the Fund $13,022 for commissions related to a trade error. This amount is included in “Net increase from payment by affiliates” in the “Statement of operations.”
MIMBT, of which DMC is a series, entered into a settlement agreement on September 19, 2024 with the US Securities and Exchange Commission (SEC) consenting to an order (Settlement Order) relating to a legacy investment strategy, the Absolute Return Mortgage-Backed Securities Strategy (ARMBS Strategy). MIMBT no longer offers the ARMBS Strategy. MIMBT agreed to the Settlement Order without admitting or denying the SEC’s findings. The Settlement Order does not impact MIMBT’s ability to continue to provide services to the Fund.
3. Investments
For the year ended November 30, 2024, the Fund made purchases and sales of investment securities other than short-term investments and US government securities as follows:
| Purchases | $1,159,925,645 |
| Sales | 3,382,292,402 |
The tax cost of investments includes adjustments to net unrealized appreciation (depreciation) which may not necessarily be the final tax cost basis adjustments but which approximate the tax basis unrealized gains and losses that may be realized and distributed to shareholders. At November 30, 2024, the cost and unrealized appreciation (depreciation) of investments for federal income tax purposes for the Fund were as follows:
| Cost of investments | $2,199,658,236 |
| Aggregate unrealized appreciation of investments | $1,190,521,313 |
| Aggregate unrealized depreciation of investments | (20,287,418) |
| Net unrealized appreciation of investments | $1,170,233,895 |
US GAAP defines fair value as the price that the Fund would receive to sell an asset or pay to transfer a liability in an orderly transaction between market participants at the measurement date under current market conditions. A three-level hierarchy for fair value measurements has been established based upon the transparency of inputs to the valuation of an asset or liability. Inputs
may be observable or unobservable and refer broadly to the assumptions that market participants would use in pricing the asset or liability. Observable inputs reflect the assumptions market participants would use in pricing the asset or liability based on market data obtained from sources independent of the reporting entity. Unobservable inputs reflect the reporting entity’s own assumptions about the assumptions that market participants would use in pricing the asset or liability based on the best information available under the circumstances. The Fund’s investment in its entirety is assigned a level based upon the observability of the inputs which are significant to the overall valuation. The three-level hierarchy of inputs is summarized as follows:
Level 1 − Inputs are quoted prices in active markets for identical investments. (Examples: equity securities, open-end investment companies, futures contracts, and exchange-traded options contracts)
Level 2 − Other observable inputs, including, but not limited to: quoted prices for similar assets or liabilities in markets that are active, quoted prices for identical or similar assets or liabilities in markets that are not active, inputs other than quoted prices that are observable for the assets or liabilities (such as interest rates, yield curves, volatilities, prepayment speeds, loss severities, credit risks, and default rates) or other market-corroborated inputs. (Examples: debt securities, government securities, swap contracts, forward foreign currency exchange contracts, foreign securities utilizing international fair value pricing, broker-quoted securities, and fair valued securities)
Level 3 − Significant unobservable inputs, including the Fund’s own assumptions used to determine the fair value of investments. (Examples: broker-quoted securities and fair valued securities)
Level 3 investments are valued using significant unobservable inputs. The Fund may also use an income-based valuation approach in which the anticipated future cash flows of the investment are discounted to calculate fair value. Discounts may also be applied due to the nature or duration of any restrictions on the disposition of the investments. Valuations may also be based upon current market prices of securities that are comparable in coupon, rating, maturity, and industry. The derived value of a Level 3 investment may not represent the value which is received upon disposition and this could impact the results of operations.
The following table summarizes the valuation of the Fund’s investments by fair value hierarchy levels as of November 30, 2024:
| | Level 1 |
| Securities | |
| Assets: | |
| Common Stocks | $3,359,471,099 |
| Short-Term Investments | 10,421,032 |
| Total Value of Securities | $3,369,892,131 |
Notes to financial statements
Macquarie Value® Fund
3. Investments (continued)
During the year ended November 30, 2024, there were no transfers into or out of Level 3 investments. The Fund’s policy is to recognize transfers into or out of Level 3 investments based on fair value at the beginning of the reporting year.
A reconciliation of Level 3 investments is presented when the Fund has a significant amount of Level 3 investments at the beginning or end of the year in relation to the Fund’s net assets. As of November 30, 2024, there were no Level 3 investments.
4. Dividend and Distribution Information
Income and long-term capital gain distributions are determined in accordance with federal income tax regulations, which may differ from US GAAP. Additionally, distributions from net short-term gains on sales of investment securities are treated as ordinary income for federal income tax purposes. The tax character of dividends and distributions paid during the years ended November 30, 2024 and 2023 were as follows:
| | Year ended |
| | 11/30/24 | | 11/30/23 |
| Ordinary income | $54,707,434 | | $111,603,975 |
| Long-term capital gains | 392,619,754 | | 543,678,219 |
| Total | $447,327,188 | | $655,282,194 |
5. Components of Net Assets on a Tax Basis
As of November 30, 2024, the components of net assets on a tax basis were as follows:
| Shares of beneficial interest | $1,481,797,781 |
| Undistributed ordinary income | 47,925,168 |
| Undistributed long-term capital gains | 669,385,200 |
| Deferred directors fees | (53,674) |
| Unrealized appreciation of investments | 1,170,233,895 |
| Net assets | $3,369,288,370 |
The differences between book basis and tax basis components of net assets are primarily attributable to tax deferral of losses on wash sales.
For financial reporting purposes, capital accounts are adjusted to reflect the tax character of permanent book/tax differences. Reclassifications are primarily due to earnings and profits distributed to shareholders on the redemption of shares and reorganization-related adjustments. Results of operations and net assets were not affected by these reclassifications. For the year ended November 30, 2024, the adjustments were to decrease total distributable earnings (loss) and increase paid-in capital by $341,254,305.
6. Capital Shares
Transactions in capital shares were as follows:
| | Year ended |
| | 11/30/24 | | 11/30/23 |
| Shares sold: |
| Class A | 4,323,086 | | 5,495,919 |
| Class C | 164,113 | | 384,277 |
| Class R | 146,487 | | 254,537 |
| Institutional Class | 16,149,659 | | 25,661,435 |
| Class R6 | 2,338,566 | | 13,490,529 |
|
| Shares from reorganization:1 |
| Class A | 12,812,848 | | — |
| Class C | 240,525 | | — |
| Class R | 406 | | — |
| Institutional Class | 8,602,848 | | — |
| Class R6 | 89,515 | | — |
|
| Shares issued upon reinvestment of dividends and distributions: |
| Class A | 6,835,001 | | 6,602,488 |
| Class C | 560,558 | | 836,637 |
| Class R | 196,553 | | 204,396 |
| Institutional Class | 15,637,507 | | 23,114,042 |
| Class R6 | 2,025,518 | | 3,022,240 |
| | 70,123,190 | | 79,066,500 |
|
| Shares redeemed: |
| Class A | (17,246,903) | | (15,293,906) |
| Class C | (3,800,324) | | (4,485,094) |
| Class R | (573,834) | | (667,176) |
| Institutional Class | (116,022,371) | | (119,119,851) |
| Class R6 | (13,866,491) | | (31,040,573) |
| | (151,509,923) | | (170,606,600) |
| Net decrease | (81,386,733) | | (91,540,100) |
Notes to financial statements
Macquarie Value® Fund
6. Capital Shares (continued)
Certain shareholders may exchange shares of one class for shares of another class in the same Fund. These exchange transactions are included in shares sold and shares redeemed in the table on the previous page and on the “Statements of changes in net assets.” For the years ended November 30, 2024 and 2023, the Fund had the following exchange transactions:
| | | Exchange Redemptions | | Exchange Subscriptions | | | |
| | | Class A
Shares | | Class C
Shares | | Institutional
Class
Shares | | Class A
Shares | | Institutional
Class
Shares | | Class R6
Shares | | Value |
| Year ended | |
| 11/30/24 | | 271,246 | | 55,043 | | 84,577 | | 75,858 | | 269,173 | | 66,150 | | $7,224,743 |
| 11/30/23 | | 390,896 | | 110,440 | | 4,027,272 | | 147,509 | | 444,259 | | 3,936,998 | | 79,601,267 |
7. Reorganization
On January 16, 2024, the Board approved a proposal to reorganize Delaware Ivy Value Fund, (the “Acquired Fund”), a series of Ivy Funds, with and into the Fund (the “Acquiring Fund”), a series of the Trust (the “Reorganization”). On June 6, 2024, the Acquired Fund shareholders approved the Reorganization. Pursuant to an Agreement and Plan of Reorganization (the “Plan”): (i) all of the property and assets of the Acquired Fund were acquired by the Acquiring Fund and (ii) the Trust, on behalf of the Acquiring Fund, assumed the liabilities of the Acquired Fund, in exchange for shares of the Acquiring Fund. In accordance with the Plan, the Acquired Fund liquidated and dissolved following the Reorganization. In approving the Reorganization, the Board considered various factors, including that the Acquiring Fund and the Acquired Fund share similar investment objectives, principal investment strategies and principal risks, and materially similar fundamental investment restrictions and that the Acquiring Fund's overall total expense ratio is expected to be equal to the corresponding Acquired Fund's total expense ratio following the Reorganization taking into account applicable expense limitation arrangements. The Reorganization was accomplished by a tax-free exchange of shares on July 26, 2024. For financial reporting purposes, assets received and shares issued by the Acquiring Fund were recorded at fair value; however, the cost basis of the investments received from the Acquired Fund was carried forward to align ongoing reporting of the Acquiring Fund’s realized and unrealized gains and losses with amounts distributable to shareholders for tax purposes.
The share transaction information associated with the Acquired Fund and the Acquiring Fund on the Reorganization date were as follows:
| | Acquired
Fund
Net Assets | | Acquired
Fund Shares
Outstanding | | Shares
Converted
to Acquiring
Fund | | Acquiring
Fund
Net Assets | | Conversion
Ratio |
| Class A | $228,495,532 | | 13,079,309 | | 12,812,848 | | $1,099,359,043 | | 0.9793 |
| Class C | 4,298,190 | | 270,326 | | 240,525 | | 61,836,604 | | 0.8898 |
| Class R | 7,243 | | 416 | | 406 | | 30,896,462 | | 0.9760 |
| Class I/Institutional Class* | 153,474,813 | | 8,680,702 | | 8,602,848 | | 2,191,961,229 | | 0.9910 |
| Class R6 | 1,596,951 | | 89,215 | | 89,515 | | 270,046,704 | | 1.0034 |
| Class Y** | 85,679 | | 4,918 | | — | | — | | — |
*Acquired Fund Class I shares are named Institutional Class for the Acquiring Fund.
**Class Y shares of the Acquired Fund were converted into Class A shares of the Acquiring Fund.
The net assets of the Acquired Fund before the Reorganization were $388,426,681. The Acquired Fund net assets and shares outstanding presented on the table above do not include the shareholders that did not participate in the Reorganization. The net assets of the Acquiring Fund immediately following the Reorganization were $4,042,058,450.
Assuming the Reorganization had been completed on December 1, 2023, the Acquiring Fund's pro forma results of operations for the year ended November 30, 2024, would have been as follows:
| Net investment income | $62,035,468 |
| Net realized gain on investments | 1,058,592,571 |
| Net change in unrealized appreciation (depreciation) | (344,524,684) |
| Net increase in net assets resulting from operations | $776,103,355 |
Because the combined investment portfolios have been managed as a single integrated portfolio since the Reorganization was completed, it is not practical to separate the amounts of revenue and earnings of the Acquired Fund that have been included in the Acquiring Fund’s “Statement of Operations” since the Reorganization was consummated on July 26, 2024.
8. Line of Credit
The Fund, along with certain other funds in the Macquarie Funds (Participants), is a participant in a $335,000,000 revolving line of credit (Agreement) intended to be used for temporary or emergency purposes as an additional source of liquidity to fund redemptions of investor shares. Under the Agreement, the Participants are charged an annual commitment fee of 0.15%, which is allocated across the Participants based on a weighted average of the respective net assets of each Participant. The Participants are permitted to borrow up to a maximum of one-third of their
Notes to financial statements
Macquarie Value® Fund
8. Line of Credit (continued)
net assets under the Agreement. Each Participant is individually, and not jointly, liable for its particular advances, if any, under the line of credit. The line of credit available under the Agreement expired on October 28, 2024. This Agreement was extended to October 27, 2025.
The Fund had no amounts outstanding as of November 30, 2024, or at any time during the year then ended.
9. Securities Lending
The Fund, along with other funds in the Macquarie Funds, may lend its securities pursuant to a security lending agreement (Lending Agreement) with The Bank of New York Mellon (BNY). At the time a security is loaned, the borrower must post collateral equal to the required percentage of the market value of the loaned security, including any accrued interest. The required percentage is: (1) 102% with respect to US securities and foreign securities that are denominated and payable in US dollars; and (2) 105% with respect to foreign securities. With respect to each loan, if on any business day the aggregate market value of securities collateral plus cash collateral held is less than the aggregate market value of the securities which are the subject of such loan, the borrower will be notified to provide additional collateral by the end of the following business day, which, together with the collateral already held, will be not less than the applicable initial collateral requirements for such security loan. If the aggregate market value of securities collateral and cash collateral held with respect to a security loan exceeds the applicable initial collateral requirement, upon the request of the borrower, BNY must return enough collateral to the borrower by the end of the following business day to reduce the value of the remaining collateral to the applicable initial collateral requirement for such security loan. As a result of the foregoing, the value of the collateral held with respect to a loaned security on any particular day, may be more or less than the value of the security on loan. The collateral percentage with respect to the market value of the loaned security is determined by the security lending agent.
Cash collateral received by the Fund is generally invested in an individual separate account. The investment guidelines permit each separate account to hold certain securities that would be considered eligible securities for a money market fund. Cash collateral received is generally invested in government securities; certain obligations issued by government sponsored enterprises; repurchase agreements collateralized by US Treasury securities; obligations issued by the central government of any Organization for Economic Cooperation and Development (OECD) country or its agencies, instrumentalities, or establishments; obligations of supranational organizations; commercial paper, notes, bonds, and other debt obligations; certificates of deposit, time deposits, and other bank obligations; certain money market funds; and asset-backed securities. The Fund can also accept US government securities and letters of credit (non-cash collateral) in connection with securities loans.
In the event of default or bankruptcy by the lending agent, realization and/or retention of the collateral may be subject to legal proceedings. In the event the borrower fails to return loaned
securities and the collateral received is insufficient to cover the value of the loaned securities and provided such collateral shortfall is not the result of investment losses, the lending agent has agreed to pay the amount of the shortfall to the Fund or, at the discretion of the lending agent, replace the loaned securities. The Fund continues to record dividends or interest, as applicable, on the securities loaned and is subject to changes in value of the securities loaned that may occur during the term of the loan. The Fund has the right under the Lending Agreement to recover the securities from the borrower on demand. With respect to security loans collateralized by non-cash collateral, the Fund receives loan premiums paid by the borrower. With respect to security loans collateralized by cash collateral, the earnings from the collateral investments are shared among the Fund, the security lending agent, and the borrower. The Fund records security lending income net of allocations to the security lending agent and the borrower.
The Fund may incur investment losses as a result of investing securities lending collateral. This could occur if an investment in the collateral investment account defaulted or became impaired. Under those circumstances, the value of the Fund’s cash collateral account may be less than the amount the Fund would be required to return to the borrowers of the securities and the Fund would be required to make up for this shortfall.
During the year ended November 30, 2024, the Fund had no securities out on loan.
10. Credit and Market Risks
Investments in equity securities in general are subject to market risks that may cause their prices to fluctuate over time. Fluctuations in the value of equity securities in which the Fund invests will cause the NAV of the Fund to fluctuate.
The Fund may invest up to 15% of its net assets in illiquid securities, which may include securities with contractual restrictions on resale, securities exempt from registration under Rule 144A promulgated under the Securities Act of 1933, as amended, and other securities which may not be readily marketable. The relative illiquidity of these securities may impair the Fund from disposing of them in a timely manner and at a fair price when it is necessary or desirable to do so. While maintaining oversight, the Board has delegated to DMC the day-to-day functions of determining whether individual securities are liquid for purposes of the Fund’s limitation on investments in illiquid securities. Securities eligible for resale pursuant to Rule 144A, which are determined to be liquid, are not subject to the Fund’s 15% limit on investments in illiquid securities. As of November 30, 2024, there were no Rule 144A securities held by the Fund.
11. Contractual Obligations
The Fund enters into contracts in the normal course of business that contain a variety of indemnifications. The Fund’s maximum exposure under these arrangements is unknown. However, the Fund has not had prior claims or losses pursuant to these contracts. Management has reviewed the Fund’s existing contracts and expects the risk of loss to be remote.
Notes to financial statements
Macquarie Value® Fund
12. Recent Accounting Pronouncements
In November 2023, the FASB issued an Accounting Standards Update (ASU), ASU 2023-07, Segment Reporting (Topic 280): Improvements to Reportable Segment Disclosures, which enhances disclosure requirements about significant segment expenses that are regularly provided to the chief operating decision maker (CODM). ASU 2023-07, among other things, (i) requires a single segment public entity to provide all of the disclosures as required by Topic 280, (ii) requires a public entity to disclose the title and position of the CODM and an explanation of how the CODM uses the reported measure(s) of segment profit or loss in assessing segment performance and deciding how to allocate resources and (iii) provides the ability for a public entity to elect more than one performance measure. ASU 2023-07 is effective for the fiscal years beginning after December 15, 2023, and interim periods beginning with the first quarter ended March 31, 2025. The Fund is currently assessing the impact of this ASU, however, the Fund does not expect a material impact on its financial statements.
13. Subsequent Events
Management has determined that no material events or transactions occurred subsequent to November 30, 2024, that would require recognition or disclosure in the Fund’s financial statements.
Report of independent registered public accounting firm
To the Board of Trustees of Delaware Group® Equity Funds II and Shareholders of Macquarie Value® Fund
Opinion on the Financial Statements
We have audited the accompanying statement of assets and liabilities, including the schedule of investments, of Macquarie Value® Fund (formerly, Delaware Value® Fund) (constituting Delaware Group® Equity Funds II, referred to hereafter as the “Fund”) as of November 30, 2024, the related statement of operations for the year ended November 30, 2024, the statement of changes in net assets for each of the two years in the period ended November 30, 2024, including the related notes, and the financial highlights for each of the five years in the period ended November 30, 2024 (collectively referred to as the “financial statements”). In our opinion, the financial statements present fairly, in all material respects, the financial position of the Fund as of November 30, 2024, the results of its operations for the year then ended, the changes in its net assets for each of the two years in the period ended November 30, 2024 and the financial highlights for each of the five years in the period ended November 30, 2024 in conformity with accounting principles generally accepted in the United States of America.
Basis for Opinion
These financial statements are the responsibility of the Fund’s management. Our responsibility is to express an opinion on the Fund’s financial statements based on our audits. We are a public accounting firm registered with the Public Company Accounting Oversight Board (United States) (PCAOB) and are required to be independent with respect to the Fund in accordance with the U.S. federal securities laws and the applicable rules and regulations of the Securities and Exchange Commission and the PCAOB.
We conducted our audits of these financial statements in accordance with the standards of the PCAOB. Those standards require that we plan and perform the audit to obtain reasonable assurance about whether the financial statements are free of material misstatement, whether due to error or fraud.
Our audits included performing procedures to assess the risks of material misstatement of the financial statements, whether due to error or fraud, and performing procedures that respond to those risks. Such procedures included examining, on a test basis, evidence regarding the amounts and disclosures in the financial statements. Our audits also included evaluating the accounting principles used and significant estimates made by management, as well as evaluating the overall presentation of the financial statements. Our procedures included confirmation of securities owned as of November 30, 2024 by correspondence with the custodian and transfer agents. We believe that our audits provide a reasonable basis for our opinion.
/s/PricewaterhouseCoopers LLP
Philadelphia, Pennsylvania
January 28, 2025
We have served as the auditor of one or more Macquarie investment companies since 2010.
Other Fund information (Unaudited)
Macquarie Value® Fund
Tax Information
The information set forth below is for the Fund’s fiscal year as required by federal income tax laws. Shareholders, however, must report distributions on a calendar year basis for income tax purposes, which may include distributions for portions of two fiscal years of the Fund. Accordingly, the information needed by shareholders for income tax purposes will be sent to them in January of each year. Please consult your tax advisor for proper treatment of this information.
All disclosures are based on financial information available as of the date of this report and, accordingly are subject to change. For any and all items requiring reporting, it is the intention of the Fund to report the maximum amount permitted under the Internal Revenue Code and the regulations thereunder.
For the fiscal year ended November 30, 2024, the Fund reports distributions paid during the year as follows:
| (A) Ordinary Income Distributions (Tax Basis)* | 12.23% |
| (B) Long-Term Capital Gain Distributions (Tax Basis) | 87.77% |
| Total Distributions (Tax Basis) | 100.00% |
| (C) Qualified Dividends1 | 100.00% |
(A) and (B) are based on a percentage of the Fund’s total distributions.
(C) is based on the ordinary income distributions.
1Qualified dividends represent dividends which qualify for the corporate dividends received deduction.
*For the fiscal year ended November 30, 2024, certain dividends paid by the Fund may be subject to a maximum tax rate of 20%. The percentage of dividends paid by the Fund from ordinary income reported as qualified income is 100.00%. Complete information will be computed and reported in conjunction with your 2024 Form 1099-DIV, as applicable.
For the fiscal year ended November 30, 2024, certain dividends paid by the Fund, determined to be Qualified Interest Income or Qualified Short-Term Capital Gains, may be subject to relief from US withholding for foreign shareholders, as provided by the American Jobs Creation Act of 2004; the Tax Relief, Unemployment Insurance Reauthorization, and Job Creation Act of 2010; and as extended by the American Taxpayer Relief Act of 2012. For the fiscal year ended November 30, 2024, the Fund has reported maximum Qualified Short-Term Capital Gains distributions of $31,995,155.
Changes in and Disagreements with Accountants for Open-End Management Investment Companies
Not applicable.
Proxy Disclosures for Open-End Management Investment Companies
Not applicable.
Remuneration Paid to Directors, Officers, and Others of Open-End Management Investment Companies
The aggregate remuneration paid to directors, officers, and others is disclosed within the financial statements.
Statement Regarding Basis of Approval for Investment Advisory Contract
Board Consideration of Investment Management Agreement and Sub-Advisory Agreement at a Meeting Held on August 13-15, 2024
At a meeting held on August 13-15, 2024 (the “Annual Contract Renewal Meeting”), the Board of Trustees (the “Board”), including a majority of Trustees each of whom is not an “interested person” as defined under the Investment Company Act of 1940 (the “Independent Trustees”), approved the renewal of the Delaware Value Fund (the “Fund”) Investment Management Agreement with Delaware Management Company (DMC) and the Sub-Advisory Agreement with Macquarie Investment Management Global Limited (MIMGL) (the “Affiliated Sub-Adviser”).
Prior to the Annual Contract Renewal Meeting, including at a Board meeting held in May 2024, the Trustees conferred extensively among themselves and with representatives of DMC about these matters. Also, the Board was assisted by the Equity Investments Committee and the Fixed Income Multi-Asset Sub-Advised Funds Investments Committee (each an “Investment Committee” and together, the “Investment Committees”), with each Investment Committee assisting the full Board in reviewing investment performance and other matters throughout the year. The Independent Trustees were also assisted in their evaluation of the Investment Management Agreement and the Sub-Advisory Agreement by independent legal counsel, from whom they received separate legal advice and with whom they met separately.
In providing information to the Board, DMC was guided by a detailed set of requests for information submitted to them by independent legal counsel on behalf of the Independent Trustees at the start of the Board’s annual contract renewal process earlier in 2024. Prior to the Annual Contract Renewal Meeting, and in response to the requests, the Board received and reviewed materials specifically relating to the renewal of the Investment Management Agreement and the Sub-Advisory Agreement. In considering and approving the Investment Management Agreement and the Sub-Advisory Agreement, the Trustees considered the information they believed relevant, including but not limited to the information discussed below. The Board considered not only the specific information presented in connection with the Annual Contract Renewal Meeting and the review process for the Investment Management Agreement and the Sub-Advisory Agreement, but also the knowledge gained over time through interaction with DMC about various topics. In this regard, the Board reviewed reports of DMC at each of its quarterly meetings, which included information about, among other things, Fund performance, investment strategies, and expenses. In addition, the Investment Committees confer with portfolio managers at various times throughout the year. In considering information relating to the approval of the Fund’s Investment Management Agreement and the Sub-Advisory Agreement, the Independent Trustees also received information from an independent fund consultant, JDL Consultants, LLC (JDL).
Other Fund information (Unaudited)
Macquarie Value® Fund
Statement Regarding Basis of Approval for Investment Advisory Contract (continued)
Board Consideration of Investment Management Agreement and Sub-Advisory Agreement at a Meeting Held on August 13-15, 2024 (continued)
The Board did not identify any particular information or consideration that was all-important or controlling, and each individual Trustee may have attributed different weights to various factors.
After its deliberations, the Board, including the Independent Trustees, unanimously approved the continuation of the Investment Management Agreement and the Sub-Advisory Agreement for a one-year term. The following summarizes a number of important, but not necessarily all of the, factors considered by the Board in support of its approval.
Nature, extent, and quality of services. The Board received and considered various information regarding the nature, extent, and quality of the advisory services provided to the Fund by DMC under its Investment Management Agreement and the experience of the officers and employees of DMC who provide these services, including the Fund’s portfolio managers. The Board met with DMC’s senior management and investment personnel. The Board reviewed the materials provided by the Fund’s portfolio management team discussing its performance, investment strategies and outlook, as well as DMC with respect to comparing Fund performance to the performance of a comparable group of mutual funds, relevant benchmarks, and performance metrics, as applicable. The Board’s review included consideration of DMC’s investment oversight and research and analysis capabilities, and its ability to attract and retain skilled investment professionals. The Board also considered information regarding DMC’s programs for risk management, including investment, operational, liquidity, derivatives (as applicable), valuation and compliance risks and its plans for enhancing those programs (including through the allocation of additional resources and enhancements to existing processes and testing). The Board received information with respect to the cybersecurity program and business continuity plans of DMC and its affiliates, as well as information from Macquarie Group Ltd. (Macquarie), the parent company of DMC, regarding Macquarie’s commitment to the US mutual fund business.
In addition, the Board considered certain non-advisory services that DMC and its affiliates provide to the fund complex. Among other things, these services include third party service provider oversight, transfer agency, internal audit, pricing and valuation, portfolio trading, and legal and compliance functions. The Board noted DMC’s responsibility for overseeing: the preparation of the Fund’s prospectus, summary prospectus, statement of additional information, and shareholder reports; responsibility for other periodic filings with regulators; organizing Board meetings and preparing materials for such Board meetings; and furnishing analytical and other support to assist the Board. The Board took into account the benefits to shareholders of investing in a Fund that is part of a family of funds managed by an affiliate of Macquarie, and the resources available to DMC as part of Macquarie’s global asset management business.
The Board received and considered various information with respect to the services provided by the Affiliated Sub-Adviser under the Sub-Advisory Agreement and the credentials and experience of the officers and employees of the Affiliated Sub-Adviser who provide these services. The Board considered the division of responsibilities between DMC and the Affiliated Sub-Adviser
and the oversight provided by DMC. The Board also considered the expertise of the Affiliated Sub-Adviser with respect to certain asset classes and/or investment styles. The Board noted that the Affiliated Sub-Adviser is part of Macquarie’s global investment platform that has offices and personnel that are located around the world. The Affiliated Sub-Adviser provides research, investment and trading analysis on the markets and economies of various countries in which the Fund may invest, makes recommendations regarding securities, provides portfolio management services and assists with security trades, as applicable. The Board took into account that the Sub-Advisory Agreement may benefit the Fund and its shareholders by permitting DMC to use the resources and talents of the Affiliated Sub-Adviser in managing the Fund.
The Board also received and considered information about the nature and extent of services offered and fee rates charged by DMC to other types of clients with investment strategies similar to those of the Fund. In this regard, the Board received information about the significantly greater scope of services, and compliance, reporting and other legal and regulatory obligations and risks of managing registered investment companies compared with those associated with managing assets of other types of clients, including third-party sub-advised fund clients, unregistered funds and separately managed accounts.
The Board concluded that, overall, it was satisfied with the nature, extent and quality of services provided (and expected to be provided) to the Fund by DMC and the Affiliated Sub-Adviser.
Investment performance. The Board received and considered information with respect to the investment performance of the Fund, including performance reports and discussions with portfolio managers at meetings of the Board’s Investment Committees throughout the year as well as reports provided by Broadridge Financial Solutions, Inc., an independent investment company data provider (Broadridge), furnished for the Annual Contract Renewal Meeting. The Broadridge reports prepared for the Fund’s institutional share class showed its investment performance in comparison to the institutional share class of a group of similar funds (the “Performance Universe”). The Board received a description of the methodology used to select the peer funds in the Performance Universe. Comparative annualized performance for the Fund was shown for the past 1-, 3-, 5- and 10-year or since inception periods, as applicable, ended December 31, 2023.
The Performance Universe consists of the Fund and all retail and institutional multi-cap value funds, regardless of asset size or primary channel of distribution. The Board noted that the Broadridge report comparison showed that the Fund’s total return for the 1-, 3- and 5- year periods was in the fourth quartile of its Performance Universe and for the 10-year period was in the third quartile of its Performance Universe. The Broadridge report comparison showed that the Fund’s total return for the 1-, 3-, 5- and 10-year periods was below the median of its Performance Universe. The Board also noted that the Fund underperformed its benchmark index for the 1-, 3-, 5- and 10-year periods. The Board noted the explanations from DMC and the Affiliated Sub-Adviser concerning the reasons for the Fund’s relative performance versus its Performance Universe and benchmark index for the various periods and any actions that DMC has taken to address performance concerns.
Comparative expenses. The Board received and considered expense data for the Fund. DMC provided the Board with information on pricing levels and fee structures for the Fund as of its
Other Fund information (Unaudited)
Macquarie Value® Fund
Statement Regarding Basis of Approval for Investment Advisory Contract (continued)
Board Consideration of Investment Management Agreement and Sub-Advisory Agreement at a Meeting Held on August 13-15, 2024 (continued)
most recently completed fiscal year. The Broadridge total expenses (reflecting any applicable fee waivers and/or expense reimbursements), for comparative consistency, were shown by Broadridge for Institutional Class shares, including 12b-1 and non-12b-1 service fees (as applicable). The Board also considered the comparative analysis of contractual management fees and actual total expense ratios of the Fund versus contractual management fees and actual total expense ratios of a group of peer funds as selected by Broadridge (the “Expense Group”). The Fund’s total expenses were also compared with those of its Expense Universe, which is comprised of the Fund, its Expense Group and all other similar with an institutional share class (i.e., funds without 12b-1 fees and non-12b-1 service fees) with assets equal to or greater than $100 million, excluding outliers (the “Expense Universe”). In reviewing comparative costs, the Fund’s contractual management fee and the actual management fee incurred by the Fund were compared with the contractual management fees (assuming all funds in the Expense Group were similar in size to the Fund) and actual management fees, taking into account any applicable breakpoints and fee waivers and/or expense reimbursements, with the Fund’s Expense Universe.
The Board also received and considered information regarding the Fund’s net operating expense ratios and their various components, including actual management fees, custodian and other non-management fees, and Rule 12b-1 and non-Rule 12b-1 shareholder service fees.
The expense comparisons for the Fund showed that its actual management fee was below the median of its Expense Universe and its actual total expenses were below its Expense Group average. It was noted that consistent with DMC’s waiver methodology, its advisory fee waivers, if any, were at the fund level and not class level.
The Board noted that DMC, and not the Fund, pays the sub-advisory fees to the Affiliated Sub-Adviser and, accordingly, that the retention of the Affiliated Sub-Adviser does not increase the fees and expenses incurred by the Fund.
Based on its consideration of the factors and information it deemed relevant, including those described here, the Board determined that the compensation payable to DMC under the Investment Management Agreement and to the Affiliated Sub-Adviser under the Sub-Advisory Agreement was reasonable.
Economies of scale. The Board received and considered information about the potential for DMC to realize economies of scale in the provision of management services to the Fund, the difficulties of calculating economies of scale at an individual Fund level, and the extent to which potential scale benefits are shared with shareholders, including the extent to which any economies of scale are reflected in the level of management fees charged. DMC discussed its advisory fee pricing and structure for the complex, including the current breakpoints. The Board considered the continuation and/or implementation of contractual fee waivers and/or expense reimbursements, as applicable. The Board noted that, as of March 31, 2024, the Fund’s net
assets exceeded its third breakpoint level and that breakpoints result in a lower advisory fee than would otherwise be the case in the absence of breakpoints, when the asset levels specified in the breakpoints schedule are exceeded. The Board considered whether the reorganization of assets from another Fund within the complex were expected to have economic benefits due to the increased assets under management represented by the combined Funds. The Board noted that the Fund may also benefit from economies of scale through initial fee setting, fee waivers and expense reimbursements, as well as DMC’s investment in its business, including investments in business infrastructure, technology and cybersecurity.
Management profitability. The Board received and considered the Investment Management Profitability Analysis that addressed the overall profitability of DMC’s business in providing management and other services to the Fund and the complex as a whole, including the methodology used by DMC in allocating costs for the purpose of determining profitability. The Board also reviewed a report prepared by JDL regarding DMC’s profitability as compared to certain peer fund complexes and the Independent Trustees discussed DMC’s profitability in such context with representatives from JDL. The Board recognized that calculating and comparing profitability at the individual fund level is difficult; that DMC’s profit, if any, can vary significantly depending on the particular fund; and that DMC’s support for, and commitment to, a fund is not solely dependent on the profits realized as to that fund.
The Board also received and considered information about the portion of the total management fee that was retained by DMC after payment of the fee to the Affiliated Sub-Adviser for sub-advisory services. In assessing the reasonableness of this amount, the Board received and evaluated information about the nature and extent of the responsibilities retained and risk assumed by DMC and not delegated to or assumed by the Affiliated Sub-Adviser. Given the affiliation between DMC and the Affiliated Sub-Adviser, the Board ascribed limited relevance to the allocation of fees between them.
Based on its review, the Board determined that DMC’s profitability was not excessive in light of the nature, extent and quality of the services provided to the Fund
Ancillary benefits. The Board received and considered information regarding the extent to which DMC and its affiliates might derive ancillary benefits from fund operations, including the potential for procuring additional business as a result of the prestige and visibility associated with its role as investment manager to the complex; the benefits from allocation of fund brokerage to improve trading efficiencies; the portfolio transactions executed through “soft dollar” arrangements; and the fees that various affiliates received for serving as transfer agent and for overseeing fund accounting and financial administration services to the complex. The Board considered that it receives periodic reports from DMC that include a representation that any soft dollar arrangements are consistent with regulatory requirements. The Board received information from DMC regarding its view of the performance of its affiliates in providing transfer agent and fund accounting and financial administration oversight services and the organizational structure employed to provide these services pursuant to their contracts with the Fund.
Based on its consideration of the factors and information it deemed relevant, including the costs of providing investment management and other services to the Fund and the ongoing
Other Fund information (Unaudited)
Macquarie Value® Fund
Statement Regarding Basis of Approval for Investment Advisory Contract (continued)
Board Consideration of Investment Management Agreement and Sub-Advisory Agreement at a Meeting Held on August 13-15, 2024 (continued)
commitment of DMC and its affiliates to the Fund, the Board did not find that any ancillary benefits received by DMC and its affiliates, including the Affiliated Sub-Adviser, were unreasonable.
Conclusion. Based on its review, consideration and evaluation of all factors it believed relevant, including the above-described factors and conclusions, the Board, including all of the Independent Trustees, unanimously approved the continuation of DMC’s Investment Management Agreement and of the Affiliated Sub-Adviser’s Sub-Advisory Agreement for an additional one-year period.
Contact information
Shareholder assistance by phone
800 523-1918, weekdays from 8:30am to
6:00pm ET
For securities dealers and financial
institutions representatives only
800 362-7500
Regular mail
Macquarie Funds
P.O. Box 534437
Pittsburgh, PA 15253-4437
Overnight courier service
Macquarie Funds
Attention: 534437
500 Ross Street, 154-0520
Pittsburgh, PA 15262
Macquarie Asset Management • 610 Market Street • Philadelphia, PA 19106-2354
Macquarie Asset Management (MAM) is the asset management division of Macquarie Group. MAM is an integrated asset manager across public and private markets offering a diverse range of capabilities, including real assets, real estate, credit, equities, and multi-asset solutions.
The Fund is advised by Delaware Management Company, a series of MIMBT, a US registered investment adviser, and distributed by Delaware Distributors, L.P. (DDLP), an affiliate of MIMBT and Macquarie Group Limited.
Other than Macquarie Bank Limited ABN 46 008 583 542 (“Macquarie Bank”), any Macquarie Group entity noted in this document is not an authorized deposit-taking institution for the purposes of the Banking Act 1959 (Commonwealth of Australia). The obligations of these other Macquarie Group entities do not represent deposits or other liabilities of Macquarie Bank. Macquarie Bank does not guarantee or otherwise provide assurance in respect of the obligations of these other Macquarie Group entities. In addition, if this document relates to an investment, (a) the investor is subject to investment risk including possible delays in repayment and loss of income and principal invested and (b) none of Macquarie Bank or any other Macquarie Group entity guarantees any particular rate of return on or the performance of the investment, nor do they guarantee repayment of capital in respect of the investment.
The Fund is governed by US laws and regulations.
This page is not part of the Financial statements and other information.
The Financial Highlights are attached herewith.
| Item 8. | Changes in and Disagreements with Accountants for Open-End Management Investment Companies. |
Not applicable.
| Item 9. | Proxy Disclosures for Open-End Management Investment Companies. |
Not applicable.
| Item 10. | Remuneration Paid to Directors, Officers, and Others of Open-End Management Investment Companies. |
This information is included as part of materials filed under Item 7 of this form.
| Item 11. | Statement Regarding Basis for Approval of Investment Advisory Contract. |
This information is included as part of materials filed under Item 7 of this form.
| Item 12. | Disclosure of Proxy Voting Policies and Procedures for Closed-End Management Investment Companies. |
Not applicable.
| Item 13. | Portfolio Managers of Closed-End Management Investment Companies. |
Not applicable.
| Item 14. | Purchases of Equity Securities by Closed-End Management Investment Company and Affiliated Purchasers. |
Not applicable.
| Item 15. | Submission of Matters to a Vote of Security Holders. |
There have been no material changes to the procedures by which shareholders may recommend nominees to the registrant’s board of trustees, where those changes were implemented after the registrant last provided disclosure in response to the requirements of Item 407(c)(2)(iv) of Regulation S-K (17 CFR 229.407) (as required by Item 22(b)(15) of Schedule 14A (17 CFR 240.14a-101)), or this Item.
| Item 16. | Controls and Procedures. |
| | (a) | The registrant’s principal executive officer and principal financial officers, or persons performing similar functions, have concluded that the registrant’s disclosure controls and procedures (as defined in Rule 30a-3(c) under the Investment Company Act of 1940, as amended (17 CFR 270.30a-3(c))) are effective, as of a date within 90 days of the filing of this report, based on their evaluation of these controls and procedures required by Rule 30a-3(b) under the Investment Company Act of 1940 (17 CFR 270.30a-3(b)) and Rules 13a-15(b) or 15d-15(b) under the Securities Exchange Act of 1934, as amended (17 CFR 240.13a-15(b) or 240.15d-15(b)) and provide reasonable assurance that the information required to be disclosed by the registrant in its reports or statements filed under the Securities Exchange Act of 1934 is recorded, processed, summarized and reported within the time periods specified in the rules and forms of the Securities and Exchange Commission. |
| | (b) | There were no significant changes in the registrant’s internal control over financial reporting (as defined in Rule 30a-3(d) under the Investment Company Act of 1940 (17 CFR 270.30a-3(d)) that occurred during the period covered by the report to stockholders included herein that have materially affected, or are reasonably likely to materially affect, the registrant’s internal control over financial reporting. |
| Item 17. | Disclosure of Securities Lending Activities for Closed-End Management Investment Companies. |
Not applicable.
| Item 18. | Recovery of Erroneously Awarded Compensation. |
Not applicable.
SIGNATURES
Pursuant to the requirements of the Securities Exchange Act of 1934 and the Investment Company Act of 1940, the registrant has duly caused this report to be signed on its behalf, by the undersigned, thereunto duly authorized.
Name of Registrant: Delaware Group® Equity Funds II
| | |
/s/ SHAWN K. LYTLE |
| By: | | Shawn K. Lytle |
| Title: | | President and Chief Executive Officer |
| Date: | | February 7, 2025 |
Pursuant to the requirements of the Securities Exchange Act of 1934 and the Investment Company Act of 1940, this report has been signed below by the following persons on behalf of the registrant and in the capacities and on the dates indicated.
| | |
/s/ SHAWN K. LYTLE |
| By: | | Shawn K. Lytle |
| Title: | | President and Chief Executive Officer |
| Date: | | February 7, 2025 |
|
/s/ RICHARD SALUS |
| By: | | Richard Salus |
| Title: | | Chief Financial Officer |
| Date: | | February 7, 2025 |