UNITED STATES
SECURITIES AND EXCHANGE COMMISSION
Washington, D.C. 20549
FORM N-CSR
CERTIFIED SHAREHOLDER REPORT OF REGISTERED
MANAGEMENT INVESTMENT COMPANIES
Investment Company Act file number 811-2490
Smith Barney Money Funds, Inc.
(Exact name of registrant as specified in charter)
| 125 Broad Street, New York, NY | 10004 | |
| (Address of principal executive offices) | (Zip code) | |
Robert I. Frenkel, Esq.
Legg Mason & Co., LLC
300 First Stamford Place, 4th Floor
Stamford, CT 06902
(Name and address of agent for service)
Registrant’s telephone number, including area code: (800) 451-2010
Date of fiscal year end: December 31
Date of reporting period: June 30, 2006
ITEM 1. REPORT TO STOCKHOLDERS.
The Semi-Annual Report to Stockholders is filed herewith.
SEMI-ANNUAL
REPORT
JUNE 30, 2006


Smith Barney
Money Funds, Inc.
Cash Portfolio
Government Portfolio
INVESTMENT PRODUCTS • NOT FDIC INSURED • NO BANK GUARANTEE • MAY LOSE VALUE
Smith Barney
Money Funds, Inc.
Cash Portfolio
Government Portfolio
Semi-Annual Report • June 30, 2006
What’s
Inside
Funds’ Objective
Each Fund seeks maximum current income and preservation of capital.
| I | ||
Fund at a Glance: | ||
| 1 | ||
| 2 | ||
| 3 | ||
| 5 | ||
| 16 | ||
| 17 | ||
| 18 | ||
| 20 | ||
| 26 | ||
| 34 | ||
“Smith Barney”, “Salomon Brothers” and “Citi” are service marks of Citigroup, licensed for use by Legg Mason as the names of funds and investment managers. Legg Mason and its affiliates, as well as the Fund’s investment manager, are not affiliated with Citigroup.

R. JAY GERKEN, CFA
Chairman, President and Chief Executive Officer
Dear Shareholder,
The U.S. economy appeared to be on solid footing during the six-month reporting period. After gross domestic product (“GDP”) i rose 1.7% in the fourth quarter of 2005—the first quarter in which GDP growth did not surpass 3.0% in nearly three years—the economy rebounded sharply in the first quarter of 2006. During this time, GDP rose 5.6%, its best showing since the third quarter of 2003. Both strong consumer and business spending prompted the economic turnaround. In the second quarter of 2006, GDP growth was a more modest 2.5%, according to the Commerce Department’s initial reading for the period. The decline was largely attributed to lower consumer spending, triggered by higher interest rates and oil prices, as well as a cooling housing market. In addition, business spending fell during the quarter.
The Federal Reserve Board (“Fed”)ii continued to raise interest rates during the reporting period. Despite the “changing of the guard” from Fed Chairman Alan Greenspan to Ben Bernanke in early 2006, it was “business as usual” for the Fed, as it raised short-term interest rates four times during the period. Since it began its tightening campaign in June 2004, the Fed has increased rates 17 consecutive times, bringing the federal funds rateiii from 1.00% to 5.25%. Coinciding with its latest rate hike in June 2006, the Fed said: “The extent and timing of any additional firming…will depend on the evolution of the outlook for both inflation and economic growth, as implied by incoming information.”
Both short- and long-term yields rose over the reporting period. During the six months ended June 30, 2006, two-year Treasury yields increased from 4.41% to 5.16%. Over the same period, 10-year Treasury yields moved from 4.39% to 5.15%. Short-term rates rose in concert with the Fed’s repeated rate hikes, while long-term rates rose on fears
Smith Barney Money Funds, Inc. I
of mounting inflationary pressures. Given the increase in short-term rates, the yields available from money market instruments rose over the six-month reporting period.
Performance Review
As of June 30, 2006, the seven-day current yield for Class A shares of the Smith Barney Money Funds, Inc.—Cash Portfolio was 4.66% and its seven-day effective yield, which reflects compounding, was 4.77%.1 As of June 30, 2006, the seven-day current yield for Class A shares of the Smith Barney Money Funds, Inc.—Government Portfolio was 4.40% and its seven-day effective yield, which reflects compounding, was 4.50%.1
| Smith Barney Money Funds, Inc. Yields as of June 30, 2006 (unaudited) | ||||
| Cash Portfolio1 | Government Portfolio1 | |||
Class A Shares | ||||
Seven-Day Current Yield | 4.66% | 4.40% | ||
Seven-Day Effective Yield | 4.77% | 4.50% | ||
Class C Shares | ||||
Seven-Day Current Yield | 4.42% | 4.57% | ||
Seven-Day Effective Yield | 4.51% | 4.67% | ||
Class Y Shares | ||||
Seven-Day Current Yield | 4.80% | 4.53% | ||
Seven-Day Effective Yield | 4.91% | 4.63% | ||
| The performance shown represents past performance. Past performance is no guarantee of future results and current performance may be higher or lower than the performance shown above. Yields will fluctuate. To obtain performance data current to the most recent month-end for Smith Barney Money Funds, Inc.—Cash Portfolio, please visit our website at www.leggmason.com/InvestorServices. | ||||
| An investment in the Funds is neither insured nor guaranteed by the Federal Deposit Insurance Corporation (“FDIC”) or any other government agency. Although the Funds seek to preserve the value of your investment at $1.00 per share, it is possible to lose money by investing in the Funds. | ||||
| 1 | The seven-day current yield reflects the amount of income generated by the investment during that seven-day period and assumes that the income is generated each week over a 365-day period. The yield is shown as a percentage of the investment. The seven-day effective yield is calculated similarly to the seven-day current yield but, when annualized, the income earned by an investment in the Fund is assumed to be reinvested. The effective yield typically will be slightly higher than the current yield because of the compounding effect of the assumed reinvestment. |
II Smith Barney Money Funds, Inc.
Special Shareholder Notices
As part of the continuing effort to integrate investment products managed by the advisers acquired with Citigroup’s asset management business, Legg Mason, Inc. (“Legg Mason”) has recommended various Fund actions in order to streamline product offerings, eliminate redundancies and improve efficiencies within the organization. At Board meetings held during June and July 2006, the Funds’ Board reviewed and approved these recommendations, and provided authorization to move ahead with proxy solicitations for those matters needing shareholder approval.
The Funds’ Board has approved the appointment of Legg Mason Partners Fund Advisor, LLC (“LMPFA”) as the Funds’ investment manager effective August 1, 2006. The Funds’ Board has also approved the appointment of Western Asset Management Company (“Western Asset”) as the Funds’ subadviser effective August 1, 2006. The portfolio managers who are responsible for the day-to-day management of the Funds remain the same immediately prior to and immediately after the date of these changes. LMPFA and Western Asset are wholly-owned subsidiaries of Legg Mason.
Information About Your Funds
As you may be aware, several issues in the mutual fund industry have come under the scrutiny of federal and state regulators. Affiliates of the Funds’ Manager have, in recent years, received requests for information from various government regulators regarding market timing, late trading, fees, and other mutual fund issues in connection with various investigations. The regulators appear to be examining, among other things, the Funds’ response to market timing and shareholder exchange activity, including compliance with prospectus disclosure related to these subjects. The Funds are not in a position to predict the outcome of these requests and investigations.
Important information with regard to recent regulatory developments that may affect the Funds is contained in the Notes to Financial Statements included in this report.
Smith Barney Money Funds, Inc. III
As always, thank you for your confidence in our stewardship of your assets. We look forward to helping you meet your financial goals.
Sincerely,

R. Jay Gerken, CFA
Chairman, President and Chief Executive Officer
July 28, 2006
The information provided is not intended to be a forecast of future events, a guarantee of future results or investment advice. Views expressed may differ from those of the firm as a whole.
RISKS: An investment in a money market fund is neither insured nor guaranteed by the FDIC or any other government agency. Although the Funds seek to preserve the value of your investment at one dollar per share. It is possible to lose money by investing in the Funds. Please see the Funds’ prospectus for more information on these and other risks.
| i | Gross domestic product is a market value of goods and services produced by labor and property in a given country. |
| ii | The Federal Reserve Board is responsible for the formulation of a policy designed to promote economic growth, full employment, stable prices, and a sustainable pattern of international trade and payments. |
| iii | The federal funds rate is the interest rate that banks with excess reserves at a Federal Reserve district bank charge other banks that need overnight loans. |
IV Smith Barney Money Funds, Inc.
Fund at a Glance (unaudited)
Smith Barney Money Funds, Inc. 2006 Semi-Annual Report 1
Fund at a Glance (unaudited) (continued)

2 Smith Barney Money Funds, Inc. 2006 Semi-Annual Report
Example
As a shareholder of the Fund, you may incur two types of costs: (1) transaction costs and (2) ongoing costs, including management fees; distribution and/or service (12b-1) fees; and other Fund expenses. This example is intended to help you understand your ongoing costs (in dollars) of investing in the Fund and to compare these costs with the ongoing costs of investing in other mutual funds.
This example is based on an investment of $1,000 invested on January 1, 2006 and held for the six months ended June 30, 2006.
Actual Expenses
The table below titled “Based on Actual Total Return” provides information about actual account values and actual expenses. You may use the information provided in this table, together with the amount you invested, to estimate the expenses that you paid over the period. To estimate the expenses you paid on your account, divide your ending account value by $1,000 (for example, an $8,600 ending account value divided by $1,000 = 8.6), then multiply the result by the number under the heading entitled “Expenses Paid During the Period.”
| Based on Actual Total Return(1) | |||||||||||||||
| Actual Total Return(2) | Beginning Account Value | Ending Account Value | Annualized Expense Ratio | Expenses Paid During the Period(3) | |||||||||||
Cash Portfolio: | |||||||||||||||
Class A | 2.13 | % | $ | 1,000.00 | $ | 1,021.30 | 0.48 | % | $ | 2.41 | |||||
Class C | 2.05 | 1,000.00 | 1,020.50 | 0.58 | 2.91 | ||||||||||
Class Y | 2.18 | 1,000.00 | 1,021.80 | 0.37 | 1.85 | ||||||||||
Government Portfolio: | |||||||||||||||
Class A | 2.03 | 1,000.00 | 1,020.30 | 0.55 | 2.76 | ||||||||||
Class C | 2.06 | 1,000.00 | 1,020.60 | 0.69 | 3.46 | ||||||||||
Class Y | 2.08 | 1,000.00 | 1,020.80 | 0.44 | 2.20 | ||||||||||
| (1) | For the six months ended June 30, 2006. |
| (2) | Assumes reinvestment of all distributions, including returns of capital, if any, at net asset value. Total return is not annualized, as it may not be representative of the total return for the year. Performance figures may reflect fee waivers and/or expense reimbursements. Past performance is no guarantee of future results. In the absence of fee waivers and/or expense reimbursements, the total return would have been lower. |
| (3) | Expenses (net of fee waivers and/or expense reimbursements) are equal to each class’ respective annualized expense ratio multiplied by the average account value over the period, multiplied by the number of days in the most recent fiscal half-year, then divided by 365. |
Smith Barney Money Funds, Inc. 2006 Semi-Annual Report 3
Fund Expenses (unaudited) (continued)
Hypothetical Example for Comparison Purposes
The table below titled “Based on Hypothetical Total Return” provides information about hypothetical account values and hypothetical expenses based on the actual expense ratio and an assumed rate of return of 5.00% per year before expenses, which is not the Fund’s actual return. The hypothetical account values and expenses may not be used to estimate the actual ending account balance or expenses you paid for the period. You may use the information provided in this table to compare the ongoing costs of investing in the Fund and other funds. To do so, compare the 5.00% hypothetical example relating to the Fund with the 5.00% hypothetical examples that appear in the shareholder reports of the other funds.
Please note that the expenses shown in the table below are meant to highlight your ongoing costs only and do not reflect any transactional costs. Therefore, the table is useful in comparing ongoing costs only, and will not help you determine the relative total costs of owning different funds. In addition, if these transaction costs were included, your costs would have been higher.
| Based on Hypothetical Total Return(1) | |||||||||||||||
| Hypothetical Annualized Total Return | Beginning Account Value | Ending Account Value | Annualized Expense Ratio | Expenses Paid During the Period(2) | |||||||||||
Cash Portfolio: | |||||||||||||||
Class A | 5.00 | % | $ | 1,000.00 | $ | 1,022.41 | 0.48 | % | $ | 2.41 | |||||
Class C | 5.00 | 1,000.00 | 1,021.92 | 0.58 | 2.91 | ||||||||||
Class Y | 5.00 | 1,000.00 | 1,022.96 | 0.37 | 1.86 | ||||||||||
Government Portfolio: | |||||||||||||||
Class A | 5.00 | 1,000.00 | 1,022.07 | 0.55 | 2.76 | ||||||||||
Class C | 5.00 | 1,000.00 | 1,021.37 | 0.69 | 3.46 | ||||||||||
Class Y | 5.00 | 1,000.00 | 1,022.61 | 0.44 | 2.21 | ||||||||||
| (1) | For the six months ended June 30, 2006. |
| (2) | Expenses (net of fee waivers and/or expense reimbursements) are equal to each class’ respective annualized expense ratio multiplied by the average account value over the period, multiplied by the number of days in the most recent fiscal half-year, then divided by 365. |
4 Smith Barney Money Funds, Inc. 2006 Semi-Annual Report
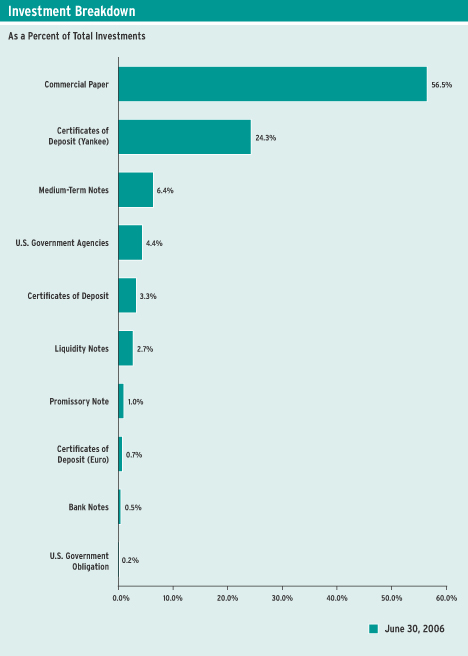
Schedules of Investments (June 30, 2006) (unaudited)
CASH PORTFOLIO
| Face Amount | Security | Value | |||||
| SHORT-TERM INVESTMENTS — 100.1% | |||||||
| Commercial Paper — 56.5% | |||||||
ABN AMRO North America Finance: | |||||||
| $ | 20,058,000 | 5.272% due 7/14/06 (a) | $ | 20,019,901 | |||
| 28,000,000 | 5.212% due 7/19/06 (a) | 27,927,340 | |||||
Amstel Funding Corp.: | |||||||
| 130,811,000 | 4.901% due 8/18/06 (a)(b) | 129,976,426 | |||||
| 182,473,000 | 4.938% due 8/25/06 (a)(b) | 181,129,289 | |||||
| 101,308,000 | 5.138% due 10/6/06 (a)(b) | 99,940,426 | |||||
| 74,232,000 | 5.209% due 10/27/06 (a)(b) | 72,995,955 | |||||
| 67,500,000 | ANZ Delaware Inc., 5.345% due 12/5/06 (a) | 65,967,778 | |||||
Aquinas Funding LLC: | |||||||
| 49,231,000 | 5.324% due 7/24/06 (a)(b) | 49,064,298 | |||||
| 35,650,000 | 5.403% due 12/11/06 (a)(b) | 34,800,956 | |||||
| 40,000,000 | 5.530% due 12/18/06 (a)(b) | 38,983,778 | |||||
Atomium Funding Corp.: | |||||||
| 50,000,000 | 5.180% due 7/10/06 (a)(b) | 49,935,500 | |||||
| 85,000,000 | 5.274% due 7/20/06 (a)(b) | 84,764,479 | |||||
| 100,000,000 | 5.324% due 7/24/06 (a)(b) | 99,661,389 | |||||
| 100,000,000 | Barton Capital Corp., 5.285% due 8/3/06 (a)(b) | 99,518,750 | |||||
Bavaria TRR Corp.: | |||||||
| 40,740,000 | 5.139% due 7/5/06 (a)(b) | 40,716,823 | |||||
| 100,000,000 | 5.321% due 7/7/06 (a)(b) | 99,911,500 | |||||
| 37,000,000 | 5.329% due 7/7/06 (a)(b) | 36,967,193 | |||||
| 86,200,000 | 5.181% due 7/10/06 (a)(b) | 86,088,802 | |||||
| 32,000,000 | 5.212% due 7/12/06 (a)(b) | 31,949,253 | |||||
| 181,700,000 | 5.303% due 7/20/06 (a)(b) | 181,193,663 | |||||
| 111,500,000 | 5.363% due 7/28/06 (a)(b) | 111,053,443 | |||||
| 98,250,000 | Bear Stearns Co., 5.393% due 7/3/06 (c) | 98,250,000 | |||||
Beethoven Funding Corp.: | |||||||
| 59,933,000 | 5.292% due 7/17/06 (a)(b) | 59,792,624 | |||||
| 106,785,000 | 5.263% due 7/21/06 (a)(b) | 106,474,434 | |||||
| 80,000,000 | 5.334% due 7/27/06 (a)(b) | 79,693,200 | |||||
| 150,000,000 | 5.346% due 7/31/06 (a)(b) | 149,335,000 | |||||
Belmont Funding LLC: | |||||||
| 150,000,000 | 5.283% due 7/20/06 (a)(b) | 149,583,583 | |||||
| 98,000,000 | 5.334% due 7/28/06 (a)(b) | 97,609,715 | |||||
Berkeley Square Finance LLC: | |||||||
| 100,441,000 | 5.278% due 7/20/06 (a)(b) | 100,162,430 | |||||
| 116,483,000 | 5.304% due 7/20/06 (a)(b) | 116,158,401 | |||||
| 70,000,000 | 5.346% due 7/24/06 (a)(b) | 69,761,854 | |||||
| 100,000,000 | 5.087% due 12/5/06 (b) | 99,982,747 | |||||
Brahms Funding Corp.: | |||||||
| 50,258,000 | 5.126% due 7/5/06 (a)(b) | 50,229,520 | |||||
| 94,870,000 | 5.192% due 7/11/06 (a)(b) | 94,733,756 | |||||
| 87,000,000 | 5.392% due 7/14/06 (a)(b) | 86,830,978 | |||||
See Notes to Financial Statements.
Smith Barney Money Funds, Inc. 2006 Semi-Annual Report 5
Schedules of Investments (June 30, 2006) (unaudited) (continued)
| Face Amount | Security | Value | |||||
| Commercial Paper — 56.5% (continued) | |||||||
Chesham Finance LLC: | |||||||
| $ | 100,000,000 | 5.273% due 7/24/06 (a)(b) | $ | 99,997,954 | |||
| 25,303,000 | 5.118% due 10/2/06 (a)(b) | 24,976,823 | |||||
| 44,000,000 | 5.171% due 10/16/06 (a)(b) | 43,340,880 | |||||
| 49,000,000 | 5.050% due 11/20/06 (b) | 48,994,396 | |||||
| 104,780,000 | Clipper Receivables Co. LLC, 5.317% due 7/27/06 (a) | 104,379,682 | |||||
Cobbler Funding LLC: | |||||||
| 57,477,000 | 5.333% due 7/25/06 (a)(b) | 57,273,531 | |||||
| 77,150,000 | 5.330% due 9/11/06 (a)(b) | 76,338,382 | |||||
| 11,770,000 | 5.296% due 9/15/06 (a)(b) | 11,640,295 | |||||
| 84,250,000 | 5.408% due 9/15/06 (a)(b) | 83,301,111 | |||||
| 31,254,000 | 5.441% due 9/15/06 (a)(b) | 30,899,684 | |||||
| 156,620,000 | Concord Minuteman Capital Co., 5.181% due 7/14/06 (a)(b) | 156,328,448 | |||||
| 85,000,000 | Crown Point Capital Co., 4.705% due 7/18/06 (a)(b) | 84,815,361 | |||||
Cullinan Finance Corp.: | |||||||
| 100,000,000 | 5.333% due 7/28/06 (a)(b) | 99,601,750 | |||||
| 82,000,000 | 5.208% due 8/30/06 (a)(b) | 81,297,533 | |||||
| 50,000,000 | 5.176% due 9/21/06 (a)(b) | 49,422,583 | |||||
| 27,285,000 | 5.270% due 11/20/06 (a)(b) | 26,732,888 | |||||
Curzon Funding LLC: | |||||||
| 90,000,000 | 5.272% due 7/18/06 (a)(b) | 89,776,875 | |||||
| 45,000,000 | 5.334% due 7/28/06 (a)(b) | 44,820,788 | |||||
| 51,000,000 | Danske Corp., 5.016% due 9/29/06 (a) | 50,376,525 | |||||
| 250,000,000 | Dexia Delaware LLC, 5.316% due 7/31/06 (a) | 248,897,917 | |||||
| 30,000,000 | East-Fleet Finance LLC, 5.303% due 7/21/06 (a)(b) | 29,912,000 | |||||
Ebury Finance LLC: | |||||||
| 115,000,000 | 5.186% due 7/5/06 (a)(b) | 114,933,939 | |||||
| 100,000,000 | 5.366% due 7/6/06 (a)(b) | 99,925,556 | |||||
| 40,000,000 | 4.658% due 7/7/06 (a)(b) | 39,969,667 | |||||
| 80,000,000 | 5.181% due 10/16/06 (a)(b) | 78,799,222 | |||||
| 82,000,000 | 5.214% due 10/27/06 (a)(b) | 80,634,609 | |||||
| 229,600,000 | 5.236% due 11/16/06 (a)(b) | 225,111,320 | |||||
| 100,000,000 | Eramus Capital Corp., 5.311% due 7/20/06 (a)(b) | 99,720,806 | |||||
Fenway Funding LLC: | |||||||
| 39,726,000 | 5.452% due 7/3/06 (a)(b) | 39,713,972 | |||||
| 100,000,000 | 5.321% due 7/17/06 (a)(b) | 99,764,444 | |||||
| 100,000,000 | Gemini Securitization LLC, 5.335% due 7/31/06 (a)(b) | 99,557,500 | |||||
| 50,000,000 | General Electric Capital Corp., 4.868% due 7/7/06 (a) | 49,960,083 | |||||
Georgetown Funding Co. LLC: | |||||||
| 134,740,000 | 5.301% due 7/25/06 (a)(b) | 134,266,164 | |||||
| 110,000,000 | 5.347% due 7/27/06 (a)(b) | 109,577,356 | |||||
Giro Balanced Funding Corp.: | |||||||
| 87,886,000 | 5.140% due 7/5/06 (a)(b) | 87,836,003 | |||||
| 87,868,000 | 5.232% due 7/13/06 (a)(b) | 87,715,403 | |||||
| 100,000,000 | 5.303% due 7/20/06 (a)(b) | 99,721,333 | |||||
See Notes to Financial Statements.
6 Smith Barney Money Funds, Inc. 2006 Semi-Annual Report
Schedules of Investments (June 30, 2006) (unaudited) (continued)
| Face Amount | Security | Value | |||||
| Commercial Paper — 56.5% (continued) | |||||||
Grampian Funding LLC: | |||||||
| $ | 65,000,000 | 4.624% due 7/3/06 (a)(b) | $ | 64,983,678 | |||
| 100,000,000 | 5.002% due 9/12/06 (a)(b) | 99,010,444 | |||||
| 39,500,000 | 5.175% due 10/16/06 (a)(b) | 38,907,116 | |||||
| 88,000,000 | 5.207% due 10/17/06 (a)(b) | 86,656,240 | |||||
| 55,000,000 | 5.165% due 10/25/06 (a)(b) | 54,107,686 | |||||
| 91,250,000 | 5.497% due 12/13/06 (a)(b) | 89,012,474 | |||||
| 50,000,000 | Hannover Funding Co. LLC, 5.315% due 7/25/06 (a)(b) | 49,823,667 | |||||
Harwood Street Funding II: | |||||||
| 150,000,000 | 5.370% due 7/11/06 (a)(b) | 149,776,667 | |||||
| 160,362,000 | 5.390% due 7/11/06 (a)(b) | 160,122,348 | |||||
| 50,000,000 | Indymac Bank FSB, 5.222% due 7/11/06 (a) | 49,927,778 | |||||
ING U.S. Funding LLC: | |||||||
| 74,000,000 | 5.194% due 10/27/06 (a) | 72,772,669 | |||||
| 68,000,000 | 5.196% due 10/30/06 (a) | 66,843,509 | |||||
| 30,460,000 | Legacy Capital Co., 5.338% due 7/19/06 (a)(b) | 30,378,976 | |||||
Liberty Street Funding Corp.: | |||||||
| 80,000,000 | 5.321% due 7/10/06 (a)(b) | 79,893,800 | |||||
| 75,000,000 | 5.244% due 7/17/06 (a)(b) | 74,826,000 | |||||
| 80,981,000 | 5.265% due 7/19/06 (a)(b) | 80,768,830 | |||||
| 24,250,000 | Main Street Warehouse Funding, 5.334% due 7/17/06 (a)(b) | 24,192,770 | |||||
Mane Funding Corp.: | |||||||
| 100,461,000 | 5.314% due 7/24/06 (a)(b) | 100,121,470 | |||||
| 78,642,000 | 5.333% due 7/27/06 (a)(b) | 78,340,408 | |||||
Mica Funding LLC: | |||||||
| 165,000,000 | 5.233% due 7/6/06 (a)(b) | 164,880,375 | |||||
| 106,400,000 | 5.173% due 7/10/06 (a)(b) | 106,263,010 | |||||
| 170,000,000 | 5.352% due 7/25/06 (a)(b) | 169,395,933 | |||||
Morrigan TRR Funding LLC: | |||||||
| 75,000,000 | 5.159% due 7/3/06 (a)(b) | 74,978,583 | |||||
| 90,000,000 | 5.213% due 7/12/06 (a)(b) | 89,857,275 | |||||
| 30,000,000 | 5.318% due 7/13/06 (a)(b) | 29,947,000 | |||||
| 70,000,000 | 5.314% due 7/17/06 (a)(b) | 69,835,422 | |||||
| 100,000,000 | 5.366% due 7/17/06 (a)(b) | 99,762,222 | |||||
| 85,000,000 | 5.371% due 7/24/06 (a)(b) | 84,709,465 | |||||
| 90,292,000 | Nyala Funding LLC, 5.266% due 7/17/06 (a)(b) | 90,081,519 | |||||
Old Line Funding Corp.: | |||||||
| 57,324,000 | 5.309% due 7/10/06 (a) | 57,248,046 | |||||
| 37,000,000 | 5.293% due 8/2/06 (a) | 36,827,004 | |||||
| 50,000,000 | 5.285% due 8/3/06 (a) | 49,759,375 | |||||
Ormond Quay Funding LLC: | |||||||
| 75,000,000 | 5.168% due 7/7/06 (a)(b) | 74,935,625 | |||||
| 100,000,000 | 5.272% due 7/18/06 (a)(b) | 99,752,083 | |||||
| 100,000,000 | 5.314% due 7/24/06 (a)(b) | 99,662,028 | |||||
See Notes to Financial Statements.
Smith Barney Money Funds, Inc. 2006 Semi-Annual Report 7
Schedules of Investments (June 30, 2006) (unaudited) (continued)
| Face Amount | Security | Value | |||||
| Commercial Paper — 56.5% (continued) | |||||||
Perry Global Funding LLC: | |||||||
| $ | 75,000,000 | 4.982% due 7/5/06 (a)(b) | $ | 74,959,000 | |||
| 50,157,000 | 5.292% due 11/10/06 (a)(b) | 49,206,190 | |||||
| 129,600,000 | Picaros Funding LLC, 4.832% due 8/3/06 (a)(b) | 129,039,264 | |||||
Polonius Inc.: | |||||||
| 47,665,000 | 5.322% due 7/21/06 (a)(b) | 47,524,653 | |||||
| 30,000,000 | 5.129% due 9/18/06 (a)(b) | 29,669,517 | |||||
| 65,170,000 | 5.245% due 10/23/06 (a)(b) | 64,109,250 | |||||
| 30,000,000 | Rabobank USA Financial Corp., 5.183% due 7/10/06 (a) | 29,961,225 | |||||
Regency Markets No. 1 LLC: | |||||||
| 120,000,000 | 5.312% due 7/21/06 (a)(b) | 119,647,333 | |||||
| 70,000,000 | 5.342% due 7/24/06 (a)(b) | 69,762,078 | |||||
Saint Germain Holdings Inc.: | |||||||
| 50,000,000 | 5.355% due 7/31/06 (a)(b) | 49,777,917 | |||||
| 70,000,000 | 5.342% due 8/3/06 (a)(b) | 69,659,275 | |||||
Sigma Finance Inc.: | |||||||
| 34,000,000 | 4.958% due 8/9/06 (a)(b) | 33,820,990 | |||||
| 99,250,000 | 5.498% due 12/13/06 (a)(b) | 96,816,307 | |||||
Societe Generale North America: | |||||||
| 11,678,000 | 5.302% due 7/3/06 (a) | 11,674,562 | |||||
| 65,000,000 | 5.227% due 11/13/06 (a) | 63,759,313 | |||||
| 41,051,000 | 5.229% due 11/13/06 (a) | 40,266,669 | |||||
Solitaire Funding LLC: | |||||||
| 105,000,000 | 5.317% due 7/21/06 (a)(b) | 104,690,833 | |||||
| 38,000,000 | 5.330% due 7/31/06 (a)(b) | 37,832,008 | |||||
| 50,000,000 | 5.162% due 10/12/06 (a)(b) | 49,280,431 | |||||
| 60,000,000 | 5.203% due 10/23/06 (a)(b) | 59,034,800 | |||||
Stanfield Victoria Funding LLC: | |||||||
| 100,000,000 | 5.133% due 10/10/06 (a)(b) | 98,597,222 | |||||
| 50,000,000 | 5.177% due 10/25/06 (a)(b) | 49,188,000 | |||||
Strand Capital LLC: | |||||||
| 125,000,000 | 4.852% due 8/1/06 (a)(b) | 124,489,792 | |||||
| 70,000,000 | 5.022% due 9/12/06 (a)(b) | 69,304,472 | |||||
| 86,700,000 | Svenska Handlesbanken Inc., 5.139% due 8/22/06 (a) | 86,065,067 | |||||
Tasman Funding Inc.: | |||||||
| 28,250,000 | 5.229% due 7/10/06 (a)(b) | 28,213,204 | |||||
| 70,000,000 | 5.192% due 7/12/06 (a)(b) | 69,889,419 | |||||
| 80,000,000 | 5.344% due 7/26/06 (a)(b) | 79,704,444 | |||||
| 115,000,000 | 5.516% due 9/29/06 (a)(b) | 113,436,000 | |||||
Thames Asset Global Securitization Inc.: | |||||||
| 85,000,000 | 5.289% due 7/7/06 (a)(b) | 84,925,200 | |||||
| 88,472,000 | 4.920% due 7/14/06 (a)(b) | 88,317,371 | |||||
| 95,484,000 | 5.316% due 7/20/06 (a)(b) | 95,216,910 | |||||
| 25,000,000 | Thornburg Mortgage Capital Resource, 5.403% due 7/28/06 (a)(b) | 24,899,125 | |||||
| 40,439,000 | Three Pillars Funding Corp., 4.941% due 7/14/06 (a)(b) | 40,368,030 | |||||
| 113,359,000 | Tulip Funding Corp., 5.356% due 7/7/06 (a) | 113,257,922 | |||||
See Notes to Financial Statements.
8 Smith Barney Money Funds, Inc. 2006 Semi-Annual Report
Schedules of Investments (June 30, 2006) (unaudited) (continued)
| Face Amount | Security | Value | |||||
| Commercial Paper — 56.5% (continued) | |||||||
UBS Finance Delaware LLC: | |||||||
| $ | 20,300,000 | 5.125% due 7/5/06 (a) | $ | 20,288,474 | |||
| 30,000,000 | 5.123% due 7/10/06 (a) | 29,961,750 | |||||
| 147,000,000 | 5.310% due 7/31/06 (a) | 146,352,588 | |||||
| 55,150,000 | 5.305% due 8/7/06 (a) | 54,851,286 | |||||
| 23,510,000 | 5.311% due 8/21/06 (a) | 23,334,811 | |||||
| 50,000,000 | 4.900% due 11/3/06 (a) | 49,179,340 | |||||
Victory Receivable Corp.: | |||||||
| 100,000,000 | 5.250% due 7/12/06 (a)(b) | 99,840,194 | |||||
| 57,081,000 | 5.233% due 7/14/06 (a)(b) | 56,973,608 | |||||
| 50,000,000 | 5.332% due 7/25/06 (a)(b) | 49,823,000 | |||||
| 85,000,000 | 5.283% due 8/1/06 (a)(b) | 84,615,729 | |||||
Total Commercial Paper | 11,951,444,035 | ||||||
| Bank Notes — 0.5% | |||||||
Bank of America Corp.: | |||||||
| 50,000,000 | 4.980% due 9/5/06 | 50,000,000 | |||||
| 50,000,000 | 5.220% due 11/15/06 | 50,000,000 | |||||
Total Bank Notes | 100,000,000 | ||||||
| Certificates Of Deposit — 3.3% | |||||||
| 38,000,000 | HSBC Bank USA, 3.990% due 7/17/06 | 38,000,000 | |||||
| 20,000,000 | HSBC Bank USA, 3.995% due 7/18/06 | 20,000,000 | |||||
Wells Fargo Bank NA: | |||||||
| 86,000,000 | 5.160% due 7/13/06 | 86,000,000 | |||||
| 25,000,000 | 4.010% due 7/24/06 | 24,998,081 | |||||
| 124,000,000 | 5.240% due 7/24/06 | 123,999,212 | |||||
| 15,000,000 | 5.290% due 7/24/06 | 15,000,000 | |||||
| 150,000,000 | 5.310% due 7/25/06 | 150,000,000 | |||||
| 90,000,000 | 4.800% due 1/16/07 | 90,013,607 | |||||
| 87,000,000 | 4.800% due 1/29/07 | 86,980,470 | |||||
| 55,000,000 | 4.860% due 1/31/07 | 55,000,000 | |||||
| 10,000,000 | 4.865% due 1/31/07 | 9,999,717 | |||||
Total Certificates of Deposit | 699,991,087 | ||||||
| Certificates Of Deposit (Euro) — 0.7% | |||||||
Societe Generale London: | |||||||
| 45,000,000 | 4.000% due 7/19/06 | 44,999,342 | |||||
| 100,000,000 | 5.190% due 11/20/06 | 99,970,589 | |||||
Total Certificates of Deposit (Euro) | 144,969,931 | ||||||
| Certificates of Deposit (Yankee) — 24.3% | |||||||
| 40,000,000 | ABN Amro Bank Chicago NV, 4.435% due 10/12/06 | 40,000,000 | |||||
Bank Nova Scotia: | |||||||
| 45,000,000 | 4.700% due 9/29/06 | 45,000,000 | |||||
| 35,000,000 | 4.860% due 1/30/07 | 34,995,923 | |||||
See Notes to Financial Statements.
Smith Barney Money Funds, Inc. 2006 Semi-Annual Report 9
Schedules of Investments (June 30, 2006) (unaudited) (continued)
| Face Amount | Security | Value | |||||
| Certificates of Deposit (Yankee) — 24.3% (continued) | |||||||
Bank of America NA: | |||||||
| $ | 122,000,000 | 5.020% due 7/21/06 | $ | 122,000,000 | |||
| 100,000,000 | 5.280% due 8/7/06 | 100,000,000 | |||||
| 191,000,000 | 4.910% due 8/23/06 | 191,000,000 | |||||
| 100,000,000 | 5.000% due 9/12/06 | 100,000,000 | |||||
| 94,000,000 | 5.090% due 10/2/06 | 94,000,000 | |||||
Barclays Bank PLC NY: | |||||||
| 98,000,000 | 4.900% due 7/17/06 | 98,000,000 | |||||
| 48,500,000 | 5.100% due 7/18/06 | 48,500,000 | |||||
| 99,000,000 | 5.125% due 7/24/06 | 99,000,000 | |||||
| 49,000,000 | 5.140% due 7/24/06 | 49,000,000 | |||||
| 100,000,000 | 5.200% due 8/31/06 | 100,000,000 | |||||
BNP Paribas NY Branch: | |||||||
| 100,000,000 | 5.000% due 9/27/06 | 100,000,000 | |||||
| 125,000,000 | 5.205% due 11/3/06 | 125,000,000 | |||||
| 75,000,000 | 5.075% due 12/8/06 | 75,000,000 | |||||
Calyon NY: | |||||||
| 100,000,000 | 4.815% due 7/14/06 | 100,000,000 | |||||
| 33,500,000 | 4.845% due 8/9/06 | 33,500,000 | |||||
| 148,000,000 | 5.000% due 9/27/06 | 148,000,000 | |||||
| 35,000,000 | 4.750% due 10/26/06 | 35,000,000 | |||||
| 63,500,000 | 5.200% due 3/30/07 | 63,486,330 | |||||
Credit Suisse New York: | |||||||
| 100,000,000 | 5.300% due 7/26/06 | 100,000,000 | |||||
| 190,000,000 | 5.110% due 8/8/06 | 190,000,000 | |||||
| 67,500,000 | 5.160% due 10/18/06 | 67,500,000 | |||||
| 65,000,000 | 4.700% due 11/3/06 | 65,000,000 | |||||
Depfa Bank PLC: | |||||||
| 28,000,000 | 5.070% due 7/17/06 | 28,000,000 | |||||
| 87,250,000 | 5.220% due 7/17/06 | 87,250,000 | |||||
| 45,000,000 | 4.020% due 7/18/06 | 45,000,000 | |||||
| 53,750,000 | 4.160% due 8/4/06 | 53,750,000 | |||||
| 60,800,000 | 4.220% due 8/11/06 | 60,800,000 | |||||
Deutsche Bank NY: | |||||||
| 75,000,000 | 4.625% due 7/6/06 | 75,000,000 | |||||
| 10,000,000 | 4.000% due 7/21/06 | 10,000,000 | |||||
| 75,000,000 | 4.250% due 8/9/06 | 75,000,000 | |||||
| 105,000,000 | 4.970% due 9/18/06 | 105,000,000 | |||||
| 75,000,000 | 4.730% due 11/6/06 | 75,000,000 | |||||
| 288,100,000 | Dexia Credit Local NY, 5.210% due 10/5/06 | 288,100,000 | |||||
| 242,100,000 | Dresdner Bank NY, 5.280% due 7/24/06 | 242,100,000 | |||||
Fortis Bank NY: | |||||||
| 144,600,000 | 5.080% due 7/5/06 | 144,600,000 | |||||
| 40,000,000 | 5.160% due 7/14/06 | 40,000,000 | |||||
| 24,000,000 | 5.290% due 7/31/06 | 24,000,000 | |||||
| 190,000,000 | 5.300% due 7/31/06 | 190,000,000 | |||||
See Notes to Financial Statements.
10 Smith Barney Money Funds, Inc. 2006 Semi-Annual Report
Schedules of Investments (June 30, 2006) (unaudited) (continued)
| Face Amount | Security | Value | |||||
| Certificates of Deposit (Yankee) — 24.3% (continued) | |||||||
| $ | 100,000,000 | 4.140% due 8/4/06 | $ | 100,000,000 | |||
| 93,000,000 | 5.225% due 4/4/07 | 93,000,000 | |||||
HBOS Treasury Services NY: | |||||||
| 80,000,000 | 4.010% due 7/20/06 | 79,994,162 | |||||
| 50,000,000 | 4.700% due 9/29/06 | 50,000,000 | |||||
| 92,000,000 | 4.750% due 10/24/06 | 92,001,418 | |||||
| 89,200,000 | 5.255% due 4/5/07 | 89,203,270 | |||||
Nordea Bank Finland NY: | |||||||
| 88,500,000 | 4.930% due 8/28/06 | 88,500,000 | |||||
| 94,500,000 | 5.260% due 12/7/06 | 94,500,000 | |||||
Royal Bank of Canada NY: | |||||||
| 153,000,000 | 4.815% due 7/14/06 | 153,000,000 | |||||
| 74,500,000 | 4.030% due 7/24/06 | 74,496,803 | |||||
Royal Bank of Scotland NY: | |||||||
| 75,000,000 | 4.620% due 7/6/06 | 75,000,000 | |||||
| 20,000,000 | 4.225% due 8/15/06 | 20,000,000 | |||||
| 79,000,000 | 4.640% due 11/1/06 | 79,000,000 | |||||
| 32,900,000 | Societe Generale London, 4.830% due 10/31/06 | 32,900,000 | |||||
Svenska Handelsbanken NY: | |||||||
| 81,100,000 | 5.260% due 7/24/06 | 81,100,000 | |||||
| 23,000,000 | 4.782% due 12/5/06 | 22,992,934 | |||||
Toronto Dominion Bank NY: | |||||||
| 77,000,000 | 5.300% due 7/31/06 | 77,000,000 | |||||
| 16,500,000 | 5.170% due 9/18/06 | 16,500,000 | |||||
| 61,500,000 | 5.230% due 3/30/07 | 61,500,000 | |||||
| Total Certificates of Deposit (Yankee) | 5,148,270,840 | ||||||
| Liquidity Notes — 2.8% | |||||||
Albis Capital Corp.: | |||||||
| 41,000,000 | 5.146% due 7/7/06 (a)(b) | 40,965,150 | |||||
| 18,800,000 | 5.130% due 7/10/06 (a)(b) | 18,776,171 | |||||
| 60,000,000 | 5.165% due 7/17/06 (a)(b) | 59,863,467 | |||||
| 200,000,000 | Fenway Funding LLC, 5.394% due 7/27/06 (a) | 199,224,333 | |||||
Harwood Street Funding I: | |||||||
| 40,000,000 | 5.334% due 8/2/06 (a)(b) | 39,811,556 | |||||
| 35,000,000 | 5.405% due 8/10/06 (a)(b) | 34,791,167 | |||||
| 45,157,000 | Harwood Street Funding II, 5.360% due 7/11/06 (a) | 45,089,892 | |||||
| 143,050,000 | Park Sienna LLC, 5.242% due 7/28/06 (a) | 142,491,568 | |||||
| Total Liquidity Notes | 581,013,304 | ||||||
| Medium-Term Notes — 6.4% | |||||||
Cheyne Finance LLC: | |||||||
| 75,000,000 | 5.164% due 7/17/06 (b)(c) | 74,978,486 | |||||
| 100,000,000 | 5.330% due 9/5/06 (b)(c) | 99,986,069 | |||||
| 200,000,000 | 5.169% due 9/15/06 (b)(c) | 199,990,645 | |||||
| 65,000,000 | 5.173% due 10/12/06 (a)(b) | 64,062,700 | |||||
See Notes to Financial Statements.
Smith Barney Money Funds, Inc. 2006 Semi-Annual Report 11
Schedules of Investments (June 30, 2006) (unaudited) (continued)
| Face Amount | Security | Value | |||||
| Medium-Term Notes — 6.4% (continued) | |||||||
| $ | 85,000,000 | Cullinan Finance Corp., 5.130% due 11/15/06 (b)(c) | $ | 84,989,208 | |||
| 300,000,000 | General Electric Capital Corp., 5.352% due 7/17/06 (c) | 300,000,000 | |||||
| 50,000,000 | Harrier Finance Funding LLC, 5.315% due 7/11/06 (b)(c) | 49,986,609 | |||||
Premier Asset Collateralized Entity LLC: | |||||||
| 53,250,000 | 5.303% due 7/25/06 (b)(c) | 53,243,703 | |||||
| 50,000,000 | 5.330% due 8/25/06 (b)(c) | 49,995,507 | |||||
| 55,000,000 | 5.330% due 9/15/06 (b)(c) | 55,000,000 | |||||
Stanfield Victoria Funding: | |||||||
| 100,000,000 | 0.000% due 7/5/06 (b)(c) | 99,980,000 | |||||
| 50,000,000 | 5.159% due 7/17/06 (b)(c) | 49,999,326 | |||||
| 25,000,000 | 5.283% due 7/24/06 (b)(c) | 24,999,525 | |||||
| 50,000,000 | 5.320% due 12/4/06 (b)(c) | 49,995,278 | |||||
| 100,000,000 | 4.780% due 1/16/07 (b) | 99,991,932 | |||||
| Total Medium-Term Notes | 1,357,198,988 | ||||||
| Promissory Note — 1.0% | |||||||
| 200,000,000 | Goldman Sachs Group Inc., 5.260% due 12/19/06 (b) | 200,000,000 | |||||
| U.S. Government Agencies — 4.4% | |||||||
Federal Home Loan Mortgage Corp. (FHLMC), Discount Notes: | |||||||
| 25,000,000 | 3.889% due 7/5/06 (a) | 24,989,597 | |||||
| 80,000,000 | 4.605% due 9/18/06 (a) | 79,220,533 | |||||
| 50,000,000 | 4.610% due 9/27/06 (a) | 49,459,167 | |||||
| 76,000,000 | 4.575% due 11/1/06 (a) | 74,861,362 | |||||
| 50,000,000 | 4.623% due 11/1/06 (a) | 49,244,917 | |||||
| 75,000,000 | 4.669% due 12/1/06 (a) | 73,578,375 | |||||
| 76,500,000 | 4.669% due 12/12/06 (a) | 74,945,690 | |||||
| 140,000,000 | 4.742% due 1/17/07 (a) | 136,476,667 | |||||
| 32,769,000 | Series RB, 5.204% due 4/17/07 (a) | 31,462,336 | |||||
Federal National Mortgage Association (FNMA): | |||||||
Discount Notes: | |||||||
| 85,000,000 | 4.345% due 9/29/06 (a) | 84,114,937 | |||||
| 35,150,000 | 4.643% due 12/29/06 (a) | 34,365,335 | |||||
| 50,000,000 | 4.821% due 1/26/07 (a) | 48,664,722 | |||||
| 23,000,000 | 4.958% due 2/23/07 (a) | 22,284,556 | |||||
| 43,000,000 | 5.111% due 3/6/07 (a) | 41,554,436 | |||||
| 33,500,000 | 5.123% due 3/30/07 (a) | 32,266,083 | |||||
| 75,000,000 | Notes, 5.284% due 9/21/06 (c) | 74,971,559 | |||||
| Total U.S. Government Agencies | 932,460,272 | ||||||
See Notes to Financial Statements.
12 Smith Barney Money Funds, Inc. 2006 Semi-Annual Report
Schedules of Investments (June 30, 2006) (unaudited) (continued)
| Face Amount | Security | Value | |||||
| U.S. Government Obligation — 0.2% | |||||||
| $ | 50,000,000 | U.S. Treasury Bills, 4.730% due 9/14/06 (a) | $ | 49,518,750 | |||
| TOTAL INVESTMENTS — 100.1% (Cost — $21,164,867,207#) | 21,164,867,207 | ||||||
Liabilities in Excess of Other Assets — (0.1)% | (13,406,509 | ) | |||||
| TOTAL NET ASSETS — 100.0% | $ | 21,151,460,698 | |||||
| (a) | Rate shown represents yield to maturity. |
| (b) | Security is exempt from registration under Rule 144A of the Securities Act of 1933. This security may be resold in transactions that are exempt from registration, normally to qualified institutional buyers. This security has been deemed liquid pursuant to guidelines approved by the Board of Directors, unless otherwise noted. |
| (c) | Variable rate security. Interest rate disclosed is that which is in effect at June 30, 2006. |
| # | Aggregate cost for federal income tax purposes is substantially the same. |
See Notes to Financial Statements.
Smith Barney Money Funds, Inc. 2006 Semi-Annual Report 13
Schedules of Investments (June 30, 2006) (unaudited) (continued)
GOVERNMENT PORTFOLIO
| Face Amount | Security | Value | |||||
| SHORT-TERM INVESTMENTS — 98.6% | |||||||
| U.S. Government & Agency Obligations — 93.4% | |||||||
| U.S. Government Agencies — 93.4% | |||||||
Federal Farm Credit Bank (FFCB): | |||||||
| $ | 12,000,000 | 4.999% due 8/1/06 (a) | $ | 12,000,100 | |||
| 25,000,000 | 5.026% due 11/13/06 (a) | 24,997,662 | |||||
Bonds: | |||||||
| 75,000,000 | 5.004% due 7/1/06 (a) | 74,997,533 | |||||
| 55,000,000 | 4.981% due 7/2/06 (a) | 54,989,165 | |||||
| 50,000,000 | 5.110% due 8/11/06 (a) | 50,002,942 | |||||
| 80,000,000 | 5.260% due 12/27/06 (a) | 79,996,080 | |||||
| 25,000,000 | Series 1, 5.230% due 9/27/06 (a) | 24,992,762 | |||||
| 10,000,000 | Discount Notes, 4.017% due 9/13/06 (b) | 9,920,656 | |||||
Series I: | |||||||
| 60,000,000 | 4.969% due 7/1/06 (a) | 59,987,380 | |||||
| 100,000,000 | 5.044% due 7/14/06 (a) | 99,999,278 | |||||
Federal Home Loan Bank (FHLB): | |||||||
| 60,000,000 | Bonds, 4.860% due 7/5/06 (a) | 59,982,042 | |||||
| 20,000,000 | 2.950% due 9/14/06 | 19,950,198 | |||||
Discount Notes: | |||||||
| 50,000,000 | 5.171% due 7/14/06 (b) | 49,907,014 | |||||
| 59,000,000 | 4.973% due 7/19/06 (b) | 58,854,565 | |||||
| 94,848,000 | 5.009% due 7/21/06 (b) | 94,586,114 | |||||
| 103,366,000 | 5.003% due 7/26/06 (b) | 103,009,962 | |||||
| 94,567,000 | 5.049% due 7/28/06 (b) | 94,212,019 | |||||
| 40,000,000 | 5.002% due 8/9/06 (b) | 39,785,933 | |||||
| 50,000,000 | 5.244% due 8/18/06 (b) | 49,653,333 | |||||
| 50,000,000 | Series I, 4.870% due 7/6/06 (a) | 49,980,206 | |||||
Federal Home Loan Mortgage Corp. (FHLMC): | |||||||
Discount Notes: | |||||||
| 25,000,000 | 3.889% due 7/5/06 (b) | 24,989,597 | |||||
| 40,000,000 | 3.930% due 7/5/06 (b) | 39,983,178 | |||||
| 8,645,000 | 4.120% due 8/1/06 (b) | 8,615,521 | |||||
| 65,000,000 | 4.909% due 9/19/06 (b) | 64,308,111 | |||||
| 40,000,000 | 4.929% due 9/19/06 (b) | 39,572,444 | |||||
| 15,000,000 | 4.610% due 9/27/06 (b) | 14,837,750 | |||||
| 30,000,000 | 5.138% due 11/14/06 (b) | 29,433,333 | |||||
| 48,200,000 | 4.677% due 12/1/06 (b) | 47,279,199 | |||||
| 15,000,000 | 4.996% due 12/29/06 (b) | 14,638,000 | |||||
| 15,000,000 | 4.655% due 1/9/07 (b) | 14,644,000 | |||||
| 45,000,000 | 4.764% due 1/17/07 (b) | 43,862,500 | |||||
| 25,000,000 | 4.981% due 2/16/07 (b) | 24,241,319 | |||||
Series RB: | |||||||
| 50,000,000 | 4.605% due 7/25/06 (b) | 49,850,000 | |||||
| 26,072,000 | 5.002% due 8/8/06 (b) | 25,936,049 | |||||
See Notes to Financial Statements.
14 Smith Barney Money Funds, Inc. 2006 Semi-Annual Report
Schedules of Investments (June 30, 2006) (unaudited) (continued)
| Face Amount | Security | Value | |||||
| U.S. Government Agencies — 93.4% (continued) | |||||||
| $ | 9,707,000 | 4.869% due 10/24/06 (b) | $ | 9,560,950 | |||
| 15,000,000 | 5.119% due 10/31/06 (b) | 14,746,342 | |||||
| 30,000,000 | 5.196% due 11/21/06 (b) | 29,396,421 | |||||
| 6,025,000 | 5.173% due 2/6/07 (b) | 5,842,376 | |||||
| 20,000,000 | 5.111% due 3/6/07 (b) | 19,328,333 | |||||
| 42,474,000 | 5.249% due 5/1/07 (b) | 40,684,240 | |||||
| 80,000,000 | Medium-Term Note, 5.188% due 7/27/06 (a) | 79,962,788 | |||||
Federal National Mortgage Association (FNMA): | |||||||
Discount Notes: | |||||||
| 22,500,000 | 4.975% due 7/17/06 (b) | 22,450,700 | |||||
| 50,000,000 | 4.626% due 7/26/06 (b) | 49,843,056 | |||||
| 40,000,000 | 4.085% due 7/28/06 (b) | 39,882,250 | |||||
| 50,000,000 | 4.705% due 8/2/06 (b) | 49,795,733 | |||||
| 95,000,000 | 5.018% due 8/16/06 (b) | 94,398,493 | |||||
| 15,258,000 | 5.068% due 10/18/06 (b) | 15,029,552 | |||||
| 20,000,000 | 4.619% due 10/27/06 (b) | 19,709,589 | |||||
| 11,392,000 | 5.135% due 11/1/06 (b) | 11,196,803 | |||||
| 36,415,000 | 5.178% due 11/15/06 (b) | 35,715,175 | |||||
| 15,299,000 | 4.677% due 12/1/06 (b) | 15,006,732 | |||||
| 50,000,000 | 4.901% due 12/29/06 (b) | 48,819,729 | |||||
| 20,000,000 | 5.022% due 2/23/07 (b) | 19,368,000 | |||||
| 10,094,000 | 5.186% due 2/23/07 (b) | 9,764,397 | |||||
| 30,000,000 | 5.111% due 3/6/07 (b) | 28,991,467 | |||||
| 25,000,000 | 5.345% due 3/30/07 (b) | 24,031,944 | |||||
Notes: | |||||||
| 15,000,000 | 5.312% due 9/22/06 (a) | 14,999,139 | |||||
| 34,400,000 | Series 1, 5.111% due 9/7/06 (a) | 34,397,002 | |||||
| Total U.S. Government & Agency Obligations | 2,286,917,156 | ||||||
| Repurchase Agreement — 5.2% | |||||||
| 127,117,000 | Greenwich Capital Markets Inc. repurchase agreement dated 6/30/06, 5.200% due 7/3/06; Proceeds at maturity — $127,172,084; | 127,117,000 | |||||
| TOTAL INVESTMENTS — 98.6% (Cost — $2,414,034,156#) | 2,414,034,156 | ||||||
Other Assets in Excess of Liabilities — 1.4% | 33,805,485 | ||||||
| TOTAL NET ASSETS — 100.0% | $ | 2,447,839,641 | |||||
| (a) | Variable rate security. Interest rate disclosed is that which is in effect at June 30, 2006. |
| (b) | Rate shown represents yield to maturity. |
| # | Aggregate cost for federal income tax purposes is substantially the same. |
See Notes to Financial Statements.
Smith Barney Money Funds, Inc. 2006 Semi-Annual Report 15
Statements of Assets and Liabilities (June 30, 2006) (unaudited)
| Cash Portfolio | Government Portfolio | |||||||
| ASSETS: | ||||||||
Investments, at amortized cost | $ | 21,164,867,207 | $ | 2,414,034,156 | ||||
Cash | 338 | 449 | ||||||
Receivable for Fund shares sold | 591,052,791 | 73,141,805 | ||||||
Interest receivable | 92,011,485 | 2,995,692 | ||||||
Deferred compensation | 624,368 | 86,416 | ||||||
Prepaid expenses | 420,641 | 202,838 | ||||||
Total Assets | 21,848,976,830 | 2,490,461,356 | ||||||
| LIABILITIES: | ||||||||
Payable for Fund shares repurchased | 587,606,706 | 41,207,433 | ||||||
Payable for securities purchased | 99,980,000 | — | ||||||
Investment management fee payable | 6,657,917 | 850,217 | ||||||
Distributions payable | 1,107,337 | 274,917 | ||||||
Deferred compensation payable | 624,368 | 86,416 | ||||||
Distribution fees payable | 586,902 | 64,965 | ||||||
Directors’ fees payable | 5,965 | 4,495 | ||||||
Accrued expenses | 946,937 | 133,272 | ||||||
Total Liabilities | 697,516,132 | 42,621,715 | ||||||
Total Net Assets | $ | 21,151,460,698 | $ | 2,447,839,641 | ||||
| NET ASSETS: | ||||||||
Par value (Note 5) | $ | 211,517,343 | $ | 24,479,585 | ||||
Paid-in capital in excess of par value | 20,940,464,776 | 2,423,495,567 | ||||||
Undistributed net investment income | 17,232 | 31,789 | ||||||
Accumulated net realized loss on investments | (538,653 | ) | (167,300 | ) | ||||
Total Net Assets | $ | 21,151,460,698 | $ | 2,447,839,641 | ||||
Shares Outstanding: | ||||||||
Class A | 21,010,336,145 | 2,441,765,892 | ||||||
Class C | 33,381 | 2,841 | ||||||
Class Y | 141,364,754 | 6,189,773 | ||||||
Net Asset Value: | ||||||||
Class A | $1.00 | $1.00 | ||||||
Class C | $1.00 | $1.00 | ||||||
Class Y | $1.00 | $1.00 | ||||||
See Notes to Financial Statements.
16 Smith Barney Money Funds, Inc. 2006 Semi-Annual Report
S tatements of Operations (For the six months ended June 30, 2006) (unaudited)
| Cash Portfolio | Government Portfolio | |||||||
| INVESTMENT INCOME: | ||||||||
Interest | $ | 495,878,567 | $ | 54,901,130 | ||||
| EXPENSES: | ||||||||
Investment management fee (Note 2) | 38,813,420 | 5,131,169 | ||||||
Distribution fees (Note 3) | 10,386,584 | 1,185,299 | ||||||
Transfer agent fees (Note 3) | 3,686,032 | 151,251 | ||||||
Insurance | 198,727 | 26,979 | ||||||
Registration fees | 172,411 | 97,637 | ||||||
Shareholder reports (Note 3) | 123,432 | 38,188 | ||||||
Custody fees | 73,638 | 10,139 | ||||||
Directors’ fees | 32,116 | 4,404 | ||||||
Audit and tax | 29,645 | 26,834 | ||||||
Legal fees | 20,530 | 19,327 | ||||||
Miscellaneous expenses | 10,219 | 5,591 | ||||||
Total Expenses | 53,546,754 | 6,696,818 | ||||||
Less: Fee waivers and/or expense reimbursements (Notes 2 and 7) | (2,993,834 | ) | (206,855 | ) | ||||
Net Expenses | 50,552,920 | 6,489,963 | ||||||
Net Investment Income | 445,325,647 | 48,411,167 | ||||||
REALIZED AND UNREALIZED LOSS ON INVESTMENTS (NOTE 1): | ||||||||
Net Realized Loss From Investment Transactions | (520,421 | ) | (167,300 | ) | ||||
Increase in Net Assets From Operations | $ | 444,805,226 | $ | 48,243,867 | ||||
See Notes to Financial Statements.
Smith Barney Money Funds, Inc. 2006 Semi-Annual Report 17
Statements of Changes in Net Assets
| For the six months ended June 30, 2006 (unaudited) and the year ended December 31, 2005 | ||||||||
| Cash Portfolio | 2006 | 2005 | ||||||
| OPERATIONS: | ||||||||
Net investment income | $ | 445,325,647 | $ | 472,369,261 | ||||
Net realized loss | (520,421 | ) | (18,232 | ) | ||||
Increase in Net Assets From Operations | 444,805,226 | 472,351,029 | ||||||
DISTRIBUTIONS TO SHAREHOLDERS FROM (NOTES 1 AND 4): | ||||||||
Net investment income | (445,325,647 | ) | (472,369,261 | ) | ||||
Decrease in Net Assets From | (445,325,647 | ) | (472,369,261 | ) | ||||
| FUND SHARE TRANSACTIONS (NOTE 5): | ||||||||
Net proceeds from sale of shares | 71,669,212,574 | 102,958,638,804 | ||||||
Reinvestment of distributions | 429,028,312 | 457,134,926 | ||||||
Cost of shares repurchased | (68,613,833,704 | ) | (102,994,449,761 | ) | ||||
Increase in Net Assets From Fund Share Transactions | 3,484,407,182 | 421,323,969 | ||||||
Increase in Net Assets | 3,483,886,761 | 421,305,737 | ||||||
NET ASSETS: | ||||||||
Beginning of period | 17,667,573,937 | 17,246,268,200 | ||||||
End of period* | $ | 21,151,460,698 | $ | 17,667,573,937 | ||||
* Includes undistributed net investment income of: | $17,232 | $17,232 | ||||||
See Notes to Financial Statements.
18 Smith Barney Money Funds, Inc. 2006 Semi-Annual Report
Statements of Changes in Net Assets (continued)
| For the six months ended June 30, 2006 (unaudited) and the year ended December 31, 2005 | ||||||||
| Government Portfolio | 2006 | 2005 | ||||||
| OPERATIONS: | ||||||||
Net investment income | $ | 48,411,167 | $ | 60,467,514 | ||||
Net realized gain (loss) | (167,300 | ) | 8,634 | |||||
Increase in Net Assets From Operations | 48,243,867 | 60,476,148 | ||||||
| DISTRIBUTIONS TO SHAREHOLDERS FROM (NOTES 1 AND 4): | ||||||||
Net investment income | (48,411,171 | ) | (60,458,877 | ) | ||||
Net realized gains | — | (8,634 | ) | |||||
Decrease in Net Assets From | (48,411,171 | ) | (60,467,511 | ) | ||||
| FUND SHARE TRANSACTIONS (NOTE 5): | ||||||||
Net proceeds from sale of shares | 6,290,221,716 | 9,602,150,169 | ||||||
Reinvestment of distributions | 45,920,641 | 58,143,963 | ||||||
Cost of shares repurchased | (5,950,563,608 | ) | (9,924,400,746 | ) | ||||
Increase (Decrease) in Net Assets From | 385,578,749 | (264,106,614 | ) | |||||
Increase (Decrease) in Net Assets | 385,411,445 | (264,097,977 | ) | |||||
| NET ASSETS: | ||||||||
Beginning of period | 2,062,428,196 | 2,326,526,173 | ||||||
End of period* | $ | 2,447,839,641 | $ | 2,062,428,196 | ||||
* Includes undistributed net investment income of: | $31,789 | $31,793 | ||||||
See Notes to Financial Statements.
Smith Barney Money Funds, Inc. 2006 Semi-Annual Report 19
For a share of each class of capital stock outstanding throughout each year ended December 31, unless otherwise noted:
| Class A Shares | ||||||||||||||||||||||||
| Cash Portfolio | 2006(1)(2) | 2005(2) | 2004 | 2003 | 2002 | 2001 | ||||||||||||||||||
Net Asset Value, Beginning of | $ | 1.000 | $ | 1.000 | $ | 1.000 | $ | 1.000 | $ | 1.000 | $ | 1.000 | ||||||||||||
Income from Operations: | ||||||||||||||||||||||||
Net investment income | 0.021 | 0.027 | 0.009 | (3) | 0.007 | 0.013 | (3) | 0.037 | (3) | |||||||||||||||
Total Income from Operations | 0.021 | 0.027 | 0.009 | (3) | 0.007 | 0.013 | (3) | 0.037 | (3) | |||||||||||||||
Less Distributions From: | ||||||||||||||||||||||||
Net investment income | (0.021 | ) | (0.027 | ) | (0.009 | )(3) | (0.007 | ) | (0.013 | ) | (0.037 | ) | ||||||||||||
Total Distributions | (0.021 | ) | (0.027 | ) | (0.009 | )(3) | (0.007 | ) | (0.013 | ) | (0.037 | ) | ||||||||||||
Net Asset Value, End of Period | $ | 1.000 | $ | 1.000 | $ | 1.000 | $ | 1.000 | $ | 1.000 | $ | 1.000 | ||||||||||||
Total Return(4) | 2.13 | % | 2.75 | % | 0.90 | % | 0.67 | % | 1.28 | % | 3.78 | % | ||||||||||||
Net Assets, End of Period (billions) | $21 | $18 | $17 | $20 | $23 | $32 | ||||||||||||||||||
Ratios to Average Net Assets: | ||||||||||||||||||||||||
Gross expenses | 0.51 | %(5) | 0.58 | % | 0.59 | % | 0.56 | % | 0.62 | % | 0.59 | % | ||||||||||||
Net expenses(6) | 0.48 | (5)(7) | 0.58 | 0.54 | (7) | 0.56 | 0.62 | 0.59 | ||||||||||||||||
Net investment income | 4.26 | (5) | 2.72 | 0.88 | 0.68 | 1.27 | 3.93 | |||||||||||||||||
| (1) | For the six months ended June 30, 2006 (unaudited). |
| (2) | Per share amounts have been calculated using the average shares method. |
| (3) | Includes short-term capital gains. |
| (4) | Performance figures may reflect fee waivers and/or expense reimbursements. Past performance is no guarantee of future results. In the absence of fee waivers and/or expense reimbursements, the total return would have been lower. Total returns for periods of less than one year are not annualized. |
| (5) | Annualized. |
| (6) | As a result of an expense limitation, the ratio of expenses to average net assets will not exceed 0.70%. |
| (7) | Reflects fee waivers and/or expense reimbursements. |
See Notes to Financial Statements.
20 Smith Barney Money Funds, Inc. 2006 Semi-Annual Report
Financial Highlights (continued)
For a share of each class of capital stock outstanding throughout each year ended December 31, unless otherwise noted:
| Class C Shares | ||||||||||||||||||||||||
| Cash Portfolio | 2006(1)(2) | 2005(2) | 2004 | 2003 | 2002 | 2001 | ||||||||||||||||||
Net Asset Value, Beginning of Period | $ | 1.000 | $ | 1.000 | $ | 1.000 | $ | 1.000 | $ | 1.000 | $ | 1.000 | ||||||||||||
Income from Operations: | ||||||||||||||||||||||||
Net investment income | 0.020 | 0.027 | 0.009 | (3) | 0.007 | 0.013 | (3) | 0.037 | (3) | |||||||||||||||
Total Income from Operations | 0.020 | 0.027 | 0.009 | (3) | 0.007 | 0.013 | (3) | 0.037 | (3) | |||||||||||||||
Less Distributions From: | ||||||||||||||||||||||||
Net investment income | (0.020 | ) | (0.027 | ) | (0.009 | )(3) | (0.007 | ) | (0.013 | ) | (0.037 | ) | ||||||||||||
Total Distributions | (0.020 | ) | (0.027 | ) | (0.009 | )(3) | (0.007 | ) | (0.013 | ) | (0.037 | ) | ||||||||||||
Net Asset Value, End of Period | $ | 1.000 | $ | 1.000 | $ | 1.000 | $ | 1.000 | $ | 1.000 | $ | 1.000 | ||||||||||||
Total Return(4) | 2.05 | % | 2.71 | % | 0.90 | % | 0.67 | % | 1.29 | % | 3.81 | % | ||||||||||||
Net Assets, End of Period (000s) | $33 | $152 | $166 | $381 | $347 | $304 | ||||||||||||||||||
| Ratios to Average Net Assets: | ||||||||||||||||||||||||
Gross expenses | 0.59 | %(5) | 0.63 | % | 0.59 | % | 0.55 | % | 0.61 | % | 0.56 | % | ||||||||||||
Net expenses(6) | 0.58 | (5)(7) | 0.63 | 0.55 | (7) | 0.55 | 0.61 | 0.56 | ||||||||||||||||
Net investment income | 4.03 | (5) | 2.65 | 0.79 | 0.67 | 1.28 | 3.53 | |||||||||||||||||
| (1) | For the six months ended June 30, 2006 (unaudited). |
| (2) | Per share amounts have been calculated using the average shares method. |
| (3) | Includes short-term capital gains. |
| (4) | Performance figures may reflect fee waivers and/or expense reimbursements. Past performance is no guarantee of future results. In the absence of fee waivers and/or expense reimbursements, the total return would have been lower. Total returns for periods of less than one year are not annualized. |
| (5) | Annualized. |
| (6) | As a result of an expense limitation, the ratio of expenses to average net assets will not exceed 0.70%. |
| (7) | Reflects fee waivers and/or expense reimbursements. |
See Notes to Financial Statements.
Smith Barney Money Funds, Inc. 2006 Semi-Annual Report 21
Financial Highlights (continued)
For a share of each class of capital stock outstanding throughout each year ended December 31, unless otherwise noted:
| Class Y Shares | ||||||||||||||||||||||||
| Cash Portfolio | 2006(1)(2) | 2005(2) | 2004 | 2003 | 2002 | 2001 | ||||||||||||||||||
Net Asset Value, Beginning of | $ | 1.000 | $ | 1.000 | $ | 1.000 | $ | 1.000 | $ | 1.000 | $ | 1.000 | ||||||||||||
Income from Operations: | ||||||||||||||||||||||||
Net investment income | 0.022 | 0.029 | 0.010 | (3) | 0.008 | 0.014 | (3) | 0.039 | (3) | |||||||||||||||
Total Income from Operations | 0.022 | 0.029 | 0.010 | (3) | 0.008 | 0.014 | (3) | 0.039 | (3) | |||||||||||||||
Less Distributions From: | ||||||||||||||||||||||||
Net investment income | (0.022 | ) | (0.029 | ) | (0.010 | )(3) | (0.008 | ) | (0.014 | ) | (0.039 | ) | ||||||||||||
Total Distributions | (0.022 | ) | (0.029 | ) | (0.010 | )(3) | (0.008 | ) | (0.014 | ) | (0.039 | ) | ||||||||||||
Net Asset Value, End of Period | $ | 1.000 | $ | 1.000 | $ | 1.000 | $ | 1.000 | $ | 1.000 | $ | 1.000 | ||||||||||||
Total Return(4) | 2.18 | % | 2.91 | % | 1.00 | % | 0.78 | % | 1.45 | % | 3.94 | % | ||||||||||||
Net Assets, End of Period (millions) | $141 | $121 | $86 | $128 | $63 | $60 | ||||||||||||||||||
Ratios to Average Net Assets: | ||||||||||||||||||||||||
Gross expenses | 0.38 | %(5) | 0.43 | % | 0.49 | % | 0.44 | % | 0.45 | % | 0.40 | % | ||||||||||||
Net expenses(6) | 0.37 | (5)(7) | 0.43 | 0.43 | (7) | 0.44 | 0.45 | 0.40 | ||||||||||||||||
Net investment income | 4.37 | (5) | 2.93 | 0.98 | 0.76 | 1.44 | 3.96 | |||||||||||||||||
| (1) | For the six months ended June 30, 2006 (unaudited). |
| (2) | Per share amounts have been calculated using the average shares method. |
| (3) | Includes short-term capital gains. |
| (4) | Performance figures may reflect fee waivers and/or expense reimbursements. Past performance is no guarantee of future results. In the absence of fee waivers and/or expense reimbursements, the total return would have been lower. Total returns for periods of less than one year are not annualized. |
| (5) | Annualized. |
| (6) | As a result of an expense limitation, the ratio of expenses to average net assets will not exceed 0.70%. |
| (7) | Reflects fee waivers and/or expense reimbursements. |
See Notes to Financial Statements.
22 Smith Barney Money Funds, Inc. 2006 Semi-Annual Report
Financial Highlights (continued)
For a share of each class of capital stock outstanding throughout each year ended December 31, unless otherwise noted:
| Class A Shares | ||||||||||||||||||||||||
| Government Portfolio | 2006(1)(2) | 2005(2) | 2004 | 2003 | 2002 | 2001 | ||||||||||||||||||
Net Asset Value, Beginning of Period | $ | 1.000 | $ | 1.000 | $ | 1.000 | $ | 1.000 | $ | 1.000 | $ | 1.000 | ||||||||||||
Income from Operations: | ||||||||||||||||||||||||
Net investment income | 0.020 | 0.027 | (3) | 0.009 | (3) | 0.006 | (3) | 0.012 | (3) | 0.036 | (3) | |||||||||||||
Total Income from Operations | 0.020 | 0.027 | (3) | 0.009 | (3) | 0.006 | (3) | 0.012 | (3) | 0.036 | (3) | |||||||||||||
Less Distributions From: | ||||||||||||||||||||||||
Net investment income | (0.020 | ) | (0.027 | )(3) | (0.009 | )(3) | (0.006 | )(3) | (0.012 | ) | (0.036 | ) | ||||||||||||
Total Distributions | (0.020 | ) | (0.027 | )(3) | (0.009 | )(3) | (0.006 | )(3) | (0.012 | ) | (0.036 | ) | ||||||||||||
Net Asset Value, End of Period | $ | 1.000 | $ | 1.000 | $ | 1.000 | $ | 1.000 | $ | 1.000 | $ | 1.000 | ||||||||||||
Total Return(4) | 2.03 | % | 2.69 | % | 0.85 | % | 0.62 | % | 1.22 | % | 3.67 | % | ||||||||||||
Net Assets, End of Period (billions) | $2 | $2 | $2 | $3 | $3 | $4 | ||||||||||||||||||
| Ratios to Average Net Assets: | ||||||||||||||||||||||||
Gross expenses | 0.56 | %(5) | 0.59 | % | 0.57 | % | 0.56 | % | 0.61 | % | 0.56 | % | ||||||||||||
Net expenses(6) | 0.55 | (5)(7) | 0.59 | 0.54 | (7) | 0.56 | 0.61 | 0.56 | ||||||||||||||||
Net investment income | 4.07 | (5) | 2.63 | 0.82 | 0.63 | 1.21 | 3.74 | |||||||||||||||||
| (1) | For the six months ended June 30, 2006 (unaudited). |
| (2) | Per share amounts have been calculated using the average shares method. |
| (3) | Includes short-term capital gains. |
| (4) | Performance figures may reflect fee waivers and/or expense reimbursements. Past performance is no guarantee of future results. In the absence of fee waivers and/or expense reimbursements, the total return would have been lower. Total returns for periods of less than one year are not annualized. |
| (5) | Annualized. |
| (6) | As a result of an expense limitation, the ratio of expenses to average net assets will not exceed 0.70%. |
| (7) | Reflects fee waivers and/or expense reimbursements. |
See Notes to Financial Statements.
Smith Barney Money Funds, Inc. 2006 Semi-Annual Report 23
Financial Highlights (continued)
For a share of each class of capital stock outstanding throughout each year ended December 31, unless otherwise noted:
| Class C Shares | ||||||||||||||||||||||||
| Government Portfolio | 2006(1)(2) | 2005(2) | 2004 | 2003 | 2002 | 2001 | ||||||||||||||||||
Net Asset Value, Beginning of | $ | 1.000 | $ | 1.000 | $ | 1.000 | $ | 1.000 | $ | 1.000 | $ | 1.000 | ||||||||||||
Income from Operations: | ||||||||||||||||||||||||
Net investment income | 0.020 | 0.025 | (3) | 0.007 | (3) | 0.006 | (3) | 0.012 | (3) | 0.036 | (3) | |||||||||||||
Total Income from Operations | 0.020 | 0.025 | (3) | 0.007 | (3) | 0.006 | (3) | 0.012 | (3) | 0.036 | (3) | |||||||||||||
Less Distributions From: | ||||||||||||||||||||||||
Net investment income | (0.020 | ) | (0.025 | )(3) | (0.007 | )(3) | (0.006 | )(3) | (0.012 | ) | (0.036 | ) | ||||||||||||
Total Distributions | (0.020 | ) | (0.025 | )(3) | (0.007 | )(3) | (0.006 | )(3) | (0.012 | ) | (0.036 | ) | ||||||||||||
Net Asset Value, End of Period | $ | 1.000 | $ | 1.000 | $ | 1.000 | $ | 1.000 | $ | 1.000 | $ | 1.000 | ||||||||||||
Total Return(4) | 2.06 | % | 2.57 | % | 0.73 | % | 0.58 | % | 1.21 | % | 3.68 | % | ||||||||||||
Net Assets, End of Period (000s) | $3 | $3 | $6 | $14 | $131 | $123 | ||||||||||||||||||
Ratios to Average Net Assets: | ||||||||||||||||||||||||
Gross expenses | 0.73 | %(5) | 0.79 | % | 0.76 | % | 0.61 | % | 0.61 | % | 0.63 | % | ||||||||||||
Net expenses(6) | 0.69 | (5)(7) | 0.65 | (7) | 0.65 | (7) | 0.61 | 0.61 | 0.63 | |||||||||||||||
Net investment income | 3.89 | (5) | 2.49 | 0.69 | 0.65 | 1.21 | 3.53 | |||||||||||||||||
| (1) | For the six months ended June 30, 2006 (unaudited). |
| (2) | Per share amounts have been calculated using the average shares method. |
| (3) | Includes short-term capital gains. |
| (4) | Performance figures may reflect fee waivers and/or expense reimbursements. Past performance is no guarantee of future results. In the absence of fee waivers and/or expense reimbursements, the total return would have been lower. Total returns for periods of less than one year are not annualized. |
| (5) | Annualized. |
| (6) | As a result of an expense limitation, the ratio of expenses to average net assets will not exceed 0.70%. |
| (7) | Reflects fee waivers and/or expense reimbursements. |
See Notes to Financial Statements.
24 Smith Barney Money Funds, Inc. 2006 Semi-Annual Report
Financial Highlights (continued)
For a share of each class of capital stock outstanding throughout each year ended December 31, unless otherwise noted:
| Class Y Shares | ||||||||||||||||||||||||
| Government Portfolio | 2006(1)(2) | 2005(2) | 2004 | 2003 | 2002 | 2001 | ||||||||||||||||||
Net Asset Value, Beginning of Period | $ | 1.000 | $ | 1.000 | $ | 1.000 | $ | 1.000 | $ | 1.000 | $ | 1.000 | ||||||||||||
Income from Operations: | ||||||||||||||||||||||||
Net investment income | 0.021 | 0.028 | (3) | 0.010 | (3) | 0.007 | (3) | 0.013 | (3) | 0.037 | (3) | |||||||||||||
Total Income from Operations | 0.021 | 0.028 | (3) | 0.010 | (3) | 0.007 | (3) | 0.013 | (3) | 0.037 | (3) | |||||||||||||
Less Distributions From: | ||||||||||||||||||||||||
Net investment income | (0.021 | ) | (0.028 | )(3) | (0.010 | )(3) | (0.007 | )(3) | (0.013 | ) | (0.037 | ) | ||||||||||||
Total Distributions | (0.021 | ) | (0.028 | )(3) | (0.010 | )(3) | (0.007 | )(3) | (0.013 | ) | (0.037 | ) | ||||||||||||
Net Asset Value, End of Period | $ | 1.000 | $ | 1.000 | $ | 1.000 | $ | 1.000 | $ | 1.000 | $ | 1.000 | ||||||||||||
Total Return(4) | 2.08 | % | 2.83 | % | 0.98 | % | 0.75 | % | 1.35 | % | 3.78 | % | ||||||||||||
Net Assets, End of Period (millions) | $6 | $13 | $3 | $1 | $2 | $21 | ||||||||||||||||||
| Ratios to Average Net Assets: | ||||||||||||||||||||||||
Gross expenses | 0.45 | %(5) | 0.45 | % | 0.43 | % | 0.44 | % | 0.48 | % | 0.44 | % | ||||||||||||
Net expenses(6) | 0.44 | (5)(7) | 0.45 | 0.41 | (7) | 0.44 | 0.48 | 0.44 | ||||||||||||||||
Net investment income | 4.09 | (5) | 2.77 | 1.05 | 0.76 | 1.38 | 3.69 | |||||||||||||||||
| (1) | For the six months ended June 30, 2006 (unaudited). |
| (2) | Per share amounts have been calculated using the average shares method. |
| (3) | Includes short-term capital gains. |
| (4) | Performance figures may reflect fee waivers and/or expense reimbursements. Past performance is no guarantee of future results. In the absence of fee waivers and/or expense reimbursements, the total return would have been lower. Total returns for periods of less than one year are not annualized. |
| (5) | Annualized. |
| (6) | As a result of an expense limitation, the ratio of expenses to average net assets will not exceed 0.70%. |
| (7) | Reflects fee waivers and/or expense reimbursements. |
See Notes to Financial Statements.
Smith Barney Money Funds, Inc. 2006 Semi-Annual Report 25
Notes to Financial Statements (unaudited)
| 1. | Organization and Significant Accounting Policies |
The Cash Portfolio (“Cash”) and Government Portfolio (“Government”) (the “Funds”) are separate diversified investment funds of the Smith Barney Money Funds, Inc. (“Company”). The Company, a Maryland corporation, is registered under the Investment Company Act of 1940, as amended (the “1940 Act”), as an open-end management investment company.
The following are significant accounting policies consistently followed by the Funds and are in conformity with U.S. generally accepted accounting principles (“GAAP”). Estimates and assumptions are required to be made regarding assets, liabilities and changes in net assets resulting from operations when financial statements are prepared. Changes in the economic environment, financial markets and any other parameters used in determining these estimates could cause actual results to differ.
(a) Investment valuation. Money market instruments are valued at amortized cost, in accordance with Rule 2a-7 under the 1940 Act, which approximates market value. This method involves valuing portfolio securities at its cost and thereafter assuming a constant amortization to maturity of any discount or premium. The Funds’ use of amortized cost is subject to their compliance with certain conditions as specified under Rule 2a-7 of the 1940 Act.
(b) Repurchase Agreements. When entering into repurchase agreements, it is the Funds’ policy that their custodian or a third party custodian take possession of the underlying collateral securities, the market value of which at least equals the principal amount of the repurchase transaction, including accrued interest. To the extent that any repurchase transaction exceeds one business day, the value of the collateral is marked-to-market to ensure the adequacy of the collateral. If the seller defaults and the market value of the collateral declines or if bankruptcy proceedings are commenced with respect to the seller of the security, realization of the collateral by the Funds may be delayed or limited.
(c) Security Transactions and Investment Income. Security transactions are accounted for on a trade date basis. Interest income, adjusted for amortization of premium and accretion of discount, is recorded on the accrual basis. The cost of investments sold is determined by use of the specific identification method.
(d) Distributions to Shareholders. Distributions from net investment income on the shares of each of the Funds are declared each business day to shareholders of record, and are paid monthly. Distributions of net realized gains, if any, are declared at least annually. Distributions are recorded on the ex-dividend date and are determined in accordance with income tax regulations, which may differ from GAAP.
(e) Class Accounting. Investment income, common expenses and realized/unrealized gain (loss) on investments are allocated to the various classes of the Funds on the basis of daily net assets of each class. Fees relating to a specific class are charged directly to that class.
(f) Federal and Other Taxes. It is the Funds’ policy to comply with the federal income and excise tax requirements of the Internal Revenue Code of 1986, as amended, applicable to regulated investment companies. Accordingly, the Funds intend to distribute substantially all of its income and net realized gains on investments, if any, to shareholders each year. Therefore, no federal income tax provision is required in the Funds’ financial statements.
26 Smith Barney Money Funds, Inc. 2006 Semi-Annual Report
Notes to Financial Statements (unaudited) (continued)
(g) Reclassification. GAAP requires that certain components of net assets be adjusted to reflect permanent differences between financial and tax reporting. These reclassifications have no effect on net assets or net asset values per share.
| 2. | Investment Management Agreement and Other Transactions with Affiliates |
For the period of this report, Smith Barney Fund Management LLC (“SBFM”), an indirect wholly-owned subsidiary of Legg Mason, Inc. (“Legg Mason”), acted as the investment manager of the Funds. Under the investment management agreement, each Fund paid an investment management fee calculated daily and paid monthly, in accordance with the following breakpoint schedule:
| Average Daily Net Assets | Annual Rate | ||
First $1.0 billion | 0.450 | % | |
Next $1.0 billion | 0.425 | ||
Next $3.0 billion | 0.400 | ||
Next $5.0 billion | 0.375 | ||
Over $10.0 billion | 0.350 | ||
During the six months ended June 30, 2006, each class of both the Cash Portfolio and the Government Portfolio had an expense limitation in place of 0.70%. This expense limitation can be terminated at any time.
During the six months ended June 30, 2006, SBFM waived a portion of its investment management fee in the amount of $398,608 and $45,625 for the Cash Portfolio and Government Portfolio, respectively. In addition, during the six months ended June 30, 2006, the Cash Portfolio and Government Portfolio were reimbursed for expenses in the amounts of $2,595,226 and $161,230, respectively.
Citigroup Global Markets Inc. (“CGM”), PFS Investments Inc. (“PFS”), and Legg Mason Investor Services, LLC (“LMIS”), a wholly-owned broker-dealer subsidiary of Legg Mason, serve as co-distributors of the Funds.
The Funds have adopted an unfunded, non-qualified deferred compensation plan (the “Plan”) which allows non-interested directors (“Directors”) to defer the receipt of all or a portion of the directors’ fees earned until a later date specified by the Directors. The deferred fees earn a return based on notional investments selected by the Directors. The balance of the deferred fees payable may change depending upon the investment performance. Any gains or losses incurred in the deferred balances are reported in the Statements of Operations under Directors’ fees. Under the Plan, deferred fees are considered a general obligation of the Funds and any payments made pursuant to the Plan will be made from the Funds’ general assets. The Board of Directors voted to discontinue offering the Plan to its members, effective January 1, 2006. This change will have no effect on fees previously deferred. As of June 30, 2006, the Funds had accrued $624,368 and $86,416 for the Cash Portfolio and Government Portfolio respectively, as deferred compensation payable.
Smith Barney Money Funds, Inc. 2006 Semi-Annual Report 27
Notes to Financial Statements (unaudited) (continued)
Certain officers and one Director of the Company are employees of Legg Mason or its affiliates and do not receive compensation from the Company.
| 3. | Class Specific Expenses |
The Funds have adopted a Rule 12b-1 distribution plan and under that plan the Funds pay a distribution fee with respect to their Class A and Class C shares calculated at the annual rate of 0.10% of the average daily net assets of each respective class. Distribution fees are accrued daily and paid monthly.
For the six months ended June 30, 2006, class specific expenses were as follows:
| Cash Portfolio | Distribution Fees | Transfer Agent Fees | Shareholder Reports Expenses | ||||||
Class A | $ | 10,386,535 | $ | 3,686,000 | $ | 123,359 | |||
Class C | 49 | 19 | 37 | ||||||
Class Y | — | 13 | 36 | ||||||
Total | $ | 10,386,584 | $ | 3,686,032 | $ | 123,432 | |||
| Government Portfolio | |||||||||
Class A | $ | 1,185,297 | $ | 151,221 | $ | 38,184 | |||
Class C | 2 | 12 | 4 | ||||||
Class Y | — | 18 | — | ||||||
Total | $ | 1,185,299 | $ | 151,251 | $ | 38,188 | |||
| 4. | Distributions to Shareholders by Class |
| Cash Portfolio | Six Months Ended June 30, 2006 | Year Ended December 31, 2005 | |||||
Net Investment Income | |||||||
Class A | $ | 442,463,359 | $ | 469,375,138 | |||
Class C | 1,995 | 4,185 | |||||
Class Y | 2,860,293 | 2,989,938 | |||||
Total | $ | 445,325,647 | $ | 472,369,261 | |||
| Government Portfolio | |||||||
Net Investment Income | |||||||
Class A | $ | 48,226,394 | $ | 60,082,453 | |||
Class C | 58 | 92 | |||||
Class Y | 184,719 | 376,332 | |||||
Total | $ | 48,411,171 | $ | 60,458,877 | |||
Net Realized Gains | |||||||
Class A | $ | — | $ | 8,583 | |||
Class C | — | 0 | * | ||||
Class Y | — | 51 | |||||
Total | $ | — | $ | 8,634 | |||
| * | Amount represents less than $1. |
28 Smith Barney Money Funds, Inc. 2006 Semi-Annual Report
Notes to Financial Statements (unaudited) (continued)
| 5. | Capital Shares |
The Company offers multiple classes of shares within the Cash and Government Portfolios. Class A and Class Y shares can be purchased directly by investors; Class C shares can only be purchased by participants in the Smith Barney 401(k) Program.
Transactions in shares of each class, each at $1.00, were as follows:
| Cash Portfolio | Six Months Ended June 30, 2006 | Year Ended December 31, 2005 | ||||
Class A | ||||||
Shares sold | 71,638,436,271 | 102,843,224,266 | ||||
Shares issued on reinvestment | 428,993,791 | 456,973,525 | ||||
Shares repurchased | (68,603,566,873 | ) | (102,913,306,356 | ) | ||
Net Increase | 3,463,863,189 | 386,891,435 | ||||
Class C | ||||||
Shares issued on reinvestment | 1,856 | 4,159 | ||||
Shares repurchased | (120,837 | ) | (17,516 | ) | ||
Net Decrease | (118,981 | ) | (13,357 | ) | ||
Class Y | ||||||
Shares sold | 30,776,303 | 115,414,539 | ||||
Shares issued on reinvestment | 32,665 | 157,243 | ||||
Shares repurchased | (10,145,994 | ) | (81,125,889 | ) | ||
Net Increase | 20,662,974 | 34,445,893 | ||||
| Government Portfolio | ||||||
Class A | ||||||
Shares sold | 6,289,330,808 | 9,575,766,056 | ||||
Shares issued on reinvestment | 45,735,881 | 57,767,451 | ||||
Shares repurchased | (5,942,563,232 | ) | (9,908,097,594 | ) | ||
Net Increase (Decrease) | 392,503,457 | (274,564,087 | ) | |||
Class C | ||||||
Shares issued on reinvestment | 57 | 91 | ||||
Shares repurchased | (376 | ) | (3,152 | ) | ||
Net Decrease | (319 | ) | (3,061 | ) | ||
Class Y | ||||||
Shares sold | 890,908 | 26,384,113 | ||||
Shares issued on reinvestment | 184,703 | 376,421 | ||||
Shares repurchased | (8,000,000 | ) | (16,300,000 | ) | ||
Net Increase (Decrease) | (6,924,389 | ) | 10,460,534 | |||
| 6. | Capital Loss Carryforward |
As of December 31, 2005, the Cash Portfolio had a net capital loss carryforward of $18,232 which expires in 2013. This amount will be available to offset any future taxable capital gains.
Smith Barney Money Funds, Inc. 2006 Semi-Annual Report 29
Notes to Financial Statements (unaudited) (continued)
| 7. | Regulatory Matters |
On May 31, 2005, the U.S. Securities and Exchange Commission (“SEC”) issued an order in connection with the settlement of an administrative proceeding against SBFM and CGM relating to the appointment of an affiliated transfer agent for the Smith Barney family of mutual funds (the “Funds”).
The SEC order finds that SBFM and CGM willfully violated Section 206(1) of the Investment Advisers Act of 1940 (“Advisers Act”). Specifically, the order finds that SBFM and CGM knowingly or recklessly failed to disclose to the boards of the Funds in 1999 when proposing a new transfer agent arrangement with an affiliated transfer agent that: First Data Investors Services Group (“First Data”), the Funds’ then-existing transfer agent, had offered to continue as transfer agent and do the same work for substantially less money than before; and that Citigroup Asset Management (“CAM”), the Citigroup business unit that, at the time, included the Fund’s investment manager and other investment advisory companies, had entered into a side letter with First Data under which CAM agreed to recommend the appointment of First Data as sub-transfer agent to the affiliated transfer agent in exchange for, among other things, a guarantee by First Data of specified amounts of asset management and investment banking fees to CAM and CGM. The order also finds that SBFM and CGM willfully violated Section 206(2) of the Advisers Act by virtue of the omissions discussed above and other misrepresentations and omissions in the materials provided to the Funds’ boards, including the failure to make clear that the affiliated transfer agent would earn a high profit for performing limited functions while First Data continued to perform almost all of the transfer agent functions, and the suggestion that the proposed arrangement was in the Funds’ best interests and that no viable alternatives existed. SBFM and CGM do not admit or deny any wrongdoing or liability. The settlement does not establish wrongdoing or liability for purposes of any other proceeding.
The SEC censured SBFM and CGM and ordered them to cease and desist from violations of Sections 206(1) and 206(2) of the Advisers Act. The order requires Citigroup to pay $208.1 million, including $109 million in disgorgement of profits, $19.1 million in interest, and a civil money penalty of $80 million. Approximately $24.4 million has already been paid to the Funds, primarily through fee waivers. The remaining $183.7 million, including the penalty, has been paid to the U.S. Treasury and will be distributed pursuant to a plan submitted for the approval of the SEC. At this time, there is no certainty as to how the above-described proceeds of the settlement will be distributed, to whom such distributions will be made, the methodology by which such distributions will be allocated, and when such distributions will be made. The order also required that transfer agency fees received from the Funds since December 1, 2004, less certain expenses, be placed in escrow and provided that a portion of such fees might be subsequently distributed in accordance with the terms of the order. On April 3, 2006, an aggregate amount of approximately $9 million was distributed to the affected Funds.
The order required SBFM to recommend a new transfer agent contract to the Fund boards within 180 days of the entry of the order; if a Citigroup affiliate submitted a proposal to serve as transfer agent or sub-transfer agent, SBFM and CGM would have been required, at their expense, to engage an independent monitor to oversee a competitive
30 Smith Barney Money Funds, Inc. 2006 Semi-Annual Report
Notes to Financial Statements (unaudited) (continued)
bidding process. On November 21, 2005, and within the specified timeframe, the Fund’s Board selected a new transfer agent for the Fund. No Citigroup affiliate submitted a proposal to serve as transfer agent. Under the order, SBFM also must comply with an amended version of a vendor policy that Citigroup instituted in August 2004.
Although there can be no assurance, SBFM does not believe that this matter will have a material adverse effect on the Funds.
On December 1, 2005, Citigroup completed the sale of substantially all of its global asset management business, including SBFM, to Legg Mason.
| 8. | Legal Matters |
Beginning in August 2005, five class action lawsuits alleging violations of federal securities laws and state law were filed against CGM and SBFM, (collectively, the “Defendants”) based on the May 31, 2005 settlement order issued against the Defendants by the SEC as described in Note 7. The complaints seek injunctive relief and compensatory and punitive damages, removal of SBFM as the advisor for the Smith Barney family of funds, rescission of the Funds’ management and other contracts with SBFM, recovery of all fees paid to SBFM pursuant to such contracts, and an award of attorneys’ fees and litigation expenses.
On October 5, 2005, a motion to consolidate the five actions and any subsequently filed, related action was filed. That motion contemplates that a consolidated amended complaint alleging substantially similar causes of action will be filed in the future.
As of the date of this report, the Fund’s investment manager believes that resolution of the pending lawsuit will not have a material effect on the financial position or results of operations of the Funds or the ability of the Fund’s investment manager and its affiliates to continue to render services to the Funds under their respective contracts.
* * *
Beginning in June 2004, class action lawsuits alleging violations of the federal securities laws were filed against CGM and a number of its then affiliates, including SBFM and Salomon Brothers Asset Management Inc (“SBAM”), which were then investment adviser or manager to certain of the Funds (the “Managers”), substantially all of the mutual funds then managed by the Managers (the “Defendant Funds”), and Board Members of the Defendant Funds (collectively, the “Defendants”). The complaints alleged, among other things, that CGM created various undisclosed incentives for its brokers to sell Smith Barney and Salomon Brothers funds. In addition, according to the complaints, the Managers caused the Defendant Funds to pay excessive brokerage commissions to CGM for steering clients towards proprietary funds. The complaints also alleged that the defendants breached their fiduciary duty to the Defendant Funds by improperly charging Rule 12b-1 fees and by drawing on fund assets to make undisclosed payments of soft dollars and excessive brokerage commissions. The complaints also alleged that the Defendant Funds failed to adequately disclose certain of the allegedly wrongful conduct. The complaints sought injunctive relief and compensatory and punitive damages, rescission of the Defendant Funds’ contracts with the Managers, recovery of all fees paid to the Managers pursuant to such contracts and an award of attorneys’ fees and litigation expenses.
Smith Barney Money Funds, Inc. 2006 Semi-Annual Report 31
Notes to Financial Statements (unaudited) (continued)
On December 15, 2004, a consolidated amended complaint (the “Complaint”) was filed alleging substantially similar causes of action. On May 27, 2005, all of the Defendants filed motions to dismiss the Complaint. On July 26, 2006, the court issued a decision and order (1) finding that plaintiffs lacked standing to sue on behalf of the shareholders of the Funds in which none of the plaintiffs had invested (including Smith Barney Money Funds, Inc. - Cash Portfolio and Government Portfolio) and dismissing those Funds from the case (although stating that they could be brought back into the case if standing as to them could be established), and (2) other than one stayed claim, dismissing all of the causes of action against the remaining Defendants, with prejudice, except for the cause of action under Section 36(b) of the Investment Company Act, which the court granted plaintiffs leave to repeal as a derivative claim.
| 9. | Other Matters |
On September 16, 2005, the staff of the SEC informed SBFM and SBAM that the staff is considering recommending that the SEC institute administrative proceedings against SBFM and SBAM for alleged violations of Section 19(a) and 34(b) of the Investment Company Act (and related Rule 19a-1). The notification is a result of an industry wide inspection by the SEC and is based upon alleged deficiencies in disclosures regarding dividends and distributions paid to shareholders of certain funds. Section 19(a) and related Rule 19a-1 of the Investment Company Act generally require funds that are making dividend and distribution payments to provide shareholders with a written statement disclosing the source of the dividends and distributions, and, in particular, the portion of the payments made from each of net investment income, undistributed net profits and/or paid-in capital. In connection with the contemplated proceedings, the staff may seek a cease and desist order and/or monetary damages from SBFM or SBAM.
Although there can be no assurance, SBFM believes that this matter is not likely to have a material adverse effect on the Fund.
| 10. | Subsequent Events |
The Funds’ Board has approved the appointment of Legg Mason Partners Fund Advisor, LLC (“LMPFA”) as the Funds’ investment manager effective August 1, 2006. The Funds’ Board has also approved the appointment of Western Asset Management Company (“Western Asset”) as the Funds’ subadviser effective August 1, 2006. The portfolio managers who are responsible for the day-to-day management of the Funds remain the same immediately prior to and immediately after the date of these changes. LMPFA and Western Asset are wholly-owned subsidiaries of Legg Mason.
LMPFA will provide administrative and certain oversight services to the Funds. LMPFA will delegate to the subadviser the day-to-day portfolio management of the Funds. The Funds’ investment management fee will remain unchanged. For its services, LMPFA will pay Western Asset 70% of the net management fee that it receives from the Funds.
The Funds’ Board has also approved a number of other initiatives designed to streamline and restructure the fund complex, and has authorized seeking shareholder approval for those initiatives where shareholder approval is required. As a result, each Fund’s shareholders will be asked to elect a new Board, approve matters that will result in the Funds
32 Smith Barney Money Funds, Inc. 2006 Semi-Annual Report
Notes to Financial Statements (unaudited) (continued)
being grouped for organizational and governance purposes with other funds in the fund complex, and domicile each Fund as a Maryland business trust, with all funds operating under uniform charter documents. Each Fund’s shareholders also will be asked to approve investment matters, including standardized fundamental investment policies.
Proxy materials describing these matters are expected to be sent to shareholders later in 2006. If shareholder approval is obtained, these matters generally are expected to be implemented during the first quarter of 2007.
| 11. | Recent Accounting Pronouncement |
During June 2006, the Financial Accounting Standards Board (“FASB”) issued FASB Interpretation 48 (“FIN 48” or the “Interpretation”), Accounting for Uncertainty in Income Taxes—an interpretation of FASB statement 109. FIN 48 supplements FASB Statement 109 by defining the confidence level that a tax position must meet in order to be recognized in the financial statements. FIN 48 prescribes a comprehensive model for how a fund should recognize, measure, present, and disclose in its financial statements uncertain tax positions that the fund has taken or expects to take on a tax return. FIN 48 requires that the tax effects of a position be recognized only if it is “more likely than not” to be sustained based solely on its technical merits. Management must be able to conclude that the tax law, regulations, case law, and other objective information regarding the technical merits sufficiently support the position’s sustainability with a likelihood of more than 50 percent. FIN 48 is effective for fiscal periods beginning after December 15, 2006, which for the Funds will be January 1, 2007. At adoption, the financial statements must be adjusted to reflect only those tax positions that are more likely than not to be sustained as of the adoption date. Management of the Funds is currently evaluating the impact that FIN 48 will have on the financial statements.
Smith Barney Money Funds, Inc. 2006 Semi-Annual Report 33
Board Approval of Management and Subadvisory Agreements (unaudited)
At a meeting held in person on June 22, 2006, the Funds’ Board, including a majority of the Board Members who are not “interested persons” of the Funds or Legg Mason Partners Fund Advisor, LLC (the “Manager”) or any sub-investment adviser or proposed sub-investment adviser as defined in the Investment Company Act of 1940, as amended (the “1940 Act”) (the “Independent Board Members”), approved a new management agreement (the “New Management Agreement”) between the Funds and the Manager. The Funds’ Board, including a majority of the Independent Board Members, also approved one or more new subadvisory agreements between the Manager and Western Asset Management Company (the “Subadviser”) (the “New Subadvisory Agreement”). The New Management Agreement and the New Subadvisory Agreement replaced the Funds’ prior management agreement with SBFM and were entered into in connection with an internal reorganization of the Manager’s, and the prior manager’s parent organization, Legg Mason. In approving the New Management Agreement and New Subadvisory Agreement, the Board, including the Independent Board Members, considered the factors discussed below, among other things.
The Board noted that the Manager will provide administrative and certain oversight services to the Funds, and that the Manager will delegate to the Subadviser the day-to-day portfolio management of the Funds. The Board Members reviewed the qualifications, backgrounds and responsibilities of the senior personnel that will provide oversight and general management services and the portfolio management team that would be primarily responsible for the day-to-day management of the Funds. The Board Members noted that the portfolio management team was expected to be the same as then managing the Funds.
The Board Members received and considered information regarding the nature, extent and quality of services expected to be provided to the Funds by the Manager under the New Management Agreement and by the Subadviser under the New Subadvisory Agreement. The Board Members’ evaluation of the services expected to be provided by the Manager and the Subadviser took into account the Board Members’ knowledge and familiarity gained as Fund Board Members, including as to the scope and quality of Legg Mason’s investment management and other capabilities and the quality of its administrative and other services. The Board Members considered, among other things, information and assurances provided by Legg Mason as to the operations, facilities and organization of the Manager and the Subadviser and the qualifications, backgrounds and responsibilities of their senior personnel. The Board Members further considered the financial resources available to the Manager, the Subadviser and Legg Mason. The Board Members concluded that, overall, the nature, extent and quality of services expected to be provided under the New Management Agreement and the New Subadvisory Agreement were acceptable.
The Board Members also received and considered performance information for the Funds as well as comparative information with respect to a peer group of funds (the “Performance Universe”) selected by Lipper, Inc. (“Lipper”), an independent provider of investment company data. The Board Members were provided with a description of the methodology Lipper used to determine the similarity of the Funds to the funds included in
34 Smith Barney Money Funds, Inc.
Board Approval of Management and Subadvisory Agreements (unaudited) (continued)
the Performance Universe. The Board Members noted that they had received and discussed with management, at periodic intervals, information comparing the Funds’ performance against, among other things, their benchmarks. Based on the Board Members’ review, which included careful consideration of the factors noted above, the Board Members concluded that the performance of the Funds, under the circumstances, supported approval of the New Management Agreement and New Subadvisory Agreement.
The Board Members reviewed and considered the management fee that would be payable by the Funds to the Manager in light of the nature, extent and quality of the management services expected to be provided by the Manager, including the fee waiver and/or expense reimbursement arrangements currently in place. Additionally, the Board Members received and considered information comparing the Funds’ management fee and overall expenses with those of comparable funds in both the relevant expense group and a broader group of funds, each selected and provided by Lipper. The Board Members also reviewed and considered the subadvisory fee that would be payable by the Manager to the Subadviser in light of the nature, extent and quality of the management services expected to be provided by the Subadviser. The Board Members noted that the Manager, and not the Funds, will pay the subadvisory fee to the Subadviser. The Board Members determined that the Funds’ management fee and the Funds’ subadvisory fee were reasonable in light of the nature, extent and quality of the services expected to be provided to the Fund under the New Management Agreement and the New Subadvisory Agreement.
The Board Members received and considered a pro-forma profitability analysis of Legg Mason and its affiliates in providing services to the Funds, including information with respect to the allocation methodologies used in preparing the profitability data. The Board Members recognized that Legg Mason may realize economies of scale based on its internal reorganization and synergies of operations. The Board Members noted that it was not possible to predict with a high degree of confidence how Legg Mason’s and its affiliates’ profitability would be affected by its internal reorganization and by other factors including potential economies of scale, but that based on their review of the pro forma profitability analysis, their most recent prior review of the profitability of the predecessor manager and its affiliates from their relationship with the Funds and other factors considered, they determined that the management fee was reasonable. The Board Members noted that they expect to receive profitability information on an annual basis.
In their deliberations, the Board Members also considered, and placed significant importance on, information that had been received and conclusions that had been reached by the Board in connection with the Board’s most recent approval of the Funds’ prior management agreement, in addition to information provided in connection with the Board’s evaluation of the terms and conditions of the New Management Agreement and the New Subadvisory Agreement.
The Board Members considered Legg Mason’s advice and the advice of its counsel that the New Management Agreement and the New Subadvisory Agreement were being entered into in connection with an internal reorganization within Legg Mason, that did not involve an actual change of control or management. The Board Members further
Smith Barney Money Funds, Inc. 35
Board Approval of Management and Subadvisory Agreements (unaudited) (continued)
noted that the terms and conditions of the New Management Agreement are substantially identical to those of the Funds’ previous management agreement except for the identity of the Manager, and that the initial term of the New Management Agreement (after which it will continue in effect only if such continuance is specifically approved at least annually by the Board, including a majority of the Independent Board Members) was the same as that under the prior management agreement.
In light of all of the foregoing, the Board, including the Independent Board Members, approved the New Management Agreement and the New Subadvisory Agreement. No single factor reviewed by the Board Members was identified as the principal factor in determining whether to approve the New Management Agreement and the New Subadvisory Agreement. The Independent Board Members were advised by separate independent legal counsel throughout the process. The Independent Board Members also discussed the proposed approval of the New Management Agreement and the New Subadvisory Agreement in private sessions with their independent legal counsel at which no representatives of the Manager or Subadviser were present.
36 Smith Barney Money Funds, Inc.
Smith Barney
Money Funds, Inc.
Cash Portfolio
Government Portfolio
DIRECTORS Lee Abraham Jane F. Dasher Donald R. Foley R. Jay Gerken, CFA Richard E. Hanson, Jr. Paul Hardin Roderick C. Rasmussen John P. Toolan
INVESTMENT MANAGER Legg Mason Partners
SUBADVISER Western Asset Management Company
DISTRIBUTORS Citigroup Global Markets Inc. Legg Mason Investor Services, LLC PFS Investments Inc.
CUSTODIAN State Street Bank and | TRANSFER AGENTS PFPC Inc. 4400 Computer Drive Westborough, Massachusetts 01581
Boston Financial Data 2 Heritage Drive North Quincy, Massachusetts 02171
INDEPENDENT REGISTERED PUBLIC ACCOUNTING FIRM KPMG LLP 345 Park Avenue New York, New York 10154 |
This report is submitted for general information of the shareholders of Smith Barney Money Funds, Inc., but it may also be used as sales literature when preceded or accompanied by the current prospectus.
This report must be preceded or accompanied by a free prospectus. Investors should consider the Funds’ investment objectives, risks, charges and expenses carefully before investing. The prospectus contains this and other important information about the Funds. Please read the prospectus carefully before investing.
www.leggmason.com/InvestorServices
©2006 Legg Mason Investor Services, LLC
Member NASD, SIPC
| FD0622 8/06 | SR06-119 |
Smith Barney Money Funds, Inc.
Cash Portfolio
Government Portfolio
The Funds are separate investment funds of the Smith Barney Money Funds, Inc., a Maryland corporation.
SMITH BARNEY MONEY FUNDS, INC.
125 Broad Street
10th Floor, MF-2
New York, New York 10004
The Funds file their complete schedule of portfolio holdings with the Securities and Exchange Commission for the first and third quarters of each fiscal year on Form N-Q. The Funds’ Forms N-Q are available on the Commission’s website at www.sec.gov. The Funds’ Forms N-Q may be reviewed and copied at the Commission’s Public Reference Room in Washington, D.C., and information on the operation of the Public Reference Room may be obtained by calling 1-800-SEC-0330. To obtain information on Form N-Q from the Funds, shareholders can call 1-800-451-2010
Information on how the Funds voted proxies relating to portfolio securities during the prior 12-month period ended June 30th of each year, and a description of the policies and procedures that the Funds use to determine how to vote proxies relating to portfolio securities is available (1) without charge, upon request, by calling 1-800-451-2010, (2) on the Funds’ website at www.leggmason.com/InvestorServices and (3) on the SEC’s website at www.sec.gov.
ITEM 2. CODE OF ETHICS.
Not Applicable.
ITEM 3. AUDIT COMMITTEE FINANCIAL EXPERT.
Not Applicable.
ITEM 4. PRINCIPAL ACCOUNTANT FEES AND SERVICES.
Not applicable.
ITEM 5. AUDIT COMMITTEE OF LISTED REGISTRANTS.
Not applicable.
ITEM 6. SCHEDULE OF INVESTMENTS.
Included herein under Item 1.
ITEM 7. DISCLOSURE OF PROXY VOTING POLICIES AND PROCEDURES FOR CLOSED-END MANAGEMENT INVESTMENT COMPANIES.
Not applicable.
ITEM 8. PORTFOLIO MANAGERS OF CLOSED-END MANAGEMENT INVESTMENT COMPANIES.
Not applicable.
ITEM 9. PURCHASES OF EQUITY SECURITIES BY CLOSED-END MANAGEMENT INVESTMENT COMPANY AND AFFILIATED PURCHASERS.
Not applicable.
ITEM 10. SUBMISSION OF MATTERS TO A VOTE OF SECURITY HOLDERS.
Not applicable.
ITEM 11. CONTROLS AND PROCEDURES.
| (a) | The registrant’s principal executive officer and principal financial officer have concluded that the registrant’s disclosure controls and procedures (as defined in Rule 30a- 3(c) under the Investment Company Act of 1940, as amended (the “1940 Act”)) are effective as of a date within 90 days of the filing date of this report that includes the disclosure required by this paragraph, based on their evaluation of the disclosure controls and procedures required by Rule 30a-3(b) under the 1940 Act and 15d-15(b) under the Securities Exchange Act of 1934. |
| (b) | There were no changes in the registrant’s internal control over financial reporting (as defined in Rule 30a-3(d) under the 1940 Act) that occurred during the registrant’s last fiscal half-year (the registrant’s second fiscal half-year in the case of an annual report) that have materially affected, or are likely to materially affect the registrant’s internal control over financial reporting. |
| ITEM 12. | EXHIBITS. |
| (a) | Not applicable. |
| (b) | Attached hereto. |
| Exhibit 99.CERT | Certifications pursuant to section 302 of the Sarbanes-Oxley Act of 2002 | |
| Exhibit 99.906CERT | Certifications pursuant to Section 906 of the Sarbanes-Oxley Act of 2002 | |
SIGNATURES
Pursuant to the requirements of the Securities Exchange Act of 1934 and the Investment Company Act of 1940, the registrant has duly caused this Report to be signed on its behalf by the undersigned, there unto duly authorized.
Smith Barney Money Funds, Inc.
| By: | /s/ R. Jay Gerken | |
| (R. Jay Gerken) | ||
| Chief Executive Officer of | ||
| Smith Barney Money Funds, Inc. | ||
| Date: September 7, 2006 | ||
Pursuant to the requirements of the Securities Exchange Act of 1934 and the Investment Company Act of 1940, this report has been signed below by the following persons on behalf of the registrant and in the capacities and on the dates indicated.
| By: | /s/ R. Jay Gerken | |
| (R. Jay Gerken) | ||
| Chief Executive Officer of | ||
| Smith Barney Money Funds, Inc. | ||
| Date: September 7, 2006 | ||
| By: | /s/ Robert J. Brault | |
| (Robert J. Brault) | ||
| Chief Financial Officer of | ||
| Smith Barney Money Funds, Inc. | ||
| Date: September 7, 2006 | ||