Eric Thornburg on Yahoo Finance Breakout
Connecticut Water Service, Inc. 2013 Annual Meeting of Shareholders May 9, 2013
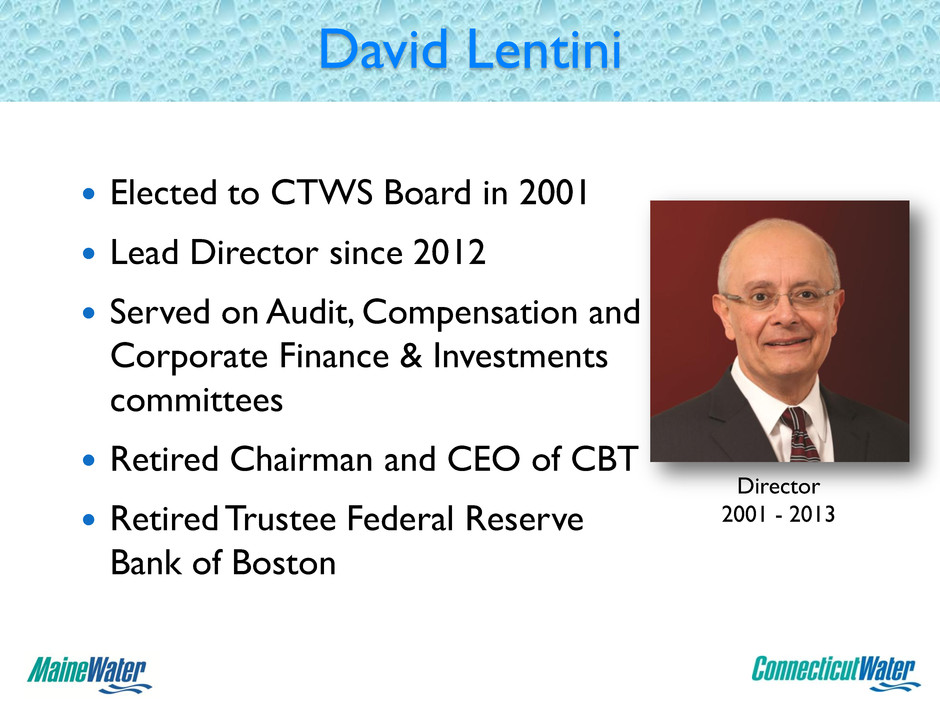
David Lentini Elected to CTWS Board in 2001 Lead Director since 2012 Served on Audit, Compensation and Corporate Finance & Investments committees Retired Chairman and CEO of CBT Retired Trustee Federal Reserve Bank of Boston Director 2001 - 2013
Forward Looking Statements Except for the historical statements and discussions, some statements contained in this report constitute “forward looking statements” within the meaning of Section 27A of the Securities Act of 1933 and Section 21E of the Securities Exchange Act of 1934. These forward looking statements are based on current expectations and rely on a number of assumptions concerning future events, and are subject to a number of uncertainties and other factors, many of which are outside our control, that could cause actual results to differ materially from such statements.
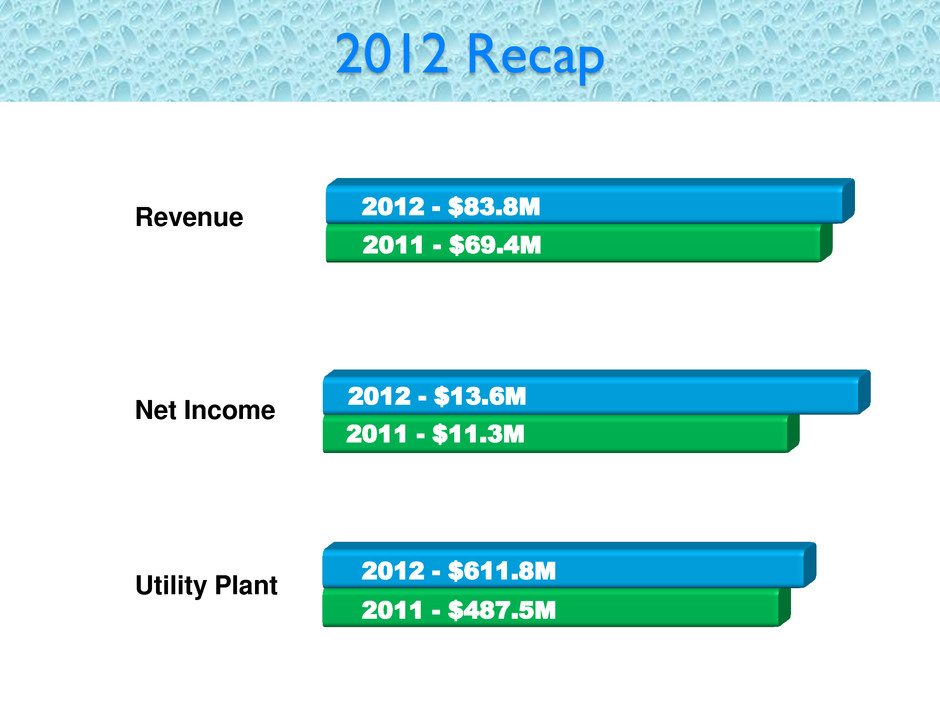
2012 Recap 2012 - $83.8M 2011 - $69.4M Revenue 2012 - $611.8M 2011 - $487.5M Utility Plant Net Income 2011 - $11.3M 2012 - $13.6M
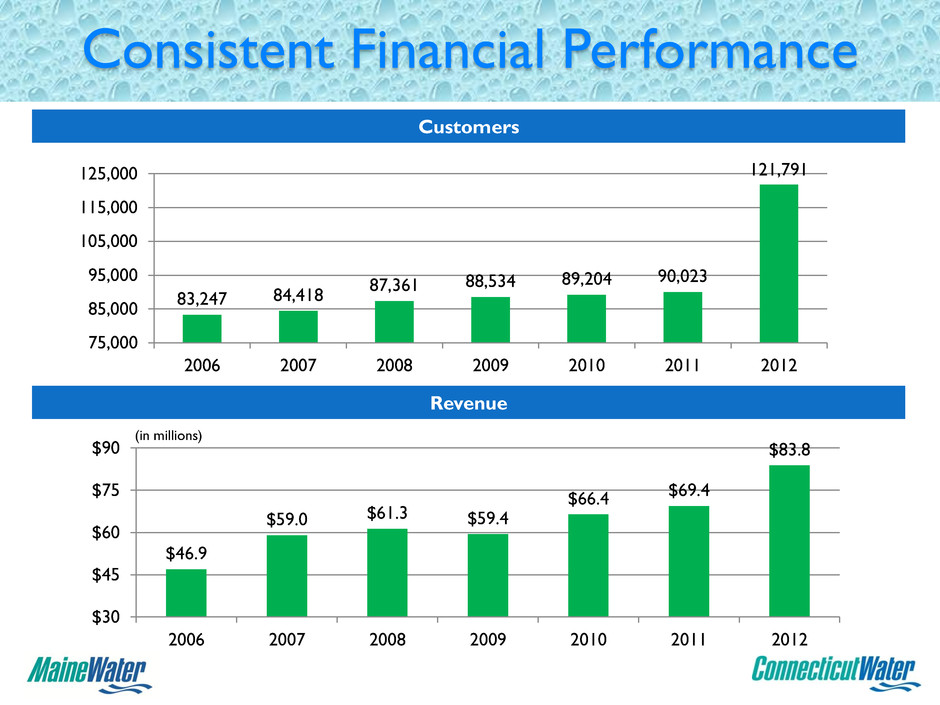
83,247 84,418 87,361 88,534 89,204 90,023 121,791 75,000 85,000 95,000 105,000 115,000 125,000 2006 2007 2008 2009 2010 2011 2012 Customers $46.9 $59.0 $61.3 $59.4 $66.4 $69.4 $83.8 $30 $45 $60 $75 $90 2006 2007 2008 2009 2010 2011 2012 Revenue (in millions) Consistent Financial Performance
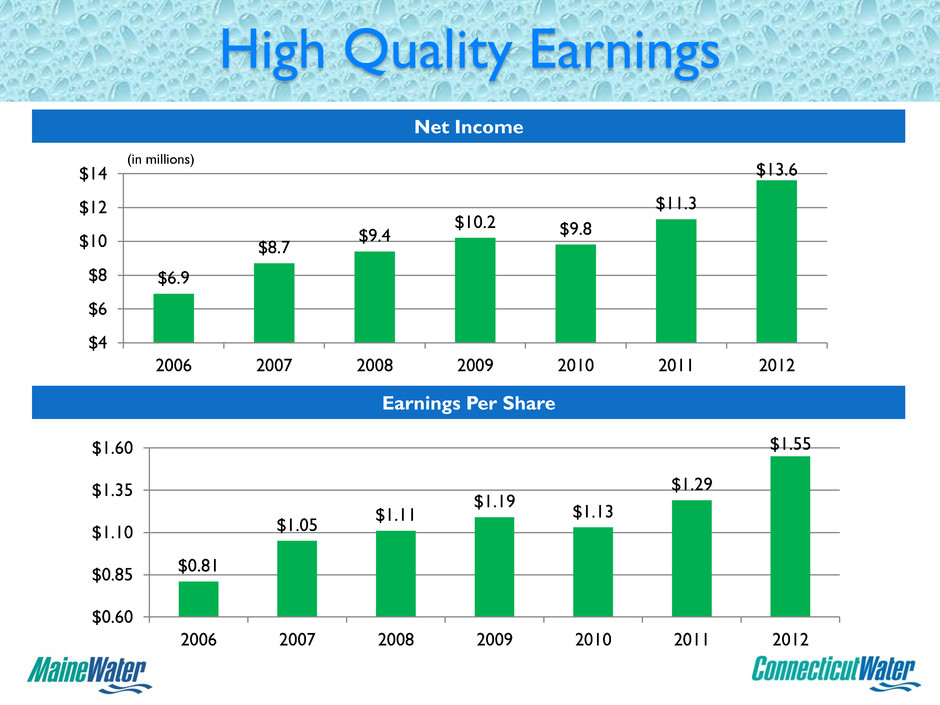
$6.9 $8.7 $9.4 $10.2 $9.8 $11.3 $13.6 $4 $6 $8 $10 $12 $14 2006 2007 2008 2009 2010 2011 2012 Net Income $0.81 $1.05 $1.11 $1.19 $1.13 $1.29 $1.55 $0.60 $0.85 $1.10 $1.35 $1.60 2006 2007 2008 2009 2010 2011 2012 Earnings Per Share High Quality Earnings (in millions)
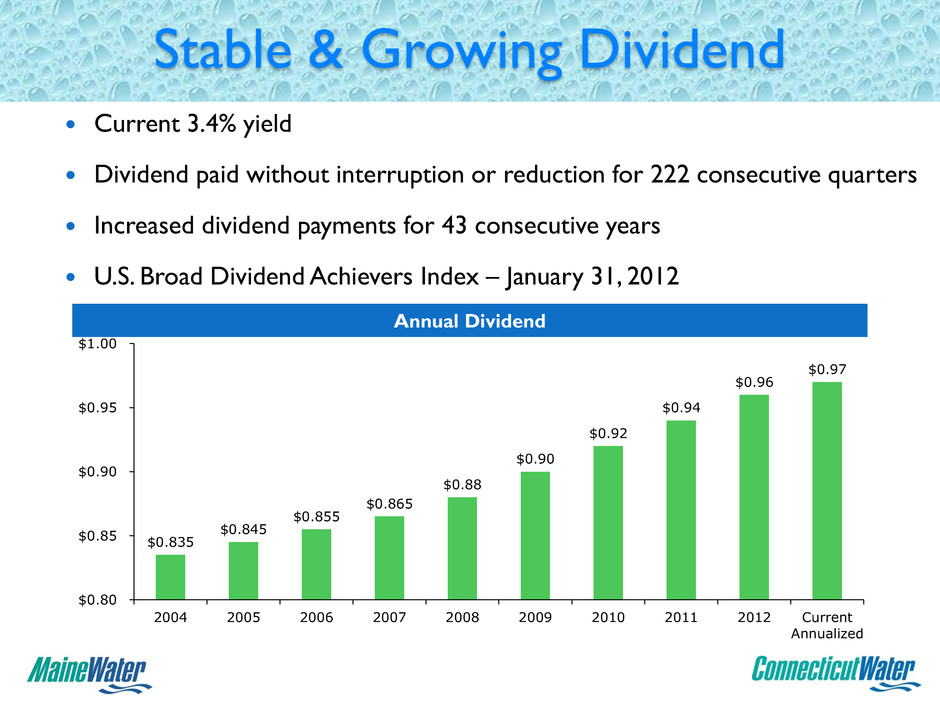
Stable & Growing Dividend Current 3.4% yield Dividend paid without interruption or reduction for 222 consecutive quarters Increased dividend payments for 43 consecutive years U.S. Broad Dividend Achievers Index – January 31, 2012 $0.835 $0.845 $0.855 $0.865 $0.88 $0.90 $0.92 $0.94 $0.96 $0.97 $0.80 $0.85 $0.90 $0.95 $1.00 2004 2005 2006 2007 2008 2009 2010 2011 2012 Current Annualized Annual Dividend
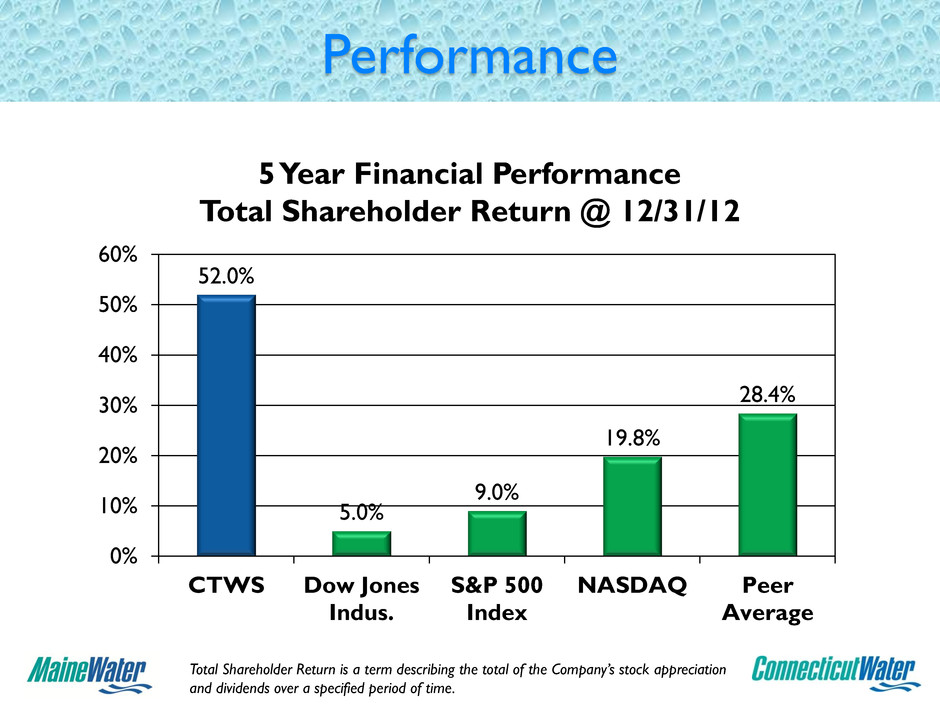
Performance 52.0% 5.0% 9.0% 19.8% 28.4% 0% 10% 20% 30% 40% 50% 60% CTWS Dow Jones Indus. S&P 500 Index NASDAQ Peer Average 5 Year Financial Performance Total Shareholder Return @ 12/31/12 Total Shareholder Return is a term describing the total of the Company’s stock appreciation and dividends over a specified period of time.
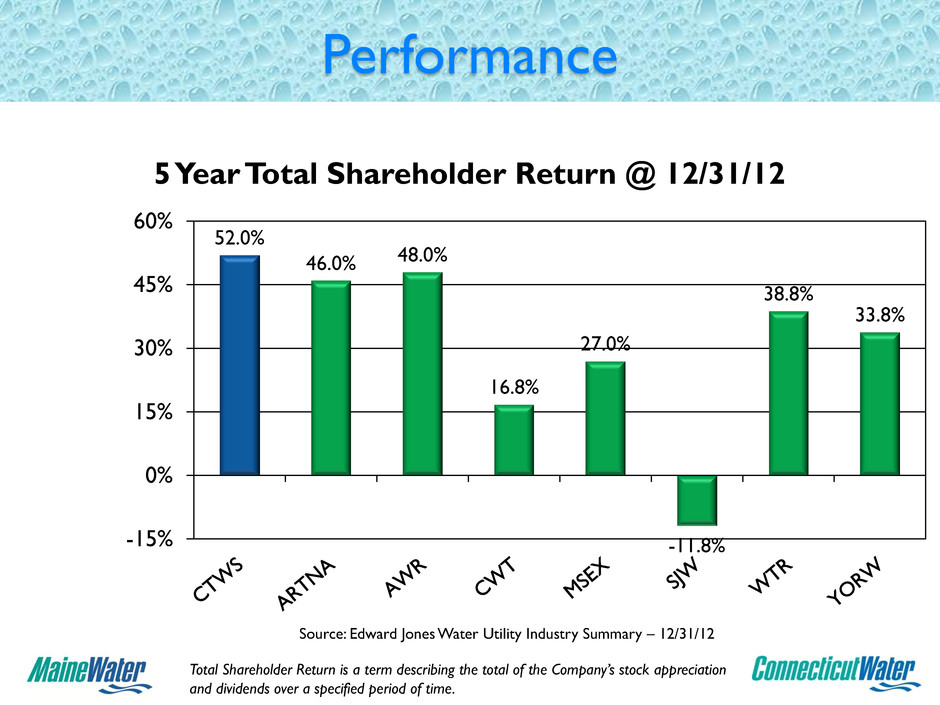
Performance 52.0% 46.0% 48.0% 16.8% 27.0% -11.8% 38.8% 33.8% -15% 0% 15% 30% 45% 60% 5 Year Total Shareholder Return @ 12/31/12 Source: Edward Jones Water Utility Industry Summary – 12/31/12 Total Shareholder Return is a term describing the total of the Company’s stock appreciation and dividends over a specified period of time.
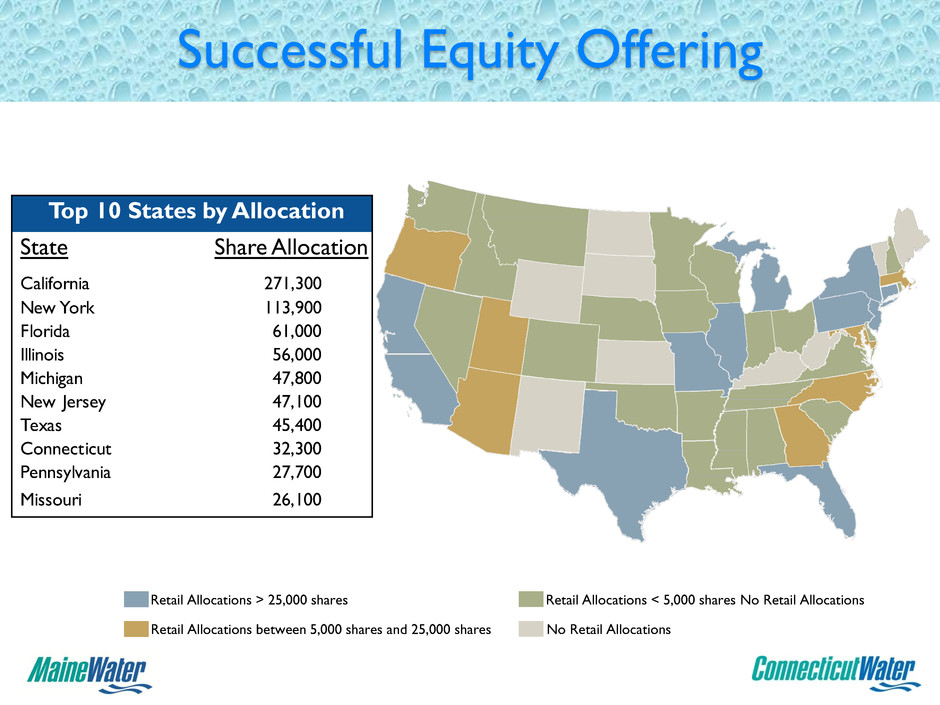
Successful Equity Offering Top 10 States by Allocation State Share Allocation California 271,300 New York 113,900 Florida 61,000 Illinois 56,000 Michigan 47,800 New Jersey 47,100 Texas 45,400 Connecticut 32,300 Pennsylvania 27,700 Missouri 26,100 Retail Allocations < 5,000 shares No Retail Allocations Retail Allocations > 25,000 shares Retail Allocations between 5,000 shares and 25,000 shares No Retail Allocations
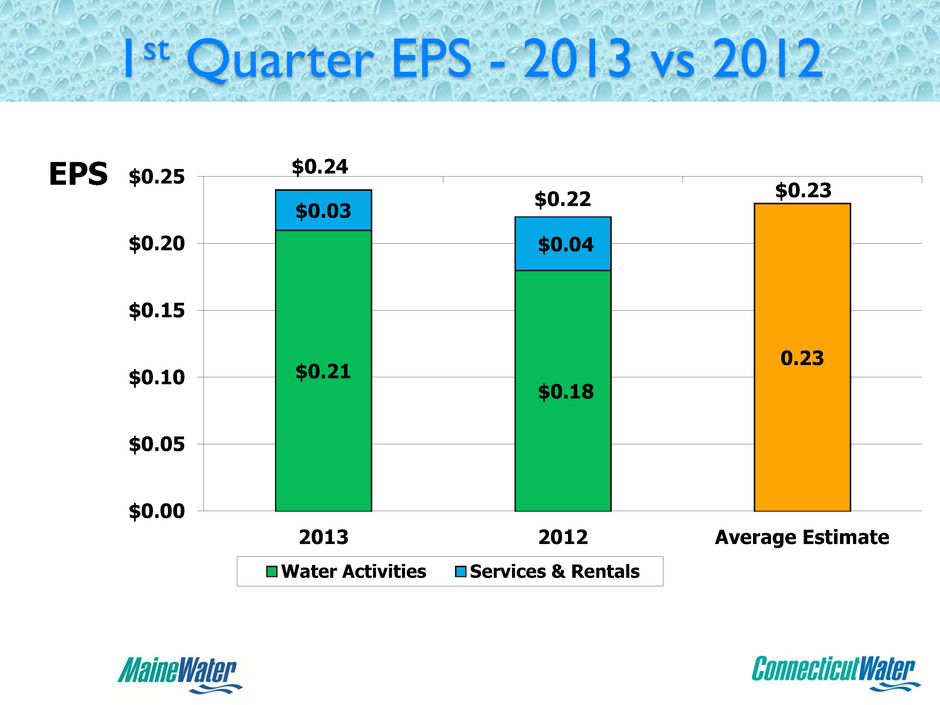
1st Quarter EPS - 2013 vs 2012 $0.21 $0.18 0.23 $0.03 $0.04 $0.00 $0.05 $0.10 $0.15 $0.20 $0.25 2013 2012 Average Estimate Water Activities Services & Rentals EPS $0.24 $0.22 $0.23
Financial Priorities Continue Growth ◦ Acquisitions ◦ Capital Investment ◦ Unregulated – Leverage Strength Manage Costs Satisfy Customers

Water, the basic ingredient of Life…
Our Mission … Passionate employees delivering life sustaining, high quality water service to families and communities while providing a fair return to our shareholders
Our Values… Honesty Trust Respect Service Teamwork Positive Attitude Straight Talk
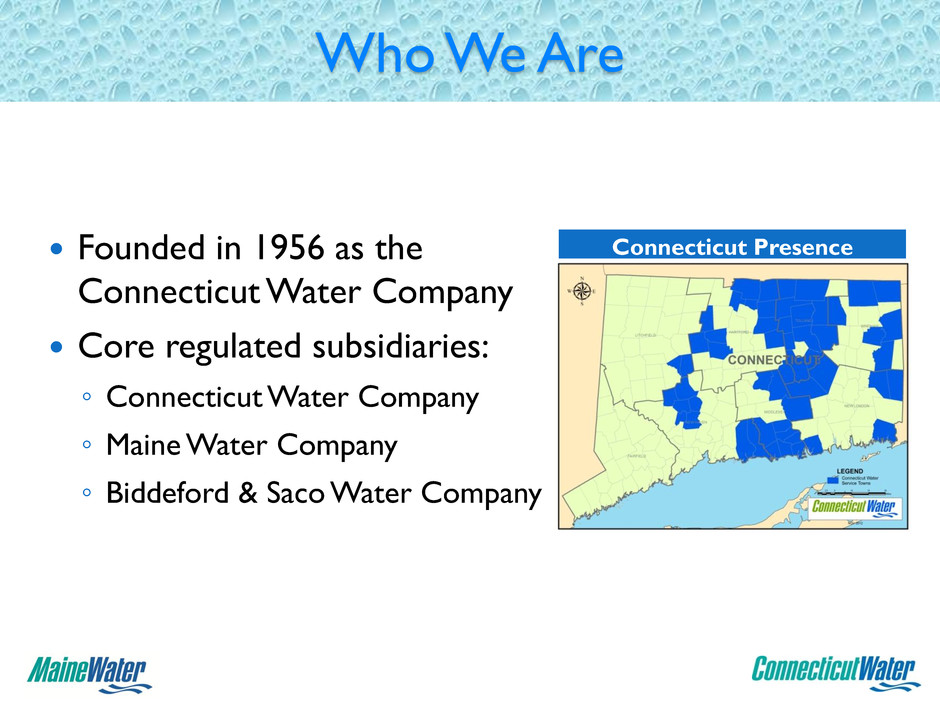
Who We Are Founded in 1956 as the Connecticut Water Company Core regulated subsidiaries: ◦ Connecticut Water Company ◦ Maine Water Company ◦ Biddeford & Saco Water Company Connecticut Presence

Who We Are 90% of net income attributable to regulated operations 121,791 utility customers (~90% residential) Complementary non-regulated businesses: ◦ New England Water Utility Services, Inc. (NEWUS) ◦ Chester Realty, Inc. 250 employees Maine Presence
Company Strategy Growth Shareholders Customers Employees
Biddeford & Saco Water Company Serving 37,000 people 4 Towns $19.4 million Net Utility Plant EV = $20.6 million 28 Employees
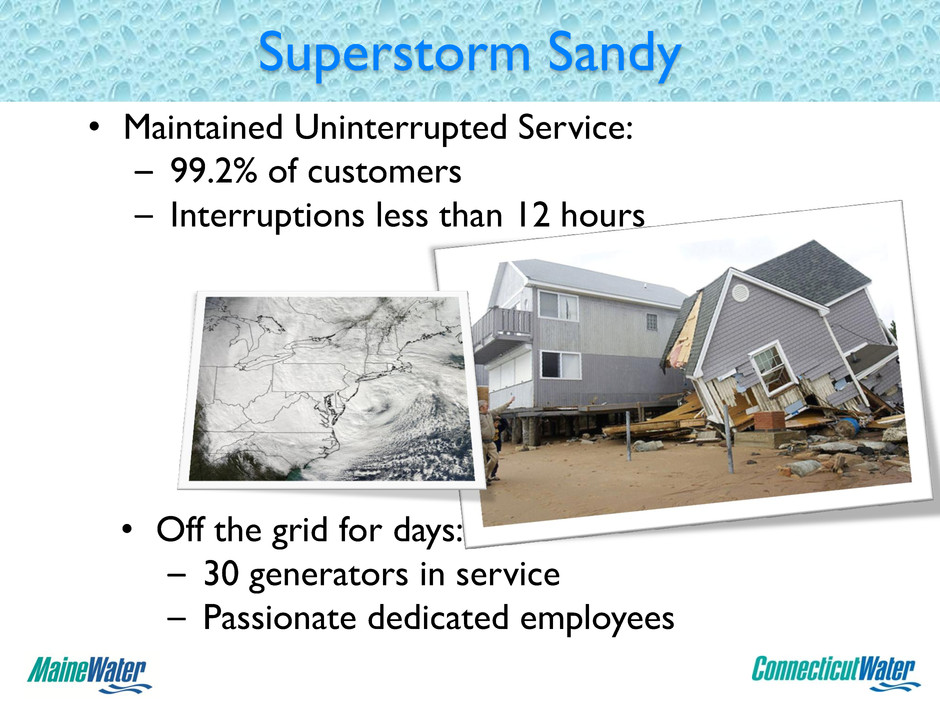
Superstorm Sandy • Maintained Uninterrupted Service: – 99.2% of customers – Interruptions less than 12 hours • Off the grid for days: – 30 generators in service – Passionate dedicated employees
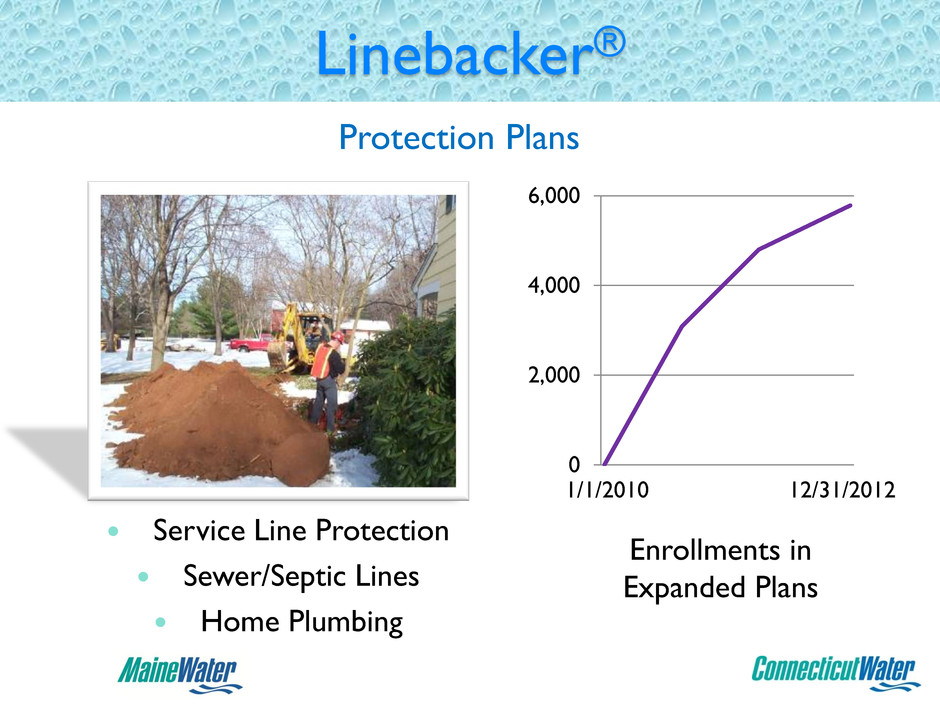
Linebacker® Service Line Protection Sewer/Septic Lines Home Plumbing 0 2,000 4,000 6,000 Enrollments in Expanded Plans 1/1/2010 12/31/2012 Protection Plans
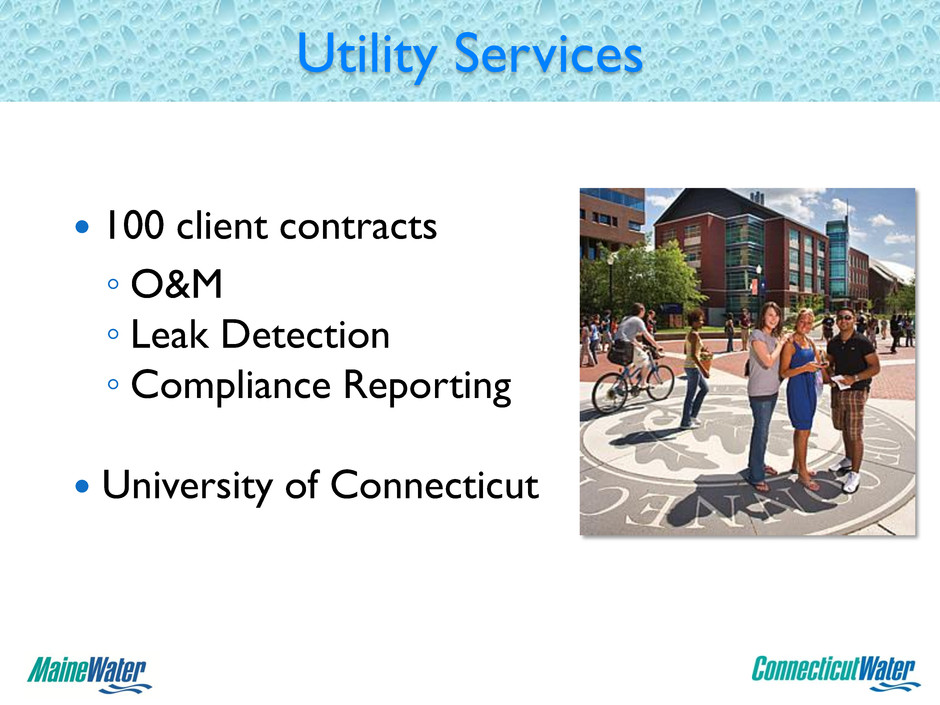
Utility Services 100 client contracts ◦ O&M ◦ Leak Detection ◦ Compliance Reporting University of Connecticut
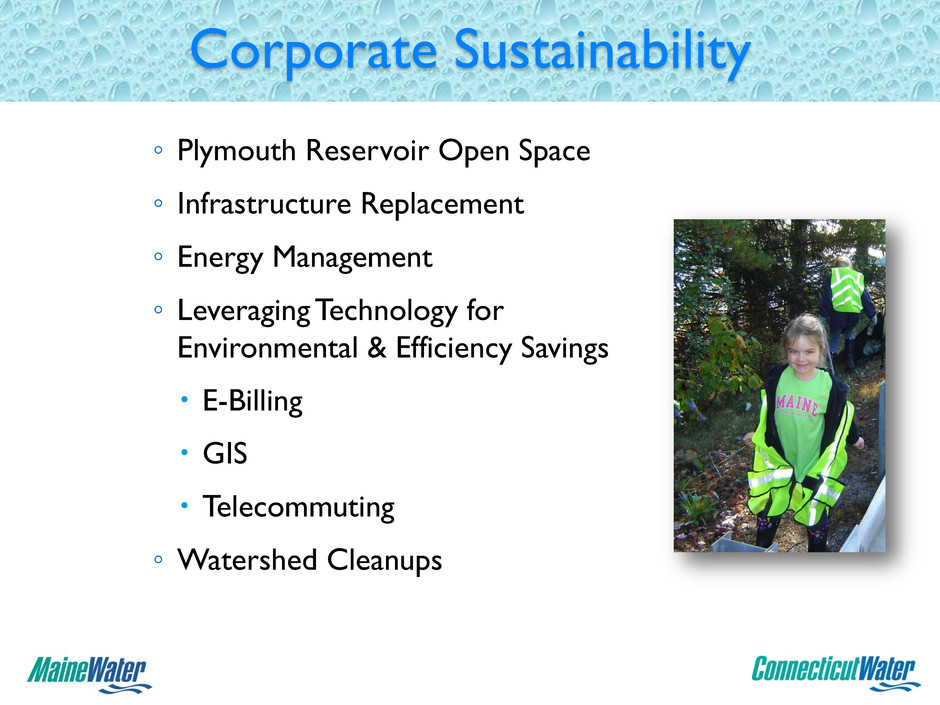
Corporate Sustainability ◦ Plymouth Reservoir Open Space ◦ Infrastructure Replacement ◦ Energy Management ◦ Leveraging Technology for Environmental & Efficiency Savings E-Billing GIS Telecommuting ◦ Watershed Cleanups
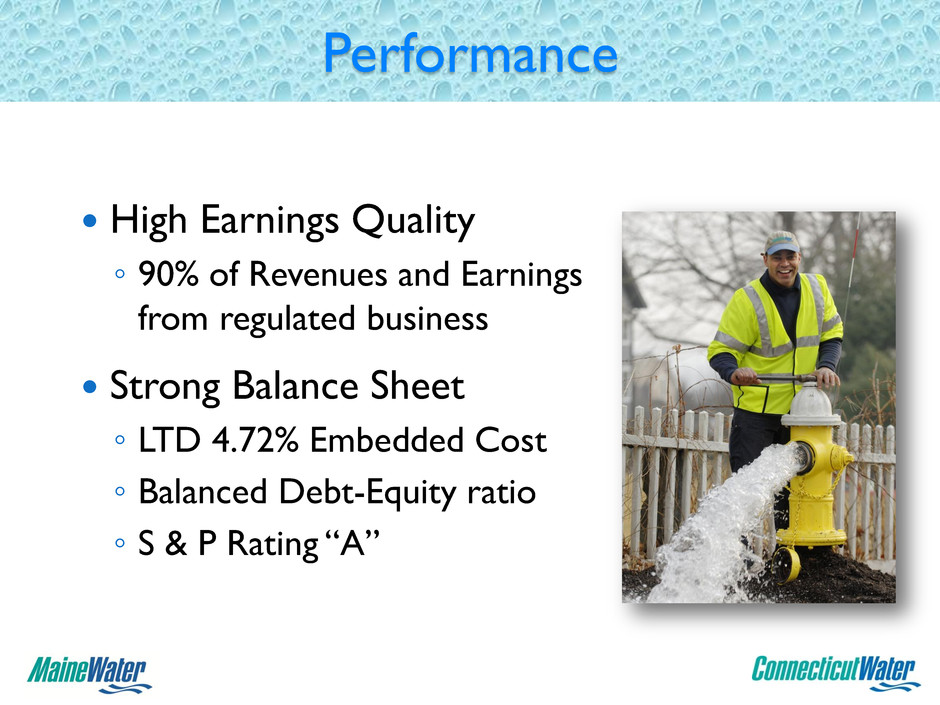
Performance High Earnings Quality ◦ 90% of Revenues and Earnings from regulated business Strong Balance Sheet ◦ LTD 4.72% Embedded Cost ◦ Balanced Debt-Equity ratio ◦ S & P Rating “A”
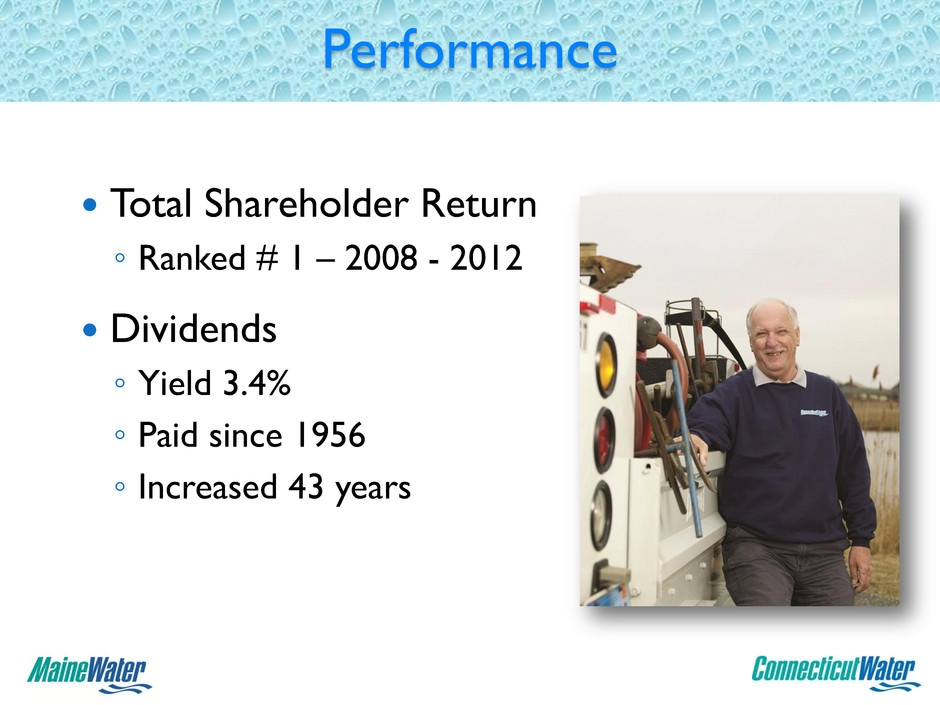
Total Shareholder Return ◦ Ranked # 1 – 2008 - 2012 Dividends ◦ Yield 3.4% ◦ Paid since 1956 ◦ Increased 43 years Performance
Analysts Remarks… “Connecticut Water had a transformative 2012, expanding from a single- state water utility into a regional player in New England with aims on further expansion. Through its two acquisitions into Maine, the company grew its customer base 35% while significantly diversifying its regulatory exposure.” (Janney, March 2013). “The company has instituted an asset management program which focuses on capital investment with corresponding rate cases, acquired several small tuck in water systems and most recently made two large scale system purchases. These actions should position CTWS well for improved growth..” (Boenning and Scattergood, March 2013). “CTWS' recent entry into Maine via acquisition provides ~30% customer growth, potentially boosting opportunities to invest capital and add tuck-in acquisitions, as well as diversifying the company's Connecticut regulatory risk.” (Baird, March 2013).
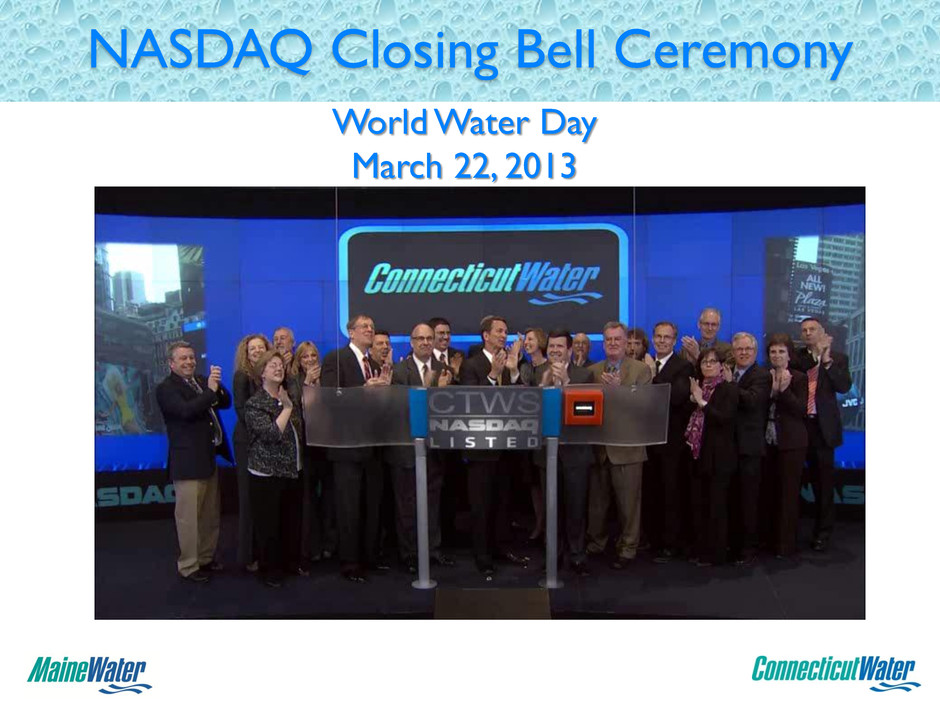
NASDAQ Closing Bell Ceremony World Water Day March 22, 2013

Thank you for your support Your Questions & Feedback…


