Exhibit 99.3
| | | | | | | | | | |
| | | | CONTENTS | | | | VISION EDC will be the most knowledgeable, the most connected and the most committed partner in trade for Canada. VALUES People We are the heart and soul of EDC. Our diversity enriches us all. Each one of us deserves respect and makes a difference. Working together is fundamental to our success. Excellence We are responsible for excellence in everything we do. We believe in personal accountability and the power of challenging the status quo. Passion Initiative and enthusiasm characterize the way we work. We take satisfaction in the quality of what we do. We are here because we want to be here. Learning We believe that learning is an invigorating and continuous process. We seek out and embrace personal and professional development, and the invaluable lessons that come from experience. 
| | |
| | ii | | 2011 Performance Highlights | | | |
| | iii | | 2011 Performance Measures | | | |
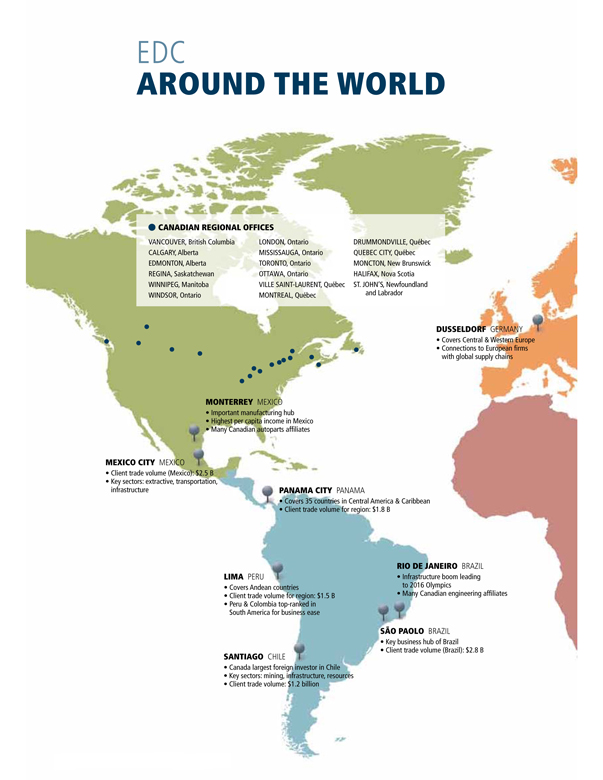
n | | 2 | | EDC Around the World | | | |
n | | 4 | | Message from the Chair | | | |
n | | 6 | | Message from the President | | | |
n | | 8 | | Message from the Chief Economist | | | |
n | | 10 | | Success Stories | | | |
n | | 18 | | Corporate Performance | | | |
n | | 28 | | Corporate Social Responsibility | | | |
n | | 32 | | Investor Relations | | | |
n | | 34 | | 2012 Strategic Objectives | | | |
n | | 38 | | Board of Directors | | | |
n | | 40 | | Executive Management Team | | | |
n | | 42 | | Corporate Governance | | | |
n | | 46 | | 2011 Financial Review | | | |
n | | 46 | | Management’s Discussion and Analysis | | | |
n | | 81 | | Consolidated Financial Statements | | | |
n | | 144 | | Ten-Year Review | | | |
| | 152 | | Glossary of Financial Terms | | | |
| | 153 | | Corporate Representation | | | |
| | | | | | | | | | |
| | | | | | | | | | |

2011 HIGHLIGHTS
ii | BUILDING RESILIENCE IN UNCERTAIN TIMES
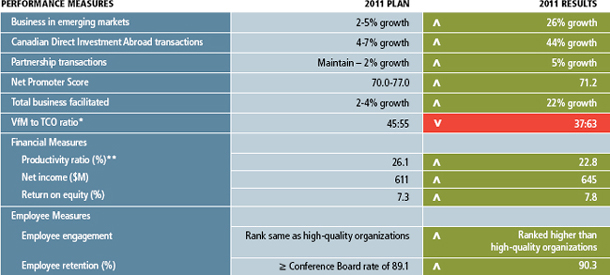
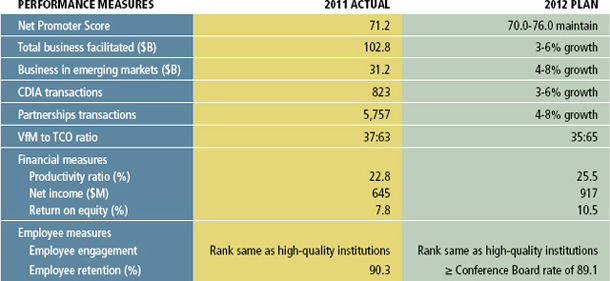
2011 PERFORMANCE MEASURES
| | |
Ratings in our performance measures are as follows:  Target met or exceeded (> 98% of plan) Target met or exceeded (> 98% of plan)
 Target substantially met (> 95% and < 98% of plan) Target substantially met (> 95% and < 98% of plan)
 Target not met (< 95% of plan) Target not met (< 95% of plan)
| | * Value for Money (VfM) are investments in IT that increase business performance. Total cost of ownership (TCO) is the cost of maintaining core business infrastructure and technology assets. ** The Productivity ratio was previously called Efficiency ratio and is the ratio of administrative expenses to net revenue, excluding debt relief. |
|
| 2011 PERFORMANCE HIGHLIGHTS BY SECTOR AND MARKET |
BUSINESS FACILITATED BY INDUSTRY SECTOR ($ IN MILLIONS)
| | | | |
| Light Manufacturing | | 7,342 | |  |
| Transportation | | 11,720 | |
| Information & Communication Technology | | 13,374 | |
| Resource | | 21,216 | |
| Extractive | | 22,273 | |
| Infrastructure & Environment | | 26,894 | |
BUSINESS FACILITATED BY GEOGRAPHIC MARKET ($ IN MILLIONS)
| | | | |
| Various regions | | 87 | |  |
| Africa/Middle East | | 6,269 | |
| South America/Central America | | 6,330 | |
| Europe | | 13,137 | |
| Asia/Pacific | | 24,260 | |
| North America/Caribbean | | 52,736 | |
EDC ANNUAL REPORT 2011 | iii
2 | BUILDING RESILIENCE IN UNCERTAIN TIMES
EDC ANNUAL REPORT 2011 | 3
MESSAGE FROM THE CHAIR

2011 turned out to be a good year for EDC particularly in light of the volatile global backdrop.
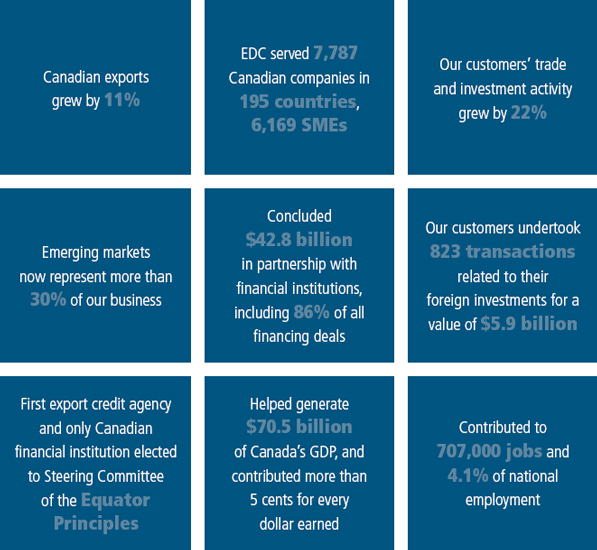
One of EDC’s key trade goals is to help our customers do more international business – exports and direct investments – in emerging markets. All the trade data clearly indicates that this is the direction global trade is moving. In fact, about a third of the trade we facilitated – some $31 billion in 2011 – was in emerging markets, up nearly a quarter over the previous year. It demonstrates how nimble companies of all sizes navigated through the turbulence. Many turned to EDC’s tools and services to venture beyond traditional markets and reduce their risks.
As the risks and complexity of global trade increase, another key goal is to do more with other financial institutions. This allows us to build on each other’s strengths and share the risk load for the benefit of our mutual customers. In 2011, the loans, guarantees and export credit we insured, together with public and private-sector financial partners, increased in value by almost 50 per cent.
Growing value to Canada
Our customers’ total exports and foreign investments had a record impact on Canadians’ jobs and the country’s economic performance. We estimate that EDC-facilitated trade in 2011 helped generate more than 5 per cent of Canada’s GDP, supporting some 707,000 jobs. That’s a remarkable success story as EDC’s primary customer base is small and mid-sized businesses; overall these firms are responsible for one out of four private sector jobs in Canada. Their growth is Canada’s strong suit and, clearly, EDC is helping propel their development.
| | |
| | Times like these also |
| underscore the | | value of careful planning |
| and | | diverse regional and |
| | global perspectives. |
|
| 4 | BUILDING RESILIENCE IN UNCERTAIN TIMES |
| | | | |
| | EDC continued to focus on bringing major foreign corporations face-to-face with well-matched Canadian suppliers and tracking the export results. | | |
Setting a new course
Times like these also underscore the value of careful planning and diverse regional and global perspectives. The Board of Directors contributes to these activities and skill sets and has built constructive relationships with EDC’s management, the Minister of International Trade and senior government officials. Combining all these elements, we advised and supported management as we set the corporation’s strategic direction for the next five years.
For example, the board met in 2011 for its annual strategy session, when we take the time to review the global situation and the future of trade for Canada. This review helped management identify several new priorities for 2012. Three industries in the midst of transformation stood out – aerospace, clean technologies and infrastructure opportunities in India. These are all areas where we think Canadian companies can be successful and make a difference.
For many of our clients, however, getting to the future meant first getting through this turbulent year. One important way EDC served Canadian firms was by redoubling our efforts to create, and help our clients carry out, new trade abroad. To that end EDC brought major foreign corporations face-to-face with well-matched Canadian suppliers. This process has become highly integrated with EDC’s services to companies engaged in large global supply chains. It complements Canada’s International Trade services in a concrete way and reinforces EDC’s development mandate.
We’re mindful of the importance of partnership. It’s our mantra, especially with our customers. So too are we partners with our colleagues in International Trade, many commercial financial institutions and our sister financial Crown corporations. Partnership and collaboration are critical because the beneficiaries are our customers. If we all do better, our customers do better.
I would also like to highlight the centralization of EDC’s risk management functions under one senior executive in these challenging times. This was part of an overall restructuring of EDC’s senior executive team towards the end of 2011 to better reflect the new global environment. As well, EDC’s ongoing measures to contain expenses and increase productivity contribute to its strength and resilience.
Special mentions
This past year was the first for our President and CEO, Stephen Poloz. He brought his unbridled energy and enthusiasm for EDC and its mandate to the chief executive’s office and made his mark quickly. As EDC’s 10th CEO in 67 years, he leads the EDC team with the confidence and curiosity required for these turbulent times.
Following the spring 2011 election, there was a change in ministerial leadership at EDC. We appreciated former International Trade Minister Peter Van Loan’s leadership during his 16 months in the portfolio and today we work closely with our new Minister, the Honourable Ed Fast. Mr. Fast’s attendance at our December board meeting reflects his regard for EDC as a member of the international trade family.
Two groups deserve special mention. My colleagues on EDC’s Board of Directors are a remarkable group of Canadians whose commitment to public service, and specifically to the Corporation, its mandate and its people, exceeds all reasonable expectations. I thank them for their guidance and dedication.
The other group is the one-of-a-kind team of executives, leaders and other employees of EDC. They come to work each day with a refreshing sense of purpose. Perhaps two things symbolize the team: the new EDC leased headquarters, for one. Not the building per se, but the design and smooth execution of the move into this building in 2011, particularly as the team maintained its demanding work flow. Second is the generosity of EDC employees: they were recognized with the Best Government of Canada Workplace Charitable Campaign 2010 Award in spring 2011. Resilience, cooperation and compassion: ingredients in a fitting formula for these times.
Our employees’ hard work shows up in the results, which speak for themselves. Our appreciation for their efforts and accomplishments is deep.
|
 |
| JIM DINNING CHAIR |
| | |
| | EDC ANNUAL REPORT 2011 | 5 |

MESSAGE FROM THE PRESIDENT
| | |
| | BUILDING RESILIENCE |
WITH OUR AND | | TRADE CLIENTS PARTNERS |

If there was any doubt, 2011 proved we live in highly uncertain times: slower economic growth, divergent economic performance between countries, growing credit stresses and unpredictable political risk events; all symptoms of an environment that’s likely to last several more years. During this awkward phase between recession and recovery, the economic climate continued to present challenges to many Canadian businesses. This made it all the more critical for EDC to position itself to help Canadian companies access new opportunities.
Moving beyond traditional markets
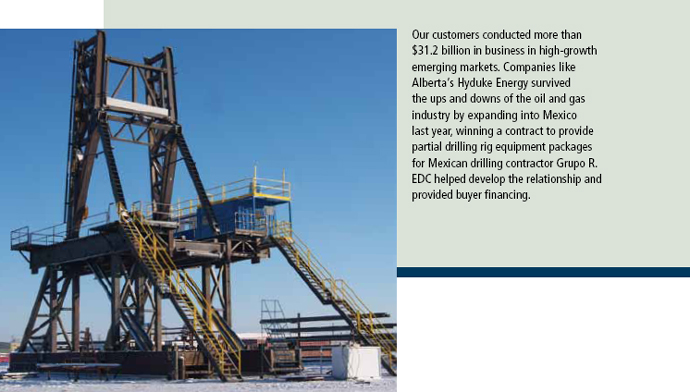
I’m especially encouraged by the inroads we helped make for our clients doing business in non-traditional markets. This year, our financial solutions helped these customers conduct $31.2 billion in business in emerging markets – an increase of 26 per cent over 2010. These markets now represent more than 30 per cent of the trade and investment we facilitate globally. This type of trade diversification is encouraging and should serve to build our resilience more.
Overall, the trade and investment that we facilitated for 7,787 customers grew 22 per cent over last year. Importantly, these customers undertook more transactions related to their foreign investments than ever, a jump of 44 per cent over last year. This amounts to 823 transactions in total, a combination of loans and insurance coverage. These foreign operations help Canadian businesses lower their costs, access large international supply chains and remain globally competitive.
More and more, we’re conducting this business in collaboration with the private sector financial community, in order to increase capacity and share risk. In 2011, these transactions grew to 5,757,
| | |
| | Emerging markets now |
| represent more than | | 30 per cent of the trade |
| and investments | | we facilitate. |
|
6 | BUILDING RESILIENCE IN UNCERTAIN TIMES
| | |
| | I’m especially encouraged by the inroads we helped make for our clients doing business in non-traditional markets. |
representing a 49 per cent jump in the overall business conducted in partnership with the private sector. Of our 937 financing deals, 86 per cent were done in partnership with other financial institutions. In fact, our partnership-preferred philosophy became an operating principle this year. We also signed a new protocol with the Business Development Bank of Canada (BDC) to minimize overlap and ensure that our customers have access to the services and financial capacity that best suit their needs.
Creating trade for the benefit of Canada
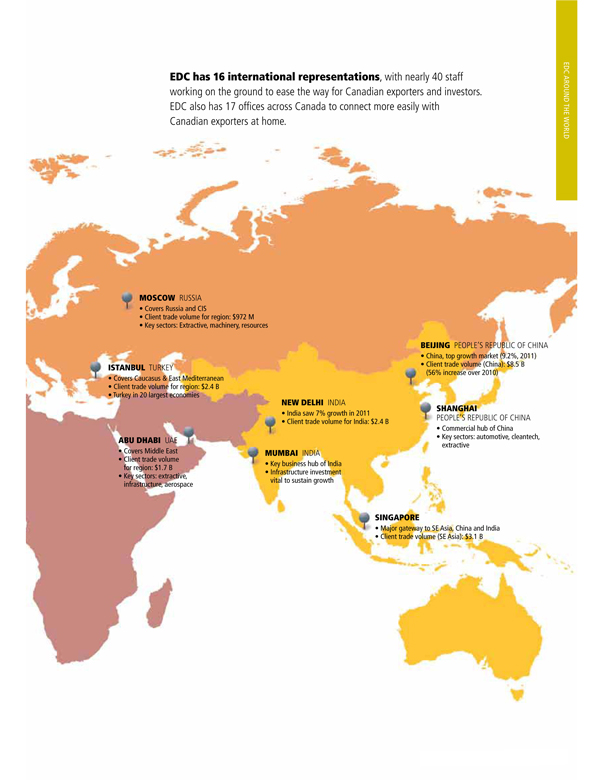
Our ultimate goal is to create prosperity for Canada. For us, this means proactively creating new trade opportunities for Canadian exporters and investors. We do so through our 16 international representatives in some of the world’s fastest-growing business hubs and in collaboration with Canada’s Trade Commissioners abroad. In addition to various matchmaking initiatives where we introduce Canadian businesses to large foreign buyers, we also participate in loans to targeted foreign companies influencing their purchase decisions to include Canadian suppliers. We call it a pull strategy, because our loans tangibly pull in exports from Canada.
As these relationships strengthen over time, foreign buyers tend to purchase more from Canada than the amount of the original loan. At the end of 2011, our pull loans that were in place for four or more years had, altogether, generated exports equal to 116 per cent of their value.
A new home, a new productive way of working
We went through a huge transformation this year, when we moved some 1,100 head office employees into a new leased building – one of the most environmentally friendly in Ottawa. I believe this building symbolizes the future of work at EDC; it integrates design and technologies that promote greater collaboration between our employees and customers, and it embodies our adoption of the Lean methodology with the goal of better productivity. Increasingly we’re asking ourselves to do more with less. And we’ve been able to do so while maintaining budget discipline – improving our expenses-to-revenue ratio, or productivity ratio. It’s all part of the “EDC Way,” an ongoing process that is shaping our resiliency to help our clients navigate the future trade environment.
Corporate Social Responsibility
As one of our overarching principles, we have a well-earned reputation for high standards of Corporate Social Responsibility (CSR), but it is an ever-evolving world and our goal is to ensure that we maintain this standard of excellence as it relates to all of our business decisions. Each year we strengthen our practices in this arena more, and in 2011, we created a Chief CSR Advisor role to better oversee the entire program.
Moving forward
Looking ahead, we’ve identified three areas where we believe Canadian firms can capitalize on opportunities and where our services can play a catalytic role. First, aerospace is set for a major transformation, which should enhance Canada’s global leadership in the industry and transform the entire supply chain. Similarly, clean technologies represent the future of sustainable development and Canada has some of the best in the field. Finally, India’s rapid economic growth will require massive infrastructure investment in areas such as power and transportation, and Canada’s expertise is an excellent match.
Special acknowledgements
Finally, I would like to thank the Board and the management team for their support and advice, helping me adjust to my first year in this office. Towards the end of 2011, we realigned our executive team to better support our corporate plan going forward. A special thanks to Sherry Noble who retired on December 31, 2011, after 34 years of service in increasingly responsible roles. As senior vice-president of the Business Solutions and Technology group since 2003, and most recently co-manager of our move to the new head office, she leaves an indelible mark throughout the corporation.
It’s been an exciting year and we are confident we have the building blocks – and resilience – to be the most knowledgeable, the most connected and the most committed partner in trade for Canada.
|
 |
| STEPHEN POLOZ PRESIDENT AND CEO |
|
| EDC ANNUAL REPORT 2011 | 7 |
MESSAGE FROM THE CHIEF ECONOMIST

The turbulence that marked 2011 eventually eclipsed the enthusiasm that first greeted the year.
An upsurge in global economic momentum during the late stages of 2010 created a springboard for growth that promised greater things for the year, and stoked the strongest feelings of optimism seen in this recessionary period. Although significant risks threatened the picture, it seemed as though the world was finally mustering its strength for a steady march to recovery. Instead, growth faltered on a number of fronts, and market volatility eroded confidence late in the year.
Clearly, something went terribly wrong
Oddly, it was not the known risks that played the spoiler. Early in the year, events that could not have been foreseen posed a major threat to the delicate global situation. The Arab Spring blindsided even the most astute analysts, sending oil prices skyward as the threat of regional contagion mounted. Higher energy prices doused resurgent consumer and business spending planet-wide, weakening global growth through mid-year.
In addition, the world had to cope with an unusual onslaught of natural disasters, from the January flooding in Australia to late-year flooding in Thailand. In between, there were other floods, droughts and seismic events, all significant, but none matching the devastation of the earthquake and tsunami in northeastern Japan in March. These events compromised global supplies of food and other key commodities, and wreaked havoc with global supply chains.
| | |
| | The effects were not |
| immediate, but | | by mid-year they were |
| more than obvious. | | Global GDP growth |
| began | | to wane, prompting predictions |
| of an imminent | | double-dip recession. |
|
| 8 | BUILDING RESILIENCE IN UNCERTAIN TIMES |
| | |
| | Demand for our commodities remained strong, but manufacturers of industrial machinery and equipment also saw impressive growth, despite increases in the Canadian dollar. |
Stock markets went into a tailspin, followed quickly by commodity and then bond markets. Not that we were feeling great ahead of these movements, but the world encountered near-panic at this point.
Worse still, volatility and fear stoked doubts about the key risks we brought into the year. Europe fumbled for both immediate and structural solutions to its sovereign debt situation, experiencing delays and downgrades, all the while implementing increasingly Draconian fiscal austerity measures. Financial institutions with significant exposure to Europe’s woes came under the microscope, spurring emergency measures aimed at shoring up confidence.
Not to be outdone, U.S. legislators came to a budgetary impasse that resulted in a debt downgrade to the world’s most sought-after financial instruments. These events brought on irrational market movements fed alternately by opportunism and excessive risk-aversion.
Amid the furor, many seemed to forget that growth was interrupted by temporary factors. Oil prices retreated as the worst fears of the Arab Spring’s impact faded. Supply chains resumed as reconstruction efforts restored production and essential infrastructure. As operations revived, it became clear that all was not lost.
Against gloomy predictions and generally abject pessimism, rising momentum began to appear – not everywhere, but in significant zones.
Perhaps the brightest spot was the U.S. economy. Undeterred even by their own sentiment, U.S. consumers spent at a strong, steady – and this time, sustainable – pace. Housing markets, on hold during mid-year, picked up strongly toward year-end. Factory orders remained impressive throughout the year, suggesting robust production through the first half of 2012.
Although it sounds very similar to the early-2011 story, in contrast, current momentum is much more concentrated on one economy. As such, it could appear more fragile and vulnerable to today’s risk mix. However, what has started in the U.S. looks sustainable, for a number of reasons.
First, it is happening in spite of weakness elsewhere. Second, it is happening without additional public stimulus. Third, it is happening on a broad base across the economy. Fourth, current levels of activity are still well below fundamental demand, suggesting that there is still a lot of sustainable growth potential in the economy. Finally, resurgent U.S. activity is occurring despite the predictions of most analysts.
Canadian exporters managed well through the turbulent year
Demand for our commodities remained strong, but manufacturers of industrial machinery and equipment also saw impressive growth, despite increases in the Canadian dollar. Growth in the auto sector was modest, largely due to temporary supply-chain interruptions. This has actually delayed sales of auto products into 2012, when the sector is expected to record impressive double-digit growth.
Together with a resurgent aerospace sector, Canada’s exporters are well-positioned for a good year ahead.
Having a bit of a wind at our backs is a nice way to start the year, but the global economy will still have to navigate past critical risks – for the most part, the same known ones we faced at the beginning of 2011. As long as decision-makers continue to address these risks with the same innovation and creativity that has brought us this far, this looks to be a good year. Hopefully, it will buy precious time that gets us closer to the state of balance in global demand and supply that is necessary to kick off the next, true world economic growth cycle.
|
 |
| PETER G. HALL VICE-PRESIDENT AND CHIEF ECONOMIST |
|
| EDC ANNUAL REPORT 2011 | 9 |


Certainly, Canada weathered the recession better than many countries. But we’re also still feeling the drag of a painfully slow global recovery.
In the coming years, tight credit, weak growth in the industrialized world, rising competition from emerging nations and a strong Canadian dollar may continue to challenge Canadian businesses hoping to expand internationally. And the stakes are high because trade represents one in five jobs.
EDC’s job is to help generate prosperity for Canada by providing financial and risk management solutions that support Canadian exporters and investors.
Increasingly, I doing this job also means actively seeking out trade opportunities for our customers.
We have several strategies in place to do so, including targeted financing to foreign buyers and “protocol” arrangements to grow procurement from Canada. And we tie them all together by introducing key foreign entities to Canadian suppliers.
Pull strategies:
the long-term view
One of our key strategies to creating trade is participating in international financing facilities to targeted foreign buyers. Essentially, we lend to large multinationals with significant supply chains, and use our influence as a lender to introduce
Canadian suppliers to senior procurement decision makers. These facilities, which we call “pulls”, led to almost $3.3 billion in new contracts in 2011, bringing new business to 871 Canadian exporters, largely small businesses. Since 2004, our pull loans facilitated export sales of almost $16 billion.
Currently, we have 244 active pulls with major buyers around the world, in sectors that match Canadian expertise. These include Codelco (Chile’s state-owned copper company), India’s Tata Motors, Brazilian energy giant Petrobras, Mexico’s state-owned petroleum company PEMEX and China’s transportation specialist, Noble Group.
|
| EDC ANNUAL REPORT 2011 | 11 |

SUCCESS STORIES
| | | | | | |
We can to Canadian | | bring real value companies – by giving them opportunities to meet | | |
with of the | | senior procurement people foreign companies that we lend to. | | |

For example, Mexico’s PEMEX is one of the largest oil and gas companies in the world. We have signed financing facilities with PEMEX over the past 30 years, and more recently started making loans to PEMEX on a pull basis. These loans have permitted EDC, the Government of Canada and several provincial governments to work with PEMEX to sell Canadian capabilities. As part of the pulls, we organize two major matchmaking events with PEMEX and their key suppliers each
year to showcase Canadian companies. Since 2006 PEMEX has bought on average $313 million a year of Canadian equipment and services. The number of Canadian suppliers to PEMEX has increased, to 60 in 2011, from 30 in 2006.
In Chile alone, we have three active pull loans in the forestry sector. CMPC, for example, is an integrated forest company that works in pulp, tissue and paper and paper products. After putting the first pull in place with CMPC in 2005, more
than 145 contracts have been signed with 110 Canadian suppliers for more than $53 million, surpassing the $48 million of our original loan. Companies like Erco Worldwide, which produces environmentally preferred chlorine dioxide technology to the pulp and paper industry, signed a $25-million deal in 2010. Other companies such as Optimil Machinery, Andritz and Autolog Sawmill Automation secured contracts worth close to $1 million each in 2011.
|
| 12 | BUILDING RESILIENCE IN UNCERTAIN TIMES |

More recently, in 2011 we provided USD 100 million in financing to India’s Tata Motors (TML) to open doors to procurement from Canadian companies. We did so because of the strong match between Canadian automotive parts expertise and the burgeoning demand of the Indian market, which has grown substantially in tandem with the explosive growth in the national economy and middle class. This facility is part of an ongoing engagement strategy with the Tata Group, following the success of previous financings with other members of the group such as Tata Communications. Matchmaking missions have already been undertaken where we have identified Canadian companies that are most suited to TML’s current and future procurement needs. This is how we can
bring real value to Canadian companies – by giving them opportunities to meet with senior procurement people of the foreign companies that we lend to.
Bringing global supply chains to Canadian exporters
Foreign multinationals with operations in Canada also contribute to Canada’s economy. Their investments into Canada bring new technology and high-paying jobs, help Canadian companies integrate into global supply chains, and enhance Canada’s productivity and competitiveness. Furthermore, when the foreign multinationals export, regardless of the multinational’s location, they may source goods and services from Canadian companies.
To encourage this trade and bring global supply chains closer to Canadian companies, we undertake agreements – or protocols – with foreign multinationals, whereby we make available a preset amount of financial capacity to be used for their foreign buyers, subject to our credit approval. These protocols aim to grow Canadian investment levels, R&D expenditures, and exports or procurement from Canada. We currently have six protocols in place with global leaders in the auto, rail and telecommunications sectors, including Ericsson Canada, Alcatel Lucent Canada, GE and Ford Motor Company of Canada.
In 2011, eight transactions that came from these protocols led to almost $1 billion in purchases from Canada.
| | | | | | |
In five years, could account for | | emerging markets 20 per cent of total Canadian exports. | | |
|
| EDC ANNUAL REPORT 2011 | 13 |

SUCCESS STORIES
Making introductions that would normally be impossible
In tandem with our pull transactions and protocols, we maintain close relationships with key foreign buyers and state-owned entities and introduce them to Canadian suppliers, something that would often be impossible for many of these smaller businesses. In 2011, we participated in 30 matchmaking missions, connecting 407 Canadian suppliers with large foreign companies from around the world.
For example, South-African-based Eskom, Africa’s largest electricity producer, hopes to double its power output by 2025, while still keeping its price for electricity competitive to accommodate those who can’t afford increases. At the same time, geopolitical instability prompted the company to diversify its supplier base. They were able to learn what capabilities Canadian companies had to offer by plugging into our network of connections. In conjunction with DFAIT and others, we introduced Eskom to about 30 Canadian suppliers from Toronto, Montreal and Vancouver, presenting opportunities to these Canadian companies, which might not have otherwise considered South Africa as an obvious trading partner.
Along with our partners at DFAIT, we also showcased Canadian capabilities in Chile – home to three of the biggest forestry companies in the world, during the 2011 Expocorma tradeshow and forestry mission in Santiago and Concepcion. This mission brought a delegation of 19 Canadian companies to meet with several large Chilean forestry players. Overall, the event is expected to result in Canadian sales of over $12 million.

| | |
| | In 2011, we |
| participated in | | 30 matchmaking |
| missions, | | connecting 407 |
| Canadian | | suppliers with large |
| foreign | | companies from |
| | around the world. |
|
| 14 | BUILDING RESILIENCE IN UNCERTAIN TIMES |

Investing abroad through foreign affiliates
More and more Canadian companies are investing in foreign affiliates, in order to diversify their customer base. They’re doing so not just to escape the strong Canadian dollar, but to compete head-on with the emergence of low cost, high quality producers in Asia and elsewhere – to remain globally competitive. And their success is building the Canadian brand and helping countless smaller Canadian businesses access their supply chain.
The strategy is paying off. Canadian companies operating abroad today are generating about the same level of sales from foreign operations as they are from export sales from Canada. According to
Statistics Canada, Canadian foreign affiliate sales grew at twice the rate of Canadian exports over the past decade, with sales originating in emerging markets nearly tripling during this period.
Adopting integrative trade practices has also helped many Canadian companies grow their business by diversifying their market base. At the start of this decade, almost 90 per cent of all Canadian exports went to the U. S . By 2010, that figure was down to 73 per cent and has continued to drop, whereas 11 per cent of our exports went to emerging markets in 2010, up from 4 per cent in 2000. If this trend continues, in five years emerging markets could account for 20 per cent of total Canadian exports.
Within that five years, the economies of India and China are expected to grow by more than 50 per cent, and Brazil by 25 per cent. These are the markets where Canadian companies need to invest to ensure their future business, and Canada’s trade prosperity.
And now is the time to make these inroads; the dollar is relatively strong and there are new opportunities emerging every day. No doubt, Canada’s trade performance is improving, but so is the performance of many other countries. We believe that Canadian companies need to adjust their integrative trade practices to keep pace with growth and realize their potential.
|
| EDC ANNUAL REPORT 2011 | 15 |

SUCCESS STORIES

Chile: Magna IV Engineering
A few years ago, Alberta-based Magna IV Engineering recognized that expanding internationally was critical to growing their business. They had been enjoying success in the Chilean mining sector since 1989, but when requests from some major clients came in, Magna IV was spurred to consider investing in a local presence. They wanted to diversify into non-mining sectors such as utilities, and knew that a local presence would certainly help these efforts. Since the contracts for the Chilean work were becoming progressively larger, EDC worked with Magna’s bank to provide an Export Guarantee and bonding so the company could free up some capital and establish its Chilean office more quickly. Currently, the Santiago office has more than 25 engineers, technicians and support staff
and, more importantly, an operational model that will help them expand with new international opportunities.
China: Norduyn Inc.
In 2010, when Norduyn Inc’s Montreal facility was operating at full capacity, they made a big decision. Norduyn produces and designs on-board equipment, such as drink trolleys, for the aerospace sector. That year they signed a large, 10-year contract with LSG Sky Chefs, an affiliate of Lufthansa, to supply airline trolleys, of which 30,000 units had already been ordered for the first three years, and an additional 12,000 units within 18 months. That led to the decision to open a manufacturing facility in Shanghai to save costs and get closer to the Chinese aerospace industry. In order to meet the commitments for the large order – and attract new customers – Norduyn needed to buy new equipment
that would help them increase capacity and improve their gross margin. EDC was able to structure the debt and provided $2 million in financing to acquire the equipment for the Shanghai affiliate.
Singapore: Sereca Fire Consulting
Sereca Fire Consulting understands that successful business often means getting closer to your customer. With 26 employees, the company provides fire engineering advice to the construction industry. With new green materials and different building codes in every region of the world, Sereca helps companies navigate regulations. Recent opportunities in the booming Asian construction market led the Vancouver-based company to establish a presence in Singapore. The company leveraged work for Vancouver’s Canada
|
| 16 | BUILDING RESILIENCE IN UNCERTAIN TIMES |
| | | | |
| | EDC provided a | | Financial Security |
| | | | Guarantee to Sereca’s |
| | bank, to could establish a | | free up working capital so they Singapore affiliate. |

Line and the Calgary Airport expansion to land two major projects in Singapore: the Sentosa Gateway Tunnel and the International Ferry Terminal. But in order to support these projects and develop new business in other Asian countries, they needed to establish an office in the country. EDC provided a Financial Security Guarantee (FSG) to Sereca’s bank, to free up working capital so they could establish the Singapore affiliate.
Vietnam: Groupe Lavergne
Groupe Lavergne produces high-quality resins from recyclable materials; they take scrap, returned expired goods, or damaged products and produce a resin that can be molded back into the original end product, such as toner cartridges. About three years ago, the company knew they needed a local presence in Asia – their large Asian customers wanted them closer to the market – and determined
that Vietnam was the place. EDC provided financing of nearly $3 million to purchase equipment for the Vietnamese facility and in 2011, the facility became operational. Asia’s auto market is now showing interest in their resins, so they hope to grow their North American base and bring more revenue home. Now, the company is seeing major cost savings and domestic business is less than one per cent of their sales.
|
| EDC ANNUAL REPORT 2011 | 17 |

| | | | | | |
| | | | DEVELOPING |
| | KNOWLEDGE | | AND RELATIONSHIPS |
| | | | Our ability to respond to the needs of Canadian companies depends on our understanding of the global marketplace and the intricacies of the integrative trade environment. This knowledge is strengthened by our relationships with Canadian financial institutions, foreign buyers, other Crown corporations, and the Government of Canada. |
Building relationships at home and abroad Relationship building is essential for gathering information and being able to take advantage of key business opportunities. In 17 offices across Canada, our account managers are the face of the corporation, serving Canadian exporters in all sectors of industry, wherever they are located. This network also extends far beyond Canadian borders, with our representations around the world. By having a presence in important markets worldwide, we can gather local market intelligence and identify new opportunities for Canadian companies. These on-the-ground representatives build and maintain relationships with strategic foreign buyers, encouraging procurement from Canadian suppliers and fostering financial partnerships that will generate benefits for Canada, particularly in rapidly growing markets such as China, India, Brazil and Mexico. | | 
Our on the ground presence in key markets around the world, such as Mumbai, India, helps us identify new opportunities for Canadian companies. |
| | Partnering for the benefit of Canada In addition to our partnerships with the private sector, we are also a member of the broader government community, where each player’s specific roles and competencies can be enhanced through collaborative efforts. DFAIT and its Trade Commissioner Service (TCS), Business Development Bank of Canada (BDC) and the Canadian Commercial Corporation (CCC ) are the key government players in the export sector. While TCS plays a different | | role from our in-market representatives in supporting international trade, they share the common goal of promoting and supporting the success of Canadian exporters and investors. In 2011, Canadian Mission staff attended a yearly training session, co-sponsored by EDC and the Canadian Commercial Corporation for outgoing Heads of Missions, on how our corporations can enhance their services. In addition, we also developed new online training modules for TCS staff unable to attend the training sessions. |
|
| EDC ANNUAL REPORT 2011 | 19 |

CORPORATE PERFORMANCE
| | | | |
| | Our new protocol with BDC ensures that Canadian companies looking to expand their international business can choose the services that best suit their needs. | | |
This year, EDC and the TCS undertook a successful collaborative pilot project developed in the Montreal area, where we identified 50 customers who would benefit from TCS expertise and introduced them to the relevant Trade Commissioners. This project will be expanded to Vancouver in 2012, with more cities planned in the future.
Our regional vice-presidents undertook regular visits to Canadian missions, embassies and consulates during travels within their assigned markets. We also conducted quarterly meetings with TCS to review joint activities and inform one another of business development plans.
Collaboration with financial institutions and Crown corporations
Given that the Canadian economy is small, open and globalizing, it’s clear that a growing number of Canadian companies will need to embrace international markets to succeed. Certainly, the integrated and coordinated response to the recession by the global financial community brought to light the many benefits of closer collaboration between financial institutions.
Our activities to support Canadian companies are enhanced through our relationships with other Crown corporations, such as the BDC, Farm Credit Canada and the Canadian Commercial Corporation. Collaboration with these Crowns enables us to gain valuable knowledge that will help us develop a wider variety of solutions to better position our customers for success.
We also formalized a Lending Practitioners Forum with several of Canada’s largest financial institutions to ensure consistent and open dialogue around strategic issues affecting the industry in the field of trade and international finance.
EDC-BDC Protocol
This year we signed a new protocol with the BDC, to ensure that Canadian companies looking to expand their business in global markets can choose the services and financial capacity that best suit their needs. The protocol aims to improve the coordination between the two Crown corporations by placing more emphasis on guiding new customers towards the relevant core strengths of each organization.
In 2011, EDC and the CCC continued to deepen our understanding of each other’s risk mitigation practices and service offerings, with an eye towards supporting joint customers from a market priority and underwriting perspective, and are currently working on formalizing a partnership protocol.
We have also been working more closely with Farm Credit Canada for the benefit of their exporting customers in the agricultural sector. This year, a joint pilot program was launched in Western Canada to work together on business development, particularly in value-added industries like horticulture and agri-food.
Intelligence for our customers
Our Trade Advisory Services (TAS) program was launched in 2010 to provide customers with enhanced trade intelligence that combines the knowledge of all our subject matter experts, made available through account managers free of charge and independent of transactional engagements. The team is now comprised of eight trade and supply chain experts. In 2011, new developments included a cash flow management video series, exporting tip sheets by sector and market, and country guides.
The team also reviewed the supply chain operations of 15 mid-market firms in 2011 and developed new relationships with trade-related stakeholders. These new relationships have already led to engagements that may not have occurred otherwise, such as, for example, the Québec Global 100 group and supply chain financing intermediaries. The team also improved the way we assess pull buyers by adding a supply chain assessment of their operations, to determine where Canadian exporters would be the best fit. TAS and our Corporate Research Department have also partnered with the Department of Foreign Affairs and International Trade ( DFAIT ) to develop a Global Value Chain manual for Canadian companies.
| | |
| 20 | BUILDING RESILIENCE IN UNCERTAIN TIMES |
| | |
| | DEPLOYING |
| INNOVATIVE | | SOLUTIONS |
| | Our innovative financial solutions played a particularly important role during the global recession and will continue to do so throughout the economic recovery, as companies look for greater predictability in managing their finances, mitigating risk and investing in future growth. |

Ratings in our performance measures are as follows:
Target met or exceeded (> 98% of plan)
Target substantially met (> 95% and < 98% of plan)
Target not met (< 95% of plan)
The crossroads between recession and recovery
Canadian companies continued to face a great deal of uncertainty throughout 2011, given the strong Canadian dollar, high commodity prices, a tight credit environment, heightened political risks and slow growth in the U.S. and Europe.
As Canadian business adjusted to this new normal, total Canadian exports increased by 11 per cent in 2011, an improvement over 2010, but still below pre-recession levels. The more encouraging news is that many Canadian companies were able to expand beyond traditional
markets and broaden their trade activity to faster-growing emerging markets. As a result, the business that we facilitated grew by 22 per cent. The share of total Canadian exports that we now facilitate increased to 21 per cent, up from 15 per cent five years ago.
Overall, we served 7,787 customers, whose export sales and investments using our financial services reached nearly $103 billion. About 80 per cent of these customers are small and medium-sized businesses. While the number of customers we serve had been rising since 2008, our customer count decreased from 8,236 in 2010. Last year, as the recovery began, the
environment has made it somewhat easier for some of these companies to manage risks and obtain financing on their own.
On the Insurance side, we helped 6,258 clients close more than $88 billion in export sales with about 74,000 buyers in more than 195 foreign markets. The majority of this business was Accounts Receivable Insurance (ARI). Given that nearly half of Canadian trade is conducted on short-term payment terms, ARI helps companies mitigate credit risk and leverage their receivables with financial institutions. Our insurance also allows them to offer their buyers more flexible payment options, including extended payment terms.
|
| EDC ANNUAL REPORT 2011 | 21 |

CORPORATE PERFORMANCE
Our financing activities delivered $14.6 billion in loans to Canadian clients and their foreign trading partners. We earned more than $1 billion in loan revenue and guarantee fees. This stems largely from more than $30 billion in commercial loans and guarantees to foreign companies in support of our Canadian clients and encompasses over $10 billion of loan advances made in 2011. We earned $234 million for coverage under our insurance programs and paid out $55 million in claims, in contrast to $126 million in 2010.
Strong growth in emerging markets
The continued uncertainty of traditional developed markets has motivated more Canadian companies to look into non-traditional markets for business, to ensure resilience moving forward. Our products and services facilitated $31.2 billion in business activity in these emerging markets in 2011, an increase of 26 per cent from 2010.
While high commodity prices contributed, much of the growth in emerging markets is a result of the investments we have made throughout the years in building relationships with our international
strategic accounts. This is particularly true in Latin American, with companies such as PEMEX, Petrobras and Codelco, where our matchmaking and targeted loans contributed $15 billion in Canadian exports and investments.
Emerging markets now represent more than 30 per cent of our business. The business that we facilitated for our customers in the BRICM countries (Brazil, Russia, India, China and Mexico) increased to almost $17 billion, up from $11.4 billion last year. The biggest increase was in the People’s Republic of China, which rose to $8.5 billion compared to $4 billion in 2010.
|
| 22 | BUILDING RESILIENCE IN UNCERTAIN TIMES |
| | |
| | Emerging markets now |
| represent | | more than 30 per cent |
| of our | | business. China alone saw an increase of |
| | 56 per cent, rising to $8.5 billion. |
Canadian companies investing abroad
The economic crisis and strong dollar certainly underscored the importance and benefits of Canadian Direct Investment Abroad (CDIA). CDIA transactions include loans to help companies open facilities in new markets or participate in joint ventures, as well as insurance for sales by foreign affiliates of Canadian companies.
In 2011, our customers undertook 823 transactions related to their foreign investments, 44 per cent more than last year. The total value of these transactions was $5.9 billion, a 25 per cent increase over 2010.
Partnership preferred
Our ability to serve Canadian companies is greatly enhanced by our partnerships with private and public sector players including banks, insurance companies, sureties and brokers. These partnerships also allow us to serve Canadian companies through their financial intermediaries, rather than directly.
In 2011, the number of transactions we conducted with partners grew to 5,757, for a value of $42.8 billion, up from $28.7 billion in 2010. Of our 937 financing transactions, 805 or nearly 86 per cent were done in partnership with financial institutions.
Equity funds
As part of our commercial offerings, we are an active investor in direct venture and growth capital investments, and also partner with private sector fund managers, both domestically and internationally. During periods of constrained credit, this program is particularly helpful to small and medium-sized companies, as it gives them access to the private equity they need to penetrate the global marketplace.
In 2011 our equity investments reached a total of $694 million in outstanding commitments and investments compared to $643 million in 2010. These include $320 million with next-generation exporters, $120 million with mid-market growth exporters and $254 million focused on connecting Canadian companies with emerging markets.
For example, we invested USD 7 million in the Capital Alliance Private Equity III Limited of Nigeria fund, through which we will develop opportunities between Canadian companies and the fund’s portfolio companies. Managed by African Capital Alliance Limited (ACA), the fund will focus on sectors key to the country’s economic development, such as power, oil and gas, telecom, and financial services – all of which mirror Canada’s export strengths. ACA’s portfolio and pipeline companies have strong connections to Canada and are already creating opportunities for incremental Canadian trade with Nigeria.
Financing and insurance in the domestic space
We continued to provide trade-related financing solutions to Canadian companies in Canada through Canada’s Economic Action Plan, which gave us temporary, additional flexibility to provide credit to Canadian companies. By working in a complementary fashion with Canadian private-sector financial and insurance institutions and the Business Development Bank of Canada (BDC), we helped position viable Canadian companies for recovery.
Under this program in 2011, we provided $3.1 billion in commercial solutions for 285 Canadian exporting companies, including $2.5 billion in direct financing, more than $454 million in domestic bonding and about $146 million in domestic credit insurance. We continued to participate as a reinsurer to private insurers, bringing additional capacity to the market for more than 163 small Canadian companies. In total, we have provided $9 billion in credit capacity to 569 Canadian companies for their trade related needs since March 2009, all of it in partnership with the private sector. This program, originally a two-year mandate from the Government of Canada, was extended until March 2012.
| | |
| | EDC ANNUAL REPORT 2011 | 23 |
CORPORATE PERFORMANCE
Sound Financial Management and Strengthened Transparency
| | |
Ratings in our performance measures are as follows: Target met or exceeded (> 98% of plan)  Target substantially met (> 95% and < 98% of plan) Target substantially met (> 95% and < 98% of plan)
Target not met (< 95% of plan) | | * 2010 results have been restated to reflect international financial reporting standards. ** Productivity ratio was previously named the Efficiency ratio. |
Through sound financial management, we ensure we have an adequate capital base to fulfill our mandate now and in the future. Operating on a self-sustaining basis with no annual appropriations from Parliament, we achieve self-sustainability by obtaining adequate return for risks taken, containing costs and appropriately managing risk.
This approach has enabled us to support almost $1,041 billion in exports and investments from the $1.3 billion in share capital invested in the Corporation by the Government of Canada since 1944.
We track our financial performance in three key performance measures; net income, return on equity and productivity ratio.
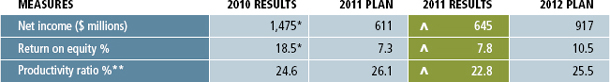
Under normal operating conditions we expect to earn net income in the range of $600 to $800 million annually. Fluctuations in the provision for credit losses, claims-related expenses and the fair value of financial instruments can cause net income to fall outside the range. Net income for 2011 was $645 million, in line with the 2011 Corporate Plan net income of $611 million, and a return to a more
normal profitability level when compared to 2010. The higher net income in 2010 was attributed to a large reversal of provisions and low claims-related expenses. The return on equity of 7.8% in 2011 was in line with the Plan.
The productivity ratio of 22.8% was significantly more favourable than the Plan of 26.1%. Administrative expenses and expenses related to our leased aircraft portfolio were lower than anticipated in the plan while loan fee revenue and realized gains on marketable securities were higher than projected in the Plan, all contributing to the favourable variance. Our continued efforts on cost containment led to lower administrative expenses in most areas.
During 2011, in compliance with changes in the Financial Administration Act, EDC began releasing quarterly financial reports to the public. These quarterly reports include financial statements for the quarter and year to date as well as a narrative discussion on financial results, risks and significant changes to operations, personnel and programs.
|
| 24 | BUILDING RESILIENCE IN UNCERTAIN TIMES |
| | |
| | DELIVERING VALUE TO |
| EDC’S | | CUSTOMERS AND PARTNERS |
We deliver value through reliable, flexible, timely and relevant service, focusing on the evolving needs of our customers regardless of their size, location or sector. Our workforce, the investments made in our technological architecture, our new head office and Lean process improvements all enabled us to provide value to Canadian global business in a cost-effective manner, and in a way that is socially responsible and upholds the expectations of Canadians.
Ratings in our performance measures are as follows:
| | |
| | | Target met or exceeded (> 98% of plan) |
 | | Target substantially met (> 95% and < 98% of plan) |
| | | Target not met (< 95% of plan) |
| * | Value for money (VfM) – investments in IT that increase business performance. |
| | Total cost of ownership (TCO) – the costs of maintaining core business infrastructure and technology assets. |
| ** | High-quality Organization norm is 74%, EDC achieved 78%. |
Measuring our success
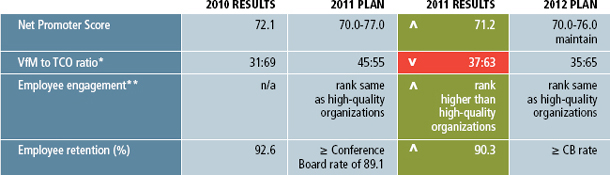
Our ongoing efforts to deliver a positive customer experience are contributing to an improved Net Promoter Score (NPS), the most relevant measure by which we evaluate our success in customer satisfaction and loyalty. Our NPS for 2011, at 71.2, although down slightly from 2010, is a good indication that the majority of our customers would be likely to refer us to partners and associates.
The NPS is based on the question: “How likely is it that you would recommend EDC
to a colleague who is also an exporter?” This single question allows us to track our progress in delivering value to customers and partners. Referral is considered one of the strongest measures of customer loyalty because it asks the customer to stake its reputation on EDC. Results indicate that we have a strong majority of promoters (73%); many passively satisfied clients (25%) and very few detractors (2%).
Account management ranked as the top driver in 2011. Other key drivers were service quality and the perception that our products are worth the time and effort.
Lean: delivering a positive customer experience
Improving our service delivery is one way we deliver greater value to our customers. By adopting the Lean methodology five years ago, we have changed the way we do business, including eliminating waste, simplifying processes and transforming technology to make our customers’ experience more predictable and consistent.
In 2011, we launched a new Lean Accounts Receivable Insurance (ARI) credit granting function, which improved the internal
|
| EDC ANNUAL REPORT 2011 | 25 |

CORPORATE PERFORMANCE

process by eliminating bottlenecks. We also launched an improved process collaboration model for our Advisory Services teams that provide advice related to environmental and social impacts, technical and legal issues, and political, reputational and human rights risk. Moving forward, we plan to create a Lean Centre of Expertise, to ensure we stay abreast of lean best practices.
Value for money
Each year, we evaluate how our information technology investments are divided between Value for Money (VfM), investments in IT, which increase business performance, and Total Cost of Ownership (TCO ), which are the costs of maintaining core business infrastructure and technology assets.
In 2011, our result of 37:63 did not reach our Corporate Plan of 45:55. While we did see a positive increase in VfM spend from 2010 when the ratio was 31:69, TCO spending was higher than plan due to the costs required to support an increasing
number of business systems and system architectural complexity. It is expected that the upward pressure on TCO will continue in the near future, as we continue to modernize our legacy systems and information technology architecture.
New head office
In 2011, we consolidated all Ottawa-based staff in one building. The new, leased head office, which is being evaluated for Leadership in Energy and Environmental Design (LEED) gold standard certification, features enhanced technology including videoconferencing facilities and wireless tools that support flexible work arrangements, increased mobility and collaboration. This technology will create greater efficiencies, and hold travel costs flat, without sacrificing our standards of customer service.
Modernizing our business applications
Our Information Technology Strategy in 2011 focused on three main initiatives: to develop an information architecture that
enables self-service business intelligence and reporting; to build common services and platforms to enable more seamless connectivity between our business and the supply chains of our clients; and to deploy a web channel that complements our other channels, with portals and content tailored to our stakeholders’ requirements.
To support the strategy, several initiatives were identified as part of our Business Architecture Redesign program – namely to modernize our current business applications and build an architectural foundation that strengthens our partnerships with our customers, and to give employees quicker and easier access to decision-making information. In 2011, we implemented the first phase of the Credit Risk Rating Engine project, which updated and standardized our credit risk processes, addressed gaps in our risk rating processes and streamlined data flow to ensure information is received on a timely basis. Phase 1 of the new edc.ca was also completed, with the launch of our new website.
|
| 26 | BUILDING RESILIENCE IN UNCERTAIN TIMES |

We also spent a good deal of effort this year strengthening our enterprise risk management framework. And, we elevated our risk management function to the executive level, appointing a senior executive to head all key aspects of risk management.
A culture of learning
Our human resources strategy is committed to ensuring that customers continue to be served by an engaged and committed workforce; a culture of learning is a cornerstone of our employment value proposition. We have a strong employee development program and offer courses within our five key learning streams: New Employees, Products & Services, Leadership Development, the “EDC Way” and Languages. Learning streams are aligned with our corporate goals and confirmed annually by EDC’s Executive Team.
In 2011, support for the new building and new work environment was a priority. We delivered technology training sessions to all employees, which corresponded with each move of employees to the new building. To support change management efforts, training sessions were also provided for leaders on Managing Teams with Remote Employees and How to Run Effective Meetings.
We also renewed our emphasis on bilingualism in order to provide service to our customers in the official language of their choice. Leaders and key resources are the strategic focus for a B level of proficiency.
As greater numbers of our employees are working outside of Ottawa, efforts continued to increase accessibility of training through online delivery and “intensive” training weeks. We implemented a learning management system to establish the platform for “anytime, anyplace, any pace” access to learning. At the end of 2011, 50 per cent of our course offerings were available in non-classroom-type formats.
Training
Ongoing learning is one of our core values. A strong learning and development program contributes to employee engagement and ensures our employees maintain the skills and knowledge needed to help our customers.
Corporate-wide training was offered in 2011 to increase employees’ understanding and awareness of the reasons behind our transformational change underway and to empower and engage employees to create a work environment with greater levels of trust and collaboration.
Our in-house language training program includes multiple options for learning, including classroom sessions, one-on-one language training sessions with senior leaders, intensive immersion programs, and online training and support. To further embed bilingualism and develop a bilingual work culture, opportunities are also being created outside the classroom for employees to practice in a day-to-day work environment.
In addition to benefiting our customers, together these measures result in a more engaged employee base. Our employee retention rate in 2011 was 90.3 per cent.
Corporate Social Responsibility
Delivering value also means operating in a socially responsible manner, which forms an integral part of our larger economic goal of enhancing Canada’s trade performance. To ensure we stay in step with international best practices, in 2011, we conducted a strategic review of our CSR practices, benchmarking ourselves against our peers. For highlights on our environmental and social performance throughout 2011, please see the Corporate Social Responsibility section of this report. We also publish a comprehensive CSR annual report slated for release in May 2012.
|
| EDC ANNUAL REPORT 2011 | 27 |


2011 CSR Scorecard
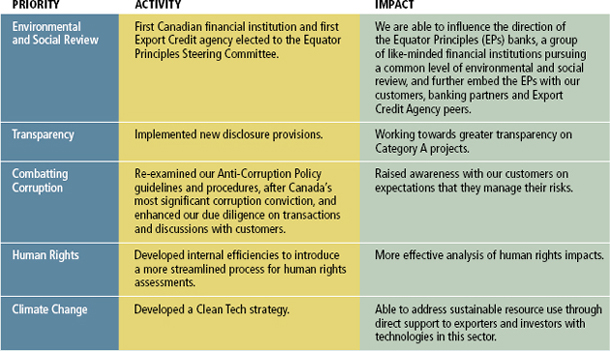
Election to the Equator Principles Steering Committee
In 2011, we became the first export credit agency and the first Canadian financial institution to be represented on the Steering Committee of the Equator Principles (EP). The Equator Principles are a financial industry benchmark for determining, assessing and managing social and environmental risk in project financing. The EP banks are committed to a common level of implementation. The EP Steering Committee is composed of 14 members that coordinate the administration, management and develop-
ment of the EPs on behalf of the member financial institutions and associates.
We first adopted the EPs in 2007, reflecting our ongoing commitment to conduct our international business in a socially and environmentally responsible manner. Currently, 73 financial institutions in 27 countries have officially adopted the EPs, covering over 70 per cent of international project finance debt in emerging markets.
Being part of the Steering Committee allows us to have a more direct hand in developing more common ground for corporate social responsibility internationally.
First year of our new Environmental and Social Risk Management Framework
We understand that there are environmental and social risks involved in the business we support. As such, it is critical that we have strong procedures to identify and reduce potential adverse impacts of these risks. In late 2010 we finalized revisions to the policies that guide our approach to reviewing and assessing the environmental – and social – risks of our business, under a new Environmental and Social Risk Management Framework.
|
| EDC ANNUAL REPORT 2011 | 29 |

CORPORATE SOCIAL RESPONSIBILITY
Greater transparency
Within the new Framework, in 2011 we made the IFC Performance Standards our dominant reference standard for environmental and social project performance in developing countries. We also began providing more information on Category A projects (those likely to have significant adverse environmental effects) through project review summaries containing information on project categorization, the rationale for our support and any relevant environmental and social issues reviewed.
Combating corruption as a competitive advantage
People often regard corruption as a moral issue when it is in fact also an economic and legal issue. At its base, corruption – and bribery – distort the rules of fair play in international trade, resulting in inferior goods and services for inflated prices.
On the legal front, corruption of a foreign official is an indictable criminal offence punishable by five years in prison. In fact, 2011 witnessed Canada’s first significant conviction of a Canadian private sector firm under the Corruption of Foreign Public Officials Act (CFPOA) and other investigations which are ongoing.
As a result, we set about to re-examine our anti-corruption policy guidelines and procedures to ensure they are best in class.
We also reinforced our working relationship with the leading anti-corruption NGO, Transparency International Canada, as a means of enhancing our own understanding of legal risks and best practices, not only for due diligence, but also to learn what other companies are doing to combat corruption.
In 2011, 54 transactions reviewed for CSR risks resulted in enhanced anti-corruption due diligence, which afforded us the opportunity to explain to our customers where we felt they faced corruption risks and what they should put in place to protect themselves.
Chief Corporate Responsibility Advisor appointed
EDC has a well-earned reputation for high standards of CSR, as well as the ability to implement these standards in transactions in a practical and effective way that supports our mandate. The world of CSR is ever-evolving and our goal is to ensure that we maintain this standard of excellence as it relates to all of our business decisions.
To that end, in 2011 Signi Schneider was appointed Chief Corporate Social Responsibility (CSR) Advisor, to lead a team of environmental and corporate responsibility experts to ensure we conduct our business in a socially responsible manner. Ms. Schneider joined EDC in 2002 in the Political Risk Analysis Department. She

In 2011 Signi Schneider was appointed Chief CSR Advisor.
has experience in the mining and oil and gas sectors and emerging markets, and most recently was responsible for human rights and political risk assessments.
Throughout the year, we also developed internal efficiencies for a more streamlined process for human rights assessments, and developed a Clean Tech strategy, which will help us address climate change through direct support to exporters and investors with clean technologies.
|
| 30 | BUILDING RESILIENCE IN UNCERTAIN TIMES |
| | |
| | The world of CSR is |
| | ever-evolving and our goal is to |
| ensure that we | | maintain our standard |
| | of excellence. |
Beyond Exports:
EDC and CARE Canada
Outside Canada, we have engaged in a partnership with CARE Canada to assist small, business development projects around the world through a joint global community investment initiative: Beyond Exports. In each year of this four-year program, we invest $170,000 and assign staff to various CARE enterprise development projects around the world.
In 2009, our first two volunteers were assigned to Peru, where they lent their expertise to several local agricultural businesses. Since then, we have sent another volunteer to Peru and four more to work with CARE Zambia. In 2011, we sent our first volunteer to India. To date, 11 volunteers have participated in this program.

|
| EDC ANNUAL REPORT 2011 | 31 |

| | | | |
2011 Summary The year began with of sense of optimism about the global economic outlook, but by mid-year that optimism was in retreat and financial market conditions began to deteriorate. With a renewal of European sovereign debt concerns – which spread into the core economies – and dislocations in several core European Bond markets, credit concerns were rekindled, particularly with European banks. The increased funding pressure on these financial institutions and continued deleveraging contributed to the economic slowdown that we witnessed in the second half of the year, which saw a general flight to safety in international financial markets. European officials did, however, become more aggressive in trying to resolve the underlying issues and restore confidence in the system. And while recent adjustments are a step in the right direction, markets will need additional information before confidence is fully restored. In this environment – where investors place a premium on safety and quality – we benefited from increased investor interest. Demand for our products exceeded our forecast and we borrowed USD 5.75 billion. Throughout the year, we continued to see dynamic growth in our investor base and heavy demand for our transactions when we went to market. | | 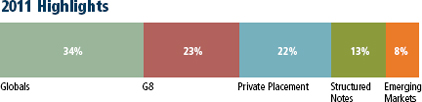
Our borrowing program is based on five key components: US dollar benchmark transactions (Globals), issuing in G8 currencies, pursuing emerging market currencies, private placements and structured notes. |
| | US Dollar benchmarks Our first benchmark was a USD 1-billion, three-year Global bond completed in April. Building on interest in the three-year sector and strong demand for credit of the Government of Canada, the transaction was significantly oversubscribed with a USD 2.6 billion order book. Central banks made up the largest portion of accounts – a testament to EDC’s Canadian credit quality. The second USD Global, a five-year, was executed in October. The order book grew quickly and reached the USD 1 billion threshold within hours. The price guidance was revised and the book closed with orders in excess of USD 1.9 billion. The geographic distribution was diverse and it included a significant presence of Central Banks and Official Institutions. | | G8 Issuance We also targeted other G8 currencies and issued two British Pounds (GBP) bonds in 2011. The first was a GBP 200-million, two-year bond that was acquired by investors from Europe, the Middle East and Africa. The second was a GBP 250-million nine-month private placement. We will continue with this strategy to fund in the G8 markets as a means of achieving investor diversification. At the beginning of 2011, we were encouraged by the depth of demand in the Kangaroo market. Market intelligence revealed international investors were increasing their Australian dollar portfolios and were receptive to gaining exposure to Canadian credit. These conditions created the ideal backdrop and we issued a AUD 500-million, five-year Kangaroo bond, which was well received by domestic and international investors. |
| | | | |
| | | | |
|
| 32 | BUILDING RESILIENCE IN UNCERTAIN TIMES |
| | |
| | Our bonds are the full faith and credit obligations of the Government of Canada. |
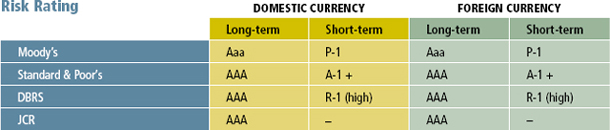
Zero per cent BIS risk weighted according to Basel II guidelines.
Australia’s regulators subsequently announced changes to meet new global banking regulations. The Sovereign supranational agency (SSA) sector did not qualify as eligible assets under their liquidity standards. Consequently, issuance into the Australian market slowed dramatically.
As the Australian Prudential Regulation Authority releases information about the evolving regulatory environment, EDC will assess the implications to the SSA sector and the impact on our funding strategy.
Private placements
The amount of private placements increased in 2011. Over the past three years we have focused our investor relations efforts in the United States – a strategy that has diversified our investors’ portfolios, particularly among institutional accounts in America and the Caribbean. These transactions provided investors with name diversification and access to Canadian credit.
The remaining funding was done through structured transactions and niche transactions in a variety of currencies and terms.
2012 Outlook
The sovereign debt crisis continues to impact global financial markets. Canada has remained resilient and benefits from its safe haven status. It is difficult to predict what market conditions will be in 2012 as the situation in Europe continues to unfold.
In 2012, our funding program is expected to be USD 6 billion. We will target benchmark transactions, medium-term notes and private placements with an emphasis on US dollars, G8 currencies and bonds denominated in emerging market currencies in support of our customers. The growth of the US market will remain a priority in 2012.
In the current environment, investors are seeking direct dialogue and more detailed information to assist with their investment decisions. Investor marketing remains a strategic priority and senior management will embark on a series of initiatives including one-on-one meetings, panel participation as well as targeted conferences.
Our bonds are the full faith and credit obligations of the Government of Canada. The ratings reflect our status as an agent of her Majesty in right of Canada and EDC’s 100 per cent ownership by the Government of Canada.
We service our debt from our own resources and our borrowings are the Government of Canada’s full obligations, with access to the Consolidated Revenue Fund (the government’s primary account) ensuring timeliness of payment. Throughout our history, this mechanism has never been used.
|
| EDC ANNUAL REPORT 2011 | 33 |

| | |
| 2012 | | STRATEGIC OBJECTIVES |
| | The following is an overview of the business strategy and performance measures of the summary of which is available at ww.edc.ca/corporateplan. |
The following table depicts our scorecard for 2012 and key measures of success and planning performance for 2012.
The planning environment
The current planning environment is one of continued economic uncertainty. Sudden changes with the potential to disrupt trade and investment activities, such as debt crises, social and political turmoil and natural disasters, are expected to occur more frequently in the future. At the same time, opportunities to sell Canadian goods and services overseas will intensify over the coming years, driven by the rapid increase in wealth in emerging markets, the signing of new trade agreements by the Government of Canada, and the development of Canada’s
potential in industries such as transportation, information and communications technology and infrastructure.
The world economy is recovering slowly and its momentum is fragile. After plunging almost 24 per cent in 2009, Canadian exports grew by 10 per cent in 2010 and 11 per cent in 2011. While the worst of the financial crisis may be behind us, Canada’s exports are not expected to reach pre-recession levels until later this year. EDC forecasts that Canadian exports will grow at a rate of close to 5 per cent per year, on average, over the next five years, with commodities, auto, aerospace and industrial machinery
and equipment sectors expected to do particularly well.
Canadian trade is diversifying quickly as companies respond to strong demand in emerging markets where growth in consumer, business and government spending is bringing opportunities in all industries. Sectors such as auto and industrial machinery will continue recovering, while demand for Canada’s resources remains firm. Innovation will allow the Canadian aerospace industry to enter a new growth phase while underpinning the development of other sectors such as health sciences, the digital economy and environmental technologies.
|
| 34 | BUILDING RESILIENCE IN UNCERTAIN TIMES |
| | | | | | |
| | Our three trade creating priorities for 2012 | | › | | Aerospace sector |
| | | |
| | | | › | | Clean technologies |
| | | |
| | | | › | | India infrastructure |
Business Strategy
Our Business Strategy focuses on the role we can play in helping Canadian companies respond to challenges and opportunities. In 2011, we adopted a new framework, which serves as the architecture for the 2012-2016 Corporate Plan. The new framework takes into account the four dimensions present in everything we do: business development, operations, risk management and financial sustainability. With a goal of creating benefits for Canada, our ability to be effective, adaptable and resilient requires a balance of all four of these dimensions in all key decisions.
In addition, our two overarching principles: a Partnership-Preferred Philosophy and a commitment to Corporate Social Responsibility will also continue to guide our decision making on key corporate initiatives.
A Partnership-Preferred Philosophy
Working alongside our private sector partners in a complementary manner is our preferred business model. It makes for better, seamless customer service, and ensures that our capacity is deployed where it is needed in an efficient manner. Similarly, we work closely with the Government of Canada and other Crown corporations.
Over the planning period, we will deepen our relationships with the financial industry, and focus on distributing our solutions to exporters across Canada; we will also strengthen our online service offering, making it easier for banks and other lenders to help deploy our solutions for the benefit of their clients. We will also enhance our relationships with players
in the broader government community, particularly the Department of Foreign Affairs and International Trade’s (DFAIT) Trade Commissioner Service, Business Development Bank of Canada and the Canadian Commercial Corporation.
Our commitment to Corporate Social Responsibility
Companies today have an increased responsibility to consider the ethical, environmental and social impacts of their business. Canadian companies operate in all sectors and have established a reputation, both in Canada and abroad, for conducting business in a fair, open and responsible manner. As a partner, we share responsibility for that reputation. In 2011, we completed a strategic review of our Corporate Social Responsibility (CSR) practices, benchmarking ourselves against the practices of export credit agencies (ECA) and private sector peers, to set a strategic direction for the coming years. Three themes emerged. Over the planning period, we will engage with our partners to keep pace with evolving standards, support a level playing field, and promote consistent implementation and application of the IFC Performance Standards, as well as greater commonality among ECAs and financial institutions in addressing human rights issues. Secondly, we will focus on providing financial solutions for the clean tech sector. Thirdly, we plan to enhance transparency through more robust disclosure of the environmental and social impacts of the projects we finance or insure, and enhance profiles of our CSR policies and performance to the public.
Delivering financial solutions and creating trade opportunities
Moving forward, we believe that the uncertain environment in which Canadian companies operate will lead to continued demand for our core services, particularly those that mitigate risk. Our suite of financial and risk management products, trade advisory solutions and matchmaking experience will play a key role in expanding Canada’s trade over the next five years. Additionally, we will increase efforts to create and develop trade opportunities for Canadian companies by using our capital to “pull” exports from Canada, connecting Canadian companies with foreign buyers, working with foreign multinationals present in Canada, and assisting Canadian companies with overseas investment.
Three trade-creating initiatives
Over 2012, we will launch three strategic initiatives in areas where the potential to create new trade and investment opportunities is significant. The first is aimed at the Canadian Aerospace industry. The advent of the CSeries program could change the face of the industry and drive the country’s global leadership in this sector. We are positioning ourselves to play a role in providing solutions to ensure that the growth potential of this industry can be realized.
Secondly, the clean technologies (clean tech) industry is one with huge opportunities that match Canada’s large pool of established and emerging expertise. Through this initiative, we will extend financial solutions to commercially viable companies and
|
| EDC ANNUAL REPORT 2011 | 35 |

2012 STRATEGIC OBJECTIVES
Working alongside
our private sector partners
in a complementary manner is our
preferred business model.
technologies in the clean technology space. We will carefully assess a series of factors, such as whether a company, its technology and associated contracts or projects are commercially viable, and consider extending the financial solutions required in partnership Canada’s private financial sector. We will also attempt to match Canada’s clean tech capabilities with global opportunities, and provide trade advice to Canadian companies – in both cases, in close partnership with the Government of Canada and provincial trade partners and Sustainable Development Technology Canada (SDTC).
The third initiative is targeted at infrastructure opportunities in India, an economy expected to expand at an annual rate of more than 8 per cent over the next five years. Supporting India’s rapid economic growth will require massive investment in new infrastructure ranging from power generation and transmission to transportation and municipal services. The Indian government has clearly indicated its commitment to delivering this infrastructure, with spending expected to reach $1 trillion over the next five years. The need to engage foreign resources, expertise and capital to build such infrastructure will present significant opportunities to Canadian companies.
Enhancing productivity and building organizational resilience
We have recently achieved productivity gains by reshaping our organizational structures, revamping our processes across business functions and upgrading our technology, and we will continue to implement initiatives that improve
performance and refine our productivity measures. We are currently in the process of redesigning our external and internal web portals to deliver better service to our customers and partners. The strategy for our external website is to provide an effective and engaging personalized, self-serve user experience where appropriate. The website changes are driven by three main objectives: to satisfy growing customer expectations, to increase operational efficiency, and to leverage “web intelligence” to drive proactive engagement.
By introducing the Lean process methodology five years ago, we have been transforming the way we work; strengthening the quality of our products and services, increasing our internal productivity and delivering more value to our customers. The Lean process presents opportunities to eliminate waste, shorten wait times and make our customers’ experience more predictable and consistent. To ensure the continued success of these initiatives, we will create a “Lean Centre of Expertise,” a team of senior experts to stay abreast of industry best practices and provide support to the organization.
Taken together, these and other initiatives will support the delivery of our solutions to Canadian businesses and our commitment to operational efficiency and sound financial management. These efforts have helped contain costs by enabling the corporation to deliver more value per employee, and provide greater value to its clients.
Cost containment
Sound financial management provides the foundation for the deployment of our financial services, and cost containment
is an ongoing discipline at EDC. The Government of Canada announced in Budget 2011 the undertaking of a Strategic and Operating Review (SOR) in order to identify areas for savings. As a non appropriation-dependent Crown corporation, we are not formally subject to the SOR but are committed to the spirit and intent of the exercise by undertaking a self-review to identify efficiencies. As such, we will strive to improve productivity across our operations. We have made significant investments in Lean processes and technology in order to contain and reduce costs over the long term, and conducted an in-depth review of our cost structure and identified areas for continued focus. For 2012, our administrative expenses are targeted at $303 million. Targeted reductions will be made in travel, marketing and external business development. We will also be targeting a productivity ratio of 24-26% for 2012 and beyond, whereby we will commit to spending no more than approximately $0.25 for every incremental dollar of net revenue that we earn.
Measuring success
Our measurement program enables us to track our performance against the strategic objectives presented in our Business Strategy. They include the Net Promoter Score (which measures customer satisfaction), total business facilitated (including business in emerging markets), the number of Canadian Direct Investment Abroad transactions, the number of partnership transactions, and measures relating to financial performance and employee retention and engagement. The measurement program also estimates how our activities contribute to the benefit of Canada’s economy.
|
| 36 | BUILDING RESILIENCE IN UNCERTAIN TIMES |
Customer-related measures
Net Promoter Score
The Net Promoter Score (NPS) is the measure we use to evaluate our success in customer satisfaction and loyalty. NPS measures our reputation and the likelihood that a customer will recommend EDC to colleagues or other businesses.
Business measures
Total Business Facilitated
Total Business Facilitated provides an order of magnitude of the business Canadian companies carry out with the help of our solutions. It is subject to variation from a range of external factors, such as exchange rates and commodity prices.
Business in emerging markets
Emerging markets present significant opportunities for Canadian companies to diversify their customer base and take advantage of growth opportunities as host economies develop. We expect growth in emerging market business to be slightly stronger than our overall growth, as Canadian companies continue to diversify their activities.
Canadian Direct Investment Abroad (CDIA)
The facilitation of CDIA is another way we measure our success in strengthening Canada’s trade capacity. Canadian companies use our services, insurance and financing programs to facilitate their CDIA in order to globalize their operations and create a competitive advantage. Investments in foreign markets by Canadian companies are an important source of benefits to Canada.
Partnering to serve Canadian companies
Our Partnership-Preferred Philosophy translates into a steady growth of the business we conduct by sharing risks with private sector partners, which enhances our ability to effectively serve Canadian companies. Partnerships enable us to serve Canadian companies through their established financial intermediaries, allowing us to share risk and provide credit enhancements to banks and sureties, making it more attractive for them to extend financing or coverage to customers. Performance is measured by the number of partnership transactions facilitated.
Leveraging technology to support the Business Strategy
We measure the allocation of information technology dollars between Value for Money initiatives (VfM) and Total Cost of Ownership (TCO). VfM refers to discretionary technology investments that drive business value. TCO refers to technology investments required to maintain core technology assets and infrastructure.
Our goal is to devote more resources to delivering on VfM objectives, while also managing TCO. In fact, since 2003, our VfM to TCO ratio has changed from 23:77 to 37:63 in 2011. However, as we continue to redesign our IT architecture, we expect this ratio will decrease in 2012 to 35:65.
Measuring financial performance
We measure our financial performance in three areas: the Productivity Ratio, Net Income and Return on Equity (ROE). These measures track our ability to deliver value to our customers, partners and shareholder, through sound financial management.
The Productivity Ratio, previously named the Efficiency Ratio, measures the operational efficiency of the corporation as investments in people and technology are required to keep pace with the growth and complexity of the business. It is the ratio of administrative expenses to net revenue, excluding debt relief.
Our total earnings are reflected in Net Income, the net result of our financing, investment, insurance and risk management activities.
Return on Equity (ROE) measures EDC’s profitability by calculating our net income as a percentage of equity. It takes into account both the profitability of EDC and the risk of the business undertaken.
Employee measures
Leveraging people
Our people strategy aims to attract and retain a highly qualified workforce in order to successfully implement our business strategy today and in the years to come. How well this is accomplished is measured by employee feedback on their engagement with EDC and by an employee retention rate.
|
| EDC ANNUAL REPORT 2011 | 37 |

BOARD OF
DIRECTORS
Norman M. Betts
Fredericton, New Brunswick
First appointed to EDC’s Board of Directors in 2007, Dr. Betts was reappointed for a second term in February 2010. Dr. Betts has an extensive record of public service. As the MLA for Southwest Miramichi, he served the people of New Brunswick as Minister of Finance from 1999 to 2001 and Minister of Business New Brunswick from 2001 to 2003. Dr. Betts is currently an associate professor with the Faculty of Business Administration at the University of New Brunswick and sits on several other Boards of Directors including New Brunswick Power Holdings, Tembec Inc., and the Nature Conservancy for the Atlantic region. He holds a PhD in Management from Queen’s School of Business and is a chartered accountant.
Jacques Boivin
Quebec City, Quebec
Mr. Boivin was appointed to EDC’s Board of Directors in March 2009. A partner at Quebec City law firm Beauvais Truchon g.p., Mr. Boivin specializes in mergers and acquisitions, sales and financing, as well as bankruptcy and insolvency. He has also served as an instructor at the École du Barreau du Québec. Mr. Boivin is a member of the Barreau du Québec, the Canadian Bar Association and INSOL International. In addition to his law practice, Mr. Boivin is active in his community and serves on boards of organizations that support education and health services.
Jeff Burghardt
Oakville, Ontario
Mr. Burghardt was appointed to EDC’s Board of Directors in June 2008. He has worked in the agricultural industry for more than 25 years, including 10 years as President and Chief Executive Officer of Prince Rupert Grain Ltd. and as Chair of the Northwest Corridor Development Corporation. A leading advocate for his region, Mr. Burghardt has served as an industry advisor to both federal and provincial governments on issues surrounding transportation, economic development and investment.
Adam Chowaniec
Ottawa, Ontario
Dr. Chowaniec was appointed to EDC’s Board of Directors in April 2008. Currently Chairman of the Board of Directors of Zarlink Semiconductor Inc., he has held executive positions at Acadia University, Bell Northern Research, Nortel Networks, Commodore International and Calmos Systems. After serving as both president and vice-president of Newbridge Networks, Dr. Chowaniec was the founding CEO of Tundra Semiconductor Corporation in 1995. From 2006 to 2008, he was Chair of the Ontario Premier’s Research and Innovation Council. He has been widely recognized for his leadership, business excellence and innovation, and was named Business Person of the Year by the Ottawa Chamber of Commerce in 1999.
Herbert M. Clarke
St. John’s, Newfoundland
Mr. Clarke was appointed to EDC’s Board of Directors in 2009. He has substantial private and public sector experience in the areas of public policy and industry-government relationships, particularly as they relate to shipbuilding, marine construction, fish and fish products, and energy. Mr. Clarke is president of HMC Associates Ltd., a private consulting and investment firm. Previously, he served as Newfoundland and Labrador’s Clerk of the Executive Council and Secretary to Cabinet, the most senior position in the province’s public service. Mr. Clarke has been a member of the Canada-Newfoundland Offshore Petroleum Board, founding Chairman of the Fisheries Resource Conservation Council, and Public Review Commissioner for a major offshore oil and gas project.
Jim Dinning
Chair, Calgary, Alberta
Mr. Dinning became Chair of Export Development Canada in 2007. He is Chair of Western Financial Group and has extensive experience in the private sector as a senior executive and as chair and director of a number of multinational and export-oriented Canadian companies. Mr. Dinning served in senior public sector leadership roles during his 11-year tenure as a member of the Alberta legislative assembly, including Minister of Education and Provincial Treasurer. He also serves as Chancellor of the University of Calgary.
38 | BUILDING RESILIENCE IN UNCERTAIN TIMES
Linda M. O. Hohol
Calgary, Alberta
Ms. Hohol was appointed to EDC’s Board of Directors in 2007. With significant experience in the financial sector and expertise in venture capital financing and wealth management, Ms. Hohol was President of the TSX Venture Exchange from 2002 to 2007, after a long career with CIBC, which included a position as Executive Vice-President of Wealth Management. She is a Director of several non-profit and private sector corporations, including ATB Financial, EllisDon Construction and United Way of Calgary, and has been recognized as one of the 100 Most Powerful Women in Canada.
Donald A. MacLeod
Dartmouth, Nova Scotia
Mr. MacLeod was appointed to EDC’s Board of Directors in 2008. Currently serving as vice-president and senior counsel for J. Ray McDermott Canada, Ltd. (Secunda Marine Services), Mr. MacLeod has held senior management positions within the organization since 1989. He has extensive involvement in commercial transactions in Canada and internationally within the shipping and offshore oil and gas sector. Mr. MacLeod is Chair of the Shipowners’ Mutual Protection and Indemnity Association (Luxembourg), and holds positions on several of its affiliates and management committees. He is a member of the Nova Scotia Barristers’ Society.
Stephen S. Poloz
President and Chief Executive Officer, Ottawa, Ontario
Mr. Poloz was appointed President and Chief Executive Officer in January 2011, after nearly 30 years of public and private sector experience in financial markets, forecasting and economic policy. He joined EDC in 1999 as vice-president and chief economist, and in 2004 was promoted to senior vice-president, corporate affairs and chief economist, adding responsibility for corporate planning, communications, government and international relations, engineering, corporate social responsibility and corporate research. From 2008 to 2010 he was senior vice-president, financing, with responsibility for all of EDC’s lending programs, in addition to the economics and corporate and international trade intelligence groups. Prior to joining EDC, Mr. Poloz spent five years with Montreal-based BCA Research, and 14 years with the Bank of Canada in Ottawa. He has been a visiting scholar at the International Monetary Fund in Washington, and at the Economic Planning Agency in Tokyo. He has served as president of the Ottawa Economics Association and is a Certified International Trade Professional.
John R. Rooney
Calgary, Alberta
Mr. Rooney was first appointed to EDC’s Board of Directors in 2007 and was reappointed in January 2010. A Calgary-based entrepreneurial executive with technical background in finance, he currently serves as Chairman and CEO of Northern Blizzard Resources Inc. Mr. Rooney is a Chartered Accountant and Chartered Business Valuator and with more than 20 years of experience primarily in the oil and gas industry. He also serves as a director of several public and private companies and not-for-profit organizations.
Jeffrey Steiner
Toronto, Ontario
Mr. Steiner was appointed to EDC’s Board of Directors in December 2010. Before establishing New Franchise Media in 2010, Mr. Steiner served approximately seven years as president and chief executive officer of the Toronto Economic Development Corporation (TEDCO), and three years as a board member of the Alcohol and Gaming Commission of Ontario. Mr. Steiner currently serves as Chair of the Governance Committee on the Board of Directors of the Ontario Centres of Excellence Inc., which oversees government investment in the commercialization of university R&D through industry-academic collaboration and venture capital finance. He is an active member of the Young Presidents’ Organization (YPO) Toronto Chapter and the Institute of Corporate Directors with an ICD. D designation.
Darlene Thibault
Laval, Quebec
Ms. Thibault was appointed to EDC’s Board of Directors in January, 2010. A Director at the Bank of Nova Scotia since 2005, Ms. Thibault is responsible for Credit Lease Scotia and the Immigrant Investor Program in the Quebec region. Her 20-year career in the financial industry has included positions at HSBC Bank, the Bank of Montreal, Bombardier Capital Ltd., AT&T Capital Canada Inc. and Pitney Bowes Leasing.
EDC ANNUAL REPORT 2011 | 39

EXECUTIVE
MANAGEMENT TEAM

Left to right: Rajesh Sharma, Derek Layne, Ken Kember, Sherry Noble (Retired December 31, 2011), Jim McArdle, Stephen Poloz, Pierre Gignac, Susanne Laperle, Benoit Daignault.
Benoit Daignault
Senior Vice-President and Global Head, Financing and Investments
Benoit Daignault was appointed Senior Vice-President, Global Head, Financing and Investments in January 2012, after serving as Senior Vice-President, Business Development since he joined EDC in 2004. He currently leads EDC’s various lending practices including Commercial Finance, Corporate and Asset-based lending, Project Finance, as well as the Equity Investment program. Previously, Mr. Daignault spent more than 10 years with General Electric Capital, where he held increasingly senior positions in both Canada and the U.S. Mr. Daignault has a Baccalaureat in Business Administration from l’École des Hautes Études Commerciales in Montreal and is a CFA charterholder. He completed the Proteus program of London Business School and the Senior Executive Program of Columbia University.
Pierre Gignac
Senior Vice-President and Chief Risk Officer, Enterprise Risk Management
Pierre Gignac was appointed Senior Vice-President, Enterprise Risk Management in January 2012, after serving as Senior Vice-President, Insurance since January 2004. He is responsible for risk management, legal services, and security services. Mr. Gignac joined EDC in April 1999 as Director, Claims and Insurance Accounting and later moved to Vice-President, Insurance and Loans Services and then Vice-President, Short-term Credit and Risk Assessment. Prior to joining EDC, Mr. Gignac held senior posts during his 14-year career at Metropolitan Life Insurance Company. Mr. Gignac is a Fellow of the Society of Actuaries, Fellow of the Canadian Institute of Actuaries, and a Chartered Financial Analyst. He is a graduate of Columbia University’s Senior Executive Program and from Laval University in Quebec City.
Ken Kember
Senior Vice-President, Finance, and Chief Financial Officer
As Senior Vice-President, Finance, and Chief Financial Officer, Ken Kember leads the finance organization, including Treasury, Financial Planning and Reporting, Corporate Accounting, Loans Services, Cash Management and Corporate Services. Mr. Kember has held various positions of increasing responsibility in the Finance Group, and served as Vice-President and Corporate Controller for six years prior to taking on his current role in 2009. Prior to joining EDC in 1995, he was a senior manager in the accounting and audit group of PricewaterhouseCoopers in Ottawa. Mr. Kember is a chartered accountant and a certified management accountant. He also serves on the board of the national capital region chapter of Financial Executives International.
|
| 40 | BUILDING RESILIENCE IN UNCERTAIN TIMES |
Susanne Laperle
Senior Vice-President, Human Resources and Communications
Susanne Laperle was appointed Senior Vice-President, Human Resources in February 2001. Ms. Laperle is responsible for EDC’s Human Resources Group, including Total Compensation, Business Partners, Recruitment, Learning and Development, Organizational Effectiveness, and Internal Communications. She has extensive experience in human resources leadership, strategy and service from a number of challenging corporate environments. Prior to joining EDC, Ms. Laperle was a Vice-President of Human Resources and Communications for several major Canadian retail companies, facilitating change across large organizations. Ms. Laperle was also a senior consultant with the John C. Williams Group in Toronto, where she specialized in human resources and communications to both service industry and public-sector clients. Ms. Laperle has an MBA from the University of Toronto.
Derek Layne
Senior Vice-President, Business Solutions and Innovation
Derek Layne was appointed as Senior Vice-President, Business Solutions and Innovation in January, 2012. In this capacity Mr. Layne is responsible for managing the technology platforms, information systems, as well as the centres of expertise for business intelligence, process and program support that enable EDC’s operations. Mr. Layne previously held various management positions within EDC’s lending practice and served as EDC’s Chief Risk Officer for the past four years prior to assuming his current role. He has over 19 years of experience in underwriting international financing. Prior to joining EDC in 1992, Mr. Layne worked for an engineering firm.
Jim McArdle
Senior Vice-President, Corporate Affairs and Secretary
Jim McArdle was appointed Senior Vice-President, Corporate Affairs and Secretary in January 2012, after serving as Senior Vice-President, Legal Services & Secretary since 2006. Mr. McArdle is responsible for Planning and External Relations, Corporate Social Responsibility, Economics, Enterprise Portfolio Management and is Secretary to the Board. Mr. McArdle joined EDC as a Legal Counsel in 1993 and became Senior Legal Counsel in 1994. He was appointed General Counsel and Senior Assistant Secretary in July 2002. Prior to joining EDC, he was a member of a national Toronto law firm for 10 years. He is a graduate of Columbia University’s Senior Executive Program.
Stephen S. Poloz
President and Chief Executive Officer
Stephen Poloz was appointed President and Chief Executive Officer in January 2011, after nearly 30 years of public and private sector experience in financial markets, forecasting and economic policy. He joined EDC in 1999 as Vice-President and Chief Economist, and in 2004 was promoted to Senior Vice-President, Corporate Affairs and Chief Economist, adding responsibility for corporate planning, communications, government and international relations, engineering, corporate social responsibility and corporate research. From 2008 to 2010 he was Senior Vice-President, Financing Products Group, with responsibility for all of EDC’s lending programs, in addition to the economics and corporate and international trade intelligence groups.
Prior to joining EDC, Mr. Poloz spent five years with Montreal-based BCA Research, and 14 years with the Bank of Canada in Ottawa. He has been a visiting scholar at the International Monetary Fund in Washington, and at the Economic Planning Agency in Tokyo. Mr. Poloz served as President of the Ottawa Economics Association and is a Certified International Trade Professional.
Rajesh Sharma
Senior Vice-President, Business Development
Rajesh Sharma was appointed Senior Vice-President, Business Development in January 2012, after serving as Senior Vice-President, Financing Products Group since 2011. Mr. Sharma leads the business strategy of the corporation through sector teams specialized in the major global supply chains. He is also responsible for the network of EDC’s offices and representations in Canada and overseas. Since joining EDC in 1995, Mr. Sharma has overseen various product lines including Project and Structured Finance, Corporate Lending and Political Risk Insurance operations. Prior to joining EDC, Mr. Sharma spent four years with Ontario Hydro. Mr. Sharma has an MBA from the University of Windsor in Canada, and an MPhil. in Economics and MA Honours in Economics, from Panjab University in India.
|
| EDC ANNUAL REPORT 2011 | 41 |

CORPORATE
GOVERNANCE
PRACTICES AT EDC
Board stewardship
The stewardship of EDC resides with its Board of Directors composed of members experienced in business, finance, investment and risk management. In 2011 the board worked with the newly appointed CEO, endorsing his vision for the Corporation. The term of the board Chair was extended by two years, enabling continuity of governance.
The board was fully engaged as EDC continued to expand its risk management programs, with an increased focus on enterprise risk management. The board participated in the annual risk identification and evaluation survey. The Risk Management Committee reported regularly on the status of transactions with challenging or unique aspects. Discussions took place on the relationship between EDC’s capital management framework and the corporation’s operational governance and risks. These discussions contributed to an expansion of EDC’s current stress-testing practices. At year end, the CEO proposed and the board approved an executive realignment, which created the new position of Senior Vice-President, Enterprise Risk Management.
Each year, the board considers and ultimately approves EDC’s corporate plan. In 2011 the board discussed several longer-term elements of the plan at its annual strategy session. The board examined the 20- to 30-year impact of globalization, geo-politics, population growth and scientific and technological changes on Canadian exporters and investors, and the impact on EDC’s role in supporting their efforts. EDC’s board and executive team
ensured the corporate plan was developed within the spirit and intent of the government’s cost-containment measures.
The Business Development Committee undertook a detailed review of EDC’s market coverage to identify gaps and determine key priorities for 2012 and beyond. The Committee reviewed refinements to EDC’s customer management model.
The Audit Committee reviewed and endorsed the annual audit plans of the Auditor General and the internal auditor. The Auditor General issued an unqualified opinion on the 2010 financial statements. For the first time, the Committee approved quarterly financial statements for public release, as directed by new legislation. The Committee reviewed reports on the Internal Audit Group’s projects and the board ensured EDC complied with government guidelines relating to governance.
Public policy objectives and legislated mandate
The mandate and powers of EDC are established by statute, including EDC’s temporary authority to offer services to Canadian companies at home through a domestic mandate. This authorization was extended to March 13, 2012. The board monitored EDC’s partnerships with banks and private surety and insurance companies to provide increased capacity in support of Canadian companies’ domestic business. The board considered EDC’s presence in foreign markets and discussed the corporation’s authority to establish additional foreign offices to support Canadian exporters.
Accountability and operations
EDC’s board functions independently of management. At each board and committee meeting, time is reserved for directors to meet in camera without management present. The Audit Committee meets in camera in three sessions: one with the federal Auditor General’s representatives, another with EDC’s internal audit vice-president, and a third with only independent directors present. The roles of EDC’s Chair and CEO are separate. All board members, other than the CEO, are independent of EDC management. To promote transparency, directors receive agendas and materials for, and are welcome to attend, committees of which they are not members.
The board has an effective working relationship with EDC’s management, and the allocation of responsibilities is reviewed regularly. The EDC by-law regulates the proceedings of the board, and also establishes the matters for which the board has reserved authority. The Board of Directors’ Charter elaborates on roles and responsibilities, primarily in terms of board stewardship, and provides additional detail on board proceedings.
EDC’s approach to governance continues to be shaped by active board engagement. The results of the board’s annual governance review are assessed by the full board. The 2010 results and related discussions provided the basis for governance activities during 2011.
|
| 42 | BUILDING RESILIENCE IN UNCERTAIN TIMES |
Corporate Social Responsibility and culture of ethical conduct
EDC’s activities in the area of corporate social responsibility are an integral part of its efforts to enhance Canada’s trade performance. The board promotes a culture of ethical business conduct, following procedures that regulate conflict of interest and insider trading, in addition to the requirements of EDC’s Code of Conduct applicable to directors. EDC directors file standing declarations of interest and refrain from discussions or voting where a real or potential conflict of interest exists. As well, board documents are screened for companies listed in directors’ standing declarations, and transaction documents are withheld from any director who has a declared interest in a party related to that transaction.
Communication with stakeholders
Effective communication between EDC and its stakeholders, including the Crown and the public, was monitored and facilitated by the board throughout 2011. The board was kept informed of ongoing outreach activities that help EDC obtain stakeholder input and feedback, including the National Stakeholder Panel and the Corporate Social Responsibility Advisory Group. Experts from various fields were invited to provide their insights as guests at formal and informal board events. The Minister of International Trade and Deputy Minister were among the guests on different occasions.
With board encouragement, EDC continued to place a high priority on coordinating and partnering with its portfolio partners, including the Trade Commissioner Service (TCS), Canadian financial institutions, Canadian Commercial Corporation (CCC) and the Business Development Bank of Canada (BDC). In 2011, EDC signed a new protocol with BDC to ensure that Canadian companies looking to expand their business in global markets have access to the services and financial capacity that best suit their needs.
In addition to periodic meetings between the board, EDC executives and government international trade personnel, the board also conducted meetings with customers in southern Alberta and Toronto in order to enhance communication between all parties.
Senior management evaluation and succession
The board’s process for assessing and evaluating the performance of the CEO was followed in 2011. The CEO’s annual performance objectives are set by the Human Resources Committee and are directly related to EDC achieving objectives set out in the Corporate Plan. The Human Resources Committee annually reviews the CEO’s performance based on these objectives, and makes recommendations to the board.
The board also oversees senior management succession. The succession plan, developed by management and approved by the Human Resources Committee, was used in filling vacancies resulting from the appointment of the President, and the
retirement of another member of the executive team. The board also completed an extensive review of the executive compensation policy in 2011.
Board education and evaluation
Directors who join the board receive orientation to EDC through briefings by senior management, and through less structured gatherings with seasoned board members. Board and committee meetings regularly include education on EDC product lines and other aspects of the corporation’s business. The education component of presentations continued in 2011, with the board using a case study approach.
Committee mandates
The Audit Committee helps the board fulfill its mandate in financial matters, as well as in business ethics, declaration of dividends, internal and external auditor terms of engagement, and monitoring the corporate compliance program. It approves and monitors important capital and administrative expenditures, reviews the implications of new accounting policies, and reviews internal and external audit results. In 2011, approval of quarterly financial statements for public release was added to the mandate of the audit committee. All Audit Committee members are independent of EDC management and committee members include financial experts. The committee, chaired by John Rooney, held five meetings.
|
| EDC ANNUAL REPORT 2011 | 43 |

CORPORATE GOVERNANCE AT EDC
The Business Development Committee provides direction that strengthens EDC’s ability to meet ongoing needs of Canadian exporters and investors. The committee monitors the development of the corporate plan, oversees management activities in analyzing market conditions and developing responses, and monitors corporate performance against business development plans and related frameworks. The committee also reviews sector strategies and new product initiatives, and annually reviews the impact on Canada’s economy of business that EDC facilitates. The committee, chaired by Norman Betts, held six meetings.
The Executive Committee has the authority to exercise many board powers, and meets only if necessary to deal with urgent matters that arise between board meetings. A meeting of the Executive Committee was not required in 2011. Jim Dinning, as Chair of the Board, chairs the committee.
The Human Resources Committee helps the board with human resources strategic planning and annually approves the management succession plan, as well as employee and executive compensation, including approving the measures and targets for the corporate incentive program. It also sets objectives and recommends the CEO’s performance assessment, and oversees the design and investment of pension plans for EDC employees. In 2011, the committee worked with management and ultimately approved the introduction of a defined contribution component for all new employees hired after December 31, 2011. The committee, chaired by Linda Hohol, held nine meetings.
The Nominating and Corporate Governance Committee deals with matters relating to EDC’s corporate governance regime. It has input into the ethics program for directors, selection criteria for appointments of the CEO and the chair, profiles of the desirable skills and experience required of directors, consideration of board candidates, and orientation and education programs. It oversees the board governance survey, monitors relations with management, and reviews the membership and mandates of committees. In 2011 several important governance matters were elevated for discussion or decision to the full board.
The committee, chaired by Jim Dinning, held one meeting.
The Risk Management Committee helps the board with oversight of the management of credit, market and other enterprise risks, including establishing and updating an effective regime governing the authorizations EDC needs to undertake its business activities, and has input into any policy changes in these areas. It also reviews and recommends transactions and policy increases requiring board approval, monitors compliance with the Environmental Review Directive, and has a role in the Capital Adequacy Policy. It receives periodic updates on various portfolio management activities and initiatives.
The committee, chaired by Adam Chowaniec, held six meetings.
Director remuneration
Compensation paid to directors is set by Order in Council. The chair and directors from the private sector receive an annual retainer for their services, plus a fixed per diem for travel time, attending
committee and board meetings and other responsibilities as they arise. The following compensation schedule has been in place since 2000:
| u | Chair of the Board: annual retainer of $12,400; $485 per diem. |
| u | Other directors: annual retainer of $6,200; $485 per diem. |
| u | Chairs of committees (other than Executive Committee) and Vice-Chair of the Board: base retainer plus $2,000. |
| u | Directors also receive reimbursement for reasonable out-of-pocket expenses, including travel, accommodations and meals, while performing their duties. |
Most members of the board serve on three committees. There were 10 board meetings in 2011, (six regular, one strategic session and three special conference calls) and 22 committee meetings. Meetings held between regularly scheduled board sessions are usually convened by teleconference. The total remuneration paid to private sector directors including the Chair (annual retainers, pro-rated for the portion of the year each director was a member of or chaired a committee, plus per diems) was $199,433, compared to $207,363 in 2010. The total for business travel, promotion and meeting expenses paid to members of the board as well as for meeting expenses for the board and committees was $191,416, compared to $189,221 in 2010 (both figures exclusive of the expenses of the CEO). The total for the CEO’s business travel and hospitality expenses expenses in 2011 was $98,113 compared to $74,771 in 2010, with the difference largely due to increased travel both throughout Canada’s regions and internationally.
|
| 44 | BUILDING RESILIENCE IN UNCERTAIN TIMES |
Membership and Attendance at Meetings of the Board and Board Committees1 in 2011
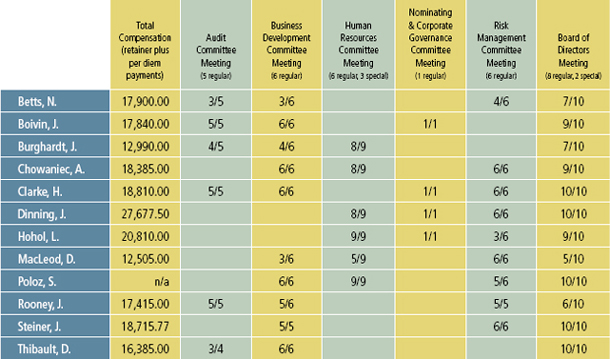
(1) Attendance is provided only for meetings of committees of which the director was a member on the meeting date.
EDC ANNUAL REPORT 2011 | 45

2011 Financial Review
| | | | | | | | |
| | MANAGEMENT’S DISCUSSION AND ANALYSIS |
| Management’s Discussion and Analysis (MD&A) should be read in conjunction with our audited consolidated financial statements and related notes for the year ended December 31, 2011. All amounts are expressed in Canadian dollars. | | 47 | | FINANCIAL RESULTS OVERVIEW |
| | | | 47 | | Summary Financial Results |
| | | | 48 | | Impact of Foreign Exchange Translation on Financial Results |
| | 48 | | FINANCIAL PERFORMANCE |
| | | | 48 | | Net Financing and Investment Income |
| | | | 50 | | Insurance Premiums and Guarantee Fees |
| | | | 51 | | Other Income (Expenses) |
| | | | 51 | | Provision for (Reversal of) Credit Losses |
| | | | 52 | | Claims-Related Expenses |
| | | | 52 | | Administrative Expenses |
| | 53 | | FINANCIAL CONDITION |
| | | | 53 | | Statement of Financial Position Summary |
| | | | 53 | | Corporate Plan Discussion |
| | | | 56 | | Portfolio Exposures and Credit Quality |
| | | | | | 56 | | Concentration of Exposure |
| | | | | | 56 | | Financing Portfolio |
| | | | | | 60 | | Insurance Portfolio |
| | | | | | 62 | | Investments and Derivative Financial Instruments |
| | | | 63 | | Capital Management |
| | | | 64 | | Off Balance Sheet Arrangements |
| | | | 64 | | Financial Instruments |
| | 65 | | RISK MANAGEMENT |
| | | | 66 | | Risk Management Framework Overview |
| | | | 66 | | Risk Governance Structure |
| | | | 67 | | Credit Risk Management |
| | | | 69 | | Market Risk Management |
| | | | 71 | | Liquidity Risk Management |
| | | | 72 | | Operational Risk Management |
| | 73 | | CRITICAL ACCOUNTING POLICIES AND ESTIMATES |
| | | | 73 | | Change in Accounting Standards |
| | | | 73 | | Non-IFRS Performance Measures |
| | 75 | | SUPPLEMENTAL INFORMATION |
| | CAUTION REGARDING FORWARD-LOOKING STATEMENTS This document contains projections and other forward-looking statements regarding future events. Such statements require us to make assumptions and are subject to inherent risks and uncertainties. These may cause actual results to differ materially from expectations expressed in the forward-looking statements. |
46 | BUILDING RESILIENCE IN UNCERTAIN TIMES
FINANCIAL RESULTS OVERVIEW
Uncertainty and volatility marked the global economy in 2011. The year started with positive momentum in the economy carried forward from 2010, but this momentum was hampered by a series of natural, political and economic events. The Tsunami in Japan, unrest in the Middle East and North Africa, the European debt crisis and the U.S. downgrade were major contributors to global instability.
In the midst of this uncertainty, Canadian exporters were able to expand their business and we saw Canadian exports rise by 11% as a result. Several factors have contributed to this growth including increased commodity prices and market diversification. Canadian companies continue to actively seek new markets in countries other than the U.S. for exporting purposes and also to engage in Canadian direct investment abroad. Not surprisingly, the level of direct financing and credit insurance that EDC facilitated in 2011 was the highest in the corporation’s history. The market diversification by Canadian exporters was a major contributor to the 26% growth in trade facilitated by EDC in emerging markets. The impact is most evident in our insurance program as the uncertainty and risk associated with these emerging markets results in higher demand for insurance products.
EDC’s ability to continue to deploy its lending and insurance solutions to Canadian businesses is dependent on the corporation’s financial sustainability. This involves earning a return sufficient to cover our expenses as well as build capital to support more business. Under normal operating conditions we expect to earn net income in the range of $600 million to $800 million annually. Fluctuations in the provision for credit losses, claims-related expenses and the fair value of financial instruments could cause net income to fall outside this range.
Despite the challenging economic environment in 2011 EDC finished the year with net income of $645 million, a return to a more normal profitability level when compared to the $1,475 million net income reported in 2010. The reduction in net income was the result of recording provisions and claims-related expenses totalling $372 million in 2011 as opposed to a $631 million provision reversal and claims-related expenses of just $1 million in 2010.
| | | | | | | | |
| (in millions of Canadian dollars) | | 2011 | | | 2010 | |
Income before provisions and claims-related expenses | | | 1,017 | | | | 845 | |
(Provisions)/reversals and claims-related expenses | | | (372 | ) | | | 630 | |
Net income | | | $645 | | | | $1,475 | |
We recorded provisions and claims-related expenses of $372 million as a result of negative credit migration in our loans portfolio, a decline in collateral values for loans in our secured aerospace portfolio and the submission of a claim in our political risk program. In comparison, we released provisions in 2010 mainly due to refinements made to our provisioning methodology, changes in the composition of our loan portfolio and improving credit conditions.
EDC is financially self-sustaining and does not receive parliamentary appropriations. The income that we generate is applied directly against Canada’s fiscal accounts and it strengthens our capital base. In the first quarter of 2011 we paid a dividend of $350 million to the Government of Canada. We ended the year with a strong capital position of $10.8 billion, which makes us more resilient, with greater capacity to help Canadian exporters and investors navigate the uncertainty and volatility in the current trade environment.
Summary Financial Results
| | | 000,000,000,000 | | | | 000,000,000,000 | |
for the year ended December 31 (in millions of Canadian dollars) | | 2011 | | | 2010 | |
Net financing and investment income | | | 956 | | | | 916 | |
Loan guarantee fees | | | 32 | | | | 33 | |
Net insurance premiums and guarantee fees | | | 234 | | | | 210 | |
Other income (expenses) | | | 79 | | | | (41 | ) |
Administrative expenses | | | 284 | | | | 273 | |
Provision for (reversal of) credit losses | | | 125 | | | | (631 | ) |
Claims-related expenses | | | 247 | | | | 1 | |
Net income | | | $645 | | | | $1,475 | |
EDC ANNUAL REPORT 2011 | 47

MANAGEMENT’S DISCUSSION AND ANALYSIS
Items of note affecting 2011 results include:
Net Financing and Investment Income – Net financing and investment income increased to $956 million in 2011 from the $916 million reported in 2010. This was largely the result of a decrease in interest expense due to the impact of currency swaps used to reduce the foreign currency risk of our capital. Refer to page 50 for further details.
Net Insurance Premiums and Guarantee Fees – Net insurance premiums and guarantee fees totalled $234 million in 2011, an increase of 11% from 2010 mainly due to increased activity within the credit insurance program.
Administrative Expenses – Administrative expenses were $284 million in 2011, an increase of $11 million, or 4% over the 2010 level of $273 million. Our new head office resulted in increases to depreciation and accommodation costs. Pension costs also increased due to a reduction in the discount rate used to value the pension obligations. Prudent management of our administrative expenses resulted in decreases in most other areas.
Provision for Credit Losses – We recorded a provision charge of $125 million in 2011 compared to a reversal of provision of $631 million in 2010. The provision charge was primarily due to negative credit migration and a decline in the value of the collateral associated with our aerospace portfolio. The reversal in 2010 was mainly the result of refinements made to our loan allowance methodology.
Claims-Related Expenses – Claims-related expenses were $247 million in 2011, a $246 million increase from 2010. Contributing to the change was an increase in the policy and claims liabilities as well as a decrease in our estimate of recoverable insurance claims. Within our political risk insurance program, a claim under consideration, and a change in the portfolio composition led to an actuarial increase in our policy and claims liabilities. During the year we paid $55 million in claims compared to $126 million in 2010.
Impact of Foreign Exchange Translation on Financial Results
By the end of 2011 the Canadian dollar had weakened relative to the U.S. dollar, resulting in a rate of U.S. $0.98 on December 31st, compared to U.S. $1.01 at the end of 2010. The weaker Canadian dollar resulted in an increase in our assets and liabilities which are primarily denominated in U.S. dollars and translated to Canadian dollars at rates prevailing at the statement of financial position date. Trade facilitated and the components of comprehensive income are translated into Canadian dollars at average exchange rates. As the weakening of the Canadian dollar did not happen until the latter part of the year, when expressed in average exchange rates the Canadian dollar was actually stronger in 2011 compared to 2010. The average rate for 2011 was U.S. $1.01 compared to U.S. $0.97 for 2010.
FINANCIAL PERFORMANCE
Net Financing and Investment Income
Loan Revenue
Loan revenue, including debt relief income, was $1,013 million in 2011, a decrease of $16 million from 2010. The total yield on our loan portfolio was 3.83% down 17 basis points.
Performing loan interest revenue was $894 million, a reduction of $6 million compared to 2010. While our average performing loan balance increased during 2011, the expected revenue impact was offset by lower yields in our fixed rate portfolio and foreign exchange.
The average interest rate on our performing floating rate loans increased to 2.56% in 2011 from 2.51% in 2010. The impact of slightly higher LIBOR rates and spreads contributed to this increase.
Components of the change in loan revenue from 2010
| | | | |
| (in millions of Canadian dollars) | | 2011 | |
Decrease in revenue from lower yield | | | (31 | ) |
Revenue from portfolio growth | | | 62 | |
Foreign exchange impact | | | (37 | ) |
Performing loan interest revenue | | | (6 | ) |
Increase in loan fees | | | 18 | |
Decrease in impaired revenue | | | (6 | ) |
Decrease in debt relief revenue | | | (21 | ) |
Decrease in other loan revenue | | | (1 | ) |
Net change in loan revenue | | | $(16 | ) |
48 | BUILDING RESILIENCE IN UNCERTAIN TIMES
| | | | |
The interest rate earned on our fixed rate portfolio declined in 2011 averaging 5.26% compared to 5.59% in 2010. The yield declined because older loans earning interest rates averaging 5.82% were repaid and replaced by current loan disbursements carrying interest rates averaging 3.51%. | | | 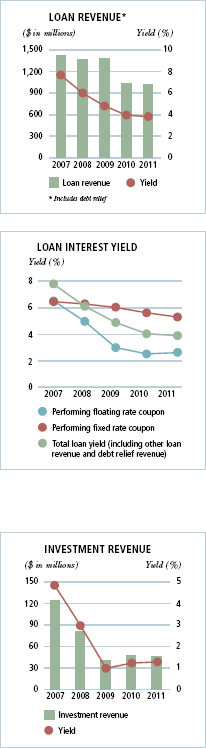 | |
Loan fee revenue increased by $18 million in 2011 due to higher commitment fees. An increase in the level of new credit authorized during the year contributed to the higher fees recorded in 2011. | |
We recognize revenue on the carrying value of our impaired loans at their original effective yield. In 2011, we recognized $9 million of impaired revenue, a decrease of $6 million from 2010. This was due to lower average carrying values of our impaired loan portfolio as compared to the previous year. | |
In 2011, we reported debt relief revenue of $4 million as a result of payments received for Ivory Coast, compared to $25 million in 2010. Payments were received from the Government of Canada to reimburse us for debt relief granted by the Government of Canada to our sovereign borrowers. For further information see Note 40, Related Party Transactions in the notes to the consolidated financial statements. | |
For a breakdown of loan interest yield on our fixed and floating portfolios, refer to Table 1 in Supplemental Information. | |
Investment Revenue | |
We maintain an investment portfolio in order to meet our liquidity requirements. Pursuant to our risk management policies, we must maintain sufficient liquidity to meet a prescribed minimum level, based on forecasted three month cash requirements. | |
Our investment revenue consists of income earned on marketable securities, bonds, and government securities held during the year. Our investment revenue decreased by $1 million to $46 million in 2011. | |
Although our total investments increased by $117 million on our statement of financial position to $3,796 million, the average balance decreased in 2011 from $3,765 million to $3,551 million. The average investment balance decreased as a result of reduced liquidity needs throughout the year. The yield on the portfolio was 1.30% versus 1.25% in 2010 as a result of higher short-term Canadian interest rates. Components of the change in investment revenue from 2010 | |
| | | | |
| (in millions of Canadian dollars) | | 2011 | |
Increase in revenue from higher yield | | | 2 | |
Foreign exchange impact | | | (2 | ) |
Impact of reduced investment portfolio | | | (1 | ) |
Net change in investment revenue | | | $(1 | ) |
EDC ANNUAL REPORT 2011 | 49
MANAGEMENT’S DISCUSSION AND ANALYSIS
| | |
Interest Expense | | |
Interest expense totalled $99 million in 2011, a decrease of $48 million from 2010 due to a lower cost of funds. | | 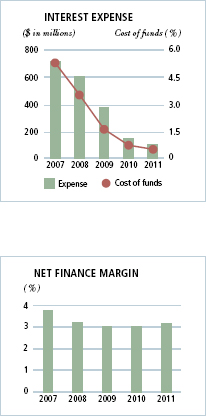 |
Our interest expense includes the cost of our debt and related derivatives and the impact of the floating rate currency swaps used to reduce the foreign currency risk related to using our capital to fund U.S. dollar denominated assets. These currency swaps are set up with the objective to offset U.S. dollar assets and liabilities. The decrease in our interest expense is mainly due to a significant increase in revenue on the currency swaps related to our capital in 2011 since the Canadian dollar interest rates applicable to the receivable component of these swaps are higher than the U.S. dollar rates on their payable component. As a result, our cost of funds decreased from 0.71% in 2010 to 0.48% in 2011. | |
Our average loans payable balance was $20,534 million in 2011, a reduction of $221 million from 2010. Net debt issuances of $454 million were more than offset by the impact of the fluctuations of the Canadian dollar against other currencies. | |
Net Finance Margin | |
The net finance margin represents net financing and investment income expressed as a percentage of average performing assets. Net financing and investment income consists of loan, leasing and investment revenue net of interest expense and leasing and financing related expenses. Our net finance margin was 3.17% in 2011 (2010 – 3.06%). The increase is mainly attributable to the reduction in interest expense discussed above. | |
For a breakdown of Net Finance Margin, refer to Table 2 in Supplemental Information. | |
Insurance Premiums and Guarantee Fees | | |
|
Premium and guarantee fee revenue earned in our insurance programs in 2011 totalled $234 million, compared to $210 million in 2010. The increase was due to higher revenue in both the credit insurance and contract insurance and bonding programs. | | 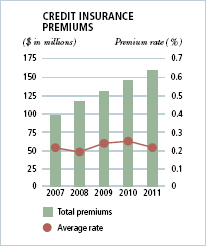
|
Insurance premiums earned under our credit insurance program totalled $168 million. We have partnered with reinsurers, primarily by way of a reinsurance treaty agreement, and in 2011 we ceded premiums of $7 million to our reinsurance partners, resulting in net premium revenue for EDC of $161 million. | |
The net premium increase of $16 million over 2010 was mainly due to additional business in this program. Credit insurance trade facilitated net of reinsurance increased by $16,484 million or 28%. This was largely driven by increased demand for documentary credit insurance products which cover foreign bank and foreign buyer counterparty risk in trade transactions. The credit insurance average premium rate decreased to 0.21% in 2011 from 0.24% in 2010, mainly due to increased business in shorter tenure, lower premium markets as well as increased activity in higher volume, lower rate accounts. | |
Premium revenue totalled $58 million for the year in our contract insurance and bonding program compared to $51 million in 2010. The average premium rate for this program was 0.60% in 2011, an increase from 0.52% in 2010 as the mix in business is gravitating towards products used by our banking partners which typically carry a higher premium rate when compared to the products used by our surety partners. The premium rates are higher on these products as they are a first demand instrument whereas with other contract insurance and bonding products such as surety, default must first be proven. | |
Political risk insurance premiums totalled $24 million in 2011, of which $9 million was ceded by way of partnering with reinsurers. The resulting net premium revenue was $15 million, an increase of $1 million over 2010. The PRI average premium rate of 0.91% in 2011 decreased from the 2010 rate of 1.04%, mainly due to changes in the portfolio mix.
50 | BUILDING RESILIENCE IN UNCERTAIN TIMES
Loan guarantee fees totalled $32 million in 2011, a decrease of $1 million over 2010. The average loan guarantee fee rate increased from 0.98% in 2010 to 1.29%. This increase reflects the expiry at the end of 2010 of a large guarantee with an investment grade obligor in the surface transportation sector. If the impact of this guarantee is removed from 2010 results, the average guarantee fee rate in 2010 would have been comparable to the 2011 rate.
For the breakdown of insurance premiums and guarantee fees, refer to Table 3 in Supplemental Information.
Other Income (Expenses)
Other income was $79 million in 2011, compared to an expense of $41 million in 2010. Key components of other income in 2011 include realized and unrealized fair value gains and losses on various financial instruments as discussed below as well as a foreign exchange translation loss.
Net realized and unrealized gains on our marketable securities portfolio totalled $71 million for 2011. During the year most long-term rates decreased, generating unrealized gains as the majority of the securities in our portfolio are long-term.
| | | | | | | | |
(in millions of Canadian dollars) | | 2011 | | | 2010 | |
Net realized and unrealized gain on marketable securities at fair value through profit or loss | | | 71 | | | | 39 | |
Net unrealized gain (loss) on loans payable designated at fair value through profit or loss | | | (147 | ) | | | 179 | |
Net unrealized gain (loss) on debt related derivatives | | | 139 | | | | (128 | ) |
Net realized and unrealized gain (loss) on loan related credit default swaps | | | 24 | | | | (9 | ) |
Foreign exchange translation gain (loss) | | | (23 | ) | | | 8 | |
Impairment loss on equipment available for lease | | | – | | | | (176 | ) |
Other | | | 15 | | | | 46 | |
Total other income (expenses) | | | $79 | | | | $(41 | ) |
We issue debt instruments in the market where we are able to obtain the most attractive funding costs and then we use derivatives to manage interest rate risk and foreign exchange risk. Unrealized losses on loans payable designated at fair value through profit or loss totalled $147 million in 2011 and the unrealized gains on the derivatives associated with the loans payable totalled $139 million. In accordance with International Financial Reporting Standards (IFRS), our debt is valued on the basis of our credit rating (AAA) while the related derivatives are valued based on curves that reflect the credit risk of the resulting exposure. During 2011, most rates relevant to the valuation of our debt and the related derivatives fell, leading to unrealized gains on our derivatives which almost offset the unrealized losses on our debt.
In 2011 we recorded a net unrealized gain of $24 million (2010 – loss of $9 million) on our portfolio of loan related credit default swaps. The majority of this gain was related to an increase in the fair value on the portion of our portfolio where we bought protection. This reflected increased market volatility that was experienced during the latter half of the year as a result of uncertainty associated with some of the underlying entities. In addition, a portion of our portfolio where we sold protection was called. This resulted in the realization of $12 million (2010 – nil) of the unrealized losses recognized since the inception of these instruments.
Also included in other income is a foreign exchange translation loss of $23 million for 2011 (2010 – gain of $8 million). These losses are due to the depreciation of the Canadian dollar against the U.S. dollar in the latter part of 2011.
Provision for (Reversal of) Credit Losses
In 2011 we recorded a provision charge of $125 million related to our loan portfolio compared to a reversal of provision for credit losses of $631 million in 2010. The provision charge was primarily due to negative credit migration across a number of industry sectors and a decline in collateral values used in the calculation of the allowance on our secured aerospace portfolio. Changes in the portfolio composition reduced the provision charge somewhat since the allowance reversed on loan repayments exceeded the allowance required as a result of disbursements and new loan commitments. In comparison, the reversal of provision in 2010 was primarily the result of refinements made to our loan allowance methodology as well as changes in the portfolio composition.
For a breakdown of the provision for credit losses, refer to Table 4 in Supplemental Information.
EDC ANNUAL REPORT 2011 | 51
MANAGEMENT’S DISCUSSION AND ANALYSIS
Claims-Related Expenses
Claims-related expenses totalled $247 million in 2011, compared to $1 million in 2010. The increase is largely the result of the actuarial change in the net allowance for claims.
There was an actuarial increase in the net allowance for claims in 2011 of $179 million, compared to a decrease of $84 million in 2010. The actuarial adjustment takes into account updates to the assumptions within the calculation as well as changes in the portfolio and risk ratings. The increase in 2011 was driven by a claim under consideration and a change in portfolio composition in our political risk insurance program.
Total claims paid were $55 million in 2011 as compared to $126 million in 2010. Claim payments decreased in 2011 as claims submitted in the credit insurance and contract insurance and bonding programs returned to the pre-crisis 2007 level.
| | | | | | | | |
| | | |
| (in millions of Canadian dollars) | | 2011 | | | 2010 | |
Claims paid | | | 54 | | | | 113 | |
Claims paid – reinsured policies | | | 1 | | | | 13 | |
Claims recovered | | | (40 | ) | | | (36 | ) |
Actuarial increase/(decrease) in the net allowance for claims | | | 179 | | | | (84 | ) |
Reinsurers’ share of claims paid | | | – | | | | (3 | ) |
Reinsurers’ share of claims recovered | | | 1 | | | | – | |
Decrease/(increase) in recoverable insurance claims | | | 50 | | | | (4 | ) |
Claims handling expenses | | | 2 | | | | 2 | |
Total claims-related expenses | | | $247 | | | | $1 | |
Administrative Expenses
| | |
Administrative expenses for 2011 totalled $284 million, an increase of $11 million, or 4% from the prior year. The growth was limited to increases in depreciation and accommodation costs associated with our new head office. In addition, pension costs increased in 2011 as a result of a reduction in the discount rate used to value the pension obligation. We are seeing the impacts of our continued focus on cost containment as we experienced reductions in most other administrative expenses. The Productivity Ratio (PR), previously referred to as the Efficiency Ratio, measures our operational efficiency as investments in people and technology are required to keep pace with the growth and complexity of the business. The PR decreased to 22.8% in 2011, significantly more favourable than the 25.0% in 2010. The change in PR in 2011 was the result of administrative expenses increasing at a significantly slower rate than the rate of increase of adjusted net revenue. Adjusted net revenue increased by 14% whereas administrative expenses increased by only 4%. | | 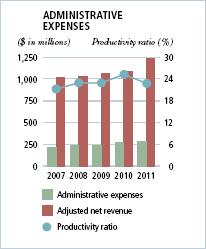 |
52 | BUILDING RESILIENCE IN UNCERTAIN TIMES
FINANCIAL CONDITION
Statement of Financial Position Summary
| | | | | | | | |
as at December 31 (in millions of Canadian dollars) | | 2011 | | | 2010 | |
Cash and investments | | | 3,886 | | | | 3,803 | |
Derivative instruments | | | 1,541 | | | | 2,010 | |
Loans receivable | | | 28,680 | | | | 26,611 | |
Allowance for losses on loans | | | (1,680 | ) | | | (1,561 | ) |
Other financing and leasing assets | | | 708 | | | | 559 | |
Other | | | 461 | | | | 460 | |
Total Assets | | | $33,596 | | | | $31,882 | |
| | | |
Loans payable | | | 23,570 | | | | 22,484 | |
Derivative instruments | | | 178 | | | | 200 | |
Allowance for loan commitments | | | 41 | | | | 93 | |
Policy and claims liabilities | | | 875 | | | | 640 | |
Other liabilities | | | 676 | | | | 504 | |
Equity | | | 8,256 | | | | 7,961 | |
Total Liabilities and Equity | | | $33,596 | | | | $31,882 | |
Total assets were $33.6 billion at the end of 2011, an increase of $1.7 billion, or 5% from 2010, which is mainly due to the depreciation of the Canadian dollar against the U.S. dollar in 2011 and an increase in our loans receivable.
Cash and Investments – We maintain an investment portfolio in order to meet our liquidity requirements. Cash and investments were $3.9 billion at the end of 2011. The amount of cash and investments remained stable from 2010 as our liquidity requirements did not change materially in 2011.
Loans Receivable – Loans receivable were $28.7 billion, an increase of $2.1 billion or 8% from 2010 mainly due to net loan disbursements of $1.7 billion and the depreciation of the Canadian dollar against the U.S. dollar at the end of the year.
Loans Payable – Loans payable were $23.6 billion compared to $22.5 billion in 2010, an increase of $1.1 billion. The increase in loans payable is mainly due to the depreciation of the Canadian dollar against the U.S. dollar in 2011, and net debt issuances which were used to fund loan disbursements in excess of operating cash flows.
Corporate Plan Discussion
The following section discusses our 2011 results and financial position in comparison to Corporate Plan projections. We begin by looking back to our 2011 Corporate Plan and compare actual results to what was expected. Then we look forward to 2012 and provide an explanation of where we anticipate changes from our 2011 results and financial position.
Financial Performance
| | | | | | | | | | | | |
for the year ended December 31 (in millions of Canadian dollars) | | 2012
Corporate Plan | | | 2011
Actual Results | | | 2011
Corporate Plan | |
Net financing and investment income | | | 931 | | | | 956 | | | | 941 | |
Insurance premiums and guarantee fees* | | | 271 | | | | 266 | | | | 248 | |
Other income (expenses) | | | (11 | ) | | | 79 | | | | (12 | ) |
Administrative expenses | | | 303 | | | | 284 | | | | 300 | |
Provision for (reversal of) credit losses | | | (125 | ) | | | 125 | | | | 130 | |
Claims-related expenses | | | 96 | | | | 247 | | | | 136 | |
Net income | | | 917 | | | | 645 | | | | 611 | |
Other comprehensive income | | | – | | | | – | | | | – | |
Comprehensive income | | | $917 | | | | $645 | | | | $611 | |
* Includes loan guarantee fees
EDC ANNUAL REPORT 2011 | 53
MANAGEMENT’S DISCUSSION AND ANALYSIS
2011 Corporate Plan
Net income for 2011 was $645 million, in line with the 2011 Corporate Plan net income of $611 million. Items of note are as follows:
Claims-related expenses were $247 million in 2011, $111 million greater than the 2011 Corporate Plan mainly due to higher claims activity within our political risk insurance program.
Other income (expenses) was $79 million, $91 million higher than the 2011 Corporate Plan mainly as a result of gains arising from changes in market conditions which were not contemplated in the Plan. Realized and unrealized gains on marketable securities contributed $71 million to this difference.
Administrative expenses were $284 million in 2011, $16 million less than the Corporate Plan. The difference is largely due to lower accommodation and human resources costs than projected in the Plan. In addition we experienced reductions in most other areas of administrative expenses as a result of our cost containment efforts. The accommodation costs as we transitioned between two head office buildings during the year were lower than projected at the time of preparing the Corporate Plan and the human resources costs were not as high as planned for 2011 as a result of focused efforts to contain headcount.
The productivity ratio (previously efficiency ratio) for 2011 was 22.8% versus the 2011 Corporate Plan of 26.1%. The main contributors to this favourable position were:
| | } | | lower than anticipated administrative expenses |
| | } | | lower expenses than anticipated on the leased aircraft portfolio |
| | } | | higher loan fee revenue |
| | } | | higher realized gains on marketable securities (as these are not projected in the Plan) |
2012 Corporate Plan
Net income for 2012 is planned to be $917 million, $272 million greater than 2011 net income of $645 million. The increase is mainly the result of expected reductions in both provisioning requirements and claims-related expenses in 2012.
The 2012 Corporate Plan is projecting a $125 million reversal of provision for credit losses, which is $250 million lower than the actual 2011 provision expense of $125 million. This difference can be explained as follows:
| | } | | Implementation of a new internal credit risk rating tool in 2012 which will standardize default rates for each risk category and assign ratings to obligors through the new tool. At the time the 2012 Corporate Plan was prepared, a provision release of approximately $100 million was anticipated upon the adoption of the revised probability of default rates resulting from the new tool. Potential other impacts are anticipated as new models are used to assess credit risk at more granular levels, both by business sector and by individual transactions, which could impact the overall change in provisions. However an assessment of the impact on provision expense of these other changes as a result of the new tool could not be quantified at the time the Plan was prepared and as such, were not included in the Corporate Plan. |
| | } | | In 2011, the impact of credit migration led to an increase in provision expense of $186 million whereas the level of credit migration anticipated in the 2012 Plan is expected to result in a provision increase of only $60 million. |
Claims-related expenses are projected to be $96 million in 2012, $151 million less than 2011. This is primarily due to the impact on 2011 results of a large claim under consideration within our political risk insurance program.
The planned administrative expenses for 2012 are $303 million, $19 million greater than 2011. Costs are expected to be higher in 2012 due to increased depreciation and accommodation costs associated with our new head office. As well, pension costs are expected to increase in 2012 as a result of anticipated changes in actuarial assumptions associated with the pension liability.
The 2012 Corporate Plan productivity ratio (PR) is 25.5%, less favourable than the 22.8% reported for 2011, primarily due to higher anticipated administrative expenses in 2012.
54 | BUILDING RESILIENCE IN UNCERTAIN TIMES
Financial Position
| | | | | | | | | | | | |
as at December 31 (in millions of Canadian dollars) | | 2012
Corporate Plan | | | 2011
Actual Results | | | 2011
Corporate Plan | |
Cash and investments | | | 3,216 | | | | 3,886 | | | | 3,369 | |
Derivative instruments | | | 2,082 | | | | 1,541 | | | | 1,888 | |
Loans receivable | | | 27,170 | | | | 28,680 | | | | 29,687 | |
Allowance for losses on loans | | | (1,253 | ) | | | (1,680 | ) | | | (1,555 | ) |
Other financing and leasing assets | | | 796 | | | | 708 | | | | 616 | |
Other | | | 616 | | | | 461 | | | | 545 | |
Total Assets | | | $32,627 | | | | $33,596 | | | | $34,550 | |
| | | | |
Loans payable | | | 22,306 | | | | 23,570 | | | | 24,625 | |
Derivative instruments | | | 130 | | | | 178 | | | | 242 | |
Allowance for losses on loan commitments | | | 100 | | | | 41 | | | | 83 | |
Policy and claims liabilities* | | | 787 | | | | 875 | | | | 728 | |
Other liabilities | | | 557 | | | | 676 | | | | 517 | |
Equity | | | 8,747 | | | | 8,256 | | | | 8,355 | |
Total Liabilities and Equity | | | $32,627 | | | | $33,596 | | | | $34,550 | |
| * | Previously referred to as allowance for claims on insurance. Amount also includes deferred insurance premiums which was included in other liabilities in this table in prior years. |
2011 Corporate Plan
Loans receivable totalled $28.7 billion at the end of 2011, $1 billion less than Plan primarily as a result of a lower loans receivable balance at the beginning of 2011 based on 2010 actual results. Loans payable for 2011 are $1 billion lower than projected in the Plan as our funding requirements generally move in tandem with the loans receivable balance which has also decreased.
2012 Corporate Plan
The Corporate Plan is projecting loans receivable to be $27.2 billion at the end of 2012, which is $1.5 billion lower than December 31, 2011. The 2012 Plan loans receivable balance was projected using a forecast 2011 loans receivable position as a starting point. However, actual results for 2011 were higher than this forecast position, mainly as a result of two items:
| | } | | the Canadian dollar ended 2011 weaker than anticipated; |
| | } | | actual net disbursements in the year were higher than expected. |
At the time of preparing the 2012 Corporate Plan, loans receivable was projected to grow by $0.7 billion mainly as a result of new business.
EDC ANNUAL REPORT 2011 | 55
MANAGEMENT’S DISCUSSION AND ANALYSIS
Portfolio Exposures and Credit Quality
CONCENTRATION OF EXPOSURE
EDC’s total exposure to risk at the end of 2011 was $76.6 billion, an increase of $5,653 million from 2010. Increased exposure in financing assets and credit insurance were the main drivers of the change. The majority of the exposure was for risks within the United States (27%) and Canada (26%). When looking at risk by industry sector, our greatest exposures are within the transportation and extractive sectors.
Exposure by Program
| | | | | | | | |
as at December 31 (in millions of Canadian dollars) | | 2011 | | | 2010 | | 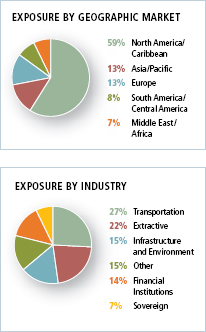 |
Financing portfolio: | | | | | | | |
Financing assets(1) | | | 29,593 | | | 27,443 | |
Commitments and guarantees(2) | | | 15,356 | | | 14,515 | |
Total financing portfolio | | | 44,949 | | | 41,958 | |
Insurance portfolio: | | | | | | | |
Credit insurance | | | 14,773 | | | 11,566 | |
Contract insurance and bonding(3) | | | 9,651 | | | 9,884 | |
Political risk insurance | | | 1,795 | | | 1,721 | |
Total insurance portfolio | | | 26,219 | | | 23,171 | |
Investments and derivative instruments | | | 5,427 | | | 5,813 | |
Total Exposure | | $ | 76,595 | | | $70,942 | |
(1)Includes gross loans receivable, equity financing and gross investment in aircraft under finance leases. (2)Includes $283 million of equity financing commitments (2010 – $314 million). (3)Includes $6,986 million of insurance guarantees (2010 – $6,943 million). | |
Within our financing and insurance portfolios, we have $1.2 billion (1.6%) of exposure to corporations located in Spain, Greece, Italy, Portugal and Ireland. At year end, we had no exposure to these countries within our investments portfolio. We have adopted a cautious, conservative approach to credit approvals within these countries and have established adequate provisions for any losses that may have occurred. In addition, during the latter part of 2011 we increased our liquidity position in the event that credit markets tighten. | |
For a detailed breakdown of the major concentrations of total gross exposure by geographical market and industry, refer to Tables 5 and 6 in Supplemental Information.
FINANCING PORTFOLIO
LOANS PORTFOLIO
We provide financing solutions to Canadian exporters and their foreign customers, to Canadian investors and to financial institutions in support of Canadian exports and foreign investments. Not only do we provide solutions for exporters with existing contracts, we also proactively identify potential procurement needs on large foreign projects and provide financing to foreign buyers in order to develop opportunities for procurement from Canadian companies. These financing products enable Canadian companies to provide their customers with flexible, medium- or long-term financing.
Gross Loans Receivable
| | |
Gross loans receivable totalled $29,093 million at the end of 2011, an increase of $2,096 million or 8% from 2010. The growth in gross loans receivable was mainly due to net loan disbursements as well as foreign exchange translation. Net loan disbursements were $1,658 million for the year, an increase of 6% from the $1,562 million of net disbursements in 2010, due to an increase in new credit authorizations. The weaker Canadian dollar at the end of 2011 also increased gross loans receivable by $511 million as most of our loans are denominated in U.S. dollars. | | 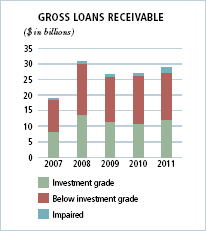 |
In assessing the credit risk profile of our loan portfolio, we rate our obligors using a system of 16 credit ratings (AA to Impaired) as established in our credit risk rating methodology. These ratings are reviewed on a regular basis. Based on their ratings, we then categorize our loans receivable into three risk classifications: investment grade performing, below investment grade performing and impaired. | |
56 | BUILDING RESILIENCE IN UNCERTAIN TIMES
Individually Impaired Loans
Impaired loans represent loans for which we no longer have reasonable assurance that the full amount of principal and interest will be collected on a timely basis in accordance with the terms of the loan agreement. At the end of 2011, impaired gross loans receivable totalled $1,805 million, an increase of $1,095 million from the end of 2010.
Our loan portfolio experienced significant negative credit migration in 2011. Loans totalling $1,383 million were classified as impaired. During 2011 loans totalling $191 million were reclassified to performing status, primarily consisting of loans to one aerospace obligor ($129 million) and loans to sovereign obligors ($40 million). An additional $43 million in impaired loans were removed from our books as a result of repayments by borrowers and principal recoveries from loan sales and repossessed assets. There were also a number of situations where all recovery methods had been exhausted and no further prospect of recovery was likely which led us to write-off impaired loans totalling $74 million.
Impaired loans as a percentage of total gross loans receivable increased from 2.6% in 2010 to 6.2% in 2011 as a result of the factors outlined above.
During the latter part of 2011 we classified two of our aerospace obligors, American Airlines, Inc. (American Airlines) and Pinnacle Airlines, Inc. (Pinnacle Airlines), as impaired. While these impairments are significant, we do not expect that these are indicative of a trend within the industry. Over the past ten years several major U.S. airlines have filed for Chapter 11 bankruptcy protection and have been able to use the process to significantly reduce operating costs, and emerge as more cost competitive airlines.
American Airlines had avoided a Chapter 11 filing, but as a result it became increasingly less competitive compared to the other major airlines. In November 2011 American Airlines filed for bankruptcy protection. American Airlines is expected to use the Chapter 11 process to eliminate a substantial number of less efficient aircraft from its fleet and to reduce its costs with respect to many other aircraft it elects to retain. As of January 2012, American Airlines is current in all obligations to EDC; however, it retains the right to reject aircraft financed by EDC during the remaining term of the Chapter 11 process.
Pinnacle Airlines, a large U.S. based regional airline, is also experiencing financial difficulties, and in early January announced that it needed to negotiate increased payments from its major airline customers as well as lower operating costs from its stakeholders or it could be forced to file Chapter 11. Pinnacle Airlines was classified as impaired as of December 31, 2011. EDC has agreed to allow the airline to defer certain payments due from January 14, 2012 to March 31, 2012, with all such payments to be paid on April 2, 2012.
The loans receivable related to these two obligors are collateralized by aircraft with an estimated fair value covering 72% of the outstanding loan balances.
Table 7 in Supplemental Information provides additional information on impaired loans including country and industry concentration.
Commercial Loans and Loan Guarantees
| | | | | | | | | | | | | | | | | | | | | | | | | | | | |
(in millions of Canadian dollars) | | Gross loans
receivable | | | Commitments | | | Loan
guarantees | | | 2011 Exposure | | | 2010 Exposure | |
| Industry | | | | | | | | | | | $ | | | % | | | $ | | | % | |
Extractive | | | 6,570 | | | | 6,170 | | | | 260 | | | | 13,000 | | | | 30 | | | | 10,651 | | | | 27 | |
Aerospace | | | 10,060 | | | | 1,644 | | | | 76 | | | | 11,780 | | | | 28 | | | | 10,986 | | | | 28 | |
Surface transportation | | | 3,748 | | | | 900 | | | | 1,167 | | | | 5,815 | | | | 14 | | | | 6,155 | | | | 16 | |
Infrastructure and environment | | | 2,745 | | | | 1,307 | | | | 289 | | | | 4,341 | | | | 10 | | | | 4,094 | | | | 10 | |
Information and communication technology | | | 2,648 | | | | 847 | | | | 164 | | | | 3,659 | | | | 9 | | | | 4,258 | | | | 11 | |
Light manufacturing | | | 661 | | | | 401 | | | | 400 | | | | 1,462 | | | | 3 | | | | 919 | | | | 2 | |
Financial institutions | | | 876 | | | | 353 | | | | 59 | | | | 1,288 | | | | 3 | | | | 1,183 | | | | 3 | |
Resources | | | 446 | | | | 391 | | | | 168 | | | | 1,005 | | | | 3 | | | | 955 | | | | 3 | |
Other | | | – | | | | 13 | | | | – | | | | 13 | | | | – | | | | – | | | | – | |
Total | | | $27,754 | | | | $12,026 | | | | $2,583 | | | $ | 42,363 | | | | 100 | | | $ | 39,201 | | | | 100 | |
Growth in the extractive sector was the primary driver behind the increase in our commercial portfolio. The sector grew by $2,349 million due to new credit authorizations. During 2011, we entered into financing transactions totalling $1,286 million with four counterparties in the oil and gas sector located in Australia, Brazil, Qatar and the United States. In addition we entered into one financing transaction totalling $247 million with a counterparty in the mining sector in Chile. All of these counterparties are investment grade.
Exposure to the information and communication technology sector continued to decline in 2011, mainly as a result of net loan repayments which included large prepayments totalling $354 million from two counterparties.
The aerospace, extractive and surface transportation sectors accounted for 72% of our total commercial exposure in 2011 (2010 – 71%). This reflects the continuous demand for financing in these sectors in support of Canadian companies. These three sectors also contain our largest single counterparty exposures.
EDC ANNUAL REPORT 2011 | 57
MANAGEMENT’S DISCUSSION AND ANALYSIS
Our largest commercial exposures in 2011 resided with three U.S. counterparties, one Mexican counterparty and one Brazilian counterparty within three industry sectors, which collectively represented $6,176 million, or 15% of the total commercial exposure. This includes exposure to two counterparties in the aerospace sector which totalled $3,211 million and two counterparties in the extractive sector which totalled $2,053 million. In the surface transportation sector, there is one passenger rail company with exposure totalling $912 million.
The ratio of non-investment grade exposure to total commercial exposure decreased from 52% in 2010 to 50% in 2011. Increased exposure to investment grade counterparties in the extractive sector contributed to this decline. Non-investment grade aerospace obligors comprise 48% of our non-investment grade exposure.
Sovereign Loans and Loan Guarantees
| | | | | | | | | | | | | | | | | | | | | | | | | | | | | | |
(in millions of Canadian dollars) | | Gross loans
receivable | | | Commitments | | | Loan
guarantees | | | 2011 Exposure | | | | | 2010 Exposure | |
Country | | | | | | | | | | | | | | | $ | | | | % | | | Country | | | $ | | | | % | |
Ukraine | | | 194 | | | | 104 | | | | – | | | | 298 | | | | 17 | | | Ukraine | | | 337 | | | | 17 | |
Serbia | | | 172 | | | | 103 | | | | – | | | | 275 | | | | 15 | | | Serbia | | | 280 | | | | 14 | |
Saudi Arabia | | | 163 | | | | – | | | | – | | | | 163 | | | | 9 | | | Saudi Arabia | | | 183 | | | | 9 | |
Ivory Coast | | | 131 | | | | – | | | | – | | | | 131 | | | | 7 | | | Ivory Coast | | | 130 | | | | 7 | |
Indonesia | | | 110 | | | | – | | | | – | | | | 110 | | | | 6 | | | Indonesia | | | 122 | | | | 6 | |
China | | | 71 | | | | – | | | | – | | | | 71 | | | | 4 | | | China | | | 87 | | | | 4 | |
Egypt | | | 63 | | | | – | | | | – | | | | 63 | | | | 4 | | | Egypt | | | 72 | | | | 4 | |
Other | | | 435 | | | | 100 | | | | 157 | | | | 692 | | | | 38 | | | Other | | | 786 | | | | 39 | |
Total | | | $1,339 | | | | $307 | | | | $157 | | | | $1,803 | | | | 100 | | | Total | | | $1,997 | | | | 100 | |
The sovereign loans and guarantees portfolio decreased by $194 million or 10% from 2010, primarily due to net repayments within the portfolio.
In 2011 non-investment grade exposure accounted for 72% of the total sovereign portfolio consistent with the 73% experienced in 2010.
Allowance for Losses on Loans, Loan Commitments and Guarantees
| | |
The total allowance for losses on loans, loan commitments and guarantees was $1,927 million at the end of 2011, an increase of $88 million from the 2010 allowance of $1,839 million. The key components resulting in the increase in the allowance in 2011 were as follows: } negative credit migration – increase $186 million; } updates to collateral values – increase $190 million; } changes in the portfolio composition – reduction $164 million; } updates made to the probability of default rates – reduction $84 million. We experienced negative credit migration across most commercial industries in our portfolio. The most pronounced credit deterioration was within the telecom, aerospace, and surface transportation sectors. The impact was partially offset by improved credit quality in our sovereign portfolio. There was also a decline in the collateral values used in the calculation of the allowance on our secured aerospace portfolio, which resulted in an increase to the allowance. | | 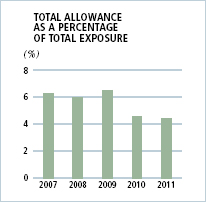 |
Changes in the composition of our financing portfolio impacted the allowance since the decrease in the allowance as a result of loan repayments exceeded the additional allowance required due to disbursements and new loan commitments. This trend began in 2010 and continued throughout 2011, largely due to activity within our secured aerospace portfolio. When calculating the allowance, we reduce the exposure on secured loans by the value of the collateral held then determine an allowance on the remaining exposure. Disbursements on new aircraft generally do not attract an allowance due to collateral values that are higher than loan values. Partial repayments on loans secured by aircraft decrease our exposure without impacting collateral values and consequently decrease the allowance required.
The total allowance as a percentage of exposure at the end of 2011 decreased slightly from 4.5% to 4.4%.
Components of the Allowance
| | | | | | | | |
(in millions of Canadian dollars) | | 2011 | | | 2010 | |
Base allowance | | | 1,314 | | | | 1,410 | |
Counterparty concentration | | | 104 | | | | 150 | |
Total collective allowance | | | 1,418 | | | | 1,560 | |
Allowance for individually impaired loans, loan commitments and guarantees | | | 509 | | | | 279 | |
Total allowance for losses on loans, loan commitments and guarantees | | | $1,927 | | | | $1,839 | |
58 | BUILDING RESILIENCE IN UNCERTAIN TIMES
For a breakdown of the collective allowance for losses on loans, loan commitments and guarantees by industry of risk, refer to Table 8 in Supplemental Information.
Base Allowance
We classify our performing exposure into categories based on obligor credit rating, industry of risk for commercial obligors and whether the exposure is secured. For secured portfolios, the exposure for each obligor is reduced by the fair value of collateral adjusted for estimated repossession costs. Based on these exposure categories we determine the appropriate base allowance. Loss severity is determined based on historical loan loss rates and by management estimates for each of our exposure categories and default rates are based on a weighted average of Moody’s and Standard & Poor’s default tables.
The base allowance decreased by $96 million in 2011 to $1,314 million primarily as a result of changes in the portfolio composition and the removal of the base allowance for obligors classified as impaired. During the year the independent variables used in the base allowance calculation, including collateral values for secured aerospace loans, were reviewed and updated where appropriate, to reflect current data. These updates resulted in a net increase to the base allowance which reduced the impact of the portfolio changes and impairment on the base allowance.
Allowance Overlays
In addition to the base allowance, we add overlays as required to the collective allowance. A concentration overlay is added to reflect the additional risk that we assume when our exposure to a specific counterparty is over a certain threshold. Market overlays are also established to take into consideration that current financial uncertainties are not always reflected in current credit ratings. The overlays are more fully explained in the following sections.
Counterparty Concentration Overlay
A concentration component is added to adequately provision for sovereign and commercial counterparties whose level of exposure is deemed by management to represent an increased amount of risk. A counterparty whose exposure exceeds 10% of our equity based on the previous year’s audited financial statements will attract a concentration component calculated on the portion of exposure over the threshold. The allowance on this portion of exposure is calculated on the same basis as the base allowance for that counterparty.
We had a concentration overlay of $104 million at the end of 2011 compared to $150 million a year earlier. The decrease is mainly due to a higher threshold in 2011 as a result of the increase in retained earnings in 2010. Obligors within the aerospace sector comprise 98% of the concentration overlay (2010 – 96% aerospace).
Market Overlays
Market overlays are added to our allowance as required to reflect the risk that the impact of recent economic events is not fully captured in current credit ratings. At the end of 2011, we determined that the current credit ratings appropriately captured the risk in the economy, and thus no market overlays were required.
Individual Allowances
We establish allowances for individually impaired loans, loan commitments and loan guarantees to recognize impairment losses. Individual allowances increased from $279 million in 2010 to $509 million in 2011. This was primarily due to the new loan impairments in the aerospace sector.
EQUITY FINANCING
EDC plays a valuable role in helping Canadian companies access capital and financing. We maintain a portfolio of equity investments focused on promising Canadian late-stage start-ups or established small and mid-sized entities to aid these companies in growing and expanding beyond the Canadian border. In addition, we invest offshore with an emphasis on emerging markets where such investment can serve to facilitate the connection of Canadian business activity into international markets. Our investments are made both directly into Canadian businesses and into funds which in turn invest in Canadian or international businesses. With the goal of growing Canadian exporters and facilitating foreign business connections, investments are normally held for periods greater than five years. Divestitures are generally made through the sale of our investment interests to third parties or through listing on public markets.
Consistent with our business goal of growing equity investments, our exposure increased by $37 million from 2010 largely as a result of new investments. During the year, we signed an additional $62 million of equity financing arrangements (2010 – $103 million).
Refer to Table 9 in Supplemental Information for a breakdown of exposure for our equity investments.
AIRCRAFT UNDER FINANCE LEASES
We have thirteen aircraft on long-term lease with one obligor in the aerospace industry in the United States. These aircraft were returned to us as a result of loan defaults by this obligor. Under the terms of a restructuring agreement, these aircraft were subsequently leased back to this obligor and classified as finance leases. Our gross investment in these finance leases is $115 million (2010 – $129 million). This exposure is non-investment grade.
EDC ANNUAL REPORT 2011 | 59
MANAGEMENT’S DISCUSSION AND ANALYSIS
INSURANCE PORTFOLIO
Credit insurance supports export growth and mitigates risks by providing companies with the confidence to do business abroad knowing that their receivables will be paid should their buyer default on payment. It also enhances their cash flow as banks are generally comfortable providing additional support when their customer’s foreign receivables are insured.
EDC’s bonding products are delivered through partnerships with banks and surety companies. Our performance security and surety bond products are used by exporters primarily to guarantee their contract performance, which helps free up working capital. Our partnerships with banks and surety companies help them mitigate their risks and make it easier for exporters to obtain the coverage they need. We provide contract frustration insurance coverage to protect against commercial and political risks resulting from buyer non-payment associated with a specific contract.
As companies diversify their supply and distribution networks and expand into new markets, they are often exposed to political risks that can result in significant losses. This is particularly true of emerging markets, where political events could adversely impact a company’s foreign operations. EDC’s political risk insurance provides peace of mind to companies and their financial intermediaries that, when faced with such risks, their assets will be protected, enabling them to take advantage of export and investment opportunities in emerging markets.
The assistance that EDC provides to our policyholders within our three primary insurance programs is counted in various ways. Under the credit insurance program, the policyholder declares their sales volume to entities covered by their policy. These declarations are counted as trade facilitated for this program. Within our contract insurance and bonding program, a facility is established and the policyholder makes requests for cover to initiate specific coverage. These requests represent trade facilitated by EDC. As transactions are signed within our political risk insurance program, they are also counted as trade facilitated.
In addition to directly underwriting insurance policies we also assume exposure from other insurers to fulfill our mandate to support Canadian exporters. We also cede reinsurance to other insurance companies to mitigate our risk. The ceding arrangements provide greater diversification of the business and minimize the net loss potential arising from large exposures.
Contingent Liabilities Under the Insurance Program
Our liability associated with outstanding insurance policies and guarantees at year end are referred to as contingent liabilities in the notes to our financial statements and are also referred to as exposure under the insurance programs throughout the management’s discussion and analysis section of this annual report.
Contingent liabilities under insurance policies and guarantees totalled $26,219 million at the end of 2011, an increase of 13% from 2010. Higher activity within our documentary credit insurance program was the main driver of the increase.
Credit Insurance Program
Contingent liabilities under the credit insurance program totalled $14,773 million at the end of 2011, an increase of $3,207 million from 2010. Exposure in the financial institutions sector increased by $2,735 million largely as a result of increased demand from policyholders to cover risks in China within our documentary credit insurance program. Exposure in the extractive sector was $2,130 million, an increase of $284 million from 2010 as a result of additional assistance in this sector as well as stronger commodity prices. Within the resource sector, exposure increased by $281 million from 2010 due to higher activity in the agri-food market.
Within the credit insurance program, the proportion of investment grade exposure remained consistent with 2010 at 87%.
| | | | | | | | | | | | | | | | |
(in millions of Canadian dollars) | | | | | 2011 Exposure | | | | | | 2010 Exposure | |
| Industry | | $ | | | % | | | $ | | | % | |
Financial institutions | | | 7,283 | | | | 49 | | | | 4,548 | | | | 39 | |
Extractive | | | 2,130 | | | | 15 | | | | 1,846 | | | | 16 | |
Resources | | | 1,693 | | | | 12 | | | | 1,412 | | | | 12 | |
Information and communication technology | | | 1,235 | | | | 8 | | | | 1,253 | | | | 11 | |
Transportation | | | 1,090 | | | | 7 | | | | 991 | | | | 9 | |
Light manufacturing | | | 981 | | | | 7 | | | | 963 | | | | 8 | |
Infrastructure and environment | | | 361 | | | | 2 | | | | 553 | | | | 5 | |
Total | | $ | 14,773 | | | | 100 | | | $ | 11,566 | | | | 100 | |
60 | BUILDING RESILIENCE IN UNCERTAIN TIMES
| | |
Contract Insurance and Bonding Contract insurance and bonding contingent liabilities totalled $9,651 million at the end of 2011 (2010 – $9,884 million). The decrease from 2010 was mainly due to a few of our larger policyholders requiring less coverage in 2011. Within our contract insurance and bonding program 94% of our exposure is located in the United States and Canada (2010 – 95%). | | 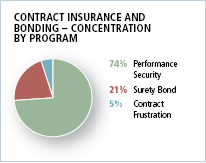
|
Political Risk Insurance At the end of 2011 the contingent liability for political risk insurance totalled $1,795 million. Our exposure in the Asia/Pacific market grew to 27% from only 7% in 2010. The issuance of a large policy in China is the primary factor for this growth. Under the terms and conditions of some of our political risk policies, EDC could be exposed to a potential liability of up to $300 million in Syria in the future. | | 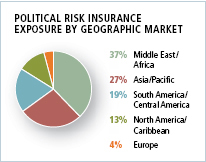
|
Claims
| | | | | | |
(in millions of Canadian dollars) | | 2011 | | 2010 | | 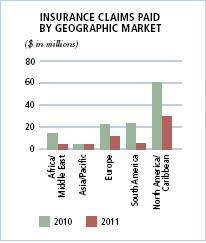 |
Claims paid | | 55 | | 126 | |
Claims recovered | | (40) | | (36) | |
Net claims | | $15 | | $90 | |
Claim payments totalled $55 million in 2011 and were comprised of 1,062 claims related to losses in 63 countries (2010 – 1,552 claims in 77 countries). Claim payments decreased in 2011 as claims submitted in the credit insurance and contract insurance and bonding programs returned to the pre-crisis 2007 level. In 2011 we recovered $43 million (2010 – $38 million) of which $3 million was disbursed to exporters (2010 – $2 million). | |
| | | | | |
| | | | | |
| | | | | |
| | | | | |
Claims Paid by Exporters’ Insured Sector
| | | | | | | | | | | | | | | | | | |
(in millions of Canadian dollars) | | | | | 2011 | | | | | | 2010 | | | 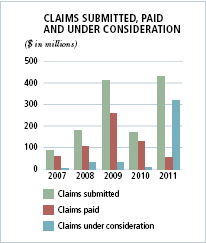 |
| | | $ | | | % | | | $ | | | % | | |
Resources | | | 15 | | | | 27 | | | | 14 | | | | 11 | | |
Infrastructure and environment | | | 14 | | | | 26 | | | | 37 | | | | 30 | | |
Light manufacturing | | | 10 | | | | 18 | | | | 10 | | | | 8 | | |
Information and communication technology | | | 9 | | | | 16 | | | | 25 | | | | 20 | | |
Extractive | | | 3 | | | | 6 | | | | 22 | | | | 17 | | |
Transportation | | | 3 | | | | 6 | | | | 4 | | | | 3 | | |
Financial institutions | | | 1 | | | | 1 | | | | 14 | | | | 11 | | |
Claims paid | | | $55 | | | | 100 | | | | $126 | | | | 100 | | |
| | | | | | | | | | | | | | | | | |
| | | | | | | | | | | | | | | | | |
| | | | | | | | | | | | | | | | | |
| | | | | | | | | | | | | | | | | |
| | | | | | | | | | | | | | | | | |
| | | | | | | | | | | | | | | | | |
| | | | | | | | | | | | | | | | | |
| | | | | | | | | | | | | | | | | |
| | | | | | | | | | | | | | | | | |
| | | | | | | | | | | | | | | | | |
| | | | | | | | | | | | | | | | | |
| | | | | | | | | | | | | | | | | |
EDC ANNUAL REPORT 2011 | 61
MANAGEMENT’S DISCUSSION AND ANALYSIS
During 2011, there were 1,722 claims submitted to EDC for consideration, compared to the 2,081 claims submitted in 2010. Although the number of claims submitted decreased, the dollar value increased due to a claim under consideration in the political risk insurance program.
At the end of 2011, the value of claims requests that were still under consideration was $315 million (2010 – $8 million).
For a breakdown of claims by size concentration, refer to Table 10 in Supplemental Information.
Policy and Claims Liabilities
| | |
At the end of December 2011, the policy and claims liabilities were $875 million. The liability net of the reinsurers’ share was $746 million, an increase of $215 million from 2010. Contributing to the change was a claim under consideration and a change in the portfolio composition in our political risk insurance program. The calculation for potential claims on insurance policies that we have ceded to reinsurance companies totalled $129 million (2010 – $109 million) and is included in the policy and claims liabilities. This amount represents the reinsurers’ share of our policy and claims liabilities and is recorded as an asset on the consolidated statement of financial position. If we were required to pay out a claim on these policies we would recover it from the reinsurer. The increase in the reinsurers’ share of the policy and claims liabilities was impacted by two new large policies in our political risk insurance program. Due to the factors discussed above, the policy and claims liabilities as a percentage of the contingent liability related to insurance policies and guarantees rose to 2.94% in 2011 compared to 2.28% in 2010. | | 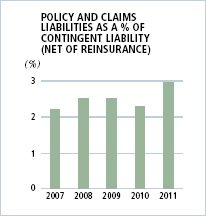 |
As permitted by International Financial Reporting Standard 7 – Financial Instruments: Disclosures, we have displayed certain parts of our Management’s Discussion and Analysis which discuss the nature, extent and management of credit, liquidity and market risks in a green font. These disclosures form an integral part of our audited Consolidated Financial Statements for the year ended December 31, 2011.
INVESTMENTS AND DERIVATIVE FINANCIAL INSTRUMENTS
The Department of Finance sets out guidelines that define the minimum acceptable counterparty credit rating pertaining to our investments and derivative financial instruments. In addition, we have policies which are reviewed periodically, and procedures that establish credit limits for each counterparty, which are reviewed by management no less than annually. These policies and procedures are designed to limit and manage the credit risk associated with these financial instruments.
Our interest-bearing deposits and investment portfolio expose us to the risk that the deposit-taking institutions or counterparty will not repay us in accordance with contractual terms. Our potential deposit and investment credit exposure is represented by the carrying value of the financial instruments.
The following table provides a breakdown, by credit rating and term to maturity, of our deposits and investments credit exposure.
| | | | | | | | | | | | | | | | | | | | |
(in millions of Canadian dollars) | | | | | | | | | | | | | |
| | | Remaining term to maturity | | | | | | | |
| Credit rating | | Under 1 year | | | 1 to 3 years | | | Over 3 years | | | 2011 Exposure | | | 2010 Exposure | |
AAA | | | 1,258 | | | | 700 | | | | 1,211 | | | | 3,169 | | | | 2,687 | |
AA+ | | | – | | | | – | | | | – | | | | – | | | | 2 | |
AA | | | – | | | | 7 | | | | 8 | | | | 15 | | | | 146 | |
AA- | | | 399 | | | | 51 | | | | 3 | | | | 453 | | | | 647 | |
A+ | | | 130 | | | | – | | | | – | | | | 130 | | | | 241 | |
A | | | 15 | | | | – | | | | – | | | | 15 | | | | 80 | |
A- | | | 60 | | | | 22 | | | | – | | | | 82 | | | | – | |
BBB+ | | | 22 | | | | – | | | | – | | | | 22 | | | | – | |
Total | | | $1,884 | | | | $780 | | | | $1,222 | | | | $3,886 | | | | $3,803 | |
Derivatives expose us to the risk that the counterparty will not repay us in accordance with contractual terms. Our potential derivative credit exposure is represented by the replacement cost of contracts that have a positive fair value. For a more in-depth discussion on the use of derivatives, refer to the section on derivatives (see page 70).
62 | BUILDING RESILIENCE IN UNCERTAIN TIMES
All swaps are transacted with high credit quality financial institutions. We operate a collateral program to mitigate credit exposure related to swaps used to hedge risk within our funding program. As market rates move between the settlement date and maturity date of the swap, the financial instrument attains value such that to terminate the swap early, one counterparty would need to make a payment to the other to compensate for the movement in rates. In order to mitigate the credit risk, we often enter into collateral agreements with financial institutions with whom we undertake swap transactions. Under the terms of the swap agreements, when the credit exposure surpasses an agreed upon threshold, collateral in the form of government securities is posted with an independent third party by our swap counterparty. At the end of December 2011, $788 million was posted as collateral by our counterparties to mitigate credit risk associated with swap agreements.
The following table provides a breakdown, by credit rating and term to maturity, of our derivative credit exposure and how it is offset against exposure netting amounts and collateral held. Exposure netting amounts represent derivative contracts where there is an agreement with the counterparty (netting agreement) that allows us to offset the counterparty’s derivative credit exposure to us against our credit exposure to that same counterparty. After applying both exposure netting and collateral held our net exposure is $643 million (2010 – $695 million).
| | | | | | | | | | | | | | | | | | | | | | | | | | | | | | | | |
| |
| (in millions of Canadian dollars) | |
| | | Remaining term to maturity | | | | | | | | | | | | 2011 | | | 2010 | |
| Credit rating | | Under 1 year | | | 1 to 3 years | | | Over 3 years | | | Gross exposure | | | Exposure netting* | | | Collateral held | | | Net exposure | | | Net exposure | |
AA | | | – | | | | – | | | | – | | | | – | | | | – | | | | – | | | | – | | | | 6 | |
AA- | | | 333 | | | | 404 | | | | 508 | | | | 1,245 | | | | (91) | | | | (695) | | | | 459 | | | | 597 | |
A+ | | | 38 | | | | 63 | | | | 55 | | | | 156 | | | | (13) | | | | (49) | | | | 94 | | | | 57 | |
A | | | 7 | | | | 6 | | | | 43 | | | | 56 | | | | (6) | | | | (25) | | | | 25 | | | | 35 | |
A- | | | 19 | | | | – | | | | 46 | | | | 65 | | | | – | | | | (4) | | | | 61 | | | | – | |
BBB+ | | | 1 | | | | – | | | | 11 | | | | 12 | | | | – | | | | (15) | | | | (3) | | | | – | |
BBB | | | – | | | | – | | | | 7 | | | | 7 | | | | – | | | | – | | | | 7 | | | | – | |
Total | | | $398 | | | | $473 | | | | $670 | | | | $1,541 | | | | $(110) | | | | $(788) | | | | $643 | | | | $695 | |
* As a result of netting agreements.
Credit risk for investments and derivative financial instruments is reported on a quarterly basis to the Asset Liability Management Committee and to the Risk Management Committee of the Board.
Capital Management
| | | | | | | | | | | | |
Our capital management framework ensures that we are appropriately capitalized and that our capital position is identified, measured, managed, and regularly reported to the Board. Being appropriately capitalized has allowed us to fulfill our mandate and sustain continued risk capacity for Canadian exporters and investors despite a more challenging credit environment. We target a level of capitalization sufficient to cover potential losses consistent with a rating standard of AA. This solvency standard aligns with that of leading financial institutions and with the key principles of financial self-sufficiency. | | | | (in millions of Canadian dollars) | | | 2011 | | | | 2010 | |
| | | | Demand for capital | | | | | | | | |
| | | | Credit risk | | | 6,598 | | | | 6,435 | |
| | | | Market risk | | | 1,438 | | | | 1,800 | |
| | | | Operational risk | | | 390 | | | | 346 | |
| | | | Business risk | | | 228 | | | | 129 | |
| | | | Strategic risk | | | 542 | | | | 520 | |
| | | | Total demand for capital | | | $9,196 | | | | $9,230 | |
| | | | Supply of capital | | | $10,836 | | | | $10,260 | |
| | | | EDC implied solvency rating | | | AAA | | | | AAA | |
| | | | | | | | | | | | |
We define capital supply as the sum of total equity and allowances, as determined in accordance with IFRS. We quantify demand for capital arising from credit, market, operational and business risks using methodologies that are generally consistent with Basel II standards. We also allocate a portion of available capital for strategic risk and market volatility. Capital adequacy is determined by comparing supply of capital to demand for capital.
We measure and report changes to capital supply, capital demand and its implied solvency rating to executive management monthly. These capital measures are reported to the Board quarterly together with forward looking stress tests which model the potential impact on capital of portfolio migration and other key risk events.
EDC ANNUAL REPORT 2011 | 63

MANAGEMENT’S DISCUSSION AND ANALYSIS
Our capital is first and foremost available to support Canadian exporters and investors for the benefit of Canada. While it is our intention to fully utilize our capital in support of our mandate there may be situations in which the Board of Directors may wish to authorize a dividend payment. As such our Capital Adequacy Policy includes a dividend methodology to guide the Board of Directors in determining a potential dividend amount.
We strive to ensure that our risk and capital management policies are aligned with industry standards and are appropriately sophisticated relative to our risk profile and business operations.
Off Balance Sheet Arrangements
In the normal course of business, we engage in a variety of transactions with special purpose entities (SPEs). SPEs are generally created for a single purpose, have a limited lifespan, and are used for risk management, legal, or taxation reasons to hold specific assets for its benefactors. These transactions are generally undertaken for risk, capital, and funding management purposes that benefit our clients. In accordance with IFRS, those SPEs where we are not exposed, or have rights to variable returns from our involvement with the SPE and do not have decision-making power to affect the returns of the SPE, have not been consolidated on our statement of financial position.
In certain financing transactions, SPEs are used to securitize assets and are typically highly debt-leveraged and, in certain circumstances, equity guarantees may also be used. EDC may also use SPEs to hold assets that have been foreclosed upon and cannot be held directly for legal or taxation reasons, typically for foreclosed assets in foreign countries.
For more discussion and complete disclosure of our involvement with SPEs, refer to Note 30, Special Purpose Entities, in the notes to the consolidated financial statements.
Financial Instruments
Given the nature of our business, our assets and liabilities are substantially composed of financial instruments. Financial instrument assets include cash resources, securities, equity financing, loans and recoverable insurance claims, while financial instrument liabilities include accounts payable, loans and loan guarantees. We also use a variety of derivative financial instruments including interest rate swaps, cross currency interest rate swaps, foreign exchange swaps, foreign exchange forwards, non-deliverable forwards, non-deliverable foreign exchange swaps and credit default swaps.
In accordance with IFRS, the majority of financial instruments are recognized on the statement of financial position at their fair value. These financial instruments include marketable securities at fair value through profit or loss, equity financing at fair value through profit or loss, derivative financial instruments and loans payable designated at fair value through profit or loss. Note 2 of the consolidated financial statements outlines the accounting treatment for our financial instruments while Note 28 provides details of how their fair values are determined.
We use derivatives to manage interest rate risk, foreign exchange risk, and credit risk. These derivatives are only contracted with creditworthy counterparties in accordance with policies established in the Risk Management Office and approved by our Board of Directors. Both our internal policies and guidelines and those set by the Minister of Finance limit our use of derivatives. We do not use derivatives for speculative purposes. We manage our exposure to derivative counterparty credit risk by contracting only with creditworthy counterparties, and in certain cases entering into collateral agreements with those counterparties. For further discussion on our risk management framework, refer to the Risk Management discussion on following pages.
64 | BUILDING RESILIENCE IN UNCERTAIN TIMES
| | |
RISK MANAGEMENT “EDC played an active role in assisting Canadian exporters with risk mitigation solutions in 2011 as they worked through a highly volatile, yet slow growth economic environment. Our credit portfolios continued to improve over the benign first half of 2011, and although they remain in good shape, default activity did pick up in the second half of the year. EDC also continued our investment in risk management infrastructure, by implementing a new integrated capital management system, by prototyping a new internal ratings based model and by creating a new corporate department, entitled Enterprise Risk Management.” Pierre Gignac SVP and Chief Risk Officer, Enterprise Risk Management | |  |
From a risk management perspective, volatility was the name of the game for credit markets in 2011 and the year would more accurately be characterized as two distinct half-years.
Credit markets carried momentum from a strong 2010 into the first half of 2011, where we saw continued spread tightening and transaction structures becoming more borrower-friendly. The readily available supply of capital combined with the amount of cash on corporate balance sheets and the lack of investment activity by companies in general resulted in reduced lending activity, but EDC was able to take advantage of these conditions by selling several loans and putting several hedges on the books at attractive prices to mitigate loan concentrations. By mid-year, EDC’s credit portfolios were in the best shape they had been since the start of the credit crisis in 2008.
During the second half of the year, the downgrade of the U.S. government’s credit rating, default speculation surrounding Greece and renewed concerns about the European sovereign debt crisis made the credit environment more challenging. EDC was able to step in and fill gaps where needed for Canadian exporters, helping many of our customers secure access to capital during these volatile credit markets, particularly as European banks reduced exposures in order to meet newly imposed regulatory capital ratios.
The challenging business environment also led to an increase in EDC’s impaired loan portfolio, in large part due to the impairment of two airlines: American Airlines, Inc.’s parent company AMR Corp. and regional carrier Pinnacle Airlines, Inc. As previously mentioned on page 57, in both cases our exposure is well secured by aircraft. Regime changes across North Africa and the Middle East have led to increased risk in our political risk insurance program, as evidenced by a claim under consideration at the end of 2011.
In 2011, we extended policy governance of EDC’s Counterparty Credit Risk Management Framework to include EDC’s counterparty exposures of our reinsurance programs. The extension results in an improved understanding of, and management of counterparty risks to which EDC is exposed. The policy prescribes minimum rating standards, maximum exposure limits and allows for a more consistent application of our risk appetite and risk management activities across the corporation.
EDC also continued to increase its investment in risk management infrastructure over the course of 2011 as we completed the implementation of our new capital management system. This new system will allow us to measure our credit, insurance and market risk portfolios on a common platform. We also took the first step in rolling out a new internal ratings based (IRB) platform for our credit portfolio, which when fully implemented will bring EDC in line with Basel II principles. Finally, in the fourth quarter, EDC elevated the position of head of risk management to an executive level position as the newly established position of SVP and Chief Risk Officer, Enterprise Risk Management, bringing greater focus to the area as a whole.
Looking forward, we expect elevated volatility to continue, with default rates creeping up and Europe remaining in the headlines. We believe offsetting this uncertainty will be the gradual recovery of the U.S. economy, as it finally begins to reap some of the benefits of the retrenching the consumer and business sectors have been doing since 2008. A focus on managing the fallout from potential sovereign defaults will remain key for us in 2012, as many countries remain levered at record levels and have constrained access to the global bond markets. Despite continued global uncertainty and a recent increase in loan impairments, EDC’s robust approach to risk management means we remain well capitalized and well positioned to help Canadian exporters mitigate the risks that come with increasing trade opportunities.
EDC ANNUAL REPORT 2011 | 65

MANAGEMENT’S DISCUSSION AND ANALYSIS
Risk Management Framework Overview
Our business activities expose us to a wide variety of risks including credit, market, operational, organizational, and business risks. Our ability to manage these risks is a key competency within the organization, and is supported by a strong risk culture and an effective risk management approach. We manage our risks by seeking to ensure that business activities and transactions provide an appropriate balance of return for the risks assumed and remain within our risk appetite, which is collectively managed throughout the organization, through adherence to our Enterprise Risk Management (ERM) Framework.
Our ERM Framework sets out the major risk categories, and identifies and defines a broad number of risks to which our businesses and operations could be exposed. This framework gives us an overall view of all potential risks EDC faces and forms the foundation for appropriate risk oversight processes and the consistent communication and reporting of key risks that could have an impact on our achievement of business objectives.
Risk identification and measurement are important elements of our ERM Framework. We have enterprise-wide methodologies, models and techniques in place to measure both the quantitative and qualitative aspects of risks, appropriate for the various types of risks we face. These methodologies, models and techniques are subject to periodic assessment and review for appropriateness and reliability. Our annual ERM assessment process by way of interviews with management allows us to identify and proactively address emerging risks and opportunities.
We also use techniques such as sensitivity analysis and stress testing to help ensure that the risks remain within our risk appetite and that our capital is adequate to cover those risks. Our stress testing program includes evaluation of the potential effects of various economic and market scenarios on our risk profile.
Our risk governance structure emphasizes and balances strong central oversight and control of risk with clear accountability for, and ownership of, risk within each business unit. This structure supports the flow of information between the business units, the members of the Executive Team, who represent each significant business unit and corporate oversight function, the President and Chief Executive Officer (CEO), and the Board of Directors.
Risk Governance Structure
The key stakeholders of our risk governance structure are:
Board and its Committees
Board of Directors
The Board of Directors (the Board) provides oversight and carries out its mandate with respect to risk and capital management through the Risk Management Committee of the Board and the Audit Committee of the Board. The Board maintains overall responsibility for approval of (i) risk management and accounting policies and (ii) our Code of Business Ethics and Code of Conduct and (iii) the Environmental Review Directive. The Board also maintains oversight responsibilities for the management of the credit, market and other enterprise risks of the Corporation, as well as oversight of the appropriateness of internal control systems and policies governing Corporate Social Responsibility.
Risk Management Committee of the Board
This Committee assists the Board in fulfilling its oversight responsibilities with respect to the prudent management of our capital structure, including the management of the credit, market and other enterprise risks of the Corporation.
Audit Committee of the Board
This Committee assists the Board in fulfilling its oversight responsibilities with respect to our standards of integrity and behaviour, financial reporting, and internal control systems. The Audit Committee also monitors our corporate compliance program.
66 | BUILDING RESILIENCE IN UNCERTAIN TIMES
Key Risk Committees
Executive Management Team
The Executive Management team, led by the President and CEO and including the executives reporting directly to the President and CEO, has primary responsibility for the management of our risks, standards of integrity and behaviour, financial reporting, and internal control systems. The Executive Management team undertakes this responsibility through various management oversight committees, by ensuring an appropriate organizational structure and governing policies are in place, and through independent validation by audit.
Management Risk Management Committee
This Committee provides an independent endorsement as to the acceptability of certain credit commitments and acts as the authority for recommending risk policies to the Board for approval, and establishing internal risk management policies and procedures.
Asset Liability Management Committee
This Committee acts as authority for recommending Market Risk Management policies to the Board for approval, and ensuring that policies are supported by appropriate procedures and practices for the measurement, management and reporting of market risk. In addition, the Committee ensures that market risk positions are managed within policy limits, and addresses such risk practices as diversification requirements, and reporting and monitoring of guidelines.
Risk Transfer Committee
This Committee acts as authority to endorse recommendations for certain risk transfer activities for portfolio management purposes.
Key Risk Management Groups
Risk Management Office (RMO)
The RMO is responsible for risk policy and management of the financial risks impacting the Corporation including credit risk, market risk, capital adequacy and liquidity risk. This includes developing and maintaining policies and standards that reflect our risk appetite and comprehensive and timely reporting to management and the Board on major risks being assumed or facing the organization. The RMO also identifies and reports to the Board on broader enterprise wide risks including operational and organizational risks.
Corporate Finance and Control (CFC)
CFC is responsible for financial planning, accounting, financial reporting, procurement, as well as cash receipts and disbursements. CFC ensures that appropriate controls exist to ensure complete and accurate financial reporting and effective cash management.
Internal Audit (IA)
IA independently monitors and reports on the effectiveness, adequacy and sustainability of business processes, risk management processes and related internal controls used by management to achieve our business objectives. All activities of the organization are within the scope of the internal audit group’s responsibility. IA uses a risk-based audit methodology that is reflective of the Institute of Internal Auditors standards, incorporates Enterprise Risk Management and includes input from management.
Business Units
Business Units are responsible for the development and execution of business plans that are aligned with EDC’s ERM Framework, and are accountable for the risks they incur. Business units work in partnership with the Risk Management Office to ensure that risks arising from their business are managed within approved limits as set out in risk policies.
Credit Risk Management
Credit risk is the risk of loss incurred if a counterparty fails to meet its financial commitments. We are exposed to credit risk under our loans and insurance programs and treasury activities.
We manage credit risk in the organization through policy requirements, established authorities and limits, mitigation activities and reporting. Our credit risk policies set out our requirements on credit granting, concentration, counterparty and country limits, risk rating, exposure measurement, monitoring and review, portfolio management and risk transfer, as well as management and Board reporting.
EDC ANNUAL REPORT 2011 | 67

MANAGEMENT’S DISCUSSION AND ANALYSIS
Credit Granting
We deliver our products and services through sector-based business teams grouped under insurance or financing. The business teams are responsible for the proper due diligence associated with each credit commitment. Every credit commitment requires recommendation and approval. Credit commitments in excess of certain thresholds also require independent endorsement by the Risk Management Office (RMO) or the Management Risk Management Committee. The purpose of endorsement is to ensure that all relevant, tangible risks in the proposed credit commitment have been identified, assessed and mitigated where possible. The credit rating of a transaction and/or the dollar amount of exposure at risk determines whether endorsement must be provided by the Management Risk Management Committee or the RMO. All transactions above U.S. $300 million require authorization by the Board. However, this threshold can be reduced to as low as U.S. $200 million for transactions with lower credit quality. Our credit approval process includes early involvement of a senior management committee in the transaction review process and more integrated engagement on transactions between our risk management, underwriting, and business development professionals.
Our approval responsibilities are governed by delegated authorities. For all products approval from the RMO is required when credit amounts exceed certain thresholds. The Board in effect delegates specific transactional approval authorities to the CEO. Onward delegation of authority by the CEO to business units is controlled to ensure decision-making authorities are restricted to those individuals with the necessary experience levels. The criteria whereby these authorities may be further delegated throughout the organization, as well as the requirements relating to documentation, communication and monitoring of delegated authorities, are set out in corporate policies and standards.
We bear counterparty risk through our treasury liquidity and derivative portfolios. Treasury counterparties are analyzed and credit limits are recommended by Market Risk Management (MRM), a team within the RMO. Recommended counterparties are endorsed by either the RMO or Management Risk Management Committee. Every treasury credit commitment requires the approval of at least two individuals with delegated approval authority. All treasury credit exposures are measured on a fair value basis and compliance with policy and operational limits is measured daily. In addition, we have policies and procedures in place to limit and to manage the credit risk associated with these financial instruments and to define collateral requirements for treasury counterparties.
Concentration Limits
To ensure diversification of risks within our credit commitments, we have established risk limits in place to protect against being overly concentrated to any one country, industry sector or commercial obligor. All limits are determined based on our capital base and risk factors associated with the exposure including the obligor rating, country rating, associated collateral and EDC product type. Exposures beyond the risk limits require either Presidential approval within discretionary limits or review by the Risk Management Committee and approval of the Board.
Risk Ratings
We have developed risk rating methodologies for all of our product lines. Many of the obligor risk rating methodologies use a combination of Moody’s and/or Standard & Poor’s external ratings and/or our internal ratings based (IRB) methodologies. Some of our IRB methodologies use vendor provided credit risk analysis/ratings tools such as Moody’s Financial Analyst, Risk Advisor, and RiskCalc. At the credit granting stage, all obligors are rated except for obligors with very small exposures (typically representing less than 1% of total exposure). We rate our obligors on a rating scale of between 8 and 16 credit grades depending on the product type. The obligor risk ratings are reviewed on a regular basis. Work is advancing on an initiative to enhance and standardize our credit risk rating methodology for obligors. In 2011 we began a multi-year project to move to an Internal Ratings Based approach.
Our Economics team is responsible for establishing, monitoring and approving country risk ratings. The country risk ratings are based on the same letter grade rating system used internally at EDC for obligors. Country risk ratings are continually reviewed by the department to take into consideration any changes in the world environment or a specific country.
For treasury related counterparties, each counterparty must be rated by at least two external rating agencies for credit exposure of greater than one year term to maturity, and at least one external rating agency for credit exposure of less than one year term to maturity. The risk rating for treasury counterparties is based on the external ratings.
Exposure Measurement
To ensure that the level of credit risk is transparent to both management and the Board, our credit exposure measurement guideline requires information reporting and comparison of the aggregated exposures within a portfolio against prescribed limits such as country, industry, and commercial obligor. We also report on approved short-term buyer limits under our accounts receivable insurance program.
68 | BUILDING RESILIENCE IN UNCERTAIN TIMES
Monitoring and Review
Our operating practices include ongoing monitoring of credit exposures. Specialized teams have been created to monitor and manage credit exposure within the different product lines which include monitoring of events in the country and industry of the obligor. The Asset Management team within the RMO is responsible for managing the credit quality and financial performance of our portfolio of commercial loans and guarantees both at the transaction and portfolio levels. This specialized team undertakes loan reviews, assesses risk ratings, and regularly monitors borrowers and the credit risk environment including research and assessment of financial, operating and industry trends. Our portfolio of credit insurance counterparties is actively monitored by our Risk Assessment and Portfolio Management team. In addition, deteriorating credits are managed by teams that specialize in restructurings, Paris Club reschedulings, claims, and recoveries. Management and the Board are frequently apprised on the credit quality of the portfolio through regular reporting including detailed quarterly reporting on the breakdown of the portfolio by risk ratings, impaired obligors, loan write-offs and claims information.
Portfolio Management
The goal of portfolio management is to ensure our ability to pursue mandate related opportunities while taking into consideration the availability of financial resources and limit constraints. Management and the Board are regularly updated on our portfolio of credit exposures through quarterly compliance reporting against concentration limits. We use both primary and secondary portfolio management activities to address imbalances or excess concentrations including, but not limited to, syndication at credit origination, the sale of assets, insurance, reinsurance and hedging using credit derivatives.
We continue to make use of credit derivatives for risk mitigation purposes targeting large exposures in our loan portfolio. To address credit concentration in our insurance portfolios we engage in various risk transfer activities primarily through reinsurance and co-insurance.
Management and Board Reporting
The RMO provides timely and comprehensive risk reporting to management and the Board on major risks being assumed by or facing EDC, enabling appropriate management and oversight. This reporting includes, but is not limited to a (i) quarterly risk management report, (ii) monthly credit risk policy compliance report, (iii) monthly capital adequacy report, and (iv) monthly report detailing our liquidity position. Ad-hoc risk reporting is provided to senior management and the Board as warranted for new or emerging risk issues or significant changes in our level of risk. Significant credit risk issues and action plans are tracked and reported to ensure management accountability and attention are maintained.
Market Risk Management
Market risk is the risk that the fair value or future cash flows of a financial instrument will fluctuate because of changes in market prices. Market risk comprises three types of risk: foreign exchange risk, interest rate risk, and other price risk. We are exposed to potential losses as a result of movements in interest and foreign exchange rates.
Through our policies and procedures, we ensure that market risks are identified, measured, managed, and regularly reported to management and the Board. Our Market Risk Management Policy sets out our requirements on interest rate and foreign exchange exposure limits, liquidity, investment, debt funding, derivatives and structured notes, management of the credit risk for treasury counterparties, and management and Board reporting. The Asset Liability Management Committee, which is chaired by the Chief Financial Officer, oversees and directs the management of market risks inherent within our normal business activities. Risk oversight is provided by the MRM team within the Risk Management Office.
Interest Rate Risk
Interest rate risk is the risk that the fair value or future cash flows of a financial instrument will fluctuate because of changes in market interest rates. We are exposed to potential adverse impacts on the value of financial instruments resulting from differences in the maturities or repricing dates of assets and liabilities both on and off-balance sheet, as well as from embedded optionality in those assets and liabilities.
Our interest rate risk is managed in accordance with guidelines established by the Department of Finance as well as policies set by the Board. We report interest rate risk on a quarterly basis to the Asset Liability Management Committee and to the Risk Management Committee of the Board.
Our interest rate risk policy limits are tested on a monthly basis to ensure compliance with our policy. Interest rate risk is measured by simulating the impact of a 100 basis point change on our net financing and investment income.
EDC ANNUAL REPORT 2011 | 69
MANAGEMENT’S DISCUSSION AND ANALYSIS
Interest Rate Sensitivity
The table below presents the sensitivity of the net financing and investment income and net income to a parallel 100 basis point change in interest rates given the outstanding positions as at December 31, 2011.
Interest Rate Change
| | | | | | | | |
(in millions of Canadian dollars) | | | | 2011 | | | | 2010 |
| | | +100 Basis | | – 100 Basis | | +100 Basis | | – 100 Basis |
| | | Points | | Points | | Points | | Points |
Change in net financing and investment income | | (11) | | 11 | | (3) | | 3 |
Change in net income | | (93) | | 92 | | (69) | | 69 |
Foreign Exchange Risk
Foreign exchange risk is the potential adverse impact on the value of financial instruments resulting from exchange rate movements. We are exposed to foreign exchange rate risk when there is a mismatch between assets and liabilities in any currency.
Our foreign exchange risk is managed in accordance with guidelines established by the Department of Finance as well as policies approved by the Board. We report our foreign exchange risk on a quarterly basis to the Asset Liability Management Committee and to the Risk Management Committee of the Board.
In addition to the guidelines and policies described above, we also have supplemental operational limits and reporting requirements. Management of foreign exchange risk is enabled through monthly risk position monitoring and reporting.
As per our policy, the potential translation loss impact to one month’s net financing and investment income (NFII) as measured by a two standard deviation change in foreign exchange rates is limited to 2.5% of projected 12 month NFII, on a consolidated Canadian dollar equivalent.
As the table below indicates, at December 31, 2011 we were offside our policy. The primary reason for exceeding our policy limit was due to additional loan allowances recorded in December due to the airline impairments. The increase in allowances opened a foreign exchange exposure which was closed subsequent to year end, bringing our exposure to an onside position.
Foreign Exchange Positions against Limit
| | | | |
(in millions of Canadian dollars) | | 2011 | | 2010 |
Limit | | 23 | | 24 |
Position | | 26 | | 13 |
The table below presents the sensitivity of net income to changes in the value of the Canadian dollar versus the other currencies we are exposed to given the outstanding positions as at December 31, 2011.
Canadian Dollar Relative to Other Currencies
| | | | | | | | |
(in millions of Canadian dollars) | | | | 2011 | | | | 2010 |
| | | Increases by 1% | | Decreases by 1% | | Increases by 1% | | Decreases by 1% |
Change in net income | | 3 | | (3) | | 1 | | (1) |
Derivatives
We use a variety of derivatives to manage costs, returns and levels of financial risk associated with funding, investment and risk management activities. The principal purpose for which we use derivatives is to hedge against foreign exchange and interest rate risk. Our use of derivatives may include, but is not restricted to, currency and interest rate swaps, foreign exchange swaps, futures and options. We do not use derivatives for speculative purposes.
70 | BUILDING RESILIENCE IN UNCERTAIN TIMES
We do not engage in the use of derivatives whose value and financial risks cannot be measured, monitored and managed on a timely basis. The MRM team formally reviews our derivative financial instrument transactions at time of inception, and on an ongoing basis to provide an independent verification on the valuation of transaction structures and of associated financial risks.
Derivatives are used to hedge risks by diversifying concentrated exposures. For example, we may balance the proportion of fixed to floating assets in our portfolio using interest rate swaps in order to diversify interest rate risk.
The following table indicates the fair value of our derivatives based upon maturity:
| | | | | | |
(in millions of Canadian dollars) | | Positive | | Negative | | Net |
Less than 1 year | | 398 | | (82) | | 316 |
1 – 3 years | | 473 | | (32) | | 441 |
Over 3 – 5 years | | 508 | | (26) | | 482 |
Over 5 years | | 162 | | (38) | | 124 |
Gross fair value of contracts | | $1,541 | | $(178) | | $1,363 |
Liquidity Risk Management
Liquidity risk is the risk that we would be unable to honour daily cash outflow commitments or the risk that we would have to obtain funds rapidly, possibly at an excessively high premium during severe market conditions. Liquidity risk arises from two sources: mismatched cash flows related to assets and liabilities; and liquidity risk due to the ability to sell credit commitments in a timely and cost effective manner.
Our treasury department is responsible for our liquidity management and the MRM team is responsible for monitoring compliance with our policies and procedures. Pursuant to our risk management policies, we must maintain sufficient liquidity to meet a prescribed minimum level, based on forecasted three month cash requirements.
Within the overall policy framework, we manage our liquidity risk both within the overall policy limits and also within supplemental limits. The MRM team measures our position on a daily basis and provides a monthly report to senior management on our actual liquidity position against this minimum limit, as well as a quarterly report to the Risk Management Committee of the Board.
We maintain liquidity through a variety of methods:
| | u | Cash and Marketable Securities: We hold cash and marketable securities to ensure that sufficient liquidity is available if required to meet forecasted cash requirements. During 2011, the average balance of cash and marketable securities was $3,629 million. | |
| | u | Access to Commercial Paper Markets: In the course of our normal activities, our commercial paper programs provide us with the necessary liquidity to meet our cash requirements on a daily basis. During 2011, the average balance of commercial paper was $2,181 million. | |
Investment Risk
The Investment Policy defines the investments that we may undertake in the market place by instrument type. The investment of corporate cash holdings is governed by Section 10(1.1)(h) of the Export Development Act, Section 128 of the Financial Administration Act, and the Corporation’s Investment Authorities approved by the Minister of Finance.
Debt Funding
The Export Development Act places limitations on our borrowings. The Act allows us to borrow and have outstanding borrowings up to a maximum of 15 times the aggregate of (a) our current paid-in capital and (b) our retained earnings determined in accordance with the previous year’s audited financial statements.
The Minister of Finance, pursuant to the requirements of the Financial Administration Act, annually approves the borrowings of the Corporation. The Debt Funding Policy is monitored on a monthly basis and reported to management and the Board on a quarterly basis.
EDC ANNUAL REPORT 2011 | 71
MANAGEMENT’S DISCUSSION AND ANALYSIS
Contractual Obligations
In the normal course of business, we enter into contracts that give rise to commitments of future minimum payments.
Future payments on our long-term debt and our other long-term payable over the next five years are depicted below.
We have two types of loan commitments. The first type is undisbursed amounts on signed loan agreements. The second type represents commitments we entered into, for which terms related to the transaction such as interest rate type and disbursement schedule have not yet been determined. This category includes letters of offer accepted and outstanding for loans and guarantees as well as unallocated, confirmed lines of credit (LOC).
Purchase obligations include those obligations that are legally binding agreements whereby we have agreed to purchase products or services with specific minimum quantities defined as fixed, minimum or variable in price over a specified period of time.
The following table provides a summary of our future payments on contractual commitments.
| | | | | | | | | | | | |
| (in millions of Canadian dollars) | | Under 1 year | | 1 to 3 years | | Over 3 to 5 years | | Over 5
years | | 2011 Total | | 2010 Total |
Long-term debt | | 6,851 | | 6,658 | | 6,155 | | 3,193 | | 22,857 | | 21,050 |
Other long-term payable | | 6 | | 19 | | 19 | | 24 | | 68 | | 74 |
Undisbursed loan commitments | | 9,722 | | – | | – | | – | | 9,722 | | 9,003 |
Undisbursed equity commitments | | 85 | | 31 | | 167 | | – | | 283 | | 314 |
Letters of offer accepted and outstanding | | 2,022 | | – | | – | | – | | 2,022 | | 2,180 |
Confirmed LOC | | 410 | | – | | – | | – | | 410 | | 384 |
Leases | | 25 | | 55 | | 59 | | 461 | | 600 | | 571 |
Purchase obligations | | 30 | | 6 | | – | | – | | 36 | | 64 |
Total | | $19,151 | | $6,769 | | $6,400 | | $3,678 | | $35,998 | | $33,640 |
Operational Risk Management
Operational risk is defined as the risk of direct or indirect loss resulting from the organizational environment, external events, inadequate internal processes, people, or systems. Operational risk includes risk to our reputation and the risk of not meeting our mandate or regulatory requirements.
Operational risk is embedded in all our activities, including the practices and controls used to manage other risks. Operational risk is difficult to measure in a complete and precise manner, given that exposure to operational risk is often implicit, bundled with other risks, or otherwise not taken on intentionally.
Operational risk is managed through our infrastructure, controls, systems and people, complemented by specialist groups focusing on enterprise-wide management of specific operational risks such as fraud, privacy, outsourcing, and business disruption, as well as people and systems risks. Specific programs, policies, standards and methodologies have been developed to support the management of operational risk.
Each business unit has responsibility for the day-to-day management of operational risk. Business unit management is responsible for ensuring that appropriate procedures, internal controls and processes are established to manage operational risks and to comply with corporate policies.
Operational risks driven by systems are managed through controls over technology development and change management.
Operational risks driven by people and processes are mitigated through human resources policies and practices, and a biennial Employee Opinion Survey. This survey provides us with a mechanism to gather employee input on climate conditions that enable or inhibit key drivers of performance. These results drive action plans to build on our strengths and support corporate values.
In the event of an external disruption, we have a mature and comprehensive Business Continuity Plan (BCP). Diligent testing is performed periodically covering all aspects of the BCP, including command and control, supplier performance, infrastructure restart and recovery and, most importantly, the effectiveness and viability of the plans for the business teams. We have activated the BCP on more than one occasion and it has performed extremely well, maintaining the business and service to our customers with minimal disruption.
72 | BUILDING RESILIENCE IN UNCERTAIN TIMES
As business practices evolve to address new operating environments with respect to reputational risk, we have strengthened our commitment to Corporate Social Responsibility (CSR), which is built on five essential pillars: business ethics, the environment, transparency, community investment and organizational climate. We have made a significant investment in time and resources on all of these fronts and have made CSR a central part of our ongoing business strategy. We recognize that growth and sustainability must be addressed simultaneously and that CSR is intrinsic to achieving sustainable trade. We strive to maximize Canadian exporter growth potential, while being conscientious of the environmental impacts of our business and acting in accordance with the highest ethical standards, as well as investing in our communities and our employees.
Our mandate guidelines ensure that we continue to respond to the needs of Canadian exporters and investors while satisfying our mandate. Issues of mandate that are unique or complex are referred to an internal legal committee.
The annual interviews with management which are part of our ERM program allow us to identify a broad spectrum of risks and facilitates the escalation of concerns related to operational risks to senior management for possible action.
Internal Audit’s independent review of processes provides additional assurance that operational risks are appropriately managed.
We also maintain a corporate insurance program to provide additional protection from loss.
CRITICAL ACCOUNTING POLICIES AND ESTIMATES
A summary of our significant accounting policies can be found in Note 2 of our December 2011 consolidated financial statements. Judgment is required in the selection of accounting policies, and their application requires the use of estimates and assumptions to arrive at the reported carrying values of our assets and liabilities. We have established procedures to ensure that accounting policies are applied consistently and that the process for making changes to methodologies and assumptions is well controlled, and occurs in an appropriate and systematic manner. Areas where significant estimates are used include the allowance for losses on loans, loan commitments and guarantees, equipment available for lease, policy and claims liabilities, recoverable insurance claims, retirement benefit obligations and financial instruments measured at fair value. For details on our use of judgment and estimates refer to page 88 of this annual report.
Change in Accounting Standards
International Financial Reporting Standards
Effective January 1, 2011, the Canadian Institute of Chartered Accountants (CICA) adopted International Financial Reporting Standards (IFRS) for publicly accountable enterprises. Our 2011 statements are compliant with IFRS, see Note 42 for further details on our transition to IFRS.
The International Accounting Standards Board (IASB) has issued a number of new standards and interpretations effective in coming years which are discussed in Note 2 of our consolidated financial statements. In addition, the IASB is currently working on projects related to the impairment of financial assets, insurance contracts and leases. Revisions made to these standards could potentially have a significant impact on EDC’s financial statements in the coming years.
Non-IFRS Performance Measures
We use a number of financial measures to assess our performance. Some of these measures are not calculated in accordance with IFRS, and do not have standardized meanings under IFRS that would ensure consistency and comparability between companies using these measures. The following non-IFRS performance measures are referenced in this report:
Productivity Ratio (PR)
Management uses PR as a measure of EDC’s efficiency. This ratio represents administrative expenses expressed as a percentage of net revenue excluding debt relief. We previously referred to the PR as the Efficiency Ratio (ER). The change was made to better reflect the intent of the measure; otherwise, the calculation of the ratio remains unchanged.
EDC ANNUAL REPORT 2011 | 73
MANAGEMENT’S DISCUSSION AND ANALYSIS
Capital Adequacy
Capital adequacy is a measurement of the amount of capital required to cover the credit, market, operational, business, and strategic risks we have undertaken compared to the existing capital base. See “Capital Management” section for details on the definition and calculation of capital adequacy.
Claims Ratio
The claims ratio expresses net claims incurred as a percentage of net written premium. Net claims incurred includes claims paid net of estimated recoveries and changes in actuarial liabilities. This ratio only includes export credit insurance activities.
Claims paid continued to decline in 2011 from levels experienced during the credit crisis. A reduction in the policy and claims liabilities driven in part by a change in actuarial assumptions, coupled with a decrease in estimated recoveries resulted in a claims ratio of (9.46)% in 2011. This change from 2010 represents a return to a more normalized claims ratio.
| | | | |
(in thousands of Canadian dollars) | | 2011 | | 2010 |
Direct premiums | | 127,167 | | 116,794 |
Reinsurance assumed | | 4,615 | | 3,112 |
Reinsurance ceded | | (7,310) | | (5,149) |
Net written premium | | $124,472 | | $114,757 |
Net claims incurred | | $(11,777) | | $(51,327) |
Claims ratio % | | (9.46)% | | (44.73)% |
Excludes the documentary credit insurance program. Unearned premiums at the beginning and end of the year and claims incurred on reinsurance assumed/ceded were nil. Net premiums earned is therefore equivalent to net written premium and direct claims incurred is equivalent to net claims incurred. |
74 | BUILDING RESILIENCE IN UNCERTAIN TIMES
SUPPLEMENTAL INFORMATION
Table 1: Loan Interest Yield
| | | | | | | | | | |
(in millions of Canadian dollars) | | 2011 | | 2010 | | 2009 | | 2008 | | 2007 |
Gross loans receivable: | | | | | | | | | | |
Average performing floating rate | | 18,356 | | 17,518 | | 18,885 | | 13,635 | | 10,336 |
Average performing fixed rate | | 8,087 | | 8,229 | | 9,389 | | 8,747 | | 7,921 |
Average performing gross loans receivable | | $26,443 | | $25,747 | | $28,274 | | $22,382 | | $18,257 |
Loan revenue: | | | | | | | | | | |
Performing floating rate interest | | 469 | | 440 | | 563 | | 672 | | 667 |
Performing fixed rate interest | | 425 | | 460 | | 561 | | 544 | | 507 |
Other loan revenue | | 115 | | 104 | | 197 | | 139 | | 231 |
Loan revenue | | 1,009 | | 1,004 | | 1,321 | | 1,355 | | 1,405 |
Debt relief revenue | | 4 | | 25 | | 49 | | – | | 1 |
Loan revenue (including debt relief) | | $1,013 | | $1,029 | | $1,370 | | $1,355 | | $1,406 |
Yields – performing loans | | | | | | | | | | |
Performing floating rate coupon | | 2.56% | | 2.51% | | 2.98% | | 4.93% | | 6.46% |
Performing fixed rate coupon | | 5.26% | | 5.59% | | 5.97% | | 6.22% | | 6.40% |
Total loan yield | | 3.83% | | 4.00% | | 4.85% | | 6.05% | | 7.70% |
|
Table 2: Net Finance Margin |
| | | | | | | | | | |
(in millions of Canadian dollars) | | 2011 | | 2010 | | 2009 | | 2008 | | 2007 |
Average gross loans receivable | | 27,094 | | 26,639 | | 29,136 | | 23,108 | | 19,110 |
Average finance lease assets – aircraft | | 94 | | 108 | | 127 | | 128 | | 129 |
Average operating lease assets | | 98 | | 266 | | 439 | | 430 | | 395 |
Average investment portfolio balance | | 3,551 | | 3,765 | | 4,085 | | 2,731 | | 2,553 |
Less: average impaired loans | | 651 | | 892 | | 862 | | 726 | | 853 |
Total average income earning assets | | $30,186 | | $29,886 | | $32,925 | | $25,671 | | $21,334 |
Financing and investment revenue: | | | | | | | | | | |
Loan | | 1,009 | | 1,004 | | 1,321 | | 1,355 | | 1,405 |
Debt relief | | 4 | | 25 | | 49 | | – | | 1 |
Finance lease | | 7 | | 8 | | 9 | | 9 | | 8 |
Operating lease | | 21 | | 32 | | 32 | | 43 | | 37 |
Investment | | 46 | | 47 | | 41 | | 81 | | 123 |
Total financing and investment revenue | | 1,087 | | 1,116 | | 1,452 | | 1,488 | | 1,574 |
Interest expense | | 99 | | 147 | | 381 | | 611 | | 717 |
Leasing and financing related expenses | | 32 | | 53 | | 68 | | 43 | | 46 |
Net financing and investment income | | $956 | | $916 | | $1,003 | | $834 | | $811 |
Net finance margin | | 3.17% | | 3.06% | | 3.05% | | 3.25% | | 3.80% |
EDC ANNUAL REPORT 2011 | 75
MANAGEMENT’S DISCUSSION AND ANALYSIS
Table 3: Insurance Premiums and Guarantee Fees
| | | | | | | | | | | | | | | | | | | | |
(in millions of Canadian dollars) | | 2011 | | | 2010 | | | 2009 | | | 2008 | | | 2007 | |
Credit insurance program(1): | | | | | | | | | | | | | | | | | | | | |
Credit insurance trade facilitated net of reinsurance | | | 75,959 | | | | 59,475 | | | | 57,183 | | | | 61,749 | | | | 46,895 | |
Premiums and fees earned | | | 161 | | | | 145 | | | | 131 | | | | 117 | | | | 98 | |
Average credit insurance premium rate % | | | 0.21 | % | | | 0.24 | % | | | 0.23 | % | | | 0.19 | % | | | 0.21 | % |
Contract insurance and bonding program(2): | | | | | | | | | | | | | | | | | | | | |
Contract insurance and bonding average exposure | | | 9,613 | | | | 9,892 | | | | 10,153 | | | | 8,961 | | | | 7,832 | |
Premiums and fees earned | | | 58 | | | | 51 | | | | 52 | | | | 42 | | | | 39 | |
Average contract insurance and bonding premium rate % | | | 0.60 | % | | | 0.52 | % | | | 0.51 | % | | | 0.47 | % | | | 0.50 | % |
Political risk insurance program: | | | | | | | | | | | | | | | | | | | | |
Political risk insurance average exposure | | | 1,648 | | | | 1,349 | | | | 1,388 | | | | 1,402 | | | | 1,232 | |
Premiums and fees earned | | | 15 | | | | 14 | | | | 14 | | | | 12 | | | | 12 | |
Average political risk insurance premium rate % | | | 0.91 | % | | | 1.04 | % | | | 1.01 | % | | | 0.86 | % | | | 0.97 | % |
Loan guarantees: | | | | | | | | | | | | | | | | | | | | |
Loan guarantees average exposure | | | 2,485 | | | | 3,368 | | | | 3,843 | | | | 3,539 | | | | 2,970 | |
Loan guarantee fees earned | | | 32 | | | | 33 | | | | 24 | | | | 20 | | | | 14 | |
Average loan guarantee fee rate % | | | 1.29 | % | | | 0.98 | % | | | 0.62 | % | | | 0.57 | % | | | 0.47 | % |
| (1) | Includes $146 million of domestic business and $0.6 million of premiums in 2011 related to our temporarily expanded mandate. |
| (2) | Includes $1,087 million of domestic exposure and $7.3 million of premiums in 2011 related to our temporarily expanded mandate. |
Table 4: Provision for (Reversal of) Credit Losses
| | | 75,952) | | | | 75,952) | | | | 75,952) | | | | 75,952) | | | | 75,952) | |
| | | | | | |
| (in millions of Canadian dollars) | | 2011 | | | 2010 | | | 2009 | | | 2008 | | | 2007 | |
Provision for (reversal of) credit losses pertaining to: | | | | | | | | | | | | | | | | | | | | |
Loans | | | 162 | | | | (234 | ) | | | 402 | | | | 249 | | | | (44 | ) |
Loan commitments | | | (53 | ) | | | (350 | ) | | | 1 | | | | 2 | | | | 215 | |
Loan guarantees | | | 16 | | | | (47 | ) | | | 28 | | | | 95 | | | | 45 | |
Total loan related provisions (reversal of) | | | 125 | | | | (631 | ) | | | 431 | | | | 346 | | | | 216 | |
Reversal of provision for credit impairment in derivative financial instruments and marketable securities | | | – | | | | – | | | | – | | | | – | | | | (20 | ) |
Total provision for (reversal of) credit losses | | | $125 | | | | $(631 | ) | | | $431 | | | | $346 | | | | $196 | |
76 | BUILDING RESILIENCE IN UNCERTAIN TIMES
Table 5: Concentration of Exposure by Geographical Market
| | | | | | | | | | | | | | | | | | | | | | | | | | |
| | | Financing portfolio | | Insurance portfolio | | | | | | | | |
| | | | | | | | | | | |
(in millions of Canadian dollars) | | | | Commitments | | | | Contract insurance
and bonding | | | | | Investments and | | | | | | | | |
| | Financing assets (1) | | and guarantees (2) | | Credit insurance | | Policies | | | Guarantees | | | Political risk
insurance | | derivative
instruments
(3) | | 2011 Exposure | | 2010 Exposure |
Country | | | | | | | | | | | | | | | | | | | | $ | | % | | $ | | % |
United States | | 9,818 | | 3,125 | | 3,819 | | | 225 | | | | 88 | | | 13 | | 3,296 | | 20,384 | | 27 | | 20,320 | | 29 |
Canada | | 3,725 | | 5,026 | | 465 | | | 2,021 | (4) | | | 6,738 | (5) | | – | | 1,806 | | 19,781 | | 26 | | 19,348 | | 27 |
Mexico | | 1,773 | | 1,208 | | 205 | | | 63 | | | | 1 | | | 26 | | – | | 3,276 | | 4 | | 3,011 | | 4 |
China | | 132 | | 36 | | 2,417 | | | 87 | | | | 1 | | | 212 | | – | | 2,885 | | 4 | | 1,366 | | 2 |
Brazil | | 1,400 | | 657 | | 663 | | | 9 | | | | – | | | 36 | | – | | 2,765 | | 4 | | 2,768 | | 4 |
India | | 1,546 | | 252 | | 920 | | | 9 | | | | – | | | – | | – | | 2,727 | | 3 | | 1,965 | | 3 |
Australia | | 730 | | 1,311 | | 135 | | | 1 | | | | – | | | – | | 19 | | 2,196 | | 3 | | 1,627 | | 2 |
Chile | | 959 | | 293 | | 354 | | | 10 | | | | – | | | – | | – | | 1,616 | | 2 | | 1,381 | | 2 |
United Kingdom | | 935 | | 99 | | 436 | | | 3 | | | | 4 | | | – | | 89 | | 1,566 | | 2 | | 1,601 | | 2 |
Turkey | | 45 | | 44 | | 1,037 | | | 4 | | | | – | | | – | | – | | 1,130 | | 1 | | 816 | | 1 |
Other(6) | | 8,530 | | 3,305 | | 4,322 | | | 233 | | | | 154 | | | 1,508 | | 217 | | 18,269 | | 24 | | 16,739 | | 24 |
Total | | $29,593 | | $15,356 | | $14,773 | | | $2,665 | | | | $6,986 | | | $1,795 | | $5,427 | | $76,595 | | 100 | | $70,942 | | 100 |
| (1) | Includes gross loans receivable, equity financing and gross investment in aircraft under finance leases. |
| (2) | Includes $283 million of equity financing commitments, $179 million of letters of offer for loan guarantees and $2,740 million of loan guarantees. |
| (3) | Investments include amounts represented by cash and marketable securities. Exposure does not take into consideration any collateral or the effect of any netting agreements with derivative counterparties. |
| (4) | Includes $2,004 million of surety bond insurance where the risk rests with the Canadian exporter. A total of 59% of the exports insured in the surety bond program are to the United States. The balance represents exports to other countries. |
| (5) | Includes $6,613 million in performance security guarantees, where the risk rests with the Canadian exporter. A total of 56% of the exports in the performance security program are to the United States. The balance represents exports to other countries. |
| (6) | Includes 175 countries with total exposure ranging from $0.001 million to $954 million. |
EDC ANNUAL REPORT 2011 | 77
MANAGEMENT’S DISCUSSION AND ANALYSIS
Table 6: Concentration of Exposure by Industry
| | | | | | | | | | | | | | | | | | | | | | | | | | | | | | | | | | | | | | |
| | | Financing portfolio | | | | | Insurance portfolio | | | | | | | | | | | | |
| | | | | | | | | | | | | | Contract insurance | | | | | | Investments and | | | | | | | | | |
| | | | | | | | Commitments | | | | | | | | | | and bonding | | | | | | | | | | | | | | | | |
(in millions of Canadian dollars) | | Financing
assets (1) | | | and
guarantees (2) | | | | | Credit
insurance | | | Policies | | | Guarantees | | | Political
risk
insurance | | | derivative
instruments (3) | | 2011 Exposure | | 2010 Exposure |
Industry | | | | | | | | | | | | | | | | | | | | | | | | | | | | | | | $ | | | % | | $ | | % |
Commercial: | | | | | | | | | | | | | | | | | | | | | | | | | | | | | | | | | | | | | | |
Extractive | | | 6,576 | | | | 6,430 | | | | | | 2,130 | | | | 217 | | | | 1,206 | | | | 641 | | | – | | | 17,200 | | | 22 | | 14,612 | | 21 |
Aerospace | | | 10,175 | | | | 1,720 | | | | | | – | | | | – | | | | – | | | | – | | | – | | | 11,895 | | | 16 | | 13,568 | | 19 |
Infrastructure and environment | | | 2,805 | | | | 1,604 | | | | | | 361 | | | | 1,741 | | | | 4,425 | | | | 893 | | | – | | | 11,829 | | | 15 | | 11,494 | | 16 |
Financial institutions | | | 1,038 | | | | 609 | | | | | | 7,283 | | | | – | | | | – | | | | – | | | 2,136 | | | 11,066 | | | 14 | | 8,647 | | 12 |
Surface transportation | | | 3,748 | | | | 2,067 | | | | | | 1,090 | | | | 525 | | | | 755 | | | | 97 | | | – | | | 8,282 | | | 11 | | 6,285 | | 9 |
Information and communication technology | | | 2,687 | | | | 1,018 | | | | | | 1,235 | | | | 92 | | | | 160 | | | | 48 | | | – | | | 5,240 | | | 7 | | 5,928 | | 8 |
Resources | | | 452 | | | | 559 | | | | | | 1,693 | | | | 13 | | | | 273 | | | | 42 | | | – | | | 3,032 | | | 4 | | 2,716 | | 4 |
Light manufacturing | | | 725 | | | | 832 | | | | | | 981 | | | | 77 | | | | 167 | | | | 74 | | | – | | | 2,856 | | | 4 | | 2,224 | | 3 |
Other | | | 47 | | | | 53 | | | | | | – | | | | – | | | | – | | | | – | | | 14 | | | 114 | | | – | | 707 | | 1 |
Total commercial | | | 28,253 | | | | 14,892 | | | | | | 14,773 | | | | 2,665 | | | | 6,986 | | | | 1,795 | | | 2,150 | | | 71,514 | | | 93 | | 66,181 | | 93 |
Sovereign | | | 1,340 | | | | 464 | | | | | | – | | | | – | | | | – | | | | – | | | 3,277 | | | 5,081 | | | 7 | | 4,761 | | 7 |
Total | | | $29,593 | | | | $15,356 | | | | | | $14,773 | | | | $2,665 | | | | $6,986 | | | | $1,795 | | | $5,427 | | | $76,595 | | | 100 | | $70,942 | | 100 |
| (1) | Includes gross loans receivable, equity financing and gross investment in aircraft under finance leases. |
| (2) | Includes $283 million of equity financing commitments, $179 million of letters of offer for loan guarantees and $2,740 million of loan guarantees. |
| (3) | Investments include amounts represented by cash and marketable securities. Exposure does not take into consideration any collateral or the effect of any master netting agreements with derivative counterparties. |
78 | BUILDING RESILIENCE IN UNCERTAIN TIMES
Table 7: Individually Impaired Loans
| | | | | | | | |
(in millions of Canadian dollars) | | 2011 | | | 2010 | |
Sovereign | | | | | | | | |
Ivory Coast | | | 131 | | | | 130 | |
Democratic Republic of the Congo | | | 47 | | | | 46 | |
Argentina | | | 46 | | | | 46 | |
Cuba | | | 24 | | | | 24 | |
Ecuador | | | – | | | | 18 | |
Gabon | | | – | | | | 13 | |
Kenya | | | – | | | | 14 | |
Subtotal | | | 248 | | | | 291 | |
Commercial | | | | | | | | |
Aerospace | | | 1,302 | | | | 180 | |
Information and communication technology | | | 83 | | | | 86 | |
Financial institutions | | | 81 | | | | 87 | |
Light manufacturing | | | 26 | | | | 22 | |
Extractive | | | 26 | | | | – | |
Surface transportation | | | 20 | | | | 37 | |
Other | | | 19 | | | | 7 | |
Subtotal | | | 1,557 | | | | 419 | |
Total impaired gross loans receivable | | | 1,805 | | | | 710 | |
Less: Individual allowance | | | 422 | | | | 257 | |
Deferred revenue and other credits | | | 205 | | | | 224 | |
Impaired net loans receivable | | | $1,178 | | | | $229 | |
EDC ANNUAL REPORT 2011 | 79

MANAGEMENT’S DISCUSSION AND ANALYSIS
Table 8: Collective Allowance for Losses on Loans,
Loan Commitments and Guarantees
| | | | | | | | | | | | | | | | | | | | | | | | |
(in millions of Canadian dollars) | | | | | | | | 2011 | | | | | | | | | 2010 | |
| Industry of risk | | Provision
exposure* | | | Collective
allowance | | | Collective
allowance as a
percentage of
provisioning
exposure | | | Provision
exposure* | | | Collective
allowance | | | Collective
allowance as a
percentage of
provisioning
exposure | |
Commercial: | | | | | | | | | | | | | | | | | | | | | | | | |
Aerospace | | | 9,815 | | | | 567 | | | | 5.8 | | | | 10,021 | | | | 668 | | | | 6.7 | |
Information and communication technology | | | 3,329 | | | | 198 | | | | 5.9 | | | | 3,899 | | | | 159 | | | | 4.1 | |
Extractive | | | 10,747 | | | | 178 | | | | 1.7 | | | | 9,260 | | | | 174 | | | | 1.9 | |
Infrastructure and environment | | | 3,651 | | | | 153 | | | | 4.2 | | | | 3,126 | | | | 141 | | | | 4.5 | |
Surface transportation | | | 5,361 | | | | 100 | | | | 1.9 | | | | 5,307 | | | | 122 | | | | 2.3 | |
Other | | | 3,043 | | | | 131 | | | | 4.3 | | | | 2,548 | | | | 130 | | | | 5.1 | |
Total commercial | | | 35,946 | | | | 1,327 | | | | 3.7 | | | | 34,161 | | | | 1,394 | | | | 4.1 | |
Sovereign | | | 1,359 | | | | 91 | | | | 6.7 | | | | 1,458 | | | | 166 | | | | 11.4 | |
Total | | | $37,305 | | | | $1,418 | | | | 3.8 | | | | $35,619 | | | | $1,560 | | | | 4.4 | |
* Calculated using factored exposure.
As noted on page 58 of the MD&A, the total allowance as a percentage of total exposure at the end of 2011 was 4.4% (2010 – 4.5%).
Table 9: Equity Financing
| | | | | | | | | | | | | | | | | | | | | | | | |
| (in millions of Canadian dollars) | | Equity
financing | | | Undisbursed
commitments | | | | | | 2011
Exposure | | | | | | 2010
Exposure | |
Gross exposure | | | | | | | | | | | $ | | | | % | | | | $ | | | | % | |
Domestic market | | | 166 | | | | 160 | | | | 326 | | | | 49 | | | | 310 | | | | 49 | |
Other advanced economies | | | 32 | | | | 12 | | | | 44 | | | | 6 | | | | 69 | | | | 11 | |
Emerging markets | | | 187 | | | | 111 | | | | 298 | | | | 45 | | | | 252 | | | | 40 | |
Total | | | $385 | | | | $283 | | | | $668 | | | | 100 | | | | $631 | | | | 100 | |
Table 10: Claims – Size Concentration
| | | | | | | | | | | | | | | | | | | | | | | | | | | | | | | | |
(in millions of Canadian dollars) | | | | | | | | | | | 2011 | | | | | | | | | | | | 2010 | |
| | | $ of
claims
paid | | | Number
of claims
paid | | | $ of
claims
recovered | | | Number
of claims
recovered | | | $ of
claims
paid | | | Number
of claims
paid | | | $ of
claims
recovered | | | Number
of claims
recovered | |
$0 – $100,000 | | | 12 | | | | 970 | | | | 32 | | | | 514 | | | | 18 | | | | 1,428 | | | | 6 | | | | 610 | |
$100,001 – $1 million | | | 21 | | | | 80 | | | | 2 | | | | 12 | | | | 27 | | | | 101 | | | | 10 | | | | 38 | |
Over $1 million | | | 22 | | | | 12 | | | | 6 | | | | 5 | | | | 81 | | | | 23 | | | | 20 | | | | 13 | |
Total | | | $55 | | | | 1,062 | | | | $40 | | | | 531 | | | | $126 | | | | 1,552 | | | | $36 | | | | 661 | |
80 | BUILDING RESILIENCE IN UNCERTAIN TIMES
| | | | | | | | | | | | |
| | | | | | | | | | | | |
| | 2011 Financial Review |
| | |
| | | | CONSOLIDATED FINANCIAL STATEMENTS |
| | | | | | | | | | | | |
| | | | | | | | | | | | |
| | | | | | | | | | | | |
| | | | | | | | | | | | |
| | | | 82 | | FINANCIAL REPORTING RESPONSIBILITY |
| | | | 83 | | INDEPENDENT AUDITOR’S REPORT |
| | | | 84 | | CONSOLIDATED STATEMENT OF FINANCIAL POSITION |
| | | | 85 | | CONSOLIDATED STATEMENT OF COMPREHENSIVE INCOME |
| | | | 86 | | CONSOLIDATED STATEMENT OF CHANGES IN EQUITY |
| | | | 87 | | CONSOLIDATED STATEMENT OF CASH FLOWS |
| | | | 88 | | NOTES TO THE CONSOLIDATED FINANCIAL STATEMENTS |
| | | | | | 88 | | 1. Corporate Mandate | | 114 | | 21. Contingent Liabilities |
| | | | | | 88 | | 2. Summary of Significant Accounting Policies | | 116 | | 22. Reinsurance Agreements |
| | | | | | 97 | | 3. Marketable Securities | | 117 | | 23. Insurance Risks |
| | | | | | 98 | | 4. Loans Receivable | | 119 | | 24. Equity |
| | | | | | 101 | | 5. Individually Impaired Loans | | 119 | | 25. Capital Management |
| | | | | | 102 | | 6. Allowance for Losses on Loans, | | 120 | | 26. Interest Rate Risk |
| | | | | | | | Loan Commitments and Loan Guarantees | | 122 | | 27. Foreign Currency Balances |
| | | | | | 103 | | 7. Equity Financing at Fair Value Through | | 124 | | 28. Fair Value of Financial Instruments |
| | | | | | | | Profit or Loss | | 127 | | 29. Financial Instrument Risks |
| | | | | | 104 | | 8. Equipment Available for Lease | | 129 | | 30. Special Purpose Entities |
| | | | | | 105 | | 9. Net Investment in Aircraft under | | 129 | | 31. Loan Revenue |
| | | | | | | | Finance Leases | | 129 | | 32. Investment Revenue |
| | | | | | 106 | | 10. Recoverable Insurance Claims | | 130 | | 33. Interest Expense |
| | | | | | 107 | | 11. Other Assets | | 130 | | 34. Leasing and Financing Related Expenses |
| | | | | | 107 | | 12. Property, Plant and Equipment | | 130 | | 35. Provision for (Reversal of) Credit Losses |
| | | | | | 108 | | 13. Intangible Assets | | 131 | | 36. Claims-Related Expenses |
| | | | | | 108 | | 14. Building under Finance Lease | | 131 | | 37. Other Income (Expenses) |
| | | | | | 109 | | 15. Accounts Payable and Other Credits | | 132 | | 38. Administrative Expenses |
| | | | | | 109 | | 16. Debt Instruments | | 132 | | 39. Retirement Benefit Obligations |
| | | | | | 110 | | 17. Derivative Financial Instruments | | 136 | | 40. Related Party Transactions |
| | | | | | 112 | | 18. Debt Instrument Maturities | | 137 | | 41. Canada Account Transactions |
| | | | | | 113 | | 19. Policy and Claims Liabilities | | 137 | | 42. Transition to International Financial |
| | | | | | 114 | | 20. Financing Commitments | | | | Reporting Standards (IFRS) |
| | | | | | | | | | | | |
| | | | | | | | | | | | |
| | | | | | | | | | | | |
| | | | | | | | | | | | |
| | | | | | | | | | | | |
| | | | | | | | | | | | |
EDC ANNUAL REPORT 2011 | 81
FINANCIAL REPORTING RESPONSIBILITY

The consolidated financial statements contained in this Annual Report have been prepared by management in accordance with International Financial Reporting Standards appropriate in the circumstances. The integrity and objectivity of the data in these consolidated financial statements are management’s responsibility. It is necessary for management to make assumptions, estimates and judgments based on information available as at the date of the financial statements. Areas where management has made significant estimates, assumptions and judgments include the determination of the control of special purpose entities, the allowance for losses on loans, the allowance for losses on loan commitments and guarantees, the allowance for claims on insurance, financial instruments measured at fair value and employee future benefits. Management is also responsible for all other information in the Annual Report and for ensuring that this information is consistent, where appropriate, with the information and data contained in the consolidated financial statements.
In support of its responsibility, management maintains financial, management control and information systems and management practices to provide reasonable assurance that the financial information is reliable, that the assets are safeguarded and that the operations are carried out effectively. We have an internal audit department whose functions include reviewing internal controls and their application, on an ongoing basis.
The Board of Directors is responsible for the management of our business and activities. In particular, it is responsible for ensuring that management fulfills its responsibilities for financial reporting and internal control and exercises this responsibility through the Audit Committee of the Board, which is composed of Directors who are not employees of EDC. The Audit Committee meets with management, the internal auditors and the Auditor General of Canada on a regular basis.
Contracts which, in our opinion, involve risks in excess of that which we would normally undertake, may be entered into under the authority of the Minister of International Trade and the Minister of Finance where the Minister of International Trade considers them to be in the national interest. Funds required for such contracts are paid to EDC by the Minister of Finance out of the Consolidated Revenue Fund, and funds recovered are remitted to the Consolidated Revenue Fund, net of amounts withheld to cover related administrative expenses. These transactions, which are known as Canada Account transactions, are shown in Note 41 to our consolidated financial statements, and the responsibility of the Board of Directors for these transactions is limited to the management of the administration thereof by EDC.
The Auditor General of Canada conducts an independent audit, in accordance with Canadian generally accepted auditing standards, and expresses his opinion on the consolidated financial statements. His report is presented on the following page.
| | |
 | |  |
| Stephen Poloz | | Ken Kember |
| President and Chief Executive Officer | | Senior Vice-President and Chief Financial Officer |
February 23, 2012 | | |
82 | BUILDING RESILIENCE IN UNCERTAIN TIMES
INDEPENDENT AUDITOR’S REPORT

TO THE MINISTER OF INTERNATIONAL TRADE
REPORT ON THE CONSOLIDATED FINANCIAL STATEMENTS
I have audited the accompanying consolidated financial statements of Export Development Canada and its subsidiary, which comprise the consolidated statements of financial position as at December 31, 2011, December 31, 2010 and January 1, 2010, and the consolidated statements of comprehensive income, consolidated statements of changes in equity and consolidated statements of cash flows for the years ended December 31, 2011 and December 31, 2010, and a summary of significant accounting policies and other explanatory information.
MANAGEMENT’S RESPONSIBILITY FOR THE CONSOLIDATED FINANCIAL STATEMENTS
Management is responsible for the preparation and fair presentation of these consolidated financial statements in accordance with International Financial Reporting Standards, and for such internal control as management determines is necessary to enable the preparation of consolidated financial statements that are free from material misstatement, whether due to fraud or error.
AUDITOR’S RESPONSIBILITY
My responsibility is to express an opinion on these consolidated financial statements based on my audits. I conducted my audits in accordance with Canadian generally accepted auditing standards. Those standards require that I comply with ethical requirements and plan and perform the audit to obtain reasonable assurance about whether the consolidated financial statements are free from material misstatement.
An audit involves performing procedures to obtain audit evidence about the amounts and disclosures in the consolidated financial statements. The procedures selected depend on the auditor’s judgment, including the assessment of the risks of material misstatement of the consolidated financial statements, whether due to fraud or error. In making those risk assessments, the auditor considers internal control relevant to the entity’s preparation and fair presentation of the consolidated financial statements in order to design audit procedures that are appropriate in the circumstances, but not for the purpose of expressing an opinion on the effectiveness of the entity’s internal control. An audit also includes evaluating the appropriateness of accounting policies used and the reasonableness of accounting estimates made by management, as well as evaluating the overall presentation of the consolidated financial statements.
I believe that the audit evidence I have obtained in my audits is sufficient and appropriate to provide a basis for my audit opinion.
OPINION
In my opinion, the consolidated financial statements present fairly, in all material respects, the financial position of Export Development Canada and its subsidiary as at December 31, 2011, December 31, 2010 and January 1, 2010, and their financial performance and cash flows for the years ended December 31, 2011 and December 31, 2010 in accordance with International Financial Reporting Standards.
REPORT ON OTHER LEGAL AND REGULATORY REQUIREMENTS
As required by the Financial Administration Act, I report that, in my opinion, the accounting principles in International Financial Reporting Standards have been applied, after giving retrospective effect to the adoption of the new standards as explained in Note 42 to the consolidated financial statements, on a basis consistent with that of the preceding year.
Further, in my opinion, the transactions of Export Development Canada and its wholly-owned subsidiary that have come to my notice during my audits of the consolidated financial statements have, in all significant respects, been in accordance with Part X of the Financial Administration Act and regulations, the Export Development Act and regulations, the by-laws of Export Development Canada and the charter and by-laws of its wholly-owned subsidiary, and the directive issued pursuant to Section 89 of the Financial Administration Act.
|
 |
| Michael Ferguson, FCA |
Auditor General of Canada |
February 23, 2012 |
Ottawa, Canada |
EDC ANNUAL REPORT 2011 | 83

CONSOLIDATED FINANCIAL STATEMENTS
EXPORT DEVELOPMENT CANADA
CONSOLIDATED STATEMENT OF FINANCIAL POSITION
| | | | | | | | | | | | |
as at (in millions of Canadian dollars) | | Dec. 31, 2011 | | | Dec. 31, 2010 | | | Jan. 1, 2010 | |
| | | | |
Assets | | | | | | | | | | | | |
Cash | | | 90 | | | | 124 | | | | 52 | |
Marketable securities: (Note 3) | | | | | | | | | | | | |
At fair value through profit or loss | | | 3,720 | | | | 3,660 | | | | 5,335 | |
At amortized cost | | | 76 | | | | 19 | | | | 20 | |
Derivative instruments (Note 17) | | | 1,541 | | | | 2,010 | | | | 1,909 | |
Loans receivable (Notes 4 and 5) | | | 28,680 | | | | 26,611 | | | | 26,477 | |
Allowance for losses on loans (Note 6) | | | (1,680 | ) | | | (1,561 | ) | | | (1,934 | ) |
Equity financing at fair value through profit or loss (Note 7) | | | 385 | | | | 317 | | | | 198 | |
Equipment available for lease (Note 8) | | | 55 | | | | 143 | | | | 326 | |
Net investment in aircraft under finance leases (Note 9) | | | 92 | | | | 99 | | | | 114 | |
Recoverable insurance claims (Note 10) | | | 44 | | | | 94 | | | | 93 | |
Reinsurers’ share of policy and claims liabilities (Note 19) | | | 129 | | | | 109 | | | | 159 | |
Other assets (Note 11) | | | 174 | | | | 182 | | | | 141 | |
Property, plant and equipment (Note 12) | | | 74 | | | | 33 | | | | 17 | |
Intangible assets (Note 13) | | | 40 | | | | 42 | | | | 41 | |
Building under finance lease (Note 14) | | | 176 | | | | – | | | | – | |
Total Assets | | | $33,596 | | | | $31,882 | | | | $32,948 | |
| | | | |
Liabilities and Equity | | | | | | | | | | | | |
Accounts payable and other credits (Note 15) | | | 159 | | | | 166 | | | | 146 | |
Loans payable: (Note 16) | | | | | | | | | | | | |
Designated at fair value through profit or loss | | | 21,505 | | | | 20,465 | | | | 22,139 | |
At amortized cost | | | 2,065 | | | | 2,019 | | | | 2,294 | |
Derivative instruments (Note 17) | | | 178 | | | | 200 | | | | 222 | |
Obligation under finance lease (Note 14) | | | 177 | | | | – | | | | – | |
Retirement benefit obligations (Note 39) | | | 74 | | | | 93 | | | | 105 | |
Allowance for losses on loan commitments (Note 6) | | | 41 | | | | 93 | | | | 453 | |
Policy and claims liabilities (Note 19) | | | 875 | | | | 640 | | | | 793 | |
Loan guarantees (Note 21) | | | 266 | | | | 245 | | | | 310 | |
| | | | 25,340 | | | | 23,921 | | | | 26,462 | |
Financing Commitments (Note 20) and Contingent Liabilities (Note 21) | | | | | | | | | | | | |
Equity | | | | | | | | | | | | |
Share capital (Note 24) | | | 1,333 | | | | 1,333 | | | | 1,333 | |
Retained earnings | | | 6,923 | | | | 6,628 | | | | 5,153 | |
| | | | 8,256 | | | | 7,961 | | | | 6,486 | |
Total Liabilities and Equity | | | $33,596 | | | | $31,882 | | | | $32,948 | |
The accompanying notes are an integral part of these consolidated financial statements.
These financial statements were approved for issuance by the Board of Directors on February 23, 2012.
| | |
 | | |
| John Rooney | | Stephen Poloz |
| Director | | Director |
February 23, 2012 | | |
84 | BUILDING RESILIENCE IN UNCERTAIN TIMES
EXPORT DEVELOPMENT CANADA
CONSOLIDATED STATEMENT OF COMPREHENSIVE INCOME
| | | | |
for the year ended December 31 (in millions of Canadian dollars) | | 2011 | | 2010 |
Financing and investment revenue: | | | | |
Loan (Note 31) | | 1,009 | | 1,004 |
Finance lease (Note 9) | | 7 | | 8 |
Operating lease (Note 8) | | 21 | | 32 |
Debt relief (Note 40) | | 4 | | 25 |
Investment (Note 32) | | 46 | | 47 |
Total financing and investment revenue | | 1,087 | | 1,116 |
| | | |
Interest expense (Note 33) | | 99 | | 147 |
Leasing and financing related expenses (Note 34) | | 32 | | 53 |
Net Financing and Investment Income | | 956 | | 916 |
| | | |
Loan Guarantee Fees | | 32 | | 33 |
| | | |
Insurance premiums and guarantee fees | | 238 | | 210 |
Reinsurance assumed | | 13 | | 11 |
Reinsurance ceded | | (17) | | (11) |
Net Insurance Premiums and Guarantee Fees (Note 22) | | 234 | | 210 |
| | | |
Other Income (Expenses) (Note 37) | | 79 | | (41) |
Administrative Expenses (Note 38) | | 284 | | 273 |
Income before Provision and Claims-Related Expenses | | 1,017 | | 845 |
| | | |
Provision for (Reversal of) Credit Losses (Note 35) | | 125 | | (631) |
Claims-Related Expenses (Note 36) | | 247 | | 1 |
Net Income | | 645 | | 1,475 |
| | | |
Other comprehensive income | | – | | – |
Comprehensive Income | | $645 | | $1,475 |
The accompanying notes are an integral part of these consolidated financial statements.
EDC ANNUAL REPORT 2011 | 85
CONSOLIDATED FINANCIAL STATEMENTS
EXPORT DEVELOPMENT CANADA
CONSOLIDATED STATEMENT OF CHANGES IN EQUITY
| | | | | | |
for the year ended December 31 (in millions of Canadian dollars) | | 2011 | | | 2010 |
| | | |
Share Capital (Note 24) | | | 1,333 | | | 1,333 |
| | | |
Retained Earnings | | | | | | |
Balance beginning of year | | | 6,628 | | | 5,153 |
Comprehensive income | | | 645 | | | 1,475 |
Dividend paid | | | (350 | ) | | – |
Balance end of year | | | 6,923 | | | 6,628 |
Total Equity at End of Year | | $ | 8,256 | | | $7,961 |
The accompanying notes are an integral part of these consolidated financial statements.
86 | BUILDING RESILIENCE IN UNCERTAIN TIMES
EXPORT DEVELOPMENT CANADA
CONSOLIDATED STATEMENT OF CASH FLOWS
| | | | | | |
for the year ended December 31 (in millions of Canadian dollars) | | 2011 | | | 2010 |
Cash Flows from (used in) Operating Activities | | | | | | |
Comprehensive income | | | 645 | | | 1,475 |
Adjustments to determine net cash from (used in) operating activities | | | | | | |
Provision for (reversal of) credit losses | | | 125 | | | (631) |
Actuarial change in the net allowance for claims | | | 179 | | | (84) |
Depreciation and amortization | | | 48 | | | 53 |
Changes in operating assets and liabilities | | | | | | |
Change in accrued interest and fees receivable | | | 20 | | | (94) |
Change in fair value of marketable securities | | | (47 | ) | | (37) |
Change in fair value of loans payable | | | 164 | | | (205) |
Change in derivative instruments receivable | | | 174 | | | (271) |
Change in derivative instruments payable | | | (138 | ) | | 665 |
Other | | | 38 | | | 245 |
Loan receivable disbursements | | | (10,393 | ) | | (10,095) |
Loan receivable repayments | | | 8,735 | | | 8,533 |
Net cash used in operating activities | | | (450 | ) | | (446) |
Cash Flows from (used in) Investing Activities | | | | | | |
Equity financing disbursements | | | (106 | ) | | (117) |
Equity financing receipts | | | 29 | | | 10 |
Finance lease repayments | | | 9 | | | 9 |
Purchases of marketable securities at fair value through profit or loss | | | (40,793 | ) | | (44,451) |
Sales/maturities of marketable securities at fair value through profit or loss | | | 40,852 | | | 46,027 |
Purchases of marketable securities at amortized cost | | | (869 | ) | | (31) |
Sales/maturities of marketable securities at amortized cost | | | 814 | | | 31 |
Distribution from investment in joint ventures | | | 54 | | | – |
Net cash from (used in) investing activities | | | (10 | ) | | 1,478 |
Cash Flows from (used in) Financing Activities | | | | | | |
Issue of long-term loans payable – designated at fair value through profit or loss | | | 5,708 | | | 4,822 |
Repayment of long-term loans payable – designated at fair value through profit or loss | | | (6,135 | ) | | (5,791) |
Repayment of long-term loans payable at amortized cost | | | – | | | (163) |
Issue of short-term loans payable – designated at fair value through profit or loss | | | 22,751 | | | 12,821 |
Repayment of short-term loans payable – designated at fair value through profit or loss | | | (21,870 | ) | | (12,650) |
Change in derivative instruments receivable | | | 296 | | | 120 |
Change in derivative instruments payable | | | 25 | | | (111) |
Dividend paid | | | (350 | ) | | – |
Net cash from (used in) financing activities | | | 425 | | | (952) |
Effect of exchange rate changes on cash | | | 1 | | | (8) |
Net increase (decrease) in cash | | | (34 | ) | | 72 |
Cash | | | | | | |
Beginning of year | | | 124 | | | 52 |
End of year | | | $90 | | | $124 |
Operating Cash Flows from Interest | | | | | | |
Cash paid for interest on loans payable | | | 156 | | | 168 |
Cash received for interest on currency swaps related to capital | | | 70 | | | 18 |
Cash received for interest on loan assets and marketable securities | | | 1,046 | | | 1,203 |
The accompanying notes are an integral part of these consolidated financial statements.
EDC ANNUAL REPORT 2011 | 87
CONSOLIDATED FINANCIAL STATEMENTS
NOTES TO THE CONSOLIDATED FINANCIAL STATEMENTS
1. Corporate Mandate
Export Development Canada (the “Corporation” or “EDC”) was established on October 1, 1969 by the Export Development Act (the “Act”), a statute of the Parliament of Canada. The Budget Implementation Act, 2009 amended the Act to expand the mandate of the Corporation for a two-year period to include domestic activities, in addition to its traditional mandate related to export trade, and the regulations governing its domestic financing and insurance activities were suspended. In March 2011, the Government, by way of Order in Council, extended the period to March 12, 2012. The Corporation is named in Part I of Schedule III to the Financial Administration Act (the “FA Act”) and is accountable for its affairs to Parliament through the Minister of International Trade (the “Minister”).
In September 2008, EDC, together with other federal Crown corporations, was given a directive (PC 2008-1598) pursuant to Section 89 of the FA Act, entitled Order giving a direction to parent Crown corporations involved in commercial lending to give due consideration to the personal integrity of those they lend to or provide benefits to, in accordance with the Federal Government’s policy to improve the accountability and integrity of federal institutions. The Corporation has, since, implemented the Directive and the President and Chief Executive Officer of EDC has notified the Minister in accordance with Subsection 89(6) of the FA Act.
The Government of Canada is the sole shareholder of Export Development Canada.
We incorporated Exinvest Inc. as a wholly-owned subsidiary (the “Subsidiary”) under the Canada Business Corporations Act in 1995.
Our earnings and those of our Subsidiary are not subject to the requirements of the Income Tax Act.
We are subject to a limit imposed by the Act on our contingent liability arrangements. The Act specifies that the limit applies to the principal amount owing under all outstanding arrangements which have the effect of providing, to any person, any insurance, reinsurance, indemnity or guarantee. This limit shall at no time exceed the greater of an amount equal to 10 times our authorized capital, and $45.0 billion which amount may be varied in an Appropriation Act. At the end of December 2011, the amount of these contingent liabilities was $29.0 billion (2010 – $25.7 billion).
We are for all purposes an agent of Her Majesty in right of Canada. As a result, all obligations under debt instruments we issue are obligations of Canada. The Act allows us to borrow and have outstanding borrowings up to a maximum of 15 times the aggregate of (a) our current paid-in capital and (b) our retained earnings determined in accordance with the previous year’s audited financial statements (refer to Note 42 for further details). The maximum applicable to December 31, 2011 is $122.7 billion (2010 – $99.8 billion), against which borrowings amounted to $23.6 billion (2010 – $22.5 billion).
2. Summary of Significant Accounting Policies
BASIS OF PRESENTATION
Our consolidated financial statements have been prepared in accordance with International Financial Reporting Standards (IFRS). The significant accounting policies used in the preparation of these consolidated financial statements are summarized on the following pages and conform in all material respects to IFRS.
CHANGE IN ACCOUNTING STANDARDS
Effective January 1, 2011, the Canadian Institute of Chartered Accountants (CICA) adopted International Financial Reporting Standards (IFRS). These financial statements reflect our adoption of IFRS, including comparative figures which have been restated to conform to these new standards. The impact to EDC of our transition to IFRS is outlined in Note 42.
BASIS OF CONSOLIDATION
Our consolidated financial statements include the assets, liabilities, results of operations and cash flows of our wholly-owned subsidiary and those special purpose entities consolidated under Standing Interpretations Committee (SIC) 12 Consolidation – Special Purpose Entities. Intercompany transactions and balances have been eliminated. We report our interests in jointly controlled entities using the equity method.
USE OF JUDGMENT, ESTIMATES AND ASSUMPTIONS
To prepare our financial statements in accordance with IFRS, it is necessary for management to exercise judgment and make use of estimates and assumptions, in applying certain accounting policies. We utilize current market data, our own historical experience and other information available to us as at the date of the financial statements in arriving at our decisions. We have established procedures to ensure that the process for determining our estimates and assumptions is well controlled, and occurs in an appropriate and systematic manner.
88 | BUILDING RESILIENCE IN UNCERTAIN TIMES
Uncertainty is inherent in the use of estimates and assumptions and as a result, actual results may vary significantly from management’s estimates. Uncertainty arises, in part, from the use of historical experience and data at a point in time to establish our assumptions. While this data may be the most reliable basis available on which to base our assumptions, economic events may occur subsequently that render previous assumptions invalid and cause a material change to actual results.
Areas where management has exercised judgment and made significant use of estimates and assumptions are discussed below.
NOTE 6 – ALLOWANCE FOR LOSSES ON LOANS, LOAN COMMITMENTS AND GUARANTEES
The allowance for losses on loans, loan commitments and guarantees represents management’s best estimate of probable credit losses. Management determines the allowances through the use of judgment and various assumptions based on its assessment of the impact of recent events and changes in economic conditions and trends. These estimates are reviewed periodically during the year and in detail as at the date of the financial statements.
The purpose of the collective allowance is to provide an estimate of probable incurred losses inherent in the loan portfolio that have not been identified on an individual loan basis. Management judgment is required with respect to assessment of probabilities of default, loss severity in the event of default, review of credit quality for internally rated obligors and the value of any collateral. Management also considers the impact of economic events, industry trends and risk concentrations on the portfolio and the required allowance.
Allowances are established on an individual basis for loans, commitments and guarantees that management has determined to be impaired and/or for which losses have been incurred. When an obligor is considered impaired, we reduce the carrying value of the loan to its net realizable value. Management is required to make a number of estimates including the timing and amount of future cash flows, residual values of underlying security, as well as the initial judgment as to whether the loan is impaired or performing.
NOTE 8 – EQUIPMENT AVAILABLE FOR LEASE
When aircraft are returned to us as a result of default under the related obligors’ loan agreements, we determine their fair value using market values obtained from an independent appraiser supplemented by additional current market data and other information available to us. Judgment is involved in allocating the resulting fair value between the components of the aircraft and in establishing the remaining useful life of the components.
We review the aircraft in our leasing portfolio for impairment quarterly. Judgment as to the impact of current economic events, trends or other circumstances on the viability of our aircraft is required in determining whether impairment has occurred or has been reversed within our portfolio. If an event is judged to have impacted the carrying value of our portfolio, estimates and assumptions surrounding the recoverable amount of the aircraft are made. These include the current fair value of the aircraft; estimated cash flows to be generated from the use of the aircraft; projected future rentals and lease rates; and estimated costs to sell the aircraft.
NOTE 10 – RECOVERABLE INSURANCE CLAIMS
When an insurance claim is paid, management estimates any future recovery and records it within recoverable insurance claims. The estimation process is dependent upon our assessment of the future cash flows to be realized through collection efforts made by EDC, the policyholder or collection agencies. The estimated recoverable amount is reviewed and adjusted on a monthly basis.
NOTE 19 – POLICY AND CLAIMS LIABILITIES
The policy and claims liabilities are based on our estimate of future claims under the terms and conditions of our insurance policies. The actuarial valuation uses simulation techniques and is based on assumptions relevant to the insurance programs and is derived in conjunction with our own experience. Management judgment is required in estimating the variables that are part of the actuarial calculation of the policy and claims liabilities. These variables include severity of loss, loss development, frequency of claim and discount rates used. Management judgment is also used in selecting the confidence level for adverse deviation.
NOTE 28 – FINANCIAL INSTRUMENTS MEASURED AT FAIR VALUE
The majority of financial instruments are recognized on our statement of financial position at their fair value. These financial instruments include marketable securities at fair value through profit or loss, derivative instruments, equity financing at fair value through profit or loss, and loans payable designated at fair value through profit or loss. Fair value is defined as the amount for which a financial asset could be exchanged, or a liability settled, between knowledgeable, willing parties in an arm’s length transaction.
Our financial instruments are categorized into one of three levels based on whether the techniques employed to value the instruments use observable or unobservable market inputs. Financial instruments categorized as Level 1 are valued using quoted market prices, thus minimal judgment or estimates are required. Those instruments categorized as Level 2 and 3 require the use of increasing levels of judgment and assumptions, including the selection of appropriate discount rates, yield curves and other inputs into our models. Refer to Note 28 for additional details on the techniques used to value our financial instruments.
EDC ANNUAL REPORT 2011 | 89
CONSOLIDATED FINANCIAL STATEMENTS
NOTE 39 – RETIREMENT BENEFIT OBLIGATIONS
EDC maintains defined benefit pension plans and other benefit plans. IFRS requires that management measure the plans’ defined benefit obligations and annual costs using assumptions that are long-term in nature and reflect our best judgment and estimates. We review key assumptions on an annual basis with our actuaries using relevant experience, in conjunction with market related data. The key assumptions include expected long-term rate of return on plan assets, rate of compensation increase, the discount rate and the longevity of plan members.
The management assumption with the greatest potential impact on our defined benefit obligation is the discount rate. The discount rate is determined by reference to the yield of a portfolio of high quality fixed income instruments (rated AA or higher), which has the same duration as the plan’s defined benefit obligation.
MARKETABLE SECURITIES
We hold marketable securities for liquidity purposes. The size and nature of our marketable securities portfolio is governed by Board approved policies. Our marketable securities are held with creditworthy counterparties that must have a minimum credit rating from an external credit rating agency of A- for all transactions.
Marketable securities held directly by EDC are recorded at fair value through profit or loss to reflect our business model for managing these instruments. We measure performance for this portfolio against appropriate benchmarks. Purchases and sales of these investments are recorded on the trade date and the transaction costs are expensed as incurred. Interest revenue is recorded in investment revenue. Realized and unrealized gains and losses on these securities are included in other income (expenses).
Marketable securities held by our subsidiary are carried at amortized cost, as the business model for managing these instruments is to collect contractual cash flows which represent the payment of principal and interest. Upon initial recognition the securities are recorded at their fair value plus any transaction costs. Subsequently they are carried at amortized cost using the effective interest method, less any impairment losses. Interest revenue is recorded in investment revenue.
LOANS RECEIVABLE
Loans receivable are recorded at fair value upon initial recognition and subsequently measured at amortized cost using the effective interest method. Our loans receivable are held in order to collect contractual cash flows which represent payments of principal, interest and fees. They are derecognized when the rights to receive cash flows have expired or we have transferred substantially all the risks and rewards of ownership.
The effective interest method is a method of calculating the amortized cost of a financial asset and of allocating the interest income over the relevant period. The effective interest rate is the rate that exactly discounts estimated future cash payments or receipts through the expected life of the financial instrument or, when appropriate, a shorter period, to the net carrying amount of the financial asset. When calculating the effective interest rate, we estimate cash flows considering all contractual terms of the financial instrument (for example, prepayment options) but do not consider future credit losses. The calculation includes all fees paid or received that are an integral part of the effective interest rate, transaction costs and all other premiums or discounts.
While it is generally our intention to hold performing loan assets until maturity, in some cases the loans are sold prior to maturity for risk mitigation purposes. Gains and losses on the sale of performing loans and gains on the sale of impaired loans are included in other income (expenses). Losses on sales of impaired loans are reported in the provision for credit losses.
LOAN GUARANTEES
In the ordinary course of business we issue loan guarantees to cover non-payment of principal, interest and fees due to banks and financial institutions providing loans to buyers of Canadian goods and services. Loan guarantees are initially recognized in the financial statements at fair value in the liability for loan guarantees. Fair value is determined to be the premium received. Subsequent to initial recognition, our liability is measured at the higher of the unamortized premiums and the allowance calculated that estimates the loss that is expected to be incurred as a result of satisfying our obligation under that guarantee.
Any increase in liability relating to loan guarantees is recorded in the statement of comprehensive income in the provision for credit losses. Guarantee fees received up-front are recognized in the statement of comprehensive income on a straight-line basis over the life of the guarantee. Guarantee fees that are received in arrears are recognized in the statement of comprehensive income on an accrual basis.
LOAN REVENUE
Loan revenue is recognized in financing and investment revenue in the statement of comprehensive income using the effective interest method.
90 | BUILDING RESILIENCE IN UNCERTAIN TIMES
IMPAIRMENT OF FINANCIAL INSTRUMENTS
MARKETABLE SECURITIES
At the end of each reporting period, for marketable securities at amortized cost, an impairment loss is recognized when there is objective evidence that there has been a deterioration of credit quality subsequent to the initial recognition of the security to the extent that we no longer have reasonable assurance as to the timely collection of the full amount of the principal and interest. The impairment loss is measured as the difference between the asset’s carrying amount and the present value of estimated future cash flows discounted at the asset’s original effective interest rate.
LOANS RECEIVABLE
Loans that have been individually assessed to be impaired meet one or more of the following criteria which represent objective evidence of impairment:
| | u | there has been a deterioration in credit quality to the extent that there is no longer reasonable assurance of the timely collection of the full amount of principal and interest; or |
| | u | for commercial loans, when there are payments overdue of 90 days or more, unless the loan is fully secured or collection efforts are reasonably expected to result in repayment of debt. |
If there is objective evidence that an impairment loss has occurred on an individual loan, the amount of the loss is measured as the difference between the loan’s carrying amount and the present value of any estimated future cash flows discounted at the loan’s original effective interest rate. The principal portion of the carrying amount of the loan is reduced through the use of an individual allowance and any accrued unpaid contractual interest and other receivables that form part of the carrying value of the loan are reduced to zero through income.
Thereafter, interest income on individually impaired loans is recognized based on the reduced carrying value of the loan using the original effective interest rate of the loan.
When a loan is uncollectible, it is written off against the individual allowance. Such loans are written off when all collection methods have been exhausted and no further prospect of recovery is likely.
Loans are returned to performing status when it is likely that contractual payments will continue pursuant to the terms of the loan. When restructured loans containing concessions are returned to performing status, their carrying value is adjusted to reflect the original yield of the loan or the weighted average yield in the case of loan consolidations.
INDIVIDUALLY IMPAIRED SOVEREIGN LOANS
In compliance with the terms of Paris Club rescheduling agreements, contractual interest maturities for individually impaired sovereign loans are included in gross loans receivable. The Paris Club is an international forum of sovereign creditors, including Canada, who agree to formally reschedule a sovereign borrower’s debt when they are experiencing financial difficulties and are unable to meet their obligations.
Sovereign loans undergoing debt rescheduling are classified as individually impaired. The resulting agreements provide for the consolidation and deferred repayment of principal and interest maturities at concessional interest rates. While impaired, we reduce the loan’s carrying value by the impact of the interest rescheduled which is included in deferred revenue and other credits in Notes 4 and 5. At the time the loan is returned to performing status, the carrying value of the loan is adjusted to reflect the original yield of the loan.
LOAN GUARANTEES
Loan guarantees with impaired obligors are identified using the same criteria on the underlying loan as used to assess the impairment of direct loans carried at amortized cost. When the underlying loan is individually assessed to be impaired, it is probable that a call on the guarantee will be made representing an outflow of economic benefits that would be required to settle our obligation under the guarantee. The amount of any credit loss and any subsequent changes due to the re-evaluation of the obligation are recognized in the statement of comprehensive income as part of the provision for credit losses.
ALLOWANCE FOR LOSSES ON LOANS, LOAN COMMITMENTS AND LOAN GUARANTEES
The allowance for losses on loans, loan commitments and loan guarantees represents management’s best estimate of probable credit losses and is based on the incurred loss model. The allowance is determined based on a review of all loans, loan guarantees and commitments and includes both individual and collective allowances.
ALLOWANCES ON INDIVIDUALLY IMPAIRED LOANS
As discussed above, if there is objective evidence that an impairment loss has occurred on an individual loan, the principal portion of the carrying amount of the loan is reduced through the use of an individual allowance. The individual allowance is the difference between the carrying value of the loan and the present value of the estimated future cash flows discounted at the loan’s original effective interest rate. The calculation of the present value of the estimated future cash flows of a collateralized loan asset reflects the cash flows that are expected to result on foreclosure less costs to obtain and sell the collateral whether or not foreclosure is probable.
EDC ANNUAL REPORT 2011 | 91
CONSOLIDATED FINANCIAL STATEMENTS
If, in a subsequent period, the amount of the impairment loss either increases or decreases and the change can be related objectively to an event occurring after the impairment was recognized (such as a change in the obligor’s financial position or a change in the estimate of future cash flows), the previously recognized impairment loss is adjusted through the individual allowance.
The amount of initial impairment loss and any subsequent changes due to the re-evaluation of estimated future cash flows are recognized in the statement of comprehensive income as part of the provision for credit losses.
COLLECTIVE ALLOWANCE
A collective allowance is established for losses which we estimate to have occurred, but have not yet been individually identified within our portfolio. Loans and loan guarantees not found to be individually impaired, as well as loan commitments are included in the collective assessment. The assessment is based on events that have occurred as of the reporting date and include factors such as business cycle trends and the fair value of collateral. The collective allowance is comprised of a base allowance, calculated using counterparty credit ratings, exposure, loss severity and probability of default factors. The collective allowance may also include concentration and market overlays.
For the base allowance we group our commercial performing loans, loan commitments and loan guarantees by industry of risk and then by secured and unsecured exposures. Sovereign exposures are classified into one portfolio. We assign credit ratings to our commercial and sovereign obligors using a system of fifteen credit ratings (AA to Watchlist) which are consistent with ratings used by our credit risk management policies. For secured portfolios, the exposure for each obligor is reduced by the fair value of collateral adjusted for estimated repossession costs. Based on these exposures we determine the appropriate base allowance. Loss severity is determined based on historical loan loss rates and by management estimates for each of our exposure categories and default rates are based on a weighted average of Moody’s and Standard & Poor’s default tables.
We have a number of significant single name counterparty concentrations as a result of our mandate. A counterparty concentration overlay is established for counterparties whose exposure is deemed by management to represent an increased amount of risk. This overlay is applied to counterparties whose exposure exceeds 10% of our equity determined in accordance with the previous year’s audited financial statements.
We determine the collective allowance using various assumptions based upon current counterparty credit ratings. We also assess the extent to which these ratings do not reflect recent economic events that may result in credit deterioration. In these cases we will estimate the potential impact on our allowances and apply market overlays to specific industries or other exposure categories that we deem appropriate.
The collective allowances for performing loans and individual allowances for impaired loans are shown as a reduction to loans receivable on the statement of financial position. Collective and individual allowances for loan commitments and loan guarantees are shown as liabilities on the statement of financial position.
FORECLOSED ASSETS
Assets that are returned to us1 because of default under loan agreements are classified as held-for-use or held-for-sale according to management’s intention. Those classified as held-for-use are included in equipment available for lease or reclassified as finance leases. Assets classified as held-for-use are initially recorded at fair value and subsequently recorded at cost less accumulated depreciation and impairment losses. Those initially classified as held-for-sale are recorded at fair value less costs to sell and included in other assets. Any write-downs at recognition are reported in the provision for credit losses and any gains are recorded in other income (expenses). We determine fair value based on market prices obtained from an independent appraiser along with current market data and other information available to us.
EQUITY FINANCING
Equity financing investments are comprised of direct investments that we have made in private and public companies and investments in private equity funds. Purchases and sales of these investments are recorded on a trade-date basis and are measured at fair value. Subsequent changes in fair value and any realized gains and losses are recorded in other income (expenses). Transaction costs are expensed as incurred, and equity investment revenue is included within other income (expenses).
EQUIPMENT AVAILABLE FOR LEASE
Equipment available for lease consists of aircraft that were returned to us because of default under the related obligors’ loan agreements. While we do not in the ordinary course of business act as a lessor, from time to time we may engage in leasing activities for asset management purposes to maximize recoveries on returned aircraft and minimize potential losses.
Equipment available for lease is accounted for using the cost model, and is stated at cost less accumulated depreciation and impairment losses. Upon initial recognition of the asset, engines are treated as a separate component and are depreciated on a straight-line basis over their remaining useful life net of their residual value. The remaining useful lives of the engines range from one to seven years. The remaining components of the aircraft are grouped together and depreciation is calculated on a straight-line basis over the remaining useful life of the
| 1 | All aircraft returned to us for which the equity interest in the leveraged lease structure has been foreclosed have been registered with a number of trusts of which we are exposed, or have rights, to variable returns from our involvement with a Special Purpose Entity (SPE) and have the ability to affect those returns through our decision-making power over the SPE. |
92 | BUILDING RESILIENCE IN UNCERTAIN TIMES
aircraft after consideration of any residual value. The remaining useful lives of the aircraft range from one to seven years. Residual values of the aircraft and engines are reviewed on an annual basis. The costs of subsequent major overhauls are capitalized and amortized over the period to the next overhaul, from one to six years.
Depreciation as well as insurance and other costs related to the equipment available for lease are included in leasing and financing related expenses. Lease set-up costs are capitalized as part of the carrying value of the aircraft and amortized over a period equaling the term of the specific lease. Operating lease revenue is recognized on a straight-line basis over the terms of the underlying leases.
A review for impairment of equipment available for lease is performed quarterly. When events or changes in circumstances indicate that an aircraft may be impaired, or that a previously recorded impairment loss may no longer exist or may have increased or decreased, the recoverable amount of the asset is estimated.
An aircraft is impaired when its carrying amount exceeds its recoverable amount. The recoverable amount is the higher of the fair value less costs to sell and the value in use. Fair value is determined by considering market data and other information available to us. The value in use is the present value of the cash flows expected to result from the aircraft’s use and eventual disposition. Current lease rentals, as well as market information on projected future rentals and fair values, form the basis of this calculation.
The amount of the impairment loss recognized is calculated as the difference between the carrying amount of the asset and its recoverable amount. When there is a reversal of impairment loss, the carrying amount of the aircraft is increased to the lower of the recoverable amount and the carrying amount that the aircraft would have had if the previous impairment loss had not been recognized. In both cases, the adjustment to the carrying value of the aircraft is recorded in other income (expenses).
FINANCE LEASES
Leases in which substantially all the risks and rewards of ownership are transferred are classified as finance leases. We have two types of finance leases – aircraft under finance leases and building under finance lease.
Aircraft under finance leases relate to aircraft that were returned to us due to default under the related obligor’s loan agreements and were subsequently placed back with the obligor under long-term, financing leases. These leases are recorded on the statement of financial position at the aggregate future minimum lease payments plus estimated residual values less unearned finance income. Residual values are based on independent appraisals and are reviewed periodically. An allowance for impairment is calculated consistent with the methodology used for our secured loan portfolio which is described on the previous page.
Finance lease revenue is recognized in a manner that produces a constant rate of return on the investment in the lease.
Our head office building has been classified as a finance lease. The building has been recorded on our statement of financial position at its estimated fair value at the inception of the lease. Lease payments are allocated between finance charges and repayment of the obligation under finance lease to achieve a constant rate of interest on the remaining balance of the obligation. The leased building is being depreciated over the most likely lease term. The estimated lease period is reviewed periodically.
Finance charges and depreciation expense on the building are recorded as accommodation costs within administrative expenses in the statement of comprehensive income.
PROPERTY, PLANT AND EQUIPMENT
Property, plant and equipment are carried at cost less accumulated depreciation and impairment losses. Depreciation is charged on a straight-line basis over the estimated useful lives of the assets or the term of the relevant lease. The estimated useful lives and depreciation methods are reviewed at the end of each year, with the effect of any changes in estimate being accounted for on a prospective basis. The useful life used in the calculation of depreciation for furniture and equipment is five years and three years for computer hardware. Leasehold improvements are depreciated over the shorter of the term of the respective lease or the useful economic life of the leasehold improvement. Depreciation is recorded in administrative expenses.
The gain or loss arising on the disposal or retirement of an item of property, plant and equipment is determined as the difference between the sale proceeds and the carrying amount of the asset, and is recognized in other income (expenses).
INTANGIBLE ASSETS
Intangible assets represent internally generated and purchased computer software. They are carried at cost less accumulated amortization and impairment losses. Amortization is charged on a straight-line basis over the estimated useful lives of the intangible assets. The estimated useful lives and amortization methods are reviewed at the end of each year, with the effect of any changes in estimate being accounted for on a prospective basis. The useful life used in the calculation of amortization for internally developed software and computer software is five years. Amortization is recorded in administrative expenses.
EDC ANNUAL REPORT 2011 | 93
CONSOLIDATED FINANCIAL STATEMENTS
INSURANCE PREMIUMS
Insurance contracts are those contracts where we have accepted significant insurance risk from the policyholders by agreeing to compensate the policyholders if a specified uncertain future event adversely affects the policyholders.
Premiums on insurance policies are deferred and recognized in income over the term of the policy on a straight-line basis.
RECOVERABLE INSURANCE CLAIMS
Recoverable insurance claims represent the portion of insurance claims paid that are expected to be recovered. Recoverable insurance claims are reviewed and adjusted on a monthly basis with any subsequent net gain or loss on recovery credited or charged to claims-related expenses.
POLICY AND CLAIMS LIABILITIES
Policy and claims liabilities represent our estimate of future claims under the terms and conditions of our insurance policies. An actuarial valuation, which conforms to the recommendations of the Canadian Institute of Actuaries, is performed to establish our liability. The valuation uses simulation techniques and assumptions derived from our own experience (severity of loss, loss development, frequency of claim, and discount rates used) relevant to our insurance programs. The liability is comprised of reported claims, incurred but not reported claims, and management’s best estimate of the net present value of net future claims under existing policies.
Deferred insurance premiums are the portion of premiums received on policies written that relate to risk periods after the current fiscal year. To the extent that our deferred premiums are not sufficient to cover our liability, an allowance is established. Any adjustments to the liability are reflected in claims-related expenses in the period in which they become known. Future developments may result in claims which are materially different than the allowance provided.
Policy and claims liabilities on our consolidated statement of financial position include both the deferred premiums and the allowance.
REINSURANCE
In the ordinary course of business, we assume and cede reinsurance with other insurance companies. We cede reinsurance to mitigate our risk. The ceding arrangements provide greater diversification of the business and minimize the net loss potential arising from large risks. Ceded reinsurance contracts do not relieve us of our obligations to the insured but they do provide for the recovery of claims arising from the liabilities ceded. We also assume reinsurance and thereby take on risk. Reinsurance premiums, unearned premiums ceded to reinsurers and recoveries and estimates of recoveries on claims are recorded in the same manner as if the reinsurance were considered direct business. Amounts recoverable from the reinsurers are estimated in a manner consistent with the claims liability associated with the reinsured policy and are recorded within reinsurers’ share of policy and claims liabilities. Reinsurance assets or liabilities are derecognized when the contractual rights are extinguished or expire.
Reinsurance assets are reviewed for impairment at each reporting date or more frequently when an indication of impairment arises during the reporting year. Impairment occurs when there is objective evidence as a result of an event that occurred after initial recognition of the reinsurance asset that EDC may not receive all outstanding amounts due under the terms of the contract and the event has a reliably measurable impact on the amounts that EDC will receive from the reinsurer.
DEFERRED REVENUE
Deferred loan revenue, which consists of exposure, administration, and other upfront loan fees, is included in loans receivable and amortized as a yield increment over the term of the related loan. Guarantee fee revenue and insurance premium revenue are recognized as deferred revenue and are amortized over the term of the related guarantee or insurance policy.
DERIVATIVE FINANCIAL INSTRUMENTS
Derivative financial instruments (derivatives) are financial contracts that derive their value from underlying changes in interest rates, foreign exchange rates, equities, credit spreads or other financial measures. Derivatives that we currently use include interest rate swaps, cross currency interest rate swaps, foreign exchange swaps, foreign exchange forwards, non-deliverable forwards, non-deliverable foreign exchange swaps and credit derivatives.
We use derivatives to manage interest rate risk, foreign exchange risk, and credit risk. These derivatives are only contracted with creditworthy counterparties in accordance with policies established by our Risk Management Office and approved by our Board of Directors.
We do not apply hedge accounting to our derivatives. Derivatives are accounted for at fair value and are recognized on the statement of financial position upon the trade date and are removed from the statement of financial position when they expire or are terminated. Derivatives with a positive fair value are reported as derivative instruments within assets, while derivatives with a negative fair value are reported as derivative instruments within liabilities. Realized and unrealized gains or losses due to a change in fair value of derivatives associated with our long and short-term loans payable and those associated with our marketable securities are recorded in other income (expenses). Realized and unrealized gains and losses due to changes in fair value of credit default swaps are also included in other income (expenses).
We also hold a portfolio of derivatives which we use to manage the foreign exchange risk associated with our operations being largely denominated in U.S. dollars. All income and expenses associated with this portfolio are included in interest expense, while realized and unrealized gains and losses are recorded in other income (expenses).
94 | BUILDING RESILIENCE IN UNCERTAIN TIMES
Long-term currency swaps are considered part of the financing cash flows on the consolidated statement of cash flows because these swaps are used to manage our funding. We often issue debt in currencies which offer a more advantageous cost. We then use currency swaps to bring those funds into the currency required to disburse on our loans. All other swaps are included in operating cash flows as they are used to alter the interest rate risk profile of the portfolio.
LOANS PAYABLE
We have designated the majority of our debt, including structured debt, at fair value through profit or loss in order to obtain the same accounting treatment as the related derivatives. In general, these derivatives are transacted to manage interest and foreign exchange rate risk on the related debt. Contractual interest on our long-term debt and commercial paper is recorded in interest expense. Any change in fair value on these instruments is recorded in other income (expenses).
Our fixed rate bonds which do not have derivatives associated with them are carried at amortized cost using the effective interest rate method with interest recorded in interest expense.
The transaction costs related to our loans payable carried at amortized cost are capitalized. The transaction costs related to our loans payable designated at fair value through profit or loss are expensed as they are incurred and are included within interest expense.
Any fair value gains or losses on initial recognition of our debt or derivatives at Level 3 on the fair value hierarchy are deferred and amortized over the life of the instruments.
ACCOUNTS PAYABLE
Accounts payable and other credits are carried at amortized cost.
TRANSLATION OF FOREIGN CURRENCY
All monetary assets and liabilities denominated in foreign currencies are translated into Canadian dollars at exchange rates prevailing at the end of the year. Income and expenses are translated at either daily or monthly average exchange rates in effect during the year. Exchange gains and losses resulting from the translation of foreign currency balances and transactions are included in other income (expenses).
RETIREMENT BENEFIT OBLIGATIONS
We maintain defined benefit pension plans and other post-retirement benefit plans including a retiring allowance plan and life insurance, health and dental care benefits.
The accrued benefit obligations are actuarially determined using the projected unit credit method (which incorporates management’s best estimate of future salary levels, retirement ages of employees and other actuarial factors).
Pension fund assets are valued at fair value for the purpose of calculating the expected return on plan assets.
The defined benefit expense (included in administrative expenses) consists of the actuarially determined retirement benefits for the current year’s service, imputed interest on projected benefit obligations net of interest earned on any plan assets and the amortization of actuarial gains or losses and other items over the average remaining working lives of employees expected to receive benefits under the plans.
Actuarial gains or losses arise from the difference between the actual rate of return and the expected rate of return on plan assets for that period and from changes in actuarial assumptions used to determine the accrued benefit obligation. They are amortized on a straight-line basis over the average remaining working lives of employees expected to receive benefits under the plans only if the net actuarial gain or loss at the beginning of the year is in excess of 10% of the greater of the accrued benefit obligation and the fair value of plan assets. Amounts below the 10% threshold are not recognized in income.
EARLY ADOPTION OF IFRS
IFRS 9 – FINANCIAL INSTRUMENTS
The International Accounting Standards Board (IASB) has undertaken a project to replace IAS 39 — Financial Instruments: Recognition and Measurement with the objective of simplifying the recognition and measurement requirements for financial instruments.
The first phase of this project has been completed and IFRS 9 — Financial Instruments, which addresses the classification and measurement of financial instruments, was issued in October 2010. The effective date of the new standard is January 1, 2015 however, we have elected to early adopt IFRS 9, as part of our first-time adoption of IFRS on January 1, 2011. The revised standard included changes that impact our marketable securities portfolio; our equity financing portfolio and our liabilities designated at fair value through profit or loss. The impact of early adopting this standard has been included in our opening equity adjustment.
Marketable Securities
IFRS 9 reduces the number of classifications of financial instruments to two – (1) measured at amortized cost and (2) fair value through profit or loss. The classification of an instrument depends upon the entity’s business model for managing its financial instruments and the characteristics of their contractual cash flows.
EDC ANNUAL REPORT 2011 | 95
CONSOLIDATED FINANCIAL STATEMENTS
We elected to early adopt this standard which enables us to present the gains and losses on all of our marketable securities within net income. Under previous Canadian generally accepted accounting principles (GAAP) the unrealized fair value gains and losses on our available-for-sale (AFS) investments were recorded within other comprehensive income.
The AFS investments held directly by EDC did not meet the criteria under IFRS 9 to be classified at amortized cost and thus have been reclassified from AFS to fair value through profit or loss. As of January 1, 2010 we held $706 million of these investments. The cumulative unrealized fair value gains of $12 million that were within other comprehensive income on our date of transition were included in our opening equity adjustment. Going forward, the unrealized fair value gains and losses are now recorded in net income.
The AFS investments held by our subsidiary Exinvest, which amounted to $20 million as of January 1, 2010, met the criteria under IFRS 9 to be classified at amortized cost. These investments were recorded at amortized cost on the date of transition to IFRS and are subsequently being carried at amortized cost using the effective interest method. Due to the short term nature of the investments, the difference between their previous carrying amount and their carrying amount under IFRS 9 was not significant.
Equity Financing Portfolio
Under previous Canadian GAAP we designated our equity financing portfolio as held-for-trading and carried the investments at fair value to be consistent with how the portfolio is managed. Under IFRS 9, these investments do not meet the criteria to be recorded at amortized cost and thus will continue to be carried at fair value with fair value gains and losses recorded in net income. The new standard provides that at initial recognition, an entity may make an irrevocable election to present subsequent changes in the fair value of an equity instrument that is not held-for-trading in other comprehensive income. Within our current portfolio, we have not made this election for any of our investments.
Liabilities Designated at Fair Value through Profit or Loss
The guidance included in IAS 39 related to the recognition and measurement of financial liabilities was substantially replicated into IFRS 9, except for the treatment of fair value gains and losses on those liabilities an entity has designated at fair value through profit or loss. Under previous Canadian GAAP, the entire change in fair value of a financial liability designated at fair value through profit or loss was included within net income, while under IFRS 9 the portion of the change in fair value related to changes in an entity’s own credit risk is calculated and recorded in other comprehensive income.
We have concluded that the changes in fair value of our debt designated at fair value through profit or loss are mainly due to market factors such as changes in interest and foreign exchange rates and not due to changes in our own credit risk. EDC is an agent of the Government of Canada, and as such our debt obligations are obligations of Canada and thus are backed by the full faith and credit of the Government of Canada. Therefore, there is no significant change in value that can be attributed to changes in our own credit risk. As a result, the entire change in fair value on our debt instruments will continue to be recorded within net income. Should ours or the government’s credit rating change, we would then record the impact of this change on the fair value of our debt within other comprehensive income.
Summary of changes in classification of financial instruments:
| | | | |
Financial instruments | | Previous Canadian GAAP | | IFRS 9 |
Marketable securities held by EDC | | Available-for-sale or held-for-trading | | Financial assets at fair value through profit or loss |
Marketable securities held by Exinvest | | Available-for-sale | | Financial assets at amortized cost |
| | | | | |
Equity financing portfolio | | Designated as held-for-trading | | Financial assets at fair value through profit or loss |
Loans payable | | Designated as held-for-trading | | Designated at fair value through profit or loss |
FUTURE ACCOUNTING CHANGES
A number of new standards, interpretations, amendments and improvements have been recently issued by the International Accounting Standards Board. The standards that are relevant to EDC are listed below. Except as indicated, the standards are effective for annual periods beginning on or after January 1, 2013.
New standards include:
| | u | IFRS 10 – Consolidated Financial Statements – provides a new definition of control that focuses on whether the investor is exposed or has rights, to variable returns from its involvement with the investee and also has the ability to affect the returns through its power over the investee. |
| | u | IFRS 11 – Joint Arrangements – focuses on the rights and obligations of an arrangement, rather than its legal form in determining whether a joint operation or joint venture exists. With this new standard the equity method must be used to account for all joint ventures. |
| | u | IFRS 12 – Disclosure of Interest in Other Entities – outlines the disclosure requirements for all forms of interests in other entities, both on and off the balance sheet. |
| | u | IFRS 13 – Fair Value Measurement – provides a consistent definition of fair value; guidance on how it should be measured; and disclosure requirements for use across all IFRSs. |
96 | BUILDING RESILIENCE IN UNCERTAIN TIMES
Amended standards include:
| | u | IAS 1 – Presentation of Financial Statements – amendments to revise the way other comprehensive income is presented. Effective for annual periods beginning on or after July 1, 2012. |
| | u | IAS 19 – Employee Benefits – the standard has been amended to remove the option to use the corridor method to defer gains and losses; requires that the impact of remeasuring pension assets and liabilities be recorded in other comprehensive income; and provides enhanced disclosure requirements for defined benefit plans. |
| | u | IAS 27 – Separate Financial Statements – this standard has been renamed and amended to maintain the accounting guidance on issuing separate financial statements. |
| | u | IAS 28 – Investments in Associates and Joint Ventures – amended as a consequence of the new standard on joint arrangements. |
We are assessing the impact of these new and amended standards on our financial statements.
3. Marketable Securities
We maintain liquidity sufficient to meet general operating requirements, to maintain stability in our short-term borrowing program and to provide flexibility in achieving corporate objectives. Consistent with our business model for managing these instruments, they are carried at fair value through profit or loss or at amortized cost.
| | | | | | | | | | | | | | | | | | | | | | | | | | | | |
(in millions of Canadian dollars) | | Dec. 31, 2011 | | | Dec. 31, 2010 | | | Jan. 1, 2010 | |
Issued or guaranteed by: | |
| At fair value
through profit
or loss |
| |
| At amortized
cost |
| | | Total | | |
| At fair value
through profit
or loss |
| |
| At amortized
cost |
| | | Total | | | | Total | |
U.S. government | | | 2,798 | | | | 57 | | | | 2,855 | | | | 2,335 | | | | – | | | | 2,335 | | | | 736 | |
Financial institutions | | | 506 | | | | – | | | | 506 | | | | 779 | | | | – | | | | 779 | | | | 1,834 | |
Other government | | | 217 | | | | – | | | | 217 | | | | 312 | | | | – | | | | 312 | | | | 216 | |
Canadian government* | | | 185 | | | | 19 | | | | 204 | | | | 98 | | | | 19 | | | | 117 | | | | 2,210 | |
Corporate | | | 14 | | | | – | | | | 14 | | | | 136 | | | | – | | | | 136 | | | | 359 | |
Total marketable securities | | | $3,720 | | | | $76 | | | | $3,796 | | | | $3,660 | | | | $19 | | | | $3,679 | | | | $5,355 | |
*Canadian government includes federal and provincial governments, and Crown corporations.
Marketable securities at amortized cost represent $76 million (2010 – $19 million; January 1, 2010 – $20 million) of securities held by our subsidiary Exinvest Inc.
The following table provides a breakdown of our marketable securities by remaining term to maturity.
| | | | | | | | | | | | | | | | | | | | | | | | | | | | | | | | |
(in millions of Canadian dollars) | | Dec. 31, 2011 | | | Dec. 31, 2010 | |
| | | Remaining term to maturity | | | | | | Remaining term to maturity | | | | |
| | | Under
1 year | | | 1 to 3
years | | | Over 3 years | | | Total | | | Under
1 year | | | 1 to 3
years | | | Over 3 years | | | Total | |
At fair value through profit or loss | | | | | | | | | | | | | | | | | | | | | | | | | | | | | | | | |
Short-term instruments | | | 1,690 | | | | – | | | | – | | | | 1,690 | | | | 1,743 | | | | – | | | | – | | | | 1,743 | |
Long-term fixed rate securities | | | 104 | | | | 742 | | | | 1,184 | | | | 2,030 | | | | 17 | | | | 802 | | | | 1,098 | | | | 1,917 | |
Total at fair value through profit or loss | | | 1,794 | | | | 742 | | | | 1,184 | | | | 3,720 | | | | 1,760 | | | | 802 | | | | 1,098 | | | | 3,660 | |
At amortized cost | | | | | | | | | | | | | | | | | | | | | | | | | | | | | | | | |
Short-term instruments | | | – | | | | – | | | | – | | | | – | | | | 19 | | | | – | | | | – | | | | 19 | |
Long-term fixed rate securities | | | – | | | | 38 | | | | 38 | | | | 76 | | | | – | | | | – | | | | – | | | | – | |
Total at amortized cost | | | – | | | | 38 | | | | 38 | | | | 76 | | | | 19 | | | | – | | | | – | | | | 19 | |
Total marketable securities before derivatives | | | 1,794 | | | | 780 | | | | 1,222 | | | | 3,796 | | | | 1,779 | | | | 802 | | | | 1,098 | | | | 3,679 | |
Derivative instruments | | | – | | | | – | | | | – | | | | – | | | | – | | | | – | | | | – | | | | – | |
Total marketable securities including derivatives | | | $1,794 | | | | $780 | | | | $1,222 | | | | $3,796 | | | | $1,779 | | | | $802 | | | | $1,098 | | | | $3,679 | |
EDC ANNUAL REPORT 2011 | 97
CONSOLIDATED FINANCIAL STATEMENTS
| | | | | | | | | | | | | | |
(in millions of Canadian dollars) | | Jan. 1, 2010 |
| | | Remaining term to maturity | | | |
| | | Under 1 year | | | 1 to 3 years | | | Over 3 years | | | Total |
At fair value through profit or loss | | | | | | | | | | | | | | |
Short-term instruments | | | 4,246 | | | | – | | | | – | | | 4,246 |
Long-term fixed rate securities | | | 146 | | | | 419 | | | | 524 | | | 1,089 |
Total at fair value through profit or loss | | | 4,392 | | | | 419 | | | | 524 | | | 5,335 |
At amortized cost | | | | | | | | | | | | | | |
Short-term instruments | | | 20 | | | | – | | | | – | | | 20 |
Total at amortized cost | | | 20 | | | | – | | | | – | | | 20 |
Total marketable securities before derivatives | | | 4,412 | | | | 419 | | | | 524 | | | 5,355 |
Derivative instruments | | | (25 | ) | | | – | | | | – | | | (25) |
Total marketable securities including derivatives | | | $4,387 | | | | $419 | | | | $524 | | | $5,330 |
4. Loans Receivable
The following table presents the various components of loans receivable and the contractual maturity and related contractual effective yields for gross loans receivable. The yields are computed on a weighted average basis by amount and term. Floating rate yields are expressed as spreads over base rates which consist mainly of LIBOR for U.S. dollars and Prime for Canadian dollars.
| | | | | | | | | | | | | | | | | | | | | | | | | | | | | | | | | | | | | | | | |
(in millions of Canadian dollars) | | Dec. 31, 2011 | | | Dec. 31, 2010 | |
| | | Floating $ | | | Spread % | | | Fixed $ | | | Yield to
maturity % | | | Total $ | | | Floating $ | | | Spread % | | | Fixed $ | | | Yield to
maturity % | | | Total $ | |
Performing: | | | | | | | | | | | | | | | | | | | | | | | | | | | | | | | | | | | | | | | | |
Past due | | | 20 | | | | 1.96 | | | | 8 | | | | 6.25 | | | | 28 | | | | 17 | | | | 4.39 | | | | 1 | | | | 7.57 | | | | 18 | |
2011 | | | – | | | | – | | | | – | | | | – | | | | – | | | | 3,278 | | | | 2.12 | | | | 929 | | | | 5.51 | | | | 4,207 | |
2012 | | | 2,807 | | | | 1.86 | | | | 1,034 | | | | 5.30 | | | | 3,841 | | | | 2,803 | | | | 2.40 | | | | 986 | | | | 5.63 | | | | 3,789 | |
2013 | | | 2,554 | | | | 2.04 | | | | 1,010 | | | | 5.44 | | | | 3,564 | | | | 2,636 | | | | 2.06 | | | | 965 | | | | 5.62 | | | | 3,601 | |
2014 | | | 2,977 | | | | 1.99 | | | | 974 | | | | 5.50 | | | | 3,951 | | | | 2,114 | | | | 2.02 | | | | 919 | | | | 5.67 | | | | 3,033 | |
2015 | | | 2,868 | | | | 2.58 | | | | 833 | | | | 5.65 | | | | 3,701 | | | | 1,861 | | | | 2.04 | | | | 783 | | | | 5.79 | | | | 2,644 | |
2016 | | | 2,417 | | | | 2.21 | | | | 729 | | | | 5.57 | | | | 3,146 | | | | 994 | | | | 2.45 | | | | 684 | | | | 5.72 | | | | 1,678 | |
2017–2021 | | | 4,153 | | | | 2.10 | | | | 2,743 | | | | 5.16 | | | | 6,896 | | | | 2,938 | | | | 1.99 | | | | 2,524 | | | | 5.55 | | | | 5,462 | |
2022 and beyond | | | 1,692 | | | | 1.63 | | | | 469 | | | | 4.68 | | | | 2,161 | | | | 1,350 | | | | 1.54 | | | | 505 | | | | 4.97 | | | | 1,855 | |
Performing gross loans receivable | | | 19,488 | | | | 2.03 | | | | 7,800 | | | | 5.20 | | | | 27,288 | | | | 17,991 | | | | 1.96 | | | | 8,296 | | | | 5.51 | | | | 26,287 | |
Impaired (Note 5) | | | 1,033 | | | | 1.76 | | | | 772 | | | | 5.41 | | | | 1,805 | | | | 634 | | | | 1.08 | | | | 76 | | | | 5.55 | | | | 710 | |
Gross loans receivable | | | $20,521 | | | | | | | | $8,572 | | | | | | | | $29,093 | | | | $18,625 | | | | | | | | $8,372 | | | | | | | | $26,997 | |
Accrued interest and fees receivable | | | | | | | | | | | | | | | | | | | 145 | | | | | | | | | | | | | | | | | | | | 163 | |
Deferred loan revenue and other credits | | | | | | | | | | | | | | | | | | | (558 | ) | | | | | | | | | | | | | | | | | | | (549 | ) |
Loans receivable | | | | | | | | | | | | | | | | | | | $28,680 | | | | | | | | | | | | | | | | | | | | $26,611 | |
98 | BUILDING RESILIENCE IN UNCERTAIN TIMES
| | | | | | | | | | | | | | | | | | |
(in millions of Canadian dollars) | | Jan. 1, 2010 |
| | | Floating $ | | | Spread % | | | Fixed $ | | | Yield to
maturity % | | | Total $ |
Performing: | | | | | | | | | | | | | | | | | | |
Past due | | | 12 | | | | 3.92 | | | | 3 | | | | 7.64 | | | 15 |
2010 | | | 3,384 | | | | 2.07 | | | | 882 | | | | 5.62 | | | 4,266 |
2011 | | | 3,197 | | | | 2.29 | | | | 863 | | | | 5.72 | | | 4,060 |
2012 | | | 2,837 | | | | 2.39 | | | | 901 | | | | 5.77 | | | 3,738 |
2013 | | | 2,303 | | | | 1.85 | | | | 869 | | | | 5.74 | | | 3,172 |
2014 | | | 1,650 | | | | 2.26 | | | | 828 | | | | 5.81 | | | 2,478 |
2015 | | | 905 | | | | 2.08 | | | | 688 | | | | 5.96 | | | 1,593 |
2016–2020 | | | 2,068 | | | | 1.99 | | | | 2,523 | | | | 5.84 | | | 4,591 |
2021 and beyond | | | 1,114 | | | | 1.18 | | | | 839 | | | | 5.36 | | | 1,953 |
Performing gross loans receivable | | | 17,470 | | | | 1.89 | | | | 8,396 | | | | 5.72 | | | 25,866 |
Impaired (Note 5) | | | 731 | | | | 1.10 | | | | 193 | | | | 6.24 | | | 924 |
Gross loans receivable | | | $18,201 | | | | | | | | $8,589 | | | | | | | $26,790 |
Accrued interest and fees receivable | | | | | | | | | | | | | | | | | | 175 |
Deferred loan revenue and other credits | | | | | | | | | | | | | | | | | | (488) |
Loans receivable | | | | | | | | | | | | | | | | | | $26,477 |
At the end of December 2011, the floating rate performing gross loans receivable yield was 3.02% (2010 – 2.82%; January 1, 2010 – 2.75%) with an average term to reset of 95 days (2010 – 98 days; January 1, 2010 – 79 days).
Sovereign loans represent 4% of total performing gross loans receivable, consistent with December 31, 2010 and January 1, 2010.
We have country risk concentrations as outlined below.
| | | | | | | | | | | | | | | | | | | | | | | | |
(in millions of Canadian dollars) | | Dec. 31, 2011 | | | Dec. 31, 2010 | | | Jan. 1, 2010 | |
| Country | | Performing gross
loans receivable | | | % | | | Performing gross
loans receivable | | | % | | | Performing gross
loans receivable | | | % | |
United States | | | 8,373 | | | | 31 | | | | 9,724 | | | | 37 | | | | 10,821 | | | | 42 | |
Canada | | | 3,508 | | | | 13 | | | | 2,708 | | | | 10 | | | | 2,962 | | | | 12 | |
Mexico | | | 1,744 | | | | 6 | | | | 1,556 | | | | 6 | | | | 1,339 | | | | 5 | |
India | | | 1,458 | | | | 5 | | | | 1,467 | | | | 6 | | | | 1,236 | | | | 5 | |
Brazil | | | 1,391 | | | | 5 | | | | 924 | | | | 4 | | | | 833 | | | | 3 | |
Chile | | | 959 | | | | 4 | | | | 1,010 | | | | 4 | | | | 921 | | | | 4 | |
United Kingdom | | | 915 | | | | 3 | | | | 894 | | | | 3 | | | | 758 | | | | 3 | |
Qatar | | | 768 | | | | 3 | | | | 680 | | | | 3 | | | | 622 | | | | 2 | |
Australia | | | 730 | | | | 3 | | | | 527 | | | | 2 | | | | 378 | | | | 1 | |
Spain | | | 662 | | | | 2 | | | | 502 | | | | 2 | | | | 337 | | | | 1 | |
Other | | | 6,780 | | | | 25 | | | | 6,295 | | | | 23 | | | | 5,659 | | | | 22 | |
Total | | | $27,288 | | | | 100 | | | | $26,287 | | | | 100 | | | | $25,866 | | | | 100 | |
We have single counterparty performing gross loans receivable totalling $3,210 million with two airlines (2010 – $3,406 million with two airlines; January 1, 2010 – $3,739 million with two airlines) located in the United States and $892 million (2010 – $796 million; January 1, 2010 – nil) with an oil and gas entity located in Mexico. In 2010, we also had single counterparty gross loans receivable with a telecom and media entity totalling $746 million (January 1, 2010 – $785 million).
EDC ANNUAL REPORT 2011 | 99
CONSOLIDATED FINANCIAL STATEMENTS
We sold $139 million in loans to various counterparties in 2011 (2010 – $104 million). This amount includes five performing loans totalling $101 million (2010 – six performing loans totalling $58 million). The performing loans were sold without recourse and the sales resulted in a loss of $2 million (2010 – $9 million).
The breakdown of our gross loans receivable by credit grade is as follows:
| | | | | | | | | | | | | | | | | | | | | | | | |
(in millions of Canadian dollars) | | Dec. 31, 2011 | | | Dec. 31, 2010 | | | Jan. 1, 2010 | |
| | | $ | | | % of total | | | $ | | | % of total | | | $ | | | % of total | |
Investment grade* | | | 11,972 | | | | 41 | | | | 10,777 | | | | 40 | | | | 11,242 | | | | 42 | |
Below investment grade | | | 15,316 | | | | 53 | | | | 15,510 | | | | 57 | | | | 14,624 | | | | 55 | |
Impaired (Note 5) | | | 1,805 | | | | 6 | | | | 710 | | | | 3 | | | | 924 | | | | 3 | |
Total gross loans receivable | | | $29,093 | | | | 100 | | | | $26,997 | | | | 100 | | | | $26,790 | | | | 100 | |
* Investment grade exposure is defined by those obligors with credit ratings of BBB- and above.
A loan payment is considered past due when the obligor has failed to make the payment by the contractual due date. The breakdown of our gross loans receivable that are past due but not impaired is as follows:
| | | | | | | | | | | | |
(in millions of Canadian dollars) | | Dec. 31, 2011 | | | Dec. 31, 2010 | | | Jan. 1, 2010 | |
Less than 30 days | | | 26 | | | | 17 | | | | 14 | |
30 to 180 days | | | 1 | | | | 1 | | | | – | |
Greater than 180 days | | | 1 | | | | – | | | | 1 | |
Total | | | $28 | | | | $18 | | | | $15 | |
We employ a range of policies to mitigate credit risk on our commercial loans which includes obtaining certain forms of security interest. The principal types of security interest are mortgages on equipment (mainly aircraft and rolling stock) and real estate, assignments or pledges on various business assets such as trade receivables, inventory, property, plant and equipment, equity shares and bank accounts. Other principal forms of credit enhancement include guarantees from counterparties with higher credit ratings who may be related to the borrower, such as a parent company.
As at December 31, 2011, 38% of our loans are collateralized mainly by aircraft and rolling stock (2010 – 37%).
Our concentrations of risk are managed by obligor, country and industry sector. The maximum credit exposure to any one obligor as at December 31, 2011 was $1,849 million (2010 – $1,940 million) before taking into account collateral and $838 million (2010 – $885 million) net of collateral.
The following reflects the movement in gross loans receivable during the year:
| | | | | | | | |
(in millions of Canadian dollars) | | Dec. 31, 2011 | | | Dec. 31, 2010 | |
Balance at beginning of year | | | 26,997 | | | | 26,790 | |
Disbursements | | | 10,330 | | | | 10,095 | |
Loan purchases | | | 63 | | | | – | |
Capitalized interest | | | 4 | | | | 42 | |
Principal repayments | | | (8,609 | ) | | | (8,435 | ) |
Principal recoveries from asset sales | | | (122 | ) | | | (73 | ) |
Receipts from the Government of Canada for sovereign debt relief | | | (4 | ) | | | (25 | ) |
Loans written off | | | (76 | ) | | | (75 | ) |
Value of repossessed assets from loan foreclosures | | | (1 | ) | | | (40 | ) |
Loans restructured into shares | | | – | | | | (3 | ) |
Foreign exchange translation | | | 511 | | | | (1,279 | ) |
Balance at end of year | | | $29,093 | | | | $26,997 | |
100 | BUILDING RESILIENCE IN UNCERTAIN TIMES
5. Individually Impaired Loans
The following table shows the carrying amount of loans specifically identified as impaired.
| | | | | | | | | | | | |
(in millions of Canadian dollars) | | Dec. 31, 2011 | | | Dec. 31, 2010 | | | Jan. 1, 2010 | |
Gross loans receivable | | | | | | | | | | | | |
Sovereign | | | 248 | | | | 291 | | | | 331 | |
Commercial | | | 1,557 | | | | 419 | | | | 593 | |
| | | | 1,805 | | | | 710 | | | | 924 | |
Less: Deferred loan revenue and other credits | | | 205 | | | | 224 | | | | 247 | |
Individual allowance | | | 422 | | | | 257 | | | | 319 | |
Carrying amount of individually impaired loans | | | $1,178 | | | | $229 | | | | $358 | |
The following reflects the movement in individually impaired gross loans receivable during the year: | |
(in millions of Canadian dollars) | | Dec. 31, 2011 | | | Dec. 31, 2010 | | | | |
Balance at beginning of year | | | 710 | | | | 924 | | | | | |
Loans classified as impaired | | | 1,383 | | | | 106 | | | | | |
Disbursements on loan guarantees called | | | 21 | | | | 20 | | | | | |
Capitalized interest | | | 2 | | | | 3 | | | | | |
Principal repayments | | | (19 | ) | | | (128 | ) | | | | |
Principal recoveries from asset sales | | | (23 | ) | | | (24 | ) | | | | |
Loans written off | | | (74 | ) | | | (66 | ) | | | | |
Principal restructured into shares | | | – | | | | (3 | ) | | | | |
Loans reinstated to performing | | | (191 | ) | | | (30 | ) | | | | |
Value of repossessed assets | | | (1 | ) | | | (40 | ) | | | | |
Receipts from the Government of Canada for sovereign debt relief | | | (4 | ) | | | (25 | ) | | | | |
Foreign exchange translation | | | 1 | | | | (27 | ) | | | | |
Balance at end of year | | | $1,805 | | | | $710 | | | | | |
During the year, impaired loans to 35 commercial borrowers totalling $74 million of principal (2010 – 26 commercial borrowers totalling $66 million) were written off. These loans were written off after all collection methods had been exhausted and no further prospect of recovery was likely. For the five years ended December 2011, cumulative write-offs of impaired loans totalled $238 million, of which 89% occurred in the past three years.
During 2011, payments of principal and interest from borrowers, as well as proceeds from sales of impaired loans were $47 million (2010 – $181 million). These amounts were applied against the carrying value of the impaired loans.
We sold $38 million in impaired loans to various counterparties in 2011 (2010 – $46 million). We recovered $22 million and the remaining $16 million was written off.
Interest income recognized on impaired loans was $9 million in 2011 (2010 – $15 million). In addition we recognized $4 million of debt relief income in 2011 (2010 – $25 million).
As at December 31, 2011, impaired loans totalling $1,287 million (2010 – $174 million; January 1, 2010 – $256 million) were secured by assets consisting of aircraft with an estimated fair value of $925 million (2010 – $112 million; January 1, 2010 – $173 million).
EDC ANNUAL REPORT 2011 | 101
CONSOLIDATED FINANCIAL STATEMENTS
6. Allowance for Losses on Loans, Loan Commitments and Loan Guarantees
The composition of the allowance for losses on loans, loan commitments and loan guarantees is as follows:
| | | | | | | | | | | | |
(in millions of Canadian dollars) | | Dec. 31, 2011 | | | Dec. 31, 2010 | | | Jan. 1, 2010 | |
Base allowance | | | | | | | | | | | | |
Investment grade exposure | | | 98 | | | | 102 | | | | 152 | |
Non-investment grade exposure | | | 1,216 | | | | 1,308 | | | | 1,884 | |
Total base allowance | | | 1,314 | | | | 1,410 | | | | 2,036 | |
Counterparty concentration | | | | | | | | | | | | |
Investment grade exposure | | | 2 | | | | 3 | | | | 2 | |
Non-investment grade exposure | | | 102 | | | | 147 | | | | 190 | |
Total counterparty concentration | | | 104 | | | | 150 | | | | 192 | |
Market overlays | | | | | | | | | | | | |
Commercial unsecured portfolio | | | – | | | | – | | | | 51 | |
Other | | | – | | | | – | | | | 17 | |
Total market overlays | | | – | | | | – | | | | 68 | |
Total collective allowance* | | | 1,418 | | | | 1,560 | | | | 2,296 | |
Allowance for individually impaired loans, loan commitments and loan guarantees | | | 509 | | | | 279 | | | | 333 | |
Total allowance for losses on loans, loan commitments and loan guarantees | | | $1,927 | | | | $1,839 | | | | $2,629 | |
* Includes allowance on finance leases of $23 million (2010 – $27 million; January 1, 2010 – $30 million).
The following table provides a breakdown of our allowance for losses on loans, loan commitments and loan guarantees by commercial and sovereign risk:
| | | | | | | | | | | | | | | | | | | | | | | | | | | | | | | | | | | | |
(in millions of
Canadian dollars) | | Dec. 31, 2011 | | | Dec. 31, 2010 | | | Jan. 1, 2010 | |
| | | Collective | | | Individual | | | Total | | | Collective | | | Individual | | | Total | | | Collective | | | Individual | | | Total | |
Commercial | | | 1,327 | | | | 476 | | | | 1,803 | | | | 1,394 | | | | 250 | | | | 1,644 | | | | 2,084 | | | | 300 | | | | 2,384 | |
Sovereign | | | 91 | | | | 33 | | | | 124 | | | | 166 | | | | 29 | | | | 195 | | | | 212 | | | | 33 | | | | 245 | |
Total allowance | | | $1,418 | | | | $509 | | | | $1,927 | | | | $1,560 | | | | $279 | | | | $1,839 | | | | $2,296 | | | | $333 | | | | $2,629 | |
102 | BUILDING RESILIENCE IN UNCERTAIN TIMES
During the year, changes to the allowance for losses on loans, loan commitments and loan guarantees were as follows:
| | | | | | | | | | | | | | | | | | | | | | | | |
| | | |
| (in millions of Canadian dollars) | | Dec. 31, 2011 | | | Dec. 31, 2010 | |
| | | Collective | | | Individual | | | Total | | | Collective | | | Individual | | | Total | |
Allowance for losses on loans | | | | | | | | | | | | | | | | | | | | | | | | |
Balance at beginning of year | | | 1,304 | | | | 257 | | | | 1,561 | | | | 1,615 | | | | 319 | | | | 1,934 | |
Provision for (reversal of) losses on loans | | | (65 | ) | | | 227 | | | | 162 | | | | (228 | ) | | | (6 | ) | | | (234 | ) |
Write–offs | | | – | | | | (70 | ) | | | (70 | ) | | | – | | | | (59 | ) | | | (59 | ) |
Recovery of amounts written-off in prior years | | | – | | | | 5 | | | | 5 | | | | – | | | | 14 | | | | 14 | |
Foreign exchange translation | | | 19 | | | | 3 | | | | 22 | | | | (83 | ) | | | (11 | ) | | | (94 | ) |
Total | | | 1,258 | | | | 422 | | | | 1,680 | | | | 1,304 | | | | 257 | | | | 1,561 | |
Allowance for losses on loan commitments | | | | | | | | | | | | | | | | | | | | | | | | |
Balance at beginning of year | | | 93 | | | | – | | | | 93 | | | | 453 | | | | – | | | | 453 | |
Reversal of losses on loan commitments | | | (53 | ) | | | – | | | | (53 | ) | | | (350 | ) | | | – | | | | (350 | ) |
Foreign exchange translation | | | 1 | | | | – | | | | 1 | | | | (10 | ) | | | – | | | | (10 | ) |
Total | | | 41 | | | | – | | | | 41 | | | | 93 | | | | – | | | | 93 | |
Allowance for losses on loan guarantees* | | | | | | | | | | | | | | | | | | | | | | | | |
Balance at beginning of year | | | 163 | | | | 22 | | | | 185 | | | | 228 | | | | 14 | | | | 242 | |
Provision for (reversal of) losses on loan guarantees | | | (50 | ) | | | 66 | | | | 16 | | | | (54 | ) | | | 7 | | | | (47 | ) |
Foreign exchange translation | | | 6 | | | | (1 | ) | | | 5 | | | | (11 | ) | | | 1 | | | | (10 | ) |
Total | | | 119 | | | | 87 | | | | 206 | | | | 163 | | | | 22 | | | | 185 | |
Total allowance for losses on loans, loan commitments and loan guarantees | | | $1,418 | | | | $509 | | | | $1,927 | | | | $1,560 | | | | $279 | | | | $1,839 | |
| * | Included in the liability for loan guarantees. |
In 2010 we conducted a review of certain aspects of the calculation of our collective allowance and made modifications to our methodology. The impact of the refinements to our methodology, which represented a change in accounting estimate, was a $312 million reduction in the collective allowance for losses on loans, loan commitments and guarantees.
The provision for individually impaired loans, loan commitments and loan guarantees for 2011 of $293 million (2010 – $1 million) includes:
| | u | a charge of $376 million (2010 – $158 million) as a result of new impairments and increases to allowances on existing impaired obligors, and | |
| | u | reversals of $83 million (2010 – $157 million) due to the return of impaired obligors to performing status and changes in the estimated future cash flows or recoveries anticipated from existing impaired obligors. | |
7. Equity Financing at Fair Value Through Profit or Loss
The equity financing portfolio is comprised of the following:
| | | 0000000 | | | | 0000000 | | | | 0000000 | | | | 0000000 | | | | 0000000 | | | | 0000000 | |
(in millions of Canadian dollars) | | Dec. 31, 2011 | | | Dec. 31, 2010 | | | Jan. 1, 2010 | |
| | | Cost | | | Fair value | | | Cost | | | Fair value | | | Cost | | | Fair value | |
Direct investments | | | | | | | | | | | | | | | | | | | | | | | | |
Loans and debt securities | | | 15 | | | | 9 | | | | 7 | | | | 2 | | | | 12 | | | | 7 | |
Equity interests | | | 52 | | | | 48 | | | | 37 | | | | 38 | | | | 43 | | | | 19 | |
| | | | 67 | | | | 57 | | | | 44 | | | | 40 | | | | 55 | | | | 26 | |
Fund investments | | | 344 | | | | 328 | | | | 285 | | | | 277 | | | | 192 | | | | 172 | |
Total equity financing | | | $411 | | | | $385 | | | | $329 | | | | $317 | | | | $247 | | | | $198 | |
There was an unrealized loss of $14 million resulting from the change in fair value of equity financing in 2011 (2010 – gain of $39 million). In 2011, we realized a gain of $7 million from the sale of one of the holdings within a fund investment. In 2010 we recorded a $15 million loss from write-offs within our direct investment portfolio.
EDC ANNUAL REPORT 2011 | 103
CONSOLIDATED FINANCIAL STATEMENTS
8. Equipment Available for Lease
Equipment available for lease consists of aircraft that were returned to us because of default under the related obligors’ loan agreements.
| | | | | | | | | | | | | | | | | | | | | | | | | | | | | | | | |
| | | |
| (in millions of Canadian dollars) | | Dec. 31, 2011 | | | Dec. 31, 2010 | |
| | | Aircraft | | | Engines | | | Major Overhaul Costs | | | Total | | | Aircraft | | | Engines | | | Major Overhaul Costs | | | Total | |
Cost: | | | | | | | | | | | | | | | | | | | | | | | | | | | | | | | | |
Balance at beginning of year(1) | | | 167 | | | | 132 | | | | 22 | | | | 321 | | | | 170 | | | | 135 | | | | 16 | | | | 321 | |
Additions | | | – | | | | – | | | | – | | | | – | | | | 18 | | | | 14 | | | | 8 | | | | 40 | |
Transfers to Held-for-Sale | | | (88 | ) | | | (72 | ) | | | (10 | ) | | | (170 | ) | | | (21 | ) | | | (17 | ) | | | (2 | ) | | | (40 | ) |
Balance at end of year | | | 79 | | | | 60 | | | | 12 | | | | 151 | | | | 167 | | | | 132 | | | | 22 | | | | 321 | |
Accumulated depreciation and impairment: | | | | | | | | | | | | | | | | | | | | | | | | | | | | | | | | |
Balance at beginning of year(1) | | | (94 | ) | | | (72 | ) | | | (15 | ) | | | (181 | ) | | | – | | | | – | | | | – | | | | – | |
Depreciation expense | | | (8 | ) | | | (5 | ) | | | (3 | ) | | | (16 | ) | | | (13 | ) | | | (5 | ) | | | (6 | ) | | | (24 | ) |
Impairment loss | | | – | | | | – | | | | – | | | | – | | | | (90 | ) | | | (74 | ) | | | (10 | ) | | | (174 | ) |
Elimination on transfer to Held-for-Sale | | | 51 | | | | 40 | | | | 9 | | | | 100 | | | | 9 | | | | 7 | | | | 1 | | | | 17 | |
Balance at end of year | | | (51 | ) | | | (37 | ) | | | (9 | ) | | | (97 | ) | | | (94 | ) | | | (72 | ) | | | (15 | ) | | | (181 | ) |
Carrying amount | | | 28 | | | | 23 | | | | 3 | | | | 54 | | | | 73 | | | | 60 | | | | 7 | | | | 140 | |
| | | | | | | | | |
Lease setup costs: | | | | | | | | | | | | | | | | | | | | | | | | | | | | | | | | |
Balance at beginning of year(1) | | | | | | | | | | | | | | | 3 | | | | | | | | | | | | | | | | 5 | |
Additions | | | | | | | | | | | | | | | – | | | | | | | | | | | | | | | | 3 | |
Amortization expense | | | | | | | | | | | | | | | (2 | ) | | | | | | | | | | | | | | | (3 | ) |
Impairment loss | | | | | | | | | | | | | | | – | | | | | | | | | | | | | | | | (2 | ) |
Balance at end of year | | | | | | | | | | | | | | | 1 | | | | | | | | | | | | | | | | 3 | |
Total equipment available for lease | | | | | | | | | | | | | | | $55 | | | | | | | | | | | | | | | | $143 | |
Number of aircraft(2) | | | | | | | | | | | | | | | 20 | | | | | | | | | | | | | | | | 43 | |
| (1) | 2010 beginning balances reflect January 1, 2010 adjustments made upon transition to IFRS – see Note 42 for more details. |
| (2) | Number of aircraft at January 1, 2010 was 42. All are CRJ200 Regional Jets. |
On a quarterly basis we assess whether there is any indication of impairment of our regional aircraft given current market conditions. In 2011, recent aircraft sales, leasing rates and other market conditions did not lead to any indication of impairment of our 20 aircraft currently on lease and therefore no impairment loss was recorded in 2011. Based on these same conditions, there was also no indication that a reversal of previous impairment losses would be required.
In 2010, due to changing market conditions, a review for impairment was performed, and an analysis of expected future cash flows was performed where necessary. As a result, we reduced the carrying value of 43 aircraft by a total of $176 million to reflect adjustments to fair value. In addition we concluded that the following factors had an impact on the remaining useful life of the aircraft: past impairment write-downs as a result of lower market values; reduced lease rates on new leases; and approximately 30% of the aircraft were idle during the year. As a result we reduced the remaining useful life of each aircraft by an average of five years with the maximum remaining useful life being seven years.
During 2011, 23 aircraft and three engines valued at $71 million (2010 – six aircraft valued at $16 million) were reclassified from equipment available for lease to the held-for-sale portfolio.
Operating lease revenue for the year was $21 million (2010 – $32 million). At the end of December 2011, all 20 of our aircraft were subject to operating leases with six airlines (2010 – 25 aircraft). The lease terms range from 12 to 60 months. There were no idle aircraft at the end of December 2011. At the end of December 2010 we had 18 idle aircraft with a carrying value of $53 million.
104 | BUILDING RESILIENCE IN UNCERTAIN TIMES
The following table presents minimum future lease payments receivable:
| | | 0000000000 | | | | 0000000000 | | | | 0000000000 | |
| | | | |
| (in millions of Canadian dollars) | | Dec. 31, 2011 | | | Dec. 31, 2010 | | | Jan. 1, 2010 | |
2010 | | | – | | | | – | | | | 24 | |
2011 | | | – | | | | 20 | | | | 19 | |
2012 | | | 13 | | | | 16 | | | | 18 | |
2013 | | | 12 | | | | 13 | | | | 18 | |
2014 | | | 8 | | | | 8 | | | | 12 | |
2015 | | | 4 | | | | 1 | | | | – | |
2016 | | | 1 | | | | – | | | | – | |
2017 and beyond | | | – | | | | – | | | | – | |
Total | | | $38 | | | | $58 | | | | $91 | |
AIRCRAFT HELD-FOR-SALE
During 2011, we sold 14 aircraft and one airframe for a total value of $46 million.
In addition to the above sales, eight aircraft were subject to an agreement to exchange them for two CRJ900 regional jets. Four of our aircraft valued at $12 million were delivered in 2011 and the remaining four aircraft valued at $11 million will be delivered early in 2012. The two CRJ900 regional jets received in the transaction are currently valued at $23 million and will be undergoing refurbishment in 2012. As such, they are currently classified under other assets.
At year end there are 16 aircraft and five engines within our held-for-sale portfolio with a carrying value of $31 million. In addition to the four aircraft waiting to be delivered in 2012 as discussed above, we have six aircraft and three engines valued at $5 million which are expected to be sold in 2012. We also have six aircraft and two engines with a carrying value of $15 million that have been contracted for part-out whereby we will seek recovery by selling the component parts of the aircraft.
9. Net Investment in Aircraft under Finance Leases
The following table presents the reconciliation between our gross investment in aircraft under finance leases and the present value of the minimum lease payments receivable.
| | | | | | | | | | | | |
| | | | |
| (in millions of Canadian dollars) | | Dec. 31, 2011 | | | Dec. 31, 2010 | | | Jan. 1, 2010 | |
Total minimum lease payments receivable | | | 81 | | | | 95 | | | | 117 | |
Estimated residual values of leased aircraft | | | 34 | | | | 34 | | | | 35 | |
Gross investment in finance leases | | | 115 | | | | 129 | | | | 152 | |
Unearned income | | | (23 | ) | | | (30 | ) | | | (39 | ) |
Finance lease interest receivable | | | – | | | | – | | | | 1 | |
Net investment in finance leases | | | 92 | | | | 99 | | | | 114 | |
Present value of estimated residual values | | | (24 | ) | | | (22 | ) | | | (22 | ) |
Present value of minimum lease payments receivable | | | $68 | | | | $77 | | | | $92 | |
Allowance for losses* | | | $23 | | | | $27 | | | | $30 | |
| * | Included within the allowance for losses on loans. |
EDC ANNUAL REPORT 2011 | 105
CONSOLIDATED FINANCIAL STATEMENTS
The following table presents minimum lease payments receivable, estimated residual values, gross investment in finance leases, as well as the present value of minimum lease payments receivable:
| | | | | | | | | | | | | | | | | | | | | | | | | | | | | | | | | | | | |
(in millions of Canadian dollars) | | Dec. 31, 2011 | | | Dec. 31, 2010 | | | Jan. 1, 2010 | |
| | | Minimum lease payments receivable | | | Estimated residual values | | | Gross investment in finance leases | | | Present value of minimum lease payments receivable | | | Minimum lease payments receivable | | | Estimated residual values | | | Gross investment in finance leases | | | Present value of minimum lease payments receivable | | | Present value of
minimum
lease
payments
receivable | |
2010 | | | – | | | | – | | | | – | | | | – | | | | – | | | | – | | | | – | | | | – | | | | 16 | |
2011 | | | – | | | | – | | | | – | | | | – | | | | 16 | | | | – | | | | 16 | | | | 16 | | | | 15 | |
2012 | | | 17 | | | | – | | | | 17 | | | | 16 | | | | 16 | | | | – | | | | 16 | | | | 14 | | | | 14 | |
2013 | | | 17 | | | | – | | | | 17 | | | | 15 | | | | 16 | | | | – | | | | 16 | | | | 13 | | | | 13 | |
2014 | | | 17 | | | | – | | | | 17 | | | | 14 | | | | 16 | | | | – | | | | 16 | | | | 12 | | | | 12 | |
2015 | | | 17 | | | | – | | | | 17 | | | | 13 | | | | 16 | | | | – | | | | 16 | | | | 12 | | | | 12 | |
2016 | | | 11 | | | | 21 | | | | 32 | | | | 9 | | | | 12 | | | | 21 | | | | 33 | | | | 8 | | | | 8 | |
2017 | | | 2 | | | | 13 | | | | 15 | | | | 1 | | | | 3 | | | | 13 | | | | 16 | | | | 2 | | | | 2 | |
Total | | | $81 | | | | $34 | | | | $115 | | | | $68 | | | | $95 | | | | $34 | | | | $129 | | | | $77 | | | | $92 | |
Finance lease revenue for the year was $7 million (2010 – $8 million). At the end of December 2011, 13 aircraft were subject to finance leases with one airline, consistent with 2010. The remaining lease terms range from 52 to 71 months.
10. Recoverable Insurance Claims
During the year, changes to the recoverable insurance claims were as follows:
| | | | | | | | |
| | | |
| (in millions of Canadian dollars) | | Dec. 31, 2011 | | | Dec. 31, 2010 | |
Balance at beginning of year | | | 94 | | | | 93 | |
Claims paid | | | 54 | | | | 113 | |
Claims paid – reinsured policies | | | 1 | | | | 13 | |
Claims recovered | | | (40 | ) | | | (36 | ) |
Change in recoverable portion of cumulative claims paid | | | (66 | ) | | | (85 | ) |
Foreign exchange translation | | | 1 | | | | (4 | ) |
Balance at end of year | | | $44 | | | | $94 | |
Of the $55 million (2010 – $126 million) in claim payments made during 2011, 73% (2010 – 57%) were related to the credit insurance program. The largest concentrations of claim payments and recoveries were in the following countries:
| | | | | | | | | | |
(in millions of Canadian dollars) | | Dec. 31, 2011 | | | | Dec. 31, 2010 |
| | | Claims paid | | Claims recovered | | | | Claims paid | | Claims recovered |
United States | | 23 | | 10 | | United States | | 31 | | 9 |
Canada | | 5 | | 8 | | Canada | | 26 | | 1 |
Spain | | 4 | | – | | Brazil | | 19 | | – |
Peru | | 4 | | 3 | | Bahrain | | 10 | | – |
United Kingdom | | 3 | | 1 | | Ukraine | | – | | 6 |
Other | | 16 | | 18 | | Other | | 40 | | 20 |
Total | | $55 | | $40 | | Total | | $126 | | $36 |
106 | BUILDING RESILIENCE IN UNCERTAIN TIMES
11. Other Assets
| | | | | | | | | | | | |
| | | | |
| (in millions of Canadian dollars) | | Dec. 31, 2011 | | | Dec. 31, 2010 | | | Jan. 1, 2010 | |
Restructuring payments receivable | | | 55 | | | | 56 | | | | 62 | |
Aircraft held-for-sale* | | | 31 | | | | 24 | | | | 10 | |
Insurance premiums receivable/prepaid reinsurance | | | 26 | | | | 20 | | | | 27 | |
Other aircraft* | | | 23 | | | | – | | | | – | |
Prepaid expenses | | | 7 | | | | 4 | | | | 5 | |
Guarantee fees receivable | | | 6 | | | | 2 | | | | 7 | |
Investment in joint ventures | | | 2 | | | | 47 | | | | 25 | |
Other | | | 24 | | | | 29 | | | | 5 | |
Total other assets | | | $174 | | | | $182 | | | | $141 | |
Restructuring payments receivable relate to an agreement between EDC and an airline obligor as part of the terms of a loan restructuring that was finalized in 2007. The receivable relates to a payable as shown in Note 15.
12. Property, Plant and Equipment
During the year, changes to property, plant and equipment were as follows:
| | | | | | | | | | | | | | | | | | | | | | | | | | | | | | | | |
(in millions of Canadian dollars) | | Dec. 31, 2011 | | | Dec. 31, 2010 | |
| | | Computer hardware | | | Furniture and equipment | | | Leasehold improvements | | | Total | | | Computer hardware | | | Furniture and equipment | | | Leasehold improvements | | | Total | |
Cost: | | | | | | | | | | | | | | | | | | | | | | | | | | | | | | | | |
Balance at beginning of year | | | 73 | | | | 33 | | | | 32 | | | | 138 | | | | 67 | | | | 32 | | | | 17 | | | | 116 | |
Additions | | | 9 | | | | 12 | | | | 30 | | | | 51 | | | | 6 | | | | 1 | | | | 15 | | | | 22 | |
Disposals | | | (60 | ) | | | (26 | ) | | | (12 | ) | | | (98 | ) | | | – | | | | – | | | | – | | | | – | |
Balance at end of year | | | 22 | | | | 19 | | | | 50 | | | | 91 | | | | 73 | | | | 33 | | | | 32 | | | | 138 | |
Accumulated depreciation: | | | | | | | | | | | | | | | | | | | | | | | | | | | | | | | | |
Balance at beginning of year | | | (62 | ) | | | (29 | ) | | | (14 | ) | | | (105 | ) | | | (58 | ) | | | (28 | ) | | | (13 | ) | | | (99 | ) |
Depreciation expense | | | (7 | ) | | | (2 | ) | | | (1 | ) | | | (10 | ) | | | (4 | ) | | | (1 | ) | | | (1 | ) | | | (6 | ) |
Disposals | | | 60 | | | | 26 | | | | 12 | | | | 98 | | | | – | | | | – | | | | – | | | | – | |
Balance at end of year | | | (9 | ) | | | (5 | ) | | | (3 | ) | | | (17 | ) | | | (62 | ) | | | (29 | ) | | | (14 | ) | | | (105 | ) |
Carrying amount | | | $13 | | | | $14 | | | | $47 | | | | $74 | | | | $11 | | | | $4 | | | | $18 | | | | $33 | |
Future contractual commitments as at December 31, 2011 were $1 million (2010 – $26 million; January 1, 2010 – $1 million).
EDC ANNUAL REPORT 2011 | 107
CONSOLIDATED FINANCIAL STATEMENTS
13. Intangible Assets
During the year, changes to intangible assets were as follows:
| | | 000000000 | | | | 000000000 | | | | 000000000 | | | | 000000000 | | | | 000000000 | | | | 000000000 | |
| | | |
| (in millions of Canadian dollars) | | Dec. 31, 2011 | | | Dec. 31, 2010 | |
| | | Internally developed software | | | Acquired computer software | | | Total | | | Internally developed software | | | Acquired computer software | | | Total | |
Cost: | | | | | | | | | | | | | | | | | | | | | | | | |
Balance at beginning of year | | | 78 | | | | 76 | | | | 154 | | | | 77 | | | | 63 | | | | 140 | |
Additions | | | 3 | | | | 10 | | | | 13 | | | | 1 | | | | 13 | | | | 14 | |
Balance at end of year | | | 81 | | | | 86 | | | | 167 | | | | 78 | | | | 76 | | | | 154 | |
Accumulated amortization: | | | | | | | | | | | | | | | | | | | | | | | | |
Balance at beginning of year | | | (66 | ) | | | (46 | ) | | | (112 | ) | | | (62 | ) | | | (37 | ) | | | (99 | ) |
Amortization expense | | | (5 | ) | | | (10 | ) | | | (15 | ) | | | (4 | ) | | | (9 | ) | | | (13 | ) |
Balance at end of year | | | (71 | ) | | | (56 | ) | | | (127 | ) | | | (66 | ) | | | (46 | ) | | | (112 | ) |
Carrying amount | | | $10 | | | | $30 | | | | $40 | | | | $12 | | | | $30 | | | | $42 | |
14. Building under Finance Lease
Our new head office building has been classified as a finance lease. Future minimum lease payments under the obligation under finance lease together with the present value of the minimum lease payments, based on an expected 25 year lease term are as follows:
| | | | | | | | | | | | | | | | |
(in millions of Canadian dollars) | | Dec. 31, 2011 | | | Dec. 31, 2010 | |
| | | Minimum payments | | | Present value of minimum lease payments | | | Minimum payments | | | Present value of minimum lease payments | |
2012 | | | 11 | | | | 11 | | | | – | | | | – | |
2013 | | | 11 | | | | 10 | | | | – | | | | – | |
2014 | | | 11 | | | | 10 | | | | – | | | | – | |
2015 | | | 11 | | | | 9 | | | | – | | | | – | |
2016 | | | 11 | | | | 9 | | | | – | | | | – | |
2017 and beyond | | | 243 | | | | 128 | | | | – | | | | – | |
Total | | | 298 | | | | 177 | | | | – | | | | – | |
Less: Future finance charges | | | (121 | ) | | | – | | | | – | | | | – | |
Present value of minimum lease payments | | | $177 | | | | $177 | | | | $– | | | | $– | |
During the year changes to the building under finance lease were as follows: | |
(in millions of Canadian dollars) | | Dec. 31, 2011 | | | Dec. 31, 2010 | | | | | | | |
Cost: | | | | | | | | | | | | | | | | |
Balance at beginning of year | | | – | | | | – | | | | | | | | | |
Additions | | | 177 | | | | – | | | | | | | | | |
Balance at end of year | | | 177 | | | | – | | | | | | | | | |
Accumulated depreciation: | | | | | | | | | | | | | | | | |
Balance at beginning of year | | | – | | | | – | | | | | | | | | |
Depreciation expense | | | (1 | ) | | | – | | | | | | | | | |
Balance at end of year | | | (1 | ) | | | – | | | | | | | | | |
Carrying amount | | | $176 | | | | $– | | | | | | | | | |
108 | BUILDING RESILIENCE IN UNCERTAIN TIMES
15. Accounts Payable and Other Credits
| | | | | | | | | | | | |
| | | | |
| (in millions of Canadian dollars) | | Dec. 31, 2011 | | | Dec. 31, 2010 | | | Jan. 1, 2010 | |
Restructuring payments payable | | | 53 | | | | 56 | | | | 62 | |
Employee benefit accruals | | | 21 | | | | 24 | | | | 16 | |
Trade payables and accruals | | | 19 | | | | 22 | | | | 18 | |
Aircraft maintenance reserve | | | 13 | | | | 20 | | | | 16 | |
Canada Account payable | | | 11 | | | | 12 | | | | 13 | |
Obligation under an exchange of non-monetary assets* | | | 11 | | | | – | | | | – | |
Aircraft lease security deposit | | | 8 | | | | 11 | | | | 8 | |
Other payables and other credits | | | 23 | | | | 21 | | | | 13 | |
Total accounts payable and other credits | | | $159 | | | | $166 | | | | $146 | |
Restructuring payments payable relate to an agreement between EDC and an airline obligor as part of the terms of a loan restructuring that was finalized in 2007. The payable relates to a receivable as shown in Note 11.
Aircraft maintenance reserve represents payments received from lessees for our leased aircraft that are reserved for major repairs and overhauls of the aircraft.
Canada Account payable primarily represents the amount of cash repayments (principal and interest) received by EDC from borrowers on Canada Account loans which were not yet remitted at year-end to the Consolidated Revenue Fund.
We recorded an obligation under an exchange for non-monetary assets as a result of entering into an agreement to exchange eight CRJ200 aircraft for two CRJ900 aircraft. Four of the aircraft were delivered in 2011; the remaining four aircraft will be delivered in 2012 and were recorded as an obligation.
Aircraft lease security deposits are received from lessees for our leased aircraft, and are held over the life of the lease term.
16. Debt Instruments
We issue debt instruments in global capital markets. Short-term payables consist of commercial paper and other short-term debt related instruments that we issue with maturities under one year. Long-term payables represent bonds and other long-term instruments which we issue in Canadian dollars, U.S. dollars and other currencies. We use foreign exchange swaps as well as cross currency interest rate swaps to convert Canadian dollar and foreign currency denominated notes primarily to U.S. dollars. Interest rate swaps are principally used to convert fixed rate instruments to floating rates, primarily related to LIBOR. We use derivative contracts and structured notes to manage interest rate risk and foreign exchange risk, and also for asset liability management purposes.
EDC is wholly owned by the Government of Canada and our obligations are backed by the full faith and credit of the Government of Canada which holds a AAA credit rating. Therefore, there is no significant change in the value of our debt instruments that can be attributed to changes in our own credit risk.
LOANS PAYABLE
Loans payable (excluding derivatives) are comprised as follows:
| | | | | | | | | | | | | | | | | | | | | | | | |
(in millions of Canadian dollars) | | Dec. 31, 2011 | | | Dec. 31, 2010 | |
| | | Designated at fair
value through profit or loss | | | At amortized cost | | | Total | | | Designated at fair value through profit or loss | | | At amortized cost | | | Total | |
Short-term payables | | | 3,567 | | | | – | | | | 3,567 | | | | 2,608 | | | | – | | | | 2,608 | |
| | | | | | | |
Long-term payables
due within current year | | | 5,426 | | | | 1,016 | | | | 6,442 | | | | 6,084 | | | | – | | | | 6,084 | |
over one year | | | 12,512 | | | | 1,037 | | | | 13,549 | | | | 11,773 | | | | 2,009 | | | | 13,782 | |
Total long-term payables | | | 17,938 | | | | 2,053 | | | | 19,991 | | | | 17,857 | | | | 2,009 | | | | 19,866 | |
Accrued interest | | | – | | | | 12 | | | | 12 | | | | – | | | | 10 | | | | 10 | |
Total loans payable | | | $21,505 | | | | $2,065 | | | | $23,570 | | | | $20,465 | | | | $2,019 | | | | $22,484 | |
EDC ANNUAL REPORT 2011 | 109
CONSOLIDATED FINANCIAL STATEMENTS
| | | | | | | | | | | | |
| | |
| (in millions of Canadian dollars) | | Jan. 1, 2010 | |
| | | Designated at fair value
through profit or loss | | | At amortized cost | | | Total | |
Short-term payables | | | 2,569 | | | | – | | | | 2,569 | |
| | | | |
Long-term payables | | | | | | | | | | | | |
due within current year | | | 5,575 | | | | 165 | | | | 5,740 | |
over one year | | | 13,995 | | | | 2,114 | | | | 16,109 | |
Total long-term payables | | | 19,570 | | | | 2,279 | | | | 21,849 | |
Accrued interest | | | – | | | | 15 | | | | 15 | |
Total loans payable | | | $22,139 | | | | $2,294 | | | | $24,433 | |
The amount to be paid at maturity on the debt designated at fair value through profit or loss is $20,916 million (2010 – $20,046 million; January 1, 2010 – $21,506 million), $589 million less than the December 2011 fair value (2010 – $419 million less than the December 31, 2010 fair value; January 1, 2010 – $633 million less than the January 1, 2010 fair value).
STRUCTURED NOTES
We have entered into a number of structured notes as part of our funding program. Structured notes are hybrid securities that combine debt instruments with derivative components.
Structured notes outstanding, included in loans payable, are as follows:
| | | | | | | | |
| | | |
| (in millions of Canadian dollars) | | Dec. 31, 2011 | | | Dec. 31, 2010 | |
Zero coupon | | | 611 | | | | 74 | |
Callable/extendible | | | 258 | | | | 62 | |
Inverse floating rate note | | | 58 | | | | 60 | |
Dual currency | | | 39 | | | | 68 | |
Float to fixed | | | 21 | | | | – | |
Total | | | $987 | | | | $264 | |
We have executed swap contracts to mitigate interest rate risk and foreign exchange risk on these structured borrowings. These contracts ensure that we will receive proceeds from the swap to meet the requirements of settling and servicing the debt obligation. We have in substance created floating rate debt by issuing bonds at fixed rates and entering into swap contracts whereby we receive fixed rate interest and pay interest at a floating rate. In swapping out of the underlying bond issue, the potential interest rate risk has been converted to credit risk. Credit exposure on derivative financial instruments is further discussed in Note 17.
17. Derivative Financial Instruments
We use a variety of derivative financial instruments to manage costs, returns and levels of financial risk associated with our funding, investment and risk management activities.
We currently use, but are not limited to, the following types of instruments:
Interest rate swaps – transactions in which two parties exchange interest flows on a specified notional amount on predetermined dates for a specified period of time using agreed-upon fixed or floating rates of interest. Notional amounts upon which interest payments/ receipts are based are not exchanged.
Cross currency interest rate swaps – transactions in which two parties exchange currencies at inception and at maturity, as well as interest flows on the exchanged amounts on predetermined dates for a specified period of time using agreed-upon fixed or floating rates of interest.
Foreign exchange swaps – commitments to exchange cash flows in different currencies where there are two exchanges, the first is made at the spot rate at inception and the second at a predetermined rate on a specified date in the future.
Foreign exchange forwards – commitments to exchange cash flows in different currencies, for which the foreign exchange rate is predetermined, at a specified date in the future.
Non-deliverable forwards – cash-settled, short-term forward contract, where the profit or loss at settlement date is calculated by taking the difference between the agreed upon exchange rate and the spot rate at the time of settlement, for an agreed upon notional amount of funds.
110 | BUILDING RESILIENCE IN UNCERTAIN TIMES
Non-deliverable foreign exchange swaps – a commitment to exchange cash flows in different currencies where there are two exchanges on pre-agreed dates and rates; with the unique characteristic that only the net value in a pre-agreed currency changes hands.
Credit default swaps – transactions between two counterparties that allow credit risks of a third-party reference entity or entities to be traded and managed. The buyer of credit protection pays a periodic fee to the protection seller over a specified term in return for compensation should a credit event (such as default or failure to pay) occur with the reference entity.
To diversify and reduce credit risk within our loan portfolio, we entered into credit default swap transactions which provide us with protection on nine single-name entities to which we have exposure through our loan portfolio. To offset the cost of these transactions, we sold credit default swap protection on a series of collateralized debt obligations which contain a diversified group of corporate names.
In any transaction there is a potential for loss. This loss potential is represented by (1) credit risk, wherein the counterparty fails to perform an obligation as agreed upon, causing the other party to incur a financial loss, and (2) interest rate risk and foreign exchange risk, where an exposure exists as a result of changes in foreign exchange rates or interest rates.
We manage our exposure to interest rate risk and foreign exchange risk using limits developed in consultation with the Department of Finance and approved by our Board of Directors.
Both our internal policies and guidelines (established in the Risk Management Office and approved by our Board of Directors) and those set by the Minister of Finance limit our use of derivatives. We do not use derivatives for speculative purposes. We manage our exposure to derivative counterparty credit risk by contracting only with creditworthy counterparties, establishing netting agreements, and in certain cases entering into collateral agreements, using Credit Support Annex (CSA) with those counterparties. Collateral agreements provide for the posting of collateral by the counterparty when our exposure to that entity exceeds a certain threshold. Collateral is held by a third party custodian and at the end of December 2011 totalled $788 million (2010 – $1,178 million) and consists of AAA rated government issued securities. All derivative counterparties must have a minimum credit rating of A-. Any exception must be approved by the Board of Directors. Internal policies and procedures establish credit approvals, controls and monitoring. We do not anticipate any significant non-performance by the counterparties.
In 2011, we reviewed our contracts for embedded derivatives and determined they did not significantly modify the cash flows that otherwise would be required by the contract and consequently they needed not to be presented separately in the statement of financial position.
Notional amounts are not recorded as assets or liabilities on our statement of financial position as they represent the face amount of the contract to which a rate or a price is applied to determine the amount of cash flows to be exchanged.
The remaining term to maturity for the notional amounts of our derivative contracts is as follows:
| | | | | | | | | | | | | | | | | | | | | | | | | | | | | | | | |
(in millions of Canadian dollars) | | Dec. 31, 2011 | | | Dec. 31, 2010 | |
| | | Remaining term to maturity | | | | | | Remaining term to maturity | | | | |
| | | Under 1 year | | | 1 to 3 years | | | Over 3 years | | | Total | | | Under 1 year | | | 1 to 3 years | | | Over 3 years | | | Total | |
Cross currency interest rate swaps | | | 2,506 | | | | 3,280 | | | | 6,611 | | | | 12,397 | | | | 2,010 | | | | 3,082 | | | | 6,112 | | | | 11,204 | |
Interest rate swaps | | | 3,337 | | | | 4,232 | | | | 4,349 | | | | 11,918 | | | | 5,559 | | | | 3,481 | | | | 3,743 | | | | 12,783 | |
Foreign exchange swaps | | | 2,673 | | | | – | | | | – | | | | 2,673 | | | | 1,640 | | | | – | | | | – | | | | 1,640 | |
Credit default swaps – protection purchased | | | 589 | | | | 107 | | | | 269 | | | | 965 | | | | 30 | | | | 667 | | | | 40 | | | | 737 | |
Non-deliverable forwards | | | 414 | | | | 64 | | | | – | | | | 478 | | | | – | | | | – | | | | – | | | | – | |
Foreign exchange forwards | | | 391 | | | | – | | | | – | | | | 391 | | | | 329 | | | | – | | | | – | | | | 329 | |
Non-deliverable foreign exchange swaps | | | 46 | | | | – | | | | – | | | | 46 | | | | 53 | | | | – | | | | – | | | | 53 | |
Credit default swaps – protection sold | | | (49 | ) | | | – | | | | – | | | | (49 | ) | | | – | | | | (60 | ) | | | – | | | | (60 | ) |
Total derivative financial instruments | | | $9,907 | | | | $7,683 | | | | $11,229 | | | | $28,819 | | | | $9,621 | | | | $7,170 | | | | $9,895 | | | | $26,686 | |
EDC ANNUAL REPORT 2011 | 111
CONSOLIDATED FINANCIAL STATEMENTS
The following table provides the fair values for each category of derivative financial instrument.
| | | | | | | | | | | | |
| | | | |
| (in millions of Canadian dollars) | | Dec. 31, 2011 | | | Dec. 31, 2010 | | | Jan. 1, 2010 | |
Cross currency interest rate swaps | | | 1,021 | | | | 1,565 | | | | 1,377 | |
Interest rate swaps | | | 292 | | | | 261 | | | | 328 | |
Foreign exchange swaps | | | 36 | | | | 15 | | | | 24 | |
Credit default swaps – protection purchased | | | 30 | | | | 2 | | | | (3 | ) |
Foreign exchange forwards | | | (1 | ) | | | 6 | | | | (2 | ) |
Credit default swaps – protection sold | | | (15 | ) | | | (39 | ) | | | (37 | ) |
Total derivative financial instruments | | | $1,363 | | | | $1,810 | | | | $1,687 | |
The change in the fair value of the derivatives recognized in net income in 2011 amounted to a gain of $139 million (2010 – loss of $160 million).
18. Debt Instrument Maturities
We often combine debt instruments with derivative financial instruments to generate lower-cost funding. For example, a fixed rate debt issue can be combined with an interest rate swap to generate floating rate funding at a lower cost than issuing a floating rate note. The following table shows our resulting net fixed and floating rate debt positions, as well as the maturities and yields of those net positions. Although we measure our swaps and the majority of debt instruments at their fair value on the financial statements, they are shown below at their notional amounts in order to provide information on cash requirements at maturity of the instruments.
| | | | | | | | | | | | | | | | | | | | | | | | | | | | | | | | |
(in millions of Canadian dollars) | | Dec. 31, 2011 | | | Dec. 31, 2010 | |
Year of maturity | |
| Debt
issues |
| |
| Swap
contracts |
| | | Net | | |
| Yield*
(%) |
| |
| Debt
issues |
| |
| Swap
contracts |
| | | Net | | |
| Yield*
(%) |
|
Fixed rate issues | | | | | | | | | | | | | | | | | | | | | | | | | | | | | | | | |
2011 | | | – | | | | – | | | | – | | | | – | | | | 5,924 | | | | (5,924 | ) | | | – | | | | – | |
2012 | | | 5,833 | | | | (4,817 | ) | | | 1,016 | | | | 4.64 | | | | 4,647 | | | | (3,652 | ) | | | 995 | | | | 4.64 | |
2013 | | | 2,239 | | | | (2,239 | ) | | | – | | | | – | | | | 1,002 | | | | (1,002 | ) | | | – | | | | – | |
2014 | | | 2,870 | | | | (1,854 | ) | | | 1,016 | | | | 3.19 | | | | 1,799 | | | | (804 | ) | | | 995 | | | | 3.19 | |
2015 | | | 3,757 | | | | (3,757 | ) | | | – | | | | – | | | | 3,679 | | | | (3,679 | ) | | | – | | | | – | |
2016 | | | 2,159 | | | | (2,138 | ) | | | 21 | | | | 8.16 | | | | 523 | | | | (504 | ) | | | 19 | | | | 8.16 | |
2017 to 2021 | | | 351 | | | | (351 | ) | | | – | | | | – | | | | 297 | | | | (297 | ) | | | – | | | | – | |
2022 and beyond | | | 563 | | | | (563 | ) | | | – | | | | – | | | | 111 | | | | (101 | ) | | | 10 | | | | 5.90 | |
Subtotal | | | 17,772 | | | | (15,719 | ) | | | 2,053 | | | | 3.71 | | | | 17,982 | | | | (15,963 | ) | | | 2,019 | | | | 3.85 | |
| | | | | | | | | |
Floating rate issues | | | | | | | | | | | | | | | | | | | | | | | | | | | | | | | | |
2011 | | | – | | | | – | | | | – | | | | | | | | 2,642 | | | | 5,542 | | | | 8,184 | | | | | |
2012 | | | 4,091 | | | | 4,653 | | | | 8,744 | | | | | | | | 498 | | | | 3,454 | | | | 3,952 | | | | | |
2013 | | | 396 | | | | 2,255 | | | | 2,651 | | | | | | | | 199 | | | | 1,001 | | | | 1,200 | | | | | |
2014 | | | 585 | | | | 1,677 | | | | 2,262 | | | | | | | | 548 | | | | 623 | | | | 1,171 | | | | | |
2015 | | | – | | | | 3,656 | | | | 3,656 | | | | | | | | – | | | | 3,588 | | | | 3,588 | | | | | |
2016 | | | – | | | | 2,081 | | | | 2,081 | | | | | | | | – | | | | 440 | | | | 440 | | | | | |
2017 to 2021 | | | 108 | | | | 288 | | | | 396 | | | | | | | | 144 | | | | 238 | | | | 382 | | | | | |
2022 and beyond | | | 17 | | | | 553 | | | | 570 | | | | | | | | 42 | | | | 88 | | | | 130 | | | | | |
Subtotal | | | 5,197 | | | | 15,163 | | | | 20,360 | | | | 0.58 | | | | 4,073 | | | | 14,974 | | | | 19,047 | | | | 0.38 | |
Total | | | $22,969 | | | | $(556) | | | | $22,413 | | | | | | | | $22,055 | | | | $(989) | | | | $21,066 | | | | | |
| * | Refers to yield to maturity for fixed rate issues, and yield to reset for floating rate issues. |
112 | BUILDING RESILIENCE IN UNCERTAIN TIMES
At the end of December 2011, the contractual cash flows, including principal and interest, related to our debt portfolio are as follows:
| | | | | | | | | | | | | | | | | | | | | | | | | | | | | | | | | | | | | | | | |
(in millions of Canadian dollars) | | Dec. 31, 2011 | | | Dec. 31, 2010 | |
| | | Under 1 year | | | 1 to 3 years | | | Over 3 to 5 years | | | Over 5 years | | | Total | | | Under 1 year | | | 1 to 3 years | | | Over 3 to 5 years | | | Over 5 years | | | Total | |
Debt | | | 10,420 | | | | 6,658 | | | | 6,155 | | | | 3,193 | | | | 26,426 | | | | 9,116 | | | | 6,962 | | | | 6,350 | | | | 1,231 | | | | 23,659 | |
Swap contracts | | | | | | | | | | | | | | | | | | | | | | | | | | | | | | | | | | | | | | | | |
Receivable | | | (5,234 | ) | | | (4,619 | ) | | | (6,140 | ) | | | (3,037 | ) | | | (19,030 | ) | | | (6,360 | ) | | | (5,097 | ) | | | (4,725 | ) | | | (978 | ) | | | (17,160 | ) |
Payable | | | 4,695 | | | | 3,932 | | | | 5,734 | | | | 836 | | | | 15,197 | | | | 5,569 | | | | 4,454 | | | | 4,210 | | | | 763 | | | | 14,996 | |
Total | | | $9,881 | | | | $5,971 | | | | $5,749 | | | | $992 | | | | $22,593 | | | | $8,325 | | | | $6,319 | | | | $5,835 | | | | $1,016 | | | | $21,495 | |
Credit exposure and other details of derivative financial instruments are included as part of Note 17.
19. Policy and Claims Liabilities
The policy and claims liabilities broken down by program are as follows:
| | | | | | | | | | | | | | | | | | | | | | | | |
(in millions of Canadian dollars) | | Dec. 31, 2011 | | | Dec. 31, 2010 | |
| | | Insurance | | | Reinsurance | | | Net liability | | | Insurance | | | Reinsurance | | | Net liability | |
Credit insurance | | | 143 | | | | (10) | | | | 133 | | | | 197 | | | | (18) | | | | 179 | |
Contract insurance and bonding | | | 122 | | | | (4) | | | | 118 | | | | 132 | | | | – | | | | 132 | |
Political risk insurance | | | 610 | | | | (115) | | | | 495 | | | | 311 | | | | (91) | | | | 220 | |
Total | | | $875 | | | | $(129) | | | | $746 | | | | $640 | | | | $(109) | | | | $531 | |
| | | | | | | | | | | | |
| | |
| (in millions of Canadian dollars) | | Jan. 1, 2010 | |
| | | Insurance | | | Reinsurance | | | Net liability | |
Credit insurance | | | 263 | | | | (8) | | | | 255 | |
Contract insurance and bonding | | | 170 | | | | – | | | | 170 | |
Political risk insurance | | | 360 | | | | (151) | | | | 209 | |
Total | | | $793 | | | | $(159) | | | | $634 | |
The policy and claims liabilities are comprised of the following components:
| | | | | | | | | | | | |
| | | | |
| (in millions of Canadian dollars) | | Dec. 31, 2011 | | | Dec. 31, 2010 | | | Jan. 1, 2010 | |
Deferred insurance premiums | | | 93 | | | | 71 | | | | 73 | |
Allowance for claims on insurance | | | 782 | | | | 569 | | | | 720 | |
Total policy and claims liabilities | | | $875 | | | | $640 | | | | $793 | |
During the year, the policy and claims liabilities were impacted by the following factors:
| | | | | | | | | | | | | | | | | | | | | | | | |
(in millions of Canadian dollars) | | Dec. 31, 2011 | | | Dec. 31, 2010 | |
| | | Insurance | | | Reinsurance | | | Net liability | | | Insurance | | | Reinsurance | | | Net liability | |
Balance at beginning of year | | | 640 | | | | (109) | | | | 531 | | | | 793 | | | | (159) | | | | 634 | |
Change in portfolio make-up and risk ratings | | | 227 | | | | (16) | | | | 211 | | | | (84 | ) | | | 32 | | | | (52 | ) |
Update of actuarial assumptions | | | 6 | | | | (13) | | | | (7) | | | | (32 | ) | | | 15 | | | | (17 | ) |
Change due to special assumptions and calculation platform change | | | (11 | ) | | | 13 | | | | 2 | | | | (22 | ) | | | – | | | | (22 | ) |
Foreign exchange translation | | | 13 | | | | (4) | | | | 9 | | | | (15 | ) | | | 3 | | | | (12 | ) |
Balance at end of year | | | $875 | | | | $(129) | | | | $746 | | | | $640 | | | | $(109) | | | | $531 | |
EDC ANNUAL REPORT 2011 | 113
CONSOLIDATED FINANCIAL STATEMENTS
20. Financing Commitments
We have three types of financing commitments.
The first type is undisbursed amounts on signed loan agreements totalling $9,722 million (2010 – $9,003 million). These commitments are immediately available to the obligor for drawdown subject to continued adherence to contractual covenants established under the financing agreements.
Undisbursed amounts on signed loan agreements with their committed fixed rates or committed floating rate spreads are outlined in the following table. All yields are computed on a weighted average basis and the spreads for floating interest rates represent the spreads over base rates which consist mainly of LIBOR for U.S. dollars.
| | | | | | | | | | | | | | | | | | | | | | | | | | | | | | | | | | | | | | | | |
(in millions of Canadian dollars) | | | | | | | | | | | Dec. 31, 2011 | | | | | | | | | | | | Dec. 31, 2010 | |
| | | Fixed
$ | | | Estimated
spot yield
% | | | Floating
$ | | | Spread % | | | Total $ | | | Fixed
$ | | | Estimated
spot yield
% | | | Floating
$ | | | Spread
% | | | Total $ | |
Commercial | | | 314 | | | | 4.54 | | | | 9,202 | | | | 1.83 | | | | 9,516 | | | | 117 | | | | 7.28 | | | | 8,601 | | | | 2.01 | | | | 8,718 | |
Sovereign | | | 103 | | | | 5.93 | | | | 103 | | | | 3.33 | | | | 206 | | | | 111 | | | | 5.79 | | | | 174 | | | | 3.33 | | | | 285 | |
Total | | | $417 | | | | 4.89 | | | | $9,305 | | | | 1.85 | | | | $9,722 | | | | $228 | | | | 6.56 | | | | $8,775 | | | | 2.04 | | | | $9,003 | |
We also have loan commitments for which terms related to the transaction such as interest rate type and disbursement schedule have not yet been determined. This category of commitments includes letters of offer accepted and outstanding for loans of $2,022 million (2010 – $2,180 million) and loan guarantees of $179 million (2010 – $87 million) as well as unallocated, confirmed lines of credit of $410 million (2010 – $384 million).
The third type of financing commitments relate to equity investments and total $283 million (2010 – $314 million), of which all are commitments to equity investment funds. Commitments are generally drawn down over a five-year period and draw downs are normally at the discretion of the fund managers.
21. Contingent Liabilities
Our contingent liabilities include credit insurance, contract insurance and bonding and political risk insurance policies and guarantees which represent direct risks undertaken. We also increase our contingent liability by assuming exposure from other insurers. We reduce our contingent liability by ceding reinsurance in both the credit insurance and political risk insurance programs to other insurance companies.
The credit insurance program protects exporters of goods and services trading on credit terms of up to a year against non-payment due to commercial and political risks. Commercial and political risks covered include buyer insolvency, default, repudiation of goods by buyer, contract cancellation and conversion and risk transfer, cancellation of export or import permits, or war-related risks. The contract insurance and bonding program provides cover for sales on exposure terms usually greater than one year and includes export credit insurance and guarantees, performance guarantees and surety, extending cover for risks inherent in performance related obligations. Political risk insurance provides risk protection for equity and other investments abroad.
At the end of December 2011, we had contingent liabilities of $28,959 million (2010 – $25,718 million) which mature as follows:
| | | | | | | | | | | | | | | | | | | | | | | | | | | | | | | | | | | | | | | | |
(in millions of Canadian dollars) | | | | | | | | Dec. 31, 2011 | | | | | | | | | Dec. 31, 2010 | |
| | | Credit
insurance | | | Contract
insurance
and
bonding | | | Political
risk
insurance | | | Guar- antees* | | | Total | | | Credit
insurance | | | Contract
insurance
and
bonding | | | Political
risk
insurance | | | Guar- antees* | | | Total | |
2011 | | | – | | | | – | | | | – | | | | – | | | | – | | | | 11,566 | | | | 1,077 | | | | 102 | | | | 4,624 | | | | 17,369 | |
2012 | | | 14,773 | | | | 1,041 | | | | 161 | | | | 4,824 | | | | 20,799 | | | | – | | | | 818 | | | | 58 | | | | 3,930 | | | | 4,806 | |
2013 | | | – | | | | 585 | | | | 55 | | | | 4,216 | | | | 4,856 | | | | – | | | | 248 | | | | 59 | | | | 483 | | | | 790 | |
2014 | | | – | | | | 322 | | | | 23 | | | | 332 | | | | 677 | | | | – | | | | 206 | | | | 22 | | | | 257 | | | | 485 | |
2015 | | | – | | | | 318 | | | | 37 | | | | 96 | | | | 451 | | | | – | | | | 383 | | | | 41 | | | | 47 | | | | 471 | |
2016 | | | – | | | | 61 | | | | 316 | | | | 120 | | | | 497 | | | | – | | | | 24 | | | | 307 | | | | 38 | | | | 369 | |
2017 – 2021 | | | – | | | | 338 | | | | 955 | | | | 121 | | | | 1,414 | | | | – | | | | 185 | | | | 1,096 | | | | 92 | | | | 1,373 | |
2022 and beyond | | | – | | | | – | | | | 248 | | | | 17 | | | | 265 | | | | – | | | | – | | | | 36 | | | | 19 | | | | 55 | |
Total | | | $14,773 | | | | $2,665 | | | | $1,795 | | | | $9,726 | | | | $28,959 | | | | $11,566 | | | | $2,941 | | | | $1,721 | | | | $9,490 | | | | $25,718 | |
| * | Includes $6,986 million of guarantees within the contract insurance and bonding program (2010 – $6,943 million). |
114 | BUILDING RESILIENCE IN UNCERTAIN TIMES
INSURANCE POLICIES
The major concentrations of risk by location are as follows:
CREDIT INSURANCE
| | | | | | | | | | | | | | | | | | | | | | | | | | | | | | | | | | |
(in millions of Canadian dollars) | | Dec. 31, 2011 | | | Dec. 31, 2010 | |
| | | Credit
insurance | | | Rein- surance
ceded | | | Rein- surance
assumed | | | Net credit
insurance | | | | | Credit
insurance | | | Rein- surance
ceded | | | Rein surance
assumed | | | Net credit
insurance | |
United States | | | 3,891 | | | | (72 | ) | | | – | | | | 3,819 | | | United States | | | 3,518 | | | | (133 | ) | | | – | | | | 3,385 | |
China | | | 2,419 | | | | (2 | ) | | | – | | | | 2,417 | | | China | | | 1,125 | | | | (1 | ) | | | – | | | | 1,124 | |
Turkey | | | 1,037 | | | | – | | | | – | | | | 1,037 | | | Turkey | | | 729 | | | | (1 | ) | | | – | | | | 728 | |
India | | | 920 | | | | – | | | | – | | | | 920 | | | South Korea | | | 681 | | | | (52 | ) | | | – | | | | 629 | |
Brazil | | | 663 | | | | – | | | | – | | | | 663 | | | Brazil | | | 621 | | | | (4 | ) | | | – | | | | 617 | |
Canada | | | 397 | | | | (7 | ) | | | 75 | | | | 465 | | | Canada | | | 284 | | | | (23 | ) | | | 72 | | | | 333 | |
Other | | | 5,544 | | | | (92 | ) | | | – | | | | 5,452 | | | Other | | | 5,022 | | | | (272 | ) | | | – | | | | 4,750 | |
Total | | | $14,871 | | | | $(173 | ) | | | $75 | | | | $14,773 | | | Total | | | $11,980 | | | | $(486 | ) | | | $72 | | | | $11,566 | |
CONTRACT INSURANCE AND BONDING
| | | | | | | | | | | | | | | | | | | | | | | | | | |
(in millions of Canadian dollars) | | Dec. 31, 2011 | | | Dec. 31, 2010 | |
| | | Contract
insurance
and
bonding | | | Rein- surance
assumed | | | Net contract
insurance
and
bonding(2) | | | | | Contract
insurance
and
bonding | | | Rein- surance
assumed | | | Net contract
insurance
and
bonding(2) | |
Canada | | | 20 | | | | 2,001 | (1) | | | 2,021 | | | Canada | | | 507 | | | | 1,759 | (1) | | | 2,266 | |
United States | | | 62 | | | | 163 | | | | 225 | | | United States | | | 74 | | | | 239 | | | | 313 | |
China | | | 87 | | | | – | | | | 87 | | | Mexico | | | 63 | | | | 2 | | | | 65 | |
Mexico | | | 61 | | | | 2 | | | | 63 | | | China | | | 43 | | | | – | | | | 43 | |
United Arab Emirates | | | 54 | | | | – | | | | 54 | | | United Arab Emirates | | | 25 | | | | – | | | | 25 | |
Other | | | 203 | | | | 12 | | | | 215 | | | Other | | | 222 | | | | 7 | | | | 229 | |
Total | | | $487 | | | | $2,178 | | | | $2,665 | | | Total | | | $934 | | | | $2,007 | | | | $2,941 | |
| (1) | Of this amount, $520 million (2010 – $458 million) relates to our temporarily expanded mandate. |
POLITICAL RISK INSURANCE
| | | | | | | | | | | | | | | | | | | | | | | | | | | | | | | | | | |
(in millions of Canadian dollars) | | Dec. 31, 2011 | | | Dec. 31, 2010 | |
| | | Political
risk
insurance | | | Rein- surance
assumed | | | Rein- surance
ceded | | | Net
political
risk
insurance | | | | | Political
risk
insurance | | | Rein- surance
assumed | | | Rein- surance
ceded | | | Net
political
risk
insurance | |
Libya | | | 300 | | | | – | | | | – | | | | 300 | | | Libya | | | 300 | | | | – | | | | – | | | | 300 | |
Peru | | | 366 | | | | – | | | | (116 | ) | | | 250 | | | Brazil | | | 313 | | | | 15 | | | | (59 | ) | | | 269 | |
China | | | 29 | | | | 183 | | | | – | | | | 212 | | | Colombia | | | 338 | | | | – | | | | (82 | ) | | | 256 | |
Angola | | | 277 | | | | – | | | | (66 | ) | | | 211 | | | Peru | | | 313 | | | | – | | | | (79 | ) | | | 234 | |
Thailand | | | 188 | | | | – | | | | (48 | ) | | | 140 | | | Dominican Republic | | | 335 | | | | 14 | | | | (196 | ) | | | 153 | |
Other | | | 1,355 | | | | 61 | | | | (734 | ) | | | 682 | | | Other | | | 1,028 | | | | 36 | | | | (555 | ) | | | 509 | |
Total | | | $2,515 | | | | $244 | | | | $(964 | ) | | | $1,795 | | | Total | | | $2,627 | | | | $65 | | | | $(971 | ) | | | $1,721 | |
EDC ANNUAL REPORT 2011 | 115
CONSOLIDATED FINANCIAL STATEMENTS
GUARANTEES
We issue performance security guarantees which provide coverage to the exporter’s bank for up to 100% of the guarantee value in the event of any call by the buyer. Financial security guarantees are issued to provide coverage to the exporter’s bank for up to 100% of the guarantee value in the event of any call by the supplier and any foreign bank. Foreign exchange guarantees are also issued which provide a guarantee to secure the settlement risks associated with foreign exchange forward contracts. Each guarantee issued stipulates a recovery provision whereby the third party, the exporter, agrees to indemnify us should a payment be made under the guarantee. Unless otherwise stated, the indemnification agreement generally ranks as an unsecured liability of the exporter.
We issue loan guarantees to cover non-payment of principal, interest and fees due to banks and financial institutions providing loans to buyers of Canadian goods and services. Calls on guarantees result in our recognition of a loan asset within our financial statements and become a direct obligation of the buyer. At the end of December 2011, loan guarantees on secured loans totalled $53 million (2010 – $52 million) and guarantees with impaired obligors totalled $114 million (2010 – $51 million).
At the end of December 2011, we have guarantees outstanding of $9,726 million (2010 – $9,490 million).
| | | | | | | | | | | | |
(in millions of Canadian dollars) | | Dec. 31, 2011 | | | Dec. 31, 2010 | | | | |
Contract insurance and bonding: | | | | | | | | | |
Performance security guarantees(1) | | | 6,613 | | | | 6,469 | | |
Foreign exchange guarantees | | | 339 | | | | 337 | | |
Financial security guarantees | | | 34 | | | | 137 | | |
Contract insurance and bonding guarantees | | | 6,986 | | | | 6,943 | | |
Loan guarantees(2) | | | 2,740 | | | | 2,547 | | |
Total | | | $9,726 | | | | $9,490 | | |
(1) Includes $610 million of domestic performance security guarantees relating to our temporarily expanded mandate (2010 – $446 million). (2) Includes $37 million of domestic loan guarantees relating to our temporarily expanded mandate (2010 – $27 million). | | |
Loan guarantees on the statement of financial position are comprised as follows: | |
(in millions of Canadian dollars) | | Dec. 31, 2011 | | | Dec. 31, 2010 | | | Jan. 1, 2010 | |
Deferred guarantee fee revenue | | | 60 | | | | 60 | | | | 68 | |
Allowance for losses on loan guarantees | | | 206 | | | | 185 | | | | 242 | |
Total | | | $266 | | | | $245 | | | | $310 | |
We are involved in various legal proceedings in the ordinary course of business. Management does not expect the outcome of any of these proceedings to have a material effect on our consolidated financial position or our results of operations.
22. Reinsurance Agreements
We cede reinsurance to limit exposure to large losses. Reinsurance contracts do not relieve us of our obligations to the insured. However, they do provide for the recovery of claims arising from the liabilities ceded. We have a reinsurance treaty agreement covering the credit insurance portfolio and some bonding obligors, as well as some facultative cover arrangements. Within the contract insurance and bonding and political risk insurance programs reinsurance is acquired on a transaction by transaction basis and currently no treaties are in place. Our risk management group assesses and monitors counterparty risks of the reinsurers; management has determined that no additional allowance is required for this ceded exposure.
We have assumed export risks for a number of Canadian exporters under facultative arrangements with private credit insurers. For the surety bond insurance line of business, within the contract insurance and bonding program, we have general reinsurance agreements with several surety companies. In addition, we have assumed facultative reinsurance positions under our contract frustration, surety bonding and political risk insurance products.
116 | BUILDING RESILIENCE IN UNCERTAIN TIMES
The effect of reinsurance on our contingent liability is disclosed in Note 21 and the impact on premiums is as follows:
| | | | | | | | | | | | | | | | | | | | | | | | | | | | | | | | |
(in millions of
Canadian dollars) | | Dec. 31, 2011 | | | Dec. 31, 2010 | |
| | | Direct premium and guarantee fees | | | Rein- surance premium assumed | | | Rein- surance premium ceded | | | Total premium and guarantee fees | | | Direct premium and guarantee fees | | | Rein- surance premium assumed | | | Rein- surance premium ceded | | | Total premium and guarantee fees | |
Credit insurance | | | 163 | | | | 5 | | | | (7 | ) | | | 161 | | | | 148 | | | | 3 | | | | (6 | ) | | | 145 | |
Contract insurance and bonding | | | 51 | | | | 8 | | | | (1 | ) | | | 58 | | | | 43 | | | | 8 | | | | – | | | | 51 | |
Political risk insurance | | | 24 | | | | – | | | | (9 | ) | | | 15 | | | | 19 | | | | – | | | | (5 | ) | | | 14 | |
Total | | | $238 | | | | $13 | | | | $(17 | ) | | | $234 | | | | $210 | | | | $11 | | | | $(11 | ) | | | $210 | |
23. Insurance Risks
INSURANCE AND FINANCIAL RISK
The risks within our insurance program are mitigated by diversification across geographical markets, industries and a portfolio of insurance contracts across uncorrelated product lines. We further manage our risk through the application of a detailed underwriting process which ensures that exposures receive tiered levels of due diligence based on their size and level of risk. Our risk acceptance decisions are supported by the Corporation’s strong resources in the areas of economics, political risk and legal. Our risk management procedures also include the use of risk transfer arrangements.
The core operating principles for risk transfer activity are to (1) mitigate potential large losses due to existing high concentration in obligor, sector and country risk, (2) protect from credit deterioration within the portfolio, and (3) proactively acquire additional credit capacity.
We engage in various risk transfer activities primarily through co-insurance and reinsurance. Co-insurance can be defined as leveraging another insurer’s capacity by jointly sharing the risk of the original insurance policy. A co-insurance agreement is typically put in place at the time of origination of the transaction. Under this structure, we are not exposed to the credit risk of the co-insurer. Under a reinsurance structure, we assume the risk of the original policy, and cede that risk to a counterparty (the “reinsurer”). Under this structure, we are exposed to the credit risk of the reinsurer (referred to as counterparty risk.) To help mitigate this risk, our placement of reinsurance is diversified such that it is not dependent on a single reinsurer. Reinsurance counterparty exposure is managed under our reinsurance counterparty management procedures and monitored by our Market Risk Management team.
INSURANCE AND GUARANTEE CONTRACTS
We principally issue insurance to our customers to protect them against non-payment by an obligor and/or other losses due to political risk. Guarantees are typically issued to the counterparties of our customers in order to provide them with recourse should our customers not perform as contracted.
A. Credit Risk
Within our credit insurance and contract insurance and bonding programs, our primary risk is credit risk. The credit risk may be that of our customers or their obligors. During our underwriting process, our assessment considers both an entity’s ability and willingness to pay. Ability to pay is primarily based on the financial strength, operations and leadership of the entity (commercial or sovereign) that is the source of our risk. Other factors such as their industry’s environment, the economy, as well as political and geographical events are also considered. Willingness to pay primarily involves an assessment of the entity’s payment history, reputation and governance.
B. Political Risk
Within our political risk insurance program, we primarily underwrite political risks as opposed to the credit risk as discussed above. Our assessment considers politically motivated events that may jeopardize our clients’ assets or income in a foreign market. As a baseline for our risk assessment of a given market we assess the transfer and convertibility of local currency, expropriation risk as well as the risk of political violence.
In addition to our risk management procedures discussed above, our Claims and Recoveries team thoroughly reviews debt files at all stages of the overdue, claim and recovery process. This team manages and pursues debt files so as to minimize losses. Continuously evolving documentation and analytical standards also ensure that the claims process and its outcomes are appropriate and consistent.
We also manage our exposure through policy structuring measures including the use of maximum liability amounts and risk sharing with our customers on certain contracts.
EDC ANNUAL REPORT 2011 | 117
CONSOLIDATED FINANCIAL STATEMENTS
ACTUARIAL CALCULATION
PRINCIPAL RISKS
There is a limitation upon the accuracy of the policy and claims liabilities, as there is an inherent uncertainty in any estimate of policy and claims liabilities. There is uncertainty in any estimate because future events could affect the ultimate claim amounts. Examples of future events include, but are not limited to:
| | (2) | higher than anticipated claim loss development; |
| | (3) | concentration of credit losses; and |
| | (4) | geo-political considerations. |
Therefore the actual ultimate claim amount may differ materially from estimates. However, we have employed standard actuarial techniques and appropriate assumptions to mitigate this risk.
KEY ASSUMPTIONS
The key risk components to the insurance provisioning exercise are claim frequency, claim severity, future claim development, and foreign exchange rates. These risk components are analyzed and estimated using EDC’s own loss experience. A qualitative component is added to these quantitative risk components as warranted by external factors as mentioned above.
SENSITIVITY ANALYSIS
The following table illustrates the impact on net income of variations in key risk components. A 10% change was applied to key risk components and the impact on policy and claims liabilities was quantified. The largest sensitivities pertain to claim frequency, claim severity and foreign exchange rates.
KEY RISKS SENSITIVITIES
| | | | | | | | | | | | |
| (in millions of Canadian dollars) | | Dec. 31, 2011 | |
| | | Changes in assumptions | | | Impact on gross liabilities | | | Impact on net income | |
Frequency of claims | | | +10% | | | | 45 | | | | 36 | |
Frequency of claims | | | -10% | | | | (47 | ) | | | (37 | ) |
Severity of claims | | | +10% | | | | 49 | | | | 39 | |
Severity of claims | | | -10% | | | | (50 | ) | | | (41 | ) |
Foreign exchange rates | | | +10% | | | | 63 | | | | 48 | |
Foreign exchange rates | | | -10% | | | | (63 | ) | | | (47 | ) |
Claims development | | | +10% | | | | 6 | | | | 6 | |
Claims development | | | -10% | | | | (6 | ) | | | (6 | ) |
| | | | | | | | | | | | |
| | | | |
| (in millions of Canadian dollars) | | | | | | | | Dec. 31, 2010 | |
| | | Changes in assumptions | | | Impact on gross liabilities | | | Impact on net income | |
Frequency of claims | | | +10% | | | | 38 | | | | 30 | |
Frequency of claims | | | -10% | | | | (40 | ) | | | (31 | ) |
Severity of claims | | | +10% | | | | 41 | | | | 33 | |
Severity of claims | | | -10% | | | | (42 | ) | | | (34 | ) |
Foreign exchange rates | | | +10% | | | | 55 | | | | 42 | |
Foreign exchange rates | | | -10% | | | | (54 | ) | | | (41 | ) |
Claims development | | | +10% | | | | 8 | | | | 8 | |
Claims development | | | -10% | | | | (8 | ) | | | (8 | ) |
118 | BUILDING RESILIENCE IN UNCERTAIN TIMES
CLAIMS DEVELOPMENT
As time passes the ultimate cost for the claims become more certain. The chart below compares actual claims with previous estimates.
| | | | | | | | | | | | | | | | | | | | | | | | |
| (in millions of Canadian dollars) | | | | | | | | | | | | | | | | | | |
| | | | | | | |
| Underwriting Year | | 2007 | | | 2008 | | | 2009 | | | 2010 | | | 2011 | | | Total | |
Estimate of cumulative claims: | | | | | | | | | | | | | | | | | | | | | | | | |
At end of underwriting year | | | 44 | | | | 92 | | | | 68 | | | | 51 | | | | 44 | | | | | |
One year later | | | 52 | | | | 132 | | | | 40 | | | | 34 | | | | | | | | | |
Two years later | | | 53 | | | | 115 | | | | 38 | | | | | | | | | | | | | |
Three years later | | | 51 | | | | 109 | | | | | | | | | | | | | | | | | |
Four years later | | | 48 | | | | | | | | | | | | | | | | | | | | | |
Estimate of cumulative claims (at Dec. 31, 2011) | | | 48 | | | | 109 | | | | 38 | | | | 34 | | | | 44 | | | | 273 | |
Cumulative payments (at Dec. 31, 2011) | | | 46 | | | | 104 | | | | 34 | | | | 27 | | | | 10 | | | | 221 | |
Effect of margin and discounting | | | – | | | | 2 | | | | – | | | | 1 | | | | 5 | | | | 8 | |
2007-2011 Claim Liabilities (IBNR) (at Dec. 31, 2011) | | | 2 | | | | 7 | | | | 4 | | | | 8 | | | | 39 | | | | 60 | |
24. Equity
EDC’s authorized share capital is $3.0 billion consisting of 30 million shares with a par value of $100 each. The number of shares issued and fully paid is 13.3 million (2010 – 13.3 million). These shares entitle our shareholder to receive a dividend from time to time. No shares were issued in 2011 (2010 – nil). In March 2011, a dividend of $350 million was paid to the Government of Canada (2010 – nil). The dividend per share in 2011 was $26.32 (2010 – nil).
25. Capital Management
EDC has a capital management process in place to ensure that we are appropriately capitalized and that our capital position is identified, measured, managed and regularly reported to the Board of Directors. We are not subject to externally imposed capital requirements.
Our primary objective with respect to capital management is to ensure that EDC has adequate capital to support the evolving needs of Canadian exporters and investors while remaining financially self-sustaining.
We manage our capital through a Board approved capital adequacy policy. Under our capital adequacy policy we determine whether we have adequate capital by comparing the supply of capital to the demand for capital. Demand for capital is calculated by a model which estimates the capital required to cover the extreme value of potential losses (including both expected and unexpected losses) arising from credit, interest rate, foreign exchange, operational and business risk. Additional capital, beyond that required to support these core risks, is designated as strategic risk capital and is made available for strategic initiatives and possible volatility in core risk capital. The supply of capital is determined by our financial statements and consists of paid-in share capital, retained earnings and allowances. There were no changes to our capital adequacy policy in 2011.
A key principle in our capital management is the establishment of a target solvency standard or credit rating which determines the level of demand for capital that is required to cover EDC’s exposures in exceptional circumstances. We target a level of capitalization sufficient to cover potential losses consistent with a rating standard of AA.
The following table represents the breakdown of EDC’s supply of capital at December 31:
| | | | | | | | | | | | |
| | | | |
| (in millions of Canadian dollars) | | Dec. 31, 2011 | | | Dec. 31, 2010 | | | Jan. 1, 2010 | |
Allowance for losses on loans | | | 1,680 | | | | 1,561 | | | | 1,934 | |
Allowance for losses on loan commitments | | | 41 | | | | 93 | | | | 453 | |
Allowance for losses on loan guarantees | | | 206 | | | | 185 | | | | 242 | |
Allowance for claims on insurance | | | 782 | | | | 569 | | | | 720 | |
Reinsurers’ share of policy and claims liabilities | | | (129 | ) | | | (109 | ) | | | (159 | ) |
Share capital | | | 1,333 | | | | 1,333 | | | | 1,333 | |
Retained earnings | | | 6,923 | | | | 6,628 | | | | 5,153 | |
Supply of capital | | | $10,836 | | | | $10,260 | | | | $9,676 | |
EDC ANNUAL REPORT 2011 | 119

CONSOLIDATED FINANCIAL STATEMENTS
26. Interest Rate Risk
The following table summarizes our interest rate risk based on the gap between the notional amount of assets and liabilities grouped by the earlier of contractual re-pricing or maturity dates. Notional amounts reflect our true exposure to re-pricing at various maturities. The differences between the notional amounts and the carrying values, the positions not subject to re-pricing risk, and equity are presented in the non-interest rate sensitive column to ensure comparability with the statement of financial position. The effective interest rates shown indicate historical rates for fixed rate and floating rate instruments.
| | | | | | | | | | | | | | | | | | | | | | | | | | | | |
(in millions of Canadian dollars) | | Immediately
rate-sensitive | | | Up to 6 months | | | Over 6 to
12 months | | | Over 1 to 5 years | | | Over 5 years | | | Non-interest
rate sensitive(2) | | | Dec. 31, 2011
Total | |
Assets | | | | | | | | | | | | | | | | | | | | | | | | | | | | |
Cash and marketable securities | | | 90 | | | | 1,690 | | | | 104 | | | | 1,372 | | | | 505 | | | | 125 | | | | 3,886 | |
Gross loans receivable | | | 350 | | | | 19,702 | | | | 478 | | | | 3,546 | | | | 3,212 | | | | 1,805 | | | | 29,093 | |
Effective interest rate % | | | 5.43 | % | | | 3.04 | % | | | 5.33 | % | | | 5.57 | % | | | 5.12 | % | | | | | | | | |
Less: | | | | | | | | | | | | | | | | | | | | | | | | | | | | |
Deferred revenue and other credits | | | | | | | | | | | | | | | | | | | | | | | (558 | ) | | | (558 | ) |
Net allowance for losses on loans | | | | | | | | | | | | | | | | | | | | | | | (1,680 | ) | | | (1,680 | ) |
Finance leases | | | – | | | | 5 | | | | 5 | | | | 66 | | | | 16 | | | | | | | | 92 | |
Effective interest rate % | | | – | | | | 7.31 | % | | | 7.31 | % | | | 7.36 | % | | | 7.20 | % | | | | | | | | |
Equity financing | | | | | | | | | | | | | | | | | | | | | | | 385 | | | | 385 | |
Equipment available for lease, other assets and accrued interest | | | | | | | | | | | | | | | | | | | | | | | 2,378 | | | | 2,378 | |
Total assets | | | $440 | | | | $21,397 | | | | $587 | | | | $4,984 | | | | $3,733 | | | | $2,455 | | | | $33,596 | |
Liabilities and equity | | | | | | | | | | | | | | | | | | | | | | | | | | | | |
Loans payable | | | | | | | 7,561 | | | | 3,644 | | | | 10,886 | | | | 878 | | | | 601 | | | | 23,570 | |
Effective interest rate % | | | | | | | 1.25 | % | | | 3.36 | % | | | 3.21 | % | | | 5.81 | % | | | | | | | | |
Total pay side instruments on swap contracts | | | | | | | 19,979 | | | | 409 | | | | – | | | | – | | | | 6,884 | | | | 27,272 | |
Effective interest rate % | | | | | | | 0.98 | % | | | – | | | | – | | | | – | | | | | | | | | |
Total receive side instruments on swap contracts | | | | | | | (6,142 | ) | | | (3,036 | ) | | | (10,930 | ) | | | (879 | ) | | | (6,916 | ) | | | (27,903 | ) |
Effective interest rate % | | | | | | | 4.19 | % | | | 4.66 | % | | | 3.48 | % | | | 4.11 | % | | | | | | | | |
Cumulative foreign exchange translation on cross currency interest rate swaps(1) | | | | | | | | | | | | | | | | | | | | | | | 631 | | | | 631 | |
Total loans payable | | | | | | | | | | | | | | | | | | | | | | | | | | | 23,570 | |
Other liabilities and deferred revenue | | | | | | | | | | | | | | | | | | | | | | | 1,770 | | | | 1,770 | |
Equity | | | | | | | | | | | | | | | | | | | | | | | 8,256 | | | | 8,256 | |
Total liabilities and equity | | | $– | | | | $21,398 | | | | $1,017 | | | | $(44 | ) | | | $(1 | ) | | | $11,226 | | | | $33,596 | |
At December 31, 2011 | | | | | | | | | | | | | | | | | | | | | | | | | | | | |
Total gap | | | 440 | | | | (1 | ) | | | (430 | ) | | | 5,028 | | | | 3,734 | | | | (8,771 | ) | | | – | |
Cumulative gap | | | 440 | | | | 439 | | | | 9 | | | | 5,037 | | | | 8,771 | | | | – | | | | – | |
Canadian dollar | | | 186 | | | | 1,166 | | | | (200 | ) | | | (462 | ) | | | 503 | | | | (1,193 | ) | | | – | |
Foreign currency | | | 254 | | | | (1,167 | ) | | | (230 | ) | | | 5,490 | | | | 3,231 | | | | (7,578 | ) | | | – | |
Total gap | | | $440 | | | | $(1 | ) | | | $(430 | ) | | | $5,028 | | | | $3,734 | | | | $(8,771 | ) | | | $– | |
| (1) | Due to foreign exchange translation, the pay and receive side instruments may not net to zero. This amount represents the difference caused by foreign exchange translation on the pay and receive side instruments on swap contracts. |
| (2) | Included in non-interest rate sensitive amounts are the differences between the carrying amounts and the notional amounts, foreign exchange contracts and foreign exchange forwards not sensitive to interest rates. |
120 | BUILDING RESILIENCE IN UNCERTAIN TIMES
| | | | | | | | | | | | | | | | | | | | | | | | | | | | |
| (in millions of Canadian dollars) | | Immediately
rate-sensitive | | | Up to 6 months | | | Over 6 to
12 months | | | Over 1 to
5 years | | | Over 5 years | | | Non-interest
rate sensitive(2) | | | Dec. 31, 2010
Total | |
Assets | | | | | | | | | | | | | | | | | | | | | | | | | | | | |
Cash and marketable securities | | | 124 | | | | 1,761 | | | | 18 | | | | 1,346 | | | | 482 | | | | 72 | | | | 3,803 | |
Gross loans receivable | | | 166 | | | | 18,327 | | | | 427 | | | | 3,644 | | | | 3,723 | | | | 710 | | | | 26,997 | |
Effective interest rate % | | | 6.48 | % | | | 2.88 | % | | | 5.48 | % | | | 5.71 | % | | | 5.52 | % | | | | | | | | |
Less: | | | | | | | | | | | | | | | | | | | | | | | | | | | | |
Deferred revenue and other credits | | | | | | | | | | | | | | | | | | | | | | | (549 | ) | | | (549 | ) |
Net allowance for losses on loans | | | | | | | | | | | | | | | | | | | | | | | (1,561 | ) | | | (1,561 | ) |
Finance leases | | | – | | | | 5 | | | | 5 | | | | 44 | | | | 45 | | | | | | | | 99 | |
Effective interest rate % | | | – | | | | 7.31 | % | | | 7.31 | % | | | 7.32 | % | | | 7.31 | % | | | | | | | | |
Equity financing | | | | | | | | | | | | | | | | | | | | | | | 317 | | | | 317 | |
Equipment available for lease, other assets and accrued interest | | | | | | | | | | | | | | | | | | | | | | | 2,776 | | | | 2,776 | |
Total assets | | | $290 | | | | $20,093 | | | | $450 | | | | $5,034 | | | | $4,250 | | | | $1,765 | | | | $31,882 | |
Liabilities and equity | | | | | | | | | | | | | | | | | | | | | | | | | | | | |
Loans payable | | | | | | | 7,189 | | | | 2,930 | | | | 11,075 | | | | 861 | | | | 429 | | | | 22,484 | |
Effective interest rate % | | | | | | | 2.63 | % | | | 2.94 | % | | | 3.48 | % | | | 5.20 | % | | | | | | | | |
Total pay side instruments on swap contracts | | | | | | | 18,915 | | | | 103 | | | | – | | | | – | | | | 5,821 | | | | 24,839 | |
Effective interest rate % | | | | | | | 0.64 | % | | | 4.50 | % | | | – | | | | – | | | | | | | | | |
Total receive side instruments on swap contracts | | | | | | | (6,000 | ) | | | (2,969 | ) | | | (10,080 | ) | | | (832 | ) | | | (6,128 | ) | | | (26,009 | ) |
Effective interest rate % | | | | | | | 4.22 | % | | | 4.68 | % | | | 3.49 | % | | | 4.11 | % | | | | | | | | |
Cumulative foreign exchange translation on cross currency interest rate swaps(1) | | | | | | | | | | | | | | | | | | | | | | | 1,170 | | | | 1,170 | |
Total loans payable | | | | | | | | | | | | | | | | | | | | | | | | | | | 22,484 | |
Other liabilities, accrued interest and deferred revenue | | | | | | | | | | | | | | | | | | | | | | | 1,437 | | | | 1,437 | |
Equity | | | | | | | | | | | | | | | | | | | | | | | 7,961 | | | | 7,961 | |
Total liabilities and equity | | | $– | | | | $20,104 | | | | $64 | | | | $995 | | | | $29 | | | | $10,690 | | | | $31,882 | |
At December 31, 2010 | | | | | | | | | | | | | | | | | | | | | | | | | | | | |
Total gap | | | 290 | | | | (11 | ) | | | 386 | | | | 4,039 | | | | 4,221 | | | | (8,925 | ) | | | – | |
Cumulative gap | | | 290 | | | | 279 | | | | 665 | | | | 4,704 | | | | 8,925 | | | | – | | | | – | |
Canadian dollar | | | 102 | | | | 1,191 | | | | 43 | | | | 279 | | | | 191 | | | | (1,806 | ) | | | – | |
Foreign currency | | | 188 | | | | (1,202 | ) | | | 343 | | | | 3,760 | | | | 4,030 | | | | (7,119 | ) | | | – | |
Total gap | | | $290 | | | | $(11 | ) | | | $386 | | | | $4,039 | | | | $4,221 | | | | $(8,925 | ) | | | $– | |
| (1) | Due to foreign exchange translation, the pay and receive side instruments may not net to zero. This amount represents the difference caused by foreign exchange translation on the pay and receive side instruments on swap contracts. |
| (2) | Included in non-interest rate sensitive amounts are the differences between the carrying amounts and the notional amounts, foreign exchange contracts and foreign exchange forwards not sensitive to interest rates. |
EDC ANNUAL REPORT 2011 | 121
CONSOLIDATED FINANCIAL STATEMENTS
27. Foreign Currency Balances
We have substantial assets and liabilities denominated in U.S. dollars and in other currencies. In addition, we have derivative financial instruments denominated in various currencies. The purpose of these derivative financial instruments is to minimize our cost of capital and optimize our yields, while remaining within treasury guidelines and limits approved by our Board of Directors.
The following table shows where we have used derivative financial instruments to manage the foreign currency exposures of our asset and liability positions. The net foreign currency exposure at the end of December 2011 (expressed in Canadian equivalent dollars) is as follows:
| | | | | | | | | | | | | | | | | | | | | | | | | | | | | | | | | | |
(in millions of Canadian dollars) | | | | | | | | | | | | | | | | | | | | | | | | | Dec. 31, 2011 | |
| | | | | | | | Assets | | | | | | | | | | | | | | Liabilities | | | | | | | | Net foreign | | |
| Foreign
|
|
| | | | Gross | | | | DI* | | | | Net | | | | | | Gross | | | | DI* | | | | Net | | |
| currency
exposure |
| |
| exchange
rate |
|
U.S. dollars | | | 26,189 | | | | – | | | | 26,189 | | | | | | (17,204 | ) | | | (9,270 | ) | | | (26,474 | ) | | | (285 | ) | | | 1.0164 | |
Euros | | | 1,260 | | | | – | | | | 1,260 | | | | | | (15 | ) | | | (1,259 | ) | | | (1,274 | ) | | | (14 | ) | | | 1.3173 | |
British pounds | | | 997 | | | | – | | | | 997 | | | | | | (1,324 | ) | | | 330 | | | | (994 | ) | | | 3 | | | | 1.5766 | |
Australian dollars | | | 654 | | | | – | | | | 654 | | | | | | (2,140 | ) | | | 1,464 | | | | (676 | ) | | | (22 | ) | | | 1.0414 | |
Japanese yen | | | 287 | | | | – | | | | 287 | | | | | | (574 | ) | | | 287 | | | | (287 | ) | | | – | | | | 0.0132 | |
Mexican peso | | | 164 | | | | – | | | | 164 | | | | | | – | | | | (166 | ) | | | (166 | ) | | | (2 | ) | | | 0.0728 | |
Polish zloty | | | 67 | | | | – | | | | 67 | | | | | | – | | | | (67 | ) | | | (67 | ) | | | – | | | | 0.2951 | |
Czech koruna | | | 63 | | | | – | | | | 63 | | | | | | – | | | | (62 | ) | | | (62 | ) | | | 1 | | | | 0.0515 | |
Brazilian real | | | 45 | | | | – | | | | 45 | | | | | | – | | | | (45 | ) | | | (45 | ) | | | – | | | | 0.5455 | |
New Zealand dollars | | | 42 | | | | – | | | | 42 | | | | | | – | | | | (52 | ) | | | (52 | ) | | | (10 | ) | | | 0.7927 | |
Hong Kong dollars | | | 35 | | | | – | | | | 35 | | | | | | (276 | ) | | | 241 | | | | (35 | ) | | | – | | | | 0.1309 | |
Tanzanian shilling | | | 11 | | | | – | | | | 11 | | | | | | – | | | | (6 | ) | | | (6 | ) | | | 5 | | | | 0.0006 | |
Swedish krona | | | – | | | | – | | | | – | | | | | | (446 | ) | | | 446 | | | | – | | | | – | | | | 0.1477 | |
Norwegian krone | | | – | | | | – | | | | – | | | | | | (457 | ) | | | 461 | | | | 4 | | | | 4 | | | | 0.1701 | |
Swiss franc | | | – | | | | – | | | | – | | | | | | (315 | ) | | | 315 | | | | – | | | | – | | | | 1.0836 | |
Turkish lira | | | – | | | | – | | | | – | | | | | | (27 | ) | | | 27 | | | | – | | | | – | | | | 0.5392 | |
| * | DI represents derivative instruments. See Note 17. |
| | | | | | | | | | | | | | | | | | | | | | | | | | | | | | | | | | |
(in millions of Canadian dollars) | | | | | | | | | | | | | | | | | | | | | | | | | Dec. 31, 2010 | |
| | | | | | | | Assets | | | | | | | | | | | | | | Liabilities | | | | | | | | Net foreign | | | | Foreign | |
| | | | Gross | | | | DI* | | | | Net | | | | | | Gross | | | | DI* | | | | Net | | |
| currency
exposure |
| |
| exchange
rate |
|
U.S. dollars | | | 24,189 | | | | – | | | | 24,189 | | | | | | (16,074 | ) | | | (8,312 | ) | | | (24,386 | ) | | | (197 | ) | | | 0.9946 | |
British pounds | | | 1,066 | | | | – | | | | 1,066 | | | | | | (987 | ) | | | (86 | ) | | | (1,073 | ) | | | (7 | ) | | | 1.5513 | |
Euros | | | 964 | | | | – | | | | 964 | | | | | | (4 | ) | | | (952 | ) | | | (956 | ) | | | 8 | | | | 1.3319 | |
Australian dollars | | | 495 | | | | – | | | | 495 | | | | | | (1,366 | ) | | | 872 | | | | (494 | ) | | | 1 | | | | 1.0170 | |
Japanese yen | | | 434 | | | | – | | | | 434 | | | | | | (581 | ) | | | 150 | | | | (431 | ) | | | 3 | | | | 0.0123 | |
Hong Kong dollars | | | 96 | | | | – | | | | 96 | | | | | | (270 | ) | | | 174 | | | | (96 | ) | | | – | | | | 0.1280 | |
Polish zloty | | | 79 | | | | – | | | | 79 | | | | | | – | | | | (79 | ) | | | (79 | ) | | | – | | | | 0.3361 | |
Czech koruna | | | 70 | | | | – | | | | 70 | | | | | | – | | | | (70 | ) | | | (70 | ) | | | – | | | | 0.0532 | |
Brazilian real | | | 53 | | | | – | | | | 53 | | | | | | – | | | | (52 | ) | | | (52 | ) | | | 1 | | | | 0.5994 | |
New Zealand dollars | | | 43 | | | | – | | | | 43 | | | | | | (158 | ) | | | 115 | | | | (43 | ) | | | – | | | | 0.7747 | |
Singapore dollars | | | 41 | | | | – | | | | 41 | | | | | | – | | | | (42 | ) | | | (42 | ) | | | (1 | ) | | | 0.7752 | |
Mexican peso | | | 35 | | | | – | | | | 35 | | | | | | (45 | ) | | | 8 | | | | (37 | ) | | | (2 | ) | | | 0.0806 | |
Tanzanian shilling | | | 32 | | | | – | | | | 32 | | | | | | – | | | | (29 | ) | | | (29 | ) | | | 3 | | | | 0.0007 | |
Swiss franc | | | – | | | | – | | | | – | | | | | | (459 | ) | | | 459 | | | | – | | | | – | | | | 1.0645 | |
Norwegian krone | | | – | | | | – | | | | – | | | | | | (306 | ) | | | 306 | | | | – | | | | – | | | | 0.1707 | |
Swedish krona | | | – | | | | – | | | | – | | | | | | (440 | ) | | | 440 | | | | – | | | | – | | | | 0.1481 | |
| * | DI represents derivative instruments. See Note 17. |
122 | BUILDING RESILIENCE IN UNCERTAIN TIMES
| | | | | | | | | | | | | | | | | | | | | | | | | | | | | | | | | | |
(in millions of Canadian dollars) | | | | | | | | | | | | | | | | | | | | | | | | | Jan. 1, 2010 | |
| | | | | | | | Assets | | | | | | | | | | | | | | Liabilities | | | | | | |
| Net foreign
|
| |
| Foreign
|
|
| | | | Gross | | | | DI* | | | | Net | | | | | | Gross | | | | DI* | | | | Net | | | | currency exposure | | | | exchange rate | |
U.S. dollars | | | 21,838 | | | | 3,053 | | | | 24,891 | | | | | | (17,515 | ) | | | (7,427 | ) | | | (24,942 | ) | | | (51 | ) | | | 1.0466 | |
Euros | | | 1,050 | | | | – | | | | 1,050 | | | | | | (7 | ) | | | (1,024 | ) | | | (1,031 | ) | | | 19 | | | | 1.5000 | |
British pounds | | | 956 | | | | – | | | | 956 | | | | | | (1,849 | ) | | | 895 | | | | (954 | ) | | | 2 | | | | 1.6918 | |
Japanese yen | | | 405 | | | | – | | | | 405 | | | | | | (711 | ) | | | 307 | | | | (404 | ) | | | 1 | | | | 0.0112 | |
Australian dollars | | | 383 | | | | – | | | | 383 | | | | | | (63 | ) | | | (321 | ) | | | (384 | ) | | | (1 | ) | | | 0.9387 | |
Hong Kong dollars | | | 114 | | | | – | | | | 114 | | | | | | (284 | ) | | | 170 | | | | (114 | ) | | | – | | | | 0.1350 | |
Czech koruna | | | 70 | | | | – | | | | 70 | | | | | | – | | | | (70 | ) | | | (70 | ) | | | – | | | | 0.0570 | |
Brazilian real | | | 56 | | | | – | | | | 56 | | | | | | – | | | | (56 | ) | | | (56 | ) | | | – | | | | 0.6006 | |
Polish zloty | | | 56 | | | | – | | | | 56 | | | | | | – | | | | (56 | ) | | | (56 | ) | | | – | | | | 0.3661 | |
Tanzanian shilling | | | 46 | | | | – | | | | 46 | | | | | | – | | | | (46 | ) | | | (46 | ) | | | – | | | | 0.0008 | |
New Zealand dollars | | | 39 | | | | – | | | | 39 | | | | | | (686 | ) | | | 648 | | | | (38 | ) | | | 1 | | | | 0.7587 | |
Singapore dollars | | | 39 | | | | – | | | | 39 | | | | | | – | | | | (39 | ) | | | (39 | ) | | | – | | | | 0.7459 | |
Mexican peso | | | 23 | | | | – | | | | 23 | | | | | | (82 | ) | | | 57 | | | | (25 | ) | | | (2 | ) | | | 0.0801 | |
Norwegian krone | | | – | | | | – | | | | – | | | | | | (322 | ) | | | 321 | | | | (1 | ) | | | (1 | ) | | | 0.1804 | |
Swiss franc | | | – | | | | – | | | | – | | | | | | (430 | ) | | | 417 | | | | (13 | ) | | | (13 | ) | | | 1.0106 | |
Turkish lira | | | – | | | | – | | | | – | | | | | | (53 | ) | | | 53 | | | | – | | | | – | | | | 0.6986 | |
| * | DI represents derivative instruments. See Note 17. |
Throughout the year, our assets and liabilities were denominated mainly in U.S. dollars, Euros and British pounds.
EDC ANNUAL REPORT 2011 | 123
CONSOLIDATED FINANCIAL STATEMENTS
28. Fair Value of Financial Instruments
Fair value represents our estimation of the amount for which an asset could be exchanged, or a liability settled, between knowledgeable, willing parties in an arm’s length transaction.
As with any estimate, uncertainty is inherent due to the unpredictability of future events. In the case of estimating the fair value of our financial instruments, this uncertainty is magnified due to the large number of assumptions used and the wide range of acceptable valuation techniques. Estimates of fair values are based on market conditions at a certain point in time, and may not be reflective of future market conditions. Therefore, the estimates of the fair value of financial instruments outlined as follows do not necessarily reflect the actual values that may occur should the instruments be exchanged in the market.
| | | | | | | | | | | | | | | | | | | | | | | | |
(in millions of Canadian dollars) | | | | | Dec. 31, 2011 | | | | | | Dec. 31, 2010 | | | | | | Jan. 1, 2010 | |
| | | | Carrying value | | | | Fair value | | | | Carrying value | | | | Fair value | | | | Carrying value | | | | Fair value | |
Assets | | | | | | | | | | | | | | | | | | | | | | | | |
Performing fixed rate loans | | | 7,481 | | | | 7,768 | | | | 7,892 | | | | 8,408 | | | | 7,918 | | | | 7,229 | |
Performing floating rate loans | | | 18,364 | | | | 17,132 | | | | 16,956 | | | | 16,169 | | | | 16,297 | | | | 15,535 | |
Total performing loans receivable | | | 25,845 | | | | 24,900 | | | | 24,848 | | | | 24,577 | | | | 24,215 | | | | 22,764 | |
Carrying value of individually impaired loans | | | 1,178 | | | | 1,178 | | | | 229 | | | | 229 | | | | 358 | | | | 358 | |
Loans receivable and accrued interest and fees | | | 27,023 | | | | 26,078 | | | | 25,077 | | | | 24,806 | | | | 24,573 | | | | 23,122 | |
Cash | | | 90 | | | | 90 | | | | 124 | | | | 124 | | | | 52 | | | | 52 | |
Marketable securities: | | | | | | | | | | | | | | | | | | | | | | | | |
At fair value through profit or loss | | | 3,720 | | | | 3,720 | | | | 3,660 | | | | 3,660 | | | | 5,335 | | | | 5,335 | |
At amortized cost | | | 76 | | | | 76 | | | | 19 | | | | 19 | | | | 20 | | | | 20 | |
Equity financing at fair value through profit or loss | | | 385 | | | | 385 | | | | 317 | | | | 317 | | | | 198 | | | | 198 | |
Recoverable insurance claims | | | 44 | | | | 44 | | | | 94 | | | | 94 | | | | 93 | | | | 93 | |
Derivative instruments | | | 1,541 | | | | 1,541 | | | | 2,010 | | | | 2,010 | | | | 1,909 | | | | 1,909 | |
Liabilities | | | | | | | | | | | | | | | | | | | | | | | | |
Accounts payable | | | 159 | | | | 159 | | | | 166 | | | | 166 | | | | 146 | | | | 146 | |
Loans payable: | | | | | | | | | | | | | | | | | | | | | | | | |
Designated at fair value through profit or loss | | | 21,505 | | | | 21,505 | | | | 20,465 | | | | 20,465 | | | | 22,139 | | | | 22,139 | |
At amortized cost | | | 2,065 | | | | 2,155 | | | | 2,019 | | | | 2,144 | | | | 2,294 | | | | 2,414 | |
Derivative instruments | | | 178 | | | | 178 | | | | 200 | | | | 200 | | | | 222 | | | | 222 | |
Loan guarantees | | | 266 | | | | 266 | | | | 245 | | | | 245 | | | | 310 | | | | 310 | |
We have controls and policies in place to ensure that our valuations are appropriate and realistic. In general, the methodologies, models and assumptions used to measure the fair value of our financial assets and liabilities are determined by our Market Risk Management team, which is not involved in the initiation of the transactions. The models, valuation methodologies, and market-based parameters and inputs that are used, are subject to regular review and validation, including a comparison with values from outside agencies. In limited circumstances where the valuation of a financial instrument is not independent from the initiation of the transaction, the resulting valuation is subject to review by a valuation committee.
The assumptions and valuation techniques that we use to estimate fair values are as follows:
124 | BUILDING RESILIENCE IN UNCERTAIN TIMES
LOANS RECEIVABLE
In order to estimate the fair value of our performing loans receivable (including accrued interest receivable), we separate them into risk pools and calculate the net present value of principal and interest cash flows. The discount rates are obtained from yield curves for each risk pool and are specific to the credit risk and term to maturity associated with each principal and interest cash flow.
The fair value of impaired loans is considered to be equal to their carrying value.
MARKETABLE SECURITIES
We estimate the fair value of marketable securities using observable market prices. If such prices are not available, we determine the fair value by discounting future cash flows using an appropriate yield curve.
EQUITY FINANCING
Our approach to fair value measurement has been derived by guidelines issued by the International Private Equity and Venture Capital (“IPEVC”) Valuation Guideline. Depending on the type of investment, we estimate fair value using one of the following: (i) market-based methodologies, such as the quoted share price or the price of recent investments; (ii) discounted earnings or cash flow approaches; or (iii) liquidation or asset-based methods. The valuations are established by management and reviewed and approved by an independent valuation committee with representatives from our Risk Management and Finance groups.
Significant assumptions used in the determination of fair value can include discount or capitalization rate, rate of return and the weighting of forecasted earnings.
LOANS PAYABLE
The fair value of our less complex loans payable is determined using the discounted cash flow method. Forward rates are used to value floating rate cash flows occurring in the future. Cash flows are discounted using the respective currency’s yield curve. Inputs to the models are market observable and may include interest rate yield curves and foreign exchange rates.
For our more complex loans payable which may include optionality, we estimate fair value using valuation models when independent market prices are not available. Inputs to these models include option volatilities and correlations in addition to interest rate yield curves and foreign exchange rates.
DERIVATIVES
Foreign exchange forwards and foreign exchange swaps are valued by discounting the notional amounts using the respective currency’s yield curve and converting the amounts using the spot Canadian dollar exchange rate.
Interest rate and cross currency interest rate swaps are valued using a discounted cash flow method. Forward rates are used to determine floating rate cash flows occurring in the future. Cash flows are discounted using the respective currency’s yield curve. Inputs to the models are market observable and may include interest rate yield curves and foreign exchange rates.
For more complex swaps which may include optionality, including cross currency interest rate swaps, interest rate swaps and non-deliverable forwards, the fair value is determined using models which are developed from recognized valuation techniques. Inputs to these models include option volatilities and correlations in addition to interest rate yield curves and foreign exchange rates. Credit default swaps are valued with the additional input of market based par credit default swap spreads or by using quoted prices from dealers where appropriate.
The valuations determined using the methodologies described above are adjusted for the credit risk of the counterparty where appropriate.
FINANCIAL INSTRUMENTS WITH CARRYING VALUE APPROXIMATING FAIR VALUE
Fair value is assumed to equal carrying value for cash, recoverable insurance claims, accounts payable and loan guarantees due to the short-term nature of these instruments.
FAIR VALUE HIERARCHY
The following table presents the fair value hierarchy for those items carried on our statement of financial position at fair value. The fair value hierarchy prioritizes the valuation techniques used to determine the fair value of a financial instrument based on whether the inputs to those techniques are observable or unobservable.
| | u | Level 1 – fair values are based on quoted prices (unadjusted) in active markets for identical assets or liabilities; | |
| | u | Level 2 – fair values are determined using inputs other than quoted prices included within Level 1 that are observable for the assets or liabilities, either directly (i.e. as prices) or indirectly (i.e. derived from prices); | |
| | u | Level 3 – fair values are determined using inputs for the assets or liabilities that are not based on observable market data (unobservable inputs). | |
EDC ANNUAL REPORT 2011 | 125
CONSOLIDATED FINANCIAL STATEMENTS
| | | | | | | | | | | | | | | | | | | | | | | | |
(in millions of Canadian dollars) | | Dec. 31, 2011 | | | | Dec. 31, 2010 | | | | Jan. 1, 2010 |
| | | Level 1 | | Level 2 | | Level 3 | | Total | | Level 1 | | Level 2 | | Level 3 | | Total | | Level 1 | | Level 2 | | Level 3 | | Total |
Assets | | | | | | | | | | | | | | | | | | | | | | | | |
Marketable securities: | | | | | | | | | | | | | | | | | | | | | | | | |
At fair value through profit or loss | | 2,029 | | 1,691 | | – | | 3,720 | | 1,917 | | 1,743 | | – | | 3,660 | | 1,089 | | 4,246 | | – | | 5,335 |
Equity financing at fair value through profit or loss | | – | | – | | 385 | | 385 | | – | | – | | 317 | | 317 | | – | | – | | 198 | | 198 |
Derivative instruments | | – | | 1,517 | | 24 | | 1,541 | | – | | 2,010 | | – | | 2,010 | | – | | 1,909 | | – | | 1,909 |
Liabilities | | | | | | | | | | | | | | | | | | | | | | | | |
Loans payable: | | | | | | | | | | | | | | | | | | | | | | | | |
Designated at fair value through profit or loss | | – | | 20,894 | | 611 | | 21,505 | | – | | 20,465 | | – | | 20,465 | | – | | 22,139 | | – | | 22,139 |
Derivative instruments | | – | | 178 | | – | | 178 | | – | | 200 | | – | | 200 | | – | | 222 | | – | | 222 |
The following table summarizes the reconciliation of Level 3 fair values between 2010 and 2011 for equity financing, loans payable designated at fair value through profit or loss and derivatives.
| | | | | | | | | | | | | | | | |
(in millions of Canadian dollars) | | | | | | | | | | | Dec. 31, 2011 | |
| | | Equity financing at
fair value through
profit or loss | | | Loans payable
designated at
fair value through
profit or loss | | | Derivatives | | | Total | |
Balance at beginning of year | | | 317 | | | | – | | | | – | | | | 317 | |
Unrealized gains (losses) included in income | | | (14 | ) | | | (64 | ) | | | 26 | | | | (52 | ) |
Purchases of assets/issuances of liabilities | | | 106 | | | | (519 | ) | | | (2 | ) | | | (415 | ) |
Return of capital | | | (29 | ) | | | – | | | | – | | | | (29 | ) |
Foreign exchange translation | | | 5 | | | | (28 | ) | | | – | | | | (23 | ) |
Balance at end of year | | | $385 | | | | $(611 | ) | | | $24 | | | | $(202 | ) |
Total gains (losses) for the year included in comprehensive income for instruments held at end of the year | | | $(7 | ) | | | $(64 | ) | | | $26 | | | | $(45 | ) |
| | | | | | | | | | | | | | | | | |
(in millions of Canadian dollars) | | | | | | | | | | | Dec. 31, 2010 | |
| | | Equity financing at
fair value through
profit or loss | | | Loans payable
designated at
fair value through
profit or loss | | | Derivatives | | | Total | |
Balance at beginning of year | | | 198 | | | | – | | | | – | | | | 198 | |
Unrealized gains included in income | | | 39 | | | | – | | | | – | | | | 39 | |
Write-off | | | (15 | ) | | | – | | | | – | | | | (15 | ) |
Purchases of assets/issuance of liabilities | | | 117 | | | | – | | | | – | | | | 117 | |
Return of capital | | | (10 | ) | | | – | | | | – | | | | (10 | ) |
Foreign exchange translation | | | (12 | ) | | | – | | | | – | | | | (12 | ) |
Balance at end of year | | | $317 | | | | $– | | | | $– | | | | $317 | |
Total gains for the year included in comprehensive income for instruments held at end of the year | | | $24 | | | | $– | | | | $– | | | | $24 | |
Changes in valuation methods may result in transfers into or out of levels 1, 2, and 3. In 2011 there were no transfers between levels (2010 – none).
126 | BUILDING RESILIENCE IN UNCERTAIN TIMES
In 2011, a sensitivity analysis was performed using possible alternative assumptions to recalculate the fair value of our Level 3 financial instruments. The fair value of Level 3 financial instruments is in whole or in part based on unobservable inputs. In preparing financial statements, appropriate levels for these unobservable inputs parameters are chosen so that they are consistent with prevailing market evidence or management judgment.
In order to perform our sensitivity analysis we adjusted the yield curve and volatility assumptions used to value our Level 3 loans payable and derivative assets. The results of our analysis on our Level 3 loans payable ranged from an unfavourable change of $11 million to a favourable change of $28 million. On our Level 3 derivative assets the impact ranged from an unfavourable change of $23 million to a favourable change of $9 million.
The effects of applying other possible alternative assumptions to our Level 3 equity financing portfolio would be an increase of $8 million in fair value.
29. Financial Instrument Risks
The principal risks that we are exposed to as a result of holding financial instruments, are credit, market and liquidity risk.
CREDIT RISK
Credit risk is the risk of loss incurred if a counterparty fails to meet its financial commitments. We are exposed to credit risk on financial instruments under both our loans program and our treasury activities. Our objectives, policies and processes for managing credit risk as well as the methods we use to measure this risk are disclosed in the notes related to our derivative financial instruments and debt instruments, as well as in the text and tables displayed in green font in management’s discussion and analysis on pages 67 to 69 of this annual report.
CONCENTRATION OF CREDIT RISK
Concentration of credit risk exposure exists when a number of counterparties operate in the same geographical market or industry, or engage in similar activities. Changes in economic or political conditions may affect their ability to meet obligations in a similar manner. We have limits in place to ensure that our exposure is not overly concentrated in any one country, industry or counterparty. Exposure in excess of these limits requires approval of our Board of Directors.
The following table provides a breakdown, by the country in which the risk resides, of the maximum gross exposure to credit risk of financial instruments:
| | | | | | | | | | | | | | | | | | | | | | | | | | | | | | | | |
(in millions of Canadian dollars) | | Gross loans
receivable | | | Loan
guarantees | | | Equity
financing | | | Investments
and derivative
instruments | | | | | | Dec. 31, 2011
Exposure | | | | | | Dec. 31, 2010
Exposure | |
Country | | | | | | | | | | | | | | | | | | | $ | | | | % | | | | $ | | | | % | |
United States | | | 9,690 | | | | 895 | | | | 13 | | | | 3,296 | | | | 13,894 | | | | 37 | | | | 13,768 | | | | 39 | |
Canada | | | 3,560 | | | | 1,119 | | | | 166 | | | | 1,806 | | | | 6,651 | | | | 18 | | | | 6,085 | | | | 17 | |
Mexico | | | 1,750 | | | | 118 | | | | 23 | | | | – | | | | 1,891 | | | | 5 | | | | 1,698 | | | | 5 | |
India | | | 1,480 | | | | 6 | | | | 66 | | | | – | | | | 1,552 | | | | 4 | | | | 1,532 | | | | 4 | |
Brazil | | | 1,393 | | | | 56 | | | | 7 | | | | – | | | | 1,456 | | | | 4 | | | | 970 | | | | 3 | |
United Kingdom | | | 917 | | | | – | | | | 19 | | | | 89 | | | | 1,025 | | | | 3 | | | | 1,087 | | | | 3 | |
Chile | | | 959 | | | | 1 | | | | – | | | | – | | | | 960 | | | | 3 | | | | 1,012 | | | | 3 | |
Qatar | | | 768 | | | | – | | | | – | | | | – | | | | 768 | | | | 2 | | | | 680 | | | | 2 | |
Australia | | | 730 | | | | 1 | | | | – | | | | 19 | | | | 750 | | | | 2 | | | | 529 | | | | 1 | |
Spain | | | 662 | | | | – | | | | – | | | | – | | | | 662 | | | | 1 | | | | 512 | | | | 1 | |
Other | | | 7,184 | | | | 544 | | | | 91 | | | | 217 | | | | 8,036 | | | | 21 | | | | 7,801 | | | | 22 | |
Total | | | $29,093 | | | | $2,740 | | | | $385 | | | | $5,427 | | | | $37,645 | | | | 100 | | | | $35,674 | | | | 100 | |
EDC ANNUAL REPORT 2011 | 127
CONSOLIDATED FINANCIAL STATEMENTS
The concentration of credit risk by industry sector for our financial instruments is as follows:
| | | 000000 | | | | 000000 | | | | 000000 | | | | 000000 | | | | 000000 | | | | 000000 | | | | 000000 | | | | 000000 | |
(in millions of Canadian dollars) | | Gross loans
receivable | | | Loan
guarantees | | | Equity
financing | | | Investments
and derivative
instruments | | | Dec. 31, 2011 Exposure | | | Dec. 31, 2010
Exposure | |
Industry | | | | | | | | | | | | | | | | | | | $ | | | | % | | | | $ | | | | % | |
Commercial: | | | | | | | | | | | | | | | | | | | | | | | | | | | | | | | | |
Aerospace | | | 10,060 | | | | 76 | | | | – | | | | – | | | | 10,136 | | | | 27 | | | | 8,966 | | | | 25 | |
Extractive | | | 6,570 | | | | 260 | | | | 5 | | | | – | | | | 6,835 | | | | 18 | | | | 5,916 | | | | 17 | |
Surface transportation | | | 3,748 | | | | 1,167 | | | | – | | | | – | | | | 4,915 | | | | 13 | | | | 4,810 | | | | 13 | |
Financial institutions | | | 876 | | | | 59 | | | | 162 | | | | 2,136 | | | | 3,233 | | | | 9 | | | | 3,920 | | | | 11 | |
Infrastructure and environment* | | | 2,745 | | | | 289 | | | | 60 | | | | – | | | | 3,094 | | | | 8 | | | | 2,594 | | | | 7 | |
Information and communication technology | | | 2,648 | | | | 164 | | | | 43 | | | | – | | | | 2,855 | | | | 8 | | | | 3,559 | | | | 10 | |
Other | | | 1,107 | | | | 568 | | | | 115 | | | | 14 | | | | 1,804 | | | | 5 | | | | 1,577 | | | | 5 | |
| | |
Total commercial | | | 27,754 | | | | 2,583 | | | | 385 | | | | 2,150 | | | | 32,872 | | | | 88 | | | | 31,342 | | | | 88 | |
Sovereign | | | 1,339 | | | | 157 | | | | – | | | | 3,277 | | | | 4,773 | | | | 12 | | | | 4,332 | | | | 12 | |
| | |
Total | | | $29,093 | | | | $2,740 | | | | $385 | | | | $5,427 | | | | $37,645 | | | | 100 | | | | $35,674 | | | | 100 | |
| | |
| * | Excludes financial institution exposure which is disclosed separately in this table. |
MARKET RISK
Market risk is the risk that the fair value or future cash flows of a financial instrument will fluctuate because of changes in market prices. Market risk comprises three types of risk: foreign exchange risk, interest rate risk, and other price risk. We are exposed to potential negative impacts on the value of financial instruments resulting from adverse movements in interest and foreign exchange rates. We have policies and procedures in place to ensure that interest rate and foreign exchange risks are identified, measured, managed and regularly reported to management and the Board of Directors.
INTEREST RATE RISK
Interest rate risk is the risk that the fair value or future cash flows of a financial instrument will fluctuate because of changes in market interest rates. We are exposed to potential adverse impacts on the value of financial instruments resulting from differences in the maturities or repricing dates of assets and liabilities, as well as from embedded optionality in those assets and liabilities.
FOREIGN EXCHANGE RISK
Foreign exchange risk is the potential adverse impact on the value of financial instruments resulting from exchange rate movements. We are exposed to foreign exchange rate risk when there is a mismatch between assets and liabilities in any currency.
Our objectives, policies and processes for managing market risk as well as a sensitivity analysis for our exposure to both interest rate and foreign exchange risk is disclosed in the text and tables displayed in green font in management’s discussion and analysis on pages 69 to 70 of this annual report.
LIQUIDITY RISK
Liquidity risk is the risk that we would be unable to honour daily cash commitments or the risk that we would have to obtain funds rapidly, possibly at an excessively high premium during severe market conditions. We maintain liquidity through a variety of methods such as holding cash and marketable securities, and having access to commercial paper markets.
Our objectives, policies and processes for managing liquidity risk as well as the methods we use to measure this risk is disclosed in the text and tables displayed in green font in management’s discussion and analysis on pages 71 to 72 of this annual report.
128 | BUILDING RESILIENCE IN UNCERTAIN TIMES
30. Special Purpose Entities
In the 2005 to 2011 timeframe, we foreclosed on a number of aircraft loans and as a result, various aircraft for which we were a secured lender were returned to us. In 2011 we also received two aircraft as part of an exchange agreement. From 2006 to 2011, these aircraft were placed into trusts which are considered to be Special Purpose Entities (SPE) under IFRS. An SPE is defined as an entity created to accomplish a narrow and well-defined objective. Under SIC 12 – Consolidation, Special Purpose Entities, when a reporting entity is exposed, or has rights to variable returns from its involvement with an SPE or has the ability to affect those returns through its decision-making power over the SPE, the SPE is consolidated within that entity’s financial statements. These trusts have therefore been consolidated and have total assets of $178 million at the end of December 2011 (2010 – $230 million; January 1, 2010 – $432 million). These assets are included in equipment available for lease, net investment in aircraft under finance leases, and aircraft held-for-sale. Aircraft held-for-sale are included in other assets (see Note 11).
In the normal course of business, we have also entered into secured leveraged lease financing transactions in the aerospace and rail transportation industries in which we have lent funds through special purpose entities and in some cases provided guarantees to the equity holders of these entities. As we do not control these entities, they do not require consolidation under SIC 12. These entities had assets of $6,520 million at the end of December 2011 (2010 – $5,485 million; January 1, 2010 – $5,507 million). The entities in the rail transportation industry were created in the 1999 to 2010 timeframe, while the SPEs in the aerospace industry were created in the 1995 to 2011 timeframe. Our maximum exposure to loss as a result of involvement with these entities was $4,199 million at the end of December 2011 (2010 – $3,669 million; January 1, 2010 – $3,625 million). Of this amount, $3,723 million (2010 – $3,202 million; January 1, 2010 – $3,131 million) relates to the net loans receivable (gross loans receivable less the total allowance for loan losses) and investment in joint ventures, and $476 million (2010 – $467 million; January 1, 2010 – $494 million) relates to the guarantees provided to the equity holders.
31. Loan Revenue
| | | | |
| | | |
| (in millions of Canadian dollars) | | 2011 | | 2010 |
Loan interest – floating rate | | 469 | | 440 |
Loan interest – fixed rate | | 425 | | 460 |
Impaired revenue | | 9 | | 15 |
Loan fee revenue | | 98 | | 80 |
Other loan revenue | | 8 | | 9 |
Total loan revenue | | $1,009 | | $1,004 |
| |
32. Investment Revenue
| | | | |
| | | |
| (in millions of Canadian dollars) | | 2011 | | 2010 |
Instruments at fair value through profit or loss | | | | |
Short-term investments | | 5 | | 5 |
Long-term investments | | 41 | | 42 |
| | | | | |
Total investment revenue | | $46 | | $47 |
| | | | | |
EDC ANNUAL REPORT 2011 | 129
CONSOLIDATED FINANCIAL STATEMENTS
33. Interest Expense
| | | | |
| | | |
| (in millions of Canadian dollars) | | 2011 | | 2010 |
Debt designated at fair value through profit or loss
and related derivatives | | | | |
Short-term debt | | 29 | | 30 |
Long-term debt – floating | | 78 | | 67 |
Long-term debt – fixed* | | (26) | | (15) |
Debt carried at amortized cost | | | | |
Long-term debt – fixed | | 78 | | 82 |
| | | | | |
Total interest expense on debt and related derivatives | | 159 | | 164 |
Interest income on currency swaps related to capital | | (70) | | (28) |
Other | | 10 | | 11 |
| | | | | |
Total interest expense | | $99 | | $147 |
| | | | | |
| * | Includes interest on instruments with cashflows that offset the cashflows of some long-term debt carried at amortized cost. |
34. Leasing and Financing Related Expenses
| | | | |
| | | |
| (in millions of Canadian dollars) | | 2011 | | 2010 |
Maintenance and technical costs | | 4 | | 15 |
Depreciation | | 16 | | 24 |
Other | | 12 | | 14 |
| | | | | |
Total leasing and financing related expenses | | $32 | | $53 |
| | | | | |
35. Provision for (Reversal of) Credit Losses
The composition of the provision for credit losses, expressed on the statement of comprehensive income, is as follows:
| | | | |
| | | |
| (in millions of Canadian dollars) | | 2011 | | 2010 |
Credit migration | | 186 | | (36) |
Changes in portfolio composition(1) | | (164) | | (203) |
Updates to independent variables: | | | | |
Changes in collateral values | | 190 | | 70 |
Updated probability of default rates | | (84) | | (6) |
Changes in estimates of loss emergence period | | 50 | | (90) |
Increased concentration threshold | | (28) | | (17) |
Refinements to the methodology(2) | | – | | (312) |
Other | | (25) | | (37) |
| | | | | |
Provision for (reversal of) credit losses | | $125 | | $(631) |
| | | | | |
| (1) | Represents provision requirements (release) as a result of disbursements, new financing volume and repayments. |
| | | | |
| | | |
| (in millions of Canadian dollars) | | 2011 | | 2010 |
Provision for (reversal of) losses on loans | | 162 | | (234) |
Reversal of losses on loan commitments | | (53) | | (350) |
Provision for (reversal of) losses on loan guarantees | | 16 | | (47) |
| | | | | |
Provision for (reversal of) credit losses | | $125 | | $(631) |
| | | | | |
130 | BUILDING RESILIENCE IN UNCERTAIN TIMES
36. Claims-Related Expenses
The composition of the claims-related expenses, expressed on the statement of comprehensive income, is as follows:
| | | | |
| | | |
| (in millions of Canadian dollars) | | 2011 | | 2010 |
Claims paid | | 54 | | 113 |
Claims paid – reinsured policies | | 1 | | 13 |
Claims recovered | | (40) | | (36) |
Actuarial increase/(decrease) in the net allowance for claims | | 179 | | (84) |
Reinsurers’ share of claims paid | | – | | (3) |
Reinsurers’ share of claims recovered | | 1 | | – |
Decrease/(increase) in recoverable insurance claims | | 50 | | (4) |
Claims handling expenses | | 2 | | 2 |
| | | | | |
Total claims-related expenses | | $247 | | $1 |
| | | | | |
37. Other Income (Expenses)
| | | 00000000000 | | | | 00000000000 | |
| | | |
| (in millions of Canadian dollars) | | 2011 | | | 2010 | |
Net unrealized gain (loss) on loans payable designated at fair value through profit or loss | | | (147) | | | | 179 | |
Net unrealized gain (loss) on debt related derivatives | | | 139 | | | | (128) | |
Net realized and unrealized gain on marketable securities at fair value through profit or loss | | | 71 | | | | 39 | |
Net realized and unrealized gain (loss) on loan related credit default swaps | | | 24 | | | | (9) | |
Foreign exchange translation gain (loss) | | | (23) | | | | 8 | |
Equity investment income | | | 12 | | | | 8 | |
Net realized and unrealized gain (loss) on equity investments at fair value through profit or loss(1) | | | (7) | | | | 24 | |
Impairment loss on equipment available for lease(2) | | | – | | | | (176) | |
Other | | | 10 | | | | 14 | |
Total other income (expenses) | | | $79 | | | | $(41) | |
| | | | | | | | | |
We have designated the majority of our long-term bonds at fair value through profit or loss in order to obtain the same accounting treatment as their related derivatives. In general, these derivatives are entered into to manage interest and foreign exchange rate risks on the related bonds. At the end of December 2011, the unrealized losses on loans payable designated at fair value through profit or loss totalled $147 million (2010 – gain of $179 million) and the unrealized gains on the derivatives associated with the loans payable totalled $139 million (2010 – loss of $128 million). In accordance with IFRS, our debt is valued on the basis of our credit rating (AAA) while the related derivatives are valued based on curves that reflect the credit risk of the resulting exposure. During 2011, most rates relevant to the valuation of our debt and the related derivatives fell; leading to gains on our derivatives which almost offset the losses on our debt.
The majority of our marketable securities are measured at fair value through profit or loss; consistent with our business model for managing these instruments. At the end of December 2011, realized and unrealized gains on marketable securities at fair value through profit or loss totalled $71 million (2010 – gain of $39 million). During 2011 most long-term rates decreased; generating gains on our portfolio as most securities are long-term.
During 2011, we recorded a net unrealized gain of $24 million (2010 – loss of $9 million) on our portfolio of loan related credit default swaps. The majority of this gain was related to an increase in the fair value on the portion of our portfolio where we bought protection. This reflected increased market volatility that was experienced during the latter half of the year as a result of uncertainty associated with some of the underlying entities. In addition, a portion of our portfolio where we sold protection was called. This resulted in the realization of $12 million (2010 – nil) of the unrealized losses recognized since the inception of these instruments.
EDC ANNUAL REPORT 2011 | 131
CONSOLIDATED FINANCIAL STATEMENTS
38. Administrative Expenses
| | | 000000000 | | | | 000000000 | |
| | | |
| (in millions of Canadian dollars) | | 2011 | | | 2010 | |
Salaries and benefits | | | 154 | | | | 157 | |
Pension, other retirement and post-employment benefits | | | 30 | | | | 23 | |
Accommodation | | | 20 | | | | 17 | |
Amortization and depreciation | | | 25 | | | | 19 | |
Other | | | 55 | | | | 57 | |
| | | | | | | | | |
Total administrative expenses | | | $284 | | | | $273 | |
| | | | | | | | | |
39. Retirement Benefit Obligations
PENSION PLANS
Effective April 24, 2000, we established pension benefit plans for our employees. The plans are defined benefit plans, providing benefits to retirees based on years of service and the best five consecutive years’ average salary of the employees. Upon retirement, the benefits are fully indexed to inflation. All permanent employees are members of the Registered Pension Plan; however, employee contributions to the plan are optional.
Upon the establishment of the pension plans, employees made an election to transfer their benefits from the Public Service Superannuation Fund. The related obligation and the assets to fund the plans that were transferred from the Government of Canada are included in the obligation and assets shown in the table on the next page.
We maintain a registered defined benefit pension plan and a supplemental defined benefit pension plan. The purpose of the Supplementary Retirement Plan is to supplement benefits to those of its members whose benefits and/or contributions under the registered plan are affected by Income Tax Act maximums. It does so by increasing their benefits to the level which would be payable under the Registered Pension Plan if these maximums did not apply. Effective January 1, 2012, we added a new defined contribution component to the plans. All employees accruing pension benefits in the plans as at December 31, 2011 continue to accrue pension benefits under the defined benefit component of the plan on and after January 1, 2012. All employees who commence employment on or after January 1, 2012 are required to join the defined contribution component of the plan.
For 2011 the average remaining working lives of employees participating in the pension plans was 11 years (2010 – 11 years).
Our appointed actuaries measure the defined benefit obligations and the fair value of the plans’ assets for accounting purposes as at December 31 of each year. We fund our defined benefit pension plans in accordance with actuarially determined amounts required to satisfy employee benefit obligations under current federal pension regulations. The most recent funding valuation for the Registered Pension Plan was as at December 31, 2010. The next required valuation, to be completed in 2012, will be as at December 31, 2011. For the Supplementary Retirement Plan, an annual funding valuation is prepared as at December 31 each year.
OTHER BENEFIT PLANS
We maintain a retiring allowance program and provide certain life insurance, health and dental care benefits to retired employees. These plans are funded as the cost of benefits are incurred and costs are accrued based on actuarial calculations. In 2011, EDC announced changes to both our Severance Policy and our Supplementary Death Benefit.
| | } | | Effective July 1, 2013, employees will no longer accumulate service in respect of the retiring allowance portion of the corporate Severance Policy. Service accumulated as at July 1, 2013 will be banked and the relevant retiring allowance will be paid out, as per the policy, when the employee leaves the Corporation. As the defined benefit obligation is only reflective of service to date, this change in policy will not impact the pension obligation until the effective date. |
| | } | | Effective July 1, 2013, the Supplementary Death Benefit will be cancelled. The cancellation of this benefit resulted in a reduction of the defined benefit obligation for other benefit plans of $1.8 million of which $1 million was recognized immediately in the 2011 defined benefit expense as it represented a vested past service cost benefit. The remainder of the impact has been included in unrecognized past service benefit – non-vested and will be deferred and amortized using the corridor method. |
For 2011 the average remaining working lives of employees participating in the other benefit plans was 14 years (2010 – 13 years).
132 | BUILDING RESILIENCE IN UNCERTAIN TIMES
The following table presents the financial position of our retirement benefit obligations:
| | | | | | | | | | | | | | | | | | | | | | | | |
(in millions of Canadian dollars) | | Dec. 31, 2011 | | | Dec. 31, 2010 | |
| | | Registered
Pension Plan | | | Supplementary
Retirement Plan | | | Other benefit
plans | | | Registered
Pension Plan | | | Supplementary
Retirement Plan | | | Other benefit
plans | |
| | | | | | | |
Defined benefit obligation: | | | | | | | | | | | | | | | | | | | | | | | | |
Obligation beginning of year | | | 471 | | | | 35 | | | | 103 | | | | 377 | | | | 27 | | | | 81 | |
Current service costs | | | 20 | | | | 2 | | | | 6 | | | | 14 | | | | 1 | | | | 5 | |
Interest cost on benefit obligation | | | 27 | | | | 2 | | | | 6 | | | | 24 | | | | 2 | | | | 5 | |
Employee contributions | | | 7 | | | | – | | | | – | | | | 6 | | | | – | | | | – | |
Actuarial loss on benefit obligation | | | 119 | | | | 14 | | | | 27 | | | | 59 | | | | 5 | | | | 14 | |
Benefits paid | | | (14) | | | | (1) | | | | (1) | | | | (9) | | | | – | | | | (2) | |
Past service costs | | | – | | | | – | | | | (2) | | | | – | | | | – | | | | – | |
| | | | | | | | | | | | | | | | | | | | | | | | | |
Defined benefit obligation at end of year | | | 630 | | | | 52 | | | | 139 | | | | 471 | | | | 35 | | | | 103 | |
| | | | | | | | | | | | | | | | | | | | | | | | | |
Fair value of plan assets: | | | | | | | | | | | | | | | | | | | | | | | | |
Fair value at beginning of year | | | 396 | | | | 46 | | | | – | | | | 336 | | | | 44 | | | | – | |
Expected return on plan assets | | | 31 | | | | 2 | | | | – | | | | 26 | | | | 2 | | | | – | |
Actuarial gain (loss) on plan assets | | | (24) | | | | (3) | | | | – | | | | 4 | | | | – | | | | – | |
Employer contributions | | | 48 | | | | – | | | | 1 | | | | 33 | | | | – | | | | 2 | |
Employee contributions | | | 7 | | | | – | | | | – | | | | 6 | | | | – | | | | – | |
Benefits paid | | | (14) | | | | (1) | | | | (1) | | | | (9) | | | | – | | | | (2) | |
| | | | | | | | | | | | | | | | | | | | | | | | | |
Fair value at end of year | | | 444 | | | | 44 | | | | – | | | | 396 | | | | 46 | | | | – | |
| | | | | | | | | | | | | | | | | | | | | | | | | |
Funded status – plan (deficit) surplus | | | (186) | | | | (8) | | | | (139) | | | | (75) | | | | 11 | | | | (103) | |
Unamortized net actuarial loss | | | 197 | | | | 22 | | | | 41 | | | | 55 | | | | 5 | | | | 14 | |
Unrecognized past service cost (benefit) non- vested | | | – | | | | – | | | | (1) | | | | – | | | | – | | | | – | |
| | | | | | | | | | | | | | | | | | | | | | | | | |
Defined benefit asset (liability) | | | $11 | | | | $14 | | | | $(99) | | | | $(20) | | | | $16 | | | | $(89) | |
| | | | | | | | | | | | | | | | | | | | | | | | | |
The unamortized net actuarial loss in our Registered Pension Plan was $197 million (2010 – $55 million; January 1, 2010 – nil) which exceeded 10% of the defined benefit obligation by $134 million (2010 – $8 million; January 1, 2010 – nil) at the end of December 2011. Using the corridor method the excess amount is being amortized on a straight-line basis to pension expense over the expected average remaining working lives of employees participating in the plan. Amortization of accumulated net actuarial losses in periods subsequent to December 2011 will be affected primarily by the discount rate used to estimate benefit obligations and by the difference between future investment results and the expected return on plan assets.
ASSET MIX
Plan assets are invested in debt securities, equity securities, real estate and held in cash. For the Registered Pension Plan, the target allocation percentages are 30% in debt securities, 55% in equity securities and 15% in real estate. The actual investment allocations at the end of December 2011 were 34% in debt securities, 53% in equity securities (2010 – 30% and 57%; January 1, 2010 – 32% and 54%), 13% in real estate (2010 – 13%; January 1, 2010 – 11%) and commodities 0% (2010 – 0%; January 1, 2010 – 3%). For the Supplementary Retirement Plan, the target is 100% in equity securities, net of the cash in a refundable tax account as prescribed by Canada Revenue Agency. This resulted in actual investment allocations of 55% in cash and 45% in equity securities at the end of 2011 (2010 – 52% and 48%; January 1, 2010 – 55% and 45%).
EDC ANNUAL REPORT 2011 | 133
CONSOLIDATED FINANCIAL STATEMENTS
Amounts for the current and previous year are as follows:
| | | | | | | | | | | | | | | | | | | | | | | | | | | | | | | | | | | | |
(in millions of Canadian dollars) | | Dec. 31, 2011 | | | Dec. 31, 2010 | | | Jan. 1, 2010 | |
| | | Registered
Pension
Plan | | | Supplementary
Retirement
Plan | | | Other
benefit
plans | | | Registered
Pension
Plan | | | Supplementary
Retirement
Plan | | | Other
benefit
plans | | | Registered
Pension
Plan | | | Supplementary
Retirement
Plan | | | Other
benefit
plans | |
| Defined benefit obligation | | | 630 | | | | 52 | | | | 139 | | | | 471 | | | | 35 | | | | 103 | | | | 377 | | | | 27 | | | | 81 | |
| Plan assets | | | 444 | | | | 44 | | | | – | | | | 396 | | | | 46 | | | | – | | | | 336 | | | | 44 | | | | – | |
| Surplus (deficit) | | | (186 | ) | | | (8 | ) | | | (139 | ) | | | (75 | ) | | | 11 | | | | (103 | ) | | | (41 | ) | | | 17 | | | | (81 | ) |
| | | | | | | | | | | | | | | | | | | | | | | | | | | | | | | | | | | | | |
| Experience adjustments on plan liabilities | | | 3 | | | | (5 | ) | | | (1 | ) | | | 2 | | | | (1 | ) | | | 4 | | | | n/a | | | | n/a | | | | n/a | |
| Experience adjustments on plan assets | | | (24 | ) | | | (3 | ) | | | – | | | | 4 | | | | – | | | | – | | | | n/a | | | | n/a | | | | n/a | |
| | | | | | | | | | | | | | | | | | | | | | | | | | | | | | | | | | | | | |
DEFINED BENEFIT EXPENSE
| | | 0000 | | | | 0000 | | | | 0000 | | | | 0000 | | | | 0000 | | | | 0000 | |
(in millions of Canadian dollars) | | 2011 | | | | | | | | | 2010 | |
| | | Registered
Pension
Plan | | | Supplementary
Retirement
Plan | | | Other
benefit
plans | | | Registered
Pension
Plan | | | Supplementary
Retirement
Plan | | | Other
benefit
plans | |
Current service costs | | | 20 | | | | 2 | | | | 6 | | | | 14 | | | | 1 | | | | 5 | |
Interest cost on benefit obligation | | | 27 | | | | 2 | | | | 6 | | | | 24 | | | | 2 | | | | 5 | |
Expected return on plan assets | | | (31) | | | | (2) | | | | – | | | | (26) | | | | (2) | | | | – | |
Actuarial loss recognized during the period | | | 1 | | | | – | | | | – | | | | – | | | | – | | | | – | |
Past service cost benefit-vested | | | – | | | | – | | | | (1) | | | | – | | | | – | | | | – | |
Total expense recognized in profit or loss | | | $17 | | | | $2 | | | | $11 | | | | $12 | | | | $1 | | | | $10 | |
Actual return on plan assets | | | $7 | | | | $(1) | | | | $– | | | | $30 | | | | $2 | | | | $– | |
TOTAL CASH PAYMENTS
Total cash payments for our retirement benefit obligations in 2011 totalled $50 million (2010 – $35 million). The payments consisted of cash contributions to the pension plans and payments paid directly to beneficiaries for the unfunded other benefit plans. Included in total cash payments in 2011 was $28 million (2010 – $18 million) in additional contributions to the Registered Pension Plan in relation to a plan deficit identified as a result of the funding valuation for 2010, 2009 and 2008. We expect to contribute $51 million to the pension plans in 2012 which includes $48 million in contributions to the Registered Pension Plan and $3 million for the other benefit plans.
ASSUMPTIONS
| | | 000000 | | | | 000000 | | | | 000000 | | | | 000000 | | | | 000000 | | | | 000000 | |
| | | Dec. 31, 2011 | | | | | | | | | Dec. 31, 2010 | |
| (Weighted average) | | Registered
Pension Plan | | | Supplementary
Retirement Plan | | | Other
benefit plans | | | Registered
Pension Plan | | | Supplementary
Retirement plan | | | Other
benefit plans | |
Defined benefit obligation: | | | | | | | | | | | | | | | | | | | | | | | | |
Discount rate | | | 4.50% | | | | 4.50% | | | | 4.50% | | | | 5.50% | | | | 5.50% | | | | 5.50% | |
| | | | | | | | | | | | | | | | | | | | | | | | | |
Rate of compensation increase | |
| 3.25% to
5.60% |
| |
| 3.25% to
5.60% |
| |
| 3.25% to
5.60% |
| |
| 3.25% to
5.60% |
| |
| 3.25% to
5.60% |
| |
| 3.25% to
5.60% |
|
Benefit costs: | | | | | | | | | | | | | | | | | | | | | | | | |
Expected rate of return on plan assets | | | 7.50% | | | | 3.75% | | | | n/a | | | | 7.50% | | | | 3.75% | | | | n/a | |
Discount rate on projected defined benefit obligation | | | 5.50% | | | | 5.50% | | | | 5.50% | | | | 6.25% | | | | 6.25% | | | | 6.25% | |
Inflation | | | 2.25% | | | | 2.25% | | | | 2.25% | | | | 2.25% | | | | 2.25% | | | | n/a | |
| | | | | | | | | | | | | | | | | | | | | | | | | |
Rate of compensation increase | |
| 3.25% to
5.60% |
| |
| 3.25% to
5.60% |
| |
| 3.25% to
5.60% |
| |
| 3.25% to
5.70% |
| |
| 3.25% to
5.70% |
| |
| 3.25% to
5.70% |
|
134 | BUILDING RESILIENCE IN UNCERTAIN TIMES
As per IAS 19, the discount rate used to determine the defined benefit obligations should be based on market rates for high-quality corporate bonds that match the currency and estimated term of the obligations. Given the long-term nature of pension plan obligations, the yields for bonds with long terms to maturity are most important. In a market such as Canada, high-quality long-term corporate bonds are few in number. Due to this lack of depth in the long-term market, the Canadian Institute of Actuaries (CIA) released an educational note in September 2011 – Accounting Discount Rate Assumption for Pension and Post-employment Benefit Plans – that proposed a preferred methodology for extrapolating the long end of the high-quality corporate bond yield curve. This preferred methodology included supplementing the long end of the yield curve with additional data points by including Canadian provincial bonds rated AA with an adjustment to account for credit risk differentials when compared to corporate bond yields. The discount rate of 4.50% used to determine the defined benefit obligation for 2011 was derived in a manner consistent with the preferred methodology included within the CIA educational note.
The rate of compensation increase used for the defined benefit obligation represents a long-term assumption and includes components for inflation, productivity increases and merit and promotion adjustments.
The expected rate of return on plan assets is determined based on the target asset mix of the portfolio set out in the investment policy and on expected long-term real returns of the different asset classes.
Assumptions regarding future mortality experience are set based on actuarial advice in accordance with published statistics in the form of post-retirement mortality tables. In 2011, the table used was UP94 with dynamic projection (generational) using scale AA. The table for 2010 was the UP94 projected to 2020 in accordance with projection scale AA. These tables translate the average life expectancy of a pensioner retiring at age 65 into years.
For the other benefit plans, the initial annual rate of increase for covered medical care benefits is assumed to be 7.93% (2010 – 8.50%). This rate is projected to trend down over six years to an ultimate rate of 4.50% for 2017 (2010 – 4.50% for 2017) and subsequent years. For dental care, the trend rate used was 4.50% (2010 – 4.50%).
SENSITIVITY ANALYSIS
The following table outlines the potential impact of changes in certain key assumptions used in measuring the defined benefit obligations and benefit costs. The sensitivity analysis contained in this table is hypothetical and should be used with caution.
| | | | | | | | | | | | | | | | | | | | | | | | |
(in millions of Canadian dollars) | | 2011 | |
| | | Registered Pension Plan | | | Supplementary Retirement Plan | | | Other benefit plans | |
| | | Obligation | | | Expense | | | Obligation | | | Expense | | | Obligation | | | Expense | |
Sensitivity of Assumptions | | | | | | | | | | | | | | | | | | | | | | | | |
Discount rate | | | 4.50% | | | | 5.50% | | | | 4.50% | | | | 5.50% | | | | 4.50% | | | | 5.50% | |
Impact of: 1% increase ($) | | | (113) | | | | (7) | | | | (9) | | | | – | | | | (26) | | | | (2) | |
1% decrease ($) | | | 151 | | | | 16 | | | | 11 | | | | 1 | | | | 35 | | | | 3 | |
Expected long-term rate of return on assets | | | n/a | | | | 7.50% | | | | n/a | | | | 3.75% | | | | n/a | | | | n/a | |
Impact of: 1% increase ($) | | | n/a | | | | (4) | | | | n/a | | | | – | | | | n/a | | | | n/a | |
1% decrease ($) | | | n/a | | | | 4 | | | | n/a | | | | – | | | | n/a | | | | n/a | |
| | | | 3.25% to | | | | 3.25% to | | | | 3.25% to | | | | 3.25% to | | | | 3.25% to | | | | 3.25% to | |
Rate of compensation increase | | | 5.60% | | | | 5.60% | | | | 5.60% | | | | 5.60% | | | | 5.60% | | | | 5.60% | |
Impact of: 1% increase ($) | | | 24 | | | | 4 | | | | 15 | | | | 2 | | | | 2 | | | | – | |
1% decrease ($) | | | (24) | | | | (4) | | | | (9) | | | | (1) | | | | (2) | | | | – | |
EDC ANNUAL REPORT 2011 | 135
CONSOLIDATED FINANCIAL STATEMENTS
During 2011, bond yields decreased which impacted the discount rate used to measure EDC’s defined benefit obligations. The discount rate has decreased to 4.50% (2010 – 5.50%) which has increased the defined benefit obligations of the plans by $121 million. This will also impact the benefit expenses for fiscal years 2012 and beyond.
The financial health of a pension plan is measured by actuarial valuations, which are prepared on both a going-concern and a solvency basis. The EDC Registered Pension Plan ratios as at December 31, 2010 were 84% on a going-concern basis and 71% on a solvency basis. Since EDC’s solvency ratio is less than 100%, we are required by federal pension legislation to make special monthly solvency contributions. During 2011 we contributed special payments of $28 million into the plan and will continue to remit all required solvency payments. The next formal valuations will be conducted by the plans’ actuaries in 2012 and will be as at December 31, 2011.
A one percentage point increase in assumed health care cost trends would have increased the service and interest costs by $2.6 million (2010 – $1.8 million) and the obligation by $31.6 million (2010 – $20.0 million). A one percentage point decrease in assumed health care cost trends would have decreased the service and interest costs and the obligation by $1.9 million (2010 – $1.3 million) and $23.3 million (2010 – $15.1 million).
40. Related Party Transactions
We enter into transactions with other government departments, agencies and Crown corporations in the normal course of business, under terms and conditions similar to those that apply to unrelated parties. The following disclosure is in addition to the related party disclosure provided elsewhere in these financial statements. All material related party transactions are either disclosed below or in the relevant notes. These transactions are measured at their exchange amounts.
CANADA ACCOUNT ADMINISTRATIVE EXPENSE RECOVERY
As described in Note 41, we enter into certain financial and contingent liability transactions on behalf of the Government of Canada known as “Canada Account” transactions. We are compensated for expenses and overhead relating to Canada Account activities. In 2011, we retained $7 million (2010 – $7 million) from Canada Account receipts and recoveries for these expenses and overhead. These amounts are netted against administrative expenses on the statement of comprehensive income.
DEBT RELIEF
When sovereign borrowers experience financial difficulties and are unable to meet their debt obligations, sovereign creditors, including the Government of Canada, agree at an international forum, the Paris Club, to formally reschedule the borrower’s debt obligations. From time to time and on a case-by-case basis, the most heavily indebted sovereign borrowers are granted debt reduction or debt service relief by the Government of Canada. The granting of debt reduction or relief by the Paris Club is contingent upon the sovereign borrower’s ability to implement and maintain economic programs outlined by the International Monetary Fund.
Prior to April 2001, the Government of Canada has reimbursed to us an amount equal to the debt relief granted by the Government of Canada to our sovereign borrowers. The formula for calculating the amount to be paid to us was amended effective April 1, 2001 in two ways. Firstly, for new loans issued by us after March 31, 2001 to sovereign borrowers which were on the Paris Club debt relief list as at April 1, 2001, the Government of Canada has no obligation to compensate us for further debt relief granted to such borrowers. Secondly, for any debt reduction for new loans resulting from unilateral debt relief measures or new debt reduction for obligations contracted prior to April 1, 2001, we will share in the costs of debt forgiveness to the amount of our appropriate allowances on the loans.
Amounts received for debt relief arrangements on sovereign impaired loans are credited to the book value of the loans similar to the treatment accorded to other receipts on impaired loans.
During 2011, we received $4 million pursuant to debt relief arrangements for Ivory Coast (2010 – $25 million for Ivory Coast and Congo). All debt relief receipts are recognized as debt relief income on the statement of comprehensive income.
136 | BUILDING RESILIENCE IN UNCERTAIN TIMES
KEY MANAGEMENT PERSONNEL COMPENSATION
Key management personnel include the Board of Directors and the Executive Management team. Compensation paid or payable to key management personnel during the year, including non-cash benefits subject to income tax, was as follows:
| | | | | | | | |
(in millions of Canadian dollars) | | 2011 | | | 2010 | |
Salaries and other short-term benefits | | | 4 | | | | 4 | |
Post-employment benefits | | | 1 | | | | 1 | |
Total | | | $5 | | | | $5 | |
41. Canada Account Transactions
Pursuant to the Act, the Minister, with the concurrence of the Minister of Finance, may authorize us to undertake certain financial and contingent liability transactions on behalf of the Government of Canada. These transactions and the legislative authorities that underlie them have come to be known collectively as “Canada Account”. Accounts for these transactions are maintained separately from our accounts and are consolidated annually as at March 31 with the financial statements of the Government of Canada, which are reported upon separately by the Government and audited by the Auditor General of Canada. The assets under the Canada Account, mainly loans receivable and accrued interest and fees recorded in accordance with the accounting policies and practices of the Government of Canada, amounted to $3,894 million at the end of December 2011 (2010 – $5,055 million).
The Act allows the Canada Account to have outstanding loans and commitments to borrowers, and arrangements giving rise to contingent liabilities under contracts of insurance and other agreements up to a maximum of $20 billion. The position against this limit at December 31, determined in accordance with the requirements of the Act, was $3.7 billion (2010 – $5.5 billion). The position against the statutory limit increases accordingly as we sign each new obligation that has the effect of extending credit or giving rise to a contingent liability.
42. Transition to International Financial Reporting Standards (IFRS)
Our transition to IFRS is accounted for in accordance with IFRS 1 – First-time Adoption of International Financial Reporting Standards, with a transition date of January 1, 2010 and reflects those accounting standards applicable for the financial year ending on December 31, 2011.
As permitted by IFRS 1, we applied the following exemptions from the requirements of IFRS and from their retrospective application:
Equipment Available for Lease
We elected to measure the aircraft within our leasing portfolio at the date of transition to IFRS at its fair value of $304 million and use that fair value as its deemed cost at that date.
Employee Benefits
For our defined benefit pension plans, we elected to recognize the cumulative unamortized actuarial losses of $97 million in equity as of the date of transition to IFRS. In addition, we elected to disclose the defined benefit obligation, plan assets, surplus or deficit and the experience adjustments arising on the plan assets and liabilities prospectively from the date of transition.
Insurance Contracts
We elected to apply the transitional provisions of IFRS 4. There was no financial impact as a result of applying this exemption.
EDC ANNUAL REPORT 2011 | 137
CONSOLIDATED FINANCIAL STATEMENTS
CONSOLIDATED STATEMENT OF COMPREHENSIVE INCOME
We have elected to present our consolidated statement of income and consolidated statement of comprehensive income as one combined statement titled consolidated statement of comprehensive income.
CONSOLIDATED STATEMENT OF CASH FLOWS
As a result of IFRS implementation our loans disbursements and repayments have been reclassified to operating activities from investing activities. Also, in accordance with IFRS we disclosed cash received for interest for current and comparative periods. Any other differences between the two statements relate to reclassifications as discussed in this note.
OPENING EQUITY ADJUSTMENT AND OPENING STATEMENT OF FINANCIAL POSITION
IFRS 1 requires that our initial financial statements under the new standards reflect our financial position as if IFRS had always been applied, with any differences upon transition eliminated through opening equity. This adjustment resulted in a $164 million reduction in our opening retained earnings. The following tables provide the details of our opening retained earnings adjustment and a reconciliation between previous Canadian GAAP and IFRS for our January 1, 2010 opening statement of financial position.
RECONCILIATION OF RETAINED EARNINGS
| | | | | | |
as at January 1, 2010 (in millions of Canadian dollars) | | Note | | | |
Retained earnings under previous Canadian GAAP | | | | | | 5,317 |
Accumulated other comprehensive loss | | | A | | | (62) |
Equipment available for lease | | | D | | | (11) |
Aircraft major overhaul costs | | | D | | | 4 |
Loans payable | | | F | | | 2 |
Defined benefit pension plans | | | H | | | (97) |
Retained earnings under IFRS | | | | | | $5,153 |
138 | BUILDING RESILIENCE IN UNCERTAIN TIMES
RECONCILIATION OF CONSOLIDATED STATEMENT
OF FINANCIAL POSITION
| | | | | | | | | | | | |
as at January 1, 2010 (in millions of Canadian dollars) | | Previous Canadian
GAAP balance | | IFRS
reclassifications | | | IFRS
adjustments | | | IFRS
balance |
Assets | | | | | | | | | | | | |
Cash | | 52 | | | – | | | | – | | | 52 |
Marketable securities: (Notes A and E) | | | | | | | | | | | | |
Available-for-sale | | 751 | | | (726 | ) | | | (25 | ) | | – |
Held-for-trading | | 4,629 | | | (4,629 | ) | | | – | | | – |
Marketable securities: (Note A) | | | | | | | | | | | | |
At fair value through profit or loss | | – | | | 5,335 | | | | – | | | 5,335 |
At amortized cost | | – | | | 20 | | | | – | | | 20 |
Derivative instruments | | 1,909 | | | – | | | | – | | | 1,909 |
Loans receivable (Notes B, E and I) | | 26,267 | | | 246 | | | | (36 | ) | | 26,477 |
Allowance for losses on loans (Notes C and E) | | (1,948) | | | – | | | | 14 | | | (1,934) |
Equity financing at fair value through profit or loss (Note I) | | 196 | | | 2 | | | | – | | | 198 |
Equipment available for lease (Notes D and I) | | 315 | | | 18 | | | | (7 | ) | | 326 |
Net investment in aircraft under finance leases (Note I) | | 113 | | | 1 | | | | – | | | 114 |
Recoverable insurance claims | | 93 | | | – | | | | – | | | 93 |
Reinsurers’ share of policy and claims liabilities | | 159 | | | – | | | | – | | | 159 |
Other assets (Note E and I) | | 124 | | | (8 | ) | | | 25 | | | 141 |
Property, plant and equipment | | 17 | | | – | | | | – | | | 17 |
Intangible assets | | 41 | | | – | | | | – | | | 41 |
Accrued interest and fees (Note I) | | 180 | | | (180 | ) | | | – | | | – |
Total Assets | | $32,898 | | | $79 | | | | $(29 | ) | | $32,948 |
| | | | | |
Liabilities and Equity | | | | | | | | | | | | |
Accounts payable and other credits (Note E, G and I) | | 139 | | | 11 | | | | (4 | ) | | 146 |
Loans payable: | | | | | | | | | | | | |
Designated at fair value through profit or loss | | 22,139 | | | – | | | | – | | | 22,139 |
At amortized cost (Note F) | | 2,296 | | | – | | | | (2 | ) | | 2,294 |
Derivative instruments | | 222 | | | – | | | | – | | | 222 |
Retirement benefit obligations (Note H) | | 8 | | | – | | | | 97 | | | 105 |
Allowance for losses on loan commitments (Notes C and E) | | 713 | | | (242 | ) | | | (18 | ) | | 453 |
Policy and claims liabilities | | 793 | | | – | | | | – | | | 793 |
Loan guarantees (Note B and C) | | – | | | 310 | | | | – | | | 310 |
| | | 26,310 | | | 79 | | | | 73 | | | 26,462 |
| Financing commitments and contingent liabilities | | | | | | | | | | |
| | | | | |
Equity | | | | | | | | | | | | |
Accumulated other comprehensive loss (Note A) | | (62) | | | – | | | | 62 | | | – |
Share capital | | 1,333 | | | – | | | | – | | | 1,333 |
Retained earnings | | 5,317 | | | – | | | | (164 | ) | | 5,153 |
| | | 6,588 | | | – | | | | (102 | ) | | 6,486 |
Total Liabilities and Equity | | $32,898 | | | $79 | | | | $(29 | ) | | $32,948 |
EDC ANNUAL REPORT 2011 | 139
CONSOLIDATED FINANCIAL STATEMENTS
EXPLANATION OF OPENING ADJUSTMENTS AND RECLASSIFICATIONS
A. MARKETABLE SECURITIES
As discussed in Note 2, we have elected to early adopt IFRS 9 for our financial assets and liabilities. Under IFRS 9, financial assets are either measured at amortized cost or fair value. The marketable securities held by EDC that were classified as held-for-trading (HFT) or available-for-sale (AFS) under previous Canadian GAAP have been reclassified to marketable securities at fair value through profit or loss. The AFS marketable securities held by Exinvest are held principally to collect interest and principal and will be carried at amortized cost under IFRS. Due to the short-term nature of these investments, their carrying value under previous Canadian GAAP was not significantly different from their carrying value under IFRS.
Under IFRS, Exinvest’s pro-rata share of its joint ventures’ assets and liabilities will be accounted for using the equity method, and recorded within other assets on the statement of financial position. Previously, we consolidated Exinvest’s interest in its joint ventures into the accounts using the proportionate consolidation method. Upon our transition to IFRS this resulted in a reduction in marketable securities of $25 million.
Under previous Canadian GAAP we recorded the unrealized foreign currency gains and losses and fair value gains and losses on our AFS marketable securities within accumulated other comprehensive income, while under IFRS, these gains and losses will be recorded within net income. Included in our opening equity adjustment is a $62 million reduction in retained earnings representing the $74 million cumulative net foreign exchange loss and the $12 million cumulative net unrealized fair value gain related to these investments.
B. LOANS RECEIVABLE
We continue to carry our loans receivable at amortized cost under IFRS. We reclassified loan interest and fees receivable of $178 million from accrued interest and fees upon transition and included them in the carrying value of our loans receivable. In addition, $68 million of deferred guarantee fees were reclassified to the liability for loan guarantees.
The change from the proportionate consolidation to the equity method of accounting for Exinvest’s investment in joint ventures reduced loans receivable by $33 million and accrued loan interest by $3 million upon transition.
C. ALLOWANCE FOR LOSSES ON LOANS, LOAN COMMITMENTS AND GUARANTEES
The allowance for losses on loans was reduced by the $14 million allowance recorded on the loans receivable held by the joint ventures and an impairment loss was recorded on our investment in joint ventures (see Note E below).
In addition, we reduced the allowance for losses on loan commitments by the individual allowance of $18 million established under previous Canadian GAAP for a potential call on an indemnity provided to Canada Account by the joint ventures. We also reclassified the $242 million allowance related to loan guarantees to the liability for loan guarantees.
D. EQUIPMENT AVAILABLE FOR LEASE
The following table outlines the details of the adjustments made to our equipment available for lease as a result of implementing IFRS. This was a result of several adjustments. Under IFRS 1, we elected to measure our aircraft at fair value on our transition date, which resulted in a decrease to their carrying value. Changes to the amortization period of major overhauls resulted in the capitalization of $4 million of these costs on transition that were expensed under previous Canadian GAAP and deferred major overhaul costs were reallocated from other assets to be included as part of the carrying value of the aircraft. Lease set up costs were also reallocated from other assets in order to be included with the equipment available for lease.
| | | | |
Equipment Available for Lease (in millions of Canadian dollars) | | Jan. 1, 2010 | |
Impact of recording aircraft at fair value on transition date | | | (11 | ) |
Change in amortization of major overhaul costs | | | 4 | |
Reallocation of major overhaul costs | | | 13 | |
Change in carrying value | | | 6 | |
Reallocation of lease set up costs | | | 5 | |
Total change | | | $11 | |
140 | BUILDING RESILIENCE IN UNCERTAIN TIMES
E. OTHER ASSETS
We recorded Exinvest’s investment in joint ventures within other assets. The change from the proportionate consolidation to the equity method of accounting for Exinvest’s investment in joint ventures resulted in adjustments to our marketable securities, loans receivable, allowance for losses on loans, accrued interest and fees, and accounts payable and other credits. The investment of $25 million on January 1, 2010 represents the initial cost of the joint ventures, adjusted to include our pro rata share of post-acquisition earnings up to the transition date, as well as an allowance for a potential call on an indemnity provided to Canada Account by the joint ventures.
| | | | |
Reconciliation of Investment Value (in millions of Canadian dollars) | | Jan. 1, 2010 | |
Marketable securities | | | 25 | |
Loans receivable | | | 33 | |
Interest receivable | | | 3 | |
Accounts payable and other credits | | | (4 | ) |
Cumulative investment in joint ventures | | | 57 | |
Allowance for call on indemnity | | | (18 | ) |
Impairment loss on joint ventures | | | (14 | ) |
Investment in joint ventures | | | $25 | |
F. LOANS PAYABLE AMORTIZED COST
Under IFRS, the transaction costs related to our debt instruments carried at amortized cost are capitalized and amortized, as opposed to being expensed as incurred under previous Canadian GAAP. This resulted in a $2 million decrease in our loans payable carried at amortized cost.
G. ACCOUNTS PAYABLE AND OTHER CREDITS
The change from proportionate consolidation to the equity method of accounting for Exinvest’s investment in joint ventures resulted in a reduction in accounts payable and other credits of $4 million upon transition.
Reclassifications from accrued interest and fees and from other assets contributed to an increase in accounts payable and other credits of $11 million (see Note I below).
H. RETIREMENT BENEFIT OBLIGATIONS
We elected under IFRS 1 to recognize in retained earnings the cumulative net unamortized actuarial losses related to our employee defined benefit plans in equity as of the date of transition to IFRS which resulted in a $97 million increase in retirement benefit obligations.
I. RECLASSIFICATIONS
Breakdowns of the reclassifications related to accrued interest and fees and other assets are provided in the following tables:
| | | | |
Reclassification of Accrued Interest and Fees to: (in millions of Canadian dollars) | | | |
Loans receivable at amortized cost | | | (178 | ) |
Equity financing at fair value through profit or loss | | | (2 | ) |
Net investment in finance leases | | | (1 | ) |
Other assets | | | (7 | ) |
Accounts payable and other credits | | | 8 | |
Total reduction to accrued interest and fees | | | $(180 | ) |
| | | | |
Reclassification of Other Assets (to)/from: (in millions of Canadian dollars) | | | |
Accrued interest and fees | | | 7 | |
Accounts payable and other credits | | | 3 | |
Equipment available for lease | | | (18 | ) |
Total reduction to other assets | | | $(8 | ) |
RECONCILED FINANCIAL STATEMENTS
The following pages include the reconciliations between previous Canadian GAAP and IFRS for the following:
| | } | | our financial position as at December 31, 2010 |
| | } | | our comprehensive income for the year ended December 31, 2010 |
EDC ANNUAL REPORT 2011 | 141
CONSOLIDATED FINANCIAL STATEMENTS
RECONCILIATION OF CONSOLIDATED STATEMENT
OF FINANCIAL POSITION
| | | | | | | | | | | | | | |
as at December 31, 2010 (in millions of Canadian dollars) | | Previous Canadian
GAAP balance | | | IFRS
reclassifications | | | IFRS
adjustments | | | IFRS
balance |
Assets | | | | | | | | | | | | | | |
Cash | | | 124 | | | | – | | | | – | | | 124 |
Marketable securities: | | | | | | | | | | | | | | |
Available-for-sale | | | 1,327 | | | | (1,296 | ) | | | (31 | ) | | – |
Held-for-trading | | | 2,383 | | | | (2,383 | ) | | | – | | | – |
Marketable securities: | | | | | | | | | | | | | | |
At fair value through profit or loss | | | – | | | | 3,660 | | | | – | | | 3,660 |
At amortized cost | | | – | | | | 19 | | | | – | | | 19 |
Derivative instruments | | | 2,010 | | | | – | | | | – | | | 2,010 |
Loans receivable | | | 26,415 | | | | 225 | | | | (29 | ) | | 26,611 |
Allowance for losses on loans | | | (1,566 | ) | | | – | | | | 5 | | | (1,561) |
Equity financing at fair value through profit or loss | | | 316 | | | | 1 | | | | – | | | 317 |
Equipment available for lease | | | 171 | | | | 17 | | | | (45 | ) | | 143 |
Net investment in aircraft under finance leases | | | 99 | | | | – | | | | – | | | 99 |
Recoverable insurance claims | | | 92 | | | | 2 | | | | – | | | 94 |
Reinsurers’ share of policy and claims liabilities | | | 109 | | | | – | | | | – | | | 109 |
Other assets | | | 150 | | | | (15 | ) | | | 47 | | | 182 |
Property, plant and equipment | | | 33 | | | | – | | | | – | | | 33 |
Intangible assets | | | 42 | | | | – | | | | – | | | 42 |
Accrued interest and fees | | | 167 | | | | (167 | ) | | | – | | | – |
Total Assets | | | $31,872 | | | | $63 | | | | $(53 | ) | | $31,882 |
| | | | | |
Liabilities and Equity | | | | | | | | | | | | | | |
Accounts payable and other credits | | | 166 | | | | 3 | | | | (3 | ) | | 166 |
Loans payable: | | | | | | | | | | | | | | |
Designated at fair value through profit or loss | | | 20,465 | | | | – | | | | – | | | 20,465 |
At amortized cost | | | 2,020 | | | | – | | | | (1 | ) | | 2,019 |
Derivative instruments | | | 200 | | | | – | | | | – | | | 200 |
Retirement benefit obligations | | | 2 | | | | – | | | | 91 | | | 93 |
Allowance for losses on loan commitments | | | 278 | | | | (185 | ) | | | – | | | 93 |
Policy and claims liabilities | | | 640 | | | | – | | | | – | | | 640 |
Loan guarantees | | | – | | | | 245 | | | | – | | | 245 |
| | | | 23,771 | | | | 63 | | | | 87 | | | 23,921 |
| Financing commitments and contingent liabilities | | | | | | | | | | | |
| | | | | |
Equity | | | | | | | | | | | | | | |
Accumulated other comprehensive loss | | | (80 | ) | | | – | | | | 80 | | | – |
Share capital | | | 1,333 | | | | – | | | | – | | | 1,333 |
Retained earnings | | | 6,848 | | | | – | | | | (220 | ) | | 6,628 |
| | | | 8,101 | | | | – | | | | (140 | ) | | 7,961 |
Total Liabilities and Equity | | | $31,872 | | | | $63 | | | | $(53 | ) | | $31,882 |
142 | BUILDING RESILIENCE IN UNCERTAIN TIMES
RECONCILIATION OF CONSOLIDATED COMPREHENSIVE INCOME
| | | | | | | | | | | | |
for the year ended December 31, 2010 (in millions of Canadian dollars) | | Previous Canadian
GAAP balance | | | IFRS
adjustments | | | IFRS
balance | |
Financing and investment revenue | | | | | | | | | | | | |
Loan | | | 1,006 | | | | (2 | ) | | | 1,004 | |
Finance lease | | | 8 | | | | – | | | | 8 | |
Operating lease | | | 32 | | | | – | | | | 32 | |
Debt relief | | | 25 | | | | – | | | | 25 | |
Investment | | | 48 | | | | (1 | ) | | | 47 | |
Total financing and investment revenue | | | 1,119 | | | | (3 | ) | | | 1,116 | |
| | | | |
Interest expense | | | 147 | | | | – | | | | 147 | |
Leasing and financing related expenses | | | 59 | | | | (6 | ) | | | 53 | |
Net Financing and Investment Income | | | 913 | | | | 3 | | | | 916 | |
| | | | |
Loan Guarantee Fees | | | 33 | | | | – | | | | 33 | |
| | | | |
Insurance premiums and guarantee fees | | | 210 | | | | – | | | | 210 | |
Reinsurance assumed | | | – | | | | 11 | | | | 11 | |
Reinsurance ceded | | | – | | | | (11 | ) | | | (11 | ) |
Net Insurance Premiums and Guarantee Fees | | | 210 | | | | – | | | | 210 | |
| | | | |
Other Expenses | | | 3 | | | | 38 | | | | 41 | |
Administrative Expenses | | | 279 | | | | (6 | ) | | | 273 | |
Income before Provision and Claims-Related Expenses | | | 874 | | | | (29 | ) | | | 845 | |
| | | | |
Provision for (Reversal of) Credit Losses | | | (658 | ) | | | 27 | | | | (631 | ) |
Claims-Related Expenses | | | 1 | | | | – | | | | 1 | |
Net Income | | | $1,531 | | | | $(56 | ) | | | $1,475 | |
| | | | |
Other Comprehensive Loss | | | | | | | | | | | | |
Net unrealized losses on available-for-sale marketable securities | | | (10 | ) | | | 10 | | | | – | |
Reclassification of gains on available-for-sale marketable securities to income | | | (8 | ) | | | 8 | | | | – | |
Other comprehensive loss | | | (18 | ) | | | 18 | | | | – | |
Comprehensive Income | | | $1,513 | | | | $(38 | ) | | | $1,475 | |
EDC ANNUAL REPORT 2011 | 143
TEN-YEAR REVIEW
STATEMENT OF FINANCIAL POSITION
| | | | | | | | | | |
as at December 31 (in millions of Canadian dollars) | | 2011(1) | | | 2010(1) | | | 2009(1) |
Gross loans receivable(2) | | | 29,093 | | | | 26,997 | | | 26,823 |
Plus: accrued loan interest and fees(3) | | | 145 | | | | 163 | | | – |
Less: deferred loan revenue and other credits | | | (558 | ) | | | (549 | ) | | (556) |
Risk mitigation insurer’s share of loan allowance | | | – | | | | – | | | – |
Less: allowance for losses on loans | | | (1,680 | ) | | | (1,561 | ) | | (1,948) |
Net loans receivable | | | 27,000 | | | | 25,050 | | | 24,319 |
Equipment available for lease | | | 55 | | | | 143 | | | 315 |
Net investment in aircraft under finance leases(4) | | | 92 | | | | 99 | | | 113 |
Equity financing at fair value through profit or loss(2) | | | 385 | | | | 317 | | | 196 |
Cash and marketable securities | | | 3,886 | | | | 3,803 | | | 5,432 |
Reinsurers’ share of policy and claims liabilities | | | 129 | | | | 109 | | | 159 |
Property, plant and equipment | | | 74 | | | | 33 | | | 17 |
Intangible assets | | | 40 | | | | 42 | | | 41 |
Other assets | | | 1,935 | | | | 2,286 | | | 2,306 |
Total assets | | | $33,596 | | | | $31,882 | | | $32,898 |
| | | | |
Loans payable | | | 23,570 | | | | 22,484 | | | 24,435 |
Other liabilities | | | 588 | | | | 459 | | | 369 |
Allowance for losses on loan commitments(5) | | | 41 | | | | 93 | | | 713 |
Policy and claims liabilities | | | 875 | | | | 640 | | | 793 |
Loan guarantees(6) | | | 266 | | | | 245 | | | – |
Total liabilities | | | 25,340 | | | | 23,921 | | | 26,310 |
Share capital | | | 1,333 | | | | 1,333 | | | 1,333 |
Retained earnings | | | 6,923 | | | | 6,628 | | | 5,317 |
Accumulated other comprehensive income (loss) | | | – | | | | – | | | (62) |
Equity | | | 8,256 | | | | 7,961 | | | 6,588 |
Total liabilities and equity | | | $33,596 | | | | $31,882 | | | $32,898 |
| (1) | 2009 through 2002 numbers are based on previous Canadian GAAP, 2011 and 2010 are based on IFRS. |
| (2) | Title has been updated to equity financing at fair value through profit or loss from equity financing designated as held-for-trading. Equity financing is included in gross loans receivable for 2002. |
| (3) | Accrued loan interest and fees were reclassified to loans receivable for IFRS presentation purposes. For 2009 through 2002, accrued loan interest and fees is included in other assets. |
| (4) | Title has been updated to net investment in aircraft under finance leases from net investment in capital leases. |
| (5) | 2009 through 2002, allowance for losses on loan commitments includes allowance for losses on loan guarantees. In 2011 and 2010 allowance for losses on loan guarantees is included with loan guarantees. |
| (6) | Loan guarantees include deferred guarantee fee revenue and allowance for losses on loan guarantees. 2009 through 2002 allowance for losses on loan guarantees is grouped with allowance for losses on loan commitments and guarantees and deferred guarantee fee revenue is grouped with loans receivable. |
144 | BUILDING RESILIENCE IN UNCERTAIN TIMES
| | | | | | | | | | | | | | | | | | | | | | | | | | |
| | | | | | | |
| 2008(1) | | | 2007(1) | | | 2006(1) | | | 2005(1) | | | 2004(1) | | | 2003(1) | | | 2002(1) | |
| | 30,898 | | | | 19,108 | | | | 19,581 | | | | 17,306 | | | | 19,419 | | | | 21,459 | | | | 26,341 | |
| | – | | | | – | | | | – | | | | – | | | | – | | | | – | | | | – | |
| | (689) | | | | (589 | ) | | | (825 | ) | | | (1,053 | ) | | | (1,289 | ) | | | (1,487 | ) | | | (1,718 | ) |
| | – | | | | – | | | | 61 | | | | 124 | | | | – | | | | – | | | | – | |
| | (1,928 | ) | | | (1,316 | ) | | | (1,674 | ) | | | (2,148 | ) | | | (2,674 | ) | | | (3,290 | ) | | | (3,613 | ) |
| | 28,281 | | | | 17,203 | | | | 17,143 | | | | 14,229 | | | | 15,456 | | | | 16,682 | | | | 21,010 | |
| | 334 | | | | 372 | | | | 233 | | | | 114 | | | | – | | | | – | | | | – | |
| | 142 | | | | 122 | | | | – | | | | – | | | | – | | | | – | | | | – | |
| | 150 | | | | 95 | | | | 58 | | | | 44 | | | | 44 | | | | 40 | | | | – | |
| | 3,843 | | | | 2,528 | | | | 3,353 | | | | 3,263 | | | | 2,894 | | | | 2,576 | | | | 2,908 | |
| | 157 | | | | 88 | | | | 67 | | | | 40 | | | | 59 | | | | 120 | | | | 195 | |
| | 15 | | | | 7 | | | | 7 | | | | 9 | | | | 10 | | | | 13 | | | | 20 | |
| | 36 | | | | 32 | | | | 28 | | | | 31 | | | | 37 | | | | 44 | | | | 43 | |
| | 2,298 | | | | 2,642 | | | | 1,936 | | | | 1,999 | | | | 2,250 | | | | 1,682 | | | | 573 | |
| | $35,256 | | | | $23,089 | | | | $22,825 | | | | $19,729 | | | | $20,750 | | | | $21,157 | | | | $24,749 | |
| | | | | | | |
| | 25,882 | | | | 15,583 | | | | 15,140 | | | | 13,424 | | | | 15,545 | | | | 17,325 | | | | 20,828 | |
| | 1,627 | | | | 375 | | | | 787 | | | | 596 | | | | 696 | | | | 497 | | | | 793 | |
| | 807 | | | | 564 | | | | 394 | | | | 355 | | | | 448 | | | | 472 | | | | 377 | |
| | 824 | | | | 543 | | | | 518 | | | | 590 | | | | 584 | | | | 628 | | | | 674 | |
| | – | | | | – | | | | – | | | | – | | | | – | | | | – | | | | – | |
| | 29,140 | | | | 17,065 | | | | 16,839 | | | | 14,965 | | | | 17,273 | | | | 18,922 | | | | 22,672 | |
| | 983 | | | | 983 | | | | 983 | | | | 983 | | | | 983 | | | | 983 | | | | 983 | |
| | 5,077 | | | | 5,121 | | | | 5,003 | | | | 3,781 | | | | 2,494 | | | | 1,252 | | | | 1,094 | |
| | 56 | | | | (80 | ) | | | – | | | | – | | | | – | | | | – | | | | – | |
| | 6,116 | | | | 6,024 | | | | 5,986 | | | | 4,764 | | | | 3,477 | | | | 2,235 | | | | 2,077 | |
| | $35,256 | | | | $23,089 | | | | $22,825 | | | | $19,729 | | | | $20,750 | | | | $21,157 | | | | $24,749 | |
EDC ANNUAL REPORT 2011 | 145

TEN-YEAR REVIEW
STATEMENT OF COMPREHENSIVE INCOME
| | | | | | | | | | |
for the year ended December 31 (in millions of Canadian dollars) | | 2011(1) | | | 2010(1) | | | 2009(1) |
Financing and investment revenue: | | | | | | | | | | |
Loan | | | 1,009 | | | | 1,004 | | | 1,321 |
Finance lease(2) | | | 7 | | | | 8 | | | 9 |
Operating lease | | | 21 | | | | 32 | | | 32 |
Debt relief | | | 4 | | | | 25 | | | 49 |
Investment | | | 46 | | | | 47 | | | 41 |
Total financing and investment revenue | | | 1,087 | | | | 1,116 | | | 1,452 |
Interest expense | | | 99 | | | | 147 | | | 381 |
Leasing and financing related expenses | | | 32 | | | | 53 | | | 68 |
Net financing and investment income | | | 956 | | | | 916 | | | 1,003 |
| | | | |
Loan guarantee fees | | | 32 | | | | 33 | | | 24 |
| | | | |
Insurance premiums and guarantee fees | | | 238 | | | | 210 | | | 197 |
Reinsurance assumed | | | 13 | | | | 11 | | | – |
Reinsurance ceded | | | (17 | ) | | | (11 | ) | | – |
Net insurance premiums and guarantee fees | | | 234 | | | | 210 | | | 197 |
| | | | |
Other income (expenses) | | | 79 | | | | (41 | ) | | (73) |
Administrative expenses | | | 284 | | | | 273 | | | 246 |
Income before provision and claims-related expenses | | | 1,017 | | | | 845 | | | 905 |
| | | | |
Provision for (reversal of) credit losses | | | 125 | | | | (631 | ) | | 431 |
Claims-related expenses | | | 247 | | | | 1 | | | 216 |
Income before unrealized fair value adjustment | | | 645 | | | | 1,475 | | | 258 |
Unrealized fair value adjustment | | | – | | | | – | | | – |
Net income | | | $645 | | | | $1,475 | | | $258 |
| (1) | 2009 through 2002 numbers are based on previous Canadian GAAP, 2011 and 2010 are based on IFRS. |
| (2) | Title has been updated to finance lease from capital lease. |
146 | BUILDING RESILIENCE IN UNCERTAIN TIMES
| | | | | | | | | | | | | | | | | | | | | | | | | | |
| | | | | | | |
| 2008(1) | | | 2007(1) | | | 2006(1) | | | 2005(1) | | | 2004(1) | | | 2003(1) | | | 2002(1) | |
| | | | | | | |
| | 1,355 | | | | 1,405 | | | | 1,174 | | | | 1,155 | | | | 1,148 | | | | 1,249 | | | | 1,400 | |
| | 9 | | | | 8 | | | | – | | | | – | | | | – | | | | – | | | | – | |
| | 43 | | | | 37 | | | | 4 | | | | – | | | | – | | | | – | | | | – | |
| | – | | | | 1 | | | | 261 | | | | 64 | | | | 43 | | | | 56 | | | | 96 | |
| | 81 | | | | 123 | | | | 123 | | | | 123 | | | | 63 | | | | 60 | | | | 69 | |
| | 1,488 | | | | 1,574 | | | | 1,562 | | | | 1,342 | | | | 1,254 | | | | 1,365 | | | | 1,565 | |
| | 611 | | | | 717 | | | | 628 | | | | 494 | | | | 345 | | | | 404 | | | | 583 | |
| | 43 | | | | 46 | | | | 19 | | | | – | | | | – | | | | – | | | | – | |
| | 834 | | | | 811 | | | | 915 | | | | 848 | | | | 909 | | | | 961 | | | | 982 | |
| | | | | | | |
| | 20 | | | | 14 | | | | 12 | | | | 9 | | | | 8 | | | | 7 | | | | 9 | |
| | | | | | | |
| | 171 | | | | 149 | | | | 147 | | | | 147 | | | | 153 | | | | 140 | | | | 138 | |
| | – | | | | – | | | | – | | | | – | | | | – | | | | – | | | | – | |
| | – | | | | – | | | | – | | | | – | | | | – | | | | – | | | | – | |
| | 171 | | | | 149 | | | | 147 | | | | 147 | | | | 153 | | | | 140 | | | | 138 | |
| | | | | | | |
| | (11 | ) | | | 46 | | | | 9 | | | | – | | | | (7 | ) | | | 7 | | | | 7 | |
| | 240 | | | | 219 | | | | 203 | | | | 182 | | | | 178 | | | | 173 | | | | 174 | |
| | 774 | | | | 801 | | | | 880 | | | | 822 | | | | 885 | | | | 942 | | | | 962 | |
| | | | | | | |
| | 346 | | | | 196 | | | | (301 | ) | | | (554 | ) | | | (312 | ) | | | 644 | | | | 725 | |
| | 222 | | | | 132 | | | | (75 | ) | | | 41 | | | | 98 | | | | 140 | | | | 115 | |
| | 206 | | | | 473 | | | | 1,256 | | | | 1,335 | | | | 1,099 | | | | 158 | | | | 122 | |
| | – | | | | – | | | | (34 | ) | | | (48 | ) | | | 143 | | | | – | | | | – | |
| | $206 | | | | $473 | | | | $1,222 | | | | $1,287 | | | | $1,242 | | | | $158 | | | | $122 | |
EDC ANNUAL REPORT 2011 | 147
TEN-YEAR REVIEW
CORPORATE ACCOUNT
| | | | | | | | | | |
Financial Arrangements Facilitated (in millions of Canadian dollars) | | 2011(1) | | | 2010(1) | | | 2009(1) |
Financing | | | | | | | | | | |
Direct financing | | | 13,734 | | | | 12,472 | | | 11,148 |
Guarantees | | | 893 | | | | 936 | | | 761 |
Total | | | 14,627 | | | | 13,408 | | | 11,909 |
| | | | |
Insurance | | | | | | | | | | |
Credit insurance | | | 76,786 | | | | 60,397 | | | 58,695 |
Contract insurance and bonding | | | 1,373 | | | | 2,514 | | | 3,733 |
Political risk insurance(2) | | | 2,859 | | | | 2,420 | | | 2,622 |
Guarantees | | | 7,174 | | | | 5,877 | | | 5,810 |
Total | | | 88,192 | | | | 71,208 | | | 70,860 |
| | | | |
Financial and Other Data | | | | | | | | | | |
Financing (in millions of Canadian dollars) | | | | | | | | | | |
Value of gross loans receivable | | | 29,093 | | | | 26,997 | | | 26,823 |
Value of equity | | | 385 | | | | 317 | | | 196 |
Value of undisbursed loans(3) | | | 9,722 | | | | 8,775 | | | 8,814 |
Value of undisbursed equity | | | 283 | | | | 314 | | | 367 |
Value of loan disbursements(3) | | | 10,393 | | | | 10,095 | | | 10,555 |
Value of equity disbursements | | | 106 | | | | 117 | | | 74 |
Value of liability on loan guarantees | | | 2,506 | | | | 2,304 | | | 3,166 |
Undisbursed amounts on loan guarantees | | | 234 | | | | 243 | | | 392 |
Amounts available for allocation under confirmed LOC | | | 410 | | | | 384 | | | 459 |
Loan amounts rescheduled | | | 4 | | | | 25 | | | 53 |
Loan amounts written off | | | 76 | | | | 75 | | | 58 |
Number of current lines of credit and protocols | | | 56 | | | | 57 | | | 71 |
Insurance (in millions of Canadian dollars) | | | | | | | | | | |
Value of liability on insurance and guarantees | | | 26,219 | | | | 23,171 | | | 22,395 |
Value of claims paid | | | 55 | | | | 126 | | | 258 |
Value of claims recovered | | | 40 | | | | 36 | | | 20 |
Value of claims outstanding at end of year | | | 381 | | | | 440 | | | 422 |
Value of claims under consideration at end of year | | | 315 | | | | 8 | | | 32 |
Number of policies issued | | | 7,913 | | | | 9,714 | | | 10,573 |
Number of insurance policies and guarantees in force | | | 8,665 | | | | 9,238 | | | 9,252 |
Average employee strength during the year | | | 1,071 | | | | 1,115 | | | 1,082 |
| (1) | 2009 through 2002 numbers are based on previous Canadian GAAP, 2011 and 2010 are based on IFRS. |
| (2) | Figures prior to 2007 were not restated to reflect current presentation. |
| (3) | Includes equity prior to 2006. |
148 | BUILDING RESILIENCE IN UNCERTAIN TIMES
| | | | | | | | | | | | | | | | | | | | | | | | | | |
2008(1) | | | 2007(1) | | | 2006(1) | | | 2005(1) | | | 2004(1) | | | 2003(1) | | | 2002(1) | |
| | | | | | | |
| | 12,966 | | | | 11,362 | | | | 8,665 | | | | 4,298 | | | | 5,075 | | | | 4,763 | | | | 6,550 | |
| | 1,120 | | | | 1,222 | | | | 1,313 | | | | 793 | | | | 1,077 | | | | 1,176 | | | | 831 | |
| | 14,086 | | | | 12,584 | | | | 9,978 | | | | 5,091 | | | | 6,152 | | | | 5,939 | | | | 7,381 | |
| | | | | | | |
| | 61,428 | | | | 47,437 | | | | 42,916 | | | | 41,565 | | | | 40,177 | | | | 37,267 | | | | 34,532 | |
| | 3,736 | | | | 3,935 | | | | 5,494 | | | | 4,566 | | | | 3,450 | | | | 4,078 | | | | 5,128 | |
| | 2,432 | | | | 2,989 | | | | 4,845 | | | | 3,892 | | | | 3,501 | | | | 3,332 | | | | 3,510 | |
| | 4,137 | | | | 3,077 | | | | 2,858 | | | | 2,330 | | | | 1,623 | | | | 1,244 | | | | 689 | |
| | 71,733 | | | | 57,438 | | | | 56,113 | | | | 52,353 | | | | 48,751 | | | | 45,921 | | | | 43,859 | |
| | | | | | | |
| | 30,898 | | | | 19,108 | | | | 19,581 | | | | 17,306 | | | | 19,419 | | | | 21,459 | | | | 26,341 | |
| | 150 | | | | 95 | | | | 58 | | | | 44 | | | | 44 | | | | 40 | | | | – | |
| | 8,024 | | | | 6,096 | | | | 3,913 | | | | 2,994 | | | | 2,794 | | | | 3,040 | | | | 3,512 | |
| | 279 | | | | 143 | | | | 85 | | | | – | | | | – | | | | – | | | | – | |
| | 13,324 | | | | 9,972 | | | | 8,321 | | | | 4,574 | | | | 4,172 | | | | 4,194 | | | | 6,028 | |
| | 96 | | | | 56 | | | | 22 | | | | – | | | | – | | | | – | | | | – | |
| | 3,612 | | | | 2,549 | | | | 2,442 | | | | 1,470 | | | | 1,909 | | | | 1,820 | | | | 2,699 | |
| | 553 | | | | 418 | | | | 537 | | | | 1,004 | | | | 820 | | | | 509 | | | | 299 | |
| | 509 | | | | 2,373 | | | | 2,607 | | | | 2,550 | | | | 1,682 | | | | 1,732 | | | | 1,655 | |
| | – | | | | 2 | | | | 251 | | | | 128 | | | | 64 | | | | 232 | | | | 775 | |
| | 5 | | | | 21 | | | | 6 | | | | 39 | | | | 81 | | | | 113 | | | | 194 | |
| | 72 | | | | 65 | | | | 69 | | | | 60 | | | | 47 | | | | 61 | | | | 47 | |
| | | | | | | |
| | 24,075 | | | | 17,609 | | | | 16,299 | | | | 14,060 | | | | 12,175 | | | | 11,468 | | | | 12,265 | |
| | 104 | | | | 60 | | | | 59 | | | | 46 | | | | 68 | | | | 80 | | | | 143 | |
| | 24 | | | | 15 | | | | 38 | | | | 32 | | | | 25 | | | | 31 | | | | 39 | |
| | 266 | | | | 171 | | | | 199 | | | | 221 | | | | 261 | | | | 282 | | | | 344 | |
| | 32 | | | | 5 | | | | 17 | | | | 25 | | | | 38 | | | | 52 | | | | 35 | |
| | 10,120 | | | | 9,708 | | | | 10,458 | | | | 10,427 | | | | 10,756 | | | | 10,184 | | | | 6,351 | |
| | 9,328 | | | | 9,330 | | | | 9,104 | | | | 8,748 | | | | 8,209 | | | | 7,491 | | | | 6,968 | |
| | 1,063 | | | | 1,073 | | | | 1,038 | | | | 1,002 | | | | 994 | | | | 1,003 | | | | 992 | |
EDC ANNUAL REPORT 2011 | 149
TEN-YEAR REVIEW
CANADA ACCOUNT
| | | | | | | | | | | | |
Financial Arrangements Facilitated (in millions of Canadian dollars) | | 2011 | | | 2010 | | | 2009 | |
Financing | | | | | | | | | | | | |
Direct financing | | | – | | | | 76 | | | | 14,222 | (2) |
| | | | |
Insurance | | | | | | | | | | | | |
Credit insurance | | | 44 | | | | 129 | | | | 628 | |
Contract insurance and bonding | | | – | | | | – | | | | – | |
Political risk insurance | | | – | | | | – | | | | – | |
Subtotal | | | 44 | | | | 129 | | | | 628 | |
Total | | | $44 | | | | $205 | | | | $14,850 | |
| | | | |
Financial and Other Data | | | | | | | | | | | | |
Financing (in millions of Canadian dollars) | | | | | | | | | | | | |
Value of total loans and notes receivable | | | 3,442 | | | | 4,720 | | | | 5,905 | |
Value of undisbursed loans | | | – | | | | 505 | | | | 607 | |
Value of loan disbursements (net of guarantees) | | | 569 | (2) | | | 446 | (2) | | | 14,398 | (2) |
Value of liability on loan guarantees | | | 241 | | | | 295 | | | | 385 | |
Undisbursed amounts on loan guarantees | | | – | | | | – | | | | – | |
Amounts available for allocation | | | – | | | | – | | | | – | |
Loan amounts rescheduled | | | – | | | | 2 | | | | 1 | |
Number of transactions financed | | | – | | | | 5 | | | | 16 | |
Number of current lines of credit and protocols | | | – | | | | – | | | | – | |
| | | | |
Insurance (in millions of Canadian dollars) | | | | | | | | | | | | |
Value of liability on insurance and guarantees | | | 8 | | | | 10 | | | | 120 | |
Value of claims paid | | | – | | | | – | | | | – | |
Value of claims recovered | | | – | | | | – | | | | 11 | |
Value of claims outstanding at end of year | | | 13 | | | | 13 | | | | 13 | |
Number of policies issued | | | – | | | | 1 | | | | 103 | |
Number of insurance policies and guarantees in force | | | 4 | | | | 7 | | | | 53 | |
| (1) | Includes activity pursuant to the Softwood Lumber deposit refund mechanism transactions. |
| (2) | Includes amounts disbursed in conjunction with the Ontario Financing Authority relating to loans in the automotive sector. |
150 | BUILDING RESILIENCE IN UNCERTAIN TIMES
| | | | | | | | | | | | | | | | | | | | | | | | | | |
2008 | | | 2007 | | | 2006 | | | 2005 | | | 2004 | | | 2003 | | | 2002 | |
| | | | | | | |
| | – | | | | 27 | (1) | | | 3,645 | (1) | | | 649 | | | | 987 | | | | 1,209 | | | | 527 | |
| | | | | | | |
| | – | | | | – | | | | – | | | | – | | | | – | | | | 1 | | | | 1 | |
| | – | | | | – | | | | – | | | | – | | | | – | | | | – | | | | – | |
| | – | | | | – | | | | – | | | | – | | | | – | | | | – | | | | 5 | |
| | – | | | | – | | | | – | | | | – | | | | – | | | | 1 | | | | 6 | |
| | $– | | | | $27 | | | | $3,645 | | | | $649 | | | | $987 | | | | $1,210 | | | | $533 | |
| | | | | | | |
| | 3,226 | | | | 2,765 | | | | 3,592 | (1) | | | 3,994 | | | | 3,786 | | | | 3,219 | | | | 2,968 | |
| | 1 | | | | 2 | | | | 1,516 | (1) | | | 1,526 | | | | 2,368 | | | | 3,303 | | | | 5,123 | |
| | – | | | | 31 | (1) | | | 3,647 | (1) | | | 650 | | | | 1,020 | | | | 981 | | | | 533 | |
| | 457 | | | | 462 | | | | 535 | | | | 1,311 | | | | 1,341 | | | | 1,486 | | | | 1,968 | |
| | – | | | | – | | | | 15 | | | | 59 | | | | 145 | | | | 225 | | | | 195 | |
| | – | | | | – | | | | – | | | | 39 | | | | 52 | | | | 61 | | | | 109 | |
| | – | | | | – | | | | 15 | | | | 41 | | | | 6 | | | | 31 | | | | 25 | |
| | – | | | | 27 | (1) | | | 803 | (1) | | | 37 | | | | 55 | | | | 45 | | | | 28 | |
| | – | | | | – | | | | – | | | | 1 | | | | 2 | | | | 2 | | | | 2 | |
| | | | | | | |
| | – | | | | – | | | | – | | | | – | | | | – | | | | – | | | | 4 | |
| | – | | | | – | | | | – | | | | – | | | | – | | | | – | | | | – | |
| | 15 | | | | 8 | | | | – | | | | – | | | | – | | | | – | | | | – | |
| | 22 | | | | 35 | | | | 44 | | | | 44 | | | | 44 | | | | 45 | | | | 47 | |
| | – | | | | – | | | | – | | | | – | | | | – | | | | 2 | | | | 1 | |
| | 2 | | | | 2 | | | | 2 | | | | 4 | | | | 4 | | | | 5 | | | | 5 | |
EDC ANNUAL REPORT 2011 | 151
| | | | |
| | GLOSSARY OF FINANCIAL TERMS |
Actuarial Gains or Losses – Changes in the value of the defined benefit obligation and the plan assets due to differences between actuarial assumptions and what has actually occurred and due to changes in actuarial assumptions. Actuarial Valuation (re: Pension Benefit Plans) – An assessment of the financial status of a benefit plan performed by an independent actuary. It includes the valuation of any plan assets and the defined benefit obligation using estimates of future events that will affect the costs and obligation for employee benefits plans. Amortized Cost – The amount at which the financial asset or financial liability is measured at initial recognition minus principal repayments, plus or minus the cumulative amortization using the effective interest method of any difference between that initial amount and the maturity amount, and minus any reduction (directly or through the use of an allowance account) for impairment or uncollectability. Basis Point – One one-hundredth of a percentage point. Previous Canadian GAAP – Canadian generally accepted accounting principles used prior to transition to IFRS. Collective Allowance – Allowance established for losses which we estimate to have occurred, but have not yet been individually identified within our portfolio. Contingent Liability – Potential debt which arises from past events and may become an actual obligation if certain events occur or fail to occur. Contingent liability is also referred to as insurance policies and guarantees outstanding. Credit Risk – The risk of loss incurred if a counterparty fails to meet its financial commitments. Defined Benefit Obligation – The actuarial present value, without deducting any plan assets, of expected future payments required to settle the obligation resulting from employee service in the current and prior periods. Derivative Financial Instruments – Financial contracts that derive their value from changes in interest rates, foreign exchange rates, credit spreads, commodity prices, equities, market indexes or other financial measures. Such instruments include futures, interest rate, foreign exchange, equity, commodity and credit derivative contracts. | | Documentary Credit Insurance Program – Provides credit risk mitigation directly to Canadian financial institutions through credit insurance policies that cover their foreign bank and foreign buyer counterparty risk in trade transactions. Effective Interest Rate – The rate that exactly discounts estimated future cash payments or receipts through the expected life of the financial instrument or, when appropriate, a shorter period, to the net carrying amount of the financial asset or financial liability. Facultative Reinsurance – Reinsurance provided on a transactional basis. Fair Value – The amount for which an asset could be exchanged, or a liability settled, between knowledgeable, willing parties in an arm’s length transaction. Foreign Exchange Risk – The risk of potential adverse impact on the value of financial instruments resulting from exchange rate movements. Gross Loans Receivable – Principal amounts outstanding under existing loan agreements. Hedge – A risk management practice used to manage interest rate or foreign exchange exposures arising from the normal course of business operations. IFRS – International Financial Reporting Standards. Individually Impaired Loans – Loans where there is objective evidence that an impairment loss has occurred. Interest Rate Risk – The risk that the fair value or future cash flows of a financial instrument will fluctuate because of changes in market interest rates. LIBOR – London Inter-Bank Offered Rate – The interest rate at which banks in London are prepared to lend funds to first-class banks. Liquidity Risk – The risk that we would be unable to honour daily cash outflow commitments or the risk that we would have to obtain funds rapidly, possibly at an excessively high premium during severe market conditions. | | Market Risk – The risk that the fair value or future cash flows of a financial instrument will fluctuate because of changes in market prices. Market risk comprises three types of risk: foreign exchange risk, interest rate risk, and other price risk. Net Finance Margin – Net financing and investment income expressed as a percentage of average performing assets. Net Financing and Investment Income – Revenue earned on leasing and financing assets and investments, less interest and leasing and financing related expenses. Net Revenue – Net income excluding the provision for credit losses, claims-related expenses and administrative expenses. Operational Risk – The risk of direct or indirect loss resulting from the organizational environment, external events, inadequate internal processes, people, or systems. Productivity Ratio – Administrative expenses expressed as a percentage of net revenue excluding debt relief and the unrealized gains and losses on long-term debt and derivatives. Projected Benefit Method Pro Rated on Services – An actuarial valuation method in which an equal portion of the total estimated future benefit is attributed to each year of service. Return on Equity – Net income expressed as a percentage of equity. Special Purpose Entity (SPE) – SPE is an entity created to accomplish a narrow and well defined objective. Such a Special Purpose Entity may take the form of a corporation, trust, partnership or unincorporated entity. SPEs often are created with legal arrangements that impose strict and sometimes permanent limits on the decision-making powers of their governing board, trustee or management over the operations of the SPE. Undisbursed Loan Commitment – A contractual amount under an existing loan agreement that has yet to be advanced to the borrower. |
152 | BUILDING RESILIENCE IN UNCERTAIN TIMES
CORPORATE REPRESENTATION
| | | | | | | | |
National Head Office Export Development Canada 150 Slater Street Ottawa, ON K1A 1K3 Tel: 613-598-2500 Fax: 613-598-3811 edc.ca Vancouver 1055 Dunsmuir Street Suite 400, Bentall Four PO Box 49086 Vancouver, BC V7X 1G4 Tel: 604-638-6950 Fax: 604-638-6955 Edmonton 10180-101 Street Suite 1150 Edmonton, AB T5J 3S4 Tel: 780-702-5233 Fax: 780-702-5235 Calgary 308-4th Avenue SW Suite 2403 Calgary, AB T2P 0H7 Tel: 403-537-9800 Fax: 403-817-6701 Regina 1914 Hamilton Street Suite 300 Regina, SK S4P 3N6 Tel: 306-586-1727 Fax: 306-586-1725 Winnipeg Commodity Exchange Tower 360 Main Street Suite 2075 Winnipeg, MB R3C 3Z3 Tel: 204-975-5090 Fax: 204-975-5094 Windsor 3270 Electricity Dr. Suite 209 Walker Industrial Park Windsor, ON N8W 5J1 Tel: 519-974-7674 Fax: 519-974-9753 | | London 148 Fullarton Street Suite 1512 London, ON N6A 5P3 Tel: 519-963-5400 Fax: 519-963-5407 Mississauga 1 City Centre Drive Suite 805 Mississauga, ON L5B 1M2 Tel: 905-366-0300 Fax: 905-366-0332 Toronto 155 Wellington Street Suite 3120 Toronto, ON M5V 3L3 Tel: 416-349-6515 Fax: 416-349-6516 Drummondville 1412 Jean Berchmans Michaud Street Drummondville, QC J2C 7V3 Tel: 819-475-2587 Fax: 819-475-2408 Montréal 800 Victoria Square Suite 4520 P.O. Box 124, Tour de la Bourse Montréal, QC H4Z 1C3 Tel: 514-908-9200 Fax: 514-878-9891 Québec City 2875 Laurier Boulevard D-3, Suite 600 Québec, QC G1V 2M2 Tel: 418-577-7408 Fax: 418-577-7419 Ville Saint-Laurent 9900 Cavendish Boulevard Suite 201 Saint-Laurent, QC H4M 2V2 Tel: 514-215-7200 Fax: 514-215-7201 | | Halifax Suite 1605 1969 Upper Water Street, Tower 2 Halifax, NS B3J 3R7 Tel: 902-442-5205 Fax: 902-442-5204 Moncton 735 Main Street Suite 400 Moncton, NB E1C 1E5 Tel: 506-851-6066 Fax: 506-851-6406 St. John’s 90 O’Leary Avenue St. John’s, NL A1B 2C7 Tel: 709-772-8808 Fax: 709-772-8693 International Sao Paulo Consulate General of Canada Av. das Nações Unidas 12901 Cenu Torre Norte, Andar 16° CEP 04578-000 São Paulo - SP, Brazil Tel: (011) 55-11-5509-4320 Fax: (011) 55-11-5509-4275 Rio de Janeiro Canadian C onsulate General Av. Atlantic 1130/5 Ander Copacabana Atlantica Business Center Rio de Janeiro, Brazil CEP 22021-000 Tel: (011) 55-21-2295-0391 Fax: (011) 55-21-2275-5735 Chile Canadian Embassy Nueva Tajamar 481 – 12th floor North Tower Las Condes Santiago, Chile Tel: (011) 56-2-652-3807 Fax: (011) 56-2-652-3808 | | Peru Canadian Embassy Bolognesi 228, Miraflores Lima 18, Peru Tel: (011) 51-1 319-3385 Fax: (011) 51-1 446-6257 Mexico Canadian Embassy Calle Schiller 529 Rincón del Bosque Colonia Polanco México, D.F. 11580 Mexico Tel: (011) 52-55-5387-9316 Fax: (011) 52-55-5387-9317 Consulate of Canada Torre Gomez Morin 955 Piso 4, Suite 404, Col. Montebello San Pedro Garza Garcia, N.L. Monterrey, Mexico, CP, 66279 Tel: (011) 52-81-8378-0240 ext. 3360 Fax: (011) 52-81-8356-9965 Panama Canadian Embassy Torres de las Americas Tower A, 11th Floor Panama City, Panama Tel: (011) 507-294-2527 Fax: (011) 507-674-0887 Germany Consulate of Canada – Düsseldorf Benrather Strasse 8 40213 Düsseldorf Germany Tel: (011) 49-0-211-17217-45 Fax: (011) 49-0-211-17217-80 Turkey Consulate of Canada 209 Buyukdere Caddesi Tekfen Tower – 16th Floor Levent 4, Istanbul 34394 Turkey Tel: (011) 90-212-385-9700 Fax: (011) 90-212-385-9715 | | Russia Canadian Embassy 23 Starokonyushenny Pereulok Moscow, 119002 Russia Tel: (011) 7-495-925-6895 Fax: (011) 7-495-925-5667 Greater China Canadian Consulate General West Tower Suite 604, Shanghai Centre 1376 Nanjing Xi Lu Shanghai 200040 China Tel: (011) 86-21-3279-2832 Fax: (011) 86-21-3279-2837 Canadian Embassy 19 Dongzhimenwai Street Chayoang District, Beijing 100600 China Tel: (011) 86-10-5139-4126 Fax: (011) 86-10-5139-4463 India Canadian High Commission 7/8 Shantipath Chanakyanpuri New Delhi 110021 India Tel: (011) 91-11-4178-2288 Fax: (011) 91-11-4178-2607 Consulate General of Canada Fort House 6th Floor 221, Dr. D.N. Road Mumbai 400 001 India Tel: (011) 91-22-6749-4480 Fax: (011) 91-22-6749-4481 Singapore Canadian High Commission One George Street, #11-01 Singapore 049145 Tel: (011) 65-6854-5949 Fax: (011) 65-6854-5848 United Arab Emirates Canadian Embassy P.O. Box 6970 Abu Dhabi United Arab Emirates Tel: (011) 971-2-694-0376 Fax: (011) 971-2-694-0389 |
| | | | |
| | |
 | | Cover Rubik’s Cube ® used by permission of Seven Towns Limited. www.rubiks.com 1. Courtesy of Empresas CMPC 2. © Ocean / Corbis 3. © Dinodia Photos / Alamy 4. © Radius Images / Alamy 5. © Radius Images / Corbis 6. Courtesy of ANDRITZ Group 7. Courtesy of Magna IV Engineering 8. Rubik’s Cube image © Pasieka / Science Photo Library / Corbis | | Inside Pages 4, 6, 8, 30, 40 © Martin Lipman Page 11 © STRINGER/epa/Corbis Page 12 © Keith Dannemiller/Corbis Page 13 Courtesy of ANDRITZ Group Page 14 Courtesy of Empresas CMPC Page 15 © Ian Trower / Age Fotostock Page 16 Courtesy of Magna IV Engineering Page 17 © Radius Images / Alamy Page 19 © Dinodia Photos / Alamy Page 22 Courtesy of Hyduke Energy Page 26 © Gleb Gomberg Page 27 © Teckles Photography Page 31 © Bern Chartrand |
| | |
| Ce document est également disponible en français. | | Printed in Canada. |