EXHIBIT 99.3

| | |
| MANDATE | | Export Development Canada (EDC) is Canada’s export credit agency. Our mandate is to support and develop Canada’s trade, and the capacity of Canadian companies to participate in and respond to international business opportunities. Our knowledge and partnerships are used by more than 7,400 Canadian companies and their global customers in up to 200 markets worldwide each year. A Crown corporation accountable to Parliament through the Minister of International Trade, we are financially self-sustaining and a recognized leader in financial reporting and economic analysis. |
| |

| | |
| VISION | | EDC will be the most knowledgeable, the most connected and the most committed partner in trade for Canada. |

| | |
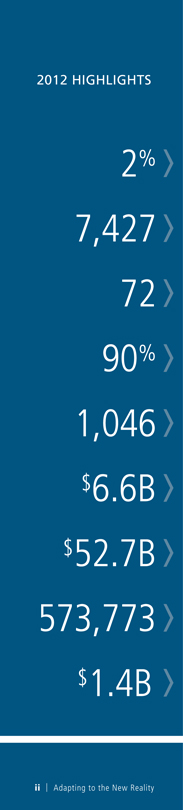 | | CANADIAN EXPORTS GREW 2% EDC SERVED 7,427 CUSTOMERS IN 187 COUNTRIES ACHIEVED CUSTOMER SATISFACTION AND LOYALTY SCORE (NET PROMOTER SCORE) OF 72, PUTTING EDC AMONG AN ELITE GROUP OF ORGANIZATIONS WITH SCORES ABOVE 70 90% OF ALL FINANCING TRANSACTIONS DONE IN PARTNERSHIP WITH FINANCIAL INSTITUTIONS 1,046 CANADIAN EXPORTERS BENEFITTED FROM OUR FINANCING FACILITIES TO TARGETED FOREIGN BUYERS OUR CUSTOMERS UNDERTOOK 896 TRANSACTIONS RELATED TO FOREIGN INVESTMENTS FOR A VALUE OF $6.6 BILLION HELPED GENERATE $52.7 BILLION OF CANADA’S GDP, MORE THAN 4.0 CENTS FOR EVERY DOLLAR EARNED HELPED SUSTAIN 573,773 JOBS, 3.3% OF NATIONAL EMPLOYMENT EDC EARNED REVENUES OF $1.4 BILLION AND GENERATED A NET INCOME OF $1.3 BILLION |
| |
| |
| |
| |
| |
| |
| |
| |
| |
| |
| |
| |
| |
| |
| |
| |
| |
| |
| |
| |
| |
| |
| |
| |
| |
| |
| | |
| | |
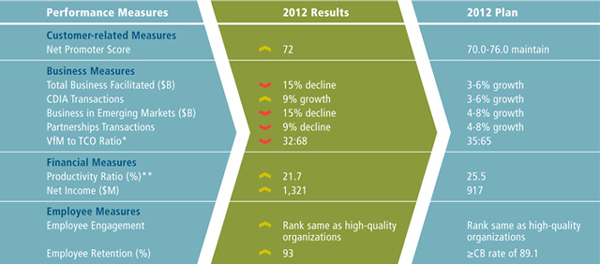
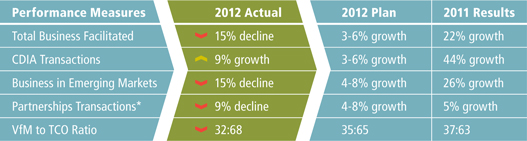
2012 PERFORMANCE MEASURES
| | | | | | |
Ratings in our performance measures are as follows:  Target met or exceeded (> 98% of plan) Target met or exceeded (> 98% of plan)
 Target substantially met (³ 95% and £ 98% of plan) Target substantially met (³ 95% and £ 98% of plan)
 Target not met (< 95% of plan) Target not met (< 95% of plan)
| | * ** | | Value for Money (VfM) are investments in IT that increase business performance. Total cost of ownership (TCO) is the cost of maintaining core business infrastructure and technology assets. The Productivity Ratio is the ratio of administrative expenses to net revenue. In 2012, our productivity ratio of 21.7 per cent was more favourable than plan due to increased loan revenue and reduced non-pension related administrative expenses. |
2012 PERFORMANCE HIGHLIGHTS BY SECTOR AND MARKET
BUSINESS FACILITATED BY INDUSTRY SECTOR ($ IN MILLIONS)
|

BUSINESS FACILITATED BY GEOGRAPHIC MARKET ($ IN MILLIONS) 
|
|
EDC Annual Report 2012 | iii |

MESSAGE FROM THE CHAIR
THE NEW REALITIES OF TRADE
As we look back on 2012, we see another volatile year for our exporters and mixed results for Export Development Canada. But we also see some bright spots in the way our customers are adapting to the global economy with the help of EDC.
For Canadian companies at large, the challenging environment has meant that in 2012 exports grew at a slower rate than anticipated. This reflects what is happening in the global economy. Slower growth in Canada’s traditional trading markets has reduced opportunities for many Canadian companies, especially small businesses. This has gradually led to a smaller pool of exporters and fewer customers for EDC in 2012. The client count, which had climbed to a record of 8,469 in 2009 at the peak of the financial crisis, has since declined to 7,427 in 2012. This stems from both the decrease in Canadian exporters and, on the plus side, more sources of credit available again.
By contrast, more clients turned to EDC to invest abroad and expand their foreign affiliate sales. We see this in the nine per cent increase in these types of transactions that EDC facilitated in 2012. Canadian direct investment abroad is at the heart of Canada’s global competitiveness, so this growth is a good sign that more Canadian businesses are adapting to the new trade realities.
These trade opportunities and challenges underscore the importance of the “D” in EDC’s name: the “development” of Canadian trade and investment in foreign markets. That’s the spirit of EDC’s mandate and it drives our agenda every day.
A vital tool EDC uses to expand Canada’s trade is partnering with public and private-sector institutions to reach more exporters. For instance, last year 90 per cent of all EDC’s financing transactions were done in partnership with other financial institutions. And we keep getting better at it. In 2012, EDC deepened its commitment to our government and Crown partners, and developed a closer working relationship with Canada’s Trade Commissioner Service to help match Canadian companies with foreign buyers. We’re also collaborating more with the Business Development Bank of Canada (BDC) to expand the financial toolbox for small business. By working together and sharing the risk, we all do more for Canadian companies – especially smaller ones.
When it comes to small businesses, this past year saw a great deal of boardroom discussion around new ways for EDC to identify and reach out to them. Management has taken to the challenge with new technology investments and business development efforts to serve small businesses more effectively. Strengthening these firms is high on the Canadian government’s agenda, recognizing that they create the most private sector jobs in Canada.
EDC is also on the same page as our shareholder, the Government of Canada, when it comes to financial sustainability. We remain committed to increasing our impact without increasing our size. The result in 2012 was even better productivity at EDC – a lower expenses to revenues ratio – than we had forecast. EDC has contributed a cumulative dividend to the Government of Canada of $1.45 billion over the past six years. In 2012 alone, based on 2011 revenues, EDC’s Board of Directors approved a dividend of $500 million. It demonstrates EDC’s financial strength and stability, which is put to work for both our customers and our shareholder.
4 | Adapting to the New Reality

Throughout my tenure at EDC, I’m proud of how EDC’s executive team and our Board have evolved to build a strong and healthy relationship. The corporation has a one-of-a-kind chemistry around its Board table. It provides advice and makes decisions quickly in these fast-changing times. Our governance practices have become more rigorous and, each year, we’ve sharpened our strategic planning process. The Board’s oversight of the introduction of EDC’s defined contribution pension plan and its focus on the enterprise’s risk management practices are two areas where our directors have made a material difference in 2012.
So as I leave the role of Chair at EDC after nearly six years, I do so with confidence that the corporation is in strong hands. From a personal standpoint, I have enjoyed working with so many great Canadians, in particular our spirited Board of Directors and executive team. A special thanks to Stephen Poloz and former president Eric Siegel for making the Board a full partner in this organization. All of us set the bar high and the results speak for themselves.
Two other Board members complete their second terms early in 2013: John Rooney, a fellow Albertan, and Norman Betts, who brought us his valuable Atlantic Canadian perspective. Both have brought a constructive partnership approach to the Board’s relationship with management. I thank them profoundly, along with all my director colleagues who’ve made my chair experience a satisfying and memorable one.
I’ve had the pleasure of working with a number of Canada’s Ministers of International Trade, most recently the Honourable Ed Fast. Like his predecessors, Mr. Fast took the time to meet with our Board and management, and has shown his confidence in EDC as a valuable trade partner. We return our appreciation.
To all of the EDC executives and employees I’ve worked with – plus so many others I’ve not yet met – you are EDC. You build the reputation and pride in the corporation every day. It shows up in every EDC result, in every EDC transaction. A hearty thanks to each of you.
It has been truly gratifying to serve EDC, the Government of Canada and the entrepreneurs who build this great country and make it flourish. Thank you for the honour. I will eagerly watch our exporters’ continued success.


|
EDC Annual Report 2012 | 5 |
MESSAGE FROM THE PRESIDENT

The post-crisis world remains wrought with uncertainty, despite signs of economic and financial healing. The key characteristics of this new normal are financial volatility, sub-par economic growth, a two-speed world – with emerging markets in the higher gear – and persistent fiscal and financial stresses.
In other words, a difficult environment for EDC and our customers. But one thing was clear for EDC: we needed to position ourselves to cope with this new reality, so that we could continue to serve the shifting needs of Canadian exporters. This meant putting more emphasis on our financial sustainability, strengthening our risk management architecture, helping companies seek new trade opportunities, and making significant technology investments. Accordingly, we made some big moves in 2012 to build our capacity to serve more Canadian companies for years to come.
First, we moved a number of our business experts into our technology group. This had two major benefits: this group is now better placed to make effective investments that will anticipate the future needs of our customers, especially smaller companies; and transaction teams are able to focus exclusively on execution and customer service, elevating productivity and service standards.
Second, we strengthened our risk management framework, which is highly regarded but has historically been focused mainly on financial risk. The group’s mandate, elevated to the executive level, was broadened to capture the full range of enterprise risks that must be managed in today’s world, including operational and compliance risks. We are also developing an enhanced governance structure that touches both management and our Board of Directors.
Third, we made financial sustainability a cornerstone of EDC’s corporate plan and its execution. Central to this operating philosophy is a new long-term commitment to a productivity ratio (administrative expenses to revenues) of 25 per cent – low by most financial institution standards. This framework commits EDC to spending only 25 per cent of every dollar earned on overhead costs. And, since our revenues capture a good sense of the value we are delivering to exporters – that is, what they pay us for our services – all Canadians are getting good value from our mandate.
These three organizational moves have better positioned us to help Canadian companies take on the biggest game-changer of the new normal – that a rising share of international business opportunities will be in emerging markets, and often will demand that companies establish a local presence in those markets.
That is why EDC tracks very closely two key performance indicators, namely, Canadian business we facilitate in emerging markets, and Canadian investments we help companies establish in them. During 2012, about one-third of our business was in emerging markets, a good sign that Canadian companies are diversifying their business to grow. We also increasingly helped companies finance and protect their investments abroad, as they seek to build a global footprint, creating new jobs here in Canada.
6 | Adapting to the New Reality
EDC’s results demonstrate that our 16 representations abroad and two-pronged strategy – to facilitate Canadian trade, and to help create new trade opportunities – are paying off for Canada. In 2012, we redoubled our efforts to bring financing to promising foreign buyers with whom we can match new Canadian suppliers. In these trade creation activities, we work closely with the Canadian Trade Commissioner Service’s experienced international network, each of us bringing complementary strengths to the table.
Another good example of trade creation in action is our work in Canada’s cleantech sector, which we had identified as a new export opportunity in 2011. In 2012, we created a virtual team, developed credit stretch parameters and signed 10 deals that will help commercialize some risky but ingenious clean technologies developed in Canada. We also set up a full partnership with Sustainable Development Technology Canada to help feed our transaction pipeline.
Indeed, EDC has adopted a partnership-preferred philosophy in everything we do. Given that we are meant to complement the private market, not displace it, we think partnership is the best way of ensuring that commercial players can grow a trade finance business in the space where EDC operates. For that reason, we actively encourage our people to seek ways to share risks with other players, in both the private and public sectors. In 2012 we set up agreements with more partners, such as the International Finance Corporation and African Export-Import Bank, to create new trade opportunities for Canadians. And we worked more closely with BDC, referring more small business clients to each other.
The other philosophy that embraces everything we do is our commitment to corporate social responsibility. Applying adequate due diligence on corruption and bribery, environmental and social impacts, and human rights is becoming more demanding as the world becomes more complex. Such preoccupations led us to strengthen our own Code of Conduct and due diligence processes for international transactions in 2012.
In these circumstances, 2012 was a positive year for EDC and its customers, but we recognize the new normal has been particularly stressful for small businesses. Many still rely on sales to the U.S., and the strong Canadian dollar is forcing them to stretch to innovate and increase productivity. The number of small exporting companies has been declining in this environment, yet they still represent more than 80 per cent of our customers.
While EDC’s small business offering is already strong, we have begun to review everything we do to ensure it is as effective and accessible as possible, in both insurance and lending. We have also launched a major technology investment program that will make our trade finance tools more self-serve in nature, through the web, to increase their availability to small companies. We are introducing small business performance metrics to track our progress more closely on this front.
I’m proud to say that despite all these challenges and increased complexity, EDC continues to make a real difference to Canada’s exporting community – and that is ultimately thanks to our people.
Our Board of Directors, 12 talented men and women from the private sector, is highly engaged in these challenges and provided superb advice along the way. In particular, I want to thank our outgoing Chair, Jim Dinning. I can say without hesitation that in his leadership of the Board, wide-ranging knowledge, and commitment to EDC, he has been one of the best Chairs a corporation could desire.
I also owe a special thanks to EDC’s executive team. Our new management structure meant that each had to stretch and adapt in 2012, and they did so seamlessly and enthusiastically. As usual, they were fully supported by our 1,250 employees, who each year find ways to adapt to new conditions and innovate in our offerings. Through their resilience, persistence and pure hard work, they help Canadian exporters get the job done.

|
EDC Annual Report 2012 | 7 |
MESSAGE FROM THE CHIEF ECONOMIST
WORLD ECONOMY
ON THE MARCH
To many, 2012 looked like a 2011 redux. Strong momentum ushered the year in, only to see it stifled in the summer – this time, by fears of fiscal and financial contagion. Those same observers may well be eyeing late-year momentum – a phenomenon we have now seen for four consecutive years – with increasing suspicion. On the surface it sure looks like more of the same: a new seasonal pattern of activity that is defining a new, lower economic growth paradigm.
However, thus far, that is not the case. Hard as it is to believe, growth is still being interrupted by temporary and unpredicted shocks. In 2011 it was the Arab Spring and severe weather conditions. In 2012, the collapse of the Greek electoral process and worries about U.S. fiscal conditions hobbled mid-year growth. Thankfully, the panic subsided, and economic momentum resumed. But it follows that today’s persistent pessimism in the marketplace makes us unusually vulnerable to these shocks, with significant impact on the economy.
If shocks are now more common, then the new pattern of global growth might indeed be permanent. Sidestepping the unpredictable natural world, the structural weakening brought about by the financial and economic collapse of 2008 has indeed increased the likelihood of shocks. By the same token, true recovery would lessen this likelihood, as stronger growth eases global vulnerability to current critical risks, and as the resulting higher confidence moderates our reaction to negative developments. If so, is true recovery something that the world economy can expect in the near term?
If there is any benefit to last year’s economic interruptions, it’s that they have actually helped to increase underlying demand pressures. The exaggerated excesses of the last growth cycle led to a collapse that took economic activity to levels commonly considered to be well below normal. Suppressed activity helped the economy to soak up the excesses, but the return to normal has been repeatedly delayed, creating a groundswell of pent-up demand.
This phenomenon is most obvious in the U.S. market. In its housing sector, building activity has been well below actual household formation since 2007, all but eliminating a surplus that epitomized the last economic cycle’s excesses. Dramatic declines in house prices dissuaded many new households from homeownership, but now that prices have reversed, these sidelined households are flooding into the market. Sales and building activity are up dramatically; even so, the upward march to normal levels suggests that the market still has two to three years of strong, double-digit growth ahead.
Given that housing is a time-tested leading indicator of overall economic activity, this revival heralds better times for the broader U.S. economy.
American consumers are already entering the fray. Mid-year global panic may have interrupted U.S. spending, but income was unfettered. Thus, when panic abated, the shopping resumed, and remained strong through year-end. Moreover, the spending upsurge is not interrupting consumer deleveraging; at the same time, the aggregate debt-to-income ratio is plunging, suggesting that current trends are sustainable, and will only improve as employment picks up.
8 | Adapting to the New Reality

Businesses in the U.S. are chiming in. Increased demand is quickly exhausting the excess production capacity in the economy. The need for U.S. firms to increase plant and equipment is becoming more critical. Fortunately, financial institutions and non-financial corporations are sitting on cash or near-cash equivalent to about 36 per cent of U.S. GDP – so they have the financial wherewithal to go on an investment binge, imminently.
Would that conditions in the rest of the developed world were as upbeat. Europe spent 2012 mired in a recession. Year-end data showed little improvement, in spite of the brighter U.S picture. Although gloom still shrouds Europe, prospects for a return to growth, albeit at a sluggish pace, are good. Lower fiscal drag and pockets of export success will drive the modest outlook. Japan’s economy remains unspectacular, and heavily dependent on public stimulus.
Even so, U.S. momentum is helping world growth. Large emerging markets reacted badly to the mid-year shocks, adding to widespread fears of a planet-wide double-dip recession. Data now show that those fears were overblown. China, Brazil and India each appear to be ending the year on a stronger note, helped by a combination of internal policy adjustments and rising export activity.
For Canadian exporters, 2012 was a mixed year. Strong momentum in the early months fizzled with the mid-year global slowdown, and a nascent rebound was aborted by the effects of Hurricane Sandy and partisan bickering in the run-up to the U.S. fiscal cliff. As such, a number of industries posted meagre export growth for the year. Even so, the auto and machinery sectors each racked up double-digit increases, and the energy and agri-food industries managed decent single-digit gains. Rising global demand is expected to bring higher growth to a broad spectrum of Canadian exporters in 2013.
While in many ways unspectacular, 2012 may well prove to have been an instrumental year in the business cycle, notwithstanding the risks and structural weaknesses of the world economy. The mid-year growth interruption not only illustrated, but augmented the resilience of underlying demand in the U.S. and elsewhere, which is set to lead the world economy to a more fulsome recovery in 2013 and beyond. If so, Canadian exporters can look forward to a new wave of growth.

|
EDC Annual Report 2012 | 9 |

It’s been four years since the recession began. While we are seeing definite signs of healing, there is still a great deal of uncertainty in the global economy.
This uncertainty, which has carried on far longer than normal, is being fed by persistent fiscal and financial stresses, geopolitical turmoil, and unforeseeable interruptions to economic growth. Emerging markets continue to outpace the developed world by a healthy margin, averaging 5 per cent growth in 2012 compared to well under 2 per cent for developed countries. And perhaps the most remarkable emerging trend in global trade patterns has been the rise of trade and investment in and among emerging economies, known as South-South trade. It’s estimated that trade between these markets could double to 25 per cent of global commerce by 2030. Consequently, the share of trade between developed countries and these southern markets is expected to fall from some 50 per cent to 30 per cent over same period.
Against this backdrop, Canadian exports continued to recover throughout 2012, but remained below the pre-recession peak seen in 2008. Overall it was a challenging year for EDC and many of our customers, but it was not without its successes, as discussed on pages 18 through 25.
CREATING CAPACITY FOR GROWTH
To position Canadian exporters for growth in this challenging environment – where diversification is more critical than ever – we redoubled our efforts to build relationships with promising foreign buyers in emerging markets and connect them with Canadian suppliers.
And we implemented several new initiatives aimed at creating trade opportunities in areas of significant potential growth for Canada. As described in the following pages, these include a focus on infrastructure opportunities in India, as well as the clean technology and aerospace sectors. Recognizing that today’s business challenges have been particularly stressful for small businesses, we also describe some of the programs we put in place to help grow this critical segment of Canada’s economy.

|
EDC Annual Report 2012 | 11 |
COMMERCIALIZING
CLEAN TECHNOLOGIES
Clean technologies are those that reduce negative environmental impacts and allow for a more efficient use of the earth’s resources.
For many reasons, EDC has made Canada’s cleantech sector a strategic priority. First, as the world’s conventional energy sources dwindle, much focus has shifted to developing renewable sources and technologies to extract them in a sustainable manner. Nearly all major economies have prioritized the development of their cleantech industries; particularly emerging markets such as China, India, Central America, and Southeast Asia, eager to address their deteriorating environmental conditions.
Furthermore, Canada’s skilled workforce, innovation clusters, research excellence and stable investment climate make it an ideal growth environment for cleantech firms. Canada is already home to more than 700 of these companies, mostly small and medium-sized, employing about 44,000 Canadians. In 2012 Canadian cleantech revenues were $9.1 billion, and are expected to reach $60 billion in the next 10 years. And 80 per cent of these companies derive more than half their sales from exports.
FROM DEVELOPMENT TO COMMERCIALIZATION
However, moving past the development phase of their innovative technology can be challenging for these companies; primarily because of gaps in the availability of lending and insurance products. For young companies, accessing lending and insurance can be one the biggest hurdles they face, even when their technology has been commercially proven. In 2012, we began laying the groundwork for a cleantech strategy to help grow these early stage companies through the commercialization stage, by developing partnerships with leading cleantech organizations, cleantech-focused venture capital firms, private equity firms and financial institutions.
For example, we signed a collaborative agreement with Sustainable Development Technology Canada (SDTC) whereby we will consider providing financial solutions to SDTC portfolio companies that are ready for commercialization. In turn, SDTC will share its assessment of technology and performance risks. We will also look for opportunities within our network of foreign buyers and top global corporations for SDTC companies. Ultimately, our long-term vision for the cleantech sector is to help more, smaller companies grow into larger ones.

With EDC’s help, B.C.’s Endurance Wind Power, a wind turbine manufacturer, pictured here, is now expanding into the United Kingdom.
For our first year with cleantech as a strategic priority, we engaged with a number of Canada’s leading cleantech companies in sub-sectors such as water management, low-energy lighting and wind power, with a view to deploying our financial solutions where market gaps existed, and where we were able to help cleantech firms at a pivotal stage in their development. By year end, we had signed 10 such transactions. These firms needed a partner, like EDC, to capitalize on strategic opportunities that had the potential to help their export sales grow significantly.
One of these deals was $7 million in financing for Surrey, B.C.-based Endurance Wind Power, a manufacturer of wind turbines in the mid-sized niche; those delivering power below 100kw. They had ambitious plans to expand into the U.K. market and our loan was part of the first phase in this strategy, which will enable the company to enter and capture a significant share of the growing U.K. renewable energy market and – ultimately – get them known on the world stage.
| | |
| 12 | Adapting to the New Reality | | |
DEVELOPING OPPORTUNITIES IN AEROSPACE
| | |
Canada’s aerospace industry now spans the country, with more than 400 companies in three world-class aerospace clusters in Vancouver, Toronto and Montreal. The importance of the industry to Canada’s prosperity led to a strategic government review of the aerospace sector that concluded in 2012, where key recommendations focused on how to help these companies to compete on a global scale. Recommendations for EDC focused on helping Canadian SMEs to penetrate the supply chains of large international players. In fact, the Canadian aerospace sector is benefiting from globally-minded SMEs that are pursuing new relationships with Tier 1 companies all around the world, making inroads into aerospace manufacturing clusters in Mexico, U.K., Brazil, the US, and China. In 2012, 128 Canadian companies in the aerospace sector used our services to undertake $4.9 billion in export trade and investment. One of these companies is Montreal-based AV&R Vision et Robotiques, developers of automated visual inspection systems for aircraft engine parts. In 2006, AV&R chose to focus on the aerospace industry and won contracts with Pratt & Whitney and General Electric in the United States. But in 2008, its U.S. customers, which accounted for 50 per cent of revenues, put orders on hold, leading AV&R to look outside North America. The firm was able to sign new deals with companies in aerospace supply chains in Germany, the U.K. and Israel. Today, roughly half of AV&R’s sales originate outside North America. | | EDC’s Export Guarantee program (EGP) helps manage the costs of servicing these new contracts. The EGP offers a partial guarantee to an exporter’s bank, giving it the confidence to lend against the value of upfront costs before the exporter is paid. For AV&R, that meant that it could complete current contracts and still have the working capital to secure the next deal. Furthermore, anchor companies such as Canada’s CAE, and Pratt & Whitney Canada (PWC), both based in Montreal, continue to expand their international sales into markets like the Middle East, South America and Southeast Asia. EDC helps grow supply chains from these anchor companies in many ways. For example, aircraft engine manufacturer PWC sells and ships to various companies with the European EADS group. EDC’s Note Purchase program, where we purchase notes payable from EADS for the value of engine sales from PWC, has become an important financial instrument for PWC. As we take on the obligation of the contract payment, PWC benefits from payments a few days after shipping, freeing up their capital, and EADS benefits from a one-year payment term instead of the 60-day standard. In addition, the development of the CSeries by Bombardier continues to play a pivotal role for aviation innovation and R&D, and creates many opportunities for smaller companies along the supply chain to grow globally. We have already made indicative financing commitments to buyers of CSeries aircraft. As the program matures and the aircraft’s acceptance grows, we will work to bring in additional capacity from the private sector. |
|
 |
As large Canadian aerospace players such as Pratt & Whitney Canada, pictured here, expand their presence in international markets, they create opportunities for smaller Canadian companies along the supply chain.

|
EDC Annual Report 2012 | 13 |
INDIA’S MASSIVE OPPORTUNITIES

India’s billion-plus people make up one of the biggest and potentially lucrative markets in the world, and one with huge opportunities for Canadian expertise in several sectors.
After GDP growth fell during the global crisis period, India has resumed its growth of more than 5 per cent since. But to maintain this momentum over the long term, India will need to pour enormous resources into expanding and upgrading its infrastructure, estimated at about US$2 trillion over the next 10 years.
India will need partners to help make this happen; it will need to engage foreign resources, both expertise and capital. Currently, bilateral trade between Canada and India sits at about $4 billion and is expected to grow to $15 billion over the next few years. But our market share is still relatively small; Canada currently ranks 34th among India’s suppliers. That said, today, there are more than 300 Canadian companies with operations in India compared to 50 companies just five years ago.
EDC has had a local presence in India since 2005 and now has representations in Mumbai and New Delhi.
And while not without its challenges, we certainly see the massive potential for Canadian business in India, particularly in areas such as engineering, construction, transportation and environmental technologies; areas where we have been working to grow Canada’s footprint.
In fact, last year we successfully participated in our first large scale infrastructure project, providing $100 million in financing as part of a larger financing package for the Mahan Aluminium Project in Madhya Pradesh.
In addition, we have investments and undisbursed commitments of about $110 million with four Indian fund managers: Avigo SME Fund II and III; Infrastructure Development Finance Company India Infrastructure Fund; Kotak India Private Equity Fund and Everstone Capital Partners II, through which we hope to introduce Canadian small and mid-size exporters to the portfolio companies of the funds.
Overall in 2012, our insurance services and loans helped more than 300 Canadian companies conduct more than $2 billion in business in India. Sixty four of these companies were small businesses.
BUILDING RELATIONSHIPS IN INDIA
One of our strategies to capitalizing on these massive opportunities and create trade in India is to participate in financing facilities to targeted Indian buyers, such as oil and gas giant Reliance Industries, Larson & Toubro, Mahindra & Mahindra, Tata Motors, and then coordinate matchmaking events to introduce them to Canadian companies.
In doing so, we are able to raise awareness of and influence purchases from Canadian suppliers. These efforts led to more than $1 billion in new Canadian contracts in India in 2012, bringing new business to over 60 exporters, largely SMEs.
|
| 14 | Adapting to the New Reality |
| | |
Many of these opportunities came from India’s burgeoning auto sector. As noted, India is one of the world’s fastest growing economies, but has only some 14 vehicles per 1,000 people, where the world average is 120. And with a population of 1.3 billion – and a fast growing middle-class – demand is only going to increase, by some estimates demand will increase more than 15 per cent a year over the next decade. This will mean massive production by India’s automakers, and a huge demand for auto parts. To meet India’s growing auto sector demands, EDC has been building relationships and providing loans to key Indian Original Equipment Manufacturers (OEMs) such as Tata Motors, and introducing Canadian suppliers to these major buyers. Last year EDC coordinated an event in partnership with the Department of Foreign Affairs and International Trade and the Automotive Parts Manufacturers Association (APMA), following the Auto Expo 2012 Show in Delhi. At the event, several Canadian companies met with senior decision makers from Mahindra & Mahindra, Ford India, Ashok Leyland and Tata Motors. One of these companies was Valiant Machine & Tool. | | The Windsor-based company makes automation systems for car manufacturers; equipment and tools needed for production lines. Several years ago Valiant recognized that the overwhelming majority of their business was to North America and began to aggressively pursue clients in new regions of the world. This eventually led the company to India to support many of its large customers with a local presence, such as Honda, GM, Volvo and Ford. They first established a small engineering and sales office and now have a full-fledged design and build house in Pune to support their customers in the region. EDC has been helping the company to grow internationally since 2001, through various products and services. And, as a result of the introductions EDC was able to make at the Delhi event, Valiant has been able to build significantly on its relationships within the Asia-Pacific region. Today, the company has about 1,600 employees, throughout 23 facilities in 11 countries, including the U.S., Austria, Germany, Belgium, the Czech Republic, Romania, Mexico and India. |
|
 |
EDC has been building relationships with large Indian buyers such as Ford India and introducing them to Canadian suppliers such as Windsor’s Valiant Machine & Tool, above.

|
EDC Annual Report 2012 | 15 |
SERVING CANADA’S SMALL BUSINESSES
| | |
Nowhere are the needs, and rewards, of adapting to today’s complex global trade environment more apparent than among Canada’s small business community, which creates about half of Canada’s private sector jobs and makes up the majority of our exporters. Together small and medium-sized businesses (SMEs) represented close to 80 per cent of our customers in 2012, or 5,807 companies. The small business segment alone, which we define as companies with annual sales less than $10 million, accounts for more than half of our customer base. Canada, however, has seen a gradual decline in small business exporters since 2005, when our dollar started to soar and, later, when U.S. purchases were slashed during the recession. This makes EDC’s trade “development” role more important than ever – not just facilitating trade, but helping create new opportunities by putting small firms in front of potential buyers, particularly in emerging markets. 
| | PROGRAMS TO HELP SMALL BUSINESS GROW While all of our financial products and services are available to SMEs, some were specifically designed to address their unique needs, such as our Export Guarantee Program (EGP) and the single buyer insurance policy. The EGP, for one, provides guarantees to commercial lenders so that they can provide more loans to their SME clients. Since EDC usually takes a larger share of the risk, up to 100 per cent for small business, the program encourages banks to help exporting companies they might otherwise not have considered. One of these companies is Quebec-based Absolute NDE, a company that tests specialized pipeline materials for the oil and gas industry. Absolute developed a niche market for testing exotic materials, not just carbon steel that most pipelines are made of. Its automated ultrasonic testing methods don’t damage the pipeline – known as non-destructive testing. In less than five years, this Quebec-based company moved from a small to a mid-sized firm. As it grew, so did its risks and financing needs. In 2012, EDC’s Export Guarantee Program enabled its bank to provide it with more working capital to buy the necessary equipment and expand the business overseas. Today, the company has facilities in France, Brazil, Norway and Australia, with some 50 employees and sub-contractors working in 12 countries. Brazil, for one, has become a key market with its growing offshore oil development. In less than five years, Quebec’s Absolute NDE, pictured here, moved from a small to a mid-sized firm by finding a niche market in the oil and gas sector and targeting opportunities in emerging markets with help from EDC’s Export Guarantee Program. |
| | |
| 16 | Adapting to the New Reality | | |

Another example is Nova Scotia-based Survival Systems. Survival Systems provides emergency egress simulation devices and survival training programs for the offshore, marine, aviation and industrial sectors – essentially anyone who may have to react, escape, rescue or survive a life-threatening situation over water, air or land. The company’s flagship Modular Egress Training Simulator (METS™) replicates the interior of various aircraft platforms.
Like many small Canadian businesses, the company struggled during the downturn, but things were getting back on track by 2011 after they secured two large contracts with the U.S. military and Russia’s largest oil and gas company. In 2012, they increased their focus on private sector training, concentrating more on the offshore oil and gas sector. And securing a partner and sister company in India helped them win a contract with the Indian navy to install a full simulation theatre in 2013.
EDC has been helping the company with their market expansion efforts since 2000. Since that time, Survival Systems has used several of our bonding and insurance solutions including the Export Guarantee Program. Simulators can take four to six months to manufacture, so having access to working capital during that time is a great advantage.
As a result of their success in 2012, Survival Systems sales have grown to more than $15 million. For EDC, that means they’re no longer considered a small business (with annual sales less than $10 million), and have “graduated” to our commercial sector. Today, Survival Systems has manufactured and distributed more than 100 METS in 30 countries including the U.S., Australia, Germany, Poland, Chile, Korea, France, Spain, Indonesia, Nigeria, Holland and India.
PARTNERING TO SERVE
SMALL BUSINESSES
We understand that partnerships are, and will continue to be, a key underpinning of our service to small business. Our protocol with BDC, signed in 2011, is a good example; in 2012, we referred 101 small businesses to BDC, who referred more than 40 to us, almost double the referrals since 2011 when the new collaboration agreement was signed.
Looking ahead, we plan to build on our relationships with financial institutions, both to increase their capacity to serve SMEs, and to refer more customers to each other.
Other plans are underway to increase our impact and ease of access to small business. For example, we are investing in technology to broaden our online offerings, such as more self-service tools and “selective coverage” options suited to the needs of small exporters. We also created a Special Advisor for Small Business, to review and refine our corporate-wide small business strategy, and to ensure progress, we introduced a corporate-wide small business transaction measure as part of our corporate scorecard in 2013.
|
EDC Annual Report 2012 | 17 |

BUSINESS MEASURES
| * | For purposes of the 2012 comparison, the 2011 partnership transactions have been restated to reflect changes to the definition of this measure made in 2012. | |
Ratings in our performance measures are as follows:
MIXED RESULTS FOR 2012
While there were signs of improvement, 2012 still presented challenges for many Canadian exporters and investors. Slower growth in the U.S. and Europe meant fewer opportunities for Canadian companies that rely on these markets. And while emerging markets continued to outpace the developed world, growth in China and India was still less than expected, which led to lower commodity prices in some instances and thus, lower volumes of EDC insured exports. At the same time, we saw less demand for our insurance and bonding services as private sector financial institutions took on a larger share of the marketplace this year and more liquidity was available for Canadian companies, good news for the Canadian economy.
In this environment, Canadian exports grew about 2 per cent in 2012, but still below pre-recession levels, and overall there are fewer exporters today than in 2008. A smaller pool of exporters and decreased demand meant a decline in the number of customers we served and the amount of business that we helped facilitate, both of which dropped closer to our more normal, 2008 pre-recession levels. A positive development was an increase in private-sector financial capacity, which reduced demand for EDC. We were also encouraged to see that our customers continued to diversify and increased their direct foreign investments.
In 2012 we served 7,427 customers, whose exports and investments totalled $87.4 billion, a 15 per cent decline from 2011 and below our plan of 3 to 6 per cent growth. Close to 80 per cent, or 5,817 were small-and medium-sized businesses, whose business facilitated by EDC totalled $11.7 billion, $642 million more than in 2011. Close to 35 per cent of these SMEs’ business was to markets in Asia.
We helped 5,772 clients by insuring almost $73 billion in export sales with about 75,092 buyers in 187 foreign markets. The majority of this business was Accounts Receivable Insurance (ARI), which helps companies mitigate credit risk and leverage their receivables with financial institutions. This insurance also allows them to offer their buyers more flexible payment options.
Our financing activities delivered $14.6 billion in loans to Canadian clients and their foreign trading partners. 90 per cent of these financing transactions were done in partnership with private sector institutions. We earned revenues of $1.2 billion from our loans, investments, and loan guarantee fees, compared to $1.1 billion in 2011.
We earned $196 million for coverage under our insurance programs and paid out $358 million in claims, due primarily to a $300 million claim charge under our PRI program.

|
EDC Annual Report 2012 | 19 |
| | | | |
CANADIAN DIRECT INVESTMENT ABROAD (CDIA) TRANSACTIONS Given the uncertainty of today’s global trade environment, foreign investment strategies have become increasingly critical for Canadian companies looking to diversify and grow, and even more so as a channel to capitalize on the opportunities arising from South-South trade. Our CDIA transactions include loans to help companies open facilities in new markets or participate in joint ventures, and insurance for sales by foreign affiliates of Canadian companies as well as political risk insurance. Overall, our customers undertook 896 transactions related to their foreign investments in 2012, 9 per cent more than last year. The value of these transactions was $6.6 billion, up from $5.9 billion in 2011. BUSINESS IN EMERGING MARKETS Through our services, our customers’ business in 138 emerging markets totalled $26.3 billion in 2012, a 15 per cent decline from 2011 and below our plan of 4 to 8 per cent growth. Key contributing factors for this decline included slower than expected economic growth in the big emerging markets such as India and China, which was associated with lower prices for some Canadian commodity exports. However, our loans to foreign buyers in emerging markets, a key focus for EDC, reached $4.4 billion in 2012, an increase of $1 billion over 2011. This included close to $865 million in financing to Brazil, up from $388 million in 2011, $214 million to China, up from $16 million in 2011, $1.4 billion to Mexico, up from $904 million in 2011, and $174 million to Southeast Asia, up from $43 million in 2011. 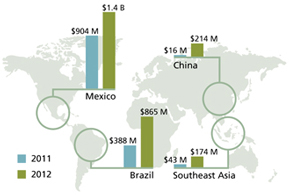
| | | | 
PARTNERSHIP TRANSACTIONS Working in partnership to combine our expertise and risk capacity is the most efficient way to expand our reach and have a greater impact on more Canadian exporters and investors. Whenever possible we try to share the risk and complement the activities of the Business Development Bank of Canada (BDC) and private-sector financial institutions, insurance companies, sureties and brokers, depending on the level of private-sector capacity. In 2012, the number of transaction we conducted with partners was 4,517, down 9 per cent from 2011’s total of 4,977, and below our plan of 4 to 8 per cent growth. These transactions led to $35.75 billion in business for our customers. Again, slower than expected growth in China also limited banks’ need for our risk capacity. EDC has 16 foreign representations in key international markets. By having a presence in important international markets, we can gather local market intelligence, build relationships with foreign buyers, and collaborate with DFAIT and the TCS to identify new opportunities for Canadian companies, particularly in rapidly growing markets such as China, India, Brazil and Mexico. Currently, emerging markets represent 30 per cent of our business activities. |
| | |
| 20 | Adapting to the New Reality | | |
As more private sector capacity returned to the market in 2012, we were generally less needed and, as a result, saw less demand for our insurance and bonding services, a positive development for the Canadian economy.
Furthermore, we were very encouraged that 90 per cent of our 794 financing transactions were done in partnership with financial institutions.
Throughout the year we continued to build on our partnerships. For example, we strengthened our relationship with the banking sector through the Lending Practitioners’ Forum, a joint consultative body with Canada’s private financial sector and participated in the Government-led Credit Insurance Advisory Group (CIAG), in order to grow our partnership with private-sector credit insurers. Other initiatives included a Memorandum of Understanding (MOU) with the International Finance Corporation (IFC) to leverage each other’s capabilities in emerging market projects and transactions, and an MOU with the African Trade Insurance Agency (ATI) to facilitate more trade and investment between Africa and Canada. We also provided a USD 30 million five-year line of credit to the African Export-Import Bank, in order to deepen the business relationship between Afreximbank and EDC.

VALUE FOR MONEY TO TOTAL
COST OF OWNERSHIP RATIO
Each year, we evaluate how our information technology investments are divided between Value for Money (VfM), investments in IT that increase business performance, and Total Cost of Ownership (TCO), which are the costs of maintaining core business infrastructure and technology assets. Our goal is to devote more resources to delivering on VfM objectives while managing TCO.
In 2012, our result of 32:68 did not reach our plan of 35:65, as we continued to modernize our legacy systems and information technology architecture. We expect that the upward pressure on TCO will continue in the near future, as these efforts are ongoing.
DOMESTIC FINANCING AND INSURANCE
In 2012, we continued to provide trade-related financing solutions to Canadian companies in the domestic market through Canada’s Economic Action Plan, which gave us temporary, additional flexibility to provide credit to Canadian companies. By participating in transactions with Canadian private-sector financial and insurance institutions and BDC, we helped position viable Canadian companies for recovery. Under this program, we undertook $2.2 billion in commercial solutions for 316 Canadian exporting companies, including $1.7 billion in direct financing, $238 million in domestic bonding and $283 million in domestic credit insurance. We continued to participate as a reinsurer to private insurers, bringing additional capacity to the market for 233 small Canadian companies. In total, we have provided $11.2 billion in credit capacity to 819 Canadian companies for their trade-related needs since March 2009. This program, originally a two-year mandate from the Government of Canada, was extended until March 12, 2013.
90 per cent of our 794 financing transactions were done in partnership with financial institutions.

|
EDC Annual Report 2012 | 21 |

DEVELOPING FUTURE OPPORTUNITIES FOR TRADE
Our ultimate goal is to generate benefits for Canada. In addition to facilitating trade, this often means finding trade opportunities where they would otherwise not exist. We do so in many ways, including participating in financing facilities to targeted foreign buyers to influence procurement from Canadian suppliers, thereby pulling in exports from Canada. These facilities led to almost $3 billion in new contracts in 2012, bringing new business to 1,046 exporters, largely SMEs. Close to 40 per cent of the 207 foreign borrowers were in emerging markets.
Currently, we have 105 active pull financing facilities with major buyers around the world. Some of these include Codelco, Chile’s state-owned copper company, India’s Tata Motors, Reliance Industries and Larson & Toubro, Brazilian energy giant Petrobras, Mexico’s state-owned petroleum company PEMEX and China’s transportation specialist, Noble Group and China Everbright, to name a few. Since 2004, our pull loans have helped create export sales of almost $18 billion.
Throughout 2012, we also participated in 38 matchmaking events in collaboration with partners such as the Trade Commissioner Service (TCS), connecting more than 400 Canadian suppliers with more than 100 large foreign buyers. These events generated more than 600 one-on-one meetings for Canadian companies and are expected to result in more than 100 eventual deals.
For example, Peru’s healthcare industry is booming and Canadian companies are well-positioned to offer their expertise. Following a visit to the market in 2011, we set
out to create awareness within Peru and put Canada’s industry on their radar. In 2012, in collaboration with the Ontario Ministry of Economic Development and Innovation, DFAIT and the TCS, we organized an inbound mission for more than 30 Canadian companies in the healthcare industry to pitch their services to procurement directors from Peru’s Grupo Auna, one of that country’s largest private healthcare providers.
INVESTMENTS
EDC is an active investor in direct venture and growth capital investments and also partners with private-sector fund managers, both domestically and internationally. During periods of constrained credit, this program is particularly helpful to small- and medium-sized companies, as it gives them access to the private equity they need to penetrate the global marketplace.
Including commitments of $230 million in 2012, since the inception of this program we have provided commitments totalling $922 million. These include $280 million in commitments to next-generation exporters, $149 million in commitments to mid-market growth exporters and $493 million in commitments focused on connecting with emerging markets. For example, we committed up to $7.5 million to the Avrio Ventures Limited Partnership II, a venture capital fund that targets Canadian companies operating in subsectors like industrial bio-products, agricultural biotechnology, natural and organic consumer packaged goods and renewable ingredients.
|
| 22 | Adapting to the New Reality |
FINANCIAL MEASURES
Ratings in our performance measures are as follows:
| | |
| | Target met or exceeded (> 98% of plan) |
| | Target substantially met (³ 95% and £ 98% of plan) |
| | Target not met (< 95% of plan) |
SOUND FINANCIAL MANAGEMENT
Through sound financial management, we ensure we have an adequate capital base to fulfill our mandate now and in the future. Operating on a self-sustaining basis with no annual appropriations from Parliament, we achieve self-sustainability by containing costs, managing our risks and getting an adequate return on the risks taken.
This approach has enabled us to facilitate almost $1.1 trillion in exports and investments from the $1.3 billion in share capital invested in us by the Government of Canada since 1944.
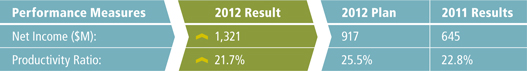
We track our financial performance through two key measures: net income and productivity ratio.
Under normal operating conditions we expect to earn net income in the range of $600 to $800 million annually. Fluctuations in the provision for credit losses, claims-related expenses and the fair value of financial instruments can cause net income to fall outside this range.
Our net income for 2012 was $1.3 billion, $404 million higher than our plan and $676 million over income reported in 2011, mainly a result of reversals in both our provision for credit losses and claims-related expenses.
HIGHER PRODUCTIVITY
In order to ensure financial sustainability, we are committed to spending no more than approximately 25 cents of every dollar earned on overhead costs. We measure this through our productivity ratio (PR), the ratio of administrative expenses to net revenue.
We view the revenue generated from our financing and insurance business as an indication of the value that companies place upon our services. In 2012 we earned $1.4 billion in revenue, higher than both 2011 and the Corporate Plan, due mainly to an increase in loan revenue from additional signings and disbursements.
Administrative expenses were $314 million in 2012, 4% above the Corporate Plan, driven by higher pension costs due to a reduction in the discount rate used to value our pension liability. However, when we exclude the impact of the additional pension costs, our administrative expenses become $283 million, lower than 2011 and plan. As pension costs can fluctuate from year to year based on assumptions used to value the pension liability, the productivity ratio is calculated based on the pension assumptions included in the Corporate Plan, with the intent of absorbing any changes in the following year.
Therefore in 2012, given increased loan revenues and reduced non-pension related administrative expenses, our productivity ratio of 21.7 per cent was significantly more favourable than our plan of 25.5 per cent. This lower PR demonstrates our disciplined approach to being more agile and delivering greater financial sustainability for the corporation.

|
EDC Annual Report 2012 | 23 |
CUSTOMER-RELATED MEASURES

Ratings in our performance measures are as follows:
| | |
| | Target met or exceeded (> 98% of plan) |
| | Target substantially met (³ 95% and £ 98% of plan) |
| | Target not met (< 95% of plan) |
We measure our success in customers satisfaction and loyalty through the Net Promoter Score, an industry standard for measuring customer satisfaction. By collecting data on how well we are servicing the needs of our customers, we get a good indication of customer referral, loyalty and retention.
We collect the data by a series of surveys of active customers that asks: “On a scale of 0 to 10, with 0 being not at all likely and 10 being extremely likely, how likely
is it that you would recommend EDC to a colleague who is also an exporter?” The NPS is a calculation based on the percentage of customers who are “Promoters” (9s and 10s) minus the percentage of customers who are “Detractors” (0s through 6s).
Our 2012 score of 72 shows that the majority of our customers would be likely to refer us to partners and associates and places EDC among an elite group of organizations with scores above 70. Service quality and value ranked were the top drivers in 2012.
Our information technology is critical to delivering timely solutions for our customers. In 2012, we began a large, multi-year program to modernize our key business systems. In doing so, we began to add more flexibility to our core transacting systems, improve web access to our services, and give employees better access to the information required to make timely decisions.
Adopting these new technology tools and further implementing the Lean process methodology across our programs has led to faster turnaround times and greater predictability for our customers.
|
| 24 | Adapting to the New Reality |
EMPLOYEE MEASURES

* High-quality organization norm is 74%; EDC achieved 78%.
Ratings in our performance measures are as follows:
| | |
| | Target met or exceeded (> 98% of plan) |
| | Target substantially met (³ 95% and £ 98% of plan) |
| | Target not met (< 95% of plan) |
PLANNING FOR OUR FUTURE LABOUR FORCE
Like many industrialized countries, Canada’s labour force is facing a demographic decline in the coming years. In this tightened labour market, the ability to attract and retain highly skilled knowledge workers is more important than ever. With this in mind, in 2012, we completed a comprehensive examination considering the future of work, our evolving business environment as well as workforce and legislative trends, in order to ensure we can continue to provide the best possible service to Canadian exporters and investors.
We then began the design of a sustainable workforce planning program to ensure that we continue to have the right people with the right skills in the right place at the right time. Elements of this program will include a workforce assessment and planning process according to the roles that drive our business, and a process to ensure we maintain the right balance of strong technical skills and behavioural competencies.
As part of this strategy, in 2012 we created a resiliency pool of 15 employees, where certain employees temporarily leave their positions in order to focus on key challenges such as trade creation opportunities or high priority projects. Employees in the resiliency pool get the opportunity to develop new skills while applying their talents to other priorities. This initiative enables us to work smarter, develop individual and organizational resiliency and create capacity for when demand is heaviest.
LEADERSHIP AND TRAINING
Our commitment to strong leadership has been central to creating a positive and productive workplace. Throughout the year, we rolled out a Leadership Talent Review process, assessing 179 leaders and giving us the opportunity to have deeper conversations on the performance and potential of our leaders. We also developed a new leadership curriculum that focused on aligning training programs to our new competency framework. “Foundations of Operational Excellence” was rolled out to 90 per cent of the leadership group in 2012 and, as a result, the group now has a solid foundation on how to lead in a Lean Environment and create high-performing teams.
As part of our legacy systems modernization project, training programs have been shifting towards “anytime, anyplace, any pace” learning. In 2012, we achieved our goal of making available 75 per cent of our courses online, resulting in greater accessibility for employees and reducing time and travel costs for employees who would previously have had to travel to head office. The last Employee Opinion Survey results indicate a score of 69 per cent on training effectiveness, six per cent higher than comparable high-quality organizations.
In addition to benefitting our customers, together these efforts continue to create a more engaged employee base. In 2012, our employee retention rate was 93 per cent.

|
EDC Annual Report 2012 | 25 |

Delivering value for our customers also involves carrying out business in the socially responsible manner that Canadians expect. For us, Corporate Social Responsibility (CSR) is more than just compliance with policy or regulation, it is the integration of values such as honesty, respect, fairness and integrity into our daily business practices.
2012 CSR SCORECARD
|
EDC Annual Report 2012 | 27 |
EDC believes that good business – adopting and embracing these principles while we facilitate trade for Canadian investors and exporters – is good for business.
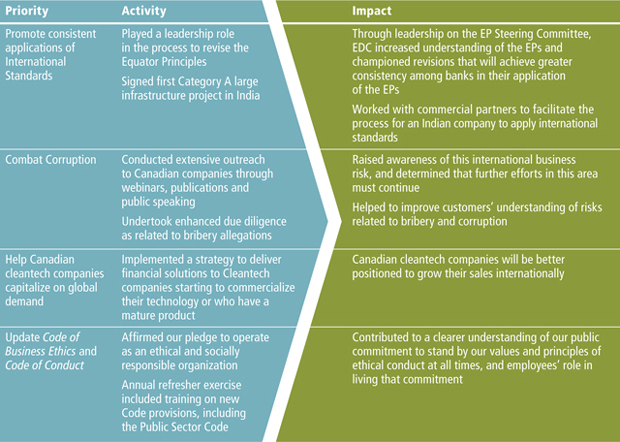
WORKING TO IMPROVE INTERNATIONAL STANDARDS
The Equator Principles (EP), adopted by over 70 financial institutions worldwide, serve as a framework for identifying, assessing, and managing environmental and social risks in Project Finance transactions. During our first year as a member of the Equator Principle’s Steering Committee, we convened consultations with industry clients and partnering financial institutions to discuss potential revisions to the EPs, particularly revisions that will achieve greater consistency in their application.
Final revisions to the EPs are expected in early 2013 and will guide how the financial industry looks at the environmental and social impacts of large infrastructure projects.
INFRASTRUCTURE IN INDIA
In 2012 we participated in our first large scale infrastructure project in India. We provided $100 million as part of a syndicated financing package for the Mahan Aluminium Project, an aluminum smelter in Madhya Pradesh.
Participating in this project gave us an opportunity to work with an Indian developer and help it apply international standards, and afforded us the opportunity to learn from some of the key CSR issues facing India today in the development of large infrastructure projects.
COMBATTING CORRUPTION
Business leaders today are faced with a complex trade environment, further complicated by the possibility of corrupt practices. Corruption impedes the free flow of goods and services within Canada and across borders, distorts international trade processes and inhibits economic growth. As such, corruption in business remained a key issue for EDC and its customers in 2012.
Throughout the year, we undertook an exercise to further clarify our own understanding of our risks and sharpen the procedures that help us manage these risks. We also updated our Code of Business Ethics as well as the employee Code of Conduct. The changes added clarity to our commitment to operate as an ethical and socially responsible organization, enhanced guidance to employees, and included new compliance processes. In addition, we formally confirmed the Values and Ethics Code for the Public Sector (which became applicable to all EDC employees in 2012) as integral to EDC’s Code of Conduct.
We also made efforts to raise awareness and educate our customers on the risk of corruption in international trade, including a webinar on Combatting Corruption in International Business. In 2012, numerous transactions reviewed for CSR risks resulted in enhanced anti-corruption due diligence, which afforded us the opportunity to explain to our customers where we felt they faced corruption risks and what they should put in place to protect themselves.
|
| 28 | Adapting to the New Reality |
| | |

BEYOND EXPORTS: EDC AND CARE CANADA Outside Canada, we have engaged in a partnership with CARE Canada to assist small, business development projects around the world through a joint global community investment initiative: Beyond Exports. In each year of this four-year program, we invest $170,000 and assign staff to various CARE enterprise development projects around the world. In 2012, we extended the program for one year. In 2009, our first two volunteers were assigned to Peru where they lent their expertise to several local agricultural businesses. Since then, we have sent additional volunteers to work with CARE Zambia and CARE India. To date, 15 volunteers have participated in this program. We also produce a Corporate Social Responsibility Annual Report which provides more comprehensive details on our CSR programs and initiatives. The 2012 CSR Report is slated for release online on May 31, 2013. Please see www.edc.ca/csr. | | 
|
|
EDC Annual Report 2012 | 29 |
INVESTOR RELATIONS
THE 2012 MARKET
2012 was a year where investors favoured risk-free investments. Ten-year yields declined from 2.38 per cent to 1.38 per cent over the course of the year. In this low yield environment, spreads relative to benchmarks, fell. With Canada’s sound fundamentals and positives relative to many developed markets, demand for EDC securities remained high.
Although European officials worked to resolve the sovereign debt crisis and derive a solution for the difficulties in Greece, uncertainty in the region continued to undermine confidence in global financial markets throughout 2012. The introduction of austerity measures caused additional stress in various countries and unemployment levels remained stubbornly high as the region went into recession.
However, the European Union, International Monetary Fund and European Central Bank did attempt to manage the support mechanisms for those countries most in need. As a result, the market reacted positively and the yields of many peripheral Eurozone borrowers retreated from all time highs.
Given the uncertainty, investors sought investments of the highest quality only. EDC’s strong AAA/Aaa credit rating and linkage to Canada provided investors with the type of product they require.
The five key areas of the funding program are as follows: USD benchmarks, issuance in G8 currencies, private placements, issuing bonds denominated in emerging market currencies and structured notes. Throughout 2012 we borrowed $8.8 billion.
USD BENCHMARKS
In June, EDC issued its first Global bond offering of the year, a USD 1 billion three-year transaction, which was significantly oversubscribed with a USD 1.8 billion order book. Fifty-two investors participated, with Central Banks making up the largest portion of the book, a testament to EDC’s investor relations strategy, exceptional credit quality and strong investor demand for exposure to Canadian credit.
“It is a rare issuer who can price at Treasuries plus 10 and still create an allocation problem. The result reflects the market’s continued high regard for the Canada story and is a testament to EDC’s execution prowess and their very consistent investor relations program. EDC had been monitoring for some time but they once again picked exactly the right time to come to market.”
RBC Capital Markets
|
| 30 | Adapting to the New Reality |
Zero per cent BIS risk weighted according to Basel II guidelines
In November, EDC issued a USD 1 billion Global benchmark in the five year tenor. The bond met with strong demand and the order book attracted more than USD 1.5 billion in orders from 53 accounts. The success of this transaction, as evidenced by the high quality of the order book and breadth of geographic distribution, highlighted the strength of EDC’s appeal among the global investor base.
G8 ISSUANCE
Offering debt securities denominated in G8 currencies allows EDC to diversify its investor base and enables our international accounts to further participate in our funding program. EDC has experienced balance sheet growth in non-USD and CAD; in recent years these assets have increased from 6 per cent to 15 per cent.
British Pounds (GBP) is the cornerstone of this strategy. EDC issued a GBP 400 million bond with a maturity of December 2014 that was reopened twice, each for GBP 100 million for a total outstanding amount of GBP 600 million. A second GBP 300 million bond was issued with a December 2015 maturity. EDC also placed a one-year floating rate note for GBP 100 million with a U.K. institutional investor.
EDC returned to the Kauri market by issuing into New Zealand a NZD 200 million five-year bond, which was subsequently reopened for another NZD 150 million. The bonds were acquired by investors in New Zealand as well as international investors.
Given demand for a Kangaroo bond, EDC came to the Australian market with a AUD 750 million five-year transaction, which was reopened for AUD 250 million to reach AUD 1 billion. The bonds were placed locally and internationally among banks and fund managers.
PRIVATE PLACEMENTS
Broadening our penetration into the U.S. market is a key objective of our investor relations strategy, and the amount of private placements increased this year. These transactions provided investors with borrower diversification and access to Canadian credit.
2013 OUTLOOK
The outlook for 2013 is mixed. Growth will be impeded in several regions, with Sovereign-supranational-agency issuance forecast to decline. That said, given the importance of the U.S. market, increasing our penetration into the USD investor base will remain a priority.
In 2013, our funding program is expected to be USD 6.5 billion. We will target benchmark transactions, medium-term notes and private placements with an emphasis on U.S. dollars, G8 currencies and bonds denominated in emerging market currencies in support of our customers.
In the current environment, investors want direct dialogue and more detailed information to assist with their investment decisions. As such, senior management will embark on a series of initiatives including one-on-one meetings, panel participation and targeted conferences throughout the year.
RISK AND RISK WEIGHTING
Our bonds are the full faith and credit obligations of the Government of Canada. The ratings reflect our status as an agent of her Majesty in right of Canada and EDC’s 100 per cent ownership by the government of Canada. We service our debt from our own resources and our borrowings are the Government of Canada’s full obligations, with access to the Consolidated Revenue fund (the government’s primary account) ensuring timeliness of payment.

|
EDC Annual Report 2012 | 31 |
2013 STRATEGIC OBJECTIVES
| | |
The following is an overview of the business strategy and performance measures of the 2013 – 2017 Corporate Plan. A summary of the Plan is available on www.edc.ca | | |
2013 SCORECARD AND KEY MEASURES
OF SUCCESS AND PLANNING
| * | In 2013 the definition of Business in Emerging Markets has been modified. It is now based on Accounting Revenue as reported in our Statement of Comprehensive Income and no longer on the business done by our customers. Revenue represents what companies are willing to pay for the services EDC provides and is therefore a better proxy of the value these services represent for them. The target was not available when the Corporate Plan was prepared but has subsequently been set as indicated. |
| ** | CDIA transactions have been restated from the Corporate Plan as certain transactions are no longer being counted under this measure. |
| *** | The target was not available when the Corporate Plan was prepared but has subsequently been set as indicated. |
|
| 32 | Adapting to the New Reality |
THE PLANNING ENVIRONMENT
While significant volatility is expected to shape the global economic environment in 2013, Canadian exporters have reason to be optimistic in the next few years. Three major forces continue to shape the planning horizon.
First, major parts of the global economy are still struggling in the aftermath of the 2008 financial crisis, which continues to temper short-term growth. Second, the new international financial regulatory framework is impacting banks and insurance companies’ ability to engage in trade finance activities. Third, emerging markets continue to grow, spurring the development of major infrastructure projects and driving strong demand for natural resources. The impact of this demand on commodity prices has contributed to a strong Canadian dollar, despite slower economic growth in Canada.
EDC’s export forecast for Canada shows strong growth in the near future, with exports predicted to rise between 6 and 8 per cent in 2013. However, closer examination reveals that Canada’s trade performance is uneven; exports in the extractive and resource sectors are on the rise, while other sectors such as information technology, light manufacturing and transportation are facing challenges.
THE BUSINESS STRATEGY
Our business strategy is designed create benefits for Canada. To achieve this goal, the 2013-2017 business strategy is built around two fundamental strategic objectives:
| | |
 | | Trade Facilitation – We will continue to adapt and improve our suite of financing and insurance solutions in response to the evolving needs of Canadian companies; and |
| | Trade Creation – Productivity gains achieved within the organization enable us to invest in innovative activities to create trade opportunities for Canadian companies that they would not otherwise be aware of or able to access on their own. |
Our business strategy is also guided by our partnership-preferred philosophy and commitment to Corporate Social Responsibility, and balances the four dimensions of our business: business development, operations, risk management and financial sustainability.
A PARTNERSHIP-PREFERRED APPROACH
Whenever possible, we use our financial capacity to complement the activities of private-sector financial institutions to ensure that customers can access financial solutions best suited to their needs. Generally the availability of private-sector capacity determines our level of involvement. For example, when credit is harder to access, we partner with the private sector to provide creditworthy companies with the capacity they need. Similarly, as the private sector returns and there is more access to credit, EDC is, by and large, less needed.
However, where there is a significant benefit for Canada but private-sector capacity is limited or unavailable, such as foreign buyer financing in challenging markets, transactions with longer tenors in specific sectors, and financial solutions for “breakthrough” companies such as those in cleantech or small businesses, we often provide financial intermediation to companies until the private sector returns. In these circumstances, we try to create conditions that favour subsequent private-sector involvement.
In 2013, we will continue to strengthen our relationship with the banking sector through the Lending Practitioners’ Forum, and participate in the Government-led Credit Insurance Advisory Group (CIAG), in order to maintain and grow our partnership with private-sector credit insurers. We will also continue to collaborate with other public-sector partners to create conditions that favour the emergence of private-sector capacity.
LEVERAGING TECHNOLOGY
Our information technology is a critical component to delivering timely financial and risk management solutions to our customers. To that end, we have undertaken a large, multi-year program to modernize our key business systems. In doing so, we will add more flexibility to our core transacting systems, improve web access to our services, and give employees better access to the information required to make timely decisions.

|
EDC Annual Report 2012 | 33 |
FOCUS ON SMALL BUSINESS EXPORTERS
Given their impact on Canada’s trade performance, our service offering to small business exporters is an important part of fulfilling our mandate. This segment, which we define as companies with under $10 million in annual sales, is our largest customer base. While the majority of these companies are served under our Accounts Receivables Insurance program, these exporters and their bankers also benefit from our bonding and guarantee solutions, and our pull financing transactions.
Looking ahead, we are making significant technological investments to broaden our service offering to more small businesses. We will continue to work closely with our partners in government so that Canadian companies can access more international trade expertise; including referrals to BDC through our protocol agreement, and collaboration with the Trade Commisisoner Service and Canadian Commercial Corporation (CCC).
THREE TRADE CREATING INITIATIVES
In 2012, we identified three trade creating initiatives that represent significant growth potential for Canada. These initiatives will remain as a focus for 2013. The first is aerospace. By providing buyer financing for the early years of Bombardier Inc.’s CSeries program, we have been helping Canadian suppliers along the aerospace industry supply chain, positioning them to serve not only the CSeries, but also other leading players in the industry. EDC has already made indicative financing commitments to buyers of CSeries aircraft. As the program matures and the aircraft’s acceptance grows, we will work to bring in additional capacity from the private sector.
Secondly, we will continue to look for transactions where we can facilitate trade for clean technology companies, specifically helping more Cleantech companies whose technologies are in the earlier stages, and therefore considered to be higher risk. Over the planning period, we will continue to deepen our understanding of the sector, and develop appropriate financial solutions to help Canadian Cleantech companies grow internationally.
Finally, we will continue to help Canadian exporters and investors access opportunities in India’s growing infrastructure sector by participating in financing projects which have the potential to source from Canadian companies and investors. We are currently exploring a range of options to strengthen our in-market presence and build ties to buyers that represent the greatest opportunity for Canadians doing business in India.
PRUDENT RISK MANAGEMENT AND FINANCIAL SUSTAINABILITY
We manage risks by ensuring that business activities and transactions provide an appropriate balance of return for the risks assumed. Our risk appetite is managed by our Enterprise Risk Management (ERM) Framework. In 2012, we created an integrated Enterprise Risk Management group under executive leadership to elevate the importance of mitigating the various risks to which we are exposed. In 2013, we will take steps to strengthen our ERM framework, particularly with respect to risks that arise from people, systems and processes.
Our commitment to financial sustainability enables us to respond to the demands of our customers today without compromising our ability to serve in the long term. Over the planning period, we have committed to spend no more than approximately 25 cents of every dollar earned on overhead costs. To do so, we need to achieve productivity savings every year by focusing on efficiency.
MEASURING SUCCESS
We track our performance against our strategic objectives presented in the Business Strategy through our Corporate Scorecard, and the following measures.
CUSTOMER-RELATED MEASURES
NET PROMOTER SCORE
The Net Promoter Score (NPS) is the measure against which we evaluate our success in customer satisfaction and loyalty. NPS measures our reputation and the likelihood that customers would recommend EDC to business colleagues.
|
| 34 | Adapting to the New Reality |
BUSINESS MEASURES
TOTAL BUSINESS FACILITATED
This measure provides an order of magnitude of the business Canadian companies carry out with the help of EDC’s solutions. It is subject to variation from a range of external factors, such as exchange rates and commodity prices.
CANADIAN DIRECT INVESTMENT ABROAD (CDIA) TRANSACTIONS
Investments in foreign markets by Canadian companies are an important source of benefits to Canada. Facilitating CDIA transactions has been incorporated into our Business Strategy over the past several years and has now become an integral part of our core business. We will continue to actively focus on and promote CDIA activities to encourage Canadian companies to diversify their exports.
PARTNERSHIP TRANSACTIONS
Our ability to serve Canadian companies is enhanced by partnering with both public- and private-sector players. In 2012, we expanded our definition of partnership transactions to include signed transactions resulting from referrals from EDC to BDC and from BDC to EDC, thereby underscoring the importance of the partnership with our sister Crown.
VALUE FOR MONEY (VfM) TO TOTAL COST OF OWNERSHIP (TCO)
While every organization must determine an optimal level of technology investment based on their corporate needs, the preference is to devote more resources to delivering on VfM objectives, while managing TCO. EDC is undergoing significant business and technology changes over the next few years that will result in better service for our customers, as well as improved internal productivity and efficiency. This will ultimately result in an improved VfM to TCO ratio.
PRODUCTIVITY RATIO (PR)
Our Productivity Ratio, the ratio of administrative expenses to net revenue, indicates how well we use our resources. We strive to keep the ratio between 24 and 26 per cent.
EMPLOYEE MEASURES
LEVERAGING PEOPLE
We aim to attract and retain a highly qualified workforce in order to implement our business strategy today and in the years to come. How well this is accomplished is measured by employee feedback on their engagement with EDC and by an employee retention rate.
NEW MEASURES FOR 2013
In 2013, our scorecard will introduce changes to reflect our renewed focus on better serving small business exporters and will refine how we measure performance against our fundamental objective of helping Canada succeed in trade.
First, to ensure our focus on small business exporters remains a priority in 2013, we are introducing a “Small Business Transactions” measure which will track all transactions related to small business exporters, closed over the course of the year.
Secondly, we will be introducing revenue as the measurement of our activity in emerging markets. By shifting our focus towards revenue instead of volume, we can get a more complete picture of the value we are delivering to Canadian companies in emerging markets. Revenue represents what companies are willing to pay for the services we provide and is a good proxy of the value these services represent for them. Although the calculation will change, this measure will continue to be called “Business in Emerging Markets.”

|
EDC Annual Report 2012 | 35 |
BOARD OF DIRECTORS
NORMAN M. BETTS
FREDERICTON, NEW BRUNSWICK
First appointed to EDC’s Board of Directors in 2007, Dr. Betts was reappointed for a second term in February 2010. Dr. Betts has an extensive record of public service. As the MLA for Southwest Miramichi, he served the people of New Brunswick as Minister of Finance from 1999 to 2001 and Minister of Business New Brunswick from 2001 to 2003. Dr. Betts is currently an associate professor with the Faculty of Business Administration at the University of New Brunswick and sits on several other Boards of Directors including New Brunswick Power Holdings and Tembec Inc. He holds a PhD in Management from Queen’s School of Business and is a chartered accountant.
JACQUES BOIVIN
QUEBEC CITY, QUEBEC
Mr. Boivin was appointed to EDC’s Board of Directors in March 2009. A lawyer with Levis, Quebec’s ksa, avocats, S.E.N.C.R.L., Mr. Boivin specializes in mergers and acquisitions, sales and financing, as well as bankruptcy and insolvency. He has also served as an instructor at the École du Barreau du Québec. Mr. Boivin is a member of the Barreau du Québec, the Canadian Bar Association and INSOL International. In addition to his law practice, Mr. Boivin is active in his community and serves on boards of organizations that support education and health services.
JEFF BURGHARDT
PRINCE RUPERT, BRITISH COLUMBIA
Mr. Burghardt was appointed to EDC’s Board of Directors in June 2008. He has worked in the agricultural industry for more than 25 years, including 10 years as President and Chief Executive Officer of Prince Rupert Grain Ltd. and as Chair of the Northwest Corridor Development Corporation. A leading advocate for his region, Mr. Burghardt has served as an industry advisor to both federal and provincial governments on issues surrounding transportation, economic development and investment.
ADAM CHOWANIEC
OTTAWA, ONTARIO
Dr. Chowaniec was appointed to EDC’s Board of Directors in April 2008. Currently Chairman of the Board of Directors of Zarlink Semiconductor Inc., he has held executive positions at Acadia University, Bell Northern Research, Nortel Networks, Commodore International and Calmos Systems. After serving as both president and vice-president of Newbridge Networks, Dr. Chowaniec was the founding CEO of Tundra Semiconductor Corporation in 1995. From 2006 to 2008, he was Chair of the Ontario Premier’s Research and Innovation Council. He has been widely recognized for his leadership, business excellence and innovation, and was named Business Person of the Year by the Ottawa Chamber of Commerce in 1999.
HERBERT M. CLARKE
ST. JOHN’S, NEWFOUNDLAND
Mr. Clarke was appointed to EDC’s Board of Directors in 2009 and was reappointed for a second term in October 2012. He has substantial private- and public-sector experience in areas of public policy and industry-government relationships, particularly as it relates to natural resource development and environmental assessment. Mr. Clarke is president of HMC Associates Ltd., a private consulting and investment firm. Previously, he served as Newfoundland and Labrador’s Clerk of the Executive Council and Secretary to Cabinet, and in senior executive roles in the mining and fishing industries. Mr. Clarke has been a board member of the Canada-Newfoundland Offshore Petroleum Board, founding Chairman of the Fisheries Resource Conservation Council, Public Review Commissioner for a major offshore oil and gas project and Co-Chair of the Joint Review Panel for the Lower Churchill Hydroelectric Generation Project.
JIM DINNING
CHAIR, CALGARY, ALBERTA
Mr. Dinning became Chair of EDC in 2007. He is Chair of Western Financial Group and has extensive experience in the private sector as a senior executive and as chair and director of a number of multinational and export-oriented Canadian companies. Mr. Dinning served in senior public-sector leadership roles during his 11-year tenure as a member of the Alberta legislative assembly including Minister of Education and Provincial Treasurer. He also serves as Chancellor of the University of Calgary.
LINDA M. O. HOHOL
CALGARY, ALBERTA
Ms. Hohol was appointed to EDC’s Board of Directors in 2007. With significant experience in the financial sector and expertise in venture capital financing and wealth management, Ms. Hohol was President of the TSX Venture Exchange from 2002 to 2007, after a long career with CIBC, which included a position as Executive Vice-President of Wealth Management. She is a Director of several non-profit and private sector corporations, including ATB Financial, EllisDon Construction and United Way of Calgary, and has been recognized as one of the 100 Most Powerful Women in Canada.
|
| 36 | Adapting to the New Reality |
ELLIOT LIFSON
MONTREAL, QUEBEC
Elliot Lifson was appointed to EDC’s Board of Directors in March 2012. Mr. Lifson is President of the Canadian Apparel Federation and Vice-Chairman of Peerless Clothing Inc., and serves as a Director for several associations and councils. Mr. Lifson is Past Chairman of the Board of the Montreal Board of Trade and currently serves in an advisory capacity. Mr. Lifson is a Professor at the Desautels Faculty of Management at McGill University and was recently nominated to the Quebec Government’s Export Québec. He is a graduate in Law from the Université de Montréal, a member of the Quebec Bar and received his MBA from the Ivey School of Business, University of Western Ontario.
DONALD A. MACLEOD
DARTMOUTH, NOVA SCOTIA
Mr. MacLeod was appointed to EDC’s Board of Directors in 2008. Currently serving as vice-president and senior counsel for J. Ray McDermott Canada, Ltd. (Secunda Marine Services), Mr. MacLeod has held senior management positions within the organization since 1989. He has extensive involvement in commercial transactions in Canada and internationally within the shipping and offshore oil and gas sector. Mr. MacLeod is chair of the Shipowners’ Mutual Protection and Indemnity Association (Luxembourg), and holds positions on several of its affiliates and management committees. He is a member of the Nova Scotia Barristers’ Society.
STEPHEN S. POLOZ, CITP
PRESIDENT AND CHIEF EXECUTIVE OFFICER, OTTAWA, ONTARIO
Stephen Poloz was appointed President and Chief Executive Officer in January 2011, after nearly 30 years of public- and private-sector experience in financial markets, forecasting and economic policy. He joined EDC in 1999 as vice-president and chief economist, and in 2004 was promoted to senior vice-president, corporate affairs and chief economist, adding responsibility for corporate planning, communications, government and international relations, engineering, corporate social responsibility and corporate research. From 2008 to 2010 he was senior vice-president, financing, with responsibility for all of EDC’s lending programs, in addition to the economics and corporate and international trade intelligence groups. Prior to joining EDC, Mr. Poloz spent five years with Montreal-based BCA Research, and 14 years with the Bank of Canada in Ottawa. He has been a visiting scholar at the International Monetary Fund in Washington, and at the Economic Planning Agency in Tokyo. He has also served as president of the Ottawa Economics Association.
JOHN R. ROONEY
CALGARY, ALBERTA
Mr. Rooney was first appointed to EDC’s Board of Directors in 2007 and was reappointed in January 2010. A Calgary-based entrepreneurial executive with technical background in finance, he currently serves as Chairman and CEO of Northern Blizzard Resources Inc. Mr. Rooney is a Chartered Accountant and Chartered Business Valuator with more than 20 years of experience primarily in the oil and gas industry. He also serves as a director of several public and private companies and not-for-profit organizations.
JEFFREY STEINER
TORONTO, ONTARIO
Mr. Steiner was appointed to EDC’s Board of Directors in December 2010. Before establishing New Franchise Media in 2010, Mr. Steiner served approximately seven years as president and chief executive officer of the Toronto Economic Development Corporation (TEDCO), and three years as a board member of the Alcohol and Gaming Commission of Ontario. Mr. Steiner currently serves as Chair of the Governance Committee on the Board of Directors of the Ontario Centres of Excellence Inc., which oversees government investment in the commercialization of university R&D through industry-academic collaboration and venture capital finance. He is an active member of the Young Presidents’ Organization (YPO) Toronto Chapter and the Institute of Corporate Directors with an ICD.D designation.
DARLENE THIBAULT
LAVAL, QUEBEC
Ms. Thibault was appointed to EDC’s Board of Directors in January, 2010. A Director at the Bank of Nova Scotia since 2005, Ms. Thibault is responsible for Credit Lease Scotia and the Immigrant Investor Program in the Quebec region. Her 20-year career in the financial industry has included positions at HSBC Bank, the Bank of Montreal, Bombardier Capital Ltd., AT&T Capital Canada Inc. and Pitney Bowes Leasing.

|
EDC Annual Report 2012 | 37 |
EXECUTIVE MANAGEMENT TEAM

Left to right: (Top row) Jim McArdle, Ken Kember (Middle row) Clive Witter, Pierre Gignac, Derek Layne, Rajesh Sharma (Bottom row) Benoit Daignault, Stehen S. Poloz, Susanne Laperle
STEPHEN S. POLOZ
PRESIDENT AND CHIEF EXECUTIVE OFFICER
Stephen Poloz was appointed President and Chief Executive Officer in January 2011, after nearly 30 years of public- and private-sector experience in financial markets, forecasting and economic policy. He joined EDC in 1999 as Vice-President and Chief Economist. From 2008 to 2010 he was Senior Vice-President, Financing, with responsibility for all of EDC’s lending programs, in addition to the Economics and Corporate and International Trade Intelligence groups. Prior to joining EDC, Mr. Poloz spent five years with Montreal-based BCA Research, and 14 years with the Bank of Canada in Ottawa. He has been a visiting scholar at the International Monetary Fund in Washington, and at the Economic Planning Agency in Tokyo. He has also served as President of the Ottawa Economics Association. Mr. Poloz is a Certified International Trade Professional.
BENOIT DAIGNAULT
SENIOR VICE-PRESIDENT, FINANCING AND INVESTMENTS
Benoit Daignault was appointed as Senior Vice-President and Global Head, Financing and Investments in January 2012, after serving as Senior Vice-President, Business Development since he joined EDC in 2004. Mr. Daignault leads EDC’s global investments and debt financing operations across all product lines, including project and structured finance, commercial lending as well as corporate and asset-back lending. Previously, Mr. Daignault spent more than 10 years with General Electric Capital, where he held increasingly senior positions in Canada and the U.S. Mr. Daignault has a Baccalaureat in Business Administration from l’École des Hautes Études Commerciales in Montreal and is a CFA Charterholder. He completed the Proteus program of London Business School and the Senior Executive Program of Columbia University.
|
| 38 | Adapting to the New Reality |
PIERRE GIGNAC
SENIOR VICE-PRESIDENT AND CHIEF RISK OFFICER, ENTERPRISE RISK MANAGEMENT
Pierre Gignac was appointed as Senior Vice-President, Enterprise Risk Management in January 2012, after serving as Senior Vice-President, Insurance since January 2004. He is responsible for Risk Management, Legal Services, and Security Services. Mr. Gignac joined EDC in April 1999 as Director, Claims and Insurance Accounting and later moved to Vice-President, Insurance and Loans Services and then Vice-President, Short-term Credit and Risk Assessment. Prior to joining EDC, Mr. Gignac held senior posts during his 14-year career at Metropolitan Life Insurance Company. Mr. Gignac is a Fellow of the Society of Actuaries, Fellow of the Canadian Institute of Actuaries, and a Chartered Financial Analyst. He is a graduate of Columbia University’s Senior Executive Program and from Laval University in Quebec City.
KEN KEMBER
SENIOR VICE-PRESIDENT, FINANCE, AND CHIEF FINANCIAL OFFICER
Ken Kember was appointed Senior Vice-President, Finance, and Chief Financial Officer in 2009. Mr. Kember leads the Finance organization, which includes Treasury, Corporate Finance & Control, Loans Services and Corporate Services. Mr. Kember has held various positions of increasing responsibility in the Finance Group, and served as Vice-President and Corporate Controller for five years before taking on his current role. Prior to joining EDC in 1995, he was a senior manager in the Accounting and Audit Group of PricewaterhouseCoopers in Ottawa. Mr. Kember holds a B.A. and a Master of Accounting degree from the University of Waterloo, and is a Chartered Accountant and Certified Management Accountant. He also serves on the board of the National Capital Region Chapter of Financial Executives International. Mr. Kember is a graduate of Columbia University’s Senior Executive Program.
SUSANNE LAPERLE
SENIOR VICE-PRESIDENT, HUMAN RESOURCES AND COMMUNICATIONS
Susanne Laperle was appointed Senior Vice-President, Human Resources in February 2001. Ms. Laperle is responsible for EDC’s Human Resources and Communications Group. She has extensive experience in human resources leadership, strategy and service from a number of challenging corporate environments. Prior to joining EDC, Ms. Laperle was a Vice-President of Human Resources and Communications for several major Canadian retail companies, facilitating change across large organizations. Ms. Laperle was also a senior consultant with the John C. Williams Group in Toronto, where she specialized in human resources and communications to both service industry and public-sector clients. Ms. Laperle has an MBA from the University of Toronto.
DEREK LAYNE
SENIOR VICE-PRESIDENT, BUSINESS SOLUTIONS AND INNOVATION
Derek Layne was appointed Senior Vice-President of the newly created Business Solutions and Innovation Group in December 2011. In this capacity Mr. Layne is responsible for managing the technology platforms, information systems, as well as the centres of expertise for business intelligence, process and program support that enable EDC’s operations. Mr. Layne previously held various management positions within EDC’s lending practice including Chief Risk Officer, before assuming his current role. Prior to joining EDC in 1992, Mr. Layne worked for an engineering firm.
JIM MCARDLE
SENIOR VICE-PRESIDENT, CORPORATE AFFAIRS & SECRETARY
Jim McArdle was appointed as Senior Vice-President, Corporate Affairs & Secretary in January 2012, after serving as Senior Vice-President, Legal Services and Secretary since 2006. Mr. McArdle is responsible for Planning and External Relations, Corporate Social Responsibility, Economics, Enterprise Portfolio Management and is Secretary to the Board. Mr. McArdle joined EDC as a Legal Counsel in 1993 and became Senior Legal Counsel in 1994. He was appointed General Counsel and Senior Assistant Secretary in July 2002. Prior to joining EDC, he was a member of a national Toronto law firm for 10 years, and is a graduate of Columbia University’s Senior Executive Program.
RAJESH SHARMA
SENIOR VICE-PRESIDENT, BUSINESS DEVELOPMENT
Rajesh Sharma was appointed as Senior Vice-President, Business Development in January 2012, after serving as Senior Vice-President, Financing Products Group since 2011. Mr. Sharma leads the business strategy of the corporation through sector teams specialized in the major global supply chains. He is also responsible for the network of EDC’s offices and representations in Canada and overseas. Since joining EDC in 1995, Mr. Sharma has overseen various product lines including its Project and Structured Finance, Corporate Lending and Political Risk Insurance operations. Prior to joining EDC, Mr. Sharma spent four years with Ontario Hydro. Mr. Sharma has an MBA from the University of Windsor, and an MPhil. in Economics and MA Honours in Economics from Panjab University in India.
CLIVE WITTER
SENIOR VICE-PRESIDENT, INSURANCE
Clive Witter was appointed as Senior Vice-President, Insurance in May 2012. Mr. Witter has 30 years experience in finance and insurance, most of it in senior leadership positions. Originally from the United Kingdom, Mr. Witter has also worked in Canada, Ireland, Belgium, and Hong Kong. Prior to joining EDC, he worked for PWC and then AVIVA Composite Insurance Group, one of the world’s largest insurance companies. His most recent position was as Chief Operating Officer, Continental Europe for Willis International, General Insurance Brokers, based in London. A Chartered Accountant, Mr. Witter is also a graduate of University College of Swansea, Wales.
|
EDC Annual Report 2012 | 39 |
CORPORATE GOVERNANCE
BOARD STEWARDSHIP
The stewardship of EDC resides with its Board of Directors composed of members experienced in business, finance, investment and risk management. In 2012 the board worked with the CEO to endorse his vision for the Corporation.
Each year, the board considers, advises on and ultimately approves EDC’s corporate plan. In 2012 the board discussed several long term elements of the plan at its annual strategy session: the needs of small business and how EDC can play an enhanced role, development of natural resources in Canada’s north and the implications of growing south-south trade. EDC’s board and executive team ensure that the corporate plan is developed within the spirit and intent of the Government of Canada’s Deficit Reduction Action Plan and the Minister of International Trade’s Statement of Accountabilities and Priorities for EDC.
The board continued to focus on EDC’s evolving risk management programs, in particular enterprise risk management (ERM). Board members participated in the annual risk identification and evaluation survey. The Risk Management Committee reported regularly on the status of transactions that have challenging or unique aspects. The board assessed and offered expertise on the design of EDC’s ERM system, including changes to the risk management reporting structure. The board reviewed an ERM “health check” conducted by external consultants to look for strengths and gaps, and reviewed a design and implementation roadmap for ERM program enhancements.
The Business Development Committee received regular reports on EDC’s progress on key corporate plan initiatives, and on activities and opportunities in Canada’s regions. The Committee assessed EDC’s market coverage on the basis of industry sectors and market segments, and resulting gaps in market coverage. This was done to identify future initiatives that could fill these gaps, and determine key priorities for 2012 and beyond.
Among its other activities, the Audit Committee reviewed and endorsed the annual audit plans of the Auditor General and the internal auditor. The Audit Committee received reports on internal audit projects and reviewed annual and quarterly financial statements. The Auditor General issued an unqualified opinion on the 2011 financial statements.
In 2012, the board created an ad hoc sub-committee on Technology to provide oversight and guidance for EDC’s technology investments.
PUBLIC POLICY OBJECTIVES AND
LEGISLATED MANDATE
The mandate and powers of EDC are established by statute, including EDC’s temporary authority to offer services to Canadian companies at home through a domestic mandate. This authorization was extended to March 12, 2013. The board monitored EDC’s work with banks and other financial services companies to provide increased capacity in support of Canadian companies’ domestic business. The board considered EDC’s presence in foreign markets and examined ways for EDC to establish foreign offices to support Canadian exporters.
CORPORATE SOCIAL RESPONSIBILITY
AND CULTURE OF ETHICAL CONDUCT
EDC’s corporate social responsibility (CSR) activities are an important part of enhancing Canada’s trade performance. The board was engaged on CSR issues throughout the year, including discussions on anti-corruption issues and guidelines on defense and security-sector exports. Representatives of Talisman Energy addressed the board on that company’s CSR activities in emerging markets.
The board itself promotes a culture of ethical business conduct, following board procedures that regulate conflict of interest and insider trading, in addition to those requirements of EDC’s Code of Conduct that apply to directors. EDC directors file standing declarations of interest and refrain from discussions or voting where a real or potential conflict of interest exists. Board documents are screened to flag companies listed in directors’ standing declarations so that transaction documents are withheld from a director who has declared an interest in a party related to that transaction.
In 2012, the board approved updates to EDC’s Code of Business Ethics and Code of Conduct. The Code of Business Ethics describes the high-level commitments for the corporation, while the Code of Conduct sets out the responsibilities of employees and directors. Amendments to the Code of Conduct addressed discretionary categories or enhanced existing rules, and expanded the provisions for acceptance or approval of gifts and hospitality, adding monetary thresholds and new recording and reporting requirements to further avoid conflicts of interest. The board formally included the Values and Ethics Code for the Public Sector, which came into force in 2012, as part of EDC’s Code of Conduct.
| | |
| 40 | Adapting to the New Reality | | |
Each year, all employees confirm their understanding and compliance with EDC’s Code of Conduct, and now with the Public Sector Code. Board members confirm their understanding and compliance with those parts of the EDC Code of Conduct that apply to them, and with the board-specific conflicts of interest and insider trading procedures.
ACCOUNTABILITY AND OPERATIONS
EDC’s board functions independently of management. At each board and committee meeting, time is reserved for directors to meet in camera with the CEO only and then without management present. The Audit Committee meets in camera in three sessions: with the federal Auditor General’s representatives, another with EDC’s internal audit vice-president, and a third with only independent directors present. In 2012, the Risk Management Committee began holding regular in camera sessions with the Chief Risk Officer.
The roles of EDC’s Chair and CEO are separate. All board members, other than the CEO, are independent of EDC management. To promote transparency, directors receive agendas and materials for, and are welcome to attend, committees of which they are not members.
The board has an effective working relationship with EDC’s management, and the allocation of responsibilities is reviewed regularly. The EDC by-law regulates the proceedings of the board, and establishes the matters for which the board has reserved authority. The Board Charter elaborates on roles and responsibilities, primarily in terms of board stewardship, and provides additional detail on board proceedings. EDC’s approach to governance continues to be shaped by active board engagement. The results of the board’s annual governance review are assessed by the full board. The 2012 results and related discussions provide the basis for governance activities going forward.
COMMUNICATION WITH STAKEHOLDERS
Effective communication between EDC and its stakeholders, including the Crown and the public, was monitored and facilitated by the board throughout 2012. The board was kept informed of ongoing outreach activities that help EDC obtain stakeholder input and feedback, including the meeting of the EDC Industry Stakeholder Panel and the Corporate Social Responsibility Advisory Group. At formal and informal board events, experts from various fields were invited to provide their insights. These guests included Jean-René Halde, President & CEO, BDC, the Honourable Perrin Beatty, President & CEO, Canadian
Chamber of Commerce. Jayson Myers, President and CEO of Canadian Manufacturers and Exporters Association and Robin Silvester, President and CEO, Port Metro Vancouver. Board members met directly with Canadian exporters at two receptions. With board encouragement, EDC continued to place a high priority on coordinating and partnering with its portfolio partners, including the Trade Commissioner Service (TCS), Canadian financial institutions, Canadian Commercial Corporation (CCC) and the Business Development Bank of Canada (BDC).
SENIOR MANAGEMENT EVALUATION AND SUCCESSION
The board’s process for assessing and evaluating the performance of the CEO continued in 2012. The CEO’s annual performance objectives are set by the Human Resources Committee and are directly related to EDC achieving objectives set out in the corporate plan. The Human Resources Committee reviews the CEO’s performance based on these objectives, and makes recommendations to the board.
The board oversees senior management succession. The board reviewed the succession plan developed by management and approved by the Human Resources Committee. The board approved one executive appointment.
BOARD EDUCATION AND EVALUATION
Upon joining the board, new directors receive an orientation through briefings by senior management and through less structured gatherings with seasoned board members. Board and committee meetings regularly include education on EDC product lines and other aspects of the corporation’s business.
COMMITTEE MANDATES
The Audit Committee ensures the board fulfills its mandate in financial matters, as well as in business ethics, declaration of dividends, internal and external auditor terms of engagement, and monitoring the corporate compliance program. It approves and monitors important capital and administrative expenditures, reviews the implications of new accounting policies, and reviews internal and external audit results. The Audit Committee approves quarterly financial statements for public release. All Audit Committee members are independent of EDC management and committee members include financial experts. The committee, chaired by John Rooney, held 6 meetings.
|
EDC Annual Report 2012 | 41 |
The Business Development Committee provides direction that strengthens EDC’s ability to meet the ongoing needs of Canadian exporters and investors. The committee monitors the development of the corporate plan, oversees management activities in analyzing market conditions and developing responses, and monitors corporate performance against business development plans and related frameworks. The committee reviews sector strategies and new product initiatives, and annually reviews the impact on Canada’s economy of business that EDC facilitates. The committee, chaired by Norman Betts, held 6 meetings.
The Executive Committee has the authority to exercise many board powers, and meets only if necessary to deal with urgent matters that arise between board meetings. A meeting of the Executive Committee was not required in 2012. Jim Dinning, as Chair of the Board, chairs the committee.
The Human Resources Committee supports the board’s oversight of human resources strategic planning and annually approves the management succession plan, employee and executive compensation and the measures and targets for the corporate incentive program. It sets objectives and advises the board on the assessment of the CEO’s performance and oversees the design, investment strategy and performance of pension plans for employees. The committee, chaired by Linda Hohol, held 6 meetings.
The Nominating and Corporate Governance Committee deals with matters relating to EDC’s corporate governance regime. It has input into the ethics program for directors, selection criteria for appointments of the CEO and the chair, profiles of the desirable skills and experience required of directors, consideration of board candidates, and orientation and education programs. It oversees the board governance survey, monitors relations with management, and reviews the membership and mandates of committees. In 2012 several important governance matters were elevated for discussion or decision to the full board. The committee, chaired by Jim Dinning, held 1 meeting.
The Risk Management Committee supports the board’s oversight of the prudent management of EDC’s capital structure, including the management of credit, market and other enterprise risks. The Committee oversees and recommends updates to the internal policy framework governing authorization of EDC’s business activities, and oversees the authorizations which EDC requires in order to undertake specific transactions. It reviews and recommends transactions requiring board approval, monitors compliance with the Environmental Review Directive, and reviews the calculations underlying dividend decisions. It receives updates on portfolio management activities. The committee, chaired by Adam Chowaniec, held 6 meetings.
DIRECTOR REMUNERATION
Compensation paid to directors is set by Order in Council. The chair and other independent directors receive an annual retainer for their services, plus a fixed per diem for travel time, attending committee and board meetings. The following compensation schedule has been in place since 2000:
| Chair of the Board: annual retainer of $12,400; $485 per diem. |
| Other directors: annual retainer of $6,200; $485 per diem. |
| Chairs of committees (other than Executive Committee) and Vice-Chair of the Board: base retainer plus $2,000. |
Directors are reimbursed for their reasonable out-of-pocket expenses while performing their duties, including travel, accommodations and meals,. Most members of the board serve on three committees. There were 9 board meetings in 2012, (6 regular, 1 strategic session and 2 conference calls) and 25 committee meetings. Meetings convened between regularly scheduled board sessions are usually held by teleconference. The total remuneration paid to independent directors including the Chair (annual retainers plus per diems) was $221,954, compared to $199,433 in 2011. The total for business travel, promotion and meeting expenses paid to members of the board plus meeting expenses for the board and committees was $172,965 compared to $191,416 in 2011 (both figures exclusive of the expenses of the CEO). The total for the CEO’s business travel and hospitality expenses in 2012 was $107,813 compared to $98,113, in 2011.
42 | Adapting to the New Reality
| | |
| | MEMBERSHIP AND ATTENDANCE AT MEETINGS OF THE BOARD AND BOARD COMMITTEES1 IN 2012 |
(1) Attendance is provided only for meetings of committees of which the director was a member on the meeting date.
|
EDC Annual Report 2012 | 43 |

2012 FINANCIAL REVIEW
MANAGEMENT’S
DISCUSSION AND ANALYSIS
Management’s Discussion and Analysis (MD&A) should be read in conjunction with our audited consolidated financial statements and related notes for the year ended December 31, 2012. All amounts are expressed in Canadian dollars.
45 FINANCIAL RESULTS OVERVIEW
63 RISK MANAGEMENT
46 Impact of Foreign Exchange Translation
64 Risk Management Overview on Financial Results
64 Portfolio Risk Profile
46 FINANCIAL PERFORMANCE
65 Risk Governance Structure
46 Net Financing and Investment Income
66 Credit Risk Management
48 Insurance Premiums and Guarantee Fees
68 Market Risk Management
49 Other Income (Expenses)
69 Liquidity Risk Management
49 Provision for (Reversal of) Credit Losses
71 Operational Risk Management
50 Claims-Related Expenses (Recovery)
72 CRITICAL ACCOUNTING POLICIES
50 Administrative Expenses
AND ESTIMATES
72 Change in Accounting Standards
51 FINANCIAL CONDITION
72 Non-IFRS Performance Measures
51 Statement of Financial Position Summary
51 Corporate Plan Discussion
73 SUPPLEMENTAL INFORMATION
53 Portfolio Exposures and Credit Quality
53 Concentration of Exposure
53 Financing Portfolio
57 Insurance Portfolio
60 Marketable Securities and
Derivative Instruments
61 Capital Management
62 Off Balance Sheet Arrangements
62 Financial Instruments
CAUTION REGARDING FORWARD-LOOKING STATEMENTS
This document contains projections and other forward-looking statements regarding future events. Such statements require us to make assumptions and are subject to inherent risks and uncertainties. These may cause actual results to differ materially from expectations expressed in the forward-looking statements.
44 | Adapting to the New Reality
FINANCIAL RESULTS OVERVIEW
Despite signs of improvement, the world economic situation and prospects continued to be challenging in 2012. The pattern was similar to 2011, with momentum early on, a softening in the summer months, but giving way to a late-year upturn spilling into the following year. Economies within Europe contracted due to investor flight, high unemployment and a tight credit environment. On the other hand, a look at the U.S. economy revealed many economic indicators returning to 2008 peak levels, although businesses remained deterred by prospects surrounding the looming fiscal cliff. In addition, slower economic growth in emerging markets was associated with lower prices for some commodities.
For Canada, these world conditions have resulted in a mixed picture: lower commodity prices and contraction in European economies have led to reduced exports. However, this has been offset by growth in the economy of our largest trading partner, the U.S Overall, Canada experienced minimal export growth in 2012. At the same time, we have seen some improvement in domestic market conditions with Canadian companies taking on greater risk capacity.
For EDC and our customers, these trends, along with some EDC-specific factors, have resulted in a decline in our insurance business in 2012. Lower commodity prices have led to a lower volume of exports to be insured, and greater risk capacity in the commercial market has reduced demand for EDC’s insurance solutions. In addition, greater private sector capacity in the surety industry has meant less need for EDC’s bonding products. EDC-specific factors include a shift in insured business activity for one large customer and a change in product offering within our financial institutions insurance program.
Our financing business came in at the same level as 2011. We signed several large investment grade loans, mainly project finance transactions with foreign borrowers. The retrenchment of European lenders led to more opportunities for EDC to participate in these transactions, allowing us to generate additional opportunities for Canadian companies.
EDC’s appetite to take on risk was evidenced in 2012 by significant loan write-offs as well as the highest level of claim payments in EDC’s history. We crystallized losses in our commercial loan book that were largely incurred during the credit crisis and as a result of difficulties experienced in recent years in the aerospace sector. There was minimal impact on our net income in 2012 since in most cases these loan losses had been reflected in our provision for credit losses in prior years. We also crystallized losses on our sovereign loan book with the write-off of loans to two heavily indebted poor countries in Africa for which debt forgiveness has been granted. Although we experienced a shift in our financing business facilitated to more investment grade loans, we continue to facilitate a large number of higher risk lower dollar value loan transactions. Based on number of transactions, more than 80% of new signings in 2012 were below investment grade loans.
Our political risk insurance program is characterized by high limits, and can be compared to catastrophic insurance coverage offered by other insurers for events such as natural disasters. While claims within this program have occurred infrequently, when made, they can be very significant as was the case in 2012 with a $300 million claim charge as a result of the turmoil in North Africa and the Middle East. This charge did not increase our claims-related expenses in 2012 as a liability was recognized in 2011 and included in claims-related expenses at that time.
EDC’s ability to continue to deploy its lending and insurance solutions to Canadian businesses is dependent on the corporation’s financial sustainability. This involves earning a return sufficient to cover our expenses as well as build capital to facilitate more business. Under normal operating conditions we expect to earn net income in the range of $600 million to $800 million and a return on capital of 6-8% annually. Fluctuations in the provision for credit losses, claims-related expenses and the fair value of financial instruments could cause net income to fall outside this range.
Overall, our 2012 financial results were virtually a repeat of 2011 when we exclude the impact of changes in both our provision for credit losses and claims-related expenses. After taking into account these two items we finished the year with net income of $1,321 million, an increase of $676 million over 2011, and a higher level of profitability than we would normally expect.
| | | | | | | | |
for the year ended December 31 (in millions of Canadian dollars) | | 2012 | | | 2011 | |
Net financing and investment income | | | 1,039 | | | | 974 | |
Loan guarantee fees | | | 38 | | | | 32 | |
Net insurance premiums and guarantee fees | | | 196 | | | | 234 | |
| | | | 1,273 | | | | 1,240 | |
Other income (expenses) | | | (16 | ) | | | 61 | |
Administrative expenses | | | 314 | | | | 284 | |
Provision for (reversal of) credit losses | | | (340 | ) | | | 125 | |
Claims-related expenses (recovery) | | | (38 | ) | | | 247 | |
Net income | | | $1,321 | | | | $645 | |

|
EDC Annual Report 2012 | 45 |
MANAGEMENT’S DISCUSSION AND ANALYSIS
We recorded provisions of $125 million and claims-related expenses of $247 million in 2011 as a result of negative credit migration in our loans portfolio, a decline in collateral values for loans in our secured aerospace portfolio and a claim submission in our political risk program. In comparison, we recorded reversals of provisions for credit losses of $340 million in 2012 mainly because we updated the assumptions used in the allowance calculation for probability of default and the amount of loss given a default event. Also, our new loans were of higher credit quality than the loans being repaid, and this led to a further release of provisions. The recovery of $38 million in claims-related expenses in 2012 was mainly due to an improvement in our anticipated recoveries and an actuarial decrease in the allowance for claims to reflect the current portfolio composition.
Other items affecting 2012 results include:
Net Financing and Investment Income – Net financing and investment income increased by $65 million from 2011, largely the result of growth in our loan book.
Net Insurance Premiums and Guarantee Fees – Net insurance premiums and guarantee fees totalled $196 million in 2012, a decrease of 16% from 2011 mainly due to lower business facilitated in our insurance portfolio year-over-year as previously discussed.
Other Income (Expenses) – Other expenses were $16 million in 2012, an increase of $77 million from 2011. The variance is largely due to the volatility associated with our financial instruments carried at fair value.
Administrative Expenses – Administrative expenses were $314 million in 2012, an increase of $30 million, or 11% from 2011. The increase comes mainly from higher pension costs due to a reduction in the discount rate used to value the pension liability.
EDC is financially self-sustaining and does not receive parliamentary appropriations. The income that we generate is applied directly against Canada’s fiscal accounts and it strengthens our capital base. In the first quarter of 2012 we paid a dividend of $500 million to the Government of Canada. We ended the year with a strong capital position of $10.8 billion, which provides us with the resiliency and capacity to help Canadian exporters and investors navigate the uncertainty and volatility in the current trade environment.
Impact of Foreign Exchange Translation on Financial Results
By the end of 2012 the Canadian dollar had strengthened relative to the U.S. dollar, resulting in a rate of U.S. $1.01 on December 31st compared to U.S. $0.98 at the end of 2011. The stronger Canadian dollar resulted in a decrease in our assets and liabilities which are primarily denominated in U.S. dollars and translated to Canadian dollars at rates prevailing at the statement of financial position date. Business facilitated and the components of comprehensive income are translated into Canadian dollars at average exchange rates. The average rate for 2012 was U.S. $1.00 compared to U.S. $1.01 for 2011.
FINANCIAL PERFORMANCE
Net Financing and Investment Income
Loan Revenue
Loan revenue was $1,116 million in 2012, an increase of $107 million from 2011. The total yield on our loan portfolio was 3.83% up 5 basis points from the previous year.
Performing loan interest revenue was $936 million in 2012, an increase of $42 million compared to 2011 due to growth in our floating rate loan portfolio as net loan disbursements totalled $2,655 million during the year.
Yields on our floating rate portfolio increased from 2.56% in 2011 to 2.71% in 2012 mainly due to increases in LIBOR rates. This was countered by a decline in our fixed rate yields from 5.26% to 5.03% during this same period due to repayments on older loans with an average yield of 5.59% being replaced by new loans with an average yield of 3.53%. As a result, the overall yield on our performing loan portfolio decreased slightly by 3 basis points to 3.35% compared to 2011.
Components of the change in loan revenue from 2011
| | | | |
| (in millions of Canadian dollars) | | 2012 | |
Revenue from portfolio growth | | | 42 | |
Decrease in revenue from lower yield | | | (9 | ) |
Foreign exchange impact | | | 9 | |
Performing loan interest revenue | | | 42 | |
Increase in impaired revenue | | | 32 | |
Increase in loan fees | | | 31 | |
Increase in other loan revenue | | | 2 | |
Net change in loan revenue | | | $107 | |
46 | Adapting to the New Reality
| | |
We recognize revenue on the carrying value of our impaired loans at their original effective yield. In 2012, we recognized $41 million of impaired revenue, an increase of $32 million from 2011. This was due to a higher average carrying value of impaired loans as compared to the previous year mainly in our aerospace portfolio. Increases in estimated recoveries on these loans have also resulted in higher impaired revenue recognition. Loan fee revenue increased by $31 million in 2012 mainly due to additional commitment fees from higher levels of credit authorizations. Also, loan prepayments have led to the immediate recognition of deferred fee revenue. For a breakdown of loan interest yield on our fixed and floating portfolios, refer to Table 1 in Supplemental Information. | | 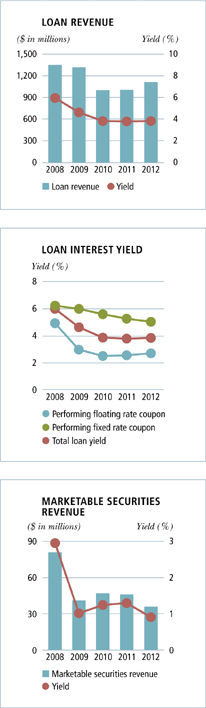 |
| Marketable Securities Revenue | |
We maintain a marketable securities portfolio in order to meet our liquidity requirements. Pursuant to our risk management policies, we must maintain sufficient liquidity to meet a prescribed minimum level, based on forecasted cash requirements. | |
Our marketable securities revenue consists of income earned on short-term instruments, bonds and government securities held during the year. Marketable securities revenue decreased by $10 million to $36 million in 2012. | |
Although the average marketable securities balance increased from $3,551 million in 2011 to $3,959 million in 2012, the continued reduction in yields during 2012 had a greater impact on revenue. The marketable securities portfolio increased as a result of carrying higher liquidity in response to market uncertainties as well as pre-funding for future disbursements. | |
During 2012, the yield on our marketable securities portfolio declined from 1.30% in 2011 to 0.91%. This is mainly the result of lower long-term U.S. Treasury yields which have a significant impact on our portfolio. | |
Components of the change in marketable securities revenue from 2011
| | | | |
| (in millions of Canadian dollars) | | 2012 | |
Impact of portfolio growth | | | 3 | |
Decrease in revenue from lower yield | | | (13 | ) |
Net change in marketable securities revenue | | | $(10 | ) |
|
EDC Annual Report 2012 | 47 |
MANAGEMENT’S DISCUSSION AND ANALYSIS
| | |
Interest Expense | | |
Our interest expense includes the cost of our debt and related derivatives. It also includes the impact of the floating rate currency swaps used to reduce the foreign currency risk related to using our capital to fund U.S. dollar denominated assets. These currency swaps are set up with the objective to offset U.S. dollar assets and liabilities with a U.S. dollar payable component and a Canadian dollar receivable component. | | 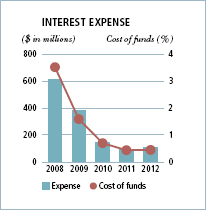 |
Interest expense totalled $108 million in 2012, an increase of $15 million from 2011 as a result of a higher average debt balance and lower revenue from our capital related currency swaps. Our average debt balance was $23,385 million in 2012, an increase of $2,851 million from 2011, which was mainly used to fund our growing loan portfolio. The net revenue generated by the capital related currency swaps was $66 million in 2012, a decrease of $4 million from 2011 as the short-term U.S. dollar and Canadian dollar rates moved closer in 2012. | |
Components of the change in interest expense from 2011
| | | | |
| (in millions of Canadian dollars) | | 2012 | |
Impact of volume increase | | | 17 | |
Decrease in revenue on currency swaps related to our capital | | | 4 | |
Decrease in expense from lower cost of funds | | | (3 | ) |
Foreign exchange impact | | | (3 | ) |
Net change in interest expense | | | $15 | |
Insurance Premiums and Guarantee Fees
| | |
Premium and guarantee fee revenue earned in our insurance programs in 2012 totalled $196 million compared to $234 million earned in the prior year. As previously discussed, market conditions such as greater risk capacity in the Canadian market and lower commodity prices led to a reduction in business facilitated which in turn translated into lower revenue. | | 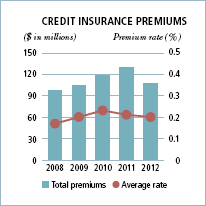 |
Insurance premiums earned under our credit insurance program amounted to $114 million for the year. We have partnered with reinsurers, primarily by way of a reinsurance treaty agreement, and in 2012 we ceded premiums of $6 million to our reinsurance partners, resulting in net premium revenue of $108 million. The net premium decreased by $21 million from 2011 mainly due to an $8,946 million or 14% decrease in business facilitated net of reinsurance in this program. In addition to the market conditions, a shift in insured business activity for one large customer within our credit insurance program was a key factor leading to the decline in business facilitated for the program in 2012. | |
Insurance premiums earned under our financial institutions insurance program totalled $18 million, a decrease of $14 million from 2011 due in part to the $4,619 million decline in business facilitated as a result of a change in product offering within the program. | |
Premium revenue was $48 million for the year in our contract insurance and bonding program compared to $58 million in 2011. Surety industry loss ratios continue to be good, increasing sureties’ appetite for risk in the U.S. for smaller clients. As a result, sureties are no longer seeking reinsurance from EDC to the same extent as during the crisis period.
Political risk insurance (PRI) premiums totalled $34 million in 2012, of which $12 million was ceded by way of partnering with reinsurers. The resulting net premium revenue was $22 million, an increase of $7 million over 2011. The PRI average premium rate of 1.35% in 2012 increased from the 2011 rate of 0.92%, mainly due to changes in the portfolio mix.
Loan guarantee fees totalled $38 million in 2012, an increase of $6 million over 2011. The average loan guarantee fee rate increased from 1.29% in 2011 to 1.53% in 2012. This increase reflects the termination of a guarantee with an investment grade obligor in the surface transportation sector before its contractual expiry date, resulting in the immediate recognition of a deferred charge in 2012.
For the breakdown of insurance premiums and guarantee fees, refer to Table 3 in Supplemental Information.
|
| 48 | Adapting to the New Reality |
Other Income (Expenses)
Other expenses were $16 million in 2012, compared to $61 million of other income in 2011. The key components of other expenses in 2012 were the realized and unrealized fair value gains and losses on various financial instruments as discussed below.
We issue debt instruments in the market where we are able to obtain the most attractive funding costs and then we use derivatives to manage interest rate risk and foreign exchange risk. Unrealized losses on loans payable designated at fair value through profit or loss totalled $36 million in 2012 and the unrealized gains on the derivatives associated with the loans payable totalled $68 million. During both 2012 and 2011 most rates relevant to the valuation of our loans payable and the related derivatives fell, leading to unrealized gains on our derivatives and unrealized losses on our loans payable. In accordance with International Financial Reporting Standards (IFRS), our debt is valued on the basis of our credit rating (AAA) while the related derivatives are valued based on curves that reflect the credit risk of the resulting exposure. In 2012, the credit exposure of these instruments decreased and this further contributed to the gain on the related derivatives.
| | | | | | |
| (in millions of Canadian dollars) | | 2012 | | | 2011 |
Net unrealized gain on derivatives related to loans payable | | | 68 | | | 135 |
Net unrealized loss on loans payable designated at fair value through profit or loss | | | (36) | | | (147) |
Net realized and unrealized gain (loss) on loan related credit default swaps | | | (70) | | | 24 |
Net realized and unrealized gain on marketable securities at fair value through profit or loss | | | 9 | | | 71 |
Foreign exchange translation gain (loss) | | | 2 | | | (23) |
Other | | | 11 | | | 1 |
Total other income (expenses) | | | $(16) | | | $61 |
In 2012 we recorded a net realized and unrealized loss of $70 million (2011 – gain of $24 million) on our portfolio of loan related credit default swaps. The loss is primarily related to a decrease in the fair value of the credit default swaps we bought to mitigate our credit exposure as the credit condition of the underlying entities improved during 2012.
We have designated the majority of our marketable securities at fair value through profit or loss; consistent with our business model for managing these instruments. At the end of December 2012 realized and unrealized gains on marketable securities at fair value through profit or loss totalled $9 million (2011 – $71 million). Our portfolio includes a portion of U.S. treasury securities and the gain is mainly due to the decrease of the relevant U.S. treasury rates during 2012. The rates did not decline as much in 2012 and therefore this translated into a smaller gain when compared with 2011.
Provision for (Reversal of) Credit Losses
In 2012 we recorded a reversal of provision for credit losses of $340 million related to our loan portfolio compared to a provision charge of $125 million in 2011. In both years, our new loans and commitments were of higher credit quality than the loans being repaid leading to a release of provisions. However, in 2011 the impact was largely offset by negative credit migration. Reductions in collateral values used in the allowance calculation led to a provision charge in both years although the impact was larger in 2011. In 2012, the updates made to the independent variables: namely, the probability of default and the amount of loss given a default event, resulted in an additional reversal of provisions as discussed on page 55.
For a breakdown of the provision for (reversal of) credit losses, refer to Table 4 in Supplemental Information.
|
EDC Annual Report 2012 | 49 |
MANAGEMENT’S DISCUSSION AND ANALYSIS
Claims-Related Expenses (Recovery)
We experienced a $38 million recovery of claims-related expenses in 2012, compared to a $247 million expense in 2011. The decrease is the result of the actuarial change in the net allowance for claims as well as an increase in recoverable insurance claims.
The actuarial adjustment takes into account updates to the assumptions within the calculation as well as changes in the portfolio and risk ratings. The actuarial increase in the net allowance for claims in 2011 was primarily driven by a large claim under consideration in our political risk insurance program. The claim charge in 2012 released the requirement for the associated liability, which contributed to the actuarial decrease of $233 million in 2012. We also experienced a further actuarial reduction in our policy and claims liabilities in 2012 due to the impact of changes in portfolio composition.
The ongoing review of our recoverable insurance claims further contributed to the recovery of claims-related expenses in 2012.
| | | | | | |
| (in millions of Canadian dollars) | | 2012 | | | 2011 |
Claims paid | | | 355 | | | 54 |
Claims paid – reinsured policies | | | 3 | | | 1 |
Claims recovered | | | (22) | | | (40) |
Actuarial increase/ (decrease) in the net allowance for claims | | | (233) | | | 179 |
Reinsurers’ share of claims recovered | | | – | | | 1 |
Decrease/ (increase) in recoverable insurance claims | | | (156) | | | 50 |
Claims handling and settlement expenses | | | 15 | | | 2 |
Total claims-related expenses (recovery) | | | $(38) | | | $247 |
Administrative Expenses
| | |
Administrative expenses for 2012 totalled $314 million, an increase of $30 million, or 11% from the prior year. The increase is largely driven by higher pension-related costs of $32 million and higher accommodation and depreciation costs of $10 million. The pension increase is due primarily to the lower discount rate used to value the pension obligation. The accommodation and depreciation costs rose as anticipated upon commencement of the lease of our new head office. Our cost containment efforts yielded savings in a number of areas including human resource costs ($4 million), consulting ($4 million), systems costs ($2 million) and travel ($2 million). | | 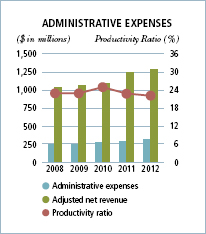 |
The Productivity Ratio (PR) measures our operational efficiency as investments in people and technology are required to keep pace with the growth and complexity of the business. The PR decreased to 21.7% in 2012, slightly more favourable than the 22.8% in 2011. Our pension costs can fluctuate greatly from year to year based on changes in assumptions used to value our pension obligation; therefore, for purposes of our PR calculation we use the actuarial assumptions used in the Corporate Plan with the intent of absorbing the changes in the following year. The PR for 2012 before the adjustment for unforeseen pension costs would have been 24.1%. | |
50 | Adapting to the New Reality
FINANCIAL CONDITION
Statement of Financial Position Summary
Total assets were $36.2 billion at the end of 2012, an increase of $2.6 billion, or 8% from 2011, which is mainly due to an increase in our loans receivable and cash and marketable securities.
Cash and Marketable Securities – We maintain a marketable securities portfolio in order to meet our liquidity requirements. Cash and marketable securities were $4.2 billion at the end of 2012, an increase of $0.3 billion from 2011. The amount of cash and marketable securities increased as a result of carrying higher liquidity in response to market uncertainties.
Loans Receivable – Loans receivable were $30.1 billion, an increase of $1.4 billion or 5% from 2011 mainly due to net loan disbursements.
Allowance for Losses on Loans – The allowance for losses on loans is $498 million lower than at the end of 2011 mainly due to a reversal of provision of $263 million in the year and loan write-offs of $212 million. Additional details are provided on pages 49 and 55.
Other Financing and Leasing Assets – The increase in 2012 is primarily due to the repossession of 34 aircraft and two spare engines valued at $465 million as a result of loan foreclosures.
| | | | | | |
as at December 31 (in millions of Canadian dollars) | | 2012 | | | 2011 |
Cash and marketable securities | | | 4,236 | | | 3,886 |
Derivative instruments | | | 1,352 | | | 1,541 |
Loans receivable | | | 30,131 | | | 28,680 |
Allowance for losses on loans | | | (1,182) | | | (1,680) |
Other financing and leasing assets | | | 1,203 | | | 708 |
Other | | | 493 | | | 461 |
Total Assets | | | $36,233 | | | $33,596 |
Loans payable | | | 25,880 | | | 23,570 |
Derivative instruments | | | 120 | | | 178 |
Allowance for loan commitments | | | 58 | | | 41 |
Policy and claims liabilities | | | 583 | | | 875 |
Other liabilities | | | 515 | | | 676 |
Equity | | | 9,077 | | | 8,256 |
Total Liabilities and Equity | | | $36,233 | | | $33,596 |
Loans Payable – Loans payable were $25.9 billion compared to $23.6 billion in 2011, an increase of $2.3 billion. The increase is mainly due to net debt issuances which were used to fund net loan disbursements. Our borrowing requirements are largely driven by activity within our loans portfolio.
Corporate Plan Discussion
The following section discusses our 2012 results and financial position in comparison to Corporate Plan projections. We begin by looking back to our 2012 Corporate Plan and compare actual results to what was expected. Then we look forward to 2013 and provide an explanation of where we anticipate changes from our 2012 results and financial position.
Financial Performance
| | | | | | | | | | |
for the year ended December 31 (in millions of Canadian dollars) | | 2013
Corporate Plan | | | 2012
Actual Results | | | 2012
Corporate Plan |
Net financing and investments income | | | 1,050 | | | | 1,039 | | | 950 |
Insurance premiums and guarantee fees* | | | 247 | | | | 234 | | | 271 |
Other income (expenses) | | | (25) | | | | (16) | | | (30) |
Administrative expenses | | | 330 | | | | 314 | | | 303 |
Provision for (reversal of) credit losses | | | 47 | | | | (340) | | | (125) |
Claims-related expenses (recovery) | | | 60 | | | | (38) | | | 96 |
Net income | | | 835 | | | | 1,321 | | | 917 |
Other comprehensive income | | | – | | | | – | | | – |
Comprehensive income | | | $835 | | | | $1,321 | | | $917 |
*Includes loan guarantee fees.
2012 Corporate Plan
Net income for 2012 was $1,321 million, $404 million higher than the 2012 Corporate Plan net income of $917 million. Items of note are as follows:
Net financing and investment income was $1,039 in 2012, $89 million greater than the 2012 Corporate Plan. This is due to increased signings and disbursements in both 2011 and 2012.
Insurance premium and loan guarantee fee income was $234 million in 2012; $37 million lower than the Corporate Plan which is attributable to lower business facilitated in 2012 as previously discussed.
|
EDC Annual Report 2012 | 51 |
MANAGEMENT’S DISCUSSION AND ANALYSIS
The 2012 reversal of provision for credit losses of $340 million was an additional release of $215 million from the 2012 Corporate Plan. The main variances are as follows:
| | u | the updates to the probability of default and the loss given default assumptions resulted in a $219 million release of provision for credit losses. |
| | u | in 2012, the impact of net portfolio growth led to a reversal of credit losses of $162 million, $91 million more than contemplated in the Corporate Plan. |
Claims-related recoveries were $38 million in 2012 compared to $96 million of expenses projected in the 2012 Corporate Plan. The ongoing review of our recoverable insurance claims as well as an actuarial reduction in our policy and claims liabilities due to changes in portfolio composition were the primary reasons for the variance.
Administrative expenses were $11 million higher than the Corporate Plan. The difference is largely due to higher pension costs than projected in the Plan. We experienced reductions in most other areas of administrative expenses as a result of our cost containment efforts.
The productivity ratio for 2012 was 21.7%, lower than the 2012 Corporate Plan projection of 25.5%. The main contributors to this favourable position were:
| | u | administrative expenses, after excluding the unforeseen pension adjustment as previously discussed, were lower than anticipated mainly as a result of our cost containment efforts. |
| | u | higher loan revenue resulting from increased signings and disbursements. |
2013 Corporate Plan
Net income for 2013 is planned to be $835 million, $486 million less than 2012 as we are expecting increases in both provisioning requirements and claims-related expenses in 2013.
The 2013 Corporate Plan is projecting a $47 million provision for credit losses, which is $387 million higher than the actual 2012 reversal of provision of $340 million. The main differences are as follows:
| | u | non-recurring reversals of provision for credit losses of $219 million as previously discussed. |
| | u | In 2012, the impact of net portfolio growth led to a release of provision for credit losses of $162 million as our new loans and commitments were of a higher credit quality than the loans being repaid. The net portfolio growth anticipated in the 2013 Plan is expected to result in a provision for credit losses of $46 million. |
Claims-related expenses are projected to be $60 million in 2013, $98 million higher than 2012. This is primarily due to the impact of the changes in portfolio composition in 2012 on our policy and claims liabilities that are not expected to recur.
Administrative expenses for 2013 are $330 million, $16 million greater than 2012. Costs are expected to be higher in 2013 mainly due to increased human resource costs as a result of normal salary adjustments since retaining our talent pool is of utmost importance for the ongoing success of the organization in meeting its mandate. We are projecting a productivity ratio of 25.9% compared to 21.7% in 2012, which falls within our targeted range of 24-26%. As previously mentioned, our current year PR is calculated based on actuarial assumptions for our pension liability used in the Corporate Plan and we absorb the impact of the changes in the following year. If we were to include the pension adjustment in our current year calculation, 2012 PR would be 24.1%.
Financial Position
| | | | | | | | | | |
as at December 31 (in millions of Canadian dollars) | | 2013
Corporate Plan | | | 2012
Actual Results | | | 2012
Corporate Plan |
Cash and marketable securities | | | 4,339 | | | | 4,236 | | | 3,216 |
Derivative instruments | | | 1,497 | | | | 1,352 | | | 2,082 |
Loans receivable | | | 31,733 | | | | 30,131 | | | 27,170 |
Allowance for losses on loans | | | (1,364) | | | | (1,182) | | | (1,253) |
Other financing and leasing assets | | | 1,249 | | | | 1,203 | | | 796 |
Other assets | | | 481 | | | | 493 | | | 616 |
Total Assets | | | $37,935 | | | | $36,233 | | | $32,627 |
Loans payable | | | 27,710 | | | | 25,880 | | | 22,306 |
Derivative instruments | | | 181 | | | | 120 | | | 130 |
Allowance for losses on loan commitments | | | 63 | | | | 58 | | | 100 |
Policy and claims liabilities | | | 565 | | | | 583 | | | 787 |
Other liabilities | | | 774 | | | | 515 | | | 557 |
Equity | | | 8,642 | | | | 9,077 | | | 8,747 |
Total Liabilities and Equity | | | $37,935 | | | | $36,233 | | | $32,627 |
|
| 52 | Adapting to the New Reality |
2012 Corporate Plan
Loans receivable totalled $30.1 billion at the end of 2012, $2.9 billion higher than Plan primarily as a result of a higher loans receivable balance at the beginning of 2012 based on 2011 actual results, as well as additional net disbursements in 2012 from what was contemplated in the Corporate Plan. Loans payable for 2012 are $3.6 billion higher than projected in the Plan both as a result of the funding required for the increase in loans receivable as well as a $1 billion increase in marketable securities.
2013 Corporate Plan
The Corporate Plan is projecting loans receivable to be $31.7 billion at the end of 2013, $1.6 billion higher than December 31, 2012, primarily due to net disbursements. Loans payable are growing in tandem with the projected increase in loans receivable.
Portfolio Exposures and Credit Quality
CONCENTRATION OF EXPOSURE
EDC’s total exposure to risk at the end of 2012 was $77.9 billion, an increase of $1.8 billion from 2011. The majority of the exposure was for risks within the United States (25%) and Canada (24%). By industry, our greatest exposures are within the extractive and transportation sectors.
Exposure by Program
| | | | | | |
as at December 31 (in millions of Canadian dollars) | | 2012 | | 2011 | | 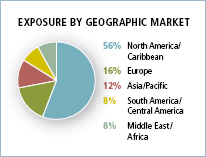 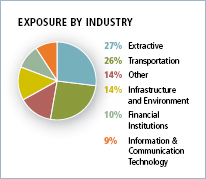 |
Financing portfolio: | | | | | |
Financing assets(1) | | 30,861 | | 29,593 | |
Commitments and guarantees(2) | | 19,923 | | 15,356 | |
Total financing portfolio | | 50,784 | | 44,949 | |
Insurance portfolio: | | | | | |
Credit insurance | | 7,750 | | 7,804 | |
Financial institutions insurance | | 4,118 | | 6,969 | |
Contract insurance and bonding(3) | | 8,161 | | 9,191 | |
Political risk insurance | | 1,503 | | 1,768 | |
Total insurance portfolio | | 21,532 | | 25,732 | |
Marketable securities and derivative instruments | | 5,588 | | 5,427 | |
Total exposure | | $77,904 | | $76,108 | |
(1) Includes gross loans receivable, investments and gross investment in aircraft under finance leases. (2) Includes $417 million of investments commitments (2011 – $283 million). (3) Includes $6,701 million of insurance guarantees (2011 – $6,986 million). While the financing portfolio experienced an increase due to new credit authorizations, a change in program offering coupled with decreased demand in some of the emerging markets, particularly China, reduced exposure under the financial institutions insurance program. For a detailed breakdown of the major concentrations of total gross exposure by geographical market and industry, refer to Tables 5 and 6 in Supplemental Information. | |
FINANCING PORTFOLIO
LOANS PORTFOLIO
We enable Canadian exports and foreign investments by providing financing solutions to Canadian exporters and their foreign customers, to Canadian investors and to financial institutions. Not only do we provide solutions for exporters with existing contracts, we also proactively identify potential procurement needs on large foreign projects and provide financing to foreign buyers in order to develop opportunities for procurement from Canadian companies. These financing products enable Canadian companies to provide their customers with flexible, medium- or long-term financing.
|
EDC Annual Report 2012 | 53 |
MANAGEMENT’S DISCUSSION AND ANALYSIS
Gross Loans Receivable
| | |
Gross loans receivable totalled $30,336 million at the end of 2012, an increase of $1,243 million or 4% from 2011. The growth was due to net loan disbursements which were $2,655 million for the year, an increase of 60% from the $1,658 million of net disbursements in 2011. During 2012, aircraft for which we had provided secured financing were returned to us by two impaired obligors. As a result, the associated loans totalling $523 million were removed from our books and replaced with aircraft assets valued at $465 million which form part of our leasing portfolio. The remaining loan balances totalling $58 million were written off along with loan balances for other obligors totalling $350 million. These two items reduced the impact of net disbursements on gross loans receivable by $873 million. The stronger Canadian dollar at the end of 2012 also decreased gross loans receivable by $552 million as most of our loans are denominated in U.S. dollars. | | 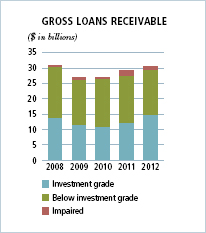 |
In assessing the credit risk profile of our loan portfolio, we rate our obligors using a system of credit ratings as established in our credit risk rating methodology. These ratings are reviewed on a regular basis. Based on their ratings, we then categorize our loans receivable into three risk classifications: investment grade performing, below investment grade performing and impaired. | |
Individually Impaired Loans
Impaired loans represent loans for which we no longer have reasonable assurance that the full amount of principal and interest will be collected on a timely basis in accordance with the terms of the loan agreement. At the end of 2012, impaired gross loans receivable totalled $1,160 million, a decrease of $645 million from the end of 2011. Overall, impaired loans as a percentage of total gross loans receivable decreased from 6.2% in 2011 to 3.8% in 2012 primarily due to the factors outlined below.
During 2012, EDC repossessed 34 aircraft from two impaired aerospace obligors including 28 aircraft from Pinnacle Airlines, Inc. which were transferred into our portfolio of equipment available for lease. Consequently, the repossession of these aircraft resulted in a reduction of $523 million to impaired loans as discussed above.
We also wrote off an additional $349 million of principal related to 27 commercial borrowers and 2 sovereign borrowers. Loans related to the commercial borrowers were written off as we exhausted all recovery methods and no further prospect of recovery was likely. Loans related to the sovereign borrowers were written off as they have been granted full debt forgiveness by their creditor countries pursuant to the terms set out by the Paris Club.
Loans totalling $361 million were classified as impaired during the year while loans totalling $169 million were removed from our books as a result of repayments by borrowers and principal recoveries from loan sales.
Table 7 in Supplemental Information provides additional information on impaired loans including country and industry concentration.
Commercial Loans and Loan Guarantees
| | | | | | | | | | | | | | | | | | | | | | | | | | |
| (in millions of Canadian dollars) | | Gross loans receivable | | | Financing commitments | | | Loan guarantees | | | 2012 Exposure | | | 2011 Exposure |
Industry | | | | | | | | | | | | | | | $ | | | | % | | | | $ | | | % |
Extractive* | | | 8,472 | | | | 7,772 | | | | 279 | | | | 16,523 | | | | 34 | | | | 13,005 | | | 31 |
Aerospace | | | 9,493 | | | | 2,798 | | | | 80 | | | | 12,371 | | | | 26 | | | | 11,780 | | | 28 |
Information and communication technology | | | 2,550 | | | | 2,816 | | | | 140 | | | | 5,506 | | | | 11 | | | | 3,659 | | | 9 |
Surface transportation | | | 3,458 | | | | 1,172 | | | | 608 | | | | 5,238 | | | | 11 | | | | 5,815 | | | 14 |
Infrastructure and environment | | | 2,693 | | | | 1,507 | | | | 306 | | | | 4,506 | | | | 9 | | | | 4,342 | | | 10 |
Light manufacturing | | | 974 | | | | 588 | | | | 369 | | | | 1,931 | | | | 4 | | | | 1,467 | | | 3 |
Financial institutions | | | 1,036 | | | | 122 | | | | 28 | | | | 1,186 | | | | 3 | | | | 1,288 | | | 3 |
Resources | | | 470 | | | | 381 | | | | 158 | | | | 1,009 | | | | 2 | | | | 1,007 | | | 2 |
Total | | | $29,146 | | | | $17,156 | | | | $1,968 | | | | $48,270 | | | | 100 | | | | $42,363 | | | 100 |
* Includes both oil and gas and mining sub-sectors.
Growth in the extractive and information and communication technology sectors was the primary driver behind the increase in our commercial portfolio exposure. The extractive sector grew by $3,518 million including new credit authorizations in both the oil and gas and mining sectors totalling $1,520 million with three counterparties in Saudi Arabia, the United Arab Emirates and the Czech Republic. We also entered into new large financing transactions in the oil and gas sector totalling $1,299 million with counterparties in the United Kingdom, Brazil and Mexico. All of these counterparties are investment grade.
|
| 54 | Adapting to the New Reality |
In 2012, 68% of loan signings were investment grade which contributed to an increase in the ratio of investment grade exposure to total commercial exposure from 51% in 2011 to 58% in 2012. The largest concentrations of commercial investment grade exposure are within the extractive (49%), information and communication technology (12%) and the infrastructure and environment sectors (10%).
The extractive, aerospace and information and communication technology sectors accounted for 71% of our total commercial exposure in 2012 (2011 – 68%). This reflects the continuous demand for financing in these sectors for Canadian companies. These three sectors also contain our largest single counterparty exposures.
Our largest commercial single counterparty exposures in 2012 resided with two U.S. counterparties, one Mexican counterparty, two Brazilian counterparties and one Saudi Arabian counterparty within two industry sectors, which collectively represented $6,710 million, or 14% of the total commercial exposure. This includes exposure to two counterparties in the aerospace sector which totalled $2,772 million and four counterparties in the extractive sector which totalled $3,938 million.
Sovereign Loans and Loan Guarantees
| | | | | | | | | | | | | | | | | | | | | | | | | | |
(in millions of Canadian dollars) | | Gross loans
receivable | | | Financing
commitments | | | Loan
guarantees | | | | | | 2012 Exposure | | | | | | 2011 Exposure |
Country | | | | | | | | | | | | | | | $ | | | | % | | | | $ | | | % |
Ukraine | | | 246 | | | | 44 | | | | – | | | | 290 | | | | 18 | | | | 298 | | | 17 |
Serbia | | | 233 | | | | 35 | | | | – | | | | 268 | | | | 17 | | | | 275 | | | 15 |
Indonesia | | | 94 | | | | 147 | | | | – | | | | 241 | | | | 15 | | | | 110 | | | 6 |
Saudi Arabia | | | 143 | | | | – | | | | – | | | | 143 | | | | 9 | | | | 163 | | | 9 |
Uruguay | | | – | | | | – | | | | 103 | | | | 103 | | | | 7 | | | | 115 | | | 6 |
Pakistan | | | 61 | | | | – | | | | – | | | | 61 | | | | 4 | | | | 64 | | | 4 |
China | | | 55 | | | | – | | | | – | | | | 55 | | | | 3 | | | | 71 | | | 4 |
Dominican Republic | | | 31 | | | | – | | | | 22 | | | | 53 | | | | 3 | | | | 70 | | | 4 |
Egypt | | | 53 | | | | – | | | | – | | | | 53 | | | | 3 | | | | 63 | | | 3 |
Other | | | 274 | | | | 20 | | | | 11 | | | | 305 | | | | 19 | | | | 574 | | | 32 |
Total | | | $1,190 | | | | $246 | | | | $136 | | | | $1,572 | | | | 100 | | | | $1,803 | | | 100 |
The sovereign loans and guarantees portfolio decreased by $231 million or 13% from 2011, primarily due to write-offs of loans with Ivory Coast and the Democratic Republic of Congo totalling $175 million which also contributed to the decline of the non-investment grade exposure from 72% in 2011 to 57% in 2012.
| | |
| Allowance for Losses on Loans, Loan Commitments and Guarantees | | 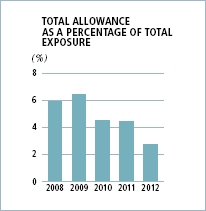 |
The total allowance for losses on loans, loan commitments and guarantees was $1,350 million at the end of 2012, a decrease of $577 million from the 2011 allowance of $1,927 million. The key components impacting the allowance in 2012 were as follows: | |
u write-offs of impaired loans – reduction $212 million; | |
u changes in the portfolio composition – reduction $162 million; u updates made to the probability of default rates – reduction $156 million; u update to loss given default assumption – reduction $63 million; u updates to collateral values – increase $75 million. | |
In 2012, we wrote off loans to 29 commercial borrowers with the largest financial impacts mainly related to the aerospace and financial institutions sectors. Net income in 2012 was not significantly impacted as the allowance was adequate to cover the majority of the losses. | |
Changes in the composition of our financing portfolio impacted the allowance since the decrease in the allowance as a result of loan repayments exceeded the additional allowance required due to disbursements and new loan commitments. In 2012, we signed several large investment grade transactions which attracted lower allowances. Also, similar to 2010 and 2011, activity within our secured aerospace portfolio contributed to this reduction in allowance. For this portfolio, we reduce the exposure on secured loans by the value of the collateral held before determining an allowance on the remaining exposure. The collateral values for new aircraft financed are higher than the loan values; therefore, disbursements on new aircraft generally do not attract an allowance. Over the term of the loan the collateral values are adjusted to reflect the age of the aircraft and other market conditions. As the collateral values fall below the loan value, additional allowances are required. Partial repayments on loans secured by aircraft decrease our exposure without impacting collateral values and consequently decrease the allowance required.
|
EDC Annual Report 2012 | 55 |
MANAGEMENT’S DISCUSSION AND ANALYSIS
In 2011, EDC initiated a multi-year project to develop an internal credit risk rating system that measures obligor and transaction risks. Based on this new system, in 2012, we changed our probability of default assumptions in our allowance calculation. The updated probability of default rates were generated by a new credit risk rating tool that uses external historical experience to generate default tables. In prior years, default rates were based on a weighted average of Moody’s and Standard & Poor’s default tables. The impact of updating the probability of default rates was a provision reversal of $156 million of which $93 million represents a change in accounting estimate as it relates to the difference between using our new tool and the approach from prior years.
Also, in June 2012, we updated the loss given default assumption in our collective allowance calculation for our commercial unsecured and sovereign portfolios. The reduction in our assumption was based on a review of the historical loss rate of our portfolio. The impact of updating the loss given default assumptions was a provision reversal of $63 million of which $53 million represents a change in accounting estimate as it relates to the difference between using the updated assumption and the prior assumption as at December 31, 2012.
The total allowance as a percentage of our total loan portfolio exposure at the end of 2012 decreased from 4.4% to 2.7% mainly as a result of the reduction in the allowance related to changes in portfolio composition and updates to independent variables.
Components of the Allowance
| | | | | | |
| (in millions of Canadian dollars) | | 2012 | | | 2011 |
Base allowance | | | 939 | | | 1,314 |
Counterparty concentration | | | 97 | | | 104 |
Total collective allowance | | | 1,036 | | | 1,418 |
Allowance for individually impaired loans, loan commitments and guarantees | | | 314 | | | 509 |
Total allowance for losses on loans, loan commitments and guarantees | | | $1,350 | | | $1,927 |
For a breakdown of the collective allowance for losses on loans, loan commitments and guarantees by industry of risk, refer to Table 8 in Supplemental Information.
Base Allowance
We classify our performing exposure into categories based on obligor credit rating, industry of risk for commercial obligors and whether the exposure is secured. For secured portfolios, the exposure for each obligor is reduced by the fair value of collateral adjusted for estimated repossession costs. Based on these exposure categories we determine the appropriate base allowance. Loss given default is determined based on historical loan loss rates and by management estimates for each of our exposure categories and default rates are based on an internally developed standard probability of default rate table.
Allowance Overlays
In addition to the base allowance, we add overlays as required to the collective allowance. A concentration overlay is added to reflect the additional risk that we assume when our exposure to a specific counterparty is over a certain threshold. Market overlays are also established to take into consideration that current financial uncertainties are not always reflected in current credit ratings. The overlays are more fully explained in the following sections.
Counterparty Concentration Overlay
A concentration component is added to adequately provision for sovereign and commercial counterparties whose level of exposure is deemed by management to represent an increased amount of risk. A counterparty whose exposure exceeds 10% of our equity based on the previous year’s audited financial statements will attract a concentration component calculated on the portion of exposure over the threshold. The allowance on this portion of exposure is calculated on the same basis as the base allowance for that counterparty.
We had a concentration overlay of $97 million at the end of 2012 compared to $104 million a year earlier. The decrease is mainly due to a higher threshold in 2012 as a result of the increase in retained earnings in 2011. Obligors within the aerospace sector comprise 96% of the concentration overlay (2011 – 98% aerospace).
Market Overlays
Market overlays are added to our allowance as required to reflect the risk that the impact of recent economic events is not fully captured in current credit ratings. At the end of 2012, we determined that the current credit ratings appropriately captured the risk in the economy, and thus no market overlays were required.
Individual Allowances
We establish allowances for individually impaired loans, loan commitments and loan guarantees to recognize impairment losses. Individual allowances decreased from $509 million in 2011 to $314 million in 2012. This was primarily due to the large amount of loan write-offs in 2012 as previously discussed on page 55.
|
| 56 | Adapting to the New Reality |
INVESTMENTS
EDC plays a valuable role in helping Canadian companies access capital and financing. We maintain a portfolio of investments focused on promising Canadian late-stage start-ups or established small and mid-sized entities to aid these companies in growing and expanding beyond the Canadian border. In addition, we invest offshore with an emphasis on emerging markets where such investments can serve to facilitate the connection of Canadian business activity into international markets. Our investments are made both directly into Canadian businesses and into funds which in turn invest in Canadian or international businesses. With the goal of growing Canadian exporters and facilitating foreign business connections, investments are normally held for periods greater than five years. Divestitures are generally made through the sale of our investment interests to third parties or through listing on public markets.
Consistent with our business goal of growing investments, our exposure increased by $178 million to $846 million in 2012 largely as a result of new commitments. During the year, we signed an additional $230 million of investment arrangements (2011 – $62 million).
Refer to Table 9 in Supplemental Information for a breakdown of exposure for our investments.
EQUIPMENT AVAILABLE FOR LEASE
Equipment available for lease consists of aircraft that were returned to us because of default under the related obligors’ loan agreements. While it is not EDC’s intent in the ordinary course of business to act as a lessor, we do engage in leasing activities for asset management purposes to maximize recoveries on returned aircraft and minimize potential losses. Our current portfolio consists of 54 aircraft and two spare engines with a carrying value of $525 million (2011 – 19 aircraft and one airframe with a carrying value of $55 million). The increase in 2012 was mainly the result of 34 aircraft and two spare engines being returned to us by two impaired obligors. Within this portfolio 32 aircraft are currently on lease with six lessees in seven countries, including four within emerging markets. Of the remaining 22 aircraft and two spare engines, 8 aircraft are idle and available for lease and the balance are contracted to be out on lease in 2013. The existing lease terms range from 8 to 95 months with contracted monthly lease payments ranging between $60 thousand and $128 thousand (2011 – 12 to 60 months and $60 thousand to $75 thousand).
AIRCRAFT UNDER FINANCE LEASES
We have 13 aircraft on long-term lease with one obligor in the aerospace industry in the United States. These aircraft were returned to us as a result of loan defaults by this obligor. Under the terms of a restructuring agreement, these aircraft were subsequently leased back to this obligor and classified as finance leases. Our gross investment in these finance leases is $96 million (2011 – $115 million). This exposure is below investment grade.
INSURANCE PORTFOLIO
Credit insurance facilitates export growth by mitigating risk; providing companies with the confidence to do business abroad knowing that their receivables will be paid should their buyer default on payment. It also enhances their cash flow as banks are generally comfortable providing additional support when their customers’ foreign receivables are insured.
Financial institutions insurance provides coverage to Canadian banks for foreign bank and foreign buyer counterparty risk in trade transactions in favour of Canadian exporters.
EDC’s bonding products are delivered through partnerships with banks and surety companies. Our performance security and surety bond products are used by exporters primarily to guarantee their contract performance, which helps free up working capital. Our partnerships with banks and surety companies help them mitigate their risks and make it easier for exporters to obtain the coverage they need. We provide contract frustration insurance coverage to protect against commercial and political risks resulting from buyer non-payment associated with a specific contract.
As companies diversify their supply and distribution networks and expand into new markets, they are often exposed to political risks that can result in significant losses. This is particularly true of emerging markets, where political events could adversely impact a company’s foreign operations. EDC’s political risk insurance provides peace of mind to companies and their financial intermediaries that, when faced with such risks, their assets will be protected, enabling them to take advantage of export and investment opportunities in emerging markets.
The assistance that EDC provides to our policyholders within our four primary insurance programs is counted in various ways. Under the credit insurance and financial institutions insurance programs, the policyholder declares their sales volume to entities covered by their policy. These declarations are counted as business facilitated for this program. Within our contract insurance and bonding program, a facility is established and the policyholder makes requests for cover to initiate specific coverage. These requests represent business facilitated by EDC. As transactions are signed within our political risk insurance program, they are also counted as business facilitated.
In addition to directly underwriting insurance policies, we assume exposure from other insurers to fulfill our mandate to support Canadian exporters. We also cede reinsurance to other insurance companies to mitigate our risk. The ceding arrangements provide greater diversification of the business and minimize the net loss potential arising from large exposures.
|
EDC Annual Report 2012 | 57 |
MANAGEMENT’S DISCUSSION AND ANALYSIS
Contingent Liabilities under the Insurance Program
Our liability associated with outstanding insurance policies and guarantees at year end is referred to as contingent liabilities in the notes to our financial statements and is also referred to as exposure under the insurance programs throughout the management’s discussion and analysis section of this annual report.
Contingent liabilities under insurance policies and guarantees totalled $21,532 million at the end of 2012, a decrease of 16% from 2011. Reduced exposure within the financial institutions program was the main driver of the decline.
Credit Insurance Program
Contingent liabilities under the credit insurance program totalled $7,750 million at the end of 2012 , consistent with the 2011 level of $7,804. Although we have seen a 14% decline in business facilitated, there will not necessarily be a corresponding change in exposure due to policy liability limits.
| | | | | | | | | | | | | | | | | | | | | | |
| (in millions of Canadian dollars) | | | | 2012 Exposure | | | | | 2011 Exposure |
Industry | | | | | $ | �� | | | | | % | | | | | | $ | | | | | % |
Extractive | | | | | 2,308 | | | | | | 30 | | | | | | 2,177 | | | | | 28 |
Resources | | | | | 1,650 | | | | | | 21 | | | | | | 1,730 | | | | | 22 |
Transportation | | | | | 1,198 | | | | | | 16 | | | | | | 1,114 | | | | | 14 |
Information and communication technology | | | | | 1,019 | | | | | | 13 | | | | | | 1,262 | | | | | 16 |
Light manufacturing | | | | | 948 | | | | | | 12 | | | | | | 1,001 | | | | | 13 |
Infrastructure and environment | | | | | 627 | | | | | | 8 | | | | | | 520 | | | | | 7 |
Total | | | | | $7,750 | | | | | | 100 | | | | | | $7,804 | | | | | 100 |
| | |
Financial Institutions Insurance | | |
Contingent liabilities for financial institutions insurance totalled $4,118 million in 2012 (2011 – $6,969). The decrease in this program from 2011 is the result of a change in program offering coupled with decreased demand in some of the emerging markets, particularly China. | | 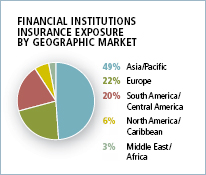 |
Contract Insurance and Bonding | | |
As we emerge from the crisis period, our contingent liability in the contract insurance and bonding program is impacted by sureties’ decreased need for reinsurance from EDC due to stronger appetite for risk in the U.S. and less need for coverage from some of our larger policyholders. The result was a decline to $8,161 million at the end of 2012 from the 2011 contingent liability of $9,191 million. | | 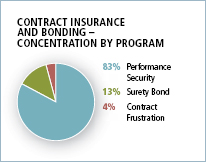 |
Within our contract insurance and bonding program 96% of our exposure is located in the United States and Canada (2011 – 94%). | |
Political Risk Insurance | | |
At the end of 2012 the contingent liability for political risk insurance totalled $1,503 million (2011 – $1,768). Decreased exposure on one large policy is the main factor responsible for the decline from 2011. | | 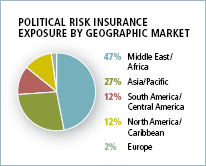 |
|
| 58 | Adapting to the New Reality |
Claims
| | | | | | | | | | |
| (in millions of Canadian dollars) | | | | 2012 | | | | | 2011 |
Claims paid | | | | | 358 | | | | | 55 |
Claims recovered | | | | | (22) | | | | | (40) |
Net claims | | | | | $336 | | | | | $15 |
Claim payments totalled $358 million in 2012 and were comprised of 970 claims related to losses in 71 countries (2011 – 1,062 claims in 63 countries). As previously mentioned we had a $300 million claim charge in our political risk insurance program in 2012 in the Middle East region. In 2011, the largest concentration of claim payments was in North America.
In 2012 we recovered $24 million in total (2011 – $43 million) of which $2 million was disbursed to exporters (2011 – $3 million).
Claims Paid by Exporters’ Insured Sector
| | | | | | | | | | | | | | | | |
| (in millions of Canadian dollars) | | | | | 2012 | | | | | | 2011 | |  |
| | | $ | | | % | | | $ | | | % | |
Extractive | | | 309 | | | | 87 | | | | 3 | | | 6 | |
Resources | | | 14 | | | | 4 | | | | 15 | | | 27 | |
Information and communication technology | | | 12 | | | | 3 | | | | 9 | | | 16 | |
Infrastructure and environment | | | 11 | | | | 3 | | | | 14 | | | 26 | |
Light manufacturing | | | 8 | | | | 2 | | | | 10 | | | 18 | |
Transportation | | | 4 | | | | 1 | | | | 3 | | | 6 | |
Financial institutions | | | – | | | | – | | | | 1 | | | 1 | |
Claims paid | | $ | 358 | | | | 100 | | | $ | 55 | | | 100 | |
During 2012, there were 1,563 claims submitted to EDC for consideration, compared to the 1,722 claims submitted in 2011. At the end of 2012, the value of claims requests that were still under consideration was $11 million (2011 – $315 million). For a breakdown of claims by size concentration, refer to Table 10 in Supplemental Information. | |
Policy and Claims Liabilities | |
At the end of 2012, the policy and claims liabilities were $583 million. The liability net of the reinsurers’ share was $493 million, a decrease of $253 million from 2011. Contributing to the decline was the impact of changes in portfolio composition in addition to the $300 million claim charge in our political risk program that was identified in 2011. | | 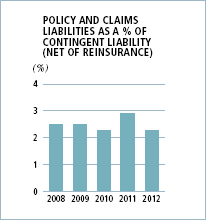 |
Changes in portfolio composition also impacted the calculation for potential claims on insurance policies that we have ceded to reinsurance companies, reducing the amount to $90 million from $129 million in 2011. This amount, recorded as an asset on the consolidated statement of financial position, represents the reinsurers’ share of our policy and claims liabilities and is also included in our policy and claims liabilities. If we were required to pay out a claim on these policies we could recover from the reinsurer depending on the terms of the agreement. | |
Due to the factors discussed above, the net policy and claims liabilities as a percentage of the contingent liability related to insurance policies and guarantees fell to 2.3% in 2012 compared to 2.9% in 2011. | |
|
EDC Annual Report 2012 | 59 |
MANAGEMENT’S DISCUSSION AND ANALYSIS
As permitted by International Financial Reporting Standard 7 – Financial Instruments: Disclosures, we have displayed certain parts of our Management’s Discussion and Analysis which discuss the nature, extent and management of credit, liquidity and market risks in a green font. These disclosures form an integral part of our audited Consolidated Financial Statements for the year end December 31, 2012.
MARKETABLE SECURITIES AND DERIVATIVE INSTRUMENTS
The Department of Finance sets out guidelines that define the minimum acceptable counterparty credit rating pertaining to our marketable securities and derivative instruments. In addition, we have policies which are reviewed periodically, and procedures that establish credit limits for each counterparty, which are reviewed by management no less than annually. These policies and procedures are designed to limit and manage the credit risk associated with these financial instruments.
Our interest-bearing deposits and marketable securities portfolio expose us to the risk that the deposit-taking institutions or counterparty will not repay us in accordance with contractual terms. Our potential deposit and marketable securities credit exposure is represented by the carrying value of the financial instruments.
The following table provides a breakdown, by credit rating and term to maturity, of our deposits and marketable securities credit exposure:
| | | | | | | | | | | | | | | | | | |
| (in millions of Canadian dollars) | | | | | | | | | | | | | | |
| | | Remaining term to maturity | | | 2012 | | | 2011 |
| Credit rating | | Under 1 year | | | 1 to 3 years | | | Over 3 years | | | Exposure | | | Exposure |
AAA | | | 1,344 | | | | 787 | | | | 1,230 | | | | 3,361 | | | 3,169 |
AA | | | – | | | | – | | | | 10 | | | | 10 | | | 15 |
AA- | | | 436 | | | | 21 | | | | – | | | | 457 | | | 453 |
A+ | | | 308 | | | | 6 | | | | 8 | | | | 322 | | | 130 |
A | | | – | | | | – | | | | – | | | | – | | | 15 |
A- | | | 26 | | | | 22 | | | | – | | | | 48 | | | 82 |
BBB+ | | | 38 | | | | – | | | | – | | | | 38 | | | 22 |
Total | | | $2,152 | | | | $836 | | | | $1,248 | | | | $4,236 | | | $3,886 |
Derivatives expose us to the risk that the counterparty will not repay us in accordance with contractual terms. Our potential derivative credit exposure is represented by the replacement cost of contracts that have a positive fair value. For a more in-depth discussion on the use of derivative instruments, refer to the section on derivative instruments (see page 69).
All swaps are transacted with high credit quality financial institutions. We operate a collateral program to mitigate credit exposure related to swaps used to hedge risk within our funding program. As market rates move between the settlement date and maturity date of the swap, the financial instrument attains value such that to terminate the swap early, one counterparty would need to make a payment to the other to compensate for the movement in rates. In order to mitigate the credit risk, we often enter into collateral agreements with financial institutions with whom we undertake swap transactions. Under the terms of the swap agreements, when the credit exposure surpasses an agreed upon threshold, collateral in the form of government securities is posted with an independent third party by our swap counterparty. At the end of December 2012, $979 million was posted as collateral by our counterparties to mitigate credit risk associated with swap agreements.
The following table provides a breakdown, by credit rating and term to maturity, of our derivative credit exposure and how it is offset against exposure netting amounts and collateral held. Exposure netting amounts represent derivative contracts where there is an agreement with the counterparty (netting agreement) that allows us to offset the counterparty’s derivative credit exposure to us against our credit exposure to that same counterparty. After applying both exposure netting and collateral held our net exposure is $335 million (2011 – $643 million).
|
| 60 | Adapting to the New Reality |
| | | | | | | | | | | | | | | | | | | | | | | | | | | | | | |
| (in millions of Canadian dollars) |
| | | Remaining term to maturity | | | Gross | | | Exposure | | | Collateral | | | 2012 Net | | | 2011 Net |
| Credit rating | | Under 1 year | | | 1 to 3 years | | | Over 3 years | | | exposure | | | netting* | | | held | | | exposure | | | exposure |
AA- | | | 62 | | | | 601 | | | | 335 | | | | 998 | | | | (31 | ) | | | (703 | ) | | | 264 | | | 459 |
A+ | | | 18 | | | | 50 | | | | 51 | | | | 119 | | | | (7 | ) | | | (66 | ) | | | 46 | | | 94 |
A | | | 25 | | | | 51 | | | | 26 | | | | 102 | | | | – | | | | (89 | ) | | | 13 | | | 25 |
A- | | | – | | | | 34 | | | | 81 | | | | 115 | | | | – | | | | (98 | ) | | | 17 | | | 61 |
BBB+ | | | – | | | | 11 | | | | – | | | | 11 | | | | – | | | | (14 | ) | | | (3) | | | (3) |
BBB | | | – | | | | 7 | | | | – | | | | 7 | | | | – | | | | (9 | ) | | | (2) | | | 7 |
Total | | | $105 | | | | $754 | | | | $493 | | | | $1,352 | | | | $(38 | ) | | | $(979 | ) | | | $335 | | | $643 |
* As a result of netting agreements.
Credit risk for marketable securities and derivative instruments is reported on a quarterly basis to the Asset Liability Management Committee and to the Risk Management Committee of the Board.
Capital Management
Our capital management framework ensures that we are appropriately capitalized and that our capital position is identified, measured, managed, and regularly reported to the Board. Being appropriately capitalized has allowed us to fulfill our mandate and sustain continued risk capacity for Canadian exporters and investors despite a more challenging credit environment.
We target a level of capitalization sufficient to cover potential losses consistent with a rating standard of AA. This solvency standard aligns with that of leading financial institutions and with the key principles of financial self-sufficiency.
We define capital supply as the sum of total equity and allowances, as determined in accordance with IFRS. We quantify demand for capital arising from credit, market, operational and business risks using methodologies that are generally consistent with Basel II standards. Capital adequacy is determined by comparing supply of capital to demand for capital.
We measure and report changes to capital supply, capital demand and its implied solvency rating to executive management monthly. These capital measures are reported to the Board quarterly together with forward looking stress tests which model the potential impact on capital of portfolio migration and other key risk events.
| | | | | | |
| (in millions of Canadian dollars) | | 2012 | | | 2011 |
Demand for capital | | | | | | |
Credit risk | | | 6,391 | | | 6,598 |
Market risk | | | 799 | | | 1,055 |
Operational risk | | | 378 | | | 390 |
Business risk | | | – | | | 228 |
Strategic risk | | | – | | | 542 |
Total demand for capital | | | $7,568 | | | $8,813 |
Supply of capital | | | $10,820 | | | $10,836 |
EDC implied solvency rating | | | AAA | | | AAA |
Our capital is first and foremost available to support Canadian exporters and investors for the benefit of Canada. While it is our intention to fully utilize our capital in support of our mandate there may be situations in which the Board of Directors may wish to authorize a dividend payment. As such our Capital Adequacy Policy includes a dividend methodology to guide the Board of Directors in determining a potential dividend amount.
In 2012 the Capital Adequacy Policy was updated to reflect the removal of strategic risk capital from the demand calculation. Strategic risk was designated for facilitating higher risk business opportunities outside of our typical operational norm. Due to its unallocated nature, the strategic risk component was removed when EDC revised its dividend methodology. Instead, demand for specifically allocated capital is now a component of our eligible dividend methodology along with a standard set of stress tests and a foreign exchange sensitivity.
At the end of December 2012, the capital demand for business risk was reduced to zero. Business risk is a proxy for volatility in our net income on a monthly basis over a five-year period. Our monthly net income has become more stable over this period, such that the demand for capital for business risk has now fallen to zero.
We strive to ensure that our risk and capital management policies are aligned with industry standards and are appropriately sophisticated relative to our risk profile and business operations.
|
EDC Annual Report 2012 | 61 |
MANAGEMENT’S DISCUSSION AND ANALYSIS
Off Balance Sheet Arrangements
In the normal course of business, we engage in a variety of transactions with special purpose entities (SPEs). SPEs are generally created for a single purpose, have a limited lifespan and are used for risk management, legal, or taxation reasons to hold specific assets for its benefactors. These transactions are generally undertaken for risk, capital and funding management purposes that benefit our clients. In accordance with IFRS, those SPEs where we are not exposed, or have rights, to variable returns from our involvement with the SPE and do not have decision-making power to affect the returns of the SPE, have not been consolidated on our statement of financial position.
In certain financing transactions, SPEs are used to securitize assets and are typically highly debt-leveraged and, in certain circumstances, equity guarantees may also be used. EDC may also use SPEs to hold assets that have been foreclosed upon and cannot be held directly for legal or taxation reasons, typically for foreclosed assets in foreign countries.
Financial Instruments
Given the nature of our business, our assets and liabilities are substantially composed of financial instruments. Financial instrument assets include cash resources, securities, investments, loans and recoverable insurance claims, while financial instrument liabilities include accounts payable, loans and loan guarantees. We also use a variety of derivative instruments including interest rate swaps, cross currency interest rate swaps, foreign exchange swaps, foreign exchange forwards, non-deliverable forwards, non-deliverable foreign exchange swaps and credit default swaps.
In accordance with IFRS, the majority of financial instruments are recognized on the statement of financial position at their fair value. These financial instruments include marketable securities at fair value through profit or loss, investments at fair value through profit or loss, derivative instruments and loans payable designated at fair value through profit or loss. Note 2 of the consolidated financial statements outlines the accounting treatment for our financial instruments while Note 28 provides details of how their fair values are determined.
We use derivatives to manage interest rate risk, foreign exchange risk and credit risk. These derivatives are only contracted with creditworthy counterparties in accordance with policies established in the Risk Management Office and approved by our Board of Directors. Both our internal policies and guidelines and those set by the Minister of Finance limit our use of derivatives. We do not use derivatives for speculative purposes. We manage our exposure to derivative counterparty credit risk by contracting only with creditworthy counterparties, and in certain cases entering into collateral agreements with those counterparties. For further discussion on our risk management framework, refer to the Risk Management discussion on the following pages.
62 | Adapting to the New Reality
| | | | |

Pierre Gignac SVP and Chief Risk Officer, Enterprise Risk Management | | | | RISK MANAGEMENT “Risk Management at EDC took on a new, expanded look in 2012 as the traditional risk management functions of credit risk, market risk and capital management were brought together with EDC’s Legal and Corporate Security departments under the newly formed Enterprise Risk Management Office. I was tasked with heading up this new group in its inaugural year. Given the continued uncertainty in global financial markets, the timing was ideal to bring a new, enterprise-wide focus to risk management, facilitated by strong involvement by EDC’s Board of Directors.” |
A continued focus by global financial markets on slow economic growth and uncertainty, as well as impending regulatory change led to retrenchment in the lending space by many financial institutions during 2012. This meant a shift in the financial intermediation role for EDC toward areas of small to medium sized businesses (an area of focus for EDC), corporate revolvers (as foreign banks in Canada exited the space) and large project financings (as major bank lenders retreated from the space). In contrast, EDC’s insurance underwriting volumes declined in 2012 as several large corporate customers increased their own risk appetite and elected to self insure.
EDC also encountered some challenges in its loan portfolio, particularly in the aerospace sector as the bankruptcy filings of American Airlines, Inc., Pinnacle Airlines, Inc. and Hawker Beechcraft, Inc., among others, ran their course. As well, EDC had the largest political risk insurance (PRI) claim charge in its history as a result of the turmoil in North Africa and the Middle East. Despite this, credit portfolios on the whole are now relatively healthy.
Much progress was made in the continued effort to keep pace with leading practice in risk management as EDC added resources and focus to the areas of internally generated risk ratings, stress testing and Enterprise Risk Management (ERM).
EDC engaged the services of a large global consulting firm to perform a “pulse check” on our ERM process and assist us in elevating the practice to better suit an institution of our size and complexity. This has led to the development of a road map toward an overarching Enterprise Risk Management framework, which is under development during 2013. EDC also conducted a more robust macro stress testing exercise in 2012, stress testing our capital adequacy and income based on pre-set macro-economic scenarios. This will be further expanded in 2013.
We also continued the rollout of our new internally modelled credit rating system, which will allow EDC to model probability of default (PD) and loss given default (LGD) ratings for the majority of our loan and guarantee exposures. A multi-year project, implementation of this system will be completed during 2013.
Risk Management continues to be a key point of focus at EDC as we attempt to balance our mandate to facilitate and create trade for Canada with the financial sustainability that allows us to continue to carry out this mandate for many years to come.
|
EDC Annual Report 2012 | 63 |
MANAGEMENT’S DISCUSSION AND ANALYSIS
Risk Management Overview
Our business activities expose us to a wide variety of risks including credit, market, operational, organizational and business risks. Our ability to manage these risks is a key competency within the organization, and is supported by a strong risk culture and an effective risk management approach. We manage our risks by seeking to ensure that business activities and transactions provide an appropriate balance of return for the risks assumed and remain within our risk tolerance.
Our Risk Management practice sets out the major risk categories and identifies and defines a broad number of risks to which our businesses and operations could be exposed. This gives us an overall view of all potential risks faced by EDC; and forms the foundation for appropriate risk oversight processes, communication and reporting.
Risk identification and measurement are important elements of our Risk Management practice. We have enterprise-wide methodologies, models and techniques in place to measure both the quantitative and qualitative aspects of risks, appropriate for the various types of risks we face. These methodologies, models and techniques are subject to periodic assessment and review for appropriateness and reliability. Through an annual risk survey, involving interviews with management, we are able to identify and proactively address emerging risks and opportunities.
We also use techniques such as sensitivity analysis and stress testing to help ensure that the risks remain within our risk tolerance and that our capital is adequate to cover those risks. Our stress testing program includes evaluation of the potential effects of severe but plausible economic and market scenarios on our risk profile.
We continue to build upon our risk management foundation and strive for continuous improvement. Efforts are currently underway to enhance our risk management infrastructure, processes and capabilities. We believe that the steps we have taken and the initiatives we continue to pursue position us to successfully execute on our business strategy.
Portfolio Risk Profile
While EDC follows leading risk management practice, we generally assume more risk than a typical financial institution due to our mandate. We take on larger single counterparty exposures and larger concentration exposures by sector than other financial institutions, most notably in the transportation and extractive sectors which lead Canadian exports.
Despite significant commitments to investment grade borrowers in 2012, the vast majority of EDC’s risk profile, as determined by capital demand for credit risk, emanates from the sub-investment grade space. As can be seen in the chart below, although only 47% of EDC’s loan portfolio is sub-investment grade, 90% of capital demand (credit risk) is attributable to this category of obligor.
| | | | | | | | | | | | | | | | |
| (in billions of Canadian dollars) | | Notional exposure | | | % of total | | | Demand for capital (credit risk) | | | % of total | |
Investment grade | | | 24.6 | | | | 53 | | | | 0.5 | | | | 10 | |
Sub-investment grade | | | 22.2 | | | | 47 | | | | 4.7 | | | | 90 | |
Total | | | $46.8 | | | | 100 | | | | $5.2 | | | | 100 | |
EDC’s large exposure concentrations reflect the significance of the sectors noted above to Canada’s economy and EDC’s mandate to help Canadian exporters. In order to mitigate this risk, EDC carries a large capital base and conducts a semi-annual stress testing exercise to test its resilience to downside event risk.
64 | Adapting to the New Reality
Risk Governance Structure
Our risk governance structure emphasizes and balances strong central oversight and control of risk with clear accountability for, and ownership of, risk within each business unit. This structure supports the flow of information between the business units, the members of the Executive Team, who represent each significant business unit and corporate oversight function, the President and Chief Executive Officer (CEO), and the Board of Directors.
Board and its Committees
Board of Directors
The Board of Directors (the Board) provides oversight and carries out its mandate with respect to risk and capital management through the Risk Management Committee of the Board and the Audit Committee of the Board. The Board maintains overall responsibility for approval of (i) risk management and accounting policies and (ii) our Code of Business Ethics and Code of Conduct and (iii) the Environmental Review Directive. The Board also maintains oversight responsibilities for the management of the credit, market and other enterprise risks of the Corporation, as well as oversight of the appropriateness of internal control systems and policies governing Corporate Social Responsibility.
Risk Management Committee of the Board
This Committee assists the Board in fulfilling its oversight responsibilities with respect to the prudent management of our capital structure, including the management of the credit, market and other enterprise risks of the Corporation.
Audit Committee of the Board
This Committee assists the Board in fulfilling its oversight responsibilities with respect to our standards of integrity and behaviour, financial reporting and internal control systems. The Audit Committee also monitors our corporate compliance program.
Key Risk Committees
Executive Management Team
The Executive Management team, led by the President and CEO and including the executives reporting directly to the President and CEO, has primary responsibility for the management of our risks, standards of integrity and behaviour, financial reporting and internal control systems. The Executive Management team undertakes this responsibility through various management oversight committees, by ensuring an appropriate organizational structure and governing policies are in place and through independent validation by audit.
Management Risk Management Committee
This Committee provides an independent endorsement as to the acceptability of certain credit commitments and acts as the authority for recommending risk policies to the Board for approval and establishing internal risk management policies and procedures.
Asset Liability Management Committee
This Committee acts as authority for recommending Market Risk Management policies to the Board for approval and ensuring that policies are supported by appropriate procedures and practices for the measurement, management and reporting of market risk. In addition, the Committee ensures that market risk positions are managed within policy limits and addresses such risk practices as diversification requirements and reporting and monitoring of guidelines.
Risk Transfer Committee
This Committee acts as authority to endorse recommendations for certain risk transfer activities for portfolio management purposes.
Key Risk Management Groups
Enterprise Risk Management (ERM) Group
The ERM Group is headed by the SVP and Chief Risk Officer, Enterprise Risk Management, and provides independent oversight and governance with respect to risk identification, measurement, control, monitoring and reporting. The Risk Management Office (RMO) as part of the ERM Group works with the business segments and other corporate oversight groups to establish policies, standards, and limits that align with EDC’s risk tolerance and monitors and reports on existing and emerging risks and compliance with EDC’s risk tolerance. The RMO provides a framework for relating risks to capital requirements through capital modeling and stress testing practices and helps determine EDC’s capital adequacy requirements.
|
EDC Annual Report 2012 | 65 |
MANAGEMENT’S DISCUSSION AND ANALYSIS
Corporate Finance and Control (CFC)
CFC is responsible for financial planning, accounting and financial reporting. CFC ensures that appropriate controls exist to ensure complete and accurate financial reporting.
Internal Audit (IA)
IA independently monitors and reports on the effectiveness, adequacy and sustainability of business processes, risk management processes and related internal controls used by management to achieve our business objectives. All activities of the organization are within the scope of the internal audit group’s responsibility. IA uses a risk-based audit methodology that is reflective of the Institute of Internal Auditors standards, incorporates Enterprise Risk Management and includes input from management.
Business Units
Business units are accountable for management and control of significant risks to which they are exposed. Business units work in partnership with the RMO to ensure that credit and market risks arising from their business are managed within approved limits as set out in risk policies.
Credit Risk Management
Credit risk is the risk of loss incurred if a counterparty fails to meet its financial commitments. We are exposed to credit risk under our loans and insurance programs and treasury activities.
We manage credit risk in the organization through policy requirements, established authorities and limits, mitigation activities and reporting. Our credit risk policies set out our requirements on credit granting, concentration, counterparty and country limits, risk rating, exposure measurement, monitoring and review, portfolio management and risk transfer, as well as management and Board reporting.
Credit Granting
We deliver our products and services through sector-based business teams grouped under insurance or financing. The business teams are responsible for the proper due diligence associated with each credit commitment. Every credit commitment requires recommendation and approval. Credit commitments in excess of certain thresholds also require independent endorsement or co-authorization by the RMO or the Management Risk Management Committee. The purpose of endorsement or co-authorization is to ensure that all relevant, tangible risks in the proposed credit commitment have been identified, assessed and mitigated where possible. The credit rating of a transaction and/or the dollar amount of exposure at risk determines whether involvement is required by the Management Risk Management Committee or the RMO. All transactions above U.S. $300 million require authorization by the Board. However, this threshold can be reduced to as low as U.S. $200 million for transactions with lower credit quality. Our credit approval process includes early involvement of a senior management committee in the transaction review process and more integrated engagement on transactions between our risk management, underwriting and business development professionals.
Our approval responsibilities are governed by delegated authorities. The Board in effect delegates specific transactional approval authorities to the CEO. Onward delegation of authority by the CEO to business units is controlled to ensure decision-making authorities are restricted to those individuals with the necessary experience levels. The criteria whereby these authorities may be further delegated throughout the organization, as well as the requirements relating to documentation, communication and monitoring of delegated authorities, are set out in corporate policies and standards.
We bear counterparty risk through our treasury liquidity and derivative portfolios. Treasury counterparties are analyzed and credit limits are recommended by Market Risk Management (MRM), a team within the RMO. Recommended counterparties are endorsed by either the RMO or Management Risk Management Committee. Every treasury credit commitment requires the approval of at least two individuals with delegated approval authority. All treasury credit exposures are measured on a fair value basis and compliance with policy and operational limits is measured daily. In addition, we have policies and procedures in place to limit and to manage the credit risk associated with these financial instruments and to define collateral requirements for treasury counterparties.
Concentration Limits
To ensure diversification of risks within our credit commitments, we have established risk limits in place to protect against being overly concentrated to any one country, industry sector or commercial obligor. All limits are determined based on our capital base and risk factors associated with the exposure including the obligor rating, country rating, associated collateral and EDC product type. Exposures beyond the risk limits require either Presidential approval within discretionary limits or review by the Risk Management Committee and approval of the Board.
|
| 66 | Adapting to the New Reality |
Risk Ratings
In 2011, EDC initiated a multi-year project to develop an internal credit risk rating system that measures obligor and transaction risks. The implementation is following a phased-in approach and will be fully completed in 2013. This new risk rating system utilizes an 18 point rating scale to differentiate the risk of default of obligors and a 6 point rating scale to differentiate the risk of loss on transactions. While our obligor rating will be arrived at independently of external ratings for the obligor, our risk-rating methodology will include a review of those external ratings.
For those obligors not yet transitioned, we continue to use our existing process. Many of the obligor risk rating methodologies use a combination of Moody’s and/or Standard & Poor’s external ratings and/or our internal ratings based (IRB) methodologies. Some of our IRB methodologies use vendor provided credit risk analysis/ratings tools such as Moody’s Financial Analyst, Risk Advisor and RiskCalc. At the credit granting stage, all obligors are rated except for obligors with very small exposures (typically representing less than 1% of total exposure). We rate our obligors on a rating scale of between 8 and 18 credit grades depending on the product type. The obligor risk ratings are reviewed on a regular basis.
Consistent with the Basel II Advanced Internal Rating-Based approach, credit risk is measured by assigning (i) a risk rating to an obligor that is tied to a probability of default (PD). The PD describes the likelihood of a default of an obligor over a one year period, and (ii) a rating to a transaction in the form of a loss given default (LGD) estimate. The LGD estimates the percentage of dollar exposure which EDC reasonably expects to lose should a default occur on a specific transaction.
Our Economics team is responsible for establishing, monitoring and approving country risk ratings. Country risk ratings are continually reviewed to take into consideration any changes in the world environment or a specific country.
For treasury related counterparties, each counterparty must be rated by at least two external rating agencies for credit exposure of greater than one year term to maturity and at least one external rating agency for credit exposure of less than one year term to maturity. The risk rating for treasury counterparties is based on the external ratings.
Exposure Measurement
To ensure that the level of credit risk is transparent to both management and the Board, our credit exposure measurement guideline requires information reporting and comparison of the aggregated exposures within a portfolio against prescribed limits such as country, industry, and commercial obligor. We also report on approved short-term buyer limits under our accounts receivable insurance program.
Monitoring and Review
Our operating practices include ongoing monitoring of credit exposures. Specialized teams have been created to monitor and manage credit exposure within the different product lines which include monitoring of events in the country and industry of the obligor. The Credit Risk Management team within the RMO is responsible for managing the credit quality and financial performance of our portfolio of commercial loans and guarantees both at the transaction and portfolio levels. This specialized team undertakes loan reviews, assesses risk ratings and regularly monitors borrowers and the credit risk environment including research and assessment of financial, operating and industry trends. Our portfolio of credit insurance counterparties is actively monitored by our Risk Assessment and Portfolio Management team. In addition, deteriorating credits are managed by teams that specialize in restructurings, Paris Club reschedulings, claims and recoveries. Management and the Board are frequently apprised on the credit quality of the portfolio through regular reporting including detailed quarterly reporting on the breakdown of the portfolio by risk ratings, impaired obligors, loan write-offs and claims information.
Portfolio Management
The goal of portfolio management is to ensure our ability to pursue mandate related opportunities while taking into consideration the availability of financial resources and limit constraints. Management and the Board are regularly updated on our portfolio of credit exposures through quarterly compliance reporting against concentration limits. We use both primary and secondary portfolio management activities to address imbalances or excess concentrations including, but not limited to, syndication at credit origination, the sale of assets, insurance, reinsurance and hedging using credit derivatives.
We continue to make use of credit derivatives for risk mitigation purposes targeting large exposures in our loan portfolio. To address credit concentration in our insurance portfolios we engage in various risk transfer activities primarily through reinsurance and co-insurance.
Management and Board Reporting
The RMO provides timely and comprehensive risk reporting to management and the Board on major risks being assumed by or facing EDC, enabling appropriate management and oversight. This reporting includes, but is not limited to a (i) quarterly risk management report, (ii) monthly credit risk policy compliance report, (iii) monthly capital adequacy report and (iv) monthly report detailing our liquidity position. Ad-hoc risk reporting is provided to senior management and the Board as warranted for new or emerging risk issues or significant changes in our level of risk. Significant credit risk issues and action plans are tracked and reported to ensure management accountability and attention are maintained.
|
EDC Annual Report 2012 | 67 |
MANAGEMENT’S DISCUSSION AND ANALYSIS
Market Risk Management
Market risk is the risk that the fair value or future cash flows of a financial instrument will fluctuate because of changes in market prices. Market risk comprises three types of risk: foreign exchange risk, interest rate risk and other price risk. We are exposed to potential losses as a result of movements in interest and foreign exchange rates.
Through our policies and procedures, we ensure that market risks are identified, measured, managed and regularly reported to management and the Board. Our Market Risk Management Policy sets out our requirements on interest rate and foreign exchange exposure limits, liquidity, investment, debt funding, derivatives and structured notes, management of the credit risk for treasury counterparties and management and Board reporting. The Asset Liability Management Committee, which is chaired by the Chief Financial Officer, oversees and directs the management of market risks inherent within our normal business activities. Risk oversight is provided by the MRM team within the RMO.
Interest Rate Risk
Interest rate risk is the risk that the fair value or future cash flows of a financial instrument will fluctuate because of changes in market interest rates. We are exposed to potential adverse impacts on the value of financial instruments resulting from differences in the maturities or repricing dates of assets and liabilities both on and off-balance sheet, as well as from embedded optionality in those assets and liabilities.
Our interest rate risk is managed in accordance with guidelines established by the Department of Finance as well as policies set by the Board. We report interest rate risk on a quarterly basis to the Asset Liability Management Committee and to the Risk Management Committee of the Board.
Our interest rate risk policy limits are tested on a monthly basis to ensure compliance with our policy. Interest rate risk is measured by simulating the impact of a 100 basis point change on our net financing and investment income.
Interest Rate Sensitivity
The table below presents the sensitivity of the net financing and investment income and net income to a parallel 100 basis point change in interest rates given the outstanding positions as at December 31, 2012:
Interest Rate Change
| | | | | | | | | | | | | | | | |
| (in millions of Canadian dollars) | | | | | 2012 | | | | | | 2011 | |
| | | +100 Basis Points | | | -100 Basis Points | | | +100 Basis Points | | | -100 Basis Points | |
Change in net financing and investment income | | | (21 | ) | | | 21 | | | | (11 | ) | | | 11 | |
Change in net income | | | (34 | ) | | | 61 | | | | (93 | ) | | | 92 | |
Foreign Exchange Risk
Foreign exchange risk is the potential adverse impact on the value of financial instruments resulting from exchange rate movements. We are exposed to foreign exchange rate risk when there is a mismatch between assets and liabilities in any currency.
Our foreign exchange risk is managed in accordance with guidelines established by the Department of Finance as well as policies approved by the Board. We report our foreign exchange risk on a quarterly basis to the Asset Liability Management Committee and to the Risk Management Committee of the Board.
In addition to the guidelines and policies described above, we also have supplemental operational limits and reporting requirements. Management of foreign exchange risk is enabled through monthly risk position monitoring and reporting.
As per our policy, the potential translation loss impact to one month’s net financing and investment income (NFII) as measured by a two standard deviation change in foreign exchange rates is limited to 2.5% of projected 12 month NFII, on a consolidated Canadian dollar equivalent.
As the table below indicates, we were onside our policy as at December 31, 2012; however, at the end of 2011 we were offside. This exception occurred due to a post-closing accounting adjustment which opened a foreign exchange exposure which was immediately closed bringing our exposure to an onside position.
Foreign Exchange Positions against Limit
| | | | | | | | |
| (in millions of Canadian dollars) | | 2012 | | | 2011 | |
Limit | | | 26 | | | | 23 | |
Position | | | 17 | | | | 26 | |
|
| 68 | Adapting to the New Reality |
The table below presents the sensitivity of net income to changes in the value of the Canadian dollar versus the other currencies we are exposed to given the outstanding positions as at December 31, 2012:
Canadian Dollar Relative to Other Currencies
| | | | | | | | | | | | | | | | |
| (in millions of Canadian dollars) | | | | | 2012 | | | | | | 2011 | |
| | | Increases by 1% | | | Decreases by 1% | | | Increases by 1% | | | Decreases by 1% | |
Change in net income | | | 2 | | | | (2) | | | | 3 | | | | (3 | ) |
Derivative Instruments
We use a variety of derivative instruments to manage costs, returns and levels of financial risk associated with funding, investment and risk management activities. The principal purpose for which we use derivative instruments is to hedge against foreign exchange and interest rate risk. Our use of derivative instruments may include, but is not restricted to, currency and interest rate swaps, foreign exchange swaps, credit default swaps, futures and options. We do not use derivative instruments for speculative purposes.
We do not engage in the use of derivative instruments whose value and financial risks cannot be measured, monitored and managed on a timely basis. The MRM team formally reviews our derivative instrument transactions at time of inception, and on an ongoing basis to provide an independent verification on the valuation of transaction structures and of associated financial risks.
Derivative instruments are used to hedge risks by diversifying concentrated exposures. For example, we may balance the proportion of fixed to floating assets in our portfolio using interest rate swaps in order to diversify interest rate risk.
The following table indicates the fair value of our derivative instruments based upon maturity:
| | | | | | | | | | | | |
| (in millions of Canadian dollars) | | Positive | | | Negative | | | Net | |
Less than 1 year | | | 105 | | | | (60 | ) | | | 45 | |
1 – 3 years | | | 754 | | | | (33 | ) | | | 721 | |
Over 3 – 5 years | | | 381 | | | | (13 | ) | | | 368 | |
Over 5 years | | | 112 | | | | (14 | ) | | | 98 | |
Gross fair value of contracts | | | $1,352 | | | | $(120 | ) | | | $1,232 | |
Liquidity Risk Management
Liquidity risk is the risk that we would be unable to honour daily cash outflow commitments or the risk that we would have to obtain funds rapidly, possibly at an excessively high premium during severe market conditions. Liquidity risk arises from two sources: mismatched cash flows related to assets and liabilities and liquidity risk due to the inability to sell marketable securities in a timely and cost effective manner.
Our treasury department is responsible for our liquidity management and the MRM team is responsible for monitoring compliance with our policies and procedures. Pursuant to our risk management policies, we must maintain sufficient liquidity to meet a prescribed minimum level, based on forecasted cash requirements.
Within the overall policy framework, we manage our liquidity risk both within the overall policy limits and also within supplemental limits. The MRM team measures our position on a daily basis and provides a monthly report to senior management on our actual liquidity position against this minimum limit, as well as a quarterly report to the Risk Management Committee of the Board.
We maintain liquidity through a variety of methods:
| | u | | Cash and Marketable Securities: We hold cash and marketable securities to ensure that sufficient liquidity is available if required to meet forecasted cash requirements. During 2012, the average balance of cash and marketable securities was $4,015 million. |
| | u | | Access to Commercial Paper Markets: In the course of our normal activities, our commercial paper programs provide us with the necessary liquidity to meet our cash requirements on a daily basis. During 2012, the average balance of commercial paper was $3,642 million. |
|
EDC Annual Report 2012 | 69 |
MANAGEMENT’S DISCUSSION AND ANALYSIS
Investment Risk
The Investment Policy defines the investments that we may undertake in the market place by instrument type. The investment of corporate cash holdings is governed by Section 10(1.1)(h) of the Export Development Act, Section 128 of the Financial Administration Act, and the Corporation’s Investment Authorities approved by the Minister of Finance.
Debt Funding
The Export Development Act places limitations on our borrowings. The Act allows us to borrow and have outstanding borrowings up to a maximum of 15 times the aggregate of (a) our current paid-in capital and (b) our retained earnings determined in accordance with the previous year’s audited financial statements.
The Minister of Finance, pursuant to the requirements of the Financial Administration Act, annually approves the borrowings of the Corporation. The Debt Funding Policy is monitored on a monthly basis and reported to management and the Board on a quarterly basis.
Contractual Obligations
In the normal course of business, we enter into contracts that give rise to commitments of future minimum payments.
Future payments on our long-term debt and our other long-term payable over the next five years are depicted below.
We have two types of loan commitments. The first type is undisbursed amounts on signed loan agreements. The second type represents commitments we entered into, for which terms related to the transaction such as interest rate type and disbursement schedule have not yet been determined. This category includes letters of offer accepted and outstanding for loans as well as unallocated, confirmed lines of credit (LOC).
Purchase obligations include those obligations that are legally binding agreements whereby we have agreed to purchase products or services with specific minimum quantities defined as fixed, minimum or variable in price over a specified period of time.
The following table provides a summary of our future payments on contractual commitments:
| | | | | | | | | | | | | | | | | | | | | | | | |
| (in millions of Canadian dollars) | | Under 1 year | | | 1 to 3 years | | | Over 3 to 5
years | | | Over 5 years | | | 2012 Total | | | 2011 Total | |
Long-term debt | | | 5,843 | | | | 10,820 | | | | 4,883 | | | | 1,496 | | | | 23,042 | | | | 22,857 | |
Other long-term payable | | | 6 | | | | 13 | | | | 13 | | | | 30 | | | | 62 | | | | 68 | |
Undisbursed loan commitments | | | 13,382 | | | | – | | | | – | | | | – | | | | 13,382 | | | | 9,722 | |
Undisbursed investment commitments | | | 110 | | | | 25 | | | | 57 | | | | 225 | | | | 417 | | | | 283 | |
Letters of offer accepted and outstanding | | | 3,857 | | | | – | | | | – | | | | – | | | | 3,857 | | | | 2,022 | |
Confirmed LOC | | | 111 | | | | – | | | | – | | | | – | | | | 111 | | | | 410 | |
Leases | | | 25 | | | | 57 | | | | 62 | | | | 430 | | | | 574 | | | | 600 | |
Purchase obligations | | | 31 | | | | 9 | | | | – | | | | – | | | | 40 | | | | 36 | |
Total | | | $23,365 | | | | $10,924 | | | | $5,015 | | | | $2,181 | | | | $41,485 | | | | $35,998 | |
|
| 70 | Adapting to the New Reality |
Operational Risk Management
Operational risk is defined as the risk of direct or indirect loss resulting from the organizational environment, external events, inadequate internal processes, people or systems. Operational risk includes risk to our reputation and the risk of not meeting our mandate or regulatory requirements.
Operational risk is embedded in all our activities, including the practices and controls used to manage other risks. Operational risk is difficult to measure in a complete and precise manner, given that exposure to operational risk is often implicit, bundled with other risks, or otherwise not taken on intentionally.
Operational risk is managed through our infrastructure, controls, systems and people, complemented by specialist groups focusing on enterprise-wide management of specific operational risks such as fraud, privacy, outsourcing, business disruption, as well as people and systems risks. Specific programs, policies, standards and methodologies have been developed to support the management of operational risk.
Each business unit has responsibility for the day-to-day management of operational risk. Business unit management is responsible for ensuring that appropriate procedures, internal controls and processes are established to manage operational risks and to comply with corporate policies.
Operational risks driven by the use of technology and information are actively managed through enterprise-wide technology risk and information security programs. These programs include robust threat and vulnerability assessments, as well as disciplined change management practices.
Operational risks driven by people and processes are mitigated through human resources policies and practices, and a biennial Employee Opinion Survey. This survey provides us with a mechanism to gather employee input on climate conditions that enable or inhibit key drivers of performance. These results drive action plans to build on our strengths and support corporate values.
During incidents that could disrupt our business and operations, Business Continuity Management supports the ability of senior management to continue to manage and operate their businesses, and provide customers access to products and services. Our enterprise-wide business continuity management program includes formal crisis management protocols and continuity strategies. EDC tests business continuity plans designed to respond to a broad range of potential scenarios.
We continuously seek to strengthen our commitment to Corporate Social Responsibility (CSR), which is built on five essential pillars: business ethics, the environment, transparency, community investment and organizational climate. We have made a significant investment in time and resources on all of these fronts and have made CSR a central part of our ongoing business strategy. We recognize that growth and sustainability must be addressed simultaneously and that CSR is intrinsic to achieving sustainable trade. We strive to maximize Canadian exporter growth potential, while being conscientious of the environmental impacts of our business and acting in accordance with the highest ethical standards, as well as investing in our communities and our employees.
Our mandate guidelines ensure that we continue to respond to the needs of Canadian exporters and investors while satisfying our mandate. Issues of mandate that are unique or complex are referred to an internal legal committee.
The annual risk survey with management allows us to identify a broad spectrum of risks and facilitate the escalation of concerns related to operational risks to senior management for possible action.
Internal Audit’s independent review of processes provides additional assurance that operational risks are appropriately managed.
We also maintain a corporate insurance program to provide additional protection from loss.
|
EDC Annual Report 2012 | 71 |
MANAGEMENT’S DISCUSSION AND ANALYSIS
CRITICAL ACCOUNTING POLICIES AND ESTIMATES
A summary of our significant accounting policies can be found in Note 2 of our December 2012 consolidated financial statements. Judgment is required in the selection of accounting policies, and their application requires the use of estimates and assumptions to arrive at the reported carrying values of our assets and liabilities. We have established procedures to ensure that accounting policies are applied consistently and that the process for making changes to methodologies and assumptions is well controlled, and occurs in an appropriate and systematic manner. Areas where significant estimates are used include the allowance for losses on loans, loan commitments and guarantees, equipment available for lease, policy and claims liabilities, recoverable insurance claims, retirement benefit obligations and financial instruments measured at fair value. For details on our use of judgment and estimates refer to page 86 of this annual report.
Change in Accounting Standards
The International Accounting Standards Board (IASB) has issued a number of new standards and interpretations effective in coming years which are discussed in Note 2 of our consolidated financial statements. In addition, the IASB is currently working on projects related to financial instruments, insurance contracts, leases and revenue recognition. Revisions made to these standards could potentially have a significant impact on EDC’s financial statements in the coming years.
Non-IFRS Performance Measures
We use a number of financial measures to assess our performance. Some of these measures are not calculated in accordance with IFRS, and do not have standardized meanings under IFRS that would ensure consistency and comparability between companies using these measures. The following non-IFRS performance measures are referenced in this report:
Productivity Ratio (PR)
Management uses PR as a measure of EDC’s efficiency. This ratio represents administrative expenses expressed as a percentage of net revenue excluding debt relief.
Capital Adequacy
Capital adequacy is a measurement of the amount of capital required to cover the credit, market, operational and business risks we have undertaken compared to the existing capital base. See “Capital Management” section for details on the definition and calculation of capital adequacy.
Claims Ratio
The claims ratio expresses net claims incurred as a percentage of net written premium. Net claims incurred includes claims paid net of recoveries, estimated recoveries and changes in actuarial liabilities. The table below includes activities in the credit insurance program.
The actuarial change in the policy liabilities due to the impact of updated assumptions and changes in portfolio composition reduced net claims incurred in both 2012 and 2011; however, the decrease in 2012 was less significant. This has resulted in a higher claims ratio for 2012.
| | | | | | | | |
| (in thousands of Canadian dollars) | | 2012 | | | 2011 | |
Direct premiums | | | 108,196 | | | | 127,296 | |
Reinsurance assumed | | | 4,280 | | | | 4,615 | |
Reinsurance ceded | | | (6,267 | ) | | | (7,310 | ) |
Net written premium | | | $106,209 | | | | $124,601 | |
Net claims incurred | | | $4,365 | | | | $(12,070 | ) |
Claims ratio % | | | 4.11 | % | | | (9.69 | )% |
72 | Adapting to the New Reality
SUPPLEMENTAL INFORMATION
Table 1: Loan Interest Yield
| | | | | | | | | | | | | | | | | | | | |
| (in millions of Canadian dollars) | | 2012 | | | 2011 | | | 2010 | | | 2009 | | | 2008 | |
Gross loans receivable: | | | | | | | | | | | | | | | | | | | | |
Average performing floating rate | | | 20,304 | | | | 18,356 | | | | 17,518 | | | | 18,885 | | | | 13,635 | |
Average performing fixed rate | | | 7,655 | | | | 8,087 | | | | 8,229 | | | | 9,389 | | | | 8,747 | |
Total average performing gross loans receivable | | | 27,959 | | | | 26,443 | | | | 25,747 | | | | 28,274 | | | | 22,382 | |
Average carrying value on impaired loans | | | 1,149 | | | | 241 | | | | 326 | | | | 311 | | | | 294 | |
Total average income earning loan assets | | | $29,108 | | | | $26,684 | | | | $26,073 | | | | $28,585 | | | | $22,676 | |
Loan revenue: | | | | | | | | | | | | | | | | | | | | |
Performing floating rate interest | | | 551 | | | | 469 | | | | 440 | | | | 563 | | | | 672 | |
Performing fixed rate interest | | | 385 | | | | 425 | | | | 460 | | | | 561 | | | | 544 | |
Other loan revenue | | | 180 | | | | 115 | | | | 104 | | | | 197 | | | | 139 | |
Loan revenue | | | $1,116 | | | | $1,009 | | | | $1,004 | | | | $1,321 | | | | $1,355 | |
Yields – performing loans: | | | | | | | | | | | | | | | | | | | | |
Performing floating rate coupon | | | 2.71 | % | | | 2.56 | % | | | 2.51 | % | | | 2.98 | % | | | 4.93 | % |
Performing fixed rate coupon | | | 5.03 | % | | | 5.26 | % | | | 5.59 | % | | | 5.97 | % | | | 6.22 | % |
Total loan yield | | | 3.83 | % | | | 3.78 | % | | | 3.85 | % | | | 4.62 | % | | | 5.98 | % |
Table 2: Net Finance Margin
| | | | | | | | | | | | | | | | | | | | |
| (in millions of Canadian dollars) | | 2012 | | | 2011 | | | 2010 | | | 2009 | | | 2008 | |
Average performing loans receivable | | | 27,959 | | | | 26,443 | | | | 25,747 | | | | 28,274 | | | | 22,382 | |
Average carrying value on impaired loans | | | 1,149 | | | | 241 | | | | 326 | | | | 311 | | | | 294 | |
Average finance lease assets – aircraft | | | 85 | | | | 94 | | | | 108 | | | | 127 | | | | 128 | |
Average operating lease assets | | | 169 | | | | 98 | | | | 266 | | | | 439 | | | | 430 | |
Average marketable securities balance | | | 3,959 | | | | 3,551 | | | | 3,765 | | | | 4,085 | | | | 2,731 | |
Average investment portfolio balance | | | 433 | | | | 364 | | | | 290 | | | | 233 | | | | 151 | |
Total average income earning assets | | | $33,754 | | | | $30,791 | | | | $30,502 | | | | $33,469 | | | | $26,116 | |
Financing and investment revenue: | | | | | | | | | | | | | | | | | | | | |
Loan | | | 1,116 | | | | 1,009 | | | | 1,004 | | | | 1,321 | | | | 1,355 | |
Finance lease | | | 6 | | | | 7 | | | | 8 | | | | 9 | | | | 9 | |
Operating lease | | | 17 | | | | 21 | | | | 32 | | | | 32 | | | | 43 | |
Marketable securities | | | 36 | | | | 46 | | | | 47 | | | | 41 | | | | 81 | |
Investment | | | 4 | | | | 12 | | | | 8 | | | | 3 | | | | 2 | |
Total financing and investment revenue | | | 1,179 | | | | 1,095 | | | | 1,099 | | | | 1,406 | | | | 1,490 | |
Interest expense | | | 108 | | | | 93 | | | | 147 | | | | 381 | | | | 611 | |
Leasing and financing related expenses | | | 32 | | | | 32 | | | | 53 | | | | 68 | | | | 43 | |
Net financing and investment income* | | | $1,039 | | | | $970 | | | | $899 | | | | $957 | | | | $836 | |
Net finance margin | | | 3.08 | % | | | 3.15 | % | | | 2.95 | % | | | 2.86 | % | | | 3.20 | % |
* Excludes debt relief.
|
EDC Annual Report 2012 | 73 |
MANAGEMENT’S DISCUSSION AND ANALYSIS
Table 3: Insurance Premiums and Guarantee Fees
| | | | | | | | | | | | | | | | | | | | |
| (in millions of Canadian dollars) | | 2012 | | | 2011 | | | 2010 | | | 2009 | | | 2008 | |
Credit insurance program(1): | | | | | | | | | | | | | | | | | | | | |
Credit insurance business facilitated net of reinsurance | | | 53,106 | | | | 62,052 | | | | 51,151 | | | | 51,146 | | | | 56,355 | |
Premiums and fees earned | | | 108 | | | | 129 | | | | 118 | | | | 104 | | | | 97 | |
Average credit insurance premium rate % | | | 0.20 | % | | | 0.21 | % | | | 0.23 | % | | | 0.20 | % | | | 0.17 | % |
Financial institutions insurance program: | | | | | | | | | | | | | | | | | | | | |
Financial institutions insurance business facilitated | | | 9,295 | | | | 13,914 | | | | 8,324 | | | | 6,037 | | | | 5,124 | |
Premiums and fees earned | | | 18 | | | | 32 | | | | 27 | | | | 27 | | | | 20 | |
Average financial institutions insurance premium rate % | | | 0.19 | % | | | 0.23 | % | | | 0.32 | % | | | 0.45 | % | | | 0.39 | % |
Contract insurance and bonding program(2): | | | | | | | | | | | | | | | | | | | | |
Contract insurance and bonding average exposure | | | 8,303 | | | | 9,090 | | | | 9,892 | | | | 10,153 | | | | 8,961 | |
Premiums and fees earned | | | 48 | | | | 58 | | | | 51 | | | | 52 | | | | 42 | |
Average contract insurance and bonding premium rate % | | | 0.58 | % | | | 0.64 | % | | | 0.52 | % | | | 0.51 | % | | | 0.47 | % |
Political risk insurance program: | | | | | | | | | | | | | | | | | | | | |
Political risk insurance average exposure | | | 1,627 | | | | 1,625 | | | | 1,349 | | | | 1,388 | | | | 1,402 | |
Premiums and fees earned | | | 22 | | | | 15 | | | | 14 | | | | 14 | | | | 12 | |
Average political risk insurance premium rate % | | | 1.35 | % | | | 0.92 | % | | | 1.04 | % | | | 1.01 | % | | | 0.86 | % |
Loan guarantees: | | | | | | | | | | | | | | | | | | | | |
Loan guarantees average exposure | | | 2,476 | | | | 2,485 | | | | 3,368 | | | | 3,843 | | | | 3,539 | |
Loan guarantee fees earned | | | 38 | | | | 32 | | | | 33 | | | | 24 | | | | 20 | |
Average loan guarantee fee rate % | | | 1.53 | % | | | 1.29 | % | | | 0.98 | % | | | 0.62 | % | | | 0.57 | % |
|
(1) Includes $283 million of domestic business facilitated and $0.7 million of premiums in 2012 related to our temporarily expanded mandate. | |
(2) Includes $919 million of domestic exposure and $3.8 million of premiums in 2012 related to our temporarily expanded mandate. | |
Table 4: Provision for (Reversal of) Credit Losses | |
| |
| (in millions of Canadian dollars) | | 2012 | | | 2011 | | | 2010 | | | 2009 | | | 2008 | |
Provision for (reversal of) credit losses pertaining to: | | | | | | | | | | | | | | | | | | | | |
Loans | | | (263) | | | | 162 | | | | (234 | ) | | | 402 | | | | 249 | |
Loan commitments | | | 18 | | | | (53 | ) | | | (350 | ) | | | 1 | | | | 2 | |
Loan guarantees | | | (95) | | | | 16 | | | | (47 | ) | | | 28 | | | | 95 | |
Total provision for (reversal of) credit losses | | | $(340) | | | | $125 | | | | $(631 | ) | | | $431 | | | | $346 | |
|
| 74 | Adapting to the New Reality |
Table 5: Concentration of Exposure by Geographical Market
| | | | | | | | | | | | | | | | | | | | | | | | | | | | | | | | | | | | | | | | | | |
| | | Financing portfolio | | | | | Insurance portfolio | | | | | | | |
| | | | | | | | | | | | | | | | | Contract insurance and bonding | | | | | | Marketable | | | | |
| (in millions of Canadian dollars) | | Financing assets(1) | | | Commitments and guarantees(2) | | | | | Credit insurance | | | Financial institutions insurance | | | Policies | | | Guarantees | | | Political risk insurance | | | securities and derivative instruments (3) | | | 2012 Exposure | |
Country | | | | | | | | | | | | | | | | | | | | | | | | | | | | | | | | | | | | | $ | | | | % | |
United States | | | 8,267 | | | | 3,970 | | | | | | 3,619 | | | | 75 | | | | 180 | | | | 77 | | | | – | | | | 3,395 | | | | 19,583 | | | | 25 | |
Canada | | | 4,189 | | | | 4,915 | | | | | | 348 | | | | 3 | | | | 1,089 | (4) | | | 6,493 | (5) | | | – | | | | 1,401 | | | | 18,438 | | | | 24 | |
Mexico | | | 1,922 | | | | 1,825 | | | | | | 239 | | | | 26 | | | | 4 | | | | – | | | | 1 | | | | – | | | | 4,017 | | | | 5 | |
Brazil | | | 2,266 | | | | 433 | | | | | | 235 | | | | 430 | | | | 7 | | | | – | | | | 40 | | | | – | | | | 3,411 | | | | 4 | |
Australia | | | 1,153 | | | | 1,165 | | | | | | 144 | | | | – | | | | 1 | | | | – | | | | – | | | | 217 | | | | 2,680 | | | | 4 | |
United Kingdom | | | 882 | | | | 1,213 | | | | | | 243 | | | | 20 | | | | – | | | | 4 | | | | – | | | | 297 | | | | 2,659 | | | | 4 | |
India | | | 1,555 | | | | 84 | | | | | | 49 | | | | 497 | | | | 1 | | | | 1 | | | | – | | | | – | | | | 2,187 | | | | 3 | |
China | | | 260 | | | | 150 | | | | | | 236 | | | | 1,012 | | | | 45 | | | | – | | | | 218 | | | | – | | | | 1,921 | | | | 2 | |
Germany | | | 566 | | | | 901 | | | | | | 191 | | | | – | | | | – | | | | – | | | | – | | | | 44 | | | | 1,702 | | | | 2 | |
Saudi Arabia | | | 529 | | | | 977 | | | | | | 18 | | | | 22 | | | | 6 | | | | – | | | | – | | | | – | | | | 1,552 | | | | 2 | |
Other(6) | | | 9,272 | | | | 4,290 | | | | | | 2,428 | | | | 2,033 | | | | 127 | | | | 126 | | | | 1,244 | | | | 234 | | | | 19,754 | | | | 25 | |
Total | | | $30,861 | | | | $19,923 | | | | | | $7,750 | | | | $4,118 | | | | $1,460 | | | | $6,701 | | | | $1,503 | | | | $5,588 | | | | $77,904 | | | | 100 | |
| | | | | | |
| | | | | | | | | | | | | | | | | | |
| | | Financing portfolio | | | | | Insurance portfolio | | | | | | | | | | |
| | | | | | | | | | | | | | | | | Contract insurance and bonding | | | | | | Marketable | | | | | | | |
| (in millions of Canadian dollars) | | Financing assets(1) | | | Commitments and guarantees(2) | | | | | Credit
insurance | | | Financial
institutions
insurance | | | Policies | | | Guarantees | | | Political
risk
insurance | | | securities and derivative instruments(3) | | | 2011 Exposure | |
Country | | | | | | | | | | | | | | | | | | | | | | | | | | | | | | | | | | | | | $ | | | | % | |
United States | | | 9,818 | | | | 3,125 | | | | | | 3,687 | | | | 132 | | | | 213 | | | | 88 | | | | 13 | | | | 3,296 | | | | 20,372 | | | | 27 | |
Canada | | | 3,725 | | | | 5,026 | | | | | | 455 | | | | 11 | | | | 1,573 | (4) | | | 6,738 | (5) | | | – | | | | 1,806 | | | | 19,334 | | | | 25 | |
Mexico | | | 1,773 | | | | 1,208 | | | | | | 197 | | | | 8 | | | | 63 | | | | 1 | | | | 26 | | | | – | | | | 3,276 | | | | 4 | |
China | | | 132 | | | | 36 | | | | | | 444 | | | | 1,973 | | | | 87 | | | | 1 | | | | 212 | | | | – | | | | 2,885 | | | | 4 | |
Brazil | | | 1,400 | | | | 657 | | | | | | 197 | | | | 465 | | | | 9 | | | | – | | | | 36 | | | | – | | | | 2,764 | | | | 4 | |
India | | | 1,546 | | | | 252 | | | | | | 198 | | | | 722 | | | | 9 | | | | – | | | | – | | | | – | | | | 2,727 | | | | 4 | |
Australia | | | 730 | | | | 1,311 | | | | | | 135 | | | | 1 | | | | 1 | | | | – | | | | – | | | | 19 | | | | 2,197 | | | | 3 | |
Chile | | | 959 | | | | 293 | | | | | | 19 | | | | 335 | | | | 10 | | | | – | | | | – | | | | – | | | | 1,616 | | | | 2 | |
United Kingdom | | | 936 | | | | 99 | | | | | | 270 | | | | 167 | | | | 4 | | | | 4 | | | | – | | | | 89 | | | | 1,569 | | | | 2 | |
Turkey | | | 45 | | | | 44 | | | | | | 15 | | | | 1,022 | | | | 3 | | | | – | | | | – | | | | – | | | | 1,129 | | | | 1 | |
Other(6) | | | 8,529 | | | | 3,305 | | | | | | 2,187 | | | | 2,133 | | | | 233 | | | | 154 | | | | 1,481 | | | | 217 | | | | 18,239 | | | | 24 | |
Total | | | $29,593 | | | | $15,356 | | | | | | $7,804 | | | | $6,969 | | | | $2,205 | | | | $6,986 | | | | $1,768 | | | | $5,427 | | | | $76,108 | | | | 100 | |
| (1) | Includes gross loans receivable, investments and gross investment in aircraft under finance leases. |
| (2) | Includes $417 million of investment commitments (2011 – $283 million), $111 million of confirmed letters of offer (2011 – $410 million) and $2,104 million of loan guarantees (2011 – $2,740 million). |
| (3) | Includes amounts represented by cash and marketable securities. Exposure does not take into consideration any collateral or the effect of any master netting agreements with derivative counterparties. |
| (4) | Includes $1,045 million of surety bond insurance where the risk rests with the Canadian exporter (2011 – $1,546 million). A total of 52% of the exports insured in the surety bond program are to the United States (2011 – 58%). The balance represents exports to other countries. |
| (5) | Includes $6,381 million in performance security guarantees, where the risk rests with the Canadian exporter (2011 – $6,613 million). A total of 56% of the exports insured in the performance security program are to the United States (2011 – 56%). The balance represents exports to other countries. |
| (6) | Includes 171 countries (2011 – 175) with total exposure ranging from $0.001 million to $1,506 million (2011 – $0.001 million to $954 million). |

|
EDC Annual Report 2012 | 75 |
MANAGEMENT’S DISCUSSION AND ANALYSIS
Table 6: Concentration of Exposure by Industry
| | | | | | | | | | | | | | | | | | | | | | | | | | | | | | | | | | | | | | | | | | |
| | | Financing portfolio | | | | | Insurance portfolio | | | | | | | | | | |
| | | Financing assets(1) | | | Commitments and guarantees(2) | | | | | Credit insurance | | | Financial institutions insurance | | | Contract insurance and bonding | | | Political risk insurance | | | Marketable securities and derivative instruments(3) | | | | | | | |
(in millions
of Canadian
dollars) | | | | | | | | Policies | | | Guarantees | | | | | 2012 Exposure | |
Industry | | | | | | | | | | | | | | | | | | | | | | | | | | | | | | | | | | | | | $ | | | | % | |
Commercial: | | | | | | | | | | | | | | | | | | | | | | | | | | | | | | | | | | | | | | | | | | |
Extractive | | | 8,485 | | | | 8,054 | | | | | | 2,308 | | | | – | | | | 80 | | | | 1,309 | | | | 664 | | | | – | | | | 20,900 | | | | 27 | |
Aerospace | | | 9,589 | | | | 2,878 | | | | | | – | | | | – | | | | – | | | | – | | | | – | | | | – | | | | 12,467 | | | | 16 | |
Infrastructure and environment | | | 2,763 | | | | 1,876 | | | | | | 627 | | | | – | | | | 843 | | | | 4,304 | | | | 598 | | | | – | | | | 11,011 | | | | 14 | |
Financial institutions | | | 1,204 | | | | 272 | | | | | | – | | | | 4,118 | | | | – | | | | – | | | | – | | | | 2,105 | | | | 7,699 | | | | 10 | |
Surface transportation | | | 3,458 | | | | 1,780 | | | | | | 1,198 | | | | – | | | | 457 | | | | 505 | | | | 99 | | | | – | | | | 7,497 | | | | 10 | |
Information and communication technology | | | 2,657 | | | | 3,019 | | | | | | 1,019 | | | | – | | | | 50 | | | | 159 | | | | 64 | | | | – | | | | 6,968 | | | | 9 | |
Light manufacturing | | | 1,030 | | | | 1,102 | | | | | | 948 | | | | – | | | | 23 | | | | 173 | | | | 73 | | | | – | | | | 3,349 | | | | 4 | |
Resources | | | 470 | | | | 539 | | | | | | 1,650 | | | | – | | | | 7 | | | | 251 | | | | 5 | | | | – | | | | 2,922 | | | | 4 | |
Other | | | 15 | | | | 20 | | | | | | – | | | | – | | | | – | | | | – | | | | – | | | | 14 | | | | 49 | | | | – | |
Total commercial | | | 29,671 | | | | 19,540 | | | | | | 7,750 | | | | 4,118 | | | | 1,460 | | | | 6,701 | | | | 1,503 | | | | 2,119 | | | | 72,862 | | | | 94 | |
Sovereign | | | 1,190 | | | | 383 | | | | | | – | | | | – | | | | – | | | | – | | | | – | | | | 3,469 | | | | 5,042 | | | | 6 | |
Total | | | $30,861 | | | | $19,923 | | | | | | $7,750 | | | | $4,118 | | | | $1,460 | | | | $6,701 | | | | $1,503 | | | | $5,588 | | | | $77,904 | | | | 100 | |
| | | | | |
| | | | | | | | | | | | | | | | |
| | | Financing portfolio | | | | | Insurance portfolio | | | | | | | | | | |
(in millions of
Canadian
dollars) | | Financing assets(1) | | | Commitments
and guarantees(2) | | | | | Credit insurance | | | Financial
institutions insurance | | | Contract insurance
and bonding | | | Political
risk insurance | | | Marketable securities and derivative instruments(3) | | | | | | | |
| | | | | | | | Policies | | | Guarantees | | | | | 2011 Exposure | |
Industry | | | | | | | | | | | | | | | | | | | | | | | | | | | | | | | | | | | | | $ | | | | % | |
Commercial: | | | | | | | | | | | | | | | | | | | | | | | | | | | | | | | | | | | | | | | | | | |
Extractive | | | 6,576 | | | | 6,435 | | | | | | 2,177 | | | | – | | | | 214 | | | | 1,206 | | | | 641 | | | | – | | | | 17,249 | | | | 22 | |
Aerospace | | | 10,175 | | | | 1,720 | | | | | | – | | | | – | | | | – | | | | – | | | | – | | | | – | | | | 11,895 | | | | 16 | |
Infrastructure and environment | | | 2,805 | | | | 1,605 | | | | | | 520 | | | | – | | | | 1,315 | | | | 4,427 | | | | 873 | | | | – | | | | 11,545 | | | | 15 | |
Financial institutions | | | 1,038 | | | | 609 | | | | | | – | | | | 6,969 | | | | – | | | | – | | | | – | | | | 2,136 | | | | 10,752 | | | | 14 | |
Surface transportation | | | 3,748 | | | | 2,067 | | | | | | 1,114 | | | | – | | | | 498 | | | | 756 | | | | 94 | | | | – | | | | 8,277 | | | | 11 | |
Information and communication technology | | | 2,687 | | | | 1,018 | | | | | | 1,262 | | | | – | | | | 98 | | | | 160 | | | | 49 | | | | – | | | | 5,274 | | | | 7 | |
Resources | | | 452 | | | | 561 | | | | | | 1,730 | | | | – | | | | 12 | | | | 270 | | | | 37 | | | | – | | | | 3,062 | | | | 4 | |
Light manufacturing | | | 725 | | | | 837 | | | | | | 1,001 | | | | – | | | | 68 | | | | 167 | | | | 74 | | | | – | | | | 2,872 | | | | 4 | |
Other | | | 47 | | | | 40 | | | | | | – | | | | – | | | | – | | | | – | | | | – | | | | 14 | | | | 101 | | | | – | |
Total commercial | | | 28,253 | | | | 14,892 | | | | | | 7,804 | | | | 6,969 | | | | 2,205 | | | | 6,986 | | | | 1,768 | | | | 2,150 | | | | 71,027 | | | | 93 | |
Sovereign | | | 1,340 | | | | 464 | | | | | | – | | | | – | | | | – | | | | – | | | | – | | | | 3,277 | | | | 5,081 | | | | 7 | |
Total | | | $29,593 | | | | $15,356 | | | | | | $7,804 | | | | $6,969 | | | | $2,205 | | | | $6,986 | | | | $1,768 | | | | $5,427 | | | | $76,108 | | | | 100 | |
| (1) | Includes gross loans receivable, investments and gross investment in aircraft under finance leases. |
| (2) | Includes $417 million of investment commitments (2011 – $283 million), $111 million of confirmed letters of offer (2011 – $410 million) and $2,104 million of loan guarantees (2011 – $2,740 million). |
| (3) | Includes amounts represented by cash and marketable securities. Exposure does not take into consideration any collateral or the effect of any master netting agreements with derivative counterparties. |
|
| 76 | Adapting to the New Reality |
Table 7: Individually Impaired Loans
| | | | | | | | |
| (in millions of Canadian dollars) | | 2012 | | | 2011 | |
Sovereign | | | | | | | | |
Argentina | | | 46 | | | | 46 | |
Cuba | | | 24 | | | | 24 | |
Iran | | | 8 | | | | – | |
Ivory Coast | | | – | | | | 131 | |
Democratic Republic of the Congo | | | – | | | | 47 | |
Subtotal | | | 78 | | | | 248 | |
Commercial | | | | | | | | |
Aerospace | | | 833 | | | | 1,302 | |
Infrastructure and environment | | | 99 | | | | 15 | |
Surface transportation | | | 37 | | | | 20 | |
Information and communication technology | | | 33 | | | | 83 | |
Light manufacturing | | | 26 | | | | 26 | |
Extractive | | | 24 | | | | 26 | |
Financial institutions | | | 23 | | | | 81 | |
Resources | | | 7 | | | | 4 | |
Subtotal | | | 1,082 | | | | 1,557 | |
Total impaired gross loans receivable | | | 1,160 | | | | 1,805 | |
Less: Individual allowance | | | 298 | | | | 422 | |
Deferred revenue and other credits | | | 24 | | | | 205 | |
Impaired net loans receivable | | | $838 | | | | $1,178 | |
| | |
| Table 8: | | Collective Allowance for Losses on Loans, |
| | Loan Commitments and Guarantees |
| | | | | | | | | | | | | | | | | | | | | | | | |
| (in millions of Canadian dollars) | | 2012 | | | | | | | | | 2011 | |
Industry of risk | |
| Provision
exposure |
* | |
| Collective
allowance |
| |
| Collective
allowance as a percentage of provisioning exposure |
| |
| Provision
exposure |
* | |
| Collective
allowance |
| |
| Collective
allowance as a percentage of provisioning exposure |
|
Commercial: | | | | | | | | | | | | | | | | | | | | | | | | |
Aerospace | | | 10,486 | | | | 476 | | | | 4.5 | | | | 9,815 | | | | 567 | | | | 5.8 | |
Extractive | | | 13,343 | | | | 129 | | | | 1.0 | | | | 10,747 | | | | 178 | | | | 1.7 | |
Information and communication technology | | | 4,089 | | | | 113 | | | | 2.8 | | | | 3,329 | | | | 198 | | | | 5.9 | |
Infrastructure and environment | | | 3,652 | | | | 76 | | | | 2.1 | | | | 3,651 | | | | 153 | | | | 4.2 | |
Light manufacturing | | | 1,703 | | | | 67 | | | | 3.9 | | | | 1,264 | | | | 61 | | | | 4.8 | |
Other | | | 6,823 | | | | 97 | | | | 1.4 | | | | 7,140 | | | | 170 | | | | 2.4 | |
Total commercial | | | 40,096 | | | | 958 | | | | 2.4 | | | | 35,946 | | | | 1,327 | | | | 3.7 | |
Sovereign | | | 1,273 | | | | 78 | | | | 6.1 | | | | 1,359 | | | | 91 | | | | 6.7 | |
Total | | | $41,369 | | | | $1,036 | | | | 2.5 | | | | $37,305 | | | | $1,418 | | | | 3.8 | |
* Calculated using factored exposure.
As noted on page 56 of the MD&A, the total allowance as a percentage of total loan portfolio exposure at the end of 2012 was 2.7% (2011 – 4.4%).
|
EDC Annual Report 2012 | 77 |
MANAGEMENT’S DISCUSSION AND ANALYSIS
Table 9: Investments
| | | | | | | | | | | | | | | | | | | | | | | | |
| (in millions of Canadian dollars) | | Investments financing | | | Undisbursed commitments | | | | | | 2012
Exposure | | | | | | 2011
Exposure | |
Gross exposure | | | | | | | | | | | $ | | | | % | | | | $ | | | | % | |
Domestic market | | | 167 | | | | 195 | | | | 362 | | | | 43 | | | | 326 | | | | 49 | |
Other advanced economies | | | 42 | | | | 17 | | | | 59 | | | | 7 | | | | 44 | | | | 6 | |
Emerging markets | | | 220 | | | | 205 | | | | 425 | | | | 50 | | | | 298 | | | | 45 | |
Total | | | $429 | | | | $417 | | | | $846 | | | | 100 | | | | $668 | | | | 100 | |
Table 10: Claims – Size Concentration
| | | | | | | | | | | | | | | | | | | | | | | | | | | | | | | | |
(in millions of Canadian dollars) | | | | | | | | | | | 2012 | | | | | | | | | | | | 2011 | |
| | |
| $ of claims
paid |
| |
| Number of
claims paid |
| |
| $ of claims
recovered |
| |
| Number
of claims recovered |
| |
| $ of claims
paid |
| |
| Number of
claims paid |
| |
| $ of claims
recovered |
| |
| Number
of claims recovered |
|
$0 – $100,000 | | | 13 | | | | 863 | | | | 4 | | | | 418 | | | | 12 | | | | 970 | | | | 32 | | | | 514 | |
$100,001 – $1 million | | | 27 | | | | 97 | | | | 8 | | | | 29 | | | | 21 | | | | 80 | | | | 2 | | | | 12 | |
Over $1 million | | | 318 | | | | 10 | | | | 10 | | | | 5 | | | | 22 | | | | 12 | | | | 6 | | | | 5 | |
Total | | | $358 | | | | 970 | | | | $22 | | | | 452 | | | | $55 | | | | 1,062 | | | | $40 | | | | 531 | |
|
| 78 | Adapting to the New Reality |
FINANCIAL REPORTING RESPONSIBILITY
| | |
 | | Ken Kember, Senior Vice-President and Chief Financial Officer |
The consolidated financial statements contained in this Annual Report have been prepared by management in accordance with International Financial Reporting Standards appropriate in the circumstances. The integrity and objectivity of the data in these consolidated financial statements are management’s responsibility. It is necessary for management to make assumptions, estimates and judgments based on information available as at the date of the financial statements. Areas where management has made significant estimates, assumptions and judgments include the determination of the control of special purpose entities, the allowance for losses on loans, loan commitments and guarantees, equipment available for lease, recoverable insurance claims, policy and claims liabilities, financial instruments measured at fair value and retirement benefit obligations. Management is also responsible for all other information in the Annual Report and for ensuring that this information is consistent, where appropriate, with the information and data contained in the consolidated financial statements.
In support of its responsibility, management maintains financial, management control and information systems and management practices to provide reasonable assurance that the financial information is reliable, that the assets are safeguarded and that the operations are carried out effectively. We have an internal audit department whose functions include reviewing internal controls and their application, on an ongoing basis.
The Board of Directors is responsible for the management of our business and activities. In particular, it is responsible for ensuring that management fulfills its responsibilities for financial reporting and internal control and exercises this responsibility through the Audit Committee of the Board, which is composed of Directors who are not employees of EDC. The Audit Committee meets with management, the internal auditors and the Auditor General of Canada on a regular basis.
Contracts which, in our opinion, involve risks in excess of that which we would normally undertake, may be entered into under the authority of the Minister of International Trade and the Minister of Finance where the Minister of International Trade considers them to be in the national interest. Funds required for such contracts are paid to EDC by the Minister of Finance out of the Consolidated Revenue Fund, and funds recovered are remitted to the Consolidated Revenue Fund, net of amounts withheld to cover related administrative expenses. These transactions, which are known as Canada Account transactions, are shown in Note 40 to our consolidated financial statements, and the responsibility of the Board of Directors for these transactions is limited to the management of the administration thereof by EDC.
The Auditor General of Canada conducts an independent audit, in accordance with Canadian generally accepted auditing standards, and expresses his opinion on the consolidated financial statements. His report is presented on the following page.
| | |
 | |  |
| Stephen Poloz | | Ken Kember |
| President and Chief Executive Officer | | Senior Vice-President and Chief Financial Officer |
February 21, 2013 | | |
|
| 80 | Adapting to the New Reality |
INDEPENDENT AUDITOR’S REPORT

TO THE MINISTER OF INTERNATIONAL TRADE
REPORT ON THE CONSOLIDATED FINANCIAL STATEMENTS
I have audited the accompanying consolidated financial statements of Export Development Canada, which comprise the consolidated statement of financial position as at December 31, 2012, the consolidated statement of comprehensive income, consolidated statement of changes in equity and consolidated statement of cash flows for the year then ended, and a summary of significant accounting policies and other explanatory information.
MANAGEMENT’S RESPONSIBILITY FOR
THE CONSOLIDATED FINANCIAL STATEMENTS
Management is responsible for the preparation and fair presentation of these consolidated financial statements in accordance with International Financial Reporting Standards, and for such internal control as management determines is necessary to enable the preparation of consolidated financial statements that are free from material misstatement, whether due to fraud or error.
AUDITOR’S RESPONSIBILITY
My responsibility is to express an opinion on these consolidated financial statements based on my audit. I conducted my audit in accordance with Canadian generally accepted auditing standards. Those standards require that I comply with ethical requirements and plan and perform the audit to obtain reasonable assurance about whether the consolidated financial statements are free from material misstatement.
An audit involves performing procedures to obtain audit evidence about the amounts and disclosures in the consolidated financial statements. The procedures selected depend on the auditor’s judgment, including the assessment of the risks of material misstatement of the consolidated financial statements, whether due to fraud or error. In making those risk assessments, the auditor considers internal control relevant to the entity’s preparation and fair presentation of the consolidated financial statements in order to design audit procedures that are appropriate in the circumstances, but not for the purpose of expressing an opinion on the effectiveness of the entity’s internal control. An audit also includes evaluating the appropriateness of accounting policies used and the reasonableness of accounting estimates made by management, as well as evaluating the overall presentation of the consolidated financial statements.
I believe that the audit evidence I have obtained is sufficient and appropriate to provide a basis for my audit opinion.
OPINION
In my opinion, the consolidated financial statements present fairly, in all material respects, the financial position of Export Development Canada as at December 31, 2012, and its financial performance and its cash flows for the year then ended in accordance with International Financial Reporting Standards.
REPORT ON OTHER LEGAL AND REGULATORY REQUIREMENTS
As required by the Financial Administration Act, I report that, in my opinion, the accounting principles in International Financial Reporting Standards have been applied on a basis consistent with that of the preceding year.
Further, in my opinion, the transactions of Export Development Canada and its wholly owned subsidiary that have come to my notice during my audit of the consolidated financial statements have, in all significant respects, been in accordance with Part X of the Financial Administration Act and regulations, the Export Development Act and regulations, the by-laws of Export Development Canada, the charter and by-laws of its wholly owned subsidiary, and the directive issued pursuant to Section 89 of the Financial Administration Act.

Clyde M. MacLellan, CA
Assistant Auditor General of Canada
for the Auditor General of Canada
February 21, 2013
Ottawa, Canada

|
EDC Annual Report 2012 | 81 |
CONSOLIDATED FINANCIAL STATEMENTS
EXPORT DEVELOPMENT CANADA
CONSOLIDATED STATEMENT OF FINANCIAL POSITION
| | | | | | |
as at (in millions of Canadian dollars) | | Dec. 31, 2012 | | | Dec. 31, 2011 |
Assets | | | | | | |
Cash | | | 80 | | | 90 |
Marketable securities: (Note 3) | | | | | | |
At fair value through profit or loss | | | 4,082 | | | 3,720 |
At amortized cost | | | 74 | | | 76 |
Derivative instruments (Note 17) | | | 1,352 | | | 1,541 |
Loans receivable (Notes 4 and 5) | | | 30,131 | | | 28,680 |
Allowance for losses on loans (Note 6) | | | (1,182) | | | (1,680) |
Investments at fair value through profit or loss (Note 7) | | | 429 | | | 385 |
Equipment available for lease (Note 8) | | | 525 | | | 55 |
Net investment in aircraft under finance leases (Note 9) | | | 80 | | | 92 |
Recoverable insurance claims (Note 10) | | | 200 | | | 44 |
Reinsurers’ share of policy and claims liabilities (Note 19) | | | 90 | | | 129 |
Other assets (Note 11) | | | 99 | | | 174 |
Property, plant and equipment (Note 12) | | | 66 | | | 74 |
Intangible assets (Note 13) | | | 38 | | | 40 |
Building under finance lease (Note 14) | | | 169 | | | 176 |
Total Assets | | | $36,233 | | | $33,596 |
Liabilities and Equity | | | | | | |
Accounts payable and other credits (Note 15) | | | 113 | | | 159 |
Loans payable: (Note 16) | | | | | | |
Designated at fair value through profit or loss | | | 24,862 | | | 21,505 |
At amortized cost | | | 1,018 | | | 2,065 |
Derivative instruments (Note 17) | | | 120 | | | 178 |
Obligation under finance lease (Note 14) | | | 173 | | | 177 |
Retirement benefit obligations (Note 38) | | | 68 | | | 74 |
Allowance for losses on loan commitments (Note 6) | | | 58 | | | 41 |
Policy and claims liabilities (Note 19) | | | 583 | | | 875 |
Loan guarantees (Note 21) | | | 161 | | | 266 |
| | | | 27,156 | | | 25,340 |
Financing Commitments (Note 20) and Contingent Liabilities (Note 21) | | | | | | |
Equity | | | | | | |
Share capital (Note 24) | | | 1,333 | | | 1,333 |
Retained earnings | | | 7,744 | | | 6,923 |
| | | | 9,077 | | | 8,256 |
Total Liabilities and Equity | | | $36,233 | | | $33,596 |
The accompanying notes are an integral part of these consolidated financial statements.
These financial statements were approved for issuance by the Board of Directors on February 21, 2013.
| | |
 | |  |
| John Rooney | | Stephen Poloz |
| Director | | Director |
February 21, 2013 | | |
|
| 82 | Adapting to the New Reality |
EXPORT DEVELOPMENT CANADA
CONSOLIDATED STATEMENT OF COMPREHENSIVE INCOME
| | | | | | |
for the year ended December 31 (in millions of Canadian dollars) | | 2012 | | | 2011 |
Financing and investment revenue: | | | | | | |
Loan (Note 30) | | | 1,116 | | | 1,009 |
Finance lease (Note 9) | | | 6 | | | 7 |
Operating lease (Note 8) | | | 17 | | | 21 |
Debt relief | | | – | | | 4 |
Marketable securities (Note 31) | | | 36 | | | 46 |
Investments (Note 7) | | | 4 | | | 12 |
Total financing and investment revenue | | | 1,179 | | | 1,099 |
Interest expense (Note 32) | | | 108 | | | 93 |
Leasing and financing related expenses (Note 33) | | | 32 | | | 32 |
Net Financing and Investment Income | | | 1,039 | | | 974 |
Loan Guarantee Fees | | | 38 | | | 32 |
Insurance premiums and guarantee fees | | | 204 | | | 238 |
Reinsurance assumed | | | 12 | | | 13 |
Reinsurance ceded | | | (20) | | | (17) |
Net Insurance Premiums and Guarantee Fees (Note 22) | | | 196 | | | 234 |
Other Income (Expenses) (Note 36) | | | (16) | | | 61 |
Administrative Expenses (Note 37) | | | 314 | | | 284 |
Income before Provision and Claims-Related Expenses (Recovery) | | | 943 | | | 1,017 |
Provision for (Reversal of) Credit Losses (Note 34) | | | (340) | | | 125 |
Claims-Related Expenses (Recovery) (Note 35) | | | (38) | | | 247 |
Net Income | | | 1,321 | | | 645 |
Other comprehensive income | | | – | | | – |
Comprehensive Income | | | $1,321 | | | $645 |
The accompanying notes are an integral part of these consolidated financial statements.
|
EDC Annual Report 2012 | 83 |
CONSOLIDATED FINANCIAL STATEMENTS
EXPORT DEVELOPMENT CANADA
CONSOLIDATED STATEMENT OF CHANGES IN EQUITY
| | | | | | |
for the year ended December 31 (in millions of Canadian dollars) | | 2012 | | | 2011 |
Share Capital (Note 24) | | | 1,333 | | | 1,333 |
Retained Earnings | | | | | | |
Balance beginning of year | | | 6,923 | | | 6,628 |
Comprehensive income | | | 1,321 | | | 645 |
Dividend paid | | | (500) | | | (350) |
Balance end of year | | | 7,744 | | | 6,923 |
Total Equity at End of Year | | | $9,077 | | | $8,256 |
The accompanying notes are an integral part of these consolidated financial statements.
|
| 84 | Adapting to the New Reality |
EXPORT DEVELOPMENT CANADA
CONSOLIDATED STATEMENT OF CASH FLOWS
| | | | | | |
for the year ended December 31 (in millions of Canadian dollars) | | 2012 | | | 2011 |
Cash Flows from (used in) Operating Activities | | | | | | |
Comprehensive income | | | 1,321 | | | 645 |
Adjustments to determine net cash from (used in) operating activities | | | | | | |
Provision for (reversal of) credit losses | | | (340) | | | 125 |
Actuarial change in the net allowance for claims on insurance | | | (233) | | | 179 |
Depreciation and amortization | | | 52 | | | 48 |
Changes in operating assets and liabilities | | | | | | |
Change in accrued interest and fees receivable | | | (3) | | | 20 |
Change in fair value of marketable securities | | | (11) | | | (47) |
Change in fair value of loans payable | | | (47) | | | 164 |
Change in derivative instruments receivable | | | 50 | | | 174 |
Change in derivative instruments payable | | | 144 | | | (138) |
Other | | | (195) | | | 38 |
Loan receivable disbursements | | | (11,887) | | | (10,393) |
Loan receivable repayments | | | 9,232 | | | 8,735 |
Net cash used in operating activities | | | (1,917) | | | (450) |
Cash Flows from (used in) Investing Activities | | | | | | |
Disbursements for investments | | | (121) | | | (106) |
Receipts from investments | | | 63 | | | 29 |
Finance lease repayments | | | 10 | | | 9 |
Purchases of marketable securities at fair value through profit or loss | | | (40,579) | | | (40,793) |
Sales/maturities of marketable securities at fair value through profit or loss | | | 40,151 | | | 40,852 |
Purchases of marketable securities at amortized cost | | | – | | | (869) |
Sales/maturities of marketable securities at amortized cost | | | – | | | 814 |
Distribution from investment in joint ventures | | | – | | | 54 |
Net cash used in investing activities | | | (476) | | | (10) |
Cash Flows from (used in) Financing Activities | | | | | | |
Issue of long-term loans payable – designated at fair value through profit or loss | | | 8,768 | | | 5,708 |
Repayment of long-term loans payable – designated at fair value through profit or loss | | | (5,943) | | | (6,135) |
Repayment of long-term loans payable at amortized cost | | | (999) | | | – |
Issue of short-term loans payable – designated at fair value through profit or loss | | | 29,601 | | | 22,751 |
Repayment of short-term loans payable – designated at fair value through profit or loss | | | (28,650) | | | (21,870) |
Change in derivative instruments receivable | | | 137 | | | 296 |
Change in derivative instruments payable | | | (30) | | | 25 |
Dividend paid | | | (500) | | | (350) |
Net cash from financing activities | | | 2,384 | | | 425 |
Effect of exchange rate changes on cash | | | (1) | | | 1 |
Net decrease in cash | | | (10) | | | (34) |
Cash | | | | | | |
Beginning of year | | | 90 | | | 124 |
End of year | | | $80 | | | $90 |
Operating Cash Flows from Interest | | | | | | |
Cash paid for interest on loans payable | | | 182 | | | 156 |
Cash received for interest on currency swaps related to capital | | | 65 | | | 70 |
Cash received for interest on loan assets and marketable securities | | | 1,121 | | | 1,046 |
The accompanying notes are an integral part of these consolidated financial statements.
|
EDC Annual Report 2012 | 85 |
CONSOLIDATED FINANCIAL STATEMENTS
NOTES TO THE CONSOLIDATED FINANCIAL STATEMENTS
1. Corporate Mandate
Export Development Canada (the “Corporation” or “EDC”) was established on October 1, 1969 by the Export Development Act (the “Act”), a statute of the Parliament of Canada. The Budget Implementation Act, 2009 amended the Act to expand the mandate of the Corporation for a two-year period to include domestic activities, in addition to its traditional mandate related to export trade, and the regulations governing its domestic financing and insurance activities were suspended. The period was extended to March 12, 2013. The Corporation is named in Part I of Schedule III to the Financial Administration Act (the “FA Act”) and is accountable for its affairs to Parliament through the Minister of International Trade (the “Minister”).
In September 2008, EDC, together with other federal Crown corporations, was given a directive (PC 2008-1598) pursuant to Section 89 of the FA Act, entitled Order giving a direction to parent Crown corporations involved in commercial lending to give due consideration to the personal integrity of those they lend to or provide benefits to, in accordance with the Federal Government’s policy to improve the accountability and integrity of federal institutions. The Corporation has, since, implemented the Directive and the President and Chief Executive Officer of EDC has notified the Minister in accordance with Subsection 89(6) of the FA Act.
The Government of Canada is the sole shareholder of Export Development Canada.
We incorporated Exinvest Inc. as a wholly-owned subsidiary (the “Subsidiary”) under the Canada Business Corporations Act in 1995.
Our earnings and those of our Subsidiary are not subject to the requirements of the Income Tax Act.
We are subject to a limit imposed by the Act on our contingent liability arrangements. The Act specifies that the limit applies to the principal amount owing under all outstanding arrangements which have the effect of providing, to any person, any insurance, reinsurance, indemnity or guarantee. This limit shall at no time exceed the greater of an amount equal to 10 times our authorized capital and $45.0 billion which amount may be varied in an Appropriation Act. At the end of December 2012, the amount of these contingent liabilities was $23.6 billion (2011 – $28.5 billion).
We are for all purposes an agent of Her Majesty in right of Canada. As a result, all obligations under debt instruments we issue are obligations of Canada. The Act allows us to borrow and have outstanding borrowings up to a maximum of 15 times the aggregate of (a) our current paid-in capital and (b) our retained earnings determined in accordance with the previous year’s audited financial statements. The maximum applicable to December 31, 2012 is $123.8 billion (2011 – $122.7 billion), against which borrowings amounted to $25.9 billion (2011 – $23.6 billion).
2. Summary of Significant Accounting Policies
BASIS OF PRESENTATION
Our consolidated financial statements have been prepared in accordance with International Financial Reporting Standards (IFRS). The significant accounting policies used in the preparation of these consolidated financial statements are summarized on the following pages and conform in all material respects to IFRS.
BASIS OF CONSOLIDATION
Our consolidated financial statements include the assets, liabilities, results of operations and cash flows of our wholly-owned subsidiary and those special purpose entities consolidated under Standing Interpretations Committee (SIC) 12 Consolidation – Special Purpose Entities (SPE). Under SIC 12, when a reporting entity is exposed, or has rights to variable returns from its involvement with an SPE or has the ability to affect those returns through its decision-making power over the SPE, the SPE is consolidated within that entity’s financial statements. These assets are included in equipment available for lease, net investment in aircraft under finance leases and aircraft held-for-sale. Aircraft held-for-sale are included in other assets. Intercompany transactions and balances have been eliminated. We report our interests in jointly controlled entities using the equity method.
USE OF JUDGMENT, ESTIMATES AND ASSUMPTIONS
To prepare our financial statements in accordance with IFRS, it is necessary for management to exercise judgment and make use of estimates and assumptions, in applying certain accounting policies. We utilize current market data, our own historical experience and other information available to us as at the date of the financial statements in arriving at our decisions. We have established procedures to ensure that the process for determining our estimates and assumptions is well controlled and occurs in an appropriate and systematic manner.
Uncertainty is inherent in the use of estimates and assumptions and as a result, actual results may vary significantly from management’s estimates. Uncertainty arises, in part, from the use of historical experience and data at a point in time to establish our assumptions. While this data may be the most reliable basis available on which to base our assumptions, economic events may occur subsequently that render previous assumptions invalid and cause a material change to actual results.
|
| 86 | Adapting to the New Reality |
Areas where management has exercised judgment and made significant use of estimates and assumptions are discussed below.
NOTE 6 – ALLOWANCE FOR LOSSES ON LOANS, LOAN COMMITMENTS AND GUARANTEES
The allowance for losses on loans, loan commitments and guarantees represents management’s best estimate of probable credit losses. Management determines the allowances through the use of judgment and various assumptions based on its assessment of the impact of recent events and changes in economic conditions and trends. These estimates are reviewed periodically during the year and in detail as at the date of the financial statements.
The purpose of the collective allowance is to provide an estimate of probable incurred losses inherent in the loan portfolio that have not been identified on an individual loan basis. Management judgment is required with respect to assessment of probabilities of default, loss severity in the event of default also referred to as loss given default, review of credit quality for internally rated obligors and the value of any collateral. Management also considers the impact of economic events, industry trends and risk concentrations on the portfolio and the required allowance.
Allowances are established on an individual basis for loans, commitments and guarantees that management has determined to be impaired and/or for which losses have been incurred. When an obligor is considered impaired, we reduce the carrying value of the loan to its net realizable value. Management is required to make a number of estimates including the timing and amount of future cash flows, residual values of underlying security, as well as the initial judgment as to whether the loan is impaired or performing.
NOTE 8 – EQUIPMENT AVAILABLE FOR LEASE
When aircraft are returned to us as a result of default under the related obligors’ loan agreements, we determine their fair value using market values obtained from an independent appraiser supplemented by additional current market data and other information available to us. Judgment is involved in allocating the resulting fair value between the components of the aircraft and in establishing the remaining useful life of the components.
We review the aircraft in our leasing portfolio for impairment quarterly. Judgment as to the impact of current economic events, trends or other circumstances on the viability of our aircraft is required in determining whether impairment has occurred or has been reversed within our portfolio. If an event is judged to have impacted the carrying value of our portfolio, estimates and assumptions surrounding the recoverable amount of the aircraft are made. These include the current fair value of the aircraft, estimated cash flows to be generated from the use of the aircraft, projected future rentals and lease rates and estimated costs to sell the aircraft.
NOTE 10 – RECOVERABLE INSURANCE CLAIMS
When an insurance claim is paid, management estimates any future recovery and records it within recoverable insurance claims. The estimation process is dependent upon our assessment of the future cash flows to be realized through collection efforts made by us, the policyholder or collection agencies. The estimated recoverable amount is reviewed and adjusted on a quarterly basis.
NOTE 19 – POLICY AND CLAIMS LIABILITIES
The policy and claims liabilities are based on our estimate of future claims under the terms and conditions of our insurance policies. The actuarial valuation uses simulation techniques and is based on assumptions relevant to the insurance programs and is derived in conjunction with our own experience. Management judgment is required in estimating the variables that are part of the actuarial calculation of the policy and claims liabilities. These variables include severity of loss, loss development, frequency of claim and discount rates used. Management judgment is also used in selecting the confidence level for adverse deviation.
NOTE 28 – FINANCIAL INSTRUMENTS MEASURED AT FAIR VALUE
The majority of financial instruments are recognized on our consolidated statement of financial position at their fair value. These financial instruments include marketable securities at fair value through profit or loss, derivative instruments, investments at fair value through profit or loss and loans payable designated at fair value through profit or loss. Fair value is defined as the amount for which a financial asset could be exchanged, or a liability settled, between knowledgeable, willing parties in an arm’s length transaction.
Our financial instruments are categorized into one of three levels based on whether the techniques employed to value the instruments use observable or unobservable market inputs. Financial instruments categorized as Level 1 are valued using quoted market prices, thus minimal judgment or estimates are required. Those instruments categorized as Level 2 and 3 require the use of increasing levels of judgment and assumptions, including the selection of appropriate discount rates, yield curves and other inputs into our models. Refer to Note 28 for additional details on the techniques used to value our financial instruments.
NOTE 38 – RETIREMENT BENEFIT OBLIGATIONS
EDC maintains defined benefit pension plans and other benefit plans. IFRS requires that management measure the plans’ defined benefit obligations and annual costs using assumptions that are long-term in nature and reflect our best judgment and estimates. We review key assumptions on an annual basis with our actuaries using relevant experience, in conjunction with market related data. The key assumptions include expected long-term rate of return on plan assets, rate of compensation increase, the discount rate and the longevity of plan members.
|
EDC Annual Report 2012 | 87 |
CONSOLIDATED FINANCIAL STATEMENTS
The management assumption with the greatest potential impact on our defined benefit obligation is the discount rate. The discount rate is determined by reference to the yield of a portfolio of high quality fixed income instruments (rated AA or higher), which has the same duration as the plan’s defined benefit obligation.
MARKETABLE SECURITIES
We hold marketable securities for liquidity purposes. The size and nature of our marketable securities portfolio is governed by Board approved policies. Our marketable securities are held with creditworthy counterparties that must have a minimum credit rating from an external credit rating agency of A- for all transactions.
Marketable securities held directly by EDC are recorded at fair value through profit or loss to reflect our business model for managing these instruments. We measure performance for this portfolio against appropriate benchmarks. Purchases and sales of marketable securities are recorded on the trade date and the transaction costs are expensed as incurred. Interest revenue is recorded in marketable securities revenue in the consolidated statement of comprehensive income. Realized and unrealized gains and losses on these securities are included in other income (expenses) in the consolidated statement of comprehensive income.
Marketable securities held by our subsidiary are carried at amortized cost, as the business model for managing these instruments is to collect contractual cash flows which represent the payment of principal and interest. Upon initial recognition the securities are recorded at their fair value plus any transaction costs. Subsequently, they are carried at amortized cost using the effective interest method, less any impairment losses. Interest revenue is recorded in marketable securities revenue in the consolidated statement of comprehensive income.
LOANS RECEIVABLE
Loans receivable are recorded at fair value upon initial recognition and subsequently measured at amortized cost using the effective interest method. Our loans receivable are held in order to collect contractual cash flows which represent payments of principal, interest and fees. They are derecognized when the rights to receive cash flows have expired or we have transferred substantially all the risks and rewards of ownership.
The effective interest method is a method of calculating the amortized cost of a financial asset and of allocating the interest income over the relevant period in financing and investment revenue in the consolidated statement of comprehensive income. The effective interest rate is the rate that exactly discounts estimated future cash payments or receipts through the expected life of the financial instrument or, when appropriate, a shorter period, to the net carrying amount of the financial asset. When calculating the effective interest rate, we estimate cash flows considering all contractual terms of the financial instrument (for example, prepayment options) but do not consider future credit losses. The calculation includes all fees paid or received that are an integral part of the effective interest rate, transaction costs and all other premiums or discounts.
While it is generally our intention to hold performing loan assets until maturity, in some cases the loans are sold prior to maturity for risk mitigation purposes. Gains and losses on the sale of performing loans and gains on the sale of impaired loans are included in other income (expenses). Losses on sales of impaired loans are reported in the provision for (reversal of) credit losses.
LOAN GUARANTEES
In the ordinary course of business we issue loan guarantees to cover non-payment of principal, interest and fees due to banks and financial institutions providing loans to Canadian exporters or buyers of Canadian goods and services. Loan guarantees are initially recognized in the financial statements at fair value in the liability for loan guarantees. Fair value is determined to be the premium received. Subsequent to initial recognition, our liability is measured at the higher of the unamortized premiums and the allowance calculated that estimates the loss that is anticipated to be incurred as a result of satisfying our obligation under that guarantee.
Any increase in liability relating to loan guarantees is recorded in the consolidated statement of comprehensive income in the provision for (reversal of) credit losses. Guarantee fees received up-front are recognized in the consolidated statement of comprehensive income on a straight-line basis over the life of the guarantee. Guarantee fees that are received in arrears are recognized in the consolidated statement of comprehensive income on an accrual basis.
IMPAIRMENT OF FINANCIAL INSTRUMENTS
MARKETABLE SECURITIES
At the end of each reporting period, for marketable securities at amortized cost, an impairment loss is recognized when there is objective evidence that there has been a deterioration of credit quality subsequent to the initial recognition of the security to the extent that we no longer have reasonable assurance as to the timely collection of the full amount of the principal and interest. The impairment loss is measured as the difference between the asset’s carrying amount and the present value of estimated future cash flows discounted at the asset’s original effective interest rate.
|
| 88 | Adapting to the New Reality |
LOANS RECEIVABLE
Loans that have been individually assessed to be impaired meet one or more of the following criteria which represent objective evidence of impairment:
| | u | there has been a deterioration in credit quality to the extent that there is no longer reasonable assurance of the timely collection of the full amount of principal and interest; or |
| | u | for commercial loans, when there are payments overdue of 90 days or more, unless the loan is fully secured or collection efforts are reasonably expected to result in repayment of debt. |
If there is objective evidence that an impairment loss has occurred on an individual loan, the amount of the loss is measured as the difference between the loan’s carrying amount and the present value of any estimated future cash flows discounted at the loan’s original effective interest rate. The principal portion of the carrying amount of the loan is reduced through the use of an individual allowance and any accrued unpaid contractual interest and other receivables that form part of the carrying value of the loan are reduced to zero through income.
Thereafter, interest income on individually impaired loans is recognized based on the reduced carrying value of the loan using the original effective interest rate of the loan.
When a loan is uncollectible, it is written off against the individual allowance. Such loans are written off when all collection methods have been exhausted and no further prospect of recovery is likely.
Loans are returned to performing status when it is likely that contractual payments will continue pursuant to the terms of the loan. When restructured loans containing concessions are returned to performing status, their carrying value is adjusted to reflect the original yield of the loan or the weighted average yield in the case of loan consolidations.
SOVEREIGN LOANS RECEIVABLE
In compliance with the terms of Paris Club rescheduling agreements, contractual interest maturities for individually impaired sovereign loans are included in gross loans receivable. The Paris Club is an international forum of sovereign creditors, including Canada, who agree to formally reschedule a sovereign borrower’s debt when they are experiencing financial difficulties and are unable to meet their obligations.
Sovereign loans undergoing debt rescheduling are classified as individually impaired. The resulting agreements provide for the consolidation and deferred repayment of principal and interest maturities at concessional interest rates. While impaired, we reduce the loan’s carrying value by the impact of the interest rescheduled which is included in deferred loan revenue and other credits in Notes 4 and 5. At the time the loan is returned to performing status, the carrying value of the loan is adjusted to reflect the original yield of the loan.
LOAN GUARANTEES
Loan guarantees with impaired obligors are identified using the same criteria on the underlying loan as used to assess the impairment of direct loans carried at amortized cost. When the underlying loan is individually assessed to be impaired, it is probable that a call on the guarantee will be made representing an outflow of economic benefits that would be required to settle our obligation under the guarantee. The amount of any credit loss and any subsequent changes due to the re-evaluation of the obligation are recognized in the consolidated statement of comprehensive income as part of the provision for (reversal of) credit losses.
ALLOWANCE FOR LOSSES ON LOANS, LOAN COMMITMENTS AND LOAN GUARANTEES
The allowance for losses on loans, loan commitments and loan guarantees represents management’s best estimate of probable credit losses and is based on the incurred loss model. The allowance is determined based on a review of all loans, loan guarantees and commitments and includes both individual and collective allowances.
ALLOWANCES ON INDIVIDUALLY IMPAIRED LOANS
The individual allowance is the difference between the carrying value of the loan and the present value of the estimated future cash flows discounted at the loan’s original effective interest rate. The calculation of the present value of the estimated future cash flows of a collateralized loan asset reflects the cash flows that are expected to result on foreclosure less costs to obtain and sell the collateral whether or not foreclosure is probable.
If, in a subsequent period, the amount of the impairment loss either increases or decreases and the change can be related objectively to an event occurring after the impairment was recognized (such as a change in the obligor’s financial position or a change in the estimate of future cash flows), the previously recognized impairment loss is adjusted through the individual allowance.
The amount of initial impairment loss and any subsequent changes due to the re-evaluation of estimated future cash flows are recognized in the consolidated statement of comprehensive income as part of the provision for (reversal of) credit losses.
COLLECTIVE ALLOWANCE
A collective allowance is established for losses which we estimate to have occurred but have not yet been individually identified within our portfolio. Loans and loan guarantees not found to be individually impaired, as well as loan commitments are included in the collective assessment. The assessment is based on events that have occurred as of the reporting date and include factors such as business cycle trends and the fair value of collateral. The collective allowance is comprised of a base allowance, calculated using counterparty credit ratings, exposure, loss severity and probability of default factors. The collective allowance may also include concentration and market overlays.
|
EDC Annual Report 2012 | 89 |
CONSOLIDATED FINANCIAL STATEMENTS
For the base allowance we group our commercial performing loans, loan commitments and loan guarantees by industry of risk and then by secured and unsecured exposures. Sovereign exposures are classified into one portfolio. We assign credit ratings to our commercial and sovereign obligors using a system of nineteen credit ratings (AAA to C-) which are consistent with ratings used by our credit risk management policies. For secured portfolios, the exposure for each obligor is reduced by the fair value of collateral adjusted for estimated repossession costs. Based on these exposures we determine the appropriate base allowance. Loss severity is determined based on historical loan loss rates and by management estimates for each of our exposure categories. Default rates are based on an internally developed standard probability of default rate table.
We have a number of significant single name counterparty concentrations as a result of our mandate. A counterparty concentration overlay is established for counterparties whose exposure is deemed by management to represent an increased amount of risk. This overlay is applied to counterparties whose exposure exceeds 10% of our equity determined in accordance with the previous year’s audited financial statements.
We determine the collective allowance using various assumptions based upon current counterparty credit ratings. We also assess the extent to which these ratings do not reflect recent economic events that may result in credit deterioration. In these cases we will estimate the potential impact on our allowances and apply market overlays to specific industries or other exposure categories that we deem appropriate.
The collective allowances for performing loans and individual allowances for impaired loans are shown as a reduction to loans receivable on the consolidated statement of financial position. Collective and individual allowances for loan commitments and loan guarantees are shown as liabilities on the consolidated statement of financial position.
FORECLOSED ASSETS
Assets that are returned to us1 because of default under loan agreements are classified as held-for-use or held-for-sale according to management’s intention. Those classified as held-for-use are included in equipment available for lease or reclassified as finance leases. Assets classified as held-for-use are initially recorded at fair value and subsequently recorded at cost less accumulated depreciation and impairment losses. Those classified as held-for-sale include aircraft or component parts held-for-sale and are recorded in other assets initially at fair value less costs to sell. Any write-downs at recognition are reported in the provision for (reversal of) credit losses and any gains are recorded in other income (expenses). We determine fair value based on market prices obtained from an independent appraiser along with current market data and other information available to us. Subsequent impairment losses or reversals of impairment losses are determined as the difference between the carrying amount and the recoverable amount and are recorded in other income (expenses).
INVESTMENTS AT FAIR VALUE THROUGH PROFIT OR LOSS
Investments are comprised of direct investments that we have made in private and public companies and investments in private equity funds. Purchases and sales of these investments are recorded on a trade-date basis and are measured at fair value. Subsequent changes in fair value and any realized gains and losses are recorded in other income (expenses). Transaction costs are expensed as incurred and included within leasing and financing related expenses.
EQUIPMENT AVAILABLE FOR LEASE
Equipment available for lease consists of aircraft that were returned to us because of default under the related obligors’ loan agreements. While we do not in the ordinary course of business act as a lessor, from time to time we may engage in leasing activities for asset management purposes to maximize recoveries on returned aircraft and minimize potential losses.
Equipment available for lease is accounted for using the cost model and is stated at cost less accumulated depreciation and impairment losses. Upon initial recognition of the asset, engines are treated as a separate component and are depreciated on a straight-line basis over their remaining useful life net of their residual value. The remaining useful lives of the engines range from one to nineteen years. The remaining components of the aircraft are grouped together and depreciation is calculated on a straight-line basis over the remaining useful life of the aircraft after consideration of any residual value. The remaining useful lives of the aircraft range from one to nineteen years. Residual values of the aircraft and engines are reviewed on an annual basis. The costs of subsequent major overhauls are capitalized and amortized over the period to the next overhaul, from one to three years.
Depreciation as well as insurance and other costs related to the equipment available for lease are included in leasing and financing related expenses. Lease set-up costs are capitalized as part of the carrying value of the aircraft and amortized over a period equaling the term of the specific lease. Operating lease revenue is recognized on a straight-line basis over the terms of the underlying leases.
A review for impairment of equipment available for lease is performed quarterly. When events or changes in circumstances indicate that an aircraft may be impaired, or that a previously recorded impairment loss may no longer exist or may have increased or decreased, the recoverable amount of the asset is estimated.
| 1 | All aircraft returned to us for which the equity interest in the leveraged lease structure has been foreclosed have been registered with a number of trusts of which we are exposed, or have rights, to variable returns from our involvement with a Special Purpose Entity (SPE) and have the ability to affect those returns through our decision-making power over the SPE. | |
|
| 90 | Adapting to the New Reality |
|
An aircraft is impaired when its carrying amount exceeds its recoverable amount. The recoverable amount is the higher of the fair value less costs to sell and the value in use. Fair value is determined by considering market data and other information available to us. The value in use is the present value of the cash flows expected to result from the aircraft’s use and eventual disposition. Current lease rentals, as well as market information on projected future rentals and fair values, form the basis of this calculation. The amount of the impairment loss recognized is calculated as the difference between the carrying amount of the asset and its recoverable amount. When there is a reversal of impairment loss, the carrying amount of the aircraft is increased to the lower of the recoverable amount and the carrying amount that the aircraft would have had if the previous impairment loss had not been recognized. In both cases, the adjustment to the carrying value of the aircraft is recorded in other income (expenses). FINANCE LEASES Leases in which substantially all the risks and rewards of ownership are transferred to EDC are classified as finance leases. We have two types of finance leases – aircraft under finance leases and building under finance lease. LESSOR Aircraft under finance leases relate to aircraft that were returned to us due to default under the related obligor’s loan agreements and were subsequently placed back with the obligor under long-term, financing leases. These leases are recorded on the consolidated statement of financial position at the aggregate future minimum lease payments plus estimated residual values less unearned finance income. Residual values are based on independent appraisals and are reviewed periodically. An allowance for impairment is calculated consistent with the methodology used for our secured loan portfolio which is described on the previous page. Finance lease revenue is recognized in a manner that produces a constant rate of return on the investment in the lease. LESSEE Our head office building is held under a finance lease. The building has been recorded on our consolidated statement of financial position at its estimated fair value at the inception of the lease. Lease payments are allocated between finance charges and by repayment of the obligation under finance lease to achieve a constant rate of interest on the remaining balance of the obligation. The leased building is being depreciated over the most likely lease term. The estimated lease period is reviewed periodically. Finance charges and depreciation expense on the building are recorded as accommodation costs within administrative expenses in the consolidated statement of comprehensive income. PROPERTY, PLANT AND EQUIPMENT Property, plant and equipment are carried at cost less accumulated depreciation and impairment losses. Depreciation is charged on a straight-line basis over the estimated useful lives of the assets or the term of the relevant lease. The estimated useful lives and depreciation methods are reviewed at the end of each year, with the effect of any changes in estimate being accounted for on a prospective basis. The useful life used in the calculation of depreciation for furniture and equipment is five years and three years for computer hardware. Leasehold improvements are depreciated over the shorter of the term of the respective lease or the useful economic life of the leasehold improvement. Depreciation is recorded in administrative expenses. The gain or loss arising on the disposal or retirement of an item of property, plant and equipment is determined as the difference between the sale proceeds and the carrying amount of the asset, and is recognized in other income (expenses). INTANGIBLE ASSETS Intangible assets represent internally developed and purchased computer software. They are carried at cost less accumulated amortization and impairment losses. Amortization is charged on a straight-line basis over the estimated useful lives of the intangible assets. The estimated useful lives and amortization methods are reviewed at the end of each year, with the effect of any changes in estimate being accounted for on a prospective basis. The useful life used in the calculation of amortization for internally developed software and computer software is five years. Amortization is recorded in administrative expenses. INSURANCE PREMIUMS Insurance contracts are those contracts where we have accepted significant insurance risk from the policyholders by agreeing to compensate the policyholders if a specified uncertain future event adversely affects the policyholders. Premiums on insurance policies are deferred and recognized in income over the term of the policy on a straight-line basis. RECOVERABLE INSURANCE CLAIMS Recoverable insurance claims represent the portion of insurance claims paid that are expected to be recovered. Recoverable insurance claims are reviewed and adjusted on a quarterly basis with any subsequent net gain or loss on recovery credited or charged to claims-related expenses (recovery). |
|
EDC Annual Report 2012 | 91 |
CONSOLIDATED FINANCIAL STATEMENTS
POLICY AND CLAIMS LIABILITIES
Policy and claims liabilities represent our estimate of future claims under the terms and conditions of our insurance policies. An actuarial valuation, which conforms to the recommendations of the Canadian Institute of Actuaries, is performed to establish our liability. The valuation uses simulation techniques and assumptions derived from our own experience (severity of loss, loss development, frequency of claim and discount rates used) relevant to our insurance programs. The liability is comprised of reported claims, incurred but not reported claims (IBNR) and management’s best estimate of the net present value of net future claims under existing policies.
Deferred insurance premiums are the portion of premiums received on policies written that relate to risk periods after the current fiscal year. To the extent that our deferred premiums are not sufficient to cover our liability, an allowance is established. Any adjustments to the liability are reflected in claims-related expenses (recovery) in the period in which they become known. Future developments may result in claims which are materially different than the allowance provided.
Policy and claims liabilities on our consolidated statement of financial position include both the deferred premiums and the allowance.
REINSURANCE
In the ordinary course of business, we assume and cede reinsurance with other insurance companies. We cede reinsurance to mitigate our risk. The ceding arrangements provide greater diversification of the business and minimize the net loss potential arising from large risks. Ceded reinsurance contracts do not relieve us of our obligations to the insured but they do provide for the recovery of claims arising from the liabilities ceded. We also assume reinsurance and thereby take on risk. Reinsurance premiums, unearned premiums ceded to reinsurers and recoveries and estimates of recoveries on claims are recorded in the same manner as if the reinsurance were considered direct business. Amounts recoverable from the reinsurers are estimated in a manner consistent with the claims liability associated with the reinsured policy and are recorded within reinsurers’ share of policy and claims liabilities. Reinsurance assets or liabilities are derecognized when the contractual rights are extinguished or expire.
Reinsurance assets are reviewed for impairment at each reporting date or more frequently when an indication of impairment arises during the reporting year. Impairment occurs when there is objective evidence as a result of an event that occurred after initial recognition of the reinsurance asset that EDC may not receive all outstanding amounts due under the terms of the contract and the event has a reliably measurable impact on the amounts that EDC will receive from the reinsurer.
DEFERRED REVENUE
Deferred loan revenue, which consists of exposure, administration and other upfront loan fees, is included in loans receivable and amortized as a yield increment over the term of the related loan. Guarantee fee revenue and insurance premium revenue are recognized as deferred revenue and are amortized over the term of the related guarantee or insurance policy.
DERIVATIVE INSTRUMENTS
Derivative instruments (derivatives) are financial contracts that derive their value from underlying changes in interest rates, foreign exchange rates, equities, credit spreads or other financial measures. Derivatives that we currently use include interest rate swaps, cross currency interest rate swaps, foreign exchange swaps, foreign exchange forwards, non-deliverable forwards, non-deliverable foreign exchange swaps and credit default swaps.
We use derivatives to manage interest rate risk, foreign exchange risk and credit risk. These derivatives are only contracted with creditworthy counterparties in accordance with policies established by our Risk Management Office and approved by our Board of Directors.
We do not apply hedge accounting to our derivatives. Derivatives are accounted for at fair value and are recognized on the consolidated statement of financial position upon the trade date and are removed from the consolidated statement of financial position when they expire or are terminated. Derivatives with a positive fair value are reported as derivative instruments within assets, while derivatives with a negative fair value are reported as derivative instruments within liabilities. Realized and unrealized gains or losses due to a change in fair value of derivatives associated with our long and short-term loans payable and those associated with our marketable securities are recorded in other income (expenses). Realized and unrealized gains and losses due to changes in fair value of credit default swaps are also included in other income (expenses).
We also hold a portfolio of derivatives which we use to manage the foreign exchange risk associated with using our capital to fund our operations largely denominated in U.S. dollars. All income and expenses associated with this portfolio are included in interest expense, while realized and unrealized gains and losses are recorded in other income (expenses).
Long-term currency swaps are considered part of the financing cash flows on the consolidated statement of cash flows because these swaps are used to manage our funding. We often issue debt in currencies which offer a more advantageous cost. We then use currency swaps to bring those funds into the currency required to disburse on our loans. All other swaps are included in operating cash flows as they are used to alter the interest rate risk profile of the portfolio.
|
| 92 | Adapting to the New Reality |
LOANS PAYABLE
We have designated the majority of our debt, including structured debt, at fair value through profit or loss in order to obtain the same accounting treatment as the related derivatives. In general, these derivatives are transacted to manage interest and foreign exchange rate risk on the related debt. Contractual interest on our long-term debt and commercial paper is recorded in interest expense. Any change in fair value on these instruments is recorded in other income (expenses).
Our fixed rate bonds which do not have derivatives associated with them are carried at amortized cost using the effective interest rate method with interest recorded in interest expense.
The transaction costs related to our loans payable carried at amortized cost are capitalized. The transaction costs related to our loans payable designated at fair value through profit or loss are expensed as they are incurred and are included within interest expense.
Any fair value gains or losses on initial recognition of our debt or derivatives at Level 3 on the fair value hierarchy are deferred and amortized over the life of the instruments.
ACCOUNTS PAYABLE AND OTHER CREDITS
Accounts payable and other credits are carried at amortized cost.
TRANSLATION OF FOREIGN CURRENCY
All monetary assets and liabilities denominated in foreign currencies are translated into Canadian dollars at exchange rates prevailing at the end of the year. Income and expenses are translated at either daily or monthly average exchange rates in effect during the year. Exchange gains and losses resulting from the translation of foreign currency balances and transactions are included in other income (expenses).
RETIREMENT BENEFIT OBLIGATIONS
We maintain defined benefit pension plans, a defined contribution plan and other post-retirement benefit plans including a retiring allowance plan and life insurance, health and dental care benefits. The defined benefit plan is only available for employees hired prior to January 1, 2012.
The accrued benefit obligations are actuarially determined using the projected unit credit method (which incorporates management’s best estimate of future salary levels, retirement ages of employees and other actuarial factors).
Pension fund assets are valued at fair value for the purpose of calculating the expected return on plan assets.
The defined benefit expense (included in administrative expenses) consists of the actuarially determined retirement benefits for the current year’s service, imputed interest on projected benefit obligations net of interest earned on any plan assets and the amortization of actuarial gains or losses and other items over the average remaining working lives of employees expected to receive benefits under the plans.
Actuarial gains or losses arise from the difference between the actual rate of return and the expected rate of return on plan assets for that period and from changes in actuarial assumptions used to determine the accrued benefit obligation. They are amortized on a straight-line basis over the average remaining working lives of employees expected to receive benefits under the plans only if the net actuarial gain or loss at the beginning of the year is in excess of 10% of the greater of the accrued benefit obligation and the fair value of plan assets. Amounts below the 10% threshold are not recognized in income.
FUTURE ACCOUNTING CHANGES
A number of new standards, interpretations, amendments and improvements have been issued by the International Accounting Standards Board (IASB). The standards that are relevant to EDC are listed below. Except as indicated, the standards are effective for annual periods beginning on or after January 1, 2013.
New standards include:
| | u | IFRS 10 – Consolidated Financial Statements – provides a new definition of control that focuses on whether the investor is exposed, or has rights to variable returns from its involvement with the investee and also has the ability to affect the returns through its power over the investee. |
| | u | IFRS 11 – Joint Arrangements – focuses on the rights and obligations of an arrangement, rather than its legal form in determining whether a joint operation or joint venture exists. With this new standard the equity method must be used to account for all joint ventures. |
| | u | IFRS 12 – Disclosure of Interest in Other Entities – outlines the disclosure requirements for all forms of interests in other entities, both on and off the balance sheet. |
| | u | IFRS 13 – Fair Value Measurement – provides a consistent definition of fair value, guidance on how it should be measured and disclosure requirements for use across all IFRSs. |
|
EDC Annual Report 2012 | 93 |
CONSOLIDATED FINANCIAL STATEMENTS
Amended standards include:
| | u | IAS 1 – Presentation of Financial Statements – amendments to revise the way other comprehensive income is presented. Effective for annual periods beginning on or after July 1, 2012. |
| | u | IAS 19 – Employee Benefits – we have quantified the impact of implementing this amendment, which was issued by the IASB in June 2011. The amendment removes the option to use the corridor method to defer gains and losses; requires that the impact of re-measuring pension assets and liabilities be recorded in other comprehensive income; and provides enhanced disclosure requirements for defined benefit plans. In addition, under the revised standard the expected rate of return on plan assets will be replaced with the net interest approach. The net interest approach is measured based on the plan’s discount rate. The new requirements will be effective January 1, 2013 and must be applied retrospectively. The transition adjustment upon adoption of the amended standard will reduce opening retained earnings by $259 million. In addition, 2012 pension expense is expected to decrease by $5 million in restated comparatives. |
| | u | IAS 27 – Separate Financial Statements – this standard has been renamed and amended to maintain the accounting guidance on issuing separate financial statements. |
| | u | IAS 28 – Investments in Associates and Joint Ventures – amended as a consequence of the new standard on joint arrangements. |
Except as otherwise disclosed, we do not expect these standards to have a significant impact on future financial results.
3. Marketable Securities
We maintain liquidity sufficient to meet general operating requirements, to maintain stability in our short-term borrowing program and to provide flexibility in achieving corporate objectives. Consistent with our business model for managing these instruments, they are carried at fair value through profit or loss or at amortized cost.
| | | | | | | | | | | | | | | | | | | | | | | | |
(in millions of Canadian dollars) | | | | | | | | Dec. 31, 2012 | | | | | | | | | Dec. 31, 2011 | |
Issued or guaranteed by: | |
| At fair value
through profit or loss |
| |
| At amortized
cost |
(2) | | | Total | | |
| At fair value
through profit or loss |
| |
| At amortized
cost |
(2) | | | Total | |
U.S. government | | | 2,954 | | | | 55 | | | | 3,009 | | | | 2,798 | | | | 57 | | | | 2,855 | |
Financial institutions | | | 673 | | | | – | | | | 673 | | | | 506 | | | | – | | | | 506 | |
Other government | | | 320 | | | | – | | | | 320 | | | | 217 | | | | – | | | | 217 | |
Canadian government(1) | | | 121 | | | | 19 | | | | 140 | | | | 185 | | | | 19 | | | | 204 | |
Corporate | | | 14 | | | | – | | | | 14 | | | | 14 | | | | – | | | | 14 | |
Total marketable securities | | | $4,082 | | | | $74 | | | | $4,156 | | | | $3,720 | | | | $76 | | | | $3,796 | |
| (1) | Canadian government includes federal and provincial governments and Crown corporations. |
| (2) | Represent securities held by our subsidiary Exinvest Inc. |
The following table provides a breakdown of our marketable securities by remaining term to maturity:
| | | | | | | | | | | | | | | | | | | | | | | | | | | | | | | | |
(in millions of Canadian dollars) | | | | | | | | Dec. 31, 2012 | | | | | | | | | Dec. 31, 2011 | |
| | | | Remaining term to maturity | | | | | | | | Remaining term to maturity | | | | | |
| | |
| Under 1
year |
| |
| 1 to 3
years |
| |
| Over 3
years |
| | | Total | | |
| Under 1
year |
| |
| 1 to 3
years |
| |
| Over 3
years |
| | | Total | |
At fair value through profit or loss | | | | | | | | | | | | | | | | | | | | | | | | | | | | | | | | |
Short-term instruments | | | 1,951 | | | | – | | | | – | | | | 1,951 | | | | 1,690 | | | | – | | | | – | | | | 1,690 | |
Long-term fixed rate securities | | | 103 | | | | 799 | | | | 1,229 | | | | 2,131 | | | | 104 | | | | 742 | | | | 1,184 | | | | 2,030 | |
Total at fair value through profit or loss | | | 2,054 | | | | 799 | | | | 1,229 | | | | 4,082 | | | | 1,794 | | | | 742 | | | | 1,184 | | | | 3,720 | |
At amortized cost | | | | | | | | | | | | | | | | | | | | | | | | | | | | | | | | |
Long-term fixed rate securities | | | 18 | | | | 37 | | | | 19 | | | | 74 | | | | – | | | | 38 | | | | 38 | | | | 76 | |
Total marketable securities | | | $2,072 | | | | $836 | | | | $1,248 | | | | $4,156 | | | | $1,794 | | | | $780 | | | | $1,222 | | | | $3,796 | |
|
| 94 | Adapting to the New Reality |
4. Loans Receivable
The following table presents the various components of loans receivable and the contractual maturity and related contractual effective yields for gross loans receivable. The yields are computed on a weighted average basis by amount and term. Floating rate yields are expressed as spreads over base rates which consist mainly of LIBOR for U.S. dollars and CDOR for Canadian dollars.
| | | | | | | | | | | | | | | | | | | | | | | | | | | | | | | | | | | | | | | | |
(in millions of Canadian dollars) | | Dec. 31, 2012 | | | Dec. 31, 2011 | |
| | |
| Floating
$ |
| |
| Spread
% |
| |
| Fixed
$ |
| | | Yield to maturity % | | |
| Total
$ |
| |
| Floating
$ |
| |
| Spread
% |
| |
| Fixed
$ |
| |
| Yield to
maturity % |
| |
| Total
$ |
|
Performing: | | | | | | | | | | | | | | | | | | | | | | | | | | | | | | | | | | | | | | | | |
Past due | | | 11 | | | | 3.72 | | | | – | | | | – | | | | 11 | | | | 20 | | | | 1.96 | | | | 8 | | | | 6.25 | | | | 28 | |
2012 | | | – | | | | – | | | | – | | | | – | | | | – | | | | 2,807 | | | | 1.86 | | | | 1,034 | | | | 5.30 | | | | 3,841 | |
2013 | | | 3,378 | | | | 1.94 | | | | 1,035 | | | | 5.24 | | | | 4,413 | | | | 2,554 | | | | 2.04 | | | | 1,010 | | | | 5.44 | | | | 3,564 | |
2014 | | | 2,834 | | | | 2.14 | | | | 1,047 | | | | 5.34 | | | | 3,881 | | | | 2,977 | | | | 1.99 | | | | 974 | | | | 5.50 | | | | 3,951 | |
2015 | | | 3,880 | | | | 2.54 | | | | 902 | | | | 5.46 | | | | 4,782 | | | | 2,868 | | | | 2.58 | | | | 833 | | | | 5.65 | | | | 3,701 | |
2016 | | | 2,970 | | | | 2.03 | | | | 810 | | | | 5.39 | | | | 3,780 | | | | 2,417 | | | | 2.21 | | | | 729 | | | | 5.57 | | | | 3,146 | |
2017 | | | 2,550 | | | | 2.43 | | | | 916 | | | | 4.90 | | | | 3,466 | | | | 1,154 | | | | 2.45 | | | | 743 | | | | 5.39 | | | | 1,897 | |
2018 – 2022 | | | 4,314 | | | | 2.15 | | | | 2,675 | | | | 4.72 | | | | 6,989 | | | | 3,437 | | | | 1.97 | | | | 2,204 | | | | 5.04 | | | | 5,641 | |
2023 and beyond | | | 1,505 | | | | 1.89 | | | | 349 | | | | 4.51 | | | | 1,854 | | | | 1,254 | | | | 1.58 | | | | 265 | | | | 4.70 | | | | 1,519 | |
Performing gross loans receivable | | | 21,442 | | | | 2.15 | | | | 7,734 | | | | 4.86 | | | | 29,176 | | | | 19,488 | | | | 2.03 | | | | 7,800 | | | | 5.20 | | | | 27,288 | |
Impaired (Note 5) | | | 868 | | | | 2.40 | | | | 292 | | | | 5.83 | | | | 1,160 | | | | 1,033 | | | | 1.76 | | | | 772 | | | | 5.41 | | | | 1,805 | |
Gross loans receivable | | | $22,310 | | | | | | | | $8,026 | | | | | | | | $30,336 | | | | $20,521 | | | | | | | | $8,572 | | | | | | | | $29,093 | |
Accrued interest and fees receivable | | | | | | | | | | | | | | | | | | | 157 | | | | | | | | | | | | | | | | | | | | 145 | |
Deferred loan revenue and other credits | | | | | | | | | | | | | | | | | | | (362 | ) | | | | | | | | | | | | | | | | | | | (558 | ) |
Loans receivable | | | | | | | | | | | | | | | | | | | $30,131 | | | | | | | | | | | | | | | | | | | | $28,680 | |
At the end of December 2012, the floating rate performing gross loans receivable yield was 2.83% (2011 – 3.02%) with an average term to reset of 109 days (2011 – 95 days).
Sovereign loans represent 4% of total performing gross loans receivable, consistent with December 31, 2011.
We have country risk concentrations as outlined below:
| | | | | | | | | | | | | | | | |
(in millions of Canadian dollars) | | Dec. 31, 2012 | | | Dec. 31, 2011 | |
Country | |
| Performing gross
loans receivable |
| | | % | | |
| Performing gross
loans receivable |
| | | % | |
United States | | | 7,326 | | | | 25 | | | | 8,373 | | | | 31 | |
Canada | | | 3,945 | | | | 14 | | | | 3,508 | | | | 13 | |
Brazil | | | 2,252 | | | | 8 | | | | 1,391 | | | | 5 | |
Mexico | | | 1,888 | | | | 6 | | | | 1,744 | | | | 6 | |
India | | | 1,472 | | | | 5 | | | | 1,458 | | | | 5 | |
Australia | | | 1,153 | | | | 4 | | | | 730 | | | | 3 | |
Chile | | | 1,136 | | | | 4 | | | | 959 | | | | 4 | |
United Kingdom | | | 861 | | | | 3 | | | | 915 | | | | 3 | |
Qatar | | | 745 | | | | 3 | | | | 768 | | | | 3 | |
Germany | | | 561 | | | | 2 | | | | 428 | | | | 2 | |
Other | | | 7,837 | | | | 26 | | | | 7,014 | | | | 25 | |
Total | | | $29,176 | | | | 100 | | | | $27,288 | | | | 100 | |
|
EDC Annual Report 2012 | 95 |
CONSOLIDATED FINANCIAL STATEMENTS
We have single counterparty performing gross loans receivable totalling $2,772 million with two airlines (2011 – $3,210 million with two airlines) located in the United States, $2,190 million with two oil and gas entities located in Mexico and Brazil (2011 – $892 million with one oil and gas entity in Mexico) and $954 million with an extractive entity located in Brazil.
We sold $197 million in loans to various counterparties in 2012 (2011 – $139 million). This amount includes nine performing loans totalling $107 million (2011 – five performing loans totalling $101 million). The performing loans were sold without recourse and the sales resulted in a loss of $1 million (2011 – $2 million).
The breakdown of our gross loans receivable by credit grade is as follows:
| | | | | | | | | | | | | | | | |
(in millions of Canadian dollars) | | Dec. 31, 2012 | | | Dec. 31, 2011 | |
| | | | $ | | | | % of total | | | | $ | | | | % of total | |
Investment grade* | | | 14,480 | | | | 48 | | | | 11,972 | | | | 41 | |
Below investment grade | | | 14,696 | | | | 48 | | | | 15,316 | | | | 53 | |
Individually impaired loans (Note 5) | | | 1,160 | | | | 4 | | | | 1,805 | | | | 6 | |
Total gross loans receivable | | | $30,336 | | | | 100 | | | | $29,093 | | | | 100 | |
| * | Investment grade exposure is defined by those obligors with credit ratings of BBB- and above. |
We employ a range of policies to mitigate credit risk on our commercial loans which includes obtaining certain forms of security interest. The principal types of security interest are mortgages on equipment (mainly aircraft and rolling stock) and real estate, assignments or pledges on various business assets such as trade receivables, inventory, property, plant and equipment, equity shares and bank accounts. Other principal forms of credit enhancement include guarantees from counterparties with higher credit ratings who may be related to the borrower, such as a parent company.
As at December 31, 2012, 33% of our loans are collateralized mainly by aircraft and rolling stock (2011 – 38%).
Our concentrations of risk are managed by obligor, country and industry sector. The maximum gross loans receivable exposure to any one obligor as at December 31, 2012 was $1,581 million (2011 – $1,849 million) before taking into account collateral and $669 million (2011 – $838 million) net of collateral.
A loan payment is considered past due when the obligor has failed to make the payment by the contractual due date. The breakdown of our gross loans receivable that are past due but not impaired is as follows:
| | | | | | | | |
(in millions of Canadian dollars) | | Dec. 31, 2012 | | | Dec. 31, 2011 | |
Less than 30 days | | | 7 | | | | 26 | |
30 to 180 days | | | 4 | | | | 1 | |
Greater than 180 days | | | – | | | | 1 | |
Total | | | $11 | | | | $28 | |
The following reflects the movement in gross loans receivable during the year:
| | | | | | | | |
(in millions of Canadian dollars) | | Dec. 31, 2012 | | | Dec. 31, 2011 | |
Balance at beginning of year | | | 29,093 | | | | 26,997 | |
Disbursements | | | 11,887 | | | | 10,330 | |
Loan purchases | | | – | | | | 63 | |
Principal repayments | | | (9,082 | ) | | | (8,609 | ) |
Value of repossessed assets from loan foreclosures | | | (465 | ) | | | (1 | ) |
Loans written off | | | (408 | ) | | | (76 | ) |
Principal recoveries from asset sales | | | (150 | ) | | | (122 | ) |
Foreign exchange translation | | | (552 | ) | | | 511 | |
Other* | | | 13 | | | | – | |
Balance at end of year | | | $30,336 | | | | $29,093 | |
| * | Includes capitalized interest of $9 million (2011 – $4 million) and financing of aircraft |
| | previously held-for-sale of $4 million (2011 – nil). In 2012 there were no receipts from the |
| | Government of Canada for sovereign debt relief (2011 – $4 million). |
|
| 96 | Adapting to the New Reality |
5. Individually Impaired Loans
The following table shows the carrying amount of loans specifically identified as impaired:
| | | | | | | | |
(in millions of Canadian dollars) | | Dec. 31, 2012 | | | Dec. 31, 2011 | |
Gross loans receivable | | | | | | | | |
Sovereign | | | 78 | | | | 248 | |
Commercial | | | 1,082 | | | | 1,557 | |
| | | 1,160 | | | | 1,805 | |
Less: Deferred loan revenue and other credits* | | | 24 | | | | 205 | |
Individual allowance | | | 298 | | | | 422 | |
Carrying amount of individually impaired loans | | | $838 | | | | $1,178 | |
| * | Reflects the write-off of two impaired loans to sovereign borrowers totalling $175 million |
| | which had a zero carrying value. |
The following reflects the movement in individually impaired gross loans receivable during the year:
| | | | | | | | |
(in millions of Canadian dollars) | | Dec. 31, 2012 | | | Dec. 31, 2011 | |
Balance at beginning of year | | | 1,805 | | | | 710 | |
Loans classified as impaired | | | 361 | | | | 1,383 | |
Disbursements on loan guarantees called | | | 72 | | | | 21 | |
Value of repossessed assets from loan foreclosures | | | (465 | ) | | | (1 | ) |
Loans written off | | | (407 | ) | | | (74 | ) |
Principal repayments | | | (123 | ) | | | (19 | ) |
Principal recoveries from asset sales | | | (46 | ) | | | (23 | ) |
Loans reinstated to performing | | | – | | | | (191 | ) |
Foreign exchange translation | | | (37 | ) | | | 1 | |
Other* | | | – | | | | (2 | ) |
Balance at end of year | | | $1,160 | | | | $1,805 | |
| * | In 2012 there was no capitalized interest (2011 – $2 million) and there were no receipts |
| | from the Government of Canada for sovereign debt relief (2011 – $4 million). |
In the third and fourth quarters of 2012, EDC repossessed a total of 34 aircraft from two impaired airline obligors for which we had provided secured financing, and as a result $465 million of related loans were removed from our books and replaced with aircraft assets which have been or will be leased out. This also resulted in loan principal write-offs totalling $58 million.
During the year, impaired loans to 29 commercial borrowers and 2 sovereign borrowers, totalling $407 million of principal (2011 – 35 commercial borrowers totalling $74 million and sovereign borrowers nil) were written off. These loans were written off after all collection methods had been exhausted and no further prospect of recovery was likely. In the case of the sovereign write-offs, pursuant to the terms set out by the Paris Club these countries were granted full debt forgiveness by their creditor countries. For the five years ended December 2012, cumulative write-offs of impaired loans totalled $624 million, of which 88% occurred in the past three years.
During 2012, payments of principal and interest from impaired borrowers, as well as proceeds from sales of impaired loans were $225 million (2011 – $47 million). These amounts were applied against the carrying value of the impaired loans.
We sold $91 million in impaired loans to various counterparties in 2012 (2011 – $38 million). We recovered $46 million and the remaining $45 million was written off.
Interest income recognized on impaired loans was $41 million in 2012 (2011 – $9 million).
As at December 31, 2012, impaired loans totalling $776 million (2011 – $1,296 million) were secured by assets consisting of aircraft with an estimated fair value of $502 million (2011 – $925 million).
|
EDC Annual Report 2012 | 97 |
CONSOLIDATED FINANCIAL STATEMENTS
6. Allowance for Losses on Loans, Loan Commitments and Loan Guarantees
The composition of the allowance for losses on loans, loan commitments and loan guarantees is as follows:
| | | | | | | | |
| (in millions of Canadian dollars) | | Dec. 31, 2012 | | | Dec. 31, 2011 | |
Base allowance | | | | | | | | |
Investment grade exposure | | | 70 | | | | 98 | |
Non-investment grade exposure | | | 869 | | | | 1,216 | |
Total base allowance | | | 939 | | | | 1,314 | |
Counterparty concentration | | | | | | | | |
Investment grade exposure | | | 4 | | | | 2 | |
Non-investment grade exposure | | | 93 | | | | 102 | |
Total counterparty concentration | | | 97 | | | | 104 | |
Total collective allowance* | | | 1,036 | | | | 1,418 | |
Allowance for individually impaired loans, loan commitments and loan guarantees | | | 314 | | | | 509 | |
Total allowance for losses on loans, loan commitments and loan guarantees | | | $1,350 | | | | $1,927 | |
| * | Includes allowance on finance leases of $17 million (2011 – $23 million). |
The following table provides a breakdown of our allowance for losses on loans, loan commitments and loan guarantees by commercial and sovereign risk:
| | | | | | | | | | | | | | | | | | | | | | | | | | | | | | | | |
(in millions of Canadian dollars) | | Dec. 31, 2012 | | | Dec. 31, 2011 | |
| | | | Collective | | | | | | Individual | | | | | | Total | | | | Collective | | | | | | Individual | | | | | | Total | |
Commercial | | | 958 | | | | | | 275 | | | | | | 1,233 | | | | 1,327 | | | | | | 476 | | | | | | 1,803 | |
Sovereign | | | 78 | | | | | | 39 | | | | | | 117 | | | | 91 | | | | | | 33 | | | | | | 124 | |
Total allowance | | | $1,036 | | | | | | $314 | | | | | | $1,350 | | | | $1,418 | | | | | | $509 | | | | | | $1,927 | |
During the year, changes to the allowance for losses on loans, loan commitments and loan guarantees were as follows:
| | | | | | | | | | | | | | | | | | | | | | | | |
| (in millions of Canadian dollars) | | Dec. 31, 2012 | | | Dec. 31, 2011 | |
| | | | Collective | | | | Individual | | | | Total | | | | Collective | | | | Individual | | | | Total | |
Allowance for losses on loans | | | | | | | | | | | | | | | | | | | | | | | | |
Balance at beginning of year | | | 1,258 | | | | 422 | | | | 1,680 | | | | 1,304 | | | | 257 | | | | 1,561 | |
Provision for (reversal of) losses on loans | | | (355 | ) | | | 92 | | | | (263 | ) | | | (65 | ) | | | 227 | | | | 162 | |
Write-offs | | | – | | | | (212 | ) | | | (212 | ) | | | – | | | | (70 | ) | | | (70 | ) |
Recovery of amounts written-off in prior years | | | – | | | | 5 | | | | 5 | | | | – | | | | 5 | | | | 5 | |
Foreign exchange translation | | | (19 | ) | | | (9 | ) | | | (28 | ) | | | 19 | | | | 3 | | | | 22 | |
Total | | | 884 | | | | 298 | | | | 1,182 | | | | 1,258 | | | | 422 | | | | 1,680 | |
Allowance for losses on loan commitments | | | | | | | | | | | | | | | | | | | | | | | | |
Balance at beginning of year | | | 41 | | | | – | | | | 41 | | | | 93 | | | | – | | | | 93 | |
Provision for (reversal of) losses on loan commitments | | | 15 | | | | 3 | | | | 18 | | | | (53 | ) | | | – | | | | (53 | ) |
Foreign exchange translation | | | (1 | ) | | | – | | | | (1 | ) | | | 1 | | | | – | | | | 1 | |
Total | | | 55 | | | | 3 | | | | 58 | | | | 41 | | | | – | | | | 41 | |
Allowance for losses on loan guarantees* | | | | | | | | | | | | | | | | | | | | | | | | |
Balance at beginning of year | | | 119 | | | | 87 | | | | 206 | | | | 163 | | | | 22 | | | | 185 | |
Provision for (reversal of) losses on loan guarantees | | | (21 | ) | | | (74 | ) | | | (95 | ) | | | (50 | ) | | | 66 | | | | 16 | |
Foreign exchange translation | | | (1 | ) | | | – | | | | (1 | ) | | | 6 | | | | (1 | ) | | | 5 | |
Total | | | 97 | | | | 13 | | | | 110 | | | | 119 | | | | 87 | | | | 206 | |
Total allowance for losses on loans, loan commitments and loan guarantees | | | $1,036 | | | | $314 | | | | $1,350 | | | | $1,418 | | | | $509 | | | | $1,927 | |
| * | Included in the liability for loan guarantees. |
|
| 98 | Adapting to the New Reality |
In 2011, we initiated a multi-year project to update and standardize our credit risk rating methodology and processes. In 2012, this project resulted in changes to our allowance assumptions for probability of default. The updated probability of default rates were generated by a new credit risk rating tool that uses external historical experience to generate default tables. In prior years, default rates were based on a weighted average of Moody’s and Standard & Poor’s default tables. The difference between using our new tool and the approach from prior years as at December 31, 2012 is a $93 million release in provision and represents a change in accounting estimate. The impact on future periods has not been determined as it is impracticable to estimate.
In June 2012, we updated the loss given default assumption in our collective allowance calculation for our commercial unsecured and sovereign portfolios. The reduction in our assumption was a result of an analysis done on the historical loss rate of our portfolio. The difference between using the updated assumption and the prior assumption as at December 31, 2012 is a $53 million release in provision and represents a change in accounting estimate. The impact on future periods has not been determined as it is impracticable to estimate.
The provision for individually impaired loans, loan commitments and loan guarantees for 2012 of $21 million (2011 – $293 million) includes:
| | u | a charge of $294 million (2011 – $376 million) as a result of new impairments and increases to allowances on existing impaired obligors, and |
| | u | reversals of $273 million (2011 – $83 million) due to changes in the estimated future cash flows or recoveries anticipated from existing impaired obligors. |
7. Investments at Fair Value Through Profit or Loss
The investments portfolio is comprised of the following:
| | | | | | | | | | | | | | | | |
| (in millions of Canadian dollars) | | Dec. 31, 2012 | | | Dec. 31, 2011 | |
| | | | Cost | | | | Fair value | | | | Cost | | | | Fair value | |
Direct investments | | | | | | | | | | | | | | | | |
Loans and debt securities | | | 11 | | | | 7 | | | | 15 | | | | 9 | |
Equity interests | | | 51 | | | | 36 | | | | 52 | | | | 48 | |
| | | | 62 | | | | 43 | | | | 67 | | | | 57 | |
Fund investments | | | 402 | | | | 386 | | | | 344 | | | | 328 | |
Total investments | | | $464 | | | | $429 | | | | $411 | | | | $385 | |
Investments revenue was $4 million in 2012 (2011 – $12 million). There was an unrealized loss of $10 million resulting from the change in fair value of investments in 2012 (2011 – $14 million). In 2012, we realized a capital gain of $13 million from the sale of two direct investments, recorded a capital gain of $10 million from six funds and a realized loss of $10 million from the write-off of three direct and one fund investments.
|
EDC Annual Report 2012 | 99 |
CONSOLIDATED FINANCIAL STATEMENTS
8. Equipment Available for Lease
Equipment available for lease consists of aircraft that were returned to us because of default under the related obligors’ loan agreements.
| | | | | | | | | | | | | | | | | | | | | | | | | | | | | | | | |
| (in millions of Canadian dollars) | | Dec. 31, 2012 | | | Dec. 31, 2011 | |
| | | | Aircraft | | | | Engines | | |
| Major
overhaul
costs |
| | | Total | | | | Aircraft | | | | Engines | | |
| Major
overhaul
costs |
| | | Total | |
Cost: | | | | | | | | | | | | | | | | | | | | | | | | | | | | | | | | |
Balance at beginning of year | | | 79 | | | | 60 | | | | 12 | | | | 151 | | | | 167 | | | | 132 | | | | 22 | | | | 321 | |
Additions | | | 364 | | | | 124 | | | | 4 | | | | 492 | | | | – | | | | – | | | | – | | | | – | |
Transfers to held-for-sale | | | (5 | ) | | | (3 | ) | | | – | | | | (8 | ) | | | (88 | ) | | | (72 | ) | | | (10 | ) | | | (170 | ) |
Balance at end of year | | | 438 | | | | 181 | | | | 16 | | | | 635 | | | | 79 | | | | 60 | | | | 12 | | | | 151 | |
Accumulated depreciation and impairment: | | | | | | | | | | | | | | | | | | | | | | | | | | | | | | | | |
Balance at beginning of year | | | (51 | ) | | | (37 | ) | | | (9 | ) | | | (97 | ) | | | (94 | ) | | | (72 | ) | | | (15 | ) | | | (181 | ) |
Depreciation expense | | | (11 | ) | | | (5 | ) | | | (2 | ) | | | (18 | ) | | | (8 | ) | | | (5 | ) | | | (3 | ) | | | (16 | ) |
Elimination on transfer to held-for-sale | | | 3 | | | | 2 | | | | – | | | | 5 | | | | 51 | | | | 40 | | | | 9 | | | | 100 | |
Balance at end of year | | | (59 | ) | | | (40 | ) | | | (11 | ) | | | (110 | ) | | | (51 | ) | | | (37 | ) | | | (9 | ) | | | (97 | ) |
Carrying amount | | | 379 | | | | 141 | | | | 5 | | | | 525 | | | | 28 | | | | 23 | | | | 3 | | | | 54 | |
Lease setup costs | | | | | | | | | | | | | | | – | | | | | | | | | | | | | | | | 1 | |
Total equipment available for lease | | | | | | | | | | | | | | | $525 | | | | | | | | | | | | | | | | $55 | |
Number of aircraft* | | | | | | | | | | | | | | | 54 | | | | | | | | | | | | | | | | 20 | |
| * | In addition to the 54 aircraft, there are also two spare engines represented in this portfolio. In 2011, the 20 aircraft represent 19 aircraft and one airframe. |
On a quarterly basis we assess whether there is any indication of impairment of our aircraft given current market conditions. In 2012, recent aircraft sales, leasing rates and other market conditions did not lead to any indication of impairment of our aircraft within this portfolio and therefore no impairment loss was recorded in 2012. Based on these same conditions, there was also no indication that a reversal of previous impairment losses would be required.
During 2012, 34 aircraft and two spare engines valued at $465 million (2011 – nil) that were returned to us as a result of loan foreclosures, were transferred into this portfolio. Also new to this portfolio are 2 aircraft valued at $23 million that were received from a non-monetary exchange agreement at the end of 2011. In 2011, these aircraft were classified under other assets as they were to undergo refurbishment in 2012. During 2012, we capitalized $4 million of major overhaul maintenance costs (2011 – nil), these costs will be amortized over a period of 36 months. In addition, we reclassified 1 aircraft and one airframe valued at $3 million (2011 – 23 aircraft and three engines valued at $71 million) out of this portfolio to the held-for-sale portfolio which is included in other assets.
The following table illustrates the carrying amount by aircraft type and summarizes the current leasing arrangements within the equipment available for lease portfolio:
| | | | | | | | | | | | | | | | | | | | | | | | | | | | | | | | |
(in millions of Canadian dollars) | | Dec. 31, 2012 | | | Dec. 31, 2011 | |
| | |
| Number of
aircraft in
portfolio |
| |
| Carrying
amount |
| |
| Number of
aircraft on
operating
lease |
| |
| Current
lease term
range |
| |
| Number of
aircraft in
portfolio |
| |
| Carrying
amount |
| |
| Number of
aircraft on
operating
lease |
| |
| Current
lease term
range |
|
Aircraft type | | | | | | | | | | | | | | | | | | | | | | | | | | | | | | | | |
CRJ200 Regional Jets | | | 18 | | | | 44 | | | | 18 | | | | 8 to 41 | | | | 20 | | | | 54 | | | | 20 | | | | 12 to 60 | |
| | | | | | | | | | | | | | | | months | | | | | | | | | | | | | | | | months | |
CRJ900 Regional Jets | | | 8 | | | | 94 | | | | – | | | | – | | | | – | | | | – | | | | – | | | | – | |
Dash 8 – Q400* | | | 28 | | | | 387 | | | | 14 | | | | 91 to 95 | | | | – | | | | – | | | | – | | | | – | |
| | | | | | | | | | | | | | | | months | | | | | | | | | | | | | | | | | |
Total portfolio | | | 54 | | | | $525 | | | | 32 | | | | | | | | 20 | | | | $54 | | | | 20 | | | | – | |
| * | In addition to the 28 aircraft, there are two Dash8-Q400 spare engines available for lease. |
|
| 100 | Adapting to the New Reality |
Operating lease revenue for the year was $17 million (2011 – $21 million). At the end of December 2012, 32 aircraft were subject to operating leases with six airlines (2011 – 20 aircraft). The remaining 14 Dash 8 – Q400s and two spare engines are contracted to go out on lease with the same lessee in 2013 for a lease term of 96 months. At the end of December 2012 there were 8 idle CRJ900 regional jets available for lease (2011 – no idle aircraft).
The following table presents minimum future lease payments receivable:
| | | | | | | | |
| (in millions of Canadian dollars) | | Dec. 31, 2012 | | | Dec. 31, 2011 | |
2012 | | | – | | | | 13 | |
2013 | | | 51 | | | | 12 | |
2014 | | | 48 | | | | 8 | |
2015 | | | 44 | | | | 4 | |
2016 | | | 41 | | | | 1 | |
2017 | | | 41 | | | | – | |
2018 and beyond | | | 122 | | | | – | |
Total | | | $347 | | | | $38 | |
AIRCRAFT OR COMPONENT PARTS HELD-FOR-SALE
During 2012, we sold 7 aircraft, one airframe and three engines with a carrying value of $8 million.
In addition to the above sales, 4 aircraft valued at $11 million that were subject to a non-monetary exchange agreement at the end of 2011, were delivered in early 2012 and are no longer in the aircraft held-for-sale portfolio.
At year end there were 6 aircraft and two engines with a carrying value of $9 million that have been contracted for part-out whereby we will seek recovery by selling the component parts of the aircraft. During 2012, the carrying value of these assets were reduced by $3 million; $2 million was a result of a write-down of 4 aircraft values and the remaining $1 million was payments received from the sale of component parts.
9. Net Investment in Aircraft under Finance Leases
The following table presents the reconciliation between our gross investment in aircraft under finance leases and the present value of the minimum lease payments receivable:
| | | | | | | | |
| (in millions of Canadian dollars) | | Dec. 31, 2012 | | | Dec. 31, 2011 | |
Total minimum lease payments receivable | | | 63 | | | | 81 | |
Estimated residual values of leased aircraft | | | 33 | | | | 34 | |
Gross investment in finance leases | | | 96 | | | | 115 | |
Unearned income | | | (17 | ) | | | (23 | ) |
Finance lease interest receivable | | | 1 | | | | – | |
Net investment in finance leases | | | 80 | | | | 92 | |
Present value of estimated residual values | | | (25 | ) | | | (24 | ) |
Present value of minimum lease payments receivable | | | $55 | | | | $68 | |
Allowance for losses* | | | $17 | | | | $23 | |
| * | Included within the allowance for losses on loans. |
|
EDC Annual Report 2012 | 101 |
CONSOLIDATED FINANCIAL STATEMENTS
The following table presents minimum lease payments receivable, estimated residual values, gross investment in finance leases, as well as the present value of minimum lease payments receivable:
| | | | | | | | | | | | | | | | | | | | | | | | | | | | | | | | |
(in millions of Canadian dollars) | | Dec. 31, 2012 | | | Dec. 31, 2011 | |
| | |
| Minimum
lease
payments
receivable |
| |
| Estimated
residual
values |
| |
| Gross
investment
in finance
leases |
| |
| Present value
of minimum
lease
payments
receivable |
| |
| Minimum
lease
payments
receivable |
| |
| Estimated
residual
values |
| |
| Gross
investment
in finance
leases |
| |
| Present value
of minimum
lease
payments
receivable |
|
2012 | | | – | | | | – | | | | – | | | | – | | | | 17 | | | | – | | | | 17 | | | | 16 | |
2013 | | | 16 | | | | – | | | | 16 | | | | 16 | | | | 17 | | | | – | | | | 17 | | | | 15 | |
2014 | | | 16 | | | | – | | | | 16 | | | | 15 | | | | 17 | | | | – | | | | 17 | | | | 14 | |
2015 | | | 16 | | | | – | | | | 16 | | | | 13 | | | | 17 | | | | – | | | | 17 | | | | 13 | |
2016 | | | 12 | | | | 20 | | | | 32 | | | | 9 | | | | 11 | | | | 21 | | | | 32 | | | | 9 | |
2017 | | | 3 | | | | 13 | | | | 16 | | | | 2 | | | | 2 | | | | 13 | | | | 15 | | | | 1 | |
Total | | | $63 | | | | $33 | | | | $96 | | | | $55 | | | | $81 | | | | $34 | | | | $115 | | | | $68 | |
Finance lease revenue for the year was $6 million (2011 – $7 million). At the end of December 2012, 13 aircraft were subject to finance leases with one airline, consistent with 2011. The remaining lease terms range from 40 to 59 months.
10. Recoverable Insurance Claims
During the year, changes to the recoverable insurance claims were as follows:
| | | | | | | | |
| (in millions of Canadian dollars) | | Dec. 31, 2012 | | | Dec. 31, 2011 | |
Balance at beginning of year | | | 44 | | | | 94 | |
Claims paid | | | 355 | | | | 54 | |
Claims paid – reinsured policies | | | 3 | | | | 1 | |
Claims recovered | | | (22 | ) | | | (40 | ) |
Change in recoverable portion of cumulative claims paid | | | (179 | ) | | | (66 | ) |
Foreign exchange translation | | | (1 | ) | | | 1 | |
Balance at end of year | | | $200 | | | | $44 | |
Of the $358 million (2011 – $55 million) in claim payments made during 2012, 84% were related to the political risk insurance program (2011 – 72% related to the credit insurance program). The largest concentrations of claim payments and recoveries were in the following geographic areas:
| | | | | | | | | | | | | | | | |
| (in millions of Canadian dollars) | | Dec. 31, 2012 | | | Dec. 31, 2011 | |
| | | | Claims paid | | | | Claims recovered | | | | Claims paid | | | | Claims recovered | |
Middle East and Africa | | | 305 | | | | 2 | | | | 5 | | | | 2 | |
North America and Caribbean | | | 25 | | | | 12 | | | | 30 | | | | 22 | |
Europe | | | 13 | | | | 2 | | | | 11 | | | | 10 | |
Asia and Pacific | | | 11 | | | | 1 | | | | 4 | | | | – | |
South and Central America | | | 4 | | | | 5 | | | | 5 | | | | 6 | |
Total | | | $358 | | | | $22 | | | | $55 | | | | $40 | |
|
| 102 | Adapting to the New Reality |
11. Other Assets
| | | | | | | | |
| (in millions of Canadian dollars) | | Dec. 31, 2012 | | | Dec. 31, 2011 | |
Restructuring payments receivable | | | 48 | | | | 55 | |
Insurance premiums receivable/prepaid reinsurance | | | 14 | | | | 26 | |
Aircraft or component parts held-for-sale* | | | 9 | | | | 31 | |
Guarantee fees receivable | | | 7 | | | | 6 | |
Prepaid expenses | | | 5 | | | | 7 | |
Investment in joint ventures | | | 1 | | | | 2 | |
Other aircraft* | | | – | | | | 23 | |
Other | | | 15 | | | | 24 | |
Total other assets | | | $99 | | | | $174 | |
Restructuring payments receivable relate to an agreement between EDC and an airline obligor as part of the terms of a loan restructuring that was finalized in 2007. The receivable relates to a payable as shown in Note 15.
12. Property, Plant and Equipment
During the year, changes to property, plant and equipment were as follows:
| | | | | | | | | | | | | | | | | | | | | | | | | | | | | | | | |
| (in millions of Canadian dollars) | | Dec. 31, 2012 | | | Dec. 31, 2011 | |
| | |
| Computer
hardware |
| |
| Furniture
and
equipment |
| |
| Leasehold
improvements |
| | | Total | | |
| Computer
hardware |
| |
| Furniture
and
equipment |
| |
| Leasehold
improvements |
| | | Total | |
Cost: | | | | | | | | | | | | | | | | | | | | | | | | | | | | | | | | |
Balance at beginning of year | | | 22 | | | | 19 | | | | 50 | | | | 91 | | | | 73 | | | | 33 | | | | 32 | | | | 138 | |
Additions | | | 3 | | | | 1 | | | | 1 | | | | 5 | | | | 9 | | | | 12 | | | | 30 | | | | 51 | |
Disposals | | | (1 | ) | | | (3 | ) | | | – | | | | (4 | ) | | | (60 | ) | | | (26 | ) | | | (12 | ) | | | (98 | ) |
Balance at end of year | | | 24 | | | | 17 | | | | 51 | | | | 92 | | | | 22 | | | | 19 | | | | 50 | | | | 91 | |
Accumulated depreciation: | | | | | | | | | | | | | | | | | | | | | | | | | | | | | | | | |
Balance at beginning of year | | | (9 | ) | | | (5 | ) | | | (3 | ) | | | (17 | ) | | | (62 | ) | | | (29 | ) | | | (14 | ) | | | (105 | ) |
Depreciation expense | | | (7 | ) | | | (4 | ) | | | (2 | ) | | | (13 | ) | | | (7 | ) | | | (2 | ) | | | (1 | ) | | | (10 | ) |
Disposals | | | 1 | | | | 3 | | | | – | | | | 4 | | | | 60 | | | | 26 | | | | 12 | | | | 98 | |
Balance at end of year | | | (15 | ) | | | (6 | ) | | | (5 | ) | | | (26 | ) | | | (9 | ) | | | (5 | ) | | | (3 | ) | | | (17 | ) |
Carrying amount | | | $9 | | | | $11 | | | | $46 | | | | $66 | | | | $13 | | | | $14 | | | | $47 | | | | $74 | |
Future contractual commitments related to property, plant and equipment as at December 31, 2012 were $1 million (2011 – $1 million).
|
EDC Annual Report 2012 | 103 |
CONSOLIDATED FINANCIAL STATEMENTS
13. Intangible Assets
During the year, changes to intangible assets were as follows:
| | | | | | | | | | | | | | | | | | | | | | | | |
| (in millions of Canadian dollars) | | Dec. 31, 2012 | | | Dec. 31, 2011 | |
| | |
| Internally
developed
software |
| |
| Acquired
computer
software |
| | | Total | | |
| Internally
developed
software |
| |
| Acquired
computer
software |
| | | Total | |
Cost: | | | | | | | | | | | | | | | | | | | | | | | | |
Balance at beginning of year | | | 81 | | | | 86 | | | | 167 | | | | 78 | | | | 76 | | | | 154 | |
Additions | | | 6 | | | | 8 | | | | 14 | | | | 3 | | | | 10 | | | | 13 | |
Disposals | | | (3 | ) | | | – | | | | (3 | ) | | | – | | | | – | | | | – | |
Balance at end of year | | | 84 | | | | 94 | | | | 178 | | | | 81 | | | | 86 | | | | 167 | |
Accumulated amortization: | | | | | | | | | | | | | | | | | | | | | | | | |
Balance at beginning of year | | | (71 | ) | | | (56 | ) | | | (127 | ) | | | (66 | ) | | | (46 | ) | | | (112 | ) |
Amortization expense | | | (4 | ) | | | (12 | ) | | | (16 | ) | | | (5 | ) | | | (10 | ) | | | (15 | ) |
Disposals | | | 3 | | | | – | | | | 3 | | | | – | | | | – | | | | – | |
Balance at end of year | | | (72 | ) | | | (68 | ) | | | (140 | ) | | | (71 | ) | | | (56 | ) | | | (127 | ) |
Carrying amount | | | $12 | | | | $26 | | | | $38 | | | | $10 | | | | $30 | | | | $40 | |
Future contractual commitments related to intangible assets as at December 31, 2012 were $7 million (2011 – $4 million).
14. Building under Finance Lease
Our head office building is held under a finance lease. Future minimum lease payments under the obligation under finance lease as well as the present value of the minimum lease payments, based on an expected 25 year lease term are as follows:
| | | | | | | | | | | | | | | | |
| (in millions of Canadian dollars) | | Dec. 31, 2012 | | | Dec. 31, 2011 | |
| | |
| Minimum
payments |
| |
| Present value of
minimum lease
payments |
| |
| Minimum
payments |
| |
| Present value of
minimum lease
payments |
|
2012 | | | – | | | | – | | | | 11 | | | | 11 | |
2013 | | | 11 | | | | 11 | | | | 11 | | | | 10 | |
2014 | | | 11 | | | | 10 | | | | 11 | | | | 10 | |
2015 | | | 11 | | | | 10 | | | | 11 | | | | 9 | |
2016 | | | 11 | | | | 9 | | | | 11 | | | | 9 | |
2017 | | | 11 | | | | 9 | | | | 11 | | | | 9 | |
2018 and beyond | | | 232 | | | | 124 | | | | 232 | | | | 119 | |
Total | | | 287 | | | | 173 | | | | 298 | | | | 177 | |
Less: future finance charges | | | (114 | ) | | | – | | | | (121 | ) | | | – | |
Present value of minimum lease payments | | | $173 | | | | $173 | | | | $177 | | | | $177 | |
During the year changes to the building under finance lease were as follows: | |
| (in millions of Canadian dollars) | | Dec. 31, 2012 | | | Dec. 31, 2011 | | | | |
Cost: | | | | | | | | | |
Balance at beginning of year | | | 177 | | | | – | | |
Additions | | | – | | | | 177 | | |
Balance at end of year | | | 177 | | | | 177 | | |
Accumulated depreciation: | | | | | | | | | |
Balance at beginning of year | | | (1 | ) | | | – | | |
Depreciation expense | | | (7 | ) | | | (1 | ) | |
Balance at end of year | | | (8 | ) | | | (1 | ) | |
Carrying amount | | | $169 | | | | $176 | | |
|
| 104 | Adapting to the New Reality |
15. Accounts Payable and Other Credits
| | | | | | | | |
| (in millions of Canadian dollars) | | Dec. 31, 2012 | | | Dec. 31, 2011 | |
Restructuring payments payable | | | 48 | | | | 53 | |
Employee benefit accruals | | | 18 | | | | 21 | |
Aircraft maintenance reserve | | | 14 | | | | 13 | |
Trade payables and accruals | | | 12 | | | | 19 | |
Canada Account payable | | | 11 | | | | 11 | |
Aircraft lease security deposit | | | 3 | | | | 8 | |
Obligation under an exchange of non-monetary assets* | | | – | | | | 11 | |
Other payables and other credits | | | 7 | | | | 23 | |
Total accounts payable and other credits | | | $113 | | | | $159 | |
Restructuring payments payable relate to an agreement between EDC and an airline obligor as part of the terms of a loan restructuring that was finalized in 2007. The payable relates to a receivable as shown in Note 11.
Aircraft maintenance reserve represents payments received from lessees for our leased aircraft that are reserved for major repairs and overhauls of the aircraft.
Canada Account payable primarily represents the amount of cash repayments (principal and interest) received by EDC from borrowers on Canada Account loans which were not yet remitted at year-end to the Consolidated Revenue Fund.
In 2011, we recorded an obligation under an exchange for non-monetary assets as a result of entering into an agreement to exchange 8 CRJ200 aircraft for 2 CRJ900 aircraft. Four of the aircraft were delivered in 2011 and the remaining 4 aircraft were delivered in early 2012. There is no obligation outstanding at the end of 2012.
Aircraft lease security deposits are received from lessees for our leased aircraft and are held over the life of the lease term.
16. Debt Instruments
We issue debt instruments in global capital markets. Short-term payables consist of commercial paper and other short-term debt related instruments that we issue with maturities under one year. Long-term payables represent bonds and other long-term instruments which we issue in Canadian dollars, U.S. dollars and other currencies. We use foreign exchange swaps as well as cross currency interest rate swaps to convert Canadian dollar and foreign currency denominated notes primarily to U.S. dollars. Interest rate swaps are principally used to convert fixed rate instruments to floating rates, primarily related to LIBOR. We use derivative contracts and structured notes to manage interest rate risk and foreign exchange risk, and also for asset liability management purposes.
EDC is wholly owned by the Government of Canada and our obligations are backed by the full faith and credit of the Government of Canada which holds an AAA credit rating. Therefore, there is no significant change in the value of our debt instruments that can be attributed to changes in our own credit risk.
LOANS PAYABLE
Loans payable (excluding derivatives) are comprised as follows:
| | | | | | | | | | | | | | | | | | | | | | | | | | | | |
| (in millions of Canadian dollars) | | Dec. 31, 2012 | | | Dec. 31, 2011 | |
| | |
| Designated
at fair value
through profit
or loss |
| |
| At amortized
cost |
| | | | | Total | | |
| Designated
at fair value
through profit
or loss |
| |
| At amortized
cost |
| | | | | Total | |
Short-term payables | | | 4,435 | | | | – | | | | | | 4,435 | | | | 3,567 | | | | – | | | | | | 3,567 | |
Long-term payables due within current year over one year | | | 5,482 | | | | – | | | | | | 5,482 | | | | 5,426 | | | | 1,016 | | | | | | 6,442 | |
| | | 14,945 | | | | 1,013 | | | | | | 15,958 | | | | 12,512 | | | | 1,037 | | | | | | 13,549 | |
Total long-term payables | | | 20,427 | | | | 1,013 | | | | | | 21,440 | | | | 17,938 | | | | 2,053 | | | | | | 19,991 | |
Accrued interest | | | – | | | | 5 | | | | | | 5 | | | | – | | | | 12 | | | | | | 12 | |
Total loans payable | | | $24,862 | | | | $1,018 | | | | | | $25,880 | | | | $21,505 | | | | $2,065 | | | | | | $23,570 | |
|
EDC Annual Report 2012 | 105 |
CONSOLIDATED FINANCIAL STATEMENTS
The amount to be paid at maturity on the debt designated at fair value through profit or loss is $24,317 million (2011 – $20,916 million), $545 million less than the December 2012 fair value (2011 – $589 million less than the December 31, 2011).
STRUCTURED NOTES
We have entered into a number of structured notes as part of our funding program. Structured notes are hybrid securities that combine debt instruments with derivative components.
Structured notes outstanding, included in loans payable, are as follows:
| | | | | | | | |
| (in millions of Canadian dollars) | | Dec. 31, 2012 | | | Dec. 31, 2011 | |
Zero coupon | | | 320 | | | | 611 | |
Callable/extendible | | | 97 | | | | 258 | |
Inverse floating rate note | | | 40 | | | | 58 | |
Float to fixed | | | 20 | | | | 21 | |
Dual currency | | | 15 | | | | 39 | |
Total | | | $492 | | | | $987 | |
We have executed swap contracts to mitigate interest rate risk and foreign exchange risk on these structured borrowings. These contracts ensure that we will receive proceeds from the swap to meet the requirements of settling and servicing the debt obligation. We have in substance created floating rate debt by issuing bonds at fixed rates and entering into swap contracts whereby we receive fixed rate interest and pay interest at a floating rate. In swapping out of the underlying bond issue, the potential interest rate risk has been converted to credit risk. Credit exposure on derivative instruments is further discussed in Note 17.
17. Derivative Instruments
We use a variety of derivative instruments to manage costs, returns and levels of financial risk associated with our funding, investment and risk management activities.
We currently use, but are not limited to, the following types of instruments:
Interest rate swaps – transactions in which two parties exchange interest flows on a specified notional amount on predetermined dates for a specified period of time using agreed-upon fixed or floating rates of interest. Notional amounts upon which interest payments/ receipts are based are not exchanged.
Cross currency interest rate swaps – transactions in which two parties exchange currencies at inception and at maturity, as well as interest flows on the exchanged amounts on predetermined dates for a specified period of time using agreed-upon fixed or floating rates of interest.
Foreign exchange swaps – commitments to exchange cash flows in different currencies where there are two exchanges, the first is made at the spot rate at inception and the second at a predetermined rate on a specified date in the future.
Foreign exchange forwards – commitments to exchange cash flows in different currencies, for which the foreign exchange rate is predetermined, at a specified date in the future.
Non-deliverable forwards – cash-settled, short-term forward contract, where the profit or loss at settlement date is calculated by taking the difference between the agreed upon exchange rate and the spot rate at the time of settlement, for an agreed upon notional amount of funds.
Non-deliverable foreign exchange swaps – a commitment to exchange cash flows in different currencies where there are two exchanges on pre-agreed dates and rates; with the unique characteristics that only the net value in a pre-agreed currency changes hands.
Credit default swaps – transactions between two counterparties that allow credit risks of a third-party reference entity or entities to be traded and managed. The buyer of credit protection pays a periodic fee to the protection seller over a specified term in return for compensation should a credit event (such as default or failure to pay) occur with the reference entity.
To diversify and reduce credit risk within our loan portfolio, we enter into credit default swap transactions that provide us with protection against credit risk. As at December 31, 2012 we held credit default swap protection against five single-name entities (December 31, 2011 – nine). In the past, to offset the cost of these transactions, we sold credit default swap protection on a series of collateralized debt obligations which contain a diversified group of corporate names. As at December 31, 2012 there was no outstanding credit default swap protection sold (December 31, 2011 – two).
|
| 106 | Adapting to the New Reality |
In any transaction there is a potential for loss. This loss potential is represented by (1) credit risk, wherein the counterparty fails to perform an obligation as agreed upon, causing the other party to incur a financial loss, and (2) interest rate risk and foreign exchange risk, where an exposure exists as a result of changes in foreign exchange rates or interest rates.
We manage our exposure to interest rate risk and foreign exchange risk using limits developed in consultation with the Department of Finance and approved by our Board of Directors.
Both our internal policies and guidelines (established in the Risk Management Office and approved by our Board of Directors) and those set by the Minister of Finance limit our use of derivatives. We do not use derivatives for speculative purposes. We manage our exposure to derivative counterparty credit risk by contracting only with creditworthy counterparties, establishing netting agreements, and in certain cases entering into collateral agreements, using Credit Support Annex (CSA) with those counterparties. Collateral agreements provide for the posting of collateral by the counterparty when our exposure to that entity exceeds a certain threshold. Collateral is held by a third party custodian and at the end of December 2012 totalled $979 million (2011 – $788 million) and consists of AAA rated government issued securities. All derivative counterparties must have a minimum credit rating of A-. Any exception must be approved by the Board of Directors. Internal policies and procedures establish credit approvals, controls and monitoring. We do not anticipate any significant non-performance by the counterparties.
In 2012, we reviewed our contracts for embedded derivatives and determined they did not significantly modify the cash flows that otherwise would be required by the contract and consequently they need not to be presented separately in the consolidated statement of financial position.
Notional amounts are not recorded as assets or liabilities on our consolidated statement of financial position as they represent the face amount of the contract to which a rate or a price is applied to determine the amount of cash flows to be exchanged.
The remaining term to maturity for the notional amounts of our derivative contracts is as follows:
| | | | | | | | | | | | | | | | | | | | | | | | | | | | | | | | |
| (in millions of Canadian dollars) | | Dec. 31, 2012 | | | Dec. 31, 2011 | |
| | | | Remaining term to maturity | | | | | | | | Remaining term to maturity | | | | | |
| | |
| Under 1
year |
| |
| 1 to 3
years |
| |
| Over 3
years |
| | | Total | | |
| Under 1
year |
| |
| 1 to 3
years |
| |
| Over 3
years |
| | | Total | |
Interest rate swaps | | | 4,355 | | | | 6,333 | | | | 2,788 | | | | 13,476 | | | | 3,337 | | | | 4,232 | | | | 4,349 | | | | 11,918 | |
Cross currency interest rate swaps | | | 1,495 | | | | 5,354 | | | | 5,906 | | | | 12,755 | | | | 2,506 | | | | 3,280 | | | | 6,611 | | | | 12,397 | |
Foreign exchange swaps | | | 2,146 | | | | – | | | | – | | | | 2,146 | | | | 2,673 | | | | – | | | | – | | | | 2,673 | |
Credit default swaps – protection purchased | | | 119 | | | | 263 | | | | – | | | | 382 | | | | 589 | | | | 107 | | | | 269 | | | | 965 | |
Foreign exchange forwards | | | 299 | | | | – | | | | – | | | | 299 | | | | 391 | | | | – | | | | – | | | | 391 | |
Non-deliverable forwards | | | 60 | | | | – | | | | – | | | | 60 | | | | 414 | | | | 64 | | | | – | | | | 478 | |
Non-deliverable foreign exchange swaps | | | – | | | | – | | | | – | | | | – | | | | 46 | | | | – | | | | – | | | | 46 | |
Credit default swaps – protection sold | | | – | | | | – | | | | – | | | | – | | | | (49 | ) | | | – | | | | – | | | | (49 | ) |
Total derivative instruments | | | $8,474 | | | | $11,950 | | | | $8,694 | | | | $29,118 | | | | $9,907 | | | | $7,683 | | | | $11,229 | | | | $28,819 | |
The following table provides the fair values for each category of derivative financial instrument:
| | | | | | | | |
| (in millions of Canadian dollars) | | Dec. 31, 2012 | | | Dec. 31, 2011 | |
Cross currency interest rate swaps | | | 1,011 | | | | 1,021 | |
Interest rate swaps | | | 289 | | | | 292 | |
Foreign exchange swaps | | | (44 | ) | | | 36 | |
Credit default swaps – protection purchased | | | (24 | ) | | | 30 | |
Credit default swaps – protection sold | | | – | | | | (15 | ) |
Foreign exchange forwards | | | – | | | | (1 | ) |
Total derivative instruments | | | $1,232 | | | | $1,363 | |
The change in the fair value of the derivatives recognized in net income in 2012 amounted to a loss of $2 million (2011 – gain of $139 million).
|
EDC Annual Report 2012 | 107 |
CONSOLIDATED FINANCIAL STATEMENTS
18. Debt Instrument Maturities
We often combine debt instruments with derivative instruments to generate lower-cost funding. For example, a fixed rate debt issue can be combined with an interest rate swap to generate floating rate funding at a lower cost than issuing a floating rate note. The following table shows our resulting net fixed and floating rate debt positions, as well as the maturities and yields of those net positions. Although we measure our swaps and the majority of debt instruments at their fair value on the financial statements, they are shown below at their notional amounts in order to provide information on cash requirements at maturity of the instruments:
| | | | | | | | | | | | | | | | | | | | | | | | | | | | | | | | |
| (in millions of Canadian dollars) | | Dec. 31, 2012 | | | Dec. 31, 2011 | |
Year of maturity | |
| Debt
issues |
| |
| Swap
contracts |
| | | Net | | |
| Yield*
(%) |
| |
| Debt
issues |
| |
| Swap
contracts |
| | | Net | | |
| Yield*
(%) |
|
Fixed rate issues | | | | | | | | | | | | | | | | | | | | | | | | | | | | | | | | |
2012 | | | – | | | | – | | | | – | | | | – | | | | 5,833 | | | | (4,817 | ) | | | 1,016 | | | | 4.64 | |
2013 | | | 3,832 | | | | (3,832 | ) | | | – | | | | – | | | | 2,239 | | | | (2,239 | ) | | | – | | | | – | |
2014 | | | 3,899 | | | | (2,906 | ) | | | 993 | | | | 3.19 | | | | 2,870 | | | | (1,854 | ) | | | 1,016 | | | | 3.19 | |
2015 | | | 5,150 | | | | (5,150 | ) | | | – | | | | – | | | | 3,757 | | | | (3,757 | ) | | | – | | | | – | |
2016 | | | 2,029 | | | | (2,009 | ) | | | 20 | | | | 8.16 | | | | 2,159 | | | | (2,138 | ) | | | 21 | | | | 8.16 | |
2017 | | | 2,689 | | | | (2,689 | ) | | | – | | | | – | | | | 278 | | | | (278 | ) | | | – | | | | – | |
2018 to 2022 | | | 71 | | | | (71 | ) | | | – | | | | – | | | | 97 | | | | (97 | ) | | | – | | | | – | |
2023 and beyond | | | 254 | | | | (254 | ) | | | – | | | | – | | | | 539 | | | | (539 | ) | | | – | | | | – | |
Subtotal | | | 17,924 | | | | (16,911 | ) | | | 1,013 | | | | 3.47 | | | | 17,772 | | | | (15,719 | ) | | | 2,053 | | | | 3.71 | |
| | | | | | | | | |
Floating rate issues | | | | | | | | | | | | | | | | | | | | | | | | | | | | | | | | |
2012 | | | – | | | | – | | | | – | | | | | | | | 4,091 | | | | 4,653 | | | | 8,744 | | | | | |
2013 | | | 6,053 | | | | 3,835 | | | | 9,888 | | | | | | | | 396 | | | | 2,255 | | | | 2,651 | | | | | |
2014 | | | 1,214 | | | | 2,714 | | | | 3,928 | | | | | | | | 585 | | | | 1,677 | | | | 2,262 | | | | | |
2015 | | | – | | | | 5,009 | | | | 5,009 | | | | | | | | – | | | | 3,656 | | | | 3,656 | | | | | |
2016 | | | – | | | | 1,934 | | | | 1,934 | | | | | | | | – | | | | 2,081 | | | | 2,081 | | | | | |
2017 | | | – | | | | 2,629 | | | | 2,629 | | | | | | | | – | | | | 221 | | | | 221 | | | | | |
2018 to 2022 | | | 139 | | | | 70 | | | | 209 | | | | | | | | 108 | | | | 81 | | | | 189 | | | | | |
2023 and beyond | | | – | | | | 254 | | | | 254 | | | | | | | | 17 | | | | 539 | | | | 556 | | | | | |
Subtotal | | | 7,406 | | | | 16,445 | | | | 23,851 | | | | 0.32 | | | | 5,197 | | | | 15,163 | | | | 20,360 | | | | 0.58 | |
Total | | | $25,330 | | | | $(466 | ) | | | $24,864 | | | | | | | | $22,969 | | | | $(556 | ) | | | $22,413 | | | | | |
| * | Refers to yield to maturity for fixed rate issues, and yield to reset for floating rate issues. |
At the end of December 2012, the contractual cash flows, including principal and interest, related to our debt portfolio are as follows:
| | | | | | | | | | | | | | | | | | | | | | | | | | | | | | | | | | | | | | | | |
(in millions of Canadian dollars) | | Dec. 31, 2012 | | | Dec. 31, 2011 | |
| | |
| Under 1
year |
| |
| 1 to 3
years |
| |
| Over 3 to
5 years |
| |
| Over 5
years |
| | | Total | | |
| Under 1
year |
| |
| 1 to 3
years |
| |
| Over 3 to
5 years |
| |
| Over 5
years |
| | | Total | |
Debt | | | 10,281 | | | | 10,820 | | | | 4,883 | | | | 1,496 | | | | 27,480 | | | | 10,420 | | | | 6,658 | | | | 6,155 | | | | 3,193 | | | | 26,426 | |
Swap contracts | | | | | | | | | | | | | | | | | | | | | | | | | | | | | | | | | | | | | | | | |
Receivable | | | (4,186 | ) | | | (8,591 | ) | | | (4,860 | ) | | | (1,353 | ) | | | (18,990 | ) | | | (5,234 | ) | | | (4,619 | ) | | | (6,140 | ) | | | (3,037 | ) | | | (19,030 | ) |
Payable | | | 3,858 | | | | 7,721 | | | | 4,561 | | | | 320 | | | | 16,460 | | | | 4,695 | | | | 3,932 | | | | 5,734 | | | | 836 | | | | 15,197 | |
Total | | | $9,953 | | | | $9,950 | | | | $4,584 | | | | $463 | | | | $24,950 | | | | $9,881 | | | | $5,971 | | | | $5,749 | | | | $992 | | | | $22,593 | |
Credit exposure and other details of derivative instruments are included as part of Note 17.
|
| 108 | Adapting to the New Reality |
19. Policy and Claims Liabilities
The policy and claims liabilities broken down by program are as follows:
| | | | | | | | | | | | | | | | | | | | | | | | |
| (in millions of Canadian dollars) | | Dec. 31, 2012 | | | Dec. 31, 2011 | |
| | | | Insurance | | | | Reinsurance | | | | Net liability | | | | Insurance | | | | Reinsurance | | | | Net liability | |
Credit insurance | | | 114 | | | | (8 | ) | | | 106 | | | | 143 | | | | (10 | ) | | | 133 | |
Contract insurance and bonding | | | 96 | | | | (2 | ) | | | 94 | | | | 122 | | | | (4 | ) | | | 118 | |
Political risk insurance | | | 373 | | | | (80 | ) | | | 293 | | | | 610 | | | | (115 | ) | | | 495 | |
Total | | | $583 | | | | $(90 | ) | | | $493 | | | | $875 | | | | $(129 | ) | | | $746 | |
The policy and claims liabilities are comprised of the following components:
| | | | | | | | |
| (in millions of Canadian dollars) | | Dec. 31, 2012 | | | Dec. 31, 2011 | |
Deferred insurance premiums | | | 100 | | | | 93 | |
Allowance for claims on insurance | | | 483 | | | | 782 | |
Total policy and claims liabilities | | | $583 | | | | $875 | |
During the year, the policy and claims liabilities were impacted by the following factors:
| | | | | | | | | | | | | | | | | | | | | | | | |
| (in millions of Canadian dollars) | | Dec. 31, 2012 | | | Dec. 31, 2011 | |
| | | | Insurance | | | | Reinsurance | | | | Net liability | | | | Insurance | | | | Reinsurance | | | | Net liability | |
Balance at beginning of year | | | 875 | | | | (129 | ) | | | 746 | | | | 640 | | | | (109 | ) | | | 531 | |
Change in portfolio make-up and risk ratings | | | (259 | ) | | | 33 | | | | (226 | ) | | | 227 | | | | (16 | ) | | | 211 | |
Update of actuarial assumptions | | | (23 | ) | | | 4 | | | | (19 | ) | | | 6 | | | | (13 | ) | | | (7 | ) |
Change due to special assumptions and calculation platform change | | | – | | | | – | | | | – | | | | (11 | ) | | | 13 | | | | 2 | |
Foreign exchange translation | | | (10 | ) | | | 2 | | | | (8 | ) | | | 13 | | | | (4 | ) | | | 9 | |
Balance at end of year | | | $583 | | | | $(90 | ) | | | $493 | | | | $875 | | | | $ | (129) | | | $746 | |
20. Financing Commitments
We have three types of financing commitments.
The first type is undisbursed amounts on signed loan agreements totalling $13,382 million (2011 – $9,722 million). These commitments are immediately available to the obligor for drawdown subject to continued adherence to contractual covenants established under the financing agreements.
Undisbursed amounts on signed loan agreements with their committed fixed rates or committed floating rate spreads are outlined in the following table. All yields are computed on a weighted average basis and the spreads over floating interest rates represent the spreads over base rates which consist mainly of LIBOR for U.S. dollars.
| | | | | | | | | | | | | | | | | | | | | | | | | | | | | | | | | | | | | | | | |
(in millions of Canadian dollars) | | Dec. 31, 2012 | | | Dec. 31, 2011 | |
| | |
| Fixed
$ |
| |
| Estimated
spot yield
% |
| |
| Floating
$ |
| |
| Spread
% |
| |
| Total
$ |
| |
| Fixed
$ |
| |
| Estimated
spot yield
% |
| |
| Floating
$ |
| |
| Spread
% |
| |
| Total
$ |
|
Commercial | | | 569 | | | | 3.16 | | | | 12,728 | | | | 1.87 | | | | 13,297 | | | | 314 | | | | 4.54 | | | | 9,202 | | | | 1.83 | | | | 9,516 | |
Sovereign | | | 44 | | | | 5.93 | | | | 41 | | | | 3.19 | | | | 85 | | | | 103 | | | | 5.93 | | | | 103 | | | | 3.33 | | | | 206 | |
Total | | | $613 | | | | 3.36 | | | | $12,769 | | | | 1.87 | | | | $13,382 | | | | $417 | | | | 4.89 | | | | $9,305 | | | | 1.85 | | | | $9,722 | |
|
EDC Annual Report 2012 | 109 |
CONSOLIDATED FINANCIAL STATEMENTS
We also have loan commitments for which terms related to the transaction such as interest rate type and disbursement schedule have not yet been determined. This category of commitments includes letters of offer accepted and outstanding for loans of $3,857 million (2011 – $2,022 million) and loan guarantees of $52 million (2011 – $179 million) as well as unallocated, confirmed lines of credit of $111 million (2011 – $410 million).
We have $9 million of loan commitments for two obligors that are impaired.
The third type of financing commitments relate to investments and total $417 million (2011 – $283 million), of which all are commitments to investment funds. Commitments are generally drawn down over a five-year period and draw downs are normally at the discretion of the fund managers.
21. Contingent Liabilities
Our contingent liabilities include credit insurance, financial institutions insurance, contract insurance and bonding and political risk insurance policies and guarantees which represent direct risks undertaken. We increase our contingent liability by assuming exposure from other insurers. We reduce our contingent liability by ceding reinsurance to other insurance companies.
The credit insurance program protects exporters of goods and services trading on credit terms of up to a year against non-payment due to commercial and political risks. Commercial and political risks covered include buyer insolvency, default, repudiation of goods by buyer, contract cancellation and conversion and risk transfer, cancellation of export or import permits, or war-related risks. The financial institutions insurance program provides Canadian banks with credit risk and payment risk mitigation on terms usually not greater than one year. The contract insurance and bonding program provides cover for sales on exposure terms usually greater than one year and includes export credit insurance and guarantees, performance guarantees and surety, extending cover for risks inherent in performance related obligations. Political risk insurance provides risk protection for equity and other investments abroad.
At the end of December 2012, we had contingent liabilities of $23,636 million (2011 – $28,472 million) which mature as follows:
| | | | | | | | | | | | | | | | | | | | | | | | |
| (in millions of Canadian dollars) | | Dec. 31, 2012 | |
| | |
| Credit
insurance |
| |
| Financial
institutions
insurance |
| |
| Contract
insurance and
bonding |
| |
| Political risk
insurance |
| | | Guarantees | * | | | Total | |
2013 | | | 7,750 | | | | 4,112 | | | | 472 | | | | 33 | | | | 4,250 | | | | 16,617 | |
2014 | | | – | | | | 5 | | | | 370 | | | | 83 | | | | 3,815 | | | | 4,273 | |
2015 | | | – | | | | 1 | | | | 221 | | | | 42 | | | | 337 | | | | 601 | |
2016 | | | – | | | | – | | | | 43 | | | | 313 | | | | 244 | | | | 600 | |
2017 | | | – | | | | – | | | | 193 | | | | 298 | | | | 52 | | | | 543 | |
2018 – 2022 | | | – | | | | – | | | | 161 | | | | 504 | | | | 97 | | | | 762 | |
2023 and beyond | | | – | | | | – | | | | – | | | | 230 | | | | 10 | | | | 240 | |
Total | | | $7,750 | | | | $4,118 | | | | $1,460 | | | | $1,503 | | | | $8,805 | | | | $23,636 | |
*Includes $6,701 million of guarantees within the contract insurance and bonding program. | |
| (in millions of Canadian dollars) | | Dec. 31, 2011 | |
| | |
| Credit
insurance |
| |
| Financial
institutions
insurance |
| |
| Contract
insurance and
bonding |
| |
| Political risk
insurance |
| | | Guarantees | * | | | Total | |
2012 | | | 7,804 | | | | 6,931 | | | | 960 | | | | 78 | | | | 4,824 | | | | 20,597 | |
2013 | | | – | | | | 35 | | | | 455 | | | | 138 | | | | 4,216 | | | | 4,844 | |
2014 | | | – | | | | 2 | | | | 213 | | | | 15 | | | | 332 | | | | 562 | |
2015 | | | – | | | | 1 | | | | 201 | | | | 37 | | | | 96 | | | | 335 | |
2016 | | | – | | | | – | | | | 39 | | | | 313 | | | | 120 | | | | 472 | |
2017 | | | – | | | | – | | | | 175 | | | | 469 | | | | 68 | | | | 712 | |
2018 – 2022 | | | – | | | | – | | | | 162 | | | | 477 | | | | 61 | | | | 700 | |
2023 and beyond | | | – | | | | – | | | | – | | | | 241 | | | | 9 | | | | 250 | |
Total | | | $7,804 | | | | $6,969 | | | | $2,205 | | | | $1,768 | | | | $9,726 | | | | $28,472 | |
| * | Includes $6,986 million of guarantees within the contract insurance and bonding program. |
|
| 110 | Adapting to the New Reality |
INSURANCE POLICIES
The major concentrations of risk by location are as follows:
CREDIT INSURANCE
| | | | | | | | | | | | | | | | | | | | | | | | | | | | | | | | | | |
(in millions of Canadian dollars) | | Dec. 31, 2012 | | | Dec. 31, 2011 | |
| | |
| Credit
insurance |
| |
| Reinsurance
assumed |
| |
| Reinsurance
ceded |
| |
| Net credit
insurance |
| | | |
| Credit
insurance |
| |
| Reinsurance
assumed |
| |
| Reinsurance
ceded |
| |
| Net credit
insurance |
|
United States | | | 3,702 | | | | 42 | | | | (125 | ) | | | 3,619 | | | United
States | | | 3,737 | | | | 22 | | | | (72 | ) | | | 3,687 | |
Canada | | | 232 | | | | 129 | | | | (13 | ) | | | 348 | | | Canada | | | 322 | | | | 140 | | | | (7 | ) | | | 455 | |
Japan | | | 357 | | | | – | | | | (10 | ) | | | 347 | | | China | | | 446 | | | | – | | | | (2 | ) | | | 444 | |
Indonesia | | | 315 | | | | – | | | | – | | | | 315 | | | Indonesia | | | 324 | | | | 1 | | | | – | | | | 325 | |
United King-
dom | | | 258 | | | | – | | | | (15 | ) | | | 243 | | | United
Kingdom | | | 289 | | | | 1 | | | | (20 | ) | | | 270 | |
Mexico | | | 232 | | | | 12 | | | | (5 | ) | | | 239 | | | Japan | | | 228 | | | | – | | | | (1 | ) | | | 227 | |
Other | | | 2,690 | | | | 1 | | | | (52 | ) | | | 2,639 | | | Other | | | 2,434 | | | | 34 | | | | (72 | ) | | | 2,396 | |
Total | | | $7,786 | | | | $184 | | | | $(220 | ) | | | $7,750 | | | Total | | | $7,780 | | | | $198 | | | | $(174 | ) | | | $7,804 | |
FINANCIAL INSTITUTIONS INSURANCE
| | | | | | | | | | |
(in millions of Canadian dollars) | | Dec. 31, 2012 | | | | | Dec. 31, 2011 | |
China | | | 1,012 | | | China | | | 1,973 | |
Turkey | | | 759 | | | Turkey | | | 1,022 | |
India | | | 497 | | | India | | | 722 | |
Brazil | | | 430 | | | South
Korea | | | 475 | |
South Korea | | | 386 | | | Brazil | | | 465 | |
Chile | | | 302 | | | Russia | | | 391 | |
Other | | | 732 | | | Other | | | 1,921 | |
Total | | | $4,118 | | | Total | | | $6,969 | |
CONTRACT INSURANCE AND BONDING
| | | | | | | | | | | | | | | | | | | | | | | | | | |
(in millions of Canadian dollars) | | Dec. 31, 2012 | | | | | Dec. 31, 2011 | |
| | |
| Contract
insurance
and
bonding |
| |
| Reinsurance
assumed |
| |
| Net
contract
insurance
and
bonding |
(2) | | | |
| Contract
insurance
and
bonding |
| |
| Reinsurance
assumed |
| |
| Net
contract
insurance
and
bonding |
(2) |
Canada | | | 44 | | | | 1,045 | | | | 1,089 | (1) | | Canada | | | 31 | | | | 1,542 | | | | 1,573 | (1) |
United States | | | 21 | | | | 159 | | | | 180 | | | United States | | | 50 | | | | 163 | | | | 213 | |
China | | | 45 | | | | – | | | | 45 | | | China | | | 87 | | | | – | | | | 87 | |
United Arab Emirates | | | 21 | | | | – | | | | 21 | | | Mexico | | | 63 | | | | – | | | | 63 | |
Israel | | | 16 | | | | – | | | | 16 | | | United Arab
Emirates | | | 54 | | | | – | | | | 54 | |
Other | | | 103 | | | | 6 | | | | 109 | | | Other | | | 209 | | | | 6 | | | | 215 | |
Total | | | $250 | | | | $1,210 | | | | $1,460 | | | Total | | | $494 | | | | $1,711 | | | | $2,205 | |
| (1) | Of this amount, $243 million (2011 – $355 million) relates to our temporarily expanded mandate. |
|
EDC Annual Report 2012 | 111 |
CONSOLIDATED FINANCIAL STATEMENTS
POLITICAL RISK INSURANCE
| | | | | | | | | | | | | | | | | | | | | | | | | | | | | | | | | | |
(in millions of Canadian dollars) | | Dec. 31, 2012 | | | Dec. 31, 2011 | |
| | |
| Political
risk
insurance |
| |
| Reinsurance
assumed |
| |
| Reinsurance
ceded |
| |
| Net
political
risk
insurance |
| | | |
| Political
risk
insurance |
| |
| Reinsurance
assumed |
| |
| Reinsurance
ceded |
| |
| Net
political
risk
insurance |
|
Libya | | | 300 | | | | – | | | | – | | | | 300 | | | Libya | | | 300 | | | | – | | | | – | | | | 300 | |
China | | | 39 | | | | 179 | | | | – | | | | 218 | | | Peru | | | 366 | | | | – | | | | (116 | ) | | | 250 | |
Angola | | | 271 | | | | – | | | | (65 | ) | | | 206 | | | China | | | 29 | | | | 183 | | | | – | | | | 212 | |
Dominican Republic | | | 316 | | | | – | | | | (190 | ) | | | 126 | | | Angola | | | 277 | | | | – | | | | (66 | ) | | | 211 | |
Papua New Guinea | | | 199 | | | | – | | | | (99 | ) | | | 100 | | | Thailand | | | 188 | | | | – | | | | (48 | ) | | | 140 | |
Other | | | 1,426 | | | | 20 | | | | (893 | ) | | | 553 | | | Other | | | 1,320 | | | | 61 | | | | (726 | ) | | | 655 | |
Total | | | $2,551 | | | | $199 | | | | $(1,247 | ) | | | $1,503 | | | Total | | | $2,480 | | | | $244 | | | | $(956 | ) | | | $1,768 | |
GUARANTEES
We issue performance security guarantees which provide coverage to the exporter’s bank for up to 100% of the guarantee value in the event of any call by the buyer. Financial security guarantees are issued to provide coverage to the exporter’s bank for up to 100% of the guarantee value in the event of any call by the supplier and any foreign bank. Foreign exchange guarantees are also issued which provide a guarantee to secure the settlement risks associated with foreign exchange forward contracts. Each guarantee issued stipulates a recovery provision whereby the third party, the exporter, agrees to indemnify us should a payment be made under the guarantee. Unless otherwise stated, the indemnification agreement generally ranks as an unsecured liability of the exporter.
We issue loan guarantees to cover non-payment of principal, interest and fees due to banks and financial institutions providing loans to buyers of Canadian goods and services. Calls on guarantees result in our recognition of a loan asset within our financial statements and become a direct obligation of the buyer. At the end of December 2012, loan guarantees with performing obligors were $2,078 million of which $41 million were secured (2011 – $2,626 million in performing guarantees of which $53 million were secured). Our impaired guarantees were $26 million for 2012 of which $3 million are secured (2011 – $114 million of which none were secured).
At the end of December 2012, we have guarantees outstanding of $8,805 million (2011 – $9,726 million).
| | | | | | | | |
| (in millions of Canadian dollars) | | Dec. 31, 2012 | | | Dec. 31, 2011 | |
Contract insurance and bonding: | | | | | | | | |
Performance security guarantees(1) | | | 6,382 | | | | 6,613 | |
Foreign exchange guarantees | | | 297 | | | | 339 | |
Financial security guarantees | | | 22 | | | | 34 | |
Contract insurance and bonding guarantees | | | 6,701 | | | | 6,986 | |
Loan guarantees(2) | | | 2,104 | | | | 2,740 | |
Total | | | $8,805 | | | | $9,726 | |
| (1) | Includes $615 million of domestic performance security guarantees relating to our temporarily expanded mandate (2011 – $610 million). | |
| (2) | Includes $64 million of domestic loan guarantees relating to our temporarily expanded mandate (2011 – $37 million). | |
Loan guarantees on the consolidated statement of financial position are comprised as follows:
| | | | | | | | |
| (in millions of Canadian dollars) | | Dec. 31, 2012 | | | Dec. 31, 2011 | |
Deferred guarantee fee revenue | | | 51 | | | | 60 | |
Allowance for losses on loan guarantees | | | 110 | | | | 206 | |
Total | | | $161 | | | | $266 | |
We are involved in various legal proceedings in the ordinary course of business. Management does not expect the outcome of any of these proceedings to have a material effect on our consolidated financial position or our results of operations.
|
| 112 | Adapting to the New Reality |
22. Reinsurance Agreements
We cede reinsurance to limit exposure to large losses. Reinsurance contracts do not relieve us of our obligations to the insured. However, they do provide for the recovery of claims arising from the liabilities ceded. We have treaty and facultative reinsurance agreements covering the credit insurance portfolio, some bonding obligors as well as some country political risk exposures. Our risk management group assesses and monitors counterparty risks of the reinsurers; management has determined that no additional allowance is required for this ceded exposure.
We have assumed export risks for a number of Canadian exporters under facultative arrangements with private credit insurers. For the surety bond insurance line of business, within the contract insurance and bonding program, we have general reinsurance agreements with several surety companies. In addition, we have assumed facultative reinsurance positions under our contract frustration, surety bonding and political risk insurance products.
The effect of reinsurance on our contingent liability is disclosed in Note 21 and the impact on premiums is as follows:
| | | | | | | | | | | | | | | | | | | | | | | | | | | | | | | | |
(in millions of Canadian dollars) | | Dec. 31, 2012 | | | Dec. 31, 2011 | |
| | |
| Direct
premium
and
guarantee
fees |
| |
| Reinsurance
premium
assumed |
| |
| Reinsurance
premium
ceded |
| |
| Total
premium
and
guarantee
fees |
| |
| Direct
premium
and
guarantee
fees |
| |
| Reinsurance
premium
assumed |
| |
| Reinsurance
premium
ceded |
| |
| Total
premium
and
guarantee
fees |
|
Credit insurance | | | 110 | | | | 4 | | | | (6 | ) | | | 108 | | | | 131 | | | | 5 | | | | (7 | ) | | | 129 | |
Financial institutions insurance | | | 18 | | | | – | | | | – | | | | 18 | | | | 32 | | | | – | | | | – | | | | 32 | |
Contract insurance and bonding | | | 44 | | | | 6 | | | | (2 | ) | | | 48 | | | | 51 | | | | 8 | | | | (1 | ) | | | 58 | |
Political risk insurance | | | 32 | | | | 2 | | | | (12 | ) | | | 22 | | | | 24 | | | | – | | | | (9 | ) | | | 15 | |
Total | | | $204 | | | | $12 | | | | $(20 | ) | | | $196 | | | | $238 | | | | $13 | | | | $(17 | ) | | | $234 | |
23. Insurance Risks
INSURANCE AND FINANCIAL RISK
The risks within our insurance program are mitigated by diversification across geographical markets, industries and a portfolio of insurance contracts across uncorrelated product lines. We further manage our risk through the application of a detailed underwriting process which ensures that exposures receive tiered levels of due diligence based on their size and level of risk. Our risk acceptance decisions are supported by the Corporation’s strong resources in the areas of economics, political risk and legal. Our risk management procedures also include the use of risk transfer arrangements.
The core operating principles for risk transfer activity are to (1) mitigate potential large losses due to existing high concentration in obligor, sector and country risk, (2) protect from credit deterioration within the portfolio, and (3) proactively acquire additional credit capacity.
We engage in various risk transfer activities primarily through co-insurance and reinsurance. Co-insurance can be defined as leveraging another insurer’s capacity by jointly sharing the risk of the original insurance policy. A co-insurance agreement is typically put in place at the time of origination of the transaction. Under this structure, we are not exposed to the credit risk of the co-insurer. Under a reinsurance structure, we assume the risk of the original policy, and cede that risk to a counterparty (the “reinsurer”). Under this structure, we are exposed to the credit risk of the reinsurer (referred to as counterparty risk.) To help mitigate this risk, our placement of reinsurance is diversified such that it is not dependent on a single reinsurer. Reinsurance counterparty exposure is managed under our reinsurance counterparty management procedures and monitored by our Market Risk Management team.
|
EDC Annual Report 2012 | 113 |
CONSOLIDATED FINANCIAL STATEMENTS
INSURANCE AND GUARANTEE CONTRACTS
We principally issue insurance to our customers to protect them against non-payment by an obligor and/or other losses due to political risk. Guarantees are typically issued to the counterparties of our customers in order to provide them with recourse should our customers not perform as contracted.
A. Credit Risk
Within our credit insurance, financial institutions insurance and contract insurance and bonding programs, our primary risk is credit risk. The credit risk may be that of our customers or their obligors. During our underwriting process, our assessment considers both an entity’s ability and willingness to pay. Ability to pay is primarily based on the financial strength, operations and leadership of the entity (commercial or sovereign) that is the source of our risk. Other factors such as their industry’s environment, the economy, as well as political and geographical events are also considered. Willingness to pay primarily involves an assessment of the entity’s payment history, reputation and governance.
B. Political Risk
Within our political risk insurance program, we primarily underwrite political risks as opposed to the credit risk as discussed above. Our assessment considers politically motivated events that may jeopardize our clients’ assets or income in a foreign market. As a baseline for our risk assessment of a given market we assess the transfer and convertibility of local currency, expropriation risk as well as the risk of political violence.
In addition to our risk management procedures discussed above, our Claims and Recoveries team thoroughly reviews debt files at all stages of the overdue, claim and recovery process. This team manages and pursues debt files so as to minimize losses. Continuously evolving documentation and analytical standards also ensure that the claims process and its outcomes are appropriate and consistent.
We also manage our exposure through policy structuring measures including the use of maximum liability amounts and risk sharing with our customers on certain contracts.
ACTUARIAL CALCULATION
PRINCIPAL RISKS
There is a limitation upon the accuracy of the policy and claims liabilities as there is an inherent uncertainty in any estimate of policy and claims liabilities. There is uncertainty in any estimate because future events could affect the ultimate claim amounts. Examples of future events include, but are not limited to:
| | (2) | higher than anticipated claim loss development; |
| | (3) | concentration of credit losses; and |
| | (4) | geo-political considerations. |
Therefore the actual ultimate claim amount may differ materially from estimates. However, we have employed standard actuarial techniques and appropriate assumptions to mitigate this risk.
KEY ASSUMPTIONS
The key risk components to the insurance provisioning exercise are claim frequency, claim severity, future claim development, and foreign exchange rates. These risk components are analyzed and estimated using EDC’s own loss experience. A qualitative component is added to these quantitative risk components as warranted by external factors as mentioned above.
SENSITIVITY ANALYSIS
The following table illustrates the impact on net income of variations in key risk components. A 10% change was applied to key risk components and the impact on policy and claims liabilities was quantified. The largest sensitivities pertain to claim frequency, claim severity and foreign exchange rates.
|
| 114 | Adapting to the New Reality |
KEY RISKS SENSITIVITIES
| | | | | | | | | | | | |
| (in millions of Canadian dollars) | | Dec. 31, 2012 | |
| | |
| Changes in
assumptions |
| |
| Impact on gross
liabilities |
| |
| Impact on net
income |
|
Frequency of claims | | | +10% | | | | 39 | | | | 32 | |
Frequency of claims | | | -10% | | | | (41 | ) | | | (33 | ) |
Severity of claims | | | +10% | | | | 41 | | | | 35 | |
Severity of claims | | | -10% | | | | (42 | ) | | | (35 | ) |
Foreign exchange rates | | | +10% | | | | 58 | | | | 47 | |
Foreign exchange rates | | | -10% | | | | (48 | ) | | | (39 | ) |
Claims development | | | +10% | | | | 5 | | | | 5 | |
Claims development | | | -10% | | | | (5 | ) | | | (5 | ) |
| | | |
| | | | | | | | | | | | |
| (in millions of Canadian dollars) | | Dec. 31, 2011 | |
| | |
| Changes in
assumptions |
| |
| Impact on gross
liabilities |
| |
| Impact on net
income |
|
Frequency of claims | | | +10% | | | | 45 | | | | 36 | |
Frequency of claims | | | -10% | | | | (47 | ) | | | (37 | ) |
Severity of claims | | | +10% | | | | 49 | | | | 39 | |
Severity of claims | | | -10% | | | | (50 | ) | | | (41 | ) |
Foreign exchange rates | | | +10% | | | | 63 | | | | 48 | |
Foreign exchange rates | | | -10% | | | | (63 | ) | | | (47 | ) |
Claims development | | | +10% | | | | 6 | | | | 6 | |
Claims development | | | -10% | | | | (6 | ) | | | (6 | ) |
CLAIMS DEVELOPMENT
As time passes the ultimate cost for the claims become more certain. The chart below compares actual claims with previous estimates for the credit insurance portfolio:
| | | | | | | | | | | | | | | | | | | | | | | | |
| (in millions of Canadian dollars) | |
Underwriting Year | | | 2008 | | | | 2009 | | | | 2010 | | | | 2011 | | | | 2012 | | | | Total | |
Estimate of cumulative claims: | | | | | | | | | | | | | | | | | | | | | | | | |
At end of underwriting year | | | 92 | | | | 68 | | | | 51 | | | | 44 | | | | 38 | | | | | |
One year later | | | 132 | | | | 40 | | | | 34 | | | | 42 | | | | | | | | | |
Two years later | | | 115 | | | | 38 | | | | 33 | | | | | | | | | | | | | |
Three years later | | | 109 | | | | 37 | | | | | | | | | | | | | | | | | |
Four years later | | | 105 | | | | | | | | | | | | | | | | | | | | | |
Estimate of cumulative claims (at Dec. 31, 2012) | | | 105 | | | | 37 | | | | 33 | | | | 42 | | | | 38 | | | | 255 | |
Cumulative incurred losses (at Dec. 31, 2012) | | | 103 | | | | 35 | | | | 30 | | | | 35 | | | | 9 | | | | 212 | |
Effect of margin and discounting | | | 2 | | | | – | | | | – | | | | 1 | | | | 4 | | | | 7 | |
2008 – 2012 Claim Liabilities (IBNR) (at Dec. 31, 2012) | | | $4 | | | | $2 | | | | $3 | | | | $8 | | | | $33 | | | | $50 | |
|
EDC Annual Report 2012 | 115 |
CONSOLIDATED FINANCIAL STATEMENTS
24. Equity
EDC’s authorized share capital is $3.0 billion consisting of 30 million shares with a par value of $100 each. The number of shares issued and fully paid is 13.3 million (2011 – 13.3 million). These shares entitle our shareholder to receive a dividend from time to time. No shares were issued in 2012 (2011 – nil). In March 2012, a dividend of $500 million was paid to the Government of Canada (2011 – $350 million). The dividend per share in 2012 was $37.59 (2011 – $26.32).
25. Capital Management
EDC has a capital management process in place to ensure that we are appropriately capitalized and that our capital position is identified, measured, managed and regularly reported to the Board of Directors. We are not subject to externally imposed capital requirements.
Our primary objective with respect to capital management is to ensure that EDC has adequate capital to support the evolving needs of Canadian exporters and investors while remaining financially self-sustaining.
We manage our capital through a Board approved capital adequacy policy. Under our capital adequacy policy we determine whether we have adequate capital by comparing the supply of capital to the demand for capital. The policy also includes an eligible dividend methodology to guide the Board of Directors in determining a potential dividend amount. Demand for capital is calculated by a model which estimates the capital required to cover the extreme value of potential losses (including both expected and unexpected losses) arising from credit, interest rate, foreign exchange, operational and business risk. The supply of capital is determined by our financial statements and consists of paid-in share capital, retained earnings and allowances. Our capital adequacy policy was updated in 2012 to reflect the removal of strategic risk capital from the demand for capital calculation. Strategic risk capital was designated for facilitating higher risk business opportunities outside of our typical operational norm. The eligible dividend methodology was updated to capture our estimated need for capital related to this business while subjecting it to a foreign exchange test and to consider a standard set of stress tests which are performed according to current market practice.
A key principle in our capital management is the establishment of a target solvency standard or credit rating which determines the level of demand for capital that is required to cover EDC’s exposures in exceptional circumstances. We target a level of capitalization sufficient to cover potential losses consistent with a rating standard of AA.
The following table represents the breakdown of EDC’s supply of capital at December 31:
| | | | | | | | |
| (in millions of Canadian dollars) | | Dec. 31, 2012 | | | Dec. 31, 2011 | |
Allowance for losses on loans | | | 1,182 | | | | 1,680 | |
Allowance for losses on loan commitments | | | 58 | | | | 41 | |
Allowance for losses on loan guarantees | | | 110 | | | | 206 | |
Allowance for claims on insurance | | | 483 | | | | 782 | |
Reinsurers’ share of policy and claims liabilities | | | (90) | | | | (129) | |
Share capital | | | 1,333 | | | | 1,333 | |
Retained earnings | | | 7,744 | | | | 6,923 | |
Supply of capital | | | $10,820 | | | | $10,836 | |
|
| 116 | Adapting to the New Reality |
26. Interest Rate Risk
The following table summarizes our interest rate risk based on the gap between the notional amount of assets and liabilities grouped by the earlier of contractual re-pricing or maturity dates. Notional amounts reflect our true exposure to re-pricing at various maturities. The differences between the notional amounts and the carrying values, the positions not subject to re-pricing risk and equity are presented in the non-interest rate sensitive column to ensure comparability with the consolidated statement of financial position. The effective interest rates shown indicate historical rates for fixed rate and floating rate instruments.
| | | | | | | | | | | | | | | | | | | | | | | | | | | | |
| (in millions of Canadian dollars) | |
| Immediately
rate-sensitive |
| |
| Up to 6
months |
| |
| Over 6 to
12 months |
| |
| Over 1 to 5
years |
| |
| Over 5
years |
| |
| Non-interest
rate sensitive |
(2) | |
| Dec. 31,
2012 Total |
|
Assets | | | | | | | | | | | | | | | | | | | | | | | | | | | | |
Cash and marketable securities | | | 80 | | | | 2,055 | | | | 17 | | | | 1,485 | | | | 466 | | | | 133 | | | | 4,236 | |
| | | | | | | | |
Gross loans receivable | | | 226 | | | | 21,799 | | | | 452 | | | | 3,675 | | | | 3,024 | | | | 1,160 | | | | 30,336 | |
Effective interest rate % | | | 5.02 | % | | | 2.89 | % | | | 5.18 | % | | | 5.30 | % | | | 4.74 | % | | | | | | | | |
| | | | | | | | |
Less: | | | | | | | | | | | | | | | | | | | | | | | | | | | | |
Deferred revenue and other credits | | | – | | | | – | | | | – | | | | – | | | | – | | | | (362 | ) | | | (362 | ) |
Allowance for losses on loans | | | – | | | | – | | | | – | | | | – | | | | – | | | | (1,182 | ) | | | (1,182 | ) |
| | | | | | | | |
Aircraft under finance leases | | | – | | | | 5 | | | | 5 | | | | 69 | | | | – | | | | 1 | | | | 80 | |
Effective interest rate % | | | – | | | | 7.32 | % | | | 7.32 | % | | | 7.32 | % | | | – | | | | | | | | | |
| | | | | | | | |
Investments at fair value through profit or loss | | | – | | | | – | | | | – | | | | – | | | | – | | | | 429 | | | | 429 | |
| | | | | | | | |
Equipment available for lease, other assets and accrued interest | | | – | | | | – | | | | – | | | | – | | | | – | | | | 2,696 | | | | 2,696 | |
Total assets | | | $306 | | | | $23,859 | | | | $474 | | | | $5,229 | | | | $3,490 | | | | $2,875 | | | | $36,233 | |
| | | | | | | | |
Liabilities and equity | | | | | | | | | | | | | | | | | | | | | | | | | | | | |
Loans payable | | | – | | | | 10,918 | | | | 409 | | | | 13,688 | | | | 315 | | | | 550 | | | | 25,880 | |
Effective interest rate % | | | – | | | | 0.90 | % | | | 2.87 | % | | | 2.59 | % | | | 7.95 | % | | | | | | | | |
| | | | | | | | |
Total pay side instruments on swap contracts | | | – | | | | 21,376 | | | | 84 | | | | – | | | | – | | | | 6,870 | | | | 28,330 | |
Effective interest rate % | | | – | | | | 0.56 | % | | | 0.43 | % | | | – | | | | – | | | | | | | | | |
| | | | | | | | |
Total receive side instruments on swap contracts | | | – | | | | (7,411 | ) | | | (489 | ) | | | (13,668 | ) | | | (316 | ) | | | (6,852 | ) | | | (28,736 | ) |
Effective interest rate % | | | – | | | | 4.19 | % | | | 4.66 | % | | | 3.48 | % | | | 4.11 | % | | | | | | | | |
| | | | | | | | |
Cumulative foreign exchange translation on cross currency interest rate swaps(1) | | | – | | | | – | | | | – | | | | – | | | | – | | | | 406 | | | | 406 | |
Total loans payable | | | | | | | | | | | | | | | | | | | | | | | | | | | 25,880 | |
Other liabilities and deferred revenue | | | – | | | | – | | | | – | | | | – | | | | – | | | | 1,276 | | | | 1,276 | |
| | | | | | | | |
Equity | | | | | | | | | | | | | | | | | | | | | | | 9,077 | | | | 9,077 | |
Total liabilities and equity | | | $– | | | | $24,883 | | | | $4 | | | | $20 | | | | $(1 | ) | | | $11,327 | | | | $36,233 | |
| | | | | | | | |
At December 31, 2012 | | | | | | | | | | | | | | | | | | | | | | | | | | | | |
Total gap | | | 306 | | | | (1,024 | ) | | | 470 | | | | 5,209 | | | | 3,491 | | | | (8,452 | ) | | | – | |
Cumulative gap | | | 306 | | | | (718 | ) | | | (248 | ) | | | 4,961 | | | | 8,452 | | | | – | | | | – | |
| | | | | | | | |
Canadian dollar | | | 183 | | | | 1,081 | | | | 48 | | | | 229 | | | | 213 | | | | (1,753 | ) | | | – | |
Foreign currency | | | 123 | | | | (2,105 | ) | | | 422 | | | | 4,980 | | | | 3,278 | | | | (6,699 | ) | | | – | |
Total gap | | | $306 | | | | $(1,024 | ) | | | $470 | | | | $5,209 | | | | $3,491 | | | | $(8,452 | ) | | | $– | |
| (1) | Due to foreign exchange translation, the pay and receive side instruments may not net to zero. This amount represents the difference caused by foreign exchange translation on the pay and receive side instruments on swap contracts. |
| (2) | Included in non-interest rate sensitive amounts are the differences between the carrying amounts and the notional amounts, foreign exchange contracts and foreign exchange forwards not sensitive to interest rates. |
|
EDC Annual Report 2012 | 117 |
CONSOLIDATED FINANCIAL STATEMENTS
| | | | | | | | | | | | | | | | | | | | | | | | | | | | |
(in millions of Canadian dollars) | |
| Immediately
rate-sensitive |
| |
| Up to 6
months |
| |
| Over 6 to 12
months |
| |
| Over 1 to 5
years |
| |
| Over 5
years |
| |
| Non-interest
rate sensitive |
(2) | |
| Dec. 31,
2011 Total |
|
Assets | | | | | | | | | | | | | | | | | | | | | | | | | | | | |
Cash and marketable securities | | | 90 | | | | 1,690 | | | | 104 | | | | 1,372 | | | | 505 | | | | 125 | | | | 3,886 | |
| | | | | | | | |
Gross loans receivable | | | 350 | | | | 19,702 | | | | 478 | | | | 3,546 | | | | 3,212 | | | | 1,805 | | | | 29,093 | |
Effective interest rate % | | | 5.43 | % | | | 3.04 | % | | | 5.33 | % | | | 5.57 | % | | | 5.12 | % | | | | | | | | |
| | | | | | | | |
Less: | | | | | | | | | | | | | | | | | | | | | | | | | | | | |
Deferred revenue and other credits | | | – | | | | – | | | | – | | | | – | | | | – | | | | (558 | ) | | | (558 | ) |
Allowance for losses on loans | | | – | | | | – | | | | – | | | | – | | | | – | | | | (1,680 | ) | | | (1,680 | ) |
| | | | | | | | |
Aircraft under finance leases | | | – | | | | 5 | | | | 5 | | | | 66 | | | | 16 | | | | – | | | | 92 | |
Effective interest rate % | | | | | | | 7.31 | % | | | 7.31 | % | | | 7.36 | % | | | 7.20 | % | | | | | | | | |
Investments at fair value through profit or loss | | | – | | | | – | | | | – | | | | – | | | | – | | | | 385 | | | | 385 | |
| | | | | | | | |
Equipment available for lease, other assets and accrued interest | | | – | | | | – | | | | – | | | | – | | | | – | | | | 2,378 | | | | 2,378 | |
Total assets | | | $440 | | | | $21,397 | | | | $587 | | | | $4,984 | | | | $3,733 | | | | $2,455 | | | | $33,596 | |
| | | | | | | | |
Liabilities and equity | | | | | | | | | | | | | | | | | | | | | | | | | | | | |
Loans payable | | | – | | | | 7,561 | | | | 3,644 | | | | 10,886 | | | | 878 | | | | 601 | | | | 23,570 | |
Effective interest rate % | | | – | | | | 1.25 | % | | | 3.36 | % | | | 3.21 | % | | | 5.81 | % | | | | | | | | |
| | | | | | | | |
Total pay side instruments on swap contracts | | | – | | | | 19,979 | | | | 409 | | | | – | | | | – | | | | 6,884 | | | | 27,272 | |
Effective interest rate % | | | – | | | | 0.98 | % | | | – | | | | – | | | | – | | | | | | | | | |
| | | | | | | | |
Total receive side instruments on swap contracts | | | – | | | | (6,142 | ) | | | (3,036 | ) | | | (10,930 | ) | | | (879 | ) | | | (6,916 | ) | | | (27,903 | ) |
Effective interest rate % | | | – | | | | 4.19 | % | | | 4.66 | % | | | 3.48 | % | | | 4.11 | % | | | | | | | | |
| | | | | | | | |
Cumulative foreign exchange translation on cross currency interest rate swaps(1) | | | – | | | | – | | | | – | | | | – | | | | – | | | | 631 | | | | 631 | |
Total loans payable | | | | | | | | | | | | | | | | | | | | | | | | | | | 23,570 | |
| | | | | | | | |
Other liabilities and deferred revenue | | | – | | | | – | | | | – | | | | – | | | | – | | | | 1,770 | | | | 1,770 | |
| | | | | | | | |
Equity | | | | | | | | | | | | | | | | | | | | | | | 8,256 | | | | 8,256 | |
Total liabilities and equity | | | $– | | | | $21,398 | | | | $1,017 | | | | $(44 | ) | | | $(1 | ) | | | $11,226 | | | | $33,596 | |
| | | | | | | | |
At December 31, 2011 | | | | | | | | | | | | | | | | | | | | | | | | | | | | |
Total gap | | | 440 | | | | (1 | ) | | | (430 | ) | | | 5,028 | | | | 3,734 | | | | (8,771 | ) | | | – | |
Cumulative gap | | | 440 | | | | 439 | | | | 9 | | | | 5,037 | | | | 8,771 | | | | – | | | | – | |
| | | | | | | | |
Canadian dollar | | | 186 | | | | 1,166 | | | | (200 | ) | | | (462 | ) | | | 503 | | | | (1,193 | ) | | | – | |
Foreign currency | | | 254 | | | | (1,167 | ) | | | (230 | ) | | | 5,490 | | | | 3,231 | | | | (7,578 | ) | | | – | |
Total gap | | | $440 | | | | $(1 | ) | | | $(430 | ) | | | $5,028 | | | | $3,734 | | | | $(8,771 | ) | | | $– | |
| (1) | Due to foreign exchange translation, the pay and receive side instruments may not net to zero. This amount represents the difference caused by foreign exchange translation on the pay and receive side instruments on swap contracts. |
| (2) | Included in non-interest rate sensitive amounts are the differences between the carrying amounts and the notional amounts, foreign exchange contracts and foreign exchange forwards not sensitive to interest rates. |
|
| 118 | Adapting to the New Reality |
27. Foreign Currency Balances
We have substantial assets and liabilities denominated in U.S. dollars and in other currencies. In addition, we have derivative instruments denominated in various currencies. The purpose of these derivative instruments is to minimize our cost of capital and optimize our yields, while remaining within treasury guidelines and limits approved by our Board of Directors.
The following table shows where we have used derivative instruments to manage the foreign currency exposures of our asset and liability positions. The net foreign currency exposure at the end of December 2012 (expressed in Canadian equivalent dollars) is as follows:
| | | | | | | | | | | | | | | | | | | | | | | | | | | | | | | | | | |
| (in millions of Canadian dollars) | | Dec. 31, 2012 | |
| | | | | | | | | | | | | | | | | | | | | | | | | | | | | | Net foreign | | | | Foreign | |
| | | | Assets | | | | | | Liabilities | | | | currency | | | | exchange | |
| | | | Gross | | | | DI* | | | | Net | | | | | | Gross | | | | DI* | | | | Net | | | | exposure | | | | rate | |
U.S. dollars | | | 27,980 | | | | 132 | | | | 28,112 | | | | | | (18,168) | | | | (10,172) | | | | (28,340) | | | | (228) | | | | 0.9933 | |
Euros | | | 1,687 | | | | – | | | | 1,687 | | | | | | (6) | | | | (1,680) | | | | (1,686) | | | | 1 | | | | 1.3107 | |
Australian dollars | | | 868 | | | | – | | | | 868 | | | | | | (3,146) | | | | 2,282 | | | | (864) | | | | 4 | | | | 1.0321 | |
British pounds | | | 808 | | | | – | | | | 808 | | | | | | (2,476) | | | | 1,669 | | | | (807) | | | | 1 | | | | 1.6138 | |
Mexican peso | | | 153 | | | | – | | | | 153 | | | | | | (22) | | | | (129) | | | | (151) | | | | 2 | | | | 0.0771 | |
Japanese yen | | | 123 | | | | – | | | | 123 | | | | | | (438) | | | | 317 | | | | (121) | | | | 2 | | | | 0.0115 | |
Norwegian krone | | | 92 | | | | – | | | | 92 | | | | | | (279) | | | | 187 | | | | (92) | | | | – | | | | 0.1787 | |
Polish zloty | | | 75 | | | | – | | | | 75 | | | | | | – | | | | (72) | | | | (72) | | | | 3 | | | | 0.3211 | |
Czech koruna | | | 64 | | | | – | | | | 64 | | | | | | – | | | | (62) | | | | (62) | | | | 2 | | | | 0.0523 | |
New Zealand dollars | | | 35 | | | | – | | | | 35 | | | | | | (294) | | | | 257 | | | | (37) | | | | (2) | | | | 0.8211 | |
Tanzanian shilling | | | 10 | | | | – | | | | 10 | | | | | | – | | | | – | | | | – | | | | 10 | | | | 0.0006 | |
Hong Kong dollars | | | 1 | | | | – | | | | 1 | | | | | | (13) | | | | 13 | | | | – | | | | 1 | | | | 0.1282 | |
Turkish lira | | | – | | | | – | | | | – | | | | | | (76) | | | | 76 | | | | – | | | | – | | | | 0.5568 | |
Brazilian real | | | – | | | | – | | | | – | | | | | | (255) | | | | 256 | | | | 1 | | | | 1 | | | | 0.4849 | |
Swiss franc | | | – | | | | – | | | | – | | | | | | (304) | | | | 304 | | | | – | | | | – | | | | 1.0857 | |
*DI represents derivative instruments. See Note 17. | |
| (in millions of Canadian dollars) | | Dec. 31, 2011 | |
| | | | | | | | | | | | | | | | | | | | | | | | | | | | | | Net foreign | | | | Foreign | |
| | | | Assets | | | | | | Liabilities | | | | currency | | | | exchange | |
| | | | Gross | | | | DI* | | | | Net | | | | | | Gross | | | | DI* | | | | Net | | | | exposure | | | | rate | |
U.S. dollars | | | 26,157 | | | | 32 | | | | 26,189 | | | | | | (17,187) | | | | (9,287) | | | | (26,474) | | | | (285) | | | | 1.0164 | |
Euros | | | 1,260 | | | | – | | | | 1,260 | | | | | | (15) | | | | (1,258) | | | | (1,273) | | | | (13) | | | | 1.3173 | |
British pounds | | | 997 | | | | – | | | | 997 | | | | | | (1,324) | | | | 330 | | | | (994) | | | | 3 | | | | 1.5766 | |
Australian dollars | | | 654 | | | | – | | | | 654 | | | | | | (2,140) | | | | 1,464 | | | | (676) | | | | (22) | | | | 1.0414 | |
Japanese yen | | | 287 | | | | – | | | | 287 | | | | | | (574) | | | | 287 | | | | (287) | | | | – | | | | 0.0132 | |
Mexican peso | | | 164 | | | | – | | | | 164 | | | | | | – | | | | (166) | | | | (166) | | | | (2) | | | | 0.0728 | |
Polish zloty | | | 67 | | | | – | | | | 67 | | | | | | – | | | | (67) | | | | (67) | | | | – | | | | 0.2951 | |
Czech koruna | | | 63 | | | | – | | | | 63 | | | | | | – | | | | (62) | | | | (62) | | | | 1 | | | | 0.0515 | |
Brazilian real | | | 45 | | | | – | | | | 45 | | | | | | – | | | | (45) | | | | (45) | | | | – | | | | 0.5455 | |
New Zealand dollars | | | 42 | | | | – | | | | 42 | | | | | | – | | | | (52) | | | | (52) | | | | (10) | | | | 0.7927 | |
Hong Kong dollars | | | 35 | | | | – | | | | 35 | | | | | | (276) | | | | 241 | | | | (35) | | | | – | | | | 0.1309 | |
Tanzanian shilling | | | 11 | | | | – | | | | 11 | | | | | | – | | | | (6) | | | | (6) | | | | 5 | | | | 0.0006 | |
Turkish lira | | | – | | | | – | | | | – | | | | | | (27) | | | | 27 | | | | – | | | | – | | | | 0.5392 | |
Swiss franc | | | – | | | | – | | | | – | | | | | | (315) | | | | 315 | | | | – | | | | – | | | | 1.0836 | |
Swedish krona | | | – | | | | – | | | | – | | | | | | (446) | | | | 446 | | | | – | | | | – | | | | 0.1477 | |
Norwegian krone | | | – | | | | – | | | | – | | | | | | (457) | | | | 461 | | | | 4 | | | | 4 | | | | 0.1701 | |
| * | DI represents derivative instruments. See Note 17. |
|
EDC Annual Report 2012 | 119 |
CONSOLIDATED FINANCIAL STATEMENTS
28. Fair Value of Financial Instruments
Fair value represents our estimation of the amount for which an asset could be exchanged, or a liability settled, between knowledgeable, willing parties in an arm’s length transaction.
As with any estimate, uncertainty is inherent due to the unpredictability of future events. In the case of estimating the fair value of our financial instruments, this uncertainty is magnified due to the large number of assumptions used and the wide range of acceptable valuation techniques. Estimates of fair values are based on market conditions at a certain point in time, and may not be reflective of future market conditions. Therefore, the estimates of the fair value of financial instruments outlined as follows do not necessarily reflect the actual values that may occur should the instruments be exchanged in the market.
| | | | | | | | | | | | | | | | |
| (in millions of Canadian dollars) | | Dec. 31, 2012 | | | Dec. 31, 2011 | |
| | | | Carrying value | | | | Fair value | | | | Carrying value | | | | Fair value | |
Assets | | | | | | | | | | | | | | | | |
Performing fixed rate loans | | | 7,462 | | | | 8,237 | | | | 7,481 | | | | 7,768 | |
Performing floating rate loans | | | 20,666 | | | | 20,774 | | | | 18,364 | | | | 17,132 | |
Total performing loans receivable | | | 28,128 | | | | 29,011 | | | | 25,845 | | | | 24,900 | |
Carrying value of individually impaired loans | | | 838 | | | | 838 | | | | 1,178 | | | | 1,178 | |
Loans receivable and accrued interest and fees | | | 28,966 | | | | 29,849 | | | | 27,023 | | | | 26,078 | |
Cash | | | 80 | | | | 80 | | | | 90 | | | | 90 | |
Marketable securities: | | | | | | | | | | | | | | | | |
At fair value through profit or loss | | | 4,082 | | | | 4,082 | | | | 3,720 | | | | 3,720 | |
At amortized cost | | | 74 | | | | 75 | | | | 76 | | | | 76 | |
Investments at fair value through profit or loss | | | 429 | | | | 429 | | | | 385 | | | | 385 | |
Recoverable insurance claims | | | 200 | | | | 200 | | | | 44 | | | | 44 | |
Derivative instruments | | | 1,352 | | | | 1,352 | | | | 1,541 | | | | 1,541 | |
Liabilities | | | | | | | | | | | | | | | | |
Accounts payable | | | 113 | | | | 113 | | | | 159 | | | | 159 | |
Loans payable: | | | | | | | | | | | | | | | | |
Designated at fair value through profit or loss | | | 24,862 | | | | 24,862 | | | | 21,505 | | | | 21,505 | |
At amortized cost | | | 1,018 | | | | 1,060 | | | | 2,065 | | | | 2,155 | |
Derivative instruments | | | 120 | | | | 120 | | | | 178 | | | | 178 | |
Loan guarantees | | | 161 | | | | 161 | | | | 266 | | | | 266 | |
We have controls and policies in place to ensure that our valuations are appropriate and realistic. In general, the methodologies, models and assumptions used to measure the fair value of our financial assets and liabilities are determined by our Market Risk Management team, which is not involved in the initiation of the transactions. The models, valuation methodologies, and market-based parameters and inputs that are used, are subject to regular review and validation, including a comparison with values from outside agencies. In limited circumstances where the valuation of a financial instrument is not independent from the initiation of the transaction, the resulting valuation is subject to review by a valuation committee.
The assumptions and valuation techniques that we use to estimate fair values are as follows:
LOANS RECEIVABLE
In order to estimate the fair value of our performing loans receivable (including accrued interest receivable), we separate them into risk pools and calculate the net present value of principal and interest cash flows. The discount rates are obtained from yield curves for each risk pool and are specific to the credit risk and term to maturity associated with each principal and interest cash flow.
The fair value of impaired loans is considered to be equal to their carrying value.
MARKETABLE SECURITIES
We estimate the fair value of marketable securities using observable market prices. If such prices are not available, we determine the fair value by discounting future cash flows using an appropriate yield curve.
|
| 120 | Adapting to the New Reality |
INVESTMENTS
Our approach to fair value measurement has been derived by guidelines issued by the International Private Equity and Venture Capital (“IPEVC”) Valuation Guideline. Depending on the type of investment, we estimate fair value using one of the following: (i) market-based methodologies, such as the quoted share price or the price of recent investments; (ii) discounted earnings or cash flow approaches; or (iii) liquidation or asset-based methods. The valuations are established by management and reviewed and approved by an independent valuation committee with representatives from our Risk Management and Finance groups.
Significant assumptions used in the determination of fair value can include discount or capitalization rate, rate of return and the weighting of forecasted earnings.
RECOVERABLE INSURANCE CLAIMS
The fair value of recoverable insurance claims is considered to be equal to their carrying value.
LOANS PAYABLE
The fair value of our less complex loans payable is determined using the discounted cash flow method. Forward rates are used to value floating rate cash flows occurring in the future. Cash flows are discounted using the respective currency’s yield curve. Inputs to the models are market observable and may include interest rate yield curves and foreign exchange rates.
For our more complex loans payable which may include optionality, we estimate fair value using valuation models when independent market prices are not available. Inputs to these models include option volatilities and correlations in addition to interest rate yield curves and foreign exchange rates.
DERIVATIVE INSTRUMENTS
Foreign exchange forwards and foreign exchange swaps are valued by discounting the notional amounts using the respective currency’s yield curve and converting the amounts using the spot Canadian dollar exchange rate.
Interest rate and cross currency interest rate swaps are valued using a discounted cash flow method. Forward rates are used to determine floating rate cash flows occurring in the future. Cash flows are discounted using the respective currency’s yield curve. Inputs to the models are market observable and may include interest rate yield curves and foreign exchange rates.
For more complex swaps which may include optionality, including cross currency interest rate swaps, interest rate swaps, and non-deliverable forwards, the fair value is determined using models which are developed from recognized valuation techniques. Inputs to these models include option volatilities and correlations in addition to interest rate yield curves and foreign exchange rates. Credit default swaps are valued with the additional input of market based par credit default swap spreads or by using quoted prices from dealers where appropriate.
The valuations determined using the methodologies described above are adjusted for the credit risk of the counterparty where appropriate.
FINANCIAL INSTRUMENTS WITH CARRYING VALUE APPROXIMATING FAIR VALUE
Fair value is assumed to equal carrying value for cash, accounts payable and loan guarantees due to the short-term nature of these instruments.
FAIR VALUE HIERARCHY
The following table presents the fair value hierarchy for those items carried on our statement of financial position at fair value. The fair value hierarchy prioritizes the valuation techniques used to determine the fair value of a financial instrument based on whether the inputs to those techniques are observable or unobservable.
| | u | Level 1 – fair values are based on quoted prices (unadjusted) in active markets for identical assets or liabilities; |
| | u | Level 2 – fair values are determined using inputs other than quoted prices included within Level 1 that are observable for the assets or liabilities, either directly (i.e. as prices) or indirectly (i.e. derived from prices); |
| | u | Level 3 – fair values are determined using inputs for the assets or liabilities that are not based on observable market data (unobservable inputs). |
|
EDC Annual Report 2012 | 121 |
CONSOLIDATED FINANCIAL STATEMENTS
| | | | | | | | | | | | | | | | | | | | | | | | | | | | | | | | |
| (in millions of Canadian dollars) | | Dec. 31, 2012 | | | Dec. 31, 2011 | |
| | | | Level 1 | | | | Level 2 | | | | Level 3 | | | | Total | | | | Level 1 | | | | Level 2 | | | | Level 3 | | | | Total | |
Assets | | | | | | | | | | | | | | | | | | | | | | | | | | | | | | | | |
Marketable securities: | | | | | | | | | | | | | | | | | | | | | | | | | | | | | | | | |
At fair value through profit or loss | | | 2,131 | | | | 1,951 | | | | – | | | | 4,082 | | | | 2,029 | | | | 1,691 | | | | – | | | | 3,720 | |
Investments at fair value through profit or loss | | | – | | | | – | | | | 429 | | | | 429 | | | | – | | | | – | | | | 385 | | | | 385 | |
Derivative instruments | | | – | | | | 1,288 | | | | 64 | | | | 1,352 | | | | – | | | | 1,517 | | | | 24 | | | | 1,541 | |
Liabilities | | | | | | | | | | | | | | | | | | | | | | | | | | | | | | | | |
Loans payable: | | | | | | | | | | | | | | | | | | | | | | | | | | | | | | | | |
Designated at fair value through profit or loss | | | – | | | | 24,542 | | | | 320 | | | | 24,862 | | | | – | | | | 20,894 | | | | 611 | | | | 21,505 | |
Derivative instruments | | | – | | | | 120 | | | | – | | | | 120 | | | | – | | | | 178 | | | | – | | | | 178 | |
The following table summarizes the reconciliation of Level 3 fair values between 2011 and 2012 for investments at fair value through profit or loss, loans payable designated at fair value through profit or loss and derivative instruments.
| | | | | | | | | | | | | | | | |
| (in millions of Canadian dollars) | | Dec. 31, 2012 | |
| | | Investments at
fair value through
profit or loss | | | Loans payable
designated at fair
value through
profit or loss | | | Derivative
instruments | | | Total | |
Balance at beginning of year | | | 385 | | | | (611 | ) | | | 24 | | | | (202 | ) |
Unrealized gains (losses) included in income | | | (10 | ) | | | (12 | ) | | | 55 | | | | 33 | |
Purchases of assets/issuances of liabilities | | | 121 | | | | – | | | | – | | | | 121 | |
Matured assets/liabilities | | | – | | | | 288 | | | | (14 | ) | | | 274 | |
Return of capital | | | (53 | ) | | | – | | | | – | | | | (53 | ) |
Write-off | | | (10 | ) | | | – | | | | – | | | | (10 | ) |
Foreign exchange translation | | | (4 | ) | | | 15 | | | | (1 | ) | | | 10 | |
Balance at end of year | | | $429 | | | | $(320 | ) | | | $64 | | | | $173 | |
Total gains (losses) for the year included in comprehensive income for instruments held at end of the year | | | $3 | | | | $(36 | ) | | | $35 | | | | $2 | |
| | | | |
| | | | | | | | | | | | | | | | |
| (in millions of Canadian dollars) | | Dec. 31, 2011 | |
| | | Investments at fair value through
profit or loss | | | Loans payable
designated at fair
value through
profit or loss | | | Derivative
instruments | | | Total | |
Balance at beginning of year | | | 317 | | | | – | | | | – | | | | 317 | |
Unrealized gains (losses) included in income | | | (14 | ) | | | (64 | ) | | | 26 | | | | (52 | ) |
Purchases of assets/issuances of liabilities | | | 106 | | | | (519 | ) | | | (2 | ) | | | (415 | ) |
Return of capital | | | (29 | ) | | | – | | | | – | | | | (29 | ) |
Foreign exchange translation | | | 5 | | | | (28 | ) | | | – | | | | (23 | ) |
Balance at end of year | | | $385 | | | | $(611 | ) | | | $24 | | | | $(202 | ) |
Total gains (losses) for the year included in comprehensive income for instruments held at end of the year | | | $(7 | ) | | | $(64 | ) | | | $26 | | | | $(45 | ) |
Changes in valuation methods may result in transfers into or out of levels 1, 2, and 3. In 2012 there were no transfers between levels (2011 – none).
In 2012, a sensitivity analysis was performed using possible alternative assumptions to recalculate the fair value of our Level 3 financial instruments. The fair value of Level 3 financial instruments is in whole or in part based on unobservable inputs. In preparing financial statements, appropriate levels for these unobservable inputs parameters are chosen so that they are consistent with prevailing market evidence or management judgment.
122 | Adapting to the New Reality
In order to perform our sensitivity analysis we adjusted the yield curve and volatility assumptions used to value our Level 3 loans payable and derivative assets. The results of our analysis on our Level 3 loans payable ranged from an unfavourable change of $15 million to a favourable change of $22 million. On our Level 3 derivative assets the impact ranged from an unfavourable change of $20 million to a favourable change of $11 million.
The effects of applying other possible alternative assumptions to our Level 3 Investments would range from a decrease of $3 million to an increase of $14 million of their fair value.
29. Financial Instrument Risks
The principal risks that we are exposed to as a result of holding financial instruments, are credit, market and liquidity risk.
CREDIT RISK
Credit risk is the risk of loss incurred if a counterparty fails to meet its financial commitments. We are exposed to credit risk on financial instruments under both our loans program and our treasury activities. Our objectives, policies and processes for managing credit risk as well as the methods we use to measure this risk are disclosed in the notes related to our derivative instruments and debt instruments, as well as in the text displayed in green font in management’s discussion and analysis on pages 66 to 67 of this annual report.
CONCENTRATION OF CREDIT RISK
Concentration of credit risk exposure exists when a number of counterparties operate in the same geographical market or industry, or engage in similar activities. Changes in economic or political conditions may affect their ability to meet obligations in a similar manner. We have limits in place to ensure that our exposure is not overly concentrated in any one country, industry or counterparty. Exposure in excess of these limits requires approval of our Board of Directors.
The following table provides a breakdown, by the country in which the risk resides, of the maximum gross exposure to credit risk of financial instruments:
| | | | | | | | | | | | | | | | | | | | | | | | | | | | | | | | | | |
(in millions of Canadian dollars) | | Gross loans
receivable | | | Loan
guarantees | | | Investments | | | Marketable
securities and
derivative
instruments | | | Dec. 31, 2012
Exposure | | | | | Dec. 31, 2011
Exposure | |
| Country | | | | | | | | | | | | | | | | | | | $ | | | | % | | | | | | $ | | | | % | |
United States | | | 8,153 | | | | 485 | | | | 18 | | | | 3,395 | | | | 12,051 | | | | 31 | | | | | | 13,894 | | | | 37 | |
Canada | | | 4,022 | | | | 978 | | | | 167 | | | | 1,401 | | | | 6,568 | | | | 17 | | | | | | 6,651 | | | | 18 | |
Brazil | | | 2,252 | | | | 51 | | | | 14 | | | | – | | | | 2,317 | | | | 6 | | | | | | 1,456 | | | | 4 | |
Mexico | | | 1,890 | | | | 98 | | | | 32 | | | | – | | | | 2,020 | | | | 5 | | | | | | 1,891 | | | | 5 | |
India | | | 1,493 | | | | 3 | | | | 61 | | | | – | | | | 1,557 | | | | 4 | | | | | | 1,552 | | | | 4 | |
Australia | | | 1,153 | | | | – | | | | – | | | | 217 | | | | 1,370 | | | | 4 | | | | | | 750 | | | | 2 | |
United Kingdom | | | 863 | | | | – | | | | 19 | | | | 297 | | | | 1,179 | | | | 3 | | | | | | 1,025 | | | | 3 | |
Chile | | | 1,136 | | | | – | | | | – | | | | – | | | | 1,136 | | | | 3 | | | | | | 960 | | | | 3 | |
Qatar | | | 745 | | | | – | | | | – | | | | – | | | | 745 | | | | 2 | | | | | | 768 | | | | 2 | |
Germany | | | 566 | | | | 5 | | | | – | | | | 44 | | | | 615 | | | | 2 | | | | | | 472 | | | | 1 | |
Other | | | 8,063 | | | | 484 | | | | 118 | | | | 234 | | | | 8,899 | | | | 23 | | | | | | 8,226 | | | | 21 | |
Total | | | $30,336 | | | | $2,104 | | | | $429 | | | | $5,588 | | | | $38,457 | | | | 100 | | | | | | $37,645 | | | | 100 | |
|
EDC Annual Report 2012 | 123 |
CONSOLIDATED FINANCIAL STATEMENTS
The concentration of credit risk by industry sector for our financial instruments is as follows:
| | | | | | | | | | | | | | | | | | | | | | | | | | | | | | | | | | |
(in millions of Canadian dollars) | | Gross loans
receivable | | | Loan
guarantees | | | Investments | | | Marketable
securities and
derivative
instruments | | | Dec. 31, 2012
Exposure | | | | | Dec. 31, 2011
Exposure | |
| Industry | | | | | | | | | | | | | | | | | | | $ | | | | % | | | | | | $ | | | | % | |
Commercial: | | | | | | | | | | | | | | | | | | | | | | | | | | | | | | | | | | |
Aerospace | | | 9,493 | | | | 80 | | | | – | | | | – | | | | 9,573 | | | | 25 | | | | | | 10,136 | | | | 27 | |
Extractive | | | 8,472 | | | | 279 | | | | 13 | | | | – | | | | 8,764 | | | | 23 | | | | | | 6,835 | | | | 18 | |
Surface transportation | | | 3,458 | | | | 608 | | | | – | | | | – | | | | 4,066 | | | | 11 | | | | | | 4,915 | | | | 13 | |
Financial institutions | | | 1,036 | | | | 28 | | | | 167 | | | | 2,105 | | | | 3,336 | | | | 9 | | | | | | 3,233 | | | | 9 | |
Infrastructure and environment | | | 2,693 | | | | 306 | | | | 70 | | | | – | | | | 3,069 | | | | 8 | | | | | | 3,094 | | | | 8 | |
Information and communication technology | | | 2,550 | | | | 140 | | | | 107 | | | | – | | | | 2,797 | | | | 7 | | | | | | 2,855 | | | | 8 | |
Other | | | 1,444 | | | | 527 | | | | 72 | | | | 14 | | | | 2,057 | | | | 5 | | | | | | 1,804 | | | | 5 | |
Total commercial | | | 29,146 | | | | 1,968 | | | | 429 | | | | 2,119 | | | | 33,662 | | | | 88 | | | | | | 32,872 | | | | 88 | |
Sovereign | | | 1,190 | | | | 136 | | | | – | | | | 3,469 | | | | 4,795 | | | | 12 | | | | | | 4,773 | | | | 12 | |
Total | | | $30,336 | | | | $2,104 | | | | $429 | | | | $5,588 | | | | $38,457 | | | | 100 | | | | | | $37,645 | | | | 100 | |
MARKET RISK
Market risk is the risk that the fair value or future cash flows of a financial instrument will fluctuate because of changes in market prices. Market risk comprises three types of risk: foreign exchange risk, interest rate risk, and other price risk. We are exposed to potential negative impacts on the value of financial instruments resulting from adverse movements in interest and foreign exchange rates. We have policies and procedures in place to ensure that interest rate and foreign exchange risks are identified, measured, managed and regularly reported to management and the Board of Directors.
INTEREST RATE RISK
Interest rate risk is the risk that the fair value or future cash flows of a financial instrument will fluctuate because of changes in market interest rates. We are exposed to potential adverse impacts on the value of financial instruments resulting from differences in the maturities or repricing dates of assets and liabilities, as well as from embedded optionality in those assets and liabilities.
FOREIGN EXCHANGE RISK
Foreign exchange risk is the potential adverse impact on the value of financial instruments resulting from exchange rate movements. We are exposed to foreign exchange rate risk when there is a mismatch between assets and liabilities in any currency.
Our objectives, policies and processes for managing market risk as well as a sensitivity analysis for our exposure to both interest rate and foreign exchange risk is disclosed in the text and tables displayed in green font in management’s discussion and analysis on pages 68 to 69 of this annual report.
LIQUIDITY RISK
Liquidity risk is the risk that we would be unable to honour daily cash commitments or the risk that we would have to obtain funds rapidly, possibly at an excessively high premium during severe market conditions. We maintain liquidity through a variety of methods such as holding cash and marketable securities and having access to commercial paper markets.
Our objectives, policies and processes for managing liquidity risk as well as the methods we use to measure this risk are disclosed in the text and tables displayed in green font in management’s discussion and analysis on pages 69 to 70 of this annual report.
124 | Adapting to the New Reality
30. Loan Revenue
| | | | | | | | |
| (in millions of Canadian dollars) | | 2012 | | | 2011 | |
Loan interest – floating rate | | | 551 | | | | 469 | |
Loan interest – fixed rate | | | 385 | | | | 425 | |
Loan fee revenue | | | 129 | | | | 98 | |
Impaired revenue | | | 41 | | | | 9 | |
Other loan revenue | | | 10 | | | | 8 | |
Total loan revenue | | | $1,116 | | | | $1,009 | |
31. Marketable Securities Revenue
| | | | | | | | |
| (in millions of Canadian dollars) | | 2012 | | | 2011 | |
Instruments at fair value through profit or loss | | | | | | | | |
Short-term instruments | | | 5 | | | | 5 | |
Long-term instruments | | | 31 | | | | 41 | |
Total marketable securities revenue | | | $36 | | | | $46 | |
32. Interest Expense
| | | | | | | | |
| (in millions of Canadian dollars) | | 2012 | | | 2011 | |
Loans payable designated at fair value through profit or loss and related derivatives | | | | | | | | |
Short-term payables | | | 28 | | | | 23 | |
Long-term payables – floating | | | 100 | | | | 78 | |
Long-term payables – fixed* | | | (33 | ) | | | (26 | ) |
Loans payable carried at amortized cost | | | | | | | | |
Long-term payables – fixed | | | 71 | | | | 78 | |
Total interest expense on loans payable and related derivatives | | | 166 | | | | 153 | |
Interest income on currency swaps related to capital | | | (66 | ) | | | (70 | ) |
Other | | | 8 | | | | 10 | |
Total interest expense | | | $108 | | | | $93 | |
| * | Includes interest on instruments with cash flows that offset the cash flows of some long-term payables carried at |
33. Leasing and Financing Related Expenses
| | | | | | | | |
| (in millions of Canadian dollars) | | 2012 | | | 2011 | |
Maintenance and technical costs | | | 4 | | | | 4 | |
Depreciation | | | 18 | | | | 16 | |
Other | | | 10 | | | | 12 | |
Total leasing and financing related expenses | | | $32 | | | | $32 | |
|
EDC Annual Report 2012 | 125 |
CONSOLIDATED FINANCIAL STATEMENTS
34. Provision for (Reversal of) Credit Losses
The composition of the provision for credit losses, expressed on the consolidated statement of comprehensive income, is as follows:
| | | | | | | | |
| (in millions of Canadian dollars) | | 2012 | | | 2011 | |
Changes in portfolio composition(1) | | | (162 | ) | | | (164 | ) |
Updates to independent variables: | | | | | | | | |
Changes in collateral values | | | 75 | | | | 190 | |
Updated probability of default rates(2) | | | (156 | ) | | | (84 | ) |
Update to loss given default(3) | | | (63 | ) | | | – | |
Changes in loss emergence period | | | (12 | ) | | | 50 | |
Increased concentration threshold | | | (4 | ) | | | (28 | ) |
Credit migration | | | (13 | ) | | | 186 | |
Other | | | (5 | ) | | | (25 | ) |
Provision for (reversal of) credit losses | | | $(340 | ) | | | $125 | |
| (1) | Represents provision requirement (release) as a result of repayments, disbursements and new financing | |
| (2) | Refer to Note 6. Included in this amount is $93 million due to the change in estimate. | |
| (3) | Refer to Note 6. Included in this amount is $53 million due to the change in estimate. | |
| | | | | | | | |
| (in millions of Canadian dollars) | | 2012 | | | 2011 | |
Provision for (reversal of) losses on loans | | | (263 | ) | | | 162 | |
Provision for (reversal of) losses on loan commitments | | | 18 | | | | (53 | ) |
Provision for (reversal of) losses on loan guarantees | | | (95 | ) | | | 16 | |
Provision for (reversal of) credit losses | | | $(340 | ) | | | $125 | |
35. Claims-Related Expenses (Recovery)
The composition of the claims-related expenses (recovery), expressed on the consolidated statement of comprehensive income, is as follows:
| | | | | | | | |
| (in millions of Canadian dollars) | | 2012 | | | 2011 | |
Claims paid | | | 355 | | | | 54 | |
Claims paid – reinsured policies | | | 3 | | | | 1 | |
Claims recovered | | | (22 | ) | | | (40 | ) |
Actuarial increase/(decrease) in the net allowance for claims | | | (233 | ) | | | 179 | |
Reinsurers’ share of claims recovered | | | – | | | | 1 | |
Decrease/(increase) in recoverable insurance claims | | | (156 | ) | | | 50 | |
Claims handling and settlement expenses | | | 15 | | | | 2 | |
Total claims-related expenses (recovery) | | | $(38 | ) | | | $247 | |
36. Other Income (Expenses)
| | | | | | | | |
| (in millions of Canadian dollars) | | 2012 | | | 2011 | |
Net unrealized gain on derivatives related to loans payable | | | 68 | | | | 135 | |
Net unrealized loss on loans payable designated at fair value through profit or loss | | | (36 | ) | | | (147 | ) |
Net realized and unrealized gain (loss) on loan related credit default swaps | | | (70 | ) | | | 24 | |
Net realized and unrealized gain on marketable securities at fair value through profit or loss | | | 9 | | | | 71 | |
Net realized and unrealized gain (loss) on investments at fair value through profit or loss* | | | 3 | | | | (7 | ) |
Foreign exchange translation gain (loss) | | | 2 | | | | (23 | ) |
Other | | | 8 | | | | 8 | |
Total other income (expenses) | | | $(16 | ) | | | $61 | |
* Refer to Note 7.
126 | Adapting to the New Reality
We have designated the majority of our long-term bonds at fair value through profit or loss in order to obtain the same accounting treatment as their related derivatives. In general, these derivatives are entered into to manage interest and foreign exchange rate risks on the related bonds.
During both 2012 and 2011 most rates relevant to the valuation of our debt fell leading to a loss on our loans payable and a gain on the related derivatives. These same rates fell less than in 2011 leading to a smaller loss on loans payable and gain on the related derivatives. In accordance with IFRS, our debt is valued on the basis of our credit rating (AAA) while the related derivatives are valued based on curves that reflect the credit risk of the resulting exposure. In 2012, the credit exposure of these instruments decreased and this further contributed to the gain on the related derivatives.
In 2012, we recorded a net realized and unrealized loss of $70 million (2011 – gain of $24 million) on our portfolio of loan related credit default swaps. The loss is primarily related to a decrease in the fair value of the credit default swaps we bought to mitigate our credit exposure as the credit condition of the underlying entities improved during 2012.
The majority of our marketable securities are measured at fair value through profit or loss; consistent with our business model for managing these instruments. At the end of December 2012 realized and unrealized gains on marketable securities at fair value through profit or loss totalled $9 million (2011 – $71 million). The gain is less in 2012 as the rates applicable to the valuation of these instruments decreased less in 2012.
37. Administrative Expenses
| | | | | | | | |
| (in millions of Canadian dollars) | | 2012 | | | 2011 | |
Salaries and benefits | | | 150 | | | | 154 | |
Pension, other retirement and post-employment benefits | | | 62 | | | | 30 | |
Accommodation | | | 26 | | | | 20 | |
Amortization and depreciation | | | 29 | | | | 25 | |
Other | | | 47 | | | | 55 | |
Total administrative expenses | | | $314 | | | | $284 | |
38. Retirement Benefit Obligations
PENSION PLANS
The defined benefit component of the pension plan was established on April 24, 2000 and is available for employees hired prior to January 1, 2012. The plan provides benefits to retirees based on years of service and the best five consecutive years’ average salary of the employees. Upon retirement, the benefits are fully indexed to inflation. All permanent employees hired prior to January 1, 2012 are members of the Registered Pension Plan; however, employee contributions to the plan are optional.
Upon the establishment of the defined benefit pension plan, employees made an election to transfer their benefits from the Public Service Superannuation Fund. The related obligation and the assets to fund the plans that were transferred from the Government of Canada are included in the obligation and assets shown in the table on the next page.
Effective January 1, 2012, we established the defined contribution component for all new permanent employees hired on or after January 1, 2012. Pension benefits are based on the accumulation of contributions and investment income allocated to the employee’s account. Employee contributions are mandatory and may be 4%, 5% or 6% of an employee’s annual earnings. The contributions are invested as directed by each employee from a selection of investment options that are authorized by the Pension Plan. We match the employee’s contribution based on points determined by an employee’s age and years of eligible service.
We maintain a registered and a supplemental pension plan for both the defined contribution and defined benefit plans. The purpose of the Supplementary Retirement Plan is to supplement benefits to those members whose benefits and/or contributions under the registered plan are affected by Income Tax Act maximums. It does so by increasing their benefits to the level which would be payable under the Registered Pension Plan if these maximums did not apply.
For 2012 the average remaining working lives of employees participating in the pension plans was 11 years (2011 – 11 years).
|
EDC Annual Report 2012 | 127 |
CONSOLIDATED FINANCIAL STATEMENTS
Our appointed actuaries measure the defined benefit obligations and the fair value of the plans’ assets for accounting purposes as at December 31 of each year. We fund our defined benefit pension plans in accordance with actuarially determined amounts required to satisfy employee benefit obligations under current federal pension regulations. The most recent funding valuation for the Registered Pension Plan was as at December 31, 2011. The next required valuation, to be completed in 2013, will be as at December 31, 2012. For the Supplementary Retirement Plan, an annual funding valuation is prepared as at December 31 each year.
OTHER BENEFIT PLANS
We maintain a retiring allowance program and provide certain life insurance, health and dental care benefits to retired employees. These plans are funded as the cost of benefits is incurred and costs are accrued based on actuarial calculations. In 2011, EDC announced changes to both our Severance Policy and our Supplementary Death Benefit.
| | u | Effective July 1, 2013, employees will no longer accumulate service in respect of the retiring allowance portion of the corporate Severance Policy. Service accumulated as at July 1, 2013 will be banked and the relevant retiring allowance will be paid out, as per the policy, when the employee leaves the Corporation. As the defined benefit obligation is only reflective of service to date, this change in policy will not impact the pension obligation until the effective date. |
| | u | Effective July 1, 2013, the Supplementary Death Benefit will be cancelled. The cancellation of this benefit resulted in a reduction of the defined benefit obligation for other benefit plans of $1.8 million of which $1 million was recognized immediately in the 2011 defined benefit expense as it represented a vested past service cost benefit. The remainder of the impact was included in unrecognized past service benefit – non-vested and was partially amortized in 2012 using the corridor approach. The unamortized balance will be recognized in equity at January 1, 2013 as part of the transition to the revised IAS 19 standard. |
For 2012 the average remaining working lives of employees participating in the other benefit plans was 13 years (2011 – 14 years).
The following table presents the financial position of our retirement benefit obligations:
| | | | | | | | | | | | | | | | | | | | | | | | | | | | |
| (in millions of Canadian dollars) | | Dec. 31, 2012 | | | Dec. 31, 2011 | |
| | | Registered
Pension
Plan | | | Supplementary
Retirement
Plan | | | | | Other
benefit
plans | | | Registered
Pension
Plan | | | Supplementary
Retirement
Plan | | | | | Other
benefit
plans | |
Defined benefit obligation: | | | | | | | | | | | | | | | | | | | | | | | | | | | | |
Obligation beginning of year | | | 630 | | | | 52 | | | | | | 139 | | | | 471 | | | | 35 | | | | | | 103 | |
Current service costs | | | 29 | | | | 2 | | | | | | 8 | | | | 20 | | | | 2 | | | | | | 6 | |
Interest cost on benefit obligation | | | 30 | | | | 2 | | | | | | 7 | | | | 27 | | | | 2 | | | | | | 6 | |
Employee contributions | | | 7 | | | | – | | | | | | – | | | | 7 | | | | – | | | | | | – | |
Actuarial (gain) loss on benefit obligation | | | (18 | ) | | | (6 | ) | | | | | (2 | ) | | | 119 | | | | 14 | | | | | | 27 | |
Benefits paid | | | (18 | ) | | | (1 | ) | | | | | (2 | ) | | | (14 | ) | | | (1 | ) | | | | | (1 | ) |
Past service costs | | | – | | | | – | | | | | | – | | | | – | | | | – | | | | | | (2 | ) |
Defined benefit obligation at end of year | | | 660 | | | | 49 | | | | | | 150 | | | | 630 | | | | 52 | | | | | | 139 | |
Fair value of plan assets: | | | | | | | | | | | | | | | | | | | | | | | | | | | | |
Fair value at beginning of year | | | 444 | | | | 44 | | | | | | – | | | | 396 | | | | 46 | | | | | | – | |
Expected return on plan assets | | | 30 | | | | 1 | | | | | | – | | | | 31 | | | | 2 | | | | | | – | |
Actuarial gain (loss) on plan assets | | | 14 | | | | 1 | | | | | | – | | | | (24 | ) | | | (3 | ) | | | | | – | |
Employer contributions | | | 63 | | | | 4 | | | | | | 2 | | | | 48 | | | | – | | | | | | 1 | |
Employee contributions | | | 7 | | | | – | | | | | | – | | | | 7 | | | | – | | | | | | – | |
Benefits paid | | | (18 | ) | | | (1 | ) | | | | | (2 | ) | | | (14 | ) | | | (1 | ) | | | | | (1 | ) |
Fair value at end of year | | | 540 | | | | 49 | | | | | | – | | | | 444 | | | | 44 | | | | | | – | |
Funded status – plan (deficit) surplus | | | (120 | ) | | | – | | | | | | (150 | ) | | | (186 | ) | | | (8 | ) | | | | | (139 | ) |
Unamortized net actuarial loss | | | 153 | | | | 13 | | | | | | 37 | | | | 197 | | | | 22 | | | | | | 41 | |
Unrecognized past service cost (benefit) non-vested | | | – | | | | – | | | | | | (1 | ) | | | – | | | | – | | | | | | (1 | ) |
Defined benefit asset (liability) | | | $33 | | | | $13 | | | | | | $(114 | ) | | | $11 | | | | $14 | | | | | | $(99 | ) |
The unamortized net actuarial loss in our Registered Pension Plan was $153 million (2011 – $197 million; which exceeded 10% of the defined benefit obligation by $87 million (2011 – $134 million) at the end of December 2012. Using the corridor method the excess amount is being amortized on a straight-line basis to pension expense over the expected average remaining working lives of employees participating in the plan. Effective January 1, 2013 under the revised IAS 19 standard the corridor method will no longer be permitted and the unamortized actuarial losses will be recognized in equity upon transition at January 1, 2013. Subsequent to January 1, 2013 any actuarial gains/losses will be recorded in other comprehensive income.
128 | Adapting to the New Reality
ASSET MIX
Plan assets are invested in debt securities, equity securities, real estate and held in cash. For the Registered Pension Plan, the target allocation percentages are 30% in debt securities, 55% in equity securities and 15% in real estate. The actual investment allocations at the end of December 2012 were 31% in debt securities, 54% in equity securities (2011 – 34% and 53%), and 15% in real estate (2011 – 13%). For the Supplementary Retirement Plan, the target is 100% in equity securities, net of the cash in a refundable tax account as prescribed by Canada Revenue Agency. This resulted in actual investment allocations of 54% in cash and 46% in equity securities at the end of 2012 (2011 – 55% and 45%).
IAS 19 requires entities to disclose the defined benefit obligation, plan assets, surplus or deficit and the experience adjustments arising on plan assets and liabilities for the current annual period and previous four annual periods. Upon transition to IFRS, we elected to disclose this information prospectively from the date of transition. Additional years’ information will be included as it becomes available.
Amounts for the current and previous two years are as follows:
| | | | | | | | | | | | | | | | | | | | | | | | |
(in millions of Canadian dollars) | | Dec. 31, 2012 | | | Dec. 31, 2011 | |
| | | Registered
Pension
Plan | | | Supplementary
Retirement
Plan | | | Other
benefit
plans | | | Registered
Pension
Plan | | | Supplementary
Retirement
Plan | | | Other
benefit
plans | |
Defined benefit obligation | | | 660 | | | | 49 | | | | 150 | | | | 630 | | | | 52 | | | | 139 | |
Plan assets | | | 540 | | | | 49 | | | | – | | | | 444 | | | | 44 | | | | – | |
Deficit | | | (120 | ) | | | – | | | | (150 | ) | | | (186 | ) | | | (8 | ) | | | (139 | ) |
Experience adjustments on plan liabilities | | | (18 | ) | | | (6 | ) | | | (1 | ) | | | 3 | | | | (5 | ) | | | (1 | ) |
Experience adjustments on plan assets | | | 14 | | | | 1 | | | | – | | | | (24 | ) | | | (3 | ) | | | – | |
| | | | | | | | | | | | | | | | | | | | | | | | |
(in millions of Canadian dollars) | | Dec. 31, 2010 | | | | | | | | | | |
| | | Registered
Pension
Plan | | | Supplementary
Retirement Plan | | | Other
benefit
plans | | | | | | | | | | |
Defined benefit obligation | | | 471 | | | | 35 | | | | 103 | | | | | | | | | | | | | |
Plan assets | | | 396 | | | | 46 | | | | – | | | | | | | | | | | | | |
Surplus (deficit) | | | (75 | ) | | | 11 | | | | (103 | ) | | | | | | | | | | | | |
Experience adjustments on plan liabilities | | | 2 | | | | (1 | ) | | | 4 | | | | | | | | | | | | | |
Experience adjustments on plan assets | | | 4 | | | | – | | | | – | | | | | | | | | | | | | |
DEFINED BENEFIT EXPENSE | |
(in millions of Canadian dollars) | | 2012 | | | 2011 | |
| | | Registered
Pension
Plan | | | Supplementary
Retirement
Plan | | | Other
benefit
plans | | | Registered
Pension
Plan | | | Supplementary
Retirement
Plan | | | Other
benefit
plans | |
Current service costs | | | 29 | | | | 2 | | | | 8 | | | | 20 | | | | 2 | | | | 6 | |
Interest cost on benefit obligation | | | 30 | | | | 2 | | | | 7 | | | | 27 | | | | 2 | | | | 6 | |
Expected return on plan assets | | | (30 | ) | | | (1 | ) | | | – | | | | (31 | ) | | | (2 | ) | | | – | |
Actuarial loss recognized during the period | | | 11 | | | | 2 | | | | 2 | | | | 1 | | | | – | | | | – | |
Past service cost benefit-vested | | | – | | | | – | | | | – | | | | – | | | | – | | | | (1 | ) |
Total expense recognized in profit or loss* | | | $40 | | | | $5 | | | | $17 | | | | $17 | | | | $2 | | | | $11 | |
Actual return on plan assets | | | $44 | | | | $2 | | | | $– | | | | $7 | | | | $(1 | ) | | | $– | |
*An additional $212 thousand was recognized in profit or loss relating to the defined contribution plan.
TOTAL CASH PAYMENTS
Total cash payments for our retirement benefit obligations in 2012 totalled $68 million (2011 – $50 million). The payments consisted of cash contributions to the pension plans and payments paid directly to beneficiaries for the unfunded other benefit plans. Included in total cash payments in 2012 was $42 million (2011 – $28 million) in additional contributions to the Registered Pension Plan in relation to a plan deficit identified as a result of the funding valuations for 2011, 2010, 2009 and 2008 and a $4 million special contribution to the Supplementary Retirement Plan in relation to a plan deficit identified as a result of the 2011 funding valuation. In addition, $212 thousand in contributions were made to the defined contribution plan in 2012. We expect to contribute $62 million to the pension plans in 2013 which includes $59 million in contributions to the Registered Pension Plan and $3 million for the other benefit plans.
|
EDC Annual Report 2012 | 129 |
CONSOLIDATED FINANCIAL STATEMENTS
| | | | | | | | | | | | | | | | | | | | | | | | |
Assumptions | | Dec. 31, 2012 | | | Dec. 31, 2011 | |
| (Weighted average) | | Registered
Pension
Plan | | | Supplementary
Retirement
Plan | | | Other
benefit
plans | | | Registered
Pension
Plan | | | Supplementary
Retirement
Plan | | | Other
benefit
plans | |
Defined benefit obligation: | | | | | | | | | | | | | | | | | | | | | | | | |
Discount rate | | | 4.50% | | | | 4.50% | | | | 4.50% | | | | 4.50% | | | | 4.50% | | | | 4.50% | |
Rate of compensation increase | | | 3.25% to | | | | 3.25% to | | | | 3.25% to | | | | 3.25% to | | | | 3.25% to | | | | 3.25% to | |
| | | | 5.65% | | | | 5.65% | | | | 5.65% | | | | 5.60% | | | | 5.60% | | | | 5.60% | |
Benefit costs: | | | | | | | | | | | | | | | | | | | | | | | | |
Expected rate of return on plan assets | | | 6.50% | | | | 3.25% | | | | n/a | | | | 7.50% | | | | 3.75% | | | | n/a | |
Discount rate on projected defined benefit obligation | | | 4.50% | | | | 4.50% | | | | 4.50% | | | | 5.50% | | | | 5.50% | | | | 5.50% | |
Inflation | | | 2.25% | | | | 2.25% | | | | 2.25% | | | | 2.25% | | | | 2.25% | | | | 2.25% | |
Rate of compensation increase | | | 3.25% to | | | | 3.25% to | | | | 3.25% to | | | | 3.25% to | | | | 3.25% to | | | | 3.25% to | |
| | | | 5.65% | | | | 5.65% | | | | 5.65% | | | | 5.60% | | | | 5.60% | | | | 5.60% | |
As per IAS 19, the discount rate used to determine the defined benefit obligations should be based on market rates for high-quality corporate bonds that match the currency and estimated term of the obligations. Given the long-term nature of pension plan obligations, the yields for bonds with long terms to maturity are most important. In a market such as Canada, high-quality long-term corporate bonds are few in number. Due to this lack of depth in the long-term market, it is necessary to extrapolate the long end of the high-quality corporate bond yield curve with additional data points. Our methodology used to set the discount rate is based on the Canadian Institute of Actuaries’ (CIA) preferred methodology which supplements the long-end of the curve by including Canadian provincial bonds rated AA with an adjustment to account for credit risk differentials when compared to corporate bond yields. We have further refined this model in deriving our discount rate of 4.50% which was then used to determine the defined benefit obligation for 2012.
The rate of compensation increase used for the defined benefit obligation represents a long-term assumption and includes components for inflation, productivity increases and merit and promotion adjustments.
The expected rate of return on plan assets is determined based on the target asset mix of the portfolio set out in the investment policy and on expected long-term real returns of the different asset classes.
Assumptions regarding future mortality experience are set based on actuarial advice in accordance with published statistics in the form of post-retirement mortality table. Consistent with 2011, the table used for 2012 was UP94 with dynamic projection (generational) using scale AA. These tables translate the average life expectancy of a pensioner retiring at age 65 into years.
For the other benefit plans, the initial annual rate of increase for covered medical care benefits is assumed to be 7.36% (2011 – 7.93%). This rate is projected to trend down over five years to an ultimate rate of 4.50% for 2017 (2011 – 4.50% for 2017) and subsequent years. For dental care, the trend rate used was consistent with 2011 at 4.50%.
SENSITIVITY ANALYSIS
The following table outlines the potential impact of changes in certain key assumptions used in measuring the defined benefit obligations and benefit costs. The sensitivity analysis contained in this table is hypothetical and should be used with caution.
| | | | | | | | | | | | | | | | | | | | | | | | |
(in millions of Canadian dollars) | | 2012 | |
| | | Registered Pension Plan | | | Supplementary
Retirement Plan | | | Other benefit plans | |
| Sensitivity of Assumptions | | Obligation | | | Expense | | | Obligation | | | Expense | | | Obligation | | | Expense | |
Discount rate | | | 4.50% | | | | 4.50% | | | | 4.50% | | | | 4.50% | | | | 4.50% | | | | 4.50% | |
Impact of: 1% increase ($) | | | (111 | ) | | | (18 | ) | | | (8 | ) | | | (1 | ) | | | (27 | ) | | | (4 | ) |
1% decrease ($) | | | 148 | | | | 24 | | | | 10 | | | | 2 | | | | 37 | | | | 5 | |
Expected long-term rate of return on assets | | | n/a | | | | 6.50% | | | | n/a | | | | 3.25% | | | | n/a | | | | n/a | |
Impact of: 1% increase ($) | | | n/a | | | | (5 | ) | | | n/a | | | | – | | | | n/a | | | | n/a | |
1% decrease ($) | | | n/a | | | | 5 | | | | n/a | | | | – | | | | n/a | | | | n/a | |
Rate of compensation increase* | | | 3.25% to | | | | 3.25% to | | | | 3.25% to | | | | 3.25% to | | | | 3.25% to | | | | 3.25% to | |
| | | | 5.65% | | | | 5.65% | | | | 5.65% | | | | 5.65% | | | | 5.65% | | | | 5.65% | |
Impact of: 1% increase ($) | | | 24 | | | | 6 | | | | 10 | | | | 3 | | | | 2 | | | | – | |
1% decrease ($) | | | (24 | ) | | | (6 | ) | | | (6 | ) | | | (2 | ) | | | (2 | ) | | | – | |
* The rate of compensation increase includes a promotional component which varies by years of service for each individual employee.
|
| 130 | Adapting to the New Reality |
The financial health of a pension plan is measured by actuarial valuations, which are prepared on both a going-concern and a solvency basis. The EDC Registered Pension Plan ratios as at December 31, 2011 were 87.9% on a going-concern basis and 62.4% on a solvency basis. Since EDC’s solvency ratio for the Registered Pension Plan is less than 100%, we are required by federal pension legislation to make special monthly solvency contributions. During 2012 we contributed special payments of $42 million into the Registered Pension Plan and will continue to remit all required solvency payments. The solvency ratio for the Supplementary Retirement Plan as at December 31, 2011 was 91.5% and EDC made a special contribution of $4 million to this plan in 2012 in order to eliminate this deficit. The next formal valuations will be conducted by the plans’ actuaries in 2013 and will be as at December 31, 2012.
A one percentage point increase in assumed health care cost trends would have increased the service and interest costs by $3.8 million (2011 – $2.6 million) and the obligation by $35.2 million (2011 – $31.6 million). A one percentage point decrease in assumed health care cost trends would have decreased the service and interest costs and the obligation by $2.7 million (2011 – $1.9 million) and $25.9 million (2011 – $23.3 million).
39. Related Party Transactions
We enter into transactions with other government departments, agencies and Crown corporations in the normal course of business, under terms and conditions similar to those that apply to unrelated parties. The following disclosure is in addition to the related party disclosure provided elsewhere in these financial statements. All material related party transactions are either disclosed below or in the relevant notes. These transactions are measured at their exchange amounts.
CANADA ACCOUNT ADMINISTRATIVE EXPENSE RECOVERY
As described in Note 40, we enter into certain financial and contingent liability transactions on behalf of the Government of Canada known as “Canada Account” transactions. We are compensated for expenses and overhead relating to Canada Account activities. In 2012, we retained $5 million (2011 – $7 million) from Canada Account receipts and recoveries for these expenses and overhead. These amounts are netted against administrative expenses on the consolidated statement of comprehensive income.
KEY MANAGEMENT PERSONNEL COMPENSATION
Key management personnel include the Board of Directors and the Executive Management team. Compensation paid or payable to key management personnel during the year, including non-cash benefits subject to income tax, was as follows:
| | | | | | | | |
(in millions of Canadian dollars) | | 2012 | | | 2011 | |
Salaries and other short-term benefits | | | 4 | | | | 4 | |
Post-employment benefits | | | 2 | | | | 1 | |
Total | | | $6 | | | | $5 | |
40. Canada Account Transactions
Pursuant to the Act, the Minister, with the concurrence of the Minister of Finance, may authorize us to undertake certain financial and contingent liability transactions on behalf of the Government of Canada. These transactions and the legislative authorities that underlie them have come to be known collectively as “Canada Account”. Accounts for these transactions are maintained separately from our accounts and are consolidated annually as at March 31 with the financial statements of the Government of Canada, which are reported upon separately by the Government and audited by the Auditor General of Canada. The assets under the Canada Account, mainly loans receivable and accrued interest and fees recorded in accordance with the accounting policies and practices of the Government of Canada, amounted to $3,722 million at the end of December 2012 (2011 – $3,894 million).
The Act allows the Canada Account to have outstanding loans and commitments to borrowers, and arrangements giving rise to contingent liabilities under contracts of insurance and other agreements up to a maximum of $20 billion. The position against this limit at December 31, determined in accordance with the requirements of the Act, was $3.4 billion (2011 – $3.7 billion). The position against the statutory limit increases accordingly as we sign each new obligation that has the effect of extending credit or giving rise to a contingent liability.
|
EDC Annual Report 2012 | 131 |
TEN-YEAR REVIEW
STATEMENT OF FINANCIAL POSITION
| | | | | | | | | | | | |
as at December 31 (in millions of Canadian dollars) | | 2012(1) | | | 2011(1) | | | 2010(1) | |
Gross loans receivable | | | 30,336 | | | | 29,093 | | | | 26,997 | |
Accrued interest and fees receivable(3) | | | 157 | | | | 145 | | | | 163 | |
Deferred loan revenue and other credits | | | (362) | | | | (558) | | | | (549) | |
Risk mitigation insurer’s share of loan allowance | | | – | | | | – | | | | – | |
Allowance for losses on loans | | | (1,182) | | | | (1,680) | | | | (1,561) | |
Net loans receivable | | | 28,949 | | | | 27,000 | | | | 25,050 | |
Equipment available for lease | | | 525 | | | | 55 | | | | 143 | |
Net investment in aircraft under finance leases | | | 80 | | | | 92 | | | | 99 | |
Investments at fair value through profit or loss(2) | | | 429 | | | | 385 | | | | 317 | |
Cash and marketable securities | | | 4,236 | | | | 3,886 | | | | 3,803 | |
Reinsurers’ share of policy and claims liabilities | | | 90 | | | | 129 | | | | 109 | |
Property, plant and equipment | | | 66 | | | | 74 | | | | 33 | |
Intangible assets | | | 38 | | | | 40 | | | | 42 | |
Other assets | | | 1,820 | | | | 1,935 | | | | 2,286 | |
Total Assets | | | $36,233 | | | | $33,596 | | | | $31,882 | |
| | | | |
Loans payable | | | 25,880 | | | | 23,570 | | | | 22,484 | |
Other liabilities | | | 474 | | | | 588 | | | | 459 | |
Allowance for losses on loan commitments(4) | | | 58 | | | | 41 | | | | 93 | |
Policy and claims liabilities | | | 583 | | | | 875 | | | | 640 | |
Loan guarantees(5) | | | 161 | | | | 266 | | | | 245 | |
Total liabilities | | | 27,156 | | | | 25,340 | | | | 23,921 | |
Share capital | | | 1,333 | | | | 1,333 | | | | 1,333 | |
Retained earnings | | | 7,744 | | | | 6,923 | | | | 6,628 | |
Accumulated other comprehensive income (loss) | | | – | | | | – | | | | – | |
Equity | | | 9,077 | | | | 8,256 | | | | 7,961 | |
Total Liabilities and Equity | | | $36,233 | | | | $33,596 | | | | $31,882 | |
| (1) | 2009 through 2003 numbers are based on previous Canadian GAAP; 2012, 2011 and 2010 are based on IFRS. |
| (2) | Title has been updated to investments at fair value through profit or loss from equity financing at fair value through profit or loss. |
| (3) | Accrued loan interest and fees were reclassified to loans receivable for IFRS presentation purposes. For 2009 through 2003, accrued loan interest and fees is included in other assets. |
| (4) | 2009 through 2003 allowance for losses on loan commitments includes allowance for losses on loan guarantees. In 2012, 2011 and 2010 allowance for losses on loan guarantees is included with loan guarantees. |
| (5) | Loan guarantees include deferred guarantee fee revenue and allowance for losses on loan guarantees. 2009 through 2003 allowance for losses on loan guarantees is grouped with allowance for losses on loan commitments and guarantees and deferred guarantee fee revenue is grouped with loans receivable. |
|
| 132 | Adapting to the New Reality |
| | | | | | | | | | | | | | | | | | | | | | | | | | |
| | | | | | | |
| 2009(1) | | | 2008(1) | | | 2007(1) | | | 2006(1) | | | 2005(1) | | | 2004(1) | | | 2003(1) | |
| | 26,823 | | | | 30,898 | | | | 19,108 | | | | 19,581 | | | | 17,306 | | | | 19,419 | | | | 21,459 | |
| | – | | | | – | | | | – | | | | – | | | | – | | | | – | | | | – | |
| | (556) | | | | (689) | | | | (589) | | | | (825) | | | | (1,053) | | | | (1,289) | | | | (1,487) | |
| | – | | | | – | | | | – | | | | 61 | | | | 124 | | | | – | | | | – | |
| | (1,948) | | | | (1,928) | | | | (1,316) | | | | (1,674) | | | | (2,148) | | | | (2,674) | | | | (3,290) | |
| | 24,319 | | | | 28,281 | | | | 17,203 | | | | 17,143 | | | | 14,229 | | | | 15,456 | | | | 16,682 | |
| | 315 | | | | 334 | | | | 372 | | | | 233 | | | | 114 | | | | – | | | | – | |
| | 113 | | | | 142 | | | | 122 | | | | – | | | | – | | | | – | | | | – | |
| | 196 | | | | 150 | | | | 95 | | | | 58 | | | | 44 | | | | 44 | | | | 40 | |
| | 5,432 | | | | 3,843 | | | | 2,528 | | | | 3,353 | | | | 3,263 | | | | 2,894 | | | | 2,576 | |
| | 159 | | | | 157 | | | | 88 | | | | 67 | | | | 40 | | | | 59 | | | | 120 | |
| | 17 | | | | 15 | | | | 7 | | | | 7 | | | | 9 | | | | 10 | | | | 13 | |
| | 41 | | | | 36 | | | | 32 | | | | 28 | | | | 31 | | | | 37 | | | | 44 | |
| | 2,306 | | | | 2,298 | | | | 2,642 | | | | 1,936 | | | | 1,999 | | | | 2,250 | | | | 1,682 | |
| | $32,898 | | | | $35,256 | | | | $23,089 | | | | $22,825 | | | | $19,729 | | | | $20,750 | | | | $21,157 | |
| | | | | | | |
| | 24,435 | | | | 25,882 | | | | 15,583 | | | | 15,140 | | | | 13,424 | | | | 15,545 | | | | 17,325 | |
| | 369 | | | | 1,627 | | | | 375 | | | | 787 | | | | 596 | | | | 696 | | | | 497 | |
| | 713 | | | | 807 | | | | 564 | | | | 394 | | | | 355 | | | | 448 | | | | 472 | |
| | 793 | | | | 824 | | | | 543 | | | | 518 | | | | 590 | | | | 584 | | | | 628 | |
| | – | | | | – | | | | – | | | | – | | | | – | | | | – | | | | – | |
| | 26,310 | | | | 29,140 | | | | 17,065 | | | | 16,839 | | | | 14,965 | | | | 17,273 | | | | 18,922 | |
| | 1,333 | | | | 983 | | | | 983 | | | | 983 | | | | 983 | | | | 983 | | | | 983 | |
| | 5,317 | | | | 5,077 | | | | 5,121 | | | | 5,003 | | | | 3,781 | | | | 2,494 | | | | 1,252 | |
| | (62) | | | | 56 | | | | (80) | | | | – | | | | – | | | | – | | | | – | |
| | 6,588 | | | | 6,116 | | | | 6,024 | | | | 5,986 | | | | 4,764 | | | | 3,477 | | | | 2,235 | |
| | $32,898 | | | | $35,256 | | | | $23,089 | | | | $22,825 | | | | $19,729 | | | | $20,750 | | | | $21,157 | |
|
EDC Annual Report 2012 | 133 |
TEN-YEAR REVIEW
STATEMENT OF COMPREHENSIVE INCOME
| | | | | | | | | | | | |
for the year ended December 31 (in millions of Canadian dollars) | | 2012(1) | | | 2011(1) | | | 2010(1) | |
Financing and investment revenue: | | | | | | | | | | | | |
Loan | | | 1,116 | | | | 1,009 | | | | 1,004 | |
Finance lease | | | 6 | | | | 7 | | | | 8 | |
Operating lease | | | 17 | | | | 21 | | | | 32 | |
Debt relief | | | – | | | | 4 | | | | 25 | |
Marketable securities | | | 36 | | | | 46 | | | | 47 | |
Investments | | | 4 | | | | 12 | | | | 8 | |
Total financing and investment revenue | | | 1,179 | | | | 1,099 | | | | 1,124 | |
Interest expense | | | 108 | | | | 93 | | | | 147 | |
Leasing and financing related expenses | | | 32 | | | | 32 | | | | 53 | |
Net Financing and Investment Income | | | 1,039 | | | | 974 | | | | 924 | |
| | | | |
Loan Guarantee Fees | | | 38 | | | | 32 | | | | 33 | |
| | | | |
Insurance premiums and guarantee fees | | | 204 | | | | 238 | | | | 210 | |
Reinsurance assumed | | | 12 | | | | 13 | | | | 11 | |
Reinsurance ceded | | | (20) | | | | (17) | | | | (11) | |
Net Insurance Premiums and Guarantee fees | | | 196 | | | | 234 | | | | 210 | |
| | | | |
Other income (expenses) | | | (16) | | | | 61 | | | | (49) | |
Administrative expenses | | | 314 | | | | 284 | | | | 273 | |
Income before Provision and Claims-Related Expenses (Recovery) | | | 943 | | | | 1,017 | | | | 845 | |
| | | | |
Provision for (Reversal of) Credit Losses | | | (340) | | | | 125 | | | | (631) | |
Claims-Related Expenses (Recovery) | | | (38) | | | | 247 | | | | 1 | |
Net Income | | | 1,321 | | | | 645 | | | | 1,475 | |
Other comprehensive income | | | – | | | | – | | | | – | |
Comprehensive Income | | | $1,321 | | | | $645 | | | | $1,475 | |
| (1) | 2009 through 2003 numbers are based on previous Canadian GAAP; 2012, 2011 and 2010 are based on IFRS. |
|
| 134 | Adapting to the New Reality |
| | | | | | | | | | | | | | | | | | | | | | | | |
| | | | | | | |
| 2009(1) | | 2008(1) | | | 2007(1) | | | 2006(1) | | | 2005(1) | | | 2004(1) | | | 2003(1) | |
| | | | | | | |
| 1,321 | | | 1,355 | | | | 1,405 | | | | 1,174 | | | | 1,155 | | | | 1,148 | | | | 1,249 | |
| 9 | | | 9 | | | | 8 | | | | – | | | | – | | | | – | | | | – | |
| 32 | | | 43 | | | | 37 | | | | 4 | | | | – | | | | – | | | | – | |
| 49 | | | – | | | | 1 | | | | 261 | | | | 64 | | | | 43 | | | | 56 | |
| 41 | | | 81 | | | | 123 | | | | 123 | | | | 123 | | | | 63 | | | | 60 | |
| 3 | | | 2 | | | | 1 | | | | – | | | | – | | | | – | | | | – | |
| 1,455 | | | 1,490 | | | | 1,575 | | | | 1,562 | | | | 1,342 | | | | 1,254 | | | | 1,365 | |
| 381 | | | 611 | | | | 717 | | | | 628 | | | | 494 | | | | 345 | | | | 404 | |
| 68 | | | 43 | | | | 46 | | | | 19 | | | | – | | | | – | | | | – | |
| 1,006 | | | 836 | | | | 812 | | | | 915 | | | | 848 | | | | 909 | | | | 961 | |
| | | | | | | |
| 24 | | | 20 | | | | 14 | | | | 12 | | | | 9 | | | | 8 | | | | 7 | |
| | | | | | | |
| 197 | | | 171 | | | | 149 | | | | 147 | | | | 147 | | | | 153 | | | | 140 | |
| – | | | – | | | | – | | | | – | | | | – | | | | – | | | | – | |
| – | | | – | | | | – | | | | – | | | | – | | | | – | | | | – | |
| 197 | | | 171 | | | | 149 | | | | 147 | | | | 147 | | | | 153 | | | | 140 | |
| | | | | | | |
| (76) | | | (13) | | | | 45 | | | | 9 | | | | – | | | | (7) | | | | 7 | |
| 246 | | | 240 | | | | 219 | | | | 203 | | | | 182 | | | | 178 | | | | 173 | |
| 905 | | | 774 | | | | 801 | | | | 880 | | | | 822 | | | | 885 | | | | 942 | |
| | | | | | | |
| 431 | | | 346 | | | | 196 | | | | (301) | | | | (554) | | | | (312) | | | | 644 | |
| 216 | | | 222 | | | | 132 | | | | (75) | | | | 41 | | | | 98 | | | | 140 | |
| 258 | | | 206 | | | | 473 | | | | 1,256 | | | | 1,335 | | | | 1,099 | | | | 158 | |
| – | | | – | | | | – | | | | (34) | | | | (48) | | | | 143 | | | | – | |
| $258 | | | $206 | | | | $473 | | | | $1,222 | | | | $1,287 | | | | $1,242 | | | | $158 | |
|
EDC Annual Report 2012 | 135 |
TEN-YEAR REVIEW
CORPORATE ACCOUNT
| | | | | | | | | | | | |
FINANCIAL ARRANGEMENTS FACILITATED (in millions of Canadian dollars) | | 2012(1) | | | 2011(1) | | | 2010(1) | |
Financing | | | | | | | | | | | | |
Direct financing | | | 13,754 | | | | 13,734 | | | | 12,472 | |
Guarantees | | | 864 | | | | 893 | | | | 936 | |
Total | | | 14,618 | | | | 14,627 | | | | 13,408 | |
| | | | |
Insurance | | | | | | | | | | | | |
Credit insurance | | | 54,087 | | | | 62,872 | | | | 52,073 | |
Financial institutions insurance | | | 9,295 | | | | 13,914 | | | | 8,324 | |
Contract insurance and bonding | | | 531 | | | | 1,049 | | | | 2,514 | |
Political risk insurance(2) | | | 2,855 | | | | 2,859 | | | | 2,420 | |
Guarantees | | | 6,063 | | | | 7,179 | | | | 5,877 | |
Total | | | 72,831 | | | | 87,873 | | | | 71,208 | |
| | | | |
FINANCIAL AND OTHER DATA | | | | | | | | | | | | |
Financing (in millions of Canadian dollars) | | | | | | | | | | | | |
Value of gross loans receivable | | | 30,336 | | | | 29,093 | | | | 26,997 | |
Value of investments | | | 429 | | | | 385 | | | | 317 | |
Value of undisbursed loans(3) | | | 13,382 | | | | 9,722 | | | | 8,775 | |
Value of undisbursed investments | | | 417 | | | | 283 | | | | 314 | |
Value of loan disbursements(3) | | | 11,887 | | | | 10,393 | | | | 10,095 | |
Value of disbursements for investments | | | 121 | | | | 106 | | | | 117 | |
Value of liability on loan guarantees | | | 1,907 | | | | 2,506 | | | | 2,304 | |
Undisbursed amounts on loan guarantees | | | 197 | | | | 234 | | | | 243 | |
Amounts available for allocation under confirmed LOC | | | 111 | | | | 410 | | | | 384 | |
Loan amounts rescheduled | | | – | | | | 4 | | | | 25 | |
Loan amounts written off | | | 408 | | | | 76 | | | | 75 | |
Number of current lines of credit and protocols | | | 37 | | | | 56 | | | | 57 | |
| | | | |
Insurance (in millions of Canadian dollars) | | | | | | | | | | | | |
Value of liability on insurance and guarantees | | | 21,532 | | | | 25,732 | | | | 23,171 | |
Value of claims paid | | | 358 | | | | 55 | | | | 126 | |
Value of claims recovered | | | 22 | | | | 40 | | | | 36 | |
Value of claims outstanding at end of year | | | 627 | | | | 381 | | | | 440 | |
Value of claims under consideration at end of year | | | 11 | | | | 315 | | | | 8 | |
Number of policies issued | | | 7,525 | | | | 7,913 | | | | 9,714 | |
Number of insurance policies and guarantees in force | | | 8,214 | | | | 8,665 | | | | 9,238 | |
| (1) | 2009 through 2003 numbers are based on previous Canadian GAAP; 2012, 2011 and 2010 are based on IFRS. |
| (2) | Figures prior to 2007 were not restated to reflect current presentation. |
| (3) | Includes investments prior to 2006. |
136 | Adapting to the New Reality
| | | | | | | | | | | | | | | | | | | | | | | | |
| | | | | | | |
| 2009(1) | | 2008(1) | | | 2007(1) | | | 2006(1) | | | 2005(1) | | | 2004(1) | | | 2003(1) | |
| | | | | | | |
| 11,148 | | | 12,966 | | | | 11,362 | | | | 8,665 | | | | 4,298 | | | | 5,075 | | | | 4,763 | |
| 761 | | | 1,120 | | | | 1,222 | | | | 1,313 | | | | 793 | | | | 1,077 | | | | 1,176 | |
| 11,909 | | | 14,086 | | | | 12,584 | | | | 9,978 | | | | 5,091 | | | | 6,152 | | �� | | 5,939 | |
| | | | | | | |
| 52,658 | | | 56,304 | | | | 44,661 | | | | 41,580 | | | | 40,659 | | | | 39,192 | | | | 36,722 | |
| 6,037 | | | 5,124 | | | | 2,776 | | | | 1,336 | | | | 906 | | | | 985 | | | | 545 | |
| 3,733 | | | 3,736 | | | | 3,935 | | | | 5,494 | | | | 4,566 | | | | 3,450 | | | | 4,078 | |
| 2,622 | | | 2,432 | | | | 2,989 | | | | 4,845 | | | | 3,892 | | | | 3,501 | | | | 3,332 | |
| 5,810 | | | 4,137 | | | | 3,077 | | | | 2,858 | | | | 2,330 | | | | 1,623 | | | | 1,244 | |
| 70,860 | | | 71,733 | | | | 57,438 | | | | 56,113 | | | | 52,353 | | | | 48,751 | | | | 45,921 | |
| | | | | | | |
| 26,823 | | | 30,898 | | | | 19,108 | | | | 19,581 | | | | 17,306 | | | | 19,419 | | | | 21,459 | |
| 196 | | | 150 | | | | 95 | | | | 58 | | | | 44 | | | | 44 | | | | 40 | |
| 8,814 | | | 8,024 | | | | 6,096 | | | | 3,913 | | | | 2,994 | | | | 2,794 | | | | 3,040 | |
| 367 | | | 279 | | | | 143 | | | | 85 | | | | – | | | | – | | | | – | |
| 10,555 | | | 13,324 | | | | 9,972 | | | | 8,321 | | | | 4,574 | | | | 4,172 | | | | 4,194 | |
| 74 | | | 96 | | | | 56 | | | | 22 | | | | – | | | | – | | | | – | |
| 3,166 | | | 3,612 | | | | 2,549 | | | | 2,442 | | | | 1,470 | | | | 1,909 | | | | 1,820 | |
| 392 | | | 553 | | | | 418 | | | | 537 | | | | 1,004 | | | | 820 | | | | 509 | |
| 459 | | | 509 | | | | 2,373 | | | | 2,607 | | | | 2,550 | | | | 1,682 | | | | 1,732 | |
| 53 | | | – | | | | 2 | | | | 251 | | | | 128 | | | | 64 | | | | 232 | |
| 58 | | | 5 | | | | 21 | | | | 6 | | | | 39 | | | | 81 | | | | 113 | |
| 71 | | | 72 | | | | 65 | | | | 69 | | | | 60 | | | | 47 | | | | 61 | |
| | | | | | | |
| 22,395 | | | 24,075 | | | | 17,609 | | | | 16,299 | | | | 14,060 | | | | 12,175 | | | | 11,468 | |
| 258 | | | 104 | | | | 60 | | | | 59 | | | | 46 | | | | 68 | | | | 80 | |
| 20 | | | 24 | | | | 15 | | | | 38 | | | | 32 | | | | 25 | | | | 31 | |
| 422 | | | 266 | | | | 171 | | | | 199 | | | | 221 | | | | 261 | | | | 282 | |
| 32 | | | 32 | | | | 5 | | | | 17 | | | | 25 | | | | 38 | | | | 52 | |
| 10,573 | | | 10,120 | | | | 9,708 | | | | 10,458 | | | | 10,427 | | | | 10,756 | | | | 10,184 | |
| 9,252 | | | 9,328 | | | | 9,330 | | | | 9,104 | | | | 8,748 | | | | 8,209 | | | | 7,491 | |

|
EDC Annual Report 2012 | 137 |
TEN-YEAR REVIEW
CANADA ACCOUNT
| | | | | | | | | | | | |
FINANCIAL ARRANGEMENTS FACILITATED (in millions of Canadian dollars) | | 2012 | | | 2011 | | | 2010 | |
Financing | | | | | | | | | | | | |
Direct financing | | | 1 | | | | – | | | | 76 | |
| | | | |
Insurance | | | | | | | | | | | | |
Credit insurance | | | 41 | | | | 44 | | | | 129 | |
Financial institutions insurance | | | – | | | | – | | | | – | |
Contract insurance and bonding | | | – | | | | – | | | | – | |
Political risk insurance | | | – | | | | – | | | | – | |
Subtotal | | | 41 | | | | 44 | | | | 129 | |
Total | | | $42 | | | | $44 | | | | $205 | |
| | | | |
FINANCIAL AND OTHER DATA | | | | | | | | | | | | |
Financing (in millions of Canadian dollars) | | | | | | | | | | | | |
Value of total loans and notes receivable | | | 3,164 | | | | 3,442 | | | | 4,720 | |
Value of undisbursed loans | | | – | | | | – | | | | 505 | |
Value of loan disbursements (net of guarantees) | | | – | | | | 569 | (2) | | | 446 | (2) |
Value of liability on loan guarantees | | | 208 | | | | 241 | | | | 295 | |
Undisbursed amounts on loan guarantees | | | – | | | | – | | | | – | |
Amounts available for allocation | | | – | | | | – | | | | – | |
Loan amounts rescheduled | | | – | | | | – | | | | 2 | |
Number of transactions financed | | | – | | | | – | | | | 5 | |
Number of current lines of credit and protocols | | | – | | | | – | | | | – | |
| | | | |
Insurance (in millions of Canadian dollars) | | | | | | | | | | | | |
Value of liability on insurance and guarantees | | | 9 | | | | 8 | | | | 10 | |
Value of claims paid | | | – | | | | – | | | | – | |
Value of claims recovered | | | – | | | | – | | | | – | |
Value of claims outstanding at end of year | | | – | | | | 13 | | | | 13 | |
Number of policies issued | | | – | | | | – | | | | 1 | |
Number of insurance policies and guarantees in force | | | 1 | | | | 4 | | | | 7 | |
| (1) | Includes activity pursuant to the Softwood Lumber deposit refund mechanism transactions. |
| (2) | Includes amounts disbursed in conjunction with the Ontario Financing Authority relating to loans in the automotive sector. |
138 | Adapting to the New Reality
| | | | | | | | | | | | | | | | | | | | | | | | | | |
| | | | | | | |
| 2009 | | | 2008 | | | 2007 | | | 2006 | | | 2005 | | | 2004 | | | 2003 | |
| | | | | | | |
| | 14,222 | (2) | | | – | | | | 27 | (1) | | | 3,645 | (1) | | | 649 | | | | 987 | | | | 1,209 | |
| | | | | | | |
| | 628 | | | | – | | | | – | | | | – | | | | – | | | | – | | | | 1 | |
| | – | | | | – | | | | – | | | | – | | | | – | | | | – | | | | – | |
| | – | | | | – | | | | – | | | | – | | | | – | | | | – | | | | – | |
| | – | | | | – | | | | – | | | | – | | | | – | | | | – | | | | – | |
| | 628 | | | | – | | | | – | | | | – | | | | – | | | | – | | | | 1 | |
| | $14,850 | | | | $ – | | | | $27 | (1) | | | $3,645 | (1) | | | $649 | | | | $987 | | | | $1,210 | |
| | | | | | | |
| | 5,905 | | | | 3,226 | | | | 2,765 | | | | 3,592 | (1) | | | 3,994 | | | | 3,786 | | | | 3,219 | |
| | 607 | | | | 1 | | | | 2 | | | | 1,516 | (1) | | | 1,526 | | | | 2,368 | | | | 3,303 | |
| | 14,398 | (2) | | | – | | | | 31 | (1) | | | 3,647 | (1) | | | 650 | | | | 1,020 | | | | 981 | |
| | 385 | | | | 457 | | | | 462 | | | | 535 | | | | 1,311 | | | | 1,341 | | | | 1,486 | |
| | – | | | | – | | | | – | | | | 15 | | | | 59 | | | | 145 | | | | 225 | |
| | – | | | | – | | | | – | | | | – | | | | 39 | | | | 52 | | | | 61 | |
| | 1 | | | | – | | | | – | | | | 15 | | | | 41 | | | | 6 | | | | 31 | |
| | 16 | | | | – | | | | 27 | (1) | | | 803 | (1) | | | 37 | | | | 55 | | | | 45 | |
| | – | | | | – | | | | – | | | | – | | | | 1 | | | | 2 | | | | 2 | |
| | | | | | | |
| | 120 | | | | – | | | | – | | | | – | | | | – | | | | – | | | | – | |
| | – | | | | – | | | | – | | | | – | | | | – | | | | – | | | | – | |
| | 11 | | | | 15 | | | | 8 | | | | – | | | | – | | | | – | | | | – | |
| | 13 | | | | 22 | | | | 35 | | | | 44 | | | | 44 | | | | 44 | | | | 45 | |
| | 103 | | | | – | | | | – | | | | – | | | | – | | | | – | | | | 2 | |
| | 53 | | | | 2 | | | | 2 | | | | 2 | | | | 4 | | | | 4 | | | | 5 | |
|
EDC Annual Report 2012 | 139 |
GLOSSARY OF FINANCIAL TERMS
| | |
Actuarial Gains or Losses – Changes in the value of the defined benefit obligation and the plan assets due to differences between actuarial assumptions and what has actually occurred and due to changes in actuarial assumptions. Actuarial Valuation (re: Pension Benefit Plans) – An assessment of the financial status of a benefit plan performed by an independent actuary. It includes the valuation of any plan assets and the defined benefit obligation using estimates of future events that will affect the costs and obligation for employee benefits plans. Amortized Cost – The amount at which the financial asset or financial liability is measured at initial recognition minus principal repayments, plus or minus the cumulative amortization using the effective interest method of any difference between that initial amount and the maturity amount, and minus any reduction (directly or through the use of an allowance account) for impairment or uncollectability. Basis Point – One one-hundredth of a percentage point. Collective Allowance – Allowance established for losses which we estimate to have occurred, but have not yet been individually identified within our portfolio. Contingent Liability – Potential debt which arises from past events and may become an actual obligation if certain events occur or fail to occur. Contingent liability is also referred to as insurance policies and guarantees outstanding. Credit Risk – The risk of loss incurred if a counterparty fails to meet its financial commitments. Defined Benefit Obligation – The actuarial present value, without deducting any plan assets, of expected future payments required to settle the obligation resulting from employee service in the current and prior periods. Derivative Instruments – Financial contracts that derive their value from changes in interest rates, foreign exchange rates, credit spreads, commodity prices, equities, market indexes or other financial measures. Such instruments include futures, interest rate, foreign exchange, equity, commodity and credit default swaps. Effective Interest Rate – The rate that exactly discounts estimated future cash payments or receipts through the expected life of the financial instrument or, when appropriate, a shorter period, to the net carrying amount of the financial asset or financial liability. Facultative Reinsurance – Reinsurance provided on a transactional basis. Fair Value – The amount for which an asset could be exchanged, or a liability settled, between knowledgeable, willing parties in an arm’s length transaction. Financial Institutions Insurance – Includes credit risk mitigation provided directly to Canadian financial institutions that cover their foreign bank and foreign buyer counterparty risk in business transactions. Foreign Exchange Risk – The risk of potential adverse impact on the value of financial instruments resulting from exchange rate movements. | | Gross Loans Receivable – Principal amounts outstanding under existing loan agreements. Hedge – A risk management practice used to manage interest rate or foreign exchange exposures arising from the normal course of business operations. IFRS – International Financial Reporting Standards. Individually Impaired Loans – Loans where there is objective evidence that an impairment loss has occurred. Interest Rate Risk – The risk that the fair value or future cash flows of a financial instrument will fluctuate because of changes in market interest rates. LIBOR – London Inter-Bank Offered Rate – The interest rate at which banks in London are prepared to lend funds to first-class banks. Liquidity Risk – The risk that we would be unable to honour daily cash outflow commitments or the risk that we would have to obtain funds rapidly, possibly at an excessively high premium during severe market conditions. Market Risk – The risk that the fair value or future cash flows of a financial instrument will fluctuate because of changes in market prices. Market risk comprises three types of risk: foreign exchange risk, interest rate risk, and other price risk. Net Finance Margin – Net financing and investment income expressed as a percentage of average income earning assets. Net Financing and Investment Income – Revenue earned on financing, leasing, marketable securities and investment assets, less interest and leasing and financing related expenses. Net Revenue – Net income excluding the provision for credit losses, claims-related expenses and administrative expenses. Operational Risk – The risk of direct or indirect loss resulting from the organizational environment, external events, inadequate internal processes, people, or systems. Productivity Ratio – Administrative expenses expressed as a percentage of net revenue excluding debt relief and the unrealized gains and losses on long-term debt and derivatives. Projected Benefit Method Pro Rated on Services – An actuarial valuation method in which an equal portion of the total estimated future benefit is attributed to each year of service. Special Purpose Entity (SPE)– SPE is an entity created to accomplish a narrow and well defined objective. Such an SPE may take the form of a corporation, trust, partnership or unincorporated entity. SPEs often are created with legal arrangements that impose strict and sometimes permanent limits on the decision-making powers of their governing board, trustee or management over the operations of the SPE. Undisbursed Loan Commitments – A contractual amount under an existing loan agreement that has yet to be advanced to the borrower. |
|
| 140 | Adapting to the New Reality |
CORPORATE REPRESENTATION
| | | | | | | | |
NATIONAL Head Office Export Development Canada 150 Slater Street Ottawa, ON K1A 1K3 Tel: 613-598-2500 Fax: 613-598-3811 edc.ca Vancouver 1055 Dunsmuir Street Suite 400, Bentall Four PO Box 49086 Vancouver, BC V7X 1G4 Tel: 604-638-6950 Fax: 604-638-6955 Edmonton 10180-101 Street Suite 3400 Edmonton, AB T5J 3S4 Tel: 780-702-5233 Fax: 780-702-5235 Calgary 308-4th Avenue SW Suite 2403 Calgary, AB T2P 0H7 Tel: 403-817-6700 Fax: 403-817-6701 Regina 1914 Hamilton Street Suite 300 Regina, SK S4P 3N6 Tel: 306-586-1727 Fax: 306-586-1725 Winnipeg Commodity Exchange Tower 360 Main Street Suite 2075 Winnipeg, MB R3C 3Z3 Tel: 204-975-5090 Fax: 204-975-5094 Windsor 3270 Electricity Dr. Suite 209 Walker Industrial Park Windsor, ON N8W 5J1 Tel: 519-974-7674 Fax: 519-974-9753 | | London 148 Fullarton Street Suite 1512 London, ON N6A 5P3 Tel: 519-963-5400 Fax: 519-963-5407 Mississauga 1 City Centre Drive Suite 805 Mississauga, ON L5B 1M2 Tel: 905-615-6470 Fax: 905-615-6471 Toronto 155 Wellington Street Suite 3120 Toronto, ON M5V 3L3 Tel: 416-349-6515 Fax: 416-349-6516 Drummondville 1412 Jean Berchmans Michaud Street Drummondville, QC J2C 7V3 Tel: 819-475-2587 Fax: 819-475-2408 Montréal 800 Victoria Square Suite 4520 P.O. Box 124, Tour de la Bourse Montréal, QC H4Z 1C3 Tel: 514-908-9200 Fax: 514-878-9891 Québec City 2875 Laurier Boulevard D-3, Suite 600 Québec, QC G1V 2M2 Tel: 418-577-7408 Fax: 418-577-7419 Ville Saint-Laurent 9900 Cavendish Boulevard Suite 201 Saint-Laurent, QC H4M 2V2 Tel: 514-215-7200 Fax: 514-215-7201 | | Halifax Suite 1605 1969 Upper Water Street, Tower 2 Halifax, NS B3J 3R7 Tel: 902-450-7600 Toll-free: 888-332-3343 Fax: 902-450-7601 Moncton 735 Main Street Suite 400 Moncton, NB E1C 1E5 Tel: 506-851-6066 Fax: 506-851-6406 St. John’s 510 Topsail Road St. John’s, NL A1E 2C2 Tel: 709-772-8808 Fax: 709-772-8693 INTERNATIONAL Sao Paulo Consulate General of Canada Av. das Nações Unidas 12901 Cenu Torre Norte, Andar 16° CEP 04578-000 São Paulo - SP, Brazil Tel: (011) 55-11-5509-4320 Fax: (011) 55-11-5509-4275 Rio de Janeiro Canadian Consulate General Av. Atlantic 1130/5 Ander Copacabana Atlantica Business Center Rio de Janeiro, Brazil CEP 22021-000 Tel: (011) 55-21-2295-0391 Fax: (011) 55-21-2275-5735 Chile Canadian Embassy Nueva Tajamar 481 – 12th floor North Tower Las Condes Santiago, Chile Tel: (011) 56-2-652-3807 Fax: (011) 56-2-652-3808 | | Peru Canadian Embassy Bolognesi 228, Miraflores Lima 18, Peru Tel: (011) 51-1 319-3385 Fax: (011) 51-1 446-6257 Mexico Canadian Embassy Calle Schiller 529 Rincón del Bosque Colonia Polanco México, D.F. 11560 Mexico Tel: (011) 52-55-5387-9316 Fax: (011) 52-55-5387-9317 Consulate of Canada Torre Gomez Morin 955 Piso 4, Suite 404, Col. Montebello San Pedro Garza Garcia, N.L. Mexico, CP, 66279 Tel: (011) 52-81-8378-0240 ext. 3360 Fax: (011) 52-81-8356-9965 Panama Canadian Embassy Torres de las Americas Tower A, 11th Floor Panama City, Panama Tel: (011) 507-294-2526 Fax: (011) 507-674-0887 Germany Consulate of Canada – Düsseldorf Benrather Strasse 8 40213 Düsseldorf Germany Tel: (011) 49-0-211-17217-45 Fax: (011) 49-0-211-17217-80 Turkey Consulate of Canada 209 Buyukdere Caddesi Tekfen Tower – 16th Floor Levent 4, Istanbul 34394 Turkey Tel: (011) 90-212-385-9700 Fax: (011) 90-212-385-9715 | | Russia Canadian Embassy 23 Starokonyushenny Pereulok Moscow, 119002 Russia Tel: (011) 7-495-925-6095 Fax: (011) 7-495-925-5667 Greater China Canadian Consulate ECO City Building 8th floor, 1788 Nanjing Xi Lu – Jing An District Shanghai, 200040 China Tel: (011) 86-21-3279-2800 Fax: (011) 86-21-3279-2801 Canadian Embassy 19 Dongzhimenwai Street Chayoang District, Beijing 100600 China Tel: (011) 86-10-5139-4126 Fax: (011) 86-10-5139-4463 India Canadian High Commission 7/8 Shantipath Chanakyanpuri New Delhi 110021 India Tel: (011) 91-11-4178-2288 Fax: (011) 91-11-4178-2607 Indiabulls Finance Centre, Tower 2, 21st Floor Senapati Bapat Marg Elphinstone Road (West) Mumbai 400 013 India Tel: (011) 91-22-6749-4480 Fax: (011) 91-22-6749-4481 Singapore Canadian High Commission One George Street, #11-01 Singapore 049145 Tel: (011) 65-6854-5949 Fax: (011) 65-6854-5848 United Arab Emirates Canadian Embassy P.O. Box 6970 Abu Dhabi United Arab Emirates Tel: (011) 971-2-694-0376 Fax: (011) 971-2-694-0389 |
| | | | |
 | | Cover (outside) Top Left: Courtesy of Pratt & Whitney Canada Top Right: © Martin Lipman Bottom © José Fuste Raga/age fotostock (inside) Left: © Martin Lipman Right: © Mel Stuart/Westend61/Corbis | | Inside Page 1 © GoGo Images Corporation/Alamy Pages 2, 3 © iStock, Creativeye99 Page 5 © Martin Lipman Pages 6, 9, 38 © Stephen Fenn Pages 10, 12 Courtesy of Endurance Wind Power Page 13 Courtesy of Pratt & Whitney Canada Page 14 © Dinodia Page 15 Courtesy of Valiant Corporation Page 16 Courtesy of Absolute NDE Page 17 Courtesy of Survival Systems Pages 18, 21, 24 © Martin Lipman Page 20 © Corbis Page 22 © REUTERS/Amit Dave Pages 26, 29 © Ladislau Papara |
| | |
| Ce document est également disponible en français. | | Printed in Canada. |