EXHIBIT 99.3
Turning the Corner on Trade
2013 Annual Report
Canada
Realize a World of Opportunity
| | | | | | | | | | | | |
| | Mandate | | |
| | | | | |
| | | Export Development Canada (EDC) is Canada’s export credit agency.
Our mandate is to support and develop Canada’s trade, and the capacity
of Canadian companies to participate in and respond to international
business opportunities. Our knowledge and partnerships are used by
close to 7,200 Canadian companies and their global customers in up to
200 markets worldwide each year. A Crown corporation accountable to
Parliament through the Minister of International Trade, we are
financially self-sustaining and a recognized leader in financial reporting
and economic analysis. | | |
| | | | | | | | | | | | | |
| | | | | | | | | | | | | |
| | | | | | | | | | | | | |
| | | | | | | | | | | | | |
| | | | | | | | | | | | | |
| | | | | | | | | | | | | |
| | | | | | | | | | | | | |
| | | | | | | | | | | | | |
| | | | | | | | | | | | | |
| | | | | | | | | | | | | |
| | | | | | | | | | | | | |
| | | | | | | | | | | | | |
| | | | | | | | | | | | | |
| | | Contents | | |
| | | | | | | | | | | | | |
| | | ii | | 2013 Highlights | | | | 38 | | 2014 Strategic Objectives |
| | | | | | | | | | | | | |
| | | | | | | | | | | | | |
| | | iii | | 2013 Performance Measures | | | | 42 | | Board of Directors |
| | | | | | | | | | | | | |
| | | | | | | | | | | | | |
| | | 2 | | EDC Around the World | | | | 44 | | Executive Management Team |
| | | | | | | | | | | | | |
| | | | | | | | | | | | | |
| | | 4 | | Message from the Chair | | | | 46 | | Corporate Governance |
| | | | | | | | | | | | | |
| | | | | | | | | | | | | |
| | | 6 | | Message from the President | | | | 50 | | 2013 Financial Review |
| | | | | | | | | | | | | |
| | | | | | | | | | | | | |
| | | 8 | | Message from the Chief Economist | | | | 50 | | Management’s Discussion and Analysis |
| | | | | | | | | | | | | |
| | | | | | | | | | | | | |
| | | 10 | | Our Priorities | | | | 83 | | Consolidated Financial Statements |
| | | | | | | | | | | | | |
| | | | | | | | | | | | | |
| | | 24 | | Performance Against our Objectives | | | | 140 | | Ten-Year Review |
| | | | | | | | | | | | | |
| | | | | | | | | | | | | |
| | | 32 | | Corporate Social Responsibility | | | | 148 | | Glossary of Financial Terms |
| | | | | | | | | | | | | |
| | | | | | | | | | | | | |
| | | 36 | | Investor Relations | | | | 149 | | Corporate Representation |
| | | | | | | | | | | | | |
| | | | | | | | | | | | | |
2013 Highlights
| | | | |
| ii | | Turning the Corner on Trade | | |
2013 Performance Measures
| * | New measures effective 2013. Business in Emerging Markets represents revenue derived from all programs in emerging markets. |
| ** | Value for Money (VfM) are investments in IT that increase business performance. Total cost of ownership (TCO) is the cost of maintaining core business infrastructure and technology assets. |
Ratings in our performance measures are as follows:
| | | | | | | | | | |
 | | Target met or exceeded (> 98% of plan) | |  | | Target substantially met (> 95% and < 98% of plan) | |  | | Target not met (< 95% of plan) |
2013 Performance Highlights
by Sector and Market
| | | | |
| Business Facilitated by Industry Sector | | | | Business Facilitated by Geographic Market |
($ in millions) | | | | ($ in millions) |
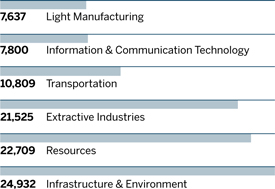 | | | | 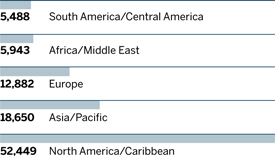 |
| | | | |
| | EDC Annual Report 2013 | | iii |

Turning the Corner on Trade
2013
After a slow start, the Canadian economy picked up steam throughout 2013. And while export growth of 3.2 per cent might seem disappointing, it was a significant improvement over the 2 per cent growth in 2012. Moving forward, as the U.S. recovery accelerates and European conditions improve, Canadian exporters and investors are well positioned for growth in 2014.
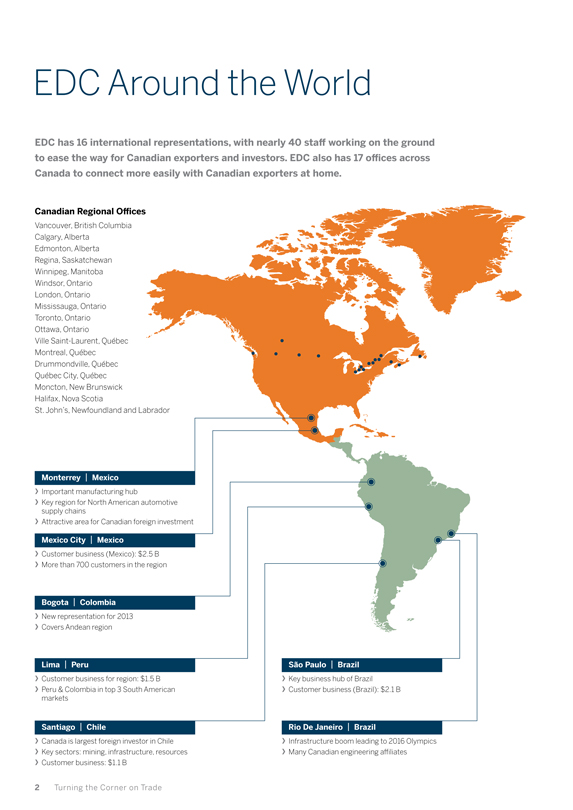
EDC Around the World
EDC has 16 international representations, with nearly 40 staff working on the ground to ease the way for Canadian exporters and investors. EDC also has 17 offices across Canada to connect more easily with Canadian exporters at home.
Canadian Regional Offices
Vancouver, British Columbia
Calgary, Alberta
Edmonton, Alberta
Regina, Saskatchewan
Winnipeg, Manitoba
Windsor, Ontario
London, Ontario
Mississauga, Ontario
Toronto, Ontario
Ottawa, Ontario
Ville Saint-Laurent, Québec
Montreal, Québec
Drummondville, Québec
Québec City, Québec
Moncton, New Brunswick
Halifax, Nova Scotia
St. John’s, Newfoundland and Labrador
Monterrey | Mexico
Important manufacturing hub
Key region for North American automotive supply chains
Attractive area for Canadian foreign investment
Mexico City | Mexico
Customer business (Mexico): $2.5 B
More than 700 customers in the region
Bogota | Colombia
New representation for 2013
Covers Andean region
Lima | Peru
Customer business for region: $1.5 B
Peru & Colombia in top 3 South American markets
Santiago | Chile
Canada is largest foreign investor in Chile
Key sectors: mining, infrastructure, resources
Customer business: $1.1 B
São Paulo | Brazil
Key business hub of Brazil
Customer business (Brazil): $2.1 B
Rio De Janeiro | Brazil
Infrastructure boom leading to 2016 Olympics
Many Canadian engineering affiliates
2 Turning the Corner on Trade
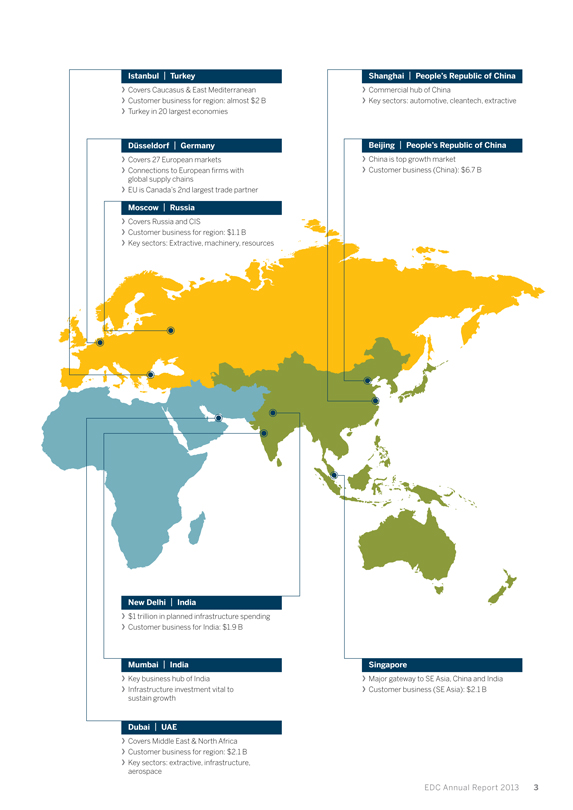
Istanbul | Turkey
Covers Caucasus & East Mediterranean
Customer business for region: almost $2 B
Turkey in 20 largest economies
Düsseldorf | Germany
Covers 27 European markets
Connections to European firms with global supply chains
EU is Canada’s 2nd largest trade partner
Moscow | Russia
Covers Russia and CIS
Customer business for region: $1.1 B
Key sectors: Extractive, machinery, resources
Shanghai | People’s Republic of China
Commercial hub of China
Key sectors: automotive, cleantech, extractive
Beijing | People’s Republic of China
China is top growth market
Customer business (China): $6.7 B
New Delhi | India
$1 trillion in planned infrastructure spending
Customer business for India: $1.9 B
Mumbai | India
Key business hub of India
Infrastructure investment vital to sustain growth
Dubai | UAE
Covers Middle East & North Africa
Customer business for region: $2.1 B
Key sectors: extractive, infrastructure, aerospace
Singapore
Major gateway to SE Asia, China and India
Customer business (SE Asia): $2.1 B
EDC Annual Report 2013 3

| | | | |
| I | | t was an honour for me to begin my service as Chairman of the Board of Directors for EDC in 2013. Drawing on my private sector experience, I understand the importance of EDC’s work; one in every five Canadian jobs is directly linked to exports – and trade is arguably the most effective way to drive economic growth and prosperity. | | |
And while the recession certainly took its toll on Canadian businesses, conditions seem to be set for better performance ahead; an improved global outlook, particularly for developed economies, should boost Canada’s exports. But to fully reap the benefits, we have to strengthen our competitiveness, develop new markets and secure our position in global supply chains. Which is why I was particularly impressed to see first-hand what EDC does for Canadian businesses looking to grow their international footprint in 198 countries, 30 per cent of which are in critical high-growth emerging markets. Not to mention the benefits these efforts bring to Canada; last year alone EDC’s work helped generate $61.9 billion of Canada’s GDP and helped sustain 568,799 jobs – that’s 3.2 per cent of total national employment. The board’s role in these efforts is to ensure good governance, which means at the highest level we provide guidance for and approve EDC’s Corporate Plan. This year we challenged management to set aggressive performance targets, to better use EDC’s capital strength for the benefit of Canadian exporters, and to raise awareness of what we can do for Canadian exporters and investors. Much of the board activities also focused on providing direction to ensure EDC was aligned with our government’s priorities. EDC reports to the Minister of International Trade, and we align our activities with the Minister’s Statement of Priorities & Accountabilities, which specifically addresses our role in helping to promote Canada’s global commerce agenda. In 2013, that meant making sure that EDC supports the government’s new Global Markets Action Plan (GMAP), an ambitious trade policy that will concentrate efforts on the markets that hold the greatest promise for Canadian business. GMAP also sets some concrete targets to increase Canada’s small- and medium-sized enterprise (SME) presence in emerging markets to 50 per cent by 2018. Currently, only about 4 per cent of the more than 1 million Canadian SMEs are exporting, and the overwhelming majority of these exports are going to the U.S. | | |
| | | | |
| 4 | | Turning the Corner on Trade | | |
| | |
| | | |
“ Much of the board activities this year also focused on providing direction to ensure EDC was aligned with our government’s priorities. ” | | |
| | As such, there was a great deal of discussion at the board level on how EDC services can help build more export momentum for SMEs, an essential part of our mandate. The board also approved some major technology initiatives with respect to EDC’s credit insurance solutions, which should enable the Corporation to help more small businesses in a more cost-effective and efficient way. No doubt, it was a year of transition for EDC on many fronts. We witnessed the global economy pick up momentum, and we saw leadership changes here at EDC, including myself as Chairman when I assumed the role in June of 2013. EDC has been well served over the years by a strong Board of Directors, so let me take this opportunity to acknowledge the leadership and valuable business and government experience that Jim Dinning brought to the table during his six years as Board Chair. He has left a very strong organization and board in his wake. A special thanks also goes to Linda Hohol, who stepped in as Vice-Chair when Jim Dinning’s term ended in April. On behalf of all EDC and the board, I would also like to thank Stephen Poloz for his 14 years of service to EDC, most notably for his two years as President and CEO before being appointed as Governor of the Bank of Canada in June. I would also like to thank Pierre Gignac who accepted the position of Acting President when Mr. Poloz left for the Bank of Canada. The board’s confidence in his ability to steer the ship throughout this period was well-placed and he demonstrated true leadership up until February 2014, when Benoit Daignault was appointed President and CEO. Pierre has since resumed his role as Senior Vice-President and Chief Risk Officer. I’d also like to thank the entire executive team for their support and dedication throughout this year of transition. And of course, the 1,200 EDC employees for their tireless work on behalf of Canada’s exporters and investors. Looking ahead, I’m confident that EDC is well positioned to build on Canada’s economic recovery and help more Canadian business succeed on the world stage. |
| |
| |  |
| | Kevin Warn-Schindel |
| | Chair |

| | | | |
| A | | fter a long string of challenging years, it looks like the global economy and Canadian trade are finally turning the corner. With a resurgence in the U.S. trade confidence began to return. Exports were up 3.2 per cent and are expected to continue to grow in 2014. It’s about time! | | |
It was also quite a year for me, as I was asked to step in as Acting President in June when Stephen Poloz accepted the position as Governor of the Bank of Canada. My goal was to ensure business as usual for EDC and our customers during the transition. | | |
In light of continued volatility in the economy and the needs of Canadian exporters and investors, we set the bar high for ourselves this year, with some significant stretch targets. And we managed to meet most and exceeded some. Overall, the exports and investments that we facilitated for our customers reached more than $95 billion. That’s a 9 per cent growth over 2012. More importantly, we saw growth in our customers’ Canadian direct investments abroad and business volumes in emerging markets – both very positive signs of better times ahead. | | |
Internally, we also saw some significant accomplishments. We prioritized our efforts to ensure we always put the customer first, by focusing on areas that bring the greatest value to the most customers. This meant investing in some major transformation projects to modernize our business systems and develop a new, web-based platform for our credit insurance products. These projects are a very significant undertaking and we’re doing it for one reason: simplicity! This is all about making it easier for our customers to do business with us – and improving the customer’s experience moving forward. | | |
During the year I spent time in several local markets, including India, a priority market for EDC, as well as other markets where we see huge potential for Canadian business, such as Indonesia and Singapore. These visits gave me a chance to witness first-hand what’s happening on the ground in markets where Canadian businesses need to be – and what I saw was opportunity. With the Government of Canada’s new Global Market Action Plan (GMAP) making trade development in foreign markets a priority, EDC will work closely with the Department of Foreign Affairs, Trade and Development (DFATD) to implement this strategy, both here in Ottawa and through our 16 international representations in key markets around the world. | | |
| | | | |
| 6 | | Turning the Corner on Trade | | |
| | | | |
“ Overall, the exports and investments that we facilitated for our customers reached more than $95 billion. ” | | GMAP also places a high priority on helping Canada’s small- and medium-sized enterprises (SMEs), the real engines of growth for the economy, and we certainly share that priority. In 2013 we explored new ways of delivering for SMEs and introduced several initiatives to grow our contribution to this segment. We also set a stretch target for small business transactions in order to track our success for this critical segment, and we surpassed it. Moving forward, we will take steps to help even more SMEs grow their international footprint. |
| |
| |
| |
| | | | As with every year, our activities in 2013 exposed us to a wide variety of risks, which means we have to be prudent about how we deploy our capital, because maintaining our strong capital base is critical to ensuring we can support exporters in the years to come. We made a lot of progress with the redesign of our Enterprise Risk Management Framework, a project that we believe will have a huge impact on our ability to better serve our customers, because it allows us to “stretch” and pursue riskier areas of business – provided the risks are aligned with the benefits that result for Canada. Overall, because of these practices, we were able to maintain a strong capital base for future business and pay a record dividend of $1.44 billion to the Government of Canada this year. As always, everything we do is guided by two principles: working in partnership wherever we can, and conducting our business in a responsible manner. We believe that working with private sector partners to combine our expertise and risk capacity is the most efficient way to expand our reach and have a greater impact on more Canadian businesses, and this year our partnership transactions led to almost $23 billion in exports and investments for our customers. We also signed an MOU with DFATD to improve the coordination between our two organizations and stepped up our collaboration efforts with the Business Development Bank of Canada. On the Corporate Social Responsibility (CSR) front, we undertook an initiative to review our strategic management of CSR, which helped us to clarify our values and risk thresholds, and improve predictability for our customers about what business we can or cannot finance or insure. I’d like to take this opportunity to thank Stephen Poloz for his direction and support. I’d also like to thank our new Chair, Kevin Warn-Schindel and the entire Board of Directors for having the confidence in me to carry the mantle as interim President up until Benoit Daignault was appointed as President and CEO in February 2014. Of course, it wouldn’t have been possible without our executive team, who truly helped make the transition so seamless. Finally, I need to thank our employees for their incredible dedication and hard work this year; those at head office as well as our regional offices across Canada and throughout the world. In retrospect, 2013 was quite a year, and quite an honour for me. I’m proud of what we were able to accomplish for the benefit of Canada’s exporters and investors. And as the global economy turns the corner, I’m confident that EDC is well-positioned and ready to help these companies grow more than ever. |
| |
| |  |
| | | | Pierre Gignac |
| | | | Acting President |

| | | | |
| I | | t is tough when you enter a year without much momentum, and immediately get doused with a cold shower. Such was the case for Canadian international trade. Heading into 2013, the U.S. economy immediately faced a fiscal cliff, as the failure of politicians to agree on a federal fiscal plan instantly activated austerity measures. For world trade, and in our case the Canadian exporting community, this was an especially disappointing development, as progress through 2012 had ignited hopes of a U.S.-led global recovery. | | |
| | | |
| | | |
Dampened export prospects hit Canada hard for another reason. We entered the year with fresh worries about prospects on the home front. Consumer debt levels were rising, threatening the biggest concentration of spending power in the economy. Housing markets looked more precarious and, at best, did not look like a growth source. Public sector restraint nixed hope of any contribution from the government sector. The onus was increasingly on trade-focused businesses to grab the growth baton and power the economy forward. | | |
Initially, it wasn’t an unreasonable expectation, as the U.S. economy had already started to show significant signs of revival. Stateside, the long-lost housing sector was re-awakening dramatically. Business orders were on the up-and-up and industrial capacity was tightening. However, the January fiscal cliff dealt momentum a significant body-blow, and it was only the first of three such events in the year. The sequestration debacle at the end of March was even more damaging, and by October, persistent political impasse led to full shutdown of federal government services. Collectively, these imposed hurdles exacted a heavy toll on a year that ought to have seen better times. | | |
Elsewhere, few were looking to the European Union (EU) for significant growth last year, and early-year gloom certainly didn’t help. Japan’s structural woes kept many from thinking that its performance could lend a hand. And without key economies leading the charge, the rest of the OECD area was hard-pressed to take the reins. | | |
Well before entering 2013, emerging markets were showing cracks in their growth profiles, and this persisted through the year. The May musing by Federal Reserve Chairman Bernanke about lessening quantitative easing sometime in the near future complicated the picture. Taper-talk hit the world by storm, instantly hitting emerging markets with currency depreciation, tumbling stock markets, higher borrowing costs and weaker prices for their commodity exports. With limited firepower to fend off these effects, these markets watched as overall activity weakened. As such, diversification of exports into emerging markets, a source of extra growth for Canada over the past decade, moderated significantly in 2013. | | |
| | | | |
| 8 | | Turning the Corner on Trade | | |
| | | | |
“ After years of stories about the next crisis, discourse seems to have shifted toward growth. ” | | Then we turned the corner Thus far not a great evaluation of the year, but it got better. A number of significant developments brightened hopes as the year wore on. First, fiscal punishment aside, underlying private sector activity in the U.S. increased at a recovery-style pace. Second, hopes were kindled in a big way mid-year when the euro area was able to declare its recession over. Third, Japan pulled off a big win as the Prime Minister’s ‘three arrow’ ‘Abenomics’ plan fired up internal enthusiasm about the economy’s prospects for the first time in 20 years. |
| |
| |
| |
| | | | After years of stories about the next crisis, discourse seems to have shifted toward growth. Small wonder – one of the most remarkable turn of events of 2013 was the return of confidence. Five years of gloom threatened to permanently reset global psychology, but mid-year, this fickle but essential factor rebounded, most dramatically in the U.S., but simultaneously in the EU and Japan as well. After an unusually protracted hibernation, our collective view of our near-term prospects has brightened considerably. On balance, Canada’s exporters were restrained through the year by weak global demand. True, our dollar softened more than expected, but this was more a reaction to sharply lower commodity prices and uncertain domestic conditions than anything, and didn’t appear to kick up manufacturing exports much. In addition, the energy sector was hobbled by transportation capacity constraints, a concern shared by other exporting industries. It’s doubly difficult when trade is hit from both the demand and supply sides. Export numbers for the year tell the story. Merchandise exports rose an estimated 3 per cent, weighed down by poor stats in a number of industries. Crude and refined metals, machinery and equipment, autos and parts and the aerospace industries all registered declines on the year. Prices were a factor in key primary goods sectors. Overall numbers were kept afloat by decent gains in energy, forestry, industrial and consumer goods sectors. The good news is that export sectors that typically lead the others, namely wood products and certain industrial goods, are generally doing well. This suggests that the difficulties encountered by other industries through 2013 are temporary. If 2013 was a year in waiting, there is hope for much better in 2014. Global economic momentum should help, alongside the impending boost from increased confidence. Better times for OECD economies suggest that emerging markets will finally see a decent lift in trade activity - which bodes well for a resumption of Canadian export diversification. There’s good reason to believe that last year’s disappointments will soon be shrugged off, giving way to a new challenge: creating the capacity to absorb the growth brought on by the new economic cycle. |
| |
| |  |
| | | | Peter G. Hall |
| | | | Vice-President and Chief Economist |

Our Priorities
10 Turning the Corner on Trade

Better Times Ahead
After a long wait, the world economy seems to be getting back on its feet. Growth is beginning to alleviate some key risks that weighed on the global economy during the crisis and we’re now seeing evidence of pent-up demand in key markets like Europe and the U.S. In 2013 Canadian exporters showed the first back-to-back rise in trade confidence in more than three years, based on optimism that the global economy is gathering steam. Certainly, all of the volatility and risks inherent in today’s integrated global trade have not gone away, but we’re turning the corner and we need to get ready for the growth that will come.
In 2012, we embarked on some new initiatives to create trade opportunities where we see potential for Canadian expertise: the infrastructure sector in India, as well as the clean technology and aerospace sectors. In 2013, we saw progress on all three fronts. We also placed a heightened priority on helping SMEs, many of whom suffered the most since the global recession. The following pages describe our efforts on these critical initiatives as well as our efforts to create trade opportunities for Canadian suppliers.
EDC Annual Report 2013 11

STRATEGIC PRIORITIES
Small Business is Big Business
Small- and medium-sized enterprises (SMEs) make up about 98 per cent of Canada’s businesses, account for 45 per cent of GDP and 60 per cent of all jobs. Of the more than 1 million SMEs operating in Canada, only 41,000 are currently exporting. About 77 per cent of these exports are going to the U.S., but moving forward, SMEs are poised to significantly diversify and grow their presence in key emerging markets.
Furthermore, Canada’s smaller businesses – those with revenues under $10 million – account for close to half of all jobs created and 25 per cent of Canadian exports. Their success, however, has been tempered by many challenges, such as the high dollar, which have made engaging in international trade more difficult. Now more than ever, these smaller businesses need support to help break into foreign supply chains, and establish a credible presence abroad. Here are some of our smaller customers’ successes in 2013.
Gary Williston, CEO of New Brunswick-based peat moss exporters Theriault & Hachey.
12 Turning the Corner on Trade
THERIAULT & HACHEY PEAT MOSS

Third-generation family businesses might be few and far between today, but they do exist. New Brunswick-based Theriault & Hachey Peat Moss, for example, has been harvesting and processing peat moss for horticultural and mushroom industries since 1963. They are one of only a few locally owned peat moss operations left in New Brunswick, after many of their
competitors were bought by other Canadian and U.S. entities. In recent years, the company has added new facilities and equipment to expand their product line of peat mixed products.
EDC has supported Theriault & Hachey with accounts receivable insurance in the past, and recently partnered with their bank to help support their operating line.
Thanks to EDC support, the company enjoyed a successful year and is now producing various grades of peat moss for markets in Japan, the U.S., Mexico, Puerto Rico, Australia and Europe.
TONIC LIFE

Tonic Life, owned by Vancouver-based Summit Clothing, designs and manufactures women’s active wear for sports like tennis and yoga. Their clothing is 100 per cent Canadian and all the manufacturing is done in Vancouver. They began operations in 2005, exporting in small quantities for three years, but real international growth happened in the last five years. They now export 90 per cent of their
products into 36 countries; including the U.S. and Europe, but increasingly to some key emerging markets. This includes Thailand, their largest customer in South East Asia, as well as Malaysia, Japan, New Zealand and Dubai.
EDC had been supporting their growth into these foreign markets for five years through accounts receivable insurance. In 2013 we partnered with their bank on two financing facilities:
one to help with pre-shipment costs linked to export contracts and the other to support their day-to-day operations through our Export Guarantee Program, essentially financing their work in progress; something not all traditional lenders are willing to do. And they’re getting a name for themselves – last year professional tennis player Martina Hingis signed on to be a spokesperson for the company based on her love of the clothing.
| | | | |
| | EDC Annual Report 2013 | | 13 |
STRATEGIC PRIORITIES
Small Business is Big Business
VAST STUDIOS

If you’re unravelling a devious plot that could endanger the entire world, you might be playing Strange Discoveries: Aurora Peak! And the devious minds behind the game? Vast Studios.
Headquartered in Toronto, Vast Studios is a video game developer, serving a niche market for women over 35 years old. Gamers would know them as the developer of 3 Tones, a game nominated for RealNetworks’
Great Game Awards as well as the Nightfall Mysteries series. They also entered into a partnership with National Geographic to make a game based on the Salem Witch Trials.
Founded in 2008, the company now offers its games in more than 10 languages and sells primarily to a large U.S. distributor. EDC has been supporting their growth since 2011, beginning with a small operating
line, in partnership with their bank, to help fund the daily operations and the normal expenses that go with developing new games and growing internationally.
In 2013, again in partnership with their bank, EDC increased its financing support to help the company significantly increase their development capacity. Today the company is hiring more developers to meet the growing demand.
OMG’S

When Chris Emery and Larry Finnson, two of Canada’s finest candy entrepreneurs, developed Chris’ grandma’s recipe into Clodhoppers, they were able to sell the business in 2006 and made millions. In 2012, they came back with OMG’s! a new gourmet confection of chocolaty graham clusters mixed with toffee bits, almonds or peanuts – delicious by any standards, hence the name. That same year they convinced
Dragons’ Den marketing maven Arlene Dickinson to invest in their premium candy.
In 2013 backed by Dickinson, OMG’s won a huge contract with Sam’s Club, a U.S. retail warehouse outlet owned by Walmart. OMG’s needed $1.5 million in contract financing to fill the massive order and came to EDC for help. Based on their earlier success with Clodhoppers and the fact that OMG’s was already
enjoying success in Canada, we were able to provide pre-shipment financing support through their bank, HSBC.
Through our Export Guarantee Program, we were able to offer 100 per cent coverage on a working capital credit facility that turned out to be critical to the success of OMG’s deal. Today, Sam’s Club is putting OMG’s on the shelves of more than 600 of its stores.
| | | | |
| 14 | | Turning the Corner on Trade | | |
SUPCO CANADA RAILWAY SUPPLY CORP (SCRS)

Based in Maple, Ontario, SCRS provides products, such as manufacturing assemblies, spare parts and components as well as quality control and inspection services for the railway and locomotive industry. Most of their business is transacted in the U.S., Saudi Arabia, Egypt and Turkey.
In their line of business, it’s typical to sell to a national government railway
service department. As such, they are required to post bid, performance and warranty bonds. EDC has been supporting SCRS’s bonding needs in partnership with their bank since 2008. We have recently supported the company’s pre-shipment financing needs which enabled SCRS to bid on larger projects than they would have been able to in the past and
gives them access to capital to fund their upfront costs, which can be burdensome with larger projects. Since 2008, they have expanded their U.S. base considerably and are now looking to markets in Tunisia and Bangladesh.
HELM OPERATIONS

The development of Canada’s ocean industry cluster could present many international opportunities, particularly for small companies such as Victoria-based Helm Operations. Established in 1999, Helm develops operations and safety and compliance software for tug and barge and offshore supply vessel companies. They began by developing an innovative way to help tugboat companies organize their operations and regain control
of their time and resources through Helm Marine Operations software. Essentially the software helps workboat companies organize their operations, prove compliance and optimize their business intelligence gathering.
In 2006 they began exporting to inland towing companies in U.S. regions such as Florida and Louisiana. EDC has been helping the company since 2011, primarily by financing
their work in progress during software development. In 2013, EDC supported Helm’s expansion into the U.S. and beyond after the company signed the largest harbor services company in the world to use their dispatch and billing software. Moving forward, Helm hopes to see significant growth in markets such as Europe, Asia Pacific and the Middle East, both in the tug and barge and offshore supply sectors.
| | | | |
| | EDC Annual Report 2013 | | 15 |

STRATEGIC PRIORITIES
The India Imperative
16 Turning the Corner on Trade
With an upswing in the U.S. economy, Canadian exporters and investors should see more opportunities in this important market moving forward. That said, the need to diversify export trade into high-growth emerging markets such as China, Brazil, Mexico and India is still as important as ever. EDC places a huge priority on these regions, as well other breakthrough markets in emerging Asia and the Andean region. In the next two to five years, these are where the biggest opportunities will be. And as a trading nation – these are the markets where Canada needs to grow its international footprint.
HELPING CANADIAN BUSINESS
ACCESS SUPPLY CHAINS IN INDIA

Our Indian infrastructure strategy is designed to help Canadian companies gain access to some of the $1 trillion in planned infrastructure spending there over the next five years, as well as all the secondary subsectors that naturally feed into such a massive building boom.
While an economic slowdown and the upcoming election have delayed some of these key infrastructure projects, there are still huge opportunities to be had in India. Throughout 2013, EDC looked at large Indian portfolio companies with massive supply chain opportunities across the board. We also continued to build relationships with other key Indian buyers through various financing facilities and equity commitments.
Leveraging Relationships to Build Trade
As part of our “connect” strategy, we use certain products, such as investments or financing facilities, to open doors for Canadian companies to access the Indian market by providing targeted financing to Indian buyers. The financing capacity gives us privileged access to senior executives in India, which we can leverage to help raise awareness of Canadian suppliers that could enhance their supply chains and help them grow.
In addition, by investing in equity funds, we can gather market intelligence and identify opportunities at the grassroots level, and help Canadian companies seize opportunities the moment they arise. By the end of 2013 we had facilitated over 140 connections between Indian buyers and Canadian exporters.
For example, last year we concluded a USD 100 million financing agreement with Tata Steel. The transaction marks the second loan that we have provided to Tata Steel, following a USD 100 million loan in 2012, and reflects the increasing Canadian supply into Tata Steel’s supply chain, as well as their operations in Canada.
We also signed an agreement with Aditya Birla Group (ABG), where we will make available up to USD 500 million in financing for the Indian multinational for opportunities that arise out of ABG’s Canadian or international operations.
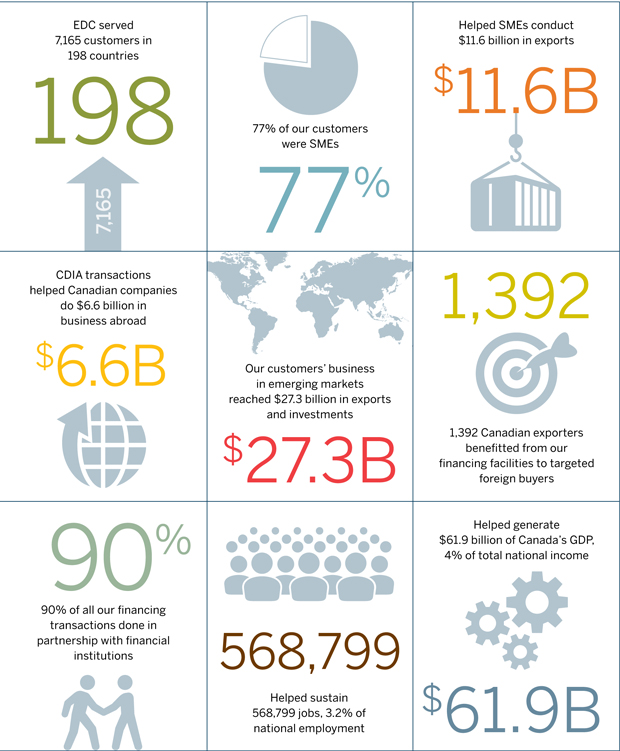
Overall, we helped almost 300 customers conduct close to $2 billion in business in India in 2013.
| | | | |
| | EDC Annual Report 2013 | | 17 |

STRATEGIC PRIORITIES
Bridging the Gaps for Cleantech
18 Turning the Corner on Trade
Our goal with the cleantech sector is to help propel Canadian exporters further into international markets. But for many, accessing lending and insurance is a big hurdle.

As emerging markets such as China, India, Central America and Southeast Asia begin to address their deteriorating environmental conditions, global cleantech revenues are expected to reach $3 trillion by 2020. That means potentially huge opportunities for the more than 700 Canadian SMEs hoping to grow beyond the domestic market.
Our goal with the cleantech sector is to help propel these Canadian exporters further into international markets as global demand grows.
But moving past the development phase can be challenging for these small companies. In fact, accessing lending and insurance can be one the biggest hurdles they face, even when their technology has been commercially proven.
Throughout the year, we were able to help bridge some of these market gaps, and support this trade creation opportunity.
In our first year of this initiative, we set a target of helping seven cleantech
companies, and were able to reach 10. In 2013, we surpassed our goal of helping 20 cleantech companies.
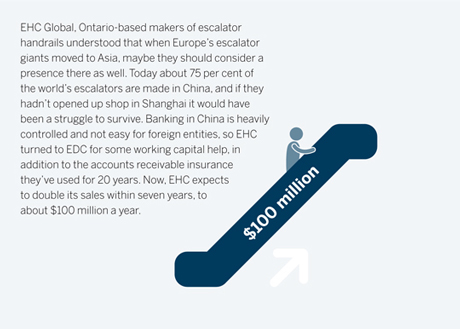
Biorem expands to Asia
One of these companies was Guelph-based Biorem. The company designs, manufactures and distributes high-efficiency air emissions control systems used to eliminate odours, volatile organic compounds and hazardous air pollutants. Biorem has been pursuing cleantech projects around the globe since they first opened their doors in 1991. Over time they’ve expanded considerably and now have operations in China and the U.S.
Like many companies, Biorem was hit hard by the recession. Their main customers at the time were U.S. municipalities and in 2011 and early 2012 business had stalled. However, the company had been diversifying and was already active in Asia, a region in great need of environmental technologies to clean water and air. Last year, they won a contract with China’s Beijing Enterprises
Water Group (BEWG), a massive company focused on water supply and sewage treatment as well as environmental protection. Biorem was sub-contracted to provide the air emissions control systems to BEWG’s Pantai Project, a huge undertaking in Malaysia to build an underground waste treatment plant. Slated for completion in 2015, the first-of-its-kind facility will treat domestic sewage from most parts of Kuala Lumpur City Centre, with leisure parks, sports facilities and a community centre above ground.
EDC helped Biorem – a customer since 2012 – secure the contract by providing a performance bond. This contract should gain Biorem a foothold leading to other water projects with BEWG in the future. In 2013 EDC increased the Account Performance Security Guarantee to $1.35 million to free up their cash flow by providing a guarantee to their bank and help them secure more international projects in the region.
| | | | |
| | EDC Annual Report 2013 | | 19 |

STRATEGIC PRIORITIES
Helping SMEs Access Aerospace Supply Chains
20 Turning the Corner on Trade
With more than 700 companies, and key technology and service clusters across Canada, the aerospace sector is critical to our economy. These clusters are fertile R&D incubators of advanced technology and state-of-the-art production, elements that invariably find their way into other sectors of the economy. Overall, the sector generated estimated total sales of $42 billion in 2013 and employs 37,000 workers.

Canadian companies of all sizes compete have enjoyed success in the global aerospace industry, and many have developed niche products or services while providing products or services to domestic buyers. These companies range from large, anchor companies like Bombardier, CAE, and Pratt & Whitney Canada, to small companies that supply, directly and indirectly, into larger value chains. One such company is EDC customer Elimetal, which supplies machined engine parts to Pratt & Whitney. EDC’s focus is to help Canadian SMEs such as Elimetal penetrate the supply chains of large international players.
In 2013, 122 Canadian companies in the aerospace sector used our services to undertake $5.3 billion in exports and investments. We expect that number to increase significantly moving forward, with Bombardier’s CSeries’ expected first delivery in 2015. To that effect, we set up financing commitments with two purchasers and made financing offers to several potential CSeries buyers. Risk-sharing agreements were also put in place with partners such as Investissement Quebec and the U.K.’s ECA and Export Credits Guarantee Department, bringing more capacity to the airline industry’s purchase of CSeries and less obligor risk for all partners.
Over the next while EDC will be focusing on the 120 Canadian companies across Canada that are supplying goods, services and know-how to the CSeries, as well as other next-generation aircraft platforms. Working alongside BDC and Canada’s banks, we plan to engage with these suppliers, mostly SMEs, and make sure that they have access to the working capital and risk mitigation tools they need.
| | | | |
| | EDC Annual Report 2013 | | 21 |
STRATEGIC PRIORITIES
Creating Trade
| | |
| Wherever possible, we also look for ways to create trade opportunities for Canadian companies. We do so because many Canadian companies don’t have the size or visibility to be included in the procurement plans of large foreign buyers, particularly SMEs. By participating in financing facilities which we call pull facilities, with targeted foreign companies, we can create opportunities for these Canadian suppliers. | | |
How Does a Pull Facility Work?
EDC provides a loan to a targeted foreign buyer with procurement needs that match Canadian expertise, and the foreign buyer commits to working with EDC to buy from Canada.

In collaboration with DFATD and the Trade Commissioner Service, we introduce the foreign buyers to qualified Canadian suppliers primarily through match-making missions.

The foreign buyer procures from Canadian businesses, bringing massive benefits to the Canadian economy.
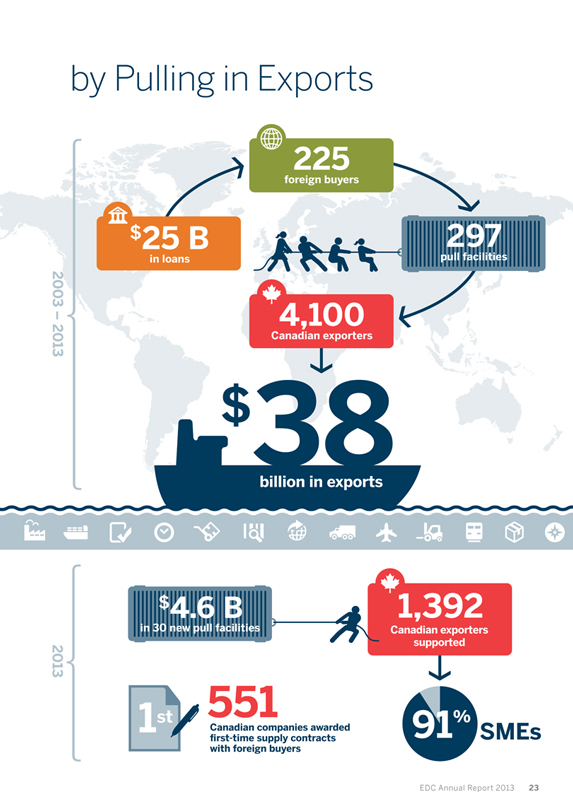
$38 Billion Reasons
Since inception of the pull program in 2003, EDC has concluded 297 pull facilities with 225 foreign buyers in 48 countries. In 10 years, our total pull loans of $25 billion have led $38 billion in exports for more than 4,100 Canadian companies. Of these companies, 93 per cent were SMEs.
Most of these benefits were the result of pulls established three to five years ago – as the relationship with the foreign buyers grows over time, we gain a better understanding of their procurements needs and increased match-making activities results in more ‘traction’ on an individual pull and subsequently more procurement from Canadian suppliers.
1,392 Canadian exporters benefitted in 2013
In 2013, we added 30 new pull facilities with new signings of $4.6 billion. During the past year, 25 pull-related match-making sessions were held with
233 introductions made between foreign buyers and Canadian suppliers. Of the 1,392 exporters supported by these pull facilities in 2013, 91 per cent were SMEs. More to the point, as a result of earlier pulls, in 2013, 551 Canadian companies were awarded first-time supply contracts with foreign buyers.
Who are These Targeted Foreign Buyers?
Mexico’s state-owned petroleum company, PEMEX; China’s transportation specialist, Noble Group; Brazilian energy giant Petrobras; Chile’s state-owned copper company, Codelco; and India’s Tata Group of companies, Reliance Industries Limited and Bharti Airtel Limited, to name a few – all large multi-nationals, with procurement needs that match Canadian expertise.
| | | | |
| 22 | | Turning the Corner on Trade | | |
by Pulling in Exports
2003 – 2013
$25 B
in loans
225
foreign buyers
297
pull facilities
4,100
Canadian exporters
$38
billion in exports
2013
$4.6 B
in 30 new pull facilities
1,392
Canadian exporters supported
1st
551
Canadian companies awarded first-time supply contracts with foreign buyers
91%
SMEs
EDC Annual Report 2013 23

Performance Against Our Objectives
24 Turning the Corner on Trade
Business Measures
| | | | | | | | | | | | |
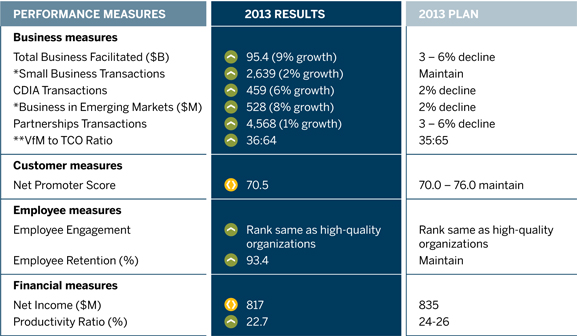
PERFORMANCE MEASURES | | | | 2013 ACTUAL | | | | 2013 PLAN | | | | 2012 RESULT |
Total Business Facilitated ($B) | | | |  95.4 (9% growth) 95.4 (9% growth)
| | | | 3 – 6% decline | | | | 15% decline |
*Small Business Transactions | | | | 2,639 (2% growth) | | | | Maintain | | | | N/A |
CDIA Transactions | | | | 459 (6% growth) | | | | 2% decline | | | | 9% growth |
*Business in Emerging Markets ($M) | | | | 528 (8% growth) | | | | 2% decline | | | | N/A |
Partnerships Transactions | | | | 4,568 (1% growth) | | | | 3 – 6% decline | | | | 9% decline |
VfM to TCO Ratio | | | | 36:64 | | | | 35:65 | | | | 32:68 |
* New measures effective 2013
Ratings in our performance measures are as follows:
| | | | | | | | | | |
 | | Target met or exceeded (> 98% of plan) | |  | | Target substantially met (³ 95% and £ 98% of plan) | |  | | Target not met (< 95% of plan) |
Getting Back on Track
As noted, Canadian exports grew by 3.2 per cent in 2013, and we expect growth to increase another 5 per cent in 2014, a solid step toward a sustained new growth cycle. Throughout the year, we also saw greater risk tolerance and a resurgence of the private sector. In this environment, while our customer’s overall business volumes grew in 2013, the total number of customers we served declined as demand for our products and services continued to return to pre-crisis levels. As such, we continued to focus on areas where we are needed most, such as helping SMEs, supporting Canadian Direct Investment Abroad (CDIA) and helping Canadian companies penetrate high-growth emerging markets, to get ready for the growth that will come.
Overall we served 7,165 customers, whose exports and investments totalled more than $95 billion, a 9 per cent growth over 2012 and above our plan of 3 to 6 per cent decline. Close to 80 per cent were SMEs.
On the Insurance side, we helped 5,298 clients close more than $77 billion in export sales with about 75,607 buyers in 198 foreign markets. The majority of this business was accounts receivable insurance, which helps companies mitigate credit risk and leverage their receivables with financial institutions. This insurance also allows them to offer their buyers more flexible payment options.
Our financing activities delivered a record $18.3 billion in loans to Canadian clients and their foreign trading partners. We earned more than $1.2 billion in loan revenue
and guarantee fees, primarily from $56.7 billion in commercial loans and guarantees to foreign companies in support of our Canadian clients, which includes $14.1 billion of loan advances made in 2013.
We earned $193 million for coverage under our insurance programs and paid out $61 million in claims, in contrast to $358 million in 2012.

| | | | |
| | EDC Annual Report 2013 | | 25 |
PERFORMANCE AGAINST OUR OBJECTIVES
| | | | |
Small Business Transactions Given SME’s impact on Canada’s trade performance, our service offering to small business exporters is an important part of fulfilling our mandate. In keeping with the Government of Canada’s priorities, in 2013 we introduced a Small Business Transactions measure to track our success for this critical segment. We define small businesses as companies with under $10 million in sales. In 2013, we surpassed our plan of 2,588 transactions, reaching 2,639. While the majority of these companies are served under our Accounts Receivable Insurance program, these exporters and their bankers also benefitted from our bonding and guarantee solutions, and targeted financing facilities. Looking ahead, we are making significant technological investments to broaden our service offering to more small businesses. We will continue to work closely with our partners in government so that small Canadian companies can access more international trade expertise, including referrals to the Business Development Bank of Canada (BDC) through our protocol agreement, and collaboration with the Trade Commissioner Service and Canadian Commercial Corporation (CCC). 
| | 
| | $6.6 billion more and more trade and investment going on within and between markets in the region, opening up huge supply chains and spurring further growth. These same regions are also experiencing rapid middle class growth, bringing more domestic consumption, entirely new consumer markets and more opportunities that match Canadian strengths. Our CDIA transactions include loans to help companies open facilities in new markets or participate in joint ventures, and insurance for sales by foreign affiliates of Canadian companies. In 2013, our customers’ CDIA volumes were up over 2012, a good sign that they’re well-postioned for the recovery. Overall, our customers undertook 459 transactions related to their foreign investments in 2013, surpassing our plan of 433. The value of these transactions was $6.6 billion. |
| | Canadian Direct Investment Abroad (CDIA) Transactions Traditionally, CDIA has brought access to resources, markets, value chains and business clusters, but today’s changing global economy is bringing with it even more opportunities and has become increasingly critical to the growth of the Canadian economy. Emerging Asia, for example, is urbanizing at an unprecedented pace, bringing massive infrastructure and related industry opportunities. Trade patterns are changing as well, with | |
| | 
|
| | | | |
| 26 | | Turning the Corner on Trade | | |
Our customers’ business volumes in key emerging markets
| | | | |
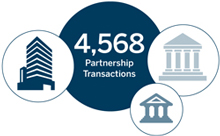
| | Partnership Transactions Working in partnership to combine our expertise and risk capacity is the most efficient way to expand our reach and have a greater impact on more Canadian business. Whenever possible we try to complement the activities of the private sector, such as BDC and private sector financial institutions, insurance companies, sureties and brokers, depending on the level of private sector capacity. For example, when credit is harder to access, we partner with the private sector to provide companies with the capacity they need, and create conditions that will favour the emergence of private sector capacity. Similarly, as the private sector returns, we are generally less needed. In 2013, the number of transactions we conducted with partners surpassed our target and reached 4,568, up slightly over 2012, resulting in $22.8 billion in business for our customers. Furthermore, 90% of our financing transactions were undertaken in partnership with private-sector financial institutions. |
| |
| |
| |
| |
| |
| |
| |
| |
| |
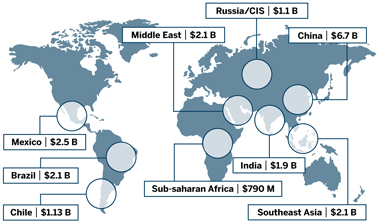
Business in Emerging Markets Growth in emerging markets is expected to outpace the developed world for some time. These regions, which include China, India, Brazil as well as others in emerging Asia, and Andean region countries such as Colombia, where we opened a representation in 2013, represent 30 per cent of our customers’ overall business, and are the markets that Canadian businesses need to penetrate for continued growth. In 2013, we introduced ‘revenue’ as the measurement of our activity in emerging markets, to get a more complete picture of the value we deliver. Revenues represent all premiums, fees and interest on transactions in emerging markets. Last year, our business in emerging markets reached revenues of $528 million in revenue, surpassing our plan. Through our services, our customers’ business in these markets reached $27.3 billion, close to 4 per cent growth over 2012. Of this, $6.7 billion was for business in China, a critical market for Canadian | | businesses moving forward, and up from $6.1 billion in 2012. Our customers also saw growth in other key markets such as the Middle East at $2.1 billion, up 64 per cent from 2012, Chile at $1.1 billion, or 60 per cent growth, Central Europe at $235 million, up 42 per cent, and Russia at $1.1 billion, with 21 per cent growth. Our financing activities to emerging markets, where we have the most impact for Canadian exporters, reached $4.4 billion. Notably, financing volumes headed to the Middle East increased to $790 million, up from $12 million in 2012. Similarly, financing volumes for our customers doing business in Sub-Saharan Africa increased to $95 million, up from $24 million in 2012. | |
| |  |
| |
| |
| |
| |
| |
| | | | |
| | EDC Annual Report 2013 | | 27 |
PERFORMANCE AGAINST OUR OBJECTIVES
| | | | |
Investments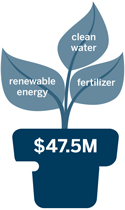 EDC is an active investor in direct venture and growth capital investments and also partner with private-sector fund managers, both domestically and internationally. During periods of constrained credit, this program is particularly helpful to SMEs as it gives them access to the private equity they need to penetrate the global marketplace. Including new commitments of $217 million in 2013, since the inception of the program we have provided commitments totalling $1.1 billion. These include $425 million in commitments to next-generation exporters, $140 million in commitments to mid-market growth exporters and $553 million in commitments focused on connecting with emerging markets. For example, this year we were part of a group of investors that committed $47.5 million in growth equity to cleantech company Anaergia Inc. The new capital will help Anaergia to take advantage of growth opportunities in converting organic waste streams into renewable energy, fertilizer and clean water. With this investment, a larger group of customers, partners and stakeholders will benefit from Anaergia’s compelling environmental and economic value propositions. | | Domestic Financing and Insurance Since 2009 EDC has operated under broadened powers to help increase access to credit for Canadian companies by participating in domestic financing and insurance transactions with private sector financial institutions, insurance providers and the surety industry. These powers were initially assigned to us for a two-year period, then extended for another three years. In 2013, the Government of Canada reviewed and assessed these activities and determined a permanent set of domestic powers, which came into force on March 11, 2014. The revised regulations are designed to allow EDC to participate in trade-enabling domestic transactions and to help make Canadian exporting companies stronger here in Canada. In doing so, we will continue to maximize private-sector participation in domestic trade transactions. In 2013 under this program, we undertook $3.6 billion in commercial solutions for 464 Canadian exporting companies, including $3 billion in direct financing, $54 million in domestic bonding and $506 million in domestic credit insurance. We continued to participate as a reinsurer to private insurers, bringing additional capacity to the market for more than 385 small Canadian companies. $3.6B | | 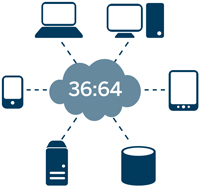
Value for Money to Total Cost of Ownership Ratio Each year, we evaluate how our information technology investments are divided between Value for Money (VfM), investments in IT that increase business performance, and Total Cost of Ownership (TCO), which are the costs of maintaining core business infrastructure and technology assets. While all organizations must determine an optimal level of technology investment based on their needs, our goal is to devote more resources to delivering on VfM objectives while managing TCO. This ratio is calculated using industry best practice in order to make comparisons to others in the industry. In 2013, our result of 36:64 reached our plan of 35:65. 
|
| | IN DOMESTIC COMMERCIAL SOLUTIONS |
| | | | |
| 28 | | Turning the Corner on Trade | | |
Financial Measures
| | | | | | | | | | | | | | |
PERFORMANCE MEASURES | | | | 2013 RESULTS | | | | 2013 PLAN | | | | 2012 RESULT |
Net Income ($M) | | | |  | | 817 | | | | 835 | | | | 1,327 |
Productivity Ratio (%) | | | |  | | 22.7 | | | | 25.9 | | | | 21.3 |
Ratings in our performance measures are as follows:
| | | | | | | | | | |
 | | Target met or exceeded (> 98% of plan) | |  | | Target substantially met (³ 95% and £ 98% of plan) | |  | | Target not met (< 95% of plan) |
Sound financial
management
Our ability to deploy lending and insurance solutions to Canadian global businesses is dependent on our commitment to sound financial management. EDC is financially self-sustaining and does not receive parliamentary appropriations. The income that we generate is applied directly against Canada’s fiscal accounts and it strengthens our capital base. We achieve self-sustainability by containing costs, managing our risks and getting an adequate return on the risks taken. This means we must be able to remain solvent under stressed scenarios, keep a well-capitalized balance sheet and adequate liquidity to meet our financial commitments and have sufficient reserves against future losses. We must also adhere to annual expense and capital budgets, generate an adequate productivity ratio and deliver timely, accurate and informative financial information. All initiatives within EDC’s Business Strategy must be evaluated to ensure they reflect our commitment to fiscal prudence and our long-term viability.

This approach has enabled us to support over $1.2 trillion in exports and investments from the $1.3 billion in share capital invested in us by the Government of Canada since 1944. In 2013 we paid a dividend of $1.44 billion to the Government of Canada. Through sound financial management, we ensure we have an adequate capital base to fulfill our mandate now and in the future. We ended the year with a capital position of $10.2 billion, which provides us with the capacity to help Canadian exporters and investors navigate the current trade environment.
We track our financial performance through two key measures: net income and productivity ratio.
Our net income for 2013 was $817 million, consistent with the 2013 Corporate Plan and $510 million lower than reported in 2012, mainly due to increases in both our provision for credit losses and claims-related expenses.
In order to ensure financial sustainability, we are committed to spending no more than approximately 25 cents of every dollar earned on overhead costs. We measure this through our productivity ratio (PR), the ratio of administrative expenses to net revenue. Our PR of 22.7% was significantly more favourable than the Corporate Plan projection of 25.9%.
Net financing and investment income increased due to higher signings and disbursements as well as lower than planned interest expense. Administrative expenses were $310 million in 2013, 6% below the Corporate Plan, mainly due to changes to actuarial assumptions used to value our pension obligation, a lower than anticipated staff complement and lower depreciation expense. However, when we exclude the impact of reduced pension costs, our administrative expenses become $317 million, 4% below the Corporate Plan. As pension costs can fluctuate from year to year based on assumptions used to value the pension liability, the productivity ratio is based on the pension assumptions used in the Corporate Plan.
| | | | |
| | EDC Annual Report 2013 | | 29 |
PERFORMANCE AGAINST OUR OBJECTIVES
Customer-related Measures
| | | | | | | | | | | | | | |
PERFORMANCE MEASURES | | | | 2013 ACTUAL | | | | 2013 PLAN | | | | 2012 RESULT |
Net Promoter Score | | | | | | 70.5 | | | | 70.0 – 76.0 maintain | | | | 72 |
Ratings in our performance measures are as follows:
| | | | | | | | | | |
 | | Target met or exceeded (> 98% of plan) | |  | | Target substantially met (³ 95% and £ 98% of plan) | |  | | Target not met (< 95% of plan) |
We measure our success in customer satisfaction and loyalty through a Net Promoter Score (NPS) – an industry standard for measuring customer opinion. By collecting data on how well we are servicing the needs of our customers, we get a good indication of customer referral, loyalty and retention.
We collect the data by a series of surveys of active customers that asks: “On a scale of 0 to 10, with 0 being not at all likely and 10 being extremely likely: How likely is it that you would recommend EDC to a colleague who is also an exporter?” The NPS is a calculation based on the percentage of customers who are “Promoters” (9s and 10s) minus the percentage of customers who are “Detractors” (0s through 6s).

Our NPS for 2013 shows that the majority of our customers would be likely to refer us to partners and associates. As the effects of the financial crisis dissipate and additional capacity returns to the market, our customer satisfaction is returning to levels witnessed in the periods of 2006 to 2009. For us this represents an opportunity to do more for our customers. In 2013 we started looking at how we can reduce barriers and make our processes easier for companies to do business with us.
To that effect, in 2013, we focused on developing comprehensive solutions to replace our Export and Domestic Supplemental Insurance. This will provide capacity to private sector insurers, allowing them to better serve the needs of Canadian customers and reach potential exporters who do not currently use credit insurance. Moving forward, we plan to make things easier for our customers to do business with us by modernizing our information technology systems, which are critical to delivering timely solutions for our customers.
| | | | |
| 30 | | Turning the Corner on Trade | | |
Employee Measures
| | | | | | | | | | | | | | |
PERFORMANCE MEASURES | | | | 2013 RESULT | | | | 2013 PLAN | | | | 2012 RESULT |
Employee Engagement | | | | | | Rank same as high-quality organizations | | | | Rank same as high-quality organizations | | | | Rank higher than high-quality organizations |
Employee Retention (%) | | | | | | 93.4 | | | | Maintain | | | | 93 |
Ratings in our performance measures are as follows:
| | | | | | | | | | |
 | | Target met or exceeded (> 98% of plan) | |  | | Target substantially met (³ 95% and £ 98% of plan) | |  | | Target not met (< 95% of plan) |
| | | | |
Planning for our future labour force Canada’s population is aging and with labour markets expected to tighten significantly in the coming years, highly skilled labour will be in short supply. In 2012, we completed a comprehensive examination considering the future of work, our evolving business environment as well as workforce and legislative trends, in order to continue to provide the best possible service to Canadian exporters and investors. With this information in mind, in 2013 we focused on strategic workforce planning to ensure that we have the right people with the right skills in the right place at the right time to support the organization’s strategy both now and in the future. Strategic workforce planning includes the following key steps: identifying key roles that drive the business; environmental scan; review of current and future state; gap analysis and action planning. In 2013, a core working group was established and received training on the Human Capital Institute | | framework for strategic workforce planning. This framework was piloted with the Human Resources and Communications Group at EDC. In 2014, strategic workforce planning will be undertaken for the Credit Insurance Transformation project and for one other line of business area. In 2012 we created a resiliency pool of employees, where certain employees temporarily leave their positions in order to focus on key challenges such as trade creation opportunities or high priority projects. In 2013, the pool grew from 15 to 30 employees. The majority of the resiliency pool assignments are focused on the delivery of our major transformational projects. | | Organizational and Employee Development In 2013 we placed an emphasis on enhancing organizational and employee development. This included offering training to our leaders on leadership essentials and launching a team pulse check to gather feedback from employees to gauge the health and work climate of teams across the organization. For employee development, we completed orientation and onboarding for new employees and launched a personal effectiveness and productivity series to support skill development, increase productivity and support career growth. |
| | 
|
| | | | |
| | EDC Annual Report 2013 | | 31 |

Corporate Social Responsibility
As part of our global community investment partnership with CARE Canada, in 2013 we sent EDC volunteers to Peru, Zambia and India to lend their expertise in various enterprise development projects.
32 Turning the Corner on Trade
Delivering value for our customers also involves carrying out business in the socially responsible manner that Canadians expect. For us, Corporate Social Responsibility (CSR) is more than just compliance with policy or regulation; it is the integration of values such as honesty, respect, fairness and integrity into our daily business practices. We believe that good business – adopting and embracing these principles while we facilitate trade for Canadian investors and exporters – is good for business.
CSR SCORECARD
| | | | | | | | |
PRIORITY | | | | ACTIVITY | | | | IMPACT |
Promoted consistent applications of International Standards | | | | Hosted OECD Practitioners’ Meeting Played a key role in final revisions to the Equator Principles (EP), released in 2013, which guide how the financial industry looks at the environmental and social impacts of large infrastructure projects. | | | | Helped achieve greater consistency among financial institutions in the application of the EPs. |
Combatting Corruption | | | | In light of our new domestic powers, and revisions to the Corruption of Foreign Public Officials Act, we reviewed our anti-corruption program experience to better understand how we approach anti-bribery and corruption. This included strategic thinking about our obligations, strengthening our anti-corruption declarations, and a review of higher risk sectors to appropriate action and approaches. Undertook an intensive effort related to enhanced due diligence into cases where counterparties faced allegations of corruption. This included extensive discussions with those firms to understand personnel, policy and procedural changes made to prevent, detect and deter such incidents. Presentations to management, staff and EDC’s Advisory Council on CSR by a multinational company that faced and overcame a corruption conviction. | | | | Deployed our expertise to help exporters strengthen their due diligence procedures and anti-corruption programs. Insulated EDC from the risk of supporting transactions involving bribery. Raised awareness among EDC staff on the risk of corruption and necessary actions to ensure ethical conduct. |
Advancing the India infrastructure initiative from a CSR standpoint | | | | Conducted market visits to partners in India, in order to better connect with actual or potential EDC customers, convey our expectations and understand how we can meet our CSR standards in infrastructure projects. | | | | Promoted EDC’s CSR standards to Indian companies and local and foreign banks. Developed an understanding of how key players approach CSR and identify which companies can likely ensure our CSR standards will be met. |
| | | | |
| | EDC Annual Report 2013 | | 33 |
CORPORATE SOCIAL RESPONSIBILITY
Strategic CSR Management
In some ways, financial and insurance products have outpaced the development of international standards, and the role of CSR within new insurance products and financing structures is not always clear. For example, loans that directly finance an investment project, such as the creation or major expansion of infrastructure, are benchmarked by EDC against the OECD Common Approaches, our Environmental and Social Review Directive or the Equator Principles. However, other products, such as accounts receivable insurance and general corporate loans, that are typically used to repay debt or for capital and operating expenditures, do not have similar benchmarking standards. As such,
in 2013 we undertook an initiative to help us clarify our CSR values and risk thresholds for these other kinds of financing and insurance instruments in order to improve predictability for our customers about our risk appetite for business activities using these kinds of products.
Human Rights
Throughout the year, we refined our methodology to integrate human rights into a common CSR risk rating methodology for non-project transactions, and increased our internal human rights due diligence training. The dialogue on human rights and the implementation of the UN Guiding Principles (GP) on Business and Human Rights continues to evolve. Throughout the year we contributed to the technical human rights related work of OECD Export
Credit Agencies and the Equator Principles Financial Institutions.
EDC is also an active member of the Equator Principles Social Working Group and a member of the EP Steering Committee and was heavily engaged in finalizing the revised Equator Principles with new references to human rights and the UN GPs. EDC also hosted the 26th meeting of the OECD Environmental and Social Practitioners and organized a panel of speakers on human rights, including the IFC and nongovernmental organizations as well as ECAs to share current practices. EDC presented its own practices on Human Rights at several conferences such as the International Association of Impact Assessment and the IFC’s Community of Learning for Financial Institutions.
| | | | |
 | | We also produce a Corporate Social Responsibility Annual Report which provides more comprehensive details on our CSR programs and initiatives. The 2013 CSR Report is slated for release online in May 2014. Please see www.edc.ca/csr. | | |
| | | | | | | | | | | | |
“ | | The CARE partnership is a unique opportunity for EDC employees to make a meaningful contribution in the markets where we do business. As someone who has just returned from Zambia where I spent four months documenting CARE’s programs and learning about development, I can confidently say it’s a win-win for both organizations. | | “ | | During our time here, we were able to help CARE fill a lot of the gaps with our unique skills and experience and, more importantly, I think we contributed by bringing a new perspective to the operations and programming. | | |
| | Kat Pipin, EDC volunteer for CARE Zambia | | ” | | | | Bruce Dunlop, EDC volunteer for CARE Zambia | | ” | | |
| | | | | | | | | | |
34 Turning the Corner on Trade | | | | | | | | | | |
| | | | |
INVESTING IN OUR GLOBAL COMMUNITIES 
|
Beyond Exports: EDC and CARE Canada One of the community investment initiatives we’re most proud of has been our five-year partnership with CARE Canada, Beyond Exports, where we have been helping CARE’s efforts to assist small, business development projects around the world. In each year of this program, we invest $170,000 and assign EDC employees to lend their expertise to various CARE enterprise development projects around the world. | | In 2009, our first two volunteers were assigned to Peru, where they coached several micro-agricultural businesses. Since then, we have sent 18 volunteers to continue the work in Peru, as well as CARE Zambia, CARE India and head office in Ottawa. In 2013, the 5th anniversary of the program, we negotiated a new agreement to continue the program. We also sent four volunteers to Zambia, Peru and India. | |  |
| | | | | | | | | | | | | | |
“ | | I applied for the position with CARE India because I always wanted to work in a humanitarian organization, but never thought there was a possible match between my skill-set and that required for a job in international development. It was pretty rewarding to discover that I could make a difference. | | | | “ | | For the project I worked on to be successful, I quickly realized that the Peruvian entrepreneurs must be able to get the technology and possess the technical tools. That’s where I stepped in. CARE gave me the mandate to develop a business plan that could be used by companies wishing to obtain micro-financing or a public-private partnership in order to maintain and grow their operations. It was gratifying to pass on a skill set that will serve them well moving forward. | | |
| | Claudia Verno, EDC volunteer for CARE India | | ” | | | | | | Andrea Rodriguez, EDC volunteer for CARE Peru | | ” | | |
| | | | | | | | | | | | |
| | | | | | | | |
| | EDC Annual Report 2013 | | 35 | | | | |
Investor Relations
Markets are reacting to recent changes in U.S. monetary policy as it begins to gradually reduce its quantitative easing program. This has led to volatility in long-term yields in the U.S. and many other economies.
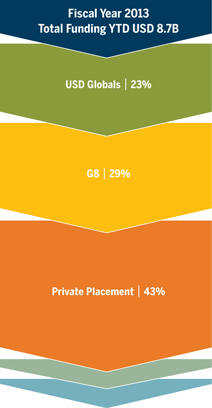
Funding
By the end of 2013, EDC borrowed USD 8.7 billion. We were active with benchmark bond issuance this year. We issued a 400 million Australian Dollar five-year benchmark bond and then increased it by 350 million. EDC was active in the New Zealand Dollar market and issued a 350 million five-year benchmark bond, increased it by 150 million and tapped it a second time for an additional 100 million. We also issued a 350 million British Pound three-year bond and increased
the bond by an additional 100 million. US Dollar Global benchmarks form a large part of our funding program and we issued two USD 1 billion Global benchmarks (three-year and five-year). There was strong interest for private placements and we responded to investor’s needs.
This year, we also issued our first one-year Chinese Yuan-denominated bond, and raised 100 million Yuan through a sale of 2.1 per cent notes due July, 2014. EDC’s Treasury is now poised for future Renminbi opportunities in support of our exporters and investors.
Structured Notes | 3%
Emerging Markets | 2%
| | | | |
| 36 | | Turning the Corner on Trade | | |
| | | | | | | | | | | | | | | | |
RISK RATING | | | | DOMESTIC | | | | FOREIGN CURRENCY |
| | | | | Long-term | | | | Short-term | | | | Long-term | | | | Short-term |
Moody’s | | | | Aaa | | | | P-1 | | | | Aaa | | | | P-1 |
S & P | | | | AAA | | | | A-1+ | | | | AAA | | | | A-1+ |
DBRS | | | | AAA | | | | R-1 (high) | | | | AAA | | | | R-1 (high) |
JCR | | | | AAA | | | | – | | | | AAA | | | | – |
Zero per cent BIS risk weighted according to Basel II guidelines.
Looking Ahead
In 2014, the forecasted funding requirements are USD 10 billion. Given the size of our borrowing program, we will look for opportunities to issue benchmark transactions in all major currencies including British Pounds, Australian Dollars, New Zealand Dollars and U.S. Dollars. We will continue to offer the following types of bonds: Globals, G8 currencies, Structured Notes, Private Placements and Emerging Currency Notes. In keeping with EDC’s Cleantech initiative, we also plan to issue an inaugural Green Bond in 2014, and will give preference to investors with a green mandate.
Based on the projected cash requirements for 2014, we expect the range for commercial paper outstanding to be between USD 5 and USD 7 billion.
Sovereign, Supranational and Agency (SSA) issuers, including EDC, will face the uncertainty and potential of rising interest rates. This will affect the tenor that investors want and could constrict issuers’ funding options. EDC believes it can meet its larger funding requirements as it remains one of the most sought-after names in the SSA market.
Credit Credentials
Our bonds are the full faith and credit obligations of the Government of Canada. The ratings reflect our status as an agent of her Majesty in right of Canada and EDC’s 100 per cent ownership by the Government of Canada. We service our debt from our own resources and our borrowings are the Government of Canada’s full obligations, with access to the Consolidated Revenue Fund (the government’s primary account) ensuring timeliness of payment. Throughout our history, this mechanism has never been needed.
| | | | |
| | EDC Annual Report 2013 | | 37 |
2014 Strategic Objectives
| | | | | | |
The following is an overview of the business strategy and performance measures of the 2014-2018 Corporate Plan. A summary of the Plan is available at www.edc.ca | | |
2014 SCORECARD AND KEY MEASURES OF SUCCESS AND PLANNING | | The Planning Environment While some risks remain, momentum is slowly building in the world economy, largely a result of resurgence in the U.S. Furthermore, as emerging markets’ growth continues to outpace the developed world, we’re also seeing changing trade patterns, with the growth of South-South trade, as well as changing global demographics, with emerging markets and their younger populations and growing middle class consumers presenting many opportunities for Canadian companies. Within this context, conditions are set for better performance for Canadian exports over the planning period, and exports of goods and services are expected to rise by 5 per cent in 2014. That said, projected growth rates indicate that Canada is still losing market share in emerging markets relative to our key OECD competitors. Maintaining market share will require much stronger growth for exports and foreign affiliate sales moving forward. |
PERFORMANCE MEASURES | | | | 2014 PLAN | |
Customer-related Measures | |
Net Promoter Score | | | | 67.0 – 73.0 | |
| | | | | |
Business Measures | |
Total Business Facilitated ($B) | | | | 0 – 3% growth | |
Business in Emerging Markets ($M) | | | | 0 – 3% growth | |
CDIA Transactions | | | | 0 – 3% growth | |
Partnerships Transactions | | | | 0 – 3% growth | |
Small Business Transactions | | | | 0 – 3% growth | |
| | | | | |
Financial Measures | |
Productivity Ratio (%) | | | | 24 – 26 | |
| | | | | |
| | | | | |
| | | | | |
| | | | | |
| | | | | |
| | | | | |
| | | | | |
| | | | | |
| | | | | |
| | | | |
| 38 | | Turning the Corner on Trade | | |
The Business Strategy
Our business strategy for the period 2014-2018 is focused on executing the initiatives launched in the last two years. The strategy also reviews emerging trade opportunities that could give rise to future initiatives. We will also be focusing our efforts on SMEs. Our priority remains to invest our resources where they will have the greatest impact on Canada’s trade competitiveness. The 2014-2018 Business Strategy is built around two fundamental strategic objectives:
| | |
 | | Trade Facilitation – This continues to be our core business. We have over the years developed an offering of effective services and solutions, which we will continue to adapt and improve as the reality Canadian companies face continues to evolve. |
| | Trade Creation – We also have a critical role to play in identifying opportunities that Canadian companies would not otherwise be aware of or able to access, and will leverage our expertise to create trade opportunities for Canadian companies. |
A Partnership-Preferred Approach
Our Partnership-Preferred Philosophy means that whenever possible, we will use our financial capacity in a manner that is complementary to the products and services of private-sector financial institutions. In particularly challenging markets or sectors, we will use our capital strength without other financial players but will, where relevant, look to create conditions that will favour the participation of the private sector. Looking ahead, we are committed to working with the private sector to ensure that Canadian companies have access to the financial services they need to grow internationally.
This will include continuing the Lending Practitioners’ Forum, a joint consultative body with Canada’s private financial sector. In the insurance sector, we will continue to participate in the Credit Insurance Advisory Group (CIAG), a Government of Canada-led initiative, and one of the most important ways we maintain and grow our partnership with private sector credit insurers. We are also an active member of the newly created Receivables Insurance Association of Canada.
Corporate Social Responsibility
Our commitment to CSR is founded on our goal to meet the expectations of Canadians to act as a good corporate citizen, upholding Canada’s values both at home and abroad, while ensuring that Canadian businesses benefit from international business opportunities. Looking forward, we will continue our efforts to raise awareness among Canadian exporters about the risks of corruption and bribery in international markets and use our expertise to help exporters strengthen their due diligence procedures and anti-corruption programs. We will also work with our peers to promote a more consistent application of international standards for assessing environmental and social risk, to ensure that Canadian exporters and investors have a level playing field with their international competitors.
| | | | |
| | EDC Annual Report 2013 | | 39 |
2014 STRATEGIC OBJECTIVES
Focus on Small
Business Exporters
Given their impact on Canada’s trade performance, our service offering to small business exporters is an important part of our mandate. This segment, which we define as companies with under $10 million in annual sales, is our largest customer base. Looking ahead, we are expanding our current range of solutions for this segment. This will include introducing a new online single buyer insurance product, focused on helping small exporters that need a simple and fast solution to protect them against buyer default. We will also introduce a small business growth financing program to help small businesses to get the credit they need to grow to the next stage.
We will also be making changes to our Guarantee Program, targeted at better serving SMEs and ensuring a level playing field with foreign competitors.
Trade-creating Initiatives
Two years ago we identified three trade-creating initiatives that represent significant growth potential for Canada. We continue to focus on the execution of these initiatives in 2014. The first is aerospace. By providing buyer financing for the early years of Bombardier Inc.’s CSeries program, we have been helping Canadian suppliers along the aerospace industry supply chain, positioning them to serve not only the CSeries, but other leading players in
the industry as well. We have placed an emphasis on making sure that SMEs have the resources to integrate into these supply chains. As the program matures and the aircraft’s acceptance grows, we will work to bring in additional capacity from the private sector.
Secondly, we will continue to create opportunities for clean technology companies, and focus on helping early stage cleantech companies to move past the development stage to a viable commercial state where they can penetrate key global markets.
Finally, we will continue to help Canadian exporters and investors access opportunities in India’s infrastructure sector. We are now well into the process of executing this strategy, which leverages our project finance participation and direct project equity to pull Canadian exporters and investors into the market. In 2014, subject to Government of Canada approvals, we will investigate augmenting our on-the-ground knowledge of local bidding and procurement practices, financing structures, CSR requirements, and regulatory and technical assessment capabilities, with a view to opening a subsidiary in India to conduct rupee-lending activities.
In addition to these three initiatives, we are continuing to mobilize for high-growth areas identified in the 2013 - 2017 Corporate Plan, including oceans, natural resources, and preparing for potential new growth areas, such as healthcare and Africa.
Changes to EDC’s Offerings
We have undertaken a Credit Insurance Transformation project, which will significantly change the way we do business with SMEs in the insurance space, helping us serve more small business customers and also enhancing partnerships with the private sector. This project will involve a major investment in new technology, which will make EDC easier and faster to deal with and allow us to improve our customers’ experience. We will implement the project over the next five years.
Additionally, we plan to grow the size of our investments program and will expand our domestic investments portfolio in early stage SMEs to enhance their chances of success in this challenging space.
Prudent Risk Management and Financial Sustainability
Our business activities expose us to a wide variety of risks, and an unpredictable planning environment requires us to exercise prudent risk management in order to remain flexible during volatile times. As such, we will willingly “stretch” or take risks that are commensurate with expected benefits, and manage these risks by ensuring that our business activities and transactions provide an appropriate balance of return for the risks assumed.
| | | | |
| 40 | | Turning the Corner on Trade | | |
Measuring Success
We track our performance against our strategic objectives presented in the Business Strategy through our Corporate Scorecard, and the following measures.
Total Business Facilitated
This measure provides an order of magnitude of the business Canadian companies carry out with the help of our solutions. For 2014 we anticipate growth in the range of 0-3 per cent predicated on continued growth in the U.S. economy and strong growth forecasts for sectors including energy, forestry, industrial machinery and equipment, and aircraft and parts. The counterbalance to this growth will be continued weakness in some core markets for exporters and softness in commodity prices.
Business in Emerging
Markets (BEM)
To provide a more complete picture of the value we deliver to Canadian companies in emerging markets, in 2013 we introduced revenue as the base for measuring our activity in these markets. Revenue derived from all programs count towards BEM and is defined as the accounting revenue reported on the income statement earned during the calendar year through premiums, fees and interest on transactions in emerging markets. In 2014 we anticipate growth in the 0-3 per cent range.
Small Business Transactions: Helping Small Business Exporters Compete Internationally
In 2013 we introduced a Small Business Transactions measure. In 2014 we anticipate growth in the 0-3 per cent range based on the continued strength in private sector capacity and continued decline in the number of new exporter entrants as forecasted by Statistics Canada. These declines will be offset in part by our focus on SME exporters, including targeted marketing initiatives and new product offerings noted in the Plan.
Canadian Direct Investment Abroad (CDIA) Transactions
As the global economy continues to integrate, CDIA is becoming increasingly critical to the health of the Canadian economy. In 2014 we are forecasting growth of 0-3 per cent as we expect to maintain existing customers and see some increase in demand for our products. We will continue our partnership strategies with banks and brokers, which we expect to result in new CDIA customers.
Partnership Transactions
Our ability to serve Canadian companies is enhanced by partnering with both public and private sector players.
In 2014 we forecast growth in the 0-3 per cent range. Growth may be on the lower end of this range as a result of increased liquidity in the market.
Net Promoter Score
The Net Promoter Score (NPS) is the measure against which we evaluate our customer satisfaction and loyalty. NPS measures our reputation and the likelihood that our customers would recommend EDC to business colleagues. For 2014 we anticipate the range to fall between 67.0 - 73.0. We will direct our focus to creating a better customer experience, such as improving the ease of doing business with EDC.
Productivity Ratio
Our Productivity Ratio captures, in aggregate form, how well we use our resources. It is the ratio of administrative expenses to net revenue. We try to ensure our productivity ratio remains between 24 and 26 per cent.
| | | | |
| | EDC Annual Report 2013 | | 41 |
Board of Directors
Norman M. Betts
Fredericton, New Brunswick
First appointed to EDC’s Board of Directors in 2007, Dr. Betts was reappointed for a second term in February, 2010. Dr. Betts has an extensive record of public service. As the MLA for Southwest Miramichi, he served the people of New Brunswick as Minister of Finance from 1999 to 2001 and Minister of Business New Brunswick from 2001 to 2003. Dr. Betts is currently an associate professor with the Faculty of Business Administration at the University of New Brunswick and sits on several other Boards of Directors including New Brunswick Power Holdings and Tembec Inc. He holds a PhD in Management from Queen’s School of Business and is a Chartered Accountant.
Jacques Boivin
Quebec City, Quebec
Mr. Boivin was first appointed to EDC’s Board of Directors in March 2009 and was reappointed for a second term in October 2012. A lawyer with Levis, Quebec’s Ksa, avocats, s.e.n.c.r.l. and at Trois-Rivičres, Quebec at Les notaires Leblanc, Martin & Associés conseillers juridiques, inc. Mr. Boivin specializes in mergers and acquisitions, sales and financing, as well as bankruptcy and insolvency. He has also served as an instructor at the École du Barreau du Québec. Mr. Boivin is a member of the Barreau du Québec, the Canadian Bar Association and INSOL International. In addition to his law practice, Mr. Boivin is active in his community and serves on boards of organizations that support education and health services.
Jeff Burghardt
Oakville, Ontario
Mr. Burghardt was first appointed to EDC’s Board of Directors in June 2008, and was reappointed for a second term in March 2012. Mr. Burghardt worked in the agricultural industry for more than 30 years, including 12 years as President and Chief Executive Officer of Prince Rupert Grain Ltd. and as Chair of the Northwest Corridor Development Corporation. A leading advocate for his region, Mr. Burghardt has served as an industry advisor to both federal and provincial governments on issues surrounding transportation, economic development and investment. Mr. Burghardt now resides in Oakville, Ontario and provides advice to a number of Canadian exporting firms.
Adam Chowaniec
Ottawa, Ontario
Dr. Chowaniec was first appointed to EDC’s Board of Directors in April 2008 and was reappointed for a second term in December 2011. Currently Chairman of the Board of Directors of Solantro Semiconductor Inc., he has chaired numerous companies and held executive positions at Bell Northern Research, Nortel Networks, Commodore International and Calmos Systems. Dr. Chowaniec is the Founding Chair of Startup Canada. He was the founding CEO of Tundra Semiconductor Corporation in 1995. From 2006 to 2008, he was Chair of the Ontario Premier’s Research and Innovation Council. He currently serves as the Chair of the Private Sector Advisory Board of the National Centres of Excellence. He has been widely recognized for his leadership, business excellence and innovation, and was named Business Person of the Year by the Ottawa Chamber of Commerce in 1999.
Herbert M. Clarke
St. John’s, Newfoundland
Mr. Clarke was appointed to EDC’s Board of Directors in 2009 and was reappointed for a second term in October 2012. He has substantial private and public sector experience in areas of public policy and industry-government relationships, particularly as it relates to natural resource development and environmental assessment. Mr. Clarke is president of HMC Associates Ltd., a private consulting and investment firm. Previously, he served as Newfoundland and Labrador’s Clerk of the Executive Council and Secretary to Cabinet, and in senior executive roles in the mining and fishing industries. Mr. Clarke has been a board member of the Canada-Newfoundland Offshore Petroleum Board, founding Chairman of the Fisheries Resource Conservation Council, Public Review Commissioner for a major offshore oil and gas project and Co-Chair of the Joint Review Panel for the Lower Churchill Hydroelectric Generation Project.
Linda M. O. Hohol
Calgary, Alberta
Ms. Hohol’s first appointment to EDC’s Board of Directors was in 2007. She was reappointed for a second term in February 2011. Ms. Hohol was appointed Vice-Chair of the Board in December 2012. With significant experience in the financial sector and expertise in venture capital financing and wealth management, Ms. Hohol was President of the TSX Venture Exchange from 2002 to 2007, after a long career with CIBC, which included a position as Executive Vice-President of Wealth Management. She is currently a Director on the boards of NAV Canada, Canadian Western bank and EllisDon Construction and has served as a Director of many non-profit and private sector corporations.
| | | | |
| 42 | | Turning the Corner on Trade | | |
Vik Khurana
Toronto, Ontario
Mr. Khurana was appointed to EDC’s Board of Directors in April 2013. He is the founder and CEO of Prudential group of companies, which constitute two Toronto-based companies, and has interests in other Asia-centric businesses. Prior to becoming an entrepreneur, Mr. Khurana worked with Toronto Dominion Bank in Commercial Credit. He has served on the boards of numerous multinational companies and non-profit organizations and is currently a board member of the Asia Pacific Foundation of Canada (APFC), Canada Post Foundation, and Advisory Board of the Indo Canada Chamber of Commerce. He is also a member of the Canada India CEO Forum. Mr. Khurana is an engineering graduate from India and holds a Master in Business Administration from St. Mary’s University in Halifax.
Elliot Lifson
Montreal, Quebec
Elliot Lifson was appointed to EDC’s Board of Directors in March 2012. Mr. Lifson is President of the Canadian Apparel Federation and Vice-Chairman of Peerless Clothing Inc., and serves as a Director for several associations and councils. Mr. Lifson is Past Chairman of the Board of the Montreal Board of Trade and currently serves in an advisory capacity. Mr. Lifson is a Professor at the Desautels Faculty of Management at McGill University and was recently nominated to the Quebec Government’s Export Québec. Mr. Lifson is the Co-Chair of Montreal’s 2014 Centraide (United Way) Campaign. He is a graduate in Law from the Université de Montréal, a
member of the Quebec Bar and received his MBA from the Ivey School of Business, University of Western Ontario.
Donald A. Macleod
Dartmouth, Nova Scotia
Mr. MacLeod was first appointed to EDC’s Board of Directors in 2008 and was reappointed in December 2011. Currently serving as Vice-President and General Manager for J. Ray McDermott Canada, Ltd., Mr. MacLeod has held senior management positions within the organization and its predecessor since 1989. He has extensive involvement in commercial transactions in Canada and internationally within the shipping and offshore oil and gas sector. Mr. MacLeod is chair of the Shipowners’ Mutual Protection and Indemnity Association (Luxembourg), and holds positions on several of its affiliates and management committees. He is a member of the Nova Scotia Barristers’ Society.
Jeffrey Steiner
Toronto, Ontario
Mr. Steiner was appointed to EDC’s Board of Directors in December 2010. Before establishing New Franchise Media in 2010, Mr. Steiner served approximately seven years as president and chief executive officer of the Toronto Economic Development Corporation (TEDCO), and three years as a board member of the Alcohol and Gaming Commission of Ontario. Mr. Steiner currently serves as Chair of the Governance Committee on the Board of Directors of the Ontario Centres of Excellence Inc., which oversees government investment in the commercialization of university R&D through industry-academic collaboration and venture capital finance. He is an active member of the Young Presidents’ Organization (YPO) Toronto Chapter and the Institute of Corporate Directors with an ICD.D designation.
Darlene Thibault
Laval, Quebec
Ms. Thibault was appointed to her first term on EDC’s Board of Directors in January 2010 and was reappointed in February 2013. Ms. Thibault has been the Director and Group Lead Eastern Canada and Quebec at the Bank of Nova Scotia since 2005, where she is responsible for Credit Lease Scotia and the Immigrant Investor Program in the Quebec region. Her 20-year career in the financial industry has included positions at HSBC Bank as a Senior Manager, the Bank of Montreal, Bombardier Capital Ltd as Canadian Commercial Credit Manager, AT&T Capital Canada Inc. and Pitney Bowes Leasing.
Kevin Warn-Schindel
Toronto, Ontario
Mr. Warn-Schindel was appointed Chairman of EDC’s Board of Directors in June, 2013. An investment management executive with extensive experience in global capital markets, he is Group Head and Managing Director of OPTrust Private Markets Group. Prior to joining OPTrust in 2004, he held senior positions with Macquarie Bank Limited, an Australian investment bank, and RBC Capital Markets, the wholesale investment banking arm of the Royal Bank of Canada.
| | | | |
| | EDC Annual Report 2013 | | 43 |
Executive Management Team

Left to right: Back row: Catherine Decarie, Clive Witter, Derek Layne, Benoit Daignault, Rajesh Sharma Front row: Jim McArdle, Pierre Gignac, Ken Kember
Benoit Daignault
President and CEO, effective February 2014
Senior Vice-President, Financing and Investments, January 2013 to February 2014
Benoit Daignault was appointed President and CEO on February 5, 2014. Prior to this appointment, Mr. Daignault served two years as Senior Vice-President, Financing and Investments, where he led EDC’s global investments and debt financing operations including project and structured finance, commercial lending as well as corporate and asset-back lending. He joined EDC in 2004 as Senior Vice-President, Business Development. Previously, Mr. Daignault spent more than 10 years with General Electric Capital, where he held increasingly senior positions in Canada and the U.S. Mr. Daignault has a Baccalaureat in Business Administration from l’École des Hautes Études Commerciales in Montreal and is a CFA Charterholder. He completed the Proteus program of London Business School and the Senior Executive Program of Columbia University.
Catherine Decarie
Senior Vice-President,
Human Resources And Communications
Catherine Decarie was appointed Senior Vice-President, Human Resources and Communications in August 2013. She is responsible for developing EDC’s strategy to attract, engage and develop the employees who deliver on EDC’s vision and business objectives. After earning her BA from Mount Allison University, Ms. Decarie pursued an LL.B. from Queen’s University and was called to the Ontario Bar in 1996. She articled with McCarthy Tetrault and has held numerous legal and human resources positions within the Toronto head office of a national retailer. She has served at EDC since 2001, rising to the position of Vice-President, Organizational & Employee Development before taking on her current role as a member of the Executive team. Ms. Decarie is a member of the Law Society of Upper Canada and sits on the Board of the Boys and Girls Club of Ottawa.
| | | | |
| 44 | | Turning the Corner on Trade | | |
Pierre Gignac
Senior Vice-President and Chief Risk Officer,
Enterprise Risk Management
Acting President, June 2013 to February 2014
On June 3, 2013, Pierre Gignac was appointed by EDC’s Board of Directors to serve as Acting President, which he held until Benoit Daignault was appointed President and CEO in February 2014. Mr. Gignac then reassumed his previous position as Senior Vice-President and Chief Risk Officer, Enterprise Risk Management. Prior to that, he served as Senior Vice-President, Insurance since January 2004. Mr. Gignac joined EDC in April 1999 as Director, Claims and Insurance Accounting and later moved to Vice-President, Insurance and Loans Services and then Vice-President, Short-term Credit and Risk Assessment. Prior to joining EDC, Mr. Gignac held senior posts during his 14-year career at Metropolitan Life Insurance Company. Mr. Gignac is a Fellow of the Society of Actuaries, Fellow of the Canadian Institute of Actuaries, and a Chartered Financial Analyst. He is a graduate of Columbia University’s Senior Executive Program and from Laval University in Quebec City.
Ken Kember
Senior Vice-President,
Finance & Chief Financial Officer
Ken Kember was appointed Senior Vice-President, Finance, and Chief Financial Officer in 2009. Mr. Kember leads the Finance organization, which includes Treasury, Corporate Finance & Control, Loans Services and Corporate Services. Mr. Kember has held various positions of increasing responsibility in the Finance Group, and served as Vice-President and Corporate Controller for five years before taking on his current role. Prior to joining EDC in 1995, he was a senior manager in the Accounting and Audit Group of PricewaterhouseCoopers in Ottawa. Mr. Kember holds a B.A. and a Master of Accounting degree from the University of Waterloo, and is a Chartered Accountant and Certified Management Accountant. He also serves on the board of the National Capital Region Chapter of Financial Executives International. Mr. Kember is a graduate of Columbia University’s Senior Executive Program.
Derek Layne
Senior Vice-President,
Business Solutions Innovation
Derek Layne was appointed Senior Vice-President of the Business Solutions Innovation Group in December 2011. In this capacity Mr. Layne is responsible for managing the technology platforms, information systems, as well as the centres of expertise for business intelligence, process and program support that enable EDC’s operations. Mr. Layne previously held various management positions within EDC’s lending practice including Chief Risk Officer, before assuming his current role. Prior to joining EDC in 1992, Mr. Layne worked for an engineering firm.
Jim McArdle
Senior Vice-President,
Corporate Affairs & Secretary
Jim McArdle was appointed as Senior Vice-President, Corporate Affairs & Secretary in January 2012, after serving as Senior Vice-President, Legal Services and Secretary since 2006. Mr. McArdle is responsible for Strategic Planning, External Relations, Corporate Social Responsibility, Economics, Enterprise Portfolio Management and is Secretary to the Board. Mr. McArdle joined EDC as a Legal Counsel in 1993 and became Senior Legal Counsel in 1994. He was appointed General Counsel and Senior Assistant Secretary in July 2002. Prior to joining EDC, he was a member of a national Toronto law firm for 10 years, and is a graduate of Columbia University’s Senior Executive Program.
Rajesh Sharma
Senior Vice-President,
Business Development
Rajesh Sharma was appointed as Senior Vice-President, Business Development in January 2012, after serving as Senior Vice-President, Financing Products Group since 2011. Mr. Sharma leads the business strategy of the Corporation. He is responsible for EDC’s business origination and client coverage through EDC’s network of offices and representations in Canada and overseas, across all industry sectors, all product lines, and all customer segments. Since joining EDC in 1995, Mr. Sharma has overseen various product lines including its Project and Structured Finance, Corporate & Asset-back Lending, Commercial Lending, Equity, Political Risk Insurance, and Economic Analysis & Forecasting. Prior to joining EDC, Mr. Sharma spent four years with Ontario Hydro. Mr. Sharma has an MBA from the University of Windsor, and an MPhil. in Economics and MA Honours in Economics from Panjab University in India and is a graduate of Columbia University’s Senior Executive Program.
Clive Witter
Senior Vice-President,
Insurance
Clive Witter was appointed as Senior Vice-President, Insurance in May 2012. Mr. Witter has 30 years experience in finance and insurance, most of it in senior leadership positions. Originally from the United Kingdom, Mr. Witter has also worked in Canada, Ireland, Belgium, and Hong Kong. Prior to joining EDC, he worked for PWC and then AVIVA Composite Insurance Group, one of the world’s largest insurance companies. His most recent position was as Chief Operating Officer, Continental Europe for Willis International, General Insurance Brokers, based in London. A Chartered Accountant, Mr. Witter is also a graduate of University College of Swansea, Wales.
| | | | |
| | EDC Annual Report 2013 | | 45 |
Corporate Governance
Board stewardship
The stewardship of EDC rests with its Board of Directors composed of members experienced in business, finance, investment and risk management. In 2013 the Board focused on operational continuity during key transitions, including a vacancy for the Chair of the Board and the President. In June 2013 Kevin Warn-Schindel was appointed Board Chair, and Pierre Gignac was appointed as Acting President until February 2014, when Benoit Daignault was appointed as President and CEO.
Each year, the Board advises on and approves EDC’s Corporate Plan. In 2013, the Board discussed several elements of the plan at its meetings throughout the year, including the annual strategy session. The needs of SMEs were a key point of focus throughout the year, with the board reviewing options for EDC to further support SMEs and success measures for SME initiatives. During the planning process, the Board also placed an emphasis on the life sciences sector, a strategy for Africa, the equity strategy, readiness for the economic recovery in the U.S. and increasing activity in EDC’s investment program management.
EDC’s Board and executive team ensure that the Corporate Plan is aligned with Government of Canada priorities, as communicated by the Minister of International Trade’s Statement of Accountabilities and Priorities for EDC, and they confirmed the Corporate Plan’s alignment with the Government’s Global Markets Action Plan.
The Board continued to focus on EDC’s risk management programs, in particular enterprise risk management (ERM). Board members participated in the annual risk identification and evaluation survey. The Risk Management Committee reviewed the status of transactions with challenging or unique aspects and received reports on the results of refined stress testing exercises, which examined the potential impacts on EDC on a variety of negative global events. The Board offered expertise on the development of EDC’s ERM Framework and approved the Risk Appetite Statement.
In 2013, the Board, with the assistance of the Audit Committee and an advisory group of Board members, approved major technology initiatives and investments and monitored their implementation. Investments in EDC’s credit insurance technology should enable EDC, in concert with several domestic partners, to develop this market by enhancing efficiency and connectivity, helping more small businesses in a cost-effective way.
Among other activities, the Audit Committee reviewed and endorsed the annual audit plans of the Auditor General and the internal auditor, and the plan for the Auditor General’s audit of the design and implementation of EDC’s environmental and social risk management framework. The Audit Committee received reports on internal audit projects and reviewed annual and quarterly financial statements.
Public policy objectives and legislated mandate
The mandate and powers of EDC are established by statute. In 2013, the government announced proposed amendments to EDC’s regulatory framework, to clarify the circumstances in which EDC can provide services in the domestic market. EDC’s temporary authority to offer services through a domestic mandate was extended to allow time for public consultation on and introduction of the new regulations. The new regulations were approved in 2013 and will enter into force in 2014. The Board monitored EDC’s work with banks and other financial services companies to provide increased capacity in a complementary manner in support of Canadian companies’ domestic business.
Corporate Social Responsibility and culture of ethical conduct
EDC’s CSR activities are an important part of enhancing Canada’s trade performance. The Board was engaged on CSR issues throughout the year, including discussions on anti-corruption issues, guidelines on defense and security-sector exports, approval of a new vice-president-level CSR lead and additional attention to EDC’s anti-corruption practices.
The Board promotes an ethical business culture, following board procedures that regulate conflict of interest and insider trading, in addition to the requirements of EDC’s Code of Conduct that apply to directors. EDC directors file standing declarations of interest and refrain from discussions or voting where a real or potential conflict of interest exists. Board
| | | | |
| 46 | | Turning the Corner on Trade | | |
documents are screened to flag companies listed in directors’ standing declarations so that transaction documents are withheld from a director who has declared an interest in a party related to that transaction.
In 2013, the Board approved updates to EDC’s Code of Business Ethics and Code of Conduct. The Code of Business Ethics describes EDC’s high-level commitments, while the Code of Conduct sets out the responsibilities of employees and directors. The most significant change to the Code of Conduct confirms employees’ accountability by an obligation to report all Code violations, expanding obligations under the Disclosure of Wrongdoing Policy. Each year, all employees annually confirm their compliance with EDC’s Code of Conduct, including the Values and Ethics Code for the Public Sector which became part of EDC’s Code of Conduct in 2012. Board members annually confirm their understanding and compliance with applicable parts of the EDC Code of Conduct, and with Board-specific conflicts of interest and insider trading procedures.
Accountability
and operations
EDC’s Board functions independently of management. At each board and committee meeting, time is reserved for directors to meet in camera with the CEO only and then without management present. The Audit Committee meets in camera in three sessions: with the federal Auditor General’s representatives, another with EDC’s internal audit vice-president, and a third with only independent directors present. The Risk Management Committee holds regular in camera sessions with the Chief Risk Officer.
The roles of EDC’s Chair and President are separate. All Board members, other than the President, are independent of EDC management. To promote transparency, directors receive agendas and materials for, and are welcome to attend, committees of which they are not members.
The Board has an effective working relationship with EDC’s management and regularly reviews the allocation of responsibilities. The EDC by-law regulates the proceedings of the Board, and establishes matters for which the board has reserved authority. The Board Charter elaborates on roles and responsibilities, in terms of Board stewardship, and provides additional detail on Board proceedings. The Board ensures that its effectiveness and that of its committees is evaluated annually, and that individual directors self-assess their own contributions. The 2013 results will form the basis for the Board’s governance activities going forward.
Communication
with stakeholders
Effective communication between EDC and its key stakeholders was monitored and facilitated by the Board throughout 2013. The Board was kept informed of outreach activities that help EDC obtain stakeholder input and feedback, including the meetings of the Industry Stakeholder Panel and the Corporate Social Responsibility Advisory Group. At formal and informal board events, experts from various fields were invited to provide their insights including Daniel Gauthier, Chairman, Groupe Le Massif, the Honourable John Manley, CEO of the Canadian Council of Chief Executive, Guy Hachey, President and
Chief Operating Officer Bombardier Aerospace, Eileen Boyd, Assistant Secretary to Cabinet, PCO, and Michael Gauthier, CFO, Bourgault Industries. Board members met directly with Canadian exporters at two receptions. With Board encouragement, EDC continued to place a priority on partnering with its portfolio partners, including the Trade Commissioner Service (TCS), Canadian financial institutions, Canadian Commercial Corporation (CCC) and the Business Development Bank of Canada (BDC).
Senior management
evaluation and succession
The Board’s process for evaluating the performance of the President continued in 2013. The President’s annual performance objectives are set by the Human Resources Committee and are directly related to EDC achieving objectives set out in the Corporate Plan. The Human Resources Committee reviews the President’s performance based on these objectives, and makes recommendations to the Board.
The Board oversees senior management succession. The succession plan developed by management and approved by the Human Resources Committee is used in senior appointments, including one executive vacancy filled in 2013. The Board, in conjunction with the Privy Council Office, has also been engaged in the search for a new President, including engagement of an executive search firm, and participation by some members of the Executive committee (L. Hohol, J. Burghardt and K. Warn-Schindel) in the recruitment process.
| | | | |
| | EDC Annual Report 2013 | | 47 |
CORPORATE GOVERNANCE
Board education
and evaluation
Upon joining the Board, new directors receive an orientation through briefings by senior management and through less structured gatherings with seasoned board members. Board and committee meetings regularly include education on EDC product lines and other aspects of EDC’s business. They also attend relevant courses throughout the year to enhance their knowledge in areas related to EDC’s operations.
Committee mandates
The Audit Committee ensures the Board fulfills its mandate in financial matters, as well as in business ethics, internal and external auditor terms of engagement, and monitoring the corporate compliance program. In 2013, responsibility for all recommendations regarding the declaration of dividends was consolidated in the Audit Committee. It also approves and monitors important capital and administrative expenditures, reviews the implications of new accounting policies, and reviews internal and external audit results. The Audit Committee approves quarterly financial statements for public release. All Audit Committee members are independent of EDC management and committee members include financial experts. The committee, chaired initially by John Rooney and later by Herbert Clarke, held 5 meetings.
The Business Development Committee provides direction that strengthens EDC’s ability to meet the ongoing needs of Canadian exporters and investors. The committee monitors the development and approval of the Corporate Plan, oversees management activities in
analyzing market conditions and developing responses, and monitors corporate performance against business development plans and related frameworks. The committee reviews sector strategies and new product initiatives, and annually reviews the impact on Canada’s economy of business that EDC facilitates. The committee, chaired by Norman Betts, held 6 meetings.
The Executive Committee has the authority to exercise many Board powers, and meets only if necessary to deal with urgent matters that arise between Board meetings. A meeting of the Executive Committee was not required in 2013. Kevin Warn-Schindel, as Chair of the Board, chairs the committee.
The Human Resources Committee supports the Board’s oversight of human resources strategic planning and approves the management succession plan, employee and executive compensation and the measures and targets for the corporate incentive program. It sets objectives and advises the Board on the assessment of the President’s performance and oversees the design, investment strategy and performance of pension plans for employees. The committee, chaired initially by Linda Hohol and then by Jeff Burghardt, held 7 meetings.
The Nominating and Corporate Governance Committee deals with matters relating to EDC’s governance regime. It has input into the ethics program for directors, selection criteria for appointments of the President and the chair, profiles of the desirable skills and experience required of directors, consideration of board candidates, and orientation and education programs. It oversees the board governance survey,
monitors relations with management, and reviews the membership and mandates of committees. In 2013 most important governance matters were elevated for discussion or decision to the full board, so the committee held no meetings. The Board chair acts as chair of this committee.
The Risk Management Committee supports the Board’s oversight of the prudent management of EDC’s capital structure, including the management of credit, market and other enterprise risks. The Committee oversees and recommends updates to the internal policy framework governing authorization of EDC’s business activities, and oversees the authorizations which EDC requires in order to undertake specific transactions. It reviews and recommends transactions requiring Board approval, and monitors compliance with the Environmental Review Directive. It receives updates on portfolio management activities. The committee, chaired by Adam Chowaniec, held 6 meetings.
Director remuneration
Compensation paid to directors is set by Order in Council. The chair and other independent directors receive an annual retainer for their services, plus a fixed per diem for travel time, and for attending committee and Board meetings. The following compensation schedule has been in place since 2000 in accordance with Treasury Board Guidelines.
| | |
| | Chair of the Board: annual retainer of $12,400; $485 per diem. |
| | Other directors: annual retainer of $6,200; $485 per diem. |
| | Chairs of committees (other than Executive Committee) and Vice-Chair of the Board: base retainer plus $2,000. |
| | | | |
| 48 | | Turning the Corner on Trade | | |
Directors are reimbursed for their reasonable out-of-pocket expenses while performing their duties, including travel, accommodations and meals. Most members of the Board serve on three committees. There were 12 Board meetings in 2013, (6 regular, 6 special) and 24 committee meetings. Meetings convened between regularly scheduled Board sessions are usually held by
teleconference. The total remuneration paid to independent directors including the Chair (annual retainers plus per diems) was $240,841, compared to $221,954 in 2012. The total for business travel, promotion and meeting expenses paid to members of the Board plus meeting expenses for the Board and committees was $165,566 compared to $172,965 in 2012 (both figures
exclusive of the expenses of the President). The total for the President’s business travel and hospitality expenses in 2013 was $36,082 compared to $107,813, in 2012. Of the $36,082 total, $23,884 was for the former President and $12,198 was for the Acting President.
MEMBERSHIP AND ATTENDANCE AT MEETINGS OF THE BOARD AND BOARD COMMITTEES IN 2013
| | | | | | | | | | | | | | | | | | | | | | | | | | |
| | | | | Total
Compensation
(retainer plus per
diem payments) | | | | | Audit
Committee Meeting
(5 Regular) | | | | Business
Development
Committee Meeting
(6 Regular) | | | | Human Resources
Committee Meeting
(6 Regular, 1 Special) | | | | Risk Management
Committee Meeting
(6 Regular) | | | | Board of Directors Meeting
(6 Regular, 6 Special) |
Betts, Norman | | | | | $18,913 | | | | | 3/5 | | | | 3/6 | | | | | | | | 4/6 | | | | 10/12 |
Boivin, Jacques | | | | | $18,853 | | | | | 5/5 | | | | 6/6 | | | | | | | | | | | | 12/12 |
Burghardt, Jeff 7 | | | | | $22,778 | | | | | 5/5 | | | | 6/6 | | | | 7/7 | | | | | | | | 12/12 |
Chowaniec, Adam | | | | | $21,338 | | | | | | | | | 6/6 | | | | 5/7 | | | | 5/6 | | | | 11/12 |
Clarke, Herbert | | | | | $25,157 | | | | | 5/5 | | | | 6/6 | | | | | | | | | | | | 12/12 |
Dinning, Jim 1 | | | | | $6,738 | | | | | | | | | | | | | 1/1 | | | | 1/1 | | | | 1/1 |
Gignac, Pierre 5 | | | | | N/A | | | | | | | | | 4/4 | | | | 4/5 | | | | 4/4 | | | | 7/8 |
Hohol, Linda 7 | | | | | $22,189 | | | | | | | | | | | | | 7/7 | | | | 5/6 | | | | 11/12 |
Khurana, Vik 3 | | | | | $13,315 | | | | | | | | | 4/5 | | | | | | | | 4/5 | | | | 10/11 |
Lifson, Elliot | | | | | $18,368 | | | | | | | | | 6/6 | | | | | | | | 6/6 | | | | 12/12 |
MacLeod, Donald A. | | | | | $14,973 | | | | | | | | | 4/6 | | | | 5/7 | | | | 4/6 | | | | 8/12 |
Poloz, Stephen 4 | | | | | N/A | | | | | | | | | 2/2 | | | | 2/2 | | | | 2/2 | | | | 3/4 |
Rooney, John 2 | | | | | $4,732 | | | | | 1/1 | | | | 1/1 | | | | | | | | 1/1 | | | | 1/1 |
Warn-Schindel, Kevin 6 | | | | | $18,449 | | | | | | | | | | | | | 5/5 | | | | 3/4 | | | | 8/8 |
Steiner, Jeffrey | | | | | $18,368 | | | | | | | | | 6/6 | | | | | | | | 6/6 | | | | 12/12 |
Thibault, Darlene | | | | | $16,670 | | | | | 5/5 | | | | 6/6 | | | | | | | | 6/6 | | | | 11/12 |
Note: Attendance is provided only for meetings of committees of which the director was a member on the meeting date.
1 - J. Dinning retired as Chair of the Board of Directors on March 31, 2013.
2 - J. Rooney’s term on the Board of Directors ended on April 25, 2013.
3 - V. Khurana was appointed to the Board of Directors on April 25, 2013.
4 - S. Poloz resigned as President of EDC on June 2, 2013.
5 - P. Gignac was appointed as Acting-President on June 3, 2013.
6 - K. Warn-Schindel was appointed as Chair of the Board of Directors on June 6, 2013.
7 - In addition to regular Committee and Board meetings, J. Burghardt and L. Hohol received payment for 6 days of meetings related to the President recruitment process.
| | | | |
| | EDC Annual Report 2013 | | 49 |
2013 FINANCIAL REVIEW
Management’s
Discussion and Analysis
| | | | | | | | | | | | | | | | | | | | |
| | |
| | Management’s Discussion and Analysis (MD&A) should be read in conjunction with our audited consolidated financial statements and related notes for the year ended December 31, 2013. All amounts are expressed in Canadian dollars. | | |
| | | | | | |
| | 51 | | Financial Results Overview | | | | 68 | | Risk Management | | |
| | | | 52 | | Impact of Foreign Exchange Translation on Financial Results | | | | | | 69 | | Risk Management Overview | | |
| | | | | | | | | | | | 69 | | Risk Governance, Oversight and Design | | |
| | 52 | | Financial Performance | | | | | | 70 | | Risk Modules | | |
| | | | 52 | | Net Financing and Investment Income | | | | | | | | 70 | | Financial Risk | | |
| | | | 54 | | Insurance Premiums and Guarantee Fees | | | | | | | | 75 | | Operational Risk Management | | |
| | | | 54 | | Other Expenses | | | | | | | | 75 | | Strategic Risk Management | | |
| | | | 55 | | Provision for (Reversal of) Credit Losses | | | | | | | | | | | | |
| | | | 55 | | Claims-Related Expenses (Recovery) | | | | 76 | | Critical Accounting Policies and Estimates | | |
| | | | 55 | | Administrative Expenses | | | | | | 76 | | Change in Accounting Standards | | |
| | | | | | | | | | | | 76 | | Non-IFRS Performance Measures | | |
| | 56 | | Financial Condition | | | | | | | | | | |
| | | | 56 | | Statement of Financial Position Summary | | | | 77 | | Supplemental Information | | |
| | | | 56 | | Corporate Plan Discussion | | | | | | | | | | | | |
| | | | 58 | | Portfolio Exposures and Credit Quality | | | | | | | | | | | | |
| | | | | | 58 | | Concentration of Exposure | | | | | | | | | | | | |
| | | | | | 58 | | Financing Portfolio | | | | | | | | | | | | |
| | | | | | 62 | | Insurance Portfolio | | | | | | | | | | | | |
| | | | | | 65 | | Marketable Securities and Derivative Instruments | | | | | | | | | | | | |
| | | | 66 | | Capital Management | | | | | | | | |
| | | | 67 | | Off Balance Sheet Arrangements | | | | | | | | |
| | | | 67 | | Financial Instruments | | | | | | | | |
| | Caution regarding forward-looking statements | | |
| | |
| | This document contains projections and other forward-looking statements regarding future events. Such statements require us to make assumptions and are subject to inherent risks and uncertainties. These may cause actual results to differ materially from expectations expressed in the forward-looking statements. | | |
| | | | |
| 50 | | Turning the Corner on Trade | | |
Financial Results Overview
After a difficult 2012, the global economy experienced yet another challenging year in 2013. A stagnant European economy, weaker than expected growth in emerging markets and lower prices for commodities, such as metals and potash, were some of the challenges encountered. Despite these challenges, prospects improved materially in the second half of the year with GDP growth accelerating while consumer confidence returned to normal levels in the U.S. and reached post-crisis highs in Europe and Japan. There is evidence of significant pent-up demand as households have delayed purchases and restrained consumption, which bodes well for stronger spending ahead. Businesses continue to remain nervous about economic uncertainty; however, sentiment has improved and investment is beginning to gain momentum.
For Canada, the global conditions produced mixed results in 2013; lower prices for metals, fertilizer and energy reduced the value of commodity exports, while other sectors such as forestry, consumer goods, food and to a lesser extent, machinery and equipment showed signs of strength. Overall, Canadian export growth of approximately 3% may seem disappointing; however, it is a significant improvement over the 2% growth in 2012. Moreover, Canada is well positioned for growth in 2014 as the U.S. recovery accelerates and European conditions begin to improve.
The improvement in economic conditions has translated into an increase in demand for EDC’s products. EDC facilitated the highest level of financing and disbursements in the corporation’s history in 2013. Opportunities for Canadian exporters were created as a result of a strengthening U.S. economy which resulted in the signings of several large loans to U.S. borrowers. In addition, the current low interest rate environment is making it attractive for companies to borrow for expanding operations, purchasing equipment and inventory, increasing working capital as well as refinancing.
Profitability returned to a more normal level in 2013 with net income ending the year at $817 million, a decrease of $510 million when compared with 2012. Although we experienced an increase of $157 million in net financing and investment income due to growth in our loan book and increased activity in our leasing portfolio, we recorded a provision charge and claims-related expenses totalling $189 million. In comparison, we recorded a $340 million provision reversal and a $38 million claims-related recovery in 2012.
| | | | | | |
for the year ended December 31 (in millions of Canadian dollars) | | 2013 | | | 2012 |
Net financing and investment income | | | 1,196 | | | 1,039 |
Loan guarantee fees | | | 36 | | | 38 |
Net insurance premiums and guarantee fees | | | 193 | | | 196 |
| | | | 1,425 | | | 1,273 |
Other expenses | | | 109 | | | 16 |
Administrative expenses | | | 310 | | | 308 |
Provision for (reversal of) credit losses | | | 30 | | | (340) |
Claims-related expenses (recovery) | | | 159 | | | (38) |
Net income | | | $817 | | | $1,327 |
The $370 million provision increase is primarily due to the following factors:
| | | | |
 | | In 2012, we updated our assumptions for probability of default and amount of loss given a default. These new assumptions meant that we needed less loan allowance, so we released provisions; | | |
| | In 2013, we had more downward credit migration in our portfolio than in 2012, so we had a provision charge to increase our allowances. | | |
Claims-related expenses were $159 million in 2013 mainly due to a reduction in our expected recoverable amount of a large political risk insurance claim charge.
We also recorded other expenses of $109 million in 2013, an increase of $93 million from 2012. The variance is largely due to the volatility associated with our financial instruments carried at fair value.
| | | | |
| | EDC Annual Report 2013 | | 51 |
MANAGEMENT’S DISCUSSION AND ANALYSIS
Impact of Foreign Exchange Translation on Financial Results
By the end of 2013, the Canadian dollar had weakened relative to the U.S. dollar, resulting in a rate of U.S. $0.94 on December 31st compared to U.S. $1.01 at the end of 2012. The weaker Canadian dollar resulted in an increase in our assets and liabilities which are primarily denominated in U.S. dollars and translated to Canadian dollars at rates prevailing at the statement of financial position date. Business facilitated and the components of comprehensive income are translated into Canadian dollars at average exchange rates. The average rate for 2013 was U.S. $0.97 compared to U.S. $1.00 for 2012.
Financial Performance
Net Financing and Investment Income
Loan Revenue
| | | | | | | | |
Loan revenue was $1,174 million in 2013, an increase of $58 million from 2012. The total yield on our loan portfolio (both performing and impaired) was 3.60%, down 23 basis points from the previous year. Although total yield on our portfolio decreased, performing loan interest revenue was $973 million in 2013, an increase of $37 million compared to 2012. The increased revenue is a result of continued growth in both our floating and fixed rate portfolios, with net loan disbursements totalling $4,168 million in 2013. Although revenue increased compared to the prior year, we are earning lower returns on our performing loans, a reflection of the lower interest rate environment. Yields on our floating rate portfolio decreased from 2.71% in 2012 to 2.43% in 2013 mainly due to lower reference rates. Our fixed rate portfolio yields also decreased from 5.03% to 4.81% during this same period due to repayments on older loans with an average yield of 5.26% being replaced by new loans with an average yield of 3.45%. As a result, the overall yield on our performing loan portfolio decreased by 31 basis points to 3.04% compared to 2012. Loan fee revenue increased by $29 million in 2013 mainly due to larger portfolio exposure as well as other events, such as loan prepayments, that allow for the immediate recognition of deferred revenue. We recognize revenue on the carrying value of our impaired loans at their original effective yield. In 2013, we recognized $30 million of impaired revenue, a decrease of $11 million from 2012. The average carrying value of our impaired loans decreased throughout 2013, as two obligors in our aerospace portfolio returned to performing status. For a breakdown of loan interest yield on our fixed and floating rate portfolios, refer to Table 1 in Supplemental Information. Components of the Change in Loan Revenue from 2012 | | 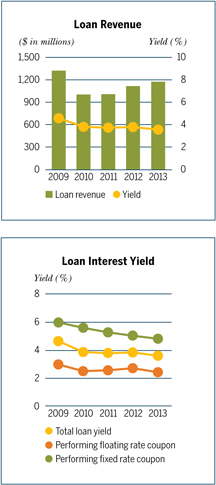
|
(in millions of Canadian dollars) | | 2013 | | | | |
Revenue from portfolio growth | | | 104 | | | | |
Decrease in revenue from lower yield | | | (96) | | | | |
Foreign exchange impact | | | 29 | | | | |
Increase in performing loan interest revenue | | | 37 | | | | |
Increase in loan fees | | | 29 | | | | |
Increase in other loan revenue | | | 3 | | | | |
Decrease in impaired revenue | | | (11) | | | | |
Net change in loan revenue | | | $58 | | | | |
| | | | |
| 52 | | Turning the Corner on Trade | | |
Marketable Securities Revenue
| | | | | | | | |
We maintain a marketable securities portfolio in order to meet our liquidity requirements. Pursuant to our Board approved risk management policies, we must maintain sufficient liquidity to meet a prescribed minimum level, based on forecasted cash requirements. The average marketable securities balance was $4,000 million for 2013, consistent with 2012 ($3,959 million). Our marketable securities revenue consists of income earned on short-term instruments, bonds and government securities held during the year. The yield on our marketable securities portfolio declined from 0.91% in 2012 to 0.80%. This is mainly the result of lower long-term U.S. Treasury yields. Consistent with the decrease in yield, our marketable securities revenue decreased by $4 million to $32 million in 2013. | | 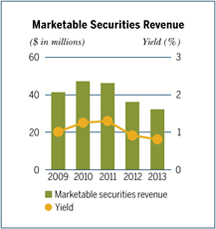
|
Interest Expense | | | | | |
Our interest expense includes the cost of our debt and related derivatives. It also includes the impact of the floating rate currency swaps used to reduce the foreign currency risk related to using our capital to fund U.S. dollar denominated assets. These currency swaps are set up with the objective to offset U.S. dollar assets and liabilities with a U.S. dollar payable component and a Canadian dollar receivable component. This allows us to hold our liquidity portfolio, described above, largely in U.S. dollars without taking on foreign exchange risk. Interest expense totalled $30 million in 2013, a decrease of $78 million from 2012 as a result of rates resetting to lower levels throughout the year. Also contributing to the reduction is the maturity of a higher cost fixed rate bond in the last quarter of 2012. Our average debt balance was $27,343 million in 2013, an increase of $3,958 million from 2012, which was mainly used to fund our growing loan portfolio. The net revenue generated by the capital related currency swaps was $72 million in 2013, an increase of $6 million from 2012 as the spread between the applicable short-term U.S. dollar and Canadian dollar rates widened in 2013. | | 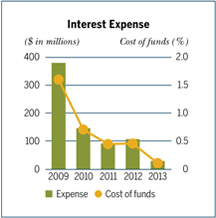
|
Components of the Change in Interest Expense from 2012 |
(in millions of Canadian dollars) | | 2013 | | | | | |
Impact of volume increase | | | 9 | | | | | |
Increase in revenue on currency swaps related to our capital | | | (6) | | | | | |
Decrease in expense from lower cost of funds | | | (82) | | | | | |
Foreign exchange impact | | | 1 | | | | | |
Net change in interest expense | | | $(78) | | | | | |
| | | | |
| | EDC Annual Report 2013 | | 53 |
MANAGEMENT’S DISCUSSION AND ANALYSIS
Insurance Premiums and Guarantee Fees
| | |
Premium and guarantee fee revenue earned in our insurance programs in 2013 totalled $193 million compared to $196 million earned in the prior year. | | 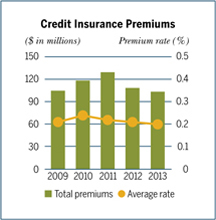
|
Insurance premiums earned under our credit insurance program amounted to $110 million for the year. We have partnered with reinsurers and in 2013 we ceded premiums of $7 million to our reinsurance partners resulting in net premium revenue of $103 million. The net premium decreased by $5 million from 2012 mainly due to increased activity in higher volume accounts with lower premium rates. | |
Insurance premiums earned under our financial institutions insurance program totalled $21 million, an increase of $3 million from 2012 as the program experienced an increase in business facilitated in China in 2013. | |
Contract insurance and bonding premiums totalled $50 million in 2013, an increase of $2 million from 2012 as a result of an increase in the average premium rate. Net premium revenue in our political risk insurance program totalled $19 million, a decrease of $3 million from 2012, mainly due to a reduction in the average premium rate as a result of changes in portfolio mix. | |
In 2013, loan guarantee revenue remained relatively stable at $36 million compared to $38 million in 2012. The slight decline is due to lower average exposure in this program.
For the breakdown of insurance premiums and guarantee fees, refer to Table 3 in Supplemental Information.
Other Expenses
Other expenses were $109 million in 2013 compared to $16 million in 2012. The key components of other expenses in 2013 were the realized and unrealized fair value gains and losses on various financial instruments as discussed below.
We issue debt instruments in the market where we are able to obtain the most attractive funding costs and then we use derivatives to manage interest rate risk and foreign exchange risk. Unrealized gains on loans payable designated at fair value through profit or loss totalled $248 million in 2013 and the unrealized losses on the derivatives associated with the loans payable totalled $288 million. During 2013, most discount rates relevant to the valuation of our loans payable and the related derivatives increased, leading to unrealized losses on our derivatives and unrealized gains on our loans payable. In accordance with International Financial Reporting Standards (IFRS), our debt is valued on the basis of our credit rating (AAA) while the related derivatives are valued based on the credit risk of the resulting exposure. The gain on loans payable was smaller than the loss on the related derivatives as the rates used to value our loans payable increased less than the rates used to value the related derivatives. During 2012 the opposite situation occurred, most rates relevant to the valuation of our debt fell, leading to a loss of $36 million on our loans payable and a gain of $68 million on the related derivatives.
| | | | | | | | |
(in millions of Canadian dollars) | | | | 2013 | | | 2012 |
Net unrealized (gain) loss on derivatives related to loans payable | | | | | 288 | | | (68) |
Net unrealized (gain) loss on loans payable designated at fair value through profit or loss | | | | | (248) | | | 36 |
Net realized and unrealized (gain) loss on marketable securities at fair value through profit or loss | | | | | 52 | | | (9) |
Net realized and unrealized loss on loan related credit default swaps | | | | | 11 | | | 70 |
Foreign exchange translation (gain) loss | | | | | 1 | | | (2) |
Other | | | | | 5 | | | (11) |
Total other expenses | | | | | $109 | | | $16 |
The majority of our marketable securities are classified at fair value through profit or loss. Net realized and unrealized losses on marketable securities at fair value through profit or loss totalled $52 million for the year (2012 – gain of $9 million). During 2013, most rates relevant to the valuation of these marketable securities increased leading to a loss, whereas in 2012, these rates fell which translated into a gain.
In 2013, we recorded a net realized and unrealized loss of $11 million (2012 – $70 million) on our portfolio of loan related credit default swaps. The reduced loss in 2013 is due to a relatively stable credit condition of the reference entities compared to a more significant improvement of their credit condition in 2012.
| | | | |
| 54 | | Turning the Corner on Trade | | |
Provision for (Reversal of) Credit Losses
In 2013, we recorded a provision charge of $30 million related to our loan portfolio compared to a $340 million release of provision in 2012. As previously discussed, the variance is largely due to the impact of assumption updates in 2012 and increased downward credit migration in the portfolio in 2013.
For a breakdown of the provision for (reversal of) credit losses, refer to Table 4 in Supplemental Information.
Claims-Related Expenses (Recovery)
Claims-related expenses totalled $159 million in 2013, compared to a $38 million recovery in 2012. The ongoing assessment of our recoverable insurance claims was the main contributor to the claims-related expenses in 2013.
The change in the net allowance for claims takes into account updates to the actuarial assumptions as well as changes in the portfolio composition and risk ratings. In 2013, while updates to the actuarial assumptions increased the allowance, changes in the portfolio composition and risk ratings led to an allowance decrease of a similar amount. In comparison, both the updating of assumptions and changes in the portfolio reduced the allowance in 2012, which resulted in a claims-related recovery for the year.
| | | | | | |
(in millions of Canadian dollars) | | | | 2013 | | 2012 |
Claims paid | | | | 56 | | 355* |
| | | | |
Claims paid – reinsured policies | | | | 5 | | 3 |
| | | | |
Claims recovered | | | | (10) | | (22) |
| | | | |
Actuarial increase/ (decrease) in the net allowance for claims | | | | 1 | | (233)* |
| | | | |
Decrease/ (increase) in recoverable insurance claims | | | | 105 | | (156)* |
| | | | |
Claims handling and settlement expenses | | | | 2 | | 15 |
Total claims-related expenses (recovery) | | | | $159 | | $(38) |
| * | Includes the impact of a $300 million claim charge in our political risk insurance program. |
Administrative Expenses
| | | | |
Administrative expenses for 2013 totalled $310 million, an increase of $2 million from the prior year. We experienced an increase in human resources costs primarily due to salary adjustments. However, a reduced pension expense resulted in our administrative expenses being consistent with the prior year. The Productivity Ratio (PR) captures how well we use our resources. The PR increased to 22.7% in 2013 compared to 21.3% in 2012. | | | 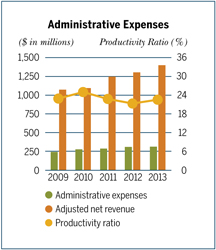 | |
| | | | |
| | EDC Annual Report 2013 | | 55 |
MANAGEMENT’S DISCUSSION AND ANALYSIS
Financial Condition
Statement of Financial Position Summary
Total assets were $41.5 billion at the end of 2013, an increase of $5.3 billion, or 15% from 2012. This is mainly due to an increase in our loans receivable.
Loans Receivable – Loans receivable were $36.4 billion, an increase of $6.2 billion or 21% from 2012 mainly due to net loan disbursements and foreign exchange translation.
Derivative Instruments – Net derivative instruments were $0.1 billion, a decrease of $1.2 billion from 2012. Year over year, the value of our derivative instruments fluctuate based on changes in underlying interest and foreign exchange rates.
Loans Payable – Loans payable were $31.3 billion compared to $25.9 billion in 2012, an increase of $5.4 billion. The increase is mainly due to net debt issuances which were used to fund net loan disbursements. Our borrowing requirements are largely driven by activity within our loans portfolio.
| | | | | | | | |
as at December 31 (in millions of Canadian dollars) | | 2013 | | | 2012 | |
Cash and marketable securities | | | 4,066 | | | | 4,236 | |
| | | |
Derivative instruments | | | 688 | | | | 1,352 | |
| | | |
Loans receivable | | | 36,357 | | | | 30,131 | |
| | | |
Allowance for losses on loans | | | (1,246) | | | | (1,182 | ) |
| | | |
Other financing and leasing assets | | | 1,268 | | | | 1,203 | |
| | | |
Other | | | 383 | | | | 493 | |
Total Assets | | | $41,516 | | | | $36,233 | |
| | | |
Loans payable | | | 31,259 | | | | 25,880 | |
| | | |
Derivative instruments | | | 626 | | | | 120 | |
| | | |
Allowance for loan commitments | | | 47 | | | | 58 | |
| | | |
Premium and claims liabilities | | | 606 | | | | 583 | |
| | | |
Other liabilities | | | 607 | | | | 717 | |
| | | |
Equity | | | 8,371 | | | | 8,875 | |
Total Liabilities and Equity | | | $41,516 | | | | $36,233 | |
Corporate Plan Discussion
The following section discusses our 2013 results and financial position in comparison to Corporate Plan projections. We begin by looking back to our 2013 Corporate Plan and compare actual results to what was expected. Then we look forward to 2014 and provide an explanation of where we anticipate changes from our 2013 results and financial position.
Financial Performance
| | | | | | | | |
for the year ended December 31 (in millions of Canadian dollars) | | | | 2014 Corporate Plan | | 2013 Actual Results | | 2013 Corporate Plan |
Net financing and investment income | | | | 1,115 | | 1,196 | | 1,032 |
| | | | | |
Insurance premiums and guarantee fees* | | | | 228 | | 229 | | 247 |
| | | | | |
Other (income) expenses | | | | (9) | | 109 | | 7 |
| | | | | |
Administrative expenses | | | | 334 | | 310 | | 330 |
| | | | | |
Provision for credit losses | | | | 177 | | 30 | | 47 |
| | | | | |
Claims-related expenses | | | | 60 | | 159 | | 60 |
Net income | | | | 781 | | 817 | | 835 |
| | | | | |
Other comprehensive income | | | | 38 | | 119 | | – |
Comprehensive income | | | | $819 | | $936 | | $835 |
| * | Includes loan guarantee fees. |
2013 Corporate Plan
Net income for 2013 was $817 million, $18 million lower than the 2013 Corporate Plan net income of $835 million. Items of note are as follows:
Net financing and investment income was $1,196 million in 2013, $164 million higher than the 2013 Corporate Plan. This is mainly due to increased signings and disbursements near the end of 2012 and in 2013, as well as lower than planned interest expense.
Other expenses were $109 million, an increase of $102 million from the Corporate Plan. The variance is largely due to changes in the fair value of our financial instruments which are not forecast due to their volatility.
Claims-related expenses were $159 million in 2013 compared to $60 million of expenses projected in the 2013 Corporate Plan. The increase is due to a reduction in the anticipated recoveries.
| | | | |
| 56 | | Turning the Corner on Trade | | |
Administrative expenses were $310 million in 2013, $20 million less than the 2013 Corporate Plan. Changes in actuarial assumptions used to value our pension obligation and a lower than projected staff complement contributed to the reduction. In addition, depreciation was lower than anticipated as the majority of our capital expenditures occurred in the latter part of the year.
Insurance premium and loan guarantee fee income was $229 million in 2013, $18 million lower than the Corporate Plan, which is attributable to lower average premium rates than projected.
The productivity ratio for 2013 was 22.7%, an improvement over the 2013 Corporate Plan projection of 25.9%. The decline is due to an increase in net financing and investment income and lower administrative expenses as previously discussed.
2014 Corporate Plan
Net income for 2014 is planned to be $781 million, $36 million less than 2013. Items of note are as follows:
The 2014 Corporate Plan is projecting a $177 million provision for credit losses, which is $147 million higher than 2013 primarily due to an increase in negative credit migration. In 2013 we had some obligors that were upgraded which allowed us to release provision. We are not expecting as much upward credit movement in 2014.
We are projecting other income of $9 million compared to other expense of $109 million in 2013. The variance is largely due to the volatility associated with our financial instruments carried at fair value.
Claims-related expenses are projected to be $60 million in 2014, $99 million lower than 2013. This is primarily due to a decrease in our anticipated recoveries in 2013 that is not projected to reoccur in 2014.
The 2014 Corporate Plan is projecting net financing and investment income to be $81 million lower than 2013. The variance is mainly due to growth in loans receivable that occurred in 2013 that was not contemplated at the time the Corporate Plan was prepared. In addition, interest expense is forecast to be higher as a result of a reduction in revenue generated on our capital swaps.
The planned administrative expenses for 2014 are $334 million, $24 million greater than 2013. Human resources, depreciation and advertising costs are expected to increase in 2014. Human resource costs will be higher in 2014 due to normal salary adjustments and a return to a full staffing complement. Depreciation costs are anticipated to increase due to the costs associated with the modernization of our current technology. As well, we plan to increase our investment in advertising in an effort to raise awareness and understanding of trade opportunities available to small businesses.
Financial Position
| | | | | | | | |
as at December 31 (in millions of Canadian dollars) | | | | 2014 Corporate Plan | | 2013 Actual Results | | 2013 Corporate Plan |
Cash and marketable securities | | | | 4,690 | | 4,066 | | 4,339 |
| | | | | |
Derivative instruments | | | | 714 | | 688 | | 1,497 |
| | | | | |
Loans receivable | | | | 35,654 | | 36,357 | | 31,733 |
| | | | | |
Allowance for losses on loans | | | | (1,198) | | (1,246) | | (1,364) |
| | | | | |
Other financing and leasing assets | | | | 1,324 | | 1,268 | | 1,249 |
| | | | | |
Other assets | | | | 487 | | 383 | | 481 |
Total Assets | | | | $41,671 | | $41,516 | | $37,935 |
| | | | | |
Loans payable | | | | 31,589 | | 31,259 | | 27,710 |
| | | | | |
Derivative instruments | | | | 575 | | 626 | | 181 |
| | | | | |
Allowance for losses on loan commitments | | | | 59 | | 47 | | 63 |
| | | | | |
Premium and claims liabilities | | | | 616 | | 606 | | 565 |
| | | | | |
Other liabilities | | | | 666 | | 607 | | 774 |
| | | | | |
Equity | | | | 8,166 | | 8,371 | | 8,642 |
Total Liabilities and Equity | | | | $41,671 | | $41,516 | | $37,935 |
| | | | |
| | EDC Annual Report 2013 | | 57 |
MANAGEMENT’S DISCUSSION AND ANALYSIS
2013 Corporate Plan
Loans receivable totalled $36.4 billion at the end of 2013, $4.6 billion higher than Plan primarily as a result of higher net disbursements than contemplated in the Corporate Plan. Loans payable for 2013 were $3.5 billion higher than projected in the Plan as a result of the funding required for the increase in loans receivable.
2014 Corporate Plan
The Corporate Plan is projecting loans receivable to be $35.7 billion at the end of 2014, $0.7 billion lower than December 31, 2013. Loans receivable for 2014 were projected using a forecast 2013 loans receivable position as the starting point. At the time of preparing the 2014 Corporate Plan, loans receivable were projected to grow by $2.2 billion as a result of new business, resulting in loans receivable of $33.4 billion. However, actual results for 2013 were higher than this forecast position, mainly as a result of an increase in net disbursements and foreign exchange translation. Consequently, it is likely that both loans receivable and net financing and investment income will be higher in 2014 than projected in the Corporate Plan.
Portfolio Exposures and Credit Quality
Concentration of Exposure
EDC’s total exposure at the end of 2013 was $86.9 billion, an increase of $8.9 billion from 2012 mainly due to growth in our financing portfolio. The majority of the exposure was within the United States (22%) and Canada (21%). By industry, our greatest exposures are within the extractive and transportation sectors.
Exposure by Program
| | | | | | | | | | | | | | |
as at December 31 (in millions of Canadian dollars) | | 2013 | | | | | 2012 | | | 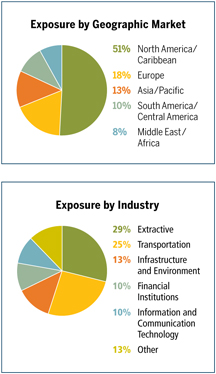 |
Financing portfolio: | | | | | | | | | | | |
Financing assets(1) | | | 37,173 | | | | | | 30,861 | | |
Commitments and guarantees(2) | | | 22,173 | | | | | | 19,932 | | |
Total financing portfolio | | | 59,346 | | | | | | 50,793 | | |
Insurance portfolio: | | | | | | | | | | | |
Credit insurance | | | 8,407 | | | | | | 7,900 | | |
Financial institutions insurance | | | 4,545 | | | | | | 4,118 | | |
Contract insurance and bonding(3) | | | 8,322 | | | | | | 8,115 | | |
Political risk insurance | | | 1,683 | | | | | | 1,690 | | |
Reinsurance ceded(4) | | | (150 | ) | | | | | (150 | ) | |
Total insurance portfolio | | | 22,807 | | | | | | 21,673 | | |
Marketable securities and derivative instruments | | | 4,754 | | | | | | 5,588 | | |
Total exposure | | $ | 86,907 | | | | | $ | 78,054 | | |
(1) | | Includes gross loans receivable, investments and gross investment in aircraft under finance leases. | | |
(2) | | Includes $541 million of investment commitments (2012 – $417 million). | | |
(3) | | Includes $6,982 million of insurance guarantees (2012 – $6,655 million). | | |
(4) | | Includes treaty reinsurance agreements covering the credit insurance portfolio and some bonding obligors. | | |
For a detailed breakdown of the major concentrations of total gross exposure by geographical market and industry, refer to Tables 5 and 6 in Supplemental Information. | | |
Financing Portfolio
Loans Portfolio
We enable Canadian exports and Canadian investments abroad by providing financing solutions to Canadian exporters and their foreign customers, to Canadian investors and to financial institutions. Not only do we provide solutions for exporters with existing contracts, we also proactively identify potential procurement needs for large foreign buyers as well as large foreign projects and provide financing in order to develop opportunities for procurement from Canadian companies. Our financing products enable Canadian companies to provide their customers with flexible financing. To mitigate credit risk within our loan portfolio, we enter into risk transfer transactions such as unfunded loan participations, credit default swaps and loan default insurance.
| | | | |
| 58 | | Turning the Corner on Trade | | |
| | | | |
Gross Loans Receivable | | | | |
Gross loans receivable totalled $36,549 million at the end of 2013, an increase of $6,213 million or 20% from 2012. The growth was due to net loan disbursements as well as foreign exchange translation. Net loan disbursements were $4,168 million for the year, an increase of 57% from the $2,655 million of net disbursements in 2012. The increase can be attributed to large net disbursements in the telecom and media, oil and gas and automotive sub-sectors. The weaker Canadian dollar at the end of 2013 also increased gross loans receivable by $2,098 million as most of our loans are denominated in U.S. dollars. In assessing the credit risk profile of our loan portfolio, we rate our obligors using a system of credit ratings as established in our credit risk rating methodology. These ratings are reviewed on a regular basis. Based on their ratings, we then categorize our loans receivable into three risk classifications: investment grade performing, below investment grade performing and impaired. | | | 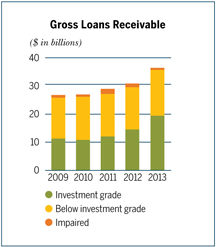 | |
Individually Impaired Loans
Impaired loans represent loans for which we no longer have reasonable assurance that the full amount of principal and interest will be collected on a timely basis in accordance with the terms of the loan agreement. At the end of 2013, impaired gross loans receivable totalled $599 million, a decrease of $561 million from the end of 2012. Overall, impaired loans as a percentage of total gross loans receivable decreased from 3.82% in 2012 to 1.64% in 2013 primarily due to the factors outlined below.
In 2013, we had $760 million of impaired loans return to performing status. The most significant items were loans to American Airlines, Inc. totalling $516 million and loans to Endeavor Air (formerly Pinnacle Airlines Corporation) totalling $242 million. In addition, loans totalling $99 million were removed from our books as a result of repayments by borrowers and principal recoveries from loan sales.
During the year, impaired loans to 34 commercial borrowers totalling $60 million of principal (2012 – 29 commercial and 2 sovereign borrowers totalling $407 million) were written off. These loans were written off after all collection methods had been exhausted and no further prospect of recovery was likely. Included in the principal write-offs is a loss of $34 million related to impaired loan sales.
Loans totalling $285 million were classified as impaired during the year, of which 80% pertain to the aerospace portfolio.
Table 7 in Supplemental Information provides additional information on impaired loans including country and industry concentration.
Commercial Loans and Loan Guarantees
| | | | | | | | | | | | | | | | | | | | | | | | | | | | | | | | |
(in millions of Canadian dollars) | | Gross loans receivable | | | Financing commitments | | | Loan guarantees | | | Risk transfer | | | 2013 Exposure | | | 2012 Exposure | |
Industry | | | | | | | | | | | | | | $ | | | % | | | $ | | | % | |
Extractive* | | | 11,517 | | | | 8,346 | | | | 294 | | | | (381) | | | | 19,776 | | | | 35 | | | | 16,523 | | | | 34 | |
Aerospace | | | 10,882 | | | | 3,125 | | | | 66 | | | | – | | | | 14,073 | | | | 25 | | | | 12,371 | | | | 26 | |
Information and communication technology | | | 3,633 | | | | 3,638 | | | | 168 | | | | – | | | | 7,439 | | | | 13 | | | | 5,506 | | | | 11 | |
Surface transportation | | | 3,761 | | | | 1,424 | | | | 645 | | | | – | | | | 5,830 | | | | 10 | | | | 5,238 | | | | 11 | |
Infrastructure and environment | | | 2,928 | | | | 1,016 | | | | 228 | | | | – | | | | 4,172 | | | | 7 | | | | 4,654 | | | | 10 | |
Financial institutions | | | 1,394 | | | | 539 | | | | 27 | | | | 338 | | | | 2,298 | | | | 4 | | | | 1,190 | | | | 2 | |
Light manufacturing | | | 765 | | | | 758 | | | | 412 | | | | – | | | | 1,935 | | | | 4 | | | | 1,931 | | | | 4 | |
Resources | | | 563 | | | | 492 | | | | 133 | | | | – | | | | 1,188 | | | | 2 | | | | 1,009 | | | | 2 | |
Total | | | $35,443 | | | | $19,338 | | | | $1,973 | | | | $(43) | | | | $56,711 | | | | 100 | | | | $48,422 | | | | 100 | |
* Includes both oil and gas and mining sub-sectors.
Growth in the extractive, information and communication technology and aerospace sectors was the primary driver behind the $8,289 million increase in our commercial portfolio exposure. The growth in these sectors is mainly a result of disbursements and a number of new loan transactions signed in the year across all geographic markets.
In 2013, investment grade exposure accounts for 55% of total commercial exposure, representing a 3% decrease from 2012. The largest concentrations of commercial investment grade exposure are within the extractive (45%), information and communication technology (17%) and the surface transportation sectors (13%).
The extractive, aerospace and information and communication technology sectors accounted for 73% of our total commercial exposure in 2013 (2012 – 71%). This reflects the continued demand for financing in these sectors for Canadian companies. Two of these three sectors also contain our largest single counterparty exposures.
| | | | |
| | EDC Annual Report 2013 | | 59 |
MANAGEMENT’S DISCUSSION AND ANALYSIS
Our largest commercial single counterparty exposures in 2013 resided with two U.S. counterparties, one Mexican counterparty, two Brazilian counterparties and one Canadian counterparty within two industry sectors, which collectively represented $8,444 million, or 15% of the total commercial exposure. Of these counterparties, two are in the aerospace sector with a total exposure of $3,828 million and four are in the extractive sector with a total exposure of $4,616 million.
Sovereign Loans and Loan Guarantees
| | | | | | | | | | | | | | | | | | | | | | | | | | | | | | | | |
(in millions of Canadian dollars) | | Gross loans receivable | | | Financing commitments | | | Loan guarantees | | | Risk transfer | | | 2013 Exposure | | | 2012 Exposure | |
Country | | | | | | | | | | | | | | $ | | | % | | | $ | | | % | |
Ukraine | | | 263 | | | | 48 | | | | – | | | | – | | | | 311 | | | | 21 | | | | 290 | | | | 20 | |
| | | | | | | | | |
Serbia | | | 289 | | | | – | | | | – | | | | – | | | | 289 | | | | 20 | | | | 268 | | | | 19 | |
| | | | | | | | | |
Indonesia | | | 140 | | | | 99 | | | | – | | | | – | | | | 239 | | | | 16 | | | | 241 | | | | 17 | |
| | | | | | | | | |
Uruguay | | | – | | | | – | | | | 100 | | | | – | | | | 100 | | | | 7 | | | | 103 | | | | 7 | |
| | | | | | | | | |
Rwanda | | | 39 | | | | 41 | | | | – | | | | – | | | | 80 | | | | 5 | | | | 46 | | | | 3 | |
| | | | | | | | | |
Pakistan | | | 63 | | | | – | | | | – | | | | – | | | | 63 | | | | 4 | | | | 61 | | | | 4 | |
| | | | | | | | | |
Argentina | | | 48 | | | | – | | | | – | | | | – | | | | 48 | | | | 3 | | | | 45 | | | | 3 | |
| | | | | | | | | |
China | | | 45 | | | | – | | | | – | | | | – | | | | 45 | | | | 3 | | | | 55 | | | | 4 | |
| | | | | | | | | |
Egypt | | | 43 | | | | – | | | | – | | | | – | | | | 43 | | | | 3 | | | | 53 | | | | 4 | |
| | | | | | | | | |
Other | | | 176 | | | | 15 | | | | 18 | | | | 43 | | | | 252 | | | | 18 | | | | 267 | | | | 19 | |
Total | | | $1,106 | | | | $203 | | | | $118 | | | | $43 | | | | $1,470 | | | | 100 | | | | $1,429 | | | | 100 | |
Sovereign exposure for 2013 is consistent with 2012 and includes 65% of non-investment grade exposure (2012 – 63%).
Allowance for Losses on Loans, Loan Commitments and Guarantees
| | | | |
The total allowance for losses on loans, loan commitments and guarantees was $1,408 million at the end of 2013, an increase of $58 million from the 2012 allowance of $1,350 million. | | 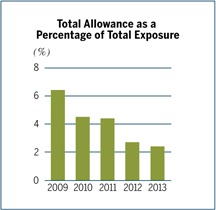 |
The key components impacting the allowance in 2013 were as follows: | |
› | | weakening of the Canadian dollar relative to the U.S. dollar resulting in an increase of $85 million; | |
› | | negative credit migration – increase of $35 million; | |
› | | write-offs of impaired loans (net of recoveries) – reduction of $57 million. | |
In 2011, EDC initiated a multi-year project to update and standardize our credit risk rating methodology and processes. In 2012, as part of the initial implementation stage of this project, we replaced our probability of default rates with updated rates generated by a new credit risk rating tool that uses external historical experience to generate default tables. This change impacted the allowance and was recognized in the 2012 financial results. | |
While the probability of default rates were updated in 2012, this was based on each obligor’s existing risk ratings at that time based on our prior risk-rating methodologies. In 2013, as part of the final implementation stages, existing exposures within the scope of this project that require annual review as per our risk management policies have been re-evaluated using the new internal credit risk rating models developed throughout 2012. This migration occurred throughout the year and the difference between using our new models and the former methodologies was a $27 million provision charge and represents a change in accounting estimate. The impact on future periods has not been determined as it is impracticable to estimate.
| | | | |
| 60 | | Turning the Corner on Trade | | |
Components of the Allowance
| | | | | | | | |
| | | |
(in millions of Canadian dollars) | | 2013 | | | 2012 | |
Base allowance | | | 954 | | | | 939 | |
| | | |
Counterparty concentration | | | 75 | | | | 97 | |
Total collective allowance | | | 1,029 | | | | 1,036 | |
| | | |
Allowance for individually impaired loans, loan commitments and guarantees | | | 379 | | | | 314 | |
Total allowance for losses on loans, loan commitments and guarantees | | | $1,408 | | | | $1,350 | |
For a breakdown of the collective allowance for losses on loans, loan commitments and guarantees by industry of risk, refer to Table 8 in Supplemental Information.
Base Allowance
We classify our performing exposure into categories based on obligor credit rating, industry of risk for commercial obligors and whether the exposure is secured. For secured portfolios, the exposure for each obligor is reduced by the fair value of collateral adjusted for estimated repossession costs. Based on these exposure categories we determine the appropriate base allowance. Loss given default is determined based on historical loan loss rates and by management estimates for each of our exposure categories and default rates are based on an internally developed standard probability of default rate table.
Allowance Overlays
In addition to the base allowance, we add overlays as required to the collective allowance. A concentration overlay is added to reflect the additional risk that we assume when our exposure to a specific counterparty is over a certain threshold. Market overlays are also established to take into consideration that current financial uncertainties are not always reflected in current credit ratings. The overlays are more fully explained in the following sections:
Counterparty Concentration Overlay
A concentration component is added to adequately provision for sovereign and commercial counterparties whose level of exposure is deemed by management to represent an increased amount of risk. A counterparty whose exposure exceeds 10% of our equity based on the previous year’s audited financial statements will attract a concentration component calculated on the portion of exposure over the threshold. The allowance on this portion of exposure is calculated on the same basis as the base allowance for that counterparty.
We had a concentration overlay of $75 million at the end of 2013 compared to $97 million a year earlier. The decrease is mainly due to a higher threshold in 2013 as a result of the increase in retained earnings in 2012 along with the upgrade of one of the aerospace obligors. The aerospace sector comprises 95% of the concentration overlay (2012 – 96% aerospace).
Market Overlays
Market overlays are added to our allowance as required to reflect the risk that the impact of recent economic events is not fully captured in current credit ratings. At the end of 2013, we determined that the current credit ratings appropriately captured the risk in the economy, and thus no market overlays were required.
Individual Allowances
We establish allowances for individually impaired loans, loan commitments and loan guarantees to recognize impairment losses. Individual allowances increased from $314 million in 2012 to $379 million by the end of 2013. This increase was due to the allowance required for new impairments, the largest of which were in the aerospace sector, as well as an increase in the specific provision rate for one large obligor in the infrastructure and environment sector. These additional provision charges were tempered by releases of individual allowance as a result of write-offs and the return to performing status in 2013 of two large aerospace obligors as previously discussed on page 59.
Investments
EDC plays a valuable role in helping Canadian companies access capital and financing. We maintain a portfolio of venture capital and private equity investments focused on promising Canadian late-stage start-ups or established small and mid-sized entities to aid these companies in growing and expanding beyond the Canadian border. In addition, we invest offshore with an emphasis on emerging markets where such investments can serve to facilitate the connection of Canadian business activity to international markets. Our investments are made both directly into Canadian businesses and into funds which in turn invest in Canadian or foreign businesses. With the goal of growing Canadian exporters and facilitating foreign business connections, investments are normally held for periods greater than five years. Divestitures are generally made through the sale of our investment interests to third parties or through listing on public markets.
Consistent with our business goal of growing investments, our exposure increased by $232 million to $1,078 million in 2013 largely as a result of new commitments. During the year, we signed an additional $217 million of investment arrangements (2012 – $230 million).
Refer to Table 9 in Supplemental Information for a breakdown of exposure for our investments.

| | | | |
| | EDC Annual Report 2013 | | 61 |
MANAGEMENT’S DISCUSSION AND ANALYSIS
Equipment Available for Lease
Equipment available for lease consists of aircraft that were returned to us because of default under the related obligors’ loan agreements. While it is not EDC’s intent in the ordinary course of business to act as a lessor, we do engage in leasing activities for asset management purposes to maximize recoveries on returned aircraft and minimize potential losses. Our current portfolio consists of 54 aircraft and two spare engines with a carrying value of $493 million (2012 – 54 aircraft and two spare engines with a carrying value of $525 million). Within this portfolio 53 aircraft and two spare engines are currently on lease with seven lessees in six countries, including four within emerging markets. The final aircraft is scheduled to be out on lease in the first quarter of 2014. The existing lease terms range from 10 to 91 months with contracted monthly lease payments ranging between $48 thousand and $128 thousand (2012 – 8 to 95 months and $60 thousand to $128 thousand).
Aircraft Under Finance Leases
We have 13 aircraft on long-term lease with one obligor in the aerospace industry in the United States. These aircraft were returned to us as a result of loan defaults by this obligor. Under the terms of a restructuring agreement, these aircraft were subsequently leased back to this obligor and classified as finance leases. Our gross investment in these finance leases is $87 million (2012 – $96 million). This exposure is below investment grade.
Insurance Portfolio
Credit insurance facilitates export growth by mitigating risk; providing companies with the confidence to do business abroad knowing that their receivables will be paid should their buyer default on payment. It also enhances their cash flow as banks are generally comfortable providing additional support when their customers’ foreign receivables are insured.
Financial institutions insurance provides coverage to Canadian banks for foreign bank and foreign buyer counterparty risk in trade transactions.
EDC’s bonding products are delivered through partnerships with banks and surety companies. Our performance security and surety bond products are used by exporters primarily to guarantee their contract performance, which helps free up working capital. Our partnerships with banks and surety companies help them mitigate their risks and make it easier for exporters to obtain the coverage they need. We provide contract frustration insurance coverage to protect against commercial and political risks resulting from buyer non-payment associated with a specific contract. The concentration within the contract insurance and bonding program is mainly comprised of performance security products.
As companies diversify their supply and distribution networks and expand into new markets, they are often exposed to political risks that can result in significant losses. This is particularly true of emerging markets, where political events could adversely impact a company’s foreign operations. EDC’s political risk insurance provides peace of mind to companies and their financial intermediaries that, when faced with such risks, their assets will be protected, enabling them to take advantage of export and investment opportunities in emerging markets.
The assistance that EDC provides to our policyholders within our four primary insurance programs is counted in various ways. Under the credit insurance and financial institutions insurance programs, the policyholder declares their sales volume to entities covered by their policy. These declarations are counted as business facilitated for this program. Within our contract insurance and bonding program, a facility is established and the policyholder makes requests for cover to initiate specific coverage. These requests represent business facilitated by EDC. As transactions are signed within our political risk insurance program, they are also counted as business facilitated.
In addition to directly underwriting insurance policies, we assume exposure from other insurers to fulfill our mandate to support Canadian exporters. We also cede reinsurance to other insurance companies to mitigate our risk. The ceding arrangements provide greater diversification of the business and minimize the net loss potential arising from large exposures.
| | | | |
| 62 | | Turning the Corner on Trade | | |
Contingent Liabilities under the Insurance Program
Our liability associated with outstanding insurance policies and guarantees at year end is referred to as contingent liabilities in the notes to our financial statements and is also referred to as exposure under the insurance programs throughout the management’s discussion and analysis section of this annual report.
Contingent liabilities under insurance policies and guarantees totalled $22,807 million at the end of 2013, compared to the 2012 level of $21,673 million.
Contingent liabilities under the credit insurance program totalled $8,407 million at the end of 2013, an increase of 6% compared to 2012, which was mainly the result of higher business facilitated.
| | | | | | | | | | | | | | | | |
| | | |
(in millions of Canadian dollars) | | 2013 Exposure | | | 2012 Exposure | |
Industry | | $ | | | % | | | $ | | | % | |
Extractive | | | 2,782 | | | | 33 | | | | 2,354 | | | | 30 | |
| | | | | |
Resources | | | 1,788 | | | | 21 | | | | 1,682 | | | | 21 | |
| | | | | |
Transportation | | | 1,222 | | | | 15 | | | | 1,221 | | | | 16 | |
| | | | | |
Light manufacturing | | | 1,092 | | | | 13 | | | | 967 | | | | 12 | |
| | | | | |
Infrastructure and environment | | | 777 | | | | 9 | | | | 637 | | | | 8 | |
| | | | | |
Information and communication technology | | | 746 | | | | 9 | | | | 1,039 | | | | 13 | |
Total | | | $8,407 | | | | 100 | | | | $7,900 | | | | 100 | |
The following charts show the exposure by geographic market for our financial
institutions and political risk insurance programs:
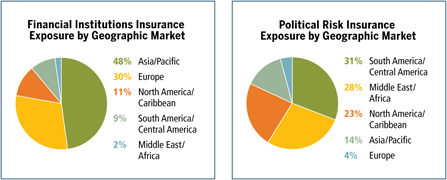
| | | | |
| | EDC Annual Report 2013 | | 63 |
MANAGEMENT’S DISCUSSION AND ANALYSIS
Claims
| | | | | | | | |
(in millions of Canadian dollars) | | 2013 | | | 2012 | |
Claims paid | | | 61 | | | | 358 | |
| | | |
Claims recovered | | | (10 | ) | | | (22 | ) |
Net claims | | | $51 | | | | $336 | |
Claim payments totalled $61 million in 2013 and were comprised of 726 claims related to losses in 70 countries (2012 – 970 claims in 71 countries). There was a $300 million claim charge in our political risk insurance program in 2012. In both 2012 and 2013, the largest concentration of claim payments was in the Middle East.
In 2013 we recovered $11 million in total (2012 – $24 million) of which $1 million was disbursed to exporters (2012 – $2 million).
Claims Paid by Exporters’ Insured Sector
| | | | | | | | | | | | | | | | | | |
(in millions of Canadian dollars) | | 2013 | | | 2012 | | | 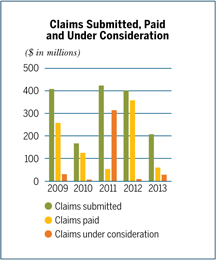 |
| | | $ | | | % | | | $ | | | % | | |
Infrastructure and environment | | | 33 | | | | 55 | | | | 11 | | | | 3 | | |
Resources | | | 18 | | | | 30 | | | | 14 | | | | 4 | | |
Light manufacturing | | | 6 | | | | 10 | | | | 8 | | | | 2 | | |
Information and communication technology | | | 2 | | | | 3 | | | | 12 | | | | 3 | | |
Extractive | | | 1 | | | | 1 | | | | 309 | | | | 87 | | |
Transportation | | | 1 | | | | 1 | | | | 4 | | | | 1 | | |
Claims paid | | $ | 61 | | | | 100 | | | $ | 358 | | | | 100 | | |
During 2013, there were 1,272 claims submitted to EDC for consideration, compared to the 1,563 claims submitted in 2012. | | |
At the end of 2013, the value of claims requests that were still under consideration was $30 million (2012 – $11 million). | | |
For a breakdown of claims by size concentration refer to Table 10 in Supplemental Information. | | |
Premium and Claims Liabilities | | |
Premium and claims liabilities represent our estimate of future claims under the terms and conditions of our insurance policies. | | | 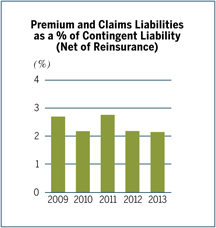 |
At the end of 2013, the premium and claims liabilities were $606 million. The liability net of the reinsurers’ share was $513 million, an increase of $20 million from 2012. The main factor in the increase from the prior year was foreign exchange translation. | | |
Potential claims on insurance policies that we have ceded to reinsurance companies were $93 million compared to $90 million in 2012. This amount, recorded as an asset on the consolidated statement of financial position, represents the reinsurers’ share of our premium and claims liabilities and is also included in our premium and claims liabilities. If we were required to pay out a claim on these policies we could recover from the reinsurer depending on the terms of the agreement. | | |
The net premium and claims liabilities as a percentage of the contingent liability related to insurance policies and guarantees was 2.3% in 2013, consistent with 2012. | | |
| | | | |
| 64 | | Turning the Corner on Trade | | |
As permitted by International Financial Reporting Standard 7 – Financial Instruments: Disclosures, we have displayed certain parts of our Management’s Discussion and Analysis which discuss the nature, extent and management of credit, liquidity and market risks in green font. These disclosures form an integral part of our audited Consolidated Financial Statements for the year ended December 31, 2013.
Marketable Securities and Derivative Instruments
The Department of Finance sets out guidelines that define the minimum acceptable counterparty credit rating pertaining to our marketable securities and derivative instruments. In addition, we have policies which are reviewed periodically, and procedures that establish credit limits for each counterparty, which are reviewed by management no less than annually. These policies and procedures are designed to limit and manage the credit risk associated with these financial instruments.
Our interest-bearing deposits and marketable securities portfolio expose us to the risk that the deposit-taking institutions or counterparty will not repay us in accordance with contractual terms. Our potential deposit and marketable securities credit exposure is represented by the carrying value of the financial instruments.
The following table provides a breakdown, by credit rating and term to maturity, of our deposits and marketable securities credit exposure:
| | | | | | | | | | | | | | | | | | | | |
(in millions of Canadian dollars) | | | | | | | | | | |
| | | Remaining term to maturity | | | | | | | |
| Credit rating | | Under 1 year | | | 1 to 3 years | | | Over 3 years | | | 2013 Exposure | | | 2012 Exposure | |
AAA | | | 948 | | | | 905 | | | | 1,090 | | | | 2,943 | | | | 3,361 | |
| | | | | | |
AA+ | | | – | | | | 50 | | | | 16 | | | | 66 | | | | – | |
| | | | | | |
AA | | | – | | | | – | | | | 26 | | | | 26 | | | | 10 | |
| | | | | | |
AA- | | | 466 | | | | – | | | | – | | | | 466 | | | | 457 | |
| | | | | | |
A+ | | | 353 | | | | 1 | | | | 7 | | | | 361 | | | | 322 | |
| | | | | | |
A | | | 48 | | | | – | | | | – | | | | 48 | | | | – | |
| | | | | | |
A- | | | 107 | | | | – | | | | – | | | | 107 | | | | 48 | |
| | | | | | |
BBB+ | | | 49 | | | | – | | | | – | | | | 49 | | | | 38 | |
Total | | | $1,971 | | | | $956 | | | | $1,139 | | | | $4,066 | | | | $4,236 | |
Derivatives expose us to the risk that the counterparty will not repay us in accordance with contractual terms. Our potential derivative credit exposure is represented by the replacement cost of contracts that have a positive fair value. For a more in-depth discussion on the use of derivative instruments, refer to the section on derivative instruments (see page 73).
All swaps are transacted with high credit quality financial institutions. We operate a collateral program to mitigate credit exposure related to swaps used to hedge risk within our funding program. As market rates move between the settlement date and maturity date of the swap, the financial instrument attains value such that to terminate the swap early, one counterparty would need to make a payment to the other to compensate for the movement in rates. In order to mitigate the credit risk, we often enter into collateral agreements with financial institutions with whom we undertake swap transactions. Under the terms of the swap agreements, when the credit exposure surpasses an agreed upon threshold, collateral in the form of government securities is posted with an independent third party by our swap counterparty. At the end of December 2013, $177 million was posted as collateral by our counterparties to mitigate credit risk associated with swap agreements.
The following table provides a breakdown, by credit rating and term to maturity, of our derivative credit exposure and how it is offset against exposure netting amounts and collateral held. Exposure netting amounts represent derivative contracts where there is an agreement with the counterparty (netting agreement) that allows us to offset the counterparty’s derivative credit exposure to us against our credit exposure to that same counterparty. After applying both exposure netting and collateral held, our net exposure is $154 million (2012 – $278 million).
| | | | |
| | EDC Annual Report 2013 | | 65 |
MANAGEMENT’S DISCUSSION AND ANALYSIS
| | | | | | | | | | | | | | | | | | | | | | | | | | | | | | | | |
| | | | | | | |
| (in millions of Canadian dollars) | | | | | | | | | | | | | | | | | | | |
Credit rating | | Remaining term to maturity | | | Gross | | | Exposure | | | Collateral | | | 2013 Net | | | 2012 Net | |
| | Under 1 year | | | 1 to 3 years | | | Over 3 years | | | exposure | | | netting* | | | held | | | exposure | | | exposure | |
AA- | | | 173 | | | | 224 | | | | 95 | | | | 492 | | | | (263 | ) | | | (116 | ) | | | 113 | | | | 235 | |
| | | | | | | | | |
A+ | | | 14 | | | | 65 | | | | 1 | | | | 80 | | | | (53 | ) | | | – | | | | 27 | | | | 34 | |
| | | | | | | | | |
A | | | 11 | | | | 17 | | | | 1 | | | | 29 | | | | (17 | ) | | | (4 | ) | | | 8 | | | | 10 | |
| | | | | | | | | |
A- | | | 7 | | | | 7 | | | | 44 | | | | 58 | | | | (7 | ) | | | (33 | ) | | | 18 | | | | 4 | |
| | | | | | | | | |
BBB+ | | | 8 | | | | 16 | | | | – | | | | 24 | | | | (17 | ) | | | (15 | ) | | | (8) | | | | (3 | ) |
| | | | | | | | | |
BBB | | | – | | | | 5 | | | | – | | | | 5 | | | | – | | | | (9 | ) | | | (4) | | | | (2 | ) |
Total | | | $213 | | | | $334 | | | | $141 | | | | $688 | | | | $(357 | ) | | | $(177 | ) | | | $154 | | | | $278 | |
* As a result of netting agreements.
Credit risk for marketable securities and derivative instruments is reported on a quarterly basis to the Asset Liability Management Committee and to the Risk Management Committee of the Board.
Capital Management
Our capital management framework ensures that we are appropriately capitalized and that our capital position is identified, measured, managed and regularly reported to the Board. Being appropriately capitalized has allowed us to fulfill our mandate and sustain continued risk capacity for Canadian exporters and investors despite a more challenging credit environment.
We target a level of capitalization sufficient to cover potential losses consistent with a rating standard of AA. This solvency standard aligns with that of leading financial institutions and with the key principles of financial self-sufficiency.
We define capital supply as the sum of total equity and allowances, as determined in accordance with IFRS. We quantify demand for capital arising from credit, market, operational and business risks using methodologies that are generally consistent with Basel III standards. Capital adequacy is determined by comparing supply of capital to demand for capital.
We measure and report changes to capital supply, capital demand and its implied solvency rating to executive management monthly. These capital measures are reported regularly to the Board together with forward looking stress tests which model the potential impact on capital of portfolio migration and other key risk events.
| | | | | | | | |
as at December 31 (in millions of Canadian dollars) | | 2013 | | | 2012 | |
Demand for capital | | | | | | | | |
| | | |
Credit risk | | | 5,937 | | | | 6,391 | |
| | | |
Market risk | | | 1,027 | | | | 799 | |
| | | |
Operational risk | | | 395 | | | | 378 | |
Total demand for capital | | | $7,359 | | | | $7,568 | |
| | | |
Supply of capital | | | $10,196 | | | | $10,618 | |
EDC implied solvency rating | | | AAA | | | | AAA | |
Our capital is first and foremost available to support Canadian exporters and investors for the benefit of Canada. It is EDC’s intention to utilize its capital fully to support its mandate but in circumstances when it finds itself in a capital surplus position then the Board of Directors considers authorizing a dividend. As such our Capital Adequacy Policy includes a dividend methodology to guide the Board of Directors in determining a potential dividend amount. This dividend methodology was revised in 2013 after consultation with the Shareholder. A dividend payment of $1.44 billion was made in 2013 which was the primary reason behind the reduction in EDC’s capital surplus. Nonetheless, at the end of 2013 our implied solvency rating remains robust at AAA.
We strive to ensure that our risk and capital management policies are aligned with industry standards and are appropriately sophisticated relative to our risk profile and business operations.
| | | | |
| 66 | | Turning the Corner on Trade | | |
Off Balance Sheet Arrangements
In the normal course of business, we engage in a variety of transactions with structured entities (SEs). SEs are generally created for a single purpose, have a limited lifespan and are used for risk management, legal or taxation reasons to hold specific assets for its benefactors. These transactions are generally undertaken for risk, capital and funding management purposes that benefit our clients. In accordance with IFRS, those SEs where we are not exposed, or have rights, to variable returns from our involvement with the SE and do not have decision-making power to affect the returns of the SE, have not been consolidated on our statement of financial position.
In certain financing transactions, SEs are used to securitize assets and are typically highly debt-leveraged and, in certain circumstances, equity guarantees may also be used. EDC may also use SEs to hold assets that have been foreclosed upon and cannot be held directly for legal or taxation reasons, typically for foreclosed assets in foreign countries.
Financial Instruments
Given the nature of our business, our assets and liabilities are substantially composed of financial instruments. Financial instrument assets include cash resources, securities, investments, loans and recoverable insurance claims, while financial instrument liabilities include accounts payable, loans and loan guarantees. We also use a variety of derivative instruments including interest rate swaps, cross currency interest rate swaps, foreign exchange swaps, foreign exchange forwards, non-deliverable forwards, non-deliverable foreign exchange swaps and credit default swaps.
In accordance with IFRS, the majority of financial instruments are recognized on the statement of financial position at their fair value. These financial instruments include marketable securities at fair value through profit or loss, investments at fair value through profit or loss, derivative instruments and loans payable designated at fair value through profit or loss. Note 2 of the consolidated financial statements outlines the accounting treatment for our financial instruments while Note 28 provides details of how their fair values are determined.
We use derivatives to manage interest rate risk, foreign exchange risk and credit risk. These derivatives are only contracted with creditworthy counterparties in accordance with policies established in the Risk Management Office and approved by our Board of Directors. Both our internal policies and guidelines and those set by the Minister of Finance limit our use of derivatives. We do not use derivatives for speculative purposes. We manage our exposure to derivative counterparty credit risk by contracting only with creditworthy counterparties, and in certain cases entering into collateral agreements with those counterparties. For further discussion on our risk management framework, refer to the Risk Management discussion on the following pages.
| | | | |
| | EDC Annual Report 2013 | | 67 |
MANAGEMENT’S DISCUSSION AND ANALYSIS
Risk Management

“Risk Management was front and centre at EDC in 2013. Facilitated by strong involvement from EDC’s Board of Directors, the corporation developed and rolled out a new Enterprise Risk Management (ERM) Framework and created its first ever Risk Appetite Statement. Under our new framework, risk management is broken down into three Risk Modules, financial risk, strategic risk and operational risk, with levels of appetite and tolerance spelled out in each sub-group beneath these.
We took several major steps forward in financial risk management, completing a three year project to introduce internal ratings based (IRB) credit ratings, completing our first reverse stress testing exercise and rolling out new risk reporting to the Board of Directors. It was also a year of change: with the departure of Stephen Poloz in May, Pierre Gignac, formerly SVP and Chief Risk Officer, Enterprise Risk Management, was appointed Acting President and CEO of EDC. We also welcomed a new head of our Legal Services group, Josée Gravel and we completed our first corporate wide disaster simulation in five years to test our business continuity readiness.”
Bruce Dunlop,
Vice-President, Risk Management and Acting Chief Risk Officer
EDC’s capital position remained strong in 2013, with solvency remaining above the AA target, enabling the corporation to pay a dividend of $1.44 billion. Semi-annual stress testing as well as the first ever “reverse stress test” indicated that EDC’s capital position remains resilient to a wide range of shocks. EDC’s loan and insurance portfolios continued to improve in 2013, with impaired loans and pending insurance claims returning to lower levels. The biggest changes in the portfolio were, on the up-side, the emergence of American Airlines, Inc. from bankruptcy protection and on the down-side a reduction in the expected recoverable amount of a large political risk insurance claim charge in the Middle East.
| | | | |
| 68 | | Turning the Corner on Trade | | |
Risk Management Overview
Our business activities expose us to a wide variety of risks including financial, operational and strategic risks. Our ability to manage these risks is a key competency within the organization, and is supported by a strong risk culture and an effective risk management approach. We manage our risks by seeking to ensure that business activities and transactions provide an appropriate balance of return for the risks assumed and remain within our risk tolerance.
Our Risk Management practice sets out the major risk categories and identifies and defines a broad number of risks to which our businesses and operations could be exposed. This gives us an overall view of all potential risks faced by EDC; and forms the foundation for appropriate risk oversight processes, communication and reporting.
Risk identification and measurement are important elements of our Risk Management practice. We have enterprise-wide methodologies, models and techniques in place to measure both the quantitative and qualitative aspects of risks, appropriate for the various types of risks we face. These methodologies, models and techniques are subject to periodic assessment and review for appropriateness and reliability. Through an annual risk survey, involving interviews with management, we are able to identify and proactively address emerging risks and opportunities.
We also use techniques such as sensitivity analysis and stress testing to help ensure that the risks remain within our risk tolerance and that our capital is adequate to cover those risks. Our stress testing program includes evaluation of the potential effects of severe but plausible economic and market scenarios on our risk profile.
We continue to build upon our risk management foundation and strive for continuous improvement. Efforts are currently underway to enhance our risk management infrastructure, processes and capabilities. We believe that the steps we have taken and the initiatives we continue to pursue position us to successfully execute on our business strategy.
Risk Governance, Oversight and Design
Our risk governance structure emphasizes and balances strong central oversight and control of risk with clear accountability for, and ownership of, risk within each business unit. This structure supports the flow of information between the business units, the members of the Executive Team, who represent each significant business unit and corporate oversight function, the President and Chief Executive Officer (CEO) and the Board of Directors.
Board and its Committees
Board of Directors
The Board of Directors (the Board) is ultimately responsible for Risk Governance by setting the cultural tone, approving the Risk Appetite Statement and ERM Framework and seeking assurance of the effectiveness of the ERM program. The Board provides oversight and carries out its mandate with respect to risk and capital management through the Risk Management Committee of the Board and the Audit Committee of the Board. The Board maintains overall responsibility for approval of (i) risk management and accounting policies and (ii) our Code of Business Ethics and Code of Conduct and (iii) the Environmental Review Directive. The Board also maintains oversight responsibilities for the management of the credit, market and other enterprise risks of the Corporation, as well as oversight of the appropriateness of internal control systems and policies governing Corporate Social Responsibility.
Risk Management Committee of the Board
This Committee assists the Board in fulfilling its oversight responsibilities with respect to the prudent management of our capital structure, including the management of the credit, market and other enterprise risks of the Corporation.
Audit Committee of the Board
This Committee assists the Board in fulfilling its oversight responsibilities with respect to our standards of integrity and behaviour, financial reporting and internal control systems. The Audit Committee also monitors our corporate compliance program.
Key Risk Committees
Executive Management Team
The Executive Management team, led by the President and CEO and including the executives reporting directly to the President and CEO, provides management oversight of risk management by determining risk appetite, approving policies and procedures and overseeing execution of risk management activities. The Executive Management Team has primary responsibility for the management of our risks, standards of integrity and behaviour, financial reporting and internal control systems. The Executive Management team undertakes this responsibility through various management oversight committees, by ensuring an appropriate organizational structure and governing policies are in place and through independent validation by audit.
Management Risk Management Committee
This Committee provides an independent endorsement as to the acceptability of certain credit commitments and acts as the authority for recommending risk policies to the Board for approval and establishing internal risk management policies and procedures.
| | | | |
| | EDC Annual Report 2013 | | 69 |
MANAGEMENT’S DISCUSSION AND ANALYSIS
Asset Liability Management Committee
This Committee acts as authority for recommending Market Risk Management policies to the Board for approval and ensuring that policies are supported by appropriate procedures and practices for the measurement, management and reporting of market risk. In addition, the Committee ensures that market risk positions are managed within policy limits and addresses such risk practices as diversification requirements and reporting and monitoring of guidelines.
Risk Transfer Committee
This Committee acts as authority to endorse recommendations for certain risk transfer activities for portfolio management purposes.
Key Risk Management Groups
Enterprise Risk Management (ERM) Group
The ERM Group is headed by the SVP and Chief Risk Officer, Enterprise Risk Management, and provides independent oversight and governance with respect to risk identification, measurement, control, monitoring and reporting. The ERM Group is also responsible for design, maintenance and evolution of the ERM Framework. The Risk Management Office (RMO) as part of the ERM Group works with the business segments and other corporate oversight groups to establish policies, standards, and limits that align with EDC’s risk tolerance and monitors and reports on existing and emerging risks and compliance with EDC’s risk tolerance. The RMO provides a framework for relating risks to capital requirements through capital modeling and stress testing practices and helps determine EDC’s capital adequacy requirements.
Corporate Finance and Control (CFC)
CFC is responsible for financial planning, accounting, financial reporting and cash management. CFC ensures that appropriate controls exist to ensure complete and accurate financial reporting and effective cash management.
Internal Audit (IA)
IA is responsible for evaluating the design and operating effectiveness of internal controls related to the achievement of business objectives pertaining to efficiency and effectiveness of operations, reliability of financial reporting and compliance with laws and regulations. IA evaluates internal controls based on the criteria established in the “Internal Control – Integrated Framework” issued by the Committee of Sponsoring Organizations of the Treadway Commission (COSO). IA’s work is conducted in accordance with the International Standards for the Professional Practice of Internal Auditing, incorporating Enterprise Risk Management and including input from management. IA reports audit results to management and the Audit Committee.
Business Units
Business units are accountable for management and control of significant risks to which they are exposed. Business units work in partnership with the RMO to ensure that credit and market risks arising from their business are managed within approved limits as set out in risk policies.
Risk Modules
EDC’s newly adopted Risk Management Framework breaks risk down into three broad Risk Modules, expressing the corporation’s risk appetite and tolerance in each of i) Financial Risk, ii) Operational Risk and iii) Strategic Risk. As a financial institution, financial risk is naturally front and centre and as a result the majority of this report covers this area.
Financial Risk
Portfolio Risk Profile
While EDC follows leading risk management practice, we generally assume more risk than a typical financial institution due to our mandate. We take on larger single counterparty exposures and larger concentration exposures by sector than other financial institutions, most notably in the transportation and extractive sectors which lead Canadian exports.
Despite significant activity with investment grade borrowers in 2013, the vast majority of EDC’s risk profile, as determined by capital demand for credit risk, emanates from the sub-investment grade space. As can be seen in the chart below, although only 43% of EDC’s loan portfolio is sub-investment grade, 86% of capital demand (credit risk) is attributable to this category of obligor.
| | | | | | | | | | | | | | | | |
| | | | | |
as at December 31 (in billions of Canadian dollars) | | Notional
exposure* | | | % of total | | | Demand for capital
(credit risk) | | | % of total | |
Investment grade | | | 30.9 | | | | 57 | | | | 0.7 | | | | 14 | |
| | | | | |
Sub-investment grade | | | 23.6 | | | | 43 | | | | 4.2 | | | | 86 | |
Total | | | $54.5 | | | | 100 | | | | $4.9 | | | | 100 | |
* Includes all financing exposure that attracts demand for capital.
| | | | |
| 70 | | Turning the Corner on Trade | | |
EDC’s large exposure concentrations reflect the significance of the transportation and extractive sectors to Canada’s economy and EDC’s mandate to help Canadian exporters. In order to mitigate this risk, EDC carries a large capital base and conducts a semi-annual stress testing exercise to test its resilience to downside event risk.
Credit Risk Management
Credit risk is the risk of loss incurred if a counterparty fails to meet its financial commitments. We are exposed to credit risk under our loans and insurance programs and treasury activities.
We manage credit risk in the organization through policy requirements, established authorities and limits, mitigation activities and reporting. Our credit risk policies set out our requirements on credit granting, concentration, counterparty and country limits, risk rating, exposure measurement, monitoring and review, portfolio management and risk transfer, as well as management and Board reporting.
Credit Granting
We deliver our products and services through sector-based business teams grouped under insurance or financing. The business teams are responsible for the proper due diligence associated with each credit commitment. Every credit commitment requires recommendation and approval. Credit commitments in excess of certain thresholds also require independent endorsement or co-authorization by the RMO or the Management Risk Management Committee. The purpose of endorsement or co-authorization is to ensure that all relevant, tangible risks in the proposed credit commitment have been identified, assessed and mitigated where possible. The credit rating of a transaction and/or the dollar amount of exposure at risk determines whether involvement is required by the Management Risk Management Committee or the RMO. All transactions above U.S. $300 million require authorization by the Board. However, this threshold can be reduced to as low as U.S. $200 million for transactions with lower credit quality. Our credit approval process includes early involvement of a senior management committee in the transaction review process and more integrated engagement on transactions between our risk management, underwriting and business development professionals.
Our approval responsibilities are governed by delegated authorities. The Board in effect delegates specific transactional approval authorities to the CEO. Onward delegation of authority by the CEO to business units is controlled to ensure decision-making authorities are restricted to those individuals with the necessary experience levels. The criteria whereby these authorities may be further delegated throughout the organization, as well as the requirements relating to documentation, communication and monitoring of delegated authorities, are set out in corporate policies and standards.
We bear counterparty risk through our treasury liquidity and derivative portfolios. Treasury counterparties are analyzed and credit limits are recommended by Market Risk Management (MRM), a team within the RMO. Recommended counterparties are endorsed by either the RMO or Management Risk Management Committee. Every treasury credit commitment requires the approval of at least two individuals with delegated approval authority. All treasury credit exposures are measured on a fair value basis and compliance with policy and operational limits is measured daily. In addition, we have policies and procedures in place to limit and to manage the credit risk associated with these financial instruments and to define collateral requirements for treasury counterparties.
Concentration Limits
To ensure diversification of risks within our credit commitments, we have established risk limits in place to protect against being overly concentrated to any one country, industry sector or commercial obligor. All limits are determined based on our capital base and risk factors associated with the exposure including the obligor rating, country rating, associated collateral and EDC product type. Exposures beyond the risk limits require either Presidential approval within discretionary limits or review by the Risk Management Committee and approval of the Board.
Risk Ratings
Consistent with the Basel II Advanced Internal Rating-Based approach, credit risk is measured by assigning (i) a risk rating to an obligor that is tied to a probability of default (PD). The PD describes the likelihood of a default of an obligor over a one year period and (ii) a rating to a transaction in the form of a loss given default (LGD) estimate. The LGD estimates the percentage of dollar exposure which EDC reasonably expects to lose should a default occur on a specific transaction.
In 2011, EDC initiated a multi-year project to develop an internal credit risk rating system that measures obligor and transaction risks for a majority of our risk exposure. The implementation was fully completed in 2013. This new risk rating system utilizes a 20 point rating scale to differentiate the PD of obligors. While our obligor rating will be arrived at independently of external ratings for the obligor, our risk-rating methodology includes a review of those external ratings.
For the remaining obligors, we continue to use our existing process. Many of the obligor risk rating methodologies use a combination of Moody’s and/or Standard & Poor’s external ratings and/or our internal ratings based (IRB) methodologies. Some of our IRB methodologies use vendor provided credit risk analysis/ratings tools such as RiskCalc. At the credit granting stage, all obligors are rated except for obligors with very small exposures (typically representing less than 1% of total exposure). We rate our obligors on a rating scale of between 8 and 20 credit grades depending on the product type. The obligor risk ratings are reviewed on a regular basis.
Our Economics team is responsible for establishing, monitoring and approving country risk ratings. Country risk ratings are continually reviewed to take into consideration any changes in the world environment or a specific country.
For treasury related counterparties, each counterparty must be rated by at least two external rating agencies for credit exposure of greater than one year term to maturity and at least one external rating agency for credit exposure of less than one year term to maturity. The risk rating for treasury counterparties is based on the external ratings.
| | | | |
| | EDC Annual Report 2013 | | 71 |
MANAGEMENT’S DISCUSSION AND ANALYSIS
Exposure Measurement
To ensure that the level of credit risk is transparent to both management and the Board, our credit exposure measurement guideline requires information reporting and comparison of the aggregated exposures within a portfolio against prescribed limits such as country, industry, and commercial obligor. We also report on approved short-term buyer limits under our accounts receivable insurance program.
Monitoring and Review
Our operating practices include ongoing monitoring of credit exposures. Specialized teams have been created to monitor and manage credit exposure within the different product lines which include monitoring of events in the country and industry of the obligor. The Credit Risk Management team within the RMO is responsible for managing the credit quality and financial performance of our portfolio of commercial loans and guarantees both at the transaction and portfolio levels. This specialized team undertakes loan reviews, assesses risk ratings and regularly monitors borrowers and the credit risk environment including research and assessment of financial, operating and industry trends. Our portfolio of credit insurance counterparties is actively monitored by our Risk Assessment and Portfolio Management team. In addition, deteriorating credits are managed by teams that specialize in restructurings, Paris Club reschedulings, claims and recoveries. Management and the Board are frequently apprised on the credit quality of the portfolio through regular reporting including detailed quarterly reporting on the breakdown of the portfolio by risk ratings, impaired obligors, loan write-offs and claims information.
Portfolio Management
The goal of portfolio management is to ensure our ability to pursue mandate related opportunities while taking into consideration the availability of financial resources and limit constraints. Management and the Board are regularly updated on our portfolio of credit exposures through quarterly compliance reporting against concentration limits. We use both primary and secondary portfolio management activities to address imbalances or excess concentrations including, but not limited to, syndication at credit origination, the sale of assets, insurance, reinsurance and hedging using credit derivatives.
We continue to make use of insurance and credit derivatives for risk mitigation purposes targeting large exposures in our loan portfolio. To address credit concentration in our insurance portfolios we engage in various risk transfer activities primarily through reinsurance and co-insurance.
Management and Board Reporting
The RMO provides timely and comprehensive risk reporting to management and the Board on major risks being assumed by or facing EDC, enabling appropriate management and oversight. This reporting includes, but is not limited to a (i) quarterly risk management report which was redesigned and overhauled in 2013, (ii) monthly credit risk policy compliance report, (iii) monthly capital adequacy report and (iv) monthly report detailing our liquidity position. Ad-hoc risk reporting is provided to senior management and the Board as warranted for new or emerging risk issues or significant changes in our level of risk. Significant credit risk issues and action plans are tracked and reported to ensure management accountability and attention are maintained.
Market Risk Management
Market risk is the risk that the fair value or future cash flows of a financial instrument will fluctuate because of changes in market prices. Market risk comprises three types of risk: foreign exchange risk, interest rate risk and other price risk. We are exposed to potential losses as a result of movements in interest and foreign exchange rates.
Through our policies and procedures, we ensure that market risks are identified, measured, managed and regularly reported to management and the Board. Our Market Risk Management Policy sets out our requirements on interest rate and foreign exchange exposure limits, liquidity, investment, debt funding, derivatives and structured notes, management of the credit risk for treasury counterparties and management and Board reporting. The Asset Liability Management Committee, which is chaired by the Chief Financial Officer, oversees and directs the management of market risks inherent within our normal business activities. Risk oversight is provided by the MRM team within the RMO.
Interest Rate Risk
Interest rate risk is the risk that the fair value or future cash flows of a financial instrument will fluctuate because of changes in market interest rates. We are exposed to potential adverse impacts on the value of financial instruments resulting from differences in the maturities or repricing dates of assets and liabilities both on and off-balance sheet, as well as from embedded optionality in those assets and liabilities.
Our interest rate risk is managed in accordance with guidelines established by the Department of Finance as well as policies set by the Board. We report interest rate risk on a quarterly basis to the Asset Liability Management Committee and to the Risk Management Committee of the Board.
Management of interest rate risk is enabled through monthly risk position monitoring against limits and reporting. Interest rate risk is measured by simulating the impact of a 100 basis point change on our net financing and investment income.
Interest Rate Sensitivity
The table below presents the sensitivity of the net financing and investment income and net income to a parallel 100 basis point change in interest rates given the outstanding positions as at December 31, 2013:
| | | | |
| 72 | | Turning the Corner on Trade | | |
Interest Rate Change
| | | | | | | | |
| | | |
| (in millions of Canadian dollars) | | 2013 | | 2012 |
| | | +100 Basis Points | | -100 Basis Points | | +100 Basis Points | | -100 Basis Points |
Change in net financing and investment income | | (35) | | 35 | | (21) | | 21 |
Change in net income | | (45) | | 83 | | (34) | | 61 |
Foreign Exchange Risk
Foreign exchange risk is the potential adverse impact on the value of financial instruments resulting from exchange rate movements. We are exposed to foreign exchange rate risk when there is a mismatch between assets and liabilities in any currency.
Our foreign exchange risk is managed in accordance with guidelines established by the Department of Finance as well as policies approved by the Board. We report our foreign exchange risk on a quarterly basis to the Asset Liability Management Committee and to the Risk Management Committee of the Board.
In addition to the guidelines and policies described above, we also have supplemental operational limits and reporting requirements. Management of foreign exchange risk is enabled through monthly risk position monitoring against limits and reporting.
As per our policy, the potential translation loss impact to one month’s net financing and investment income (NFII) as measured by a two standard deviation change in foreign exchange rates is limited to 2.5% of projected 12 month NFII, on a consolidated Canadian dollar equivalent basis.
As the table below indicates, we were onside our policy as at December 31, 2013.
Foreign Exchange Positions against Limit
| | | | | | |
| | | |
| (in millions of Canadian dollars) | | 2013 | | | 2012 |
Limit | | | 27 | | | 26 |
Position | | | 18 | | | 17 |
The table below presents the sensitivity of net income to changes in the value of the Canadian dollar versus the other currencies to which we were exposed given the outstanding positions as at December 31, 2013:
Canadian Dollar Relative to Other Currencies
| | | | | | | | |
| | | |
| (in millions of Canadian dollars) | | 2013 | | 2012 |
| | | Increases by 1% | | Decreases by 1% | | Increases by 1% | | Decreases by 1% |
Change in net income | | 3 | | (3) | | 2 | | (2) |
Derivative Instruments
We use a variety of derivative instruments to manage costs, returns and levels of financial risk associated with funding, investment and risk management activities. The principal purpose for which we use derivative instruments is to hedge against foreign exchange and interest rate risk. Our use of derivative instruments may include, but is not restricted to, currency and interest rate swaps, foreign exchange swaps, credit default swaps, futures and options. We do not use derivative instruments for speculative purposes.
We do not engage in the use of derivative instruments whose value and financial risks cannot be measured, monitored and managed on a timely basis. The MRM team formally reviews our derivative instrument transactions at time of inception, and on an ongoing basis to provide an independent verification on the valuation of transaction structures and of associated financial risks.
Derivative instruments are used to hedge risks by diversifying concentrated exposures. For example, we may balance the proportion of fixed to floating assets in our portfolio using interest rate swaps in order to diversify interest rate risk.
The following table indicates the fair value of our derivative instruments based upon maturity:
| | | | | | |
| (in millions of Canadian dollars) | | Positive | | Negative | | Net |
Less than 1 year | | 213 | | (108) | | 105 |
1 – 3 years | | 334 | | (132) | | 202 |
Over 3 – 5 years | | 97 | | (314) | | (217) |
Over 5 years | | 44 | | (72) | | (28) |
Gross fair value of contracts | | $688 | | $(626) | | $62 |
| | | | |
| | EDC Annual Report 2013 | | 73 |
MANAGEMENT’S DISCUSSION AND ANALYSIS
Liquidity Risk Management
Liquidity risk is the risk that we would be unable to honour daily cash outflow commitments or the risk that we would have to obtain funds rapidly, possibly at an excessively high premium during severe market conditions. Liquidity risk arises from two sources: mismatched cash flows related to assets and liabilities and liquidity risk due to the inability to sell marketable securities in a timely and cost effective manner.
Our treasury department is responsible for our liquidity management and the MRM team is responsible for monitoring compliance with our policies and procedures. Pursuant to our risk management policies, we must maintain sufficient liquidity to meet a prescribed minimum level, based on forecasted cash requirements.
Within the overall policy framework, we manage our liquidity risk both within the overall policy limits and also within supplemental limits. The MRM team measures our position on a daily basis and provides a monthly report to senior management on our actual liquidity position against this minimum limit, as well as a quarterly report to the Risk Management Committee of the Board.
We maintain liquidity through a variety of methods:
| | |
| | Cash and Marketable Securities: We hold cash and marketable securities to ensure that sufficient liquidity is available if required to meet forecasted cash requirements. During 2013, the average balance of cash and marketable securities was $4,063 million. |
| |
| | Access to Commercial Paper Markets: In the course of our normal activities, our commercial paper programs provide us with the necessary liquidity to meet our cash requirements on a daily basis. During 2013, the average balance of commercial paper was $5,824 million. |
Investment Risk
The Investment Policy defines the marketable securities investments that we may undertake in the market place by instrument type. The investment of corporate cash holdings is governed by Section 10(1.1)(h) of the Export Development Act, Section 128 of the Financial Administration Act, and the Corporation’s Investment Authorities approved by the Minister of Finance.
Debt Funding
The Export Development Act places limitations on our borrowings. The Act allows us to borrow and have outstanding borrowings up to a maximum of 15 times the aggregate of (a) our current paid-in capital and (b) our retained earnings determined in accordance with the previous year’s audited financial statements.
The Minister of Finance, pursuant to the requirements of the Financial Administration Act, annually approves the borrowings of the Corporation. The Debt Funding Policy is monitored on a monthly basis and reported to management and the Board on a quarterly basis.
Contractual Obligations
In the normal course of business, we enter into contracts that give rise to commitments of future minimum payments.
We have two types of loan commitments. The first type is undisbursed amounts on signed loan agreements. The second type represents commitments we entered into, for which terms related to the transaction such as interest rate type and disbursement schedule have not yet been determined. This category includes letters of offer accepted and outstanding for loans as well as unallocated confirmed lines of credit (LOC).
Purchase obligations include those obligations that are legally binding agreements whereby we have agreed to purchase products or services with specific minimum quantities defined as fixed, minimum or variable in price over a specified period of time.
The following table provides a summary of our future payments on contractual commitments:
| | | | | | | | | | | | | | | | | | | | | | |
| (in millions of Canadian dollars) | | Under 1
year | | | 1 to 3
years | | | Over 3 to 5
years | | | Over 5
years | | | 2013 Total | | | 2012 Total |
Long-term debt | | | 8,249 | | | | 11,913 | | | | 5,529 | | | | 1,229 | | | | 26,920 | | | 23,042 |
Short-term debt | | | 5,913 | | | | – | | | | – | | | | – | | | | 5,913 | | | 4,438 |
Other long-term payable | | | 6 | | | | 13 | | | | 13 | | | | 24 | | | | 56 | | | 62 |
Undisbursed loan commitments | | | 14,885 | | | | – | | | | – | | | | – | | | | 14,885 | | | 13,391 |
Undisbursed investment commitments | | | 26 | | | | 33 | | | | 166 | | | | 316 | | | | 541 | | | 417 |
Letters of offer accepted and outstanding | | | 4,485 | | | | – | | | | – | | | | – | | | | 4,485 | | | 3,857 |
Unallocated confirmed LOC | | | 157 | | | | – | | | | – | | | | – | | | | 157 | | | 111 |
Leases | | | 26 | | | | 52 | | | | 55 | | | | 344 | | | | 477 | | | 574 |
Purchase obligations | | | 27 | | | | 8 | | | | 1 | | | | – | | | | 36 | | | 40 |
Total | | | $33,774 | | | | $12,019 | | | | $5,764 | | | | $1,913 | | | | $53,470 | | | $45,932 |
| | | | |
| 74 | | Turning the Corner on Trade | | |
Operational Risk Management
Operational risk is the risk of loss resulting from inadequate management functions (e.g. frameworks, protocols, guidelines, procedures and communication channels) to govern, assess and respond to the risks associated with the effective acquisition, deployment and protection of human, intellectual and physical resources.
We divide operational risk into four broad categories:
| | |
| | People: Attracting, retaining, developing and deploying people with the necessary skill-sets and behaviours. |
| |
| | Information process and technology: Managing information to conduct and enable business. |
| |
| | Legal and compliance: Ensuring legal compliance and policy adherence; and protecting the organization’s rights and interests. |
| |
| | Security and protection: Protecting people and assets; and ensuring business continuity. |
Exposure to operational risk could affect EDC’s ability to achieve our corporate plan by way of lost opportunity, business interruption and/ or damage to our reputation.
EDC has developed specific policies to manage operational risk. Each business segment or corporate function is accountable for ensuring that appropriate guidelines and procedures are established in accordance with the policies that govern their respective areas of responsibility. As well, these leaders are entrusted to manage operational risks on a day-to-day basis. We also maintain a practical and disciplined approach to acquiring appropriate insurance coverage. Further, all of this is supplemented by governance frameworks and conventions such as our Corporate Social Responsibility (CSR) practice and Business Continuity Plan.
EDC has identified a list of key operational risks inherent to our business, e.g. change management, data integrity, information security, internal/external fraud, business continuity, etc. EDC has assessed and continues to assess our exposure to these risks. This is done through a number of means including the biennial Employee Opinion Survey (EOS) and the annual Enterprise Risk Management Survey. The EOS provides us with a mechanism to gather employee input on conditions that enable or inhibit key drivers of performance. The EOS results serve to drive action plans in order to build on our strengths and support corporate values. The annual ERM survey allows us to identify a broad spectrum of risks and facilitates the escalation of concerns to Executive Management and consideration of mitigating action, as appropriate.
In addition, EDC has a discipline around challenging our readiness to respond to a broad range of catastrophic external events. For example, in 2013, EDC simulated the effects of an earthquake to test our readiness to respond. The outcome of this exercise provided good instruction for the development of further actions to mitigate potential threats.
Finally, Internal Audit’s independent review provides additional assurance that operational risks are appropriately managed.
Strategic Risk Management
Strategic risk arises when an organization fails to read the environment, formulate strategies with sufficient forward vision to ensure ongoing relevance and longevity, develop products and services to address market dynamics and requirements and cascade the strategy throughout the organization. Strategic Risk Management is particularly important for EDC in light of our mandate to support, facilitate and serve to create trade.
We subdivide strategic risk into three overarching themes:
| | |
| | External environment: Systematic identification and assessment of external risks and opportunities. |
| |
| | Planning: Formulating and communicating corporate direction and objectives. |
| |
| | New opportunities and innovation: Assuring organizational capacity to evolve and innovate. |
EDC is diligent in attuning itself to the external environment through the work of specialized groups such as Economic and Political Intelligence Centre (EPIC), the Corporate Research Department (CRD) and the Market Strategy team. Our annual environmental scan involves a comprehensive assessment of risks and opportunities. As well, our annual customer survey that drives our net promoter score and our proactive business development practice affords us critical insights into customer needs. The insight gained from these surveillance activities is incorporated into our annual planning exercises.
Our Corporate Social Responsibility (CSR) practice is built on five pillars: business ethics, the environment, transparency, community investment and organizational climate and plays a central role in our ongoing formulation of business strategy. We recognize that growth and sustainability must be addressed simultaneously and that CSR is intrinsic to achieving sustainable trade. In addition our focus on CSR instills the need to be conscientious of the environmental impacts of our business, to act in accordance with the highest ethical standards and invest in our communities and employees.
| | | | |
| | EDC Annual Report 2013 | | 75 |
MANAGEMENT’S DISCUSSION AND ANALYSIS
Critical Accounting Policies and Estimates
A summary of our significant accounting policies can be found in Note 2 of our December 2013 consolidated financial statements. Judgment is required in the selection of accounting policies, and their application requires the use of estimates and assumptions to arrive at the reported carrying values of our assets and liabilities. We have established procedures to ensure that accounting policies are applied consistently and that the process for making changes to methodologies and assumptions is well controlled, and occurs in an appropriate and systematic manner. Areas where significant estimates are used include the allowance for losses on loans, loan commitments and guarantees, equipment available for lease, premium and claims liabilities, recoverable insurance claims, retirement benefit obligations and financial instruments measured at fair value. For details on our use of judgment and estimates refer to page 91 of this annual report.
Change in Accounting Standards
The International Accounting Standards Board (IASB) has issued a number of new standards and interpretations effective as of January 1, 2013 and these are discussed in Note 2 of our consolidated financial statements. In addition, the IASB is currently working on projects related to financial instruments, insurance contracts, leases and revenue recognition. Revisions made to these standards could potentially have a significant impact on EDC’s financial statements in the coming years.
Non-IFRS Performance Measures
We use a number of financial measures to assess our performance. Some of these measures are not calculated in accordance with IFRS, and do not have standardized meanings under IFRS that would ensure consistency and comparability between companies using these measures. The following non-IFRS performance measures are referenced in this report:
Productivity Ratio (PR)
Management uses PR as a measure of EDC’s efficiency. This ratio represents administrative expenses expressed as a percentage of net revenue excluding unrealized gains and losses on our long-term debt and derivatives as well as the impact due to fluctuations in the exchange rate from the rate projected in the Corporate Plan. As pension costs can fluctuate from year to year based on assumptions used to value the pension liability, the productivity ratio is calculated based on the pension assumptions in the Corporate Plan, with the intent of absorbing any changes in the following year.
Capital Adequacy
Capital adequacy is a measurement of the amount of capital required to cover the credit, market, operational and business risks we have undertaken compared to the existing capital base. See the “Capital Management” section for details on the definition and calculation of capital adequacy.
Claims Ratio
The claims ratio expresses net claims incurred as a percentage of net premiums earned. Net claims incurred includes claims paid net of recoveries and changes in actuarial liabilities. The table below includes activities in the credit insurance program.
Reinsurance assumed and ceded reflect various partnerships we have with private insurers and reinsurers in offering and managing insurance capacity.
Updated assumptions used in the actuarial calculation of the premium liabilities resulted in the increase in net claims incurred and a higher claims ratio for 2013.
| | | | |
| | | |
| (in thousands of Canadian dollars) | | 2013 | | 2012 |
Direct premiums | | 101,557 | | 108,196 |
Reinsurance assumed | | 6,221 | | 4,280 |
Reinsurance ceded | | (7,010) | | (6,267) |
Net premiums earned | | $100,768 | | $106,209 |
Direct net claims incurred | | 55,572 | | 1,904 |
Net claims incurred – reinsurance assumed | | 1,599 | | 2,570 |
Net claims incurred | | $57,171 | | $4,474 |
Claims ratio | | 56.74% | | 4.21% |
| | | | |
| 76 | | Turning the Corner on Trade | | |
Supplemental Information
Table 1: Loan Interest Yield
| | | | | | | | | | | | | | | | | | |
| | | | | | |
| (in millions of Canadian dollars) | | 2013 | | | 2012 | | | 2011 | | | 2010 | | | 2009 |
Gross loans receivable: | | | | | | | | | | | | | | | | | | |
Average performing floating rate | | | 23,801 | | | | 20,304 | | | | 18,356 | | | | 17,518 | | | 18,885 |
Average performing fixed rate | | | 8,198 | | | | 7,655 | | | | 8,087 | | | | 8,229 | | | 9,389 |
Total average performing gross loans receivable | | | 31,999 | | | | 27,959 | | | | 26,443 | | | | 25,747 | | | 28,274 |
Average carrying value on impaired loans | | | 584 | | | | 1,149 | | | | 241 | | | | 326 | | | 311 |
Total average income earning loan assets | | | $32,583 | | | | $29,108 | | | | $26,684 | | | | $26,073 | | | $28,585 |
Loan revenue: | | | | | | | | | | | | | | | | | | |
Performing floating rate interest | | | 579 | | | | 551 | | | | 469 | | | | 440 | | | 563 |
Performing fixed rate interest | | | 394 | | | | 385 | | | | 425 | | | | 460 | | | 561 |
Other loan revenue | | | 201 | | | | 180 | | | | 115 | | | | 104 | | | 197 |
Loan revenue | | | $1,174 | | | | $1,116 | | | | $1,009 | | | | $1,004 | | | $1,321 |
Yields – performing loans: | | | | | | | | | | | | | | | | | | |
Performing floating rate coupon | | | 2.43 | % | | | 2.71 | % | | | 2.56 | % | | | 2.51 | % | | 2.98% |
Performing fixed rate coupon | | | 4.81 | % | | | 5.03 | % | | | 5.26 | % | | | 5.59 | % | | 5.97% |
Total loan yield | | | 3.60 | % | | | 3.83 | % | | | 3.78 | % | | | 3.85 | % | | 4.62% |
Table 2: Net Finance Margin | | | | | | | | | | | | | | | | | | |
| | | | | | |
| (in millions of Canadian dollars) | | 2013 | | | 2012 | | | 2011 | | | 2010 | | | 2009 |
Average performing loans receivable | | | 31,999 | | | | 27,959 | | | | 26,443 | | | | 25,747 | | | 28,274 |
Average carrying value on impaired loans | | | 584 | | | | 1,149 | | | | 241 | | | | 326 | | | 311 |
Average finance lease assets – aircraft | | | 77 | | | | 85 | | | | 94 | | | | 108 | | | 127 |
Average operating lease assets | | | 508 | | | | 169 | | | | 98 | | | | 266 | | | 439 |
Average marketable securities balance | | | 4,000 | | | | 3,959 | | | | 3,551 | | | | 3,765 | | | 4,085 |
Average investment portfolio balance | | | 492 | | | | 433 | | | | 364 | | | | 290 | | | 233 |
Total average income earning assets | | | $37,660 | | | | $33,754 | | | | $30,791 | | | | $30,502 | | | $33,469 |
Financing and investment revenue: | | | | | | | | | | | | | | | | | | |
Loan | | | 1,174 | | | | 1,116 | | | | 1,009 | | | | 1,004 | | | 1,321 |
Finance lease | | | 6 | | | | 6 | | | | 7 | | | | 8 | | | 9 |
Operating lease | | | 55 | | | | 17 | | | | 21 | | | | 32 | | | 32 |
Marketable securities | | | 32 | | | | 36 | | | | 46 | | | | 47 | | | 41 |
Investment | | | 8 | | | | 5 | | | | 12 | | | | 8 | | | 3 |
Total financing and investment revenue | | | 1,275 | | | | 1,180 | | | | 1,095 | | | | 1,099 | | | 1,406 |
Interest expense | | | 30 | | | | 108 | | | | 93 | | | | 147 | | | 381 |
Leasing and financing related expenses | | | 49 | | | | 33 | | | | 32 | | | | 53 | | | 68 |
Net financing and investment income* | | | $1,196 | | | | $1,039 | | | | $970 | | | | $899 | | | $957 |
Net finance margin | | | 3.18 | % | | | 3.08 | % | | | 3.15 | % | | | 2.95 | % | | 2.86% |
* Excludes debt relief.
| | | | |
| | EDC Annual Report 2013 | | 77 |
MANAGEMENT’S DISCUSSION AND ANALYSIS
Table 3: Insurance Premiums and Guarantee Fees
| | | | | | | | | | | | | | | | | | |
(in millions of Canadian dollars) | | 2013 | | | 2012 | | | 2011 | | | 2010 | | | 2009 |
Credit insurance program(1): | | | | | | | | | | | | | | | | | | |
Credit insurance business facilitated | | | 56,257 | | | | 54,140 | | | | 62,924 | | | | 52,220 | | | 52,754 |
Premiums and fees earned prior to ceding reinsurance | | | 110 | | | | 114 | | | | 136 | | | | 124 | | | 109 |
Average credit insurance premium rate | | | 0.20 | % | | | 0.21 | % | | | 0.22 | % | | | 0.24 | % | | 0.21% |
Financial institutions insurance program: | | | | | | | | | | | | | | | | | | |
Financial institutions insurance business facilitated | | | 10,630 | | | | 9,295 | | | | 13,914 | | | | 8,324 | | | 6,037 |
Premiums and fees earned | | | 21 | | | | 18 | | | | 32 | | | | 27 | | | 27 |
Average financial institutions insurance premium rate | | | 0.20 | % | | | 0.19 | % | | | 0.23 | % | | | 0.32 | % | | 0.45% |
Contract insurance and bonding program(2): | | | | | | | | | | | | | | | | | | |
Contract insurance and bonding average exposure | | | 8,309 | | | | 8,303 | | | | 9,090 | | | | 9,892 | | | 10,153 |
Premiums and fees earned | | | 50 | | | | 48 | | | | 58 | | | | 51 | | | 52 |
Average contract insurance and bonding premium rate | | | 0.60 | % | | | 0.58 | % | | | 0.64 | % | | | 0.52 | % | | 0.51% |
Political risk insurance program: | | | | | | | | | | | | | | | | | | |
Political risk insurance average exposure | | | 1,602 | | | | 1,627 | | | | 1,625 | | | | 1,349 | | | 1,388 |
Premiums and fees earned | | | 19 | | | | 22 | | | | 15 | | | | 14 | | | 14 |
Average political risk insurance premium rate | | | 1.19 | % | | | 1.35 | % | | | 0.92 | % | | | 1.04 | % | | 1.01% |
Loan guarantees: | | | | | | | | | | | | | | | | | | |
Loan guarantees average exposure | | | 2,081 | | | | 2,476 | | | | 2,485 | | | | 3,368 | | | 3,843 |
Loan guarantee fees earned | | | 36 | | | | 38 | | | | 32 | | | | 33 | | | 24 |
Average loan guarantee fee rate | | | 1.73 | % | | | 1.53 | % | | | 1.29 | % | | | 0.98 | % | | 0.62% |
(1) Includes $506 million of domestic business facilitated and $1.4 million of premiums in 2013 related to our temporarily expanded mandate. (2) Includes $764 million of domestic exposure and $3.6 million of premiums in 2013 related to our temporarily expanded mandate. Table 4: Provision for (Reversal of) Credit Losses |
(in millions of Canadian dollars) | | 2013 | | | 2012 | | | 2011 | | | 2010 | | | 2009 |
Provision for (reversal of) credit losses pertaining to: | | | | | | | | | | | | | | | | | | |
Loans | | | 43 | | | | (263 | ) | | | 162 | | | | (234 | ) | | 402 |
Loan commitments | | | (14 | ) | | | 18 | | | | (53 | ) | | | (350 | ) | | 1 |
Loan guarantees | | | 1 | | | | (95 | ) | | | 16 | | | | (47 | ) | | 28 |
Total provision for (reversal of) credit losses | | | $30 | | | | $(340 | ) | | | $125 | | | | $(631 | ) | | $431 |
| | | | |
| 78 | | Turning the Corner on Trade | | |
Table 5: Concentration of Exposure by Geographical Market
| | | | | | | | | | | | | | | | | | | | | | | | | | | | | | | | | | | | |
(in millions of Canadian dollars) | | Financing portfolio | | | | Insurance portfolio | | | Marketable
securities and
derivative
instruments(4) | | | | | | |
| | Financing
assets(1) | | Commitments
and
guarantees(2) | | | | Credit
insurance | | Financial
institutions
insurance | | Contract insurance
and bonding | | | Political
risk
insurance(3) | | | Reinsurance
ceded | | | | | | | | |
| | | | | | | Policies | | | Guarantees | | | | | | 2013 Exposure | |
Country | | | | | | | | | | | | | | | | | | | | | | | | | | $ | | | % | |
United States | | 8,196 | | 5,349 | | | | 3,623 | | 147 | | | 213 | | | | 39 | | | | – | | | | – | | | 3,086 | | | 20,653 | | | | 22 | |
| | | | | | | | | | | | | |
Canada | | 4,518 | | 6,542 | | | | 456 | | – | | | 954 | (5) | | | 6,870 | (6) | | | – | | | | – | | | 808 | | | 20,148 | | | | 21 | |
| | | | | | | | | | | | | |
Mexico | | 2,291 | | 1,367 | | | | 192 | | 7 | | | 4 | | | | – | | | | 353 | | | | – | | | – | | | 4,214 | | | | 5 | |
| | | | | | | | | | | | | |
Brazil | | 2,344 | | 814 | | | | 260 | | 197 | | | 18 | | | | – | | | | 299 | | | | – | | | – | | | 3,932 | | | | 4 | |
| | | | | | | | | | | | | |
United Kingdom | | 2,467 | | 685 | | | | 251 | | 99 | | | 2 | | | | 4 | | | | 3 | | | | – | | | 282 | | | 3,793 | | | | 4 | |
| | | | | | | | | | | | | |
Australia | | 2,047 | | 811 | | | | 171 | | – | | | – | | | | – | | | | 4 | | | | – | | | 174 | | | 3,207 | | | | 4 | |
| | | | | | | | | | | | | |
China | | 610 | | 284 | | | | 365 | | 1,195 | | | 35 | | | | – | | | | 538 | | | | – | | | – | | | 3,027 | | | | 3 | |
| | | | | | | | | | | | | |
Chile | | 1,247 | | 433 | | | | 36 | | 130 | | | 1 | | | | – | | | | 369 | | | | – | | | – | | | 2,216 | | | | 2 | |
| | | | | | | | | | | | | |
India | | 1,553 | | 120 | | | | 191 | | 259 | | | 6 | | | | – | | | | 9 | | | | – | | | – | | | 2,138 | | | | 2 | |
| | | | | | | | | | | | | |
Germany | | 700 | | 959 | | | | 148 | | – | | | – | | | | – | | | | – | | | | – | | | 17 | | | 1,824 | | | | 2 | |
| | | | | | | | | | | | | |
Other(7) | | 11,200 | | 4,809 | | | | 2,714 | | 2,511 | | | 107 | | | | 69 | | | | 7,255 | | | | – | | | 387 | | | 29,052 | | | | 31 | |
| | | 37,173 | | 22,173 | | | | 8,407 | | 4,545 | | | 1,340 | | | | 6,982 | | | | 8,830 | | | | – | | | 4,754 | | | 94,204 | | | | 100 | |
Country limits in excess of policy limits(3) | | – | | – | | | | – | | – | | | – | | | | – | | | | (7,147) | | | | – | | | – | | | (7,147 | ) | | | – | |
| | | | | | | | | | | | | |
Reinsurance ceded(8) | | – | | – | | | | – | | – | | | – | | | | – | | | | – | | | | (150 | ) | | – | | | (150 | ) | | | – | |
Total | | $37,173 | | $22,173 | | | | $8,407 | | $4,545 | | | $1,340 | | | | $6,982 | | | | $1,683 | | | | $(150 | ) | | $4,754 | | | $86,907 | | | | 100 | |
| | | | | | | | | | | | | | | | | | | | | | | | | | | | | | | | | | | | |
(in millions of Canadian dollars) | | Financing portfolio | | | | Insurance portfolio | | | Marketable
securities and derivative
instruments(4) | | | | | | |
| | Financing
assets(1) | | Commitments
and
guarantees(2) | | | | Credit
insurance | | Financial
institutions
insurance | | Contract insurance
and bonding | | | Political
risk
insurance(3) | | | Reinsurance
ceded | | | | | | | | |
| | | | | | | | | | | | | | | | | | | | |
| | | | | | | Policies | | | Guarantees | | | | | | 2012 Exposure | |
Country | | | | | | | | | | | | | | | | | | | | | | | | | | $ | | | % | |
United States | | 8,267 | | 3,970 | | | | 3,709 | | 75 | | | 180 | | | | 77 | | | | – | | | | – | | | 3,395 | | | 19,673 | | | | 23 | |
| | | | | | | | | | | | | |
Canada | | 4,189 | | 4,915 | | | | 361 | | 3 | | | 1,089 | (5) | | | 6,447 | (6) | | | – | | | | – | | | 1,401 | | | 18,405 | | | | 22 | |
| | | | | | | | | | | | | |
Mexico | | 1,922 | | 1,825 | | | | 243 | | 26 | | | 4 | | | | – | | | | 337 | | | | – | | | – | | | 4,357 | | | | 5 | |
| | | | | | | | | | | | | |
Brazil | | 2,266 | | 433 | | | | 235 | | 430 | | | 7 | | | | – | | | | 280 | | | | – | | | – | | | 3,651 | | | | 4 | |
| | | | | | | | | | | | | |
Australia | | 1,153 | | 1,165 | | | | 144 | | – | | | 1 | | | | – | | | | 4 | | | | – | | | 217 | | | 2,684 | | | | 3 | |
| | | | | | | | | | | | | |
United Kingdom | | 882 | | 1,213 | | | | 243 | | 20 | | | – | | | | 4 | | | | 3 | | | | – | | | 297 | | | 2,662 | | | | 3 | |
| | | | | | | | | | | | | |
China | | 260 | | 150 | | | | 236 | | 1,012 | | | 45 | | | | – | | | | 495 | | | | – | | | – | | | 2,198 | | | | 3 | |
| | | | | | | | | | | | | |
India | | 1,555 | | 84 | | | | 49 | | 497 | | | 1 | | | | 1 | | | | 8 | | | | – | | | – | | | 2,195 | | | | 3 | |
| | | | | | | | | | | | | |
Chile | | 1,136 | | 37 | | | | 30 | | 302 | | | 2 | | | | – | | | | 343 | | | | – | | | – | | | 1,850 | | | | 2 | |
| | | | | | | | | | | | | |
Germany | | 566 | | 901 | | | | 191 | | – | | | – | | | | – | | | | – | | | | – | | | 44 | | | 1,702 | | | | 2 | |
| | | | | | | | | | | | | |
Other(7) | | 8,665 | | 5,239 | | | | 2,459 | | 1,753 | | | 131 | | | | 126 | | | | 7,053 | | | | – | | | 234 | | | 25,660 | | | | 30 | |
| | | 30,861 | | 19,932 | | | | 7,900 | | 4,118 | | | 1,460 | | | | 6,655 | | | | 8,523 | | | | – | | | 5,588 | | | 85,037 | | | | 100 | |
Country limits in excess of policy limits(3) | | – | | – | | | | – | | – | | | – | | | | – | | | | (6,833) | | | | – | | | – | | | (6,833 | ) | | | – | |
| | | | | | | | | | | | | |
Reinsurance ceded(8) | | – | | – | | | | – | | – | | | – | | | | – | | | | – | | | | (150 | ) | | – | | | (150 | ) | | | – | |
Total | | $30,861 | | $19,932 | | | | $7,900 | | $4,118 | | | $1,460 | | | | $6,655 | | | | $1,690 | | | | $(150 | ) | | $5,588 | | | $78,054 | | | | 100 | |
| (1) | Includes gross loans receivable, investments and gross investment in aircraft under finance leases. Where EDC has entered into risk transfer transactions, exposure reflects the industry of the risk mitigation provider. |
| (2) | Includes $541 million of investment commitments (2012 – $417 million), $157 million of unallocated confirmed lines of credit (2012 – $111 million) and $2,091 million of loan guarantees (2012 – $2,104 million). |
| (3) | Includes the sum of individual country exposures and thus exceeds the maximum liability of $1,683 million (2012 – $1,690 million) for all the policies in the program. |
| (4) | Includes amounts represented by cash and marketable securities. Exposure does not take into consideration any collateral or the effect of any master netting agreements with derivative counterparties. |
| (5) | Includes $952 million of surety bond insurance, where the risk rests with the Canadian exporter (2012 – $1,045 million). A total of 52% of the exports insured in the surety bond program are to the United States (2012 – 52%). The balance represents exports to other countries. |
| (6) | Includes $6,771 million in performance security guarantees, where the risk rests with the Canadian exporter (2012 – $6,335 million). A total of 52% of the exports insured in the performance security program are to the United States (2012 – 56%). The balance represents exports to other countries. |
| (7) | Includes 181 countries (2012 – 171) with total exposure ranging from $0.001 million to $1,695 million (2012 – $0.001 million to $1,506 million). |
| (8) | Includes treaty reinsurance agreements covering the credit insurance portfolio and some bonding obligors. |
| | | | |
| | EDC Annual Report 2013 | | 79 |
MANAGEMENT’S DISCUSSION AND ANALYSIS
Table 6: Concentration of Exposure by Industry
| | | | | | | | | | | | | | | | | | | | | | | | | | | | |
| | | Financing portfolio | | | | Insurance portfolio | | | Marketable securities and derivative instruments(3) | | | |
(in millions of Canadian dollars) | | Financing assets(1) | | Commitments and guarantees(2) | | | | Credit insurance | | Financial institutions insurance | | Contract insurance and bonding | | Political risk insurance | |
| Reinsurance
ceded |
| | | | | | | |
| | | | | | | Policies | | Guarantees | | | | | 2013 Exposure |
| Industry | | | | | | | | | | | | | | | | | | | | | | | $ | | | % |
Commercial: | | | | | | | | | | | | | | | | | | | | | | | | | | | | |
Extractive | | 11,162 | | 8,650 | | | | 2,782 | | – | | 85 | | 1,619 | | 679 | | | – | | | – | | | 24,977 | | | 29 |
Aerospace | | 10,969 | | 3,191 | | | | 398 | | – | | 183 | | 184 | | 87 | | | – | | | – | | | 15,012 | | | 17 |
Infrastructure and environment | | 3,075 | | 1,418 | | | | 777 | | – | | 768 | | 4,046 | | 800 | | | – | | | – | | | 10,884 | | | 13 |
Information and communication technology | | 3,826 | | 3,956 | | | | 746 | | – | | 61 | | 175 | | 77 | | | – | | | – | | | 8,841 | | | 10 |
Financial institutions | | 1,732 | | 566 | | | | – | | 4,545 | | – | | – | | – | | | – | | | 1,654 | | | 8,497 | | | 10 |
Surface transportation | | 3,761 | | 2,069 | | | | 824 | | – | | 223 | | 494 | | 35 | | | – | | | – | | | 7,406 | | | 8 |
Light manufacturing | | 929 | | 1,370 | | | | 1,092 | | – | | 17 | | 183 | | 1 | | | – | | | – | | | 3,592 | | | 4 |
Resources | | 570 | | 632 | | | | 1,788 | | – | | 3 | | 281 | | 4 | | | – | | | – | | | 3,278 | | | 4 |
Total commercial | | 36,024 | | 21,852 | | | | 8,407 | | 4,545 | | 1,340 | | 6,982 | | 1,683 | | | – | | | 1,654 | | | 82,487 | | | 95 |
Sovereign | | 1,149 | | 321 | | | | – | | – | | – | | – | | – | | | – | | | 3,100 | | | 4,570 | | | 5 |
| | | 37,173 | | 22,173 | | | | 8,407 | | 4,545 | | 1,340 | | 6,982 | | 1,683 | | | – | | | 4,754 | | | 87,057 | | | 100 |
Reinsurance ceded(4) | | – | | – | | | | – | | – | | – | | – | | – | | | (150 | ) | | – | | | (150 | ) | | – |
Total | | $37,173 | | $22,173 | | | | $8,407 | | $4,545 | | $1,340 | | $6,982 | | $1,683 | | | $(150 | ) | | $4,754 | | | $86,907 | | | 100 |
| | | | | | | | | | | | | | | | | | | | | | | | | | | | | |
(in millions of Canadian dollars) | | Financing portfolio | | | | Insurance portfolio | | | Marketable securities and derivative instruments(3) | | | | | | |
| | Financing assets(1) | | Commitments and guarantees(2) | | | | Credit insurance | | Financial institutions insurance | | Contract insurance and bonding | | Political risk insurance | |
| Reinsurance
ceded |
| | | | | | | |
| | | | | | | Policies | | Guarantees | | | | | 2012 Exposure |
| Industry | | | | | | | | | | | | | | | | | | | | | | | $ | | | % |
Commercial: | | | | | | | | | | | | | | | | | | | | | | | | | | | | |
Extractive | | 8,487 | | 8,056 | | | | 2,354 | | – | | 80 | | 1,309 | | 661 | | | – | | | – | | | 20,947 | | | 27 |
Aerospace | | 9,591 | | 2,879 | | | | 376 | | – | | 168 | | 166 | | 65 | | | – | | | – | | | 13,245 | | | 17 |
Infrastructure and environment | | 2,991 | | 1,922 | | | | 637 | | – | | 843 | | 4,258 | | 785 | | | – | | | – | | | 11,436 | | | 15 |
Financial institutions | | 1,036 | | 154 | | | | – | | 4,118 | | – | | – | | – | | | – | | | 2,119 | | | 7,427 | | | 9 |
Surface transportation | | 3,458 | | 1,780 | | | | 845 | | – | | 289 | | 339 | | 33 | | | – | | | – | | | 6,744 | | | 9 |
Information and communication technology | | 2,657 | | 3,064 | | | | 1,039 | | – | | 50 | | 159 | | 67 | | | – | | | – | | | 7,036 | | | 9 |
Light manufacturing | | 1,110 | | 1,141 | | | | 967 | | – | | 23 | | 173 | | 74 | | | – | | | – | | | 3,488 | | | 4 |
Resources | | 485 | | 553 | | | | 1,682 | | – | | 7 | | 251 | | 5 | | | – | | | ��� | | | 2,983 | | | 4 |
Total commercial | | 29,815 | | 19,549 | | | | 7,900 | | 4,118 | | 1,460 | | 6,655 | | 1,690 | | | – | | | 2,119 | | | 73,306 | | | 94 |
Sovereign | | 1,046 | | 383 | | | | – | | – | | – | | – | | – | | | – | | | 3,469 | | | 4,898 | | | 6 |
| | | 30,861 | | 19,932 | | | | 7,900 | | 4,118 | | 1,460 | | 6,655 | | 1,690 | | | – | | | 5,588 | | | 78,204 | | | 100 |
Reinsurance ceded(4) | | – | | – | | | | – | | – | | – | | – | | – | | | (150 | ) | | – | | | (150 | ) | | – |
Total | | $30,861 | | $19,932 | | | | $7,900 | | $4,118 | | $1,460 | | $6,655 | | $1,690 | | | $(150 | ) | | $5,588 | | | $78,054 | | | 100 |
| (1) | Includes gross loans receivable, investments and gross investment in aircraft under finance leases. Where EDC has entered into risk transfer transactions, exposure reflects the industry of the risk mitigation provider. |
| (2) | Includes $541 million of investment commitments (2012 – $417 million), $157 million of unallocated confirmed lines of credit (2012 – $111 million) and $2,091 million of loan guarantees (2012 – $2,104 million). |
| (3) | Includes amounts represented by cash and marketable securities. Exposure does not take into consideration any collateral or the effect of any master netting agreements with derivative counterparties. |
| (4) | Includes treaty reinsurance agreements covering the credit insurance portfolio and some bonding obligors. |
| | | | |
| 80 | | Turning the Corner on Trade | | |
Table 7: Individually Impaired Loans
| | | | | | | | | | |
(in millions of Canadian dollars) | | 2013 | | | 2012 | |
Commercial | | | | | | | | |
Aerospace | | | 281 | | | | 833 | |
Infrastructure and environment | | | 110 | | | | 99 | |
Light manufacturing | | | 30 | | | | 26 | |
Information and communication technology | | | 25 | | | | 33 | |
Extractive | | | 22 | | | | 24 | |
Financial institutions | | | 21 | | | | 23 | |
Surface transportation | | | 19 | | | | 37 | |
Resources | | | 10 | | | | 7 | |
Subtotal | | | 518 | | | | 1,082 | |
Sovereign | | | | | | | | |
Argentina | | | 48 | | | | 46 | |
Cuba | | | 25 | | | | 24 | |
Iran | | | 8 | | | | 8 | |
Subtotal | | | 81 | | | | 78 | |
Total impaired gross loans receivable | | | 599 | | | | 1,160 | |
Less: | | Individual allowance | | | 345 | | | | 298 | |
| | | Deferred revenue and other credits | | | 15 | | | | 24 | |
Impaired net loans receivable | | | $239 | | | | $838 | |
| | | | |
| Table 8: | | Collective Allowance for Losses on Loans, Loan Commitments and Guarantees | | |
| | | | | | | | | | | | | | | | | | | | | | | | |
(in millions of Canadian dollars) | | 2013 | | | 2012 | |
| Industry of risk | | Provision
exposure* | | | Collective
allowance | | | Collective
allowance as
a percentage
of provision
exposure | | | Provision
exposure* | | | Collective
allowance | | | Collective
allowance as
a percentage
of provision
exposure | |
Commercial: | | | | | | | | | | | | | | | | | | | | | | | | |
Aerospace | | | 12,470 | | | | 438 | | | | 3.5 | | | | 10,486 | | | | 476 | | | | 4.5 | |
Extractive | | | 16,171 | | | | 164 | | | | 1.0 | | | | 13,343 | | | | 129 | | | | 1.0 | |
Infrastructure and environment | | | 3,541 | | | | 107 | | | | 3.0 | | | | 3,795 | | | | 76 | | | | 2.0 | |
Information and communication technology | | | 6,247 | | | | 89 | | | | 1.4 | | | | 4,089 | | | | 113 | | | | 2.8 | |
Light manufacturing | | | 1,448 | | | | 53 | | | | 3.7 | | | | 1,703 | | | | 67 | | | | 3.9 | |
Surface transportation | | | 5,247 | | | | 40 | | | | 0.8 | | | | 4,867 | | | | 58 | | | | 1.2 | |
Resources | | | 938 | | | | 26 | | | | 2.8 | | | | 868 | | | | 30 | | | | 3.5 | |
Financial institutions | | | 1,931 | | | | 14 | | | | 0.7 | | | | 1,088 | | | | 9 | | | | 0.8 | |
Total commercial | | | 47,993 | | | | 931 | | | | 1.9 | | | | 40,239 | | | | 958 | | | | 2.4 | |
Sovereign | | | 1,275 | | | | 98 | | | | 7.7 | | | | 1,130 | | | | 78 | | | | 6.9 | |
Total | | | $49,268 | | | | $1,029 | | | | 2.1 | | | | $41,369 | | | | $1,036 | | | | 2.5 | |
* Calculated using factored exposure.
| | | | |
| | EDC Annual Report 2013 | | 81 |
MANAGEMENT’S DISCUSSION AND ANALYSIS
Table 9: Investments
| | | | | | | | | | | | | | | | | | | | | | | | |
| (in millions of Canadian dollars) | | Investments
financing | | | Undisbursed
commitments | | | 2013 Exposure | | | 2012 Exposure | |
Gross exposure | | | | | | | | $ | | | % | | | $ | | | % | |
Domestic market | | | 259 | | | | 242 | | | | 501 | | | | 47 | | | | 362 | | | | 43 | |
| | | | | | | |
Other advanced economies | | | 23 | | | | 22 | | | | 45 | | | | 4 | | | | 59 | | | | 7 | |
| | | | | | | |
Emerging markets | | | 255 | | | | 277 | | | | 532 | | | | 49 | | | | 425 | | | | 50 | |
Total | | | $537 | | | | $541 | | | | $1,078 | | | | 100 | | | | $846 | | | | 100 | |
Table 10: Claims – Size Concentration
| | | | | | | | | | | | | | | | | | | | | | | | | | | | | | | | |
(in millions of Canadian dollars) | | 2013 | | | 2012 | |
| | | $ of claims
paid | | | Number of
claims paid | | | $ of claims
recoveries | | | Number of
claims with
recoveries | | | $ of claims
paid | | | Number of
claims paid | | | $ of claims
recoveries | | | Number of
claims with
recoveries | |
$0 – $100,000 | | | 11 | | | | 643 | | | | 3 | | | | 298 | | | | 13 | | | | 863 | | | | 4 | | | | 418 | |
| | | | | | | | | |
$100,001 – $1 million | | | 18 | | | | 74 | | | | 7 | | | | 23 | | | | 27 | | | | 97 | | | | 8 | | | | 29 | |
| | | | | | | | | |
Over $1 million | | | 32 | | | | 9 | | | | – | | | | – | | | | 318 | | | | 10 | | | | 10 | | | | 5 | |
Total | | | $61 | | | | 726 | | | | $10 | | | | 321 | | | | $358 | | | | 970 | | | | $22 | | | | 452 | |
| | | | |
| 82 | | Turning the Corner on Trade | | |
| | | | | | | | | | | | | | | | |
| | 2013 FINANCIAL REVIEW Consolidated Financial Statements | | |
| | | | |
| | 84 | | Financial Reporting Responsibility | | | | |
| | | | |
| | 85 | | Independent Auditor’s Report | | | | |
| | | | |
| | 86 | | Consolidated Statement of Financial Position | | | | |
| | | | |
| | 87 | | Consolidated Statement of Comprehensive Income | | | | |
| | | | |
| | 88 | | Consolidated Statement of Changes in Equity | | | | |
| | | | |
| | 89 | | Consolidated Statement of Cash Flows | | | | |
| | | | |
| | 90 | | Notes to the Consolidated Financial Statements | | | | |
| | | | | | | | |
| | | | 90 | | 1. | | Corporate Mandate | | 114 | | 21. | | Contingent Liabilities | | |
| | | | | | | | |
| | | | 90 | | 2. | | Summary of Significant Accounting Policies | | 117 | | 22. | | Reinsurance Agreements | | |
| | | | | | | | |
| | | | 98 | | 3. | | Marketable Securities | | 117 | | 23. | | Insurance Risks | | |
| | | | | | | | |
| | | | 99 | | 4. | | Loans Receivable | | 120 | | 24. | | Equity | | |
| | | | | | | | |
| | | | 101 | | 5. | | Individually Impaired Loans | | 120 | | 25. | | Capital Management | | |
| | | | | | | | |
| | | | 102 | | 6. | | Allowance for Losses on Loans, Loan Commitments and Loan Guarantees | | 121 123 | | 26. 27. | | Interest Rate Risk Foreign Currency Balances | | |
| | | | | | | | |
| | | | 103 | | 7. | | Investments at Fair Value Through Profit or Loss | | 124 | | 28. | | Fair Value of Financial Instruments | | |
| | | | | | | | |
| | | | 104 | | 8. | | Equipment Available for Lease | | 128 | | 29. | | Financial Instrument Risks | | |
| | | | | | | | |
| | | | 105 | | 9. | | Net Investment in Aircraft under Finance Leases | | 129 | | 30. | | Structured Entities | | |
| | | | | | | | |
| | | | 106 | | 10. | | Recoverable Insurance Claims | | 130 | | 31. | | Loan Revenue | | |
| | | | | | | | |
| | | | 106 | | 11. | | Other Assets | | 130 | | 32. | | Marketable Securities Revenue | | |
| | | | | | | | |
| | | | 107 | | 12. | | Property, Plant and Equipment | | 131 | | 33. | | Interest Expense | | |
| | | | | | | | |
| | | | 107 | | 13. | | Intangible Assets | | 131 | | 34. | | Leasing and Financing Related Expenses | | |
| | | | | | | | |
| | | | 108 | | 14. | | Building under Finance Lease | | 131 | | 35. | | Provision for (Reversal of) Credit Losses | | |
| | | | | | | | |
| | | | 108 | | 15. | | Accounts Payable and Other Credits | | 132 | | 36. | | Claims-Related Expenses (Recovery) | | |
| | | | | | | | |
| | | | 109 | | 16. | | Debt Instruments | | 132 | | 37. | | Other Expenses | | |
| | | | | | | | |
| | | | 110 | | 17. | | Derivative Instruments | | 133 | | 38. | | Administrative Expenses | | |
| | | | | | | | |
| | | | 112 | | 18. | | Debt Instrument Maturities | | 133 | | 39. | | Retirement Benefit Obligations | | |
| | | | | | | | |
| | | | 113 | | 19. | | Premium and Claims Liabilities | | 138 | | 40. | | Related Party Transactions | | |
| | | | | | | | |
| | | | 113 | | 20. | | Financing Commitments | | 139 | | 41. | | Canada Account Transactions | | |
| | | | |
| | EDC Annual Report 2013 | | 83 |
FINANCIAL REPORTING RESPONSIBILITY
| | |
 | | Ken Kember, Senior Vice-President and Chief Financial Officer |
The consolidated financial statements contained in this Annual Report have been prepared by management in accordance with International Financial Reporting Standards appropriate in the circumstances. The integrity and objectivity of the data in these consolidated financial statements are management’s responsibility. It is necessary for management to make assumptions, estimates and judgments based on information available as at the date of the financial statements. Areas where management has made significant estimates, assumptions and judgments include the allowance for losses on loans, loan commitments and guarantees, equipment available for lease, recoverable insurance claims, premium and claims liabilities, financial instruments measured at fair value, and retirement benefit obligations. Management is also responsible for all other information in the Annual Report and for ensuring that this information is consistent, where appropriate, with the information and data contained in the consolidated financial statements.
In support of its responsibility, management maintains financial, management control and information systems and management practices to provide reasonable assurance that the financial information is reliable, that the assets are safeguarded and that the operations are carried out effectively. We have an internal audit department whose functions include reviewing internal controls and their application, on an ongoing basis.
The Board of Directors is responsible for the management of our business and activities. In particular, it is responsible for ensuring that management fulfills its responsibilities for financial reporting and internal control and exercises this responsibility through the Audit Committee of the Board, which is composed of Directors who are not employees of EDC. The Audit Committee meets with management, the internal auditors and the Auditor General of Canada on a regular basis.
Contracts which, in our opinion, involve risks in excess of that which we would normally undertake, may be entered into under the authority of the Minister of International Trade and the Minister of Finance where the Minister of International Trade considers them to be in the national interest. Funds required for such contracts are paid to EDC by the Minister of Finance out of the Consolidated Revenue Fund, and funds recovered are remitted to the Consolidated Revenue Fund, net of amounts withheld to cover related administrative expenses. These transactions, which are known as Canada Account transactions, are shown in Note 41 to our consolidated financial statements, and the responsibility of the Board of Directors for these transactions is limited to the management of the administration thereof by EDC.
The Auditor General of Canada conducts an independent audit, in accordance with Canadian generally accepted auditing standards, and expresses his opinion on the consolidated financial statements. His report is presented on the following page.
| | | | |
 | | | |  |
| Benoit Daignault | | | | Ken Kember |
| President and Chief Executive Officer | | | | Senior Vice-President and Chief Financial Officer |
| | |
| February 20, 2014 | | | | |
| | | | |
| 84 | | Turning the Corner on Trade | | |
INDEPENDENT AUDITOR’S REPORT
To the Minister of International Trade
Report on the Consolidated
Financial Statements
I have audited the accompanying consolidated financial statements of Export Development Canada, which comprise the consolidated statement of financial position as at December 31, 2013, and the consolidated statement of comprehensive income, consolidated statement of changes in equity and consolidated statement of cash flows for the year then ended, and a summary of significant accounting policies and other explanatory information.
Management’s Responsibility for the Consolidated Financial Statements
Management is responsible for the preparation and fair presentation of these consolidated financial statements in accordance with International Financial Reporting Standards, and for such internal control as management determines is necessary to enable the preparation of consolidated financial statements that are free from material misstatement, whether due to fraud or error.
Auditor’s Responsibility
My responsibility is to express an opinion on these consolidated financial statements based on my audit. I conducted my audit in accordance with Canadian generally accepted auditing standards. Those standards require that I comply with ethical requirements and plan and perform the audit to obtain reasonable assurance about whether the consolidated financial statements are free from material misstatement.
An audit involves performing procedures to obtain audit evidence about the amounts and disclosures in the consolidated financial statements. The procedures selected depend on the auditor’s judgment, including the assessment of the risks of material misstatement of the consolidated financial statements, whether due to fraud or error. In making those risk assessments, the auditor considers internal control relevant to the entity’s preparation and fair presentation of the consolidated financial statements in order to design audit procedures that are appropriate in the circumstances, but not for the purpose of expressing an opinion on the effectiveness of the entity’s internal control. An audit also includes evaluating the appropriateness of accounting policies used and
the reasonableness of accounting estimates made by management, as well as evaluating the overall presentation of the consolidated financial statements.
I believe that the audit evidence I have obtained is sufficient and appropriate to provide a basis for my audit opinion.
Opinion
In my opinion, the consolidated financial statements present fairly, in all material respects, the financial position of Export Development Canada as at December 31, 2013, and its financial performance and its cash flows for the year then ended in accordance with International Financial Reporting Standards.
Report on Other Legal and
Regulatory Requirements
As required by the Financial Administration Act, I report that, in my opinion, the accounting principles in International Financial Reporting Standards have been applied, after giving retrospective effect to the change in the method of accounting for employee benefits as explained in Note 2 to the consolidated financial statements, on a basis consistent with that of the preceding year.
Further, in my opinion, the transactions of Export Development Canada and its wholly owned subsidiary that have come to my notice during my audit of the consolidated financial statements have, in all significant respects, been in accordance with Part X of the Financial Administration Act and regulations, the Export Development Act and regulations, the by-laws of Export Development Canada, the charter and by-laws of its wholly owned subsidiary, and the directive issued pursuant to Section 89 of the Financial Administration Act.
|
 |
| Clyde M. MacLellan, FCPA, FCA |
Assistant Auditor General for the Auditor General of Canada |
|
| February 20, 2014 |
| Ottawa, Canada |

| | | | |
| | EDC Annual Report 2013 | | 85 |
CONSOLIDATED FINANCIAL STATEMENTS
Export Development Canada
Consolidated Statement of Financial Position
| | | | | | | | | | | | |
| | | | |
as at (in millions of Canadian dollars) | | Dec. 31, 2013 | | | Dec. 31, 2012 (Restated – Note 2) | | | Jan. 1, 2012 (Restated – Note 2) | |
| | | | |
Assets | | | | | | | | | | | | |
| | | | |
Cash | | | 127 | | | | 80 | | | | 90 | |
| | | | |
Marketable securities: (Note 3) | | | | | | | | | | | | |
| | | | |
At fair value through profit or loss | | | 3,859 | | | | 4,082 | | | | 3,720 | |
| | | | |
At amortized cost | | | 80 | | | | 74 | | | | 76 | |
| | | | |
Derivative instruments (Note 17) | | | 688 | | | | 1,352 | | | | 1,541 | |
| | | | |
Loans receivable (Notes 4 and 5) | | | 36,357 | | | | 30,131 | | | | 28,680 | |
| | | | |
Allowance for losses on loans (Note 6) | | | (1,246 | ) | | | (1,182 | ) | | | (1,680 | ) |
| | | | |
Investments at fair value through profit or loss (Note 7) | | | 537 | | | | 429 | | | | 385 | |
| | | | |
Equipment available for lease (Note 8) | | | 493 | | | | 525 | | | | 55 | |
| | | | |
Net investment in aircraft under finance leases (Note 9) | | | 76 | | | | 80 | | | | 92 | |
| | | | |
Recoverable insurance claims (Note 10) | | | 96 | | | | 200 | | | | 44 | |
| | | | |
Reinsurers’ share of premium and claims liabilities (Note 19) | | | 93 | | | | 90 | | | | 129 | |
| | | | |
Other assets (Note 11) | | | 91 | | | | 99 | | | | 174 | |
| | | | |
Property, plant and equipment (Note 12) | | | 59 | | | | 66 | | | | 74 | |
| | | | |
Intangible assets (Note 13) | | | 44 | | | | 38 | | | | 40 | |
| | | | |
Building under finance lease (Note 14) | | | 162 | | | | 169 | | | | 176 | |
Total Assets | | | $41,516 | | | | $36,233 | | | | $33,596 | |
| | | | |
Liabilities and Equity | | | | | | | | | | | | |
| | | | |
Accounts payable and other credits (Note 15) | | | 144 | | | | 113 | | | | 159 | |
| | | | |
Loans payable: (Note 16) | | | | | | | | | | | | |
| | | | |
Designated at fair value through profit or loss | | | 29,108 | | | | 24,862 | | | | 21,505 | |
| | | | |
At amortized cost | | | 2,151 | | | | 1,018 | | | | 2,065 | |
| | | | |
Derivative instruments (Note 17) | | | 626 | | | | 120 | | | | 178 | |
| | | | |
Obligation under finance lease (Note 14) | | | 170 | | | | 173 | | | | 177 | |
| | | | |
Retirement benefit obligations (Note 39) | | | 128 | | | | 270 | | | | 333 | |
| | | | |
Allowance for losses on loan commitments (Note 6) | | | 47 | | | | 58 | | | | 41 | |
| | | | |
Premium and claims liabilities (Note 19) | | | 606 | | | | 583 | | | | 875 | |
| | | | |
Loan guarantees (Note 21) | | | 165 | | | | 161 | | | | 266 | |
| | | | 33,145 | | | | 27,358 | | | | 25,599 | |
Financing commitments (Note 20) and contingent liabilities (Note 21) | | | | | | | | | | | | |
| | | | |
Equity | | | | | | | | | | | | |
| | | | |
Share capital (Note 24) | | | 1,333 | | | | 1,333 | | | | 1,333 | |
| | | | |
Retained earnings | | | 7,038 | | | | 7,542 | | | | 6,664 | |
| | | | 8,371 | | | | 8,875 | | | | 7,997 | |
Total Liabilities and Equity | | | $41,516 | | | | $36,233 | | | | $33,596 | |
The accompanying notes are an integral part of these consolidated financial statements.
These financial statements were approved for issuance by the Board of Directors on February 20, 2014
| | | | |
 | |  | | |
| Herbert M. Clarke | | Benoit Daignault | | |
| Director | | Director | | |
| | |
| February 20, 2014 | | | | |
| | | | |
| 86 | | Turning the Corner on Trade | | |
Export Development Canada
Consolidated Statement of Comprehensive Income
| | | | | | | | |
for the year ended December 31 (in millions of Canadian dollars) | | 2013 | | | 2012 (Restated –Note 2) | |
Financing and investment revenue: | | | | | | | | |
Loan (Note 31) | | | 1,174 | | | | 1,116 | |
Finance lease (Note 9) | | | 6 | | | | 6 | |
Operating lease (Note 8) | | | 55 | | | | 17 | |
Marketable securities (Note 32) | | | 32 | | | | 36 | |
Investments (Note 7) | | | 8 | | | | 5 | |
Total financing and investment revenue | | | 1,275 | | | | 1,180 | |
Interest expense (Note 33) | | | 30 | | | | 108 | |
Leasing and financing related expenses (Note 34) | | | 49 | | | | 33 | |
Net Financing and Investment Income | | | 1,196 | | | | 1,039 | |
Loan Guarantee Fees | | | 36 | | | | 38 | |
Insurance premiums and guarantee fees | | | 204 | | | | 204 | |
Reinsurance assumed | | | 11 | | | | 12 | |
Reinsurance ceded | | | (22 | ) | | | (20 | ) |
Net Insurance Premiums and Guarantee Fees (Note 22) | | | 193 | | | | 196 | |
Other Expenses (Note 37) | | | 109 | | | | 16 | |
Administrative Expenses (Note 38) | | | 310 | | | | 308 | |
Income before Provision and Claims-Related Expenses (Recovery) | | | 1,006 | | | | 949 | |
Provision for (Reversal of) Credit Losses (Note 35) | | | 30 | | | | (340 | ) |
Claims-Related Expenses (Recovery) (Note 36) | | | 159 | | | | (38 | ) |
Net Income | | | 817 | | | | 1,327 | |
Other comprehensive income: | | | | | | | | |
Pension plan re-measurement (Note 39) | | | 119 | | | | 51 | |
Comprehensive Income | | | $936 | | | | $1,378 | |
The accompanying notes are an integral part of these consolidated financial statements.
All items presented in other comprehensive income will not be reclassified to net income in subsequent periods.
| | | | |
| | EDC Annual Report 2013 | | 87 |
CONSOLIDATED FINANCIAL STATEMENTS
Export Development Canada
Consolidated Statement of Changes in Equity
| | | | | | | | |
for the year ended December 31 (in millions of Canadian dollars) | | 2013 | | | 2012
(Restated – Note 2) | |
| | | |
Share Capital (Note 24) | | | 1,333 | | | | 1,333 | |
| | | |
Retained Earnings | | | | | | | | |
| | | |
Balance beginning of year | | | 7,542 | | | | 6,923 | |
| | | |
Effect of amendments to IAS 19 | | | – | | | | (259 | ) |
Revised balance beginning of year | | | 7,542 | | | | 6,664 | |
| | | |
Net income | | | 817 | | | | 1,321 | |
| | | |
Effect of amendments to IAS 19 | | | – | | | | 6 | |
| | | |
Other comprehensive income | | | | | | | | |
| | | |
Effect of amendments to IAS 19 | | | – | | | | 51 | |
| | | |
Pension plan-remeasurement | | | 119 | | | | – | |
| | | |
Dividends paid (Note 24) | | | (1,440 | ) | | | (500 | ) |
Balance end of year | | | 7,038 | | | | 7,542 | |
| | | |
Total Equity at End of Year | | | $8,371 | | | | $8,875 | |
The accompanying notes are an integral part of these consolidated financial statements.
| | | | |
| 88 | | Turning the Corner on Trade | | |
Export Development Canada
Consolidated Statement of Cash Flows
| | | | | | | | |
for the year ended December 31 (in millions of Canadian dollars) | | 2013 | | | 2012 (Restated – Note 2) | |
| | | |
Cash Flows from (used in) Operating Activities | | | | | | | | |
| | | |
Net income | | | 817 | | | | 1,327 | |
| | | |
Adjustments to determine net cash from (used in) operating activities | | | | | | | | |
| | | |
Provision for (reversal of) credit losses | | | 30 | | | | (340 | ) |
| | | |
Actuarial change in the net allowance for claims on insurance | | | 1 | | | | (233 | ) |
| | | |
Depreciation and amortization | | | 65 | | | | 52 | |
| | | |
Changes in operating assets and liabilities | | | | | | | | |
| | | |
Change in accrued interest and fees receivable | | | (4 | ) | | | (3 | ) |
| | | |
Change in fair value of marketable securities | | | 97 | | | | (11 | ) |
| | | |
Change in fair value of loans payable | | | (265 | ) | | | (47 | ) |
| | | |
Change in derivative instruments receivable | | | 358 | | | | 50 | |
| | | |
Change in derivative instruments payable | | | (744 | ) | | | 144 | |
| | | |
Other | | | 78 | | | | (201 | ) |
| | | |
Loan disbursements | | | (14,100 | ) | | | (11,887 | ) |
| | | |
Loan repayments | | | 9,932 | | | | 9,232 | |
Net cash used in operating activities | | | (3,735 | ) | | | (1,917 | ) |
| | | |
Cash Flows from (used in) Investing Activities | | | | | | | | |
| | | |
Disbursements for investments | | | (124 | ) | | | (121 | ) |
| | | |
Receipts from investments | | | 30 | | | | 63 | |
| | | |
Finance lease repayments | | | 10 | | | | 10 | |
| | | |
Purchases of marketable securities at fair value through profit or loss | | | (42,134 | ) | | | (40,579 | ) |
| | | |
Sales/maturities of marketable securities at fair value through profit or loss | | | 42,502 | | | | 40,151 | |
| | | |
Purchases of marketable securities at amortized cost | | | (20 | ) | | | – | |
| | | |
Sales/maturities of marketable securities at amortized cost | | | 19 | | | | – | |
Net cash from (used in) investing activities | | | 283 | | | | (476 | ) |
| | | |
Cash Flows from (used in) Financing Activities | | | | | | | | |
| | | |
Issue of long-term loans payable – designated at fair value through profit or loss | | | 7,899 | | | | 8,768 | |
| | | |
Repayment of long-term loans payable – designated at fair value through profit or loss | | | (5,694 | ) | | | (5,943 | ) |
| | | |
Issue of long-term loans payable at amortized cost | | | 1,030 | | | | – | |
| | | |
Repayment of long-term loans payable at amortized cost | | | – | | | | (999 | ) |
| | | |
Issue of short-term loans payable – designated at fair value through profit or loss | | | 22,313 | | | | 29,601 | |
| | | |
Repayment of short-term loans payable – designated at fair value through profit or loss | | | (21,194 | ) | | | (28,650 | ) |
| | | |
Change in derivative instruments receivable | | | 310 | | | | 137 | |
| | | |
Change in derivative instruments payable | | | 269 | | | | (30 | ) |
| | | |
Dividend paid | | | (1,440 | ) | | | (500 | ) |
Net cash from financing activities | | | 3,493 | | | | 2,384 | |
| | | |
Effect of exchange rate changes on cash | | | 6 | | | | (1 | ) |
| | | |
Net increase (decrease) in cash | | | 47 | | | | (10 | ) |
| | | |
Cash | | | | | | | | |
| | | |
Beginning of period | | | 80 | | | | 90 | |
End of period | | | $127 | | | | $80 | |
| | | |
Operating Cash Flows from Interest | | | | | | | | |
| | | |
Cash paid for interest on loans payable | | | 97 | | | | 182 | |
| | | |
Cash received for interest on currency swaps related to capital | | | 73 | | | | 65 | |
| | | |
Cash received for interest on loan assets and marketable securities | | | 1,088 | | | | 1,121 | |
The accompanying notes are an integral part of these consolidated financial statements.
| | | | |
| | EDC Annual Report 2013 | | 89 |
CONSOLIDATED FINANCIAL STATEMENTS
Notes to the Consolidated Financial Statements
1. Corporate Mandate
Export Development Canada (the “Corporation” or “EDC”) was created in 1944 as Canada’s export credit agency (ECA). On October 1, 1969, EDC was established as a Crown corporation by a statute of the Parliament of Canada, the Export Development Act (the “Act”).
EDC’s mandate is to support and develop Canada’s trade, and the capacity of Canadian companies to participate in and respond to international business opportunities. Since 2009, EDC has been operating under broadened powers to help increase access to credit for Canadian companies by participating in domestic financing and insurance transactions with private-sector financial institutions, insurance providers and the surety industry. These powers were meant to be temporary, initially for a two-year period and extended for another three years. The government has since reviewed and assessed EDC’s activities in order to determine an adequate, permanent set of domestic powers for the future. This work, which included consultations with a wide range of stakeholders, has resulted in the drafting of new regulations which were published in the Canada Gazette in December 2013 and will come into force on March 11, 2014 (the “New Regulations”).
The New Regulations clarify the circumstances in which EDC can provide support within Canada. They introduce flexibility in our ability to establish a link between a transaction and the international activities of our customers. It also enables EDC to provide support for purely domestic transactions (financing, guarantees and insurance) to companies that have at least 50 percent of their total annual consolidated sales in export and foreign markets.
The Corporation is named in Part I of Schedule III to the Financial Administration Act (the “FA Act”) and is accountable for its affairs to Parliament through the Minister of International Trade (the “Minister”).
In September 2008, EDC, together with other federal Crown corporations, was given a directive (PC 2008-1598) pursuant to Section 89 of the FA Act, entitled Order giving a direction to parent Crown corporations involved in commercial lending to give due consideration to the personal integrity of those they lend to or provide benefits to, in accordance with the Federal Government’s policy to improve the accountability and integrity of federal institutions. The Corporation has, since, implemented the Directive and the President and Chief Executive Officer of EDC has notified the Minister in accordance with Subsection 89(6) of the FA Act.
The Government of Canada is the sole shareholder of EDC.
We incorporated Exinvest Inc. as a wholly-owned subsidiary (the “Subsidiary”) under the Canada Business Corporations Act in 1995.
Our earnings and those of our Subsidiary are not subject to the requirements of the Income Tax Act.
We are subject to a limit imposed by the Act on our contingent liability arrangements. The Act specifies that the limit applies to the principal amount owing under all outstanding arrangements which have the effect of providing, to any person, any insurance, reinsurance, indemnity or guarantee. This limit shall at no time exceed the greater of an amount equal to 10 times our authorized capital and $45.0 billion which amount may be varied in an Appropriation Act. At the end of December 2013, the amount of these contingent liabilities was $24.9 billion (2012 – $23.8 billion).
We are for all purposes an agent of Her Majesty in right of Canada. As a result, all obligations under debt instruments we issue are obligations of Canada. The Act allows us to borrow and have outstanding borrowings up to a maximum of 15 times the aggregate of (a) our current paid-in capital and (b) our retained earnings determined in accordance with the previous year’s audited financial statements. The maximum applicable to December 31, 2013 is $136.2 billion (2012 – $123.8 billion), against which borrowings amounted to $31.3 billion (2012 – $25.9 billion).
2. Summary of Significant Accounting Policies
Basis of Presentation
Our consolidated financial statements have been prepared in accordance with International Financial Reporting Standards (IFRS). The corporation is organized and managed as a single business segment. The significant accounting policies used in the preparation of these consolidated financial statements are summarized on the following pages and conform in all material respects to IFRS.
Basis of Consolidation
Our consolidated financial statements include the assets, liabilities, results of operations and cash flows of our wholly-owned subsidiary and those structured entities consolidated under IFRS 10 – Consolidated Financial Statements. Intercompany transactions and balances have been eliminated.
Changes in Accounting Standards
A number of new standards, interpretations, amendments and improvements have been issued by the International Accounting Standards Board (IASB). The standards that are relevant to EDC are listed below. The standards were adopted for the annual period beginning on January 1, 2013.
| | | | |
| 90 | | Turning the Corner on Trade | | |
New standards include:
| | |
| | IFRS 10 – Consolidated Financial Statements – replaces the guidance on control and consolidation in IAS 27 – Consolidated and Separate Financial Statements, and SIC-12 – Consolidation – Special Purpose Entities. IFRS 10 requires consolidation of an investee only if the investor possesses power over the investee, has exposure to variable returns from its involvement with the investee and has the ability to use its power over the investee to affect its returns. Detailed guidance is provided on applying the definition of control. The accounting requirements for consolidation have remained largely consistent with IAS 27. EDC assessed its consolidation conclusions on January 1, 2013 and determined that the adoption of IFRS 10 did not result in any change in the consolidation status of its subsidiary and investees. |
| |
| | IFRS 11 – Joint Arrangements – supersedes IAS 31 – Interests in Joint Ventures, and requires joint arrangements to be classified either as joint operations or joint ventures depending on the contractual rights and obligations of each investor that jointly controls the arrangement. For joint operations, a company recognizes its share of assets, liabilities, revenues and expenses of the joint operation. An investment in a joint venture is accounted for using the equity method as set out in IAS 28 – Investments in Associates and Joint Ventures (amended in 2011). EDC has assessed its joint arrangements and concluded that the adoption of IFRS 11 resulted in changes in the accounting for its joint arrangements; however, the impact was not material. |
| |
| | IFRS 12 – Disclosure of Interests in Other Entities, outlines the disclosure requirements for all forms of interests in other entities both on and off the balance sheet. EDC has assessed the disclosure requirements and has determined that the adoption of IFRS 12 did not require additional disclosure with the exception of Note 30 Structured Entities. |
| |
| | IFRS 13 – Fair Value Measurement – provides a single framework for measuring fair value. The measurement of the fair value of an asset or liability is based on assumptions that market participants would use when pricing the asset or liability under current market conditions, including assumptions about risk. EDC adopted IFRS 13 on January 1, 2013 on a prospective basis. The adoption of IFRS 13 did not require any adjustments to the valuation techniques used by EDC to measure fair value and did not result in any measurement adjustments as at January 1, 2013. |
Amended standards include:
| | |
| | IAS 1 – Presentation of Financial Statements – requires EDC to group other comprehensive income items by those that will be reclassified subsequently to profit or loss and those that will not be reclassified. We have modified our consolidated statement of comprehensive income accordingly. |
| |
| | IAS 19 – Employee Benefits – In June 2011, the IASB issued amendments to IAS 19 – Employee Benefits. These amendments remove the option to use the corridor method to defer gains and losses, require that the impact of re-measuring pension assets and liabilities be recorded in other comprehensive income and provide enhanced disclosure requirements for defined benefit plans. The new requirements were effective January 1, 2013 and must be applied retrospectively. The transition adjustment upon adoption of the amended standard reduced opening retained earnings by $259 million. Other comprehensive income increased by $51 million due to the retrospective application of the re-measurement of actuarial gains on the obligation related to 2012. In addition, the 2012 pension expense was restated to $56 million as a result of the retrospective application of the standard, a decrease of $6 million when compared to the pension expense in the 2012 Annual Report. |
| |
| | IAS 27 – Separate Financial Statements – this standard has been renamed and amended to maintain the accounting guidance on issuing separate financial statements. This amendment did not have any impact on EDC. |
| |
| | IAS 28 – Investments in Associates and Joint Ventures – amended as a consequence of the new standard on joint arrangements. This amendment did not have any impact on EDC. |
Use of Judgment, Estimates and Assumptions
To prepare our financial statements in accordance with IFRS, it is necessary for management to exercise judgment and make use of estimates and assumptions, in applying certain accounting policies. We utilize current market data, our own historical experience and other information available to us as at the date of the financial statements in arriving at our decisions. We have established procedures to ensure that the process for determining our estimates and assumptions is well controlled and occurs in an appropriate and systematic manner.
Uncertainty is inherent in the use of estimates and assumptions and as a result, actual results may vary significantly from management’s estimates. Uncertainty arises, in part, from the use of historical experience and data at a point in time to establish our assumptions. While this data may be the most reliable basis available on which to base our assumptions, economic events may occur subsequently that render previous assumptions invalid and cause a material change to actual results.
Areas where management has exercised judgment and made significant use of estimates and assumptions are discussed below.
Note 6 – Allowance for Losses on Loans, Loan Commitments and Guarantees
The allowance for losses on loans, loan commitments and guarantees represents management’s best estimate of probable credit losses. Management determines the allowances through the use of judgment and various assumptions based on its assessment of the impact of recent events and changes in economic conditions and trends. These estimates are reviewed periodically during the year and in detail as at the date of the financial statements.
| | | | |
| | EDC Annual Report 2013 | | 91 |
CONSOLIDATED FINANCIAL STATEMENTS
The purpose of the collective allowance is to provide an estimate of probable incurred losses inherent in the loan portfolio that have not been identified on an individual loan basis. Management judgment is required with respect to assessment of probabilities of default, loss severity in the event of default also referred to as loss given default, review of credit quality for internally rated obligors and the value of any collateral. Management also considers the impact of economic events, industry trends and risk concentrations on the portfolio and the required allowance.
Allowances are established on an individual basis for loans, commitments and guarantees that management has determined to be impaired and/or for which losses have been incurred. When an obligor is considered impaired, we reduce the carrying value of the loan to its net realizable value. Management is required to make a number of estimates including the timing and amount of future cash flows, residual values of underlying security, as well as the initial judgment as to whether the loan is impaired or performing.
Note 8 – Equipment Available for Lease
When aircraft are returned to us as a result of default under the related obligors’ loan agreements, we determine their fair value using market values obtained from an independent appraiser supplemented by additional current market data and other information available to us. Judgment is involved in allocating the resulting fair value between the components of the aircraft and in establishing the remaining useful life of the components.
We review the aircraft in our leasing portfolio for impairment quarterly. Judgment as to the impact of current economic events, trends or other circumstances on the viability of our aircraft is required in determining whether impairment has occurred or has been reversed within our portfolio. If an event is judged to have impacted the carrying value of our portfolio, estimates and assumptions surrounding the recoverable amount of the aircraft are made. These include the current fair value of the aircraft, estimated cash flows to be generated from the use of the aircraft, projected future rentals and lease rates and estimated costs to sell the aircraft.
Note 10 – Recoverable Insurance Claims
When an insurance claim is paid, management estimates any future recovery and records it within recoverable insurance claims. The estimation process is dependent upon our assessment of the future cash flows to be realized through collection efforts made by us, the policyholder or collection agencies. The estimated recoverable amount is reviewed and adjusted on a quarterly basis.
Note 19 – Premium and Claims Liabilities
The premium and claims liabilities are based on our estimate of future claims under the terms and conditions of our insurance policies. The actuarial valuation uses simulation techniques and is based on assumptions relevant to the insurance programs and is derived in conjunction with our own experience. Management judgment is required in estimating the variables that are part of the actuarial calculation of the premium and claims liabilities. These variables include severity of loss, loss development, frequency of claim and discount rates used. Management judgment is also used in selecting the confidence level for adverse deviation.
Note 28 – Financial Instruments Measured at Fair Value
The majority of financial instruments are recognized on our consolidated statement of financial position at their fair value. These financial instruments include marketable securities at fair value through profit or loss, recoverable insurance claims, derivative instruments, investments at fair value through profit or loss and loans payable designated at fair value through profit or loss. Fair value is defined as the price that would be received to sell an asset or paid to transfer a liability in an orderly transaction between market participants at the measurement date.
Our financial instruments are categorized into one of three levels based on whether the techniques employed to value the instruments use observable or unobservable market inputs. Financial instruments categorized as Level 1 are valued using quoted market prices, thus minimal judgment or estimates are required. Those instruments categorized as Level 2 and 3 require the use of increasing levels of judgment and assumptions, including the selection of appropriate discount rates, yield curves and other inputs into our models. Refer to Note 28 for additional details on the techniques used to value our financial instruments.
Our policy is to recognize transfers into and out of fair value hierarchy levels at the date of the event or change in circumstances that caused the transfer. Quantitative disclosure is required for all transfers among all levels regardless of their significance.
Note 39 – Retirement Benefit Obligations
EDC maintains a defined benefit pension plan, a defined contribution plan and other post-retirement benefit plans. IFRS requires that management measure the plans’ defined benefit obligations and annual costs using assumptions that are long-term in nature and reflect our best judgment and estimates. We review key assumptions on an annual basis with our actuaries using relevant experience, in conjunction with market related data. The key assumptions include expected rate of compensation increase, the discount rate and the longevity of plan members. The management assumption with the greatest potential impact on our defined benefit obligation is the discount rate. The discount rate is determined by reference to the yield of a portfolio of high quality fixed income instruments (rated AA or higher), which has the same duration as the plan’s defined benefit obligation.
Marketable Securities
We hold marketable securities for liquidity purposes. The size and nature of our marketable securities portfolio are governed by Board approved policies. Our marketable securities are held with creditworthy counterparties that must have a minimum credit rating from an external credit rating agency of A- for all transactions.
| | | | |
| 92 | | Turning the Corner on Trade | | |
Marketable securities held directly by EDC are recorded at fair value through profit or loss to reflect our business model for managing these instruments. We measure performance for this portfolio against appropriate benchmarks. Purchases and sales of marketable securities are recorded on the trade date and the transaction costs are expensed as incurred. Interest revenue is recorded in marketable securities revenue in the consolidated statement of comprehensive income. Realized and unrealized gains and losses on these securities are included in other expenses in the consolidated statement of comprehensive income.
Marketable securities held by our subsidiary are carried at amortized cost, as the business model for managing these instruments is to collect contractual cash flows which represent the payment of principal and interest. Upon initial recognition the securities are recorded at their fair value plus any transaction costs. Subsequently, they are carried at amortized cost using the effective interest method, less any impairment losses. Interest revenue is recorded in marketable securities revenue in the consolidated statement of comprehensive income.
Loans Receivable
Loans receivable are recorded at fair value upon initial recognition and subsequently measured at amortized cost using the effective interest method. Our loans receivable are held in order to collect contractual cash flows which represent payments of principal, interest and fees. They are derecognized when the rights to receive cash flows have expired or we have transferred substantially all the risks and rewards of ownership.
The effective interest method is a method of calculating the amortized cost of a financial asset and of allocating the interest income over the relevant period in financing and investment revenue in the consolidated statement of comprehensive income. The effective interest rate is the rate that exactly discounts estimated future cash payments or receipts through the expected life of the financial instrument or, when appropriate, a shorter period, to the net carrying amount of the financial asset. When calculating the effective interest rate, we estimate cash flows considering all contractual terms of the financial instrument (for example, prepayment options) but do not consider future credit losses. The calculation includes all fees paid or received that are an integral part of the effective interest rate, transaction costs and all other premiums or discounts.
While it is generally our intention to hold performing loan assets until maturity, in some cases the loans are sold prior to maturity for risk mitigation purposes. Gains and losses on the sale of performing loans and gains on the sale of impaired loans are included in other expenses. Losses on sales of impaired loans are reported in the provision for (reversal of) credit losses.
Loan Guarantees
In the ordinary course of business we issue loan guarantees to cover non-payment of principal, interest and fees due to banks and financial institutions providing loans to Canadian exporters or buyers of Canadian goods and services. Loan guarantees are initially recognized in the financial statements at fair value in the liability for loan guarantees. Fair value is determined to be the guarantee fee received. Subsequent to initial recognition, our liability is measured at the higher of the unamortized guarantee fees and the allowance calculated that estimates the loss anticipated to be incurred as a result of satisfying our obligation under that guarantee.
Any increase in liability relating to loan guarantees is recorded in the consolidated statement of comprehensive income in the provision for (reversal of) credit losses. Guarantee fees received up-front are recognized in the consolidated statement of comprehensive income on a straight-line basis over the life of the guarantee. Guarantee fees that are received in arrears are recognized in the consolidated statement of comprehensive income on an accrual basis.
Impairment of Financial Instruments
Marketable Securities
At the end of each reporting period, for marketable securities at amortized cost, an impairment loss is recognized when there is objective evidence that there has been a deterioration of credit quality subsequent to the initial recognition of the security to the extent that we no longer have reasonable assurance as to the timely collection of the full amount of the principal and interest. The impairment loss is measured as the difference between the asset’s carrying amount and the present value of estimated future cash flows discounted at the asset’s original effective interest rate.
Loans Receivable
Loans that have been individually assessed to be impaired meet one or more of the following criteria which represent objective evidence of impairment:
| | |
| | there has been a deterioration in credit quality to the extent that there is no longer reasonable assurance of the timely collection of the full amount of principal and interest; or |
| |
| | for commercial loans, when there are payments overdue of 90 days or more, unless the loan is fully secured or collection efforts are reasonably expected to result in repayment of debt. |
If there is objective evidence that an impairment loss has occurred on an individual loan, the amount of the loss is measured as the difference between the loan’s carrying amount and the present value of any estimated future cash flows discounted at the loan’s original effective interest rate. The principal portion of the carrying amount of the loan is reduced through the use of an individual allowance and any accrued unpaid contractual interest and other receivables that form part of the carrying value of the loan are reduced to zero through income.
Thereafter, interest income on individually impaired loans is recognized based on the reduced carrying value of the loan using the original effective interest rate of the loan.
| | | | |
| | EDC Annual Report 2013 | | 93 |
CONSOLIDATED FINANCIAL STATEMENTS
When a loan is uncollectible, it is written off against the individual allowance. Such loans are written off when all collection methods have been exhausted and no further prospect of recovery is likely.
Loans are returned to performing status when it is likely that contractual payments will continue pursuant to the terms of the loan. When restructured loans containing concessions are returned to performing status, their carrying value is adjusted to reflect the original yield of the loan or the weighted average yield in the case of loan consolidations.
Sovereign Loans Receivable
In compliance with the terms of Paris Club rescheduling agreements, contractual interest maturities for individually impaired sovereign loans are included in gross loans receivable. The Paris Club is an international forum of sovereign creditors, including Canada, who agree to formally reschedule sovereign borrowers’ debt when they are experiencing financial difficulties and are unable to meet their obligations.
Sovereign loans undergoing debt rescheduling are classified as individually impaired. The resulting agreements provide for the consolidation and deferred repayment of principal and interest maturities at concessional interest rates. While impaired, we reduce the loan’s carrying value by the impact of the interest rescheduled which is included in deferred loan revenue and other credits in Notes 4 and 5. At the time the loan is returned to performing status, the carrying value of the loan is adjusted to reflect the original yield of the loan.
Loan Guarantees
Loan guarantees with impaired obligors are identified using the same criteria on the underlying loan as used to assess the impairment of direct loans carried at amortized cost. When the underlying loan is individually assessed to be impaired, it is probable that a call on the guarantee will be made representing an outflow of economic benefits that would be required to settle our obligation under the guarantee. The amount of any credit loss and any subsequent changes due to the re-evaluation of the obligation are recognized in the consolidated statement of comprehensive income as part of the provision for (reversal of) credit losses.
Allowance for Losses on Loans, Loan Commitments and Loan Guarantees
The allowance for losses on loans, loan commitments and loan guarantees represents management’s best estimate of probable credit losses and is based on the incurred loss model. The allowance is determined based on a review of all loans, loan guarantees and commitments and includes both individual and collective allowances.
Allowances on Individually Impaired Loans
The individual allowance is the difference between the carrying value of the loan and the present value of the estimated future cash flows discounted at the loan’s original effective interest rate. The calculation of the present value of the estimated future cash flows of a collateralized loan asset reflects the cash flows that are expected to result on foreclosure less costs to obtain and sell the collateral whether or not foreclosure is probable.
If, in a subsequent period, the amount of the impairment loss either increases or decreases and the change can be related objectively to an event occurring after the impairment was recognized (such as a change in the obligor’s financial position or a change in the estimate of future cash flows), the previously recognized impairment loss is adjusted through the individual allowance.
The amount of initial impairment loss and any subsequent changes due to the re-evaluation of estimated future cash flows are recognized in the consolidated statement of comprehensive income as part of the provision for (reversal of) credit losses.
Collective Allowance
A collective allowance is established for losses which we estimate to have occurred but have not yet been individually identified within our portfolio. Loans and loan guarantees not found to be individually impaired, as well as loan commitments, are included in the collective assessment. The assessment is based on events that have occurred as of the reporting date and include factors such as business cycle trends and the fair value of collateral. The collective allowance is comprised of a base allowance, calculated using counterparty credit ratings, exposure, loss severity and probability of default factors. The collective allowance may also include concentration and market overlays.
For the base allowance we group our commercial performing loans, loan commitments and loan guarantees by industry of risk and then by secured and unsecured exposures. Sovereign exposures are classified into one portfolio. We assign credit ratings to our commercial and sovereign obligors using a system of twenty credit ratings (AAA to C-) which are consistent with ratings used by our credit risk management policies. For secured portfolios, the exposure for each obligor is reduced by the fair value of collateral adjusted for estimated repossession costs. Based on these exposures we determine the appropriate base allowance. Loss severity is determined based on historical loan loss rates and by management estimates for each of our exposure categories. Default rates are based on an internally developed standard probability of default rate table.
We have a number of significant single name counterparty concentrations as a result of our mandate. A counterparty concentration overlay is established for counterparties whose exposure is deemed by management to represent an increased amount of risk. This overlay is applied to counterparties whose exposure exceeds 10% of our equity determined in accordance with the previous year’s audited financial statements.
We determine the collective allowance using various assumptions based upon current counterparty credit ratings. We also assess the extent to which these ratings do not reflect recent economic events that may result in credit deterioration. In these cases we will estimate the potential impact on our allowances and apply market overlays to specific industries or other exposure categories that we deem appropriate.
| | | | |
| 94 | | Turning the Corner on Trade | | |
The collective allowances for performing loans and individual allowances for impaired loans are shown as a reduction to assets on the consolidated statement of financial position. Collective and individual allowances for loan commitments and loan guarantees are shown as liabilities on the consolidated statement of financial position.
Foreclosed Assets
Assets that are returned to us1 because of default under loan agreements are classified as held-for-use or held-for-sale according to management’s intention. Those classified as held-for-use are included in equipment available for lease or reclassified as finance leases. Assets classified as held-for-use are initially recorded at fair value and subsequently recorded at cost less accumulated depreciation and impairment losses. Those classified as held-for-sale include aircraft or component parts held-for-sale and are recorded in other assets initially at fair value less costs to sell. Any write-downs at recognition are reported in the provision for (reversal of) credit losses and any gains are recorded in other expenses. We determine fair value based on market prices obtained from an independent appraiser along with current market data and other information available to us. Subsequent impairment losses or reversals of impairment losses are determined as the difference between the carrying amount and the recoverable amount and are recorded in other expenses.
Investments at Fair Value Through Profit or Loss
Investments are comprised of direct investments that we have made in private and public companies and investments in private equity funds. Purchases and sales of these investments are recorded on a trade-date basis and are measured at fair value. Subsequent changes in fair value and any realized gains and losses are recorded in other expenses. Transaction costs are expensed as incurred and included within leasing and financing related expenses.
Equipment Available for Lease
Equipment available for lease consists of aircraft that were returned to us because of default under the related obligors’ loan agreements. While we do not in the ordinary course of business act as a lessor, from time to time we may engage in leasing activities for asset management purposes to maximize recoveries on returned aircraft and minimize potential losses.
Equipment available for lease is accounted for using the cost model and is stated at cost less accumulated depreciation and impairment losses. Upon initial recognition of the asset, engines are treated as a separate component and are depreciated on a straight-line basis over their remaining useful life net of their residual value. The remaining useful lives of the engines range from one to eighteen years. The remaining components of the aircraft are grouped together and depreciation is calculated on a straight-line basis over the remaining useful life of the aircraft after consideration of any residual value. The remaining useful lives of the aircraft range from one to eighteen years. Residual values of the aircraft and engines are reviewed on an annual basis. The costs of subsequent major overhauls are capitalized and amortized over the period to the next overhaul, from one to three years.
Depreciation as well as insurance and other costs related to the equipment available for lease are included in leasing and financing related expenses. Lease set-up costs are capitalized as part of the carrying value of the aircraft and amortized over a period equaling the term of the specific lease. Operating lease revenue is recognized on a straight-line basis over the terms of the underlying leases.
An impairment loss is identified when the carrying value of the aircraft exceeds its recoverable amount. The recoverable amount is the higher of the fair value less costs to sell and the value in use. Fair value is determined by considering market data and other information available to us. The value in use is the present value of the cash flows expected to result from the aircraft’s use and eventual disposition. Current lease rentals, as well as market information on projected future rentals and fair values, form the basis of this calculation.
A review for impairment of equipment available for lease is performed quarterly. When events or changes in circumstances indicate that there may be an impairment loss or that a previously recorded impairment loss may no longer exist or may have increased or decreased, the recoverable amount of the asset is estimated.
The amount of the impairment loss recognized is calculated as the difference between the carrying amount of the asset and its recoverable amount. When there is a reversal of impairment loss, the carrying amount of the aircraft is increased to the lower of the recoverable amount and the carrying amount that the aircraft would have had if the previous impairment loss had not been recognized. In both cases, the adjustment to the carrying value of the aircraft is recorded in other expenses.
Finance Leases
Leases in which substantially all the risks and rewards of ownership are transferred to EDC are classified as finance leases. We have two types of finance leases – aircraft under finance leases and building under finance lease.
Lessor
Aircraft under finance leases relate to aircraft that were returned to us due to default under the related obligor’s loan agreements and were subsequently placed under long-term financing leases. These leases are recorded on the consolidated statement of financial position at the aggregate future minimum lease payments plus estimated residual values less unearned finance income. Residual values are based on independent appraisals and are reviewed periodically. An allowance for impairment is calculated consistent with the methodology used for our secured loan portfolio which is described on page 94.
Finance lease revenue is recognized in a manner that produces a constant rate of return on the investment in the lease.
| 1 | All aircraft returned to us for which the equity interest in the leveraged lease structure has been foreclosed have been registered with a number of trusts of which we are exposed, or have rights, to variable returns from our involvement with a structured entity and have the ability to affect those returns through our decision-making power over the structured entity. |
| | | | |
| | EDC Annual Report 2013 | | 95 |
CONSOLIDATED FINANCIAL STATEMENTS
Lessee
Our head office building is held under a finance lease. The building has been recorded on our consolidated statement of financial position at its estimated fair value at the inception of the lease. Lease payments are allocated between finance charges and repayment of the obligation under finance lease to achieve a constant rate of interest on the remaining balance of the obligation. The leased building is being depreciated over the most likely lease term of 25 years. The estimated lease period is reviewed periodically.
Finance charges and depreciation expense on the building are recorded as accommodation costs within administrative expenses in the consolidated statement of comprehensive income.
Property, Plant and Equipment
Property, plant and equipment are carried at cost less accumulated depreciation and impairment losses. Depreciation is charged on a straight-line basis over the estimated useful lives of the assets or the term of the relevant lease. The estimated useful lives and depreciation methods are reviewed at the end of each year, with the effect of any changes in estimate being accounted for on a prospective basis. The useful life used in the calculation of depreciation for furniture and equipment is five years and three years for computer hardware. Leasehold improvements are depreciated over the shorter of the term of the respective lease or the useful economic life of the leasehold improvement. Depreciation is recorded in administrative expenses.
The gain or loss arising on the disposal or retirement of an item of property, plant and equipment is determined as the difference between the sale proceeds and the carrying amount of the asset and is recognized in other expenses.
Intangible Assets
Intangible assets represent internally developed and purchased computer software. They are carried at cost less accumulated amortization and impairment losses. Amortization is charged on a straight-line basis over the estimated useful lives of the intangible assets. The estimated useful lives and amortization methods are reviewed at the end of each year, with the effect of any changes in estimate being accounted for on a prospective basis. The useful life used in the calculation of amortization for internally developed software and computer software is five years. Amortization is recorded in administrative expenses.
Insurance Premiums
Insurance contracts are those contracts where we have accepted significant insurance risk from the policyholders by agreeing to compensate the policyholders if they are adversely affected by a specified uncertain future event.
Premiums on insurance policies are deferred and recognized in income over the term of the policy on a straight-line basis.
Recoverable Insurance Claims
Recoverable insurance claims represent the portion of insurance claims paid that are expected to be recovered. Recoverable insurance claims are reviewed and adjusted on a quarterly basis with any subsequent net gain or loss on recovery credited or charged to claims-related expenses (recovery).
Premium and Claims Liabilities
Premium and claims liabilities represent our estimate of future claims under the terms and conditions of our insurance policies. An actuarial valuation, which conforms to the recommendations of the Canadian Institute of Actuaries, is performed to establish our liability. The valuation uses simulation techniques and assumptions derived from our own experience (severity of loss, loss development, frequency of claim and discount rates used) relevant to our insurance programs. The liability is comprised of reported claims, incurred but not reported claims (IBNR), and management’s best estimate of the net present value of net future claims under existing policies.
Deferred insurance premiums are the portion of premiums received on policies written that relate to risk periods after the current fiscal year. To the extent that our deferred premiums are not sufficient to cover our liability, an allowance is established. Any adjustments to the liability are reflected in claims-related expenses (recovery) in the period in which they become known. Future developments may result in claims which are materially different than the allowance provided.
Premium and claims liabilities on our consolidated statement of financial position include both the deferred premiums and the allowance.
Reinsurance
In the ordinary course of business, we assume and cede reinsurance with other insurance companies. We cede reinsurance to mitigate our risk. The ceding arrangements provide greater diversification of the business and minimize the net loss potential arising from large risks. Ceded reinsurance contracts do not relieve us of our obligations to the insured but they do provide for the recovery of claims arising from the liabilities ceded. We also assume reinsurance and thereby take on risk. Reinsurance premiums, unearned premiums ceded to reinsurers and recoveries and estimates of recoveries on claims are recorded in the same manner as if the reinsurance were considered direct business. Amounts recoverable from the reinsurers are estimated in a manner consistent with the claims liability associated with the reinsured policy and are recorded within reinsurers’ share of premium and claims liabilities. Reinsurance assets or liabilities are derecognized when the contractual rights are extinguished or expire.
| | | | |
| 96 | | Turning the Corner on Trade | | |
Reinsurance assets are reviewed for impairment at each reporting date or more frequently when an indication of impairment arises during the reporting year. Impairment occurs when there is objective evidence as a result of an event that occurred after initial recognition of the reinsurance asset that we may not receive all outstanding amounts due under the terms of the contract and the event has a reliably measurable impact on the amounts that we will receive from the reinsurer.
Deferred Revenue
Deferred loan revenue, which consists of exposure, administration and other upfront loan fees, is included in loans receivable and amortized as a yield increment over the term of the related loan. Guarantee fee revenue and insurance premium revenue are recognized as deferred revenue and are amortized over the term of the related guarantee or insurance policy.
Derivative Instruments
Derivative instruments (derivatives) are financial contracts that derive their value from underlying changes in interest rates, foreign exchange rates, equities, credit spreads or other financial measures. Derivatives that we currently use include interest rate swaps, cross currency interest rate swaps, foreign exchange swaps, foreign exchange forwards, non-deliverable forwards and credit default swaps.
We use derivatives to manage interest rate risk, foreign exchange risk and credit risk. We also hold a portfolio of derivatives which we use to manage the foreign exchange risk associated with using our capital to fund our operations largely denominated in U.S. dollars. Derivatives are only contracted with creditworthy counterparties in accordance with policies established by our Risk Management Office and approved by our Board of Directors.
We do not apply hedge accounting to our derivatives. Derivatives are accounted for at fair value and are recognized on the consolidated statement of financial position upon the trade date and are removed from the consolidated statement of financial position when they expire or are terminated. Derivatives with a positive fair value are reported as derivative instruments within assets, while derivatives with a negative fair value are reported as derivative instruments within liabilities. All interest income and expenses associated with our derivatives are included in interest expense, while realized and unrealized gains and losses are recorded in other expenses.
Long-term currency swaps are considered part of the financing cash flows on the consolidated statement of cash flows because these swaps are used to manage our funding. We often issue debt in currencies which offer a more advantageous cost. We then use currency swaps to bring those funds into the currency required to disburse on our loans. All other swaps are included in operating cash flows as they are used to alter the interest rate risk profile of the portfolio.
Loans Payable
We have designated the majority of our debt, including structured debt, at fair value through profit or loss in order to obtain the same accounting treatment as the related derivatives. In general, these derivatives are transacted to manage interest and foreign exchange rate risk on the related debt. Contractual interest on our long-term debt and commercial paper is recorded in interest expense. Any change in fair value on these instruments is recorded in other expenses.
Our fixed rate bonds which do not have derivatives associated with them are carried at amortized cost using the effective interest rate method with interest recorded in interest expense.
The transaction costs related to our loans payable carried at amortized cost are capitalized. The transaction costs related to our loans payable designated at fair value through profit or loss are expensed as they are incurred and are included within interest expense.
Any fair value gains or losses on initial recognition of our debt or derivatives at Level 3 on the fair value hierarchy are deferred and amortized over the life of the instruments.
Accounts Payable and Other Credits
Accounts payable and other credits are carried at amortized cost.
Translation of Foreign Currency
All monetary assets and liabilities denominated in foreign currencies are translated into Canadian dollars, the functional and presentation currency of the Corporation, at exchange rates prevailing at the end of the year. Income and expenses are translated at either daily or monthly average exchange rates in effect during the year. Exchange gains and losses resulting from the translation of foreign currency balances and transactions are included in other expenses.
Foreign currency non-monetary items that are measured at historical cost are translated at historical rates. Foreign currency non-monetary items measured at fair value are translated using the rate of exchange at the date the fair value was determined.
Retirement Benefit Obligations
We maintain a defined benefit pension plan, a defined contribution plan, and other post-retirement benefit plans including a retiring allowance plan and life insurance, health and dental care benefits. The defined benefit plan is only available for employees hired prior to January 1, 2012.
The accrued benefit obligations are actuarially determined using the projected unit credit method (which incorporates management’s best estimate of future salary levels, retirement ages of employees and other actuarial factors).
| | | | |
| | EDC Annual Report 2013 | | 97 |
CONSOLIDATED FINANCIAL STATEMENTS
Pension fund assets are valued at fair value for the purpose of calculating the expected return on plan assets.
The defined benefit expense (included in administrative expenses) consists of the actuarially determined retirement benefits for the current year’s service, imputed interest on projected benefit obligations net of interest earned on any plan assets over the average remaining working lives of employees expected to receive benefits under the plans.
Re-measurement gains and losses arise from the difference between the actual rate of return and the discount rate on plan assets for that period and from changes in actuarial assumptions used to determine the accrued benefit obligation. Actuarial gains or losses are recognized in other comprehensive income and are closed to retained earnings.
Early Adoption of IFRS
IFRS 9 – Financial Instruments
EDC early adopted IFRS 9 (2010) – Financial Instruments upon transition to IFRS in 2011. The IASB has deferred the mandatory effective date pending the finalization of the impairment and classification and measurement requirements; however, early application of IFRS 9 is still permitted.
Future Accounting Changes
A number of new amendments and improvements effective on or after January 1, 2014 have been issued by the IASB. We do not expect these amendments and improvements to have a significant impact on future financial results.
3. Marketable Securities
We maintain liquidity sufficient to meet general operating requirements, to maintain stability in our short-term borrowing program and to provide flexibility in achieving corporate objectives. Consistent with our business model for managing these instruments, they are carried at fair value through profit or loss or at amortized cost.
| | | | | | | | | | | | | | | | | | | | | | | | |
(in millions of Canadian dollars) | | Dec. 31, 2013 | | | Dec. 31, 2012 | |
Issued or guaranteed by: | |
| At fair value
through profit
or loss |
| |
| At amortized
cost |
(2) | | | Total | | |
| At fair value
through profit
or loss |
| |
| At amortized
cost |
(2) | | | Total | |
U.S. government | | | 2,596 | | | | 60 | | | | 2,656 | | | | 2,954 | | | | 55 | | | | 3,009 | |
| | | | | | | |
Financial institutions | | | 824 | | | | – | | | | 824 | | | | 673 | | | | – | | | | 673 | |
| | | | | | | |
Other government | | | 326 | | | | – | | | | 326 | | | | 320 | | | | – | | | | 320 | |
| | | | | | | |
Canadian government(1) | | | 98 | | | | 20 | | | | 118 | | | | 121 | | | | 19 | | | | 140 | |
| | | | | | | |
Corporate | | | 15 | | | | – | | | | 15 | | | | 14 | | | | – | | | | 14 | |
Total marketable securities | | | $3,859 | | | | $80 | | | | $3,939 | | | | $4,082 | | | | $74 | | | | $4,156 | |
| (1) | Canadian government includes federal and provincial governments and Crown corporations. |
| (2) | Represent securities held by our subsidiary Exinvest Inc. |
The following table provides a breakdown of our marketable securities by remaining term to maturity:
| | | | | | | | | | | | | | | | | | | | | | | | | | | | | | | | |
(in millions of Canadian dollars) | | Dec. 31, 2013 | | | Dec. 31, 2012 | |
| | | Remaining term to maturity | | | | | | Remaining term to maturity | | | | |
| | | Under 1
year | | | 1 to 3
years | | | Over 3
years | | | Total | | | Under 1
year | | | 1 to 3
years | | | Over 3
years | | | Total | |
At fair value through profit or loss | | | | | | | | | | | | | | | | | | | | | | | | | | | | | | | | |
| | | | | | | | | |
Short-term instruments | | | 1,745 | | | | – | | | | – | | | | 1,745 | | | | 1,951 | | | | – | | | | – | | | | 1,951 | |
| | | | | | | | | |
Long-term fixed rate securities | | | 79 | | | | 917 | | | | 1,118 | | | | 2,114 | | | | 103 | | | | 799 | | | | 1,229 | | | | 2,131 | |
Total at fair value through profit or loss | | | 1,824 | | | | 917 | | | | 1,118 | | | | 3,859 | | | | 2,054 | | | | 799 | | | | 1,229 | | | | 4,082 | |
At amortized cost | | | | | | | | | | | | | | | | | | | | | | | | | | | | | | | | |
| | | | | | | | | |
Long-term fixed rate securities | | | 20 | | | | 39 | | | | 21 | | | | 80 | | | | 18 | | | | 37 | | | | 19 | | | | 74 | |
Total marketable securities | | | $1,844 | | | | $956 | | | | $1,139 | | | | $3,939 | | | | $2,072 | | | | $836 | | | | $1,248 | | | | $4,156 | |
| | | | |
| 98 | | Turning the Corner on Trade | | |
4. Loans Receivable
The following table presents the various components of loans receivable and the contractual maturity and related contractual effective yields for gross loans receivable. The yields are computed on a weighted average basis by amount and term. Floating rate yields are expressed as spreads over base rates which consist mainly of LIBOR for U.S. dollars and CDOR for Canadian dollars.
| | | | | | | | | | | | | | | | | | | | | | | | | | | | | | | | | | | | | | | | |
(in millions of Canadian dollars) | | Dec. 31, 2013 | | | Dec. 31, 2012* | |
| | | Floating $ | | | Spread % | | | Fixed $ | | | Yield to maturity % | | | Total $ | | | Floating $ | | | Spread % | | | Fixed $ | | | Yield to maturity % | | | Total $ | |
Performing: | | | | | | | | | | | | | | | | | | | | | | | | | | | | | | | | | | | | | | | | |
| | | | | | | | | | | |
Past due | | | 7 | | | | 5.21 | | | | 2 | | | | 6.21 | | | | 9 | | | | 11 | | | | 3.72 | | | | – | | | | – | | | | 11 | |
| | | | | | | | | | | |
2013 | | | – | | | | – | | | | – | | | | – | | | | – | | | | 3,324 | | | | 1.93 | | | | 1,035 | | | | 5.24 | | | | 4,359 | |
| | | | | | | | | | | |
2014 | | | 3,788 | | | | 2.01 | | | | 1,146 | | | | 5.20 | | | | 4,934 | | | | 2,664 | | | | 2.27 | | | | 1,047 | | | | 5.34 | | | | 3,711 | |
| | | | | | | | | | | |
2015 | | | 4,170 | | | | 2.34 | | | | 1,070 | | | | 5.29 | | | | 5,240 | | | | 4,024 | | | | 2.53 | | | | 903 | | | | 5.46 | | | | 4,927 | |
| | | | | | | | | | | |
2016 | | | 5,001 | | | | 1.87 | | | | 989 | | | | 5.23 | | | | 5,990 | | | | 3,068 | | | | 2.03 | | | | 810 | | | | 5.39 | | | | 3,878 | |
| | | | | | | | | | | |
2017 | | | 4,447 | | | | 2.00 | | | | 1,130 | | | | 4.84 | | | | 5,577 | | | | 2,458 | | | | 2.41 | | | | 916 | | | | 4.90 | | | | 3,374 | |
| | | | | | | | | | | |
2018 | | | 3,228 | | | | 2.34 | | | | 1,148 | | | | 4.46 | | | | 4,376 | | | | 1,426 | | | | 2.38 | | | | 736 | | | | 5.04 | | | | 2,162 | |
| | | | | | | | | | | |
2019 – 2023 | | | 5,414 | | | | 2.12 | | | | 2,873 | | | | 4.47 | | | | 8,287 | | | | 3,429 | | | | 2.02 | | | | 2,124 | | | | 4.59 | | | | 5,553 | |
| | | | | | | | | | | |
2024 and beyond | | | 1,265 | | | | 2.53 | | | | 272 | | | | 4.34 | | | | 1,537 | | | | 1,038 | | | | 1.76 | | | | 163 | | | | 4.70 | | | | 1,201 | |
| | | | | | | | | | | |
Performing gross loans receivable | | | 27,320 | | | | 2.18 | | | | 8,630 | | | | 4.59 | | | | 35,950 | | | | 21,442 | | | | 2.13 | | | | 7,734 | | | | 4.86 | | | | 29,176 | |
| | | | | | | | | | | |
Impaired (Note 5) | | | 398 | | | | 2.63 | | | | 201 | | | | 4.35 | | | | 599 | | | | 868 | | | | 2.40 | | | | 292 | | | | 5.83 | | | | 1,160 | |
Gross loans receivable | | | $27,718 | | | | | | | | $8,831 | | | | | | | | $36,549 | | | | $22,310 | | | | | | | | $8,026 | | | | | | | | $30,336 | |
| | | | | | | | | | | |
Accrued interest and fees receivable | | | | | | | | | | | | | | | | | | | 154 | | | | | | | | | | | | | | | | | | | | 157 | |
| | | | | | | | | | | |
Deferred loan revenue and other credits | | | | | | | | | | | | | | | | | | | (346) | | | | | | | | | | | | | | | | | | | | (362) | |
Loans receivable | | | | | | | | | | | | | | | | | | | $36,357 | | | | | | | | | | | | | | | | | | | | $30,131 | |
* Prior year comparatives have been restated to reflect updated repayment schedules.
At the end of December 2013, the floating rate performing gross loans receivable yield was 2.57% (2012 – 2.83%) with an average term to reset of 112 days (2012 – 109 days).
Sovereign loans represent 3% of total performing gross loans receivable, consistent with December 31, 2012.
We have country risk concentrations as outlined below:
| | | | | | | | | | | | | | | | | | |
(in millions of Canadian dollars) | | Dec. 31, 2013 | | | Dec. 31, 2012 | | | |
Country | | Performing gross
loans receivable | | | % | | | Performing gross
loans receivable | | | % | | | |
United States | | | 8,023 | | | | 22 | | | | 7,326 | | | | 25 | | | |
| | | | | | |
Canada | | | 4,142 | | | | 12 | | | | 3,945 | | | | 14 | | | |
| | | | | | |
Brazil | | | 2,700 | | | | 8 | | | | 2,252 | | | | 8 | | | |
| | | | | | |
Mexico | | | 2,248 | | | | 6 | | | | 1,888 | | | | 6 | | | |
| | | | | | |
United Kingdom | | | 2,238 | | | | 6 | | | | 861 | | | | 3 | | | |
| | | | | | |
Australia | | | 2,047 | | | | 6 | | | | 1,153 | | | | 4 | | | |
| | | | | | |
India | | | 1,471 | | | | 4 | | | | 1,472 | | | | 5 | | | |
| | | | | | |
Chile | | | 1,247 | | | | 3 | | | | 1,136 | | | | 4 | | | |
| | | | | | |
Russia | | | 806 | | | | 2 | | | | 524 | | | | 2 | | | |
| | | | | | |
Qatar | | | 749 | | | | 2 | | | | 745 | | | | 3 | | | |
| | | | | | |
Other | | | 10,279 | | | | 29 | | | | 7,874 | | | | 26 | | | |
Total | | | $35,950 | | | | 100 | | | | $29,176 | | | | 100 | | | |
| | | | |
| | EDC Annual Report 2013 | | 99 |
CONSOLIDATED FINANCIAL STATEMENTS
We have single counterparty performing gross loans receivable with two airlines totalling $3,103 million (2012 – $2,772 million) located in the United States, $2,404 million with two oil and gas entities located in Mexico and Brazil (2012 – $2,190 million) and $985 million with an extractive entity located in Brazil (2012 – $954 million).
We sold $160 million in loans to various counterparties in 2013 (2012 – $197 million). We recovered $124 million and the remaining $36 million was written off (2012 – $150 million recovered and $47 written off). The loans sold include four performing loans totalling $88 million (2012 – nine performing loans totalling $107 million). The performing loans were sold without recourse and the sales resulted in a loss of $2 million (2012 – $1 million).
The breakdown of our gross loans receivable by credit grade is as follows:
| | | | | | | | | | | | | | | | |
| (in millions of Canadian dollars) | | Dec. 31, 2013 | | | Dec. 31, 2012 | |
| | | $ | | | % of total | | | $ | | | % of total | |
Investment grade* | | | 19,413 | | | | 53 | | | | 14,480 | | | | 48 | |
| | | | | |
Below investment grade | | | 16,537 | | | | 45 | | | | 14,696 | | | | 48 | |
| | | | | |
Individually impaired loans (Note 5) | | | 599 | | | | 2 | | | | 1,160 | | | | 4 | |
Total gross loans receivable | | | $36,549 | | | | 100 | | | | $30,336 | | | | 100 | |
* Investment grade exposure represents obligors with credit ratings of BBB- and above.
We employ a range of policies to mitigate credit risk on our commercial loans which includes obtaining certain forms of security interest. The principal types of security interest are mortgages on equipment (mainly aircraft and rolling stock) and real estate, assignments or pledges on various business assets such as trade receivables, inventory, property, plant and equipment, equity shares and bank accounts. Other principal forms of credit enhancement include guarantees from counterparties with higher credit ratings that may be related to the borrower, such as a parent company.
As at December 31, 2013, 29% of our loans were collateralized mainly by aircraft and rolling stock (2012 – 33%). EDC did not repossess any assets during the year.
Our concentrations of risk are managed by obligor, country and industry sector. The maximum gross loans receivable exposure to any one obligor as at December 31, 2013 was $1,647 million (2012 – $1,581 million) before taking into account collateral and $626 million (2012 – $669 million) net of collateral.
A loan payment is considered past due when the obligor has failed to make the payment by the contractual due date. The breakdown of our gross loans receivable that are past due but not impaired is as follows:
| | | | | | | | |
| (in millions of Canadian dollars) | | Dec. 31, 2013 | | | Dec. 31, 2012 | |
Less than 30 days | | | 7 | | | | 7 | |
| | | |
30 to 180 days | | | 2 | | | | 4 | |
Total | | | $9 | | | | $11 | |
The following reflects the movement in gross loans receivable during the year: | |
| (in millions of Canadian dollars) | | 2013 | | | 2012 | |
Balance at beginning of year | | | 30,336 | | | | 29,093 | |
| | | |
Disbursements | | | 14,100 | | | | 11,887 | |
| | | |
Principal repayments | | | (9,808 | ) | | | (9,082 | ) |
| | | |
Principal recoveries from asset sales | | | (124 | ) | | | (150 | ) |
| | | |
Loans written off | | | (62 | ) | | | (408 | ) |
| | | |
Value of repossessed assets from loan foreclosures | | | – | | | | (465 | ) |
| | | |
Foreign exchange translation | | | 2,098 | | | | (552 | ) |
| | | |
Other* | | | 9 | | | | 13 | |
Balance at end of year | | | $36,549 | | | | $30,336 | |
| * | Includes capitalized interest of $9 million (2012 – $9 million). In 2013 there was no financing of aircraft previously held-for-sale (2012 – $4 million). | |
| | | | |
| 100 | | Turning the Corner on Trade | | |
5. Individually Impaired Loans
The following table shows the carrying amount of loans specifically identified as impaired:
| | | | | | |
(in millions of Canadian dollars) | | Dec. 31, 2013 | | | Dec. 31, 2012 |
Gross loans receivable | | | | | | |
Sovereign | | | 81 | | | 78 |
Commercial | | | 518 | | | 1,082 |
| | | | 599 | | | 1,160 |
Less: Deferred loan revenue and other credits | | | 15 | | | 24 |
Individual allowance | | | 345 | | | 298 |
Carrying amount of individually impaired loans | | | $239 | | | $838 |
The following reflects the movement in individually impaired gross loans receivable during the year: |
(in millions of Canadian dollars) | | 2013 | | | 2012 |
Balance at beginning of year | | | 1,160 | | | 1,805 |
Loans classified as impaired | | | 285 | | | 361 |
Disbursements on loan guarantees called | | | 20 | | | 72 |
Loans reinstated to performing | | | (760) | | | – |
Principal repayments | | | (61) | | | (123) |
Loans written off | | | (60) | | | (407) |
Principal recoveries from asset sales | | | (38) | | | (46) |
Value of repossessed assets from loan foreclosures | | | – | | | (465) |
Foreign exchange translation | | | 51 | | | (37) |
Other | | | 2 | | | – |
Balance at end of year | | | $599 | | | $1,160 |
During the year, impaired loans to 34 commercial borrowers and no sovereign borrowers totalling $60 million of principal (2012 – 29 commercial and 2 sovereign borrowers totalling $407 million) were written off. These loans were written off after all collection methods had been exhausted and no further prospect of recovery was likely. For the five years ended December 2013, cumulative write-offs of impaired loans totalled $679 million, of which 80% occurred in the past three years.
In 2013, we had $760 million of loans return to performing status (2012 – nil); the most significant loans were to American Airlines, Inc. totalling $516 million and Endeavor Air (formerly Pinnacle Airlines Corporation) totalling $242 million. During 2013, payments of principal and interest from impaired borrowers, as well as proceeds from sales of impaired loans were $122 million (2012 – $225 million). These amounts were applied against the carrying value of the impaired loans.
We sold $72 million in impaired loans to various counterparties in 2013 (2012 – $91 million). We recovered $38 million and the remaining $34 million was written off.
Interest income recognized on impaired loans was $30 million in 2013 (2012 – $41 million).
As at December 31, 2013, impaired loans totalling $222 million (2012 – $776 million) were secured by assets consisting of aircraft with an estimated fair value of $179 million (2012 – $502 million).
| | | | |
| | EDC Annual Report 2013 | | 101 |
CONSOLIDATED FINANCIAL STATEMENTS
| 6. | | Allowance for Losses on Loans, Loan Commitments and Loan Guarantees |
The composition of the allowance for losses on loans, loan commitments and loan guarantees is as follows:
| | | | | | |
(in millions of Canadian dollars) | | Dec. 31, 2013 | | | Dec. 31, 2012 |
Base allowance | | | | | | |
Investment grade exposure | | | 90 | | | 70 |
Non-investment grade exposure | | | 864 | | | 869 |
Total base allowance | | | 954 | | | 939 |
Counterparty concentration | | | | | | |
Investment grade exposure | | | 4 | | | 4 |
Non-investment grade exposure | | | 71 | | | 93 |
Total counterparty concentration | | | 75 | | | 97 |
Total collective allowance* | | | 1,029 | | | 1,036 |
Allowance for individually impaired loans, loan commitments and loan guarantees | | | 379 | | | 314 |
Total allowance for losses on loans, loan commitments and loan guarantees | | | $1,408 | | | $1,350 |
* Includes allowance on finance leases of $10 million (2012 – $17 million).
The following table provides a breakdown of our allowance for losses on loans, loan commitments and loan guarantees by commercial and sovereign risk:
| | | | | | | | | | | | | | | | | | | | | | |
(in millions of Canadian dollars) | | Dec. 31, 2013 | | | Dec. 31, 2012 |
| | | Collective | | | Individual | | | Total | | | Collective | | | Individual | | | Total |
Commercial | | | 931 | | | | 325 | | | | 1,256 | | | | 958 | | | | 275 | | | 1,233 |
Sovereign | | | 98 | | | | 54 | | | | 152 | | | | 78 | | | | 39 | | | 117 |
Total allowance | | | $1,029 | | | | $379 | | | | $1,408 | | | | $1,036 | | | | $314 | | | $1,350 |
During the year, changes to the allowance for losses on loans, loan commitments and loan guarantees were as follows:
| | | | | | | | | | | | | | | | | | | | | | |
(in millions of Canadian dollars) | | 2013 | | | 2012 |
| | | Collective | | | Individual | | | Total | | | Collective | | | Individual | | | Total |
Allowance for losses on loans | | | | | | | | | | | | | | | | | | | | | | |
Balance at beginning of year | | | 884 | | | | 298 | | | | 1,182 | | | | 1,258 | | | | 422 | | | 1,680 |
Provision for (reversal of) losses on loans | | | (39 | ) | | | 82 | | | | 43 | | | | (355 | ) | | | 92 | | | (263) |
Write-offs | | | – | | | | (58 | ) | | | (58) | | | | – | | | | (212 | ) | | (212) |
Recovery of amounts written-off in prior years | | | – | | | | 1 | | | | 1 | | | | – | | | | 5 | | | 5 |
Foreign exchange translation | | | 56 | | | | 22 | | | | 78 | | | | (19 | ) | | | (9 | ) | | (28) |
Total | | | 901 | | | | 345 | | | | 1,246 | | | | 884 | | | | 298 | | | 1,182 |
Allowance for losses on loan commitments | | | | | | | | | | | | | | | | | | | | | | |
Balance at beginning of year | | | 55 | | | | 3 | | | | 58 | | | | 41 | | | | – | | | 41 |
Provision for (reversal of) losses on loan commitments | | | (16 | ) | | | 2 | | | | (14) | | | | 15 | | | | 3 | | | 18 |
Foreign exchange translation | | | 3 | | | | – | | | | 3 | | | | (1 | ) | | | – | | | (1) |
Total | | | 42 | | | | 5 | | | | 47 | | | | 55 | | | | 3 | | | 58 |
Allowance for losses on loan guarantees* | | | | | | | | | | | | | | | | | | | | | | |
Balance at beginning of year | | | 97 | | | | 13 | | | | 110 | | | | 119 | | | | 87 | | | 206 |
Provision for (reversal of) losses on loan guarantees | | | (14 | ) | | | 15 | | | | 1 | | | | (21 | ) | | | (74 | ) | | (95) |
Foreign exchange translation | | | 3 | | | | 1 | | | | 4 | | | | (1 | ) | | | – | | | (1) |
Total | | | 86 | | | | 29 | | | | 115 | | | | 97 | | | | 13 | | | 110 |
Total allowance for losses on loans, loan commitments and loan guarantees | | | $1,029 | | | | $379 | | | | $1,408 | | | | $1,036 | | | | $314 | | | $1,350 |
* Included in the liability for loan guarantees.
| | | | |
| 102 | | Turning the Corner on Trade | | |
In 2011, we initiated a multi-year project to update and standardize our credit risk rating methodology and processes. In 2012, as part of the initial implementation stage of this project, we replaced our probability of default rates with updated rates generated by a new credit risk rating tool that uses external historical experience to generate default tables. This change impacted the allowance and was recognized in the 2012 financial results.
While the probability of default rates were updated in 2012, this was based on each obligor’s existing risk ratings at that time based on our prior risk-rating methodologies. In 2013, as part of the final implementation stages, existing exposures within the scope of this project that require annual review as per our risk management policies have been re-evaluated using the new internal credit risk rating models developed throughout 2012. This migration occurred throughout the year and the difference between using our new models and the former methodologies was a $27 million provision charge and represents a change in accounting estimate. This change in estimate also impacted the provision expense reported in Note 35. The impact on future periods has not been determined as it is impracticable to estimate.
The provision for individually impaired loans, loan commitments and loan guarantees for 2013 of $99 million (2012 – $21 million) includes:
| | |
| | a charge of $194 million (2012 – $294 million) as a result of new impairments and increases to allowances on existing impaired obligors, and |
| |
| | reversals of $95 million (2012 – $273 million) due to changes in the estimated future cash flows or recoveries anticipated from existing impaired obligors as well as obligors reclassified to performing status. |
7. Investments at Fair Value Through Profit or Loss
The investments portfolio is comprised of the following:
| | | | | | | | | | | | |
(in millions of Canadian dollars) | | Dec. 31, 2013 | | | Dec. 31, 2012 |
| | | Cost | | | Fair value | | | Cost | | Fair value |
Direct investments | | | | | | | | | | | | |
Loans and debt securities | | | 7 | | | | 8 | | | 11 | | 7 |
Equity interests | | | 74 | | | | 62 | | | 51 | | 36 |
| | | | 81 | | | | 70 | | | 62 | | 43 |
Fund investments | | | 496 | | | | 467 | | | 402 | | 386 |
Total investments | | | $577 | | | | $537 | | | $464 | | $429 |
Investments revenue was $8 million in 2013 (2012 – $5 million). There was an unrealized loss of $8 million resulting from the change in fair value of investments in 2013 (2012 – $10 million). In 2013, we recorded a capital gain of $12 million from seven funds (2012 – $10 million from six funds). We did not record a capital gain from our direct investments (2012 – $13 million) nor did we recognize a realized loss in 2013 (2012 – $10 million).
| | | | |
| | EDC Annual Report 2013 | | 103 |
CONSOLIDATED FINANCIAL STATEMENTS
8. Equipment Available for Lease
Equipment available for lease consists of aircraft that were returned to us because of default under the related obligors’ loan agreements.
| | | | | | | | | | | | | | | | | | | | | | | | | | | | | | |
(in millions of Canadian dollars) | | 2013 | | | 2012 |
| | | Aircraft | | | Engines | | | Major
overhaul
costs | | | Total | | | Aircraft | | | Engines | | | Major
overhaul
costs | | | Total |
Cost: | | | | | | | | | | | | | | | | | | | | | | | | | | | | | | |
Balance at beginning of year | | | 438 | | | | 181 | | | | 16 | | | | 635 | | | | 79 | | | | 60 | | | | 12 | | | 151 |
Additions | | | – | | | | – | | | | – | | | | – | | | | 364 | | | | 124 | | | | 4 | | | 492 |
Transfers to held-for-sale | | | – | | | | – | | | | – | | | | – | | | | (5 | ) | | | (3 | ) | | | – | | | (8) |
Balance at end of year | | | 438 | | | | 181 | | | | 16 | | | | 635 | | | | 438 | | | | 181 | | | | 16 | | | 635 |
Accumulated depreciation and impairment: | | | | | | | | | | | | | | | | | | | | | | | | | | | | | | |
Balance at beginning of year | | | (59 | ) | | | (40 | ) | | | (11 | ) | | | (110 | ) | | | (51 | ) | | | (37 | ) | | | (9 | ) | | (97) |
Depreciation expense | | | (24 | ) | | | (6 | ) | | | (3 | ) | | | (33 | ) | | | (11 | ) | | | (5 | ) | | | (2 | ) | | (18) |
Elimination on transfer to held-for-sale | | | – | | | | – | | | | – | | | | – | | | | 3 | | | | 2 | | | | – | | | 5 |
Balance at end of year | | | (83 | ) | | | (46 | ) | | | (14 | ) | | | (143 | ) | | | (59 | ) | | | (40 | ) | | | (11 | ) | | (110) |
Carrying amount | | | 355 | | | | 135 | | | | 2 | | | | 492 | | | | 379 | | | | 141 | | | | 5 | | | 525 |
Lease setup costs | | | | | | | | | | | | | | | 1 | | | | | | | | | | | | | | | – |
Total equipment available for lease | | | | | | | | | | | | | | | $493 | | | | | | | | | | | | | | | $525 |
Number of aircraft * | | | | | | | | | | | | | | | 54 | | | | | | | | | | | | | | | 54 |
* In addition to the 54 aircraft, there are also two spare engines in this portfolio for both 2013 and 2012.
On a quarterly basis we assess whether there is any indication of impairment of our aircraft given current market conditions such as recent aircraft sales, leasing rates and other market conditions. Based on our assessment, no impairment loss was recorded in 2013. Based on these same conditions, there was also no indication that a reversal of previous impairment losses would be required.
During 2013, no aircraft were returned to us as a result of loan foreclosures. In 2012, 34 aircraft and two spare engines valued at $465 million were transferred into this portfolio, as well as 2 aircraft valued at $23 million that were received from a non-monetary exchange agreement.
In 2013, no aircraft were reclassified out of this portfolio; while in 2012, 1 aircraft and one airframe valued at $3 million were reclassified to the held-for-sale portfolio which is included in other assets.
The following table illustrates the carrying amount by aircraft type and summarizes the current leasing arrangements within the equipment available for lease portfolio:
| | | | | | | | | | | | | | | | | | | | | | | | | | | | | | |
(in millions of Canadian dollars) | | Dec. 31, 2013 | | | Dec. 31, 2012 |
| | | Number of
aircraft in
portfolio | | | Carrying
amount | | | Number of
aircraft on
operating
lease | | | Current
lease term
range | | | Number of
aircraft in
portfolio | | | Carrying
amount | | | Number of
aircraft on
operating
lease | | | Current
lease term
range |
Aircraft type | | | | | | | | | | | | | | | | | | | | | | | | | | | | | | |
CRJ200 Regional Jets | | | 18 | | | | 35 | | | | 18 | | |
| 10 to 46
months |
| | | 18 | | | | 44 | | | | 18 | | | 8 to 41 months |
CRJ900 Regional Jets | | | 8 | | | | 90 | | | | 8 | | |
| 86 to 89
months |
| | | 8 | | | | 94 | | | | – | | | – |
Dash 8 – Q400* | | | 28 | | | | 368 | | | | 27 | | |
| 79 to 91
months |
| | | 28 | | | | 387 | | | | 14 | | | 91 to 95 months |
Total portfolio | | | 54 | | | | $493 | | | | 53 | | | | | | | | 54 | | | | $525 | | | | 32 | | | |
* In addition to the 28 aircraft, there are two Dash8 – Q400 spare engines available for lease, for both 2013 and 2012.
| | | | |
| 104 | | Turning the Corner on Trade | | |
Operating lease revenue for the year was $55 million (2012 – $17 million). At the end of December 2013 there was 1 idle Dash 8 – Q400 aircraft (2012 – 8 CRJ900 regional jets) contracted to go out on lease in early 2014 for an estimated lease term of 84 months.
The following table presents minimum future lease payments receivable:
| | | | | | |
(in millions of Canadian dollars) | | Dec. 31, 2013 | | | Dec. 31, 2012 |
2013 | | | – | | | 49 |
2014 | | | 70 | | | 50 |
2015 | | | 67 | | | 47 |
2016 | | | 62 | | | 44 |
2017 | | | 60 | | | 43 |
2018 | | | 58 | | | 43 |
2019 and beyond | | | 122 | | | 86 |
Total | | | $439 | | | $362 |
Aircraft or component parts held-for-sale
In 2013, EDC reassessed the value of the 6 aircraft and two engines that were available for part-out. As a result, the carrying value has been written down from $9 million to nil. The resulting impairment loss has been recorded in other expenses.
9. Net Investment in Aircraft under Finance Leases
The following table presents the reconciliation between our gross investment in aircraft under finance leases and the present value of the minimum lease payments receivable:
| | | | | | |
(in millions of Canadian dollars) | | Dec. 31, 2013 | | | Dec. 31, 2012 |
Total minimum lease payments receivable | | | 51 | | | 63 |
Estimated residual values of leased aircraft | | | 36 | | | 33 |
Gross investment in finance leases | | | 87 | | | 96 |
Unearned income | | | (12 | ) | | (17) |
Finance lease interest receivable | | | 1 | | | 1 |
Net investment in finance leases | | | 76 | | | 80 |
Present value of estimated residual values | | | (29 | ) | | (25) |
Present value of minimum lease payments receivable | | | $47 | | | $55 |
Allowance for losses* | | | $10 | | | $17 |
* Included within the allowance for losses on loans, refer to Note 6.
The following table presents minimum lease payments receivable, estimated residual values, gross investment in finance leases, as well as the present value of minimum lease payments receivable:
| | | | | | | | | | | | | | | | | | | | | | | | | | | | | | |
(in millions
of Canadian
dollars) | | Dec. 31, 2013 | | | Dec. 31, 2012 |
| | | Minimum
lease
payments
receivable | | | Estimated
residual
values | | | Gross
investment
in finance
leases | | | Present value
of minimum
lease
payments
receivable | | | Minimum
lease
payments
receivable | | | Estimated
residual
values | | | Gross
investment
in finance
leases | | | Present value
of minimum
lease
payments
receivable |
2013 | | | – | | | | – | | | | – | | | | – | | | | 16 | | | | – | | | | 16 | | | 16 |
2014 | | | 19 | | | | – | | | | 19 | | | | 18 | | | | 16 | | | | – | | | | 16 | | | 15 |
2015 | | | 17 | | | | – | | | | 17 | | | | 16 | | | | 16 | | | | – | | | | 16 | | | 13 |
2016 | | | 13 | | | | 22 | | | | 35 | | | | 11 | | | | 12 | | | | 20 | | | | 32 | | | 9 |
2017 | | | 2 | | | | 14 | | | | 16 | | | | 2 | | | | 3 | | | | 13 | | | | 16 | | | 2 |
Total | | | $51 | | | | $36 | | | | $87 | | | | $47 | | | | $63 | | | | $33 | | | | $96 | | | $55 |
Finance lease revenue for the year was $6 million (2012 – $6 million). At the end of December 2013, 13 aircraft were subject to finance leases with one airline, consistent with 2012. The remaining lease terms range from 28 to 47 months.
| | | | |
| | EDC Annual Report 2013 | | 105 |
CONSOLIDATED FINANCIAL STATEMENTS
10. Recoverable Insurance Claims
During the year, changes to recoverable insurance claims were as follows:
| | | | | | |
(in millions of Canadian dollars) | | 2013 | | | 2012 |
Balance at beginning of year | | | 200 | | | 44 |
Claims paid | | | 56 | | | 355 |
Claims paid – reinsured policies | | | 5 | | | 3 |
Claims recovered | | | (10 | ) | | (22) |
Change in recoverable portion of cumulative claims paid | | | (156 | ) | | (179) |
Foreign exchange translation | | | 1 | | | (1) |
Balance at end of year | | | $96 | | | $200 |
Of the $61 million in claim payments made during 2013 (2012 – $358 million), 53% were related to the credit insurance program (2012 – 84% related to the political risk insurance program). The largest concentrations of claim payments and recoveries were in the following geographic areas:
| | | | | | | | | | | | | | |
(in millions of Canadian dollars) | | Dec. 31, 2013 | | | Dec. 31, 2012 |
| | | Claims paid | | | Claims recovered* | | | Claims paid | | | Claims recovered* |
Middle East and Africa | | | 25 | | | | 2 | | | | 305 | | | 2 |
North America and Caribbean | | | 22 | | | | 5 | | | | 25 | | | 12 |
Europe | | | 8 | | | | 3 | | | | 13 | | | 2 |
Asia and Pacific | | | 4 | | | | – | | | | 11 | | | 1 |
South and Central America | | | 2 | | | | – | | | | 4 | | | 5 |
Total | | | $61 | | | | $10 | | | | $358 | | | $22 |
* Represents recoveries on claims paid in the current and prior years.
11. Other Assets
| | | | | | |
(in millions of Canadian dollars) | | Dec. 31, 2013 | | | Dec. 31, 2012 |
Restructuring payments receivable | | | 49 | | | 48 |
Insurance premiums receivable/prepaid reinsurance | | | 16 | | | 14 |
Guarantee fees receivable | | | 9 | | | 7 |
Prepaid expenses | | | 5 | | | 5 |
Aircraft or component parts held-for-sale* | | | – | | | 9 |
Other | | | 12 | | | 16 |
Total other assets | | | $91 | | | $99 |
* Refer to Note 8.
Restructuring payments receivable relate to an agreement between EDC and an airline obligor as part of the terms of a loan restructuring that was finalized in 2007. The receivable relates to a payable as shown in Note 15.
| | | | |
| 106 | | Turning the Corner on Trade | | |
12. Property, Plant and Equipment
During the year, changes to property, plant and equipment were as follows:
| | | | | | | | | | | | | | | | | | | | |
(in millions of Canadian dollars) | | 2013 | | 2012 |
| | | Computer
hardware | | Furniture
and
equipment | | Leasehold
improvements | | Total | | Computer
hardware | | Furniture
and
equipment | | Leasehold
improvements | | Total |
Cost: | | | | | | | | | | | | | | | | | | | | |
Balance at beginning of year | | 24 | | | | 17 | | 51 | | 92 | | 22 | | 19 | | | | 50 | | 91 |
Additions | | 4 | | | | – | | – | | 4 | | 3 | | 1 | | | | 1 | | 5 |
Disposals | | – | | | | – | | – | | – | | (1) | | (3) | | | | – | | (4) |
Balance at end of year | | 28 | | | | 17 | | 51 | | 96 | | 24 | | 17 | | | | 51 | | 92 |
Accumulated depreciation: | | | | | | | | | | | | | | | | | | | | |
Balance at beginning of year | | (15) | | | | (6) | | (5) | | (26) | | (9) | | (5) | | | | (3) | | (17) |
Depreciation expense | | (6) | | | | (3) | | (2) | | (11) | | (7) | | (4) | | | | (2) | | (13) |
Disposals | | – | | | | – | | – | | – | | 1 | | 3 | | | | – | | 4 |
Balance at end of year | | (21) | | | | (9) | | (7) | | (37) | | (15) | | (6) | | | | (5) | | (26) |
Carrying amount | | $7 | | | | $8 | | $44 | | $59 | | $9 | | $11 | | | | $46 | | $66 |
Future contractual commitments related to property, plant and equipment as at December 31, 2013 were $1 million (2012 – $1 million). 13. Intangible Assets During the year, changes to intangible assets were as follows: |
| (in millions of Canadian dollars) | | 2013 | | | | 2012 |
| | | Internally developed software | | Acquired computer software | | Total | | Internally developed software | | Acquired computer software | | Total |
Cost: | | | | | | | | | | | | | | | | | | | | |
Balance at beginning of year | | | | 84 | | 94 | | 178 | | 81 | | 86 | | 167 |
Additions | | | | 16 | | 4 | | 20 | | 6 | | 8 | | 14 |
Disposals | | | | – | | (6) | | (6) | | | | (3) | | – | | (3) |
Balance at end of year | | | | 100 | | 92 | | 192 | | | | 84 | | 94 | | 178 |
Accumulated amortization: | | | | | | | | | | | | | | | | | | | | |
Balance at beginning of year | | | | (72) | | (68) | | (140) | | | | (71) | | (56) | | (127) |
Amortization expense | | | | (4) | | (10) | | (14) | | | | (4) | | (12) | | (16) |
Disposals | | | | – | | 6 | | 6 | | | | 3 | | – | | 3 |
Balance at end of year | | | | (76) | | (72) | | (148) | | | | (72) | | (68) | | (140) |
Carrying amount | | | | $24 | | $20 | | $44 | | | | $12 | | $26 | | $38 |
Future contractual commitments related to intangible assets as at December 31, 2013 were $10 million (2012 – $7 million).
| | | | |
| | EDC Annual Report 2013 | | 107 |
CONSOLIDATED FINANCIAL STATEMENTS
14. Building under Finance Lease
Our head office building is held under a finance lease for 20 years with the option of two further terms of five years each. Future minimum lease payments under the obligation under finance lease as well as the present value of the minimum lease payments, based on the expected 25 year lease term are as follows:
| | | | | | | | | | | | | | |
(in millions of Canadian dollars) | | Dec. 31, 2013 | | | Dec. 31, 2012 |
| | | Minimum
payments | | | Present value of
minimum lease
payments | | | Minimum
payments | | | Present value of
minimum lease
payments |
2013 | | | – | | | | – | | | | 11 | | | 11 |
2014 | | | 11 | | | | 11 | | | | 11 | | | 10 |
2015 | | | 11 | | | | 10 | | | | 11 | | | 10 |
2016 | | | 11 | | | | 10 | | | | 11 | | | 9 |
2017 | | | 11 | | | | 9 | | | | 11 | | | 9 |
2018 | | | 11 | | | | 9 | | | | 11 | | | 9 |
2019 and beyond | | | 222 | | | | 121 | | | | 221 | | | 115 |
Total | | | 277 | | | | 170 | | | | 287 | | | 173 |
Less: future finance charges | | | (107 | ) | | | – | | | | (114 | ) | | – |
Present value of minimum lease payments | | | $170 | | | | $170 | | | | $173 | | | $173 |
During the year changes to the building under finance lease were as follows:
| | | | | | | | |
(in millions of Canadian dollars) | | 2013 | | | 2012 | |
Cost | | | 177 | | | | 177 | |
Accumulated depreciation: | | | | | | | | |
Balance at beginning of year | | | (8) | | | | (1 | ) |
Depreciation expense | | | (7) | | | | (7 | ) |
Balance at end of year | | | (15) | | | | (8 | ) |
Carrying amount | | | $162 | | | | $169 | |
15. Accounts Payable and Other Credits
| | | | | | | | |
(in millions of Canadian dollars) | | Dec. 31, 2013 | | | Dec. 31, 2012 | |
Restructuring payments payable | | | 48 | | | | 48 | |
Employee benefit accruals | | | 27 | | | | 18 | |
Canada Account payable | | | 24 | | | | 11 | |
Aircraft maintenance reserve | | | 19 | | | | 14 | |
Trade payables and accruals | | | 13 | | | | 12 | |
Aircraft lease security deposit | | | 3 | | | | 3 | |
Other payables and other credits | | | 10 | | | | 7 | |
Total accounts payable and other credits | | | $144 | | | | $113 | |
Restructuring payments payable relate to an agreement between EDC and an airline obligor as part of the terms of a loan restructuring that was finalized in 2007. The payable relates to a receivable as shown in Note 11.
Canada Account payable primarily represents the amount of cash repayments (principal and interest) received by EDC from borrowers on Canada Account loans which were not yet remitted at year-end to the Consolidated Revenue Fund.
Aircraft maintenance reserve represents payments received from lessees for our leased aircraft that are reserved for major repairs and overhauls of the aircraft.
Aircraft lease security deposits are received from lessees for our leased aircraft and are held over the life of the lease term.
| | | | |
| 108 | | Turning the Corner on Trade | | |
16. Debt Instruments
We issue debt instruments in global capital markets. Short-term payables consist of commercial paper and other short-term debt related instruments that we issue with maturities under one year. Long-term payables represent bonds and other long-term instruments which we issue in Canadian dollars, U.S. dollars and other currencies. We use foreign exchange swaps as well as cross currency interest rate swaps to convert Canadian dollar and foreign currency denominated notes primarily to U.S. dollars. Interest rate swaps are principally used to convert our debt to floating rates, primarily related to LIBOR. We use derivative contracts to manage interest rate risk and foreign exchange risk, and also for asset liability management purposes.
EDC is wholly owned by the Government of Canada and our obligations are backed by the full faith and credit of the Government of Canada which holds an AAA credit rating. Therefore, there is no significant change in the value of our debt instruments that can be attributed to changes in our own credit risk.
Loans Payable
Loans payable (excluding derivatives) are comprised as follows:
| | | | | | | | | | | | |
(in millions of Canadian dollars) | | Dec. 31, 2013 | | Dec. 31, 2012 |
| | | Designated at
fair value through
profit or loss | | At amortized
cost | | Total | | Designated at
fair value through
profit or loss | | At amortized
cost | | Total |
Short-term payables | | 5,910 | | – | | 5,910 | | 4,435 | | – | | 4,435 |
Long-term payables | | | | | | | | | | | | |
due within current year | | 7,156 | | 1,063 | | 8,219 | | 5,482 | | – | | 5,482 |
over one year | | 16,042 | | 1,085 | | 17,127 | | 14,945 | | 1,013 | | 15,958 |
Total long-term payables | | 23,198 | | 2,148 | | 25,346 | | 20,427 | | 1,013 | | 21,440 |
Accrued interest | | – | | 3 | | 3 | | – | | 5 | | 5 |
Total loans payable | | $29,108 | | $2,151 | | $31,259 | | $24,862 | | $1,018 | | $25,880 |
The amount to be paid at maturity on the debt designated at fair value through profit or loss is $28,827 million (2012 – $24,317 million), $281 million less than the December 2013 fair value (2012 – $545 million).
Structured Notes
We have entered into a number of structured notes as part of our funding program. Structured notes are hybrid securities that combine debt instruments with derivative components.
Structured notes outstanding, included in loans payable, are as follows:
| | | | | | | | |
(in millions of Canadian dollars) | | Dec. 31, 2013 | | | Dec. 31, 2012 | |
Callable/extendible | | | 370 | | | | 97 | |
Zero coupon | | | 241 | | | | 320 | |
Capped floating rate note | | | 78 | | | | 80 | |
Inverse floating rate note | | | 39 | | | | 40 | |
Float to fixed | | | 22 | | | | 20 | |
Dual currency | | | 5 | | | | 15 | |
Total | | | $755 | | | | $572 | |
We have executed swap contracts to mitigate interest rate risk and foreign exchange risk on these structured borrowings. These contracts ensure that we will receive proceeds from the swap to meet the requirements of settling and servicing the debt obligation. We have in substance created floating rate debt by issuing bonds and entering into swap contracts whereby we receive interest matching the interest on the bond; leaving us with a net floating rate interest payable. In swapping out of the underlying bond issue, the potential interest rate risk has been converted to credit risk. Credit exposure on derivative instruments is further discussed in Note 17.
| | | | |
| | EDC Annual Report 2013 | | 109 |
CONSOLIDATED FINANCIAL STATEMENTS
17. Derivative Instruments
We use a variety of derivative instruments to manage costs, returns and levels of financial risk associated with our funding, investment and risk management activities.
We currently use, but are not limited to, the following types of instruments:
Interest rate swaps – transactions in which two parties exchange interest flows on a specified notional amount on predetermined dates for a specified period of time using agreed-upon fixed or floating rates of interest. Notional amounts upon which interest payments/ receipts are based are not exchanged.
Cross currency interest rate swaps – transactions in which two parties exchange currencies at inception and at maturity, as well as interest flows on the exchanged amounts on predetermined dates for a specified period of time using agreed-upon fixed or floating rates of interest.
Foreign exchange swaps – commitments to exchange cash flows in different currencies where there are two exchanges, the first is made at the spot rate at inception and the second at a predetermined rate on a specified date in the future.
Foreign exchange forwards – commitments to exchange cash flows in different currencies, for which the foreign exchange rate is predetermined, at a specified date in the future.
Non-deliverable forwards – a cash-settled, short-term forward contract, where the profit or loss at settlement date is calculated by taking the difference between the agreed-upon exchange rate and the spot rate at the time of settlement, for an agreed-upon notional amount of funds.
Credit default swaps – transactions between two counterparties that allow credit risks of a third-party reference entity or entities to be traded and managed. The buyer of credit protection pays a periodic fee to the protection seller over a specified term in return for compensation should a credit event (such as default or failure to pay) occur with the reference entity.
To diversify and reduce credit risk within our loan portfolio, we enter into credit default swap transactions that provide us with protection against credit risk. As at December 31, 2013, we held credit default swap protection against two single-name entities (December 31, 2012 – five).
In any transaction there is a potential for loss. This loss potential is represented by (1) credit risk, wherein a counterparty fails to perform an obligation as agreed upon, causing the other party to incur a financial loss, and (2) interest rate risk and foreign exchange risk, where an exposure exists as a result of changes in foreign exchange rates or interest rates.
We manage our exposure to interest rate risk and foreign exchange risk using limits developed in consultation with the Department of Finance and approved by our Board of Directors. Both our internal policies and guidelines (established in the Risk Management Office and approved by our Board of Directors) and those set by the Minister of Finance limit our use of derivatives. We do not use derivatives for speculative purposes.
We manage our exposure to derivative counterparty credit risk by contracting only with creditworthy counterparties, establishing International Swaps and Derivatives Association (ISDA) master netting agreements, and in certain cases entering into collateral agreements, via Credit Support Annex (CSA) with those counterparties. Internal policies and procedures establish credit approvals, controls and monitoring.
Under ISDA master netting agreements, the amounts owing by each counterparty on a single day are netted into a single payment by currency. ISDA agreements do not meet the criteria for offsetting in the consolidated statement of financial position because the right to offset all outstanding derivatives is only enforceable upon specific credit events such as the default of one of the parties to the agreement. Upon such events, all transactions under the agreement are terminated; a net termination value is assessed which determines the final amount payable to settle all outstanding transactions.
Collateral agreements provide for the posting of collateral by the counterparty when our exposure to that entity exceeds a certain threshold. Collateral is held by a third party custodian and at the end of December 2013 totalled $177 million (2012 – $979 million) and consists of AAA rated government issued securities. All derivative counterparties must have a minimum credit rating of A- and any exception must be approved by the Board of Directors. We have outstanding derivative transactions which had a fair value of $2 million at the end of 2013 (2012 – $18 million) with four counterparties (2012 – two) below the minimum credit rating requirement. These exceptions have been approved by the Board of Directors. We do not anticipate any significant non-performance by the counterparties.
In 2013, we reviewed our contracts for embedded derivatives and determined they did not significantly modify the cash flows that otherwise would be required by the contract and consequently they need not to be presented separately in the consolidated statement of financial position.
Notional amounts are not recorded as assets or liabilities on our consolidated statement of financial position as they represent the face amount of the contract to which a rate or a price is applied to determine the amount of cash flows to be exchanged.
| | | | |
| 110 | | Turning the Corner on Trade | | |
The remaining term to maturity for the notional amounts of our derivative contracts is as follows:
| | | | | | | | | | | | | | | | | | | | | | | | | | |
(in millions of Canadian dollars) | | Dec. 31, 2013 | | | Dec. 31, 2012 | |
| | | Remaining term to maturity | | | | | Remaining term to maturity | | | |
| | | Under 1 year | | 1 to 3 years | | Over 3 years | | Total | | | Under 1
year | | | 1 to 3 years | | Over 3
years | | Total | |
Interest rate swaps | | 5,064 | | 6,595 | | 2,960 | | | 14,619 | | | | 4,355 | | | 6,333 | | 2,788 | | | 13,476 | |
Cross currency interest rate swaps | | 2,599 | | 5,889 | | 5,236 | | | 13,724 | | | | 1,495 | | | 5,354 | | 5,906 | | | 12,755 | |
Foreign exchange swaps | | 2,654 | | – | | – | | | 2,654 | | | | 2,146 | | | – | | – | | | 2,146 | |
Foreign exchange forwards | | 288 | | – | | – | | | 288 | | | | 299 | | | – | | – | | | 299 | |
Credit default swaps – protection purchased | | – | | 282 | | – | | | 282 | | | | 119 | | | 263 | | – | | | 382 | |
Non-deliverable forwards | | – | | – | | – | | | – | | | | 60 | | | – | | – | | | 60 | |
Total derivative instruments | | $10,605 | | $12,766 | | $8,196 | | | $31,567 | | | | $8,474 | | | $11,950 | | $8,694 | | | $29,118 | |
The following table provides the fair values for each category of derivative financial instrument: | |
(in millions of Canadian dollars) | | | | Dec. 31, 2013 | | | | | | Dec. 31, 2012 | |
| | | Positive | | Negative | | Total | | | Positive | | Negative | | Total | |
Cross currency interest rate swaps | | | | 508 | | 526 | | | (18 | ) | | | | | | 1,053 | | 42 | | | 1,011 | |
Interest rate swaps | | | | 165 | | 44 | | | 121 | | | | | | | 293 | | 4 | | | 289 | |
Foreign exchange swaps | | | | 14 | | 33 | | | (19 | ) | | | | | | 4 | | 48 | | | (44 | ) |
Credit default swaps – protection purchased | | | | 1 | | 22 | | | (21 | ) | | | | | | 2 | | 26 | | | (24 | ) |
Foreign exchange forwards | | | | – | | 1 | | | (1 | ) | | | | | | – | | – | | | – | |
Total derivative instruments | | | | 688 | | 626 | | | 62 | | | | | | | 1,352 | | 120 | | | 1,232 | |
Impact of netting agreements | | | | (357) | | (357) | | | – | | | | | | | (95) | | (95) | | | – | |
Total | | | | $331 | | $269 | | | $62 | | | | | | | $1,257 | | $25 | | | $1,232 | |
Collateral received | | | | | | | | | | | (177 | ) | | | | | | | | | | | | | (979 | ) |
Net amount | | | | | | | | | | | $(115 | ) | | | | | | | | | | | | | $253 | |
The change in the fair value of the derivatives recognized in net income in 2013 amounted to a loss of $299 million (2012 – loss of $2 million).
| | | | |
| | EDC Annual Report 2013 | | 111 |
CONSOLIDATED FINANCIAL STATEMENTS
18. Debt Instrument Maturities
We often combine debt instruments with derivative instruments to generate lower-cost funding. For example, a fixed rate debt issue can be combined with an interest rate swap to generate floating rate funding at a lower cost than issuing a floating rate note. The following table shows our resulting net fixed and floating rate debt positions, as well as the maturities and yields of those net positions. Although we measure our swaps and the majority of debt instruments at their fair value on the financial statements, they are shown below at their notional amounts in order to provide information on cash requirements at maturity of the instruments.
| | | | | | | | | | | | | | | | | | | | | | | | | | | | | | |
(in millions of Canadian dollars) | | Dec. 31, 2013 | | | Dec. 31, 2012 |
Year of maturity | | Debt
issues | | | Swap
contracts | | | Net | | | Yield*
(%) | | | Debt
issues | | | Swap
contracts | | | Net | | | Yield*
(%) |
Fixed rate issues | | | | | | | | | | | | | | | | | | | | | | | | | | | | | | |
2013 | | | – | | | | – | | | | – | | | | – | | | | 3,832 | | | | (3,832 | ) | | | – | | | – |
2014 | | | 4,457 | | | | (3,394 | ) | | | 1,063 | | | | 3.19 | | | | 3,899 | | | | (2,906 | ) | | | 993 | | | 3.19 |
2015 | | | 5,371 | | | | (5,371 | ) | | | – | | | | – | | | | 5,150 | | | | (5,150 | ) | | | – | | | – |
2016 | | | 4,268 | | | | (3,183 | ) | | | 1,085 | | | | 0.88 | | | | 2,029 | | | | (2,009 | ) | | | 20 | | | 8.16 |
2017 | | | 2,729 | | | | (2,729 | ) | | | – | | | | – | | | | 2,689 | | | | (2,689 | ) | | | – | | | – |
2018 | | | 2,300 | | | | (2,300 | ) | | | – | | | | – | | | | – | | | | – | | | | – | | | – |
2019 to 2023 | | | 57 | | | | (57 | ) | | | – | | | | – | | | | 71 | | | | (71 | ) | | | – | | | – |
2024 and beyond | | | 199 | | | | (199 | ) | | | – | | | | – | | | | 254 | | | | (254 | ) | | | – | | | – |
Subtotal | | | 19,381 | | | | (17,233 | ) | | | 2,148 | | | | 1.09 | | | | 17,924 | | | | (16,911 | ) | | | 1,013 | | | 3.47 |
Floating rate issues | | | | | | | | | | | | | | | | | | | | | | | | | | | | | | |
2013 | | | – | | | | – | | | | – | | | | | | | | 6,053 | | | | 3,835 | | | | 9,888 | | | |
2014 | | | 9,627 | | | | 3,297 | | | | 12,924 | | | | | | | | 1,214 | | | | 2,714 | | | | 3,928 | | | |
2015 | | | 1,818 | | | | 5,329 | | | | 7,147 | | | | | | | | – | | | | 5,009 | | | | 5,009 | | | |
2016 | | | – | | | | 3,158 | | | | 3,158 | | | | | | | | – | | | | 1,934 | | | | 1,934 | | | |
2017 | | | – | | | | 2,778 | | | | 2,778 | | | | | | | | – | | | | 2,629 | | | | 2,629 | | | |
2018 | | | – | | | | 2,366 | | | | 2,366 | | | | | | | | – | | | | – | | | | – | | | |
2019 to 2023 | | | 149 | | | | 67 | | | | 216 | | | | | | | | 139 | | | | 70 | | | | 209 | | | |
2024 and beyond | | | – | | | | 199 | | | | 199 | | | | | | | | – | | | | 254 | | | | 254 | | | |
Subtotal | | | 11,594 | | | | 17,194 | | | | 28,788 | | | | 0.27 | | | | 7,406 | | | | 16,445 | | | | 23,851 | | | 0.32 |
Total | | | $30,975 | | | | $(39 | ) | | | $30,936 | | | | | | | | $25,330 | | | | $(466 | ) | | | $24,864 | | | |
* Refers to yield to maturity for fixed rate issues and yield to reset for floating rate issues.
At the end of December 2013, the contractual cash flows, including principal and interest, related to our debt portfolio are as follows:
| | | | | | | | | | | | | | | | | | | | | | | | | | | | | | | | | | | | | | |
(in millions of Canadian dollars) | | Dec. 31, 2013 | | | Dec. 31, 2012 |
| | | Under 1
year | | | 1 to 3
years | | | Over 3 to
5 years | | | Over 5
years | | | Total | | | Under 1
year | | | 1 to 3
years | | | Over 3 to
5 years | | | Over 5
years | | | Total |
Debt | | | 14,162 | | | | 11,913 | | | | 5,529 | | | | 1,229 | | | | 32,833 | | | | 10,281 | | | | 10,820 | | | | 4,883 | | | | 1,496 | | | 27,480 |
Swap contracts | | | | | | | | | | | | | | | | | | | | | | | | | | | | | | | | | | | | | | |
Receivable | | | (3,448 | ) | | | (8,982 | ) | | | (5,529 | ) | | | (1,072 | ) | | | (19,031 | ) | | | (4,186 | ) | | | (8,591 | ) | | | (4,860 | ) | | | (1,353 | ) | | (18,990) |
Payable | | | 3,298 | | | | 8,497 | | | | 5,153 | | | | 257 | | | | 17,205 | | | | 3,858 | | | | 7,721 | | | | 4,561 | | | | 320 | | | 16,460 |
Total | | | $14,012 | | | | $11,428 | | | | $5,153 | | | | $414 | | | | $31,007 | | | | $9,953 | | | | $9,950 | | | | $4,584 | | | | $463 | | | $24,950 |
Credit exposure and other details of derivative instruments are included as part of Note 17.
| | | | |
| 112 | | Turning the Corner on Trade | | |
19. Premium and Claims Liabilities
The premium and claims liabilities broken down by program are as follows:
| | | | | | | | | | | | | | | | | | | | | | |
| | | |
| (in millions of Canadian dollars) | | Dec. 31, 2013 | | | Dec. 31, 2012 | |
| | | Insurance | | Reinsurance | | Net liability | | | Insurance | | | Reinsurance | | | Net liability | |
Credit insurance | | 137 | | (5) | | | 132 | | | | 114 | | | | (8 | ) | | | 106 | |
| | | | | | | |
Financial institutions insurance | | 3 | | (2) | | | 1 | | | | – | | | | – | | | | – | |
| | | | | | | |
Contract insurance and bonding | | 72 | | (1) | | | 71 | | | | 96 | | | | (2 | ) | | | 94 | |
| | | | | | | |
Political risk insurance | | 394 | | (85) | | | 309 | | | | 373 | | | | (80 | ) | | | 293 | |
Total | | $606 | | $(93) | | | $513 | | | | $583 | | | | $(90 | ) | | | $493 | |
|
The premium and claims liabilities are comprised of the following components: | |
(in millions of Canadian dollars) | | Dec. 31, 2013 | | Dec. 31, 2012 | | | | | | | | | | |
Deferred insurance premiums | | 96 | | 100 | | | | | | | | | | | | | |
| | | | | | |
Allowance for claims on insurance | | 510 | | 483 | | | | | | | | | | | | | |
Total premium and claims liabilities | | $606 | | $583 | | | | | | | | | | | | | |
|
During the year, the premium and claims liabilities were impacted by the following factors: | |
| | | |
| (in millions of Canadian dollars) | | Dec. 31, 2013 | | | Dec. 31, 2012 | |
| | | Insurance | | Reinsurance | | Net liability | | | Insurance | | | Reinsurance | | | Net liability | |
Balance at beginning of year | | 583 | | (90) | | | 493 | | | | 875 | | | | (129 | ) | | | 746 | |
| | | | | | | |
Change in portfolio make-up and risk ratings | | (41) | | 9 | | | (32 | ) | | | (259 | ) | | | 33 | | | | (226 | ) |
| | | | | | | |
Update of actuarial assumptions | | 32 | | (5) | | | 27 | | | | (23 | ) | | | 4 | | | | (19 | ) |
| | | | | | | |
Foreign exchange translation | | 32 | | (7) | | | 25 | | | | (10 | ) | | | 2 | | | | (8 | ) |
Balance at end of year | | $606 | | $(93) | | | $513 | | | | $583 | | | | $(90 | ) | | | $493 | |
20. Financing Commitments
We have three types of financing commitments.
The first type is undisbursed amounts on signed loan agreements totalling $14,885 million (2012 – $13,391 million). These commitments are immediately available to the obligor for drawdown subject to continued adherence to contractual covenants established under the financing agreements.
Undisbursed amounts on signed loan agreements with their committed fixed rates or committed floating rate spreads are outlined in the following table. All yields are computed on a weighted average basis and the spreads over floating interest rates represent the spreads over base rates which consist mainly of U.S. dollar LIBOR.
| | | | | | | | | | | | | | | | | | | | | | | | | | | | | | | | | | | | | | | | |
(in millions of Canadian dollars) | | Dec. 31, 2013 | | | Dec. 31, 2012 | |
| | | Fixed
$ | | | Estimated
spot yield
% | | | Floating
$ | | | Spread
% | | | Total $ | | | Fixed
$ | | | Estimated
spot yield
% | | | Floating
$ | | | Spread
% | | | Total $ | |
Commercial | | | 205 | | | | 3.32 | | | | 14,512 | | | | 1.58 | | | | 14,717 | | | | 570 | | | | 3.15 | | | | 12,736 | | | | 1.87 | | | | 13,306 | |
| | | | | | | | | | | |
Sovereign | | | 48 | | | | 5.93 | | | | 120 | | | | 2.13 | | | | 168 | | | | 44 | | | | 5.93 | | | | 41 | | | | 3.19 | | | | 85 | |
Total | | | $253 | | | | 3.81 | | | | $14,632 | | | | 1.58 | | | | $14,885 | | | | $614 | | | | 3.35 | | | | $12,777 | | | | 1.87 | | | | $13,391 | |
We also have loan commitments for which terms related to the transaction, such as interest rate type and disbursement schedule, have not yet been determined. This category of commitments includes letters of offer accepted and outstanding for loans of $4,485 million (2012 – $3,857 million) and loan guarantees of $14 million (2012 – $52 million) as well as unallocated confirmed lines of credit of $157 million (2012 – $111 million).
The third type of financing commitment relates to investments and totals $541 million (2012 – $417 million), which represents commitments to investment funds and one direct investment. Commitments are generally drawn down over a five-year period and drawdowns are normally at the discretion of the fund managers.
| | | | |
| | EDC Annual Report 2013 | | 113 |
CONSOLIDATED FINANCIAL STATEMENTS
21. Contingent Liabilities
Our contingent liabilities include credit insurance, financial institutions insurance, contract insurance and bonding, political risk insurance policies and guarantees which represent direct risks undertaken. We increase our contingent liability by assuming exposure from other insurers. We reduce our contingent liability by ceding reinsurance to other insurance companies.
The credit insurance program protects exporters of goods and services trading on credit terms of up to a year against non-payment due to commercial and political risks. Commercial and political risks covered include buyer insolvency, default, repudiation of goods by buyer, contract cancellation and conversion and risk transfer, cancellation of export or import permits, or war-related risks. The financial institutions insurance program provides Canadian banks with credit risk and payment risk mitigation on terms usually not greater than one year. The contract insurance and bonding program provides cover for sales on exposure terms usually greater than one year and includes export credit insurance and guarantees, performance guarantees and surety, extending cover for risks inherent in performance related obligations. Political risk insurance provides risk protection for equity and other investments abroad.
At the end of December 2013, we had contingent liabilities of $24,898 million (2012 – $23,777 million) which mature as follows:
| | | | | | | | | | | | | | | | |
(in millions of Canadian dollars) | | Dec. 31, 2013 |
| | | Credit
insurance | | | Financial
institutions
insurance | | Contract
insurance and
bonding | | Political risk
insurance | | Guarantees(1) | | Reinsurance
ceded(2) | | Total |
2014 | | | 8,407 | | | 4,424 | | 440 | | 104 | | 4,834 | | (150) | | 18,059 |
| | | | | | | | |
2015 | | | – | | | 121 | | 396 | | 45 | | 1,603 | | – | | 2,165 |
| | | | | | | | |
2016 | | | – | | | – | | 172 | | 312 | | 358 | | – | | 842 |
| | | | | | | | |
2017 | | | – | | | – | | 91 | | 534 | | 63 | | – | | 688 |
| | | | | | | | |
2018 | | | – | | | – | | 71 | | 38 | | 17 | | – | | 126 |
| | | | | | | | |
2019 – 2023 | | | – | | | – | | 170 | | 462 | | 70 | | – | | 702 |
| | | | | | | | |
2024 and beyond | | | – | | | – | | – | | 188 | | 2,128 | | – | | 2,316 |
Total | | | $8,407 | | | $4,545 | | $1,340 | | $1,683 | | $9,073 | | $(150) | | $24,898 |
(1) Includes $6,982 million of guarantees within the contract insurance and bonding program. (2) Treaty reinsurance agreement covering the credit insurance portfolio and some bonding obligors. |
(in millions of Canadian dollars) | | Dec. 31, 2012 |
| | | Credit
insurance | | | Financial
institutions
insurance | | Contract
insurance and
bonding | | Political risk
insurance | | Guarantees(1) | | Reinsurance
ceded(2) | | Total |
2013 | | | 7,900 | | | 4,112 | | 631 | | 33 | | 4,250 | | (150) | | 16,776 |
| | | | | | | | |
2014 | | | – | | | 5 | | 370 | | 83 | | 1,630 | | – | | 2,088 |
| | | | | | | | |
2015 | | | – | | | 1 | | 221 | | 42 | | 536 | | – | | 800 |
| | | | | | | | |
2016 | | | – | | | – | | 43 | | 313 | | 210 | | – | | 566 |
| | | | | | | | |
2017 | | | – | | | – | | 193 | | 496 | | 39 | | – | | 728 |
| | | | | | | | |
2018 | | | – | | | – | | 2 | | 25 | | 38 | | – | | 65 |
| | | | | | | | |
2019 – 2023 | | | – | | | – | | – | | 492 | | 68 | | – | | 560 |
| | | | | | | | |
2024 and beyond | | | – | | | – | | – | | 206 | | 1,988 | | – | | 2,194 |
Total | | | $7,900 | | | $4,118 | | $1,460 | | $1,690 | | $8,759 | | $(150) | | $23,777 |
| (1) | Includes $6,655 million of guarantees within the contract insurance and bonding program. |
| (2) | Treaty reinsurance agreement covering the credit insurance portfolio and some bonding obligors. |
| | | | |
| 114 | | Turning the Corner on Trade | | |
Insurance Policies
The major concentrations of risk by location and insurance program are as follows:
Credit Insurance
| | | | | | | | | | | | | | | | | | | | | | | | | | | | | | |
(in millions of Canadian dollars) | | Dec. 31, 2013 | | | | Dec. 31, 2012 | |
| | | Credit
insurance | | Reinsurance
assumed | | | Reinsurance
ceded | | | Net credit insurance | | | | Credit
insurance | | | Reinsurance
assumed | | | Reinsurance
ceded | | | Net credit
insurance | |
United States | | 3,640 | | | 21 | | | | (38 | ) | | 3,623 | | United States | | | 3,702 | | | | 42 | | | | (35 | ) | | | 3,709 | |
| | | | | | | | | | |
Indonesia | | 496 | | | – | | | | (12 | ) | | 484 | | Canada | | | 232 | | | | 129 | | | | – | | | | 361 | |
| | | | | | | | | | |
Canada | | 185 | | | 271 | | | | – | | | 456 | | Japan | | | 357 | | | | – | | | | (10 | ) | | | 347 | |
| | | | | | | | | | |
China | | 369 | | | 1 | | | | (5 | ) | | 365 | | Indonesia | | | 315 | | | | – | | | | – | | | | 315 | |
| | | | | | | | | | |
Japan | | 350 | | | – | | | | (16 | ) | | 334 | | United Kingdom | | | 257 | | | | – | | | | (14 | ) | | | 243 | |
| | | | | | | | | | |
Other | | 3,157 | | | 55 | | | | (67 | ) | | 3,145 | | Other | | | 2,926 | | | | 13 | | | | (14 | ) | | | 2,925 | |
Total | | $8,197 | | | $348 | | | | $(138 | ) | | $8,407 | | Total | | | $7,789 | | | | $184 | | | | $(73 | ) | | | $7,900 | |
| | | | | | | | |
|
Financial Institutions Insurance | |
(in millions of Canadian dollars) | | Dec. 31, 2013 | | | | Dec. 31, 2012 | |
China | | 1,195 | | China | | | 1,012 | |
| | | | |
Turkey | | 1,078 | | Turkey | | | 759 | |
| | | | |
South Korea | | 469 | | India | | | 497 | |
| | | | |
India | | 259 | | Brazil | | | 430 | |
| | | | |
Brazil | | 197 | | South Korea | | | 386 | |
| | | | |
Other | | 1,347 | | Other | | | 1,034 | |
Total | | $4,545 | | Total | | | $4,118 | |
| | | | | | | | | | | | | | | | | | | | | | | | | | |
|
Contract Insurance and Bonding |
(in millions of Canadian dollars) | | | | Dec. 31, 2013 | | | | Dec. 31, 2012 |
| | | | | Contract
insurance and
bonding | | | Reinsurance
assumed | | | Net contract
insurance and
bonding(1) | | | | Contract
insurance and
bonding | | | Reinsurance
assumed | | | Net contract
insurance and
bonding(1) |
Canada | | | | | 2 | | | | 952 | | | 954(2) | | Canada | | | 44 | | | | 1,045 | | | 1,089(2) |
| | | | | | | | | |
United States | | | | | 43 | | | | 170 | | | 213 | | United States | | | 21 | | | | 159 | | | 180 |
| | | | | | | | | |
China | | | | | 35 | | | | – | | | 35 | | China | | | 45 | | | | – | | | 45 |
| | | | | | | | | |
United Arab Emirates | | | | | 20 | | | | – | | | 20 | | United Arab Emirates | | | 21 | | | | – | | | 21 |
| | | | | | | | | |
Brazil | | | | | 12 | | | | 6 | | | 18 | | Israel | | | 16 | | | | – | | | 16 |
| | | | | | | | | |
Other | | | | | 100 | | | | – | | | 100 | | Other | | | 103 | | | | 6 | | | 109 |
Total | | | | | $212 | | | | $1,128 | | | $1,340 | | Total | | | $250 | | | | $1,210 | | | $1,460 |
| (2) | Of this amount, $231 million (2012 – $243 million) relates to our temporarily expanded mandate. |
| | | | |
| | EDC Annual Report 2013 | | 115 |
CONSOLIDATED FINANCIAL STATEMENTS
Political Risk Insurance
Within the political risk insurance program we issue policies under which the policyholder can request coverage for multiple countries but our contingent liability is limited to the maximum liability of the policy. Our largest country exposures for political risk insurance are as follows:
| | | | | | | | | | | | | | | | | | | | | | | | | | | | | | | | | | |
(in millions of Canadian dollars) | | Dec. 31, 2013 | | | Dec. 31, 2012 | |
| | | Political
risk
insurance | | | Reinsurance
assumed | | | Reinsurance
ceded | | | Net political risk insurance | | | | | Political
risk
insurance | | | Reinsurance
assumed | | | Reinsurance
ceded | | | Net
political
risk
insurance | |
China | | | 609 | | | | 191 | | | | (262 | ) | | | 538 | | | China | | | 561 | | | | 179 | | | | (245 | ) | | | 495 | |
| | | | | | | | | | |
Peru | | | 581 | | | | – | | | | (191 | ) | | | 390 | | | Venezuela | | | 400 | | | | – | | | | (27 | ) | | | 373 | |
| | | | | | | | | | |
Venezuela | | | 401 | | | | – | | | | (27 | ) | | | 374 | | | Peru | | | 544 | | | | – | | | | (179 | ) | | | 365 | |
| | | | | | | | | | |
Chile | | | 560 | | | | – | | | | (191 | ) | | | 369 | | | Chile | | | 522 | | | | – | | | | (179 | ) | | | 343 | |
| | | | | | | | | | |
Colombia | | | 444 | | | | – | | | | (85 | ) | | | 359 | | | Mexico | | | 416 | | | | – | | | | (79 | ) | | | 337 | |
| | | | | | | | | | |
Mexico | | | 438 | | | | – | | | | (85 | ) | | | 353 | | | Colombia | | | 411 | | | | – | | | | (79 | ) | | | 332 | |
| | | | | | | | | | |
Trinidad and Tobago | | | 327 | | | | – | | | | – | | | | 327 | | | Trinidad and Tobago | | | 325 | | | | – | | | | – | | | | 325 | |
| | | | | | | | | | |
Jamaica | | | 602 | | | | – | | | | (284 | ) | | | 318 | | | Tunisia | | | 310 | | | | – | | | | – | | | | 310 | |
| | | | | | | | | | |
Tunisia | | | 310 | | | | – | | | | – | | | | 310 | | | Russia | | | 303 | | | | – | | | | – | | | | 303 | |
| | | | | | | | | | |
Russia | | | 305 | | | | – | | | | – | | | | 305 | | | Qatar | | | 303 | | | | – | | | | – | | | | 303 | |
| | | | | | | | | | |
Other | | | 7,079 | | | | 22 | | | | (1,914 | ) | | | 5,187 | | | Other | | | 7,143 | | | | 20 | | | | (2,126 | ) | | | 5,037 | |
| | | | 11,656 | | | | 213 | | | | (3,039 | ) | | | 8,830 | | | | | | 11,238 | | | | 199 | | | | (2,914 | ) | | | 8,523 | |
| | | | | | | | | | |
Country limits in excess of policy limits | | | (9,147 | ) | | | – | | | | 2,000 | | | | (7,147) | | | Country limits in excess of policy limits | | | (8,698 | ) | | | – | | | | 1,865 | | | | (6,833 | ) |
Total | | | $2,509 | | | | $213 | | | | $(1,039 | ) | | | $1,683 | | | Total | | | $2,540 | | | | $199 | | | | $(1,049 | ) | | | $1,690 | |
Guarantees
We issue performance security guarantees which provide coverage to the exporter’s bank for up to 100% of the guarantee value in the event of any call by the buyer. Financial security guarantees are issued to provide coverage to the exporter’s bank for up to 100% of the guarantee value in the event of any call by the supplier and any foreign bank. Foreign exchange guarantees are also issued which provide a guarantee to secure the settlement risks associated with foreign exchange forward contracts. Each guarantee issued stipulates a recovery provision whereby the third party, the exporter, agrees to indemnify us should a payment be made under the guarantee. Unless otherwise stated, the indemnification agreement generally ranks as an unsecured liability of the exporter.
We issue loan guarantees to cover non-payment of principal, interest and fees due to banks and financial institutions providing loans to buyers of Canadian goods and services. Calls on guarantees result in our recognition of a loan asset within our financial statements and become a direct obligation of the buyer. At the end of December 2013, loan guarantees with performing obligors were $2,045 million of which $48 million were secured (2012 – $2,078 million in performing guarantees of which $41 million were secured). Our loan guarantees with impaired obligors were $46 million for 2013 of which $3 million were secured (2012 – $26 million of which $3 million were secured).
At the end of December 2013, we have guarantees outstanding of $9,073 million (2012 – $8,759 million).
| | | | | | | | |
(in millions of Canadian dollars) | | Dec. 31, 2013 | | | Dec. 31, 2012 | |
Contract insurance and bonding: | | | | | | | | |
| | | |
Performance security guarantees(1) | | | 6,861 | | | | 6,382 | |
| | | |
Performance security guarantees ceded | | | (88) | | | | (46 | ) |
| | | |
Foreign exchange guarantees | | | 194 | | | | 297 | |
| | | |
Financial security guarantees | | | 15 | | | | 22 | |
Contract insurance and bonding guarantees | | | 6,982 | | | | 6,655 | |
| | | |
Loan guarantees(2) | | | 2,091 | | | | 2,104 | |
Total | | | $9,073 | | | | $8,759 | |
| (1) | Includes $494 million of domestic performance security guarantees related to our temporarily expanded mandate (2012 – $615 million). | |
| (2) | Includes $54 million of domestic loan guarantees related to our temporarily expanded mandate (2012 – $64 million). | |
| | | | |
| 116 | | Turning the Corner on Trade | | |
Loan guarantees on the consolidated statement of financial position are comprised as follows:
| | | | | | |
| (in millions of Canadian dollars) | | Dec. 31, 2013 | | | Dec. 31, 2012 |
Deferred guarantee fee revenue | | | 50 | | | 51 |
Allowance for losses on loan guarantees | | | 115 | | | 110 |
Total | | | $165 | | | $161 |
We are involved in various legal proceedings in the ordinary course of business. Management does not expect the outcome of any of these proceedings to have a material effect on our consolidated financial position or our results of operations.
22. Reinsurance Agreements
We cede reinsurance to limit exposure to large losses. Reinsurance contracts do not relieve us of our obligations to the insured. However, they do provide for the recovery of claims arising from the liabilities ceded. We have treaty and facultative reinsurance agreements covering the credit insurance portfolio, some bonding obligors as well as some country political risk exposures. Our risk management group assesses and monitors counterparty risks of the reinsurers; management has determined that no additional allowance is required for this ceded exposure.
We have assumed export risks for a number of Canadian exporters under facultative arrangements with private credit insurers. For the surety bond insurance line of business, within the contract insurance and bonding program, we have general reinsurance agreements with several surety companies. In addition, we have assumed facultative reinsurance positions under our contract frustration, surety bonding and political risk insurance products.
The effect of reinsurance on our contingent liability is disclosed in Note 21 and the impact on premiums is as follows:
| | | | | | | | | | | | | | | | | | | | | | | | | | | | | | |
| (in millions of Canadian dollars) | | Dec. 31, 2013 | | | Dec. 31, 2012 |
| | | Direct
premium and
guarantee
fees | | | Reinsurance
premium
assumed | | | Reinsurance
premium
ceded | | | Total premium and guarantee fees | | | Direct
premium and
guarantee
fees | | | Reinsurance
premium
assumed | | | Reinsurance
premium
ceded | | | Total
premium and
guarantee
fees |
Credit insurance | | | 104 | | | | 6 | | | | (7 | ) | | | 103 | | | | 110 | | | | 4 | | | | (6 | ) | | 108 |
Financial institutions insurance | | | 21 | | | | – | | | | – | | | | 21 | | | | 18 | | | | – | | | | – | | | 18 |
Contract insurance and bonding | | | 48 | | | | 4 | | | | (2 | ) | | | 50 | | | | 44 | | | | 6 | | | | (2 | ) | | 48 |
Political risk insurance | | | 31 | | | | 1 | | | | (13 | ) | | | 19 | | | | 32 | | | | 2 | | | | (12 | ) | | 22 |
Total | | | $204 | | | | $11 | | | | $(22 | ) | | | $193 | | | | $204 | | | | $12 | | | | $(20 | ) | | $196 |
23. Insurance Risks
Insurance and Financial Risk
The risks within our insurance program are mitigated by diversification across geographical markets, industries and a portfolio of insurance contracts across uncorrelated product lines. We further manage our risk through the application of a detailed underwriting process which ensures that exposures receive tiered levels of due diligence based on their size and level of risk. Our risk acceptance decisions are supported by the Corporation’s resources in the areas of economics, political risk and legal. Our risk management procedures also include the use of risk transfer arrangements.
The core operating principles for risk transfer activity are to (1) mitigate potential large losses due to existing high concentration in obligor, sector and country risk, (2) protect from credit deterioration within the portfolio and (3) proactively acquire additional credit capacity.
We engage in various risk transfer activities primarily through co-insurance and reinsurance. Co-insurance can be defined as leveraging another insurer’s capacity by jointly sharing the risk of the original insurance policy. A co-insurance agreement is typically put in place at the time of origination of the transaction. Under this structure, we are not exposed to the credit risk of the co-insurer. Under a reinsurance structure, we assume the risk of the original policy, and cede that risk to a counterparty (the “reinsurer”). Under this structure, we are exposed to the credit risk of the reinsurer (referred to as counterparty risk.) To help mitigate this risk, our placement of reinsurance is diversified such that it is not dependent on a single reinsurer. Reinsurance counterparty exposure is managed under our reinsurance counterparty management procedures and monitored by our Market Risk Management team.
| | | | |
| | EDC Annual Report 2013 | | 117 |
CONSOLIDATED FINANCIAL STATEMENTS
Insurance and Guarantee Contracts
We principally issue insurance to our customers to protect them against non-payment by an obligor and/or other losses due to political risk. Guarantees are typically issued to the counterparties of our customers in order to provide them with recourse should our customers not perform as contracted.
A. Credit Risk
Within our credit insurance, financial institutions insurance and contract insurance and bonding programs, our primary risk is credit risk. The credit risk may be that of our customers or their obligors. During our underwriting process, our assessment considers both an entity’s ability and willingness to pay. Ability to pay is primarily based on the financial strength, operations and leadership of the entity (commercial or sovereign) that is the source of our risk. Other factors such as their industry’s environment, the economy, as well as political and geographical events are also considered. Willingness to pay primarily involves an assessment of the entity’s payment history, reputation and governance.
B. Political Risk
Within our political risk insurance program, we primarily underwrite political risks as opposed to the credit risk as discussed above. Our assessment considers politically motivated events that may jeopardize our clients’ assets or income in a foreign market. As a baseline for our risk assessment of a given market we assess the transfer and convertibility of local currency, expropriation risk as well as the risk of political violence.
In addition to our risk management procedures discussed above, our Claims and Recoveries team thoroughly reviews debt files at all stages of the overdue, claim and recovery process. This team manages and pursues debt files so as to minimize losses. Continuously evolving documentation and analytical standards also ensure that the claims process and its outcomes are appropriate and consistent.
We also manage our exposure through policy structuring measures including the use of maximum liability amounts and risk sharing with our customers on certain contracts.
Actuarial Calculation
Principal Risks
There is a limitation upon the accuracy of the premium and claims liabilities as there is an inherent uncertainty in any estimate of premium and claims liabilities. There is uncertainty in any estimate because future events could affect the ultimate claim amounts. Examples of future events include, but are not limited to:
| | (2) | higher than anticipated claim loss development; |
| | (3) | concentration of credit losses; and |
| | (4) | geo-political considerations. |
Therefore the actual ultimate claim amount may differ materially from estimates. However, we have employed standard actuarial techniques and appropriate assumptions to mitigate this risk.
Key Assumptions
The key risk components to the insurance provisioning exercise are claim frequency, claim severity, future claim development, and foreign exchange rates. These risk components are analyzed and estimated using EDC’s own loss experience. A qualitative component is added to these quantitative risk components as warranted by the external factors mentioned above.
| | | | |
| 118 | | Turning the Corner on Trade | | |
Sensitivity Analysis
The following table illustrates the impact on net income of variations in key risk components. A 10% change was applied to key risk components and the impact on premium and claims liabilities was quantified. The largest sensitivities pertain to claim frequency, claim severity and foreign exchange rates.
Key Risks Sensitivities
| | | | | | | | | | | | |
(in millions of Canadian dollars) | | Dec. 31, 2013 | |
| | | Changes in
assumptions | | | Impact on gross liabilities | | | Impact on net liabilities | |
Frequency of claims | | | +10% | | | | 39 | | | | 32 | |
Frequency of claims | | | -10% | | | | (40) | | | | (33 | ) |
Severity of claims | | | +10% | | | | 41 | | | | 35 | |
Severity of claims | | | -10% | | | | (43) | | | | (36 | ) |
Foreign exchange rates | | | +10% | | | | 58 | | | | 46 | |
Foreign exchange rates | | | -10% | | | | (48) | | | | (39 | ) |
Claims development | | | +10% | | | | 4 | | | | 4 | |
Claims development | | | -10% | | | | (4) | | | | (4 | ) |
| | | |
| | | | | | | | | | | | |
(in millions of Canadian dollars) | | Dec. 31, 2012 | |
| | | Changes in
assumptions | | | Impact on gross
liabilities | | | Impact on net
liabilities | |
Frequency of claims | | | +10% | | | | 39 | | | | 32 | |
Frequency of claims | | | -10% | | | | (41) | | | | (33 | ) |
Severity of claims | | | +10% | | | | 41 | | | | 35 | |
Severity of claims | | | -10% | | | | (42) | | | | (35 | ) |
Foreign exchange rates | | | +10% | | | | 58 | | | | 47 | |
Foreign exchange rates | | | -10% | | | | (48) | | | | (39 | ) |
Claims development | | | +10% | | | | 5 | | | | 5 | |
Claims development | | | -10% | | | | (5) | | | | (5 | ) |
Claims Development
As time passes the ultimate cost for the claims becomes more certain. The chart below compares actual claims with previous estimates for the credit insurance portfolio:
| | | | | | | | | | | | | | | | | | | | | | |
(in millions of Canadian dollars) | | | | | | | | | | | | | | | | | |
Underwriting Year | | | 2009 | | | | 2010 | | | | 2011 | | | | 2012 | | | | 2013 | | | Total |
Estimate of cumulative claims: | | | | | | | | | | | | | | | | | | | | | | |
At end of underwriting year | | | 68 | | | | 51 | | | | 44 | | | | 38 | | | | 24 | | | |
One year later | | | 40 | | | | 34 | | | | 42 | | | | 29 | | | | | | | |
Two years later | | | 38 | | | | 33 | | | | 42 | | | | | | | | | | | |
Three years later | | | 37 | | | | 33 | | | | | | | | | | | | | | | |
Four years later | | | 38 | | | | | | | | | | | | | | | | | | | |
Estimate of cumulative claims at Dec. 31, 2013 | | | 38 | | | | 33 | | | | 42 | | | | 29 | | | | 24 | | | 166 |
Cumulative incurred losses at Dec. 31, 2013 | | | (37 | ) | | | (31 | ) | | | (38 | ) | | | (24 | ) | | | (5 | ) | | (135) |
Effect of margin and discounting | | | – | | | | – | | | | – | | | | 1 | | | | 3 | | | 4 |
2009 – 2013 Claim Liabilities (IBNR) at Dec. 31, 2013 | | | 1 | | | | 2 | | | | 4 | | | | 6 | | | | 22 | | | 35 |
| | | | |
| | EDC Annual Report 2013 | | 119 |
CONSOLIDATED FINANCIAL STATEMENTS
24. Equity
EDC’s authorized share capital is $3.0 billion consisting of 30 million shares with a par value of $100 each. The number of shares issued and fully paid is 13.3 million (2012 – 13.3 million). These shares entitle our shareholder to receive a dividend from time to time. No shares were issued in 2013 (2012 – nil). In 2013, a dividend of $1.44 billion was paid to the Government of Canada (2012 – $500 million). The dividend per share in 2013 was $108.27 (2012 – $37.59).
25. Capital Management
EDC has a capital management process in place to ensure that we are appropriately capitalized and that our capital position is identified, measured, managed and regularly reported to the Board of Directors. We are not subject to externally imposed capital requirements.
Our primary objective with respect to capital management is to ensure that EDC has adequate capital to support the evolving needs of Canadian exporters and investors while remaining financially self-sustaining.
We manage our capital through a Board approved capital adequacy policy. Under our capital adequacy policy we determine whether we have adequate capital by comparing the supply of capital to the demand for capital. The policy also includes an eligible dividend methodology to guide the Board of Directors in determining a potential dividend amount. Demand for capital is calculated by a model which estimates the capital required to cover the extreme value of potential losses (including both expected and unexpected losses) arising from credit, interest rate, foreign exchange, operational and business risk. The supply of capital is determined by our financial statements and consists of paid-in share capital, retained earnings and allowances. A new approach to our dividend policy was adopted in 2013 which compares our supply of capital at year-end to three components for the demand of capital: our demand for capital at year-end, a 10% buffer of our demand for capital to allow for changes in the external environment and fluctuations in portfolio results, and a specific provision for explicitly identified strategic initiatives.
A key principle in our capital management is the establishment of a target solvency standard or credit rating which determines the level of demand for capital that is required to cover EDC’s exposures in exceptional circumstances. We target a level of capitalization sufficient to cover potential losses consistent with a rating standard of AA.
The following table represents the breakdown of EDC’s supply of capital at December 31:
| | | | | | | | |
(in millions of Canadian dollars) | | Dec. 31, 2013 | | | Dec. 31, 2012 | |
Allowance for losses on loans | | | 1,246 | | | | 1,182 | |
Allowance for losses on loan commitments | | | 47 | | | | 58 | |
Allowance for losses on loan guarantees | | | 115 | | | | 110 | |
Allowance for claims on insurance | | | 510 | | | | 483 | |
Reinsurers’ share of premium and claims liabilities | | | (93) | | | | (90 | ) |
Share capital | | | 1,333 | | | | 1,333 | |
Retained earnings | | | 7,038 | | | | 7,542 | |
Supply of capital | | | $10,196 | | | | $10,618 | |
| | | | |
| 120 | | Turning the Corner on Trade | | |
26. Interest Rate Risk
The following table summarizes our interest rate risk based on the gap between the notional amount of assets and liabilities grouped by the earlier of contractual re-pricing or maturity dates. Notional amounts reflect our true exposure to re-pricing at various maturities. The differences between the notional amounts and the carrying values, the positions not subject to re-pricing risk and equity are presented in the non-interest rate sensitive column to ensure comparability with the consolidated statement of financial position. The effective interest rates shown indicate historical rates for fixed rate and floating rate instruments.
| | | | | | | | | | | | | | | | | | | | | | | | | | | | | | |
| (in millions of Canadian dollars) | | Immediately
rate-sensitive | | | Up to 6
months | | | Over 6 to 12
months | | | Over 1 to 5 years | | | Over 5 years | | | Non-interest rate sensitive(1) | | | | | Dec. 31, 2013 Total | |
Assets | | | | | | | | | | | | | | | | | | | | | | | | | | | | | | |
Cash and marketable securities | | | 127 | | | | 1,745 | | | | 97 | | | | 1,606 | | | | 450 | | | | 41 | | | | | | 4,066 | |
| | | | | | | | | |
Gross loans receivable | | | 116 | | | | 27,842 | | | | 509 | | | | 4,338 | | | | 3,145 | | | | 599 | | | | | | 36,549 | |
Effective interest rate % | | | 5.77 | % | | | 2.62 | % | | | 5.10 | % | | | 4.96 | % | | | 4.50 | % | | | | | | | | | | |
| | | | | | | | | |
Less: | | | | | | | | | | | | | | | | | | | | | | | | | | | | | | |
Deferred revenue and other credits | | | – | | | | – | | | | – | | | | – | | | | – | | | | (346) | | | | | | (346) | |
Allowance for losses on loans | | | – | | | | – | | | | – | | | | – | | | | – | | | | (1,246) | | | | | | (1,246) | |
| | | | | | | | | |
Aircraft under finance leases | | | – | | | | 7 | | | | 6 | | | | 62 | | | | – | | | | 1 | | | | | | 76 | |
Effective interest rate % | | | – | | | | 7.32 | % | | | 7.32 | % | | | 7.32 | % | | | – | | | | | | | | | | | |
| | | | | | | | | |
Investments at fair value through profit or loss | | | – | | | | – | | | | – | | | | – | | | | – | | | | 537 | | | | | | 537 | |
| | | | | | | | | |
Equipment available for lease, other assets and accrued interest | | | – | | | | – | | | | – | | | | – | | | | – | | | | 1,880 | | | | | | 1,880 | |
Total assets | | | $243 | | | | $29,594 | | | | $612 | | | | $6,006 | | | | $3,595 | | | | $1,466 | | | | | | $41,516 | |
Liabilities and equity | | | | | | | | | | | | | | | | | | | | | | | | | | | | | | |
Loans payable | | | – | | | | 14,270 | | | | 2,152 | | | | 14,296 | | | | 256 | | | | 285 | | | | | | 31,259 | |
Effective interest rate % | | | – | | | | 1.23 | % | | | 1.14 | % | | | 2.24 | % | | | 9.60 | % | | | | | | | | | | |
| | | | | | | | | |
Total pay side instruments on swap contracts | | | – | | | | 25,050 | | | | – | | | | – | | | | – | | | | 6,448 | | | | | | 31,498 | |
Effective interest rate % | | | – | | | | 0.65 | % | | | – | | | | – | | | | – | | | | | | | | | | | |
| | | | | | | | | |
Total receive side instruments on swap contracts | | | – | | | | (9,228 | ) | | | (1,834 | ) | | | (13,744 | ) | | | (256 | ) | | | (6,224) | | | | | | (31,286) | |
Effective interest rate % | | | – | | | | 2.19 | % | | | 1.27 | % | | | 2.20 | % | | | 5.52 | % | | | | | | | | | | |
| | | | | | | | | |
Cumulative foreign exchange translation on cross currency interest rate swaps(2) | | | – | | | | – | | | | – | | | | – | | | | – | | | | (212) | | | | | | (212) | |
Total loans payable | | | | | | | | | | | | | | | | | | | | | | | | | | | | | 31,259 | |
Other liabilities and deferred revenue | | | – | | | | – | | | | – | | | | – | | | | – | | | | 1,886 | | | | | | 1,886 | |
| | | | | | | | | |
Equity | | | | | | | | | | | | | | | | | | | | | | | 8,371 | | | | | | 8,371 | |
Total liabilities and equity | | | $– | | | | $30,092 | | | | $318 | | | | $552 | | | | $– | | | | $10,554 | | | | | | $41,516 | |
At December 31, 2013 | | | | | | | | | | | | | | | | | | | | | | | | | | | | | | |
Total gap | | | 243 | | | | (498 | ) | | | 294 | | | | 5,454 | | | | 3,595 | | | | (9,088) | | | | | | – | |
Cumulative gap | | | 243 | | | | (255 | ) | | | 39 | | | | 5,493 | | | | 9,088 | | | | – | | | | | | – | |
Canadian dollar | | | 46 | | | | 1,463 | | | | 32 | | | | 215 | | | | 255 | | | | (2,011) | | | | | | – | |
Foreign currency | | | 197 | | | | (1,961 | ) | | | 262 | | | | 5,239 | | | | 3,340 | | | | (7,077) | | | | | | – | |
Total gap | | | $243 | | | | $(498 | ) | | | $294 | | | | $5,454 | | | | $3,595 | | | | $(9,088) | | | | | | $– | |
| (1) | Included in non-interest rate sensitive amounts are the differences between the carrying amounts and the notional amounts, foreign exchange contracts and foreign exchange forwards not sensitive to interest rates. |
| (2) | Due to foreign exchange translation, the pay and receive side instruments may not net to zero. This amount represents the difference caused by foreign exchange translation on the pay and receive side instruments on swap contracts. |
| | | | |
| | EDC Annual Report 2013 | | 121 |
CONSOLIDATED FINANCIAL STATEMENTS
| | | | | | | | | | | | | | | | | | | | | | | | | | | | |
(in millions of Canadian dollars) | | Immediately
rate-sensitive | | | Up to 6
months | | | Over 6 to 12
months | | | Over 1 to 5
years | | | Over 5
years | | | Non-interest
rate sensitive(1) | | | Dec. 31, 2012 Total | |
Assets | | | | | | | | | | | | | | | | | | | | | | | | | | | | |
Cash and marketable securities | | | 80 | | | | 2,055 | | | | 17 | | | | 1,485 | | | | 466 | | | | 133 | | | | 4,236 | |
Gross loans receivable | | | 226 | | | | 21,799 | | | | 452 | | | | 3,675 | | | | 3,024 | | | | 1,160 | | | | 30,336 | |
Effective interest rate % | | | 5.02 | % | | | 2.89 | % | | | 5.18 | % | | | 5.30 | % | | | 4.74 | % | | | | | | | | |
Less: | | | | | | | | | | | | | | | | | | | | | | | | | | | | |
Deferred revenue and other credits | | | – | | | | – | | | | – | | | | – | | | | – | | | | (362) | | | | (362 | ) |
Allowance for losses on loans | | | – | | | | – | | | | – | | | | – | | | | – | | | | (1,182) | | | | (1,182 | ) |
Aircraft under finance leases | | | – | | | | 5 | | | | 5 | | | | 69 | | | | – | | | | 1 | | | | 80 | |
Effective interest rate % | | | – | | | | 7.32 | % | | | 7.32 | % | | | 7.32 | % | | | – | | | | | | | | | |
Investments at fair value through profit or loss | | | – | | | | – | | | | – | | | | – | | | | – | | | | 429 | | | | 429 | |
Equipment available for lease, other assets and accrued interest | | | – | | | | – | | | | – | | | | – | | | | – | | | | 2,696 | | | | 2,696 | |
Total assets | | | $306 | | | | $23,859 | | | | $474 | | | | $5,229 | | | | $3,490 | | | | $2,875 | | | | $36,233 | |
Liabilities and equity | | | | | | | | | | | | | | | | | | | | | | | | | | | | |
Loans payable | | | – | | | | 10,918 | | | | 409 | | | | 13,688 | | | | 315 | | | | 550 | | | | 25,880 | |
Effective interest rate % | | | – | | | | 0.90 | % | | | 2.87 | % | | | 2.59 | % | | | 7.95 | % | | | | | | | | |
Total pay side instruments on swap contracts | | | – | | | | 21,376 | | | | 84 | | | | – | | | | – | | | | 6,870 | | | | 28,330 | |
Effective interest rate % | | | – | | | | 0.56 | % | | | 0.43 | % | | | – | | | | – | | | | | | | | | |
Total receive side instruments on swap contracts | | | – | | | | (7,411 | ) | | | (489 | ) | | | (13,668 | ) | | | (316 | ) | | | (6,852) | | | | (28,736 | ) |
Effective interest rate % | | | – | | | | 4.19 | % | | | 4.66 | % | | | 3.48 | % | | | 4.11 | % | | | | | | | | |
Cumulative foreign exchange translation on cross currency interest rate swaps(2) | | | – | | | | – | | | | – | | | | – | | | | – | | | | 406 | | | | 406 | |
Total loans payable | | | | | | | | | | | | | | | | | | | | | | | | | | | 25,880 | |
Other liabilities and deferred revenue | | | – | | | | – | | | | – | | | | – | | | | – | | | | 1,478 | | | | 1,478 | |
Equity | | | | | | | | | | | | | | | | | | | | | | | 8,875 | | | | 8,875 | |
Total liabilities and equity | | | $– | | | | $24,883 | | | | $4 | | | | $20 | | | | $(1) | | | | $11,327 | | | | $36,233 | |
At December 31, 2012 | | | | | | | | | | | | | | | | | | | | | | | | | | | | |
Total gap | | | 306 | | | | (1,024 | ) | | | 470 | | | | 5,209 | | | | 3,491 | | | | (8,452) | | | | – | |
Cumulative gap | | | 306 | | | | (718 | ) | | | (248 | ) | | | 4,961 | | | | 8,452 | | | | – | | | | – | |
Canadian dollar | | | 183 | | | | 1,081 | | | | 48 | | | | 229 | | | | 213 | | | | (1,753) | | | | – | |
Foreign currency | | | 123 | | | | (2,105 | ) | | | 422 | | | | 4,980 | | | | 3,278 | | | | (6,699) | | | | – | |
Total gap | | | $306 | | | | $(1,024 | ) | | | $470 | | | | $5,209 | | | | $3,491 | | | | $(8,452) | | | | $– | |
| (1) | Included in non-interest rate sensitive amounts are the differences between the carrying amounts and the notional amounts, foreign exchange contracts and foreign exchange forwards not sensitive to interest rates. |
| (2) | Due to foreign exchange translation, the pay and receive side instruments may not net to zero. This amount represents the difference caused by foreign exchange translation on the pay and receive side instruments on swap contracts. |
| | | | |
| 122 | | Turning the Corner on Trade | | |
27. Foreign Currency Balances
We have substantial assets and liabilities denominated in U.S. dollars and in other currencies. In addition, we have derivative instruments denominated in various currencies. The purpose of these derivative instruments is to manage the foreign currency exposures of our asset and liability positions, minimize our cost of capital and optimize our yields, while remaining within treasury guidelines and limits approved by our Board of Directors.
The following table shows where we have used derivative instruments along with our net foreign currency exposure at the end of December 2013 (expressed in Canadian equivalent dollars):
| | | | | | | | | | | | | | | | | | | | | | | | | | | | | | | | | | |
(in millions of Canadian dollars) | | Dec. 31, 2013 | |
| | | Assets | | | | | Liabilities | | | Net foreign
currency | | | Foreign
exchange | |
| | | Gross | | | DI* | | | Net | | | | | Gross | | | DI* | | | Net | | | exposure | | | rate | |
U.S. dollar | | | 33,734 | | | | (21 | ) | | | 33,713 | | | | | | (21,967 | ) | | | (12,067 | ) | | | (34,034 | ) | | | (321 | ) | | | 1.0632 | |
Euro | | | 1,944 | | | | – | | | | 1,944 | | | | | | (153 | ) | | | (1,801 | ) | | | (1,954 | ) | | | (10 | ) | | | 1.4653 | |
Australian dollar | | | 851 | | | | – | | | | 851 | | | | | | (3,548 | ) | | | 2,700 | | | | (848 | ) | | | 3 | | | | 0.9491 | |
British pound | | | 819 | | | | – | | | | 819 | | | | | | (3,020 | ) | | | 2,204 | | | | (816 | ) | | | 3 | | | | 1.7613 | |
Mexican peso | | | 405 | | | | – | | | | 405 | | | | | | – | | | | (399 | ) | | | (399 | ) | | | 6 | | | | 0.0812 | |
Czech koruna | | | 90 | | | | – | | | | 90 | | | | | | – | | | | (87 | ) | | | (87 | ) | | | 3 | | | | 0.0536 | |
Norwegian kroner | | | 89 | | | | – | | | | 89 | | | | | | (180 | ) | | | 92 | | | | (88 | ) | | | 1 | | | | 0.1753 | |
Polish zloty | | | 81 | | | | – | | | | 81 | | | | | | – | | | | (78 | ) | | | (78 | ) | | | 3 | | | | 0.3525 | |
Japanese yen | | | 35 | | | | – | | | | 35 | | | | | | (375 | ) | | | 342 | | | | (33 | ) | | | 2 | | | | 0.0101 | |
New Zealand dollar | | | 30 | | | | – | | | | 30 | | | | | | (819 | ) | | | 790 | | | | (29 | ) | | | 1 | | | | 0.8754 | |
Tanzanian shilling | | | 12 | | | | – | | | | 12 | | | | | | – | | | | – | | | | – | | | | 12 | | | | 0.0007 | |
Hong Kong dollar | | | – | | | | – | | | | – | | | | | | (14 | ) | | | 14 | | | | – | | | | – | | | | 0.1371 | |
Chinese renminbi | | | – | | | | – | | | | – | | | | | | (18 | ) | | | 18 | | | | – | | | | – | | | | 0.1755 | |
Turkish lira | | | – | | | | – | | | | – | | | | | | (63 | ) | | | 63 | | | | – | | | | – | | | | 0.4943 | |
Chilean peso | | | – | | | | – | | | | – | | | | | | (74 | ) | | | 74 | | | | – | | | | – | | | | 0.0020 | |
Brazilian real | | | – | | | | – | | | | – | | | | | | (112 | ) | | | 112 | | | | – | | | | – | | | | 0.4501 | |
Swedish krona | | | – | | | | – | | | | – | | | | | | (193 | ) | | | 193 | | | | – | | | | – | | | | 0.1655 | |
Swiss franc | | | – | | | | – | | | | – | | | | | | (325 | ) | | | 325 | | | | – | | | | – | | | | 1.1945 | |
* DI represents derivative instruments. See Note 17.
| | | | | | | | | | | | | | | | | | | | | | | | | | | | | | | | | | |
(in millions of Canadian dollars) | | Dec. 31, 2012 | |
| | | Assets | | | | | Liabilities | | | Net foreign
currency | | | Foreign
exchange | |
| | | Gross | | | DI* | | | Net | | | | | Gross | | | DI* | | | Net | | | exposure | | | rate | |
U.S. dollar | | | 27,980 | | | | 132 | | | | 28,112 | | | | | | (18,168 | ) | | | (10,172 | ) | | | (28,340 | ) | | | (228 | ) | | | 0.9933 | |
Euro | | | 1,687 | | | | – | | | | 1,687 | | | | | | (6 | ) | | | (1,680 | ) | | | (1,686 | ) | | | 1 | | | | 1.3107 | |
Australian dollar | | | 868 | | | | – | | | | 868 | | | | | | (3,146 | ) | | | 2,282 | | | | (864 | ) | | | 4 | | | | 1.0321 | |
British pound | | | 808 | | | | – | | | | 808 | | | | | | (2,476 | ) | | | 1,669 | | | | (807 | ) | | | 1 | | | | 1.6138 | |
Mexican peso | | | 153 | | | | – | | | | 153 | | | | | | (22 | ) | | | (129 | ) | | | (151 | ) | | | 2 | | | | 0.0771 | |
Japanese yen | | | 123 | | | | – | | | | 123 | | | | | | (438 | ) | | | 317 | | | | (121 | ) | | | 2 | | | | 0.0115 | |
Norwegian krone | | | 92 | | | | – | | | | 92 | | | | | | (279 | ) | | | 187 | | | | (92 | ) | | | – | | | | 0.1787 | |
Polish zloty | | | 75 | | | | – | | | | 75 | | | | | | – | | | | (72 | ) | | | (72 | ) | | | 3 | | | | 0.3211 | |
Czech koruna | | | 64 | | | | – | | | | 64 | | | | | | – | | | | (62 | ) | | | (62 | ) | | | 2 | | | | 0.0523 | |
New Zealand dollar | | | 35 | | | | – | | | | 35 | | | | | | (294 | ) | | | 257 | | | | (37 | ) | | | (2 | ) | | | 0.8211 | |
Tanzanian shilling | | | 10 | | | | – | | | | 10 | | | | | | – | | | | – | | | | – | | | | 10 | | | | 0.0006 | |
Hong Kong dollar | | | 1 | | | | – | | | | 1 | | | | | | (13 | ) | | | 13 | | | | – | | | | 1 | | | | 0.1282 | |
Turkish lira | | | – | | | | – | | | | – | | | | | | (76 | ) | | | 76 | | | | – | | | | – | | | | 0.5568 | |
Brazilian real | | | – | | | | – | | | | – | | | | | | (255 | ) | | | 256 | | | | 1 | | | | 1 | | | | 0.4849 | |
Swiss franc | | | – | | | | – | | | | – | | | | | | (304 | ) | | | 304 | | | | – | | | | – | | | | 1.0857 | |
* DI represents derivative instruments. See Note 17.
| | | | |
| | EDC Annual Report 2013 | | 123 |
CONSOLIDATED FINANCIAL STATEMENTS
28. Fair Value of Financial Instruments
Fair value represents our estimation of the price that would be received to sell an asset or paid to transfer a liability in an orderly transaction between market participants at the measurement date.
As with any estimate, uncertainty is inherent due to the unpredictability of future events. In the case of estimating the fair value of our financial instruments, this uncertainty is magnified due to the large number of assumptions used and the wide range of acceptable valuation techniques. Estimates of fair values are based on market conditions at a certain point in time, and may not be reflective of future market conditions. Therefore, the estimates of the fair value of financial instruments outlined as follows do not necessarily reflect the actual values that may occur should the instruments be exchanged in the market.
| | | | | | | | | | | | | | | | |
| (in millions of Canadian dollars) | | Dec. 31, 2013 | | | Dec. 31, 2012 | |
| | | Carrying value | | | Fair value | | | Carrying value | | | Fair value | |
Assets | | | | | | | | | | | | | | | | |
Performing fixed rate loans* | | | 8,334 | | | | 8,675 | | | | 7,462 | | | | 8,237 | |
Performing floating rate loans* | | | 26,548 | | | | 27,460 | | | | 20,666 | | | | 20,774 | |
Total performing loans receivable* | | | 34,882 | | | | 36,135 | | | | 28,128 | | | | 29,011 | |
Impaired loans | | | 239 | | | | 239 | | | | 838 | | | | 838 | |
Loans receivable and accrued interest and fees | | | 35,121 | | | | 36,374 | | | | 28,966 | | | | 29,849 | |
Marketable securities: | | | | | | | | | | | | | | | | |
At fair value through profit or loss | | | 3,859 | | | | 3,859 | | | | 4,082 | | | | 4,082 | |
At amortized cost | | | 80 | | | | 79 | | | | 74 | | | | 75 | |
Derivative instruments | | | 688 | | | | 688 | | | | 1,352 | | | | 1,352 | |
Investments at fair value through profit or loss | | | 537 | | | | 537 | | | | 429 | | | | 429 | |
Recoverable insurance claims | | | 96 | | | | 96 | | | | 200 | | | | 200 | |
Other assets | | | 91 | | | | 93 | | | | 99 | | | | 102 | |
Liabilities | | | | | | | | | | | | | | | | |
Accounts payable and other credits | | | 144 | | | | 150 | | | | 113 | | | | 121 | |
Loans payable: | | | | | | | | | | | | | | | | |
Designated at fair value through profit or loss | | | 29,108 | | | | 29,108 | | | | 24,862 | | | | 24,862 | |
At amortized cost | | | 2,151 | | | | 2,160 | | | | 1,018 | | | | 1,060 | |
Derivative instruments | | | 626 | | | | 626 | | | | 120 | | | | 120 | |
Loan guarantees | | | 165 | | | | 133 | | | | 161 | | | | 141 | |
* Performing loans receivable includes accrued interest and fees receivable net of deferred loan revenue and other credits.
We have controls and policies in place to ensure that our valuations are appropriate and realistic. In general, the methodologies, models and assumptions used to measure the fair value of our financial assets and liabilities are determined by our Market Risk Management team, which is not involved in the initiation of the transactions. The models, valuation methodologies, and market-based parameters and inputs that are used, are subject to regular review and validation, including a comparison with values from outside agencies. In limited circumstances where the valuation of a financial instrument is not independent from the initiation of the transaction, the resulting valuation is subject to review by a valuation committee. The valuation committee meets periodically. Instruments are reviewed and placed on the fair value hierarchy by the valuation committee before being fully implemented.
The assumptions and valuation techniques that we use to estimate fair values are as follows:
Loans Receivable
In order to estimate the fair value of our performing loans receivable (including accrued interest and fees receivable net of deferred loan revenue), we separate them into risk pools and calculate the net present value of principal and interest cash flows. The discount rates are obtained from yield curves for each risk pool and are specific to the credit risk and term to maturity associated with each principal and interest cash flow.
The fair value of impaired loans is considered to be equal to their carrying value. Once a loan has been assessed as impaired, the carrying value is reduced to reflect the present value of any estimated future cash flows discounted at the loan’s original effective interest rate.
Marketable Securities
We estimate the fair value of marketable securities using observable market prices. If such prices are not available, we determine the fair value by discounting future cash flows using an appropriate yield curve.
| | | | |
| 124 | | Turning the Corner on Trade | | |
Investments at Fair Value Through Profit or Loss
Our approach to fair value measurement has been developed using guidelines issued by the International Private Equity and Venture Capital (“IPEVC”) Valuation Guideline. Depending on the type of investment, we estimate fair value using one of the following: market-based methodologies, such as the quoted share price or the price of recent investments; capitalization based on the most recent published funds financial statements; multiples of discounted earnings or cash flow approaches; or liquidation or asset-based methods. The valuations are established by investment managers, reviewed by management, and approved by an independent valuation committee that is comprised of representatives from our Risk Management and Finance groups. The valuation methods are constantly validated and calibrated through discussions with co-investors and market participants, taking into account all known market events.
In the process of assessing the fair value for certain investment instruments, estimates determined in a manner consistent with industry practice, are employed in the models which cannot be directly observed in the market. EDC’s unobservable estimates are outlined in the table below:
| | | | | | | | |
| |
(in millions of Canadian dollars) |
Valuation technique | | Unobservable input | | Range
(weighted average) | | | Fair value at Dec. 31, 2013(1) |
Liquidity discount | | Discount rate | | | 10% – 30% (17%) | | | 30 |
| | | | |
Discounted cash flows | | Discount rate | | | 18% (18%) | | | 4 |
| | | | |
EBITDA Multiple(2) | | Multiple of EBITDA | | | 4.5 – 8.0 (4.8) | | | 3 |
| (1) | The valuation of an investment may use multiple unobservable inputs and therefore its fair value can be included multiple times in the fair value amounts. |
| (2) | Earnings before interest, taxes, depreciation and amortization. |
Recoverable Insurance Claims
For the purpose of estimating their fair value, recoverable insurance claims are separated into groups of estimated time to recovery. Generally the time to recovery of insurance claims will be relatively short; for these, the fair value is considered to be equal to the expected future cash flows. For insurance claims where the recovery is expected to occur over a longer period, we calculate the net present value of the expected cash flows using a discount rate appropriate for the claim.
| | | | | | | | |
| |
(in millions of Canadian dollars) |
Valuation technique | | Unobservable input | | Range | | | Fair value at
Dec. 31, 2013 |
Discounted cash flows | | Probability of recovery | | | 0% – 100% | | | 66 |
Other Assets and Accounts Payable and Other Credits
The fair value of short-term other assets and accounts payable and other credits are assumed to equal their carrying value due to their short-term nature. For long-term other assets and accounts payable, we estimate fair value by discounting future cash flows using an appropriate yield curve.
Loans Payable
The fair value of our less complex loans payable is determined using the discounted cash flow method. Forward rates are used to value floating rate cash flows occurring in the future. Cash flows are discounted using the respective currency’s yield curve. Inputs to the models are market observable and may include interest rate yield curves and foreign exchange rates.
For our more complex loans payable which may include optionality, we estimate fair value using valuation models when independent market prices are not available. Inputs to these models include option volatilities and correlations in addition to interest rate yield curves and foreign exchange rates. All models are reviewed on a three year rotational basis and are calibrated automatically each time a model is employed in valuing a deal. Changes in fair value are analyzed every month.
EDC employed an external consultant in 2011 to validate the models used to construct and value its financial instruments. The consultant deemed the models used to be consistent with those models used by issuers who economically hedge the issuance.
EDC hedges its structured notes using interest rate and cross currency swaps that convert EDC’s obligations into floating rate notes. The receive leg of the swap mirrors the payment structure of EDC’s structured notes; thus, any slight inaccuracy in the derivation of expected future payments on EDC’s structured notes or their valuation is negated by the opposite valuation and derivation of the expected future payments from the receive leg of the swap.
Loans payable valued using market data with insufficient liquidity are categorized as Level 3 in the fair value hierarchy.
| | | | |
| | EDC Annual Report 2013 | | 125 |
CONSOLIDATED FINANCIAL STATEMENTS
Derivative Instruments
Foreign exchange forwards and foreign exchange swaps are valued by discounting the notional amounts using the respective currency’s yield curve and converting the amounts using the spot Canadian dollar exchange rate.
Interest rate and cross currency interest rate swaps are valued using a discounted cash flow method. Forward rates are used to determine floating rate cash flows occurring in the future. Cash flows are discounted using the respective currency’s yield curve. Inputs to the models are market observable and may include interest rate yield curves and foreign exchange rates.
For more complex swaps which may include optionality, including cross currency interest rate swaps, interest rate swaps, and non-deliverable forwards, the fair value is determined using models which are developed from recognized valuation techniques, validated and managed in the same manner as our more complex loans payable as described above. Credit default swaps are valued with the additional input of market based par credit default swap spreads or by using quoted prices from dealers where appropriate.
The valuations determined using the methodologies described above are adjusted for the credit risk of the counterparty where appropriate.
Derivative instruments valued using market data with insufficient liquidity are categorized as Level 3 in the fair value hierarchy.
Loan Guarantees
We estimate the fair value of loan guarantees as the difference between the possible payout discounted using the appropriate credit risk curve and EDC’s credit risk curve; net of the deferred guarantee fees.
Fair Value Hierarchy
The following table presents the fair value hierarchy of our financial instruments based on whether the inputs to those techniques are observable or unobservable.
| | |
| | Level 1 – fair values are based on quoted prices (unadjusted) in active markets for identical assets or liabilities; |
| |
| | Level 2 – fair values are determined using inputs other than quoted prices included within Level 1 that are observable for the assets or liabilities, either directly (i.e. as prices) or indirectly (i.e. derived from prices); |
| |
| | Level 3 – fair values are determined using inputs for the assets or liabilities that are not based on observable market data (unobservable inputs). |
| | | | | | | | | | | | | | | | | | | | | | | | | | | | | | | | |
(in millions of Canadian dollars) | | Dec. 31, 2013 | | | Dec. 31, 2012 | |
| | | Level 1 | | | Level 2 | | | Level 3 | | | Total | | | Level 1 | | | Level 2 | | | Level 3 | | | Total | |
| | | | | | | | | |
Assets | | | | | | | | | | | | | | | | | | | | | | | | | | | | | | | | |
| | | | | | | | | |
Performing fixed rate loans | | | – | | | | 8,675 | | | | – | | | | 8,675 | | | | – | | | | 8,237 | | | | – | | | | 8,237 | |
| | | | | | | | | |
Performing floating rate loans | | | – | | | | 27,460 | | | | – | | | | 27,460 | | | | – | | | | 20,774 | | | | – | | | | 20,774 | |
Total performing loans receivable | | | – | | | | 36,135 | | | | – | | | | 36,135 | | | | – | | | | 29,011 | | | | – | | | | 29,011 | |
| | | | | | | | | |
Impaired loans | | | – | | | | 239 | | | | – | | | | 239 | | | | – | | | | 838 | | | | – | | | | 838 | |
Loans receivable and accrued interest and fees | | | – | | | | 36,374 | | | | – | | | | 36,374 | | | | – | | | | 29,849 | | | | – | | | | 29,849 | |
| | | | | | | | | |
Marketable securities: | | | | | | | | | | | | | | | | | | | | | | | | | | | | | | | | |
| | | | | | | | | |
At fair value through profit or loss | | | 2,114 | | | | 1,745 | | | | – | | | | 3,859 | | | | 2,131 | | | | 1,951 | | | | – | | | | 4,082 | |
| | | | | | | | | |
At amortized cost | | | 79 | | | | – | | | | – | | | | 79 | | | | 75 | | | | – | | | | – | | | | 75 | |
| | | | | | | | | |
Derivative instruments | | | – | | | | 645 | | | | 43 | | | | 688 | | | | – | | | | 1,288 | | | | 64 | | | | 1,352 | |
| | | | | | | | | |
Investments at fair value through profit or loss | | | 11 | | | | – | | | | 526 | | | | 537 | | | | – | | | | – | | | | 429 | | | | 429 | |
| | | | | | | | | |
Recoverable insurance claims | | | – | | | | – | | | | 96 | | | | 96 | | | | – | | | | – | | | | 200 | | | | 200 | |
| | | | | | | | | |
Other assets | | | 42 | | | | 51 | | | | – | | | | 93 | | | | 51 | | | | 51 | | | | – | | | | 102 | |
| | | | | | | | | |
Liabilities | | | | | | | | | | | | | | | | | | | | | | | | | | | | | | | | |
| | | | | | | | | |
Accounts payable and other credits | | | 96 | | | | 54 | | | | – | | | | 150 | | | | 64 | | | | 57 | | | | – | | | | 121 | |
| | | | | | | | | |
Loans payable: | | | | | | | | | | | | | | | | | | | | | | | | | | | | | | | | |
| | | | | | | | | |
Designated at fair value through profit or loss | | | – | | | | 28,867 | | | | 241 | | | | 29,108 | | | | – | | | | 24,542 | | | | 320 | | | | 24,862 | |
| | | | | | | | | |
Designated at amortized cost | | | – | | | | 2,160 | | | | – | | | | 2,160 | | | | – | | | | 1,060 | | | | – | | | | 1,060 | |
| | | | | | | | | |
Derivative instruments | | | – | | | | 626 | | | | – | | | | 626 | | | | – | | | | 120 | | | | – | | | | 120 | |
| | | | | | | | | |
Loan guarantees | | | – | | | | 133 | | | | – | | | | 133 | | | | – | | | | 141 | | | | – | | | | 141 | |
| | | | |
| 126 | | Turning the Corner on Trade | | |
The following table summarizes the reconciliation of Level 3 fair values between 2012 and 2013 for recoverable insurance claims, investments at fair value through profit or loss, loans payable designated at fair value through profit or loss and derivative instruments.
| | | | | | | | | | | | | | | | | | | | |
(in millions of Canadian dollars) | | Dec. 31, 2013 | |
| | | Recoverable
insurance
claims | | | Investments
at fair value
through profit
or loss | | | Loans payable
designated at fair
value through
profit or loss | | | Derivative
instruments | | | Total | |
Balance at beginning of year | | | 200 | | | | 429 | | | | (320 | ) | | | 64 | | | | 373 | |
| | | | | | |
Decrease in recoverable insurance claims | | | (105 | ) | | | – | | | | – | | | | – | | | | (105 | ) |
| | | | | | |
Accrued interest | | | – | | | | – | | | | (12 | ) | | | 12 | | | | – | |
| | | | | | |
Unrealized gains (losses) included in other expenses | | | – | | | | (11 | ) | | | 31 | | | | (28 | ) | | | (8 | ) |
| | | | | | |
Purchases of assets/issuances of liabilities | | | – | | | | 124 | | | | – | | | | – | | | | 124 | |
| | | | | | |
Matured assets/liabilities | | | – | | | | – | | | | 78 | | | | (8 | ) | | | 70 | |
| | | | | | |
Return of capital | | | – | | | | (30 | ) | | | – | | | | – | | | | (30 | ) |
| | | | | | |
Transfer out of Level 3 | | | – | | | | (8 | ) | | | – | | | | – | | | | (8 | ) |
| | | | | | |
Foreign exchange translation | | | 1 | | | | 22 | | | | (18 | ) | | | 3 | | | | 8 | |
Balance at end of year | | | $96 | | | | $526 | | | | $(241 | ) | | | $43 | | | | $424 | |
Total gains (losses) for the year included in comprehensive income for instruments held at end of the year | | | $(100 | ) | | | $5 | | | | $13 | | | | $(10 | ) | | | $(92 | ) |
| | | | | | | | | | | | | | | | | | | | |
(in millions of Canadian dollars) | | Dec. 31, 2012 | |
| | | Recoverable
insurance
claims | | | Investments
at fair value
through profit
or loss | | | Loans payable
designated at fair
value through
profit or loss | | | Derivative
instruments | | | Total | |
Balance at beginning of year | | | 44 | | | | 385 | | | | (611 | ) | | | 24 | | | | (158 | ) |
| | | | | | |
Increase in recoverable insurance claims | | | 157 | | | | – | | | | – | | | | – | | | | 157 | |
| | | | | | |
Accrued interest | | | – | | | | – | | | | (17 | ) | | | 16 | | | | (1 | ) |
| | | | | | |
Unrealized gains (losses) included in other expenses | | | – | | | | (10 | ) | | | 5 | | | | 39 | | | | 34 | |
| | | | | | |
Purchases of assets/issuances of liabilities | | | – | | | | 121 | | | | – | | | | – | | | | 121 | |
| | | | | | |
Matured assets/liabilities | | | – | | | | – | | | | 288 | | | | (14 | ) | | | 274 | |
| | | | | | |
Return of capital | | | – | | | | (53 | ) | | | – | | | | – | | | | (53 | ) |
| | | | | | |
Write-off | | | – | | | | (10 | ) | | | – | | | | – | | | | (10 | ) |
| | | | | | |
Foreign exchange translation | | | (1 | ) | | | (4 | ) | | | 15 | | | | (1 | ) | | | 9 | |
Balance at end of year | | | $200 | | | | $429 | | | | $(320 | ) | | | $64 | | | | $373 | |
Total gains (losses) for the year included in comprehensive income for instruments held at end of the year | | | $161 | | | | $3 | | | | $(36 | ) | | | $51 | | | | $179 | |
Changes in valuation methods may result in transfers into or out of Levels 1, 2, and 3. In 2013 three direct investments went public (2012 – none) and quoted prices became available; as a result $8 million of investments were transferred from Level 3 to Level 1.
In 2013, a sensitivity analysis was performed using possible alternative assumptions to recalculate the fair value of our Level 3 financial instruments. The fair value of Level 3 financial instruments is in whole or in part based on unobservable inputs. In preparing financial statements, appropriate levels for these unobservable inputs parameters are chosen so that they are consistent with prevailing market evidence or management judgment.
In order to perform our sensitivity analysis we adjusted the yield curve and volatility assumptions used to value our Level 3 loans payable and derivative assets. The results of our analysis on our Level 3 loans payable ranged from an unfavourable change of $23 million to a favourable change of $29 million. On our Level 3 derivative assets the impact ranged from an unfavourable change of $28 million to a favourable change of $21 million.
In order to perform our sensitivity analysis for our Level 3 investments, we adjusted the unobservable inputs. The unobservable inputs used to value our Level 3 investments include one or more of the following: rate of returns, liquidity discount, and multiple of EBITDA. When multiple unobservable inputs are shocked, no netting is considered, resulting in the highest favourable or unfavourable change. The results of our analysis on our Level 3 investments ranged from an unfavourable change of $14 million to a favourable change of $16 million.
The unobservable input used in the fair value measurement of the recoverable insurance claims is the probability of recovery. In order to perform our sensitivity analysis, we adjusted the probability of recovery used to value our Level 3 recoverable insurance claims. The results of our analysis ranged from an unfavourable change of $33 million to a favourable change of $44 million.
| | | | |
| | EDC Annual Report 2013 | | 127 |
CONSOLIDATED FINANCIAL STATEMENTS
29. Financial Instrument Risks
The principal risks that we are exposed to as a result of holding financial instruments are credit, market and liquidity risk.
Credit Risk
Credit risk is the risk of loss incurred if a counterparty fails to meet its financial commitments. We are exposed to credit risk on financial instruments under both our loans program and our treasury activities. Our objectives, policies and processes for managing credit risk as well as the methods we use to measure this risk are disclosed in the notes related to our derivative instruments and debt instruments, as well as in the text displayed in green font in management’s discussion and analysis on pages 71 to 72 of this annual report.
Concentration of Credit Risk
Concentration of credit risk exposure exists when a number of counterparties operate in the same geographical market or industry, or engage in similar activities. Changes in economic or political conditions may affect their ability to meet obligations in a similar manner. We have limits in place to ensure that our exposure is not overly concentrated in any one country, industry or counterparty. Exposure in excess of these limits requires approval of our Board of Directors.
The following table provides a breakdown, by the country in which the risk resides, of the maximum gross exposure to credit risk of financial instruments:
| | | | | | | | | | | | | | | | | | | | | | | | | | | | | | | | | | | | |
(in millions of Canadian dollars) | | Gross loans
receivable | | | Loan
guarantees | | | Investments | | | Marketable
securities and
derivative
instruments | | | Risk
transfer | | | Dec. 31, 2013
Exposure | | | Dec. 31, 2012
Exposure | |
Country | | | | | | | | | | | | | | | | | $ | | | % | | | $ | | | % | |
United States | | | 8,078 | | | | 519 | | | | – | | | | 3,086 | | | | 31 | | | | 11,714 | | | | 27 | | | | 12,051 | | | | 31 | |
Canada | | | 4,206 | | | | 1,041 | | | | 259 | | | | 808 | | | | 53 | | | | 6,367 | | | | 14 | | | | 6,568 | | | | 17 | |
United Kingdom | | | 2,238 | | | | 6 | | | | 19 | | | | 282 | | | | 210 | | | | 2,755 | | | | 6 | | | | 1,179 | | | | 3 | |
Brazil | | | 2,709 | | | | 44 | | | | 16 | | | | – | | | | (381 | ) | | | 2,388 | | | | 5 | | | | 2,317 | | | | 6 | |
Mexico | | | 2,252 | | | | 67 | | | | 39 | | | | – | | | | – | | | | 2,358 | | | | 5 | | | | 2,020 | | | | 5 | |
Australia | | | 2,047 | | | | – | | | | – | | | | 174 | | | | – | | | | 2,221 | | | | 5 | | | | 1,370 | | | | 4 | |
India | | | 1,494 | | | | 5 | | | | 59 | | | | – | | | | – | | | | 1,558 | | | | 4 | | | | 1,557 | | | | 4 | |
Chile | | | 1,247 | | | | – | | | | – | | | | – | | | | – | | | | 1,247 | | | | 3 | | | | 1,136 | | | | 3 | |
Russia | | | 806 | | | | 1 | | | | – | | | | – | | | | – | | | | 807 | | | | 2 | | | | 528 | | | | 1 | |
Qatar | | | 749 | | | | – | | | | – | | | | – | | | | – | | | | 749 | | | | 2 | | | | 745 | | | | 2 | |
Other | | | 10,723 | | | | 408 | | | | 145 | | | | 404 | | | | 87 | | | | 11,767 | | | | 27 | | | | 8,986 | | | | 24 | |
Total | | | $36,549 | | | | $2,091 | | | | $537 | | | | $4,754 | | | | $– | | | | $43,931 | | | | 100 | | | | $38,457 | | | | 100 | |
The concentration of credit risk by industry sector for our financial instruments is as follows:
| | | | | | | | | | | | | | | | | | | | | | | | | | | | | | | | | | | | |
(in millions of Canadian dollars) | | Gross loans
receivable | | | Loan
guarantees | | | Investments | | | Marketable
securities and
derivative
instruments | | | Risk
transfer | | | Dec. 31, 2013
Exposure | | | Dec. 31, 2012
Exposure | |
Industry | | | | | | | | | | | | | | | | | $ | | | % | | | $ | | | % | |
Commercial: | | | | | | | | | | | | | | | | | | | | | | | | | | | | | | | | | | | | |
Extractive | | | 11,517 | | | | 294 | | | | 26 | | | | – | | | | (381 | ) | | | 11,456 | | | | 26 | | | | 8,767 | | | | 24 | |
Aerospace | | | 10,882 | | | | 66 | | | | – | | | | – | | | | – | | | | 10,948 | | | | 25 | | | | 9,574 | | | | 25 | |
Surface transportation | | | 3,761 | | | | 645 | | | | – | | | | – | | | | – | | | | 4,406 | | | | 10 | | | | 4,066 | | | | 11 | |
Information and communication technology | | | 3,633 | | | | 168 | | | | 193 | | | | – | | | | – | | | | 3,994 | | | | 9 | | | | 2,841 | | | | 7 | |
Financial institutions | | | 1,394 | | | | 27 | | | | – | | | | 1,654 | | | | 338 | | | | 3,413 | | | | 8 | | | | 3,183 | | | | 8 | |
Infrastructure and environment | | | 2,928 | | | | 228 | | | | 147 | | | | – | | | | – | | | | 3,303 | | | | 7 | | | | 3,274 | | | | 8 | |
Other | | | 1,328 | | | | 545 | | | | 171 | | | | – | | | | – | | | | 2,044 | | | | 5 | | | | 2,101 | | | | 5 | |
Total commercial | | | 35,443 | | | | 1,973 | | | | 537 | | | | 1,654 | | | | (43 | ) | | | 39,564 | | | | 90 | | | | 33,806 | | | | 88 | |
Sovereign | | | 1,106 | | | | 118 | | | | – | | | | 3,100 | | | | 43 | | | | 4,367 | | | | 10 | | | | 4,651 | | | | 12 | |
Total | | | $36,549 | | | | $2,091 | | | | $537 | | | | $4,754 | | | | $– | | | | $43,931 | | | | 100 | | | | $38,457 | | | | 100 | |
| | | | |
| 128 | | Turning the Corner on Trade | | |
Market risk
Market risk is the risk that the fair value or future cash flows of a financial instrument will fluctuate because of changes in market prices. Market risk comprises three types of risk: foreign exchange risk, interest rate risk and other price risk. We are exposed to potential negative impacts on the value of financial instruments resulting from adverse movements in interest and foreign exchange rates. We have policies and procedures in place to ensure that interest rate and foreign exchange risks are identified, measured, managed and regularly reported to management and the Board of Directors.
Interest Rate Risk
Interest rate risk is the risk that the fair value or future cash flows of a financial instrument will fluctuate because of changes in market interest rates. We are exposed to potential adverse impacts on the value of financial instruments resulting from differences in the maturities or repricing dates of assets and liabilities, as well as from embedded optionality in those assets and liabilities.
Foreign Exchange Risk
Foreign exchange risk is the potential adverse impact on the value of financial instruments resulting from exchange rate movements. We are exposed to foreign exchange rate risk when there is a mismatch between assets and liabilities in any currency.
Our objectives, policies and processes for managing market risk as well as a sensitivity analysis for our exposure to both interest rate and foreign exchange risk is disclosed in the text and tables displayed in green font in management’s discussion and analysis on pages 72 to 73 of this annual report.
Liquidity Risk
Liquidity risk is the risk that we would be unable to honour daily cash commitments or the risk that we would have to obtain funds rapidly, possibly at an excessively high premium during severe market conditions. We maintain liquidity through a variety of methods such as holding cash and marketable securities and having access to commercial paper markets.
Our objectives, policies and processes for managing liquidity risk as well as the methods we use to measure this risk are disclosed in the text and tables displayed in green font in management’s discussion and analysis on page 74 of this annual report.
30. Structured Entities
A structured entity (SE) is defined as an entity created to accomplish a narrow and well-defined objective. Under IFRS 10 – Consolidated Financial Statements, when a reporting entity has power over a SE and is exposed, or has rights to variable returns from its involvement with a SE and has the ability to affect those returns through its power over the SE, the reporting entity is considered to have control over the SE which must be consolidated within the reporting entity’s financial statements. When the reporting entity does not control the SE, consolidation is not required under IFRS 10.
Consolidated Structured Entities
In the 2005 to 2012 timeframe, we foreclosed on a number of aircraft loans and as a result, various aircraft for which we were a secured lender were returned to us. Since 2006, these aircraft were placed into trusts which are considered to be Structured Entities (SE) that we control under IFRS.
These trusts have therefore been consolidated and have total assets of $569 million at the end of December 2013 (2012 – $614 million). These assets are included in equipment available for lease, net investment in aircraft under finance leases and aircraft or component parts held-for-sale.
The following table illustrates the total assets of consolidated SEs within the financial statements of EDC:
| | | | |
(in millions of Canadian dollars) | | Dec. 31, 2013 | | Dec. 31, 2012 |
Equipment available for lease | | 493 | | 525 |
Net investment in aircraft under finance leases | | 76 | | 80 |
Aircraft or component parts held-for-sale* | | – | | 9 |
Total assets of consolidated SEs | | $569 | | $614 |
* Aircraft or component parts held-for-sale are included in other assets. Refer to Note 11.
| | | | |
| | EDC Annual Report 2013 | | 129 |
CONSOLIDATED FINANCIAL STATEMENTS
Unconsolidated Structured Entities
In the normal course of business, we sometimes provide financing and in some cases guarantees to equity investors via SEs; typically in the transportation and extractive sectors. As we do not control these entities, they do not require consolidation under IFRS 10. The following table summarizes our maximum exposure to loss for transactions structured through SEs as well as the carrying values recognized in the consolidated statement of financial position of EDC’s interest in these unconsolidated SEs.
| | | | | | | | | | |
(in millions of Canadian dollars) | | Dec. 31, 2013 | | | Dec. 31, 2012 | |
SEs included in the consolidated statement of financial position | | | | | | | | | | |
Loans receivable | | Note 4 | | | 9,652 | | | | 8,228 | |
Allowance for loan losses | | | | | (204) | | | | (183 | ) |
Net loans receivable | | | | | 9,448 | | | | 8,045 | |
Fund investments | | Note 7 | | | 467 | | | | 386 | |
Maximum exposure in the consolidated statement of financial position | | | | | 9,915 | | | | 8,431 | |
Commitments and guarantees | | | | | | | | | | |
Commitments | | | | | | | | | | |
Fund investments | | Note 20 | | | 536 | | | | 417 | |
Signed loan agreements | | Note 20 | | | 1,462 | | | | 1,959 | |
Letters of offer | | Note 20 | | | 1,864 | | | | 2,255 | |
Guarantees provided to equity holders | | Note 21 | | | 347 | | | | 344 | |
Maximum exposure to commitments and guarantees | | | | | 4,209 | | | | 4,975 | |
Maximum exposure to structured entities | | | | | $14,124 | | | | $13,406 | |
We invest in funds which are pooled investments vehicles structured as limited partnerships and financed by the limited partners. Funds invest primarily in private or public companies and are considered to be SEs.
As disclosed in Note 20, there are two types of loan commitments related to transactions structured through SEs. The first type are undisbursed amounts on signed loan agreements which are immediately available to the obligor for drawdown subject to continued adherence to contractual covenants established under the financing agreements. The second type are loan commitments for which terms related to the transaction, such as interest rate type and disbursement schedule, have not yet been determined and which are currently anticipated to be structured through SEs. This category of commitments includes letters of offer accepted and outstanding.
31. Loan Revenue
| | | | |
(in millions of Canadian dollars) | | 2013 | | 2012 |
Loan interest – floating rate | | 579 | | 551 |
Loan interest – fixed rate | | 394 | | 385 |
Loan fee revenue | | 158 | | 129 |
Impaired revenue | | 30 | | 41 |
Other loan revenue | | 13 | | 10 |
Total loan revenue | | $1,174 | | $1,116 |
32. Marketable Securities Revenue
| | | | |
(in millions of Canadian dollars) | | 2013 | | 2012 |
Instruments at fair value through profit or loss | | | | |
Short-term instruments | | 5 | | 5 |
Long-term instruments | | 26 | | 30 |
Instruments at amortized cost | | | | |
Long-term instruments | | 1 | | 1 |
Total marketable securities revenue | | $32 | | $36 |
| | | | |
| 130 | | Turning the Corner on Trade | | |
33. Interest Expense
| | | | | | |
(in millions of Canadian dollars) | | 2013 | | | 2012 |
Loans payable designated at fair value through profit or loss and related derivatives | | | | | | |
Short-term payables | | | 21 | | | 28 |
Long-term payables – floating | | | 73 | | | 100 |
Long-term payables – fixed* | | | (33) | | | (33) |
Loans payable carried at amortized cost | | | | | | |
Long-term payables – fixed | | | 35 | | | 71 |
Total interest expense on loans payable and related derivatives | | | 96 | | | 166 |
Interest income on currency swaps related to capital | | | (72) | | | (66) |
Other | | | 6 | | | 8 |
Total interest expense | | | $30 | | | $108 |
| * | Includes interest on instruments with cash flows that offset the cash flows of some long-term payables carried at amortized cost. | |
34. Leasing and Financing Related Expenses
| | | | | | |
(in millions of Canadian dollars) | | 2013 | | | 2012 |
Depreciation | | | 33 | | | 18 |
Maintenance and technical costs | | | 6 | | | 4 |
Risk mitigation expense | | | 5 | | | 4 |
Other | | | 5 | | | 7 |
Total leasing and financing related expenses | | | $49 | | | $33 |
35. Provision for (Reversal of) Credit Losses
The composition of the provision for credit losses, expressed on the consolidated statement of comprehensive income, is as follows:
| | | | | | |
(in millions of Canadian dollars) | | 2013 | | | 2012 |
Changes in portfolio composition(1) | | | 4 | | | (87) |
Updates to independent variables: | | | | | | |
Updated probability of default rates(2) | | | – | | | (156) |
Update to loss given default(3) | | | – | | | (63) |
Changes in loss emergence period | | | – | | | (12) |
Increased concentration threshold | | | (8) | | | (4) |
Credit migration | | | 35 | | | (13) |
Other | | | (1) | | | (5) |
Provision for (reversal of) credit losses | | | $30 | | | $(340) |
| (1) | Represents provision requirement (release) as a result of repayments, performing loan sales, disbursements and new financing commitments. Also includes the impact of changes in collateral values for our secured loans as these impacts should be considered in conjunction with the impact of the repayments on these loans. | |
| (2) | Included in the 2012 amount is $93 million due to the change in estimate. Refer to Note 6. |
| (3) | Included in the 2012 amount is $53 million due to the change in the loss given default estimate. |
| | | | |
| | EDC Annual Report 2013 | | 131 |
CONSOLIDATED FINANCIAL STATEMENTS
| | | | | | |
(in millions of Canadian dollars) | | 2013 | | | 2012 |
Provision for (reversal of) losses on loans | | | 43 | | | (263) |
Provision for (reversal of) losses on loan commitments | | | (14) | | | 18 |
Provision for (reversal of) losses on loan guarantees | | | 1 | | | (95) |
Provision for (reversal of) credit losses | | | $30 | | | $(340) |
36. Claims-Related Expenses (Recovery)
The composition of the claims-related expenses (recovery), expressed on the consolidated statement of comprehensive income, is as follows:
| | | | | | |
(in millions of Canadian dollars) | | 2013 | | | 2012 |
Claims paid | | | 56 | | | 355 |
Claims paid – reinsured policies | | | 5 | | | 3 |
Claims recovered | | | (10) | | | (22) |
Actuarial increase/(decrease) in the net allowance for claims | | | 1 | | | (233) |
Decrease/(increase) in recoverable insurance claims | | | 105 | | | (156) |
Claims handling and settlement expenses | | | 2 | | | 15 |
Total claims-related expenses (recovery) | | | $159 | | | $(38) |
37. Other Expenses
| | | | | | |
(in millions of Canadian dollars) | | 2013 | | | 2012 |
Net unrealized (gain) loss on derivatives related to loans payable | | | 288 | | | (68) |
Net unrealized (gain) loss on loans payable designated at fair value through profit or loss | | | (248) | | | 36 |
Net realized and unrealized (gain) loss on marketable securities at fair value through profit or loss | | | 52 | | | (9) |
Net realized and unrealized loss on loan related credit default swaps | | | 11 | | | 70 |
Net realized and unrealized gain on investments at fair value through profit or loss* | | | (4) | | | (3) |
Foreign exchange translation (gain) loss | | | 1 | | | (2) |
Other | | | 9 | | | (8) |
Total other expenses | | | $109 | | | $16 |
* Refer to Note 7.
We have designated the majority of our long-term bonds at fair value through profit or loss in order to obtain the same accounting treatment as their related derivatives. In general, these derivatives are entered into to manage interest and foreign exchange rate risks on the related bonds.
During 2013, most rates relevant to the valuation of our loans payable and the related derivatives increased, leading to unrealized losses of $288 million on our derivatives and unrealized gains of $248 million on our loans payable. In accordance with IFRS, our debt is valued on the basis of our credit rating (AAA) while the related derivatives are valued based on the credit risk of the resulting exposure. The gain on loans payable was smaller than the loss on the related derivatives since the rates used to value our loans payable increased less than the rates used to value the related derivatives. During 2012, most rates relevant to the valuation of our debt fell, leading to a loss of $36 million on our loans payable and a gain of $68 million on the related derivatives.
The majority of our marketable securities are measured at fair value through profit or loss, consistent with our business model for managing these instruments. At the end of December 2013, net realized and unrealized losses on marketable securities at fair value through profit or loss totalled $52 million (2012 – gains of $9 million). During 2013, most rates relevant to the valuation of these marketable securities increased leading to a loss. During 2012, the rates fell which translated into a gain.
In 2013 we recorded a net realized and unrealized loss of $11 million (2012 – $70 million) on our portfolio of loan related credit default swaps. The reduced loss in 2013 is due to a relatively stable credit condition of the reference entities compared to a more significant improvement of their credit condition in 2012.
| | | | |
| 132 | | Turning the Corner on Trade | | |
38. Administrative Expenses
| | | | | | |
(in millions of Canadian dollars) | | 2013 | | | 2012 |
Salaries and benefits | | | 161 | | | 150 |
Pension, other retirement and post-employment benefits | | | 49 | | | 56 |
Accommodation | | | 27 | | | 26 |
Amortization and depreciation | | | 25 | | | 29 |
Other | | | 48 | | | 47 |
Total administrative expenses | | | $310 | | | $308 |
39. Retirement Benefit Obligations
Pension Plans
The defined benefit component of the Registered Pension Plan (RPP) was established on April 24, 2000 and is available for employees hired prior to January 1, 2012. The RPP is registered under the Pension Benefits Standards Act (PBSA) with the Office of the Superintendent of Financial Institutions Canada and, as a registered pension plan as defined under the Income Tax Act (ITA), is not subject to income taxes for the contributions or investment income received. The RPP provides benefits to retirees based on years of service and the best five consecutive years’ average salary of the employees. Upon retirement, the benefits are fully indexed to inflation. All permanent employees hired prior to January 1, 2012 are members of the RPP; however, employee contributions to the plan are optional.
We also maintain a Supplementary Retirement Plan (SRP), the purpose of which is to supplement benefits for members whose benefits and/or contributions under the RPP are affected by ITA maximums. It does so by increasing their benefits to the level which would be payable under the RPP if these maximums did not apply.
Effective January 1, 2012, we established a defined contribution component for both the RPP and the SRP (collectively referred to as ‘the Plans’) which is mandatory for all new permanent employees hired on or after January 1, 2012. Pension benefits are based on the accumulation of contributions and investment income allocated to the employee’s account. Employee contributions may be 4%, 5% or 6% of an employee’s annual earnings. The contributions are invested as directed by each employee from a selection of available investment options. We match the employee’s contribution based on points determined by an employee’s age and years of eligible service.
The Plans’ durations are between 18 to 20 years.
Other Benefit Plans
We maintain a retiring allowance program and provide certain life insurance, health and dental care benefits to retired employees. These plans’ durations are between 18 to 20 years and are funded as the cost of benefits is incurred. Costs are accrued based on actuarial calculations. Effective July 1, 2013, EDC introduced two changes to the other benefit plans as follows:
| | |
| | Employees are no longer accumulating service in respect of the retiring allowance portion of the corporate Severance Policy. Service accumulated as at July 1, 2013 was banked and the relevant retiring allowance will be paid out, as per the policy, when the employee leaves the Corporation. |
| |
| | The Supplementary Death Benefit was cancelled. The cancellation of this benefit resulted in a reduction of the defined benefit obligation for other benefit plans of $1.8 million of which $1 million was recognized in the 2011 defined benefit expense as it represented a vested past service cost benefit. The remainder of the impact had been included in unrecognized past service benefit – non-vested and was partially amortized in 2012. The remaining unamortized balance was recognized in retained earnings at January 1, 2013 as part of the transition to the amended IAS 19 standard. |
Plans’ Governance Structure
EDC’s pension governance structure is overseen by the Human Resources Committee of the Board (HRC) and two management groups. The first management group is at the executive level, the Management Pension Committee (MPC) and the second at the operational level, the Pension Working Group (PWG). The HRC has oversight responsibilities with respect to pension plan design, review and amendments and is responsible for ensuring that actuarial valuations are performed as required by legislation. In addition, the HRC reviews investment policies, goals and performance, as well as the appointments and terminations of trustees and investment managers.
The MPC provides recommendations for plan design changes, monitors funds’ investment performance and meets with the investment managers on a periodic basis. The MPC approves changes to plan custodians, oversees and supports pension activities undertaken by the PWG. The PWG is responsible for implementing policies, managing and monitoring fund operations and undertaking day to day operational functions. The PWG consists of EDC personnel with full or part time responsibility for pension matters and includes representatives from Human Resources, Finance and Legal Services.
| | | | |
| | EDC Annual Report 2013 | | 133 |
CONSOLIDATED FINANCIAL STATEMENTS
Risk Mitigation
The RPP’s and the SRP’s investment portfolios are subject to a variety of financial instrument risks that could adversely affect the cash flows, financial position and income of the Plans. The Plans’ financial risk is concentrated in its investment holdings and includes credit risk, liquidity risk and market risk. The exposure to these risks is not considered to be significant or unusual. The Plans’ Statements of Investment Policies and Procedures (SIPP) prescribe an asset mix policy, require portfolio investment diversification and limit exposure to individual investments and major asset classes to reduce the level of risk associated with the Plans. The SIPPs are reviewed at least annually and investment principles and beliefs are revisited periodically to ensure that changes to the investment policies are made if required.
Funding Risk
Funding risk is the risk that the investment asset growth and contribution rates of the pension plan will not be sufficient to cover the pension obligations, resulting in unfunded liabilities. In accordance with regulatory requirements, if any unfunded liabilities exist, special contributions are required over specified future periods in order to reduce any deficit determined by the actuarial valuation process. The most significant contributors to funding risk are fluctuations in discount rates and returns on assets.
Other Risks
The defined benefit obligation is subject to measurement uncertainty due to the use of actuarial assumptions such as discount rates, mortality rates, rate of compensation increases as well as withdrawal and retirement rates. The impact of these factors on the pension plan and other post employment benefits can be significant and volatile at times.
The following table presents the financial position of our retirement benefit obligations.
| | | | | | | | | | | | | | | | | | | | | | | | | | | | | | |
(in millions of Canadian dollars) | | Dec. 31, 2013 | | | Dec. 31, 2012 |
| | | Registered
Pension
Plan | | | Supplementary
Retirement
Plan | | | Other
benefit
plans | | | Total | | | Registered
Pension
Plan | | | Supplementary
Retirement
Plan | | | Other
benefit
plans | | | Total |
Defined benefit obligation: | | | | | | | | | | | | | | | | | | | | | | | | | | | | | | |
Obligation beginning of year | | | 660 | | | | 49 | | | | 150 | | | | 859 | | | | 631 | | | | 52 | | | | 139 | | | 822 |
Current service costs | | | 24 | | | | 2 | | | | 9 | | | | 35 | | | | 29 | | | | 2 | | | | 8 | | | 39 |
Interest cost on benefit obligation | | | 31 | | | | 2 | | | | 7 | | | | 40 | | | | 30 | | | | 2 | | | | 7 | | | 39 |
Employee contributions | | | 7 | | | | – | | | | – | | | | 7 | | | | 7 | | | | – | | | | – | | | 7 |
Actuarial (gain) loss from changes in plan experience | | | 7 | | | | – | | | | (14 | ) | | | (7 | ) | | | (14 | ) | | | (4 | ) | | | (1 | ) | | (19) |
Actuarial gain from changes in financial assumptions | | | (83 | ) | | | (6 | ) | | | (14 | ) | | | (103 | ) | | | (5 | ) | | | (2 | ) | | | (1 | ) | | (8) |
Actuarial loss from changes in demographic assumptions | | | 42 | | | | 4 | | | | 5 | | | | 51 | | | | – | | | | – | | | | – | | | – |
Benefits paid | | | (17 | ) | | | (2 | ) | | | (2 | ) | | | (21 | ) | | | (18 | ) | | | (1 | ) | | | (2 | ) | | (21) |
Defined benefit obligation at end of year | | | 671 | | | | 49 | | | | 141 | | | | 861 | | | | 660 | | | | 49 | | | | 150 | | | 859 |
Fair value of plan assets: | | | | | | | | | | | | | | | | | | | | | | | | | | | | | | |
Fair value at beginning of year | | | 540 | | | | 49 | | | | – | | | | 589 | | | | 444 | | | | 44 | | | | – | | | 488 |
Interest income on plan assets | | | 26 | | | | 2 | | | | – | | | | 28 | | | | 21 | | | | 2 | | | | – | | | 23 |
Return on plan assets, excluding interest income on plan assets | | | 56 | | | | 4 | | | | – | | | | 60 | | | | 24 | | | | – | | | | – | | | 24 |
Employer contributions | | | 65 | | | | 4 | | | | 2 | | | | 71 | | | | 63 | | | | 4 | | | | 2 | | | 69 |
Employee contributions | | | 7 | | | | – | | | | – | | | | 7 | | | | 7 | | | | – | | | | – | | | 7 |
Benefits paid | | | (17 | ) | | | (2 | ) | | | (2 | ) | | | (21 | ) | | | (18 | ) | | | (1 | ) | | | (2 | ) | | (21) |
Administrative costs | | | (1 | ) | | | – | | | | – | | | | (1 | ) | | | (1 | ) | | | – | | | | – | | | (1) |
Fair value at end of year | | | 676 | | | | 57 | | | | – | | | | 733 | | | | 540 | | | | 49 | | | | – | | | 589 |
Funded status – plan (deficit) surplus | | | $5 | | | | $8 | | | | $(141 | ) | | | $(128 | ) | | | $(120 | ) | | | $– | | | | $(150 | ) | | $(270) |
| * | In addition to the plans noted above, the obligation for the defined contribution components of the Plans was $2.3 million (2012 – $384 thousand). The fair value of the assets match the obligation. |
| ** | The asset ceiling test had no impact on the net asset position of the Plans. |
| | | | |
| 134 | | Turning the Corner on Trade | | |
Asset Mix
The objective when managing capital of the Plans is to safeguard the ability to continue as a going concern in order to maintain adequate assets to support development of the investment activities of the Plans and to ensure adequate assets to fund future benefit payments. The Plans’ policies are to invest in a diversified portfolio of investments, based on criteria established in the SIPPs which assist in the management of capital and mitigation of risk. Periodically, an asset-liability modeling (ALM) study is performed to ensure that the pension plan’s investment strategy policies are appropriate in terms of risk and return profiles to ensure proper matching to meet our long-term funding obligation. The results of the ALM are reviewed by the MPC and recommendations, if any, are made to the HRC as part of the annual SIPPs review.
The Plans’ assets are invested in debt securities, equity securities, real estate and held in cash. For the RPP, the target allocation percentages are 30% in debt securities, 55% in equity securities and 15% in real estate. The actual investment allocations at the end of December 2013 were 25% in debt securities (2012 – 31%), 61% in equity securities (2012 – 54%) and 14% in real estate (2012 – 15%). For the SRP, the target is 100% in equity securities, net of cash held in a refundable tax account as prescribed by Canada Revenue Agency (CRA). This resulted in actual investment allocations of 47% in cash and 53% in equity securities at the end of 2013 (2012 – 54% in cash and 46% in equity securities).
Fair Value Measurements
All financial instruments of the Plans recognized at fair value in the consolidated statement of financial position must be classified into fair value hierarchy levels based on the transparency of the inputs used to measure the fair value as defined in Note 28 Fair Value of Financial Instruments.
The table below presents the fair value hierarchy of the assets for both the RPP and the SRP:
| | | | | | | | |
(in millions of Canadian dollars) | | Dec. 31, 2013 |
| | | Level 1 | | Level 2 | | Level 3 | | Total |
Canadian pooled bond funds | | – | | 170 | | – | | 170 |
Canadian pooled equity fund | | – | | 145 | | – | | 145 |
International pooled equity find | | – | | 142 | | – | | 142 |
U.S. pooled equity fund | | – | | 155 | | – | | 155 |
Real estate pooled fund | | – | | – | | 96 | | 96 |
Foreign currency forward contracts | | – | | (3) | | – | | (3) |
Other* | | 28 | | – | | – | | 28 |
Total | | $28 | | $609 | | $96 | | $733 |
* Represents cash, cash held with CRA and investments in Canadian short-term notes. |
(in millions of Canadian dollars) | | Dec. 31, 2012 |
| | | Level 1 | | Level 2 | | Level 3 | | Total |
Canadian pooled bond funds | | – | | 167 | | – | | 167 |
Canadian pooled equity fund | | – | | 106 | | – | | 106 |
International pooled equity find | | – | | 104 | | – | | 104 |
U.S. pooled equity fund | | – | | 103 | | – | | 103 |
Real estate pooled fund | | – | | – | | 83 | | 83 |
Foreign currency forward contracts | | – | | (1) | | – | | (1) |
Other * | | 27 | | – | | – | | 27 |
Total | | $27 | | $479 | | $83 | | $589 |
* Represents cash, cash held with CRA and investments in Canadian short-term notes.
| | | | |
| | EDC Annual Report 2013 | | 135 |
CONSOLIDATED FINANCIAL STATEMENTS
Defined Benefit Expense
| | | | | | | | | | | | | | | | |
(in millions of Canadian dollars) | | 2013 | | 2012 |
| | | Registered
Pension
Plan | | Supplementary
Retirement
Plan | | Other
benefit
plans | | Total | | Registered
Pension
Plan | | Supplementary
Retirement
Plan | | Other
benefit
plans | | Total |
Current service costs | | 24 | | 2 | | 9 | | 35 | | 29 | | 2 | | 8 | | 39 |
Administrative costs | | 1 | | – | | – | | 1 | | 1 | | – | | – | | 1 |
Service costs | | 25 | | 2 | | 9 | | 36 | | 30 | | 2 | | 8 | | 40 |
Interest cost on benefit obligation | | 31 | | 2 | | 7 | | 40 | | 30 | | 2 | | 7 | | 39 |
Interest income on plan assets | | (26) | | (2) | | – | | (28) | | (21) | | (2) | | – | | (23) |
Net interest on the net defined benefit liability | | 5 | | – | | 7 | | 12 | | 9 | | – | | 7 | | 16 |
Expense recognized in profit or loss* | | $30 | | $2 | | $16 | | $48 | | $39 | | $2 | | $15 | | $56 |
| * | Employer contributions to the defined contribution components of the Plans are expensed as employees render their service. In 2013, these contributions totalled $998 thousand (2012 – $212 thousand). |
Key Assumptions
The following table outlines the key assumptions used in measuring the defined benefit obligations and defined benefit costs.
| | | | | | | | | | | | |
Assumptions | | Dec. 31, 2013 | | Dec. 31, 2012 |
(Weighted average) | | Registered Pension Plan | | Supplementary
Retirement Plan | | Other benefit plans | | Registered Pension Plan | | Supplementary
Retirement Plan | | Other benefit plans |
Defined benefit obligation: | | | | | | | | | | | | |
Discount rate | | 5.10% | | 5.10% | | 5.10% | | 4.50% | | 4.50% | | 4.50% |
Rate of compensation increase | | 3.25% to 5.65% | | 3.25% to 5.65% | | 3.25% to 5.65% | | 3.25% to 5.65% | | 3.25% to 5.65% | | 3.25% to 5.65% |
Benefit costs: | | | | | | | | | | | | |
Discount rate on projected defined benefit obligation | | 4.50% | | 4.50% | | 4.50% | | 4.50% | | 4.50% | | 4.50% |
Inflation | | 2.25% | | 2.25% | | 2.25% | | 2.25% | | 2.25% | | 2.25% |
Rate of compensation increase | | 3.25% to 5.65% | | 3.25% to 5.65% | | 3.25% to 5.65% | | 3.25% to 5.60% | | 3.25% to 5.60% | | 3.25% to 5.60% |
Due to the long-term nature of the pension plans, the calculation of expenses and obligations depends on various assumptions. These assumptions require significant judgment and have inherent uncertainties that management may not be able to control. The assumptions are determined annually by management, in consultation with our actuaries.
As per IAS 19, the discount rate used to determine the defined benefit obligations should be based on market rates for high-quality corporate bonds that match the currency and estimated term of the obligations. Given the long-term nature of pension plan obligations, the yields for bonds with long terms to maturity are most important. In a market such as Canada, high-quality long-term corporate bonds are few in number. Due to this lack of depth in the long-term market, it is necessary to extrapolate the long end of the high-quality corporate bond yield curve with additional data points. Our methodology used to set the discount rate is based on the Canadian Institute of Actuaries’ (CIA) preferred methodology which supplements the long-end of the curve by including Canadian provincial bonds rated AA with an adjustment to account for credit risk differentials when compared to corporate bond yields. We have further refined this model in deriving our discount rate of 5.10% which was then used to determine the defined benefit obligation for 2013.
The rate of compensation increase used for the defined benefit obligation represents a long-term assumption and includes components for merit and promotion adjustments.
Assumptions regarding future mortality experience are set based on actuarial advice in accordance with published statistics in the form of post-retirement mortality tables. In 2013, the CIA introduced new mortality tables which highlighted that Canadian pensioners are living longer. The table for 2013 is based on combined public and private sector data. The mortality tables translate the average life expectancy of a pensioner retiring at age 65 into years. Our 2013 obligation reflects the use of the new mortality table which embeds greater longevity estimates and represents a change in estimate. The difference between using the old mortality table and the new mortality table is an increase of $50 million to the obligation.
For the other benefit plans, the initial annual rate of increase for covered medical care benefits is assumed to be 7.00% (2012 – 7.36%). This rate is projected to trend down over seven years to an ultimate rate of 4.50% for 2020 (2012 – 4.50% for 2017) and subsequent years. For dental care, the trend rate used was 4.50% (2012 – 4.50%).
| | | | |
| 136 | | Turning the Corner on Trade | | |
Re-measurements Recognized in Other Comprehensive Income (OCI)
As a result of applying the previously discussed assumptions, actuarial gains or losses on the defined benefit plans arise from the difference between actual and expected experience. Under amended IAS 19 issued in June 2011 by the IASB, actuarial gains and losses are to be immediately recognized in OCI. The amended standard removed the option to defer gains and losses. The implementation of the amended standard resulted in the recognition of re-measurement gains totalling $119 million in OCI during 2013 (2012 – $51 million). These amounts have been closed out to retained earnings. As such, there is no accumulated OCI in respect of these amounts.
The table below summarizes the re-measurement recognized in OCI throughout 2013:
| | | | | | | | | | | | | | | | | | | | | | | | | | | | | | |
(in millions of Canadian dollars) | | 2013 | | | 2012 |
| | | Registered
Pension
Plan | | | Supplementary
Retirement
Plan | | | Other
benefit
plans | | | Total | | | Registered
Pension
Plan | | | Supplementary
Retirement
Plan | | | Other
benefit
plans | | | Total |
Re-measurements on pension obligations | | | | | | | | | | | | | | | | | | | | | | | | | | | | | | |
Actuarial gains (losses) – plan experience assumptions | | | (7 | ) | | | – | | | | 14 | | | | 7 | | | | 14 | | | | 4 | | | | 1 | | | 19 |
Actuarial losses – demographic assumptions | | | (42 | ) | | | (4 | ) | | | (5 | ) | | | (51) | | | | – | | | | – | | | | – | | | – |
Actuarial gains – financial assumptions | | | 83 | | | | 6 | | | | 14 | | | | 103 | | | | 5 | | | | 2 | | | | 1 | | | 8 |
| | | | 34 | | | | 2 | | | | 23 | | | | 59 | | | | 19 | | | | 6 | | | | 2 | | | 27 |
Re-measurements on plan assets excluding interest income | | | | | | | | | | | | | | | | | | | | | | | | | | | | | | |
Return on plan assets | | | 56 | | | | 4 | | | | – | | | | 60 | | | | 24 | | | | – | | | | – | | | 24 |
Total re-measurements recognized in other comprehensive income, end of year | | | $90 | | | | $6 | | | | $23 | | | | $119 | | | | $43 | | | | $6 | | | | $2 | | | $51 |
Sensitivity Analysis
The following table outlines the potential impact of changes in certain key assumptions used in measuring the defined benefit obligations. The sensitivity analysis contained in this table is hypothetical and should be used with caution.
| | | | | | | | | | | | |
(in millions of Canadian dollars) | | 2013 |
| | | Registered
Pension Plan | | | Supplementary
Retirement Plan | | | Other
benefit plans |
Sensitivity of Assumptions | | Obligation | | | Obligation | | | Obligation |
Discount rate | | | | | | | | | | |
Impact of: | | 1% increase ($) | | | (111) | | | | (8) | | | (24) |
| | | 1% decrease ($) | | | 145 | | | | 9 | | | 32 |
Longevity Risk Sensitivity | | | | | | | | | | |
Impact of: | | increase of 1 year in life expectancy | | | 19 | | | | 2 | | | 6 |
Rate of compensation increase(1) | | | | | | | | | | |
Impact of: | | 1% increase ($) | | | 18 | | | | 8 | | | 1 |
| | | 1% decrease ($) | | | (19) | | | | (5) | | | (2) |
Inflation rate assumption | | | | | | | | | | |
Impact of: | | 0.25% increase ($) | | | 27 | | | | 2 | | | n/a(2) |
| | | 0.25% decrease ($) | | | (26) | | | | (2) | | | n/a(2) |
| (1) | The rate of compensation increase includes a merit and promotional component which varies by years of service for each individual employee. |
| (2) | Inflation rate assumption for the other benefit plans are already factored into the other sensitivities. |
A one percentage point increase in assumed health care cost trends would have increased the service and interest cost by $4 million (2012 – $4 million) and the obligation by $30 million (2012 – $35 million). A one percentage point decrease in assumed health care cost trends would have decreased the service and interest costs by $3 million (2012 – $3 million) and the obligation by $22 million (2012 – $26 million).
| | | | |
| | EDC Annual Report 2013 | | 137 |
CONSOLIDATED FINANCIAL STATEMENTS
Total Contributions
Total contributions for our retirement benefit obligations in 2013 totalled $72 million (2012 – $69 million). The contributions include cash contributions to the pension plans and payments made directly to beneficiaries for the unfunded other benefit plans. Included in total contributions in 2013 was $46 million (2012 – $42 million) in additional contributions to the RPP in relation to a plan deficit identified as a result of the funding valuations from 2009 to 2012 and a $4 million special contribution to the SRP (2012 – $4 million) in relation to a plan deficit identified as a result of the 2012 funding valuation. The total also includes $998 thousand in contributions made to the defined contribution plans in 2013 (2012 – $212 thousand). We expect to contribute $68 million to the Plans in 2014 which includes $63 million in contributions to the RPP, $2 million to the defined contribution plan and $3 million for the other benefit plans. Contributions to the SRP will be determined once the actuarial valuation is complete in mid 2014.
Funding and Solvency Valuation
Our appointed actuaries measure the defined benefit obligations and the fair value of the Plans’ assets for accounting purposes as at December 31 of each year. We fund our defined benefit pension plans in accordance with actuarially determined amounts required to satisfy employee benefit obligations under current federal pension regulations. The most recent funding valuation for the RPP and the SRP was as at December 31, 2012. The next required valuation, to be completed in 2014, will be as at December 31, 2013.
The financial health of a pension plan is measured by actuarial valuations, which are prepared on both a going-concern and a solvency basis. The EDC RPP ratios as at December 31, 2012 were 96.6% on a going-concern basis and 67.7% on a solvency basis. Since EDC’s solvency ratio for the RPP is less than 100%, we are required by federal pension legislation to make special monthly solvency contributions. During 2013 we contributed special payments of $44 million into the RPP and will continue to remit all required solvency payments. The solvency ratio for the SRP as at December 31, 2012 was 91.4% and EDC made a special contribution of $4 million to this plan in 2013 in order to eliminate this deficit. The next formal valuations will be conducted by the Plans’ actuaries in 2014 and will be as at December 31, 2013.
40. Related Party Transactions
We enter into transactions with other government departments, agencies and Crown corporations in the normal course of business, under terms and conditions similar to those that apply to unrelated parties. The following disclosure is in addition to the related party disclosure provided elsewhere in these financial statements. All material related party transactions are either disclosed below or in the relevant notes. These transactions are measured at their exchange amounts.
Canada Account Administrative Expense Recovery
As described in Note 41, we enter into certain financial and contingent liability transactions on behalf of the Government of Canada known as “Canada Account” transactions. We are compensated for expenses and overhead relating to Canada Account activities. In 2013, we retained $4 million (2012 – $5 million) from Canada Account receipts and recoveries for these expenses and overhead. These amounts are netted against administrative expenses on the consolidated statement of comprehensive income.
Key Management Personnel Compensation
Key management personnel include the Board of Directors and the Executive Management team. Compensation paid or payable to key management personnel during the year, including non-cash benefits subject to income tax, was as follows:
| | | | | | | | |
(in millions of Canadian dollars) | | 2013 | | | 2012 | |
Salaries and other short-term benefits | | | 4 | | | | 4 | |
Post-employment benefits | | | 1 | | | | 2 | |
Total | | | $5 | | | | $6 | |
| | | | |
| 138 | | Turning the Corner on Trade | | |
41. Canada Account Transactions
Pursuant to the Act, the Minister, with the concurrence of the Minister of Finance, may authorize us to undertake certain financial and contingent liability transactions on behalf of the Government of Canada. These transactions and the legislative authorities that underlie them have come to be known collectively as “Canada Account”. Accounts for these transactions are maintained separately from our accounts and are consolidated annually as at March 31 with the financial statements of the Government of Canada, which are reported upon separately by the Government and audited by the Auditor General of Canada. The assets under the Canada Account, mainly loans receivable and accrued interest and fees are recorded in accordance with the accounting policies and practices of the Government of Canada, and amounted to $3,481 million at the end of December 2013 (2012 – $3,738 million).
The Act allows the Canada Account to have outstanding loans and commitments to borrowers and arrangements giving rise to contingent liabilities under contracts of insurance and other agreements up to a maximum of $20 billion. The position against this limit at December 31, determined in accordance with the requirements of the Act, was $3.0 billion (2012 – $3.4 billion). The position against the statutory limit increases accordingly as we sign each new obligation that has the effect of extending credit or giving rise to a contingent liability.
| | | | |
| | EDC Annual Report 2013 | | 139 |
TEN-YEAR REVIEW
Statement of Financial Position
| | | | | | | | | | | | |
as at December 31 (in millions of Canadian dollars) | | 2013(1) | | | 2012(1) | | | 2011(1) | |
Gross loans receivable | | | 36,549 | | | | 30,336 | | | | 29,093 | |
Accrued interest and fees receivable(2) | | | 154 | | | | 157 | | | | 145 | |
Deferred loan revenue and other credits | | | (346) | | | | (362) | | | | (558) | |
Risk mitigation insurer’s share of loan allowance | | | – | | | | – | | | | – | |
Allowance for losses on loans | | | (1,246) | | | | (1,182) | | | | (1,680) | |
Net loans receivable | | | 35,111 | | | | 28,949 | | | | 27,000 | |
Equipment available for lease | | | 493 | | | | 525 | | | | 55 | |
Net investment in aircraft under finance leases | | | 76 | | | | 80 | | | | 92 | |
Investments at fair value through profit or loss | | | 537 | | | | 429 | | | | 385 | |
Cash and marketable securities | | | 4,066 | | | | 4,236 | | | | 3,886 | |
Reinsurers’ share of premium and claims liabilities | | | 93 | | | | 90 | | | | 129 | |
Property, plant and equipment | | | 59 | | | | 66 | | | | 74 | |
Intangible assets | | | 44 | | | | 38 | | | | 40 | |
Other assets | | | 1,037 | | | | 1,820 | | | | 1,935 | |
Total Assets | | | $41,516 | | | | $36,233 | | | | $33,596 | |
Loans payable | | | 31,259 | | | | 25,880 | | | | 23,570 | |
Other liabilities | | | 1,068 | | | | 676 | | | | 588 | |
Allowance for losses on loan commitments(3) | | | 47 | | | | 58 | | | | 41 | |
Premium and claims liabilities | | | 606 | | | | 583 | | | | 875 | |
Loan guarantees(4) | | | 165 | | | | 161 | | | | 266 | |
Total liabilities | | | 33,145 | | | | 27,358 | | | | 25,340 | |
Share capital | | | 1,333 | | | | 1,333 | | | | 1,333 | |
Retained earnings | | | 7,038 | | | | 7,542 | | | | 6,923 | |
Accumulated other comprehensive income (loss) | | | – | | | | – | | | | – | |
Equity | | | 8,371 | | | | 8,875 | | | | 8,256 | |
Total Liabilities and Equity | | | $41,516 | | | | $36,233 | | | | $33,596 | |
| (1) | 2013 through 2010 numbers are based on IFRS; 2009 through 2004 numbers are based on previous Canadian GAAP. |
| (2) | For 2013 through 2010, accrued loan interest and fees were reclassified to loans receivable for IFRS presentation purposes. For 2009 through 2004, accrued loan interest and fees are included in other assets. |
| (3) | For 2013 through 2010, allowance for losses on loan guarantees is included with loan guarantees. For 2009 through 2004, allowance for losses on loan commitments includes allowance for losses on loan guarantees. |
| (4) | For 2013 through 2010, loan guarantees include deferred guarantee fee revenue and allowance for losses on loan guarantees. For 2009 through 2004 allowance for losses on loan guarantees is grouped with allowance for losses on loan commitments and guarantees and deferred guarantee fee revenue is grouped with loans receivable. |
| | | | |
| 140 | | Turning the Corner on Trade | | |
| | | | | | | | | | | | | | | | | | | | | | | | | | |
2010(1) | | | 2009(1) | | | 2008(1) | | | 2007(1) | | | 2006(1) | | | 2005(1) | | | 2004(1) | |
| | 26,997 | | | | 26,823 | | | | 30,898 | | | | 19,108 | | | | 19,581 | | | | 17,306 | | | | 19,419 | |
| 163 | | | | – | | | | – | | | | – | | | | – | | | | – | | | | – | |
| (549) | | | | (556) | | | | (689) | | | | (589) | | | | (825) | | | | (1,053) | | | | (1,289) | |
| – | | | | – | | | | – | | | | – | | | | 61 | | | | 124 | | | | – | |
| (1,561) | | | | (1,948) | | | | (1,928) | | | | (1,316) | | | | (1,674) | | | | (2,148) | | | | (2,674) | |
| | 25,050 | | | | 24,319 | | | | 28,281 | | | | 17,203 | | | | 17,143 | | | | 14,229 | | | | 15,456 | |
| 143 | | | | 315 | | | | 334 | | | | 372 | | | | 233 | | | | 114 | | | | – | |
| 99 | | | | 113 | | | | 142 | | | | 122 | | | | – | | | | – | | | | – | |
| 317 | | | | 196 | | | | 150 | | | | 95 | | | | 58 | | | | 44 | | | | 44 | |
| 3,803 | | | | 5,432 | | | | 3,843 | | | | 2,528 | | | | 3,353 | | | | 3,263 | | | | 2,894 | |
| 109 | | | | 159 | | | | 157 | | | | 88 | | | | 67 | | | | 40 | | | | 59 | |
| 33 | | | | 17 | | | | 15 | | | | 7 | | | | 7 | | | | 9 | | | | 10 | |
| 42 | | | | 41 | | | | 36 | | | | 32 | | | | 28 | | | | 31 | | | | 37 | |
| 2,286 | | | | 2,306 | | | | 2,298 | | | | 2,642 | | | | 1,936 | | | | 1,999 | | | | 2,250 | |
| | $31,882 | | | | $32,898 | | | | $35,256 | | | | $23,089 | | | | $22,825 | | | | $19,729 | | | | $20,750 | |
| 22,484 | | | | 24,435 | | | | 25,882 | | | | 15,583 | | | | 15,140 | | | | 13,424 | | | | 15,545 | |
| 459 | | | | 369 | | | | 1,627 | | | | 375 | | | | 787 | | | | 596 | | | | 696 | |
| 93 | | | | 713 | | | | 807 | | | | 564 | | | | 394 | | | | 355 | | | | 448 | |
| 640 | | | | 793 | | | | 824 | | | | 543 | | | | 518 | | | | 590 | | | | 584 | |
| 245 | | | | – | | | | – | | | | – | | | | – | | | | – | | | | – | |
| | 23,921 | | | | 26,310 | | | | 29,140 | | | | 17,065 | | | | 16,839 | | | | 14,965 | | | | 17,273 | |
| | 1,333 | | | | 1,333 | | | | 983 | | | | 983 | | | | 983 | | | | 983 | | | | 983 | |
| 6,628 | | | | 5,317 | | | | 5,077 | | | | 5,121 | | | | 5,003 | | | | 3,781 | | | | 2,494 | |
| – | | | | (62) | | | | 56 | | | | (80) | | | | – | | | | – | | | | – | |
| | 7,961 | | | | 6,588 | | | | 6,116 | | | | 6,024 | | | | 5,986 | | | | 4,764 | | | | 3,477 | |
| | $31,882 | | | | $32,898 | | | | $35,256 | | | | $23,089 | | | | $22,825 | | | | $19,729 | | | | $20,750 | |
| | | | |
| | EDC Annual Report 2013 | | 141 |
TEN-YEAR REVIEW
Statement of Comprehensive Income
| | | | | | | | | | | | |
for the year ended December 31 (in millions of Canadian dollars) | | 2013(1) | | | 2012(1) | | | 2011(1) | |
Financing and investment revenue: | | | | | | | | | | | | |
Loan | | | 1,174 | | | | 1,116 | | | | 1,009 | |
Finance lease | | | 6 | | | | 6 | | | | 7 | |
Operating lease | | | 55 | | | | 17 | | | | 21 | |
Debt relief | | | – | | | | – | | | | 4 | |
Marketable securities | | | 32 | | | | 36 | | | | 46 | |
Investments | | | 8 | | | | 5 | | | | 12 | |
Total financing and investment revenue | | | 1,275 | | | | 1,180 | | | | 1,099 | |
Interest expense | | | 30 | | | | 108 | | | | 93 | |
Leasing and financing related expenses | | | 49 | | | | 33 | | | | 32 | |
Net Financing and Investment Income | | | 1,196 | | | | 1,039 | | | | 974 | |
Loan Guarantee Fees | | | 36 | | | | 38 | | | | 32 | |
Insurance premiums and guarantee fees | | | 204 | | | | 204 | | | | 238 | |
Reinsurance assumed | | | 11 | | | | 12 | | | | 13 | |
Reinsurance ceded | | | (22) | | | | (20) | | | | (17) | |
Net Insurance Premiums and Guarantee fees | | | 193 | | | | 196 | | | | 234 | |
Other (Income) Expenses | | | 109 | | | | 16 | | | | (61) | |
Administrative Expenses | | | 310 | | | | 308 | | | | 284 | |
Income before Provision and Claims-Related Expenses (Recovery) | | | 1,006 | | | | 949 | | | | 1,017 | |
Provision for (Reversal of) Credit Losses | | | 30 | | | | (340) | | | | 125 | |
Claims-Related Expenses (Recovery) | | | 159 | | | | (38) | | | | 247 | |
Net Income | | | 817 | | | | 1,327 | | | | 645 | |
Other comprehensive income | | | 119 | | | | 51 | | | | – | |
Comprehensive Income | | | $936 | | | | $1,378 | | | | $645 | |
| (1) | 2013 through 2010 numbers are based on IFRS; 2009 through 2004 numbers are based on previous Canadian GAAP. |
| | | | |
| 142 | | Turning the Corner on Trade | | |
| | | | | | | | | | | | | | | | | | | | | | | | | | |
2010(1) | | | 2009(1) | | | 2008(1) | | | 2007(1) | | | 2006(1) | | | 2005(1) | | | 2004(1) | |
| | | | | | | |
| | 1,004 | | | | 1,321 | | | | 1,355 | | | | 1,405 | | | | 1,174 | | | | 1,155 | | | | 1,148 | |
| 8 | | | | 9 | | | | 9 | | | | 8 | | | | – | | | | – | | | | – | |
| 32 | | | | 32 | | | | 43 | | | | 37 | | | | 4 | | | | – | | | | – | |
| 25 | | | | 49 | | | | – | | | | 1 | | | | 261 | | | | 64 | | | | 43 | |
| 47 | | | | 41 | | | | 81 | | | | 123 | | | | 123 | | | | 123 | | | | 63 | |
| 8 | | | | 3 | | | | 2 | | | | 1 | | | | – | | | | – | | | | – | |
| | 1,124 | | | | 1,455 | | | | 1,490 | | | | 1,575 | | | | 1,562 | | | | 1,342 | | | | 1,254 | |
| 147 | | | | 381 | | | | 611 | | | | 717 | | | | 628 | | | | 494 | | | | 345 | |
| 53 | | | | 68 | | | | 43 | | | | 46 | | | | 19 | | | | – | | | | – | |
| | 924 | | | | 1,006 | | | | 836 | | | | 812 | | | | 915 | | | | 848 | | | | 909 | |
| 33 | | | | 24 | | | | 20 | | | | 14 | | | | 12 | | | | 9 | | | | 8 | |
| 210 | | | | 197 | | | | 171 | | | | 149 | | | | 147 | | | | 147 | | | | 153 | |
| 11 | | | | – | | | | – | | | | – | | | | – | | | | – | | | | – | |
| (11) | | | | – | | | | – | | | | – | | | | – | | | | – | | | | – | |
| | 210 | | | | 197 | | | | 171 | | | | 149 | | | | 147 | | | | 147 | | | | 153 | |
| 49 | | | | 76 | | | | 13 | | | | (45) | | | | (9) | | | | – | | | | 7 | |
| 273 | | | | 246 | | | | 240 | | | | 219 | | | | 203 | | | | 182 | | | | 178 | |
| | 845 | | | | 905 | | | | 774 | | | | 801 | | | | 880 | | | | 822 | | | | 885 | |
| (631) | | | | 431 | | | | 346 | | | | 196 | | | | (301) | | | | (554) | | | | (312) | |
| 1 | | | | 216 | | | | 222 | | | | 132 | | | | (75) | | | | 41 | | | | 98 | |
| | 1,475 | | | | 258 | | | | 206 | | | | 473 | | | | 1,256 | | | | 1,335 | | | | 1,099 | |
| – | | | | – | | | | – | | | | – | | | | (34) | | | | (48) | | | | 143 | |
| | $1,475 | | | | $258 | | | | $206 | | | | $473 | | | | $1,222 | | | | $1,287 | | | | $1,242 | |
| | | | |
| | EDC Annual Report 2013 | | 143 |
TEN-YEAR REVIEW
Corporate Account
| | | | | | |
Financial Arrangements Facilitated (in millions of Canadian dollars) | | 2013(1) | | 2012(1) | | 2011(1) |
Financing | | | | | | |
Direct financing | | 17,497 | | 13,754 | | 13,734 |
Guarantees | | 851 | | 864 | | 893 |
Total | | 18,348 | | 14,618 | | 14,627 |
Insurance | | | | | | |
Credit insurance | | 56,224 | | 54,087 | | 62,872 |
Financial institutions insurance | | 10,630 | | 9,295 | | 13,914 |
Contract insurance and bonding | | 808 | | 531 | | 1,049 |
Political risk insurance(2) | | 2,743 | | 2,855 | | 2,859 |
Guarantees | | 6,659 | | 6,063 | | 7,179 |
Total | | 77,064 | | 72,831 | | 87,873 |
Financial and Other Data | | | | | | |
Financing (in millions of Canadian dollars) | | | | | | |
Value of gross loans receivable | | 36,549 | | 30,336 | | 29,093 |
Value of investments | | 537 | | 429 | | 385 |
Value of undisbursed loans(3) | | 14,885 | | 13,391 | | 9,722 |
Value of undisbursed investments | | 541 | | 417 | | 283 |
Value of loan disbursements(3) | | 14,100 | | 11,887 | | 10,393 |
Value of disbursements for investments | | 124 | | 121 | | 106 |
Value of liability on loan guarantees | | 1,954 | | 1,907 | | 2,506 |
Undisbursed amounts on loan guarantees | | 137 | | 197 | | 234 |
Amounts available for allocation under confirmed LOC | | 157 | | 111 | | 410 |
Loan amounts rescheduled | | – | | – | | 4 |
Loan amounts written off | | 62 | | 408 | | 76 |
Number of current lines of credit and protocols | | 26 | | 37 | | 56 |
Insurance (in millions of Canadian dollars) | | | | | | |
Value of liability on insurance and guarantees | | 24,898 | | 23,777 | | 25,732 |
Value of claims paid | | 61 | | 358 | | 55 |
Value of claims recovered | | 10 | | 22 | | 40 |
Value of claims outstanding at end of year | | 637 | | 627 | | 381 |
Value of claims under consideration at end of year | | 30 | | 11 | | 315 |
Number of policies issued | | 7,836 | | 7,525 | | 7,913 |
Number of insurance policies and guarantees in force | | 8,553 | | 8,214 | | 8,665 |
| (1) | 2013 through 2010 numbers are based on IFRS; 2009 through 2004 numbers are based on previous Canadian GAAP. |
| (2) | Figures prior to 2007 were not restated to reflect current presentation. |
| (3) | Includes investments prior to 2006. |
| | | | |
| 144 | | Turning the Corner on Trade | | |
| | | | | | | | | | | | | | | | | | | | | | | | | | |
| | | | | | | |
| 2010(1) | | | 2009(1) | | | 2008(1) | | | 2007(1) | | | 2006(1) | | | 2005(1) | | | 2004(1) | |
| | | | | | | |
| | 12,472 | | | | 11,148 | | | | 12,966 | | | | 11,362 | | | | 8,665 | | | | 4,298 | | | | 5,075 | |
| 936 | | | | 761 | | | | 1,120 | | | | 1,222 | | | | 1,313 | | | | 793 | | | | 1,077 | |
| | 13,408 | | | | 11,909 | | | | 14,086 | | | | 12,584 | | | | 9,978 | | | | 5,091 | | | | 6,152 | |
| | | | | | | |
| | 52,073 | | | | 52,658 | | | | 56,304 | | | | 44,661 | | | | 41,580 | | | | 40,659 | | | | 39,192 | |
| 8,324 | | | | 6,037 | | | | 5,124 | | | | 2,776 | | | | 1,336 | | | | 906 | | | | 985 | |
| 2,514 | | | | 3,733 | | | | 3,736 | | | | 3,935 | | | | 5,494 | | | | 4,566 | | | | 3,450 | |
| 2,420 | | | | 2,622 | | | | 2,432 | | | | 2,989 | | | | 4,845 | | | | 3,892 | | | | 3,501 | |
| 5,877 | | | | 5,810 | | | | 4,137 | | | | 3,077 | | | | 2,858 | | | | 2,330 | | | | 1,623 | |
| | 71,208 | | | | 70,860 | | | | 71,733 | | | | 57,438 | | | | 56,113 | | | | 52,353 | | | | 48,751 | |
| | | | | | | |
| | 26,997 | | | | 26,823 | | | | 30,898 | | | | 19,108 | | | | 19,581 | | | | 17,306 | | | | 19,419 | |
| 317 | | | | 196 | | | | 150 | | | | 95 | | | | 58 | | | | 44 | | | | 44 | |
| 8,775 | | | | 8,814 | | | | 8,024 | | | | 6,096 | | | | 3,913 | | | | 2,994 | | | | 2,794 | |
| 314 | | | | 367 | | | | 279 | | | | 143 | | | | 85 | | | | – | | | | – | |
| 10,095 | | | | 10,555 | | | | 13,324 | | | | 9,972 | | | | 8,321 | | | | 4,574 | | | | 4,172 | |
| 117 | | | | 74 | | | | 96 | | | | 56 | | | | 22 | | | | – | | | | – | |
| 2,304 | | | | 3,166 | | | | 3,612 | | | | 2,549 | | | | 2,442 | | | | 1,470 | | | | 1,909 | |
| 243 | | | | 392 | | | | 553 | | | | 418 | | | | 537 | | | | 1,004 | | | | 820 | |
| 384 | | | | 459 | | | | 509 | | | | 2,373 | | | | 2,607 | | | | 2,550 | | | | 1,682 | |
| 25 | | | | 51 | | | | – | | | | 2 | | | | 251 | | | | 128 | | | | 64 | |
| 75 | | | | 58 | | | | 5 | | | | 21 | | | | 6 | | | | 39 | | | | 81 | |
| | 57 | | | | 71 | | | | 72 | | | | 65 | | | | 69 | | | | 60 | | | | 47 | |
| | | | | | | |
| | 23,171 | | | | 22,395 | | | | 24,075 | | | | 17,609 | | | | 16,299 | | | | 14,060 | | | | 12,175 | |
| 126 | | | | 258 | | | | 104 | | | | 60 | | | | 59 | | | | 46 | | | | 68 | |
| 36 | | | | 20 | | | | 24 | | | | 15 | | | | 38 | | | | 32 | | | | 25 | |
| 440 | | | | 422 | | | | 266 | | | | 171 | | | | 199 | | | | 221 | | | | 261 | |
| 8 | | | | 32 | | | | 32 | | | | 5 | | | | 17 | | | | 25 | | | | 38 | |
| | 9,714 | | | | 10,573 | | | | 10,120 | | | | 9,708 | | | | 10,458 | | | | 10,427 | | | | 10,756 | |
| 9,238 | | | | 9,252 | | | | 9,328 | | | | 9,330 | | | | 9,104 | | | | 8,748 | | | | 8,209 | |

| | | | |
| | EDC Annual Report 2013 | | 145 |
TEN-YEAR REVIEW
Canada Account
| | | | | | | | | | |
Financial Arrangements Facilitated (in millions of Canadian dollars) | | 2013 | | | 2012 | | 2011 | |
Financing | | | | | | | | | | |
Direct financing | | | – | | | 1 | | | – | |
Insurance | | | | | | | | | | |
Credit insurance | | | 30 | | | 41 | | | 44 | |
Financial institutions insurance | | | – | | | – | | | – | |
Contract insurance and bonding | | | – | | | – | | | – | |
Political risk insurance | | | – | | | – | | | – | |
Subtotal | | | 30 | | | 41 | | | 44 | |
Total | | | 30 | | | 42 | | | 44 | |
Financial and Other Data | | | | | | | | | | |
Financing (in millions of Canadian dollars) | | | | | | | | | | |
Value of total loans and notes receivable | | | 2,821 | | | 3,164 | | | 3,442 | |
Value of undisbursed loans | | | – | | | – | | | – | |
Value of loan disbursements (net of guarantees) | | | – | | | – | | | 569 | (2) |
Value of liability on loan guarantees | | | 186 | | | 208 | | | 241 | |
Undisbursed amounts on loan guarantees | | | – | | | – | | | – | |
Amounts available for allocation | | | – | | | – | | | – | |
Loan amounts rescheduled | | | – | | | – | | | – | |
Number of transactions financed | | | – | | | – | | | – | |
Number of current lines of credit and protocols | | | – | | | – | | | – | |
Insurance (in millions of Canadian dollars) | | | | | | | | | | |
Value of liability on insurance and guarantees | | | 9 | | | 9 | | | 8 | |
Value of claims paid | | | – | | | – | | | – | |
Value of claims recovered | | | – | | | – | | | – | |
Value of claims outstanding at end of year | | | – | | | – | | | 13 | |
Number of policies issued | | | – | | | – | | | – | |
Number of insurance policies and guarantees in force | | | 1 | | | 1 | | | 4 | |
| (1) | Includes activity pursuant to the Softwood Lumber deposit refund mechanism transactions. |
| (2) | Includes amounts disbursed in conjunction with the Ontario Financing Authority relating to loans in the automotive sector. |
| | | | |
| 146 | | Turning the Corner on Trade | | |
| | | | | | | | | | | | | | | | | | | | | | | | | | |
| | | | | | | |
2010 | | | 2009 | | | 2008 | | | 2007 | | | 2006 | | | 2005 | | | 2004 | |
| | | | | | | |
| | 76 | | | | 14,222 | (2) | | | – | | | | 27 | (1) | | | 3,645 | (1) | | | 649 | | | | 987 | |
| | | | | | | |
| | 129 | | | | 628 | | | | – | | | | – | | | | – | | | | – | | | | – | |
| – | | | | – | | | | – | | | | – | | | | – | | | | – | | | | – | |
| – | | | | – | | | | – | | | | – | | | | – | | | | – | | | | – | |
| – | | | | – | | | | – | | | | – | | | | – | | | | – | | | | – | |
| | 129 | | | | 628 | | | | – | | | | – | | | | – | | | | – | | | | – | |
| | 205 | | | | 14,850 | | | | – | | | | 27 | (1) | | | 3,645 | (1) | | | 649 | | | | 987 | |
| | | | | | | |
| | 4,720 | | | | 5,905 | | | | 3,226 | | | | 2,765 | | | | 3,592 | (1) | | | 3,994 | | | | 3,786 | |
| 505 | | | | 607 | | | | 1 | | | | 2 | | | | 1,516 | (1) | | | 1,526 | | | | 2,368 | |
| 446 | (2) | | | 14,398 | (2) | | | – | | | | 31 | (1) | | | 3,647 | (1) | | | 650 | | | | 1,020 | |
| 295 | | | | 385 | | | | 457 | | | | 462 | | | | 535 | | | | 1,311 | | | | 1,341 | |
| – | | | | – | | | | – | | | | – | | | | 15 | | | | 59 | | | | 145 | |
| – | | | | – | | | | – | | | | – | | | | – | | | | 39 | | | | 52 | |
| 2 | | | | 1 | | | | – | | | | – | | | | 15 | | | | 41 | | | | 6 | |
| | 5 | | | | 16 | | | | – | | | | 27 | (1) | | | 803 | (1) | | | 37 | | | | 55 | |
| – | | | | – | | | | – | | | | – | | | | – | | | | 1 | | | | 2 | |
| | | | | | | |
| | 10 | | | | 120 | | | | – | | | | – | | | | – | | | | – | | | | – | |
| – | | | | – | | | | – | | | | – | | | | – | | | | – | | | | – | |
| – | | | | 11 | | | | 15 | | | | 8 | | | | – | | | | – | | | | – | |
| 13 | | | | 13 | | | | 22 | | | | 35 | | | | 44 | | | | 44 | | | | 44 | |
| | 1 | | | | 103 | | | | – | | | | – | | | | – | | | | – | | | | – | |
| 7 | | | | 53 | | | | 2 | | | | 2 | | | | 2 | | | | 4 | | | | 4 | |
| | | | |
| | EDC Annual Report 2013 | | 147 |
Glossary of Financial Terms
Actuarial Gains or Losses – Changes in the value of the defined benefit obligation and the plan assets due to differences between actuarial assumptions and what has actually occurred and due to changes in actuarial assumptions.
Actuarial Valuation (re: Pension Benefit Plans) – An assessment of the financial status of a benefit plan performed by an independent actuary. It includes the valuation of any plan assets and the defined benefit obligation using estimates of future events that will affect the costs and obligation for employee benefits plans.
Amortized Cost – The amount at which the financial asset or financial liability is measured at initial recognition minus principal repayments, plus or minus the cumulative amortization using the effective interest method of any difference between that initial amount and the maturity amount and minus any reduction (directly or through the use of an allowance account) for impairment or uncollectability.
Basis Point – One one-hundredth of a percentage point.
Contingent Liability – Potential debt which arises from past events and may become an actual obligation if certain events occur or fail to occur. Contingent liability is also referred to as insurance policies and guarantees outstanding.
Credit Risk – The risk of loss incurred if a counterparty fails to meet its financial commitments.
Defined Benefit Obligation – The actuarial present value, without deducting any plan assets, of expected future payments required to settle the obligation resulting from employee service in the current and prior periods.
Derivative Instruments – Financial contracts that derive their value from changes in interest rates, foreign exchange rates, credit spreads, commodity prices, equities, market indexes or other financial measures. Such instruments include futures, interest rate, foreign exchange, equity, commodity and credit default swaps.
Effective Interest Rate – The rate that exactly discounts estimated future cash payments or receipts through the expected life of the financial instrument or, when appropriate, a shorter period, to the net carrying amount of the financial asset or financial liability.
Exposure at Default – Generally represents the gross exposure – outstanding amount for on-balance sheet exposure and loan equivalent amount for off-balance sheet exposure.
Facultative Reinsurance – Reinsurance provided on a transactional basis.
Foreign Exchange Risk – The risk of potential adverse impact on the value of financial instruments resulting from exchange rate movements.
Gross Loans Receivable – Principal amounts outstanding under existing loan agreements.
Hedge – A risk management practice used to manage interest rate or foreign exchange exposures arising from the normal course of business operations.
Individually Impaired Loans – Loans where there is objective evidence that an impairment loss has occurred.
Interest Rate Risk – The risk that the fair value or future cash flows of a financial instrument will fluctuate because of changes in market interest rates.
LIBOR – London Inter-Bank Offered Rate – The interest rate at which banks in London are prepared to lend funds to first-class banks.
Loss Given Default – Measures the severity of loss on a facility in the event of a borrower’s default, expressed as a percentage of exposure at default.
Liquidity Risk – The risk that we would be unable to honour daily cash outflow commitments or the risk that we would have to obtain funds rapidly, possibly at an excessively high premium during severe market conditions.
Market Risk – The risk that the fair value or future cash flows of a financial instrument will fluctuate because of changes in market prices. Market risk comprises three types of risk: foreign exchange risk, interest rate risk and other price risk.
Net Finance Margin – Net financing and investment income expressed as a percentage of average income earning assets.
Net Financing and Investment Income – Revenue earned on financing, leasing, marketable securities and investment assets, less interest and leasing and financing related expenses.
Net Revenue – Net income excluding the provision for credit losses, claims-related expenses and administrative expenses.
Operational Risk – The risk of direct or indirect loss resulting from the organizational environment, external events, inadequate internal processes, people, or systems.
Performing Loans – Loans for which there is reasonable assurance that EDC can collect the principal and interest on time.
Productivity Ratio – Administrative expenses expressed as a percentage of net revenue excluding the unrealized gains and losses on long-term debt and derivatives as well as the impact due to fluctuations in the exchange rate from the rate projected in the Corporate Plan.
Probability of Default – Measures the likelihood that a borrower will default within a one-year time horizon, expressed as a percentage.
Projected Benefit Method Pro Rated on Services – An actuarial valuation method in which an equal portion of the total estimated future benefit is attributed to each year of service.
Structured Entity (SE) – An entity that has been designed so that voting or similar rights are not the dominant factor in deciding who controls the entity, such as when any voting rights relate to administrative tasks only and the relevant activities are directed by means of contractual arrangements.
Undisbursed Loan Commitments – A contractual amount under an existing loan agreement that has yet to be advanced to the borrower.
| | | | |
| 148 | | Turning the Corner on Trade | | |
Corporate Representation national International Head Office Mississauga Sao Paulo Russia Export Development Canada 1 City Centre Drive Consulate General of Canada Canadian Embassy 150 Slater Street Suite 805 Av. das Nações Unidas 12901 23 Starokonyushenny Pereulok Ottawa, ON Mississauga, ON Cenu Torre Norte, Andar 16° Moscow, 119002 K1A 1K3 L5B 1M2 CEP 04578-000 Russia Tel: 613-598-2500 Tel: 905-615-6470 São Paulo – SP, Brazil Tel: (011) 7-495-925-6095 Fax: 613-598-3811 Fax: 905-615-6471 Tel: (011) 55-11-5509-4320 Fax: (011) 7-495-925-5667 edc.ca Fax: (011) 55-11-5509-4275 Toronto Greater China Vancouver 155 Wellington Street Rio de Janeiro Canadian Consulate 1055 Dunsmuir Street Suite 3120 Canadian Consulate General ECO City Building Suite 400, Bentall Four Toronto, ON Av. Atlantic 1130, 13th Floor 8th floor, 1788 Nanjing Xi Lu – PO Box 49086 M5V 3H1 Copacabana Jing An District Vancouver, BC Tel: 416-349-6515 Rio de Janeiro, Brazil Shanghai, 200040 V7X 1G4 Fax: 416-349-6516 CEP 22021-000 China Tel: 604-678-2240 Tel: (011) 55-21-2295-0391 Tel: (011) 86-21-3279-2800 Drummondville Fax: 604-678-2241 Fax: (011) 55-21-2275-5735 Fax: (011) 86-21-3279-2801 1412 Jean Berchmans Edmonton Michaud Street Chile Canadian Embassy 10180-101 Street Drummondville, QC Canadian Embassy 19 Dongzhimenwai Street Suite 3400 J2C 7V3 Nueva Tajamar Chayoang District, Edmonton, AB Tel: 819-475-2587 481 – 12th floor Beijing 100600 T5J 3S4 Fax: 819-475-2408 North Tower China Tel: 780-801-5402 Las Condes Tel: (011) 86-10-5139-4126 Montréal Fax: 780-801-5333 Santiago, Chile Fax: (011) 86-10-5139-4463 800 Victoria Square Tel: (011) 56-2-652-3807 Calgary Suite 4520 India Fax: (011) 56-2-652-3808 308-4th Avenue SW P.O. Box 124 Canadian High Commission Suite 2403 Tour de la Bourse Peru 7/8 Shantipath Calgary, AB Montréal, QC Canadian Embassy Chanakyanpuri T2P 0H7 H4Z 1A1 Bolognesi 228, Miraflores New Delhi 110021 Photo credits: Tel: 403-817-6700 Tel: 514-908-9200 Lima 18, Peru India Fax: 403-817-6701 Fax: 514-878-9891 Tel: (011) 51-1 319-3385 Tel: (011) 91-11-4178-2288 Cover © Murat Taner/Corbis; Regina Québec City Fax: (011) 51-1 446-6257 Fax: (011) 91-11-4178-2607 pages 4, 6, 8 portraits © Martin Lipman / background © Masterfile; 1914 Hamilton Street 2875 Laurier Boulevard Mexico Indiabulls Finance Centre pages 10/11 © Martin Lipman; Suite 300 D-3, Suite 600 Canadian Embassy Tower 2, 21st Floor page 12 © Martin Lipman; page 13 (top, left to right) Regina, SK Québec, QC Calle Schiller 529 Senapati Bapat Marg © OmegaTransFer/iStock, © Kurt S4P 3N6 G1V 2M2 Rincón del Bosque Elphinstone Road (West) Drubbel/iStock, © hopsalka/iStock; Tel: 306-586-1727 Tel: 418-577-7400 Colonia Polanco Mumbai 400 013 page 13 (bottom, left to right) Fax: 306-586-1725 Fax: 418-577-7419 México, D.F. 11560 India courtesy of Tonic Life; Winnipeg Ville Saint-Laurent Mexico Tel: (011) 91-22-6749-4480 page 14 (top, left to right) courtesy of Vast Studios, © Steve Hix/Somos Tel: (011) 52-55-5387-9316 Fax: (011) 91-22-6749-4481 Commodity Exchange Tower 9900 Cavendish Boulevard Images/Corbis, © heshphoto/Corbis Fax: (011) 52-55-5387-9317 (computer screen insets courtesy 360 Main Street Suite 201 Singapore of Vast Studios; Suite 2075 Saint-Laurent, QC Consulate of Canada Canadian High Commission page 14 (bottom, left to right) Winnipeg, MB H4M 2V2 Torre Gomez Morin 955 One George Street, #11-01 © Cristian Baitg/iStock, courtesy R3C 3Z3 Tel: 514-215-7200 Piso 4, Suite 404, Col. Singapore 049145 of OMG’s, © Martin Lipman; Tel: 204-975-5092 Fax: 514-215-7201 Montebello Tel: (011) 65-6854-5949 page 15 (top, left to right) courtesy of Fax: 204-975-5094 Halifax San Pedro Garza Garcia, N.L. Fax: (011) 65-6854-5848 SUPCO Canada Railway Supply Corp; page 15 bottom, left and right Mexico, CP, 66279 Windsor Suite 1605 United Arab Emirates courtesy of Helm Operations, Tel: (011) 52-81-8378-0240 top right © Masterfile; 3270 Electricity Dr. 1969 Upper Water Street, Consulate of Canada ext. 3360 page 16 © Dinodia; Suite 209 Tower 2 Jumeirah Emirates Towers Fax: (011) 52-81-8356-9965 page 17 (left to right) © Walker Industrial Park Halifax, NS Business Tower, 19th Floor Windsor, ON B3J 3R7 Germany Sheikh Zayed Road ImagesBazaar/Alamy, © Danita Delimont/Alamy, © Reuters/Stringer N8W 5J1 Tel: 902-450-7600 Consulate of Canada – Dubai, United Arab Emirates India, © REUTERS/Vincent Kessler; Tel: 519-974-7674 Toll-free: 888-332-3343 Düsseldorf Tel: (011) 971-4-404-8444 page 18 © ssuaphoto/iStock; page 19 (left to right) courtesy of Fax: 519-974-9753 Fax: 902-450-7601 Benrather Strasse 8 Bogotá Biorem, © Jonutis/iStock, courtesy 40213 Düsseldorf of Biorem; London Moncton Embassy of Canada Germany page 20 courtesy of Bombardier; 148 Fullarton Street 735 Main Street Carrera 7 #114 – 33 Piso 14, Tel: (011) 49-0-211-17217-45 page 21 (left to right) © Ian Lishman/ Suite 1512 Suite 400 Bogotá, Colombia Juice Images/Corbis, © 77studio/ Fax: (011) 49-0-211-17217-80 London, ON Moncton, NB Tel: (011) 57-1-657-9800 iStock, © Monty Rakusen/cultura/ N6A 5P3 E1C 1E5 Turkey Fax: (011) 57-657-9915 Corbis; Tel: 519-963-5400 Tel: 506-851-6066 Consulate of Canada page 24 © Martin Lipman; page 32 © Andrea Rodriguez; Fax: 519-963-5407 Fax: 506-851-6406 209 Buyukdere Caddesi page 35 © Bruce Dunlop, Claudia Tekfen Tower – 16th Floor Verno, Andrea Rodriguez; St. John’s Levent 4, Istanbul page 44 © Stephen Fenn; 510 Topsail Road 34394 Turkey page 84 © Stephen Fenn. St. John’s, NL Tel: (011) 90-212-385-9700 A1E 2C2 Fax: (011) 90-212-385-9715 Tel: 709-772-8808 Fax: 709-772-8693 FSc loGo PlaceD Here PleaSe FSC LOGO PLACED HERE PLEASE Ce document est également disponible en français. Printed in Canada.

EDC is the owner of trademarks and official marks. Any use of an EDC trademark or official mark without written permission is strictly prohibited. All other trademarks appearing in this document are the property of their respective owners. The information presented is subject to change without notice. EDC assumes no responsibility for inaccuracies contained herein. Copyright © 2014 Export Development Canada. All rights reserved. Canada EDC