EXHIBIT 99.3


At Export Development Canada (EDC), we measure success one way: our impact in helping Canadian companies compete and win in an increasingly complex trade environment.
Did we help companies find success in international markets? Did we manage our resources – our knowledge, our capital, our products – to maximum effect? Did we bring creativity to the solutions Canadian exporters need?
Broadly speaking, this annual report is intended to answer those questions. And for 2016, the answer to each was a solid yes. By most measures, last year was very successful for EDC: we set corporate records for supporting cleantech companies, providing growth capital for small businesses, and financing for small and medium enterprises. Our products and programs helped Canadian companies gain access to global supply chains, connect with foreign buyers, manage risk, access capital, and explore new markets.
But even against that backdrop, 2016 was a success for another reason. It was the year we determined that we could do better, and where we asked ourselves if we could create even more impact than we already have. The answer we arrived at (again) was yes.
In 2016, we challenged ourselves by asking the most fundamental questions: What does success really look like? What would make EDC more relevant to our customers? Where are we falling short and what can we do about it? Can we help more companies find new markets, and in this way contribute to building a bigger, stronger, and more sustainable Canadian economy?
The answer to these questions begins, in part, with our new corporate vision: EDC is the leader in helping every Canadian company go, grow, and succeed internationally.
It’s a big, ambitious vision for our organization’s future. We hope that as you read this annual report you’ll get a clear sense of the impact EDC had last year, and also the potential impact we can bring to exporters in the years ahead.
Key Performance Indicators
Performance Measures
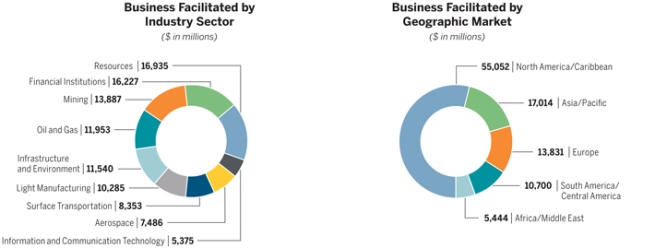
Highlights by Sector and Market
2016 Highlights
Message from the Chair
Over the past year, the global economy continued to experience volatility and Canadian companies endured uncertainty as they contemplated pursuing opportunities abroad. With a downturn in commodities that has yet to fully rebound and seemingly louder voices opposed to trade and globalization, it’s easy to conceive of a new trade paradigm riddled with complex challenges and barriers. And yet, Canada is a nation that has historically relied on trade to drive economic growth.
What does this all mean? While the Canadian economy faces challenges ahead and trade is ever-evolving, there are still business opportunities for Canadian companies that can adapt to these realities. There are many paths to export success, but businesses – particularly small- and medium-sized enterprises (SMEs) – will need more help than ever to navigate their export journey and find their way to foreign buyers and global supply chains.
In 2016, EDC continued to help ensure that Canadian businesses were aware of the benefits of exporting, that they could access the products and services they needed to succeed internationally, and that they had new opportunities to expand beyond their traditional markets. However, as Canadian companies must adapt to be successful traders in today’s world, so must we as Canada’s export credit agency. EDC has a significant role to play in ensuring that all Canadian companies remain well positioned to compete globally. We need to focus on the evolving needs of our customers, particularly SMEs.
The Board has been involved in, and supportive of, EDC’s new business strategy that will focus on serving more Canadian exporters by exploring new ways to
respond to their broad spectrum of needs. In addition to our financing, insurance, and bonding solutions that mitigate the risk associated with exporting, we will be doing more to build awareness and provide our knowledge, expertise, and connections to help more Canadians find success in exporting. This means we must engage companies much earlier in their exporting journey, whether they are getting ready to export or are just considering it for the future of their business.
Now is a good time for change and to strive for new goals. EDC’s shareholder is pursuing a progressive and inclusive trade agenda. We will be actively supporting its commitment to free trade and will help raise Canada’s profile globally. In addition to the free trade agreements already in place, Canadian companies stand to benefit significantly from new agreements on the horizon, such as the Comprehensive Economic and Trade Agreement (CETA). These can help to further reduce barriers and offer greater access to international markets. Helping to grow Canada’s export potential is a collaborative effort that will require cooperation among all government players, as well as stronger relationships with a broader set of stakeholders.
This effort will also require the continuance of strong management and performance by EDC. As Chair, I would like to thank my colleagues on the Board for their commitment and guidance to help ensure EDC’s strong corporate governance. More specifically, their support of EDC’s transformation in enterprise risk management (ERM) will help ensure that the risks we take in pursuit of our business objectives are effectively managed and governed.

| | |
In 2017, we will be implementing a major component of our ERM program – the Three Lines of Defence (3LD) model, which bolsters our risk management capacity across the organization. This new model will help ensure that we have the appropriate checks and balances in place and conduct our business in a manner similar to leading financial institutions. With better clarity on our risk appetite, we will have more flexibility to serve even more Canadian exporters and investors. On behalf of the Board, I would also like to express my gratitude to our executive management team for their continued leadership and vision. Despite another year of economic and geopolitical volatility, the team led EDC to strong results in 2016, especially in terms of supporting more SMEs, business in emerging markets, and supporting | | foreign investment. This success should also be attributed to EDC’s 1,400 employees around the world, who pushed through 2016 with great skill and tireless efforts to help stretch our capacity as a leader in exports and trade. As Chair of EDC’s Board for the past three-and-a-half years, I am confident in our ability to help grow Canada’s export potential over the long-term. The importance of international trade for Canada’s economy only grows, and so do the opportunities for Canadian companies to expand their business and find success in new markets. Now is also the time to focus on how EDC will grow to ensure we fulfil the various export needs of Canadian companies so that they are ready to respond to calls for Canadian capabilities and expertise around the world. |
Message from
the President and CEO
EDC’s customers continued to engage in trade and make investments outside Canada in 2016 despite headlines that suggested a global slowdown in trade-related activity. Leveraging EDC’s unique financial, risk, and trade expertise allowed these companies to boldly pursue new opportunities in a volatile world and generate successful outcomes for their international business.
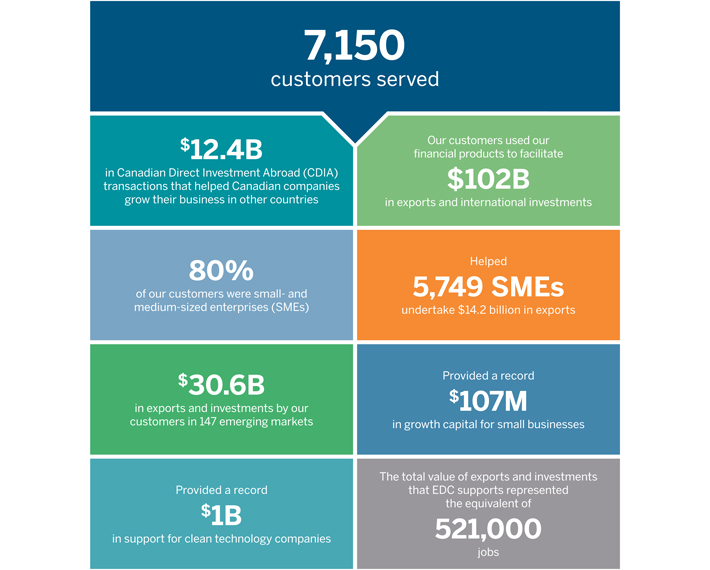
Our small business customers used a record $107 million of EDC’s growth capital products. For those companies requiring working capital solutions, we provided more than $550 million in direct financing for small- and medium-sized companies – a 166 per cent increase over the previous year. In addition, EDC provided more than $1 billion though our export guarantee program, which helps smaller companies to develop new markets, increase their productivity, or to make international investments.
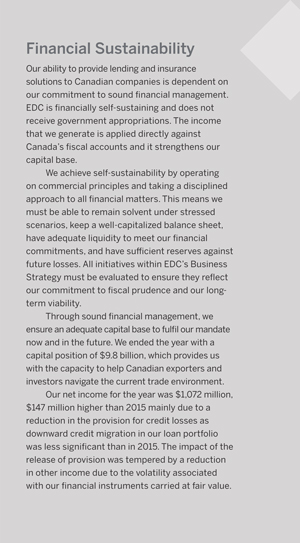
While helping our customers in 2016, EDC also took care of the fundamentals – the business essentials that protect our sustainability as a commercial operation. We generated a net income of $1.07 billion, reflecting a well-managed and profitable portfolio supported by a strong capital position of $9.8 billion. Our productivity ratio ensured that just 27 cents of every dollar we earned went to pay our expenses, while the remaining 73 cents was available for reinvestment in what is most important to us – doing more to help Canadian companies take advantage of trade opportunities. EDC’s prudential business model also provides a financial benefit for our Shareholder, the Government of Canada, through the payment of a $786 million dividend for the 2016 calendar year.
This was also a year in which EDC helped to expand Canada’s global brand, opening new representations in London and Jakarta. We also added our first standalone, wholly-owned branch in Singapore, which is capable of underwriting financial transactions in market to better support the growing business of Canadian companies in one of the world’s most vibrant economic regions.
The achievements of 2016 tell a story about the kind of impact that EDC had helping Canadian exporters find international success, and I hope you’ll take the time to explore all of it in this annual report. But not everything that EDC accomplished last year can be captured on a map or spreadsheet.
In 2016, we devoted significant time and resources to building a better understanding of the marketplace. We studied the journey Canadian companies go through as they evolve from playing exclusively in a domestic market to becoming trade-ready businesses. Our objective was to get a clearer picture of what companies really need, unrelated to the solutions that EDC currently offers. What are the non-financial hurdles that companies face and what information do exporters need? What type of connections help companies take their products or services to international markets?
That, naturally, led to an analysis of our own organization – areas of focus, operational model, and definition of success. In truth, this kind of continuous improvement is an approach that EDC has been practicing for years. But what defined 2016 were the steps taken to reshape EDC’s business, including a corporate-wide reorganization currently underway that responds directly to what we have learned about the exporter journey. It’s a reshaping of our business that we

| | |
believe will grow EDC’s ability to have a greater impact on more Canadian companies, which is captured in our new corporate vision statement: EDC is the leader in helping every Canadian company go, grow, and succeed internationally. It’s a bold aspiration, rooted in and inspired by the many success stories captured in this report. Canada needs more of them, and EDC will play a leading role in helping Canadian companies generate more trade business. EDC’s success is built on the dedication of its employees who, every day, bring skill, creativity, and energy to our mandate of expanding the | | impact of Canadian businesses around the world. They are the people who made such a difference for so many Canadian companies in 2016, and will continue to make a difference in the years to come. I’m also proud of how they help those companies, bringing the highest ethical standards and a culture of corporate social responsibility to every transaction. Ultimately, the achievements you will read about in this annual report are their achievements, the women and men of EDC. It is a privilege to work with them all. Together, we’ll continue our work of bringing more of the benefits of international trade home to Canada ... and bringing more of Canada to the world. |
EDC Annual Report 2016 11
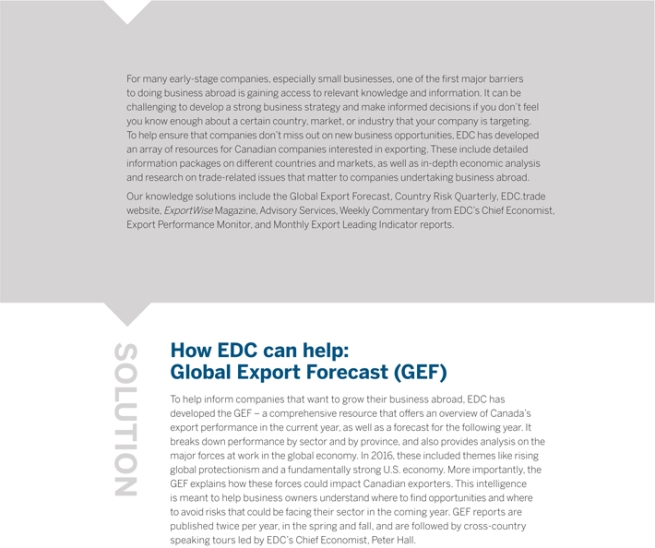
How to gain
knowledge to inform
business strategy

|
LED Roadway Lighting According to Peter Conlon, CEO of Halifax-based LED Roadway Lighting, there are two essential qualities a business needs to succeed internationally – courage and patience. His innovative company, which designs and manufactures LED-based roadway and infrastructure lighting products, has demonstrated both qualities and today they’re illuminating streets, buildings, and bridges in 60 countries around the world. When Conlon talks about the courage needed to export, he doesn’t mean it in the sense of taking a blind leap beyond our borders and hoping for the best. He insists that knowledge is essential because the more informed you are, the more confidence you have to make a bold move. He also says that when the going gets tough, understanding of global economic trends and awareness of market forces can help a new exporter make patient, measured choices that keep their export journey on track. Conlon credits EDC’s Global Export Forecast with providing that knowledge piece that is so crucial to success. Not only does it provide important numbers like forecasts for the CAD/USD exchange rate, or expected GDP growth in key emerging markets, it puts those numbers into context, making them tangible and relevant for Canadian businesses in all sectors. |
EDC Annual Report 2016 13
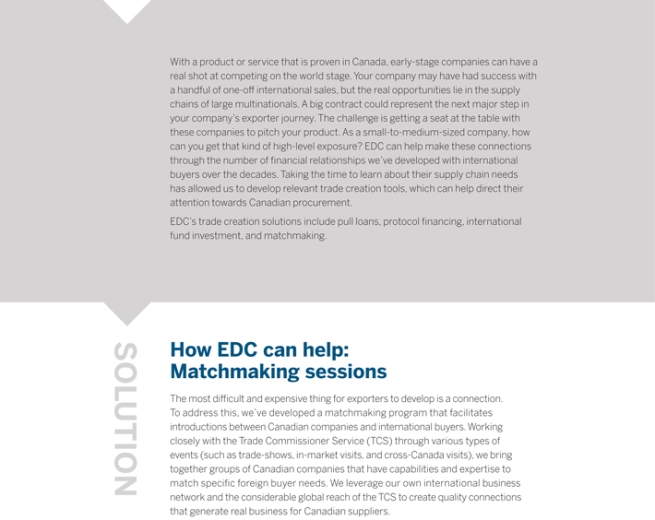
How to make
connections with
new foreign buyers

|
Vizimax People all over the world rely on energy – a lot – and that demand is growing by the day. Recognizing this undeniable trend, Longeuil, Quebec’s Vizimax came up with innovative solutions to optimize how energy companies generate, move, and consume energy. Vizimax products can be used in different industries, from electric utilities to railway infrastructure. Since the desire for energy efficiency is global, they’ve been able to sell their technology all over the world. EDC supported a number of those sales and recognized the expertise that Vizimax had to offer. When EDC was planning a trade mission to Chile in 2015 along with the TCS (focused on smart electric grid technology), Vizimax was invited along. While in Chile, they sat down with Conecta, a large Chilean energy company that deals in power systems and smart grids. Eighteen months later, that introduction translated into new business for Vizimax, as Conecta chose the Canadian company’s patented technology for two major projects it was working on. EDC recognizes that connections drive business, which is why we’re making our business more about connections. |
EDC Annual Report 2016 15
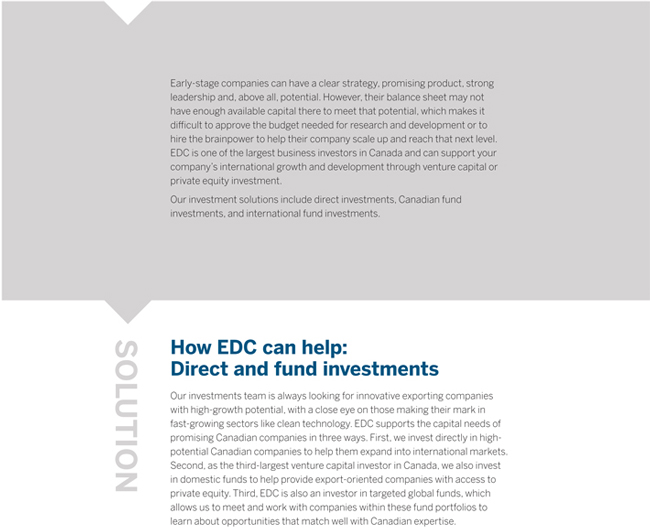
How to access
capital to grow
your business

|
ecobee Inspired by ideas to reduce his family’s energy use, engineer Stuart Lombard formed ecobee – a clean technology company that launched the first WiFi-connected thermostat in 2009. Since then, the company has experienced rapid growth, with its customers across North America saving on energy bills and experiencing unparalleled comfort with ecobee’s innovative product. With sales more than doubling each year, the Toronto-based company has become a global leader in the emerging thermostat market, second only to Nest – a company acquired by Google in 2014. Stirred by increasing competition from much larger companies, ecobee’s growth strategy continues to focus on innovation, while also improving the customer experience and building its brand. This past year, EDC played an important role in helping ecobee execute on its plans. Our commitment to ecobee, working with other co-investors like Amazon, is designed to help boost the company’s international sales. |
EDC Annual Report 2016 17
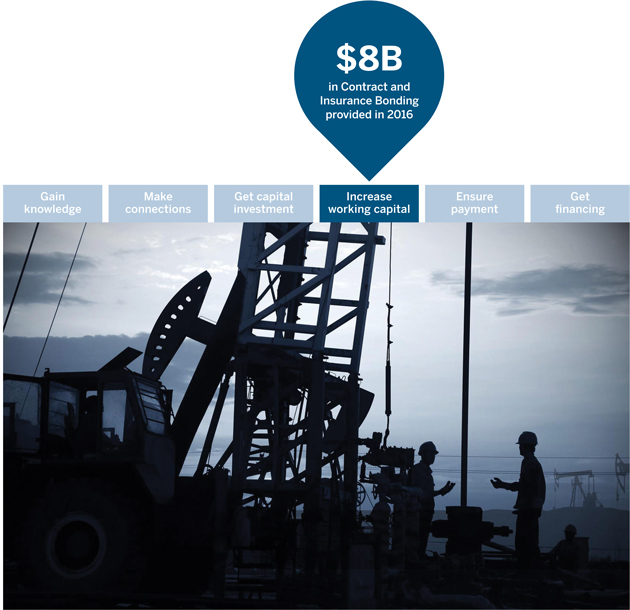
How to increase
your working capital

|
International Frontier Resources Corporation Calgary-based International Frontier Resources Corporation (IFR), a Canadian oil and gas exploration and production company, took a big export step in 2014 – they decided to look beyond Canada and the U.S. to pursue opportunities in Mexico. They did so following an announcement by the Mexican government in 2013 that the country would start undergoing significant energy reforms, including partially opening the country’s untapped oil reserves to foreign investment. As part of IFR’s Mexico focus, a new team of energy professionals from Calgary with experience in the latest oilfield drilling and completion technologies joined the company. IFR also formed a strategic joint-venture with a Mexican petrochemical leader. With that partnership in place, IFR was able to secure a contract to explore one of the oil fields made available by the reforms. One requirement for the contract, however, was a U.S. $1.76 million performance bond to guarantee a minimum amount of work would be done on the newly acquired oil field. EDC was able to guarantee this bond by providing IFR with an APSG. The APSG unlocked capital for IFR that would have otherwise been tied up in the bond, which they can now leverage to seek out more business and accelerate their growth in the promising new market. |
EDC Annual Report 2016 19
How to make sure
you get paid by a
new foreign buyer

|
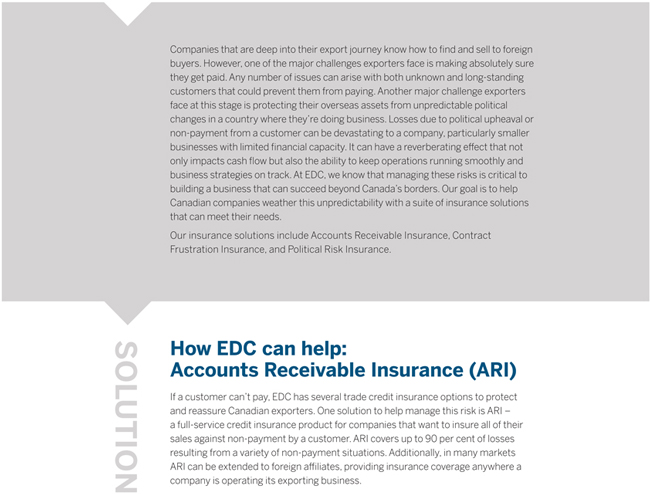
AGT Many people don’t know that Canada is the second biggest producer of pulse crops in the world. High-quality superfoods like lentils, peas, and beans leave our borders in heaps, and there’s one company that’s supplying the world with a ton of them – Regina, Saskatchewan’s AGT Food and Ingredients (AGT). Founded in 2007, AGT has undergone rapid growth through acquisitions and international investment. In 2010, the company had nine facilities in two countries. Today, it has 41 across five continents. EDC became involved with what is now AGT in 2002, when it was still a small company named Saskcan Pulse Trading. One of the tools that helped the company along its export journey was EDC’s ARI. By insuring its sales, other financial institutions were more willing to lend AGT money because they knew it would be getting paid, regardless of whether customers defaulted. AGT then used this extra capital to grow its business in size and global reach. The proof, as they say, is in the pulses: in 2003, EDC insured U.S. $11-million worth of AGT’s exports. In 2015, that number was just under U.S. $1 billion. |
EDC Annual Report 2016 21
How to get reliable
financing for your
international business
|
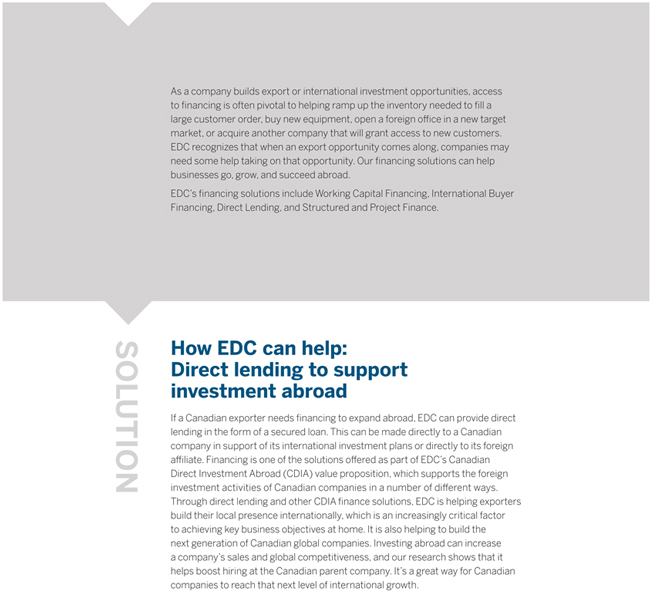
LCI Education Network The export journey is unique for all companies, and that’s especially true for LCI Education Network. Since it was founded in 1959, the Montreal-based organization has developed a vast network of post-secondary institutions focused on creative and management fields, but it was only after 30 years in business that it opened its first international campus in Casablanca, Morocco. After finding success there, it began expanding to new campuses all over the world. Today, LCI is exporting its top-tier education to thousands of students spread out over 22 campuses in 12 countries. Part of its expansion plan was to purchase campuses in order to avoid the complications of renting properties in different markets. The trade-off, however, was significant upfront expenses. EDC was able to support LCI’s strategy, providing it with direct financing for its investments abroad. EDC’s loans helped LCI purchase a campus in Bogota, Colombia, and another in Melbourne, Australia, which officially opened its doors in 2016. With this international expansion, LCI has become one of the most widespread academic networks in the world. |
EDC Annual Report 2016 23
EDC Annual Report 2016 25

Business Measures
Total Business Facilitated
$102B  -2%
-2%
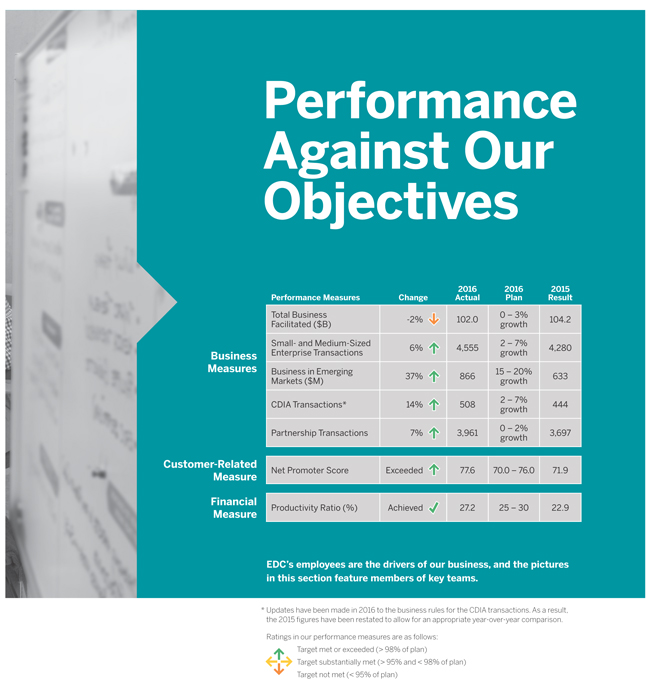
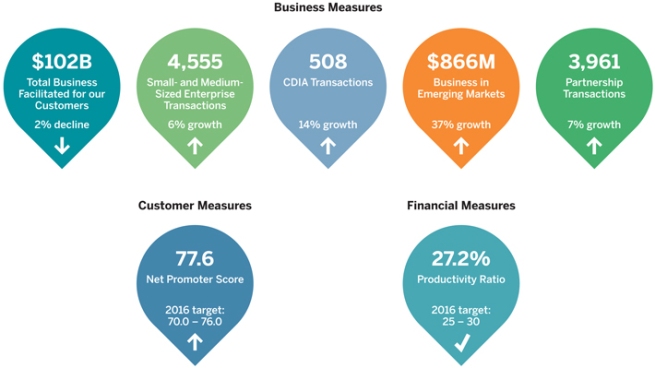
Through our financial solutions, our customers’ exports and investments totalled $102 billion, slightly down from $104 billion in 2015, mainly as a result of decreases across our insurance products.
Through all of our insurance products, we helped 5,400 clients undertake more than $73 billion in export sales with about 87,000 buyers in almost every country in the world. EDC’s insurance products help companies mitigate credit risk and leverage their receivables with financial institutions to unlock more short term financing. EDC earned $192 million in premiums for coverage under all our insurance products and paid out $110 million in claims, compared to the $143 million paid out in 2015.
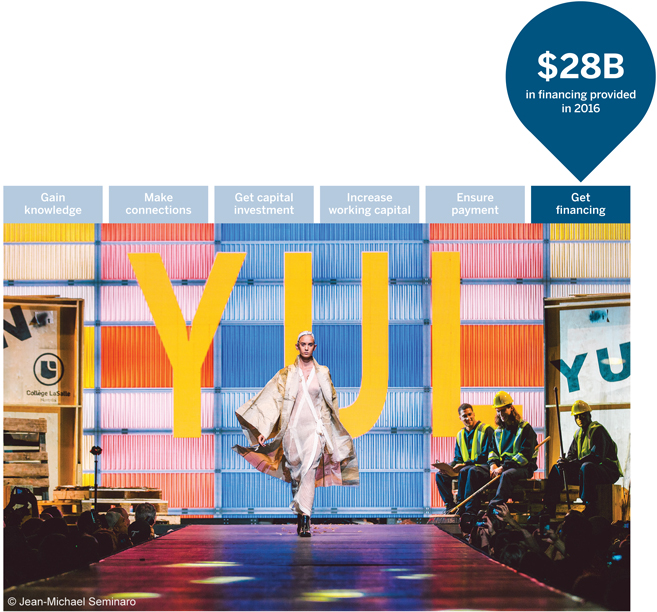
In addition, our financing activities delivered a record of $28 billion in loans to Canadian clients and their foreign trading partners. We earned more than $1.8 billion in loan revenue and guarantee fees, which was aided by higher interest rates and growth in our loan portfolio in 2016.
Small- and Medium-Sized Enterprise Transactions
4,555  6%
6%
SMEs are important contributors to Canada’s economy. A key measure of our corporate success is our ability to help SMEs (companies with sales under $50 million) export and expand to new markets. We accomplish this through our financing and insurance solutions, as well as leveraging our relationships with foreign buyers to encourage the purchase of Canadian goods and services and to introduce SMEs into their supply chains.
To track our efforts, we look at the number of insurance and financing transactions that occur in a calendar year. In 2016, we facilitated 4,555 transactions, up from 4,280 the previous year. Our customers expect fast, simple, and predictable services, as well as the ability to access from anywhere at any time. With these expectations in mind, we embarked on several initiatives tailored to SMEs. This includes the nationwide launch of Select Credit Insurance in 2015. This online, self-service product is geared toward small businesses, providing them with selective sales coverage in minutes. By the end of 2016, this insurance product covered 346 transactions, which is a 55 per cent increase from 2015. This is a good sign our SME customers value this type of coverage. Similarly, more SMEs used our Export Guarantee Program, which hit a record of $1 billion in 2016.

Business in Emerging Markets
$866M 37%
In 2016, EDC saw significant growth in emerging markets, which represented 30 per cent of the business EDC supports – up from 28 per cent in 2015.
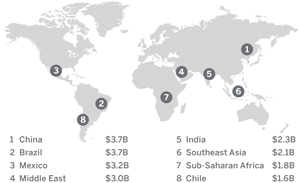
Our customers used EDC’s products and services to support $30.6 billion of their emerging market business, a five per cent increase over 2015. That business generated $866 million in revenue for EDC, up 37 per cent from the previous year. Our financing activities in emerging markets reached $8.7 billion in 2016, up 23 per cent from 2015.
To help grow Canada’s footprint in key markets, EDC opened permanent representations in London, U.K., and Jakarta, Indonesia, bringing our total to 19 locations in 14 countries. EDC also opened our first full service foreign office in Singapore, where we can complement our business development efforts with onsite underwriting of financing products. This will help EDC be more competitive and provide faster turnaround times in supporting Canadian companies and their Asian buyers throughout the region.
Business Facilitated in Emerging Markets in 2016
Canadian Direct Investment
Abroad (CDIA) Transactions
508 14%
In an integrated global economy, having a local presence in foreign markets is key to achieving the business goals of Canadian companies. That’s why we offer a range of solutions to assist Canadian companies with their foreign investment activities. These include loans to help companies open facilities in new markets or participate in joint ventures. These also include insurance products to mitigate risks, such as a customer’s refusal to pay a foreign affiliate or a government taking possession of a Canadian company’s overseas equipment or facility.
CDIA continues to contribute to the strength of Canadian companies at home, and supporting CDIA transactions has become an integral part of our core business. In fact, Canadian companies now generate almost as many sales via their affiliates every year as they do directly from their Canadian exporting operations.
In 2016, we facilitated 508 transactions for our customers’ investment activities abroad, up from 444 last year. This growth was primarily due to increased demand for our financing solutions like the Export Guarantee Program (EGP). We continue to grow the EGP through nationwide awareness campaigns with banks. Additionally, an improved U.S. economy led to more demand for EGPs from EDC’s customers in the light manufacturing sector.
EDC Annual Report 2016 27

Partnership Transactions
3,961 7%
EDC is committed to working with the private sector to ensure Canadian companies have access to the financial services they need to go, grow, and succeed internationally. We believe that combining our expertise with financial institution partners is an effective way to expand our reach and serve more Canadian exporters. This involves complementing the activities of financial institutions such as banks, insurance companies, sureties, and brokers, depending on the level of private sector capacity.
In 2016, the number of transactions we undertook with financial partners reached 3,961 – a 7 per cent increase compared to 2015. This growth was primarily due to increased demand for products within our guarantee solutions. Through these solutions, EDC shares the risk and security with our financial partners to encourage them to increase their lending, particularly to SMEs.
Customer Measures
Net Promoter Score
Exceeded target 77.6
The Net Promoter Score (NPS) is the measure EDC uses to determine customer satisfaction and improve the customer experience. It is a way of understanding and delivering on what our customers want.
This metric is based on a single question we ask our customers in a survey: “On a scale of 0 – 10, with 0 being not at all likely and 10 being extremely likely, how likely is it that you would recommend EDC to a colleague who is also an exporter?” The NPS is calculated by subtracting the percentage of customers who are “Detractors” (0s to 6s) from the percentage of customers who are “Promoters” (9s and 10s).
EDC is an industry leader – historically our NPS is among the top 10 per cent of North American B2B companies. This year is no exception with a NPS of 77.6 – our highest score since we started using this metric. This strong result refiects our maturity in understanding communications as a key driver of our NPS. Our sales force increased its communication efforts this year with the goal of acting more effectively on customer feedback, which resulted in an improved customer experience.

Financial Measures
Productivity Ratio
Achieved  27.2%
27.2%
The Productivity Ratio (PR), the ratio of administrative expenses to net revenue, captures how well we use our resources and ultimately manage our costs. In 2016, our PR was 27.2 per cent and was within our targeted range for the year of 25 to 30 per cent. This PR means that 27.2 cents of every dollar we earn goes to pay our expenses, and the other 72.8 cents is available to grow our capital base and support our loan and insurance portfolios. While our PR was less favourable than the 2015 PR of 22.9 per cent, 2016 saw significant investments in our business. These initiatives are necessary to fulfill our mandate of supporting Canadian exporters, including a large-scale transformation effort to modernize our systems and the build out of our enterprise risk management (ERM) framework. As a result of these investments, we experienced an increase in administrative expenses in 2016.
EDC Annual Report 2016 29
EDC Annual Report 2016 31
|
Innovating for Canadian Companies |
We are developing solutions that fit the nature of trade today. As we adjust to the changing needs of our customers, sometimes we adapt or stretch the parameters of our existing solutions to support them in new ways. In some cases we try new and different approaches that have never been done before. Our support for Shopify and IL&FS are just two examples of the creative, novel thinking we provide to help more Canadian companies export.

Shopify
As a leading Canadian e-commerce company, Shopify knows what it takes to support small business growth. With its headquarters based in Ottawa, the technology company’s innovative software helps businesses manage sales across multiple channels, including web, social media, marketplaces, and brick-and-mortar locations. Shopify’s platform has helped businesses of all sizes scale up, serving customers in approximately 150 countries worldwide.
In 2016, EDC worked with Shopify to insure merchant cash advances offered by Shopify Capital – a new division the company launched to address the cash-flow needs of their small-business customers. With Shopify Capital, businesses can complete a few simple steps to secure tailored financing options that can help spur their growth. By supporting this new division of Shopify, EDC is not only helping one of Canada’s corporate champions grow, but also contributing to a broader shared goal: to help more SMEs get the financing they need to go global.
IL&FS
This past year, EDC completed a landmark financial transaction in India, which remains a strategic market and one of the bright spots in the still-volatile global economy. In November 2016, EDC disbursed the first-ever Indian rupee-denominated loan (also referred to as a Masala loan) by a foreign financial institution, providing Infrastructure Leasing & Financial Services (IL&FS) with INR 3.2 billion in financing. As one of the leading infrastructure and development companies in India, IL&FS is able to use this financing to develop critical infrastructure improvement projects across the country using Canadian suppliers. This also marked the company’s first financing from a Canadian institution.
With its unique structure, the Masala loan eliminates currency risk entirely and allows IL&FS to deploy the funding as it sees fit, without needing to convert dollars into rupees. Building on more than 30 years of experience in India, EDC is committed to supporting more Indian companies in their currency of choice, with the goal of facilitating more business with Canada.

A shared priority
As one of the fastest-growing sectors, cleantech offers significant economic opportunities for Canada. Companies in this sector use proprietary technology in innovative ways to directly reduce negative environmental impacts, or create net positive ones. Cleantech as a whole generated $11.7 billion in annual revenues and directly employed more than 55,000 Canadians in 2014. If properly supported, companies in this sector can help contribute to Canada’s key priorities on many fronts.
While 87 per cent of Canadian cleantech companies are currently exporting, there is an opportunity for Canada to have a much larger share of the massive global market, which was estimated at close to U.S. $1 trillion in 2014. However, access to financing can often be a significant limiting factor, especially for high-growth companies in this space.
We have been actively supporting Canadian cleantech companies since 2012, when we began a focused effort to help catalyze the cleantech space. As a result of this experience, we are more acutely aware of the international opportunities for Canadian companies and the challenges they may face along their export journey. Since then, we’ve continued to grow our portfolio of customers in this sector year after year. In 2016, we supported more than 120 Canadian cleantech companies – a 36 per cent increase over 2015 – and facilitated a record of $1 billion of their business.
Doing more where it matters
Over the years, we’ve focused on responding to the needs of cleantech companies, which has led us to work with companies in earlier commercialization stages. Reflecting on our experience and success, this past year we updated our cleantech strategy to ensure that we continue to advance the Canadian cleantech ecosystem.
As part of Canada’s Cleantech Working Group, we have been collaborating with our partners at the Business Development Bank of Canada (BDC), Sustainable Development Technology Canada (SDTC), and Global Affairs Canada to focus on how we can work together to provide enhanced support to the sector.
At EDC, we will play a leading role in providing financial services to the Canadian cleantech sector. Moving forward, we will also be taking the necessary steps to ensure that the most relevant solutions are in place to serve more cleantech companies and increase the volume of business we support.
Canadian success stories
There is a wide range of industries in the cleantech sector. Many innovative, export-oriented companies draw on Canada’s strengths in power generation, energy infrastructure, energy efficiency, and water and wastewater. The following three success stories are good examples of how EDC can support this sector.
EDC Annual Report 2016 33
| | | | |
 | | | | Temporal Power Mississauga-based Temporal Power uses its leading-edge technology to deliver a highly efficient, renewable energy storage solution. The company is helping to improve power quality, maintain grid stability, and balance energy on power systems. After signing a contract with the Aruba government, Temporal Power sought support from EDC to help navigate the unfamiliar banking, legal, and construction regulations. EDC provided bonding solutions that allowed the company to take advance payments from customers, freeing up its capital to help fund the project and pay suppliers. |
| | | |
| | | | |
 | | | | Green Power Labs Based in Dartmouth, Nova Scotia, Green Power Labs is a leading developer and service provider for predictive energy management solutions. With over 13 years of operational experience, the company uses predictive analytics and controls to provide critical weather and energy data for building and grid operations in real time. It then uses this data to optimize building energy performance, as well as improve energy consumption, generation, and storage. These innovations also help reduce energy use, costs, and carbon footprint. This past year, Green Power Labs relied on EDC’s knowledge for insight on the German and Indian markets, as well as products to reduce the risk of managing foreign accounts receivable. |
| | | |
| | | | |
 | | | | Electrovaya As a leading developer and manufacturer of lithium-ion battery power solutions, Electrovaya has been an export- focused company since its founding in 1996. With its advanced technology, Electrovaya supplies solutions for clean transportation and renewable energy applications in the automotive, aerospace, and personal electronics sectors. As more countries look to mitigate the effects of climate change, the competitive global market for lithium-ion batteries will continue to grow. Electrovaya’s purchase of a large manufacturing plant in Germany helped boost the company’s exports. To help provide Electrovaya with access to working capital, EDC partnered with the company’s bank through the Export Guarantee Program (EGP). Additionally, EDC insured contracts for the company with Accounts Receivable Insurance (ARI), which provided increased margining and, in turn, additional access to working capital. |
| | | |

London
With the official opening of a new representation in London in September 2016, EDC has further bolstered its position to support Canadian companies in one of the largest markets for trade and investment. Even with the uncertainty emerging in the wake of Brexit, the U.K. remains one of the most accommodating business environments, and the largest destination for Canadian direct investment in Europe. With CETA moving forward, Canadian companies will benefit even more from our London representation as a gateway to the rest of Europe.
In 2016, EDC supported approximately $3.1 billion in total business volume and just over $1 billion in financing in the U.K., serving 584 Canadian customers. For Western Europe, these volumes extend to $10.8 billion in total business, $4.5 billion in financing and 1,283 total customers served.
Connected by strong historic and cultural ties with the U.K., Canada will have strong opportunities in the future, especially for export-minded companies from a diversity of sectors, such as cleantech and renewable energy, metals and mining, infrastructure, and transportation. As a global financial centre that is home to many multinationals, London also offers a gateway to opportunities in different markets across Europe. More broadly, London can provide access to the supply chains in emerging markets and is often the place of choice for raising capital for companies operating in these regions.
|
EDC in the United Kingdom › 584 Canadian companies assisted › $3.1 billion in business volume |
Opening the door for Canada’s oil and gas sector
In 2016, EDC committed $50 million in a credit facility for Lundin Petroleum – a Swedish oil and gas exploration and production company – to support upstream projects that could provide international opportunities for Canadian suppliers. This deal represents the first agreement of its kind in Scandinavia, which is an increasingly promising region for Canadian businesses. Our new office in London was instrumental in originating and completing this deal, as it ensured a direct and close relationship with Lundin Petroleum out of Geneva, Switzerland and Oslo, Norway. This proximity will be integral for introducing unique Canadian capabilities to the company going forward.
EDC Annual Report 2016 35

Singapore
As both a financial and transport hub for Southeast Asia, Singapore is a vital entry and distribution point for the broader region, where the total stock of Canadian direct investment now exceeds that in China and India combined. As a result, Singapore is an attractive market that offers plenty of export opportunities for Canadian companies. With a robust rule of law regime, business-friendly government policies, forward-looking and visionary leadership, first-class infrastructure, low tax rate, highly skilled labour force, and an anti-corruption culture, Singapore is one of the easiest places in the world to set up businesses.
This year, EDC reached $2.1 billion in terms of business facilitated, including $438 million financing to support 493 Canadian customers in the ASEAN region. In December, we opened our first international branch in Singapore, which allows EDC to conduct financial transactions directly in the market and react to customer demands in real time.
The costs of operating in Singapore, a sophisticated and competitive market, can be relatively high for Canadian companies. However, demand for exports in the aerospace, ICT, transportation, and infrastructure sectors, among many others, remains strong. Additionally, Canada’s resource wealth presents emerging opportunities in the agri-food and forestry sectors. For many exporters, the key to success here is developing tailored approaches given the diversity of markets within the region.
|
EDC in Singapore › 232 Canadian companies assisted › $795 million in business volume |
Supporting a Canadian exporter’s sales
Headquartered in Montreal, CAE is a global leader in training for the civil aviation, defence and security, and healthcare markets. With its innovative virtual-to-live training solutions, the company has a long history of business success in the Asia Pacific region. CAE continues to export to this region’s fast-growing civil aviation industry, as many airlines seek to recruit and train more pilots in response to increasing passenger traffic – a trend that is expected to continue. EDC has provided a combination of financing and insurance solutions to CAE in pursuit of its export growth.
In 2016, we provided financing to support the sale of CAE’s training solutions, including flight simulators, to airlines expanding throughout the region. These opportunities are further bolstered by CAE’s training network, which includes centres in key growth markets such as Singapore, in addition to new centres recently opened in Japan and Korea.
|
Corporate Social Responsibility |

At EDC, we see Corporate Social Responsibility (CSR) as a critical component to helping Canadian businesses operate internationally. Over the past few years, more consumers have come to expect robust CSR practices, creating greater demands on companies to conduct their business ethically and to keep a close eye on their social and environmental impacts.
In today’s trading environment, not only do companies need a smart export strategy to grow and succeed, they also need to recognize the increasing role of CSR in underscoring their competitiveness internationally. Fortunately, many Canadian businesses have taken a progressive, proactive approach to CSR, which can often be a differentiator in international markets.
To help Canadian companies succeed internationally, we’ve enhanced our focus on CSR with our customers. Increasingly, a key part of our business is providing guidance to companies to help them identify CSR risks in certain markets and sectors, and to help them work through challenging situations when they arise abroad. We want to help all Canadian companies raise the bar and take CSR seriously. Being ranked among the Corporate Knights Future 40 Responsible Corporate Leaders in Canada tells us we’re on the right track, but there’s still more to achieve.
As we continue to adapt and build our capacity to meet our customers’ evolving needs, our understanding of CSR will also broaden. Moving forward, CSR will remain a critical component of the transactions we support and will also be more deeply ingrained in our culture.
For more information, EDC’s 2015 CSR Report can be accessed online at www.edc.ca.
2016 Highlights
Environmental Leadership
This year, EDC has begun officially reporting its contribution to climate finance. In 2016, EDC provided $273 million in support of transactions in developing countries that contributed to climate change mitigation by reducing or avoiding greenhouse gas emissions. These transactions are evaluated using the International Finance Corporation’s Definitions and Metrics for Climate-Related Activities, the benchmark international standard, and are part of EDC’s commitment to developing meaningful initiatives that support the Government of Canada’s contributions to a low-carbon and climate-resilient future.
EDC Annual Report 2016 37
|
Corporate Social Responsibility |
CSR Scorecard
| | |
Priority | | 2016 Activities |
| |
| Combatting corruption | | Launched a multi-year project to advance our Financial Crimes and Know Your Customer (KYC) program, including hiring an external consultant to conduct a current state and gap analysis. |
| |
| Focusing on climate change | | Adopted and implemented the Organisation for Economic Co-operation and Development (OECD) Sector Understanding limiting support for coal-fired power plants. Began evaluating the carbon exposure of our business portfolio. |
| |
| Protecting human rights | | Continued to evolve our approach for screening transactions for human rights risks, including establishing a committee to monitor emerging issues and provide recommendations on how to support and manage customer exposure in high-risk circumstances. |
| |
Honouring international commitments | | Continued role as an Equator Principles Association Steering Committee member. Actively engaged within the OECD Environmental and Social Practitioners to share experiences and advance environmental and social risk management practices among export credit agencies. |
| |
| Investing in our community | | Held first-ever Community Investment Day, with almost 800 employees across Canada and around the world volunteering to support 26 organizations. |
Community Investment
Small enterprise development: Through our ongoing partnership with CARE Canada, four EDC employees were posted at CARE offices in Ottawa, Morocco, and Zambia in 2016, applying their knowledge and skills to economic empowerment initiatives in emerging markets. Since 2009, 29 EDC advisors have volunteered in seven CARE locations around the world, where we are proud partners in programs contributing to financial inclusion, microfinance, small enterprise development, and women’s economic empowerment initiatives.
Charitable giving: In 2016, EDC donated $56,750 to 28 Canadian charitable organizations through our Charitable Donations Program. This program includes the contributions of more than 50 employees who volunteered a total of more than 4,000 hours in 2016. EDC employees and Board members also donated an initial $20,660 to assist the people of Fort McMurray, Alberta in response to the wildfires. This amount grew to $61,980 after being matched twice – once by the Government of Canada and once by EDC – effectively tripling our impact. Additionally, EDC employees gave $202,985 to this year’s corporate Charitable Campaign, supporting the United Way/Centraide, HealthPartners, and many other registered charities across Canada.
Educating youth: To help foster the next generation of Canadian business leaders, EDC awarded 30 scholarships to post-secondary students at 16 colleges and universities in seven provinces as part of its International Business Scholarships Program. Our employees also conducted trade simulations with almost 500 high school and university students across Canada, helping them better understand the opportunities and challenges of doing business abroad. Additionally, our employees volunteered their time as judges and speakers at five university-level international business case competitions.
Supporting entrepreneurs: To honour our late colleague and friend, Dr. Adam Chowaniec, EDC continued to fund the Adam Chowaniec Memorial Fund for Global Entrepreneurship in partnership with StartUp Canada. The fund has helped more than 400 entrepreneurs access the resources and opportunities to help them scale up.

EDC’s Treasury team issues debt securities, manages the Corporation’s liquidity, and mitigates operational and financial risks. We aim to establish a presence in capital markets and borrow in currencies that are important to Canadian exporters. Our capital market activities can support the future potential of Canadian companies as they strive to go, grow, and succeed internationally.
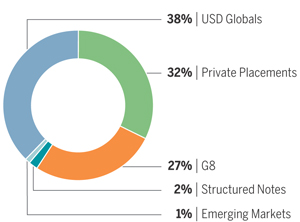
Funding
By the end of 2016, EDC had borrowed USD 10.4 billion and was active with benchmark bond issuances. American Dollar Global benchmarks are a large part of our funding program, and we issued four USD 1 billion Global benchmarks (two five-year and two three-year bonds).
Floating rate notes were also in demand in 2016, and EDC issued two USD 500 million four-year bonds; one in March and a second in November.
EDC was equally active in the Sterling market and reopened an existing three-year benchmark bond, increasing it twice by GBP 125 million and GBP 75 million, respectively, to bring the total to GBP 500 million. We also issued a new GBP 350 million four-year benchmark transaction that was subsequently reopened, increasing it by GBP 150 million to bring the total to GBP 500 million.
EDC also issued a 300 million Australian Dollar five-year benchmark bond. We maintained our presence in the New Zealand Dollar market by reopening an existing four-year benchmark bond, increasing it by NZD 125 million to bring the total to NZD 425 million.
Fiscal Year 2016
Total Funding YTD USD 10.4 billion
EDC Annual Report 2016 39
EDC continues to focus on supporting the internationalization of the Chinese Renminbi and presented two Chinese Yuan-denominated bonds: a one-year 400 million Yuan bond through the sale of 3.36 per cent notes due in May 2017 and a one-year 170 million Yuan bond through the sale of 2.90 per cent notes due in June 2017. These two bonds were the only emerging currency bonds issued this year.
EDC also responded to investor needs for private placement transactions denominated in a variety of currencies.
Looking Ahead
The 2017 plan is to borrow USD 11 billion – USD 12 billion. We will continue to monitor our positions to determine the appropriate mix of fixed- and floating-rate liabilities. We will look for opportunities to issue public transactions in U.S. Dollars, Australian Dollars, New Zealand Dollars, and Great Britain Pounds. We anticipate the remaining funding will come from private placements in U.S. Dollars and emerging market currencies.
The volatility in the current market environment, the potential for the U.S. Federal Reserve to continue to increase interest rates, and an evolving regulatory landscape could impact liquidity and swap spreads in 2017. We have seen U.S. dollar interest rates increase and anticipate a widening of credit spreads. These movements could impact our overall floating rate borrowing costs, which may increase in 2017 as we continue to fund in line with the market.
Based on the projected cash requirements for 2017, we expect the range for commercial paper outstanding to be between USD 6 billion and USD 8 billion.
Sovereign, Supranational and Agency (SSA) issuers, including EDC, may face the potential of rising interest rates. This will affect the tenor that investors demand and could constrict issuers’ funding options. EDC believes it can meet its funding requirements as it remains one of the most sought-after names in the SSA market.
Credit Credentials
While we service our debt from our own resources, our bonds carry the full faith and credit obligations of the Government of Canada. The ratings reflect our status as an agent of her Majesty in right of Canada and EDC’s 100 per cent ownership by the Government of Canada. EDC’s debt is a charge on and payable out of the Consolidated Revenue Fund (the government’s primary account).
| | | | | | | | |
Risk | | Domestic | | Foreign Currency |
Rating | | Long-term | | Short-term | | Long-term | | Short-term |
Moody’s | | Aaa | | P-1 | | Aaa | | P-1 |
S & P | | AAA | | A-1+ | | AAA | | A-1+ |
DBRS | | AAA | | R-1 (high) | | AAA | | R-1 (high) |
JCR | | AAA | | – | | AAA | | – |
Zero per cent BIS risk weighted according to Basel II guidelines

The following is an overview of the business strategy and performance measures of the 2017-2021 Corporate Plan. A summary of the Plan is available on www.edc.ca.
The Planning Environment
The global economy continues to experience volatility, giving rise to an unpredictable international landscape. While uncertainty has emerged around a shift in U.S. trade policy, the U.S. will likely remain a key driver of global growth over the planning period, and we expect positive growth in emerging markets, such as China and India. The Canadian economy faces challenges ahead, resulting from the downturn in commodities. As such, globalization remains an important contributor to Canada’s growth. Furthermore, Canada continues to enter into and ratify new free trade agreements that will make it easier for Canadian companies to engage in international trade.
Within this context, EDC is forecasting Canada’s export growth to be approximately 6.0 per cent in 2017. Trade and investment will be key drivers for the Canadian economy over the planning period, in part driven by a lower Canadian dollar. Canadian businesses have articulated a comprehensive set of challenges they face when looking to develop and grow their international footprint. Our job is to help them respond and compete successfully.
The Business Strategy
EDC’s business strategy for the 2017-2021 period is focused on doing more to increase the number of Canadian companies exporting and to support their diversification to new markets. We will also play a key role in supporting the Government of Canada as it advances its progressive trade agenda and works to raise Canada’s profile globally.
We will explore new ways to address the broad spectrum of challenges that Canadian companies and exporters face. Our solutions include early-stage services, such as knowledge and advice on exporting, and solutions for later-stage needs, including a range of financing, insurance, and bonding solutions to help Canadian exporters. We will work through our network of representatives in Canada and abroad, as well as through our partners, such as the Trade Commissioner Service.
The 2017 – 2021 Business Strategy outlines three main objectives:
1. Build awareness of the benefits of exporting and provide knowledge and advice to help Canadian companies go international: We will connect with more Canadian companies to share information and build awareness of the solutions EDC and its partners can provide to help Canadian companies become exporters and encourage trade growth.
2. Anticipate and respond to the needs of Canadian companies to support and accelerate their international growth: We will ensure that current and potential exporters have access to a range of solutions that address and evolve with their needs as they grow their business internationally.
3. Create new trade opportunities and promote trade diversification in order to help Canadian companies succeed internationally: We will facilitate connections and find new opportunities for Canadian companies to help them expand beyond traditional markets.
Objective 1: Build awareness and share our knowledge
We will continue to increase awareness about the benefits of exporting, and the knowledge and services that EDC can offer to exporters of all sizes and stages. The goal is to encourage more Canadian companies to start exporting and to encourage those that already are to export more. This is particularly important for SMEs, as we look to help them grow their small firms into big businesses by selling internationally. We will help give businesses the confidence they need to go global by promoting free trade agreements, responding to the need for knowledge, and connecting companies with information, tools, and partners required to begin selling overseas.
EDC Annual Report 2016 41
Objective 2: Anticipate and respond to needs
As Canadian businesses progress along their journey to globalization, the support they need evolves and becomes more specific to their respective global strategies. By listening to what Canadian exporters are telling us they require to conduct business internationally, we will ensure that Canadian businesses have access to a comprehensive suite of products to help them achieve growth at any stage in their exporter life cycle. Over the planning period, we will work to anticipate and respond to exporter needs and enhance our existing service offerings to address these needs. We will do so by continuing to invest in online services for our customers, taking more risk for Canadian SMEs and supporting Canadian direct investment abroad (CDIA). We will also continue supporting companies in key Canadian industries, such as cleantech, manufacturing, mining, and oil and gas.
Objective 3: Create new trade opportunities
We will help create new opportunities for Canadian businesses and promote trade diversification among exporters and investors. In order to do so, we will leverage our deep knowledge of Canadian capabilities and industries, in-depth market knowledge, and our connections with foreign buyers for the benefit of Canadian companies seeking new trade opportunities. EDC’s international footprint is core to our trade diversification strategy, as we will leverage recently opened offices and continue to look to expand our global presence. We will focus on helping more Canadian exporters enter lucrative emerging markets like China and India, and to do so faster. We will also build awareness and increase trade to developed markets that remain critically important to Canadian companies as a gateway to these emerging markets.
Corporate Social Responsibility
Today’s broader global market has enhanced expectations regarding responsible business practices. As we assist customers in pursuit of international opportunities, we also support them in responding to these expectations by informing them about conducting business in a socially responsible manner. By educating and promoting strong CSR practices with current and future exporters, we help them manage risks and give them the confidence they need to enter new markets.
Our CSR practices balance the interests of our many stakeholders and are foundational to what we do, guiding our actions as we conduct business both in Canada and abroad. We review transactions to ensure that international standards will be met. We work with customers and borrowers to help increase their knowledge and understanding of these standards and how they can enhance their own business practices. CSR will remain a corporate priority for EDC throughout the planning period.
EDC was ranked in the top 10 among the Corporate Knights Future 40 Responsible Corporate Leaders in Canada in both 2015 and 2016. We are continually exploring ways to actively engage in CSR discussions, both at customer and international standard levels. Over the planning period, we will explore new ways to add value to our customers in this regard and, in so doing, we will help Canadian companies increase their awareness and practice of international CSR standards when conducting business internationally.
Delivering on our Objectives
To meet the needs of more customers than ever before and to contribute significantly to the Government of Canada’s trade agenda over the long term, we have in place robust practices for risk management, operational management, financial sustainability, and human resources that are in alignment with private sector best practices. We continuously look for ways to create capacity, efficiency, and value for our customers.
Measuring Success
Our scorecard tracks our performance against the strategic objectives outlined in the Business Strategy through the measures outlined below. As the trade environment and our priorities evolve, so do the benchmarks against which we measure our success.
| | |
Performance Measures | | 2017 Plan |
Customer-related Measures |
Net Promoter Score | | 70.0 – 76.0 |
Business Measures |
Total Business Facilitated | | 4 – 7% growth |
Business in Emerging Markets | | 2 – 6% growth |
CDIA Transactions | | 2 – 7% growth |
Small Business and Commercial Transactions (new measure) | | 4 – 10% growth |
| | |
Financial Measures |
Productivity Ratio | | 28 – 32% |
Net Promoter Score
The Net Promoter Score (NPS) is the measure against which we evaluate our customers’ satisfaction and loyalty. NPS measures the likelihood that our customers would recommend EDC to business colleagues. EDC continues to be a leader in customer loyalty. Our score, relative to other organizations, is strong and remains in the top 10 per cent of North American B2B companies. For 2017, our target NPS range is 70.0 – 76.0.
Total Business Facilitated
This measure provides an order of magnitude of the business Canadian companies carry out with the help of our solutions. Looking forward to 2017, we are projecting growth in the range of 4 to 7 per cent. This growth is expected to stem from targeted initiatives in our ARI product, increases in signings due to new foreign office openings, and new pull transactions with international buyers.
Business in Emerging Markets (BEM)
This measure uses revenue to demonstrate the value we deliver to Canadian companies in emerging markets. Revenue is a comparable measure of value across our insurance and financing programs, therefore providing a balanced view of our business. Revenue derived from all programs counts towards BEM and is defined as the accounting revenue reported on the income statement earned during the calendar year through premiums, fees, and interest on transactions in emerging markets. In 2017, we expect growth in BEM to be in the 2 to 6 per cent range, due in part to growth in our loan portfolio.
Canadian Direct Investment Abroad (CDIA) Transactions
CDIA continues to be critical to the health of the Canadian economy, and supporting CDIA transactions has become an integral part of our core business. We expect the 2016 trend to continue, resulting in a growth range for CDIA of 2 to 7 per cent in 2017. This will be attributable to our focus on expanding partnerships with financial institutions and making improvements to our programs to add more value for our partners.
Small Business and Commercial Transactions
Over the past number of years, we have placed a strong emphasis on supporting SMEs in both developed and emerging markets. In 2017, we are replacing the Small- and Medium-Sized Business Transactions measure with a new, modified measure called Small Business and Commercial Transactions. This updated measure reflects a more comprehensive range of businesses that export to ensure that we have an eye on companies of all sizes and at all stages. We anticipate growth in this measure to be in the 4 to 10 per cent range due to our continued efforts to increase EDC’s awareness and to strengthen partnerships with financial institutions.
Productivity Ratio
Our Productivity Ratio captures, in aggregate form, how well we use our resources. It is the ratio of administrative expenses to net revenue. In 2017, our targeted range will be 28 to 32 per cent, which reflects critical investments we are making in key areas, including transformation projects and our effort to serve more Canadian exporters than before.
|
| EDC Annual Report 2016 43 |

Board Stewardship and Governance
EDC’s stewardship rests with its Board of Directors, which is composed of seasoned professionals in the fields of business, finance, investment, policy, and risk management. Members possess deep knowledge and understanding of various sectors including agriculture, fishing, mining, energy, manufacturing and transportation. Their collective experience is leveraged to help inform EDC’s business direction.
Each year the Board provides input to, and approves, EDC’s Corporate Plan. In 2016, Board discussions focused around how the plan would flow directly from EDC’s long-term Corporate Strategy. Three strategic objectives were identified as the guiding focus for the corporate plan.
These were:
| | 1. | Building awareness of the benefits of exporting and provide knowledge and advice to help Canadian companies go international; |
| | 2. | Anticipating and responding to the needs of Canadian companies to support and accelerate their international growth; and |
| | 3. | Creating new trade opportunities and promoting diversification in order to help Canadian companies succeed internationally. |
All three goals stem from EDC’s determination to stay relevant to the needs of existing and future customers.
EDC’s Board also plays the important role, along with the Executive Management Team, of ensuring that the Corporate Plan is aligned with the Government of Canada’s priorities.
Board Governance
2016 marked the first year of the Board’s enhanced governance framework, which was the result of last year’s Board Governance review. The new framework helped ensure continued strong corporate governance for EDC through a variety of measures. Of note, the Terms of Reference for certain board committees were revised and improved, as was the Director Profile, which outlines the ideal skills and capabilities for Directors and helps determine if the Board as a whole possesses all of the required skills.
The Board also welcomed the introduction of a new digital platform to allow EDC to continue to share key information with the Board in a timely and secure manner, thereby facilitating meeting effectiveness and supporting informed decision-making during Board and Committee meetings.
Finally, the Government of Canada announced a new approach for Governor in Council appointments, including Crown directors in February 2016. With several board member terms having expired and others coming to an end in 2017, EDC worked closely with the government to ensure that new Director appointments will be undertaken in accordance with these new guidelines.
Enterprise Risk Management
Enterprise risk management (ERM) continues to be a priority for EDC’s Board. As EDC undertakes a multi-year ERM transformation program, the Board continued to play a significant role in supporting the ongoing planning and implementation of EDC’s ERM practice. This included in-depth discussions during the Board’s annual strategy session in June, as well as regular engagement during all Board meetings. In particular, the Board approved an updated Risk Appetite Statement for the Corporation, as well as a “Policy of Policies” (POP), an ERM Policy, an ERM Framework, and a Model Risk Management Policy. In addition, the Board approved a Compliance and Ethics Charter that outlines the mandate of the Compliance and Ethics function.
To help support the ERM transformation program, a sub-Committee of the Risk Management Committee was also created. The Board, as well as the Executive Management Team, will continue to be actively engaged in building an ERM practice that reflects strong, effective governance and risk management.
The Board’s Risk Management Committee, the Senior Vice-President and Chief Risk Officer, and the Vice President and Chief Compliance & Ethics Officer, will all play central roles in delivering on the critical priority of building a culture of risk awareness.
New Corporate Strategy
This past year, the Executive Management Team began its work to implement EDC’s new long term Corporate Strategy. The Board and the Business Development and Strategy Committee have been engaged on this initiative throughout the year.
Public Policy Objective and Legislated Mandate
The mandate and powers of EDC are established by statute, which remained unchanged in 2016. The Board reviewed the 2016 Statement of Priorities and Accountabilities (SPA) received from the Minister responsible for EDC, which provides guidance for the Corporation’s strategic orientation. The Board also reviewed the Minister of International Trade’s Mandate Letter and received an update on the recently announced Government of Canada’s Trade and Investment Strategy to ensure that EDC’s activities reflect the Government’s specific goals and objectives.
Corporate Social Responsibility (CSR) and Culture of Ethical Conduct
EDC’s CSR activities are a critical component of enhancing Canada’s trade performance. The Board engaged on CSR issues throughout the year, received regular quarterly updates on Environmental Review Directive (ERD) transactions and significant CSR group undertakings, and held periodic discussions on specific CSR matters of interest or concern. In addition, one Board member attended EDC’s CSR Advisory Council as a participant to bring the Board’s perspective to the discussions.
The Board promotes an ethical business culture, and leads by example in this regard. EDC Directors file standing declarations of interest and refrain from discussions or voting where a real or potential conflict of interest exists. Board documents are screened to flag companies listed in the standing declarations of Directors so that transaction documents are withheld from a Director who has declared an interest in a party related to that transaction.
Each year, the Board receives a report on employee confirmation with EDC’s Code of Conduct, including the Values and Ethics Code for the Public Sector that became part of EDC’s own Code of Conduct in 2012. Board members also receive annual “refresher” training to confirm their own understanding and compliance with the requirements of the EDC Code of Conduct that apply to Directors, and with the board-specific procedures that regulate conflicts of interest and insider trading. In 2016, this training was given by EDC’s Vice President and Chief Compliance & Ethics Officer.
Accountability and Operations
The Board has an effective working relationship with EDC’s management and regularly reviews the allocation of responsibilities. The EDC by-law regulates the proceedings of the Board, and establishes matters for which the Board has reserved authority. The Board Charter elaborates on roles and responsibilities, in terms of board stewardship, and provides additional detail on board proceedings.
EDC’s Board functions independently of management. At each Board and Committee meeting, time is reserved for Directors to meet in camera with the CEO and separately without the CEO. The Audit Committee meets in camera in three sessions: with the federal Auditor General’s representatives; with EDC’s Senior Vice-President and Chief Internal Auditor (newly appointed in 2016); and, the full Audit Committee without the CEO. The Risk Management Committee holds regular in camera sessions with the Chief Risk Officer and Vice President and Chief Compliance Officer & Ethics Officer.
The roles of EDC’s Chair and President are separate. All board members, other than the President, are independent of EDC management. Directors receive agendas and materials for, and are welcome to attend, any committees of which they are not members.
|
| EDC Annual Report 2016 45 |
Communication with Stakeholders
In 2016, the Board continued to monitor and facilitate effective communication between EDC and its key stakeholders, including its shareholder, the Government of Canada.
The Board was kept informed of outreach activities that help EDC obtain stakeholder input and feedback, including the meeting of the Industry Stakeholder Panel. At formal and informal board events, experts from various fields were invited to provide their insight and have discussions with the Board. Additionally, the Board conducts regular outreach during its out-of-town meetings in order to interact with local EDC customers, government officials, and other key stakeholders in these communities. In 2016, for example, four CEOs of companies in the oil and gas sector participated in a session with the Board during the June meetings in Calgary.
With encouragement from the Board, EDC continued to prioritize partnerships in 2016. The Corporation undertook initiatives to enhance relationships with the Trade Commissioner Services, Canadian financial institutions, and sister Crown corporations such as the Canadian Commercial Corporation (CCC) and the Business Development Bank of Canada (BDC).
The Business Development and Strategy Committee played a key role in reviewing programs to increase public awareness of EDC and the services it can provide to Canadian businesses.
Senior Management Evaluation and Succession
The Board evaluates the performance of the President and Senior Vice-Presidents on an annual basis. The President’s annual performance objectives are set by the Human Resources Committee and are directly related to EDC achieving objectives set out in the Corporate Plan. The Human Resources Committee reviews the President’s performance based on these objectives, and makes recommendations to the Board. The Board in turn provides the government with recommendations for ratings related to the President’s salary and variable pay. The Human Resources Committee also reviews performance and compensation of senior management and certain other positions on an annual basis.
In addition, the Board oversees senior management succession. The succession plan, as developed by management and approved by the Human Resources Committee, is used for senior appointments.
Travel and Hospitality Directive
In response to the Government of Canada’s Directive to Crown corporations to align with the Treasury Board procedures and guidelines on Travel, Hospitality, Conference and Event Expenditures, the Board worked closely with the Executive Management Team to ensure that both EDC’s corporate and Board travel-related policies were compliant with the Directive.
Audit Activities
The Board received regular reports from the Audit Committee in 2016. A sub-Committee of the Audit Committee continued to provide additional oversight of the Credit Insurance Transformation (CIT) project, the goal of which is to make it easier and more cost-effective for companies to obtain receivables insurance from EDC.
In December 2016, the Board also approved the Office of the Auditor General of Canada’s (OAG) Special Examination plan, which is undertaken at least every ten years. The examination enables the OAG to provide the Board with reasonable assurance that there are no significant deficiencies in the Corporation’s financial and management control, information systems, and management practices.
Committee Mandates
The Audit Committee ensures the Board fulfills its mandate in financial matters, as well as with respect to reporting of any investigations by the Vice President and Chief Compliance & Ethics Officer, and internal and external auditor terms of engagement. The Audit Committee approves and monitors important capital and administrative expenditures, reviews the implications of new accounting policies, and reviews internal and external audit results. The Committee approves quarterly financial statements for public release. All Audit Committee members are financially literate and are independent of EDC management. The Committee, chaired by Herbert Clarke, held six regular meetings and one special meeting.
The Business Development and Strategy Committee provides direction that strengthens EDC’s ability to meet the ongoing needs of Canadian exporters and investors. The Committee monitors the development and approval of the Corporate Plan, recommends the Plan to the Board, oversees management activities in analyzing market conditions and developing responses, and monitors corporate performance against business development plans and related frameworks. The Committee reviews sector strategies and new product initiatives, and annually reviews the impact of EDC’s business on Canada’s economy. The Committee, chaired by Jeffrey Steiner, held six regular meetings and one special meeting.
The Executive Committee has the authority to exercise certain board powers, and meets only if necessary to deal with urgent matters that arise between board meetings. A meeting of the Executive Committee was not required in 2016. Kevin Warn-Schindel, as Chair of the Board, chairs the Committee.
The Human Resources Committee supports the Board’s oversight of human resources strategic planning and approves the management succession plan, employee and executive compensation, and the measures and targets for the corporate incentive program. It sets objectives and advises the Board on the assessment of the President’s performance and oversees the design, investment strategy, and performance of pension plans for employees. The Committee, chaired by Jeff Burghardt, held six regular meetings and one special meeting.
The Nominating and Corporate Governance Committee deals with matters relating to EDC’s governance regime. It has input into the ethics program for Directors, selection criteria for appointments of the President and the chair, profiles of the desirable skills and experience required of Directors, consideration of board candidates, and orientation and education programs. It oversees the board governance survey, monitors relations with management, and reviews the membership and mandates of committees. In 2016, governance matters were elevated for discussion or decision to the full Board. The Board Chair acts as chair of this committee, which had one special meeting in 2016.
The Risk Management Committee supports the Board’s oversight of the prudent management of EDC’s capital structure, including the management of credit, market, and other enterprise risks. The Committee oversees and recommends updates to the internal policy framework governing authorization of EDC’s business activities, and oversees the authorizations that EDC requires in order to undertake specific transactions. It reviews and recommends transactions requiring Board approval, and monitors compliance with the Environmental Review Directive. It also oversees EDC’s compliance and ethics programs and receives updates on portfolio management activities. The Committee, chaired by Darlene Thibault, held six regular meetings.
Director Remuneration
Compensation paid to Directors is set by Order in Council. The Chair and other independent Directors receive an annual retainer for their services, plus a fixed per diem for travel time, and for attending committee and board meetings. The following compensation schedule has been in place since 2000, in accordance with Treasury Board Guidelines.
| | › | Chair of the Board: annual retainer of $12,400; $485 per diem |
| | › | Other Directors: annual retainer of $6,200; $485 per diem |
| | › | Chairs of committees (other than Executive Committee) and Vice-Chair of the Board: base retainer plus $2,000 |
Directors are reimbursed for their reasonable out-of-pocket expenses while performing their duties, including travel, accommodations and meals. Most Board members serve on three committees. There were 13 Board meetings in 2016 (6 regular, 7 special) and 28 committee meetings. Meetings convened between regularly scheduled Board sessions are usually held by teleconference. The total remuneration paid to independent Directors including the Chair (annual retainers plus per diems) was $271,202.50 in 2016 compared to $258,368 in 2015. The total for business travel, promotion and meeting expenses paid to members of the Board plus meeting expenses for the Board and Committees was $169,511 in 2016 compared to $179,084 in 2015 (both figures exclusive of the expenses of the President). The total for the President’s business travel and hospitality expenses in 2016 was $79,390 compared to $69,279 in 2015.
| | | | | | | | | | | | | | | | | | | | | | | | | | | | |
Membership and attendance at meetings of the EDC Board and Board Committees in 2016 | |
| | | Total
Compensation
(retainer plus per
diem payments) | | | Audit Committee Meeting
(6 regular, 1 special) | | | Business
Development
and Strategy
Committee Meeting
(6 regular, 1 special) | | | Human Resources
Committee Meeting
(6 regular, 1 special) | | | Nominating
& Corporate
Governance
Committee Meeting
(1 special) | | | Risk Management
Committee Meeting
(6 regular) | | | Board of Directors Meeting
(6 regular, 7 special) | |
Boivin, Jacques | | | $20,628.75 | | | | 6/7 | | | | 7/7 | | | | | | | | | | | | | | | | 12/13 | |
Burghardt, Jeff | | | $29,540.00 | | | | 7/7 | | | | 7/7 | | | | 7/7 | | | | 1/1 | | | | | | | | 13/13 | |
Clarke, Herbert | | | $30,752.50 | * | | | 7/7 | | | | 7/7 | | | | | | | | 1/1 | | | | | | | | 13/13 | |
Culbert, Heather | | | $21,720.00 | | | | 4/7 | | | | | | | | 7/7 | | | | | | | | 6/6 | | | | 11/13 | |
Daignault, Benoit | | | n/a | | | | | | | | 7/7 | ** | | | 7/7 | | | | | | | | 6/6 | | | | 13/13 | |
Gordon, Lindsay | | | $18,203.75 | | | | 4/7 | | | | | | | | 4/7 | | | | | | | | 5/6 | | | | 9/13 | |
Khurana, Vik | | | $18,082.50 | | | | | | | | 6/7 | | | | | | | | | | | | 5/6 | | | | 12/13 | |
Lifson, Elliot | | | $17,597.50 | | | | | | | | 6/7 | | | | 7/7 | | | | | | | | 6/6 | | | | 9/13 | |
McLeese, Robert | | | $20,871.25 | | | | 7/7 | | | | 7/7 | | | | | | | | | | | | | | | | 13/13 | |
Stefanson, Jason | | | $19,052.50 | | | | 4/7 | | | | | | | | 4/7 | | | | | | | | 4/6 | | | | 11/13 | |
Steiner, Jeffrey | | | $22,022.50 | | | | | | | | 7/7 | | | | | | | | 1/1 | | | | 5/6 | | | | 13/13 | |
Thibault, Darlene | | | $24,083.75 | | | | 6/7 | | | | 7/7 | | | | | | | | 1/1 | | | | 6/6 | | | | 13/13 | |
Warn-Schindel, Kevin | | | $28,647.50 | | | | | | | | | | | | 7/7 | | | | 1/1 | | | | 6/6 | | | | 12/13 | |
* Includes attendance at two (2) meetings of EDC’s CSR Advisory Council, plus related travel time.
** B. Daignault attended these meetings in his capacity as President.
|
| EDC Annual Report 2016 47 |
Board of Directors
Kevin Warn-Schindel
Toronto, Ontario
Mr. Warn-Schindel was appointed Chairman of EDC’s Board of Directors in June 2013. He is currently a Managing Director at HarbourVest Partners, LLC, a global private investment firm, where he leads the Real Assets investment program. Prior to this, he served 10 years as the Group Head and Managing Director of the OPTrust Private Markets Group, an investment unit of OPTrust. An investment management executive with extensive experience in global capital markets, he has held senior positions with Macquarie Bank Limited, an Australian investment bank, and RBC Capital Markets, the wholesale investment banking arm of the Royal Bank of Canada.
Jacques Boivin
Quebec City, Quebec
Mr. Boivin was appointed to EDC’s Board of Directors in March 2009 and reappointed for a second term in October 2012. A member of the KSA, attorneys S.E.N.C.R.L. law firm in Lévis, Quebec, Mr. Boivin specializes in mergers and acquisitions, sales and financing, as well as bankruptcy and insolvency. He has also served as an instructor at the École du Barreau du Québec and is a member of the Barreau du Québec, the Canadian Bar Association, and INSOL International. In addition to his law practice, Mr. Boivin is an active member of his community and serves as an administrator and director on the boards of directors for the Institut universitaire de cardiologie et de pneumologie de Québec – Université Laval, the Fondation Sourdine, and the Association des fondations d’établissement de santé du Québec.
Jeff Burghardt
Oakville, Ontario
Mr. Burghardt was first appointed to EDC’s Board of Directors in June 2008. He was reappointed for a second term in February 2012. He has worked in the agricultural industry for more than 30 years, including 13 years as President and Chief Executive Officer of Prince Rupert Grain Ltd. and as Chair of the Northwest Corridor Development Corporation. A leading advocate for his region, Mr. Burghardt has served as an industry adviser to both federal and provincial governments on issues such as transportation, economic development, investment, healthcare, and labour relations.
Herbert M. Clarke
St. John’s, Newfoundland and Labrador
Mr. Clarke was appointed to EDC’s Board of Directors in 2009, and reappointed for a second term in October 2012. He has substantial experience in areas of public policy and industry/government relationships particularly relating to shipbuilding, marine construction, fish and fish products, and energy. He has held senior executive positions in both the fishing and mining industries and has served as Deputy Minister for several Departments of the Government of Newfoundland and Labrador, including as Clerk of the Executive Council and Secretary to Cabinet. Mr. Clarke has been a member of the Canada-Newfoundland and Labrador Offshore Petroleum Board, founding Chairman of the Fisheries Resource Conservation Council, Public Review Commissioner for the White Rose Development Application, and Co-Chair for the Joint Review Panel for the Lower Churchill Hydroelectric Generation Project. Mr. Clarke is President of HMC Associates Ltd., a private consulting and investment firm.
Heather J. Culbert
Calgary, Alberta
Heather Culbert was appointed to EDC’s Board of Directors in April 2015. With over 27 years experience in the oil and gas sector, Ms. Culbert has held senior management positions at Enerplus Corporation, Cody Energy, and Suncor, as well as serving the clients of her own IT Management Consulting firm. As Senior VP of Corporate Services with Enerplus, she developed significant expertise in all aspects of the oil and gas business, including a specialization in merger and acquisition integration, strategic planning and corporate performance. Ms. Culbert is currently serving as Board Chair of the Southern Alberta Institute of Technology (SAIT), the Strategic Advisory Board for the Charbonneau Cancer Research Institute, the United Way World Leadership Council, and the United Way Calgary as past Board Chair. Heather is a graduate of SAIT in Computer Technology, a graduate of Queens Executive Program, and was recently awarded a SAIT Honorary Bachelor of Science Degree. In 2013, she was the recipient of the Doc Seaman Generosity of Spirit Award as an individual philanthropist; in 2005, she received the Alberta Centennial Medal for Community Service; and in 2003, she was recognized as SAIT’s Distinguished Alumna.
Lindsay Gordon
Vancouver, British Columbia
Lindsay Gordon was appointed to EDC’s Board of Directors in April 2014. Mr. Gordon spent 25 years with HSBC, one of the world’s largest banking and financial services organizations, serving as President and CEO for nine years. Prior to this he spent 10 years in senior roles with EDC. Mr. Gordon currently serves on a variety of Boards, including HSBC France, HSBC Bermuda, the Canadian Institute for Advanced Research (CIFAR), and Clear Seas Centre for Responsible Marine Shipping. He is also Chancellor of the University of British Columbia, a member of the Presidents Group of the Ministry of Social Development and Social Innovation of British Columbia, a member of the Long Term Policy Committee of the Business Council of British Columbia, and Governor and Co-Founder of the CH.I.L.D. Foundation. Mr. Gordon was a past Director for the CD Howe Institute, and was a member of the Canadian Council of Chief Executives. He was also the 2010 recipient of the B’nai Brith Award of Merit for Outstanding Canadians and a recipient of the 2012 Queen Elizabeth II Diamond Jubilee Medal. He holds a BA and MBA from the University of British Columbia.
Vikram Khurana
Toronto, Ontario
Mr. Khurana was appointed to EDC’s Board of Directors in April 2013. He is the founder and CEO of Leading System Consultants Inc. and has interests in other Asia-centric businesses. Prior to becoming an entrepreneur, Mr. Khurana worked with Toronto Dominion Bank. He has served on the boards of numerous multinational companies and non-profit organizations and is currently a board member of the Asia Pacific Foundation of Canada (APFC), Canada Post Foundation, and Dean’s Council at the Ted Rogers School of Management. He was also a member of the Canada-India CEO Forum. Mr. Khurana is an Engineering graduate from India and holds a MBA from St. Mary’s University in Halifax.
Elliot Lifson
Montreal, Quebec
Elliot Lifson was appointed to EDC’s Board of Directors in March 2012. Mr. Lifson is Vice-Chairman of Peerless Clothing Inc. He is also President of the Canadian Apparel Federation, and in addition to his duties with the Federation, he is a member of the Board of the Apparel Manufacturing Institute of Quebec and Director of Manufacturers and Exporters of Quebec. As well, Mr. Lifson is Past Chairman of the Board of the Montreal Board of Trade and currently sits on the Board in an advisory capacity. Mr. Lifson is also the Division Chair for the apparel sector of the Ministère du Développement Économique, Innovation, et Exportation. Mr. Lifson sits on the Board of many charitable institutions and currently serves as Professor at the Desautels Faculty of Management at McGill University and has received its distinguished teaching award. Mr. Lifson was recently nominated to the Quebec Government Committee, Export Québec, and is a recipient of the 2012 Queen Elizabeth II Diamond Jubilee Medal. He is a graduate in Law from the Université de Montréal and a member of the Quebec Bar. He received his MBA from the Ivey School of Business, University of Western Ontario.
Robert S. McLeese
Toronto, Ontario
Mr. McLeese was appointed to EDC’s Board of Directors in April 2015. He is the Founder and President of Toronto-based Access Capital Corp., a financial advisory firm specializing in the independent power industry, where he provides strategic and financing advice to buyers and sellers of alternative energy projects. Mr. McLeese is also Chairman and President of ACI Energy, Inc. which owns and operates two waste coal fueled power plants in the United States. He is a past Director of Rand Capital Corporation, Buffalo; a past Advisory Board member of Fengate Capital; and a past Director, Treasurer and Past President of the Association of Power Producers of Ontario. He is also a past Director of Creststreet Power & Income Fund, a co-developer of wind projects in Quebec, Nova Scotia, and Alberta. Mr. McLeese is the recipient of the 2011 Probyn Prize for innovation in sustainable energy finance and a Recipient of the 2012 Queen Elizabeth II Diamond Jubilee Medal.
Jason T. Stefanson
Winnipeg, Manitoba
Mr. Stefanson was appointed to EDC’s Board of Directors in May 2014. He is currently Vice Chairman and Managing Director of CIBC World Markets in Western Canada, where he advises public, private, and government clients. Prior to that, he has been a senior executive at Ensis Capital Corporation, a manager of venture capital funds at Assante Corporation, a wealth management firm and at Canterbury Park Capital L.P., a Western Canadian private equity fund. Mr. Stefanson practiced corporate and securities law at Pitblado & Hoskin in Winnipeg, and has served on a number of private company and charitable, community, and political boards. Mr. Stefanson attended the University of Manitoba Faculty of Arts and is a graduate of Osgoode Hall Law School.
Jeffrey Steiner
Toronto, Ontario
Mr. Steiner was appointed to EDC’s Board of Directors in December 2010 and was reappointed in June 2014. He is the founder & CEO of New Franchise Media Inc., a film & television development company. Previously, Mr. Steiner served as President and Chief Executive Officer of the Toronto Economic Development Corporation (TEDCO) and served for three years as a board member of the Alcohol & Gaming Commission of Ontario. Mr. Steiner currently serves as Co-Chair of the Canada-UAE Business Council. He is actively involved in the angel investor community in Ontario and is a member of the Young Presidents’ Organization (YPO/WPO) Ontario Chapter, the Law Society of Upper Canada, and the Institute of Corporate Directors, having earned an ICD.D corporate governance designation. Mr. Steiner also serves on various advisory boards of Canadian mining and technology companies listed on the Toronto Stock Exchange.
Darlene Thibault
Laval, Quebec
Ms. Thibault was first appointed to EDC’s Board of Directors in January 2010 and was reappointed for a second term in February 2013. A Director of Equipment Leasing in the Corporate Finance Division at the Bank of Montreal since June 2015, Ms. Thibault helped build and launch a new product offering to add to BMO’s range of commercial services. Ms. Thibault was with the Bank of Nova Scotia from 2005 to 2015, with her last role being a Regional Director and Group Lead in the Specialized Financial Services where she managed the leasing portfolios as well as the Immigrant Investor Program for Eastern Canada and Quebec. A graduate of McGill University in the Faculty of Arts, her 20-year career in the financial industry has included positions at HSBC Bank, the Bank of Montreal, Bombardier Capital Ltd., AT&T Capital Canada Inc., and Pitney Bowes Leasing. Ms. Thibault is also a member of the Institute of Corporate Directors.
|
| EDC Annual Report 2016 49 |
Executive Management Team
| | | | | | | | |

| | 
| | 
| | 
| | 
|
| | | | |
Benoit Daignault President & Chief Executive Officer Benoit Daignault joined EDC in 2004. Before his appointment as President and CEO in February of 2014, he served as Senior Vice-President, Financing and Investments after serving as Senior Vice-President, Business Development. Before joining EDC, Mr. Daignault spent more than 10 years with General Electric Capital, where he held increasingly senior positions in both Canada and the U.S. Mr. Daignault has a Baccalaureate in Business Administration from l’École des Hautes Études Commerciales in Montreal and is a CFA charterholder. He completed the Proteus program of the London Business School and the Senior Executive Program of Columbia University. He currently serves on the board of QG100 as well as on the board of the Conference Board of Canada. | | Carl Burlock Senior Vice-President and Global Head, Financing and Investments Carl Burlock was appointed Senior Vice-President and Global Head, Financing and Investments in May 2014. Since joining EDC in 1997, Mr. Burlock most recently served as Vice-President, Commercial Markets and Small Business, where he was responsible for account management and business development activities for Canadian businesses in the commercial and small business segments. He also served as Vice-President of HR Client Services, overseeing a broad portfolio of critical HR functions; Director of EDC’s Extractive and Resources Financing team; as well as various positions within EDC’s industry sector areas. Prior to joining EDC, Mr. Burlock spent nine years as a Mechanical Engineer for Nova Scotia Power Inc., primarily in mechanical design and construction. He holds a Master of Business Administration from Dalhousie University and a Bachelor of Mechanical Engineering from Dalhousie University/Technical University of Nova Scotia. | | Stephanie Butt Thibodeau Senior Vice-President, Human Resources Stephanie Butt Thibodeau was appointed to the role of Senior Vice-President, Human Resources in January 2016. She is responsible for the development of EDC’s people strategy to attract, engage, and develop the talented employees who deliver on EDC’s vision and business objectives in support of Canadian trade. Prior to this appointment, Ms. Butt Thibodeau was the Vice President of HR Client Services. She joined EDC in 1995 and has held leadership roles in all of EDC’s core lines of business, including financing, insurance, and international business development. Ms. Butt Thibodeau holds a Bachelor of Commerce degree from the University of Ottawa and is a CFA charterholder. | | Catherine Decarie Senior Vice-President, Corporate Affairs In her role as Senior Vice-President, Corporate Affairs, Catherine Decarie leads critical corporate and business advisory functions that oversee EDC’s strategic relationships with government, media, private sector partners, and civil society. The Corporate Affairs group includes Corporate Communications, Public Affairs, Legal Services, and Corporate Social Responsibility. Since joining EDC in 2001, Ms. Decarie has held numerous roles of increasing responsibility. In 2013, she was named a member of the executive team, taking on the position of SVP, Human Resources, a role she held until being appointed to her current position in 2015. Called to the Ontario Bar in 1996, Ms. Decarie articled with McCarthy Tetrault and has held numerous legal and human resources positions within the Toronto head office of a national retailer. She earned her B.A. from Mount Allison University and her LL.B from Queen’s University. Ms. Decarie is a graduate of the Senior Executive Program of Columbia University and maintains her membership in the Law Society of Upper Canada. | | Al Hamdani Senior Vice-President and Chief Risk Officer, Enterprise Risk Management Al Hamdani was appointed Senior Vice-President and Chief Risk Officer in July 2015. In this capacity, Mr. Hamdani oversees EDC’s current enterprise risk management activities, including credit and market risk management, capital management, and compliance, as well as a broader change program aimed at enhancing EDC’s overall enterprise risk management practices. Prior to this position, Mr. Hamdani served in various senior leadership roles at EDC, including Vice-President and Head of EDC’s Risk Management Office overseeing EDC’s credit adjudication, loan portfolio management, and capital and market risk management activities, as well as Vice-President and Head of EDC’s Structured and Project Finance Group. Before joining EDC in 1999, Mr. Hamdani held positions at CIBC World Markets as well as the Bank of Canada. Mr. Hamdani has a Master of Business Administration degree from the Rotman School of Management, a Bachelor’s Degree in Economics from Carleton University, and is a Chartered Financial Analyst. |
| | | | | | | | |
 | |  | |  | |  | |  |
| | | | |
Ken Kember Senior Vice-President, Finance and Technology, and Chief Financial Officer Ken Kember was appointed Senior Vice-President, Finance, and Chief Financial Officer in 2009 and in 2016 assumed responsibility for EDC’s Technology Group. Mr. Kember leads the Finance and Technology organization, which includes Treasury, Corporate Finance & Control, Loans Services, Corporate Accounts Receivable, Corporate Services, and EDC’s Technology Group, which is responsible for technology solution delivery, support, and infrastructure. Mr. Kember has held various positions of increasing responsibility in the Finance Group, and served as Vice-President and Corporate Controller for five years before taking on his current role. Prior to joining EDC in 1995, he was a senior manager in the Accounting and Audit Group of PricewaterhouseCoopers in Ottawa. Mr. Kember holds a B.A. and a Master of Accounting degree from the University of Waterloo, and is a Chartered Professional Accountant. He is also a graduate of the Senior Executive Program of Columbia University. Mr. Kember serves on the board of Financial Executives International Canada. | | Mairead Lavery Senior Vice-President, Business Development Mairead Lavery was appointed as Senior Vice-President, Business Development in December 2014. Ms. Lavery is responsible for EDC’s business origination and client coverage through the network of EDC’s offices and representations in Canada and overseas, across all industry sectors, all product lines, and all customer segments. Prior to joining EDC, Ms. Lavery worked at Bombardier for 16 years, where she held increasingly senior positions, managing teams of more than 500 employees. She served as Vice-President Finance and Vice-President Strategy, Business Development and Structured Finance for Bombardier’s Aerospace Group and most recently as Vice-President Transformation and Shared Services. A native of Northern Ireland, Ms. Lavery earned a degree in Management and Accounting from Queen’s University Belfast and is also a Fellow of the Institute of Chartered Accountants of Ireland. | | Derek Layne Senior Vice-President, Strategy and Innovation Derek Layne was appointed Senior Vice-President, Strategy and Innovation in 2016, having previously served as SVP, Business Solutions and Innovation, since December 2011. In this capacity, Mr. Layne is responsible for leading the Corporation’s strategy development and economics activities. Mr. Layne held various management positions within EDC’s lending practice and served as EDC’s Chief Risk Officer for four years. He has over 20 years of experience in underwriting international financing. Prior to joining EDC in 1992, Mr. Layne worked for an engineering firm. Mr. Layne holds a Bachelor of Mechanical Engineering degree from Carleton University and a Master of Business Administration degree from the University of Western Ontario. He is also a graduate of the Senior Executive Program of Columbia University. | | Jim McArdle Senior Vice-President and Chief Corporate Advisor Jim McArdle was appointed as Senior Vice-President and Chief Corporate Advisor in 2015. In this capacity, he is responsible for senior-level government engagement and the operationalization of special files for the Executive Management Team. Mr. McArdle previously served as SVP, Corporate Affairs and Secretary between 2012 and 2015 and SVP, Legal Services and Secretary since 2006. Mr. McArdle joined EDC as a Legal Counsel in 1993 and became Senior Legal Counsel in 1994. He was appointed General Counsel and Senior Assistant Secretary in July 2002. Prior to joining EDC, he was a member of a national Toronto law firm for 10 years and is a graduate of Columbia University’s Senior Executive Program. Mr. McArdle holds an LL.B from the University of Western Ontario. | | Clive Witter Senior Vice-President, Insurance Clive Witter was appointed as Senior Vice-President, Insurance in May 2012. Mr. Witter has 30 years of experience in finance and insurance, most of it in senior leadership positions. Originally from the United Kingdom, Mr. Witter has also worked in Canada, Ireland, Belgium, and Hong Kong. Prior to joining EDC, he worked for PricewaterhouseCoopers and then AVIVA Composite Insurance Group, one of the world’s largest insurance companies. His most recent position was as Chief Operating Officer, Continental Europe for Willis International, General Insurance Brokers, based in London, U.K. A Chartered Accountant, Mr. Witter is a graduate of University College of Swansea, Wales. |
EDC Annual Report 2016 51

Contents
53 Financial Results Overview
54 Impact of Foreign Exchange Translation on Financial Results
54 Financial Performance
54 Net Financing and Investment Income
56 Insurance Premiums and Insurance Guarantee Fees
56 Other (Income) Expenses
57 Provision for (Reversal of) Credit Losses
57 Claims-Related Expenses
57 Administrative Expenses
58 Financial Condition
58 Statement of Financial Position Summary
58 Corporate Plan Discussion
60 Portfolio Exposures and Credit Quality
60 Concentration of Exposure
61 Financing Portfolio
64 Insurance Portfolio
66 Marketable Securities and Derivative Instruments
67 Capital Management
68 Off Balance Sheet Arrangements
68 Financial Instruments
68 Risk Management Overview
69 Risk Governance, Oversight and Design
71 Risk Modules
71 Financial Risk
76 Operational Risk Management
76 Strategic Risk Management
77 Critical Accounting Policies and Estimates
77 Change in Accounting Standards
78 Non-IFRS Performance Measures
79 Supplemental Information
52 Changing Trade
Management’s Discussion and Analysis
Management’s Discussion and Analysis (MD&A) should be read in conjunction with our audited consolidated financial statements and related notes for the year ended December 31, 2016.
All amounts are expressed in Canadian dollars.
Caution regarding forward-looking statements
This document contains projections and other forward-looking statements regarding future events. Such statements require us to make assumptions and are subject to inherent risks and uncertainties. These may cause actual results to differ materially from expectations expressed in the forward-looking statements.
Management’s Discussion and Analysis
|
Financial Results Overview |
Following several years where economic uncertainty was the dominant concern, political uncertainty and instability emerged as a key global risk in 2016, especially in developed economies.
The U.S. presidential election process introduced significant uncertainty for investors and consumers around the world. The U.S. economy proved to be resilient with pent up business and consumer demand translating into increased business investment, strong automotive sales and continued recovery in the housing market. The election results and the continuation of Republican control of Congress boosted financial markets at the end of the year on expectations of deregulation and infrastructure spending plans. At the same time it increased uncertainty around North American and international trade policies.
In Europe, the vote to exit Britain from the European Union (EU) toppled the Prime Minister and shocked financial markets just as growth and macroeconomic stability began to return to Europe. Significant terrorist attacks in Europe increased pressure on governments across the continent and led to increased calls within several countries to leave the EU and the euro. Italy’s banking system weakness, along with the failed coup in Turkey, raised further concerns about economic and political stability in and around Europe.
Other markets suffered from their own political uncertainty as a systematic corruption crisis in Brazil resulted in the impeachment of legislators, cabinet members and the President. A corruption crisis also toppled President Park Geun-hye of South Korea and put some of the country’s largest companies under the spotlight.
In Canada, wildfires devastated communities in Alberta and had a significant impact on the province’s energy infrastructure and production capacity in the second quarter of 2016. The fires and their impact on oil production contributed to weaker Canadian economic growth and exports in the first half of 2016.
Despite the lackluster start to the year, the continued strength of the U.S. economy and the strong U.S. dollar began to translate into stronger Canadian exports in the second half of 2016. Tight U.S. production capacity and increased competitiveness of Canadian firms helped boost real export growth. Additionally, the gradual recovery in the price of oil to more than U.S. $53 per barrel at the end of the year, along with the recovery of other commodity prices, supported the overall value of Canadian exports. All of these positive factors culminated in the first Canadian trade surplus in over two years and a surge in exports to markets across the globe. This was evident in our 2016 results as we saw an increase in demand for EDC’s financing products, primarily in the oil and gas, infrastructure and environment and resources sectors.
Our net income for the year was $1,072 million, an increase of $147 million when compared with 2015 mainly due to a reduction in the provision for credit losses as downward credit migration in our loan portfolio was less significant than in 2015. The impact of the provision release was tempered by a reduction in other income due to the volatility associated with our financial instruments carried at fair value.
| | | | | | | | |
for the year ended December 31 (in millions of Canadian dollars) | | 2016 | | | 2015 | |
Net financing and investment income | | | 1,316 | | | | 1,337 | |
| | |
Loan guarantee fees | | | 40 | | | | 41 | |
| | |
Net insurance premiums and guarantee fees | | | 192 | | | | 194 | |
| | | | 1,548 | | | | 1,572 | |
Other (income) expenses | | | 76 | | | | (200) | |
| | |
Administrative expenses | | | 385 | | | | 351 | |
| | |
Provision for (reversal of) credit losses | | | (31) | | | | 437 | |
| | |
Claims-related expenses | | | 46 | | | | 59 | |
Net income | | | $1,072 | | | | $925 | |
EDC Annual Report 2016 53
Management’s Discussion and Analysis
Impact of Foreign Exchange Translation on Financial Results
The Canadian dollar relative to the U.S. dollar was stronger at the end of 2016 resulting in a rate of $0.74 at the end of the year, compared to $0.72 at the end of 2015. The impact of the stronger dollar is a decrease in our assets and liabilities which are primarily denominated in U.S. dollars and are translated to Canadian dollars at rates prevailing at the statement of financial position date. Our business facilitated and the components of net income are translated into Canadian dollars at average exchange rates. The Canadian dollar averaged $0.75 against the U.S. dollar in 2016 compared to $0.78 for 2015.
Had the Canadian dollar remained stable relative to the U.S. dollar throughout 2016:
| | |
| › | | gross loans receivable would have been $56.7 billion, instead of $55.4 billion, an increase of 2%; |
| |
| › | | total assets would have been $64.6 billion, instead of $63.1 billion, an increase of 2%; |
| |
| › | | total business facilitated would have been $99.2 billion, instead of $102.0 billion, a decrease of 3%; and |
| |
| › | | net income would have been $1,032 million, instead of $1,072 million, a decrease of 4%. |
Net Financing and Investment Income
Loan Revenue
Loan revenue was $1,720 million in 2016, an increase of $245 million from 2015. The total yield on our loan portfolio was 3.20%, an increase of 11 basis points compared to the previous year.
Performing loan interest revenue was $1,531 million in 2016, an increase of $271 million compared to 2015. The increase is mainly due to higher yields on our floating rate portfolio, as well as growth in our loan portfolio due to net disbursements of $4,239 million in 2016. In addition, the impact of the stronger U.S. dollar against the Canadian dollar also contributed to the increase in interest revenue, as our loans are primarily denominated in U.S. dollars.
Components of the change in loan revenue from 2015
| | | | |
(in millions of Canadian dollars) | | 2016 | |
Increase in revenue from higher yield | | | 118 | |
| |
Revenue from portfolio growth | | | 99 | |
| |
Foreign exchange impact | | | 54 | |
Increase in performing loan interest revenue | | | 271 | |
| |
Decrease in loan fee revenue | | | (35) | |
| |
Other increases | | | 9 | |
Net change in loan revenue | | | $245 | |
| | |
Yields on our floating rate portfolio increased to 2.65% in 2016 from 2.27% in 2015. Reference rates on our floating rate portfolio increased throughout 2016, contributing to the overall increase in floating rate loan revenue and the higher yield. Our fixed rate portfolio yields decreased to 3.69% from 4.01% due to repayments on older loans with an average yield of 4.67% being replaced by new loans with an average yield of 3.76%. The overall yield on our performing loan portfolio increased by 21 basis points to 2.87%. Loan fee revenue decreased by $35 million to $165 million in 2016. In 2015, the impact of the immediate recognition of deferred revenue as a result of events such as loan prepayments was more significant. For a breakdown of loan interest yield on our fixed and floating rate portfolios, refer to Table 1 in Supplemental Information. | | Loan Revenue Loan Interest Yield 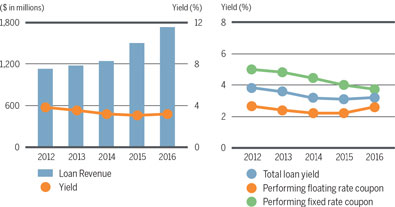
|
54 Changing Trade
Management’s Discussion and Analysis
Marketable Securities Revenue
| | | | |
We maintain a marketable securities portfolio in order to meet our liquidity requirements. Our Board approved risk management policies require us to maintain sufficient liquidity to meet a prescribed minimum level based on forecasted cash requirements. Our marketable securities revenue consists of income earned on short-term instruments, bonds and government securities held during the year. In 2016, marketable securities revenue increased by $13 million to $73 million mainly as a result of higher yields. Our marketable securities portfolio is mainly sensitive to long-term U.S. Treasury rates. As these rates increased in 2016, the yield on our marketable securities portfolio increased from 0.94% in 2015 to 1.08% in 2016. | | Marketable Securities Revenue 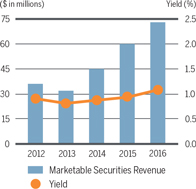
|
Components in the change in marketable securities revenue from 2015 | | | |
| (in millions of Canadian dollars) | | 2016 | |
Increase in revenue from yield | | 9 | |
Impact of portfolio growth | | 2 | |
Foreign exchange impact | | 2 | |
Net change in marketable securities revenue | | $13 | |
Interest Expense
| | |
Our interest expense includes the cost of our debt and related derivatives. It also includes the impact of the floating rate currency swaps used to reduce the foreign currency risk related to using our capital to fund U.S. dollar denominated assets. These currency swaps are set up with the objective to offset U.S. dollar assets and liabilities with a U.S. dollar payable component and a Canadian dollar receivable component. This also allows us to hold our marketable securities portfolio, described above, largely in U.S. dollars without taking on foreign exchange risk. We have been earning revenue on these currency swaps as the Canadian dollar interest rates applicable to the receivable component of these swaps have been higher than the U.S. dollar rates on their payable component. Interest expense totalled $450 million in 2016, an increase of $267 million from 2015 mainly as a result of increased cost of funds. Our cost of funds increased from 0.40% to 0.89% as we issued our debt at higher rates primarily due to increases in the U.S. London Interbank Offered Rate (LIBOR). In addition, our average debt outstanding increased, largely driven by net loan disbursements. | | Interest Expense 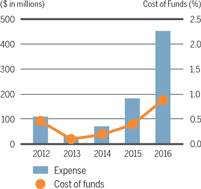
|
Components of the change in interest expense from 2015
| | | | |
| (in millions of Canadian dollars) | | 2016 | |
Increase in expense from higher cost of funds | | | 164 | |
| |
Impact of portfolio growth | | | 60 | |
| |
Decrease in revenue on currency swaps related to our capital | | | 38 | |
| |
Foreign exchange impact | | | 5 | |
Net change in interest expense | | | $267 | |
| | |
The net revenue generated by the capital related currency swaps was $7 million in 2016, a reduction of $38 million from 2015; this is due to a decrease in the spread between the Canadian Dollar Offered Rate (CDOR) on the receivable component and the LIBOR on the payable component. The average spread narrowed as the U.S. LIBOR rate increased throughout the year due to various market factors. | | |
|
| EDC Annual Report 2016 55 |
Management’s Discussion and Analysis
| | |
| Net Finance Margin | | |
| |
The net finance margin represents net financing and investment income expressed as a percentage of average income earnings assets. Net financing and investment income consists of loan, marketable securities, investment and leasing revenues net of interest expense and leasing and financing related expenses. Our net finance margin was 2.14% in 2016, a 30 basis point decline from 2015 largely due to a reduction in the revenue earned on our capital swaps, lower yields on our fixed rate loan portfolio and a decrease in loan fee revenue. The variability in the net finance margin over the past five years is largely a result of a decline in the yields on our fixed rate loan portfolio, a reduction in the revenue earned on our capital swaps and a decrease in the spreads earned on our floating rate loan portfolio. We expect our net finance margin to decline slightly in 2017 due to continued pressure on our fixed rate loan yields and the spreads earned on our floating rate portfolio. For a breakdown of net finance margin, refer to Table 2 in Supplemental Information. | | Net Finance Margin 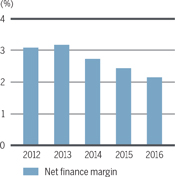
|
Insurance Premiums and Insurance Guarantee Fees
Premium and guarantee fee revenue earned in our insurance program in 2016 totalled $192 million, consistent with 2015; however, there were fluctuations in revenue within the individual product groups.
Net insurance premiums earned under our contract insurance and bonding product group totalled $62 million, an increase of $7 million from 2015 due to increased activity in the oil and gas and the infrastructure and environment sectors with several key exporters.
Net insurance premiums earned under our political risk insurance product group totalled $9 million, a decrease of $9 million from 2015 due to the expiry of a large policy, as well as the increased use of reinsurance in our efforts to mitigate risk.
For the breakdown of insurance premiums and guarantee fees, refer to Table 3 in Supplemental Information.
Other (Income) Expenses
Other expense was $76 million in 2016 compared to income of $200 million in 2015.
We have designated the majority of our loans payable at fair value through profit or loss in order to obtain the same accounting treatment as their related derivatives. In general, these derivatives are entered into to manage interest and foreign exchange rate risks on the related loans payable.
In accordance with International Financial Reporting Standards (IFRS), our loans payable are valued on the basis of our credit rating (AAA) while the related derivatives are valued based on the credit risk of the resulting exposure. During 2016, the net gains on our loans payable were smaller than the net losses on the related derivatives as rates used to value our loans payable increased less than the rates used to value the related derivatives leading to net realized and unrealized losses of $59 million. In contrast, in 2015, the rates used to value our loans payable increased at a greater magnitude than those used to value our derivatives leading to net realized and unrealized gains of $92 million.
| | | | | | | | |
| | | |
(in millions of Canadian dollars) | | 2016 | | | 2015 | |
Net realized and unrealized loss on derivatives related to loans payable | | | 89 | | | | 97 | |
| | |
Net realized and unrealized gain on loans payable designated at fair value through profit or loss | | | (30 | ) | | | (189 | ) |
| | |
Net realized and unrealized gain on investments at fair value through profit or loss | | | (40 | ) | | | (51 | ) |
| | |
Net realized and unrealized loss on marketable securities at fair value through profit or loss | | | 19 | | | | 13 | |
| | |
(Gain) loss on sale of aircraft* | | | 21 | | | | (45 | ) |
| | |
Foreign exchange translation (gain) loss | | | 9 | | | | (11 | ) |
| | |
Other | | | 8 | | | | (14 | ) |
| | |
Total other (income) expenses | | | $76 | | | | $(200 | ) |
* Refer to Notes 8 and 9 of the consolidated financial statements.
In 2016, our investments portfolio experienced realized losses of $17 million (2015 – gains of $66 million) and unrealized gains of $57 million (2015 – losses of $15 million). The realized losses were primarily due to dispositions of direct investments whereas the unrealized gains stemmed from valuation adjustments related to our fund investments.
Our marketable securities portfolio is mainly sensitive to long-term U.S. Treasury rates. In 2016, the marketable securities portfolio experienced unrealized losses of $27 million (2015 – losses of $17 million), a reflection of the continued increase in long-term U.S. Treasury rates. In addition, as we rebalanced the portfolio, securities bearing higher coupons than prevailing market rates were sold and generated realized gains of $8 million (2015 – $4 million).
Management’s Discussion and Analysis
Provision for (Reversal of) Credit Losses
In 2016, we recorded a reversal of provision for credit losses of $31 million related to our loan portfolio. The reversal of provision was primarily due to the impact of updates to the models used to generate the probability of default and loss given default assumptions used in the allowance calculation in 2016. Refer to page 105 for further discussion on the model updates. In 2015, our provision for credit losses was $437 million largely due to the addition of a $265 million market overlay in the extractive sector and downward credit migration that occurred mainly in the extractive portfolio. Refer to page 63 for further discussion on the market overlay in the extractive sector.
For a breakdown of the provision for (reversal of) credit losses, refer to Table 4 in Supplemental Information.
Claims-Related Expenses
We paid $110 million in claims in 2016, a decrease of $33 million over the prior year mainly due to a reduction in claims related to losses for buyers in the resources sector within our credit insurance product group.
| | | | | | | | |
| | | |
(in millions of Canadian dollars) | | 2016 | | | 2015 | |
Claims paid | | | 110 | | | | 143 | |
| | |
Claims recovered | | | (14 | ) | | | (15 | ) |
| | |
Claims recovered from reinsurers | | | (9 | ) | | | – | |
| | |
Actuarial decrease in the net allowance for claims on insurance* | | | (33 | ) | | | (55 | ) |
| | |
Increase in recoverable insurance claims | | | (10 | ) | | | (16 | ) |
| | |
Claims handling expenses | | | 2 | | | | 2 | |
| | |
Total claims-related expenses | | | $46 | | | | $59 | |
* Refer to Note 19 of the consolidated financial statements.
Administrative Expenses
| | |
Administrative expenses for 2016 totalled $385 million, an increase of $34 million from the prior year. We are making significant investments in our business, which are necessary to fulfill our mandate of supporting Canadian exporters, including a large scale transformation effort to modernize our systems and the build out of our enterprise risk management framework. As a result of these investments, we experienced an increase in human resources and professional services costs in 2016. The Productivity Ratio (PR) captures how well we use our resources and ultimately manage our costs. As expected, as we invest in our business, the 2016 PR of 27.2% was less favourable than the 22.9% in 2015; however, it is within our targeted range for the year of 25% to 30%. | | Administrative Expenses 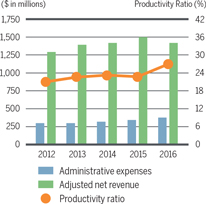
|
|
| EDC Annual Report 2016 57 |
Management’s Discussion and Analysis
Statement of Financial Position Summary
Total Assets were $63.1 billion at the end of 2016, an increase of $2.1 billion, or 3% from 2015. This is mainly due to an increase in our loans receivable.
Loans Receivable – Loans receivable were $55.3 billion, an increase of $2.2 billion or 4% from 2015 due to net loan disbursements of $4.2 billion, partially offset by foreign exchange translation of $1.8 billion.
Loans Payable – Loans payable were $49.1 billion compared to $46.9 billion in 2015, an increase of $2.2 billion. The increase is mainly due to net debt issuances which were used to fund net loan disbursements. Our borrowing requirements are largely driven by activity within our loans receivable portfolio.
| | | | | | | | |
as at December 31 (in millions of Canadian dollars) | | 2016 | | | 2015 | |
Cash and marketable securities | | | 7,389 | | | | 7,694 | |
| | |
Derivative instruments | | | 324 | | | | 350 | |
| | |
Loans receivable | | | 55,250 | | | | 53,136 | |
| | |
Allowance for losses on loans | | | (1,552 | ) | | | (1,715) | |
| | |
Investments at fair value through profit or loss | | | 1,005 | | | | 848 | |
| | |
Other | | | 708 | | | | 656 | |
Total Assets | | | $63,124 | | | | $60,969 | |
| | |
Loans payable | | | 49,101 | | | | 46,909 | |
| | |
Derivative instruments | | | 2,819 | | | | 3,434 | |
| | |
Premium and claims liabilities | | | 656 | | | | 688 | |
| | |
Other liabilities | | | 785 | | | | 773 | |
| | |
Equity | | | 9,763 | | | | 9,165 | |
| | |
Total Liabilities and Equity | | | $63,124 | | | | $60,969 | |
Corporate Plan Discussion
The following section discusses our 2016 results and financial position in comparison to Corporate Plan projections. We begin by looking back to our 2016 Corporate Plan and compare actual results to what was expected. Then we look forward to 2017 and provide an explanation of where we anticipate changes from our 2016 results and financial position.
Financial Performance
| | | | | | | | | | | | |
for the year ended December 31 (in millions of Canadian dollars) | | 2017 Corporate Plan | | | 2016 Actual Results | | | 2016 Corporate Plan | |
Net financing and investment income | | | 1,258 | | | | 1,316 | | | | 1,146 | |
| | | |
Insurance premiums and guarantee fees* | | | 243 | | | | 232 | | | | 238 | |
| | | |
Other (income) expenses | | | (31) | | | | 76 | | | | (76) | |
| | | |
Administrative expenses | | | 458 | | | | 385 | | | | 400 | |
| | | |
Provision for (reversal of) credit losses | | | 221 | | | | (31 | ) | | | 73 | |
| | | |
Claims-related expenses | | | 59 | | | | 46 | | | | 80 | |
Net income | | | 794 | | | | 1,072 | | | | 907 | |
| | | |
Other comprehensive income | | | 102 | | | | 26 | | | | 75 | |
| | | |
Comprehensive income | | | $896 | | | | $1,098 | | | | $982 | |
* Includes loan guarantee fees.
Management’s Discussion and Analysis
2016 Corporate Plan
Net income for 2016 was $1,072 million, $165 million higher than the 2016 Corporate Plan net income of $907 million. Items of note are as follows:
| | |
| › | | Net financing and investment income was $170 million higher than the Corporate Plan mainly due to the impact of a weaker Canadian dollar in relation to the U.S. dollar and higher net loan disbursements than was anticipated in the Plan. |
| |
| › | | Other income was $152 million lower than the Corporate Plan mainly due to realized losses on our investments portfolio as a result of weaker private equity market activity than projected in the Plan. In addition, we experienced volatility associated with our financial instruments carried at fair value. Due to the volatility and difficulty in estimating fair value gains or losses on financial instruments, no forecast for these items is included in the Corporate Plan. |
| |
| › | | We recorded a reversal of provision for credit losses of $31 million compared to a provision charge of $73 million in the Corporate Plan primarily due to the impact of the updated probability of default and loss given default models which resulted in a higher reversal of provision than contemplated in the Plan. |
2017 Corporate Plan
Net income for 2017 is planned to be $794 million, $278 million less than 2016. Items of note are as follows:
| | |
| › | | Provision for credit losses are projected to be $252 million higher mainly as a result of the release of provision in 2016 due to the impact of the updated probability of default and loss given default models. |
| |
| › | | Administrative expenses are expected to increase in 2017 due to the significant investments we are making in our business, resulting in additional human resource and depreciation costs as described below: |
| | | | |
| | › | | Investment in our strategy to: |
| | | | | | |
| | • | | build brand awareness; |
| | |
| | • | | anticipate and respond to the needs of Canadian companies to further their international growth; and |
| | |
| | • | | create new trade opportunities and increase trade diversification to help Canadian companies succeed internationally. |
| | | | |
| | › | | we are investing in a large scale transformation effort to replace and enhance our credit insurance systems and other systems to improve the ease of doing business for our customers; and |
| | › | | we are investing in the build out of our enterprise risk management framework. |
| | |
| › | | Net financing and investment income is projected to be $58 million lower than 2016, mainly due to a decrease in the overall yield on our loan portfolio as the forecast for spreads on our new loans are less than the spreads on the loans coming off our books. |
| |
| › | | We are projecting other income of $31 million compared to other expense of $76 million in 2016. In 2017 we are projecting realized gains on investments due to anticipated improvement in private equity market activity. Also contributing to the change is the volatility associated with our financial instruments carried at fair value. |
| |
| › | | Pension plan re-measurement gains are projected to be $102 million compared to $26 million in 2016, mainly due to a projected increase in the discount rate used to value our pension obligations. |
Financial Position
| | | | | | | | | | | | |
as at December 31 (in millions of Canadian dollars) | | 2017 Corporate Plan | | | 2016 Actual Results | | | 2016 Corporate Plan | |
Cash and marketable securities | | | 6,036 | | | | 7,389 | | | | 5,856 | |
| | | |
Derivative instruments | | | 519 | | | | 324 | | | | 449 | |
| | | |
Loans receivable | | | 58,705 | | | | 55,250 | | | | 48,999 | |
| | | |
Allowance for losses on loans | | | (1,826) | | | | (1,552 | ) | | | (1,182) | |
| | | |
Investments at fair value through profit or loss | | | 978 | | | | 1,005 | | | | 809 | |
| | | |
Other assets | | | 537 | | | | 708 | | | | 754 | |
| | | |
Total Assets | | | $64,949 | | | | $63,124 | | | | $55,685 | |
| | | |
Loans payable | | | 51,669 | | | | 49,101 | | | | 43,001 | |
| | | |
Derivative instruments | | | 2,400 | | | | 2,819 | | | | 2,287 | |
| | | |
Premium and claims liabilities | | | 481 | | | | 656 | | | | 487 | |
| | | |
Other liabilities | | | 742 | | | | 785 | | | | 568 | |
| | | |
Equity | | | 9,657 | | | | 9,763 | | | | 9,342 | |
| | | |
Total Liabilities and Equity | | | $64,949 | | | | $63,124 | | | | $55,685 | |

|
| EDC Annual Report 2016 59 |
Management’s Discussion and Analysis
2016 Corporate Plan
Cash and marketable securities were $1.5 billion higher than Corporate Plan mainly due to a growing portfolio to meet higher liquidity requirements and a weaker Canadian dollar than projected in the Corporate Plan.
Loans receivable totalled $55.3 billion at the end of 2016, $6.3 billion higher than Corporate Plan primarily as a result of a weaker Canadian dollar and a higher 2016 opening loans receivable balance than contemplated in the Corporate Plan.
Loans payable for 2016 were $6.1 billion higher than projected in the Corporate Plan as a result of foreign exchange translation and the funding required for net loan disbursements.
2017 Corporate Plan
The Corporate Plan is projecting loans receivable to be $58.7 billion at the end of 2017, which is $3.4 billion higher than the actual December 31, 2016 loans receivable amount. Loans receivable for 2017 were projected using a forecast 2016 loans receivable position as the starting point. At the time of preparing the 2017 Corporate Plan, loans receivable were projected to grow in 2016 by $1.1 billion resulting in loans receivable of $54.2 billion. However, actual results for 2016 were higher than anticipated, mainly due to higher net disbursements as well as foreign exchange translation. Consequently, it is likely that both loans receivable and net financing and investment income will be higher in 2017 than projected in the Corporate Plan. As mentioned previously, our borrowing requirements are largely driven by activity in our loans receivable portfolio and therefore it is likely that our loans payable will also be higher in 2017.
Portfolio Exposures and Credit Quality
Concentration of Exposure
EDC’s total exposure at the end of 2016 was $112.1 billion, a decrease of $0.9 billion from 2015 primarily due to a decline in our insurance portfolio. The majority of the exposure in 2016 was within the United States (23%) and Canada (23%).
Exposure by Portfolio
| | | | | | | | |
as at December 31 (in millions of Canadian dollars) | | 2016 | | | 2015 | |
Financing portfolio: | | | | | | | | |
| | |
Financing assets(1) | | | 56,380 | | | | 54,241 | |
| | |
Commitments and guarantees(2) | | | 25,320 | | | | 26,448 | |
| | |
Total financing portfolio | | | 81,700 | | | | 80,689 | |
Insurance portfolio: | | | | | | | | |
| | |
Credit insurance | | | 9,480 | | | | 9,390 | |
| | |
Financial institutions insurance | | | 3,900 | | | | 4,872 | |
| | |
Contract insurance and bonding(3) | | | 8,171 | | | | 8,906 | |
| | |
Political risk insurance | | | 1,392 | | | | 1,396 | |
| | |
Reinsurance ceded(4) | | | (250 | ) | | | (250 | ) |
| | |
Total insurance portfolio | | | 22,693 | | | | 24,314 | |
| | |
Marketable securities and derivative instruments(5) | | | 7,713 | | | | 8,044 | |
| | |
Total exposure | | | $112,106 | | | | $113,047 | |
| (1) | Includes gross loans receivable, investments and gross investment in aircraft under finance leases. |
| (2) | Includes $914 million of investment commitments (2015 – $903 million). |
| (3) | Includes $7,499 million of insurance guarantees (2015 – $8,181 million). |
| (4) | Represents treaty reinsurance agreements covering most bonding obligors and the short-term export credit insurance portfolio, including most foreign bank exposures. |
For a detailed breakdown of the major concentrations of total gross exposure by geographical market and industry, refer to Tables 5 and 6 in Supplemental Information.
Exposure by Geographic Market
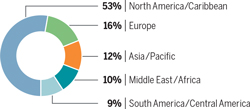
Exposure by Industry
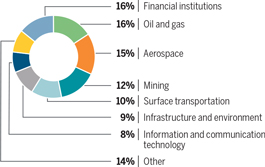
Management’s Discussion and Analysis
Financing Portfolio
Loans Portfolio
We enable Canadian exports and Canadian investments abroad by providing financing solutions to Canadian exporters and their foreign customers, to Canadian investors and to financial institutions. Not only do we provide solutions for exporters with existing contracts, we also proactively identify potential procurement needs for large foreign buyers as well as large foreign projects and provide financing in order to develop opportunities for procurement from Canadian companies which we refer to as pull facilities. Our financing products enable Canadian companies to provide their customers with flexible financing. To mitigate credit risk within our loan portfolio, we enter into risk transfer transactions such as unfunded loan participations and loan default insurance.
| | |
| Gross Loans Receivable | | |
Gross loans receivable totalled $55,375 million at the end of 2016, an increase of $2,049 million or 4% from 2015. The growth was due to net loan disbursements, partially offset by foreign exchange translation. Net loan disbursements were $4,239 million for the year, which can be attributed to large net disbursements in the information and communication technology and the mining sectors. The stronger Canadian dollar decreased gross loans receivable by $1,783 million, with the majority of this attributed to loans denominated in U.S. dollars. In assessing the credit risk profile of our loan portfolio, we rate our obligors using a system of credit ratings as established in our credit risk rating methodology. These ratings are reviewed on a regular basis. Based on their ratings, we then categorize our loans receivable into three risk classifications: investment grade, non-investment grade and impaired. | | Gross Loans Receivable 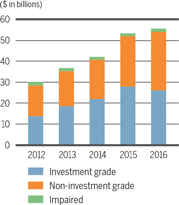
|
Individually Impaired Gross Loans Receivable
Impaired loans represent loans for which we no longer have reasonable assurance that the full amount of principal and interest will be collected on a timely basis in accordance with the terms of the loan agreement. At the end of 2016, impaired gross loans receivable totalled $1,037 million, an increase of $94 million from the end of 2015. Overall, impaired loans as a percentage of total gross loans receivable increased to 1.88% in 2016 from 1.77% in 2015.
Note 5 in the consolidated financial statements provides additional information on the activity in our impaired loans portfolio during the year.
Table 7 in Supplemental Information provides industry concentration on impaired gross loans receivable.
Commercial Loans, Loan Commitments and Loan Guarantees
| | | | | | | | | | | | | | | | | | | | | | | | | | | | | | | | |
(in millions of Canadian dollars) | |
| Gross loans
receivable |
| | | Commitments | | |
| Loan
guarantees |
| | | Risk Transfer | | | | 2016 Exposure | | | | 2015 Exposure | |
Industry | | | | | | | | | | | | | | | | | | | $ | | | | % | | | | $ | | | | % | |
Oil and gas | | | 10,666 | | | | 7,103 | | | | 266 | | | | (2,028) | | | | 16,007 | | | | 21 | | | | 15,645 | | | | 20 | |
Aerospace | | | 13,092 | | | | 2,519 | | | | 96 | | | | (99) | | | | 15,608 | | | | 20 | | | | 16,139 | | | | 22 | |
Mining | | | 8,421 | | | | 1,832 | | | | 101 | | | | (739) | | | | 9,615 | | | | 12 | | | | 10,710 | | | | 14 | |
Surface transportation | | | 5,201 | | | | 3,215 | | | | 615 | | | | – | | | | 9,031 | | | | 11 | | | | 8,815 | | | | 11 | |
Financial institutions | | | 4,278 | | | | 905 | | | | 5 | | | | 3,066 | | | | 8,254 | | | | 11 | | | | 7,057 | | | | 9 | |
Information and communication technology | | | 5,785 | | | | 1,610 | | | | 395 | | | | (355) | | | | 7,435 | | | | 10 | | | | 8,373 | | | | 11 | |
Infrastructure and environment | | | 4,170 | | | | 2,491 | | | | 279 | | | | – | | | | 6,940 | | | | 9 | | | | 6,542 | | | | 8 | |
Light manufacturing | | | 1,436 | | | | 1,417 | | | | 513 | | | | – | | | | 3,366 | | | | 4 | | | | 2,569 | | | | 3 | |
Resources | | | 1,017 | | | | 528 | | | | 155 | | | | – | | | | 1,700 | | | | 2 | | | | 1,515 | | | | 2 | |
Total | | | $54,066 | | | | $21,620 | | | | $2,425 | | | | $(155) | | | | $77,956 | | | | 100 | | | | $77,365 | | | | 100 | |
The exposure in the commercial loans portfolio was consistent with 2015. In order to manage our concentration risk, we enter into unfunded loan participation and loan default insurance agreements with financial institutions and sovereign entities, thereby transferring exposure from other industries to the financial institutions industry and sovereign entities. These risk transfer activities contributed to the increased exposure in the financial institutions industry.
|
| EDC Annual Report 2016 61 |
Management’s Discussion and Analysis
In 2016, non-investment grade exposure accounted for 48% (2015 – 42%). The increase in non-investment grade exposure is mostly attributable to the oil and gas and mining sectors. The largest concentrations of non-investment grade exposures are within the aerospace (26%), oil and gas (23%) and mining sectors (16%).
Our five most significant counterparty exposures representing $7,761 million, or 10% of the total commercial exposure at the end of 2016 were as follows:
| | | | |
| | › | | two oil and gas obligors with total exposure of $3,329 million, located in Brazil and Mexico; |
| | |
| | › | | two aerospace obligors with total exposure of $2,959 million, located in the United States; and |
| | |
| | › | | one mining obligor with total exposure of $1,473 million, located in Brazil. |
After considering collateral and other risk mitigation strategies, our exposure to these counterparties represents $4,247 million.
Sovereign Loans, Loan Commitments and Loan Guarantees
| | | | | | | | | | | | | | | | | | | | | | | | | | | | | | | | |
(in millions of Canadian dollars) | |
| Gross loans
receivable |
| | | Commitments | | |
| Loan
guarantees |
| |
| Risk
transfer |
| | | 2016 Exposure | | | | 2015 Exposure | |
Country | | | | | | | | | | | | | | | | | | | $ | | | | % | | | | $ | | | | % | |
| | | | | | | | |
Angola | | | 247 | | | | 272 | | | | – | | | | – | | | | 519 | | | | 28 | | | | – | | | | – | |
| | | | | | | | |
Serbia | | | 252 | | | | – | | | | – | | | | – | | | | 252 | | | | 14 | | | | 305 | | | | 20 | |
| | | | | | | | |
Ukraine | | | 197 | | | | – | | | | – | | | | – | | | | 197 | | | | 11 | | | | 270 | | | | 18 | |
| | | | | | | | |
Indonesia | | | 192 | | | | – | | | | – | | | | – | | | | 192 | | | | 11 | | | | 235 | | | | 16 | |
| | | | | | | | |
China | | | 93 | | | | – | | | | – | | | | – | | | | 93 | | | | 5 | | | | 25 | | | | 2 | |
| | | | | | | | |
Uruguay | | | – | | | | – | | | | 89 | | | | – | | | | 89 | | | | 5 | | | | 105 | | | | 7 | |
| | | | | | | | |
Rwanda | | | 74 | | | | – | | | | – | | | | – | | | | 74 | | | | 4 | | | | 86 | | | | 6 | |
| | | | | | | | |
Pakistan | | | 68 | | | | – | | | | – | | | | – | | | | 68 | | | | 4 | | | | 74 | | | | 5 | |
| | | | | | | | |
Argentina | | | 61 | | | | – | | | | – | | | | – | | | | 61 | | | | 3 | | | | 77 | | | | 5 | |
| | | | | | | | |
Other | | | 125 | | | | – | | | | – | | | | 155 | | | | 280 | | | | 15 | | | | 329 | | | | 21 | |
Total | | | $1,309 | | | | $272 | | | | $89 | | | | $155 | | | | $1,825 | | | | 100 | | | | $1,506 | | | | 100 | |
Sovereign exposure increased by 21% as a result of a financing agreement with the Republic of Angola to purchase locomotives.
Sovereign exposure includes 71% of non-investment grade exposure (2015 – 64%).
Allowance for Losses on Loans, Loan Commitments and Loan Guarantees
The total allowance for losses on loans, loan commitments and loan guarantees was $1,735 million at the end of 2016 a decrease of $196 million from the 2015 allowance.
The key components impacting the allowance in 2016 were as follows:
| | | | |
| | › | | write-off of impaired loans (net of recoveries) – reduction of $177 million; |
| | |
| | › | | updated probability of default and loss given default models (refer to page 105) – reduction of $137 million; |
| | |
| | › | | change in portfolio composition – increase of $78 million; and |
| | |
| | › | | downward credit migration – increase of $37 million. |
Management’s Discussion and Analysis
| | | | | | | | | | | | |
Components of the Allowance | | | | | | | | | | | | |
(in millions of Canadian dollars) | | | | | 2016 | | | | 2015 | | | |
Base allowance | | | | | 1,169 | | | | 1,056 | | | |
| | | | |
Counterparty concentration | | | | | 27 | | | | 45 | | | |
| | | | |
Market overlay – extractive | | | | | – | | | | 265 | | | |
Total collective allowance | | | | | 1,196 | | | | 1,366 | | | |
| | | | |
Allowance for individually impaired loans, loan commitments and loan guarantees | | | | | 539 | | | | 565 | | | |
Total allowance for losses on loans, loan commitments and loan guarantees | | | | | $1,735 | | | | $1,931 | | | |
For a breakdown of the collective allowance for losses on loans, loan commitments and loan guarantees by industry of risk, refer to Table 8 in Supplemental Information. | | | |
Base Allowance
We classify our performing exposure into categories based on obligor credit rating, industry of risk for commercial obligors and whether the exposure is secured. For exposures that are secured by collateral or subject to other risk mitigation measures, such as unfunded loan participations and loan default insurance, the exposure for each obligor is reduced by the fair value of collateral adjusted for estimated repossession costs or the amount of risk mitigation as applicable. Based on these exposures we determine the appropriate base allowance. Probability of default and loss given default are estimated based on historical loan loss rates, residual value, expert judgement, management assumption or model-based approaches.
Counterparty Concentration Overlay
A concentration component is added to adequately provision for sovereign and commercial counterparties whose level of exposure is deemed by management to represent an increased amount of risk. A counterparty whose exposure exceeds 10% of our equity based on the previous year’s audited financial statements will attract a concentration component calculated on the portion of exposure over the threshold. The allowance on this portion of exposure is calculated on the same basis as the base allowance for that counterparty.
We had a concentration overlay of $27 million, a decrease of $18 million from 2015 mainly due to the increase of the concentration threshold, as well as the reduction in exposure from obligors who do meet the threshold.
Market Overlays
Market overlays are added to our allowance as required to reflect the risk that the impact of recent economic events is not fully captured in current credit ratings. Our 2015 allowance included a $265 million market overlay within three sub-sectors of our extractive portfolio. The three sub-sectors were oil field services, metal mining and coal and oil and gas exploration and production. The market overlay was established at the end of 2015 to reflect the elevated risk in these sub-sectors and was removed in 2016 as credit ratings were updated and the impact of the increased risk was reflected in the base allowance.
Individual Allowances
We establish allowances for individually impaired loans, loan commitments and loan guarantees to recognize impairment losses. Individual allowances were $539 million at the end of 2016, a decrease of $26 million from 2015. The impact of new impairments across our portfolio was offset by the reduction in allowance on loans written off during the year, the improved outlook of impaired obligors in the extractive industry and the impact of obligors being reclassified to performing.
Investments
EDC plays a role in helping Canadian companies access capital and financing. We maintain a portfolio of venture capital and private equity investments focused on promising Canadian late-stage start-ups or established small and mid-sized entities to aid these companies in growing and expanding beyond the Canadian border. In addition, we invest offshore with an emphasis on emerging markets where such investments can serve to facilitate the connection of Canadian business activity to international markets. Our investments are made both directly into Canadian businesses and into funds which in turn invest in Canadian or foreign businesses. With the goal of growing Canadian exporters and facilitating foreign business connections, investments are normally held for periods greater than five years. Divestitures are generally made through the sale of our investment interests through private sales to third parties or sales on public markets.
Consistent with our business goal of growing investments, our exposure increased by $170 million to $1,919 million in 2016 largely as a result of new commitments. During the year, we signed an additional $249 million of investment arrangements (2015 – $351 million).
Refer to Table 9 in Supplemental Information for a breakdown of exposure for our investments.
|
| EDC Annual Report 2016 63 |
Management’s Discussion and Analysis
Insurance Portfolio
Credit insurance facilitates export growth by mitigating risk, providing companies with the confidence to do business abroad knowing that their receivables will be paid should their buyer default on payment. It also enhances their cash flow as banks are generally comfortable providing additional support when their customers’ foreign receivables are insured.
Financial institutions insurance provides coverage to Canadian banks for foreign bank and foreign buyer counterparty risk in trade transactions.
EDC’s bonding products are delivered through partnerships with banks and surety companies. Our performance security and surety bond products are used by exporters primarily to guarantee their contract performance, which helps free up working capital. Our partnerships with banks and surety companies help them mitigate their risks and make it easier for exporters to obtain the coverage they need. We provide contract frustration insurance coverage to protect against commercial and political risks resulting from buyer non-payment associated with a specific contract.
As companies diversify their supply and distribution networks and expand into new markets, they are often exposed to political risks that can result in significant losses. This is particularly true of emerging markets, where political events could adversely impact a company’s foreign operations. EDC’s political risk insurance provides peace of mind to companies and their financial intermediaries that, when faced with such risks, their assets will be protected, enabling them to take advantage of export and investment opportunities in emerging markets.
The assistance that EDC provides to our policyholders within our four primary insurance product groups is counted in various ways. Under the credit insurance and financial institutions insurance product groups, the policyholder declares their sales volume to entities covered by their policy. These declarations are counted as business facilitated for these product groups. Within our contract insurance and bonding product group, a facility is established and the policyholder makes requests for cover to initiate specific coverage. These requests represent business facilitated by EDC. As transactions are signed within our political risk insurance product group, they are also counted as business facilitated.
In addition to directly underwriting insurance policies, we assume exposure from other insurers to fulfill our mandate to support Canadian exporters. We also cede reinsurance to other insurance companies to mitigate our risk. The ceding arrangements provide greater diversification of the business and minimize the net loss potential arising from large exposures.
Insurance in Force
Our liability associated with outstanding insurance policies and guarantees is referred to as insurance in force and exposure throughout this annual report.
Insurance in force totalled $22,693 million at the end of 2016, compared to the 2015 level of $24,314 million.
The following charts show the exposure by industry of our credit insurance and contract insurance and bonding product groups:
| | |
Credit Insurance Exposure by Industry | | Contract Insurance and Bonding Exposure by Industry |
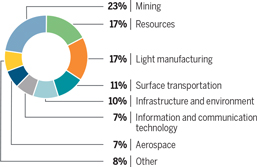 | | 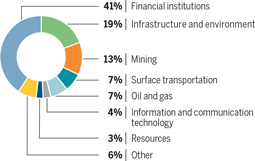 |
The following charts show the exposure by geographic market for our financial institutions and political risk insurance product groups:
| | |
Financial Institutions Insurance Exposure by Geographic Market | | Political Risk Insurance Exposure by Geographic Market |
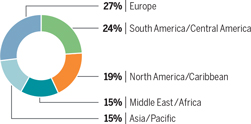 | | 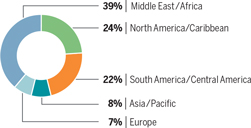 |
Management’s Discussion and Analysis
Claims
| | | | | | | | | | | | | | | | | | |
The following table provides a breakdown of claims paid by exporter’s insured sector: | | Claims Submitted, Paid and Under Consideration 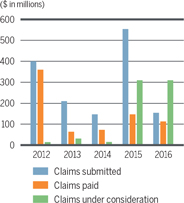
|
(in millions of Canadian dollars) | | 2016 | | | 2015 | |
| | | | $ | | | | % | | | | $ | | | % | |
Infrastructure and environment | | | 28 | | | | 25 | | | | 22 | | | 15 | |
Resources | | | 24 | | | | 22 | | | | 98 | | | 69 | |
Mining | | | 23 | | | | 21 | | | | 3 | | | 2 | |
Light manufacturing | | | 14 | | | | 13 | | | | 11 | | | 8 | |
Surface transportation | | | 10 | | | | 9 | | | | 1 | | | 1 | |
Information and communication technology | | | 9 | | | | 8 | | | | 5 | | | 3 | |
Oil and gas | | | 2 | | | | 2 | | | | 3 | | | 2 | |
Claims paid | | | 110 | | | | 100 | | | | 143 | | | 100 | |
Claims recovered | | | (23) | | | | | | | | (15) | | | | |
Net claims paid | | | $87 | | | | | | | | $128 | | | | |
Claim payments totalled $110 million in 2016 and were comprised of 696 claims related to losses in 70 countries (2015 – 665 claims in 75 countries). In 2016, the largest concentration of claim payments was made under our credit insurance product group for default and insolvency geographically concentrated in the Americas. | | |
In 2016, we recovered $24 million in total (2015 – $17 million) of which $1 million was disbursed to exporters (2015 – $2 million). | | |
For a breakdown of claims by size concentration, refer to Table 10 in Supplemental Information. | | |
Premium and Claims Liabilities | | |
Premium and claims liabilities represent our estimate of future claims under the terms and conditions of our insurance policies. | | Premium and Claims Liabilities as a % of Insurance in Force (net of reinsurance) 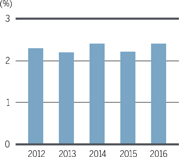
|
At the end of 2016, the premium and claims liabilities were $656 million. The liability net of the reinsurers’ share was $540 million, a decrease of $7 million from 2015. The most significant components impacting the net premium and claims liabilities were as follows: | |
› severity of loss assumption update for sovereign and government related entities portfolio (refer to pages 112 to 113) – decrease of $75 million; and | |
› heightened risk primarily in our political risk insurance product group – increase of $65 million. | |
These items also impacted the calculation for potential claims on insurance policies that we have ceded to reinsurance companies, reducing the amount to $116 million from $141 million in 2015. The reinsurance ceded amount, recorded as an asset on the consolidated statement of financial position, represents the reinsurers’ share of our premium and claims liabilities and is also included in our premium and claims liabilities. If we were required to pay out a claim on these policies we could recover from the reinsurer depending on the terms of the agreement. | |
The net premium and claims liabilities as a percentage of the insurance in force was 2.4% in 2016 (2015 – 2.2%). | | |
|
| EDC Annual Report 2016 65 |
Management’s Discussion and Analysis
As permitted by International Financial Reporting Standard 7 – Financial Instruments: Disclosures, we have displayed certain parts of our Management’s Discussion and Analysis which discuss the nature, extent and management of credit, liquidity and market risks in teal font. These disclosures form an integral part of our audited Consolidated Financial Statements for the year ended December 31, 2016.
Marketable Securities and Derivative Instruments
Our policies and procedures, which are reviewed periodically, are designed to limit and manage credit risk associated with marketable securities and derivative instruments. These policies and procedures define the minimum acceptable counterparty rating in alignment with the Minister of Finance Financial Risk Management Guidelines for Crown Corporations. In addition, we have policies which are reviewed periodically and procedures that establish credit limits for each counterparty, which are reviewed by management no less than annually. These policies and procedures are designed to limit and manage the credit risk associated with these financial instruments.
Our interest-bearing deposits and marketable securities portfolio expose us to the risk that the deposit-taking institutions or counterparties will not repay us in accordance with contractual terms. Our potential deposit and marketable securities credit exposure is represented by the carrying value of the financial instruments.
The following table provides a breakdown, by credit rating and term to maturity, of our deposits and marketable securities credit exposure:
| | | | | | | | | | | | | | | | | | |
(in millions of Canadian dollars) | |
| | | Remaining term to maturity | | | 2016 Exposure | | 2015 Exposure | |
Credit rating | | Under 1 year | | | 1 to 3 years | | | Over 3 years | | | |
| | | | | |
AAA | | | 1,901 | | | | 1,378 | | | | 2,054 | | | 5,333 | | | 5,533 | |
| | | | | |
AA+ | | | – | | | | – | | | | – | | | – | | | 75 | |
| | | | | |
AA | | | 1 | | | | 54 | | | | – | | | 55 | | | 34 | |
| | | | | |
AA– | | | 1,364 | | | | – | | | | – | | | 1,364 | | | 1,473 | |
| | | | | |
A+ | | | 308 | | | | – | | | | – | | | 308 | | | 101 | |
| | | | | |
A | | | 27 | | | | – | | | | – | | | 27 | | | – | |
| | | | | |
A– | | | 302 | | | | – | | | | – | | | 302 | | | 427 | |
| | | | | |
BBB+* | | | – | | | | – | | | | – | | | – | | | 51 | |
Total | | | $3,903 | | | | $1,432 | | | | $2,054 | | | $7,389 | | | $7,694 | |
* Represents cash deposits.
Derivatives expose us to the risk that the counterparty will not repay us in accordance with contractual terms. Our potential derivative credit exposure is represented by the replacement cost of contracts that have a positive fair value. For a more in-depth discussion on the use of derivative instruments, refer to the section on derivative instruments (see page 74).
All swaps are transacted with high credit quality financial institutions. We operate a collateral program to mitigate credit exposure related to swaps used to hedge risk within our funding program. As market rates move between the settlement date and maturity date of the swap, the financial instrument attains value such that to terminate the swap early, one counterparty would need to make a payment to the other to compensate for the movement in rates. In order to mitigate the credit risk, we often enter into collateral agreements with financial institutions with whom we undertake swap transactions. Under the terms of the swap agreements, when the credit exposure surpasses an agreed upon threshold, collateral in the form of government securities is posted with an independent third party by our swap counterparty. At the end of 2016, $22 million was posted as collateral by our counterparties to mitigate credit risk associated with swap agreements.
Management’s Discussion and Analysis
The following table provides a breakdown, by credit rating and term to maturity, of our derivative credit exposure and how it is offset against exposure netting amounts and collateral held. Exposure netting amounts represent derivative contracts where there is an agreement with the counterparty (netting agreement) that allows us to offset the counterparty’s derivative credit exposure to us against our credit exposure to that same counterparty. After applying both exposure netting and collateral held, our net exposure is $182 million (2015 – $172 million).
| | | | | | | | | | | | | | | | | | | | | | | | |
(in millions of Canadian dollars) | |
Credit rating | | Remaining term to maturity | | | Gross exposure | | Exposure netting* | | Collateral held | | 2016 Net exposure | | 2015 Net exposure | |
| | Under 1 year | | | 1 to 3 years | | | Over 3 years | | | | | | |
| AA | | | – | | | | – | | | | 43 | | | 43 | | – | | – | | 43 | | | 1 | |
| | | | | | | | |
| AA- | | | 61 | | | | 15 | | | | 19 | | | 95 | | (74) | | – | | 21 | | | 24 | |
| | | | | | | | |
| A+ | | | 124 | | | | 16 | | | | 8 | | | 148 | | (42) | | – | | 106 | | | 129 | |
| | | | | | | | |
| A | | | 7 | | | | – | | | | 27 | | | 34 | | – | | (22) | | 12 | | | 8 | |
| | | | | | | | |
| A- | | | 4 | | | | – | | | | – | | | 4 | | (4) | | – | | – | | | 10 | |
Total | | | $196 | | | | $31 | | | | $97 | | | $324 | | $(120) | | $(22) | | $182 | | | $172 | |
* As a result of netting agreements.
Credit risk for marketable securities and derivative instruments is reported on a quarterly basis to the Asset Liability Management Committee and to the Risk Management Committee of the Board.
Capital Management
Our capital management framework ensures that we are appropriately capitalized and that our capital position is identified, measured, managed and regularly reported to the Board. Our capital is first and foremost available to support Canadian exporters and investors for the benefit of Canada. Being appropriately capitalized has allowed us to fulfill our mandate and sustain continued risk capacity for Canadian exporters and investors despite a more challenging credit environment.
EDC developed and implemented a new capital management framework in 2016 under the Internal Capital Adequacy Assessment Process (ICAAP). This was complemented by an initiative led by the Department of Finance, in tandem with the financial Crown corporations, to develop a common capital and dividend framework.
Under ICAAP, EDC continues to target a level of capitalization sufficient to cover potential losses consistent with a rating standard of AA. This solvency standard aligns with that of leading financial institutions and with the key principles of financial self-sufficiency.
Items introduced under ICAAP include commonality of risk components among the Crown corporations. For EDC this includes the introduction of capital set aside for pension plan risk, the introduction of correlation in the modeling of credit risk, a redefinition of a business/strategic risk component and a redefinition of capital supply (Tier 1 Capital) more in line with industry standards. We continue to assess capital adequacy by comparing the supply of capital to the demand for capital.
| | | | | | | | |
as at December 31 (in millions of Canadian dollars) | | 2016 | | | 2015* | |
Demand for capital | | | | | | | | |
| | |
Credit risk | | | 3,622 | | | | 5,844 | |
| | |
Market risk | | | 994 | | | | 1,062 | |
| | |
Operation risk | | | 230 | | | | 532 | |
| | |
Strategic risk | | | 485 | | | | – | |
| | |
Pension plan risk | | | 466 | | | | – | |
| | |
Strategic initiatives | | | 35 | | | | – | |
Total demand for capital | | | $5,832 | | | | $7,438 | |
| | |
Supply of capital | | | $9,763 | | | | $11,549 | |
EDC implied solvency rating | | | AAA | | | | AAA | |
* Figures presented for 2015 were calculated using the capital management methodology in effect as at December 31, 2015, where demand for capital included both expected and unexpected losses.
We measure and report changes to capital supply, capital demand and its implied solvency rating to executive management monthly. These capital measures are reported regularly to the Board together with forward looking stress tests which model the potential impact on capital of portfolio migration and other key risk events.
We strive to ensure that our risk and capital management policies are aligned with industry standards and are appropriately sophisticated relative to our risk profile and business operations.
|
| EDC Annual Report 2016 67 |
Management’s Discussion and Analysis
Off Balance Sheet Arrangements
In the normal course of business, we engage in a variety of transactions with structured entities (SEs). SEs are generally created for a single purpose, have a limited lifespan and are used for risk management, legal or taxation reasons to hold specific assets for its benefactors. These transactions are generally undertaken for risk, capital and funding management purposes that benefit our clients. In accordance with IFRS, those SEs where we are not exposed, or have rights, to variable returns from our involvement with the SE and do not have decision-making power to affect the returns of the SE, have not been consolidated on our statement of financial position.
In certain financing transactions, SEs are used to securitize assets and are typically highly debt-leveraged and, in certain circumstances, equity guarantees may also be used. EDC may also use SEs to hold assets that have been foreclosed upon and cannot be held directly for legal or taxation reasons, typically for foreclosed assets in foreign countries. Refer to Note 29 of the consolidated financial statements for further details.
Financial Instruments
Given the nature of our business, our assets and liabilities are substantially composed of financial instruments. Financial instrument assets include cash resources, securities, investments, loans and recoverable insurance claims, while financial instrument liabilities include accounts payable, loans and loan guarantees. We may also use a variety of derivative instruments including interest rate swaps, cross currency interest rate swaps, foreign exchange swaps, foreign exchange forwards and credit default swaps.
In accordance with IFRS, the majority of financial instruments are recognized on the statement of financial position at their fair value. These financial instruments include marketable securities at fair value through profit or loss, investments at fair value through profit or loss, derivative instruments, loans payable designated at fair value through profit or loss and recoverable insurance claims. Note 2 of the consolidated financial statements outlines the accounting treatment for our financial instruments, while Note 27 provides details of how their fair values are determined.
We use derivatives to manage interest rate risk, foreign exchange risk and credit risk. These derivatives are only contracted with creditworthy counterparties in accordance with policies established in the Risk Management Office (RMO) and approved by our Board of Directors. Both our internal policies and guidelines and those set by the Minister of Finance limit our use of derivatives. We do not use derivatives for speculative purposes. We manage our exposure to derivative counterparty credit risk by contracting only with creditworthy counterparties, and in certain cases entering into collateral agreements with those counterparties. For further discussion on our risk management framework, refer to the Risk Management discussion on the following pages.
Risk Management Overview
Striking the right balance between risk and reward in pursuit of growth
Our global business activities expose us to a wide variety of risks – financial, operational and strategic – across a diverse economic and political landscape. As we seize new business opportunities, we must be vigilant in our efforts to identify and anticipate risks and manage them in a prudent manner. By doing so, we will safeguard our ability to achieve our business objectives and remain sustainable and relevant in the years to come.
We have established a foundational enterprise risk management (ERM) practice and we are making significant investments in our risk management activities. We have adopted a plan to enhance our practice to ensure comprehensive, enterprise-wide risk management. We refer to this as our ERM Transformation program. This plan has been augmented by guidance provided by the Office of the Superintendent of Financial Institutions and industry leaders.
As EDC is Canada’s export credit agency, the focus of the ERM Transformation program is not about developing a system to take more or less risk, but rather a system to better manage and govern the risk we do take, including elevating awareness, understanding and foresight throughout the organization. By better managing our risk, we can serve more exporters and investors and in so doing, play a more significant role in Canada’s trade ecosystem.
The ERM transformation emphasizes a strong risk culture of oversight and clear direction, ownership and accountability, and the requirement for robust monitoring and reporting. It is an enterprise-wide project touching all areas of our business. Key elements include: governance in accordance with a three-lines-of-defence model (3LD); articulation and operationalization of EDC’s risk appetite; enhanced discipline around risk management processes; and integration of new financial risk policies.
Our Board of Directors and management team are actively engaged to ensure that the ERM transformation program is effectively implemented at all levels of the corporation.
This multi-year transformation began in 2012 with the development of a concept for an ERM Framework that outlines an overarching governance structure for effectively managing risk across the entire organization. We have also developed a Risk Appetite Statement that articulates our desired attitudes and behaviours – “from the top” – toward taking risk and seizing opportunities.
Management’s Discussion and Analysis
In 2015, in accordance with our ERM Framework, we began designing and building out our 3LD governance model – an industry best-practice approach to risk governance and a foundational part of the overall ERM transformation program that will be applied across the corporation. The 3LD model will ensure that we continue to manage our business according to the evolving standards of Canadian financial institutions. It will ensure that three distinct stages of appropriate checks and balances are in place as we deliver our solutions for our customers. This will greatly enhance overall clarity around risk and decision-making and, in turn, help us deliver risk appropriate solutions for our exporters in a more efficient and predictable manner.
Throughout 2016, we focused our attention on the design and planning of our 3LD model and on conducting a deep dive into key organizational areas impacted by this transformation. Additionally, we began work on two projects relating to financial crimes and the build out of a new compliance function. We added the position of Chief Compliance and Ethics Officer in 2015 with the goal of increasing our oversight and management of compliance risks across the organization. This position has a direct reporting line to the Risk Management Committee of the Board. The core functions of the new Compliance and Ethics group at EDC include compliance risk management, ethics, privacy and access to information, complaints, insider threats and financial crimes. The financial crimes project underway will allow us to closely examine this compliance function to assess the risks of money laundering, terrorist financing, sanctions, bribery and corruption, as well as external fraud as they relate to EDC. The desired outcome of the project is a thorough understanding of financial crimes and the development of policies and procedures that govern the way we address them.
As the ERM transformation program moves from planning to implementation, both EDC and its customers will begin to realize the benefits of having clarity around risk and decision-making.
Risk Governance, Oversight and Design
Our risk governance structure emphasizes and balances strong central oversight and control of risk with clear accountability for, and ownership of risk within the “front lines”. The Three Lines of Defence (3LD) risk governance model ensures a balance between three distinct organizational functions, or “lines of defence”:
| | |
| › | | 1st Line of Defence: People at the frontline who take, own and manage risk on a day-to-day basis. |
| › | | 2nd Line of Defence: The risk and compliance functions that provide independent oversight of first-line activities by ensuring that there are the right checks and balances in place, the governance structure is appropriate and the proper tools are available. |
| › | | 3rd Line of Defence: The internal audit function, which provides independent assurance on the effectiveness of risk management policies, processes and practices to senior management and the Board. |
This structure supports the cascade of EDC’s Risk Appetite throughout the organization and provides forums for risks to be appropriately considered, discussed, debated and factored into business decisions at all levels and across all functions.
Board and its Committees
The ERM transformation program includes a review of Board and key risk management committees. As we restructure around the 3LD model, including bringing together first line of defence functions, our risk committees will be revised and aligned accordingly.
Board of Directors
The Board of Directors is ultimately responsible for Risk Governance by setting the cultural tone, approving EDC’s Risk Appetite Statement and ERM Framework, and maintaining oversight as to the efficacy of the ERM program. It has responsibility to ensure a Delegation of Authority Framework is in place that meets business needs and respects established risk philosophies and principles. In addition, it has responsibility to ensure that EDC’s incentive, reward and performance management and evaluation systems are aligned and in place, with due emphasis on risk, compliance and controls. The Board operates six1 formal committees to oversee and provide guidance and direction. This committee structure helps to ensure that risks are adequately considered, discussed, debated and factored into business decisions.
Risk Management Committee of the Board
This Committee assists the Board in fulfilling its oversight responsibilities with respect to the prudent management of our capital structure, including the management of the credit, market and other enterprise risks of the Corporation.
Audit Committee of the Board
The Audit Committee assists the Board in fulfilling its oversight responsibilities with respect to our standards of integrity and behaviour, financial reporting and internal control systems.
(1) For further details on Board Committees, please refer to pages 46 to 47 of this Annual Report.
|
| EDC Annual Report 2016 69 |
Management’s Discussion and Analysis
Key Risk Committees
Executive Management Team
The Executive Management team, led by the President and CEO and including the executives reporting directly to the President and CEO, is ultimately accountable for managing enterprise risk within the Board-approved Risk Appetite, approving policies and procedures and overseeing execution of risk management activities. The Executive Management Team has primary responsibility for the management of EDC’s risks, standards of integrity and behaviour, financial reporting and internal control systems. The Executive Management team undertakes this responsibility through various management oversight committees, by ensuring an appropriate organizational structure and governing policies are in place and through independent validation by audit.
Management Risk Management Committee
This Committee has responsibility to make risk decisions, provide guidance on risk issues, undertake risk governance and to ensure that appropriate capital and risk management policies are in place.
Asset Liability Management Committee
The Asset Liability Committee acts as authority for recommending market risk policies to the Board for approval and ensuring that policies are supported by appropriate procedures and practices for the measurement, management and reporting of market risk. In addition, the Committee provides endorsement as to the acceptability of EDC’s asset/liability management strategy, ensures that market risk positions are managed within policy limits, and addresses such risk practices as diversification requirements and reporting and monitoring of guidelines.
Investment Committee
The Investment Committee reviews and endorses the acceptability of transactions to be made under EDC’s Investments program, and recommends transactions to the appropriate level of authority. It also makes recommendations regarding the program’s strategy to the Executive and the Board of Directors and monitors program-level performance.
Large Exposures Group
This Committee reviews EDC’s exposure to an obligor when a transaction is being considered that would breach one of EDC’s Board or risk management obligor limits. The Committee opines on how we should manage our exposure and provides guidance on hedging the proposed transaction at the time of origination, if required.
Business Review Committee
The Business Review Committee provides a forum to achieve Executive alignment on non-transactional topics of a strategic nature. Topics brought forward will likely be precedent setting and may involve innovative ideas around EDC’s business direction.
Management Pension Committee
This Committee oversees operations and performs high-level decision-making functions with respect to the pension plans and the related pension funds including recommendations to the Human Resources Committee of the Board.
Strategy Execution Committee
This Committee is responsible for ensuring good program governance for EDC’s corporate transformation initiatives that balances clear project delivery accountability with the need to manage integration and trade-offs across programs. The goal is to oversee performance of each program in the context of corporate strategy.
Key Risk Management Groups
Enterprise Risk Management Group
As the second line of defence, the ERM Group provides independent oversight of the management of risks inherent in EDC’s activities, including the establishment of EDC’s enterprise risk management policies and framework to manage risk in alignment with EDC’s risk appetite and business strategies. The ERM Group is responsible for identifying, measuring, monitoring, assessing, and reporting on risk factors facing EDC, and ensuring that risk considerations are taken into account and align with EDC’s risk tolerance in all areas and processes at EDC. The ERM Group is headed by the SVP, Enterprise Risk Management and Chief Risk Officer, who works closely with both the President and Chief Executive Officer, the Board of Directors and other members of Senior Management to set the ‘tone at the top’ and establish a risk aware culture across EDC.
Management’s Discussion and Analysis
Finance
Responsible for financial planning, accounting, financial reporting and cash management, Finance ensures that appropriate controls exist to ensure complete and accurate financial reporting and effective cash management.
Internal Audit
As the third line of defence, Internal Audit (IA) is responsible to provide independent and objective assurance and advisory services designed to add value and help EDC achieve its business objectives pertaining to operations, reporting, and compliance with laws and regulations. IA does this by bringing a systematic and disciplined approach to evaluating and improving internal controls, risk management, and governance processes. Although IA’s mandate includes the provision of advisory services to management, these services will be ancillary to the assurance services it provides to the Audit Committee of the Board of Directors. Our Chief Internal Auditor (CIA) reports to the Chair of the Audit Committee of the Board of Directors, and has a dotted line relationship with EDC’s President.
IA governs itself by adhering to The Institute of Internal Auditors’ (IIA) mandatory guidance, including the Definition of Internal Auditing, the IIA Code of Ethics and the International Standards for the Professional Practice of Internal Auditing (IIA Standards). This guidance constitutes principles of the fundamental requirements for the professional practice of internal auditing and for evaluating the effectiveness of the internal audit activity’s performance
Front Line Units
Front Line Units includes business units and other functions within the first line of defence who take, own and manage risk on a day-to-day basis. These functions are responsible for identifying, assessing, mitigating, assuming, controlling and reporting on risk in accordance with established enterprise risk appetite, policies, culture and strategic goals.
Risk Modules
EDC’s Risk Management Framework breaks risk down into three broad Risk Modules, expressing the corporation’s risk appetite and tolerance in each of i) Financial Risk, ii) Operational Risk and iii) Strategic Risk. As a financial institution, financial risk is naturally front and centre and, as a result, the majority of this report covers this area.
Financial Risk
Portfolio Risk Profile
While EDC follows leading risk management practice, we generally assume more risk than a typical financial institution due to our mandate. We take on larger single counterparty exposures and larger concentration exposures by sector than other financial institutions, most notably in the transportation and extractive sectors which lead Canadian exports.
Despite a portfolio distribution that is almost equally segmented between investment grade and non-investment grade borrowers in 2016, the vast majority of EDC’s risk profile, as determined by capital demand for credit risk, emanates from the non-investment grade space. Although only 48% of EDC’s loan portfolio is non-investment grade, 94% of capital demand is attributable to this category of obligor.
Credit Risk Management
Credit risk is the risk of loss incurred if a counterparty fails to meet its financial commitments. We are exposed to credit risk under our loans and insurance programs and treasury activities.
We manage credit risk in the organization through policy requirements, established authorities and limits, mitigation activities and reporting. Our credit risk policies set out our requirements on credit granting, concentration, counterparty and country limits, risk rating, exposure measurement, monitoring and review, portfolio management and risk transfer, as well as management and Board reporting.
Credit Granting
We deliver our products and services through sector-based business teams grouped under insurance or financing. The business teams are responsible for the proper due diligence associated with each credit commitment. Every credit commitment requires recommendation and approval. Credit commitments in excess of certain thresholds also require independent endorsement or co-authorization by the RMO or the Management Risk Management Committee. The purpose of endorsement or co-authorization is to ensure that all relevant, tangible risks in the proposed credit commitment have been identified, assessed and mitigated where possible. The credit rating of a transaction and/ or the dollar amount of exposure at risk determines whether involvement is required by the Management Risk Management Committee or the RMO. All transactions above U.S. $300 million require authorization by the Board. However, this threshold can be reduced to as low as U.S. $200 million for transactions with lower credit quality. Our credit approval process includes early involvement of a senior management committee in the transaction review process and more integrated engagement on transactions between our risk management, underwriting and business development professionals.
|
| EDC Annual Report 2016 71 |
Management’s Discussion and Analysis
Our approval responsibilities are governed by delegated authorities. The Board in effect delegates specific transactional approval authorities to the CEO. Onward delegation of authority by the CEO to business units is controlled to ensure decision-making authorities are restricted to those individuals with the necessary experience levels. The criteria whereby these authorities may be further delegated throughout the organization, as well as the requirements relating to documentation, communication and monitoring of delegated authorities, are set out in corporate policies and standards.
We bear counterparty risk through our treasury liquidity and derivative portfolios. Treasury counterparties are analyzed and credit limits are recommended by the Market Risk team in the RMO. Recommended counterparties are endorsed by either the RMO or Management Risk Management Committee. Every treasury credit commitment requires the approval of at least two individuals with delegated approval authority. All treasury credit exposures are measured on a fair value basis and compliance with policy and operational limits is measured daily. In addition, we have policies and procedures in place to limit and to manage the credit risk associated with these financial instruments and to define collateral requirements for treasury counterparties.
We also bear counterparty risk through our insurance portfolio under a reinsurance structure, where we are exposed to the credit risk of the reinsurer. To help mitigate this risk, our placement of reinsurance is diversified such that it is not dependent on a single reinsurer. Reinsurance counterparty exposure is managed under our reinsurance counterparty management procedures and monitored by our Risk Management team.
Concentration Limits
To ensure diversification of risks within our credit commitments, we have established risk limits in place to protect against being overly concentrated to any one country, industry sector or commercial obligor. All limits are determined based on our capital base and risk factors associated with the exposure including the obligor rating, country rating, associated collateral and EDC product type. Exposures beyond the risk limits require either Presidential approval within discretionary limits or review by the Risk Management Committee and approval of the Board.
Risk Ratings
Consistent with the Basel II Advanced Internal Rating-Based approach, credit risk is measured by assigning (i) a risk rating to an obligor that is tied to a probability of default (PD). The PD describes the likelihood of a default of an obligor over a one year period and (ii) a rating to a transaction in the form of a loss given default (LGD) estimate. The LGD estimates the percentage of dollar exposure which EDC reasonably expects to lose should a default occur on a specific transaction.
EDC’S internal credit risk rating system measures obligor and transaction risks for the majority of our risk exposure. This risk rating system utilizes a 20 point rating scale to differentiate the PD of obligors and a 6 point rating scale to differentiate the LGD of transactions. While our obligor rating is arrived at independently of external ratings for the obligor, our risk-rating methodology includes a review of those external ratings.
Our Economics team is responsible for establishing, monitoring and approving country risk ratings. Country risk ratings are continually reviewed to take into consideration any changes in the world environment or a specific country.
For treasury related counterparties, EDC’s internal credit rating is assigned as the lower of the highest two external ratings.
Exposure Measurement
To ensure that the level of credit risk is transparent to both management and the Board, our credit exposure measurement guideline requires information reporting and comparison of the aggregated exposures within a portfolio against prescribed limits such as country, industry and obligor. We also report on approved short-term buyer limits under our accounts receivable insurance program.
Monitoring and Review
Our operating practices include ongoing monitoring of credit exposures. Specialized teams are in place to monitor and manage credit exposure within the different product lines which include monitoring of events in the country and industry of the obligor. The Credit Risk Management team within the RMO is responsible for managing the credit quality and financial performance of our portfolio of commercial loans and guarantees both at the transaction and portfolio levels. This specialized team undertakes loan reviews, assesses risk ratings and regularly monitors borrowers and the credit risk environment including research and assessment of financial, operating and industry trends. Our portfolio of credit insurance counterparties is actively monitored by our Risk Assessment and Portfolio Management team. In addition, deteriorating credits are managed by teams that specialize in restructurings, Paris Club reschedulings, claims and recoveries. Management and the Board are frequently apprised on the credit quality of the portfolio through regular reporting including detailed quarterly reporting on the breakdown of the portfolio by risk ratings, impaired obligors, loan write-offs and claims information.
Management’s Discussion and Analysis
Portfolio Management
The goal of portfolio management is to ensure our ability to pursue mandate related opportunities while taking into consideration the availability of financial resources and limit constraints. Management and the Board are regularly updated on our portfolio of credit exposures through quarterly compliance reporting against concentration limits. We use both primary and secondary portfolio management activities to address imbalances or excess concentrations including, but not limited to, syndication at credit origination, the sale of assets, insurance, reinsurance and hedging using credit derivatives.
We continue to make use of insurance and credit derivatives for risk mitigation purposes targeting large exposures in our loan portfolio. To address credit concentration in our insurance portfolios we engage in various risk transfer activities primarily through reinsurance and co-insurance.
Management and Board Reporting
The RMO provides timely and comprehensive risk reporting to management and the Board on major risks being assumed by or facing EDC, enabling appropriate management and oversight. This reporting includes, but is not limited to, a (i) quarterly risk management report, (ii) monthly credit risk policy compliance report, (iii) monthly capital adequacy report and (iv) monthly report detailing our liquidity position. Ad-hoc risk reporting is provided to senior management and the Board as warranted for new or emerging risk issues or significant changes in our level of risk. Significant credit risk issues and action plans are tracked and reported to ensure management accountability and attention are maintained.
Market Risk Management
Market risk is the risk that the fair value or future cash flows of a financial instrument will fluctuate because of changes in market prices. Market risk comprises three types of risk: foreign exchange risk, interest rate risk and other price risk. We are exposed to potential losses as a result of movements in interest and foreign exchange rates.
Through our policies and procedures, we ensure that market risks are identified, measured, managed and regularly reported to management and the Board. Our Market Risk policies set out our requirements on interest rate and foreign exchange exposure limits, liquidity, investment, debt funding, derivatives and structured notes, management of the credit risk for treasury counterparties and management and Board reporting. The Asset Liability Management Committee, which has a rotating chair, alternating between the Chief Risk Officer (CRO) and CFO, currently chaired by the CRO, oversees and directs the management of market risks inherent within our normal business activities. Risk oversight is provided by the Market Risk team in the RMO.
Interest Rate Risk
Interest rate risk is the risk that the fair value or future cash flows of a financial instrument will fluctuate because of changes in market interest rates. We are exposed to potential adverse impacts on the value of financial instruments resulting from differences in the maturities or repricing dates of assets and liabilities both on and off-balance sheet, as well as from embedded optionality in those assets and liabilities.
Our interest rate risk is managed in accordance with guidelines established by the Department of Finance as well as policies set by the Board. We report interest rate risk on a monthly basis to the Asset Liability Management Committee and quarterly to the Risk Management Committee of the Board.
Management of interest rate risk is enabled through monthly risk position monitoring against limits and reporting. Interest rate risk is measured by simulating the impact of a 100 basis point change on our net financing and investment income.
Interest Rate Sensitivity
The table below presents the sensitivity of the net financing and investment income and net income to a parallel 100 basis point change in interest rates given the outstanding positions as at December 31:
Interest Rate Change
| | | | | | | | | | | | | | | | |
| | | | | |
| (in millions of Canadian dollars) | | | | | 2016 | | | | | | 2015 | |
| | | +100 Basis
Points | | | -100 Basis
Points | | | +100 Basis
Points | | | -100 Basis
Points | |
Change in net financing and investment income | | | (9 | ) | | | 9 | | | | 7 | | | | (7 | ) |
| | | | |
Change in net income | | | (105 | ) | | | 126 | | | | (93 | ) | | | 133 | |
|
| EDC Annual Report 2016 73 |
Management’s Discussion and Analysis
Foreign Exchange Risk
Foreign exchange risk is the potential adverse impact on the value of financial instruments resulting from exchange rate movements. We are exposed to foreign exchange rate risk when there is a mismatch between assets and liabilities in any currency.
Our foreign exchange risk is managed in accordance with guidelines established by the Department of Finance as well as policies approved by the Board. We report our foreign exchange risk on a monthly basis to the Asset Liability Management Committee and quarterly basis to the Risk Management Committee of the Board.
In addition to the guidelines and policies described above, we also have supplemental operational limits and reporting requirements. Management of foreign exchange risk is enabled through monthly risk position monitoring against limits and reporting.
As per our policy, the potential translation loss impact to one month’s net financing and investment income (NFII) as measured by a two standard deviation change in foreign exchange rates is limited to 2.5% of projected 12 month NFII, on a consolidated Canadian dollar equivalent basis.
As the table below indicates, we were onside our policy as at December 31.
| | | | | | | | | | | | | | | | | | | | | | | | |
Foreign Exchange Positions against Limit | | | | | | | | | | | | | | | | | | |
| | | | | | | | |
| (in millions of Canadian dollars) | | 2016 | | | 2015 | | | | | | | | | | | | | | |
Limit | | | 31 | | | 26 | | | | | | | | | | | | | | | | | | |
| | | | | | | |
Position | | | 14 | | | 8 | | | | | | | | | | | | | | | | | | |
The table below presents the sensitivity of net income to changes in the value of the Canadian dollar versus the other currencies to which we were exposed given the outstanding positions as at December 31: Canadian Dollar Relative to Other Currencies | |
| | | | | | | | |
| (in millions of Canadian dollars) | | | | | 2016 | | | | 2015 | | | | | | | | | | |
| | | Increases
by 1% | | | Decreases by 1% | | Increases
by 1% | | Decreases
by 1% | | | | | | | | | | |
Change in net income | | | (3 | ) | | 3 | | 1 | | | (1 | ) | | | | | | | | | | | | |
| | | | | | | | | | | | | | | | | | | | | | | | |
Derivative Instruments We use a variety of derivative instruments to manage costs, returns and levels of financial risk associated with funding, investment and risk management activities. The principal purpose for which we use derivative instruments is to hedge against foreign exchange and interest rate risk. Our use of derivative instruments may include, but is not restricted to, currency and interest rate swaps, foreign exchange swaps, credit default swaps, futures and options. We do not use derivative instruments for speculative purposes. We do not engage in the use of derivative instruments whose value and financial risks cannot be measured, monitored and managed on a timely basis. The Market Risk team formally reviews our derivative instrument transactions at time of inception, and on an ongoing basis to provide an independent verification on the valuation of transaction structures and of associated financial risks. Derivative instruments are used to hedge risks by matching various exposures. For example, we may balance the proportion of fixed to floating assets in our portfolio using interest rate swaps in order to mitigate interest rate risk. The following table indicates the fair value of our derivative instruments based upon maturity: | |
As at December 31 (in millions of Canadian dollars) | | | | | | | | | 2016 | | | | | | | | | 2015 | |
| | | Positive | | | Negative | | Net | | | Positive | | | Negative | | | Net | |
Less than 1 year | | | 196 | | | (712) | | | (516) | | | | 115 | | | | (910) | | | | (795) | |
1 – 3 years | | | 31 | | | (1,454) | | | (1,423) | | | | 138 | | | | (1,564) | | | | (1,426) | |
Over 3 – 5 years | | | 13 | | | (459) | | | (446) | | | | 12 | | | | (663) | | | | (651) | |
Over 5 years | | | 84 | | | (194) | | | (110) | | | | 85 | | | | (297) | | | | (212) | |
Gross fair value of contracts | | | $324 | | | $(2,819) | | | $(2,495) | | | | $350 | | | | $(3,434) | | | | $(3,084) | |
Management’s Discussion and Analysis
Liquidity Risk Management
Liquidity risk is the risk that we would be unable to honour daily cash outflow commitments or the risk that we would have to obtain funds rapidly, possibly at an excessively high premium during severe market conditions. Liquidity risk arises from two sources: mismatched cash flows related to assets and liabilities and liquidity risk due to the inability to sell marketable securities in a timely and cost effective manner.
Our treasury department is responsible for our liquidity management and the Market Risk team is responsible for monitoring compliance with our policies and procedures. Pursuant to our risk management policies, we must maintain sufficient liquidity to meet a prescribed minimum level, based on forecasted cash requirements.
Within the overall policy framework, we manage our liquidity risk both within the overall policy limits and also within supplemental limits. The Market Risk team measures our position on a daily basis and provides a monthly report to senior management on our actual liquidity position against this minimum limit, as well as a quarterly report to the Risk Management Committee of the Board.
We maintain liquidity through a variety of methods:
| | › | Cash and Marketable Securities: We hold cash and marketable securities to ensure that sufficient liquidity is available if required to meet forecasted cash requirements. During 2016, the average balance of cash and marketable securities was $6,829 million. |
| | › | Access to Commercial Paper Markets: In the course of our normal activities, our commercial paper programs provide us with the necessary liquidity to meet our cash requirements on a daily basis. During 2016, the average balance of commercial paper was $9,376 million. |
Investment Risk
The Investment Policy defines the marketable securities investments that we may undertake in the market place by instrument type. The investment of corporate cash holdings is governed by Section 10(1.1)(h) of the Export Development Act, Section 128 of the Financial Administration Act, and the Corporation’s Investment Authorities approved by the Minister of Finance.
Debt Funding
The Export Development Act places limitations on our borrowings. The Act allows us to borrow and have outstanding borrowings up to a maximum of 15 times the aggregate of (a) our current paid-in capital and (b) our retained earnings determined in accordance with the previous year’s audited financial statements.
The Minister of Finance, pursuant to the requirements of the Financial Administration Act, annually approves the borrowings of the Corporation. The Debt Funding Policy is monitored on a monthly basis and reported to management and the Board on a quarterly basis.
Contractual Obligations
In the normal course of business, we enter into contracts that give rise to commitments of future minimum payments.
We have two types of loan commitments. The first type is undisbursed amounts on signed loan agreements. The second type represents commitments we entered into, for which terms related to the transaction such as interest rate type and disbursement schedule have not yet been determined. This category includes letters of offer accepted and outstanding for loans as well as unallocated confirmed lines of credit (LOC).
Purchase obligations include those obligations that are legally binding agreements whereby we have agreed to purchase products or services with specific minimum quantities defined as fixed, minimum or variable in price over a specified period of time.
The following table provides a summary of our future payments on contractual commitments:
| | | | | | | | | | | | | | | | | | | | | | | | |
(in millions of Canadian dollars) | |
| Under
1 year |
| |
| 1 to 3
years |
| |
| Over 3 to 5
years |
| |
| Over 5
years |
| |
| 2016
Total |
| |
| 2015
Total |
|
Long-term debt | | | 10,194 | | | | 21,024 | | | | 9,336 | | | | 587 | | | | 41,141 | | | | 39,013 | |
Short-term debt | | | 9,194 | | | | – | | | | – | | | | – | | | | 9,194 | | | | 9,897 | |
Other long-term payable | | | 9 | | | | 17 | | | | 17 | | | | 6 | | | | 49 | | | | 60 | |
Undisbursed loan commitments | | | 19,147 | | | | – | | | | – | | | | – | | | | 19,147 | | | | 19,928 | |
Undisbursed investment commitments | | | 914 | | | | – | | | | – | | | | – | | | | 914 | | | | 903 | |
Letters of offer accepted and outstanding | | | 2,523 | | | | – | | | | – | | | | – | | | | 2,523 | | | | 3,007 | |
Unallocated confirmed LOC | | | 181 | | | | – | | | | – | | | | – | | | | 181 | | | | 109 | |
Leases | | | 28 | | | | 53 | | | | 56 | | | | 252 | | | | 389 | | | | 417 | |
Purchase obligations | | | 69 | | | | 16 | | | | 2 | | | | – | | | | 87 | | | | 50 | |
Total | | | $42,259 | | | | $21,110 | | | | $9,411 | | | | $845 | | | | $73,625 | | | | $73,384 | |
|
| EDC Annual Report 2016 75 |
Management’s Discussion and Analysis
Operational Risk Management
Operational risk is the risk of loss resulting from inadequate or failed internal processes, people and systems or from external events.
We divide operational risk into five broad categories:
| | › | People: attracting, retaining, developing and deploying people with the necessary skill-sets and behaviours and ensuring an appropriate corporate culture. |
| | › | Innovation and Transformation: assuring capacity to innovate and evolve. |
| | › | Information Management and Technology: managing information and technology to enable and conduct business. |
| | › | Governance, Legal and Compliance: operating responsibly, protecting EDC’s rights and interests, and ensuring compliance. |
| | › | Security and Protection: protecting EDC’s people and assets and ensuring business continuity. |
Exposure to operational risk could affect EDC’s ability to meet objectives and execute on our Corporate Plan by way of lost opportunity, business interruption and/or damage to our reputation.
EDC has developed specific policies to manage operational risk. Under the ERM transformation, we have initiated refurbishment of these policies, in part to ensure adherence to sound practice, and in part to embed the three lines of defence governance structure.
EDC has identified a list of key operational risks inherent to our business, including data integrity, information security and internal and external fraud. We have assessed and continue to assess our exposure to these risks. This is done through a number of means including the biennial employee engagement survey and the annual ERM Survey. The employee engagement survey provides us with a mechanism to gather employee input on conditions that enable or inhibit key drivers of performance and the results serve to drive action plans in order to build on our strengths and support corporate values. The annual ERM survey allows us to analyze a broad spectrum of risks and facilitates the escalation of concerns to Executive Management and the Board, and consideration of mitigating action, as appropriate.
We also maintain a practical and disciplined approach to acquiring appropriate insurance coverage. Further, we deploy certain governance frameworks and conventions such as our Corporate Social Responsibility (CSR) practice and Business Continuity Plan.
Finally, Internal Audit’s independent review provides additional assurance that operational risks are appropriately managed.
Strategic Risk Management
We define strategic risk as the risk of a decline in earnings derived from changes to EDC’s business environment. Strategic risk is divided into two categories:
| | › | External Environment: systematically identifying and assessing external risks and opportunities. |
| | › | Planning: formulating, communicating, executing and evaluating corporate direction and objectives. |
EDC is diligent in attuning itself to the external environment through the work of specialized groups such as our Economic and Political Intelligence Centre, Corporate Research Department, and our Corporate Strategy team. As well, the annual customer survey that drives our net promoter score and our proactive business development practice affords us critical insights into customer needs. The insight gained from these surveillance activities is incorporated into our strategic and operational planning exercises.
Our CSR practice is built on five pillars: business ethics, the environment, transparency, community investment and organizational climate and plays a central role in our ongoing formulation of business strategy. We recognize that growth and sustainability must be addressed simultaneously and that CSR is intrinsic to achieving sustainable trade. In addition our focus on CSR instills the need to be conscientious of the environmental impacts of our business, to act in accordance with the highest ethical standards and invest in our communities and employees.
Management’s Discussion and Analysis
|
Critical Accounting Policies and Estimates |
A summary of our significant accounting policies can be found in Note 2 of our 2016 consolidated financial statements. Judgment is required in the selection of accounting policies and their application requires the use of estimates and assumptions to arrive at the reported carrying values of our assets and liabilities. We have established procedures to ensure that accounting policies are applied consistently and that the process for making changes to methodologies and assumptions is well controlled and occurs in an appropriate and systematic manner. Areas where significant estimates are used include the allowance for losses on loans, loan commitments and loan guarantees; recoverable insurance claims; premium and claims liabilities; retirement benefit obligations; and the fair value of financial instruments. Management exercises judgment in the allowance for losses on loans, loan commitments and loan guarantees; premium and claims liabilities; the fair value of financial instruments; structured entities and retirement benefit obligations. For details on our use of estimates and key judgments refer to page 93 of this annual report.
Change in Accounting Standards
In 2016, we adopted Disclosure Initiative amendments related to presentation of financial statements effective as of January 1, 2016 as issued by the International Accounting Standards Board (IASB). These amendments are discussed in Note 2 of our 2016 consolidated financial statements. The IASB is currently working on projects related to insurance contracts and the Disclosure Initiative. Revisions to standards as a result of these ongoing projects could potentially have a significant impact on EDC’s financial statements in future years.
IFRS 9 Financial Instruments
In July 2014, the IASB issued the final version of IFRS 9 Financial Instruments (IFRS 9), which is to be applied retrospectively for reporting periods beginning on or after January 1, 2018 and replaces the guidance in IAS 39 Financial Instruments: Recognition and Measurement. IFRS 9 includes requirements for classification and measurement of financial assets and liabilities, impairment of financial assets and hedge accounting. As we early adopted the classification and measurement requirements of IFRS 9 upon transition to IFRS in 2011 and do not apply hedge accounting to our derivatives, we will only be implementing the impairment requirements by the application date.
IFRS 9 does not require restatement of comparative period financial statements except in limited circumstances relating to the hedge accounting provisions of the standard. We have made the decision not to restate comparative figures and will recognize any measurement differences on January 1, 2018 through an adjustment to opening retained earnings.
The following describes the requirements of the standard as well as our implementation progress.
Impairment
IFRS 9 introduces a new impairment model based on probability weighted expected credit losses (ECLs). This model requires the recognition of impairment at an amount equal to 12-month ECLs or lifetime ECLs depending on whether there has been a significant increase in credit risk since initial recognition of the financial instrument. On initial recognition, and where there has been no significant increase in credit risk, 12-month ECLs are recognized. Where credit risk has significantly increased since initial recognition, lifetime ECLs are recognized. Lifetime ECLs are also recognized for credit impaired assets and interest revenue on these instruments is calculated based on the carrying amount of the asset, net of the loss allowance, rather than on its gross carrying amount. If credit quality improves in a subsequent period such that the increase in credit risk since initial recognition is no longer considered significant, the loss allowance shall revert back to being recognized based on 12-month ECLs.
The expected credit loss model must be forward looking and requires the use of reasonable and supportable forecasts of future economic conditions as at the reporting date. Entities are not expected to consider every possible scenario, however the scenarios considered should reflect a representative sample of possible outcomes. The scenarios are not to be biased towards extremes, should reflect consistency among variables and consider key drivers of ECLs.
The expected credit loss model is a function of the probability of default (PD), loss given default (LGD), and exposure at default (EAD) of a specific obligor or group of obligors with like characteristics. We plan to leverage our existing regulatory capital models and make adjustments, where appropriate, to these risk inputs to satisfy the requirements of IFRS 9.
Project Governance
An enterprise-wide project is underway to ensure timely compliance with the impairment requirements of IFRS 9. An Executive Steering Committee consisting of senior representatives from finance, risk management, economics and technology has been formed to oversee the execution of the project. A number of cross-functional working groups have been established to work through the complexities of the standard, with decisions presented to the Executive Steering Committee for approval.
At this time it is not possible to quantify the potential financial impact of adopting IFRS 9. We will complete the development and validation of the impairment models for the calculation of ECLs in 2017 to support a parallel run in the latter part of 2017. Updates to all accounting policy manuals, internal control documents along with all systems and process changes will be completed in order to support the implementation of the standard by January 1, 2018.
|
| EDC Annual Report 2016 77 |
Management’s Discussion and Analysis
IFRS 16 Leases
In January 2016, the IASB released the new Leases Standard requiring lessees to recognize assets and liabilities for the rights and obligations created by leases. The standard is expected to have a minimal impact on EDC’s financial statements and is effective for reporting periods beginning on or after January 1, 2019.
IAS 7 Statement of Cash Flows
In January 2016, the IASB issued amendments to the standard related to its Disclosure Initiative that require entities to provide disclosures that enable users of financial statements to evaluate changes in liabilities arising from financing activities. The amendments are effective for annual periods beginning on or after January 1, 2017 and will result in enhanced cash flow disclosure of loans payable and derivative instruments.
Non-IFRS Performance Measures
We use a number of financial measures to assess our performance. Some of these measures are not calculated in accordance with IFRS, and do not have standardized meanings under IFRS that would ensure consistency and comparability between companies using these measures. The following non-IFRS performance measures are referenced in this report:
Productivity Ratio (PR)
Management uses PR as a measure of EDC’s efficiency. This ratio represents administrative expenses expressed as a percentage of net revenue excluding unrealized gains and losses on our long-term debt and derivatives as well as the impact due to fluctuations in the exchange rate from the rate projected in the Corporate Plan. As pension costs can fluctuate from year to year based on assumptions used to value the pension liability, the productivity ratio is calculated based on the pension assumptions in the Corporate Plan, with the intent of absorbing any changes in the following year.
Capital Adequacy
Capital adequacy is a measurement of the amount of capital required to cover the credit, market, operational, pension and business/ strategic risks we have undertaken compared to the existing capital base. See the “Capital Management” section for details on the definition and calculation of capital adequacy.
Claims Ratio
The claims ratio expresses net claims incurred as a percentage of net written premium. Net claims incurred include claims paid net of estimated recoveries and changes in actuarial liabilities. This ratio, as shown below, only includes credit insurance activities.
Reinsurance assumed and ceded reflects various partnerships we have with private insurers and reinsurers in offering and managing insurance capacity.
Net claims incurred includes claims paid net of recoveries and estimated recoveries of $54 million (2015 – $97 million) and an increase in actuarial liabilities of $31 million (2015 – $69 million increase).
The decrease in the claims ratio is due to lower net claims incurred than was experienced in the prior year. We had significant claim payments in the resources sector in 2015 which did not reoccur. In addition, the impact of updates to the assumptions used in the actuarial calculation of the premium liabilities was more significant in 2015.
| | | | | | | | |
(in millions of Canadian dollars) | | | 2016 | | | | 2015 | |
Direct premiums | | | 103 | | | | 106 | |
Reinsurance assumed | | | 3 | | | | 2 | |
Reinsurance ceded | | | (7 | ) | | | (6 | ) |
Net written premium | | | $99 | | | | $102 | |
Direct net claims incurred | | | 85 | | | | 165 | |
Net claims incurred – reinsurance assumed | | | – | | | | 1 | |
Net claims incurred | | | $85 | | | | $166 | |
Claims ratio | | | 86 | % | | | 163 | % |
Management’s Discussion and Analysis
| | | | | | | | | | | | | | | | | | | | |
Table 1: Loan Interest Yield | |
(in millions of Canadian dollars) | | | 2016 | | | | 2015 | | | | 2014 | | | | 2013 | | | | 2012 | |
Gross loans receivable: | | | | | | | | | | | | | | | | | | | | |
Average performing floating rate | | | 42,031 | | | | 36,951 | | | | 29,696 | | | | 23,801 | | | | 20,304 | |
Average performing fixed rate | | | 11,309 | | | | 10,468 | | | | 8,897 | | | | 8,198 | | | | 7,655 | |
Total average performing gross loans receivable | | | 53,340 | | | | 47,419 | | | | 38,593 | | | | 31,999 | | | | 27,959 | |
Average carrying value on impaired loans | | | 485 | | | | 267 | | | | 239 | | | | 584 | | | | 1,149 | |
Total average income earning loan assets | | | $53,825 | | | | $47,686 | | | | $38,832 | | | | $32,583 | | | | $29,108 | |
Loan revenue: | | | | | | | | | | | | | | | | | | | | |
Performing floating rate interest | | | 1,114 | | | | 840 | | | | 663 | | | | 579 | | | | 551 | |
Performing fixed rate interest | | | 417 | | | | 420 | | | | 394 | | | | 394 | | | | 385 | |
Other loan revenue | | | 189 | | | | 215 | | | | 182 | | | | 201 | | | | 180 | |
Loan revenue | | | $1,720 | | | | $1,475 | | | | $1,239 | | | | $1,174 | | | | $1,116 | |
Yields – performing loans: | | | | | | | | | | | | | | | | | | | | |
Performing floating rate coupon | | | 2.65 | % | | | 2.27 | % | | | 2.23 | % | | | 2.43 | % | | | 2.71 | % |
Performing fixed rate coupon | | | 3.69 | % | | | 4.01 | % | | | 4.43 | % | | | 4.81 | % | | | 5.03 | % |
Total performing loan yield | | | 2.87 | % | | | 2.66 | % | | | 2.74 | % | | | 3.04 | % | | | 3.35 | % |
Total loan yield | | | 3.20 | % | | | 3.09 | % | | | 3.19 | % | | | 3.60 | % | | | 3.83 | % |
Table 2: Net Finance Margin | |
(in millions of Canadian dollars) | | | 2016 | | | | 2015 | | | | 2014 | | | | 2013 | | | | 2012 | |
Average performing loans receivable | | | 53,340 | | | | 47,419 | | | | 38,593 | | | | 31,999 | | | | 27,959 | |
Average carrying value on impaired loans | | | 485 | | | | 267 | | | | 239 | | | | 584 | | | | 1,149 | |
Average finance lease assets – aircraft | | | 10 | | | | 66 | | | | 70 | | | | 77 | | | | 85 | |
Average operating lease assets | | | – | | | | – | | | | 349 | | | | 508 | | | | 169 | |
Average marketable securities balance | | | 6,693 | | | | 6,311 | | | | 5,047 | | | | 4,000 | | | | 3,959 | |
Average investment portfolio balance | | | 903 | | | | 787 | | | | 599 | | | | 492 | | | | 433 | |
Total average income earning assets | | | $61,431 | | | | $54,850 | | | | $44,897 | | | | $37,660 | | | | $33,754 | |
Financing and investment revenue: | | | | | | | | | | | | | | | | | | | | |
Loan | | | 1,720 | | | | 1,475 | | | | 1,239 | | | | 1,174 | | | | 1,116 | |
Finance lease | | | 1 | | | | 5 | | | | 5 | | | | 6 | | | | 6 | |
Operating lease | | | – | | | | – | | | | 50 | | | | 55 | | | | 17 | |
Marketable securities | | | 73 | | | | 60 | | | | 45 | | | | 32 | | | | 36 | |
Investment | | | 9 | | | | 8 | | | | 6 | | | | 8 | | | | 5 | |
Total financing and investment revenue | | | 1,803 | | | | 1,548 | | | | 1,345 | | | | 1,275 | | | | 1,180 | |
Interest expense | | | 450 | | | | 183 | | | | 70 | | | | 30 | | | | 108 | |
Leasing and financing related expenses | | | 37 | | | | 28 | | | | 48 | | | | 49 | | | | 33 | |
Net financing and investment income | | | $1,316 | | | | $1,337 | | | | $1,227 | | | | $1,196 | | | | $1,039 | |
Net finance margin | | | 2.14 | % | | | 2.44 | % | | | 2.73 | % | | | 3.18 | % | | | 3.08 | % |
|
| EDC Annual Report 2016 79 |
Management’s Discussion and Analysis
| | | | | | | | | | | | | | | | | | | | |
Table 3: Insurance Premiums and Guarantee Fees | |
| | | | | |
(in millions of Canadian dollars) | | 2016 | | | 2015 | | | 2014 | | | 2013 | | | 2012 | |
Credit insurance product group: | | | | | | | | | | | | | | | | | | | | |
| | | | | |
Credit insurance business facilitated | | | 55,724 | | | | 60,175 | | | | 56,020 | | | | 56,224 | | | | 54,087 | |
| | | | | |
Premiums and fees earned prior to ceding reinsurance | | | 108 | | | | 110 | | | | 105 | | | | 110 | | | | 114 | |
Average credit insurance premium rate | | | 0.19 | % | | | 0.18 | % | | | 0.19 | % | | | 0.20 | % | | | 0.21 | % |
Financial institutions insurance product group: | | | | | | | | | | | | | | | | | | | | |
| | | | | |
Financial institutions insurance business facilitated | | | 7,421 | | | | 7,666 | | | | 11,415 | | | | 10,630 | | | | 9,295 | |
| | | | | |
Premiums and fees earned prior to ceding reinsurance | | | 21 | | | | 19 | | | | 25 | | | | 21 | | | | 18 | |
Average financial institutions insurance premium rate | | | 0.28 | % | | | 0.25 | % | | | 0.22 | % | | | 0.20 | % | | | 0.19 | % |
Contract insurance and bonding product group: | | | | | | | | | | | | | | | | | | | | |
| | | | | |
Contract insurance and bonding average exposure | | | 7,982 | | | | 8,728 | | | | 8,219 | | | | 8,309 | | | | 8,303 | |
| | | | | |
Premiums and fees earned | | | 62 | | | | 55 | | | | 52 | | | | 50 | | | | 48 | |
Average contract insurance and bonding premium rate | | | 0.78 | % | | | 0.63 | % | | | 0.63 | % | | | 0.60 | % | | | 0.58 | % |
Political risk insurance product group: | | | | | | | | | | | | | | | | | | | | |
| | | | | |
Political risk insurance average exposure | | | 1,328 | | | | 1,610 | | | | 1,676 | | | | 1,602 | | | | 1,627 | |
| | | | | |
Premiums and fees earned | | | 9 | | | | 18 | | | | 20 | | | | 19 | | | | 22 | |
Average political risk insurance premium rate | | | 0.71 | % | | | 1.12 | % | | | 1.19 | % | | | 1.19 | % | | | 1.35 | % |
Loan guarantees: | | | | | | | | | | | | | | | | | | | | |
| | | | | |
Loan guarantees average exposure | | | 2,395 | | | | 2,148 | | | | 2,068 | | | | 2,081 | | | | 2,476 | |
| | | | | |
Loan guarantee fees earned | | | 40 | | | | 41 | | | | 36 | | | | 36 | | | | 38 | |
Average loan guarantee fee rate | | | 1.67 | % | | | 1.91 | % | | | 1.74 | % | | | 1.73 | % | | | 1.53 | % |
|
Table 4: Provision for (Reversal of) Credit Losses | |
| | | | | |
(in millions of Canadian dollars) | | 2016 | | | 2015 | | | 2014 | | | 2013 | | | 2012 | |
Provision for (reversal of) credit losses on: | | | | | | | | | | | | | | | | | | | | |
| | | | | |
Loans | | | (4 | ) | | | 381 | | | | (15 | ) | | | 43 | | | | (263 | ) |
| | | | | |
Loan commitments | | | (30 | ) | | | 61 | | | | (6 | ) | | | (14 | ) | | | 18 | |
| | | | | |
Loan guarantees | | | 3 | | | | (5 | ) | | | (18 | ) | | | 1 | | | | (95 | ) |
Total provision for (reversal of) credit losses | | | $(31 | ) | | | $437 | | | | $(39 | ) | | | $30 | | | | $(340 | ) |
Management’s Discussion and Analysis
| | | | | | | | | | | | | | | | | | | | | | | | | | | | | | | | | | | | | | | | | | | | | | |
Table 5: Concentration of Exposure by Geographical Market | |
| | | Financing portfolio | | | | | Insurance portfolio | | | | | | | | | | |
(in millions
of Canadian
dollars) | | Financing assets(1) | | | Commitments and guarantees(2) | | | | | Credit insurance | | | Financial institutions insurance | | | Contract insurance and bonding | | | Political risk insurance(3) | | | Reinsurance ceded | | | Marketable securities and derivative instruments(4) | | | 2016 Exposure | |
| | | | | | | | | | | |
| | | | | | | | Policies | | | Guarantees | | | | | |
Country | | | | | | | | | | | | | | | | | | | | | | | | | | | | | | | | | | | | | | | | | $ | | | | % | |
United States | | | 11,285 | | | | 5,524 | | | | | | 4,789 | | | | 233 | | | | 39 | | | | 11 | | | | – | | | | – | | | | 5,427 | | | | 27,308 | | | | 23 | |
| | | | | | | | | | | | |
Canada | | | 6,917 | | | | 10,162 | | | | | | 240 | | | | – | | | | 472 | (5) | | | 7,446(6) | | | | – | | | | – | | | | 1,469 | | | | 26,706 | | | | 23 | |
| | | | | | | | | | | | |
United Kingdom | | | 3,822 | | | | 1,538 | | | | | | 293 | | | | – | | | | – | | | | – | | | | – | | | | – | | | | 229 | | | | 5,882 | | | | 5 | |
| | | | | | | | | | | | |
Brazil | | | 3,264 | | | | 294 | | | | | | 742 | | | | 367 | | | | 103 | | | | – | | | | 92 | | | | – | | | | – | | | | 4,862 | | | | 4 | |
| | | | | | | | | | | | |
Mexico | | | 2,036 | | | | 2,091 | | | | | | 268 | | | | 8 | | | | 5 | | | | – | | | | 106 | | | | – | | | | – | | | | 4,514 | | | | 4 | |
| | | | | | | | | | | | |
Australia | | | 3,220 | | | | 297 | | | | | | 277 | | | | – | | | | – | | | | – | | | | 4 | | | | – | | | | 163 | | | | 3,961 | | | | 3 | |
| | | | | | | | | | | | |
China | | | 1,780 | | | | 380 | | | | | | 322 | | | | 213 | | | | 4 | | | | – | | | | 310 | | | | – | | | | – | | | | 3,009 | | | | 3 | |
| | | | | | | | | | | | |
India | | | 2,542 | | | | 156 | | | | | | 156 | | | | 107 | | | | 4 | | | | – | | | | 8 | | | | – | | | | – | | | | 2,973 | | | | 3 | |
| | | | | | | | | | | | |
Chile | | | 1,990 | | | | 356 | | | | | | 32 | | | | 97 | | | | 1 | | | | – | | | | 182 | | | | – | | | | – | | | | 2,658 | | | | 2 | |
| | | | | | | | | | | | |
Saudi Arabia | | | 2,290 | | | | 32 | | | | | | 45 | | | | 1 | | | | 1 | | | | – | | | | 2 | | | | – | | | | – | | | | 2,371 | | | | 2 | |
| | | | | | | | | | | | |
Other(7) | | | 17,234 | | | | 4,490 | | | | | | 2,316 | | | | 2,874 | | | | 43 | | | | 42 | | | | 5,107 | | | | – | | | | 425 | | | | 32,531 | | | | 28 | |
| | | 56,380 | | | | 25,320 | | | | | | 9,480 | | | | 3,900 | | | | 672 | | | | 7,499 | | | | 5,811 | | | | – | | | | 7,713 | | | | 116,775 | | | | 100 | |
| | | | | | | | | | | | |
Country limits in excess of policy limits(3) | | | – | | | | – | | | | | | – | | | | – | | | | – | | | | – | | | | (4,419) | | | | – | | | | – | | | | (4,419 | ) | | | – | |
| | | | | | | | | | | | |
Reinsurance ceded(8) | | | – | | | | – | | | | | | – | | | | – | | | | – | | | | – | | | | – | | | | (250 | ) | | | – | | | | (250 | ) | | | – | |
Total | | | $56,380 | | | | $25,320 | | | | | | $9,480 | | | | $3,900 | | | | $672 | | | | $7,499 | | | | $1,392 | | | | $(250 | ) | | | $7,713 | | | | $112,106 | | | | 100 | |
| | | | | | | | | | | | | | | | | | | | | | | | | | | | | | | | | | | | | | | | | | | | | | |
| | | Financing portfolio | | | | | Insurance portfolio | | | | | | | | | | |
(in millions
of Canadian
dollars) | | Financing assets(1) | | | Commitments and guarantees(2) | | | | | Credit insurance | | | Financial institutions insurance | | | Contract insurance
and bonding | | | Political risk insurance(3) | | | Reinsurance ceded | | | Marketable
securities and derivative instruments(4) | | | 2015 Exposure | |
| | | | | | | | | | | |
| | | | | | | | Policies | | | Guarantees | | | | | |
Country | | | | | | | | | | | | | | | | | | | | | | | | | | | | | | | | | | | | | | | | | $ | | | | % | |
United States | | | 11,493 | | | | 5,559 | | | | | | 4,730 | | | | 248 | | | | 49 | | | | 23 | | | | – | | | | – | | | | 5,862 | | | | 27,964 | | | | 24 | |
| | | | | | | | | | | | |
Canada | | | 6,580 | | | | 9,002 | | | | | | 292 | | | | – | | | | 455 | (5) | | | 8,105(6) | | | | – | | | | – | | | | 1,028 | | | | 25,462 | | | | 22 | |
| | | | | | | | | | | | |
United Kingdom | | | 3,911 | | | | 1,701 | | | | | | 259 | | | | 103 | | | | – | | | | 2 | | | | 2 | | | | – | | | | 67 | | | | 6,045 | | | | 5 | |
| | | | | | | | | | | | |
Brazil | | | 3,620 | | | | 236 | | | | | | 564 | | | | 580 | | | | 110 | | | | – | | | | 95 | | | | – | | | | – | | | | 5,205 | | | | 4 | |
| | | | | | | | | | | | |
Mexico | | | 2,502 | | | | 1,772 | | | | | | 322 | | | | 39 | | | | 7 | | | | – | | | | 109 | | | | – | | | | – | | | | 4,751 | | | | 4 | |
| | | | | | | | | | | | |
Australia | | | 3,202 | | | | 509 | | | | | | 296 | | | | – | | | | – | | | | – | | | | 4 | | | | – | | | | 495 | | | | 4,506 | | | | 4 | |
| | | | | | | | | | | | |
Chile | | | 2,193 | | | | 165 | | | | | | 39 | | | | 583 | | | | 36 | | | | – | | | | 186 | | | | – | | | | – | | | | 3,202 | | | | 3 | |
| | | | | | | | | | | | |
Germany | | | 1,295 | | | | 1,088 | | | | | | 193 | | | | – | | | | 1 | | | | – | | | | – | | | | – | | | | – | | | | 2,577 | | | | 2 | |
| | | | | | | | | | | | |
Saudi Arabia | | | 1,659 | | | | 857 | | | | | | 39 | | | | – | | | | 1 | | | | – | | | | 4 | | | | – | | | | – | | | | 2,560 | | | | 2 | |
| | | | | | | | | | | | |
India | | | 1,855 | | | | 376 | | | | | | 118 | | | | 139 | | | | 4 | | | | – | | | | 9 | | | | – | | | | – | | | | 2,501 | | | | 2 | |
| | | | | | | | | | | | |
Other(7) | | | 15,931 | | | | 5,183 | | | | | | 2,538 | | | | 3,180 | | | | 62 | | | | 51 | | | | 5,559 | | | | – | | | | 592 | | | | 33,096 | | | | 28 | |
| | | 54,241 | | | | 26,448 | | | | | | 9,390 | | | | 4,872 | | | | 725 | | | | 8,181 | | | | 5,968 | | | | – | | | | 8,044 | | | | 117,869 | | | | 100 | |
| | | | | | | | | | | | |
Country limits in excess of policy limits(3) | | | – | | | | – | | | | | | – | | | | – | | | | – | | | | – | | | | (4,572) | | | | – | | | | – | | | | (4,572 | ) | | | – | |
| | | | | | | | | | | | |
Reinsurance ceded(8) | | | – | | | | – | | | | | | – | | | | – | | | | – | | | | – | | | | – | | | | (250 | ) | | | – | | | | (250 | ) | | | – | |
Total | | | $54,241 | | | | $26,448 | | | | | | $9,390 | | | | $4,872 | | | | $725 | | | | $8,181 | | | | $1,396 | | | | $(250 | ) | | | $8,044 | | | | $113,047 | | | | 100 | |
| (1) | Includes gross loans receivable, investments, gross investment in aircraft under finance leases and the impact of risk transfer transactions. |
| (2) | Includes undisbursed loan commitments, accepted and outstanding letters of offer, loan guarantees, investment commitments, unallocated confirmed lines of credit and the impact of risk transfer transactions. |
| (3) | Includes the sum of individual country exposures and thus exceeds the maximum liability of $1,392 million (2015 – $1,396 million) for all the policies in the political risk insurance product group. |
| (4) | Includes cash. Exposure does not take into consideration any collateral or the effect of any master netting agreements with derivative counterparties. |
| (5) | Includes $467 million of surety bond insurance, where the risk rests with the Canadian exporter (2015 – $455 million). A total of 49% of the exports insured under surety bond products are to the United States (2015 – 41%). The balance represents exports to other countries. |
| (6) | Includes $7,150 million in performance security guarantees, where the risk rests with the Canadian exporter (2015 – $7,900 million). A total of 58% of the exports insured under performance security products are to the United States (2015 – 61%). The balance represents exports to other countries. |
| (7) | Includes 185 countries (2015 – 181) with total exposure ranging from $0.001 million to $1,994 million (2015 – $0.001 million to $2,418 million). |
| (8) | Represents treaty reinsurance agreements covering most bonding obligors and the short-term export credit insurance portfolio, including most foreign bank exposures. |
EDC Annual Report 2016 81
Management’s Discussion and Analysis
| | | | | | | | | | | | | | | | | | | | | | | | | | | | | | | | | | | | | | | | | | | | | | | | |
Table 6: Concentration of Exposure by Industry | |
| | | Financing portfolio | | | | | | Insurance portfolio | | | | | | | | | | |
(in millions
of Canadian
dollars) | | Financing assets(1) | | | Commitments and guarantees(2) | | | | | | Credit insurance | | | Financial institutions insurance | | | Contract insurance
and bonding | | | Political risk insurance | | | Reinsurance ceded | | | Marketable
securities and derivative instruments(3) | | | | | | | |
| | | | | | | | | | | | | | | | | |
| | | | | | | | | Policies | | | Guarantees | | | | | | 2016 Exposure | |
Industry | | | | | | | | | | | | | | | | | | | | | | | | | | | | | | | | | | | | | | | | | | | $ | | | | % | |
Commercial: | | | | | | | | | | | | | | | | | | | | | | | | | | | | | | | | | | | | | | | | | | | | | | | | |
| | | | | | | | | | | | |
Financial institutions | | | 7,344 | | | | 737 | | | | | | | | 177 | | | | 3,900 | | | | 110 | | | | 3,207 | | | | 237 | | | | – | | | | 2,282 | | | | 17,994 | | | | 16 | |
| | | | | | | | | | | | |
Oil and gas | | | 8,653 | | | | 7,561 | | | | | | | | 565 | | | | – | | | | 13 | | | | 581 | | | | 383 | | | | – | | | | – | | | | 17,756 | | | | 16 | |
| | | | | | | | | | | | |
Aerospace | | | 12,993 | | | | 2,615 | | | | | | | | 615 | | | | – | | | | 29 | | | | 236 | | | | 79 | | | | – | | | | – | | | | 16,567 | | | | 15 | |
| | | | | | | | | | | | |
Mining | | | 7,685 | | | | 1,934 | | | | | | | | 2,216 | | | | – | | | | 6 | | | | 1,020 | | | | 137 | | | | – | | | | – | | | | 12,998 | | | | 12 | |
| | | | | | | | | | | | |
Surface transportation | | | 5,201 | | | | 3,830 | | | | | | | | 1,045 | | | | – | | | | 252 | | | | 353 | | | | 56 | | | | – | | | | 44 | | | | 10,781 | | | | 10 | |
| | | | | | | | | | | | |
Infrastructure and environment | | | 4,397 | | | | 3,095 | | | | | | | | 981 | | | | – | | | | 199 | | | | 1,367 | | | | 430 | | | | – | | | | – | | | | 10,469 | | | | 9 | |
| | | | | | | | | | | | |
Information and communication technology | | | 5,737 | | | | 2,265 | | | | | | | | 659 | | | | – | | | | 50 | | | | 235 | | | | 39 | | | | – | | | | – | | | | 8,985 | | | | 8 | |
| | | | | | | | | | | | |
Light manufacturing | | | 1,844 | | | | 2,210 | | | | | | | | 1,570 | | | | – | | | | 10 | | | | 220 | | | | 21 | | | | – | | | | – | | | | 5,875 | | | | 5 | |
| | | | | | | | | | | | |
Resources | | | 1,062 | | | | 712 | | | | | | | | 1,652 | | | | – | | | | 3 | | | | 280 | | | | 10 | | | | – | | | | – | | | | 3,719 | | | | 3 | |
Total commercial | | | 54,916 | | | | 24,959 | | | | | | | | 9,480 | | | | 3,900 | | | | 672 | | | | 7,499 | | | | 1,392 | | | | – | | | | 2,326 | | | | 105,144 | | | | 94 | |
| | | | | | | | | | | | |
Sovereign | | | 1,464 | | | | 361 | | | | | | | | – | | | | – | | | | – | | | | – | | | | – | | | | – | | | | 5,387 | | | | 7,212 | | | | 6 | |
| | | 56,380 | | | | 25,320 | | | | | | | | 9,480 | | | | 3,900 | | | | 672 | | | | 7,499 | | | | 1,392 | | | | – | | | | 7,713 | | | | 112,356 | | | | 100 | |
| | | | | | | | | | | | |
Reinsurance ceded(4) | | | – | | | | – | | | | | | | | – | | | | – | | | | – | | | | – | | | | – | | | | (250 | ) | | | – | | | | (250 | ) | | | – | |
Total | | | $56,380 | | | | $25,320 | | | | | | | | $9,480 | | | | $3,900 | | | | $672 | | | | $7,499 | | | | $1,392 | | | | $(250 | ) | | | $7,713 | | | | $112,106 | | | | 100 | |
| | | | | | | | | | | | | | | | | | | | | | | | | | | | | | | | | | | | | | | | | | | | | | | | |
| | | Financing portfolio | | | | | | Insurance portfolio | | | | | | | | | | |
(in millions of Canadian dollars) | | Financing assets(1) | | | Commitments and guarantees(2) | | | | | | Credit insurance | | | Financial institutions insurance | | | Contract insurance
and bonding | | | Political risk insurance | | | Reinsurance ceded | | | Marketable securities and derivative instruments(3) | | | | | | | |
| | | | | | | | | | | | | | | | | |
| | | | | | | | | Policies | | | Guarantees | | | | | | 2015 Exposure | |
Industry | | | | | | | | | | | | | | | | | | | | | | | | | | | | | | | | | | | | | | | | | | | $ | | | | % | |
Commercial: | | | | | | | | | | | | | | | | | | | | | | | | | | | | | | | | | | | | | | | | | | | | | | | | |
| | | | | | | | | | | | |
Financial institutions | | | 6,049 | | | | 1,008 | | | | | | | | 151 | | | | 4,872 | | | | 98 | | | | 3,726 | | | | 247 | | | | – | | | | 2,393 | | | | 18,544 | | | | 17 | |
| | | | | | | | | | | | |
Oil and gas | | | 9,087 | | | | 6,599 | | | | | | | | 483 | | | | – | | | | 28 | | | | 637 | | | | 314 | | | | – | | | | 24 | | | | 17,172 | | | | 15 | |
| | | | | | | | | | | | |
Aerospace | | | 13,651 | | | | 2,556 | | | | | | | | 567 | | | | – | | | | 37 | | | | 236 | | | | 85 | | | | – | | | | – | | | | 17,132 | | | | 15 | |
| | | | | | | | | | | | |
Mining | | | 7,367 | | | | 3,346 | | | | | | | | 1,815 | | | | – | | | | 9 | | | | 1,217 | | | | 148 | | | | – | | | | – | | | | 13,902 | | | | 12 | |
| | | | | | | | | | | | |
Surface transportation | | | 5,196 | | | | 3,618 | | | | | | | | 975 | | | | – | | | | 245 | | | | 317 | | | | 57 | | | | – | | | | 8 | | | | 10,416 | | | | 9 | |
| | | | | | | | | | | | |
Infrastructure and environment | | | 3,954 | | | | 3,096 | | | | | | | | 1,017 | | | | – | | | | 221 | | | | 1,343 | | | | 439 | | | | – | | | | – | | | | 10,070 | | | | 9 | |
| | | | | | | | | | | | |
Information and communication technology | | | 4,856 | | | | 3,983 | | | | | | | | 737 | | | | – | | | | 72 | | | | 197 | | | | 81 | | | | – | | | | – | | | | 9,926 | | | | 9 | |
| | | | | | | | | | | | |
Light manufacturing | | | 1,770 | | | | 1,468 | | | | | | | | 1,491 | | | | – | | | | 9 | | | | 188 | | | | 15 | | | | – | | | | – | | | | 4,941 | | | | 4 | |
| | | | | | | | | | | | |
Resources | | | 940 | | | | 639 | | | | | | | | 2,154 | | | | – | | | | 6 | | | | 320 | | | | 10 | | | | – | | | | – | | | | 4,069 | | | | 4 | |
Total commercial | | | 52,870 | | | | 26,313 | | | | | | | | 9,390 | | | | 4,872 | | | | 725 | | | | 8,181 | | | | 1,396 | | | | – | | | | 2,425 | | | | 106,172 | | | | 94 | |
| | | | | | | | | | | | |
Sovereign | | | 1,371 | | | | 135 | | | | | | | | – | | | | – | | | | – | | | | – | | | | – | | | | – | | | | 5,619 | | | | 7,125 | | | | 6 | |
| | | 54,241 | | | | 26,448 | | | | | | | | 9,390 | | | | 4,872 | | | | 725 | | | | 8,181 | | | | 1,396 | | | | – | | | | 8,044 | | | | 113,297 | | | | 100 | |
| | | | | | | | | | | | |
Reinsurance ceded(4) | | | – | | | | – | | | | | | | | – | | | | – | | | | – | | | | – | | | | – | | | | (250 | ) | | | – | | | | (250 | ) | | | – | |
Total | | | $54,241 | | | | $26,448 | | | | | | | | $9,390 | | | | $4,872 | | | | $725 | | | | $8,181 | | | | $1,396 | | | | $(250 | ) | | | $8,044 | | | | $113,047 | | | | 100 | |
| (1) | Includes gross loans receivable, investments, gross investment in aircraft under finance leases and the impact of risk transfer transactions. |
| (2) | Includes undisbursed loan commitments, accepted and outstanding letters of offer, loan guarantees, investment commitments, unallocated confirmed lines of credit and the impact of risk transfer transactions. |
| (3) | Includes cash. Exposure does not take into consideration any collateral or the effect of any master netting agreements with derivative counterparties. |
| (4) | Represents treaty reinsurance agreements covering most bonding obligors and the short-term export credit insurance portfolio, including most foreign bank exposures. |
Management’s Discussion and Analysis
Table 7: Individually Impaired Gross Loans Receivable
| | | | | | | | |
| | | |
(in millions of Canadian dollars) | | 2016 | | | 2015 | |
| | |
Commercial | | | | | | | | |
| | |
Mining | | | 315 | | | | 324 | |
| | |
Aerospace | | | 215 | | | | 107 | |
| | |
Information and communication technology | | | 209 | | | | 25 | |
| | |
Infrastructure and environment | | | 95 | | | | 97 | |
| | |
Resources | | | 94 | | | | 111 | |
| | |
Oil and gas | | | 71 | | | | 105 | |
| | |
Light manufacturing | | | 22 | | | | 56 | |
| | |
Surface transportation | | | 8 | | | | 8 | |
Total commercial | | | 1,029 | | | | 833 | |
| | |
Sovereign | | | | | | | | |
| | |
Iran | | | 8 | | | | 8 | |
| | |
Argentina | | | – | | | | 77 | |
| | |
Cuba | | | – | | | | 25 | |
Total sovereign | | | 8 | | | | 110 | |
Total impaired gross loans receivable | | | $1,037 | | | | $943 | |
| Table 8: | Collective Allowance for Losses on Loans, Loan Commitments and Loan Guarantees |
| | | | | | | | | | | | | | | | | | | | | | | | |
| | | |
(in millions of Canadian dollars) | | 2016 | | | 2015 | |
Industry of risk | | Provision
exposure* | | | Collective
allowance | | | Collective allowance as a percentage of provision exposure | | | Provision
exposure* | | | Collective
allowance | | | Collective allowance as a percentage of provision exposure | |
Commercial: | | | | | | | | | | | | | | | | | | | | | | | | |
| | | | | | |
Aerospace | | | 14,295 | | | | 293 | | | | 2.0 | | | | 15,435 | | | | 329 | | | | 2.1 | |
| | | | | | |
Oil and gas | | | 14,037 | | | | 227 | | | | 1.6 | | | | 13,711 | | | | 279 | | | | 2.0 | |
| | | | | | |
Mining | | | 8,828 | | | | 226 | | | | 2.6 | | | | 9,181 | | | | 240 | | | | 2.6 | |
| | | | | | |
Information and communication technology | | | 6,683 | | | | 105 | | | | 1.6 | | | | 7,045 | | | | 124 | | | | 1.8 | |
| | | | | | |
Infrastructure and environment | | | 5,985 | | | | 104 | | | | 1.7 | | | | 5,337 | | | | 69 | | | | 1.3 | |
| | | | | | |
Light manufacturing | | | 2,490 | | | | 91 | | | | 3.7 | | | | 2,193 | | | | 99 | | | | 4.5 | |
| | | | | | |
Surface transportation | | | 7,828 | | | | 58 | | | | 0.7 | | | | 7,647 | | | | 57 | | | | 0.7 | |
| | | | | | |
Resources | | | 1,444 | | | | 29 | | | | 2.0 | | | | 1,277 | | | | 26 | | | | 2.0 | |
| | | | | | |
Financial institutions | | | 7,910 | | | | 24 | | | | 0.3 | | | | 6,482 | | | | 24 | | | | 0.4 | |
Total commercial | | | 69,500 | | | | 1,157 | | | | 1.7 | | | | 68,308 | | | | 1,247 | | | | 1.8 | |
| | | | | | |
Sovereign | | | 1,749 | | | | 39 | | | | 2.2 | | | | 1,358 | | | | 119 | | | | 8.8 | |
Total | | | $71,249 | | | | $1,196 | | | | 1.7 | | | | $69,666 | | | | $1,366 | | | | 2.0 | |
* Calculated using factored exposure.
EDC Annual Report 2016 83
Management’s Discussion and Analysis
| | | | | | | | | | | | | | | | | | | | | | | | |
Table 9: Investments | |
(in millions of Canadian dollars) | | Investments
financing | | | Undisbursed
commitments | | | | | | 2016 Exposure | | | | | | 2015 Exposure | |
Gross exposure | | | | | | | | | | | $ | | | | % | | | | $ | | | | % | |
Domestic market | | | 450 | | | | 473 | | | | 923 | | | | 48 | | | | 797 | | | | 46 | |
| | | | | | |
Other advanced economies | | | 27 | | | | 65 | | | | 92 | | | | 5 | | | | 110 | | | | 6 | |
| | | | | | |
Emerging markets | | | 528 | | | | 376 | | | | 904 | | | | 47 | | | | 844 | | | | 48 | |
Total | | | $1,005 | | | | $914 | | | | $1,919 | | | | 100 | | | | $1,751 | | | | 100 | |
Table 10: Claims – Size Concentration
| | | | | | | | | | | | | | | | | | | | | | | | | | | | | | | | |
| | | |
(in millions of Canadian dollars) | | 2016 | | | 2015 | |
| | | | | | | | |
| | | $ of claims
paid | | | Number of
claims paid | | | $ of claims
recoveries | | | Number of claims with recoveries | | | $ of claims paid | | | Number of
claims paid | | | $ of claims
recoveries | | | Number of claims with recoveries | |
$0 – $100,000 | | | 11 | | | | 557 | | | | 3 | | | | 253 | | | | 10 | | | | 506 | | | | 3 | | | | 253 | |
| | | | | | | | |
$100,001 – $1 million | | | 33 | | | | 121 | | | | 9 | | | | 31 | | | | 38 | | | | 134 | | | | 7 | | | | 24 | |
| | | | | | | | |
Over $1 million | | | 66 | | | | 18 | | | | 11 | | | | 3 | | | | 95 | | | | 25 | | | | 5 | | | | 3 | |
Total | | | $110 | | | | 696 | | | | $23 | | | | 287 | | | | $143 | | | | 665 | | | | $15 | | | | 280 | |
EDC Annual Report 2016 85 Consolidated Financial Statements Contents Consolidated Financial Statements 86 Financial Reporting Responsibility 87 Independent Auditor’s Report 88 Consolidated Statement of Financial Position 89 Consolidated Statement of Comprehensive Income 90 Consolidated Statement of Changes in Equity 91 Consolidated Statement of Cash Flows 92 Notes to the Consolidated Financial Statements 92 1. Corporate Mandate 93 2. Summary of Significant Accounting Policies 100 3. Marketable Securities 101 4. Loans Receivable 103 5. Individually Impaired Gross Loans Receivable 104 6. Allowance for Losses on Loans, Loan Commitments and Loan Guarantees 105 7. Investments at Fair Value Through Profit or Loss 105 8. Assets Held-for-Sale 106 9. Net Investment in Aircraft under Finance Leases 106 10. Recoverable Insurance Claims 106 11. Other Assets 107 12. Property, Plant and Equipment 107 13. Intangible Assets 108 14. Building under Finance Lease 108 15. Accounts Payable and Other Credits 109 16. Debt Instruments 110 17. Derivative Instruments 111 18. Debt Instrument Maturities 112 19. Premium and Claims Liabilities 113 20. Financing Commitments 113 21. Contingent Liabilities 115 22. Insurance Risks 120 23. Equity 120 24. Capital Management 121 25. Interest Rate Risk 123 26. Foreign Currency Balances 124 27. Fair Value of Financial Instruments 128 28. Financial Instrument Risks 129 29. Structured Entities 130 30. Loan Revenue 130 31. Marketable Securities Revenue 131 32. Interest Expense 131 33. Leasing and Financing Related Expenses 131 34. Net Insurance Premiums and Guarantee Fees 132 35. Provision for (Reversal of) Credit Losses 132 36. Claims-Related Expenses 132 37. Other (Income) Expenses 133 38. Administrative Expenses 133 39. Retirement Benefit Obligations 139 40. Related Party Transactions 139 41. Canada Account Transactions
Financial Reporting Responsibility
| | |
 | | Financial Reporting Responsibility Ken Kember Senior Vice-President and Chief Financial Officer |
The consolidated financial statements contained in this Annual Report have been prepared by management in accordance with International Financial Reporting Standards appropriate in the circumstances. The integrity and objectivity of the data in these consolidated financial statements are management’s responsibility. It is necessary for management to make assumptions, estimates and judgments based on information available as at the date of the financial statements. Areas where management has made significant estimates, assumptions and judgments include the allowance for losses on loans, loan commitments and loan guarantees, assets held-for-sale, recoverable insurance claims, premium and claims liabilities, financial instruments measured at fair value, retirement benefit obligations and the determination of the control of structured entities. Management is also responsible for all other information in the Annual Report and for ensuring that this information is consistent, where appropriate, with the information and data contained in the consolidated financial statements.
In support of its responsibility, management maintains financial, management control and information systems and management practices to provide reasonable assurance that the financial information is reliable, that the assets are safeguarded and that the operations are carried out effectively. We have an internal audit department whose functions include reviewing internal controls and their application, on an ongoing basis.
The Board of Directors is responsible for the management of our business and activities. In particular, it is responsible for ensuring that management fulfills its responsibilities for financial reporting and internal control and exercises this responsibility through the Audit Committee of the Board, which is composed of Directors who are not employees of EDC. The Audit Committee meets with management, the internal auditors and the Auditor General of Canada on a regular basis.
Contracts which, in our opinion, involve risks in excess of that which we would normally undertake, may be entered into under the authority of the Minister of International Trade and the Minister of Finance where the Minister of International Trade considers them to be in the national interest. Funds required for such contracts are paid to EDC by the Minister of Finance out of the Consolidated Revenue Fund, and funds recovered are remitted to the Consolidated Revenue Fund, net of amounts withheld to cover related administrative expenses. These transactions, which are known as Canada Account transactions, are shown in Note 41 to our consolidated financial statements, and the responsibility of the Board of Directors for these transactions is limited to the management of the administration thereof by EDC.
The Auditor General of Canada conducts an independent audit, in accordance with Canadian generally accepted auditing standards, and expresses his opinion on the consolidated financial statements. His report is presented on the following page.
| | |
 | | 
|
Benoit Daignault | | Ken Kember |
| |
| President and Chief Executive Officer | | Senior Vice-President and Chief Financial Officer |
| |
February 24, 2017 | | |
Independent Auditor’s Report
| | | | |
 | | Office of the Auditor General of Canada | | Bureau du vérificateur général du Canada |
To the Minister of International Trade
Report on the Consolidated
Financial Statements
I have audited the accompanying consolidated financial statements of Export Development Canada, which comprise the consolidated statement of financial position as at December 31, 2016, and the consolidated statement of comprehensive income, consolidated statement of changes in equity and consolidated statement of cash flows for the year then ended, and a summary of significant accounting policies and other explanatory information.
Management’s Responsibility for the
Consolidated Financial Statements
Management is responsible for the preparation and fair presentation of these consolidated financial statements in accordance with International Financial Reporting Standards, and for such internal control as management determines is necessary to enable the preparation of consolidated financial statements that are free from material misstatement, whether due to fraud or error.
Auditor’s Responsibility
My responsibility is to express an opinion on these consolidated financial statements based on my audit. I conducted my audit in accordance with Canadian generally accepted auditing standards. Those standards require that I comply with ethical requirements and plan and perform the audit to obtain reasonable assurance about whether the consolidated financial statements are free from material misstatement.
An audit involves performing procedures to obtain audit evidence about the amounts and disclosures in the consolidated financial statements. The procedures selected depend on the auditor’s judgment, including the assessment of the risks of material misstatement of the consolidated financial statements, whether due to fraud or error. In making those risk assessments, the auditor considers internal control relevant to the entity’s preparation and fair presentation of the consolidated financial statements in order to design audit procedures that are appropriate in the circumstances, but not for the purpose of expressing an opinion on the effectiveness of the entity’s internal control. An audit also
includes evaluating the appropriateness of accounting policies used and the reasonableness of accounting estimates made by management, as well as evaluating the overall presentation of the consolidated financial statements.
I believe that the audit evidence I have obtained is sufficient and appropriate to provide a basis for my audit opinion.
Opinion
In my opinion, the consolidated financial statements present fairly, in all material respects, the financial position of Export Development Canada as at December 31, 2016, and its financial performance and its cash flows for the year then ended in accordance with International Financial Reporting Standards.
Report on Other Legal and
Regulatory Requirements
As required by the Financial Administration Act, I report that, in my opinion, the accounting principles in International Financial Reporting Standards have been applied, on a basis consistent with that of the preceding year.
Further, in my opinion, the transactions of Export Development Canada and its wholly-owned subsidiary that have come to my notice during my audit of the consolidated financial statements have, in all significant respects, been in accordance with Part X of the Financial Administration Act and regulations, the Export Development Act and regulations, the by-laws of Export Development Canada, the charter and by-laws of its wholly-owned subsidiary, and the directives issued pursuant to Section 89 of the Financial Administration Act.

Mary Katie Kerrigan, CPA, CA
Principal
for the Auditor General of Canada
February 24, 2017
Ottawa, Canada
|
| EDC Annual Report 2016 87 |
Consolidated Financial Statements
Export Development Canada
Consolidated Statement of Financial Position
| | | | | | | | | | | | |
as at December 31 (in millions of Canadian dollars) | | Notes | | | 2016 | | | 2015 | |
Assets | | | | | | | | | | | | |
| | | |
Cash | | | | | | | 330 | | | | 438 | |
| | | |
Marketable securities | | | 3 | | | | 7,059 | | | | 7,256 | |
| | | |
Derivative instruments | | | 17 | | | | 324 | | | | 350 | |
| | | |
Assets held-for-sale | | | 8 | | | | 42 | | | | 15 | |
| | | |
Loans receivable | | | 4, 5 | | | | 55,250 | | | | 53,136 | |
| | | |
Allowance for losses on loans | | | 6 | | | | (1,552 | ) | | | (1,715 | ) |
| | | |
Investments at fair value through profit or loss | | | 7 | | | | 1,005 | | | | 848 | |
| | | |
Net investment in aircraft under finance leases | | | 9 | | | | – | | | | 64 | |
| | | |
Recoverable insurance claims | | | 10 | | | | 63 | | | | 54 | |
| | | |
Reinsurers’ share of premium and claims liabilities | | | 19 | | | | 116 | | | | 141 | |
| | | |
Other assets | | | 11 | | | | 156 | | | | 110 | |
| | | |
Retirement benefit asset | | | 39 | | | | 43 | | | | – | |
| | | |
Property, plant and equipment | | | 12 | | | | 55 | | | | 53 | |
| | | |
Intangible assets | | | 13 | | | | 92 | | | | 71 | |
| | | |
Building under finance lease | | | 14 | | | | 141 | | | | 148 | |
| | | | |
Total Assets | | | | | | | $63,124 | | | | $60,969 | |
| | | |
Liabilities and Equity | | | | | | | | | | | | |
| | | |
Accounts payable and other credits | | | 15 | | | | 142 | | | | 115 | |
| | | |
Loans payable | | | 16 | | | | 49,101 | | | | 46,909 | |
| | | |
Derivative instruments | | | 17 | | | | 2,819 | | | | 3,434 | |
| | | |
Obligation under finance lease | | | 14 | | | | 158 | | | | 162 | |
| | | |
Retirement benefit obligations | | | 39 | | | | 240 | | | | 225 | |
| | | |
Allowance for losses on loan commitments | | | 6 | | | | 78 | | | | 113 | |
| | | |
Premium and claims liabilities | | | 19 | | | | 656 | | | | 688 | |
| | | |
Loan guarantees | | | 6, 21 | | | | 167 | | | | 158 | |
| | | | | | | | 53,361 | | | | 51,804 | |
Financing commitments (Note 20) and contingent liabilities (Note 21) | | | | | | | | | | | | |
| | | |
Equity | | | | | | | | | | | | |
| | | |
Share capital | | | 23 | | | | 1,333 | | | | 1,333 | |
| | | |
Retained earnings | | | | | | | 8,430 | | | | 7,832 | |
| | | | | | | | 9,763 | | | | 9,165 | |
Total Liabilities and Equity | | | | | | | $63,124 | | | | $60,969 | |
The accompanying notes are an integral part of these consolidated financial statements.
These financial statements were approved for issuance by the Board of Directors on February 24, 2017.
| | | | |
 | |  | | |
| Herbert M. Clarke | | Benoit Daignault | | |
| Director | | Director | | |
Consolidated Financial Statements
Export Development Canada
Consolidated Statement of Comprehensive Income
| | | | | | | | | | | | |
for the year ended December 31 | | | | | | | | | |
(in millions of Canadian dollars) | | Notes | | | 2016 | | | 2015 | |
| | | |
Financing and Investment Revenue: | | | | | | | | | | | | |
| | | |
Loan | | | 30 | | | | 1,720 | | | | 1,475 | |
| | | |
Finance lease | | | | | | | 1 | | | | 5 | |
| | | |
Marketable securities | | | 31 | | | | 73 | | | | 60 | |
| | | |
Investments | | | | | | | 9 | | | | 8 | |
Total financing and investment revenue | | | | | | | 1,803 | | | | 1,548 | |
| | | |
Interest expense | | | 32 | | | | 450 | | | | 183 | |
| | | |
Leasing and financing related expenses | | | 33 | | | | 37 | | | | 28 | |
Net Financing and Investment Income | | | | | | | 1,316 | | | | 1,337 | |
| | | |
Loan Guarantee Fees | | | | | | | 40 | | | | 41 | |
Insurance premiums and guarantee fees | | | | | | | 223 | | | | 217 | |
| | | |
Reinsurance assumed | | | | | | | 6 | | | | 7 | |
| | | |
Reinsurance ceded | | | | | | | (37 | ) | | | (30 | ) |
| | | |
Net Insurance Premiums and Guarantee Fees | | | 34 | | | | 192 | | | | 194 | |
| | | |
Other (Income) Expenses | | | 37 | | | | 76 | | | | (200 | ) |
| | | |
Administrative Expenses | | | 38 | | | | 385 | | | | 351 | |
| | | |
Income before Provision and Claims-Related Expenses | | | | | | | 1,087 | | | | 1,421 | |
| | | |
Provision for (Reversal of) Credit Losses | | | 35 | | | | (31 | ) | | | 437 | |
| | | |
Claims-Related Expenses | | | 36 | | | | 46 | | | | 59 | |
| | | |
Net Income | | | | | | | 1,072 | | | | 925 | |
| | | |
Other comprehensive income: | | | | | | | | | | | | |
| | | |
Pension plan re-measurement | | | 39 | | | | 26 | | | | 24 | |
| | | | |
Comprehensive Income | | | | | | | $1,098 | | | | $949 | |
The accompanying notes are an integral part of these consolidated financial statements.
All items presented in other comprehensive income will not be reclassified to net income in subsequent periods.
|
| EDC Annual Report 2016 89 |
Consolidated Financial Statements
Export Development Canada
Consolidated Statement of Changes in Equity
| | | | | | | | | | | | |
for the year ended December 31 | | | | | | | | | |
(in millions of Canadian dollars) | | Notes | | | 2016 | | | 2015 | |
| | | |
Share Capital | | | 23 | | | | 1,333 | | | | 1,333 | |
| | | |
Retained Earnings | | | | | | | | | | | | |
| | | |
Balance beginning of year | | | | | | | 7,832 | | | | 6,883 | |
| | | |
Net income | | | | | | | 1,072 | | | | 925 | |
| | | |
Other comprehensive income | | | | | | | | | | | | |
| | | |
Pension plan re-measurement | | | | | | | 26 | | | | 24 | |
| | | |
Dividends paid | | | 23 | | | | (500) | | | | – | |
| | | | |
Balance end of year | | | | | | | 8,430 | | | | 7,832 | |
| | | |
Total Equity at End of Year | | | | | | $ | 9,763 | | | $ | 9,165 | |
The accompanying notes are an integral part of these consolidated financial statements.
90 Changing Trade
Consolidated Financial Statements
Export Development Canada
Consolidated Statement of Cash Flows
| | | | | | | | |
for the year ended December 31 | | | | | | |
(in millions of Canadian dollars) | | 2016 | | | 2015 | |
| | |
Cash Flows from (used in) Operating Activities | | | | | | | | |
| | |
Net income | | | 1,072 | | | | 925 | |
| | |
Adjustments to determine net cash from (used in) operating activities | | | | | | | | |
| | |
Provision for (reversal of) credit losses | | | (31 | ) | | | 437 | |
| | |
Actuarial change in the net allowance for claims on insurance | | | (33 | ) | | | (55 | ) |
| | |
Depreciation and amortization | | | 32 | | | | 31 | |
| | |
Realized (gains) and losses | | | 16 | | | | (120 | ) |
| | |
Changes in operating assets and liabilities | | | | | | | | |
| | |
Change in accrued interest and fees receivable | | | (158 | ) | | | (22 | ) |
| | |
Change in fair value of marketable securities | | | 33 | | | | 24 | |
| | |
Change in fair value of loans payable | | | (58 | ) | | | (159 | ) |
| | |
Change in derivative instruments | | | (18 | ) | | | 186 | |
| | |
Other | | | 113 | | | | (86 | ) |
| | |
Loan disbursements | | | (22,709 | ) | | | (18,800 | ) |
| | |
Loan repayments and principal recoveries from loan asset sales | | | 18,713 | | | | 14,990 | |
| | |
Net cash used in operating activities | | | (3,028 | ) | | | (2,649 | ) |
| | |
Cash Flows from (used in) Investing Activities | | | | | | | | |
| | |
Disbursements for investments | | | (237 | ) | | | (209 | ) |
| | |
Receipts from investments | | | 121 | | | | 194 | |
| | |
Finance lease repayments | | | 4 | | | | 16 | |
| | |
Purchases of marketable securities | | | (58,539 | ) | | | (70,292 | ) |
| | |
Sales/maturities of marketable securities | | | 58,505 | | | | 70,538 | |
| | |
Proceeds on sale of assets held-for-sale | | | 4 | | | | 74 | |
| | | |
Net cash from (used in) investing activities | | | (142 | ) | | | 321 | |
| | |
Cash Flows from (used in) Financing Activities | | | | | | | | |
| | |
Issue of long-term loans payable | | | 13,733 | | | | 16,089 | |
| | |
Repayment of long-term loans payable | | | (9,206 | ) | | | (13,440 | ) |
| | |
Issue of short-term loans payable | | | 36,184 | | | | 27,406 | |
| | |
Repayment of short-term loans payable | | | (36,583 | ) | | | (27,306 | ) |
| | |
Disbursements from sale/maturity of derivative instruments | | | (548 | ) | | | (158 | ) |
| | |
Receipts from sale/maturity of derivative instruments | | | – | | | | 73 | |
| | |
Dividend paid | | | (500 | ) | | | – | |
| | |
Net cash from financing activities | | | 3,080 | | | | 2,664 | |
| | |
Effect of exchange rate changes on cash | | | (18 | ) | | | 33 | |
| | |
Net increase (decrease) in cash | | | (108 | ) | | | 369 | |
| | |
Cash | | | | | | | | |
| | |
Beginning of year | | | 438 | | | | 69 | |
| | |
End of year | | | $330 | | | | $438 | |
| | |
Operating Cash Flows from Interest | | | | | | | | |
| | |
Cash paid for interest on loans payable | | | $386 | | | | $190 | |
| | |
Cash received for interest on currency swaps related to capital | | | $12 | | | | $49 | |
| | |
Cash received for interest on loan assets and marketable securities | | | $1,620 | | | | $1,392 | |
The accompanying notes are an integral part of these consolidated financial statements.
|
| EDC Annual Report 2016 91 |
Consolidated Financial Statements
|
Notes to the Consolidated Financial Statements |
| | |

| | Corporate Mandate |
Export Development Canada (the “Corporation” or “EDC”) was created in 1944 as Canada’s export credit agency (ECA). On October 1, 1969, EDC was established as a Crown corporation by a statute of the Parliament of Canada, the Export Development Act (the “Act”). EDC’s mandate is to support and develop, directly or indirectly, Canada’s export trade, and Canadian capacity to engage in that trade and respond to international business opportunities.
The Corporation is named in Part I of Schedule III to the Financial Administration Act (the “FA Act”) and is accountable for its affairs to Parliament through the Minister of International Trade (the “Minister”).
In September 2008, EDC, together with other federal Crown corporations, was given a directive (PC 2008-1598) pursuant to Section 89 of the FA Act, entitled Order giving a direction to parent Crown corporations involved in commercial lending to give due consideration to the personal integrity of those they lend to or provide benefits to, in accordance with the Federal Government’s policy to improve the accountability and integrity of federal institutions. Following its issuance the Corporation implemented the Directive and the President and Chief Executive Officer of EDC notified the Minister in accordance with Subsection 89(6) of the FA Act.
In December 2014, the Governor in Council issued a directive (PC 2014-1381) that requires EDC to implement pension plan reforms. These pension reforms are intended to ensure that pension plans of Crown corporations provide a 50:50 current service cost-sharing ratio between employee and employer for pension contributions, to be phased in for all members by December 31, 2017. EDC has taken action to implement the spirit and intent of these reforms, such as raising the normal age at which an employee can retire with a full pension. We submitted a business case pursuant to an established process to request an exemption from equal cost sharing, given the closure of our Defined Benefit pension plan and introduction of a Defined Contribution pension plan. On February 13, 2017, approval of the business case was granted by way of a new directive (PC2017-127) which repeals the original pension plan reform directive issued in 2014.
In July 2015, the Corporation, together with other federal Crown corporations, was issued a directive (PC 2015-1110) pursuant to Section 89 of the FA Act to align our travel, hospitality, conference and event expenditure policies, guidelines and practices with Treasury Board policies, directives and related instruments on travel, hospitality, conference and event expenditures in a manner that is consistent with our legal obligations and to report on the implementation of this directive in the Corporation’s next Corporate Plan. We have complied with the directive in a way that does not hinder our ability to deliver on our mandate for Canadian companies.
The Government of Canada is the sole shareholder of EDC.
We incorporated Exinvest Inc. as a wholly-owned subsidiary (the “Subsidiary”) under the Canada Business Corporations Act in 1995.
Our earnings and those of our Subsidiary are not subject to the requirements of the Income Tax Act.
We are subject to a limit imposed by the Act on our contingent liability arrangements. The Act specifies that the limit applies to the principal amount owing under all outstanding arrangements which have the effect of providing, to any person, any insurance, reinsurance, indemnity or guarantee. This limit shall at no time exceed the greater of an amount equal to 10 times our authorized capital and $45.0 billion which amount may be varied in an Appropriation Act. At the end of December 2016, the amount of these contingent liabilities was $25.2 billion (2015 – $26.5 billion).
We are for all purposes an agent of Her Majesty in right of Canada. As a result, all obligations under debt instruments we issue are obligations of Canada. The Act allows us to borrow and have outstanding borrowings up to a maximum of 15 times the aggregate of (a) our current paid-in capital and (b) our retained earnings determined in accordance with the previous year’s audited financial statements. The maximum applicable to December 31, 2016 is $137.5 billion (2015 – $123.2 billion), against which borrowings amounted to $49.1 billion (2015 – $46.9 billion).
Consolidated Financial Statements
| | |
 | | Summary of Significant Accounting Policies |
Basis of Presentation
Our consolidated financial statements have been prepared in accordance with International Financial Reporting Standards (IFRS). The Corporation is organized and managed as a single business segment. The significant accounting policies used in the preparation of these consolidated financial statements are summarized on the following pages and conform in all material respects to IFRS.
Basis of Consolidation
Our consolidated financial statements include the assets, liabilities, results of operations and cash flows of our wholly-owned subsidiary and those structured entities consolidated under IFRS 10 – Consolidated Financial Statements. Intercompany transactions and balances have been eliminated.
Application of New and Revised International Financial Reporting Standards
(a) New standards, amendments and interpretations
Disclosure Initiative – Amendments to IAS 1 – Presentation of Financial Statements – The Corporation adopted narrow-scope amendments to IAS 1 which provide guidance on the application of materiality in the financial statements and removes impediments to judgment when applying IAS 1. EDC has assessed the disclosure requirements and determined that the adoption did not result in any change.
(b) Standards, amendments and interpretations not yet in effect
The following standards and amendments issued by the IASB have been assessed as having a possible effect on EDC in the future. EDC is currently assessing the impact of these standards and amendments on its consolidated financial statements:
Disclosure Initiative – Amendments to IAS 7 – Statement of Cash Flows – In January 2016, the IASB issued amendments to the standard that require entities to provide disclosures that enable users of financial statements to evaluate changes in liabilities arising from financing activities. The amendments are effective for annual periods beginning on or after January 1, 2017 and will result in enhanced cash flow disclosure of loans payable and derivative instruments.
IFRS 9 – Financial Instruments – In July 2014, the IASB issued the final version of IFRS 9, Financial Instruments, which is to be applied retrospectively for reporting periods beginning on or after January 1, 2018 and replaces the guidance in IAS 39 Financial Instruments: Recognition and Measurement. The standard introduces an expected loss impairment model and limited changes to the classification and measurement requirements for financial assets. EDC early adopted the classification and measurement requirements of IFRS 9 upon transition to IFRS in 2011. Changes to the impairment model are highly relevant to EDC and will impact our allowance for losses on loans, loan commitments and loan guarantees, however, we cannot reasonably quantify the impact at this time.
IFRS 15 – Revenue from Contracts with Customers – In May 2014, the IASB issued the new standard which establishes a comprehensive framework for the recognition, measurement and disclosure of revenue and cash flows arising from an entity’s contracts with customers except for revenue arising from items such as financial instruments, insurance contracts and leases. The standard is expected to have a minimal impact on EDC’s financial statements and is effective for reporting periods beginning on or after January 1, 2018.
IFRS 16 – Leases – In January 2016, the IASB released the new Leases Standard requiring lessees to recognize assets and liabilities for the rights and obligations created by leases. The standard is expected to have a minimal impact on EDC’s financial statements and is effective for reporting periods beginning on or after January 1, 2019.
Use of Estimates and Key Judgments
To prepare our financial statements in accordance with IFRS, it is necessary for management to exercise judgment and make use of estimates and assumptions, in applying certain accounting policies. We utilize current market data, our own historical experience and other information available to us as at the date of the financial statements in arriving at our decisions. We have established procedures to ensure that the process for determining our estimates and assumptions is well controlled and occurs in an appropriate and systematic manner.
Uncertainty is inherent in the use of estimates and assumptions and as a result, actual results may vary significantly from management’s estimates. Uncertainty arises, in part, from the use of historical experience and data at a point in time to establish our assumptions. While this data may be the most reliable basis available on which to base our assumptions, economic events may occur subsequently that render previous assumptions invalid and cause a material change to actual results.
Areas where management has made significant use of estimates and exercised judgment are discussed below.
|
| EDC Annual Report 2016 93 |
Consolidated Financial Statements
Estimates
Note 6 – Allowance for Losses on Loans, Loan Commitments and Loan Guarantees
The allowance for losses on loans, loan commitments and loan guarantees represents management’s best estimate of probable credit losses. These estimates are reviewed periodically during the year and in detail as at the date of the financial statements.
The purpose of the collective allowance is to provide an estimate of probable incurred losses inherent in the loan portfolio that have not been identified on an individual loan basis. Estimation is inherent in the assessment of probabilities of default, loss severity in the event of default also referred to as loss given default, review of credit quality and the value of any collateral. Management also considers the impact of economic events, industry trends and risk concentrations on the portfolio and the required allowance.
Allowances are established on an individual basis for loans, commitments and guarantees that management has determined to be impaired and/or for which losses have been incurred. When an obligor is considered impaired, we reduce the carrying value of the loan to its net realizable value. Management is required to make a number of estimates including the timing and amount of future cash flows and the residual values of the underlying collateral.
Note 8 – Assets Held-for-Sale
Assets held-for-sale are measured at the lower of their carrying amount and fair value less costs to sell. At each reporting period, we estimate the recoverable amount of these assets by obtaining market values from an independent appraiser supplemented by additional current market data and other information available to us, less estimated costs to sell.
Note 10 – Recoverable Insurance Claims
When an insurance claim is paid, management estimates any future recovery and records it within recoverable insurance claims. The estimation process is dependent upon our assessment of the future cash flows to be realized through collection efforts made by us, the policyholder or collection agencies. The estimated recoverable amount is reviewed and adjusted on a quarterly basis.
Note 19 – Premium and Claims Liabilities
The premium and claims liabilities are based on our estimate of future claims under the terms and conditions of our insurance policies. The actuarial valuation uses simulation techniques and is based on assumptions relevant to the insurance products and is derived in conjunction with our own experience. The actuarial calculation of the premium and claims liabilities uses management’s assumptions for, among other things, the severity of loss, loss development, frequency of claim and discount rate.
Note 27 – Fair Value of Financial Instruments
The majority of financial instruments are recognized on our consolidated statement of financial position at their fair value. These financial instruments include marketable securities at fair value through profit or loss, recoverable insurance claims, derivative instruments, investments at fair value through profit or loss and loans payable designated at fair value through profit or loss. Fair value is defined as the price that would be received to sell an asset or paid to transfer a liability in an orderly transaction between market participants at the measurement date.
Our financial instruments are categorized into one of three levels based on whether the techniques employed to value the instruments use observable or unobservable market inputs. Financial instruments categorized as Level 1 are valued using quoted market prices, thus minimal estimation is required. Those instruments categorized as Level 2 and 3 require the use of greater estimation and judgment as they may include inputs that are not based on observable market data. Refer to Note 27 for additional details on the techniques used to value our financial instruments.
Note 39 – Retirement Benefit Obligations
EDC maintains a defined benefit pension plan, a defined contribution plan and other post-retirement benefit plans. IFRS requires that management measure the plans’ defined benefit obligations and annual costs using assumptions that are long-term in nature and reflect our best estimates. We review key assumptions on an annual basis with our actuaries using relevant experience, in conjunction with market related data. The key assumptions include expected rate of compensation increase, the discount rate, inflation rate, longevity of plan members, and health care costs.
Judgments
Note 6 – Allowance for Losses on Loans, Loan Commitments and Loan Guarantees
Management judgment is used to assess the impact of recent events and changes in economic conditions to determine whether a financial asset or group of financial assets is impaired or performing.
Note 19 – Premium and Claims Liabilities
Judgment is used in selecting the severity of loss, loss development, frequency of claim, discount rate and the confidence level for adverse deviation in the calculation of our insurance premium and claims liabilities.
Note 27 – Fair Value of Financial Instruments
The categorization of our financial instruments into three fair value hierarchy levels requires judgment. Our policy is to recognize transfers into and out of these levels at the date of the event or change in circumstances that caused the transfer. Quantitative disclosure is provided for all transfers among all levels regardless of their significance.
Financial instruments categorized as Level 2 and 3 require significant judgment in the selection of appropriate discount rates, yield curves and other inputs into our models which are not based on observable market data.
Consolidated Financial Statements
Note 29 – Structured Entities
A structured entity (SE) is defined as an entity created to accomplish a narrow and well-defined objective. Management exercises judgment in determining whether EDC has control of structured entities. When EDC has power over a SE and is exposed, or has rights to variable returns from its involvement with a SE and has the ability to affect those returns through its power over the SE, EDC is considered to control the SE and the SE is consolidated within our financial statements. When the criteria for control are not met, SEs are not consolidated.
Note 39 – Retirement Benefit Obligations
The management assumption with the greatest potential impact on our defined benefit obligation is the discount rate. Management judgment is used in the determination of the discount rate, which is set by reference to the yield of a portfolio of high quality fixed income instruments (rated AA or higher), that match the timing of the expected benefit payments.
Marketable Securities
We hold marketable securities for liquidity purposes. The size and nature of our marketable securities portfolio are governed by Board approved policies. Our marketable securities are held with creditworthy counterparties that must have a minimum credit rating from an external credit rating agency of A- for all transactions.
Marketable securities held directly by EDC are recorded at fair value through profit or loss to reflect our business model for managing these instruments. We measure performance for this portfolio against appropriate benchmarks. Purchases and sales of marketable securities are recorded on the trade date and the transaction costs are expensed as incurred. Interest revenue is recorded in marketable securities revenue in the consolidated statement of comprehensive income. Realized and unrealized gains and losses on these securities are included in other (income) expenses in the consolidated statement of comprehensive income.
Loans Receivable
Loans receivable are recorded at fair value upon initial recognition and subsequently measured at amortized cost using the effective interest method. Our loans receivable are held in order to collect contractual cash flows which represent payments of principal, interest and fees. They are derecognized when the rights to receive cash flows have expired or we have transferred substantially all the risks and rewards of ownership.
The effective interest method is a method of calculating the amortized cost of a financial asset and of allocating the interest income over the relevant period in financing and investment revenue in the consolidated statement of comprehensive income. The effective interest rate is the rate that exactly discounts estimated future cash payments or receipts through the expected life of the financial instrument or, when appropriate, a shorter period, to the net carrying amount of the financial asset. When calculating the effective interest rate, we estimate cash flows considering all contractual terms of the financial instrument (for example, prepayment options) but do not consider future credit losses. The calculation includes all fees paid or received that are an integral part of the effective interest rate, transaction costs and all other premiums or discounts.
While it is generally our intention to hold performing loan assets until maturity, in some cases the loans are sold prior to maturity for risk mitigation purposes. Gains and losses on the sale of performing loans and gains on the sale of impaired loans are included in other (income) expenses. Losses on sales of impaired loans are reported in the provision for (reversal of) credit losses.
Loan Guarantees
In the ordinary course of business we issue loan guarantees to cover non-payment of principal, interest and fees due to financial institutions providing loans to Canadian exporters or buyers of Canadian goods and services. Loan guarantees are initially recognized in the financial statements at fair value in the liability for loan guarantees. Fair value is determined to be the guarantee fee received. Subsequent to initial recognition, our liability is measured at the higher of the unamortized guarantee fees and the allowance calculated that estimates the loss anticipated to be incurred as a result of satisfying our obligation under that guarantee.
Any increase in liability relating to the allowance on loan guarantees is recorded in the consolidated statement of comprehensive income in the provision for (reversal of) credit losses. Guarantee fees are recognized in the consolidated statement of comprehensive income on a straight-line basis over the life of the guarantee.
Impairment of Financial Instruments
Loans Receivable
Loans that have been individually assessed to be impaired meet one or more of the following criteria which represent objective evidence of impairment:
| | › | there has been a deterioration in credit quality to the extent that there is no longer reasonable assurance of the timely collection of the full amount of principal and interest; or |
| | › | for commercial loans, when there are payments overdue of 90 days or more, unless the loan is fully secured or collection efforts are reasonably expected to result in repayment of debt. |
If there is objective evidence that an impairment loss has occurred on an individual loan, the amount of the loss is measured as the difference between the loan’s carrying amount and the present value of any estimated future cash flows discounted at the loan’s original effective interest rate. The carrying value of the loan is reduced through the use of an individual allowance.
|
| EDC Annual Report 2016 95 |
Consolidated Financial Statements
Thereafter, interest income on individually impaired loans is recognized based on the reduced carrying value of the loan using the original effective interest rate of the loan.
When a loan is uncollectible, it is written off against the individual allowance. Such loans are written off when all collection methods have been exhausted and no further prospect of recovery is likely.
Loans are returned to performing status when it is likely that contractual payments will continue pursuant to the terms of the loan.
Sovereign Loans Receivable
Consistent with the terms of Paris Club rescheduling agreements, contractual interest maturities for individually impaired sovereign loans are included in gross loans receivable. The Paris Club is an international forum of sovereign creditors, including Canada, who agree to formally reschedule sovereign borrowers’ debt when they are experiencing financial difficulties and are unable to meet their obligations. Sovereign loans undergoing debt rescheduling are classified as individually impaired.
Renegotiated Loans
In situations where a borrower experiences financial difficulties we may grant certain concessionary modifications to the terms and conditions of a loan. Upon modification, the loan’s carrying value is adjusted to its estimated future cash flows discounted using the original effective interest rate or, in the case of a significant modification, discounted using the effective interest rate of the modified loan. The difference in carrying value between the modified loan and original loan is recognized in the statement of comprehensive income in provision for (reversal of) credit losses.
Loan Guarantees
Loan guarantees with impaired obligors are identified using the same criteria on the underlying loan as used to assess the impairment of direct loans carried at amortized cost. When the underlying loan is individually assessed to be impaired, it is probable that a call on the guarantee will be made representing an outflow of economic benefits that would be required to settle our obligation under the guarantee. The amount of any credit loss and any subsequent changes due to the re-evaluation of the obligation are recognized in the consolidated statement of comprehensive income as part of the provision for (reversal of) credit losses.
Allowance for Losses on Loans, Loan Commitments and Loan Guarantees
The allowance for losses on loans, loan commitments and loan guarantees represents management’s best estimate of probable credit losses and is based on the incurred loss model. The allowance is determined based on a review of all loans, loan guarantees and commitments and includes both individual and collective allowances.
Allowances on Individually Impaired Loans
The individual allowance is the difference between the carrying value of the loan and the present value of the estimated future cash flows discounted at the loan’s original effective interest rate. The calculation of the present value of the estimated future cash flows of a collateralized loan asset reflects the cash flows that are expected to result on foreclosure less costs to obtain and sell the collateral whether or not foreclosure is probable.
If, in a subsequent period, the amount of the impairment loss either increases or decreases and the change can be related objectively to an event occurring after the impairment was recognized (such as a change in the obligor’s financial position or a change in the estimate of future cash flows), the previously recognized impairment loss is adjusted through the individual allowance.
The amount of initial impairment loss and any subsequent changes due to the re-evaluation of estimated future cash flows are recognized in the consolidated statement of comprehensive income as part of the provision for (reversal of) credit losses.
Collective Allowance
A collective allowance is established for losses which we estimate to have occurred but have not yet been individually identified within our portfolio. Performing loans and loan guarantees, as well as loan commitments, are included in the collective assessment. The assessment is based on events that have occurred as of the reporting date and include factors such as business cycle trends and the fair value of collateral. The collective allowance is comprised of a base allowance, calculated using counterparty credit ratings, exposure, loss severity and probability of default factors. The collective allowance may also include concentration and market overlays.
For the base allowance we group our commercial loans, loan commitments and loan guarantees by industry of risk and then by secured and unsecured exposures. Sovereign exposures are classified into one portfolio. We assign credit ratings to our commercial and sovereign obligors using a system of twenty credit ratings (AAA to C-) which are consistent with ratings used by our credit risk management policies. For exposures that are secured by collateral or subject to other risk mitigation measures, such as unfunded loan participations and loan default insurance, the exposure for each obligor is reduced by the fair value of collateral adjusted for estimated repossession costs or the amount of risk mitigation as applicable. Based on these exposures we determine the appropriate base allowance. Loss severity is determined based on historical loan loss rates and by management estimates for each of our exposure categories. Default rates are based on an internally developed standard probability of default rate table.
Consolidated Financial Statements
We have a number of significant single name counterparty concentrations as a result of our mandate. A counterparty concentration overlay is established for counterparties whose exposure is deemed by management to represent an increased amount of risk. This overlay is applied to counterparties whose exposure exceeds 10% of our equity determined in accordance with the previous year’s audited financial statements.
We determine the collective allowance using various assumptions based upon current counterparty credit ratings. We also assess the extent to which these ratings do not reflect recent economic events that may result in credit deterioration. In these cases we will estimate the potential impact on our allowances and apply market overlays to specific industries or other exposure categories that we deem appropriate.
The collective allowances for performing loans and individual allowances for impaired loans are shown as a reduction to assets on the consolidated statement of financial position. Collective and individual allowances for loan commitments and loan guarantees are shown as liabilities on the consolidated statement of financial position.
Foreclosed Assets
Assets that are returned to us1 because of default under loan agreements are classified as held-for-use or held-for-sale according to management’s intention. Those classified as held-for-use have been placed under long-term finance leases. Those classified as held-for-sale include aircraft or component parts held-for-sale and are recorded initially at fair value less costs to sell. Any write-downs at recognition are reported in the provision for (reversal of) credit losses and any gains are recorded in other (income) expenses. We determine fair value based on market prices obtained from an independent appraiser along with current market data and other information available to us. Subsequent impairment losses or reversals of impairment losses are determined as the difference between the carrying amount and the recoverable amount and are recorded in other (income) expenses.
Investments at Fair Value Through Profit or Loss
Investments are comprised of direct investments that we hold in private and public companies and investments in private equity funds. Purchases and sales of these investments are recorded on a trade-date basis and are measured at fair value. Subsequent changes in fair value and any realized gains and losses are recorded in other (income) expenses. Transaction costs are expensed as incurred and included within leasing and financing related expenses.
Finance Leases
EDC applies IAS 17 – Leases in accounting for finance leases, both where EDC is the lessor or the lessee. A finance lease is a lease which transfers substantially all the risks and rewards of the leased assets on the lessee.
Lessor
Aircraft under finance leases relate to aircraft that were returned to us due to default under the related obligor’s loan agreements and were subsequently placed under long-term finance leases. These leases are recorded on the consolidated statement of financial position at the aggregate future minimum lease payments plus estimated residual values less unearned finance income. Residual values are based on independent appraisals and are reviewed periodically. An allowance for impairment is calculated consistent with the methodology used for our secured loan portfolio which is described on page 96.
Finance lease revenue is recognized in a manner that produces a constant rate of return on the investment in the lease.
Lessee
Our head office building is held under a finance lease. The building has been recorded on our consolidated statement of financial position at its estimated fair value at the inception of the lease. Lease payments are allocated between finance charges and repayment of the obligation under finance lease to achieve a constant rate of interest on the remaining balance of the obligation. The leased building is being depreciated over the most likely lease term of 25 years. The estimated lease period is reviewed periodically.
Finance charges and depreciation expense on the building are recorded as occupancy costs within administrative expenses in the consolidated statement of comprehensive income.
Property, Plant and Equipment
Property, plant and equipment are carried at cost less accumulated depreciation and impairment losses. Depreciation is charged on a straight-line basis over the estimated useful lives of the assets or the term of the relevant lease. The estimated useful lives and depreciation methods are reviewed at the end of each year, with the effect of any changes in estimate being accounted for on a prospective basis. The useful life used in the calculation of depreciation for furniture and equipment is five years and three years for computer hardware. Leasehold improvements are depreciated over the shorter of the term of the respective lease or the useful economic life of the leasehold improvement. Depreciation is recorded in administrative expenses.
The gain or loss arising from the disposal or retirement of an item of property, plant and equipment is determined as the difference between the sale proceeds and the carrying amount of the asset and is recognized in other (income) expenses.
| (1) | All aircraft returned to us for which the equity interest in the leveraged lease structure has been foreclosed have been registered with a number of trusts of which we are exposed, or have rights, to variable returns from our involvement with a structured entity and have the ability to affect those returns through our decision-making power over the structured entity. |
|
| EDC Annual Report 2016 97 |
Consolidated Financial Statements
Intangible Assets
Intangible assets represent internally developed and purchased computer software. They are carried at cost less accumulated amortization and impairment losses. Amortization is charged on a straight-line basis over the estimated useful lives of the intangible assets. The estimated useful lives and amortization methods are reviewed at the end of each year, with the effect of any changes in estimate being accounted for on a prospective basis. The useful life used in the calculation of amortization for both internally developed and acquired computer software is five years. Amortization is recorded in administrative expenses.
Insurance Premiums
Insurance contracts are those contracts where we have accepted significant insurance risk from the policyholders by agreeing to compensate the policyholders if they are adversely affected by a specified uncertain future event.
Premiums on insurance policies are deferred and recognized in income over the term of the policy on a straight-line basis.
Recoverable Insurance Claims
Recoverable insurance claims represent the portion of insurance claims paid that are expected to be recovered. Recoverable insurance claims are reviewed and adjusted on a quarterly basis with any subsequent net gain or loss on recovery credited or charged to claims-related expenses.
Premium and Claims Liabilities
Premium and claims liabilities represent our estimate of future claims under the terms and conditions of our insurance policies. An actuarial valuation, which conforms to the recommendations of the Canadian Institute of Actuaries, is performed to establish our liability. The valuation uses simulation techniques and assumptions derived from our own experience (severity of loss, loss development, frequency of claim and discount rates used) relevant to our insurance products. The liability is comprised of reported claims, incurred but not reported claims (IBNR), and management’s best estimate of the net present value of net future claims under existing policies.
Deferred insurance premiums are the portion of premiums received on policies written that relate to risk periods after the current fiscal year. To the extent that our deferred premiums are not sufficient to cover our liability, an allowance is established. Any adjustments to the liability are reflected in claims-related expenses in the period in which they become known. Future developments may result in claims which are materially different than the allowance provided.
Premium and claims liabilities on our consolidated statement of financial position include both the deferred premiums and the allowance for claims on insurance.
Reinsurance
In the ordinary course of business, we assume and cede reinsurance with other insurance companies. We cede reinsurance to mitigate our risk. The ceding arrangements provide greater diversification of the business and minimize the net loss potential arising from large risks. Ceded reinsurance contracts do not relieve us of our obligations to the insured but they do provide for the recovery of claims arising from the liabilities ceded. We also assume reinsurance and thereby take on risk. Reinsurance premiums, unearned premiums ceded to reinsurers and recoveries and estimates of recoveries on claims are recorded in the same manner as if the reinsurance were considered direct business. Amounts recoverable from the reinsurers are estimated in a manner consistent with the claims liability associated with the reinsured policy and are recorded within reinsurers’ share of premium and claims liabilities. Reinsurance assets or liabilities are derecognized when the contractual rights are extinguished or expire.
Reinsurance assets are reviewed for impairment at each reporting date or more frequently when an indication of impairment arises during the reporting year. Impairment occurs when there is objective evidence as a result of an event that occurred after initial recognition of the reinsurance asset that we may not receive all outstanding amounts due under the terms of the contract and the event has a reliably measurable impact on the amounts that we will receive from the reinsurer.
Deferred Revenue
Deferred loan revenue, which consists of exposure, administration and other upfront loan fees, is included in loans receivable and amortized as a yield increment over the term of the related loan. Guarantee fee revenue and insurance premium revenue are recognized as deferred revenue and are amortized over the term of the related guarantee or insurance policy.
Derivative Instruments
Derivative instruments (derivatives) are financial contracts that derive their value from underlying changes in interest rates, foreign exchange rates, equities, credit spreads or other financial measures. Derivatives that we may use to manage interest rate risk, foreign exchange risk and credit risk include interest rate swaps, cross currency interest rate swaps, foreign exchange swaps, foreign exchange forwards and credit default swaps. We also hold a portfolio of derivatives which we use to manage the foreign exchange risk associated with using our capital to fund our operations largely denominated in U.S. dollars. Derivatives are only contracted with creditworthy counterparties in accordance with policies established by our Risk Management Office and approved by our Board of Directors.
Consolidated Financial Statements
We do not apply hedge accounting to our derivatives. Derivatives are accounted for at fair value and are recognized on the consolidated statement of financial position upon the trade date and are removed from the consolidated statement of financial position when they expire or are terminated. Derivatives with a positive fair value are reported as derivative instruments within assets, while derivatives with a negative fair value are reported as derivative instruments within liabilities. All interest income and expenses associated with our derivatives are included in interest expense or marketable securities revenue, while realized and unrealized gains and losses are recorded in other (income) expenses.
Long-term currency swaps are considered part of the financing cash flows on the consolidated statement of cash flows because these swaps are used to manage our funding. We often issue debt in currencies which offer a more advantageous cost of funds. We then use currency swaps to bring those funds into the currency required to disburse on our loans. All other swaps are included in operating cash flows as they are used to alter the interest rate risk profile of the portfolio.
Loans Payable
We have designated the majority of our debt, including structured debt, at fair value through profit or loss in order to obtain the same accounting treatment as the related derivatives. In general, these derivatives are transacted to manage interest and foreign exchange rate risk on the related debt. Contractual interest on our debt is recorded in interest expense. Any change in fair value on these instruments is recorded in other (income) expenses.
Any fair value gains or losses on initial recognition of our debt or derivatives at Level 3 on the fair value hierarchy are deferred and amortized over the life of the instruments.
Our fixed rate bonds which do not have derivatives associated with them are carried at amortized cost with interest recorded in interest expense using the effective interest rate method.
The transaction costs related to our loans payable at amortized cost are capitalized and amortized in interest expense using the effective interest rate method over the life of the instrument.
During the current year, to provide clearer presentation of our loans payable, we made a change to the Consolidated Statement of Financial Position, to aggregate the loans payable balance and to the Consolidated Statement of Cash Flows to aggregate the long-term loans payable financing activities. These changes to presentation were applied consistently to comparative figures to ensure comparability and the disclosures in Note 16 have been maintained and continue to provide detail of loans payable on a disaggregated basis.
Accounts Payable and Other Credits
Accounts payable and other credits are carried at amortized cost.
Translation of Foreign Currency
All monetary assets and liabilities denominated in foreign currencies are translated into Canadian dollars, the functional and presentation currency of the Corporation, at exchange rates prevailing at the end of the year. Income and expenses are translated at either daily or monthly average exchange rates in effect during the year. Exchange gains and losses resulting from the translation of foreign currency balances and transactions are included in other (income) expenses.
Foreign currency non-monetary items that are measured at historical cost are translated at historical rates. Foreign currency non-monetary items measured at fair value are translated using the rate of exchange at the date the fair value was determined.
Retirement Benefit Obligations
We maintain a defined benefit pension plan, a defined contribution plan, and other post-retirement benefit plans including a retiring allowance plan and life insurance, health and dental care benefits. The defined benefit plan is only available for employees hired prior to January 1, 2012.
The accrued benefit obligations are actuarially determined using the projected unit credit method (which incorporates management’s best estimate of future salary levels, retirement ages of employees and other actuarial factors).
The defined benefit expense (included in administrative expenses) consists of the actuarially determined retirement benefits for the current year’s service and imputed interest on projected benefit obligations net of interest earned on any plan assets over the average remaining working lives of employees expected to receive benefits under the plans.
Re-measurement gains and losses arise from the difference between the actual rate of return and the discount rate on plan assets for that period and from changes in actuarial assumptions used to determine the accrued benefit obligation. These gains or losses are recognized in other comprehensive income and are closed to retained earnings.
|
| EDC Annual Report 2016 99 |
Consolidated Financial Statements
| | |
 | | Marketable Securities |
We maintain liquidity sufficient to meet general operating requirements, to maintain stability in our short-term borrowing program and to provide flexibility in achieving corporate objectives. Consistent with our business model for managing these instruments, they are carried at fair value through profit or loss.
The following table provides a breakdown of our marketable securities issued or guaranteed by:
| | | | | | | | |
| | | |
(in millions of Canadian dollars) | | Dec. 31, 2016 | | | Dec. 31, 2015 | |
| | |
U.S. government | | | 4,639 | | | | 4,916 | |
| | |
Financial institutions | | | 1,672 | | | | 1,613 | |
| | |
Other governments | | | 748 | | | | 681 | |
| | |
Corporate | | | – | | | | 24 | |
| | |
Canadian governments | | | – | | | | 22 | |
| | | |
Total marketable securities | | | $7,059 | | | | $7,256 | |
The following table provides a breakdown of our marketable securities and related derivatives by remaining term to maturity. Of the short-term instruments, $1,561 million had a term to maturity of three months or less from their date of acquisition (2015 – $1,628 million).
| | | | | | | | | | | | | | | | | | | | | | | | | | | | | | | | |
| | | |
| (in millions of Canadian dollars) | | Dec. 31, 2016 | | | Dec. 31, 2015 | |
| | | | |
| | | Remaining term to maturity | | | | | | Remaining term to maturity | | | | |
| | | | | | | | |
| | | Under 1 | | | 1 to 3 | | | Over 3 | | | | | | Under 1 | | | 1 to 3 | | | Over 3 | | | | |
| | | year | | | years | | | years | | | Total | | | year | | | years | | | years | | | Total | |
| | | | | | | | |
Short-term instruments | | | 3,325 | | | | – | | | | – | | | | 3,325 | | | | 3,325 | | | | – | | | | – | | | | 3,325 | |
| | | | | | | | |
Long-term fixed rate securities | | | 248 | | | | 1,432 | | | | 2,054 | | | | 3,734 | | | | 150 | | | | 1,784 | | | | 1,997 | | | | 3,931 | |
| | | | | | | | |
Total marketable securities before derivatives | | | 3,573 | | | | 1,432 | | | | 2,054 | | | | 7,059 | | | | 3,475 | | | | 1,784 | | | | 1,997 | | | | 7,256 | |
| | | | | | | | |
Derivative instruments | | | (2 | ) | | | – | | | | – | | | | (2) | | | | – | | | | – | | | | – | | | | – | |
| | | | | | | | | |
Total marketable securities | | | $3,571 | | | | $1,432 | | | | $2,054 | | | | $7,057 | | | | $3,475 | | | | $1,784 | | | | $1,997 | | | | $7,256 | |
Consolidated Financial Statements
| | |
 | | Loans Receivable |
The following table presents the various components of loans receivable and the contractual maturity and related contractual effective yields for gross loans receivable. The yields are computed on a weighted average basis by amount and term. Floating rate yields are expressed as spreads over base rates which consist mainly of LIBOR for U.S. dollars and CDOR for Canadian dollars.
| | | | | | | | | | | | | | | | | | | | | | | | | | | | | | | | | | | | | | | | |
| (in millions of | | | | | | | | | | | | | | | | | | | | | | | | | | | | | | |
| Canadian dollars) | | Dec. 31, 2016 | | | Dec. 31, 2015 | |
| | | | | | | | | | | | Yield to | | | | | | | | | | | | | | | Yield to | | | | |
| | | Floating | | | Spread | | | Fixed | | | maturity | | | Total | | | Floating | | | Spread | | | Fixed | | | maturity | | | Total | |
| | | $ | | | % | | | $ | | | % | | | $ | | | $ | | | % | | | $ | | | % | | | $ | |
| | | | | | | | | | |
Performing: | | | | | | | | | | | | | | | | | | | | | | | | | | | | | | | | | | | | | | | | |
| | | | | | | | | | |
Past due | | | 74 | | | | 3.86 | | | | 77 | | | | 5.93 | | | | 151 | * | | | 12 | | | | 2.26 | | | | 9 | | | | 4.00 | | | | 21 | |
| | | | | | | | | | |
2016 | | | – | | | | – | | | | – | | | | – | | | | – | | | | 7,521 | | | | 1.68 | | | | 1,330 | | | | 4.67 | | | | 8,851 | |
| | | | | | | | | | |
2017 | | | 6,299 | | | | 2.12 | | | | 1,748 | | | | 4.22 | | | | 8,047 | | | | 5,121 | | | | 2.08 | | | | 1,524 | | | | 4.46 | | | | 6,645 | |
| | | | | | | | | | |
2018 | | | 7,257 | | | | 1.70 | | | | 2,219 | | | | 3.74 | | | | 9,476 | | | | 7,962 | | | | 1.70 | | | | 2,042 | | | | 3.84 | | | | 10,004 | |
| | | | | | | | | | |
2019 | | | 9,085 | | | | 1.92 | | | | 1,748 | | | | 4.43 | | | | 10,833 | | | | 7,608 | | | | 1.90 | | | | 1,491 | | | | 4.32 | | | | 9,099 | |
| | | | | | | | | | |
2020 | | | 4,741 | | | | 1.92 | | | | 1,608 | | | | 3.89 | | | | 6,349 | | | | 4,183 | | | | 1.77 | | | | 1,430 | | | | 4.08 | | | | 5,613 | |
| | | | | | | | | | |
2021 | | | 5,897 | | | | 1.84 | | | | 1,784 | | | | 2.81 | | | | 7,681 | | | | 2,051 | | | | 2.17 | | | | 1,498 | | | | 2.81 | | | | 3,549 | |
| | | | | | | | | | |
2022 – 2026 | | | 6,704 | | | | 2.30 | | | | 2,808 | | | | 4.19 | | | | 9,512 | | | | 5,109 | | | | 2.08 | | | | 1,981 | | | | 4.22 | | | | 7,090 | |
| | | | | | | | | | |
2027 and beyond | | | 1,924 | | | | 2.60 | | | | 365 | | | | 4.83 | | | | 2,289 | | | | 1,450 | | | | 2.31 | | | | 61 | | | | 4.38 | | | | 1,511 | |
| | | | | | | | | | |
Performing gross loans receivable | | | 41,981 | | | | 2.12 | | | | 12,357 | | | | 3.97 | | | | 54,338 | | | | 41,017 | | | | 1.99 | | | | 11,366 | | | | 3.93 | | | | 52,383 | |
| | | | | | | | | | |
Impaired (Note 5) | | | 570 | | | | 3.37 | | | | 467 | | | | 3.39 | | | | 1,037 | | | | 653 | | | | 5.29 | | | | 290 | | | | 3.83 | | | | 943 | |
| | | | | | | | | | |
Gross loans receivable | | | $42,551 | | | | | | | | $12,824 | | | | | | | | $55,375 | | | | $41,670 | | | | | | | | $11,656 | | | | | | | | $53,326 | |
| | | | | | | | | | |
Accrued interest and fees receivable | | | | | | | | | | | | | | | | | | | 236 | | | | | | | | | | | | | | | | | | | | 200 | |
| | | | | | | | | | |
Deferred loan revenue and other credits | | | | | | | | | | | | | | | | | | | (361 | ) | | | | | | | | | | | | | | | | | | | (390) | |
| | | | | | | | | | | |
Loans receivable | | | | | | | | | | | | | | | | | | | $55,250 | | | | | | | | | | | | | | | | | | | | $53,136 | |
| * | During the first week of January 2017, payments of $75 million were received. |
At the end of 2016, the floating rate performing gross loans receivable yield was 3.11% (2015 – 2.57%) with an average term to reset of 86 days (2015 – 81 days).
Sovereign loans represented 2% of total performing gross loans receivable (2015 – 3%).
We had country risk concentrations as outlined below:
| | | | | | | | | | | | | | | | | | |
| (in millions of | | | | | | | | | | | | | | |
| Canadian dollars) | | Dec. 31, 2016 | | | | | Dec. 31, 2015 | |
| | | Performing gross | | | | | | | | Performing gross | | | | |
| Country | | loans receivable | | | % | | | Country | | loans receivable | | | % | |
| | | | | |
United States | | | 11,048 | | | | 20 | | | United States | | | 11,080 | | | | 21 | |
| | | | | |
Canada | | | 6,288 | | | | 12 | | | Canada | | | 6,110 | | | | 12 | |
| | | | | |
Brazil | | | 3,603 | | | | 7 | | | Brazil | | | 4,166 | | | | 8 | |
| | | | | |
Australia | | | 3,220 | | | | 6 | | | Mexico | | | 3,261 | | | | 6 | |
| | | | | |
Mexico | | | 3,067 | | | | 6 | | | Australia | | | 3,202 | | | | 6 | |
| | | | | |
India | | | 2,686 | | | | 5 | | | United Kingdom | | | 2,774 | | | | 5 | |
| | | | | |
Chile | | | 2,353 | | | | 4 | | | Chile | | | 2,221 | | | | 4 | |
| | | | | |
Saudi Arabia | | | 2,290 | | | | 4 | | | India | | | 2,034 | | | | 4 | |
| | | | | |
United Kingdom | | | 2,102 | | | | 4 | | | Saudi Arabia | | | 1,659 | | | | 3 | |
| | | | | |
Germany | | | 1,628 | | | | 3 | | | United Arab Emirates | | | 1,295 | | | | 3 | |
| | | | | |
Other | | | 16,053 | | | | 29 | | | Other | | | 14,581 | | | | 28 | |
| | | | | |
Total | | | $54,338 | | | | 100 | | | Total | | | $52,383 | | | | 100 | |
|
| EDC Annual Report 2016 101 |
Consolidated Financial Statements
Our most significant single counterparty performing gross loans receivable at the end of 2016 were as follows:
| | › | five commercial airline sector obligors totalling $5,723 million (2015 – four obligors totalling $5,375 million), three located in the United States, one in Denmark and one in Canada; |
| | › | four mining entities totalling $4,566 million (2015 – three entities totalling $3,754 million) located in Brazil, Chile, Mongolia and United Arab Emirates; |
| | › | three oil and gas entities totalling $4,005 million (2015 – three entities totalling $4,278 million) located in Mexico, Brazil and Saudi Arabia; and |
| | › | two telecommunication companies located in the United Kingdom and the United States for $2,084 million (2015 – two companies totalling $2,145 million). |
In 2016, we sold $231 million in performing loans to various counterparties in which we recovered $221 million and the remaining $10 million was written off. In 2015, we sold $177 million in performing loans to various counterparties in which we recovered $175 million and the remaining $2 million was written off. The performing loans were sold without recourse.
The breakdown of our gross loans receivable by credit grade was as follows:
| | | | | | | | | | | | | | | | |
(in millions of Canadian dollars) | | Dec. 31, 2016 | | | Dec. 31, 2015 | |
| | | $ | | | % of total | | | $ | | | % of total | |
Investment grade* | | | 26,511 | | | | 48 | | | | 28,505 | | | | 53 | |
Below investment grade | | | 27,827 | | | | 50 | | | | 23,878 | | | | 45 | |
Individually impaired loans (Note 5) | | | 1,037 | | | | 2 | | | | 943 | | | | 2 | |
Total gross loans receivable | | $55,375 | | | 100 | | | $53,326 | | | 100 | |
* Investment grade exposure represents obligors with credit ratings of BBB- and above.
We employ a range of policies to mitigate credit risk on our commercial loans which includes obtaining certain forms of security interest. The principal types of security interest are mortgages on equipment (mainly aircraft and rolling stock) and real estate, assignments or pledges on various business assets such as trade receivables, inventory, property, plant and equipment, equity shares and bank accounts. Other principal forms of credit enhancement include guarantees from counterparties with higher credit ratings that may be related to the borrower, such as a parent company.
As at the end of 2016, 25% of our loans were collateralized mainly by aircraft and rolling stock (2015 – 26%).
Our concentrations of risk are managed by obligor, country and industry sector. The maximum gross loans receivable exposure to any one obligor at the end of 2016 was $1,614 million (2015 – $1,730 million). After consideration of collateral, unfunded loan participations and loan default insurance, the maximum net exposure to any one obligor was $1,288 million (2015 – $1,402 million).
A loan payment is considered past due when the obligor has failed to make the payment by the contractual due date. The breakdown of our gross loans receivable that are past due but not impaired was as follows:
| | | | | | | | | | | | |
(in millions of Canadian dollars) | | Dec. 31, 2016 | | | | | | Dec. 31, 2015 | |
Less than 30 days | | | 148 | | | | | | | | 17 | |
30 to 180 days | | | 1 | | | | | | | | 4 | |
Greater than 180 days | | | 2 | | | | | | | | – | |
Total | | | $151 | | | | | | | | $21 | |
The following reflects the movement in gross loans receivable during the year: | |
(in millions of Canadian dollars) | | 2016 | | | | | | 2015 | |
Balance at beginning of year | | | 53,326 | | | | | | | | 41,791 | |
Disbursements | | | 22,709 | | | | | | | | 18,800 | |
Principal repayments | | | (18,470 | ) | | | | | | | (14,815 | ) |
Principal recoveries from loan asset sales | | | (243 | ) | | | | | | | (175 | ) |
Financing on sale of assets held-for-sale | | | – | | | | | | | | 321 | |
Loans written off | | | (193 | ) | | | | | | | (42 | ) |
Capitalized interest | | | 29 | | | | | | | | 22 | |
Foreign exchange translation | | | (1,783 | ) | | | | | | | 7,424 | |
Balance at end of year | | | $55,375 | | | | | | | | $53,326 | |
Consolidated Financial Statements
| | |
 | | Individually Impaired Gross Loans Receivable |
The following table shows the carrying amount of loans specifically identified as impaired:
| | | | | | | | | | |
(in millions of Canadian dollars) | | Dec. 31, 2016 | | | Dec. 31, 2015 | | | |
Gross loans receivable | | | | | | | | | | |
Sovereign | | | 8 | | | | 110 | | | |
Commercial | | | 1,029 | | | | 833 | | | |
| | | | 1,037 | | | | 943 | | | |
Less: Deferred loan revenue and other credits | | | 20 | | | | 42 | | | |
Individual allowance | | | 516 | | | | 553 | | | |
Carrying amount of individually impaired loans | | | $501 | | | | $348 | | | |
The following reflects the movement in individually impaired gross loans receivable during the year: |
(in millions of Canadian dollars) | | 2016 | | | 2015 | | | |
Balance at beginning of year | | | 943 | | | | 660 | | | |
Loans classified as impaired | | | 563 | | | | 542 | | | |
Capitalized interest | | | 15 | | | | 5 | | | |
Disbursements on loan guarantees called | | | 7 | | | | 13 | | | |
Loans written off | | | (183 | ) | | | (40 | ) | | |
Principal repayments | | | (125 | ) | | | (96 | ) | | |
Loans reinstated to performing | | | (98 | ) | | | (255 | ) | | |
Transfer to assets held-for-sale | | | (29 | ) | | | – | | | |
Principal recoveries from loan sales | | | (22 | ) | | | – | | | |
Foreign exchange translation | | | (34 | ) | | | 114 | | | |
Balance at end of year | | | $1,037 | | | | $943 | | | |
In 2016, we had $563 million of loans made impaired (2015 – $542 million) from 15 commercial borrowers (2015 – 8 commercial borrowers).
During the year, impaired loans to 15 commercial borrowers totalling $183 million of principal (2015 – 29 commercial borrowers totalling $40 million) were written off. These loans were written off after all collection methods had been exhausted and no further prospect of recovery was likely.
In 2016 we had $98 million of loans return to performing status which related to two obligors. In 2015, $255 million of loans related to three obligors returned to performing status.
During the year, control of six helicopters held as security on loan agreements was relinquished to EDC. As a result, $67 million of related loans were removed from our books and replaced with aircraft assets totalling $29 million which will be sold. This also resulted in loan principal write-offs totalling $38 million.
In 2016, we sold a $29 million impaired loan to a single counterparty (2015 – nil). We recovered $22 million and the remaining $7 million was written off.
Interest income recognized on impaired loans was $19 million in 2016 (2015 – $9 million).
|
| EDC Annual Report 2016 103 |
Consolidated Financial Statements
| | |

| | Allowance for Losses on Loans, Loan Commitments and Loan Guarantees |
The composition of the allowance for losses on loans, loan commitments and loan guarantees was as follows:
| | | | | | |
(in millions of Canadian dollars) | | Dec. 31, 2016 | | Dec. 31, 2015 | |
Base allowance | | | | | | |
Investment grade exposure | | 80 | | | 125 | |
Non-investment grade exposure | | 1,089 | | | 931 | |
Total base allowance | | 1,169 | | | 1,056 | |
Counterparty concentration | | | | | | |
Investment grade exposure | | 6 | | | 9 | |
Non-investment grade exposure | | 21 | | | 36 | |
Total counterparty concentration | | 27 | | | 45 | |
Market overlay – extractive | | – | | | 265 | |
Total collective allowance* | | 1,196 | | | 1,366 | |
Allowance for individually impaired loans, loan commitments and loan guarantees | | 539 | | | 565 | |
Total allowance for losses on loans, loan commitments and loan guarantees | | $1,735 | | | $1,931 | |
| * | Includes allowance on other receivables of $5 million (2015 – $4 million) and allowance on finance leases of nil (2015 – $1 million). |
The following table provides a breakdown of our allowance for losses on loans, loan commitments and loan guarantees by commercial and sovereign risk:
| | | | | | | | | | | | | | | | | | | | | | | | |
| (in millions of Canadian dollars) | | Dec. 31, 2016 | | | Dec. 31, 2015 | |
| | | Collective | | | Individual | | | Total | | | Collective | | | Individual | | | Total | |
Commercial | | | 1,157 | | | | 531 | | | | 1,688 | | | | 1,247 | | | | 510 | | | | 1,757 | |
Sovereign | | | 39 | | | | 8 | | | | 47 | | | | 119 | | | | 55 | | | | 174 | |
Total allowance | | | $1,196 | | | | $539 | | | | $1,735 | | | | $1,366 | | | | $565 | | | | $1,931 | |
During the year, changes to the allowance for losses on loans, loan commitments and loan guarantees were as follows: | | | | | |
| (in millions of Canadian dollars) | | 2016 | | | 2015 | |
| | | Collective | | | Individual | | | Total | | | Collective | | | Individual | | | Total | |
Allowance for losses on loans | | | | | | | | | | | | | | | | | | | | | | | | |
Balance at beginning of year | | | 1,162 | | | | 553 | | | | 1,715 | | | | 812 | | | | 351 | | | | 1,163 | |
Provision for (reversal of) losses on loans | | | (86 | ) | | | 82 | | | | (4) | | | | 205 | | | | 176 | | | | 381 | |
Write–offs | | | – | | | | (177 | ) | | | (177) | | | | – | | | | (36 | ) | | | (36) | |
Recovery of amounts written-off in prior years | | | – | | | | – | | | | – | | | | – | | | | 1 | | | | 1 | |
Foreign exchange translation and other | | | (40 | ) | | | 58 | | | | 18 | | | | 145 | | | | 61 | | | | 206 | |
Total | | | 1,036 | | | | 516 | | | | 1,552 | | | | 1,162 | | | | 553 | | | | 1,715 | |
Allowance for losses on loan commitments | | | | | | | | | | | | | | | | | | | | | | | | |
Balance at beginning of year | | | 110 | | | | 3 | | | | 113 | | | | 44 | | | | – | | | | 44 | |
Provision for (reversal of) losses on loan commitments | | | (31 | ) | | | 1 | | | | (30) | | | | 58 | | | | 3 | | | | 61 | |
Foreign exchange translation | | | (5 | ) | | | – | | | | (5) | | | | 8 | | | | – | | | | 8 | |
Total | | | 74 | | | | 4 | | | | 78 | | | | 110 | | | | 3 | | | | 113 | |
Allowance for losses on loan guarantees* | | | | | | | | | | | | | | | | | | | | | | | | |
Balance at beginning of year | | | 94 | | | | 9 | | | | 103 | | | | 89 | | | | 12 | | | | 101 | |
Provision for (reversal of) losses on loan guarantees | | | (7 | ) | | | 10 | | | | 3 | | | | (2 | ) | | | (3 | ) | | | (5) | |
Foreign exchange translation | | | (1 | ) | | | – | | | | (1) | | | | 7 | | | | – | | | | 7 | |
Total | | | 86 | | | | 19 | | | | 105 | | | | 94 | | | | 9 | | | | 103 | |
Total allowance for losses on loans, loan commitments and loan guarantees | | | $1,196 | | | | $539 | | | | $1,735 | | | | $1,366 | | | | $565 | | | | $1,931 | |
| * | Included in the liability for loan guarantees. |
Consolidated Financial Statements
During 2015, a fundamental shift occurred in the extractive sector as demand for commodities dropped, which resulted in a rapid and sustained decline of their prices. In consideration of the elevated risk associated with obligors in the extractive sector and the concern that current credit ratings may not reflect the impact of recent market events, we established a $265 million market overlay at the end of 2015 as a component of our collective allowance. As market conditions stabilized and updated financial information became available in the first half of 2016, credit ratings were updated, the impact was reflected in the base allowance and the extractive market overlay was fully removed.
In 2016, we updated the probability of default and loss given default assumptions in the collective allowance calculation for our project finance portfolio. The updated methodology uses a dual risk rating approach of probability of default and loss given default rates based on Standard & Poor’s project finance specific risk rating models. In prior years, a single rating approach (probability of default) and a general loss given default assumption was used. The difference between using the updated assumptions and the prior assumptions as at December 31, 2016 is a $32 million increase in allowance and represents a change in accounting estimate. This change in estimate also impacted the provision for credit losses in Note 35. The impact on future periods has not been determined as it is impracticable to estimate.
We also updated the loss given default assumption in our collective allowance calculation for our sovereign and government related entities portfolio. The reduction in our assumption was a result of introducing obligor specific loss given default rates which replaces a general rate used for all obligors within the portfolio. The difference between using the updated assumption and the prior assumption as at December 31, 2016 is a $169 million decrease in allowance and represents a change in accounting estimate. This change in estimate also impacted the provision for credit losses in Note 35. The impact on future periods has not been determined as it is impracticable to estimate.
The provision charge for individually impaired loans, loan commitments and loan guarantees for 2016 of $93 million (2015 – $176 million) includes:
| | › | a charge of $317 million (2015 – $374 million) as a result of new impairments and increases to allowances on existing impaired obligors; and |
| | › | reversals of $224 million (2015 – $198 million) due to changes in the estimated future cash flows or recoveries anticipated from existing impaired obligors as well as obligors reclassified to performing status. |
| | |
 | | Investments at Fair Value Through Profit or Loss |
| | | | | | | | | | | | | | | | |
(in millions of Canadian dollars) | | Dec. 31, 2016 | | | Dec. 31, 2015 | |
| | | | Cost | | | | Fair value | | | | Cost | | | | Fair value | |
| | | | |
Direct investments | | | | | | | | | | | | | | | | |
| | | | |
Loans and debt securities | | | 5 | | | | 4 | | | | 9 | | | | 5 | |
| | | | |
Equity interests | | | 114 | | | | 111 | | | | 108 | | | | 86 | |
| | | | |
| | | 119 | | | | 115 | | | | 117 | | | | 91 | |
| | | | |
Fund investments | | | 852 | | | | 890 | | | | 754 | | | | 757 | |
| | | | |
Total investments | | | $971 | | | | $1,005 | | | | $871 | | | | �� $848 | |
| | |
 | | Assets Held-for-Sale |
Assets in our held-for-sale portfolio represent assets returned to us as a result of default under loan agreements.
| | | | | | | | | | | | | | | | |
(in millions of Canadian dollars) | | Dec. 31, 2016 | | | Dec. 31, 2015 | | | | | | | |
| | | | |
Helicopters* | | | 29 | | | | – | | | | | | | | | |
| | | | |
Aircraft | | | 13 | | | | 15 | | | | | | | | | |
| | | | | |
Total assets held-for-sale | | | $42 | | | | $15 | | | | | | | | | |
At the beginning of 2016, the portfolio consisted of one Q400 and two engines with a carrying value of $15 million. During the year the two engines were sold for a net gain of $2 million, the impact of which is included in other (income) expenses (2015 – sale of 35 aircraft for a net gain of $45 million). The Q400 remains in the portfolio at a carrying value of $13 million.
|
| EDC Annual Report 2016 105 |
Consolidated Financial Statements
| | |

| | Net Investment in Aircraft under Finance Leases |
At the beginning of 2016, the portfolio consisted of 13 aircraft with a carrying value of $64 million. During the year all 13 aircraft were sold for a net loss of $23 million, the impact of which is included in other (income) expenses.
| | |

| | Recoverable Insurance Claims |
During the year, changes to recoverable insurance claims were as follows:
| | | | | | | | | | | | |
(in millions of Canadian dollars) | | | | 2016 | | | 2015 | | | |
Balance at beginning of year | | | | | 54 | | | | 33 | | | |
Claims paid | | | | | 110 | | | | 143 | | | |
Claims recovered | | | | | (14) | | | | (15) | | | |
Claims recovered from reinsurers | | | | | (9) | | | | – | | | |
Change in recoverable portion of cumulative claims paid | | | | | (77) | | | | (112) | | | |
Foreign exchange translation | | | | | (1) | | | | 5 | | | |
Balance at end of year | | | | | $63 | | | | $54 | | | |
| | | | | | | | |
Of the $110 million in claim payments made during 2016 (2015 – $143 million), 60% were related to the credit insurance product group (2015 – 84%). The largest concentrations of claim payments and recoveries were in the following geographic areas: |
| | | | | | | | |
(in millions of Canadian dollars) | | | | Dec. 31, 2016 | | | | Dec. 31, 2015 |
| | | Claims paid | | Claims recovered* | | Claims paid | | Claims recovered* |
North America and Caribbean | | 42 | | 15 | | 15 | | 9 |
South and Central America | | 29 | | 1 | | 37 | | 3 |
Europe | | 24 | | 4 | | 55 | | 1 |
Asia and Pacific | | 9 | | 2 | | 10 | | 1 |
Middle East and Africa | | 6 | | 1 | | 26 | | 1 |
Total | | $110 | | $23 | | $143 | | $15 |
* Represents recoveries on claims paid in the current and prior years. |
| | |
| |
 | | Other Assets |
| | | | | | | | | | | | |
| | | | | |
(in millions of Canadian dollars) | | | | Dec. 31, 2016 | | | Dec. 31, 2015 | | | |
Restructuring payments receivable | | | | | 45 | | | | 52 | | | |
Insurance premiums receivable | | | | | 37 | | | | 14 | | | |
Receivable from sale of aircraft | | | | | 22 | | | | – | | | |
Prepaid expenses | | | | | 13 | | | | 10 | | | |
Guarantee fees receivable | | | | | 13 | | | | 14 | | | |
Other | | | | | 26 | | | | 20 | | | |
Total other assets | | | | | $156 | | | | $110 | | | |
Restructuring payments receivable relate to an agreement between EDC and an airline obligor as part of the terms of a loan restructuring that was finalized in 2007. The receivable relates to a payable as shown in Note 15.
Consolidated Financial Statements
| | |

| | Property, Plant and Equipment |
|
During the year, changes to property, plant and equipment were as follows: |
| | | | | | | | | | | | | | | | | | | | | | | | | | | | | | | | |
| | | | | | | | | |
(in millions of Canadian dollars) | | | | | | | | | | | 2016 | | | | | | | | | | | | 2015 | |
| | | Computer
hardware | | | Furniture
and
equipment | | | Leasehold
improvements | | | Total | | | Computer
hardware | | | Furniture
and
equipment | | | Leasehold
improvements | | | Total | |
Cost: | | | | | | | | | | | | | | | | | | | | | | | | | | | | | | | | |
| | | | | | | | |
Balance at beginning of year | | | 30 | | | | 18 | | | | 52 | | | | 100 | | | | 27 | | | | 17 | | | | 51 | | | | 95 | |
| | | | | | | | |
Additions | | | 7 | | | | 3 | | | | 3 | | | | 13 | | | | 5 | | | | 1 | | | | 1 | | | | 7 | |
| | | | | | | | |
Disposals | | | (1 | ) | | | (1 | ) | | | – | | | | (2 | ) | | | (2 | ) | | | – | | | | – | | | | (2 | ) |
Balance at end of year | | | 36 | | | | 20 | | | | 55 | | | | 111 | | | | 30 | | | | 18 | | | | 52 | | | | 100 | |
Accumulated depreciation: | | | | | | | | | | | | | | | | | | | | | | | | | | | | | | | | |
| | | | | | | | |
Balance at beginning of year | | | (21 | ) | | | (15 | ) | | | (11 | ) | | | (47 | ) | | | (19 | ) | | | (12 | ) | | | (8 | ) | | | (39 | ) |
| | | | | | | | |
Depreciation expense | | | (5 | ) | | | (3 | ) | | | (3 | ) | | | (11 | ) | | | (4 | ) | | | (3 | ) | | | (3 | ) | | | (10 | ) |
| | | | | | | | |
Disposals | | | 1 | | | | 1 | | | | – | | | | 2 | | | | 2 | | | | – | | | | – | | | | 2 | |
Balance at end of year | | | (25 | ) | | | (17 | ) | | | (14 | ) | | | (56 | ) | | | (21 | ) | | | (15 | ) | | | (11 | ) | | | (47 | ) |
Carrying amount | | | $11 | | | | $3 | | | | $41 | | | | $55 | | | | $9 | | | | $3 | | | | $41 | | | | $53 | |
Future contractual commitments related to property, plant and equipment at the end of 2016 were $3 million (2015 – $1 million).
| | |

| | Intangible Assets |
|
During the year, changes to intangible assets were as follows: |
| | | | | | | | | | | | | | | | | | | | | | | | |
| | | | | | | |
(in millions of Canadian dollars) | | | | | | | | 2016 | | | | | | | | | 2015 | |
| | | Internally
developed software | | | Acquired computer
software | | | Total | | | Internally
developed software | | | Acquired computer
software | | | Total | |
Cost: | | | | | | | | | | | | | | | | | | | | | | | | |
| | | | | | |
Balance at beginning of year | | | 135 | | | | 80 | | | | 215 | | | | 117 | | | | 87 | | | | 204 | |
| | | | | | |
Additions | | | 18 | | | | 17 | | | | 35 | | | | 18 | | | | 11 | | | | 29 | |
| | | | | | |
Disposals | | | (1 | ) | | | (8 | ) | | | (9 | ) | | | – | | | | (18 | ) | | | (18 | ) |
Balance at end of year | | | 152 | | | | 89 | | | | 241 | | | | 135 | | | | 80 | | | | 215 | |
Accumulated amortization: | | | | | | | | | | | | | | | | | | | | | | | | |
| | | | | | |
Balance at beginning of year | | | (86 | ) | | | (58 | ) | | | (144 | ) | | | (80 | ) | | | (68 | ) | | | (148 | ) |
| | | | | | |
Amortization expense | | | (5 | ) | | | (9 | ) | | | (14 | ) | | | (6 | ) | | | (8 | ) | | | (14 | ) |
| | | | | | |
Disposals | | | 1 | | | | 8 | | | | 9 | | | | – | | | | 18 | | | | 18 | |
Balance at end of year | | | (90 | ) | | | (59 | ) | | | (149 | ) | | | (86 | ) | | | (58 | ) | | �� | (144 | ) |
Carrying amount | | | $62 | | | | $30 | | | | $92 | | | | $49 | | | | $22 | | | | $71 | |
Future contractual commitments related to intangible assets at the end of 2016 were $30 million (2015 – $25 million).
|
| EDC Annual Report 2016 107 |
Consolidated Financial Statements
| | |
 | | Building under Finance Lease |
Our head office building is held under a finance lease for 20 years with the option of two further terms of 5 years each. Future minimum lease payments under the obligation under finance lease as well as the present value of the minimum lease payments based on the expected 25 year lease term are as follows:
| | | | | | | | | | | | | | | | | | |
| | | | |
(in millions of Canadian dollars) | | Dec. 31, 2016 | | | Dec. 31, 2015 | | | |
| | | Minimum
payments | | | Present value of minimum lease
payments | | | Minimum
payments | | | Present value of
minimum lease
payments | | | |
| | | | | |
2016 | | | – | | | | – | | | | 11 | | | | 11 | | | |
| | | | | |
2017 | | | 11 | | | | 11 | | | | 11 | | | | 10 | | | |
| | | | | |
2018 | | | 11 | | | | 10 | | | | 11 | | | | 10 | | | |
| | | | | |
2019 | | | 11 | | | | 10 | | | | 11 | | | | 9 | | | |
| | | | | |
2020 | | | 11 | | | | 9 | | | | 11 | | | | 9 | | | |
| | | | | |
2021 | | | 11 | | | | 9 | | | | 11 | | | | 9 | | | |
| | | | | |
2022 and beyond | | | 189 | | | | 109 | | | | 189 | | | | 104 | | | |
| | | | | |
Total | | | 244 | | | | 158 | | | | 255 | | | | 162 | | | |
| | | | | |
Less: future finance charges | | | (86 | ) | | | – | | | | (93 | ) | | | – | | | |
Present value of minimum lease payments | | | $158 | | | | $158 | | | | $162 | | | | $162 | | | |
|
During the year, changes to the building under finance lease were as follows: |
| | | | | | |
(in millions of Canadian dollars) | | 2016 | | | 2015 | | | | | | | | | |
Cost | | | 177 | | | | 177 | | | | | | | | | | | |
Accumulated depreciation: | | | | | | | | | | | | | | | | | | |
| | | | | |
Balance at beginning of year | | | (29 | ) | | | (22) | | | | | | | | | | | |
| | | | | |
Depreciation expense | | | (7 | ) | | | (7) | | | | | | | | | | | |
| | | | | |
Balance at end of year | | | (36 | ) | | | (29) | | | | | | | | | | | |
| | | | | |
Carrying amount | | | $141 | | | | $148 | | | | | | | | | | | |
|
 Accounts Payable and Other Credits Accounts Payable and Other Credits |
| | | | | | | | | | | | | | | |
| | | | | | |
| (in millions of Canadian dollars) | | Dec. 31, 2016 | | | Dec. 31, 2015 | | | | | | | | | |
| | | | | |
Employee benefit accruals | | | 46 | | | | 35 | | | | | | | | | | | |
| | | | | |
Restructuring payments payable | | | 42 | | | | 50 | | | | | | | | | | | |
| | | | | |
Trade payables and accruals | | | 25 | | | | 15 | | | | | | | | | | | |
| | | | | |
Canada Account payable | | | 10 | | | | 4 | | | | | | | | | | | |
| | | | | |
Reinsurance premiums payable | | | 10 | | | | 3 | | | | | | | | | | | |
| | | | | |
Other payables and other credits | | | 9 | | | | 8 | | | | | | | | | | | |
| | | | | |
Total accounts payable and other credits | | | $142 | | | | $115 | | | | | | | | | | | |
Restructuring payments payable relates to an agreement between EDC and an airline obligor as part of the terms of a loan restructuring that was finalized in 2007. The payable relates to a receivable as shown in Note 11.
Canada Account payable primarily represents the amount of cash repayments (principal and interest) received by EDC from borrowers on Canada Account loans which were not yet remitted at year-end to the Consolidated Revenue Fund.
Consolidated Financial Statements
| | |

| | Debt Instruments |
We issue debt instruments in global capital markets. Short-term payables consist of commercial paper and other short-term debt related instruments that we issue with maturities under one year. Long-term payables represent bonds and other long-term instruments which we issue in U.S. dollars and other currencies with maturities exceeding one year. We use foreign exchange swaps as well as cross currency interest rate swaps to convert Canadian dollar and foreign currency denominated notes primarily to U.S. dollars. Interest rate swaps are principally used to convert our debt to floating rates, primarily related to LIBOR. We use these derivative instruments to manage interest rate risk and foreign exchange risk, and also for asset liability management purposes.
EDC is wholly owned by the Government of Canada and our obligations are backed by the full faith and credit of the Government of Canada which holds a AAA credit rating. Therefore, there is no significant change in the value of our debt instruments that can be attributed to changes in our own credit risk.
Loans Payable
The components of loans payable (excluding derivatives) were as follows:
| | | | | | | | | | | | | | | | | | | | | | | | |
| | | | | | |
| (in millions of Canadian dollars) | | | | | Dec. 31, 2016 | | | | | | | | | Dec. 31, 2015 | |
| | | | | | |
| | | Designated at
fair value through
profit or loss | | | At amortized
cost | | | Total | | | Designated at fair value through profit or loss | | | At amortized cost | | | Total | |
Short-term payables | | | 9,238 | | | | – | | | | 9,238 | | | | 9,911 | | | | – | | | | 9,911 | |
Long-term payables | | | | | | | | | | | | | | | | | | | | | | | | |
due within current year | | | 7,717 | | | | 2,421 | | | | 10,138 | | | | 7,284 | | | | 1,757 | | | | 9,041 | |
over one year | | | 22,968 | | | | 6,752 | | | | 29,720 | | | | 22,096 | | | | 5,860 | | | | 27,956 | |
Total long-term payables | | | 30,685 | | | | 9,173 | | | | 39,858 | | | | 29,380 | | | | 7,617 | | | | 36,997 | |
Accrued interest and other | | | – | | | | 5 | | | | 5 | | | | – | | | | 1 | | | | 1 | |
Total loans payable | | | $39,923 | | | | $9,178 | | | | $49,101 | | | | $39,291 | | | | $7,618 | | | | $46,909 | |
The amount to be paid at maturity on the debt designated at fair value through profit or loss was $39,742 million (2015 – $39,035 million), $181 million less than the December 2016 fair value (2015 – $256 million).
In 2016, there were unrealized foreign exchange translation gains of $169 million (2015 – losses of $1,149 million) on our loans payable designated at amortized cost. The foreign exchange exposure of these loans payable is managed as part of our foreign currency risk management together with all other assets and liabilities. Refer to Note 26 for further details on our consolidated foreign exchange translation exposures and Note 37 for our consolidated foreign exchange translation (gain) loss.
Structured Notes
We have entered into a number of structured notes as part of our funding program. Structured notes are hybrid securities that combine debt instruments with derivative components.
Structured notes outstanding, included in loans payable, were as follows:
| | | | | | | | |
| | | |
(in millions of Canadian dollars) | | Dec. 31, 2016 | | | Dec. 31, 2015 | |
Callable/extendible | | | 936 | | | | 1,228 | |
Zero coupon | | | 96 | | | | 335 | |
Dual currency | | | 6 | | | | 6 | |
Total | | | $1,038 | | | | $1,569 | |
We have executed swap contracts to mitigate interest rate risk and foreign exchange risk on these structured borrowings. These contracts ensure that we will receive proceeds from the swap to meet the requirements of settling and servicing the debt obligation. We have, in substance, created floating rate debt by issuing bonds and entering into swap contracts whereby we receive interest matching the interest on the bond, leaving us with a net floating rate interest payable. In swapping out of the underlying bond issue, the potential interest rate risk has been converted to credit risk. Credit exposure on derivative instruments is further discussed in Note 17.
|
| EDC Annual Report 2016 109 |
Consolidated Financial Statements
| | |

| | Derivative Instruments |
We use a variety of derivative instruments to manage costs, returns and levels of financial risk associated with our funding, investment and risk management activities.
We currently use, but are not limited to, the following types of instruments:
Interest rate swaps – transactions in which two parties exchange interest flows on a specified notional amount on predetermined dates for a specified period of time using agreed-upon fixed or floating rates of interest. Notional amounts upon which interest payments/receipts are based are not exchanged.
Cross currency interest rate swaps – transactions in which two parties exchange currencies at inception and at maturity, as well as interest flows on the exchanged amounts on predetermined dates for a specified period of time using agreed-upon fixed or floating rates of interest.
Foreign exchange swaps – commitments to exchange cash flows in different currencies where there are two exchanges; the first is made at the spot rate at inception and the second at a predetermined rate on a specified date in the future.
Foreign exchange forwards – commitments to exchange cash flows in different currencies, for which the foreign exchange rate is predetermined, at a specified date in the future.
In any transaction there is a potential for loss. This loss potential is represented by (1) credit risk, wherein a counterparty fails to perform an obligation as agreed upon, causing the other party to incur a financial loss, and (2) interest rate risk and foreign exchange risk, where an exposure exists as a result of changes in foreign exchange rates or interest rates.
We manage our exposure to interest rate risk and foreign exchange risk using limits developed in consultation with the Department of Finance and approved by our Board of Directors. Both our internal policies and guidelines (established in the Risk Management Office and approved by our Board of Directors) and those set by the Minister of Finance limit our use of derivatives. We do not use derivative instruments for speculative purposes.
We manage our exposure to derivative counterparty credit risk by contracting only with creditworthy counterparties, establishing International Swaps and Derivatives Association (ISDA) master netting agreements, and in certain cases entering into collateral agreements, via Credit Support Annex with those counterparties. Internal policies and procedures establish credit approvals, controls and monitoring.
Under ISDA master netting agreements, the amounts owing by each counterparty on a single day are netted into a single payment by currency. ISDA agreements do not meet the criteria for offsetting in the consolidated statement of financial position because the right to offset all outstanding derivative instruments is only enforceable upon specific credit events such as the default of one of the parties to the agreement. Upon such events, all transactions under the agreement are terminated, a net termination value is assessed which determines the final amount payable to settle all outstanding transactions.
Collateral agreements provide for the posting of collateral by the counterparty when our exposure to that entity exceeds a certain threshold. Collateral is held by a third party custodian and at the end of 2016 totalled $22 million (2015 – $68 million) and consists of AAA rated government issued securities.
All derivative counterparties must have a minimum credit rating of A- and any exception must be approved by the Board of Directors. We held derivatives with no counterparties that have a rating below this requirement (2015 – two counterparties with a combined negative fair value of $62 million).
In 2016, we reviewed our contracts for embedded derivatives in non-financial contracts and determined that there were no embedded derivatives.
Notional amounts are not recorded as assets or liabilities on our consolidated statement of financial position as they only represent the face amount of the contract to which a rate or a price is applied to determine the amount of cash flows to be exchanged.
The remaining term to maturity for the notional amounts of our derivative contracts was as follows:
| | | | | | | | | | | | | | | | | | | | | | | | | | | | | | | | |
| | | |
(in millions of Canadian dollars) | | Dec. 31, 2016 | | | Dec. 31, 2015 | |
| | | Remaining term to maturity | | | | | | Remaining term to maturity | | | | |
| | | Under 1 | | | 1 to 3 | | | Over 3 | | | | | | Under 1 | | | 1 to 3 | | | Over 3 | | | | |
| | | year | | | years | | | years | | | Total | | | year | | | years | | | years | | | Total | |
Interest rate swaps | | | 4,744 | | | | 11,928 | | | | 5,731 | | | | 22,403 | | | | 3,918 | | | | 10,229 | | | | 5,575 | | | | 19,722 | |
| | | | | | | | |
Cross currency interest rate swaps | | | 2,775 | | | | 6,831 | | | | 3,862 | | | | 13,468 | | | | 4,583 | | | | 6,837 | | | | 5,300 | | | | 16,720 | |
| | | | | | | | |
Foreign exchange swaps | | | 4,878 | | | | – | | | | – | | | | 4,878 | | | | 4,784 | | | | – | | | | – | | | | 4,784 | |
| | | | | | | | |
Foreign exchange forwards | | | 113 | | | | – | | | | – | | | | 113 | | | | 10 | | | | – | | | | – | | | | 10 | |
| | | | | | | | |
Total derivative instruments | | | $12,510 | | | | $18,759 | | | | $9,593 | | | | $40,862 | | | | $13,295 | | | | $17,066 | | | | $10,875 | | | | $41,236 | |
Consolidated Financial Statements
The following table provides the fair values for each category of derivative financial instrument:
| | | | | | | | | | | | | | | | | | | | | | | | |
| | | |
(in millions of Canadian dollars) | | Dec. 31, 2016 | | | Dec. 31, 2015 | |
| | | | | | |
| | | Positive | | | Negative | | | Total | | | Positive | | | Negative | | | Total | |
| | | | | | |
Cross currency interest rate swaps | | | 125 | | | | 2,599 | | | | (2,474 | ) | | | 121 | | | | 3,314 | | | | (3,193 | ) |
| | | | | | |
Interest rate swaps | | | 113 | | | | 190 | | | | (77 | ) | | | 127 | | | | 59 | | | | 68 | |
| | | | | | |
Foreign exchange swaps | | | 86 | | | | 27 | | | | 59 | | | | 102 | | | | 61 | | | | 41 | |
| | | | | | |
Foreign exchange forwards | | | – | | | | 3 | | | | (3 | ) | | | – | | | | – | | | | – | |
| | | | | | |
Total derivative instruments | | | 324 | | | | 2,819 | | | | (2,495 | ) | | | 350 | | | | 3,434 | | | | (3,084 | ) |
| | | | | | |
Impact of netting agreements | | | (120 | ) | | | (120 | ) | | | – | | | | (110 | ) | | | (110 | ) | | | – | |
| | | | | | |
Total | | | $204 | | | | $2,699 | | | | $(2,495 | ) | | | $240 | | | | $3,324 | | | | $(3,084 | ) |
| | | | | | |
Applicable collateral | | | | | | | | | | | (22 | ) | | | | | | | | | | | (68 | ) |
| | | | | | | |
Net amount | | | | | | | | | | | $(2,517 | ) | | | | | | | | | | | $(3,152 | ) |
The change in the fair value of the derivative instruments recognized in net income in 2016 amounted to a loss of $89 million (2015 – loss of $101 million).
| | |
 | | Debt Instrument Maturities |
We often combine debt instruments with derivative instruments to generate lower-cost funding. For example, a fixed rate debt issue can be combined with an interest rate swap to generate floating rate funding at a lower cost than issuing a floating rate note. The following table shows our resulting net fixed and floating rate debt positions, as well as the maturities and yields of those net positions. Although we measure our swaps and the majority of debt instruments at their fair value on the financial statements, they are shown below at their notional amounts in order to provide information on cash requirements at maturity of the instruments.
| | | | | | | | | | | | | | | | | | | | | | | | | | | | | | | | |
| | | |
(in millions of Canadian dollars) | | Dec. 31, 2016 | | | Dec. 31, 2015 | |
| | | Debt | | | Swap | | | | | | Yield* | | | Debt | | | Swap | | | | | | Yield* | |
Year of maturity | | issues | | | contracts | | | Net | | | (%) | | | issues | | | contracts | | | Net | | | (%) | |
| | | | | | | | |
Fixed rate issues | | | | | | | | | | | | | | | | | | | | | | | | | | | | | | | | |
| | | | | | | | |
2016 | | | – | | | | – | | | | – | | | | – | | | | 6,764 | | | | (5,007 | ) | | | 1,757 | | | | 0.87 | |
| | | | | | | | |
2017 | | | 6,350 | | | | (3,526 | ) | | | 2,824 | | | | 0.96 | | | | 6,430 | | | | (3,801 | ) | | | 2,629 | | | | 0.96 | |
| | | | | | | | |
2018 | | | 8,867 | | | | (7,925 | ) | | | 942 | | | | 1.23 | | | | 8,468 | | | | (8,468 | ) | | | – | | | | – | |
| | | | | | | | |
2019 | | | 7,625 | | | | (3,590 | ) | | | 4,035 | | | | 1.56 | | | | 4,840 | | | | (2,072 | ) | | | 2,768 | | | | 1.79 | |
| | | | | | | | |
2020 | | | 3,634 | | | | (3,634 | ) | | | – | | | | – | | | | 2,124 | | | | (2,124 | ) | | | – | | | | – | |
| | | | | | | | |
2021 | | | 3,882 | | | | (1,836 | ) | | | 2,046 | | | | 1.14 | | | | 812 | | | | (211 | ) | | | 601 | | | | 0.03 | |
| | | | | | | | |
2022 to 2026 | | | 283 | | | | (283 | ) | | | – | | | | – | | | | – | | | | – | | | | – | | | | – | |
| | | | | | | | |
2027 and beyond | | | 66 | | | | (66 | ) | | | – | | | | – | | | | 245 | | | | (245 | ) | | | – | | | | – | |
| | | | | | | | | |
Subtotal | | | 30,707 | | | | (20,860 | ) | | | 9,847 | | | | 1.34 | | | | 29,683 | | | | (21,928 | ) | | | 7,755 | | | | 1.27 | |
| | | | | | | | |
Floating rate issues | | | | | | | | | | | | | | | | | | | | | | | | | | | | | | | | |
| | | | | | | | |
2016 | | | – | | | | – | | | | – | | | | | | | | 12,146 | | | | 5,479 | | | | 17,625 | | | | | |
| | | | | | | | |
2017 | | | 12,983 | | | | 3,792 | | | | 16,775 | | | | | | | | 3,287 | | | | 4,068 | | | | 7,355 | | | | | |
| | | | | | | | |
2018 | | | 2,535 | | | | 8,628 | | | | 11,163 | | | | | | | | 152 | | | | 8,984 | | | | 9,136 | | | | | |
| | | | | | | | |
2019 | | | 1,345 | | | | 3,901 | | | | 5,246 | | | | | | | | 1,384 | | | | 2,352 | | | | 3,736 | | | | | |
| | | | | | | | |
2020 | | | 1,345 | | | | 3,773 | | | | 5,118 | | | | | | | | – | | | | 2,164 | | | | 2,164 | | | | | |
| | | | | | | | |
2021 | | | – | | | | 1,863 | | | | 1,863 | | | | | | | | – | | | | 238 | | | | 238 | | | | | |
| | | | | | | | |
2022 to 2026 | | | – | | | | 283 | | | | 283 | | | | | | | | – | | | | – | | | | – | | | | | |
| | | | | | | | |
2027 and beyond | | | – | | | | 67 | | | | 67 | | | | | | | | – | | | | 245 | | | | 245 | | | | | |
| | | | | | | | | |
Subtotal | | | 18,208 | | | | 22,307 | | | | 40,515 | | | | 1.00 | | | | 16,969 | | | | 23,530 | | | | 40,499 | | | | 0.50 | |
| | | | | | | | | |
Total | | | $48,915 | | | | $1,447 | | | | $50,362 | | | | | | | | $46,652 | | | | $1,602 | | | | $48,254 | | | | | |
| * | Refers to yield to maturity for fixed rate issues and yield to reset for floating rate issues. |
|
| EDC Annual Report 2016 111 |
Consolidated Financial Statements
At the end of 2016, the contractual cash flows, including principal and interest, related to our debt portfolio were as follows:
| | | | | | | | | | | | | | | | | | | | | | | | | | | | | | | | | | | | | | | | |
| | | | | | | | | |
(in millions of Canadian dollars) | | | | | | | | | | | Dec. 31, 2016 | | | | | | | | | | | | Dec. 31, 2015 | |
| | | Under 1
year | | | 1 to 3
years | | | Over 3 to 5
years | | | Over 5
years | | | Total | | | Under 1
year | | | 1 to 3
years | | | Over 3 to 5 years | | | Over 5
years | | | Total | |
Debt | | | 19,388 | | | | 21,024 | | | | 9,336 | | | | 587 | | | | 50,335 | | | | 18,983 | | | | 18,915 | | | | 8,958 | | | | 2,054 | | | | 48,910 | |
| | | | | | | | | | |
Swap contracts | | | | | | | | | | | | | | | | | | | | | | | | | | | | | | | | | | | | | | | | |
| | | | | | | | | | |
Receivable | | | (3,590 | ) | | | (11,960 | ) | | | (5,837 | ) | | | (588) | | | | (21,975 | ) | | | (5,077 | ) | | | (12,805 | ) | | | (4,619 | ) | | | (1,451 | ) | | | (23,952) | |
| | | | | | | | | | |
Payable | | | 3,813 | | | | 12,587 | | | | 5,654 | | | | 351 | | | | 22,405 | | | | 5,487 | | | | 13,084 | | | | 4,526 | | | | 483 | | | | 23,580 | |
Total | | | $19,611 | | | | $21,651 | | | | $9,153 | | | | $350 | | | | $50,765 | | | | $19,393 | | | | $19,194 | | | | $8,865 | | | | $1,086 | | | | $48,538 | |
Credit exposure and other details of derivative instruments are included as part of Note 17.
| | |

| | Premium and Claims Liabilities |
The premium and claims liabilities broken down by product group were as follows:
| | | | | | | | | | | | | | | | | | | | | | | | |
| | | | | |
| (in millions of Canadian dollars) | | Dec. 31, 2016 | | | | | | | | | Dec. 31, 2015 | |
| | | Insurance | | | Reinsurance | | | Net liabilities | | | Insurance | | | Reinsurance | | | Net liabilities | |
Credit insurance(1) | | | 248 | | | | (13 | ) | | | 235 | | | | 212 | | | | (13 | ) | | | 199 | |
| | | | | | |
Contract insurance and bonding(2) | | | 34 | | | | (4 | ) | | | 30 | | | | 32 | | | | (1 | ) | | | 31 | |
| | | | | | |
Political risk insurance(2) | | | 374 | | | | (99 | ) | | | 275 | | | | 444 | | | | (127 | ) | | | 317 | |
Total | | | $656 | | | | $(116) | | | | $540 | | | | $688 | | | | $(141) | | | | $547 | |
(1) Includes financial institutions insurance. (2) Prior year comparatives have been reclassified to properly reflect future anticipated premiums. The premium and claims liabilities were comprised of the following components: | |
| | | | | | | |
| (in millions of Canadian dollars) | | Dec. 31, 2016 | | | Dec. 31, 2015 | | | | | | | | | | | | | |
Deferred insurance premiums | | | 157 | | | | 121 | | | | | | | | | | | | | | | | | |
Allowance for claims on insurance | | | 499 | | | | 567 | | | | | | | | | | | | | | | | | |
Total premium and claims liabilities | | | 656 | | | | 688 | | | | | | | | | | | | | | | | | |
Reinsurers’ share of allowance for claims on insurance | | | (90 | ) | | | (114) | | | | | | | | | | | | | | | | | |
| | | | | | |
Prepaid reinsurance | | | (26 | ) | | | (27) | | | | | | | | | | | | | | | | | |
Reinsurers’ share of premium and claims liabilities | | | (116 | ) | | | (141) | | | | | | | | | | | | | | | | | |
Net premium and claims liabilities | | | $540 | | | | $547 | | | | | | | | | | | | | | | | | |
During the year, the premium and claims liabilities were impacted by the following factors: | |
| | | |
| (in millions of Canadian dollars) | | Dec. 31, 2016 | | | Dec. 31, 2015 | |
| | | Insurance | | | Reinsurance | | | Net liabilities | | | Insurance | | | Reinsurance | | | Net liabilities | |
Balance at beginning of year | | | 688 | | | | (141 | ) | | | 547 | | | | 618 | | | | (88 | ) | | | 530 | |
| | | | | | |
Change in portfolio make-up and risk ratings | | | 53 | | | | 12 | | | | 65 | | | | (5 | ) | | | – | | | | (5) | |
| | | | | | |
Update of actuarial assumptions | | | 11 | | | | – | | | | 11 | | | | (3 | ) | | | 3 | | | | – | |
| | | | | | |
Update to severity of loss methodology | | | (84 | ) | | | 9 | | | | (75 | ) | | | – | | | | – | | | | – | |
| | | | | | |
Additional reinsurance on large exposures | | | – | | | | – | | | | – | | | | – | | | | (27 | ) | | | (27) | |
| | | | | | |
Foreign exchange translation | | | (12 | ) | | | 4 | | | | (8 | ) | | | 78 | | | | (29 | ) | | | 49 | |
Balance at end of year | | | $656 | | | | $(116 | ) | | | $540 | | | | $688 | | | | $(141 | ) | | | $547 | |
Consolidated Financial Statements
In 2016, we updated the methodology for determining severity of loss used in the actuarial calculation of our allowance for claims on insurance for our sovereign and government related entities portfolio, introducing obligor specific severity of loss rates, replacing a general rate used for all obligors within the portfolio. The difference between using the updated methodology and the prior methodology as at December 31, 2016 is a $75 million release of allowance and represents a change in accounting estimate. This change in estimate also impacted claims-related expenses reported in Note 36. The impact on future periods has not been determined as it is impracticable to estimate.
| | |
 | | Financing Commitments |
We have three types of financing commitments.
The first type is undisbursed amounts on signed loan agreements totalling $19,147 million (2015 – $19,928 million). These commitments are immediately available to the obligor for drawdown subject to continued adherence to contractual covenants established under the financing agreements.
Undisbursed amounts on signed loan agreements with their committed fixed rates or committed floating rate spreads are outlined in the following table. All yields are computed on a weighted average basis and the spreads over floating interest rates represent the spreads over base rates which consist mainly of U.S. dollar LIBOR.
| | | | | | | | | | | | | | | | | | | | | | | | | | | | | | | | | | | | | | | | |
(in millions of Canadian dollars) | | Dec. 31, 2016 | | | Dec. 31, 2015 | |
| | | | | | Estimated | | | | | | | | | | | | | | | Estimated | | | | | | | | | | |
| | | Fixed $ | | | spot yield % | | | Floating $ | | | Spread % | | | Total $ | | | Fixed $ | | | spot yield % | | | Floating $ | | | Spread % | | | Total $ | |
Commercial | | | 865 | | | | 2.46 | | | | 18,010 | | | | 1.36 | | | | 18,875 | | | | 852 | | | | 3.02 | | | | 19,049 | | | | 1.42 | | | | 19,901 | |
Sovereign | | | 272 | | | | 2.86 | | | | – | | | | – | | | | 272 | | | | 27 | | | | 2.80 | | | | – | | | | – | | | | 27 | |
Total | | $ | 1,137 | | | | 2.56 | | | $ | 18,010 | | | | 1.36 | | | $ | 19,147 | | | $ | 879 | | | | 3.01 | | | $ | 19,049 | | | | 1.42 | | | $ | 19,928 | |
We also have loan and loan guarantee commitments for which terms related to the transaction, such as interest rate type and disbursement schedule, have not yet been determined. This category of commitments includes letters of offer accepted and outstanding for loans of $2,523 million (2015 – $3,007 million) and loan guarantees of $41 million (2015 – $314 million) as well as unallocated confirmed lines of credit of $181 million (2015 – $109 million).
The third type of financing commitment relates to undisbursed investment commitments of $12 million for direct investments (2015 – $16 million) and fund investments of $902 million (2015 – $887 million). The majority of these commitments are drawn down over a five-year period, although drawdowns may occur over the life of the fund at the discretion of the fund managers.
| | |
 | | Contingent Liabilities |
Insurance in Force and Loan Guarantees
As described in Note 1, we are subject to a limit imposed by the Act on our contingent liabilities related to the total outstanding principal amount owing under all insurance policies, reinsurance policies, indemnities and guarantees of the greater of (i) $45 billion and (ii) an amount equal to 10 times the authorized capital of the Corporation. The following table presents the net amount of these contingent liabilities:
| | | | | | | | |
(in millions of Canadian dollars) | | Dec. 31, 2016 | | | Dec. 31, 2015 | |
Insurance in force: | | | | | | | | |
Credit insurance | | | 9,480 | | | | 9,390 | |
Financial institutions insurance | | | 3,900 | | | | 4,872 | |
Contract insurance and bonding | | | 8,171 | | | | 8,906 | |
Political risk insurance | | | 1,392 | | | | 1,396 | |
Reinsurance ceded* | | | (250 | ) | | | (250 | ) |
Insurance in force | | | 22,693 | | | | 24,314 | |
Loan guarantees | | | 2,514 | | | | 2,187 | |
Total | | | $25,207 | | | | $26,501 | |
* Represents treaty reinsurance agreements covering most bonding obligors and the
short-term export credit insurance portfolio, including most foreign bank exposures.
|
| EDC Annual Report 2016 113 |
Consolidated Financial Statements
Insurance in Force
Exposure on our insurance in force at the end of 2016 totalled $22,693 million (2015 – $24,314 million). Net premium and claims liabilities related to this exposure on the consolidated statement of financial position was $540 million (2015 – $547 million); refer to Note 19 for further details. For details regarding insurance products and risks refer to Note 22.
Loan Guarantees
We issue loan guarantees to cover non-payment of principal, interest and fees due to financial institutions providing loans to Canadian exporters or buyers of Canadian goods and services. Calls on guarantees result in our recognition of a loan asset within our financial statements and become a direct obligation of the exporter or buyer. At the end of 2016, loan guarantees with performing obligors were $2,482 million of which $38 million were secured (2015 – $2,171 million in performing guarantees of which $62 million were secured). Loan guarantees with impaired obligors were $32 million for 2016 of which none were secured (2015 – $16 million of which none were secured).
Loan guarantees on the consolidated statement of financial position were comprised as follows:
| | | | | | | | |
(in millions of Canadian dollars) | | Dec. 31, 2016 | | | Dec. 31, 2015 | |
Deferred guarantee fee revenue | | | 62 | | | | 55 | |
Allowance for losses on loan guarantees | | | 105 | | | | 103 | |
Total | | | $167 | | | | $158 | |
Maturity Analysis
The maturity profile of our insurance in force and loan guarantees is summarized as follows:
| | | | | | | | | | | | | | | | | | | | | | | | | | | | | | | | |
(in millions of Canadian dollars) | | | | | | | | | | | | | | | | | | | | | | | Dec. 31, 2016 | |
| | | | | | Financial | | | Contract insurance and bonding | | | | | | | | | | | | | |
| | | Credit | | | institutions | | | | | | | | | Political risk | | | Loan | | | Reinsurance | | | | |
| | | insurance | | | insurance | | | Policies | | | Guarantees | | | insurance | | | guarantees | | | ceded* | | | Total | |
2017 | | | 9,398 | | | | 3,813 | | | | 131 | | | | 2,353 | | | | 456 | | | | 2,444 | | | | (250) | | | | 18,345 | |
2018 | | | 76 | | | | 87 | | | | 320 | | | | 1,338 | | | | 147 | | | | 3 | | | | – | | | | 1,971 | |
2019 | | | 4 | | | | – | | | | 137 | | | | 414 | | | | 110 | | | | – | | | | – | | | | 665 | |
2020 | | | 2 | | | | – | | | | 33 | | | | 682 | | | | 62 | | | | 27 | | | | – | | | | 806 | |
2021 | | | – | | | | – | | | | 29 | | | | 16 | | | | 168 | | | | 24 | | | | – | | | | 237 | |
2022 – 2026 | | | – | | | | – | | | | 22 | | | | 2,696 | | | | 323 | | | | 16 | | | | – | | | | 3,057 | |
2027 and beyond | | | – | | | | – | | | | – | | | | – | | | | 126 | | | | – | | | | – | | | | 126 | |
Total | | | $9,480 | | | | $3,900 | | | | $672 | | | | $7,499 | | | | $1,392 | | | | $2,514 | | | | $(250) | | | | $25,207 | |
| | | | | | | | |
| | | | | | | | | | | | | | | | | | | | | | | | | |
(in millions of Canadian dollars) | | | | | | | | | | | | | | | | | | | | | | | Dec. 31, 2015 | |
| | | | | | Financial | | | Contract insurance and bonding | | | | | | | | | | | | | |
| | | Credit | | | institutions | | | | | | | | | Political risk | | | Loan | | | Reinsurance | | | | |
| | | insurance | | | insurance | | | Policies | | | Guarantees | | | insurance | | | guarantees | | | ceded* | | | Total | �� |
2016 | | | 9,301 | | | | 4,646 | | | | 200 | | | | 3,026 | | | | 15 | | | | 2,102 | | | | (250) | | | | 19,040 | |
2017 | | | 87 | | | | 205 | | | | 344 | | | | 1,277 | | | | 559 | | | | 34 | | | | – | | | | 2,506 | |
2018 | | | 2 | | | | 21 | | | | 130 | | | | 199 | | | | 105 | | | | – | | | | – | | | | 457 | |
2019 | | | – | | | | – | | | | 11 | | | | 164 | | | | 121 | | | | – | | | | – | | | | 296 | |
2020 | | | – | | | | – | | | | 4 | | | | 739 | | | | 63 | | | | – | | | | – | | | | 806 | |
2021 | | | – | | | | – | | | | 8 | | | | 2 | | | | 162 | | | | 23 | | | | – | | | | 195 | |
2022 – 2026 | | | – | | | | – | | | | 28 | | | | 2,774 | | | | 335 | | | | 18 | | | | – | | | | 3,155 | |
2027 and beyond | | | – | | | | – | | | | – | | | | – | | | | 36 | | | | 10 | | | | – | | | | 46 | |
Total | | | $9,390 | | | | $4,872 | | | | $725 | | | | $8,181 | | | | $1,396 | | | | $2,187 | | | | $(250) | | | | $26,501 | |
| * | Represents treaty reinsurance agreements covering most bonding obligors and the short-term export credit insurance portfolio, including most foreign bank exposures. |
Legal Proceedings
We are involved in various legal proceedings in the ordinary course of business. Management does not expect the outcome of any of these proceedings to have a material effect on our consolidated financial position or our results of operations.
Consolidated Financial Statements
| | |

| | Insurance Risks |
Insurance and Financial Risk
We principally issue insurance to our customers to protect them against non-payment by an obligor and/or other losses due to political risk. Guarantees and surety bond insurance are typically issued to the counterparties of our customers in order to provide them with recourse should our customers not perform as contracted.
We define insurance risk to be the risk that the actual experience under an insurance policy does not follow what was anticipated at policy inception.
The risks within our insurance program are mitigated by diversification across geographical markets, industries and a portfolio of insurance contracts across uncorrelated product lines. We further manage our risk through the application of a detailed underwriting process which ensures that exposures receive tiered levels of due diligence based on their size and level of risk. Our risk acceptance decisions are supported by the Corporation’s resources in the areas of economics, political risk and legal. Our risk management procedures also include the use of risk transfer arrangements.
The core operating principles for risk transfer activity are to (1) mitigate potential large losses due to existing high concentration in obligor, sector and country risk, (2) protect from credit deterioration within the portfolio and (3) proactively acquire additional credit capacity.
We engage in various risk transfer activities primarily through co-insurance and reinsurance. Co-insurance can be defined as leveraging another insurer’s capacity by jointly sharing the risk of the original insurance policy. A co-insurance agreement is typically put in place at the time of origination of the transaction. Under this structure, we are not exposed to the credit risk of the co-insurer.
Under a reinsurance structure, we assume the risk of the original policy, and cede that risk to a counterparty (the “reinsurer”) to limit our exposure to large losses. We have treaty reinsurance agreements covering most bonding obligors and the short-term export credit insurance portfolio, including most foreign bank exposures. We additionally have facultative reinsurance agreements covering specific credit insurance policies and buyers and some large bonding obligors, as well as specific political risk insurance policies. Reinsurance contracts do not relieve us of our obligations to the insured; however, they do provide for the recovery of claims arising from the liabilities ceded. Under a reinsurance structure, we are exposed to the credit risk of the reinsurer (referred to as counterparty risk). To help mitigate this risk, our placement of reinsurance is diversified such that it is not dependent on a single reinsurer. Reinsurance counterparty exposure is managed under our reinsurance counterparty management procedures and monitored by our Risk Management team.
We have assumed export risks for a number of Canadian exporters under facultative arrangements with private insurers. For the surety bond insurance line of business within the contract insurance and bonding product group, we have general reinsurance agreements with several surety companies. In addition, we have assumed facultative reinsurance positions under our credit insurance, contract frustration, surety bonding and political risk insurance products.
In addition to our risk management procedures discussed above, our Claims and Recoveries team thoroughly reviews debt files at all stages of the overdue, claim and recovery process. This team manages and pursues debt files so as to minimize losses. Continuously evolving documentation and analytical standards also ensure that the claims process and its outcomes are appropriate and consistent.
We also manage our exposure through policy structuring measures including the use of maximum liability amounts and risk sharing with our customers on certain contracts.
Note that the terms “exposure” and “insurance in force” are used interchangeably throughout this section to refer to the lesser of current policy declarations and the total maximum liability of all active policies at the reporting date.
Concentrations of Insurance Risk
Management identifies concentrations of insurance risk through the review of portfolio data and sensitivity analysis. Risk limits are imposed at the insurance product level to ensure that we are not over-exposed to any one risk. Concentrations of insurance risk can result from large policies with specific entities, as well as from geographical region. Concentrations of risk for our insurance business are discussed below based on the four principal insurance product groups that we underwrite.
Credit Insurance
Credit insurance protects exporters of goods and services trading on credit terms of generally up to one year against non-payment due to commercial and political risks. Commercial and political risks covered include buyer insolvency, default, repudiation of goods by buyer, contract cancellation and conversion and risk transfer, cancellation of export or import permits or war-related risks.
Our primary risk in the credit insurance product group is the credit risk of our customers’ obligors. During our underwriting process, our assessment considers both an entity’s ability and willingness to pay. Ability to pay is primarily based on the financial strength, operations and leadership of the entity (commercial or sovereign) that is the source of our risk. Other factors, such as the environment of the entity’s industry, the economy and political and geographical events are also considered. Willingness to pay is assessed based on the entity’s payment history, reputation and governance.
|
| EDC Annual Report 2016 115 |
Consolidated Financial Statements
We use a rating system to assign risk levels to our customers’ obligors. Buyer credit limits for each obligor are then established and approved for specified periods of time. The percentage of outstanding buyer limits based on the internal ratings assigned to the policyholders’ obligors, as well as the equivalent external ratings, were as follows:
| | | | | | | | | | | | | | | | |
| | | | | | | | | Dec. 31, 2016 | | | Dec. 31, 2015 | |
| | | | | | | | | Percentage of | | | Percentage of | |
| | | Standard & | | | | | | outstanding | | | outstanding | |
Internal risk level | | Poor’s | | | Moody’s | | | buyer limits | | | buyer limits | |
Low | | | AAA to A- | | | | Aaa to A3 | | | | 33% | | | | 32% | |
| | | | |
Moderate | | | BBB+ to BBB- | | | | Baa1 to Baa3 | | | | 28% | | | | 29% | |
| | | | |
Medium | | | BB+ to BB | | | | Ba1 to Ba2 | | | | 16% | | | | 17% | |
| | | | |
High | | | BB- to B- | | | | Ba3 to B3 | | | | 20% | | | | 19% | |
| | | | |
Priority watch | | | CCC+ to D | | | | Caa1 to C | | | | 3% | | | | 3% | |
The major concentrations of risk by country based on the total potential risk exposure for the credit insurance product group were as follows:
| | | | | | | | | | | | | | | | | | | | | | | | | | | | | | | | | | |
(in millions of
Canadian dollars) | | | | | | | | Dec. 31, 2016 | | | | | | | | | | | | | | Dec. 31, 2015 | |
| | | Credit | | | Reinsurance | | | Reinsurance | | | Net credit | | | | | Credit | | | Reinsurance | | | Reinsurance | | | Net credit | |
| | | insurance | | | assumed | | | ceded | | | insurance | | | | | insurance | | | assumed | | | ceded | | | insurance | |
United States | | | 4,723 | | | | 93 | | | | (27 | �� ) | | | 4,789 | | | United States | | | 4,718 | | | | 63 | | | | (51 | ) | | | 4,730 | |
| | | | | | | | | |
Brazil | | | 742 | | | | – | | | | – | | | | 742 | | | Brazil | | | 592 | | | | 2 | | | | (30 | ) | | | 564 | |
| | | | | | | | | |
China | | | 319 | | | | 4 | | | | (1 | ) | | | 322 | | | China | | | 460 | | | | 2 | | | | (14 | ) | | | 448 | |
| | | | | | | | | |
United Kingdom | | | 319 | | | | 2 | | | | (28 | ) | | | 293 | | | Mexico | | | 300 | | | | 48 | | | | (26 | ) | | | 322 | |
| | | | | | | | | |
Australia | | | 273 | | | | 4 | | | | – | | | | 277 | | | Australia | | | 298 | | | | – | | | | (2 | ) | | | 296 | |
| | | | | | | | | |
Other | | | 3,061 | | | | 35 | | | | (39 | ) | | | 3,057 | | | Other | | | 3,072 | | | | 34 | | | | (76 | ) | | | 3,030 | |
Total | | | $9,437 | | | | $138 | | | | $(95 | ) | | | $9,480 | | | Total | | | $9,440 | | | | $149 | | | | $(199 | ) | | | $9,390 | |
Financial Institutions Insurance
Financial institutions insurance provides Canadian banks with credit risk and payment risk mitigation on terms of generally less than one year. Within our financial institutions insurance product group, our primary risk lies with the credit rating of the foreign bank. At the end of 2016, our financial institutions insurance policies had outstanding $1,609 million (2015 – $2,575 million) of insurance exposure that was rated as investment grade and $2,291 million (2015 – $2,297 million) of insurance exposure rated as non-investment grade.
Additional risk can arise from significant transactions within a geographical region. The major concentrations of risk by country for the financial institutions product group, based on the total potential risk exposure, were as follows:
| | | | | | | | | | |
(in millions of Canadian dollars) | | Dec. 31, 2016 | | | | | Dec. 31, 2015 | |
Turkey | | | 1,011 | | | Turkey | | | 949 | |
| | | |
United Arab Emirates | | | 420 | | | Chile | | | 583 | |
| | | |
Brazil | | | 367 | | | Brazil | | | 580 | |
| | | |
Cayman Islands | | | 248 | | | United States | | | 248 | |
| | | |
United States | | | 233 | | | China | | | 245 | |
| | | |
Other | | | 1,621 | | | Other | | | 2,267 | |
Total | | | $3,900 | | | Total | | | $4,872 | |
Contract Insurance and Bonding
Contract insurance and bonding provides cover for sales on exposure terms usually greater than one year and includes export credit insurance and guarantees, performance guarantees and surety, extending cover for risks inherent in performance-related obligations. We issue performance security guarantees which provide coverage to the exporter’s bank for up to 100% of the guarantee value in the event of any call by the buyer. Financial security guarantees are issued to provide coverage to the exporter’s bank for up to 100% of the guarantee value in the event of any call by the supplier and foreign bank. These guarantees stipulate a recovery provision whereby the third party, the exporter, agrees to indemnify us should a payment be made under the guarantee. Unless otherwise stated, the indemnification agreement generally ranks as an unsecured liability of the exporter. Foreign exchange guarantees are also issued which provide a guarantee to secure the settlement risks associated with foreign exchange forward contracts.
Consolidated Financial Statements
The primary source of risk within the contract insurance and bonding product group is the credit rating of our policies’ obligors. We assign an internal risk rating to each policy’s obligor, based on a number of factors, including external credit rating and country of transaction.
The major concentrations of risk by internal risk rating based on the total insurance in force for the contract insurance and bonding product group were as follows:
| | | | | | | | |
(in millions of
Canadian dollars) | | Dec. 31, 2016 | | | Dec. 31, 2015 | |
Internal risk level | |
| Outstanding
risk exposure |
| |
| Outstanding
risk exposure |
|
AA to BBB- | | | 4,879 | | | | 5,592 | |
BB+ to B- | | | 3,171 | | | | 3,156 | |
CCC+ and below | | | 121 | | | | 158 | |
Total | | | $8,171 | | | | $8,906 | |
The largest concentrations of risk by country for the contract insurance and bonding product group, based on total insurance in force, were as follows:
| | | | | | | | | | | | | | | | | | | | |
(in millions of
Canadian dollars) | | | | | | | | | | | | | | Dec. 31, 2016 | |
| | | Contract
insurance and
bonding | | | Reinsurance
assumed | | | Insurance
guarantees | | | Reinsurance
ceded | | | Net contract
insurance and
bonding | |
Canada | | | 5 | | | | 467 | | | | 8,345 | | | | (899 | ) | | | 7,918 | |
Brazil | | | 4 | | | | 99 | | | | – | | | | – | | | | 103 | |
United States | | | 20 | | | | 19 | | | | 11 | | | | – | | | | 50 | |
United Arab Emirates | | | 14 | | | | – | | | | – | | | | – | | | | 14 | |
Israel | | | 7 | | | | – | | | | – | | | | – | | | | 7 | |
Other | | | 37 | | | | – | | | | 42 | | | | – | | | | 79 | |
Total | | | $87 | | | | $585 | | | | $8,398 | | | | $(899 | ) | | | $8,171 | |
| | | | | | | | | | | | | | | | | | | | |
(in millions of
Canadian dollars) | | | | | | | | | | | | | | Dec. 31, 2015 | |
| | | Contract
insurance and
bonding | | | Reinsurance
assumed | | | Insurance
guarantees | | | Reinsurance
ceded | | | Net contract
insurance and
bonding | |
Canada | | | – | | | | 455 | | | | 8,688 | | | | (583 | ) | | | 8,560 | |
Brazil | | | 4 | | | | 106 | | | | – | | | | – | | | | 110 | |
United States | | | 20 | | | | 29 | | | | 23 | | | | – | | | | 72 | |
Chile | | | 36 | | | | – | | | | – | | | | – | | | | 536 | |
China | | | 13 | | | | – | | | | – | | | | – | | | | 13 | |
Other | | | 62 | | | | – | | | | 53 | | | | – | | | | 115 | |
Total | | | $135 | | | | $590 | | | | $8,764 | | | | $(583 | ) | | | $8,906 | |
Contract insurance and bonding guarantees in force were as follows:
| | | | | | | | |
(in millions of Canadian dollars) | | Dec. 31, 2016 | | | Dec. 31, 2015 | |
Contract insurance and bonding: | | | | | | | | |
Performance security guarantees | | | 8,050 | | | | 8,473 | |
Foreign exchange guarantees | | | 346 | | | | 285 | |
Financial security guarantees | | | 2 | | | | 6 | |
Gross contract insurance and bonding guarantees | | | 8,398 | | | | 8,764 | |
Performance security guarantees ceded | | | (899) | | | | (583) | |
Contract insurance and bonding guarantees | | | $7,499 | | | | $8,181 | |
|
| EDC Annual Report 2016 117 |
Consolidated Financial Statements
Political Risk Insurance
Political risk insurance provides risk protection for equity and other investments abroad with the underwriting based primarily on political risks. Our risk assessment considers politically motivated events that may jeopardize our customers’ assets or income in a foreign market. As a baseline for our risk assessment of a given market, we assess the transfer and convertibility of local currency, expropriation risk as well as the risk of political violence. The policyholder can request coverage for multiple countries; however, our risk exposure is limited to the maximum liability of the policy.
Our largest country exposures for political risk insurance by total insurance in force were as follows:
| | | | | | | | | | | | | | | | | | | | | | | | | | | | | | | | | | |
(in millions of Canadian dollars) | | | | | | | | Dec. 31, 2016 | | | | | | | | | | | | | | Dec. 31, 2015 | |
| | | Political risk
insurance | | | Reinsurance
assumed | | | Reinsurance
ceded | | | Net
political risk
insurance | | | | | Political risk
insurance | | | Reinsurance
assumed | | | Reinsurance
ceded | | | Net
political risk
insurance | |
Venezuela | | | 379 | | | | – | | | | (20 | ) | | | 359 | | | Venezuela | | | 381 | | | | – | | | | (20 | ) | | | 361 | |
Trinidad and
Tobago | | | 334 | | | | – | | | | – | | | | 334 | | | Trinidad and Tobago | | | 336 | | | | – | | | | – | | | | 336 | |
China | | | 785 | | | | 242 | | | | (717 | ) | | | 310 | | | China | | | 809 | | | | 249 | | | | (738 | ) | | | 320 | |
Russia | | | 302 | | | | – | | | | – | | | | 302 | | | Russia | | | 304 | | | | – | | | | – | | | | 304 | |
Tunisia | | | 300 | | | | – | | | | – | | | | 300 | | | Qatar | | | 302 | | | | – | | | | – | | | | 302 | |
Qatar | | | 300 | | | | – | | | | – | | | | 300 | | | Tunisia | | | 300 | | | | – | | | | – | | | | 300 | |
Algeria | | | 300 | | | | – | | | | – | | | | 300 | | | Algeria | | | 300 | | | | – | | | | – | | | | 300 | |
Libya | | | 300 | | | | – | | | | – | | | | 300 | | | Libya | | | 300 | | | | – | | | | – | | | | 300 | |
Yemen | | | 300 | | | | – | | | | – | | | | 300 | | | Yemen | | | 300 | | | | – | | | | – | | | | 300 | |
Angola | | | 370 | | | | – | | | | (88 | ) | | | 282 | | | Angola | | | 380 | | | | – | | | | (90 | ) | | | 290 | |
Other | | | 9,386 | | | | 154 | | | | (6,816 | ) | | | 2,724 | | | Other | | | 9,987 | | | | – | | | | (7,132 | ) | | | 2,855 | |
| | | 13,056 | | | | 396 | | | | (7,641 | ) | | | 5,811 | | | | | | 13,699 | | | | 249 | | | | (7,980 | ) | | | 5,968 | |
Country limits in excess of policy limits | | | (10,500 | ) | | | (132 | ) | | | 6,213 | | | | (4,419 | ) | | Country limits in excess of policy limits | | | (11,049 | ) | | | – | | | | 6,477 | | | | (4,572 | ) |
Total | | | $2,556 | | | | $264 | | | | $(1,428 | ) | | | $1,392 | | | Total | | | $2,650 | | | | $249 | | | | $(1,503 | ) | | | $1,396 | |
Actuarial Calculation
Principal Risks
There is a limitation upon the accuracy of the premium and claims liabilities as there is an inherent uncertainty in any estimate of premium and claims liabilities. There is uncertainty in any estimate because future events could affect the ultimate claim amounts. Examples of future events include, but are not limited to:
| | (2) | higher than anticipated claim loss development; |
| | (3) | concentration of credit losses; and |
| | (4) | geo-political considerations. |
Therefore, the actual ultimate claim amount may differ materially from estimates. However, we have employed standard actuarial techniques and appropriate assumptions to mitigate this risk.
Consolidated Financial Statements
Key Assumptions
The key risk components to the insurance provisioning exercise are claim frequency, claim severity, future claim development and foreign exchange rates. These risk components are analyzed and estimated using EDC’s own loss experience. A qualitative component is added to these quantitative risk components as warranted by the external factors previously mentioned.
Sensitivity Analysis
The following table illustrates the impact on net income of variations in key risk components. A 10% change was applied to key risk components and the impact on premium and claims liabilities was quantified. The largest sensitivities pertain to claim frequency, claim severity and foreign exchange rates.
Key Risks Sensitivities
| | | | | | | | | | | | | | | | |
(in millions of Canadian dollars) | | | | | | | | | | | Dec. 31, 2016 | |
| | | Changes in
assumptions | | | Impact on
gross liabilities | | | Impact on
net liabilities | | | Impact on
net income | |
Frequency of claims | | | +10% | | | | 28 | | | | 22 | | | | (22 | ) |
Frequency of claims | | | -10% | | | | (29 | ) | | | (22 | ) | | | 22 | |
Severity of claims | | | +10% | | | | 36 | | | | 26 | | | | (26 | ) |
Severity of claims | | | -10% | | | | (37 | ) | | | (26 | ) | | | 26 | |
Foreign exchange rates | | | +10% | | | | 54 | | | | 37 | | | | (37 | ) |
Foreign exchange rates | | | -10% | | | | (45 | ) | | | (32 | ) | | | 32 | |
Claims development | | | +10% | | | | 8 | | | | 8 | | | | (8 | ) |
Claims development | | | -10% | | | | (8 | ) | | | (8 | ) | | | 8 | |
| | | | | | | | | | | | | | | | |
(in millions of Canadian dollars) | | | | | | | | | | | Dec. 31, 2015 | |
| | | Changes in
assumptions | | | Impact on
gross liabilities | | | Impact on
net liabilities | | | Impact on
net income | |
Frequency of claims | | | +10% | | | | 34 | | | | 23 | | | | (23 | ) |
Frequency of claims | | | -10% | | | | (35 | ) | | | (25 | ) | | | 25 | |
Severity of claims | | | +10% | | | | 33 | | | | 26 | | | | (26 | ) |
Severity of claims | | | -10% | | | | (37 | ) | | | (26 | ) | | | 26 | |
Foreign exchange rates | | | +10% | | | | 57 | | | | 39 | | | | (39 | ) |
Foreign exchange rates | | | -10% | | | | (47 | ) | | | (33 | ) | | | 33 | |
Claims development | | | +10% | | | | 8 | | | | 8 | | | | (8 | ) |
Claims development | | | -10% | | | | (8 | ) | | | (8 | ) | | | 8 | |
|
| EDC Annual Report 2016 119 |
Consolidated Financial Statements
Claims Development
As time passes, the ultimate cost for the claims becomes more certain. The chart below compares actual claims with previous estimates for the credit insurance portfolio:
| | | | | | | | | | | | | | | | | | | | | | | | |
(in millions of Canadian dollars) | | | | | | | | | | | | | | | | | | |
Underwriting Year | | | 2012 | | | | 2013 | | | | 2014 | | | | 2015 | | | | 2016 | | | | Total | |
Estimate of ultimate claims: | | | | | | | | | | | | | | | | | | | | | | | | |
At end of underwriting year | | | 38 | | | | 24 | | | | 37 | | | | 51 | | | | 60 | | | | | |
One year later | | | 29 | | | | 40 | | | | 74 | | | | 59 | | | | | | | | | |
Two years later | | | 28 | | | | 85 | | | | 63 | | | | | | | | | | | | | |
Three years later | | | 30 | | | | 84 | | | | | | | | | | | | | | | | | |
Four years later | | | 29 | | | | | | | | | | | | | | | | | | | | | |
Estimate of ultimate claims at Dec. 31, 2016 | | | 29 | | | | 84 | | | | 63 | | | | 59 | | | | 60 | | | | 295 | |
Cumulative incurred losses at Dec. 31, 2016 | | | (28 | ) | | | (80 | ) | | | (58 | ) | | | (45 | ) | | | (11 | ) | | | (222 | ) |
Effect of margin and discounting | | | – | | | | 2 | | | | 1 | | | | 2 | | | | 8 | | | | 13 | |
2012 – 2016 Claim Liabilities (IBNR) at Dec. 31, 2016 | | | 1 | | | | 6 | | | | 6 | | | | 16 | | | | 57 | | | | 86 | |
2002 – 2011 Claim Liabilities (IBNR) at Dec. 31, 2016 | | | | | | | | | | | | | | | | | | | | | | | 3 | |
2002 – 2016 Claim Liabilities (IBNR) at Dec. 31, 2016 | | | | | | | | | | | | | | | | | | | | | | | $89 | |
| | |
 | | Equity |
EDC’s authorized share capital is $3.0 billion consisting of 30 million shares with a par value of $100 each. The number of shares issued and fully paid is 13.3 million (2015 – 13.3 million). These shares entitle our shareholder to receive a dividend from time to time. No shares were issued in 2016 (2015 – nil). In 2016, a dividend of $500 million was paid to the Government of Canada (2015 – nil). The dividend per share in 2016 was $37.59 (2015 – nil).
| | |
 | | Capital Management |
EDC has a capital management process in place to ensure that we are appropriately capitalized and that our capital position is identified, measured, managed and regularly reported to the Board of Directors. We are not subject to externally imposed capital requirements.
Our primary objective with respect to capital management is to ensure that EDC has adequate capital to support the evolving needs of Canadian exporters and investors while remaining financially self-sustaining.
We manage our capital through a Board approved capital adequacy policy. Under our capital adequacy policy, we determine whether we have adequate capital by comparing the supply of capital to the demand for capital. The policy also includes an eligible dividend methodology to guide the Board of Directors in determining a potential dividend amount.
In 2016, we developed and implemented a new capital management framework under the Internal Capital Adequacy Assessment Process (ICAAP). Demand for capital, which is calculated by a model that estimates the capital required to cover the extreme value of potential losses, now includes pension plan risk, a new definition of business/strategic risk in addition to previously existing credit, market and operational components. The supply of capital is determined by our financial statements and consists of paid-in share capital and retained earnings and no longer includes allowances. Finally, our dividend policy compares our supply of capital at year-end to the demand of capital and now returns the capital surplus over a planning horizon of five years.
A key principle in our capital management is the establishment of a target solvency standard or credit rating which determines the level of demand for capital that is required to cover EDC’s exposures in exceptional circumstances. We target a level of capitalization sufficient to cover potential losses consistent with a rating standard of AA.
Consolidated Financial Statements
| | |
 | | Interest Rate Risk |
The following table summarizes our interest rate risk based on the gap between the notional amount of assets and liabilities grouped by the earlier of contractual re-pricing or maturity dates. Notional amounts reflect our true exposure to re-pricing at various maturities. The differences between the notional amounts and the carrying values, the positions not subject to re-pricing risk and equity are presented in the non-interest rate sensitive column to ensure comparability with the consolidated statement of financial position. The effective interest rates shown indicate historical rates for fixed rate and floating rate instruments.
| | | | | | | | | | | | | | | | | | | | | | | | | | | | |
(in millions of Canadian dollars) | | Immediately
rate-sensitive | | | Up to 6
months | | | Over 6 to 12
months | | | Over 1 to 5
years | | | Over 5
years | | | Non-interest
rate sensitive(1) | | | Dec. 31, 2016
Total | |
Assets | | | | | | | | | | | | | | | | | | | | | | | | | | | | |
Cash and marketable securities | | | 330 | | | | 3,334 | | | | 234 | | | | 2,656 | | | | 825 | | | | 10 | | | | 7,389 | |
Effective interest rate % | | | 0 | % | | | 0.59 | % | | | 1.29 | % | | | 1.68 | % | | | 2.02 | % | | | | | | | | |
Gross loans receivable | | | 523 | | | | 42,386 | | | | 898 | | | | 7,358 | | | | 3,173 | | | | 1,037 | | | | 55,375 | |
Effective interest rate % | | | 6.29 | % | | | 3.11 | % | | | 4.05 | % | | | 3.69 | % | | | 4.25 | % | | | | | | | | |
Less: | | | | | | | | | | | | | | | | | | | | | | | | | | | | |
Deferred revenue and other credits | | | – | | | | – | | | | – | | | | – | | | | – | | | | (361 | ) | | | (361 | ) |
Allowance for losses on loans | | | – | | | | – | | | | – | | | | – | | | | – | | | | (1,552 | ) | | | (1,552 | ) |
Investments at fair value through profit or loss | | | – | | | | – | | | | – | | | | – | | | | – | | | | 1,005 | | | | 1,005 | |
Other assets and accrued interest | | | – | | | | – | | | | – | | | | – | | | | – | | | | 1,268 | | | | 1,268 | |
Total assets | | | $853 | | | | $45,720 | | | | $1,132 | | | | $10,014 | | | | $3,998 | | | | $1,407 | | | | $63,124 | |
Liabilities and equity | | | | | | | | | | | | | | | | | | | | | | | | | | | | |
Loans payable | | | – | | | | 21,617 | | | | 3,458 | | | | 23,489 | | | | 351 | | | | 186 | | | | 49,101 | |
Effective interest rate % | | | – | | | | 0.96 | % | | | 1.45 | % | | | 1.60 | % | | | 2.54 | % | | | | | | | | |
Total pay side instruments on swap contracts | | | – | | | | 31,959 | | | | 269 | | | | 335 | | | | 663 | | | | 10,200 | | | | 43,426 | |
Effective interest rate % | | | – | | | | 1.11 | % | | | 0.75 | % | | | 4.18 | % | | | 2.42 | % | | | | | | | | |
Total receive side instruments on swap contracts | | | – | | | | (9,625 | ) | | | (3,458 | ) | | | (17,745 | ) | | | (1,014 | ) | | | (9,020 | ) | | | (40,862 | ) |
Effective interest rate % | | | – | | | | 0.35 | % | | | 1.45 | % | | | 1.79 | % | | | 2.44 | % | | | | | | | | |
Cumulative foreign exchange translation on cross currency interest rate
swaps(2) | | | – | | | | – | | | | – | | | | – | | | | – | | | | (2,564) | | | | (2,564 | ) |
Total loans payable | | | | | | | | | | | | | | | | | | | | | | | | | | | 49,101 | |
Other liabilities and deferred revenue | | | – | | | | – | | | | – | | | | – | | | | – | | | | 4,260 | | | | 4,260 | |
Equity | | | | | | | | | | | | | | | | | | | | | | | 9,763 | | | | 9,763 | |
Total liabilities and equity | | | $– | | | | $43,951 | | | | $269 | | | | $6,079 | | | | $– | | | | $12,825 | | | | $63,124 | |
At December 31, 2016 | | | | | | | | | | | | | | | | | | | | | | | | | | | | |
Total gap | | | 853 | | | | 1,769 | | | | 863 | | | | 3,935 | | | | 3,998 | | | | (11,418 | ) | | | – | |
Cumulative gap | | | 853 | | | | 2,622 | | | | 3,485 | | | | 7,420 | | | | 11,418 | | | | – | | | | – | |
Canadian dollar | | | 197 | | | | 2,007 | | | | 68 | | | | 524 | | | | 321 | | | | (3,117 | ) | | | – | |
Foreign currency | | | 656 | | | | (238 | ) | | | 795 | | | | 3,411 | | | | 3,677 | | | | (8,301 | ) | | | – | |
Total gap | | | $853 | | | | $1,769 | | | | $863 | | | | $3,935 | | | | $3,998 | | | | $(11,418 | ) | | | $– | |
| (1) | Included in non-interest rate sensitive amounts are the differences between the carrying amounts and the notional amounts, foreign exchange contracts and foreign exchange forwards not sensitive to interest rates. |
| (2) | Due to foreign exchange translation, the pay and receive side instruments may not net to zero. This amount represents the difference caused by foreign exchange translation on the pay and receive side instruments on swap contracts. |
|
| EDC Annual Report 2016 121 |
Consolidated Financial Statements
| | | | | | | | | | | | | | | | | | | | | | | | | | | | |
(in millions of Canadian dollars) | | Immediately
rate-sensitive | | | Up to 6
months | | | Over 6 to 12
months | | | Over 1 to 5
years | | | Over 5
years | | | Non-interest
rate sensitive(1) | | | Dec. 31, 2015
Total | |
Assets | | | | | | | | | | | | | | | | | | | | | | | | | | | | |
Cash and marketable securities | | | 438 | | | | 3,326 | | | | 149 | | | | 2,769 | | | | 967 | | | | 45 | | | | 7,694 | |
Effective interest rate % | | | 0 | % | | | 0.15 | % | | | 0.95 | % | | | 1.64 | % | | | 2.18 | % | | | | | | | | |
Gross loans receivable | | | 343 | | | | 41,406 | | | | 607 | | | | 6,487 | | | | 3,540 | | | | 943 | | | | 53,326 | |
Effective interest rate % | | | 5.68 | % | | | 2.59 | % | | | 4.67 | % | | | 4.16 | % | | | 3.60 | % | | | | | | | | |
Less: | | | | | | | | | | | | | | | | | | | | | | | | | | | | |
Deferred revenue and other credits | | | – | | | | – | | | | – | | | | – | | | | – | | | | (390) | | | | (390 | ) |
Allowance for losses on loans | | | – | | | | – | | | | – | | | | – | | | | – | | | | (1,715) | | | | (1,715 | ) |
Aircraft under finance leases | | | – | | | | 22 | | | | 20 | | | | 21 | | | | – | | | | 1 | | | | 64 | |
Effective interest rate % | | | – | | | | 7.48 | % | | | 7.33 | % | | | 7.28 | % | | | – | | | | | | | | | |
Investments at fair value through profit or loss | | | – | | | | – | | | | – | | | | – | | | | – | | | | 848 | | | | 848 | |
Other assets and accrued interest | | | – | | | | – | | | | – | | | | – | | | | – | | | | 1,142 | | | | 1,142 | |
Total assets | | | $781 | | | | $44,754 | | | | $776 | | | | $9,277 | | | | $4,507 | | | | $874 | | | | $60,969 | |
Liabilities and equity | | | | | | | | | | | | | | | | | | | | | | | | | | | | |
Loans payable | | | – | | | | 20,455 | | | | 3,999 | | | | 21,141 | | | | 1,057 | | | | 257 | | | | 46,909 | |
Effective interest rate % | | | – | | | | 0.94 | % | | | 0.97 | % | | | 1.85 | % | | | 3.44 | % | | | | | | | | |
Total pay side instruments on swap contracts | | | – | | | | 34,535 | | | | – | | | | – | | | | 306 | | | | 9,750 | | | | 44,591 | |
Effective interest rate % | | | – | | | | 0.80 | % | | | – | | | | – | | | | 2.94 | % | | | | | | | | |
Total receive side instruments on swap contracts | | | – | | | | (12,363 | ) | | | (3,279 | ) | | | (16,920 | ) | | | (762 | ) | | | (7,912) | | | | (41,236 | ) |
Effective interest rate % | | | – | | | | 1.72 | % | | | 0.99 | % | | | 1.96 | % | | | 3.97 | % | | | | | | | | |
Cumulative foreign exchange translation on cross currency interest rate swaps(2) | | | – | | | | – | | | | – | | | | – | | | | – | | | | (3,355) | | | | (3,355 | ) |
Total loans payable | | | | | | | | | | | | | | | | | | | | | | | | | | | 46,909 | |
Other liabilities and deferred revenue | | | – | | | | – | | | | – | | | | – | | | | – | | | | 4,895 | | | | 4,895 | |
Equity | | | | | | | | | | | | | | | | | | | | | | | 9,165 | | | | 9,165 | |
Total liabilities and equity | | | $– | | | | $42,627 | | | | $720 | | | | $4,221 | | | | $601 | | | | $12,800 | | | | $60,969 | |
At December 31, 2015 | | | | | | | | | | | | | | | | | | | | | | | | | | | | |
Total gap | | | 781 | | | | 2,127 | | | | 56 | | | | 5,056 | | | | 3,906 | | | | (11,926) | | | | – | |
Cumulative gap | | | 781 | | | | 2,908 | | | | 2,964 | | | | 8,020 | | | | 11,926 | | | | – | | | | – | |
Canadian dollar | | | 116 | | | | 1,319 | | | | 18 | | | | 152 | | | | 204 | | | | (1,809) | | | | – | |
Foreign currency | | | 665 | | | | 808 | | | | 38 | | | | 4,904 | | | | 3,702 | | | | (10,117) | | | | – | |
Total gap | | | $781 | | | | $2,127 | | | | $56 | | | | $5,056 | | | | $3,906 | | | | $(11,926) | | | | $– | |
| (1) | Included in non-interest rate sensitive amounts are the differences between the carrying amounts and the notional amounts, foreign exchange contracts and foreign exchange forwards not sensitive to interest rates. |
| (2) | Due to foreign exchange translation, the pay and receive side instruments may not net to zero. This amount represents the difference caused by foreign exchange translation on the pay and receive side instruments on swap contracts. |
Consolidated Financial Statements
| | |
 | | Foreign Currency Balances |
We have substantial assets and liabilities denominated in U.S. dollars and in other currencies. In addition, we have derivative instruments denominated in various currencies. The purpose of these derivative instruments is to manage the foreign currency exposures of our asset and liability positions, minimize our cost of capital and optimize our yields, while remaining within treasury guidelines and limits approved by our Board of Directors.
The following table shows where we used derivative instruments along with our net foreign currency exposure expressed in Canadian equivalent dollars:
| | | | | | | | | | | | | | | | | | | | | | | | | | | | | | | | |
(in millions of
Canadian dollars) | | | | | | | | | | | | | | | | | | | | | | | Dec. 31, 2016 | |
| | | Assets | | | Liabilities | | | Net foreign
currency
exposure | | | Foreign
exchange
rate | |
| | | Gross | | |
| Derivative
instruments |
| | | Net | | | | Gross | | |
| Derivative
instruments |
| | | Net | | | |
| | | | | | | | | |
U.S. dollar | | | 50,719 | | | | 784 | | | | 51,503 | | | | (39,967 | ) | | | (11,321 | ) | | | (51,288) | | | | 215 | | | | 1.3448 | |
| | | | | | | | |
Euro | | | 3,026 | | | | – | | | | 3,026 | | | | (1,172 | ) | | | (1,797 | ) | | | (2,969) | | | | 57 | | | | 1.4162 | |
| | | | | | | | |
Australian dollar | | | 2,113 | | | | – | | | | 2,113 | | | | (3,396 | ) | | | 1,293 | | | | (2,103) | | | | 10 | | | | 0.9706 | |
| | | | | | | | |
British pound | | | 807 | | | | 53 | | | | 860 | | | | (2,966 | ) | | | 2,099 | | | | (867) | | | | (7 | ) | | | 1.6581 | |
| | | | | | | | |
South African rand | | | 529 | | | | – | | | | 529 | | | | – | | | | (525 | ) | | | (525) | | | | 4 | | | | 0.0979 | |
| | | | | | | | |
Mexican peso | | | 500 | | | | – | | | | 500 | | | | – | | | | (493 | ) | | | (493) | | | | 7 | | | | 0.0652 | |
| | | | | | | | |
Colombian peso | | | 194 | | | | – | | | | 194 | | | | – | | | | (195 | ) | | | (195) | | | | (1 | ) | | | 0.0005 | |
| | | | | | | | |
Swedish krona | | | 123 | | | | – | | | | 123 | | | | – | | | | (120 | ) | | | (120) | | | | 3 | | | | 0.1477 | |
| | | | | | | | |
Czech koruna | | | 84 | | | | – | | | | 84 | | | | – | | | | (82 | ) | | | (82) | | | | 2 | | | | 0.0524 | |
| | | | | | | | |
New Zealand dollar | | | 78 | | | | – | | | | 78 | | | | (1,743 | ) | | | 1,667 | | | | (76) | | | | 2 | | | | 0.9346 | |
| | | | | | | | |
Polish zloty | | | 73 | | | | – | | | | 73 | | | | – | | | | (73 | ) | | | (73) | | | | – | | | | 0.3215 | |
| | | | | | | | |
Indian rupee | | | 65 | | | | – | | | | 65 | | | | – | | | | (75 | ) | | | (75) | | | | (10 | ) | | | 0.0198 | |
| | | | | | | | |
Norwegian kroner | | | 42 | | | | – | | | | 42 | | | | – | | | | (40 | ) | | | (40) | | | | 2 | | | | 0.1557 | |
| | | | | | | | |
Kazakhstan tenge | | | 3 | | | | – | | | | 3 | | | | – | | | | (3 | ) | | | (3) | | | | – | | | | 0.0040 | |
| | | | | | | | |
Japanese yen | | | 2 | | | | – | | | | 2 | | | | (6 | ) | | | 6 | | | | – | | | | 2 | | | | 0.0115 | |
| | | | | | | | |
Singapore dollar | | | 1 | | | | – | | | | 1 | | | | 1 | | | | – | | | | 1 | | | | 2 | | | | 0.9292 | |
| | | | | | | | |
Hong Kong dollar | | | 1 | | | | – | | | | 1 | | | | – | | | | – | | | | – | | | | 1 | | | | 0.1734 | |
| | | | | | | | |
Swiss franc | | | – | | | | – | | | | – | | | | (340 | ) | | | 340 | | | | – | | | | – | | | | 1.3213 | |
| | | | | | | | |
Chinese renminbi | | | – | | | | – | | | | – | | | | (262 | ) | | | 262 | | | | – | | | | – | | | | 0.1931 | |
| | | | | | | | |
| | | | | | | | | | | | | | | | | | | | | | | | | | | | | | | | | |
(in millions of
Canadian dollars) | | | | | | | | | | | | | | | | | | | | | | | Dec. 31, 2015 | |
| | | Assets | | | Liabilities | | | Net foreign currency
exposure | | | Foreign exchange
rate | |
| | | Gross | | | Derivative
instruments | | | Net | | | Gross | | | Derivative
instruments | | | Net | | | |
U.S. dollar | | | 51,173 | | | | 210 | | | | 51,383 | | | | (35,710 | ) | | | (15,822 | ) | | | (51,532) | | | | (149 | ) | | | 1.3837 | |
| | | | | | | | |
Euro | | | 2,377 | | | | – | | | | 2,377 | | | | (1,303 | ) | | | (1,073 | ) | | | (2,376) | | | | 1 | | | | 1.5037 | |
| | | | | | | | |
Australian dollar | | | 2,002 | | | | – | | | | 2,002 | | | | (3,756 | ) | | | 1,754 | | | | (2,002) | | | | – | | | | 1.0084 | |
| | | | | | | | |
British pound | | | 874 | | | | 1 | | | | 875 | | | | (3,687 | ) | | | 2,798 | | | | (889) | | | | (14 | ) | | | 2.0394 | |
| | | | | | | | |
South African rand | | | 478 | | | | – | | | | 478 | | | | – | | | | (475 | ) | | | (475) | | | | 3 | | | | 0.0894 | |
| | | | | | | | |
Mexican peso | | | 436 | | | | – | | | | 436 | | | | – | | | | (437 | ) | | | (437) | | | | (1 | ) | | | 0.0804 | |
| | | | | | | | |
New Zealand dollar | | | 281 | | | | – | | | | 281 | | | | (1,645 | ) | | | 1,364 | | | | (281) | | | | – | | | | 0.9455 | |
| | | | | | | | |
Swedish krona | | | 223 | | | | – | | | | 223 | | | | – | | | | (225 | ) | | | (225) | | | | (2 | ) | | | 0.1638 | |
| | | | | | | | |
Czech koruna | | | 88 | | | | – | | | | 88 | | | | – | | | | (87 | ) | | | (87) | | | | 1 | | | | 0.0556 | |
| | | | | | | | |
Polish zloty | | | 80 | | | | – | | | | 80 | | | | – | | | | (80 | ) | | | (80) | | | | – | | | | 0.3526 | |
| | | | | | | | |
Norwegian kroner | | | 53 | | | | – | | | | 53 | | | | (79 | ) | | | 27 | | | | (52) | | | | 1 | | | | 0.1564 | |
| | | | | | | | |
Tanzanian shilling | | | 11 | | | | – | | | | 11 | | | | – | | | | – | | | | – | | | | 11 | | | | 0.0006 | |
| | | | | | | | |
Japanese yen | | | 2 | | | | – | | | | 2 | | | | (6 | ) | | | 6 | | | | – | | | | 2 | | | | 0.0115 | |
| | | | | | | | |
Hong Kong dollar | | | 1 | | | | – | | | | 1 | | | | – | | | | – | | | | – | | | | 1 | | | | 0.1785 | |
| | | | | | | | |
Swiss franc | | | – | | | | – | | | | – | | | | (368 | ) | | | 369 | | | | 1 | | | | 1 | | | | 1.3841 | |
| | | | | | | | |
Chinese renminbi | | | – | | | | – | | | | – | | | | (659 | ) | | | 661 | | | | 2 | | | | 2 | | | | 0.2107 | |
|
| EDC Annual Report 2016 123 |
Consolidated Financial Statements
| | |
 | | Fair Value of Financial Instruments |
Fair value represents our estimation of the price that would be received to sell an asset or paid to transfer a liability in an orderly transaction between market participants at the measurement date.
As with any estimate, uncertainty is inherent due to the unpredictability of future events. In the case of estimating the fair value of our financial instruments, this uncertainty is magnified due to the large number of assumptions used and the wide range of acceptable valuation techniques. Estimates of fair values are based on market conditions at a certain point in time, and may not be reflective of future market conditions. Therefore, the estimates of the fair value of financial instruments outlined as follows do not necessarily reflect the actual values that may occur should the instruments be exchanged in the market.
| | | | | | | | | | | | | | | | | | | | |
| (in millions of Canadian dollars) | | Dec. 31, 2016 | | | Dec. 31, 2015 | | | | |
| | | Carrying value | | | Fair value | | | Carrying value | | | Fair value | | | | |
| | | | | |
Assets | | | | | | | | | | | | | | | | | | | | |
| | | | | |
Performing fixed rate loans* | | | 12,088 | | | | 12,190 | | | | 11,102 | | | | 11,299 | | | | | |
| | | | | |
Performing floating rate loans* | | | 41,114 | | | | 41,679 | | | | 39,972 | | | | 40,436 | | | | | |
Total performing loans receivable* | | | 53,202 | | | | 53,869 | | | | 51,074 | | | | 51,735 | | | | | |
| | | | | |
Impaired loans | | | 501 | | | | 501 | | | | 348 | | | | 348 | | | | | |
| | | | | |
Loans receivable and accrued interest and fees | | | 53,703 | | | | 54,370 | | | | 51,422 | | | | 52,083 | | | | | |
| | | | | |
Marketable securities | | | 7,059 | | | | 7,059 | | | | 7,256 | | | | 7,256 | | | | | |
| | | | | |
Derivative instruments | | | 324 | | | | 324 | | | | 350 | | | | 350 | | | | | |
| | | | | |
Investments at fair value through profit or loss | | | 1,005 | | | | 1,005 | | | | 848 | | | | 848 | | | | | |
| | | | | |
Recoverable insurance claims | | | 63 | | | | 63 | | | | 54 | | | | 54 | | | | | |
| | | | | |
Other assets | | | 156 | | | | 154 | | | | 110 | | | | 109 | | | | | |
| | | | | |
Liabilities | | | | | | | | | | | | | | | | | | | | |
| | | | | |
Accounts payable and other credits | | | 142 | | | | 145 | | | | 115 | | | | 121 | | | | | |
| | | | | |
Loans payable | | | 49,101 | | | | 49,019 | | | | 46,909 | | | | 46,904 | | | | | |
| | | | | |
Derivative instruments | | | 2,819 | | | | 2,819 | | | | 3,434 | | | | 3,434 | | | | | |
| | | | | |
Loan guarantees | | | 167 | | | | 123 | | | | 158 | | | | 120 | | | | | |
* Performing loans receivable includes accrued interest and fees receivable net of allowance for losses on loans, deferred loan revenue and other credits. | |
We have controls and policies in place to ensure that our valuations are appropriate and realistic. In general, the methodologies, models and assumptions used to measure the fair value of our financial assets and liabilities are determined by our Risk Management team, which is not involved in the initiation of the transactions. The models, valuation methodologies, and market-based parameters and inputs that are used are subject to regular review and validation, including a comparison with values from outside agencies. In limited circumstances where the valuation of a financial instrument is not independent from the initiation of the transaction, the resulting valuation is subject to review by a valuation committee. The valuation committee meets periodically. Instruments are reviewed and placed on the fair value hierarchy by the valuation committee before being fully implemented.
The assumptions and valuation techniques that we use to estimate fair values are as follows:
Loans Receivable
In order to estimate the fair value of our performing loans receivable (including accrued interest and fees receivable net of deferred loan revenue), we separate them into risk pools and calculate the net present value of principal and interest cash flows. The discount rates are obtained from yield curves for each risk pool and are specific to the credit risk and term to maturity associated with each principal and interest cash flow.
The fair value of impaired loans is considered to be equal to their carrying value. Once a loan has been assessed as impaired, the carrying value is reduced to reflect the present value of any estimated future cash flows discounted at the loan’s original effective interest rate.
Loans receivable valued using unobservable market inputs, such as yield curves for low credit-rated loans, are categorized as Level 3 in the fair value hierarchy.
Consolidated Financial Statements
Marketable Securities
We estimate the fair value of marketable securities using observable market prices. If such prices are not available, we determine the fair value by discounting future cash flows using an appropriate yield curve.
Investments at Fair Value Through Profit or Loss
Our approach to fair value measurement has been developed using International Private Equity and Venture Capital Valuation Guidelines. Depending on the type of direct investment, we estimate fair value using one of the following: market-based methodologies, such as the quoted share price from available market data, price of recent investment, multiples, or industry benchmarks; income-based methodologies such as discounted cash flows; or replacement cost-based methodology such as net assets. Our fund valuations are performed using their most recent published financial statements. The valuations are established by investment managers, reviewed by management and approved by an independent valuation committee that is comprised of representatives from our Risk Management and Finance groups. The valuation methods are constantly validated and calibrated through discussions with co-investors and market participants, taking into account all known market events.
In the process of assessing the fair value for certain investment instruments, estimates determined in a manner consistent with industry practice are employed in the models which cannot be directly observed in the market. EDC’s unobservable estimates are outlined in the table below:
| | | | | | | | |
| | | |
(in millions of Canadian dollars) | | | | | |
| Valuation technique | | Unobservable input | | Range (average) | |
| Fair value at
Dec. 31, 2016 |
(1) |
| | | |
Multiples | | Multiple (Sales or EBITDA(2)) | | 1.1 – 9.7(7.1) | | | 61 | |
| | | |
| | Liquidity Discount | | 25% – 25%(25%) | | | 5 | |
| | | |
| | Discount Rate | | 15% – 40%(26%) | | | 6 | |
Discounted Cash Flows | | Discount Rate | | 0% – 1%(1%) | | | 1 | |
|
(1) The valuation of an investment may use multiple unobservable inputs and therefore its fair value can be included multiple times in the fair value amounts. (2) Earnings before interest, taxes, depreciation and amortization. | |
Recoverable Insurance Claims
For the purpose of estimating their fair value, recoverable insurance claims are separated into groups of estimated time to recovery. The time to recovery of insurance claims is relatively short; therefore, the fair value is considered to be equal to the expected future cash flows.
Other Assets and Accounts Payable and Other Credits
The fair value of short-term other assets and accounts payable and other credits are assumed to equal their carrying value due to their short-term nature. For long-term other assets and accounts payable, we estimate fair value by discounting future cash flows using an appropriate yield curve.
Loans Payable
The fair value of our less complex loans payable is determined using the discounted cash flow method. Forward rates are used to value floating rate cash flows occurring in the future. Cash flows are discounted using the respective currency’s yield curve. Inputs to the models are market observable and may include interest rate yield curves and foreign exchange rates.
For our more complex loans payable which may include optionality, we estimate fair value using valuation models when independent market prices are not available. Inputs to these models include option volatilities and correlations in addition to interest rate yield curves and foreign exchange rates. All models are reviewed on a three year rotational basis and are calibrated automatically each time a model is employed in valuing a deal. Changes in fair value are analyzed every month.
EDC hedges its structured notes using interest rate and cross currency swaps that convert EDC’s obligations into floating rate notes. The receive leg of the swap mirrors the payment structure of EDC’s structured notes; thus, any slight inaccuracy in the derivation of expected future payments on EDC’s structured notes or their valuation is negated by the opposite valuation and derivation of the expected future payments from the receive leg of the swap.
Loans payable valued using unobservable inputs derived from market data, such as interest rate volatility for maturities greater than 15 years, are categorized as Level 3 in the fair value hierarchy.
|
| EDC Annual Report 2016 125 |
Consolidated Financial Statements
Derivative Instruments
Foreign exchange forwards and foreign exchange swaps are valued by discounting the notional amounts using the respective currency’s yield curve and converting the amounts using the spot Canadian dollar exchange rate.
Interest rate and cross currency interest rate swaps are valued using a discounted cash flow method. Forward rates are used to determine floating rate cash flows occurring in the future. Cash flows are discounted using the respective currency’s yield curve. Inputs to the models are market observable and may include interest rate yield curves and foreign exchange rates.
For more complex swaps which may include optionality, including cross currency interest rate swaps, interest rate swaps and non-deliverable forwards, the fair value is determined using models which are developed from recognized valuation techniques, validated and managed in the same manner as our more complex loans payable as described above. Credit default swaps are valued with the additional input of market based par credit default swap spreads or by using quoted prices from dealers where appropriate.
The valuations determined using the methodologies described above are adjusted for the credit risk of the counterparty where appropriate.
Derivative instruments valued using unobservable inputs derived by market data, such as interest rate volatility for maturities greater than 15 years, are categorized as Level 3 in the fair value hierarchy.
Loan Guarantees
We estimate the fair value of loan guarantees as the calculated allowance for losses before taking into account any deferred guarantee fee revenue already received. This represents management’s best estimate of probable credit losses and is based on the incurred loss model.
Fair Value Hierarchy
The following table presents the fair value hierarchy of our financial instruments based on whether the inputs to the valuation techniques are observable or unobservable.
| | |
› | | Level 1 – fair values are based on quoted prices (unadjusted) in active markets for identical assets or liabilities; |
| |
| › | | Level 2 – fair values are determined using inputs other than quoted prices included within Level 1 that are observable for the assets or liabilities, either directly (i.e. as prices) or indirectly (i.e. derived from prices); and |
| |
› | | Level 3 – fair values are determined using inputs for the assets or liabilities that are not based on observable market data (unobservable inputs). |
| | | | | | | | | | | | | | | | | | | | | | | | | | | | | | | | | | | | |
| | | | | | | | | |
(in millions of Canadian dollars) | | | | | | | | Dec. 31, 2016 | | | | | | | | | | | | Dec. 31, 2015 | | | | |
| | | Level 1 | | | Level 2 | | | Level 3 | | | Total | | | Level 1 | | | Level 2 | | | Level 3 | | | Total | | | | |
| | | | | | | | | |
Assets | | | | | | | | | | | | | | | | | | | | | | | | | | | | | | | | | | | | |
| | | | | | | | | |
Performing fixed rate loans | | | – | | | | 11,720 | | | | 470 | | | | 12,190 | | | | – | | | | 10,834 | | | | 465 | | | | 11,299 | | | | | |
| | | | | | | | | |
Performing floating rate loans | | | – | | | | 41,233 | | | | 446 | | | | 41,679 | | | | – | | | | 39,902 | | | | 534 | | | | 40,436 | | | | | |
Total performing loans receivable | | | – | | | | 52,953 | | | | 916 | | | | 53,869 | | | | – | | | | 50,736 | | | | 999 | | | | 51,735 | | | | | |
| | | | | | | | | |
Impaired loans | | | – | | | | 501 | | | | – | | | | 501 | | | | – | | | | 348 | | | | – | | | | 348 | | | | | |
| | | | | | | | | |
Loans receivable and accrued interest and fees | | | – | | | | 53,454 | | | | 916 | | | | 54,370 | | | | – | | | | 51,084 | | | | 999 | | | | 52,083 | | | | | |
| | | | | | | | | |
Marketable securities | | | 3,734 | | | | 3,325 | | | | – | | | | 7,059 | | | | 3,931 | | | | 3,325 | | | | – | | | | 7,256 | | | | | |
| | | | | | | | | |
Derivative instruments | | | – | | | | 297 | | | | 27 | | | | 324 | | | | – | | | | 267 | | | | 83 | | | | 350 | | | | | |
| | | | | | | | | |
Investments at fair value through profit or loss | | | – | | | | – | | | | 1,005 | | | | 1,005 | | | | 1 | | | | – | | | | 847 | | | | 848 | | | | | |
| | | | | | | | | |
Recoverable insurance claims | | | – | | | | – | | | | 63 | | | | 63 | | | | – | | | | – | | | | 54 | | | | 54 | | | | | |
| | | | | | | | | |
Other assets | | | 89 | | | | 65 | | | | – | | | | 154 | | | | 58 | | | | 51 | | | | – | | | | 109 | | | | | |
| | | | | | | | | |
Liabilities | | | | | | | | | | | | | | | | | | | | | | | | | | | | | | | | | | | | |
| | | | | | | | | |
Accounts payable and other credits | | | 99 | | | | 46 | | | | – | | | | 145 | | | | 65 | | | | 56 | | | | – | | | | 121 | | | | | |
| | | | | | | | | |
Loans payable | | | – | | | | 48,923 | | | | 96 | | | | 49,019 | | | | – | | | | 46,569 | | | | 335 | | | | 46,904 | | | | | |
| | | | | | | | | |
Derivative instruments | | | – | | | | 2,819 | | | | – | | | | 2,819 | | | | – | | | | 3,434 | | | | – | | | | 3,434 | | | | | |
| | | | | | | | | |
Loan guarantees | | | – | | | | 123 | | | | – | | | | 123 | | | | – | | | | 120 | | | | – | | | | 120 | | | | | |
Consolidated Financial Statements
The following table summarizes the reconciliation of Level 3 fair values between 2016 and 2015 for recoverable insurance claims, investments at fair value through profit or loss, loans payable designated at fair value through profit or loss and derivative instruments.
| | | | | | | | | | | | | | | | | | | | |
(in millions of Canadian dollars) | | | | | | | | | | | | | | Dec. 31, 2016 | |
| | | Recoverable
insurance
claims | | | Investments
at fair value
through profit
or loss | | | Loans payable
designated at fair
value through
profit or loss | | | Derivative
instruments | | | Total | |
Balance at beginning of year | | | 54 | | | | 847 | | | | (335 | ) | | | 83 | | | | 649 | |
| | | | | |
Increase in recoverable insurance claims | | | 10 | | | | – | | | | – | | | | – | | | | 10 | |
| | | | | |
Change in accrued interest | | | – | | | | – | | | | 47 | | | | (47 | ) | | | – | |
| | | | | |
Unrealized gains (losses) included in other (income) expenses | | | – | | | | 57 | | | | 13 | | | | (8 | ) | | | 62 | |
| | | | | |
Purchases of assets/issuances of liabilities | | | – | | | | 241 | | | | – | | | | – | | | | 241 | |
| | | | | |
Matured assets/liabilities | | | – | | | | – | | | | 166 | | | | – | | | | 166 | |
| | | | | |
Return of capital | | | – | | | | (125 | ) | | | – | | | | – | | | | (125 | ) |
| | | | | |
Foreign exchange translation | | | (1 | ) | | | (15 | ) | | | 13 | | | | (1 | ) | | | (4 | ) |
Balance at end of year | | | $63 | | | | $1,005 | | | | $(96 | ) | | | $27 | | | | $999 | |
Total gains (losses) for the year included in comprehensive income for instruments held at end of the year | | | $10 | | | | $(39 | ) | | | $(3 | ) | | | $(4 | ) | | | $(36 | ) |
| | | | | | | | | | | | | | | | | | | | |
(in millions of Canadian dollars) | | | | | | | | | | | | | | Dec. 31, 2015 | |
| | | Recoverable
insurance
claims | | | Investments
at fair value
through profit
or loss | | | Loans payable
designated at fair
value through
profit or loss | | | Derivative
instruments | | | Total | |
Balance at beginning of year | | | 33 | | | | 687 | | | | (292 | ) | | | 72 | | | | 500 | |
| | | | | |
Increase in recoverable insurance claims | | | 16 | | | | – | | | | – | | | | – | | | | 16 | |
| | | | | |
Change in accrued interest | | | – | | | | – | | | | (11 | ) | | | 11 | | | | – | |
| | | | | |
Unrealized gains (losses) included in other (income) expenses | | | – | | | | (15 | ) | | | 11 | | | | (13 | ) | | | (17 | ) |
| | | | | |
Purchases of assets/issuances of liabilities | | | – | | | | 218 | | | | – | | | | – | | | | 218 | |
| | | | | |
Matured assets/liabilities | | | – | | | | – | | | | 13 | | | | – | | | | 13 | |
| | | | | |
Return of capital | | | – | | | | (126 | ) | | | – | | | | – | | | | (126 | ) |
| | | | | |
Foreign exchange translation | | | 5 | | | | 83 | | | | (56 | ) | | | 13 | | | | 45 | |
Balance at end of year | | | $54 | | | | $847 | | | | $(335 | ) | | | $83 | | | | $649 | |
Total gains (losses) for the year included in comprehensive income for instruments held at end of the year | | | $16 | | | | $50 | | | | $(11 | ) | | | $15 | | | | $70 | |
Changes in valuation methods may result in transfers into or out of Levels 1, 2 and 3. No transfers occurred in 2016 (2015 – nil).
In 2016, a sensitivity analysis was performed using possible alternative assumptions to recalculate the fair value of our Level 3 financial instruments. The fair value of Level 3 financial instruments is in whole or in part based on unobservable inputs. In preparing financial statements, appropriate levels for these unobservable inputs parameters are chosen so that they are consistent with prevailing market evidence or management judgment.
In order to perform our sensitivity analysis, we adjusted the yield curve and volatility assumptions used to value our Level 3 loans payable and derivative assets. The results of our analysis on our Level 3 loans payable ranged from an unfavourable change of $1 million to a favourable change of $3 million. On our Level 3 derivative assets the impact ranged from an unfavourable change of $1 million to a favourable change of $0.1 million.
In order to perform our sensitivity analysis for our Level 3 investments, we adjusted the unobservable inputs. The unobservable inputs used to value our Level 3 investments include one or more of the following: recent investment factor, liquidity discount, multiples and discount rates. When multiple unobservable inputs are shocked, no netting is considered, resulting in the highest favourable or unfavourable change. The results of our analysis on our Level 3 investments ranged from an unfavourable change of $44 million to a favourable change of $50 million.
|
| EDC Annual Report 2016 127 |
Consolidated Financial Statements
| | |
 | | Financial Instrument Risks |
The principal risks that we are exposed to as a result of holding financial instruments are credit, market and liquidity risk.
Credit Risk
Credit risk is the risk of loss incurred if a counterparty fails to meet its financial commitments. We are exposed to credit risk on financial instruments under both our loans program and our treasury activities. Our objectives, policies and processes for managing credit risk as well as the methods we use to measure this risk are disclosed in the notes related to our derivative instruments and debt instruments, as well as in the text highlighted in management’s discussion and analysis on pages 71 to 73 of this annual report.
Concentration of Credit Risk
Concentration of credit risk exposure exists when a number of counterparties operate in the same geographical market or industry, or engage in similar activities. Changes in economic or political conditions may affect their ability to meet obligations in a similar manner. We have limits in place to ensure that our exposure is not overly concentrated in any one country, industry or counterparty. Exposure in excess of these limits requires the approval of our Board of Directors.
The following table provides a breakdown, by the country in which the risk resides, of the maximum gross exposure to credit risk of financial instruments:
| | | | | | | | | | | | | | | | | | | | | | | | | | | | | | | | | | | | |
(in millions of
Canadian dollars) | | Gross loans
receivable | | | Loan
guarantees | | | Investments | | | Marketable
securities and
derivative
instruments* | | | Risk
transfer | | | Dec. 31, 2016
Exposure | | | Dec. 31, 2015 Exposure | |
Country | | | | | | | | | | | | | | | | | | | | | | | $ | | | | % | | | | $ | | | | % | |
United States | | | 11,048 | | | | 508 | | | | 22 | | | | 5,427 | | | | 215 | | | | 17,220 | | | | 26 | | | | 17,773 | | | | 28 | |
| | | | | | | | | |
Canada | | | 6,353 | | | | 1,497 | | | | 451 | | | | 1,469 | | | | 113 | | | | 9,883 | | | | 15 | | | | 8,922 | | | | 14 | |
| | | | | | | | | |
United Kingdom | | | 2,102 | | | | 3 | | | | 1 | | | | 229 | | | | 1,719 | | | | 4,054 | | | | 6 | | | | 3,981 | | | | 6 | |
| | | | | | | | | |
Australia | | | 3,220 | | | | – | | | | – | | | | 163 | | | | – | | | | 3,383 | | | | 5 | | | | 3,697 | | | | 6 | |
| | | | | | | | | |
Brazil | | | 3,841 | | | | 29 | | | | 57 | | | | – | | | | (634 | ) | | | 3,293 | | | | 5 | | | | 3,646 | | | | 6 | |
| | | | | | | | | |
India | | | 2,694 | | | | 1 | | | | 150 | | | | – | | | | (302 | ) | | | 2,543 | | | | 4 | | | | 1,859 | | | | 3 | |
| | | | | | | | | |
Saudi Arabia | | | 2,290 | | | | – | | | | – | | | | – | | | | – | | | | 2,290 | | | | 3 | | | | 1,659 | | | | 2 | |
| | | | | | | | | |
Mexico | | | 3,072 | | | | 47 | | | | 26 | | | | – | | | | (1,062 | ) | | | 2,083 | | | | 3 | | | | 2,550 | | | | 4 | |
| | | | | | | | | |
Chile | | | 2,353 | | | | – | | | | – | | | | – | | | | (363 | ) | | | 1,990 | | | | 3 | | | | 2,193 | | | | 3 | |
| | | | | | | | | |
China | | | 1,595 | | | | 4 | | | | 185 | | | | – | | | | – | | | | 1,784 | | | | 3 | | | | 1,310 | | | | 2 | |
| | | | | | | | | |
Other | | | 16,807 | | | | 425 | | | | 113 | | | | 425 | | | | 314 | | | | 18,084 | | | | 27 | | | | 16,815 | | | | 26 | |
Total | | | $55,375 | | | | $2,514 | | | | $1,005 | | | | $7,713 | | | | $– | | | | $66,607 | | | | 100 | | | | $64,405 | | | | 100 | |
* Includes cash. The concentration of credit risk by industry sector for our financial instruments was as follows: | |
(in millions of
Canadian dollars) | | Gross loans
receivable | | | Loan
guarantees | | | Investments | | | Marketable
securities and
derivative
instruments* | | | Risk
transfer | | | Dec.31, 2016
Exposure | | | Dec.31, 2015 Exposure | |
Industry | | | | | | | | | | | | | | | | | | | | | | | $ | | | | % | | | | $ | | | | % | |
Commercial: | | | | | | | | | | | | | | | | | | | | | | | | | | | | | | | | | | | | |
| | | | | | | | | |
Aerospace | | | 13,092 | | | | 96 | | | | – | | | | – | | | | (99 | ) | | | 13,089 | | | | 20 | | | | 13,695 | | | | 21 | |
| | | | | | | | | |
Financial institutions | | | 4,278 | | | | 5 | | | | – | | | | 2,282 | | | | 3,066 | | | | 9,631 | | | | 15 | | | | 8,452 | | | | 13 | |
| | | | | | | | | |
Oil and gas | | | 10,666 | | | | 266 | | | | 15 | | | | – | | | | (2,028 | ) | | | 8,919 | | | | 13 | | | | 9,290 | | | | 14 | |
| | | | | | | | | |
Mining | | | 8,421 | | | | 101 | | | | 3 | | | | – | | | | (739 | ) | | | 7,786 | | | | 12 | | | | 7,480 | | | | 12 | |
| | | | | | | | | |
Information and communication technology | | | 5,785 | | | | 395 | | | | 307 | | | | – | | | | (355 | ) | | | 6,132 | | | | 9 | | | | 5,039 | | | | 8 | |
| | | | | | | | | |
Surface Transportation | | | 5,201 | | | | 615 | | | | – | | | | 44 | | | | – | | | | 5,860 | | | | 9 | | | | 5,828 | | | | 9 | |
| | | | | | | | | |
Infrastructure and Environment | | | 4,170 | | | | 279 | | | | 227 | | | | – | | | | – | | | | 4,676 | | | | 7 | | | | 4,212 | | | | 7 | |
| | | | | | | | | |
Other | | | 2,453 | | | | 668 | | | | 453 | | | | – | | | | – | | | | 3,574 | | | | 5 | | | | 3,312 | | | | 5 | |
| | | | | | | | | |
Total commercial | | | 54,066 | | | | 2,425 | | | | 1,005 | | | | 2,326 | | | | (155 | ) | | | 59,667 | | | | 90 | | | | 57,308 | | | | 89 | |
| | | | | | | | | |
Sovereign | | | 1,309 | | | | 89 | | | | – | | | | 5,387 | | | | 155 | | | | 6,940 | | | | 10 | | | | 7,097 | | | | 11 | |
Total | | | $55,375 | | | | $2,514 | | | | $1,005 | | | | $7,713 | | | | $– | | | | $66,607 | | | | 100 | | | | $64,405 | | | | 100 | |
Consolidated Financial Statements
Market Risk
Market risk is the risk that the fair value or future cash flows of a financial instrument will fluctuate because of changes in market prices. Market risk comprises three types of risks: foreign exchange risk, interest rate risk and other price risk. We are exposed to potential negative impacts on the value of financial instruments resulting from adverse movements in interest and foreign exchange rates. We have policies and procedures in place to ensure that interest rate and foreign exchange risks are identified, measured, managed and regularly reported to management and the Board of Directors.
Interest Rate Risk
Interest rate risk is the risk that the fair value or future cash flows of a financial instrument will fluctuate because of changes in market interest rates. We are exposed to potential adverse impacts on the value of financial instruments resulting from differences in the maturities or repricing dates of assets and liabilities, as well as from embedded optionality in those assets and liabilities.
Foreign Exchange Risk
Foreign exchange risk is the potential adverse impact on the value of financial instruments resulting from exchange rate movements. We are exposed to foreign exchange rate risk when there is a mismatch between assets and liabilities in any currency.
Our objectives, policies and processes for managing market risk as well as a sensitivity analysis for our exposure to both interest rate and foreign exchange risk are disclosed in the text and tables highlighted in management’s discussion and analysis on pages 73 to 74 of this annual report.
Liquidity Risk
Liquidity risk is the risk that we would be unable to honour daily cash commitments or the risk that we would have to obtain funds rapidly, possibly at an excessively high premium during severe market conditions. We maintain liquidity through a variety of methods such as holding cash and marketable securities and having access to commercial paper markets.
Our objectives, policies and processes for managing liquidity risk as well as the methods we use to measure this risk are disclosed in the text and tables highlighted in management’s discussion and analysis on page 75 of this annual report.
| | |
 | | Structured Entities |
A structured entity (SE) is defined as an entity created to accomplish a narrow and well-defined objective. Under IFRS 10 – Consolidated Financial Statements, when a reporting entity has power over a SE and is exposed, or has rights to variable returns from its involvement with a SE and has the ability to affect those returns through its power over the SE, the reporting entity is considered to have control over the SE which must be consolidated within the reporting entity’s financial statements. When the reporting entity does not control the SE, consolidation is not required under IFRS 10.
Consolidated Structured Entities
In the 2005 to 2012 timeframe, we foreclosed on a number of aircraft loans and as a result, various aircraft for which we were a secured lender were returned to us. Since 2006, these aircraft were placed into trusts which are considered to be SEs that we control under IFRS.
These trusts have, therefore, been consolidated and had total assets of $13 million at the end of 2016 (2015 – $79 million).
The following table illustrates the total assets of consolidated SEs within the financial statements of EDC:
| | | | | | | | |
(in millions of Canadian dollars) | | Dec. 31, 2016 | | | Dec. 31, 2015 | |
Assets held-for-sale(1) | | | 13 | | | | 15 | |
| | |
Net investment in aircraft under finance leases(2) | | | – | | | | 64 | |
Total assets of consolidated SEs | | | $13 | | | | $79 | |
|
| EDC Annual Report 2016 129 |
Consolidated Financial Statements
Unconsolidated Structured Entities
In the normal course of business, we sometimes provide financing and in some cases guarantees to equity investors via SEs, typically in the transportation and extractive sectors. As we do not control these entities, they do not require consolidation under IFRS 10. The following table summarizes our maximum exposure to loss for transactions structured through SEs as well as the carrying values recognized in the consolidated statement of financial position of EDC’s interest in these unconsolidated SEs.
| | | | | | | | |
(in millions of Canadian dollars) | | Dec. 31, 2016 | | | Dec. 31, 2015 | |
| | |
SEs included in the consolidated statement of financial position | | | | | | | | |
| | |
Loans receivable | | | 14,391 | | | | 13,702 | |
| | |
Allowance for losses on loans | | | (421 | ) | | | (496) | |
Net loans receivable | | | 13,970 | | | | 13,206 | |
| | |
Fund investments | | | 890 | | | | 757 | |
Maximum exposure in the consolidated statement of financial position | | | 14,860 | | | | 13,963 | |
| | |
Commitments and guarantees | | | | | | | | |
| | |
Commitments | | | | | | | | |
| | |
Signed loan agreements | | | 1,354 | | | | 1,305 | |
| | |
Letters of offer | | | 28 | | | | 1,247 | |
| | |
Fund investments | | | 902 | | | | 887 | |
| | |
Guarantees provided to equity holders | | | 337 | | | | 393 | |
Maximum exposure to commitments and guarantees | | | 2,621 | | | | 3,832 | |
Maximum exposure to structured entities | | | $17,481 | | | | $17,795 | |
As disclosed in Note 20, there are two types of loan commitments related to transactions structured through SEs. The first type is undisbursed amounts on signed loan agreements which are immediately available to the obligor for drawdown subject to continued adherence to contractual covenants established under the financing agreements. The second type is loan commitments for which terms related to the transaction, such as interest rate type and disbursement schedule, have not yet been determined and which are currently anticipated to be structured through SEs. This category of commitments includes letters of offer accepted and outstanding.
We invest in funds which are pooled investment vehicles structured as limited partnerships and financed by the limited partners. These funds invest primarily in private or public companies and are considered to be SEs.
| | |
 | | Loan Revenue |
| | | | | | | | |
(in millions of Canadian dollars) | | 2016 | | | 2015 | |
Loan interest – floating rate | | | 1,114 | | | | 840 | |
| | |
Loan interest – fixed rate | | | 417 | | | | 420 | |
| | |
Loan fee revenue | | | 165 | | | | 200 | |
| | |
Impaired revenue | | | 19 | | | | 9 | |
| | |
Other loan revenue | | | 5 | | | | 6 | |
Total loan revenue | | | $1,720 | | | | $1,475 | |
| | |
 | | Marketable Securities Revenue |
| | | | | | | | |
(in millions of Canadian dollars) | | 2016 | | | 2015 | |
Short-term instruments | | | 13 | | | | 7 | |
| | |
Long-term instruments | | | 60 | | | | 53 | |
Total marketable securities revenue | | | $73 | | | | $60 | |
Consolidated Financial Statements
| | |

| | Interest Expense |
| | | | | | | | |
(in millions of Canadian dollars) | | 2016 | | | 2015 | |
Loans payable and related derivatives | | | | | | | | |
| | |
Short-term payables | | | 117 | | | | 59 | |
| | |
Long-term payables – floating | | | 254 | | | | 103 | |
| | |
Long-term payables – fixed* | | | 84 | | | | 64 | |
Total interest expense on loans payable and related derivatives | | | 455 | | | | 226 | |
| | |
Interest income on swaps related to capital | | | (7 | ) | | | (45 | ) |
| | |
Other | | | 2 | | | | 2 | |
Total interest expense | | | $450 | | | | $183 | |
* Includes interest expense for debt classified at amortized cost of $93 million (2015 – $80 million). | |
| | |

| | Leasing and Financing Related Expenses |
| | | | | | | | |
(in millions of Canadian dollars) | | 2016 | | | 2015 | |
Risk mitigation expense | | | 30 | | | | 23 | |
| | |
Maintenance and technical costs | | | 1 | | | | 1 | |
| | |
Other | | | 6 | | | | 4 | |
Total leasing and financing related expenses | | | $37 | | | | $28 | |
| | |

| | Net Insurance Premiums and Guarantee Fees |
| | | | | | | | | | | | | | | | | | | | | | | | | | | | | | | | |
(in millions of Canadian dollars) | | | | | | | | | | | Dec. 31, 2016 | | | | | | | | | Dec. 31, 2015 | |
| | | Direct
premiums
and guarantee
fees | | | Reinsurance
premiums
assumed | | | Reinsurance
premiums
ceded | | | Net premiums
and guarantee
fees | | | Direct
premiums
and guarantee
fees | | | Reinsurance
premiums
assumed | | | Reinsurance
premiums
ceded | | | Net premiums
and guarantee
fees | |
Credit insurance | | | 105 | | | | 3 | | | | (7) | | | | 101 | | | | 108 | | | | 2 | | | | (6 | ) | | | 104 | |
| | | | | | | | |
Financial institutions insurance | | | 21 | | | | – | | | | (1) | | | | 20 | | | | 19 | | | | – | | | | (2 | ) | | | 17 | |
| | | | | | | | |
Contract insurance and bonding | | | 68 | | | | 4 | | | | (10) | | | | 62 | | | | 59 | | | | 3 | | | | (7 | ) | | | 55 | |
| | | | | | | | |
Political risk insurance | | | 29 | | | | (1 | ) | | | (19) | | | | 9 | | | | 31 | | | | 2 | | | | (15 | ) | | | 18 | |
Total | | | $223 | | | | $6 | | | | $(37) | | | | $192 | | | | $217 | | | | $7 | | | | $(30 | ) | | | $194 | |
|
| EDC Annual Report 2016 131 |
Consolidated Financial Statements
| | |
 | | Provision for (Reversal of) Credit Losses |
The composition of the reversal of credit losses, expressed on the consolidated statement of comprehensive income, was as follows:
| | | | | | | | |
(in millions of Canadian dollars) | | 2016 | | | 2015 | |
Credit migration(1) | | | 37 | | | | 551 | |
| | |
Updated probability of default and loss given default models(2) | | | (137 | ) | | | – | |
| | |
Decreased (increased) concentration threshold | | | (9 | ) | | | 1 | |
| | |
Changes in portfolio composition(3) | | | 78 | | | | (114 | ) |
| | |
Other | | | – | | | | (1 | ) |
Provision for (reversal of) credit losses | | | $(31 | ) | | | $437 | |
(1) Includes a market overlay for the extractive sector of nil (2015 – $265 million). Refer to Note 6. (2) Refer to Note 6. (3) Represents provision requirement (release) as a result of repayments, performing loan sales, disbursements and new financing commitments. Also includes the impact of changes in collateral values for our secured loans as these impacts should be considered in conjunction with the impact of the repayments on these loans. | |
| | | | | | | | |
(in millions of Canadian dollars) | | 2016 | | | 2015 | |
Provision for (reversal of) losses on loans | | | (4 | ) | | | 381 | |
| | |
Provision for (reversal of) losses on loan commitments | | | (30 | ) | | | 61 | |
| | |
Provision for (reversal of) losses on loan guarantees | | | 3 | | | | (5 | ) |
Provision for (reversal of) credit losses | | | $(31 | ) | | | $437 | |
| | |

| | Claims-Related Expenses |
The composition of the claims-related expenses expressed on the consolidated statement of comprehensive income, was as follows:
| | | | | | | | |
(in millions of Canadian dollars) | | 2016 | | | 2015 | |
Claims paid | | | 110 | | | | 143 | |
| | |
Claims recovered | | | (14 | ) | | | (15 | ) |
| | |
Claims recovered from reinsurers | | | (9 | ) | | | – | |
| | |
Actuarial decrease in the net allowance for claims on insurance* | | | (33 | ) | | | (55 | ) |
| | |
Increase in recoverable insurance claims | | | (10 | ) | | | (16 | ) |
| | |
Claims handling expenses | | | 2 | | | | 2 | |
Total claims-related expenses | | | $46 | | | | $59 | |
| | |

| | Other (Income) Expenses |
| | | | | | | | |
(in millions of Canadian dollars) | | 2016 | | | 2015 | |
Net realized and unrealized loss on derivatives related to loans payable | | | 89 | | | | 97 | |
| | |
Net realized and unrealized gain on loans payable designated at fair value through profit or loss | | | (30 | ) | | | (189 | ) |
| | |
Net realized and unrealized gain on investments at fair value through profit or loss | | | (40 | ) | | | (51 | ) |
| | |
Net realized and unrealized loss on marketable securities at fair value through profit or loss | | | 19 | | | | 13 | |
| | |
(Gain) loss on sale of aircraft* | | | 21 | | | | (45 | ) |
| | |
Foreign exchange translation (gain) loss | | | 9 | | | | (11 | ) |
| | |
Other | | | 8 | | | | (14 | ) |
Total other (income) expenses | | | $76 | | | $ | (200 | ) |
* Refer to Notes 8 and 9.
Consolidated Financial Statements
| | |

| | Administrative Expenses |
| | | | | | | | |
(in millions of Canadian dollars) | | 2016 | | | 2015 | |
Salaries and benefits | | | 198 | | | | 180 | |
| | |
Pension, other retirement and post-employment benefits | | | 50 | | | | 54 | |
| | |
Occupancy | | | 27 | | | | 24 | |
| | |
Amortization and depreciation | | | 25 | | | | 24 | |
| | |
Professional services | | | 20 | | | | 12 | |
| | |
Marketing and communications | | | 17 | | | | 17 | |
| | |
Travel | | | 8 | | | | 7 | |
| | |
Other | | | 40 | | | | 33 | |
Total administrative expenses | | $ | 385 | | | $ | 351 | |
| | |

| | Retirement Benefit Obligations |
Pension Plans
The Registered Pension Plan (RPP) was established on April 24, 2000 as a defined benefit plan (DB) and, effective January 1, 2012, a defined contribution (DC) component was added. The RPP is registered under the Pension Benefits Standards Act (PBSA) with the Office of the Superintendent of Financial Institutions (OSFI) Canada. As a registered pension plan as defined under the Income Tax Act (ITA), the RPP is not subject to income taxes for the contributions or investment income.
For employees hired prior to January 1, 2012, the DB component of the RPP provides a benefit based on years of pensionable service and the best consecutive five year average pensionable earnings. Employee and employer contributions are pooled into a fund and the employer directs the investments. Upon retirement, the benefits are fully indexed to inflation and paid from the fund.
For employees hired on or after January 1, 2012, the DC component of the RPP provides a benefit that is the accumulation of employee and employer contributions and investment income in the employee’s account. Employees choose to contribute a fixed percentage up to a maximum of 6% of their pensionable earnings, which is matched by the employer based on the employee’s age and years of eligible service. The contributions are invested as directed by each employee from a selection of available investment options.
When the RPP was established, the Supplementary Retirement Plan (SRP) was also created, the purpose of which is to supplement benefits for members whose benefits and/or contributions under the RPP are affected by ITA maximums. The SRP increases their benefits to the level which would be payable under the RPP if these maximums did not apply. The RPP and SRP defined benefit plans’ durations are 21 and 20 years. Effective January 1, 2012, a DC component was added.
A number of administrative amendments were made to the pension plan in 2016. The most significant amendment was adding the Pooled Retirement Pension Plan (PRPP) as a vehicle for transfers to comply with the PBSA.
Other Benefit Plans
We maintain a closed retiring allowance program (service accumulation ceased July 1, 2013) and provide certain life insurance, health and dental care benefits to retired employees who qualify. These plans’ durations are 23 years and are funded as the cost of benefits is incurred. Costs are accrued based on actuarial calculations.
Plans’ Governance Structure
EDC’s pension governance structure is comprised of the Human Resources Committee of the Board (HRC) and two management groups. The first management group, the Management Pension Committee (MPC), is at the executive level, and the second, the Pension Working Group (PWG), is at the operational level.
The HRC has oversight responsibilities with respect to pension plan design, amendments, funding, asset mix, investment structure and appointments or terminations of investment managers. In addition, the HRC reviews investment policies, goals and performance and also seeks and receives assurances from management on pension matters that have been delegated.
The MPC has authority for all decisions about the pension that have not been retained by the HRC. The MPC provides recommendations to the HRC for plan design changes, monitors funds’ investment performance and meets with the investment managers on a periodic basis. The MPC approves changes to plan custodians, oversees and supports pension activities undertaken by the PWG. The PWG is responsible for implementing policies, managing and monitoring fund operations and undertaking day to day operational functions. The PWG consists of EDC personnel with full or part time responsibility for pension matters and includes representatives from Human Resources and Finance.
|
| EDC Annual Report 2016 133 |
Consolidated Financial Statements
Risk Mitigation
The RPP’s and the SRP’s investment portfolios are subject to a variety of financial instrument risks that could adversely affect the cash flows, financial position and income of the Plans. The Plans’ financial risk is concentrated in their investment holdings and includes credit risk, liquidity risk and market risk. The exposure to these risks is not considered to be significant or unusual. The Plans’ Statements of Investment Policies and Procedures (SIPP) prescribe an asset mix policy, require portfolio investment diversification and limit exposure to individual investments and major asset classes to reduce the level of risk associated with the Plans. The SIPPs are reviewed at least annually and investment principles and beliefs are revisited periodically to ensure that changes to the investment policies are made if required.
Funding Risk
Funding risk is the risk that the investment asset growth and contribution rates of the pension plan will not be sufficient to cover the pension obligations, resulting in unfunded liabilities. In accordance with regulatory requirements, if any unfunded liabilities exist, special contributions are required over specified future periods in order to reduce any deficit determined by the actuarial valuation process. The most significant contributors to funding risk are fluctuations in discount rates and returns on assets.
Other Risks
The DB obligation is subject to measurement uncertainty due to the use of actuarial assumptions such as discount rates, mortality rates, rate of compensation increases as well as withdrawal and retirement rates. The impact of these factors on the pension plan and other post-employment benefits can be significant and volatile at times.
The following table presents a reconciliation of the net asset and obligation of the DB plans, including the present value of the DB retirement benefit obligations and the fair value of plan assets:
| | | | | | | | | | | | | | | | | | | | | | | | | | | | | | | | |
(in millions of Canadian dollars) | | | | | | | | Dec. 31, 2016 | | | Dec. 31, 2015 | |
| | | Registered
Pension
Plan | | | Supplementary
Retirement
Plan | | | Other
benefit
plans | | | Total | | | Registered
Pension
Plan | | | Supplementary
Retirement
Plan | | | Other
benefit
plans | | | Total | |
| | | | | | | | |
Defined benefit obligation: | | | | | | | | | | | | | | | | | | | | | | | | | | | | | | | | |
| | | | | | | | |
Obligation beginning of year | | | 895 | | | | 74 | | | | 216 | | | | 1,185 | | | | 855 | | | | 66 | | | | 198 | | | | 1,119 | |
| | | | | | | | |
Current service costs | | | 27 | | | | 3 | | | | 6 | | | | 36 | | | | 28 | | | | 2 | | | | 8 | | | | 38 | |
| | | | | | | | |
Interest cost on benefit obligation | | | 38 | | | | 3 | | | | 9 | | | | 50 | | | | 37 | | | | 3 | | | | 10 | | | | 50 | |
| | | | | | | | |
Employee contributions | | | 9 | | | | – | | | | – | | | | 9 | | | | 8 | | | | – | | | | – | | | | 8 | |
| | | | | | | | |
Actuarial (gain) loss from changes in plan experience | | | (6 | ) | | | 3 | | | | – | | | | (3 | ) | | | 12 | | | | 7 | | | | (28 | ) | | | (9 | ) |
| | | | | | | | |
Actuarial (gain) loss from changes in financial assumptions | | | – | | | | 3 | | | | 4 | | | | 7 | | | | (27 | ) | | | (3 | ) | | | 2 | | | | (28 | ) |
| | | | | | | | |
Actuarial loss from changes in demographic assumptions | | | – | | | | – | | | | – | | | | – | | | | – | | | | – | | | | 28 | | | | 28 | |
| | | | | | | | |
Benefits paid | | | (21 | ) | | | (1 | ) | | | (2 | ) | | | (24 | ) | | | (18 | ) | | | (1 | ) | | | (2 | ) | | | (21 | ) |
Obligation at end of
year(1) | | | 942 | | | | 85 | | | | 233 | | | | 1,260 | | | | 895 | | | | 74 | | | | 216 | | | | 1,185 | |
| | | | | | | | |
Fair value of plan assets: | | | | | | | | | | | | | | | | | | | | | | | | | | | | | | | | |
| | | | | | | | |
Fair value at beginning of year | | | 892 | | | | 68 | | | | – | | | | 960 | | | | 801 | | | | 60 | | | | – | | | | 861 | |
| | | | | | | | |
Interest income on plan assets | | | 37 | | | | 3 | | | | – | | | | 40 | | | | 35 | | | | 3 | | | | – | | | | 38 | |
| | | | | | | | |
Return on plan assets, excluding interest income on plan assets | | | 30 | | | | – | | | | – | | | | 30 | | | | 14 | | | | 1 | | | | – | | | | 15 | |
| | | | | | | | |
Employer contributions | | | 39 | | | | 8 | | | | 2 | | | | 49 | | | | 54 | | | | 5 | | | | 2 | | | | 61 | |
| | | | | | | | |
Employee contributions | | | 9 | | | | – | | | | – | | | | 9 | | | | 8 | | | | – | | | | – | | | | 8 | |
| | | | | | | | |
Benefits paid | | | (21 | ) | | | (1 | ) | | | (2 | ) | | | (24 | ) | | | (18 | ) | | | (1 | ) | | | (2 | ) | | | (21) | |
| | | | | | | | |
Administrative costs | | | (1 | ) | | | – | | | | – | | | | (1 | ) | | | (2 | ) | | | – | | | | – | | | | (2) | |
Fair value at end of
year(1) | | | 985 | | | | 78 | | | | – | | | | 1,063 | | | | 892 | | | | 68 | | | | – | | | | 960 | |
Funded status – plan (deficit) surplus(2) | | | $43 | | | | $(7 | ) | | | $(233 | ) | | | $(197 | ) | | | $(3 | ) | | | $(6 | ) | | | $(216 | ) | | | $(225 | ) |
| (1) | The asset ceiling test had no impact on the asset or obligation position of the Plans. |
| (2) | On the Statement of Financial Position, the RPP is classified as a retirement benefit asset totalling $43 million and the SRP and Other benefit plans are classified as retirement benefit obligations totalling $240 million. |
Consolidated Financial Statements
Asset Mix
The objective when managing capital of the Plans is to safeguard the ability to continue as a going concern in order to maintain adequate assets to support investment activities of the Plans and to ensure adequate assets to fund future benefit payments. The Plans’ policies are to invest in a diversified portfolio of investments, based on criteria established in the SIPPs which assist in the management of capital and mitigation of risk. Periodically, an asset-liability modeling (ALM) study is performed to ensure that the pension plan’s investment strategy policies are appropriate in terms of risk and return profiles to ensure proper matching to meet our long-term funding obligation. The results of the ALM are reviewed by the MPC and recommendations, if any, are made to the HRC as part of the annual SIPPs review. An ALM study was initiated in late 2016 and recommendations will be brought forward to the MPC and HRC in 2017.
During the year the Canadian real estate asset class was revised to become an alternative investment category in the SIPP with the same target combined allocation of 15% for all assets within the class. The alternative category is comprised of global listed infrastructure and real estate.
The following table outlines the target allocation and asset mix of the DB plans’ assets:
| | | | | | | | | | | | | | | | | | | | | | | | |
| | | Registered Pension Plan | | | | | | Supplementary Retirement Plan* | |
| | | 2016 Target
% | | | 2016
% | | | 2015
% | | | | | | 2016
% | | | 2015 % | |
Cash | | | – | | | | – | | | | – | | | | | | | | 44% | | | | 49% | |
| | | | | | |
Debt securities | | | 30% | | | | 27% | | | | 29% | | | | | | | | – | | | | – | |
| | | | | | |
Equities | | | 55% | | | | 59% | | | | 59% | | | | | | | | 56% | | | | 51% | |
| | | | | | |
Alternatives | | | 15% | | | | 14% | | | | 12% | | | | | | | | – | | | | – | |
Total | | | 100% | | | | 100% | | | | 100% | | | | | | | | 100% | | | | 100% | |
* The target is 100% in equity securities, net of cash held in a refundable tax account as prescribed by Canada Revenue Agency (CRA).
Fair Value Measurements
All financial instruments of the Plans recognized at fair value in the consolidated statement of financial position must be classified into fair value hierarchy levels as shown in the table below, based on the extent to which the inputs used to measure the fair value are observable or unobservable as defined in Note 27 Fair Value of Financial Instruments.
| | | | | | | | | | | | | | | | | | | | | | | | | | | | | | | | |
(in millions of Canadian dollars) | | Dec. 31, 2016 | | | Dec. 31, 2015 | |
| | | Level 1 | | | Level 2 | | | Level 3 | | | Total | | | Level 1 | | | Level 2 | | | Level 3 | | | Total | |
Fixed income | | | – | | | | 268 | | | | – | | | | 268 | | | | – | | | | 259 | | | | – | | | | 259 | |
| | | | | | | | |
Equities | | | | | | | | | | | | | | | | | | | | | | | | | | | | | | | | |
| | | | | | | | |
Canadian | | | – | | | | 209 | | | | – | | | | 209 | | | | – | | | | 171 | | | | – | | | | 171 | |
| | | | | | | | |
International | | | – | | | | 128 | | | | – | | | | 128 | | | | – | | | | 133 | | | | – | | | | 133 | |
| | | | | | | | |
U.S. | | | – | | | | 147 | | | | – | | | | 147 | | | | – | | | | 133 | | | | – | | | | 133 | |
| | | | | | | | |
Global equities | | | – | | | | 133 | | | | – | | | | 133 | | | | – | | | | 131 | | | | – | | | | 131 | |
| | | | | | | | |
Alternatives | | | – | | | | 22 | | | | 117 | | | | 139 | | | | – | | | | – | | | | 106 | | | | 106 | |
| | | | | | | | |
Derivatives | | | – | | | | 3 | | | | – | | | | 3 | | | | – | | | | (8 | ) | | | – | | | | (8) | |
| | | | | | | | |
Other* | | | 36 | | | | – | | | | – | | | | 36 | | | | 35 | | | | – | | | | – | | | | 35 | |
Total | | | $36 | | | | $910 | | | | $117 | | | | $1,063 | | | | $35 | | | | $819 | | | | $106 | | | | $960 | |
* Represents cash and cash held with CRA.
|
| EDC Annual Report 2016 135 |
Consolidated Financial Statements
The pension expenses recognized in the consolidated statement of comprehensive income, as split in their DB and DC components, were as follows:
| | | | | | | | | | | | | | | | | | | | | | | | | | | | | | | | |
| (in millions of Canadian dollars) | | 2016 | | | 2015 | |
| | | Registered
Pension
Plan | | | Supplementary
Retirement
Plan | | | Other
benefit
plans | | | Total | | | Registered
Pension
Plan | | | Supplementary
Retirement
Plan | | | Other
benefit
plans | | | Total | |
| | | | | | | | |
Defined benefit | | | | | | | | | | | | | | | | | | | | | | | | | | | | | | | | |
| | | | | | | | |
Current service costs | | | 27 | | | | 3 | | | | 6 | | | | 36 | | | | 28 | | | | 2 | | | | 8 | | | | 38 | |
| | | | | | | | |
Administrative costs | | | 1 | | | | – | | | | – | | | | 1 | | | | 1 | | | | – | | | | – | | | | 1 | |
Service costs | | | 28 | | | | 3 | | | | 6 | | | | 37 | | | | 29 | | | | 2 | | | | 8 | | | | 39 | |
Interest cost on benefit obligation | | | 38 | | | | 3 | | | | 9 | | | | 50 | | | | 37 | | | | 3 | | | | 10 | | | | 50 | |
| | | | | | | | |
Interest income on plan assets | | | (37 | ) | | | (3 | ) | | | – | | | | (40 | ) | | | (35 | ) | | | (3 | ) | | | – | | | | (38 | ) |
Net interest on the defined benefit liability (asset) | | | 1 | | | | – | | | | 9 | | | | 10 | | | | 2 | | | | – | | | | 10 | | | | 12 | |
Total defined benefit expense | | | 29 | | | | 3 | | | | 15 | | | | 47 | | | | 31 | | | | 2 | | | | 18 | | | | 51 | |
Defined contribution expense | | | 3 | | | | – | | | | – | | | | 3 | | | | 3 | | | | – | | | | – | | | | 3 | |
Total expense recognized in profit or loss | | | $32 | | | | $3 | | | | $15 | | | | $50 | | | | $34 | | | | $2 | | | | $18 | | | | $54 | |
Key Assumptions
The following table outlines the key assumptions used in measuring the obligations of the defined benefit components of the plans:
| | | | | | | | | | | | | | | | | | | | | | | | |
| | | |
| Assumptions | | Dec. 31, 2016 | | | Dec. 31, 2015 | |
| (Weighted average) | | Registered
Pension Plan | | | Supplementary
Retirement Plan | | | Other
benefit plans | | | Registered
Pension Plan | | | Supplementary
Retirement Plan | | | Other
benefit plans | |
Defined benefit obligation: | | | | | | | | | | | | | | | | | | | | | | | | |
| | | | | | |
Discount rate | | | 4.00% | | | | 4.00% | | | | 4.00% | | | | 4.10% | | | | 4.10% | | | | 4.10% | |
| | | | | | |
Inflation | | | 2.00% | | | | 2.00% | | | | 2.00% | | | | 2.00% | | | | 2.00% | | | | 2.00% | |
| | | | | | |
Rate of compensation increase | |
| 2.75% to
4.75% |
| |
| 2.75% to
4.75% |
| |
| 2.75% to
6.75% |
| |
| 3.25% to
5.45% |
| |
| 3.25% to
5.45% |
| |
| 3.25% to
7.25% |
|
| | | | | | |
Benefit costs: | | | | | | | | | | | | | | | | | | | | | | | | |
| | | | | | |
Discount rate on projected defined benefit obligation | | | 4.10% | | | | 4.10% | | | | 4.10% | | | | 4.20% | | | | 4.20% | | | | 4.20% | |
| | | | | | |
Inflation | | | 2.00% | | | | 2.00% | | | | 2.00% | | | | 2.25% | | | | 2.25% | | | | 2.25% | |
| | | | | | |
Rate of compensation increase | |
| 3.25% to
5.45% |
| |
| 3.25% to
5.45% |
| |
| 3.25% to
7.25% |
| |
| 3.25% to
5.65% |
| |
| 3.25% to
5.65% |
| |
| 3.25% to
5.65% |
|
| | | | | | |
Assumed medical cost trend: | | | | | | | | | | | | | | | | | | | | | | | | |
| | | | | | |
Initial medical cost trend rate | | | – | | | | – | | | | 5.93% | | | | – | | | | – | | | | 6.29% | |
| | | | | | |
Medical cost trend rate declines to | | | – | | | | – | | | | 4.5% | | | | – | | | | – | | | | 4.50% | |
| | | | | | |
Year that the rate reaches the ultimate trend rate | | | – | | | | – | | | | 2020 | | | | – | | | | – | | | | 2020 | |
| | | | | | |
Dental care trend | | | – | | | | – | | | | 4.25% | | | | – | | | | – | | | | 4.25% | |
Due to the long-term nature of the pension plans, the calculation of expenses and obligations depends on various assumptions. These assumptions require significant judgment and have inherent uncertainties that management may not be able to control. The assumptions are determined annually by management, in consultation with our actuaries.
Accounting standards require that the discount rate used to determine the DB obligations be based on market rates for high-quality corporate bonds that match the currency and estimated term of the obligations. Our methodology used to set the discount rate is based on the Canadian Institute of Actuaries’ (CIA) preferred methodology. The standards also require that the interest income on plan assets be computed by applying the discount rate used to measure the plan obligation at the beginning of the year.
The rate of compensation increase used for the DB obligation represents a long-term assumption and includes components for merit and promotion adjustments.
Assumptions regarding future mortality experience are set based on actuarial advice in accordance with published statistics in the form of post-retirement mortality tables.
Consolidated Financial Statements
Re-measurements Recognized in Other Comprehensive Income (OCI)
As a result of applying the previously discussed assumptions, actuarial gains or losses on the DB plans arise from the difference between actual and expected experience and are immediately recognized in OCI. Re-measurement gains totalling $26 million were recognized in OCI during 2016 (2015 – $24 million gains). These amounts have been closed out to retained earnings. As such, there is no accumulated OCI in respect of these amounts.
The table below summarizes the re-measurement recognized in OCI throughout the year:
| | | | | | | | | | | | | | | | | | | | | | | | | | | | | | | | |
| | | | | | | | | |
| (in millions of Canadian dollars) | | | | | | | | | | | 2016 | | | | | | | | | | | | 2015 | |
| | | Registered | | | Supplementary | | | Other | | | | | | Registered | | | Supplementary | | | Other | | | | |
| | | Pension | | | Retirement | | | benefit | | | | | | Pension | | | Retirement | | | benefit | | | | |
| | | Plan | | | Plan | | | plans | | | Total | | | Plan | | | Plan | | | plans | | | Total | |
| | | | | | | | |
Re-measurement on pension obligations | | | | | | | | | | | | | | | | | | | | | | | | | | | | | | | | |
| | | | | | | | |
Actuarial gains (losses) – plan experience assumptions | | | 6 | | | | (3 | ) | | | – | | | | 3 | | | | (12 | ) | | | (7 | ) | | | 28 | | | | 9 | |
| | | | | | | | |
Actuarial losses – demographic assumptions | | | – | | | | – | | | | – | | | | – | | | | – | | | | – | | | | (28 | ) | | | (28 | ) |
| | | | | | | | |
Actuarial gains (losses) – financial assumptions | | | – | | | | (3 | ) | | | (4 | ) | | | (7 | ) | | | 27 | | | | 3 | | | | (2 | ) | | | 28 | |
| | | | 6 | | | | (6 | ) | | | (4 | ) | | | (4 | ) | | | 15 | | | | (4 | ) | | | (2 | ) | | | 9 | |
| | | | | | | | |
Re-measurement on plan assets excluding interest income | | | | | | | | | | | | | | | | | | | | | | | | | | | | | | | | |
| | | | | | | | |
Return on plan assets | | | 30 | | | | – | | | | – | | | | 30 | | | | 14 | | | | 1 | | | | – | | | | 15 | |
| | | | | | | | |
Total re-measurements recognized in other comprehensive income (loss), end of year | | | $36 | | | | $(6 | ) | | | $(4 | ) | | | $26 | | | | $29 | | | | $(3) | | | | $(2 | ) | | | $24 | |
Sensitivity Analysis
The following table outlines the potential impact of changes in certain key assumptions used in measuring the DB obligations. The sensitivity analysis contained in this table is hypothetical and should be used with caution.
| | | | | | | | | | | | | | | | |
| | | | |
| (in millions of Canadian dollars) | | | | | | | | Dec. 31, 2016 | |
| | | Registered | | | Supplementary | | | Other | | | | |
| | | Pension | | | Retirement | | | benefit | | | | |
| | | Plan | | | Plan | | | plans | | | Total | |
| Sensitivity of Assumptions | | Obligation | | | Obligation | | | Obligation | | | Obligation | |
Discount rate | | | | | | | | | | | | | | | | |
| | | | |
Impact of: 1% increase ($) | | | (163 | ) | | | (14 | ) | | | (46 | ) | | | (223 | ) |
| | | | |
1% decrease ($) | | | 217 | | | | 19 | | | | 63 | | | | 299 | |
Longevity Risk Sensitivity | | | | | | | | | | | | | | | | |
| | | | |
Impact of: increase of 1 year in life expectancy | | | 28 | | | | 3 | | | | 10 | | | | 41 | |
Rate of compensation increase(1) | | | | | | | | | | | | | | | | |
| | | | |
Impact of: 1% increase ($) | | | 26 | | | | 14 | | | | 1 | | | | 41 | |
| | | | |
1% decrease ($) | | | (27 | ) | | | (9 | ) | | | (1 | ) | | | (37 | ) |
Inflation rate assumption | | | | | | | | | | | | | | | | |
| | | | |
Impact of: 0.25% increase ($) | | | 39 | | | | 4 | | | | n/a | (2) | | | 43 | |
| | | | |
0.25% decrease ($) | | | (37 | ) | | | (3 | ) | | | n/a | (2) | | | (40 | ) |
| (1) | The rate of compensation increase includes a merit and promotional component which varies by years of service for each individual employee. | |
| (2) | Inflation rate assumption for the other benefit plans are already factored into the other sensitivities. | |
|
| EDC Annual Report 2016 137 |
Consolidated Financial Statements
A one percentage point increase in assumed health care cost trends would have increased the service and interest cost by $5 million and the obligation by $63 million. Whereas a one percentage point decrease would have decreased the service and interest costs by $3 million and the obligation by $46 million.
Total Contributions
Total employer contributions for pension, other post-employment and other post-retirement benefits were as follows:
| | | | | | | | | | | | | | | | | | | | | | | | | | | | | | | | |
(in millions of Canadian dollars) | | | | | | | | 2016 | | | | | | | | | | | | 2015 | |
| | | Registered
Pension
Plan | | | Supplementary
Retirement
Plan | | | Other
benefit
plans | | | Total | | | Registered
Pension
Plan | | | Supplementary
Retirement
Plan | | | Other
benefit
plans | | | Total | |
| | | | | | | | |
DB | | | | | | | | | | | | | | | | | | | | | | | | | | | | | | | | |
| | | | | | | | |
Regular contributions | | | 16 | | | | – | | | | 2 | | | | 18 | | | | 18 | | | | – | | | | 2 | | | | 20 | |
| | | | | | | | |
Special contributions | | | 23 | | | | 8 | | | | – | | | | 31 | | | | 36 | | | | 5 | | | | – | | | | 41 | |
Total defined benefit cash payments | | | 39 | | | | 8 | | | | 2 | | | | 49 | | | | 54 | | | | 5 | | | | 2 | | | | 61 | |
| | | | | | | | |
DC | | | | | | | | | | | | | | | | | | | | | | | | | | | | | | | | |
| | | | | | | | |
Total defined contribution cash payments | | | 3 | | | | – | | | | – | | | | 3 | | | | 3 | | | | – | | | | – | | | | 3 | |
Total cash payments | | | $42 | | | | $8 | | | | $2 | | | | $52 | | | | $57 | | | | $5 | | | | $2 | | | | $64 | |
We expect to contribute $48 million to the Plans in 2017 which includes $38 million to the RPP, $6 million to the DC plan and $4 million for the other benefit plans. Contributions to the SRP will be determined once the actuarial valuation is complete in mid-2017.
Funding and Solvency Valuation
Our appointed actuaries measure the DB obligations and the fair value of the Plans’ assets for accounting purposes as at December 31 of each year. We fund our DB pension plans in accordance with actuarially determined amounts required to satisfy employee benefit obligations under current federal pension regulations. The most recent funding valuation for the RPP and the SRP was as at December 31, 2015. The next formal valuations will be conducted by the Plans’ actuaries in 2017 and will be as at December 31, 2016.
The financial health of a pension plan is measured by actuarial valuations, which are prepared on both a going-concern and a solvency basis. The EDC DB RPP ratios as at December 31, 2015 were 137.4% (2014 – 125.5%) on a going-concern basis and 88.9% (2014 – 80.4%) on a solvency basis. Since EDC’s solvency ratio for the RPP is less than 100%, we are required by federal pension legislation to make special monthly solvency contributions. During 2016, we contributed special payments of $23 million into the RPP and will continue to remit all required solvency payments. The solvency ratio for the SRP as at December 31, 2015 was 89.3% (2014 – 92.2%) and EDC made a special contribution of $8 million to this plan in 2016.
Consolidated Financial Statements
| | |
 | | Related Party Transactions |
We enter into transactions with other government departments, agencies and Crown corporations in the normal course of business, under terms and conditions similar to those that apply to unrelated parties. The following disclosure is in addition to the related party disclosure provided elsewhere in these financial statements. All material related party transactions are either disclosed below or in the relevant notes. These transactions were measured at their exchange amounts.
Canada Account Administrative Expense Recovery
As described in Note 41, we enter into certain financial and contingent liability transactions on behalf of the Government of Canada known as “Canada Account” transactions. We are compensated for expenses and overhead relating to Canada Account activities. In 2016, we retained $3 million (2015 – $3 million) from Canada Account receipts and recoveries for these expenses and overhead. These amounts are netted against administrative expenses on the consolidated statement of comprehensive income.
Key Management Personnel Compensation
Key management personnel include the Board of Directors and the Executive Management team. Compensation paid or payable to key management personnel during the year, including non-cash benefits subject to income tax, was as follows:
| | | | | | | | |
(in millions of Canadian dollars) | | 2016 | | | 2015 | |
Salaries and other short-term benefits | | | 4 | | | | 4 | |
Post-employment benefits | | | 1 | | | | 1 | |
Total | | | $5 | | | | $5 | |
| | |
 | | Canada Account Transactions |
Pursuant to the Act, the Minister, with the concurrence of the Minister of Finance, may authorize us to undertake certain financial and contingent liability transactions on behalf of the Government of Canada. These transactions and the legislative authorities that underlie them have come to be known collectively as “Canada Account”. Accounts for these transactions are maintained separately from our accounts and are consolidated annually as at March 31 with the financial statements of the Government of Canada, which are reported upon separately by the Government and audited by the Auditor General of Canada. The assets under the Canada Account, mainly loans receivable and accrued interest and fees, are recorded in accordance with the accounting policies and practices of the Government of Canada and amounted to $4.2 billion at the end of December 2016 (2015 – $4.5 billion).
The Act allows the Canada Account to have outstanding loans and commitments to borrowers and arrangements giving rise to contingent liabilities under contracts of insurance and other agreements up to a maximum of $20 billion. The position against the statutory limit at the end of 2016, determined in accordance with the requirements of the Act, was $3.1 billion (2015 – $3.5 billion).

|
| EDC Annual Report 2016 139 |
Ten-Year Review
Statement of Financial Position
| | | | | | | | | | | | |
As at December 31 (in millions of Canadian dollars) | | | 2016 | (1) | | | 2015 | (1) | | | 2014 | (1) |
Gross loans receivable | | | 55,375 | | | | 53,326 | | | | 41,791 | |
Accrued interest and fees receivable(2) | | | 236 | | | | 200 | | | | 163 | |
Deferred loan revenue and other credits | | | (361 | ) | | | (390 | ) | | | (368 | ) |
Allowance for losses on loans | | | (1,552 | ) | | | (1,715 | ) | | | (1,163 | ) |
Net loans receivable | | | 53,698 | | | | 51,421 | | | | 40,423 | |
Assets held-for-sale(3) | | | 42 | | | | 15 | | | | 364 | |
Equipment available for lease | | | – | | | | – | | | | – | |
Net investment in aircraft under finance leases | | | – | | | | 64 | | | | 68 | |
Investments at fair value through profit or loss | | | 1,005 | | | | 848 | | | | 689 | |
Cash and marketable securities | | | 7,389 | | | | 7,694 | | | | 6,545 | |
Reinsurers’ share of premium and claims liabilities | | | 116 | | | | 141 | | | | 88 | |
Property, plant and equipment | | | 55 | | | | 53 | | | | 56 | |
Intangible assets | | | 92 | | | | 71 | | | | 56 | |
Other assets | | | 727 | | | | 662 | | | | 715 | |
Total Assets | | | $63,124 | | | | $60,969 | | | | $49,004 | |
Loans payable | | | 49,101 | | | | 46,909 | | | | 38,038 | |
Other liabilities | | | 3,359 | | | | 3,936 | | | | 1,935 | |
Allowance for losses on loan commitments(4) | | | 78 | | | | 113 | | | | 44 | |
Premium and claims liabilities | | | 656 | | | | 688 | | | | 618 | |
Loan guarantees(5) | | | 167 | | | | 158 | | | | 153 | |
Total Liabilities | | | 53,361 | | | | 51,804 | | | | 40,788 | |
Share capital | | | 1,333 | | | | 1,333 | | | | 1,333 | |
Retained earnings | | | 8,430 | | | | 7,832 | | | | 6,883 | |
Accumulated other comprehensive income (loss) | | | – | | | | – | | | | – | |
Equity | | | 9,763 | | | | 9,165 | | | | 8,216 | |
Total Liabilities and Equity | | | $63,124 | | | | $60,969 | | | | $49,004 | |
| (1) | 2016 through 2010 are based on IFRS; 2009 through 2007 numbers are based on previous Canadian GAAP. |
| (2) | For 2016 through 2010, accrued loan interest and fees were reclassified to loans receivable for IFRS presentation purposes. For 2009 through 2007, accrued loan interest and fees are included in other assets. |
| (3) | At the end of December 2016, there was one Q400 and two engines included in assets held-for-sale. For 2013 through 2007, assets held-for-sale is grouped with other assets. |
| (4) | For 2016 through 2010, allowance for losses on loan guarantees is included with loan guarantees. For 2009 through 2007, allowance for losses on loan commitments includes allowance for losses on loan guarantees. |
| (5) | For 2016 through 2010, loan guarantees include deferred guarantee fee revenue and allowance for losses on loan guarantees. For 2009 through 2007 allowance for losses on loan guarantees is grouped with allowance for losses on loan commitments and guarantees and deferred guarantee fee revenue is grouped with loans receivable. |
Ten-Year Review
| | | | | | | | | | | | | | | | | | | | | | | | | | |
| | | | | | | | | | | | | | | | | | | | | | | | | | | |
| | 2013 | (1) | | | 2012 | (1) | | | 2011 | (1) | | | 2010 | (1) | | | 2009 | (1) | | | 2008 | (1) | | | 2007 | (1) |
| 36,549 | | | | 30,336 | | | | 29,093 | | | | 26,997 | | | | 26,823 | | | | 30,898 | | | | 19,108 | |
| 154 | | | | 157 | | | | 145 | | | | 163 | | | | – | | | | – | | | | – | |
| (346 | ) | | | (362 | ) | | | (558 | ) | | | (549 | ) | | | (556 | ) | | | (689 | ) | | | (589 | ) |
| (1,246 | ) | | | (1,182 | ) | | | (1,680 | ) | | | (1,561 | ) | | | (1,948 | ) | | | (1,928 | ) | | | (1,316 | ) |
| 35,111 | | | | 28,949 | | | | 27,000 | | | | 25,050 | | | | 24,319 | | | | 28,281 | | | | 17,203 | |
| – | | | | – | | | | – | | | | – | | | | – | | | | – | | | | – | |
| 493 | | | | 525 | | | | 55 | | | | 143 | | | | 315 | | | | 334 | | | | 372 | |
| 76 | | | | 80 | | | | 92 | | | | 99 | | | | 113 | | | | 142 | | | | 122 | |
| 537 | | | | 429 | | | | 385 | | | | 317 | | | | 196 | | | | 150 | | | | 95 | |
| 4,066 | | | | 4,236 | | | | 3,886 | | | | 3,803 | | | | 5,432 | | | | 3,843 | | | | 2,528 | |
| 93 | | | | 90 | | | | 129 | | | | 109 | | | | 159 | | | | 157 | | | | 88 | |
| 59 | | | | 66 | | | | 74 | | | | 33 | | | | 17 | | | | 15 | | | | 7 | |
| 44 | | | | 38 | | | | 40 | | | | 42 | | | | 41 | | | | 36 | | | | 32 | |
| 1,037 | | | | 1,820 | | | | 1,935 | | | | 2,286 | | | | 2,306 | | | | 2,298 | | | | 2,642 | |
| $41,516 | | | | $36,233 | | | | $33,596 | | | | $31,882 | | | | $32,898 | | | | $35,256 | | | | $23,089 | |
| 31,259 | | | | 25,880 | | | | 23,570 | | | | 22,484 | | | | 24,435 | | | | 25,882 | | | | 15,583 | |
| 1,068 | | | | 676 | | | | 588 | | | | 459 | | | | 369 | | | | 1,627 | | | | 375 | |
| 47 | | | | 58 | | | | 41 | | | | 93 | | | | 713 | | | | 807 | | | | 564 | |
| 606 | | | | 583 | | | | 875 | | | | 640 | | | | 793 | | | | 824 | | | | 543 | |
| 165 | | | | 161 | | | | 266 | | | | 245 | | | | – | | | | – | | | | – | |
| 33,145 | | | | 27,358 | | | | 25,340 | | | | 23,921 | | | | 26,310 | | | | 29,140 | | | | 17,065 | |
| 1,333 | | | | 1,333 | | | | 1,333 | | | | 1,333 | | | | 1,333 | | | | 983 | | | | 983 | |
| 7,038 | | | | 7,542 | | | | 6,923 | | | | 6,628 | | | | 5,317 | | | | 5,077 | | | | 5,121 | |
| – | | | | – | | | | – | | | | – | | | | (62 | ) | | | 56 | | | | (80 | ) |
| 8,371 | | | | 8,875 | | | | 8,256 | | | | 7,961 | | | | 6,588 | | | | 6,116 | | | | 6,024 | |
| $41,516 | | | | $36,233 | | | | $33,596 | | | | $31,882 | | | | $32,898 | | | | $35,256 | | | | $23,089 | |
|
| EDC Annual Report 2016 141 |
Ten-Year Review
Statement of Comprehensive Income
| | | | | | | | | | | | |
| for the year ended December 31 | | | | | | | | | |
(in millions of Canadian dollars) | | | 2016(1) | | | | 2015(1) | | | | 2014(1) | |
Financing and investment revenue: | | | | | | | | | | | | |
Loan | | | 1,720 | | | | 1,475 | | | | 1,239 | |
Finance lease | | | 1 | | | | 5 | | | | 5 | |
Operating lease | | | – | | | | – | | | | 50 | |
Debt relief | | | – | | | | – | | | | – | |
Marketable securities | | | 73 | | | | 60 | | | | 45 | |
Investments | | | 9 | | | | 8 | | | | 6 | |
Total financing and investment revenue | | | 1,803 | | | | 1,548 | | | | 1,345 | |
Interest expense | | | 450 | | | | 183 | | | | 70 | |
Leasing and financing related expenses | | | 37 | | | | 28 | | | | 48 | |
Net Financing and Investment Income | | | 1,316 | | | | 1,337 | | | | 1,227 | |
Loan Guarantee Fees | | | 40 | | | | 41 | | | | 36 | |
Insurance premiums and guarantee fees | | | 223 | | | | 217 | | | | 210 | |
Reinsurance assumed | | | 6 | | | | 7 | | | | 8 | |
Reinsurance ceded | | | (37) | | | | (30) | | | | (23) | |
Net Insurance Premiums and Guarantee Fees | | | 192 | | | | 194 | | | | 195 | |
Other (Income) Expenses | | | 76 | | | | (200) | | | | (76) | |
Administrative Expenses | | | 385 | | | | 351 | | | | 327 | |
Income before Provision and Claims-Related Expenses | | | 1,087 | | | | 1,421 | | | | 1,207 | |
Provision for (Reversal of) Credit Losses | | | (31) | | | | 437 | | | | (39) | |
Claims-Related Expenses (Recovery) | | | 46 | | | | 59 | | | | 117 | |
Net Income | | | 1,072 | | | | 925 | | | | 1,129 | |
Other comprehensive income (loss) | | | 26 | | | | 24 | | | | (155) | |
Comprehensive Income | | | $1,098 | | | | $949 | | | | $974 | |
| (1) | 2016 through 2010 are based on IFRS; 2009 through 2007 numbers are based on previous Canadian GAAP. |
Ten-Year Review
| | | | | | | | | | | | | | | | | | | | | | | | | | |
2013(1) | | | 2012(1) | | | 2011(1) | | | 2010(1) | | | 2009(1) | | | 2008(1) | | | 2007(1) | |
| | | | | | |
| | 1,174 | | | | 1,116 | | | | 1,009 | | | | 1,004 | | | | 1,321 | | | | 1,355 | | | | 1,405 | |
| 6 | | | | 6 | | | | 7 | | | | 8 | | | | 9 | | | | 9 | | | | 8 | |
| 55 | | | | 17 | | | | 21 | | | | 32 | | | | 32 | | | | 43 | | | | 37 | |
| – | | | | – | | | | 4 | | | | 25 | | | | 49 | | | | – | | | | 1 | |
| 32 | | | | 36 | | | | 46 | | | | 47 | | | | 41 | | | | 81 | | | | 123 | |
| 8 | | | | 5 | | | | 12 | | | | 8 | | | | 3 | | | | 2 | | | | 1 | |
| 1,275 | | | | 1,180 | | | | 1,099 | | | | 1,124 | | | | 1,455 | | | | 1,490 | | | | 1,575 | |
| 30 | | | | 108 | | | | 93 | | | | 147 | | | | 381 | | | | 611 | | | | 717 | |
| 49 | | | | 33 | | | | 32 | | | | 53 | | | | 68 | | | | 43 | | | | 46 | |
| 1,196 | | | | 1,039 | | | | 974 | | | | 924 | | | | 1,006 | | | | 836 | | | | 812 | |
| 36 | | | | 38 | | | | 32 | | | | 33 | | | | 24 | | | | 20 | | | | 14 | |
| 204 | | | | 204 | | | | 238 | | | | 210 | | | | 197 | | | | 171 | | | | 149 | |
| 11 | | | | 12 | | | | 13 | | | | 11 | | | | – | | | | – | | | | – | |
| (22) | | | | (20) | | | | (17) | | | | (11) | | | | – | | | | – | | | | – | |
| 193 | | | | 196 | | | | 234 | | | | 210 | | | | 197 | | | | 171 | | | | 149 | |
| 109 | | | | 16 | | | | (61) | | | | 49 | | | | 76 | | | | 13 | | | | (45) | |
| 310 | | | | 308 | | | | 284 | | | | 273 | | | | 246 | | | | 240 | | | | 219 | |
| 1,006 | | | | 949 | | | | 1,017 | | | | 845 | | | | 905 | | | | 774 | | | | 801 | |
| 30 | | | | (340) | | | | 125 | | | | (631) | | | | 431 | | | | 346 | | | | 196 | |
| 159 | | | | (38) | | | | 247 | | | | 1 | | | | 216 | | | | 222 | | | | 132 | |
| 817 | | | | 1,327 | | | | 645 | | | | 1,475 | | | | 258 | | | | 206 | | | | 473 | |
| 119 | | | | 51 | | | | – | | | | – | | | | – | | | | – | | | | – | |
| $936 | | | | $1,378 | | | | $645 | | | | $1,475 | | | | $258 | | | | $206 | | | | $473 | |
|
| EDC Annual Report 2016 143 |
Ten-Year Review
Corporate Account
| | | | | | | | | | | | |
Financial Arrangements Facilitated | | | | | | | | | | | | |
(in millions of Canadian dollars) | | 2016(1) | | | 2015(1) | | | 2014(1) | |
Financing | | | | | | | | | | | | |
Direct financing | | | 26,587 | | | | 24,277 | | | | 20,613 | |
Guarantees | | | 1,483 | | | | 1,133 | | | | 963 | |
Total | | | 28,070 | | | | 25,410 | | | | 21,576 | |
| | | |
Insurance | | | | | | | | | | | | |
Credit insurance | | | 55,724 | | | | 60,175 | | | | 56,020 | |
Financial institutions insurance | | | 7,421 | | | | 7,666 | | | | 11,415 | |
Contract insurance and bonding | | | 1,094 | | | | 618 | | | | 623 | |
Political risk insurance | | | 2,728 | | | | 2,805 | | | | 2,643 | |
Guarantees | | | 7,004 | | | | 7,531 | | | | 6,593 | |
Total | | | 73,971 | | | | 78,795 | | | | 77,294 | |
| | | |
Financial and Other Data | | | | | | | | | | | | |
Financing (in millions of Canadian dollars) | | | | | | | | | | | | |
Value of gross loans receivable | | | 55,375 | | | | 53,326 | | | | 41,791 | |
Value of investments | | | 1,005 | | | | 848 | | | | 689 | |
Value of undisbursed loans | | | 19,147 | | | | 19,928 | | | | 16,593 | |
Value of undisbursed investments | | | 914 | | | | 903 | | | | 672 | |
Value of loan disbursements | | | 22,709 | | | | 18,800 | | | | 15,186 | |
Value of disbursements for investments | | | 237 | | | | 209 | | | | 149 | |
Value of liability on loan guarantees | | | 2,411 | | | | 2,086 | | | | 1,963 | |
Undisbursed amounts on loan guarantees | | | 103 | | | | 101 | | | | 145 | |
Amounts available for allocation under confirmed LOC | | | 181 | | | | 109 | | | | 122 | |
Loan amounts rescheduled | | | 24 | | | | – | | | | 50 | |
Loan amounts written off | | | 193 | | | | 42 | | | | 165 | |
Number of current lines of credit and protocols | | | 13 | | | | 16 | | | | 21 | |
Insurance (in millions of Canadian dollars) | | | | | | | | | | | | |
Value of liability on insurance and guarantees | | | 22,693 | | | | 24,314 | | | | 22,155 | |
Value of claims paid | | | 110 | | | | 143 | | | | 72 | |
Value of claims recovered | | | 23 | | | | 15 | | | | 13 | |
Value of claims outstanding at end of year | | | 732 | | | | 806 | | | | 666 | |
Value of claims under consideration at end of year | | | 305 | | | | 307 | | | | 12 | |
Number of policies issued | | | 6,490 | | | | 6,623 | | | | 7,018 | |
Number of insurance policies and guarantees in force | | | 7,302 | | | | 7,383 | | | | 7,967 | |
| (1) | 2016 through 2010 are based on IFRS; 2009 through 2007 numbers are based on previous Canadian GAAP. |
Ten-Year Review
| | | | | | | | | | | | |
| | | | | | | | | | | | | |
2013(1) | | 2012(1) | | 2011(1) | | 2010(1) | | 2009(1) | | 2008(1) | | 2007(1) |
| | | | | | | | | | | | |
17,497 | | 13,754 | | 13,734 | | 12,472 | | 11,148 | | 12,966 | | 11,362 |
851 | | 864 | | 893 | | 936 | | 761 | | 1,120 | | 1,222 |
18,348 | | 14,618 | | 14,627 | | 13,408 | | 11,909 | | 14,086 | | 12,584 |
| | | | | | |
| | | | | | | | | | | | |
56,224 | | 54,087 | | 62,872 | | 52,073 | | 52,658 | | 56,304 | | 44,661 |
10,630 | | 9,295 | | 13,914 | | 8,324 | | 6,037 | | 5,124 | | 2,776 |
808 | | 531 | | 1,049 | | 2,514 | | 3,733 | | 3,736 | | 3,935 |
2,743 | | 2,855 | | 2,859 | | 2,420 | | 2,622 | | 2,432 | | 2,989 |
6,659 | | 6,063 | | 7,179 | | 5,877 | | 5,810 | | 4,137 | | 3,077 |
77,064 | | 72,831 | | 87,873 | | 71,208 | | 70,860 | | 71,733 | | 57,438 |
| | | | | | |
| | | | | | | | | | | | |
| | | | | | | | | | | | | |
36,549 | | 30,336 | | 29,093 | | 26,997 | | 26,823 | | 30,898 | | 19,108 |
537 | | 429 | | 385 | | 317 | | 196 | | 150 | | 95 |
14,885 | | 13,391 | | 9,722 | | 8,775 | | 8,814 | | 8,024 | | 6,096 |
541 | | 417 | | 283 | | 314 | | 367 | | 279 | | 143 |
14,100 | | 11,887 | | 10,393 | | 10,095 | | 10,555 | | 13,324 | | 9,972 |
124 | | 121 | | 106 | | 117 | | 74 | | 96 | | 56 |
1,954 | | 1,907 | | 2,506 | | 2,304 | | 3,166 | | 3,612 | | 2,549 |
137 | | 197 | | 234 | | 243 | | 392 | | 553 | | 418 |
157 | | 111 | | 410 | | 384 | | 459 | | 509 | | 2,373 |
– | | – | | 4 | | 25 | | 51 | | – | | 2 |
62 | | 408 | | 76 | | 75 | | 58 | | 5 | | 21 |
26 | | 37 | | 56 | | 57 | | 71 | | 72 | | 65 |
| | | | | | |
| | | | | | | | | | | | |
22,807 | | 21,673 | | 25,732 | | 23,171 | | 22,395 | | 24,075 | | 17,609 |
61 | | 358 | | 55 | | 126 | | 258 | | 104 | | 60 |
10 | | 22 | | 40 | | 36 | | 20 | | 24 | | 15 |
637 | | 627 | | 381 | | 440 | | 422 | | 266 | | 171 |
30 | | 11 | | 315 | | 8 | | 32 | | 32 | | 5 |
7,836 | | 7,525 | | 7,913 | | 9,714 | | 10,573 | | 10,120 | | 9,708 |
8,553 | | 8,214 | | 8,665 | | 9,238 | | 9,252 | | 9,328 | | 9,330 |
|
| EDC Annual Report 2016 145 |
Ten-Year Review
Canada Account
| | | | | | | | | | | | |
Financial Arrangements Facilitated | | | | | | | | | | | | |
(in millions of Canadian dollars) | | 2016 | | | 2015 | | | 2014 | |
Financing | | | | | | | | | | | | |
Direct financing | | | – | | | | 156 | | | | 25 | |
Insurance | | | | | | | | | | | | |
Credit insurance | | | 28 | | | | 41 | | | | 28 | |
Financial institutions insurance | | | – | | | | – | | | | – | |
Contract insurance and bonding | | | – | | | | – | | | | – | |
Political risk insurance | | | – | | | | – | | | | – | |
Subtotal | | | 28 | | | | 41 | | | | 28 | |
Total | | | 28 | | | | 197 | | | | 53 | |
Financial and Other Data | | | | | | | | | | | | |
Financing (in millions of Canadian dollars) | | | | | | | | | | | | |
Value of total loans and notes receivable | | | 2,998 | | | | 3,359 | | | | 2,924 | |
Value of undisbursed loans | | | – | | | | – | | | | – | |
Value of loan disbursements (net of guarantees) | | | – | | | | 156 | | | | 25 | |
Value of liability on loan guarantees | | | 121 | | | | 142 | | | | 164 | |
Undisbursed amounts on loan guarantees | | | – | | | | – | | | | – | |
Amounts available for allocation | | | – | | | | – | | | | – | |
Loan amounts rescheduled | | | – | | | | – | | | | – | |
Number of transactions financed | | | – | | | | 2 | | | | 1 | |
Insurance (in millions of Canadian dollars) | | | | | | | | | | | | |
Value of liability on insurance and guarantees | | | 3 | | | | 7 | | | | 6 | |
Value of claims paid | | | – | | | | – | | | | – | |
Value of claims recovered | | | – | | | | – | | | | – | |
Value of claims outstanding at end of year | | | – | | | | – | | | | – | |
Number of policies issued | | | – | | | | – | | | | – | |
Number of insurance policies and guarantees in force | | | 1 | | | | 1 | | | | 1 | |
| (1) | Includes activity pursuant to the Softwood Lumber deposit refund mechanism transactions. |
| (2) | Includes amounts disbursed in conjunction with the Ontario Financing Authority relating to loans in the automotive sector. |
Ten-Year Review
| | | | | | | | | | | | | | | | | | | | | | | | | | |
| | | | | | | |
2013 | | | 2012 | | | 2011 | | | 2010 | | | 2009 | | | 2008 | | | 2007 | |
| | | | | | | | | | | | | | | | | | | | | | | | | | |
| | – | | | | 1 | | | | – | | | | 76 | | | | 14,222 | (2) | | | – | | | | 27 | (1) |
| | | | | | | | | | | | | | | | | | | | | | | | | | |
| 30 | | | | 41 | | | | 44 | | | | 129 | | | | 628 | | | | – | | | | – | |
| | – | | | | – | | | | – | | | | – | | | | – | | | | – | | | | – | |
| | – | | | | – | | | | – | | | | – | | | | – | | | | – | | | | – | |
| | – | | | | – | | | | – | | | | – | | | | – | | | | – | | | | – | |
| | 30 | | | | 41 | | | | 44 | | | | 129 | | | | 628 | | | | – | | | | – | |
| | 30 | | | | 42 | | | | 44 | | | | 205 | | | | 14,850 | | | | – | | | | 27 | (1) |
| | | | | | | | | | | | | | | | | | | | | | | | | | |
| | | | | | | | | | | | | | | | | | | | | | | | | | | |
| | 2,821 | | | | 3,164 | | | | 3,442 | | | | 4,720 | | | | 5,905 | | | | 3,226 | | | | 2,765 | |
| | – | | | | – | | | | – | | | | 505 | | | | 607 | | | | 1 | | | | 2 | |
| | – | | | | – | | | | 569 | (2) | | | 446 | (2) | | | 14,398 | (2) | | | – | | | | 31 | (1) |
| | 186 | | | | 208 | | | | 241 | | | | 295 | | | | 385 | | | | 457 | | | | 462 | |
| | – | | | | – | | | | – | | | | – | | | | – | | | | – | | | | – | |
| | – | | | | – | | | | – | | | | – | | | | – | | | | – | | | | – | |
| | – | | | | – | | | | – | | | | 2 | | | | 1 | | | | – | | | | – | |
| | – | | | | – | | | | – | | | | 5 | | | | 16 | | | | – | | | | 27 | (1) |
| | | | | | | | | | | | | | | | | | | | | | | | | | |
| | 9 | | | | 9 | | | | 8 | | | | 10 | | | | 120 | | | | – | | | | – | |
| | – | | | | – | | | | – | | | | – | | | | – | | | | – | | | | – | |
| | – | | | | – | | | | – | | | | – | | | | 11 | | | | 15 | | | | 8 | |
| | – | | | | – | | | | 13 | | | | 13 | | | | 13 | | | | 22 | | | | 35 | |
| | – | | | | – | | | | – | | | | 1 | | | | 103 | | | | – | | | | – | |
| | 1 | | | | 1 | | | | 4 | | | | 7 | | | | 53 | | | | 2 | | | | 2 | |
|
| EDC Annual Report 2016 147 |
Glossary of Financial Terms
Actuarial Gains or Losses – Changes in the value of the defined benefit obligation and the plan assets due to differences between actuarial assumptions and what has actually occurred and due to changes in actuarial assumptions.
Actuarial Valuation (re: Pension Benefit Plans) – An assessment of the financial status of a benefit plan performed by an independent actuary. It includes the valuation of any plan assets and the defined benefit obligation using estimates of future events that will affect the costs and obligation for employee benefits plans.
Amortized Cost – The amount at which the financial asset or financial liability is measured at initial recognition minus principal repayments, plus or minus the cumulative amortization using the effective interest method of any difference between that initial amount and the maturity amount and minus any reduction (directly or through the use of an allowance account) for impairment or uncollectability.
Basis Point – One one-hundredth of a percentage point.
CDOR – Canadian Dollar Offered Rate - An industry determined financial benchmark and the recognized benchmark index for Canadian bankers’ acceptances with a term to maturity of one year or less.
Contingent Liability – Potential debt which arises from past events and may become an actual obligation if certain events occur or fail to occur. Contingent liability is also referred to as insurance policies and guarantees outstanding.
Credit Risk – The risk of loss incurred if a counterparty fails to meet its financial commitments.
Defined Benefit Obligation – The actuarial present value, without deducting any plan assets, of expected future payments required to settle the obligation resulting from employee service in the current and prior periods.
Derivative Instruments – Financial contracts that derive their value from changes in interest rates, foreign exchange rates, credit spreads, commodity prices, equities, market indexes or other financial measures. Such instruments include futures, interest rate, foreign exchange, equity, commodity and credit default swaps.
Effective Interest Rate – The rate that exactly discounts estimated future cash payments or receipts through the expected life of the financial instrument or, when appropriate, a shorter period, to the net carrying amount of the financial asset or financial liability.
Exposure at Default – Generally represents the gross exposure – outstanding amount for on-balance sheet exposure and loan equivalent amount for off-balance sheet exposure.
Facultative Reinsurance – Reinsurance provided on a transactional basis.
Foreign Exchange Risk – The risk of potential adverse impact on the value of financial instruments resulting from exchange rate movements.
Gross Loans Receivable – Principal amounts outstanding under existing loan agreements.
Hedge – A risk management practice used to manage interest rate or foreign exchange exposures arising from the normal course of business operations.
Individually Impaired Loans – Loans where there is objective evidence that an impairment loss has occurred.
Insurance Risk – The risk that the actual experience under an insurance policy does not follow what was anticipated at policy inception.
Interest Rate Risk – The risk that the fair value or future cash flows of a financial instrument will fluctuate because of changes in market interest rates.
LIBOR – London Inter-Bank Offered Rate – The interest rate at which banks in London are prepared to lend funds to first-class banks.
Loss Given Default – Measures the severity of loss on a facility in the event of a borrower’s default, expressed as a percentage of exposure at default.
Liquidity Risk – The risk that we would be unable to honour daily cash outflow commitments or the risk that we would have to obtain funds rapidly, possibly at an excessively high premium during severe market conditions.
Market Risk – The risk that the fair value or future cash flows of a financial instrument will fluctuate because of changes in market prices. Market risk comprises three types of risk: foreign exchange risk, interest rate risk and other price risk.
Net Finance Margin – Net financing and investment income expressed as a percentage of average income earning assets.
Net Financing and Investment Income – Revenue earned on financing, leasing, marketable securities and investment assets, less interest and leasing and financing related expenses.
Net Revenue – Net income excluding the provision for credit losses, claims-related expenses, administrative expenses, and unrealized gains and losses.
Operational Risk – The risk of direct or indirect loss resulting from the organizational environment, external events, inadequate internal processes, people, or systems.
Performing Loans – Loans for which there is reasonable assurance that EDC can collect the principal and interest on time.
Productivity Ratio – Administrative expenses expressed as a percentage of net revenue excluding the impact due to fluctuations in the exchange rate from the rate projected in the Corporate Plan.
Probability of Default – Measures the likelihood that a borrower will default within a one-year time horizon, expressed as a percentage.
Structured Entity (SE) – An entity that has been designed so that voting or similar rights are not the dominant factor in deciding who controls the entity, such as when any voting rights relate to administrative tasks only and the relevant activities are directed by means of contractual arrangements.
Undisbursed Loan Commitments – A contractual amount under an existing loan agreement that has yet to be advanced to the borrower.
Corporate Representation
| | | | | | | | |
National | | International |
| | | | |
| Head Office | | Quebec Region | | North America | | Europe | | Asia |
| | | | |
Export Development Canada 150 Slater Street Ottawa, ON K1A 1K3 Tel: 613-598-2500 Fax: 613-598-3811 edc.ca Atlantic Region Halifax 1969 Upper Water Street, Tower 2 Suite 1605 Halifax, NS B3J 3R7 Tel: 902-450-7610 Fax: 902-450-7601 Moncton 735 Main Street Suite 400 Moncton, NB E1C 1E5 Tel: 506-872-8416 Fax: 506-872-8433 St. John’s 510 Topsail Road St. John’s, NL A1E 2C2 Tel: 709-772-8808 Fax: 709-772-8693 Ontario Region Toronto 155 Wellington Street West Suite 3120 Toronto, ON M5V 3L3 Tel: 416-349-6515 Fax: 416-349-6516 London 148 Fullarton Street Suite 1512 London, ON N6A 5P3 Tel: 519-858-6200 Fax: 519-858-6201 Mississauga 1 City Centre Drive Suite 805 Mississauga, ON L5B 1M2 Tel: 905-615-6470 Fax: 905-615-6471 Windsor 3270 Electricity Dr. Suite 209 Walker Industrial Park Windsor, ON N8W 5J1 Tel: 519-974-7674 Fax: 519-974-9753 | | Montréal 800 Victoria Square Suite 4520 P.O. Box 124 Tour de la Bourse Montréal, QC H4Z 1A1 Tel: 514-876-7100 Fax: 514-878-9891 Brossard 4805 Lapinière Suite 4300 Brossard, QC J4Z 0G2 Phone: 450-926-0642 Fax: 450-926-6124 Drummondville 1412 Jean Berchmans Michaud Street Drummondville, QC J2C 7V3 Tel: 819-475-2587 Fax: 819-475-2408 Québec City 2875 Laurier Boulevard D-3, Suite 600 Québec, QC G1V 2M2 Tel: 418-577-7400 Fax: 418-577-7419 Ville Saint-Laurent 9900 Cavendish Boulevard Suite 201 Saint-Laurent, QC H4M 2V2 Tel: 514-215-7200 Fax: 514-215-7201 Western Region Calgary 308-4th Avenue SW Suite 2403 Calgary, AB T2P 0H7 Tel: 403-817-6700 Fax: 403-817-6701 Edmonton 10180-101 Street Suite 3400 Edmonton, AB T5J 3S4 Tel: 780-801-5402 Fax: 780-801-5333 Regina 1914 Hamilton Street Suite 300 Regina, SK S4P 3N6 Tel: 306-586-1727 Fax: 306-586-1725 Vancouver 1055 Dunsmuir Street Suite 400, Bentall Four PO Box 49086 Vancouver, BC V7X 1G4 Tel: 604-678-2240 Fax: 604-678-2241 Winnipeg 201 Portage Avenue Suite 1050 Winnipeg, MB R3B 3K6 Tel: 204-318-5620 Fax: 204-318-5621 | | Mexico City Canadian Embassy Calle Schiller 529 Rincón del Bosque Colonia Polanco México, D.F. 1156 Mexico Tel: (011) 52-55-5387-9315 Monterrey Consulate General of Canada Gomez Morin 955 4th Floor, Suite 404 Garza Garcia, NL, C.P. 66279 Mexico Tel: (011) 52-81-8378-0240 South America Bogotá Embassy of Canada Carrera 7 #114 – 33, Piso 14, Bogotá Colombia Tel: (011) 57-1-657-9800 Lima Canadian Embassy Bolognesi 228, Miraflores Lima 18, Peru Tel: (011) 51-1319-3385 Santiago Canadian Embassy Nueva Tajamar 481 – 12th floor North Tower Las Condes Santiago, Chile Tel: (011) 56-2-652-3807 Rio de Janeiro Canadian Consulate General Av. Atlantic, Andar 13° Copacabana Rio de Janeiro - RJ, Brazil CEP 22021-000 Tel: (011) 55-21-2295-0391 São Paulo Canadian Consulate General Av. das Nações Unidas 12901 Cenu Torre Norte, Andar 16° CEP 04578-000 Săo Paulo – SP, Brazil Tel: (011) 55-11-5509-4362 | | Düsseldorf Consulate of Canada – Düsseldorf Benrather Strasse 8 40213 Düsseldorf Germany Tel: (011) 49-211-1721745 Istanbul Consulate of Canada 209 Buyukdere Caddesi Tekfen Tower – 16th Floor Levent 4, Istanbul 34394 Turkey Tel: (011) 90-212-385-9700 London High Commission of Canada Trafalgar Square London SW1Y 5BJ United Kingdom Tel: (011) 44-20-7004-6138 Moscow Canadian Embassy 23 Starokonyushenny Pereulok Moscow, 119002 Russia Tel: (011) 7-495-925-6095 Africa/Middle East Johannesburg High Commission of Canada 10 Arnold Road Johannesburg, 2196 South Africa Tel: (011) 27-11-442-3130 Dubai Consulate General of Canada Jumeirah Emirates Towers, 19th Floor Sheikh Zayed Road Dubai, United Arab Emirates Tel: (011) 971-4-404-8515 | | Jakarta Embassy of Canada World Trade Centre I – 6th Floor Jalan Jend. Sudirman Kav. 29-31 Jakarta 12920 Indonesia Tel: (011) 62-21-2550-7835 New Delhi Canadian High Commission 7/8 Shantipath Chanakyapuri New Delhi 110021 India Tel: (011) 91-11-4178-2288 Mumbai Consulate General of Canada Indiabulls Finance Centre Tower 2, 21st Floor Senapati Bapat Marg Elphinstone Road (West) Mumbai 400 013 India Tel: (011) 91-22-6749-4480 Beijing 19 Dong Zhi Men Wai Da Jie Chayoang District Beijing 10600 China Tel: (011) 86-10-5139-4126 Shanghai Canadian Consulate General ECO City Building 8th floor, 1788 Nanjing Xi Lu Jing An District Shanghai, 200040 China Tel: (011) 86-21-3279-2800 Singapore 12 Marina Boulevard #34-04 Marina Bay Financial Centre Tower 3 Singapore 18982 Tel: (011) 65-6854-5900 |
|
| EDC Annual Report 2016 149 |
Mandate
| | |
| EDC helps Canadian companies go, grow, and succeed in their international business. As a financial Crown corporation, EDC provides financing, insurance, bonding, trade knowledge, and matchmaking connections to help Canadian companies sell and invest abroad. EDC also provides financial solutions to buyers of Canadian goods and services around the world. | | |


| | | | |
| |
| | Photo Credits Covers/tables of contents, ©iStock/iSci; pages 7 & 9, © Martin Lipman; page 10/11, © iStock/ferrantraite; page 13, courtesy of LED Roadway Lighting/Alexandre Marchetti; page 15, courtesy of Vizimax; page 17 courtesy of ecobee; page 19, courtesy of IFRC; page 21, courtesy of AGT; page 23, courtesy of LCI Education Network; pages 24 – 31, © Martin Lipman; page 32 (left to right), courtesy of Shopify, courtesy of IL&FS Transportation Networks Limited (ITNL); page 33, courtesy of Brookfield Renewable Power; page 34 (top to bottom), courtesy of Temporal Power, courtesy of Green Power Labs, courtesy of Electrovaya; page 35, © Alamy Stock Photo/bama; page 36, © Alamy Stock Photo/Hemis; page 37, 39, 50, 51, 86, ©Martin Lipman. |
| |
| | | EDC Employees Featured in This Report (in order from left to right) |
| | |
| | Page 24 | | Commercial Markets & Small Business: Ana Paola Guadarrama, Tom Prowse, Valerie Anka, Michael Ansara |
| | |
| | Page 26 | | (left) Global Trade: Bryan Sirois, Joan Hellard, Owen Hopkins |
| | |
| | Page 26 | | (middle) SME Transactions: Larissa Kabondo |
| | |
| | Page 26 | | (right) SME Transactions: Philippe Guénette, Sapna Popat Sitar |
| | |
| | Page 27 | | (left) International Business Development: Anna Popov, Marti Anne Falcone |
| | |
| | Page 27 | | (left/middle) International Business Development: Nathan Andrew Nelson |
| | |
| | Page 27 | | (middle/right) International Financing Guarantee: James Morgan, Marie-Eve Varin-Lacasse |
| | |
| | Page 27 | | (right) International Financing Guarantee: Vincent Landry, Jan Tutty |
| | |
| | Page 28 | | (left) Financial Institutions Team & Political Risk Insurance: Jean-François Lamoureux, Lesley Vair |
| | |
| | Page 28 | | (middle) Financial Institutions Team & Political Risk Insurance: Christophe Perrault, Jennifer Hum, Mikael Osborne |
| | |
| | Page 28 | | (right) Commercial Markets & Small Business: Ana Paola Guadarrama, Valerie Anka |
| | |
| | Page 29 | | (left) Corporate Finance & Control : Karen Gensey, Benoit Ouimet |
| | |
| | Page 29 | | (middle) Corporate Finance & Control : Vanitha Vallipuram |
| | |
| | Page 29 | | (right) Corporate Finance & Control : Rob Burns, Holly Avery, Marsha Acott, Michelle Emond |
| | |
| | Page 30/31 | | Global Trade: Rami Gabriel, Amal Hawa, Sonia Vieira, Anna Young, John Place |
| | |
| | Page 37 | | Environmental and Corporate Responsibility: Christine Belley, Ryan Wake, Rob Cameron |
| | |
| | Page 39 | | Treasury: (left row, left to right) Darren Poole, Nancy Kyte, Rimal Gaind, Guillaume Eckert, Susan Love |
| | | | (right row, left to right) Tracy MacIntyre, Marsha Loraas, Xianchang (David) Li, Ricardo Dubresil |
| |
| | Ce document est également disponible en français. |