EXHIBIT 3
Canada’s Bridge
to Global Trade and Investment
ANNUAL REPORT 2002
TABLE OF CONTENTS
Overview
For almost six decades, EDC has served Canadian exporters and investors of all sizes, from all sectors of the economy, doing business in up to 200 markets around the world. We offer a full range of financial products and services, tailored to meet customers’ needs.
Canada’s Bridge to Global Trade and Investment
During 2002, revelations of corporate malfeasance, just on the heels of September 11 (2001), heightened uncertainty associated with international trade. EDC fulfilled a critical role, helping customers expand their financial capacity, access relevant knowledge, identify opportunities and venture into global markets with confidence.
The following statistics represent a few highlights of EDC’s performance in 2002:
| • | | $51.2 billion in exports and international investments using EDC solutions |
| |
| • | | 7,223 customers served |
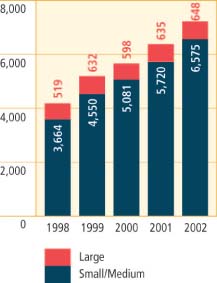
| | • | | 648 large customers |
| |
| | • | | 6,575 small and medium-sized customers |
| • | | $122 million net income |
| |
| • | | $24.6 billion total assets |
| |
| • | | $0 Parliamentary appropriation |
| |
| • | | $95 million dividend to shareholder |
| |
| • | | 992 average employee strength |
i
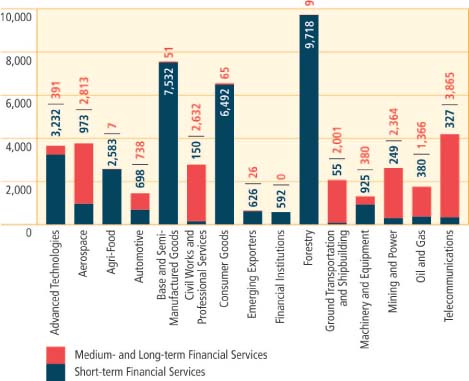
2002 Corporate Account Highlights
Business Volume by
Industry Sector
($ in millions) |
 |
| | | |
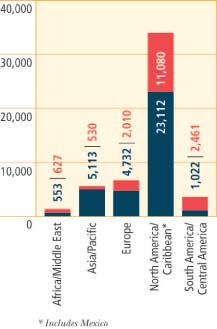
Business Volume by
Geographic Market
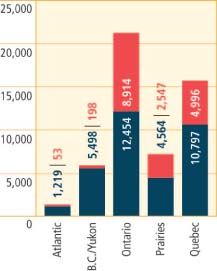
($ in millions) | | Business Volume by
Canadian Region
($ in millions) |
 | |  |
Five-Year Review
ii
| | | | | |
Business Volume
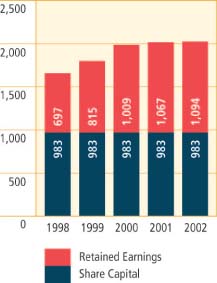
($ in millions) | | Shareholder’s Equity
($ in millions) | | Customers Served |
 | |  | |
 |
SME Scorecard
| | | | | | | | | | | | | | | | | |
| | | 2002 | | Target | | % Achieved | | 2001 |
| | |
| |
| |
| |
|
| SME – Customers served count (direct and indirect) | | | 6,575 | | | | 6,050 | | | | 109 | % | | | 5,720 | |
| SME – Business volume ($ millions) | | | 9,698 | | | | 7,800 | | | | 124 | % | | | 7,670 | |
| Emerging Exporters (EE) – number of new customers | | | 818 | | | | 800 | | | | 102 | % | | | 743 | |
| EE – average credit approval turnaround time | | 2 days | | | — | | | | — | | | 2 days |
| | | | | |
| SMEs as a Percentage | | SME Volume by | | SME Product Usage |
| of EDC’s Customer Base | | Geographic Market | |
|
 | |  | |  |
| | | | | |
| Number of SME | | Volume Support | | SME Service |
| Customers | | for SMEs
($ in billions) | | Attribute Ratings
(%) |
 | |  | |  |
Helping small and medium-sized enterprises (SMEs) expand and grow their business in international markets is a top priority for EDC. No company is too small to export, and no exporter is too small for EDC. The Emerging Exporters (EE) Team, which signed 818 new accounts receivable insurance customers in 2002, specializes in serving businesses with up to $1 million in annual export sales. In total, the EE Team now accounts for more than 50 per cent of EDC’s direct customer base.
iii
Contents
| | | |
| i | | Canada’s Bridge to Global Trade and Investment |
| | | |
| ii | | 2002 Corporate Account Highlights and Five-Year Review |
| | | |
| iii | | SME Scorecard |
| | | |
| | | 2002 Corporate Review |
| | | |
| 2 | | Message to the Shareholder |
| 9 | | Message from the Chairperson |
| 10 | | Performance Against Objectives |
| 14 | | Capacity |
| 16 | | Knowledge |
| 18 | | Opportunity |
| 20 | | Confidence |
| 22 | | Milestones 2002 |
Investor Relations
| | | |
| 23 | | Message to Investors |
| 24 | | Investor Relations |
| 25 | | Secure |
| 25 | | Experienced |
| 26 | | Debt Products |
| 26 | | Performance |
| 27 | | Liquidity |
| 27 | | Funding Program |
| | | |
| 28 | | Executive Management Team/Management Representatives |
| | | |
| 29 | | 2002 Financial Review |
| | | |
| 30 | | Management’s Discussion and Analysis |
| 54 | | Financial Reporting Responsibility |
| 55 | | Auditor’s Report |
| 56 | | Consolidated Financial Statements |
| 78 | | Five-Year Review |
| | | |
| 81 | | Board of Directors |
| | | |
| 82 | | Corporate Governance Practices |
| 85 | | Committees of the Board of Directors |
| | | |
| 88 | | Code of Business Ethics |
| | | |
| 90 | | Glossary of Financial Terms |
| | | |
| 91 | | Corporate Offices |
| | | |
| 92 | | Vision and Values |
Message to the Shareholder
| | | |
A. Ian Gillespie
President and Chief Executive Officer | |  |
Against a backdrop of continued economic and financial market uncertainty and geo-political tensions, EDC’s role as a steadfast bridge to international success and competitiveness proved to be more important than ever in 2002.
2
Canada’s Bridge to Global Trade and Investment
The risks associated with international trade increased significantly post-September 11, 2001. In 2002, a series of new concerns — particularly revelations of corporate malfeasance — pushed uncertainty to a whole new level. For Canadian exporters, the fallout included border delays, higher insurance rates and renewed signs of trade protectionism, all of which translated into higher risks and costs.
Overall, Canadian companies experienced lower export sales in 2002. Despite this decline, EDC carried out $51.2 billion in business volumes on behalf of Canadian companies during 2002, an increase of 16 per cent over the 2001 level of $44.3 billion. This is not entirely surprising, since Canadian companies engaged in international trade had an increased stake in managing their trade risk in 2002, and they faced a greater need for financial intermediation.
EDC business volumes in 2002 were equivalent to 11 per cent of total Canadian exports of goods and services — up from 9.4 per cent in 2001. The increase comes from the fact that while overall Canadian exports were down in 2002, EDC volumes continued to grow.
In keeping with our mandate to facilitate Canada’s trade and investment agenda, EDC continued to serve Canadian exporters and investors of all sizes and from all sectors of the economy by helping to expand financial capacity, access relevant knowledge, identify opportunities and venture into global markets with confidence.
We served 7,223 customers in 2002, doing business in 182 countries and territories. A majority of the Canadian companies using our services were small and medium-sized companies (SMEs). We worked with 6,575 SMEs, an increase of 855 new SME customers over the previous year. The total volume of SME transactions amounted to $9.7 billion, an increase of $2 billion over SME business volumes in 2001.
3
Building Capacity
While exporter needs vary depending on their size and industry sector, EDC remains focused on finding ways to build capacity for Canadian companies across the board.
Today, global competitiveness increasingly hinges on being able to participate in global supply chains. For larger customers, this often means having the capacity to establish manufacturing facilities abroad, and to merge, create alliances, enter partnerships or participate in joint ventures. In some cases, the majority of content of a particular export may be produced outside of Canada, but we will facilitate a transaction as long as there are sufficient Canadian benefits associated with it.
Over the years, EDC’s Canadian benefits policy has evolved to keep pace with the way international trade is conducted in an increasingly globalized environment. Canadian benefits are not defined exclusively in terms of Canadian content. Today, other benefits such as future trade creation, R&D investment, higher-quality jobs in Canada, sub-supply for smaller Canadian firms and the maintenance of international market share are more important than ever.
In 2002, we better positioned ourselves to address the evolving needs of exporters by launching our first web-based products, EXPORT Check and EXPORT Protect. Both products enhance the accessibility and timeliness of our short-term insurance services. In 2003 we will launch GLOBEX, a new application that will automate short-term underwriting processes and will give us a solid foundation for further “webifying” delivery of our insurance services. Across all our teams, we are continually updating and adding new risk management tools.
To further enhance our ability to serve exporters, we continued to leverage our private and our public sector partnerships. In 2002, EDC developed and executed a strategy to expand our working capital solutions through the banking network, geared primarily to serving SMEs. Through Canadian risk-sharing partnerships, we continued to make working capital solutions available to smaller businesses and increase our partners’ involvement in international transactions. For example, we expanded our two-year partnership with i-Trade Inc., a Canadian private trade finance provider, resulting in increased access to working capital and cash flow for EDC policyholders.
By pursuing reinsurance treaties with both public and private international partners, we continued to extend the global reach of Canadian companies and minimize their risk in third countries. Reinsurance agreements were finalized with our counterparts in Italy (SACE) and the Netherlands (Gerling-NCM), making it easier and less costly for exporters in all three countries to access the support they need to close their deals.
We also continued to develop our public sector partnerships, to enhance our ability to provide Canadian business with seamless and practical access to a full range of international business development services offered by the Government of Canada. In addition to maintaining our close relationships with the Department of
| | | |
| EDC’s new web-based products, EXPORT Check and EXPORT Protect, enhance the accessibility and timeliness of our short-term insurance services. | |  |
4
Foreign Affairs and International Trade, Department of Finance, Industry Canada, other financial Crown corporations and provincial and municipal governments engaged in trade advisory or business development activities, we became an Executive Member of Team Canada Inc.
Knowledge sharing
In today’s increasingly integrated global economy, rapidly changing economic, market and political conditions generate an endless stream of data and opinion that can challenge the knowledge resources of even the largest of corporations. EDC is a recognized centre of international trade finance expertise, offering the knowledge capacity that our customers need to manage uncertainty and risk in global markets.
From a geographic standpoint, our economists continued to offer customized political risk and investment assessment services that gave our customers real and meaningful insight on specific countries and sectors. Our semi-annual Let’s Talk Risk Workshops and Executive Roundtables were delivered in 16 major cities across Canada, complemented by national distribution of our Global Export Forecast and Trade Confidence Index. These, plus our new EXPORT Market Insight service, were central to our efforts to package our information in formats that are relevant, useful and timely for our customers.
In addition, EDC’s sector-based approach to serving customers helps us continue to build in-depth knowledge. This enables us to anticipate emerging customer needs, so that we are better able to provide customized solutions and facilitate their efforts to do more business in more markets. Furthermore, it provides us with the insight we need to identify potential opportunities and bridge gaps in the current export landscape.
For example, EDC identified the environmental sector as having growth potential, and responded by launching its EnviroExport Initiative about four years ago. Today, we play a key role in expanding exports of Canadian environmental goods, technologies and services for some 200 customers. Last year alone, EDC’s trade finance and risk management services facilitated about $500 million in environmental industry exports and investments.
In other non-traditional export sectors, such as culture, we also expanded our support. The added dimension to EDC’s promotion of culture is the opportunity to showcase a key national strength. Canada’s culture helps define us as a nation and, in the face of today’s often homogenizing forces of globalization, we must use every opportunity to demonstrate our nation’s unique attributes. In fact, EDC took a hands-on approach to promoting Canadian culture in 2002, becoming the presenting sponsor of the Tom Thomson Exhibition at the National Gallery of Canada. In 2003, we will further enhance our support for Canadian culture by becoming the presenting sponsor for the National Arts Centre Orchestra’s fall tour of 10 cities in the United States and Mexico, which coincides with the tenth anniversary of the North American Free Trade Agreement (NAFTA).
| | | |
 | | Ian Gillespie in conversation with Alexandre Dubé, one of EDC’s 21 Education and Youth Employment (EYE) scholarship winners. |
5
In addition to seeking new ways to serve current exporters in 2002, EDC continued to foster the development of an export culture in Canada through education. This entailed a wide range of sponsorship and outreach activities, with special emphasis on providing learning and employment opportunities for youth. Last year, we expanded our university partnership program, increasing the number of partners to 25 (up from 18) and offering 21 international studies scholarships.
Seeking Opportunities
A central component of EDC’s public policy mandate is our commitment to better assist Canadian companies doing business in higher risk developing markets, where financial intermediation is less prevalent but where significant export growth potential exists.
In 2002, we strengthened EDC’s foreign market expertise by establishing permanent representation in Warsaw (Poland), and placing a second representative in Mexico — this time in Monterrey. EDC’s business volumes for Canadian firms selling to or investing in the Mexican market have almost doubled (from $1.2 billion in 1999 to $2.3 billion in 2002) since we established our first representation in Mexico City in 1999 to build on opportunities created by NAFTA.
These two new additions enhance our existing complement of representatives in Beijing (China), Sâo Paulo (Brazil) and Mexico City (Mexico). All are strategically placed to access several economies rich in opportunities for Canadians. In-market presence helps us develop firsthand, competitive intelligence, and identify opportunities for Canadian business. Plans are underway to place representatives in additional markets in 2003.
An important aspect of our developing market strategy lies in working directly with Canadian companies to back their international marketing activities. In 2002, we took part in five federal trade missions including two Team Canada excursions to Germany and Russia, and missions with the Minister for International Trade to Africa, India and Mexico. EDC also sponsored and participated in many market development activities that included additional trade missions and exporter outreach roundtables.
In 2002, EDC facilitated more than $9.9 billion of business in 152 developing markets. This represents a downward turn in EDC business volumes in higher risk markets compared to 2001 figures, which was consistent with the downturn in global demand. However, the number of customers using EDC services to expand their business in developing markets has risen steadily, reaching 1,370 last year (up from 1,278 in 2001). In 2003, we will continue our efforts to find new opportunities and partnerships in these markets.
All of these activities rely on the strength of our balance sheet, which in turn requires that we manage portfolio risk. We must diversify our exposures geographically and across industry sectors, while at the same time responding to specific needs within the Canadian economy. In 2002, two key sectors faced highly unusual economic conditions: aerospace and telecommunications. EDC has an established record of providing services to Canadian exporters in both the aerospace and telecommunications sectors, and last year we continued to
| | | |
| In 2002, EDC established permanent representation in Warsaw (Poland) and placed a second representative in Mexico, for a total of five international representatives. | |  |
6
deliver the trade finance services exporters needed, while managing the associated risks. Consistent with other financial institutions, EDC provisions against possible future loan losses and insurance claims by setting aside both specific and general allowances from its net income.
EDC’s net income in 2002 was $122 million, an increase from $58 million the previous year. The increase reflected income of $96 million as a result of the federal government reimbursing EDC for an amount equal to debt relief granted by the Government of Canada to poor countries for debts incurred with EDC in prior years. Lower cost of funds also contributed to the increase in net income. The impact of these factors was partially offset by increased provisions for credit losses required due to credit deterioration. Also during 2002, at the request of the federal government, EDC paid a dividend of $95 million.
Maintaining a healthy balance sheet in 2002 has positioned us to live up to our commitment of ensuring there is substantial and growing capacity in Canada’s financial system to meet the trade and investment finance needs of Canadian businesses.
Confidence
EDC takes great pride in our reputation for sustainability and integrity, particularly in today’s increasingly challenging global trade environment. An area that has always been an important priority, and is increasingly brought under scrutiny in this post-Enron environment, is business ethics. EDC has implemented a series of fundamental practices designed to ensure that we conduct our business based on a high standard of business ethics. Anti-corruption declarations, and the review of environmental and social impacts, have become integral to our processes when analyzing finance and insurance transactions.
Since its establishment in the fall of 2001, EDC’s Advisory Council on Corporate Social Responsibility has provided a regular forum for the review of emerging national and international standards for both the public and private sector and our own business practices. The Advisory Council meets semi-annually and is an important pillar of EDC’s overall stakeholder engagement strategy. EDC has taken significant steps to ensure that it obtains views from other stakeholders, including non-government organizations.
In 2002, EDC appointed its first Compliance Officer, to provide additional public accountability. The Compliance Officer’s role included establishing a compliance program for matters related to EDC’s disclosure policy, environmental review directive, and anti-corruption practices.
From a policy perspective, in 2002 we updated EDC’s environmental review procedures to ensure that the transactions we facilitate will comply with the requirements of the Environmental Review Directive, which was made part of the Export Development Act when it was amended in 2001. As part of this initiative, we strengthened our team of environmental specialists who review transactions being considered for EDC support and work with international organizations to advance the environmental and social requirements of projects in which Canadian suppliers may have an interest.
| | | |
 | | The review of environmental and social impacts has become integral to EDC processes when analyzing finance and insurance transactions. |
7
Since our introduction of a new disclosure policy in October 2001, as a means of providing greater public transparency on our operations, our web site has become a rich source of information about our aggregate business as well as about specific transactions. I am pleased that our customers have fully endorsed this approach, enabling us to achieve 100 per cent compliance from customers asked to consent to the public release of this information.
In addition to continuing to evolve and strengthen our own environmental review and disclosure procedures, we actively engage in discussions with export credit agencies in other countries. We seek to encourage greater transparency on project-related environmental information around the globe, and to ensure Canadian exporters, as leaders in these areas, are not put at a competitive disadvantage by Canada’s heightened requirements.
We provide clear direction with regard to the ethical standards applied to EDC business activities — to employees, customers and stakeholders — via our own Code of Conduct and Code of Business Ethics. EDC has also adhered to international anti-corruption initiatives such as the 1997 Action Statement by OECD export credit agencies, and to Canada’s anti-corruption legislation, The Corruption of Foreign Public Officials Act. To ensure effective implementation of these new obligations, we have trained staff, updated documentation and enhanced monitoring systems. We have informed our customers of requirements related to anti-corruption and have held workshops across Canada to encourage our customers to develop best practices in this area. In 2002, we also took steps to ensure our business practices conform with Canada’s obligations under the United Nations Security Council Resolution against terrorism.
Bridge to Global Markets
The people of EDC are dedicated to helping Canadian companies build bridges to global markets — working with them to find financial solutions, access relevant knowledge and access global opportunities. The demands we have placed on our employees have never been greater, the circumstances never more challenging, yet our employees have passed the test with flying colours once again. One measure of this is that they achieved a customer satisfaction survey score of 81.8 in 2002, up from 81.5 in 2001. My sincere thanks to each of you for your accomplishments last year, and for the enthusiasm you have shown in taking on even larger performance goals for 2003. I would also like to thank the Advisory Council on Corporate Social Responsibility for being an indispensable sounding board, and the Board of Directors for its unfailing and ongoing support.

A. Ian Gillespie
President and Chief Executive Officer
| | | |
| EDC is dedicated to helping Canadian companies build bridges to global markets. | |  |
8
Message from the Chairperson
When I joined the EDC Board of Directors on January 1, 2002, the corporation was heading into a challenging year. The Export Development Act, by which EDC is governed, had been recently amended in December 2001, following an extensive legislative review process. The resulting message was essentially: we like what you are doing EDC — do more of it. In 2002, during a slow and uncertain economic recovery, EDC continued to expand its ability to serve Canadian businesses of all sizes and across all sectors of the Canadian economy.
In talking with Canadian business people — and specifically EDC customers — it is evident that EDC has a unique and critical role to play within Canada’s export credit system. As Chairperson of EDC’s Board of Directors, I have a personal interest in helping EDC optimize this role. The Board has always helped to shape EDC’s strategic direction, and played an integral role during the legislative review process concluded in 2001.
In October 2002, the Board created a committee to conduct a strategic review. While the legislative review process studied EDC and its evolving role, the current strategic review will examine Canada’s export credit system and EDC’s place and function within that system. It will help determine how EDC can partner with others within Canada’s export credit system to ensure that optimal support from both the public and the private sectors is available to Canadian companies pursuing international business, for years to come.
In 2002, the corporation proved yet again that it is a dedicated and reliable partner for Canadian exporters and investors, as evidenced by the results in this report. Furthermore, EDC effectively managed its own portfolios and finances to maintain a solid financial base, enabling it to meet the current and future needs of its customers, and to fulfill the expectations of the shareholder and other stakeholders.
In closing, on behalf of the Board, I would like to congratulate the management team on EDC’s impressive ranking among the top 100 employers in Canada for the second year running. I would also like to thank the employees of EDC for their ongoing efforts to help Canadian businesses succeed in the increasingly competitive global marketplace. EDC has our commitment and support, as together we strive to enhance the availability and competitiveness of financial services for Canadian exporters and investors.

Paul Gobeil, FCA
Chairperson of the Board of Directors
9
Performance Against Objectives
Strategic Objectives 2002
Expand on EDC’s reputation for Corporate Social Responsibility (CSR)
| | Respond to the findings of the Legislative Review. |
| |
| | • | Strengthen EDC’s environmental review procedures. |
| |
| | • | Be mindful of Canadian international commitments. |
| |
| | • | Implement the disclosure policy. |
| |
| | • | Strengthen communication between EDC and the Department of Foreign Affairs and International Trade (DFAIT) with respect to human rights in countries where EDC conducts business. |
| |
| | • | Continue stakeholder engagement. |
| |
| | • | Build awareness of EDC’s new name and logo. |
Results
| | • | In 2002, EDC updated its environmental review procedures and its systems to ensure that supported transactions meet the legal requirements of the Environmental Review Directive (ERD). |
| |
| | • | EDC has taken steps to ensure that its customers are aware of Canada’s anti-corruption legislation, the Corruption of Foreign Public Officials Act and the OECD efforts in that regard, and that its business practices conform with Canada’s obligations under the United Nations Security Council Resolution against terrorism. |
| |
| | • | Enhanced aggregate and individual transaction reporting have been successfully implemented at EDC. Provisions for the disclosure of environmental and social impact information on projects took effect on May 1, 2002. |
| |
| | • | In 2002, EDC and DFAIT took steps to strengthen their channels of communications with respect to human rights developments in relevant countries. |
| |
| | • | EDC maintains a regular dialogue with a variety of stakeholders ranging from government and customers to non-governmental organizations, to seek their feedback on an array of issues. Significant progress was made in 2002, including: improvements to the CSR area of our web site; the addition of a compliance program; and sponsorship of a series of cross-Canada briefings on matters related to CSR. |
| |
| | • | Various communication tools were utilized to promote EDC’s new name, which instantly identifies the organization as a Canadian entity. |
10
Capture Opportunities for Canadian Companies
| | Enhance EDC’s products and service delivery to serve more Canadian companies operating internationally. |
| |
| | • | Increase the number of customers served to 6,800. Increase the number of SMEs served to 6,050. |
| |
| | • | Introduce expanded e-services, in particular for SMEs. |
| |
| | • | Enhance EDC’s distribution channel strategy to reach more companies and optimize service to customers (EDC sales force; its brokers and bank partners; e-business channels). |
| |
| | • | Achieve a Customer Satisfaction Index (CSI) rating of 80.0. |
Results
| | • | A total of 7,223 customers were served, an increase of 14 per cent over 2001. Of these customers, 6,575 were SMEs, a 15 per cent growth over 2001. |
| |
| | • | EDC introduced two new on-line products in 2002, EXPORT Check and EXPORT Protect, our first fully automated trade finance products. |
| |
| | • | Several financial institutions signed master facility agreements relating to EDC’s pre-shipment financing program for small business. As for e-business channels, seven new portals to EDC were built from association web sites to provide easy links to EDC for association members. |
| |
| | • | EDC’s customers once again expressed high levels of satisfaction with EDC. The 2002 CSI came in at a record 81.8, up from 81.5 last year. |
| | Leverage EDC’s reputation for leadership and excellence and provide value-added support to Canadian companies selling or investing abroad. |
| |
| | • | Support $40 billion or more in volume of exports and investments. |
| |
| | • | Develop and implement an integrated country sectors strategy to build a platform for increased support to developing markets. In 2002, support $9.5 billion or more business in developing markets. |
| |
| | • | Expand presence abroad. |
Results
| | • | EDC continued its partnerships with Canadian companies by facilitating $51.2 billion of their export and investment business, representing a 16 per cent increase over 2001 volume. |
| |
| | • | EDC expanded its developing markets tool kit and initiated new partnership approaches with exporters in support of its integrated country sectors strategy. Business concluded in 2002 exceeded the target, $9.9 billion versus $9.5 billion, but represents a decrease of 10 per cent compared to 2001 results. The decrease was primarily due to financial crises in key markets which saw a reduced level of export activity in 2002. |
| |
| | • | EDC increased its foreign representation from three to five in 2002, adding permanent resources in both Warsaw, Poland and Monterrey, Mexico. |
| | Add financial and/or service capacity by expanding the network of partners. |
| |
| | • | Implement the broker and banker strategies. |
Results
| | • | In 2002, a strategy was developed and executed to expand EDC’s working capital support through the banking network. |
11
Strategic Objectives 2002
Financial Health
| | Carefully manage financial risks to ensure that EDC remains financially sound, to support future business. |
| |
| | • | Net loss of $159 million. |
| |
| | • | Financial Sustainability Ratio (FSR) of 12.3 per cent. |
| |
| | • | Internal Efficiency Ratio (IER) of 20.7 per cent. The IERs reported in EDC’s 2002 and 2003 Corporate Plans were 20.0% for 2002 and 17.0% for 2003. Subsequent to the publication of the 2003 Corporate Plan, the calculation basis for the IER was modified as explained on page 35 of this Annual Report. The strategic objectives have been revised to reflect the change in calculation basis. |
| |
| | • | Return On Equity (ROE) of -9.2 per cent. |
Results
| | • | EDC achieved a net income of $122 million. All our financial results in 2002 were better than forecast under the Corporate Plan. The Plan was developed soon after the events of September 11 when it was nearly impossible to predict how 2002 would unfold. |
| |
| | • | An FSR of 13.9 per cent was achieved. |
| |
| | • | The IER came in at 17.4 per cent. |
| |
| | • | An ROE of 5.9 per cent was attained. |
12
Internal Readiness
| | Ensure adequate resources and efficient internal processes to deliver results. |
| |
| | • | Maintain voluntary turnover rate of less than 10 per cent. |
| |
| | • | Invest an average of five training days per employee. |
| |
| | • | Broaden awareness of EDC as an employer of choice. |
| |
| | • | Introduce flexibility in the employee benefits program. |
| |
| | • | Target an improvement in key areas with respect to the employee survey. |
Results
| | • | The turnover rate came in at a record low of four per cent. |
| |
| | • | On average, employees received five days of training. |
| |
| | • | For the second year in a row, EDC was recognized as one of the “Top 100 Employers” in Canada. This public recognition enhances EDC’s employment brand and helps attract the best people. |
| |
| | • | A review of EDC’s benefits programs was completed and a new design was proposed. |
| |
| | • | A Climate Pulse Check was administered to all EDC employees to measure progress against key areas. The results will be available in the first quarter of 2003. |
Improve productivity and service with technology.
| | • | Continue to capitalize on high growth opportunities in E-Business including more “self-service” to our short-term insurance customers. |
| |
| | • | Expand on our capabilities within our Treasury function. |
| |
| | • | Continue automation of the Medium- and Long-Term Financial Services areas. |
| |
| Results |
| |
| | • | In October, EDC launched its new Receivable Insurance Centre, where our customers can perform a variety of insurance-related functions online. |
| |
| | • | With Treasury’s enhanced pricing capabilities coupled with its aggressive investor relations initiative, EDC executed in excess of 100 transactions worldwide to fund Canadian exports. |
| |
| | • | EDC enhanced the automated authorization process for its financing products from time of enquiry to time of signing, and continued to upgrade the existing automated underwriting processes for its insurance products. |
Strategic Objectives 2003
Operate in a Socially Responsible Manner
| • | | Engage Non-governmental Organizations stakeholders on a quarterly basis on CSR issues. |
| |
| • | | Host an international workshop on “Reputation Risk Management” for members of the Berne Union. |
| |
| • | | Raise the profile of the compliance program. |
| |
| • | | Continue to actively promote the disclosure of information on projects for which EDC is considering providing support. |
| |
| • | | Continue to strengthen EDC’s environmental review procedures in preparation for a special audit of the implementation of the ERD. |
Grow EDC’s Customer Base and Enhance our Customer Service Proposition
| • | | Implement a brand positioning campaign with our new advertising agency. |
| |
| • | | Create a proactive Small Business brand image and improve prospecting and service process efficiencies. |
| |
| • | | Develop a proactive relationship management strategy for key customers. |
| |
| • | | Expand geographic representation in both domestic and international markets. |
| |
| • | | Enhance EDC’s tool kit. |
| |
| • | | Increase the number of customers served to 8,000. |
| |
| • | | Increase the number of SMEs served to 7,200. |
| |
| • | | Achieve a Customer Satisfaction Index (CSI) rating of 80.0. |
Expand our support of Canada’s trade and investments abroad.
| • | | Raise awareness of EDC’s activities and promote EDC’s interest and capabilities in developing markets in order to proactively pursue more business in these markets. |
| |
| • | | Expand the use of partnerships with both the private and public sector in order to create capacity to support more business. |
| |
| • | | Enhance risk-sharing products with financial institutions. |
| |
| • | | Support $54.5 billion or more in volume of exports and investments. |
| |
| • | | Support $11.75 billion or more business in developing markets. |
Manage in a Financially Prudent Manner
| • | | Net income of $190 million. |
| |
| • | | FSR of 13.0 per cent. |
| |
| • | | Internal Efficiency Ratio of 19.8 per cent. The IERs reported in EDC’s 2002 and 2003 Corporate Plans were 20.0% for 2002 and 17.0% for 2003. Subsequent to the publication of the 2003 Corporate Plan, the calculation basis for the IER was modified as explained on page 35 of this Annual Report. The strategic objectives have been revised to reflect the change in calculation basis. |
| |
| • | | ROE of 8.4 per cent. |
Resource to Deliver Results
| • | | Maintain voluntary turnover rate of less than 10 per cent. |
| |
| • | | Invest an average of five training days per employee. |
| |
| • | | Rank above high-quality organizations for the majority of elements measured on EDC’s employee opinion survey. |
| |
| • | | Create a compelling career choice. |
| |
| • | | Continue to develop outstanding leaders. |
Improve productivity and service with technology.
| • | | Continue to focus on E-Business: make the internet an effective information channel; enhance customer service by “webifying” all parts of our short-term insurance value chain; and sell credit and financial services online. |
13

| | | |
| EDC’s Regional Vice-President for western Canada, Lewis Megaw (left),with Robert Ohlson, President, Niko Resources Ltd. | |  |
“EDC frees up cash and working capital for Niko by providing performance guarantees to our banks. This in turn gives us the capacity to undertake more contracts, and expand our use of Canadian supplies and services.’’
| | Robert Ohlson, President,
Niko Resources Ltd.
Calgary, Alberta |
14
Capacity
For many Canadian businesses, international trade offers far greater potential to expand and succeed than focusing on the more limited domestic market. To compete in global markets, these businesses need the capacity to establish operations abroad and to enter into partnerships.
More than almost any other industrialized country in the world, Canada’s economic prosperity depends on its ability to maintain and expand its trade capacity. Canada’s economy relies heavily on international trade, with exports representing 43 per cent of Canadian GDP. About 30 cents of every dollar earned by Canadians, and one out of every five jobs, is associated with the export of goods and services.
EDC remains committed to its vision: to be the recognized leader in providing ground-breaking commercial financial solutions to companies of all sizes, helping them succeed in the global marketplace and create enduring prosperity for Canada.
To encourage more companies to compete in global markets, EDC offers a range of products and services, including trade finance and risk management solutions. Its export insurance provides protection against non-payment, and is used extensively by the small and medium-sized companies that make up 91 per cent of EDC’s customer base.
For larger, more long-term projects, foreign buyers are increasingly looking to their suppliers for alternative sources of financing. EDC’s financing solutions can give Canadian exporters a competitive edge in these situations. To provide Canadian exporters with the broadest possible access to capital, EDC works together with Canadian banks to help finance opportunities for Canadian companies in global markets.
EDC was able to provide this type of financing advantage to Niko Resources Ltd., a Calgary-based oil and gas company. Niko operates oil and gas fields located in India, and its Indian operations account for 99 per cent of the company’s total revenue. The company typically begins by drilling low-risk development wells and reworking existing wells, then expands into exploration and development operations — and all of these stages employ Canadians.
During the exploration phase, Niko requires a financial guarantee to meet its contractual obligations with the government of India. EDC provides Niko’s bank with an annual Performance Security Guarantee, rather than the bank putting a lien on the company’s own funds for security. This frees more of Niko’s cash and working capital to enable it to pursue other opportunities — a very real advantage, given its foothold in India, the world’s sixth largest energy consumer.
| | | |
 | | Bridge to China
“While a revival in world markets for agriculture, telecom and transportation should help restore Canadian exports to China back to their previous levels, it will take a stronger commitment of Canadian capital and technology to enhance capacity and ensure we enjoy a sustained and expanding share of China’s import market.”
Alison Nankivell,
EDC’s Regional Director for China (Beijing, China) |
15

| | | |
 | | EDC’s Regional Vice-President for Quebec, Françoise Faverjon-Fortin, with Jean-Pierre Dion, Financial and Corporate Events Manager, Cirque Éloize |
“EDC has proven to us that they are not just ‘money’ people — they are creative and they are able to provide creative solutions. This opened up new opportunities to partner with us.’’
| | Jean-Pierre Dion, Financial and Corporate Events Manager,
Cirque Éloize
Montreal, Quebec |
16
Knowledge
EDC’s sector-based approach to serving customers enables it to build in-depth knowledge of individual sectors and enhances the corporation’s ability to provide customized solutions. In some cases, sector knowledge helps EDC to identify other potential growth sectors, and to bridge gaps in the current export landscape.
In recent years, EDC has expanded its customer base and facilitated a range of non-traditional exports, such as film and television, multimedia and the performing arts. Typically, these companies come to EDC for insurance to protect them against non-payment or contract frustration, on a specific contract or transaction. EDC can also provide bonding, which protects the customer’s bank.
Initially, insurance and bonding were the types of services that EDC offered to Cirque Éloize. This circus company approached EDC to insure Excentricus, a show encompassing circus arts, theatre and music. However, working closely with Cirque Éloize gave EDC further insight into how it could customize more of its services to meet additional needs.
While it was producing its latest creation, Nomade, Cirque Éloize became the first company in the entertainment industry to take advantage of EDC’s pre-shipment financing, an EDC product designed to finance work in progress. Financing is required during the development stage of each new production to cover costs such as salaries, props, lighting, special effects, costumes, choreography, music and travel.
Through pre-shipment financing, EDC can guarantee up to 75 per cent of a loan needed to finance a product — whether its something that comes in a box or something less tangible like the productions of Cirque Éloize. EDC can also partner with other financial institutions to enhance support for an exporter. In the case of Cirque Éloize, a partnership between La Caisse d’économie Desjardins de la culture and EDC’s Small Business Financial Solutions Team, helped guarantee part of Cirque Éloize’s line of credit, so they could obtain needed working capital.
Other non-traditional export sectors offer significant growth opportunities as well. In 2002, EDC identified tourism as one such sector. In-bound tourism is valued at more than $16 billion annually, and accounts for almost 30 per cent of Canada’s total services exports. EDC is promoting its insurance services to tourism operators, as a means of facilitating in-bound tourism business to Canada. Tourism is a departure from the traditional definition of exporting, expanding it to encompass Canadian services purchased by foreign buyers — in transactions that take place on Canadian soil.
| | | |
 | | Bridge to Mexico
“To develop an effective market expansion strategy, you need three key types of intelligence: market intelligence, customer intelligence and competitor intelligence. The constant turmoil of today’s markets makes accurately gathering this kind of knowledge challenging, but even more essential to understanding the forces at play.”
Marvin Hough (left), EDC’s Regional Director for Mexico
and Central America (Mexico City, Mexico)
Noé Elizondo, EDC’s Regional Manager for Monterrey (Monterrey, Mexico) |
17

| | | |
| EDC’s Regional Vice-President for Atlantic Canada, David Surrette (right), with Martin Karlsen, President and Owner, Karlsen Shipping Company Limited and Polar Star Expeditions | |  |
“Without EDC financing, this project would not have happened in Canada. The conversion of the Polar Star would have been done elsewhere, likely in Poland, and Canadian shipyard workers would not have had the job opportunities.”
| | Martin Karlsen, President and Owner,
Karlsen Shipping Company Limited and Polar Star Expeditions
Halifax, Nova Scotia |
18
Opportunity
In today’s global marketplace, export and investment opportunities are as diverse as the companies pursuing them. Increasingly, EDC has found ways to facilitate transactions that help create new and innovative possibilities for Canadian companies.
Helping Canadian companies engage in international trade extends well beyond facilitating the export of goods or services to other countries. While that is the traditional concept of trade, it represents a gradually shrinking proportion of it.
Among the many Canadian companies which have adapted and evolved accordingly are Halifax-based Karlsen Shipping Company and its spin-off, Polar Star Expeditions. Founded more than 100 years ago, Karlsen Shipping traditionally operated fishing, offshore support and other vessels. In 2001, it expanded operations to include the adventure travel industry, with the launch of Polar Star Expeditions.
Karlsen Shipping had previous experience in Arctic tour operations, having chartered a vessel to a tour operator in Spitzbergen, north of Norway. It took about five years of searching before the company found the ‘Njord’ (now called the ‘Polar Star’) to purchase and convert into a tour boat. Since its commissioning in 1969, the ship had served as an icebreaker and training ship with the Swedish Navy and Coast Guard.
In addition to shopping around for a vessel to purchase, Karlsen Shipping researched financing options and came across EDC. The corporation financed the transaction through Karlsen’s foreign affiliate, and the ship conversion was done at the Verreault Navigation shipyard of Les Mechins, Quebec. Benefits to Canada included the labour and a portion of the supplies required to modify the former icebreaker, converting it into a passenger ship with a capacity of 100. Today, the Polar Star provides expedition cruises to the Arctic, Antarctic and other destinations.
The Canadian benefits associated with the financing for conversion of the Polar Star are among the types of less traditional Canadian benefits now being taken into consideration in the evaluation of transactions. Recognizing that Canadian benefits can no longer be defined exclusively in terms of Canadian content, the economic impact of other benefits such as future trade creation, R&D investment, higher-quality jobs in Canada, sub-supply from smaller Canadian firms and the maintenance of international market share are increasingly being taken into account in EDC’s decisions.
| | | |
 | | Bridge to Central and Eastern Europe
“In general, prospects for economies throughout Central and Eastern Europe have brightened considerably during the past two years. With a combined population of more than 300 million, comprised of people well aware that goods and services can make life more enjoyable, these countries are ripe with opportunity.”
Dennis Goresky,
EDC’s Regional Director for Central and Eastern Europe
(Warsaw, Poland) |
19
| | | |
 | |  |
| | | EDC’s Regional Vice-President for Ontario, Ruth Fothergill,
with Douglas Langley, Vice-President, Delcan Corporation’s
Environmental Division |
“For financing, we depend on EDC to supplement our private sources of capital. In Venezuela alone, EDC has already financed a half a dozen of our projects in the environmental sector, including design/build, equipment procurement and management of municipal wastewater treatment plants.”
| | Douglas Langley, Vice-President,
Delcan Corporation’s Environmental Division
Toronto, Ontario |
20
Confidence
Business ethics have always been an important priority for EDC. The corporation has implemented a series of fundamental business practices designed to ensure that it maintains its high ethical standards. This in turn helps build confidence among Canadian exporters and investors, as well as their foreign buyers and partners.
Sustainable trade is top-of-mind in today’s global arena, brought to the forefront by the United Nations’ Kyoto Protocol and events such as the World Summit on Sustainable Development held in 2002. At EDC, the review of environmental and social impacts, and anti-corruption declarations, have become integral to its analysis of finance and insurance transactions. Last year, EDC appointed a Compliance Officer to address these issues, provide advice to EDC, and to oversee compliance audits.
EDC’s compliance program serves as a bridge between all stakeholders and certain public policy initiatives of EDC. All stakeholders, including customers, may avail themselves of EDC’s compliance program to satisfy themselves as to the integrity of EDC’s initiatives. During 2002, the inaugural year of the program, two complaints were received.
The environmental industry presents a wealth of opportunities to Canadian firms that supply innovative environmental products or services. In recognition of the growth potential within this sector, EDC launched its EnviroExport Initiative about four years ago. Today, EDC plays a key role in expanding exports of Canadian environmental goods, technologies and services for some 200 customers. Last year alone, EDC’s trade finance and risk management services facilitated about $500 million in environmental industry exports and investments.
Canadian firms are achieving recognition for their expertise in developing water and wastewater treatment technologies, handling liquid and solid wastes, and manufacturing environmental equipment. For example, Delcan Corporation — a key player in rehabilitating lakes and giving people access to potable water in many parts of Latin America — was named winner of the Industry Award for Export Performance at GLOBE 2002. Canadian expertise in environmental engineering and environmental consulting is also in high demand.
Many environmental exporters use EDC’s short-term credit insurance, which protects them against non-payment by foreign buyers, covering up to 90 per cent of the loss. However, EDC can also provide insurance of service contracts and coverage of bid and performance bonds, political risk insurance, and some types of financing.
| | | |
 | | Bridge to Brazil and Southern Cone
“Shortly after Brazil’s new government assumed power last year, the country’s currency improved, as did investor confidence. With the renewed focus on fostering change in the macroeconomic condition of Brazil, a Canadian proposal that complements goods and services with partnerships, transfer of technology and investment is clearly a winning combination.”
J. Claudio Escobar,
EDC’s Regional Director for Brazil and Southern Cone Countries
(Sâo Paulo, Brazil) |
21
Milestones 2002
| | | |
 | | EDC was the presenting sponsor of an exhibit of Canadian artist Tom Thomson’s work, at the National Gallery of Canada in Ottawa. We believe that support of our Canadian identity, including our cultural identity, contributes significantly to the success of Canadian exporters and investors. The exhibit drew more than 105,000 visitors, a quarter of whom were from outside of Canada. |
Community Milestones
| • | | EDC’s annual United Way/Healthpartners Campaign raised over $135,000. In addition, this year more than 60 EDC employees donated their time, participating in the Day of Caring hosted by the United Way and Volunteer Ottawa in October. |
| |
| • | | 85 per cent of EDC employees participated in the 2002 Commuter Challenge, using environmentally friendly alternatives to get to work, and earning EDC first place in our category (government company with 100-1,000 employees). This resulted in the selection of EDC’s Fitness Centre as the launch site for the City of Ottawa’s second annual Gottawalk campaign. |
| |
| • | | As part of its Education and Youth Employment strategy, EDC: |
| | • | | sponsored the Junior Team Canada program, which enabled 1,600 students to attend training centres across Canada; sent 60 delegates on Economic Missions to Mexico, China and the Philippines; and sent three delegates on the Prime Minister’s Trade Mission to Russia. |
| |
| | • | | expanded its University Partnership program from 18 to 25 partners across Canada, and offered 21 International Studies Scholarships. |
| |
| | • | | launched its Go Global: Youth Trade Challenge, an essay contest enabling Canadian youth 18-25 to share their ideas on international trade, offering a total of $11,000 in prizes. Some 350 youth took part in the discussions and essay contest and more than 6,000 visitors logged onto the web site. |
Corporate Milestones
| • | | EDC established permanent representatives in Warsaw, Poland and Monterrey, Mexico, to better serve Canadian companies and their buyers in those markets. These two new additions enhance our existing complement of representatives in Beijing (China), Sao Paulo (Brazil) and Mexico City (Mexico). |
| |
| • | | EDC appointed a fourth Regional Vice-President in Canada, this one to serve the Atlantic region. |
| |
| • | | EDC’s Compliance Officer established a compliance program for matters related to EDC’s disclosure policy, environmental review directive, and business ethics program. |
| |
| • | | EDC was ranked by Macleans’ magazine among the top 100 employers in Canada for the second year in a row, with its employee newsletter making the top 10 for a second time. |
| |
| • | | EDC implemented its revised Environmental Review Directive (ERD), establishing objective and systematic practices for conducting environmental reviews of projects being considered for financing or political risk insurance services. |
| |
| • | | EDC launched its first web-based products, EXPORT Check and EXPORT Protect. |
| |
| • | | EDC became an Executive Member of Team Canada Inc. |
| |
| • | | EDC’s 2001 Annual Report received the Auditor General of Canada’s Award for Excellence in Annual Reporting — this is the fifth time in nine years that EDC has received the award. |
22
Message to Investors
| | | |
Marie MacDougall
Vice-President and Treasurer | |  |
For more than 50 years, Export Development Canada (EDC) has facilitated steady growth in Canadian exports. Such strong performance is the result of a business strategy that seeks to balance growth in three areas — customers, capacity and people.
We continue to look for opportunities to develop new products and services to meet customer needs. Recently, EDC added internet-based services, delivery partners and knowledge products, responding to customer needs in competitive markets around the world. As a result, our customer base continues to expand.
Our financial capacity is a critical element of our growth strategy. As Canada’s export volumes continue to expand, EDC must ensure that the strength of its balance sheet keeps up with the increasing demand for its services. Shareholder’s equity has grown steadily and in 2002 reached CAD 2.1 billion. Our total assets were CAD 24.6 billion in 2002, and we continue to prudently manage portfolio risk by diversifying our exposures both geographically and across industry sectors.
The third element of our strategy is our people. We have the largest pool of trade finance talent in Canada. The bottom line is that EDC is a well established financial institution, with more than five decades of solid growth and strong financial performance.
Two years ago, EDC launched a global investor relations initiative and since that time EDC executives have met with 200 investors in Asia, Europe and Canada. Our web site contains information of interest to current and prospective investors. In 2002, EDC conducted a direct mail campaign to more than 1,000 professional bond managers to inform them of EDC’s funding activities in the domestic market. Our aim is to better understand their requirements and structure our funding program to incorporate their feedback.
EDC’s credit rating was upgraded to Aaa/AAA, contributing to increased demand for our debt securities. Our total funding programs were targeted to reach USD 8 billion in 2002. We focused our efforts on selected markets, including Canada, Asia, Europe and the United States and raised USD 7 billion. Given international demand we launched USD 1 billion of long-term debt into the global capital market.
In 2003, EDC will raise USD 5.5 billion in long-term debt and will operate a USD 2.5 billion commercial paper program, targeting Canada, the United States, Asia and Europe. We will continue with our enhanced global investor relations program in 2003, ensuring investors have access to the information they need to make informed investment decisions.
As you weigh the various investment choices for your portfolio, please consider the comparative advantages of EDC bonds. EDC is a leading provider of risk-free debt securities and provides a broad range of products through financial institutions or private placements directly with investors. EDC not only provides vital services to Canadian exporters — it makes an excellent choice for your portfolio.

Marie MacDougall
Vice-President and Treasurer
23
Investor Relations
EDC debt securities offer many comparative advantages for investors
Innovative
EDC continues to strengthen its relationships with investors around the world through direct contact and dialogue.
Relationships with the investment community are essential to EDC. Ensuring investors are well-informed of EDC’s investment products and services further strengthens those relationships. To that end, EDC executives met with over 100 investment dealers and bankers in London last year, enhancing EDC’s name recognition in a key market. Relationship building efforts continued in Toronto where EDC met with partners from financial institutions and the investment community to acknowledge their key role in the success of EDC’s borrowing program.
In September, EDC executives held inaugural meetings with institutional investors in Beijing presenting EDC’s borrowing program. In Tokyo, EDC conducted a road show with more than 50 investors and 30 representatives from Japanese security houses. To further enhance its investor relations efforts, meetings took place with regional financial institutions in the Nagoya region.
Executives also met with banks, insurance companies and fund managers from across Canada to better understand their investment needs. Feedback from these investors has been invaluable in guiding the development of a responsive borrowing strategy.
Keeping our investors informed of EDC’s role in supporting Canadian exporters and the benefits of EDC debt securities remains a key priority. Our web site provides information for current and prospective investors in multiple languages, and is located at www.edc.ca/invest. Our longstanding commitment to transparency and reporting excellence guides the development of our web site content. In 2002, EDC introduced enhanced functionality to our web site such as:
| • | | Capital Markets Activity Report — an updated list of recent trades |
| |
| • | | Credit Spread History — to demonstrate spread performance of selected issues |
| |
| • | | Bond Report — indicative rates for structured products |
In 2003, EDC will expand the web site content to include:
| • | | Call monitor — an updated list of bonds to be called |
| |
| • | | Order book distribution on recent issues |
| |
| • | | Complete list of EDC’s Treasury team members with contact information |
www.edc.ca/invest
24
Secure
Aaa/AAA Rating
The ratings for the debt of EDC reflect its status as an agent of Her Majesty in right of Canada; as such, EDC’s debt is an irrevocable full faith and credit obligation of the Canadian government.
In 2002, Moody’s Investor Service and Standard & Poor’s upgraded Canada’s ratings to Aaa/AAA. The ratings upgrades were based on:
| • | | Canada’s track record of improving public-sector finance levels; |
| |
| • | | the shift of Canada’s current account balance into a surplus allowing its net liability position to improve; and |
| |
| • | | diminishment of contentious constitutional issues. |
In conjunction with the Government of Canada upgrade, the ratings of Export Development Canada debt securities were also upgraded to Aaa/AAA.
In 2002, the Japan Credit Rating Agency conducted an assessment and re-confirmed its AAA rating of EDC’s debt securities.
| | | | | | | | | | | | | | | | | |
| | | Domestic | | Foreign Currency |
| | |
| |
|
| | | Long-term | | Short-term | | Long-term | | Short-term |
| | |
| |
| |
| |
|
| Moody’s | | Aaa | | | P1 | | | Aaa | | | P1 | |
| Standard & Poor’s | | AAA | | | A-1+ | | | AAA | | | A-1+ | |
| DBRS | | AAA | | R-1 (high) | | AA (high) | | R-1 (high) |
| JCR | | AAA | | | — | | | AAA | | | — | |
0% BIS Risk Weighted
EDC debt obligations incur favourable capital treatment as they constitute a direct claim on a central government within the OECD. This is in accordance with the International Convergence of Capital Measurement and Capital Standards set forth by the Basel Committee on Banking Regulations and Supervisory practices. As such, EDC carries a zero risk weighting for regulatory capital applications.
Experienced
EDC has been a recognized leader in the capital markets for more than three decades. In a world where the pace of change continues to accelerate, this kind of knowledge is a valuable commodity. For our investors, it is experience they value and trust.
EDC partners with financial institutions who continuously demonstrate their commitment to market making. EDC’s knowledge and experience ensures high execution standards and allows us to reach a broad range of investors. Our expectation is to receive solid primary placement with institutional and retail investors around the world.
In 2002, we developed new structures and extended terms on our debt securities to enhance our ability to do more business with investors.
Partnering with underwriters enables EDC to achieve key objectives, a broader investor base and spread performance in the secondary market.
25
Debt Products
As a frequent international issuer, EDC customizes debt offerings to respond to investors’ portfolio requirements by providing a spectrum of products in a wide variety of structures and currencies. Timing of issuance and structuring of debt products can be executed quickly to allow investors to respond to opportunities.
Debt products issued by EDC:
| | | | | | | |
| • | | Eurobonds, Global Bonds and Domestic Issues | | • | | Callable Structured Notes |
| • | | Zero Coupon | | • | | Dual Currency Issues |
| • | | Floating Rate Notes | | • | | Private Placements |
| • | | Step Up | | • | | Commercial Paper |
In 2002, EDC executed more than 100 transactions through a combination of strategic and opportunistic issues complemented by structured products.
Performance
In 2002, EDC re-entered the global bond market, executing two successful transactions in the three and five-year maturities. Investor participation and geographical distribution met our expectations.
USD 500 million 2.750% Global Bond due December 12, 2005
Export Development Canada (Aaa/AAA)
| | | | |
| Issue Details | | | |
Launch Date:
Issue Price:
Co-Lead Managers:
Syndicate Group: | | December 9, 2002
99.829
RBC Capital Markets/Salomon Smith Barney
DB/CIBC/BMO/Scotia/BNP Paribas/Mizuho/NBF/TD | |
| |
| Investor Participation | | Geographical Distribution | |
 | |
 | |
| |
USD 500 million 4.00% Global Bond due August 1, 2007
Export Development Canada (Aaa/AAA)
|
| Issue Details | | | |
Launch Date:
Issue Price:
Co-Lead Managers:
Syndicate Group: | | July 24, 2002
99.874
BNP Paribas/Salomon Smith Barney
CSFB/Deutsche/Dresdner/Mizuho/RBC/TD | |
| |
26
| | | | |
| Investor Participation | | Geographical Distribution | |
 | |
 | |
Liquidity
EDC debt securities are a component of major bond indices.
| • | | Scotia Capital Universe Index |
| |
| • | | Lehman Global Aggregate Index |
Investors who are benchmarked against these indices understand the importance of including EDC debt in their portfolios in order to match or exceed their return targets.
EDC bonds are a component of the Scotia Capital Universe Index. Major fixed-income indices are used by investors to determine asset allocation and for performance measurement. Entry into the Scotia Capital Universe Index is determined by minimum issue size of CAD 100 million, liquidity and pricing.
EDC debt obligations are also included in the Lehman Global Aggregate Index. The weight of EDC bonds is expected to increase in 2003 due to the addition of Canadian provincial, agency and investment grade corporate bonds. For inclusion in the Lehman Global Aggregate Index, Canadian bonds must have the equivalent of USD 300 million par amount outstanding and a BBB rating or higher by Moody’s Investor Service.
EDC will continue to monitor the indices which are most relevant to our investors, in order to demonstrate liquidity in capital markets.
Funding Program
The funding program supports EDC’s lending activities in order to support Canadian exporters. As EDC’s business continues to grow its funding program must keep pace.
2002 Highlights
Due to continued volatility in the capital markets, securities of high-quality borrowers were in demand in 2002. EDC creates value for global investors by managing its funding program to meet their requirements within approved asset-liability policies.
Long-term Funding Program
| • | | Aggregate volume of USD 4 billion |
| |
| • | | In excess of 100 transactions |
| |
| • | | Core markets: Asia, Canada, Europe and the United States |
| |
| • | | Maturities of one year and longer |
Short-term Funding Program
| • | | Aggregate volume of USD 3 billion |
| |
| • | | Core markets: Asia, Canada, Europe and the United States |
| |
| • | | Maturities up to 365 days |
2003 Borrowing Strategy
EDC expects to issue USD 8 billion in debt securities.
| • | | Short-term funding target of USD 2.5 billion |
| |
| • | | Long-term funding target of USD 5.5 billion |
Core markets will be targeted
| • | | Canada |
| |
| • | | United States |
| |
| • | | Europe |
| |
| • | | Asia |
27
Management Representatives
| | | |
 | |  |
| Left to right: Rolfe Cooke, Eric Siegel and Ron Dahms | | Left to right: Susanne Laperle, Peter Allen and Gilles Ross. |
| | | | | | | |
Executive
Management Team
As at December 31, 2002
| | Management
Representatives
As at December 31, 2002
| | | | |
| |
A. Ian Gillespie
President and Chief
Executive Officer
Peter Allen
Senior Vice-President and
Chief Financial Officer
Rolfe Cooke
Senior Vice-President,
Short-term
Financial Services
Ron Dahms
Senior Vice-President,
Business Development
Susanne Laperle
Senior Vice-President,
Human Resources
Gilles Ross
Senior Vice-President,
Legal Services and
Secretary
Eric Siegel
Executive Vice-President,
Medium- and Long-term
Financial Services | | Rosemarie Boyle
Corporate Communications
and External Relations
Jim Brockbank
Risk Management Office
Jim Christie
National Sales
Don Curtis
Industrial Equipment
June Domokos
International Markets — Asia
Françoise Faverjon-Fortin
Quebec Region
Robert Forbes
Energy, Infrastructure
and Services
Ruth Fothergill
Ontario Region
John Gagan
Corporate Finance
and Control
Pierre Gignac
Insurance and Loan Services | | Glen Hodgson
Economics
Harry Kaunisviita
Corporate Business Systems
Louise Landry
Strategic Planning and
Corporate Performance
Derek Layne
Project Finance
Norman Low
Information Technologies
Marie MacDougall
Treasury
Jim McArdle
Legal Services
Mike McLean
International Markets —
Americas
Lewis Megaw
Western Region
Keith Milloy
Short-term Insurance | | Gilles Morin
E-Business
Suzanne Morris
SME Services
Mike Neals
Marketing
Sherry Noble
Structured Finance
Kevin O’Brien
Transportation, Equity and CIB
Brian Pearce
Internal Audit and Evaluation
Stephen Poloz
Economics
Sandy Reid
Asset Management
Ed Simac
Information Systems
Henri Souquières
International Markets
David Surrette
Atlantic Region |
28
2002 Financial Review
| | | | |
| | | Management’s Discussion and Analysis |
| 30 | | | Operating Highlights |
| 37 | | | Risk Management |
| | | | |
| 54 | | Financial Reporting Responsibility |
| | | | |
| 55 | | Auditor’s Report |
| | | | |
| | | Consolidated Financial Statements |
| 56 | | | Consolidated Balance Sheet |
| 57 | | | Consolidated Statement of Income and Retained Earnings |
| 58 | | | Consolidated Statement of Cash Flows |
| 59 | | | Notes to the Consolidated Financial Statements |
| | | | |
| 78 | | Five-Year Review |
29
Management’s Discussion and Analysis
Operating Highlights
Income Statement Discussion
Net Income
Net income reported for 2002 was $122 million, up $64 million from the 2001 level of $58 million primarily due to increased net interest income. Net interest income increased by $175 million, or 21% from the 2001 level of $814 million principally as a result of two factors. Firstly, receipt of debt relief resulted in the recognition of income associated with non-accrued capitalized interest (debt relief income) and secondly, lower funding costs were achieved in a low interest rate environment. This increased income was partially offset by increased provisions and administrative expenses. EDC’s provision for credit losses increased by a net amount of $99 million from the level of $741 million in 2001. Additional provisions required due to credit deterioration and impairment were partially offset by provisions released as a result of prepayments and debt relief. Administrative expenses were 17% higher than 2001 mainly as a result of the increased human resources, occupancy and technology costs required to manage higher business volumes.
The following table outlines net income and return on shareholder’s equity over the last five years:
| | | | | | | | | | | | | | | | | | | | | |
| ($ in millions) | | 2002 | | 2001 | | 2000 | | 1999 | | 1998 |
| |
| |
| |
| |
| |
|
| Net income | | | 122 | | | | 58 | | | | 194 | | | | 118 | | | | 135 | |
| Shareholder’s equity | | | 2,077 | | | | 2,050 | | | | 1,992 | | | | 1,798 | | | | 1,680 | |
| | |
| |
| |
| |
| |
|
| Return (%) on shareholder’s equity | | | 5.9 | % | | | 2.8 | % | | | 9.7 | % | | | 6.6 | % | | | 8.0 | % |
| | |
| |
| |
| |
| |
|
Net Interest Income
The net margin of 3.86%, which represents net interest income expressed as a percentage of average performing assets employed, increased by 50 basis points from the 2001 level of 3.36%.
The following items contributed to this increase:
| | | | | |
| | | bp |
| | |
|
| Increase in debt relief income | | | 37 | |
| Increased spread due to lower debt funding costs | | | 13 | |
| Decreased interest reversals on impaired loans | | | 4 | |
| Decreased amortization of non-accrued capitalized interest | | | (3 | ) |
| Impact of decreased prepayment fees | | | (2 | ) |
| Increased gains on sale of shares/loan assets | | | 1 | |
| | | |
| |
| Net increase in net interest margin | | | 50 | bp |
| | | |
| |
Net Margin
The net interest margin increased in 2002 primarily due to increased debt relief income and reduced funding costs. Debt relief income was $96 million in 2002 compared to $1 million in 2001 and pertained to amounts received for Yugoslavia ($61 million) and Ivory Coast ($35 million). The interest rate environment in 2002 was such that it was beneficial to increase short-term funding to take advantage of the low interest rates in the short-term. This funding strategy reduced interest expense and thereby increased the spread between the yield on assets and the cost to borrow.
Decreased amortization of non-accrued capitalized interest and decreased prepayment fees reduced the margin by 5 basis points, but this was offset by the positive effect of reduced interest reversals on impaired loans and increased gains on sale of loan assets.
30
| | | | | | | | | | | | | | | | | | | | | | |
| ($ in millions) | | 2002 | | 2001 | | 2000 | | 1999 | | 1998 |
| |
| |
| |
| |
| |
|
| Average gross loans receivable | | | 24,790 | | | | 22,982 | | | | 19,744 | | | | 17,331 | | | | 14,286 | |
| Average investment portfolio balance | | | 2,759 | | | | 2,840 | | | | 3,215 | | | | 2,758 | | | | 1,908 | |
| | | |
| | | |
| | | |
| | | |
| | | |
| |
| Less: average impaired loans | | | 1,914 | | | | 1,596 | | | | 1,311 | | | | 1,468 | | | | 1,861 | |
| | | |
| | | |
| | | |
| | | |
| | | |
| |
| Total average assets employed | | | 25,635 | | | | 24,226 | | | | 21,648 | | | | 18,621 | | | | 14,333 | |
| | | |
| | | |
| | | |
| | | |
| | | |
| |
| Interest income: | | | | | | | | | | | | | | | | | | | | |
| | Loans | | | 1,404 | | | | 1,620 | | | | 1,585 | | | | 1,256 | | | | 1,055 | |
| | Debt relief | | | 96 | | | | 1 | | | | — | | | | 2 | | | | — | |
| | Investment portfolio | | | 69 | | | | 127 | | | | 197 | | | | 146 | | | | 126 | |
| | | |
| | | |
| | | |
| | | |
| | | |
| |
| Total interest income | | | 1,569 | | | | 1,748 | | | | 1,782 | | | | 1,404 | | | | 1,181 | |
| Interest expense | | | 580 | | | | 934 | | | | 1,066 | | | | 796 | | | | 642 | |
| | | |
| | | |
| | | |
| | | |
| | | |
| |
| Net interest income | | $ | 989 | | | $ | 814 | | | $ | 716 | | | $ | 608 | | | $ | 539 | |
| | | |
| | | |
| | | |
| | | |
| | | |
| |
| Net margin | | | 3.86 | % | | | 3.36 | % | | | 3.31 | % | | | 3.27 | % | | | 3.76 | % |
| | | |
| | | |
| | | |
| | | |
| | | |
| |
Interest Income — Loans
For 2002, loan interest income was $1,404 million, a decrease of $216 million, or 13%, from the level of $1,620 million in 2001. The performing gross loans receivable averaged $22,876 million in 2002 (2001 — $21,386 million) with an average yield of 6.56% (2001 — 7.58%). In 2002, disbursements exceeded repayments by $871 million, which, when combined with increased average foreign exchange rates, had the impact of increasing the average performing loans by $1,490 million, or 7%, over 2001.
Components of change in interest income — loans from prior year
| | | | | | |
| ($ in millions) |
| | | | | | |
| Volume increases | | | 88 | |
| Yield decreases | | | (290 | ) |
| Foreign exchange impact | | | 17 | |
| Decrease in other loan interest | | | (31 | ) |
| | | | |
| |
| Net change in interest income — loans | | $ | (216 | ) |
| | | | |
| |
| | | |
| Interest Income — Loans* | | Loan Interest Yield |
| ($ in millions) Yield (%) | | Yield (%) |
 | |  |
Performing fixed rate loans receivable averaged $11,969 million in 2002 (2001 — $10,235 million) with an average coupon yield of 6.99% (2001 — 7.19%), earning interest of $837 million (2001 — $736 million). The increase in average fixed rate loans receivable was principally the result of increases in the aerospace and mining and power industry sectors. The coupon on performing fixed rate loans receivable decreased over last year. This was due to the changes in the portfolio as older loans earning higher interest rates were repaid. Meanwhile, current loan disbursements carry lower interest rates. Disbursements during the year yielded 6.38% while existing loans repaid carried a yield of 7.37%. New fixed rate loans signed in 2002 yielded 5.96% compared with 6.68% in 2001.
The performing floating rate loans receivable averaged $10,907 million in 2002 (2001 — $11,151 million) with an average coupon rate of 3.68% (2001 — 6.13%) earning interest of $401 million (2001 — $684 million). The six month moving average U.S. dollar LIBOR was 2.04% in 2002,a decrease of 261 basis points from the 2001 average. The reduction in U.S. dollar LIBOR resulted in decreased floating rate interest income which led to lower yields on the floating rate loans portfolio. New floating rate loans signed in 2002 yielded 1.61% over LIBOR compared with 1.75% in 2001.
31
The following table analyzes loan interest income as a percentage of the average loans receivable:
| | | | | | | | | | | | | | | | | | | | | | |
| ($ in millions) | | 2002 | | 2001 | | 2000 | | 1999 | | 1998 |
| |
| |
| |
| |
| |
|
| Gross loans receivable: | | | | | | | | | | | | | | | | | | | | |
| | Average performing fixed rate | | | 11,969 | | | | 10,235 | | | | 7,873 | | | | 7,005 | | | | 5,906 | |
| | Average performing floating rate | | | 10,907 | | | | 11,151 | | | | 10,560 | | | | 8,858 | | | | 6,519 | |
| | | |
| | | |
| | | |
| | | |
| | | |
| |
| | Average performing gross loans receivable | | | 22,876 | | | | 21,386 | | | | 18,433 | | | | 15,863 | | | | 12,425 | |
| | | |
| | | |
| | | |
| | | |
| | | |
| |
| Loan interest income: | | | | | | | | | | | | | | | | | | | | |
| | Performing fixed rate interest | | | 837 | | | | 736 | | | | 573 | | | | 515 | | | | 452 | |
| | Performing floating rate interest | | | 401 | | | | 684 | | | | 811 | | | | 572 | | | | 442 | |
| | Other loan interest | | | 166 | | | | 200 | | | | 201 | | | | 169 | | | | 161 | |
| | | |
| | | |
| | | |
| | | |
| | | |
| |
| Loan interest income | | | 1,404 | | | | 1,620 | | | | 1,585 | | | | 1,256 | | | | 1,055 | |
| Debt relief income | | | 96 | | | | 1 | | | | — | | | | 2 | | | | — | |
| | | |
| | | |
| | | |
| | | |
| | | |
| |
| Loan interest income (including debt relief) | | $ | 1,500 | | | $ | 1,621 | | | $ | 1,585 | | | $ | 1,258 | | | $ | 1,055 | |
| | | |
| | | |
| | | |
| | | |
| | | |
| |
| Yields — performing loans | | | | | | | | | | | | | | | | | | | | |
| | Performing fixed rate coupon | | | 6.99 | % | | | 7.19 | % | | | 7.28 | % | | | 7.35 | % | | | 7.65 | % |
| | Performing floating rate coupon | | | 3.68 | % | | | 6.13 | % | | | 7.68 | % | | | 6.46 | % | | | 6.78 | % |
| | Total loan interest yield | | | 6.56 | % | | | 7.58 | % | | | 8.60 | % | | | 7.93 | % | | | 8.49 | % |
| | | |
| | | |
| | | |
| | | |
| | | |
| |
Other loan interest income comprises loan fee income and amortization of non-accrued capitalized interest (NACI). Total loan fee income was $86 million in 2002, compared to $115 million in 2001. Amortization of NACI was $76 million in 2002, $7 million less than in 2001. Also included in other loan interest income is a gain on sale of assets of $4 million (2001 — $2 million).
Interest Income — Investment Portfolio
EDC’s investment portfolio consists of marketable securities, investments and government treasury bills. The portfolio interest income decreased by $58 million between 2001 and 2002. The main components of that change were a decrease in the average amount invested and lower interest rates.
Average investment balances (which include associated derivative contracts) decreased by 3% from $2,840 million in 2001 to $2,759 million in 2002. However, by the end of 2002 the investment portfolio had increased to $2,899 million. During the latter part of the year, management implemented a strategy to increase liquidity. In light of increased geo-political risk it was determined that it would be prudent to increase liquidity to better manage any potential market disruptions.
Investment yields decreased from 4.47% in 2001 to 2.51% in 2002. This reflects the fact that interest rates in Canada and the United States were at lower levels during most of 2002 relative to 2001.
Investment Portfolio
Interest Income
| | | |
| ($ in millions) | | Yield (%) |
Components of change in interest income —
investment portfolio from prior year
| | | | | |
| ($ in millions) | | | | |
| Volume decreases | | | (4 | ) |
| Yield decreases | | | (54 | ) |
| | | |
| |
| Net change in interest income — investment portfolio | | $ | (58 | ) |
| | | |
| |
32
Interest Expense
Interest expense decreased by $354 million between 2001 and 2002. The main factor that accounted for this change was a decrease in the general level of interest rates. However, the decrease was partially offset by an increase in overall debt volume as well as the continued strength of the U.S. dollar relative to the Canadian dollar.
EDC carried an average floating rate debt balance of $15,278 million in 2002 (2001 —$14,409 million) at an average cost of 1.98% (2001 — 4.51%), resulting in interest expense of $302 million (2001 — $650 million). Long-term debt instruments comprise 77% of the floating rate debt portfolio while short-term debt (i.e.,commercial paper) makes up the balance.
EDC carried an average fixed rate debt balance of $4,745 million in 2002 (2001 — $4,438 million) at an average cost of 5.86% (2001 — 6.34%), resulting in interest expense of $278 million (2001 — $281 million).
Interest Expense
(Excluding Foreign Exchange
Translation Gain/Loss)
| | | |
| ($ in millions) | | Cost of Funds (%) |
Components of change in interest expense from prior year
| | | | | |
| ($ in millions) | | | | |
| Volume increases | | | 49 | |
| Cost of funds decreases | | | (409 | ) |
| Foreign exchange impact on interest expense | | | 9 | |
| | | |
| |
| Net change prior to foreign currency translation gain/loss | | | (351 | ) |
| | | |
| |
| Change in the Corporation’s foreign currency translation gain/loss | | | (3 | ) |
| | | |
| |
| Net change in interest expense | | $ | (354 | ) |
| | | |
| |
Levels of interest rates both in Canada and the United States were lower in 2002, relative to 2001. This was reflected in the average cost of funds, which decreased from 4.95% in 2001, to 2.90% in 2002. The decrease in the general level of interest rates had the most significant impact on the floating rate debt portfolio with the average yield falling by 253 basis points.
The overall increase in debt volume is the result of borrowing requirements necessary to support the continued growth in the loans receivable portfolio. The average balance of long-term debt increased from $15,535 million in 2001 to $16,580 million in 2002 while the average balance of short-term debt increased from $3,313 million in 2001 to $3,443 million in 2002. The average balances for both short-term and long-term debt include associated derivative contracts.
Continued strength of the U.S. dollar relative to the Canadian dollar during 2002 increased interest expense on foreign currency denominated debt by $9 million.
Interest expense, as reported on the income statement, includes the Corporation’s foreign exchange translation gain/loss for the year. Included in interest expense for 2002 is a translation gain of $2.6 million (2001 — $75 thousand gain).
33
Insurance Premiums and Guarantee Fees
The following table analyzes the average premium rate for insurance premiums and guarantee fees:
| | | | | | | | | | | | | | | | | | |
| ($ in millions) | | 2002 | | 2001 |
| |
| |
|
| | | | $ | | % | | $ | | % |
| Short-term program: | | | | | | | | | | | | | | | | |
| | Short-term insurance average exposure | | | 28,897 | | | | | | | | 23,487 | | | | | |
| | Premiums and fees earned | | | 101 | | | | | | | | 91 | | | | | |
| | | |
| | | |
| | | |
| | | |
| |
| | Average short-term premium rate | | | | | | | 0.35 | | | | | | | | 0.39 | |
| | | |
| | | |
| | | |
| | | |
| |
| Medium-term program: | | | | | | | | | | | | | | | | |
| | Medium-term insurance average exposure | | | 5,253 | | | | | | | | 5,162 | | | | | |
| | Premiums and fees earned | | | 37 | | | | | | | | 35 | | | | | |
| | | |
| | | |
| | | |
| | | |
| |
| | Average medium-term premium rate | | | | | | | 0.70 | | | | | | | | 0.68 | |
| | | |
| | | |
| | | |
| | | |
| |
| Loan guarantees: | | | | | | | | | | | | | | | | |
| | Loan guarantees average exposure | | | 2,628 | | | | | | | | 2,145 | | | | | |
| | Loan guarantee fees earned | | | 9 | | | | | | | | 8 | | | | | |
| | | |
| | | |
| | | |
| | | |
| |
| | Average loan guarantee fee rate | | | | | | | 0.34 | | | | | | | | 0.37 | |
| | | |
| | | |
| | | |
| | | |
| |
Short-term insurance premium revenue totaled $101 million, or 69% of 2002 insurance premiums earned. Short-term premium revenue increased by $10 million or 11% from the 2001 level of $91 million. This was the result of an increase in short-term insurance exposure, which increased by $5,410 million, or 23% over 2001 mainly due to an overall increase in short-term insurance volumes. The decrease in the average premium rate is mainly due to the issuance of a few large policies which carry a lower premium rate.
Medium-term insurance premium revenue for the year totaled $37 million, an increase of 6% over 2001. The average exposure in the medium-term insurance programs increased by $91 million, or 2% over 2001. This increase was primarily due to the growth in the surety bond program. The decrease in the average loan guarantee fee rate was driven primarily by the signing of loan guarantees with higher credit ratings, which carry lower guarantee fees.
Provision for Credit Losses
The following table analyzes the expense for the provision for credit losses over the last five years:
| | | | | | | | | | | | | | | | | | | | | | |
| ($ in millions) | | 2002 | | 2001 | | 2000 | | 1999 | | 1998 |
| |
| |
| |
| |
| |
|
| Provision for credit losses pertaining to: | | | | | | | | | | | | | | | | | | | | |
| | Loans | | | 930 | | | | 208 | | | | 381 | | | | 397 | | | | 313 | |
| | Loan commitments | | | (231 | ) | | | 521 | | | | — | | | | — | | | | — | |
| | Loan guarantees | | | 26 | | | | (71 | ) | | | 10 | | | | (7 | ) | | | 32 | |
| | Insurance | | | 115 | | | | 83 | | | | 158 | | | | 133 | | | | 88 | |
| | | |
| | | |
| | | |
| | | |
| | | |
| |
| Total provision for credit losses | | $ | 840 | | | $ | 741 | | | $ | 549 | | | $ | 523 | | | $ | 433 | |
| | | |
| | | |
| | | |
| | | |
| | | |
| |
A provision charge of $930 million (2001 — $208 million) was made to the income statement for losses on loans. This was primarily the result of credit downgrades which occurred throughout 2002.
A provision credit of $231 million (2001 — $521 million charge) was made to the income statement for losses on loan commitments. This credit was made in accordance with the general provisioning methodology. Under this methodology, a provision is charged for those loans that are committed or signed, but not yet disbursed. This reduction was due to fewer loan commitments being outstanding at the end of 2002.
A provision charge was made to the income statement for credit losses on loan guarantees in the amount of $26 million (2001 — $71 million credit).
During the year, there was a $115 million charge (2001 — $83 million) to the income statement for the provision for insurance claims. Of the total provision for insurance claims, $111 million was due to the write-off of recoverable claims in 2002 (2001 — $74 million).
34
Administrative Expenses
Net administrative expenses for 2002 totaled $174 million, an increase of 17% from the prior year. Expenditures related to human resources, occupancy and technology were higher as a result of strategic investments in technology and people in order to continue to service and grow the business.
Expressed as a percentage of net revenue (internal efficiency ratio), administrative expenses increased to 17.4% in 2002, from 17.0% in 2001. The calculation of the internal efficiency ratio was revised in 2002 to exclude the impact of debt relief income from net revenue and also to exclude from administrative expenses the impact of amounts retained from Canada Account receipts and recoveries to meet overhead and expenses related to Canada Account transactions. The ratio has been revised to exclude these amounts because it is management’s view that the ratio should be calculated on amounts over which it exercises control. Debt relief is determined by the shareholder and is not within management’s control so it is excluded from the calculation. Despite the fact that EDC receives compensation for expenses and overhead related to Canada Account activities, management is nevertheless responsible for control of the gross administrative expenses and therefore the internal efficiency ratio is based on the gross administrative expenses. Prior years’ results have been restated.
Administrative Expenses
Corporate Plan Discussion
Comparison with 2002 Plan
Business volume for 2002 reached a record $51.2 billion, a 16% increase over the 2001 level of $44.3 billion, and exceeded the 2002 planned volume of $40.0 billion. Planned 2002 volume was projected shortly after the September 11th attacks and reflected the economic uncertainty that existed at that time. The increase over plan can be attributed to financing surpassing the plan by $2.2 billion, contract insurance and bonding by $2.5 billion and short-term insurance by $6.5 billion.
Loans receivable and loans payable increased over the plan mainly due to the higher financing volumes and a stronger US dollar than planned.
The 2002 net income of $122 million was higher than the 2002 Corporate Plan projection of a $159 million loss primarily due to higher net interest income and lower provisions than planned. EDC achieved its level of profitability in 2002 primarily as a result of debt relief and lower funding costs. Net interest income exceeded plan by $199 million primarily as a result of two factors: firstly due to the recognition as income of the non-accrued capitalized interest associated with debt relief (debt relief income) and secondly because of the lower funding costs which resulted from management’s strategy of increasing the proportion of short-term borrowings to take advantage of the steep yield curve that existed in 2002. Provisions for credit losses were $57 million lower than the plan in 2002 due primarily to the release of provisions which occurred as a result of the unplanned debt relief.
Administrative expenses were below plan by $10 million, due to efforts to contain costs in the current economic environment. The internal efficiency ratio was 17.4%, better than the revised plan of 20.7% as a result of higher than planned net revenue and lower administrative expenses. The Corporate Plan projected the internal efficiency ratio to be 20.0% for 2002. This was subsequently revised to 20.7% to reflect the new calculation of the ratio as explained above under the administrative expenses section.
2003 Corporate Plan
The Corporate Plan projects the year 2003 business volume to increase to $54.5 billion from $51.2 billion in 2002 primarily due to an increase in short-term insurance volume.
The loans receivable and loans payable balances are expected to increase from 2002 actuals since disbursements in 2003 are expected to exceed repayments.
Net income is planned at $190 million, which is higher than 2002 by $68 million. The major projected net income variances from the 2002 actual results are due to a projected increase in net interest income and a projected decrease in the provision for credit losses. This is partially offset by a projected increase in administrative expenses due primarily to the continuing investment in technology.
35
| | | | | | | | | | | | | |
| | | 2003 | | 2002 | | 2002 |
| | | Corporate | | Actual | | Corporate |
| | | Plan | | Results | | Plan |
| | |
| |
| |
|
Volume | | | | | | | | | | | | |
($ in billions) | | | | | | | | | | | | |
| Financing | | | 7.5 | | | | 7.4 | | | | 5.2 | |
| Contract insurance and bonding | | | 5.0 | | | | 5.8 | | | | 3.3 | |
| Political risk insurance | | | 4.0 | | | | 3.5 | | | | 3.5 | |
| Short-term insurance | | | 38.0 | | | | 34.5 | | | | 28.0 | |
| | | |
| | | |
| | | |
| |
| Total | | $ | 54.5 | | | $ | 51.2 | | | $ | 40.0 | |
| | | |
| | | |
| | | |
| |
Balance Sheet | | | | | | | | | | | | |
($ in millions) | | | | | | | | | | | | |
Assets | | | | | | | | | | | | |
| Loans receivable | | | 25,845 | | | | 24,623 | | | | 23,376 | |
| Allowance for losses on loans | | | 3,500 | | | | 3,613 | | | | 3,142 | |
| | | |
| | | |
| | | |
| |
| Net loans receivable | | | 22,345 | | | | 21,010 | | | | 20,234 | |
| Cash and marketable securities | | | 2,584 | | | | 2,824 | | | | 2,422 | |
| Investments | | | 76 | | | | 75 | | | | 342 | |
| Accrued interest and other assets | | | 540 | | | | 474 | | | | 470 | |
| Derivative related amounts | | | 181 | | | | 171 | | | | 287 | |
| | | |
| | | |
| | | |
| |
| Total Assets | | $ | 25,726 | | | $ | 24,554 | | | $ | 23,755 | |
| | | |
| | | |
| | | |
| |
Liabilities and Shareholder’s Equity | | | | | | | | | | | | |
| Loans payable | | | 21,716 | | | | 20,828 | | | | 20,010 | |
| Accrued interest and other liabilities | | | 516 | | | | 428 | | | | 529 | |
| Allowance for loan commitments and guarantees | | | 555 | | | | 377 | | | | 664 | |
| Allowance for claims on insurance | | | 470 | | | | 460 | | | | 498 | |
| Derivative related amounts | | | 205 | | | | 384 | | | | 324 | |
| | | |
| | | |
| | | |
| |
| Total Liabilities | | | 23,462 | | | | 22,477 | | | | 22,025 | |
| | | |
| | | |
| | | |
| |
| Share capital | | | 983 | | | | 983 | | | | 983 | |
| Retained earnings | | | 1,281 | | | | 1,094 | | | | 747 | |
| | | |
| | | |
| | | |
| |
| Shareholder’s Equity | | | 2,264 | | | | 2,077 | | | | 1,730 | |
| | | |
| | | |
| | | |
| |
| Total Liabilities and Shareholder’s Equity | | $ | 25,726 | | | $ | 24,554 | | | $ | 23,755 | |
| | | |
| | | |
| | | |
| |
Income Statement | | | | | | | | | | | | |
($ in millions) | | | | | | | | | | | | |
| Interest income | | | | | | | | | | | | |
| Loans | | | 1,482 | | | | 1,404 | | | | 1,501 | |
| Debt relief | | | 113 | | | | 96 | | | | — | |
| Investment portfolio | | | 81 | | | | 69 | | | | 93 | |
| | | |
| | | |
| | | |
| |
| | | | 1,676 | | | | 1,569 | | | | 1,594 | |
| Interest expense | | | 665 | | | | 580 | | | | 804 | |
| | | |
| | | |
| | | |
| |
| Net interest income | | | 1,011 | | | | 989 | | | | 790 | |
| Insurance premiums and guarantee fees | | | 158 | | | | 147 | | | | 132 | |
| Provision for credit losses | | | 780 | | | | 840 | | | | 897 | |
| | | |
| | | |
| | | |
| |
| Income after provision for credit losses | | | 389 | | | | 296 | | | | 25 | |
| Administrative expenses | | | 199 | | | | 174 | | | | 184 | |
| | | |
| | | |
| | | |
| |
| Net Income/(Loss) | | $ | 190 | | | $ | 122 | | | $ | (159 | ) |
| | | |
| | | |
| | | |
| |
Dividend | | $ | — | | | $ | 95 | | | $ | 50 | |
| | | |
| | | |
| | | |
| |
36
Risk Management
Enterprise Risk Management Process
EDC strives to balance the risk it takes with the financial and mandate returns it generates for that risk to ensure continued capacity for Canadian exporters. Risk management is central to EDC’s business. Not only must the Corporation manage the risks it faces in its operations, it is in the business of providing exporters and investors with the tools they need to manage their own risks.
To enhance its risk management capabilities, EDC takes guidance from an Enterprise Risk Management framework that provides a comprehensive view of the key risks it faces and tools to measure, monitor and manage them. This framework comprises guiding principles, policies and analytical and reporting tools that support EDC in carrying out effective risk management practices.
The ongoing responsibilities for risk management are shared throughout the Corporation. The Board of Directors maintains overall responsibility for approval of risk management policies within the Corporation and provides additional governance through its Risk Management Committee. A management Risk Management Committee oversees compliance with risk management policies and processes and is accountable to the Board Risk Management Committee in this endeavour. A central Risk Management Office, led by EDC’s Chief Risk Officer, coordinates and develops risk management standards and methodologies and manages operational asset exposures while working closely with the business units who originate these exposures.
EDC monitors key risks within five risk categories: credit, market, operational, organizational and business. To date, EDC’s focus as a financial institution has been on the management and ongoing development of the credit and market risk components. Attention is also focused on the integration of the remaining elements of its framework centered on operational, organizational and business risks.
37
EDC Risk Management Organization
Credit Risk
is the risk of loss incurred if a counterparty fails to meet its financial commitments. EDC is exposed to credit risk under its loans and insurance programs and treasury activities. The Corporation has credit risk management policies in place to manage and continuously monitor these credit exposures.
Operational Risk
is the potential risk of loss from human error, internal control weaknesses and systems deficiencies. EDC has policies, procedures, and an Internal Audit department in place to mitigate the possibility of material losses as a result of operational risk.
Organizational Risk
is the risk of loss or cost to the company due to the organizational environment (people and skills, incentives, culture and values). EDC has policies and procedures in place to manage and monitor its organizational environment.
Business Risk
is the potential for loss relating to EDC’s external environment or to its relations with stakeholders. EDC has policies and practices in place to manage and monitor the possibility of adverse effects as a result of business risk.
Market Risk
is the likelihood of loss to EDC as a result of movements in interest and foreign exchange rates and the risk that funds will not be available to meet corporate obligations. EDC manages the market risk of its assets and liabilities on a portfolio basis and has policies in place to limit its exposure to interest rate and foreign exchange movements and to ensure sufficient liquidity is retained to meet requirements and maintain stability in short-term borrowing programs.
Each of the above risks is discussed in greater detail on the following pages.
38
Credit Risk
Credit risk represents the most substantial risk to EDC. As at December 31, 2002, EDC had $52.4 billion of exposure to credit risk, as detailed on the next page. The Corporation regularly reviews its processes and systems in order to improve the administration and assessment of credit risk associated with financing, insurance and treasury transactions. The Corporation is committed to ensuring that its origination and portfolio management policies and methodologies embody relevant best-in-class practices within the private sector and the public sector.
As organizations develop risk management capabilities, there is an increasing recognition of the central importance of the ability to transfer or otherwise mitigate credit risk to manage credit exposure and portfolio concentrations. As risk transfer and mitigation tools continue to develop in international capital and trade finance markets, greater opportunities for this kind of active portfolio management may emerge, providing EDC with enhanced flexibility in maintaining its capacity for taking risk.
EDC manages the credit risk associated with its exposures at the portfolio level and the transaction level, as follows:
Portfolio Credit Risk Management
EDC has in place a Credit Risk Management Framework. The policy framework establishes the approval responsibilities of the Board of Directors, the oversight responsibilities of the Risk Management Committee of the Board of Directors, and the operational, approval and reporting responsibilities of Management. Among other things, the framework includes methodologies to determine country risk limits, industry risk limits and commercial obligor risk limits. All limits are determined based on the Corporation’s capital base and risk factors associated with the exposure. The framework also provides for reporting of management transaction approvals, risk aggregations and compliance with the policies to the Board of Directors on a regular basis.
Country risk is continually reviewed by the Corporation’s Economics Department to take into consideration any changes in the world environment or a specific country. The Economics Department risk rates all countries, and all other things being equal, the higher the country risk, the lower the country risk limit.
Commercial obligor risk is regularly reviewed by the Corporation to take into consideration any changes that may affect the credit risk of the commercial obligor. The Corporation risk rates all commercial obligors, and all other things being equal, the higher the risk, the lower the commercial obligor risk limit.
It is Management’s responsibility to operate the Corporation’s credit risk exposures within the limits established by the Board. Any exceptions to limits require specific Board approval.
Specific Transaction Risk Management
In order to better understand the credit risk associated with EDC’s individual credit commitments, the Corporation is organized into business teams along industry sectors. The business teams are responsible for the proper due diligence associated with each credit commitment. Within the business team structure, each individual has a delegation of approval authority based on relevant expertise and experience. Every credit commitment (except for very small amounts) requires the approval of at least two individuals with delegated approval authority.
Significant potential transactions with respect to credit risk and structure are reviewed for endorsement by the Risk Management Office prior to authorization. The Risk Management Office reports to the Chief Risk Officer who in turn reports to the Senior Vice-President and Chief Financial Officer. Very significant transactions with respect to credit risk and structure are also reviewed for endorsement by the management Risk Management Committee. The management Risk Management Committee comprises the following seven corporate officers: the President; the Executive Vice-President of Medium- and Long-term Financial Services; the Senior Vice-President and Chief Financial Officer; the Senior Vice-President, Legal Services, and Secretary; the Senior Vice-President of Short-term Financial Services; the Senior Vice-President of Business Development; and the Chief Risk Officer. In addition, certain very significant transactions with respect to credit risk and structure require the approval of the Board of Directors.
The Corporation actively monitors and manages the credit risks associated with transactions post-commitment to ensure that where there is a change in the risk, the implications are assessed and managed. Where negative changes in risk have occurred, the transactions are downgraded, allowances adjusted and plans to mitigate potential losses put into place.
39
Concentration of Exposure
The following reflects the major concentrations of total commercial and sovereign exposure in the geographic market and country where the risk resided for all operations at the end of 2002.
Exposure by Geographic Market
| | | | | | | | | | | | | | | | | | | | | | | | | | | | | | | | | |
| | | | | | | | | | | Insurance Policies and | | | | | | | | | | | | |
| | | Loans Portfolio | | Guarantees Outstanding | | Investments | | | | | | | | |
| | |
| |
| | and Derivative | | | | | | | | |
| | | Gross Loans | | | | | | Short- | | Medium- | | Medium-term | | Financial | | | | | | 2002 |
| Country | | Receivable | | Commitments | | term | | term | | Guarantees(1) | | Instruments(2) | | | | | | Exposure |
| |
| |
| |
| |
| |
| |
| | | | | |
|
| ($ in millions) | | | | | | | | | | | | | | | | | | | | | | | | | | $ | | % |
| | | | | | | | | | | | | | | | | | | | | | | | | |
| |
|
| United States | | | 11,568 | | | | 2,447 | | | | 4,226 | | | | 115 | | | | 3,082 | | | | 1,510 | | | | 22,948 | | | | 44 | |
| Canada | | | 2,523 | (3) | | | 1,262 | (3) | | | 93 | | | | 2,410 | (4) | | | 156 | | | | 1,579 | | | | 8,023 | | | | 15 | |
| Mexico | | | 1,440 | | | | 1,256 | | | | 147 | | | | 219 | | | | 35 | | | | — | | | | 3,097 | | | | 6 | |
| China | | | 973 | | | | 259 | | | | 182 | | | | 149 | | | | 23 | | | | — | | | | 1,586 | | | | 3 | |
| Brazil | | | 930 | | | | 235 | | | | 188 | | | | 181 | | | | 1 | | | | — | | | | 1,535 | | | | 3 | |
| United Kingdom | | | 987 | | | | 47 | | | | 248 | | | | 7 | | | | 63 | | | | 74 | | | | 1,426 | | | | 3 | |
| Peru | | | 828 | | | | 20 | | | | 7 | | | | 110 | | | | 2 | | | | — | | | | 967 | | | | 2 | |
| Indonesia | | | 885 | | | | — | | | | 27 | | | | 16 | | | | 2 | | | | — | | | | 930 | | | | 2 | |
| Venezuela | | | 649 | | | | 228 | | | | 35 | | | | 9 | | | | 9 | | | | — | | | | 930 | | | | 2 | |
| Germany | | | 129 | | | | 160 | | | | 130 | | | | 3 | | | | 5 | | | | 174 | | | | 601 | | | | 1 | |
| Other(5) | | | 5,429 | | | | 1,413 | | | | 1,814 | | | | 751 | | | | 818 | | | | 114 | | | | 10,339 | | | | 19 | |
| | | |
| | | |
| | | |
| | | |
| | | |
| | | |
| | | |
| | | |
| |
| Total | | $ | 26,341 | | | $ | 7,327 | | | $ | 7,097 | | | $ | 3,970 | | | $ | 4,196 | | | $ | 3,451 | | | $ | 52,382 | | | | 100 | |
| | | |
| | | |
| | | |
| | | |
| | | |
| | | |
| | | |
| | | |
| |
| (1) | | Includes $2,998 million of loan guarantees. |
| |
| (2) | | Investments include amounts represented by cash, marketable securities and investments. Exposure does not take into consideration any collateral or the effect of any master netting agreements with derivative counterparties. |
| |
| (3) | | Includes the impact of one transaction signed in 1997 for $1,389 million with recourse to the Consolidated Revenue Fund of Canada in the event of a loan default. |
| |
| (4) | | Includes $2,393 million of surety bond insurance where risk rests with the exporter. A total of 79% of the exports insured in the surety bond program are to the United States. The balance represents exports to other countries. |
| |
| (5) | | Includes 164 countries with total exposure ranging from $0.001 million to $576 million |
40
Concentration of Exposure — Loans Portfolio
Over the last four years, gross loans receivable have increased at an average yearly rate of 12%, moving from $16,524 million in 1998 to $26,341 million in 2002. This increase is due to the continued growth in commercial financing outstanding, ranging from $8,974 million in 1998 to $19,401 million in 2002. Over the last four years, commercial loans have increased by an average yearly rate of 21%, while sovereign loans outstanding have declined over the same period.
Accordingly, the mix between commercial and sovereign loans has continued to shift in favour of commercial loans. In 1998,the ratio of commercial to sovereign was 54:46,while by 2002 it had shifted to 70:30. In 2002, new signing volume to commercial borrowers accounted for 97% of total signing volume. During 2002, 332 customers were supported through loans financing (2001 — 252 customers).
| | | |
| Gross Loans Receivable | | Commercial Loans Exposure |
| | | |
| ($ in millions) | | (% of Exposure) |
 | |  |
Commercial Loans
As depicted, the commercial exposure has increased for the aerospace and resource industries sectors, while exposure in the information technologies and surface transportation sectors has declined from last year. Aerospace exposure has increased by $1 billion in 2002, reflecting EDC’s continued support to customers of 27 Canadian exporters in the aerospace sector. Exposure in the information technology sector declined by more than $900 million from 2001. Reductions in the level of commitments outstanding at the end of the year account for $520 million of the decrease, while the remainder is due to a reduction in the gross loans receivable balance.
Five counterparties comprising the Corporation’s largest commercial exposure balances collectively represent $7,861 million, or 28%, of the total commercial exposure. Of these five, two are foreign transit authorities within the surface transportation sector, comprising $3,377 million, or 12%. Two are foreign airlines within the aerospace sector, comprising $2,705 million, or 10% and the fifth is a foreign automotive company within the resource industries sector, comprising $1,779 million, or 6%.
The ratio of below investment grade loans to total commercial exposure has remained relatively stable from 2001 to 2002 for all sectors except for information technologies. The percentage of below investment grade exposure in this sector represented 8% of total commercial exposure in 2002, down from the level of 13% reported in 2001. This can be largely attributed to a 19% decrease in below investment grade gross loans receivable in the information technologies sector. Write-offs of $162 million during 2002 in this sector was a contributing factor for the decline.
| | | | | | | | | | | | | | | | | | | | | | | | | | | | | |
| | | Gross Loans | | | | | | Loan | | Total | | | | | | Total | | | | |
| ($ in millions) | | Receivable | | Commitments | | Guarantees | | Exposure | | 2002 | | Exposure | | 2001 |
| |
| |
| |
| |
| |
| |
| |
|
| Commercial Exposure | | | | | | | | | | | | | | $ | | % | | $ | | % |
| | | | | | | | | | | | | |
| |
| |
| |
|
| Aerospace | | | 6,901 | | | | 2,308 | | | | 52 | | | | 9,261 | | | | 33 | | | | 8,219 | | | | 30 | |
| Resource Industries | | | 6,344 | | | | 1,952 | | | | 222 | | | | 8,518 | | | | 31 | | | | 8,175 | | | | 30 | |
| Surface Transportation | | | 3,065 | | | | 268 | | | | 2,541 | | | | 5,874 | | | | 21 | | | | 5,935 | | | | 22 | |
| Information Technologies | | | 2,929 | | | | 680 | | | | 73 | | | | 3,682 | | | | 13 | | | | 4,504 | | | | 16 | |
| Financial Institutions | | | 162 | | | | 448 | | | | — | | | | 610 | | | | 2 | | | | 538 | | | | 2 | |
| | | |
| | | |
| | | |
| | | |
| | | |
| | | |
| | | |
| |
| Total | | $ | 19,401 | | | $ | 5,656 | | | $ | 2,888 | | | $ | 27,945 | | | | 100 | | | $ | 27,371 | | | | 100 | |
| | | |
| | | |
| | | |
| | | |
| | | |
| | | |
| | | |
| |
41
Sovereign Loans
The Corporation has the following sovereign risk concentrations for its sovereign portfolio:
| | | | | | | | | | | | | | | | | | | | | | | | | | | | | |
| | | Gross Loans | | | | | | Loan | | Total | | | | | | Total | | | | |
| ($ in millions) | | Receivable | | Commitments | | Guarantees | | Exposure | | 2002 | | Exposure | | 2001 |
| |
| |
| |
| |
| |
| |
| |
|
| Sovereign Exposure | | | | | | | | | | | | | | $ | | % | | $ | | % |
| | | | | | | | | | | | | |
| |
| |
| |
|
| Canada | | | 1,259 | | | | 130 | | | | — | | | | 1,389 | | | | 16 | | | | 1,475 | | | | 15 | |
| China | | | 933 | | | | 254 | | | | 1 | | | | 1,188 | | | | 14 | | | | 1,613 | | | | 17 | |
| Peru | | | 581 | | | | — | | | | — | | | | 581 | | | | 7 | | | | 616 | | | | 6 | |
| Indonesia | | | 513 | | | | — | | | | — | | | | 513 | | | | 6 | | | | 527 | | | | 5 | |
| Venezuela | | | 292 | | | | 205 | | | | 9 | | | | 506 | | | | 6 | | | | 533 | | | | 6 | |
| Algeria | | | 440 | | | | 53 | | | | — | | | | 493 | | | | 6 | | | | 539 | | | | 6 | |
| Cameroon | | | 374 | | | | — | | | | — | | | | 374 | | | | 4 | | | | 405 | | | | 4 | |
| Other | | | 2,548 | | | | 1,029 | | | | 100 | | | | 3,677 | | | | 41 | | | | 4,011 | | | | 41 | |
| | | |
| | | |
| | | |
| | | |
| | | |
| | | |
| | | |
| |
| Total | | $ | 6,940 | | | $ | 1,671 | | | $ | 110 | | | $ | 8,721 | | | | 100 | | | $ | 9,719 | | | | 100 | |
| | | |
| | | |
| | | |
| | | |
| | | |
| | | |
| | | |
| |
The sovereign portfolio as a whole has decreased from 2001 by $998 million, or 10%. This, mainly can be attributed to the decline in the value of sovereign gross loans receivables, which decreased by $565 million, or 8.1%. Repayments exceeded disbursements in 2002 in the sovereign loan portfolio.
Concentration of Exposure — Insurance Portfolio
Insurance Policies Outstanding
| | | | | | | | | |
| ($ in millions) | | 2002 | | 2001 |
| |
| |
|
| Short-term | | | 7,097 | | | | 6,255 | |
| Medium-term | | | 5,168 | | | | 5,689 | |
| | | |
| | | |
| |
| Total | | $ | 12,265 | | | $ | 11,944 | |
| | | |
| | | |
| |
At December 31, 2002, policies with terms of less than one year comprised 68% of the total exposure compared to 59% in 2001.
Insurance Policies
Outstanding by Policy Term
Short-term Program
Size Concentration
During 2002, the short-term program supported 5,435 customers. In terms of total insured volume, the top five customers represented 27% of the total 2002 insured volume (2001 — 16%). The largest number of buyers in terms of aggregate credit authorizations is within the $1,000 to $500,000 range and has remained relatively unchanged from 2001 levels in terms of overall concentration.
The following table shows the number of foreign buyers and the respective exposure for the year classified by exposure size within the short-term portfolio:
| | | | | | | | | | | | | | | | | |
| | | 2002 | | 2001 |
| | |
| |
|
| $ Value of Foreign Exposure* | | Total | | | | | | Total | | | | |
| | | Number of | | Exposure | | Number of | | Exposure |
| ($ in thousands) | | Foreign Buyers | | ($ in millions) | | Foreign Buyers | | ($ in millions) |
| |
| |
| |
| |
|
| 1 — 500 | | | 47,110 | | | | 5,828 | | | | 43,227 | | | | 5,337 | |
| 501 — 2,000 | | | 3,758 | | | | 3,596 | | | | 3,890 | | | | 3,714 | |
| 2,001 — 5,000 | | | 855 | | | | 2,717 | | | | 987 | | | | 3,128 | |
| 5,001 — 10,000 | | | 327 | | | | 2,272 | | | | 343 | | | | 2,394 | |
| 10,001 and over | | | 258 | | | | 7,089 | | | | 297 | | | | 7,848 | |
| | | |
| | | |
| | | |
| | | |
| |
| Total | | | 52,308 | | | $ | 21,502 | | | | 48,744 | | | $ | 22,421 | |
| | | |
| | | |
| | | |
| | | |
| |
| * | | Excludes buyers located in Canada as most of the Corporation’s domestic business is now being underwritten by St. Paul Guarantee Insurance Company. |
42
Country Concentration
The largest concentrations within the short-term program are in the following countries:
| | | | | | | | | | | | | | | | | | | | | |
| ($ in millions) | | 2002 | | | | | | 2001 |
| |
| | | | | |
|
| | | $ | | % | | | | | | $ | | % |
| | |
| |
| | | | | |
| |
|
| U.S. | | | 4,226 | | | | 60 | | | U.S. | | | 3,450 | | | | 55 | |
| United Kingdom | | | 248 | | | | 3 | | | Brazil | | | 237 | | | | 4 | |
| South Korea | | | 225 | | | | 3 | | | Japan | | | 228 | | | | 4 | |
| Brazil | | | 188 | | | | 3 | | | Canada | | | 194 | | | | 3 | |
| Japan | | | 187 | | | | 3 | | | United Kingdom | | | 188 | | | | 3 | |
| Other* | | | 2,023 | | | | 28 | | | Other* | | | 1,958 | | | | 31 | |
| | | |
| | | |
| | | | | | | |
| | | |
| |
| Total | | $ | 7,097 | | | | 100 | | | Total | | $ | 6,255 | | | | 100 | |
| | | |
| | | |
| | | | | | | |
| | | |
| |
| * | | Includes 135 countries with concentrations ranging from $0.001 million to $182 million (2001 — 138 countries ranging from $0.001 million to $163 million). |
Industry Concentration
The insurance policies’ liability in terms of industry concentration are as follows:
Insurance Policies’ Liability — by Industry Sector
Short-term Programs
(%)
Medium-term Insurance Program
Size Concentration
During 2002, 540 customers were supported in the medium-term program (2001 — 432). The top five customers represented 42% of the 2002 medium-term insurance policies outstanding (2001 — 58%). The largest exposure within the top five customers is $893 million. The five largest policies as at December 31, 2002, represent 13% (2001 — 16%) of the total medium-term policies outstanding.
43
Country Concentration
As at December 31, 2002, the medium-term insurance policies and guarantees outstanding portfolio comprised 2,113 transactions in 134 countries (2001 — 1,838 transactions in 129 countries) with an average exposure of $2.4 million (2001 — $3.1 million).
The largest insurance policies and guarantees outstanding in terms of where the risk resides within the medium-term portfolio are in the following countries:
| | | | | | | | | | | | | | | | | | | | | | | | | | | | | | | | | | | | | |
| ($ in millions) | | 2002 | | | | | | 2001 |
| |
| | | | | |
|
| | | | | | | Insurance | | | | | | | | | | | | | | | | | | Insurance | | | | | | | | |
| | | Insurance | | Guarantees | | $ | | % | | | | | | Insurance | | Guarantees | | $ | | % |
| | |
| |
| |
| |
| | | | | |
| |
| |
| |
|
| Canada | | | 2,409 | | | | 40 | | | | 2,449 | | | | 47 | | | Canada | | | 2,387 | | | | 41 | | | | 2,428 | | | | 43 | |
| U.S. | | | 115 | | | | 474 | | | | 589 | | | | 11 | | | U.S. | | | 68 | | | | 327 | | | | 395 | | | | 7 | |
| Mexico | | | 218 | | | | 6 | | | | 224 | | | | 4 | | | Brazil | | | 323 | | | | 1 | | | | 324 | | | | 6 | |
| Israel | | | 4 | | | | 211 | | | | 215 | | | | 4 | | | Mexico | | | 273 | | | | 7 | | | | 280 | | | | 5 | |
| Colombia | | | 204 | | | | — | | | | 204 | | | | 4 | | | China | | | 209 | | | | 27 | | | | 236 | | | | 4 | |
| Other* | | | 1,020 | | | | 467 | | | | 1,487 | | | | 30 | | | Other* | | | 1,283 | | | | 743 | | | | 2,026 | | | | 35 | |
| | | |
| | | |
| | | |
| | | |
| | | | | | | |
| | | |
| | | |
| | | |
| |
| Total | | $ | 3,970 | | | $ | 1,198 | | | $ | 5,168 | | | | 100 | | | Total | | $ | 4,543 | | | $ | 1,146 | | | $ | 5,689 | | | | 100 | |
| | | |
| | | |
| | | |
| | | |
| | | | | | | |
| | | |
| | | |
| | | |
| |
| * | | Includes 129 countries with concentrations ranging from $0.009 million to $183 million (2001 — 122 countries ranging from $0.012 million to $222 million). |
Exposure in Canada is made up largely ($2,393 million) of surety bond insurance (2001 — $2,364 million), 79% of which is to support exports to the United States (2001 — 54%).
Program Concentration
Total medium-term exposure has decreased by $521 million or 9% over 2001 results. Surety bond exposure increased by $30 million and performance security program exposure decreased by $319 million over 2001 results.
Concentration by Program
Credit Quality — Loans
Risk concentration remains comparable to 2001, with the largest increase attributable to impaired loans. The performing gross loans receivable grew by 2% in 2002 to $24,082 million from the 2001 level of $23,576 million. The level of growth in the performing portfolio is below that experienced in prior years due primarily to reduced net disbursements and increased impairments in 2002.
Impaired Loans
Impaired loans represent loans for which the Corporation no longer has reasonable assurance that the full amount of principal and interest will be collected on a timely basis in accordance with the terms of the loan agreement. Impaired loans as a percentage of total gross loans receivable increased from 6.5% in 2001 to 8.6% in 2002. This is higher than the average impaired loans of 8.0% over the last five years, a reflection of the current economic environment.
In 2002, loans totaling $840 million became impaired. These were composed of 17 commercial loans in the following countries: United States ($291 million), Argentina ($114 million), Brazil ($185 million), Mexico ($60 million), Germany ($63 million), Sweden ($18 million), others ($1 million) and sovereign loans to counterparties in Argentina ($66 million) and Kenya ($42 million). During the year, no loans were reclassified from impaired to performing.
Impaired loans to seven commercial borrowers ($162 million) and one sovereign borrower ($32 million) totaling $194 million were written off against the allowance for loan losses. These loans were fully provided for by the allowance for loan losses and $128 million of these loans had been made impaired in 2002.
| | | |
| Gross Loans Receivables | | Gross Loans Receivables |
| ($ in billions) | | (%) |
| | | |
 | |  |
44
The largest concentrations of gross loans receivable for impaired loans are listed in the following table:
| | | | | | | | | | | | | | | | | | | | | | | | | |
| ($ in millions) | | 2002 | | 2001 |
| |
| |
|
| | | Gross | | Non-accrued | | | | | | Gross | | Non-accrued | | | | |
| | | Loans | | Capitalized | | Loans | | Loans | | Capitalized | | Loans |
| | | Receivable | | Interest | | Receivable | | Receivable | | Interest | | Receivable |
| | |
| |
| |
| |
| |
| |
|
Sovereign | | | | | | | | | | | | | | | | | | | | | | | | |
| Cameroon | | | 374 | | | | 322 | | | | 52 | | | | 405 | | | | 323 | | | | 82 | |
| Ivory Coast | | | 208 | | | | 208 | | | | — | | | | 264 | | | | 183 | | | | 81 | |
| Russia | | | 135 | | | | 60 | | | | 75 | | | | 138 | | | | 60 | | | | 78 | |
| Yugoslavia | | | 192 | | | | 192 | | | | — | | | | 122 | | | | — | | | | 122 | |
| Pakistan | | | 112 | | | | 34 | | | | 78 | | | | 95 | | | | 16 | | | | 79 | |
| Other | | | 400 | | | | 173 | | | | 227 | | | | 296 | | | | 160 | | | | 136 | |
| | | |
| | | |
| | | |
| | | |
| | | |
| | | |
| |
| Subtotal | | | 1,421 | | | | 989 | | | | 432 | | | | 1,320 | | | | 742 | | | | 578 | |
| | | |
| | | |
| | | |
| | | |
| | | |
| | | |
| |
Commercial | | | | | | | | | | | | | | | | | | | | | | | | |
| Information Technologies | | | 376 | | | | 11 | | | | 365 | | | | 166 | | | | — | | | | 166 | |
| Resource Industries | | | 320 | | | | 1 | | | | 319 | | | | 107 | | | | — | | | | 107 | |
| Aerospace | | | 141 | | | | — | | | | 141 | | | | 54 | | | | — | | | | 54 | |
| Financial Institutions | | | 1 | | | | — | | | | 1 | | | | 1 | | | | — | | | | 1 | |
| Surface Transportation | | | — | | | | — | | | | — | | | | 2 | | | | — | | | | 2 | |
| | | |
| | | |
| | | |
| | | |
| | | |
| | | |
| |
| Subtotal | | | 838 | | | | 12 | | | | 826 | | | | 330 | | | | — | | | | 330 | |
| | | |
| | | |
| | | |
| | | |
| | | |
| | | |
| |
| Total Impaired | | | 2,259 | | | | 1,001 | | | | 1,258 | | | | 1,650 | | | | 742 | | | | 908 | |
| Less: Specific Allowance | | | | | | | | | | | 582 | | | | | | | | | | | | 370 | |
| | | | | | | | | | | |
| | | | | | | | | | | |
| |
| Net Impaired Loans Receivable | | | | | | | | | | $ | 676 | | | | | | | | | | | $ | 538 | |
| | | | | | | | | | | |
| | | | | | | | | | | |
| |
When sovereign borrowers experience financial difficulties and are unable to meet their debt obligations, sovereign creditors, including the Government of Canada, agree at an international forum, the Paris Club, to formally reschedule the borrower’s debt obligations. From time to time and on a case-by-case basis, the most heavily indebted sovereign borrowers are granted debt reduction or debt service relief by the Government of Canada. The granting of debt reduction or relief by the Paris Club is contingent upon the sovereign borrower’s ability to implement and maintain economic programs outlined by the International Monetary Fund.
In the past, the Government of Canada has reimbursed the Corporation an amount equal to the debt relief granted by the Government of Canada to the Corporation’s sovereign borrowers. The formula for calculating the amount to be paid to the Corporation was amended effective April 1, 2001 in two ways. Firstly, for new loans issued by the Corporation to sovereign borrowers which were on the Paris Club debt relief list as at April 1, 2001, the Government of Canada has no obligation to compensate the Corporation for further debt relief granted to such borrowers. Secondly, for any debt reduction for new loans resulting from unilateral debt relief measures or new debt reduction for obligations contracted prior to April 1, 2001, EDC will share in the costs of debt forgiveness to the amount of its appropriate specific allowances.
Amounts received for debt relief arrangements on sovereign impaired loans are credited to the book value of the loans similar to the treatment accorded to other receipts on impaired loans. To the extent that amounts received exceed the book value of the loans as a result of non-accrued capitalized interest, debt relief income is recorded, and any provisions are returned to income.
Payments received from the Government of Canada for debt relief for sovereign loans totaled $402 million in 2002 (2001 — $13 million) and related to Yugoslavia ($155 million), Cameroon ($119 million), Ivory Coast ($115 million), Bolivia ($10 million) and other countries ($3 million). These amounts are not included as receipts from borrower countries in the table below.
The following cash flows pertain to impaired loan debtors and represent, in the case of sovereign receipts, the long-term efforts of multilateral rescheduling arrangements through the Paris Club. The largest receipts for impaired loans including contractual principal and interest from borrowers were as noted:
| | | | | | | | | | | | | |
| ($ in millions) | | 2002 | | | | | | 2001 |
| |
| | | | | |
|
Sovereign | | | | | | Sovereign | | | | |
| Russia | | | 8 | | | Russia | | | 11 | |
| Pakistan | | | 2 | | | Gabon | | | 10 | |
| Other | | | 7 | | | Other | | | 8 | |
| | | |
| | | | | | | |
| |
| Subtotal | | | 17 | | | Subtotal | | | 29 | |
Commercial | | | 92 | | | Commercial | | | 5 | |
| | | |
| | | | | | | |
| |
| Total | | $ | 109 | | | Total | | $ | 34 | |
| | | |
| | | | | | | |
| |
45
Loan Commitments
Loan commitments include undisbursed amounts on signed loans, letters of offer outstanding and unallocated confirmed lines of credit.
In 2002, loan commitments on investment grade financing accounted for 62% of the total commitments compared to 46% in 2001. This result is reflective of a higher concentration of loan signings for investment grade loans.
Loan Commitments
($ in millions)
Credit Quality — Insurance
Short-term
Within the short-term programs, the comparative spread in terms of country risk classification has remained relatively unchanged in 2002 compared with the 2001 levels.
Insurance Policies
Outstanding — Short-Term
(%)
Medium-term
Within the medium-term programs, there was a 5% increase in high investment grade concentration in 2002 compared with 2001 levels.
The increase in high investment grade in 2002 was mainly the result of an overall increase of 49% in exposure in the United States, due to the issuance of several performance guarantee policies. This increase was partially offset by the expiration of performance worldwide policies within the high investment grade category.
Insurance Policies
Outstanding — Medium-Term
(%)
Claims Experience
| | | | | | | | | |
| ($ in millions) | | 2002 | | 2001 |
| |
| |
|
| Claims paid | | | 144 | | | | 144 | |
| Claims recovered | | | 39 | | | | 51 | |
| | | |
| | | |
| |
| Net claims | | $ | 105 | | | $ | 93 | |
| | | |
| | | |
| |
In 2002, the Corporation paid 1,857 claims in 78 countries. During the same period in 2001, the Corporation paid 1,712 claims in 66 countries.
In 2002, claim payments were particularly impacted by the financial problems encountered in the industrial equipment sector. The 138 claim payments for $45 million represented 7% of the total number of claim payments and 31% of the total amount paid. Commercial defaults by buyers in Argentina and Mexico represented the majority of payments.
The value of claim payments remained the same as 2001 at $144 million. Meanwhile, the number of claims paid increased 8% from 2001.
The claims paid as a percentage of insurance policies outstanding over the past five years has averaged 1.00%.
Claims Paid
Number of Claims ($ in millions)
46
Size Concentration
| | | | | | | | | | | | | | | | | | | | | | | | | |
| ($ in millions) | | 2002 | | 2001 |
| |
| |
|
| | | $ of Claims | | Number of | | Claims | | $ of Claims | | Number of | | Claims |
| | | Paid | | Claims Paid | | Recovered | | Paid | | Claims Paid | | Recovered |
| |
| |
| |
| |
| |
| |
|
| $0 — $100,000 | | | 24 | | | | 1,635 | | | | 34 | | | | 24 | | | | 1,534 | | | | 15 | |
| $100,001 — $1 million | | | 49 | | | | 192 | | | | 1 | | | | 43 | | | | 163 | | | | 1 | |
| Over $1 million | | | 71 | | | | 30 | | | | 4 | | | | 77 | | | | 15 | | | | 35 | |
| | | |
| | | |
| | | |
| | | |
| | | |
| | | |
| |
| Total | | $ | 144 | | | | 1,857 | | | $ | 39 | | | $ | 144 | | | | 1,712 | | | $ | 51 | |
| | | |
| | | |
| | | |
| | | |
| | | |
| | | |
| |
Since the number of claims paid increased while the total value of claims remained constant, the average amount paid per claim decreased to $78 thousand from $84 thousand in 2001.
Insurance Claims Paid by Geographic Market
| | | | | | | | | | | | | | | | | | | | | | | | | | | | | | | | | | | | | | | | | | | | | | | | | |
| ($ in millions) | | 2002 | | 2001 |
| |
| |
|
| | | | | | | | | | | Call on | | | | | | | | | | | | | | | | | | | | | | Call on | | | | | | | | | | | | |
| Geographic Market | | Default | | Insolvency | | a Bond | | Expropriation | | Other | | Total | | Default | | Insolvency | | a Bond | | Expropriation | | Other | | Total |
| |
| |
| |
| |
| |
| |
| |
| |
| |
| |
| |
| |
|
| North America/ Caribbean* | | | 57 | | | | 27 | | | | 2 | | | | — | | | | — | | | | 86 | | | | 83 | | | | 17 | | | | — | | | | — | | | | — | | | | 100 | |
| Europe | | | 16 | | | | 1 | | | | 5 | | | | — | | | | — | | | | 22 | | | | 5 | | | | 2 | | | | 1 | | | | — | | | | 1 | | | | 9 | |
| South America/ Central America | | | 16 | | | | 4 | | | | — | | | | — | | | | 3 | | | | 23 | | | | 10 | | | | 3 | | | | — | | | | — | | | | — | | | | 13 | |
| Middle East/Africa | | | 3 | | | | — | | | | 5 | | | | — | | | | — | | | | 8 | | | | 2 | | | | — | | | | 1 | | | | — | | | | — | | | | 3 | |
| Asia/Pacific | | | 4 | | | | — | | | | — | | | | — | | | | 1 | | | | 5 | | | | 10 | | | | — | | | | — | | | | 9 | | | | — | | | | 19 | |
| | | |
| | | |
| | | |
| | | |
| | | |
| | | |
| | | |
| | | |
| | | |
| | | |
| | | |
| | | |
| |
| Total | | $ | 96 | | | $ | 32 | | | $ | 12 | | | $ | 0 | | | $ | 4 | | | $ | 144 | | | $ | 110 | | | $ | 22 | | | $ | 2 | | | $ | 9 | | | $ | 1 | | | $ | 144 | |
| | | |
| | | |
| | | |
| | | |
| | | |
| | | |
| | | |
| | | |
| | | |
| | | |
| | | |
| | | |
| |
Default Risk
Default is defined as the failure of the buyer to pay by the due date all or any part of the gross invoice value of goods delivered to and accepted by the buyer.
Default claim payments on behalf of losses in Mexico increased from 2001 ($17 million) and an increase in payments for losses in the United States ($3 million) offset by a decrease in payments for losses in Virgin Islands (British) ($45 million) account for most of the increase in claim payments in North America/Caribbean. The 2001 losses in Virgin Islands (British) related to financial difficulties of a parent company based in Singapore.
The increase in claim payments in Europe is due to losses in Germany which have increased from 2001 ($7 million) and an increase in Belgium ($4 million).
In South America/Central America, the majority of the increase is due to losses in Argentina ($10 million) offset by a decrease in claim payments in Venezuela ($3 million) and Peru ($2 million).
The decrease in claim payments in Asia/Pacific for default risk is mainly due to a decrease in claim payments for losses in Indonesia ($3 million) and China ($2 million).
Insolvency Risk
Insolvency of the customer occurs when the customer has reorganized his financial affairs under the bankruptcy or insolvency laws of his country.
The increase in insolvency claims paid within North America/Caribbean is mainly due to increases in the United States ($14 million) offset by a decrease in claim payments for losses in Canada ($4 million).
Call on a Bond
Call on a bond is the unilateral decision by the beneficiary of a stand-by letter of credit (the bond), issued on behalf of an exporter and in relation to its contract obligations, to demand the immediate payment of the face amount thereof.
The increase in claim payments in Europe is mainly due to an increase in payments for losses in Poland ($4 million).
The claims payments for losses in Saudi Arabia and the United Arab Emirates have increased from 2001 ($2 million each) which accounts for most of the increase in claim payments in Middle East/Africa.
47
Expropriation Risk
Expropriation is described as direct or indirect action(s) or omission(s), taken, authorized or condoned by a foreign government which have the result of depriving an insured of the benefits, use or control of its asset or investment.
The $9 million in claim payments made in Asia/Pacific for expropriation risk in 2001 is due to losses in Pakistan. No similar claim payments occurred in 2002.
Industry Concentration
The majority of the claims paid in 2002 were in the industrial equipment sector, mainly in Mexico ($15 million) and Argentina ($14 million). In 2001, the majority of the payments in the forestry sector were due to losses resulting from financial difficulties of a Singapore based forestry conglomerate ($45 million) and losses in China ($2 million). Within the financial institutions industry sector, the claims paid in 2002 were mainly due to losses in the United States ($6 million) and Poland ($4 million).
Claims Paid by Industry Sector
($ in millions)
Claims Submitted
At the end of 2002, the value of the claims requests that were still under consideration was $35 million (2001 — $48 million). The largest concentrations are related to claims pending for losses in the United States ($24 million) and Jordan ($5 million).
The value of claims submitted has decreased from $232 million in 2001 to $213 million in 2002 while the number of claims submitted increased from 2,571 in 2001 to 2,829 in 2002. The decrease in value from 2001 is mainly due to large claims in the Virgin Islands (British) in 2001. The five countries with the largest claims submitted in 2002 were the United States ($118 million), Argentina ($25 million), Mexico ($22 million), Jordan ($6 million) and Poland ($4 million).
Claims Submitted, Paid and
Under Consideration
($ in millions)
48
Credit Quality — Investments and Derivative Financial Instruments
EDC’s interest-bearing deposits and investment portfolio expose EDC to the risk that the deposit-taking institutions or the investment issuer will not repay EDC in accordance with contractual terms. EDC’s potential deposit and investment credit exposure is represented by the carrying value of the financial instruments.
The following table provides a breakdown, by credit rating and term to maturity, of EDC’s deposit and investment credit exposure.
| | | | | | | | | | | | | | | | | | | | | |
| ($ in millions) | | | | | | Remaining Term to Maturity | | | | | | | | |
| | | | | | |
| | | | | | | | |
| Credit | | Under 1 | | 1 to 3 | | Over 3 | | 2002 | | 2001 |
| Rating* | | Year | | Years | | Years | | Net Exposure | | Net Exposure |
| |
| |
| |
| |
| |
|
| Aaa | | | 1,122 | | | | 123 | | | | 352 | | | | 1,597 | | | | 974 | |
| Aa1 | | | 223 | | | | 15 | | | | 10 | | | | 248 | | | | 471 | |
| Aa2 | | | 331 | | | | 17 | | | | 27 | | | | 375 | | | | 115 | |
| Aa3 | | | 406 | | | | 91 | | | | 43 | | | | 540 | | | | 577 | |
| A1 | | | 60 | | | | 10 | | | | — | | | | 70 | | | | 161 | |
| A2 | | | 46 | | | | — | | | | — | | | | 46 | | | | 57 | |
| A3 | | | 32 | | | | — | | | | — | | | | 32 | | | | — | |
| | | |
| | | |
| | | |
| | | |
| | | |
| |
| Total | | $ | 2,220 | | | $ | 256 | | | $ | 432 | | | $ | 2,908 | | | $ | 2,355 | |
| | | |
| | | |
| | | |
| | | |
| | | |
| |
| * | | Moody’s long-term rating |
Derivatives expose EDC to the risk that the counterparty will not repay EDC in accordance with contractual terms. EDC’s potential derivative credit exposure is represented by the replacement cost of contracts that have positive fair value.
The following table provides a breakdown, by credit rating and term to maturity, of EDC’s derivative credit exposure.
| | | | | | | | | | | | | | | | | | | | | | | | | | | | | | | | | |
| ($ in millions) | | | | | | Remaining Term to Maturity | | | | | | | | | | | | | | | | | | | | |
| | | | | | |
| | | | | | | | | | | | | | | | | | | | |
| Credit | | Under 1 | | 1 to 3 | | Over 3 | | | | | | Exposure | | Collateral | | 2002 Net | | 2001 Net |
| Rating* | | Year | | Years | | Years | | Total | | Netting ** | | Held | | Exposure | | Exposure |
| |
| |
| |
| |
| |
| |
| |
| |
|
| Aaa | | | 3 | | | | 13 | | | | 22 | | | | 38 | | | | (14 | ) | | | — | | | | 24 | | | | 7 | |
| Aa1 | | | 15 | | | | 38 | | | | 30 | | | | 83 | | | | (62 | ) | | | — | | | | 21 | | | | 5 | |
| Aa2 | | | 5 | | | | 1 | | | | 42 | | | | 48 | | | | (42 | ) | | | — | | | | 6 | | | | 24 | |
| Aa3 | | | 41 | | | | 89 | | | | 244 | | | | 374 | | | | (58 | ) | | | (68 | ) | | | 248 | | | | 125 | |
| A1 | | | — | | | | — | | | | — | | | | — | | | | — | | | | — | | | | — | | | | 42 | |
| | | |
| | | |
| | | |
| | | |
| | | |
| | | |
| | | |
| | | |
| |
| Total | | $ | 64 | | | $ | 141 | | | $ | 338 | | | $ | 543 | | | $ | (176 | ) | | $ | (68 | ) | | $ | 299 | | | $ | 203 | |
| | | |
| | | |
| | | |
| | | |
| | | |
| | | |
| | | |
| | | |
| |
| * | | Moody’s long-term rating |
| |
| ** | | As a result of master netting agreements |
The Department of Finance sets out guidelines that limit the counterparty credit quality of EDC’s investments and derivative financial instruments. In addition, EDC has policies and procedures in place to limit and to manage the credit risk associated with these financial instruments.
Credit risk for investments and derivative financial instruments is reported on a monthly basis to the Asset/Liability Management Committee and quarterly to the Risk Management Committee of the Board.
| | | |
Allowance as a
Percentage of
Total Exposure
(%) | Allowance
Components
(%) | |
 | |
Allowance for Losses on Loans, Loan Commitments and Guarantees
EDC’s allowance for losses on loans, loan commitments and guarantees was $3,990 million at December 31, 2002, an increase of $510 million from 2001.
The allowance as a percentage of total exposure has increased to 10.9% in 2002. The increase from 2001 was primarily caused by the economic down-turn experienced in global markets. Numerous airline downgrades and financial uncertainty in the aerospace sector were primarily responsible for the increase in provisioning. As well, new impaired loans of $840 million caused an increase in provisioning, with telecom financing representing 51% of the total impairment.
The current provisioning methodology is comprised of various components of the total allowance which allows EDC to adequately provide for increased risks to specific counterparties, industries, and countries. These are represented by the counterparty concentration, country overlay, and industry overlay components, respectively, and are explained in more detail in the following sections.
49
Counterparty Concentration
A concentration component is added to adequately provision for sovereign and commercial counterparties whose level of exposure is deemed by management to represent an increased amount of risk. At December 31, a counterparty whose exposure exceeds 10% of shareholder’s equity will attract a concentration component calculated on the portion of exposure over that threshold. The allowance on this portion of exposure is calculated at the base allowance rate for that counterparty. The threshold is set based on external benchmarks for commercial chartered banks.
Indonesia and Venezuela represent 79% of the sovereign concentration allowance, while counterparties in the aerospace industry comprise 83% of the commercial concentration allowance.
Counterparty
Concentration
(%)
Country Overlay
A country overlay component is added for exposure to countries with negative outlooks that are experiencing economic downturns or recession. For countries with negative outlooks, the full impact of downturns or economic uncertainty are often not reflected in current credit ratings. This is due to timing issues for financial uncertainties that are often not reflected in credit ratings for up to two years after a downturn begins. The amount of overlay added is directly related to the amount of exposure, both sovereign and commercial, in every country with a negative outlook. An incremental allowance is added based on the current allowance and probability of a downgrade. When a country’s outlook changes to stable, a reversal of the overlay is amortized over the subsequent two years. The United States, Venezuela and Brazil collectively represent 80% of the total country overlay allowance.
The overlay for Venezuela was increased in 2002 to reflect the heightened economic uncertainty brought about by the volatile political situation and general strike that Venezuela was experiencing at the end of 2002.
Country Overlay
(%)
Industry Overlay
An industry overlay component is added to reflect the risk of economic downturns being experienced by companies in certain industries that are on credit watch or have negative outlooks. It is believed that companies in these industries have a greater risk than is reflected in current credit ratings. This is due to timing issues for financial difficulties that may not be reflected in current financial results, or for companies that are expected to be downgraded in the near future. The amount of overlay added is directly related to the amount of exposure to each company and the probability of a subsequent downgrade. Based on the probability of the downgrade and the likely credit rating, an appropriate amount of incremental allowance is added.
The aerospace industry comprises 71% of the total industry overlay and reflects the current financial uncertainty that many aerospace concerns are experiencing, which may result in further credit rating downgrades.
Industry Overlay
(%)
50
Allowance for Claims on Insurance
As at December 31, 2002, the allowance for claims on insurance is $460 million, a decrease of $4 million or 1% over the 2001 allowance of $464 million. During 2002, $115 million was charged to the income statement for the provision for credit losses relating to claims on insurance. This was offset by charges to the allowance of $111 million, due to write-offs of recoverable claims paid and claims expenses of $8 million. Despite the growth experienced in most insurance programs as well as a corresponding growth in the claims incurred but not reported, the impact of a refinement in the actuarial valuation methodology resulted in a net decrease in the allowance.
Seventy-eight per cent of the total unrecoverable portion of claims paid amount was attributable to short-term insurance claims.
The allowance as a percentage of insurance policies outstanding has remained within a range of 3.1% to 3.9% averaging 3.5% over the last five years. The allowance is based on an actuarial valuation of the insurance policy and claim liabilities. The actuarial valuation uses simulation techniques and is based on assumptions (frequency of claim and severity of loss) relevant for each insurance program separately and is derived from the Corporation’s own experience. Moreover, the allowance includes a provision for adverse deviation such that it will be sufficient to cover all expected losses 19 times out of 20.
| | | |
Unrecoverable Portion
of Claims Paid by
Geographic Market | Allowance as a %
of Insurance
Policies Outstanding
(%) | |
 | |
Capitalization
The gross assets of the Corporation are $29.9 billion (2001 — $28.2 billion), which are supported by shareholder’s equity and allowances of $6.5 billion (2001 — $6.0 billion). At this level of capitalization, 22% of assets do not require external debt financing (2001 — 21%).
The following table shows the capitalization of EDC over the last five years:
| | | | | | | | | | | | | | | | | | | | | | |
| ($ in millions) | | 2002 | | 2001 | | 2000 | | 1999 | | 1998 |
| |
| |
| |
| |
| |
|
| Shareholder’s equity: | | | | | | | | | | | | | | | | | | | | |
| | Capital | | | 983 | | | | 983 | | | | 983 | | | | 983 | | | | 983 | |
| | Retained earnings | | | 1,094 | | | | 1,067 | | | | 1,009 | | | | 815 | | | | 697 | |
| | | | |
| | | |
| | | |
| | | |
| | | |
| |
| Subtotal | | | 2,077 | | | | 2,050 | | | | 1,992 | | | | 1,798 | | | | 1,680 | |
| Allowances | | | 4,470 | | | | 3,964 | | | | 3,289 | | | | 2,798 | | | | 2,516 | |
| | | | |
| | | |
| | | |
| | | |
| | | |
| |
| Total capitalization | | $ | 6,547 | | | $ | 6,014 | | | $ | 5,281 | | | $ | 4,596 | | | $ | 4,196 | |
| | | | |
| | | |
| | | |
| | | |
| | | |
| |
Operational, Organizational and Business Risks
Operational risk is the potential risk of loss from human error, internal control weaknesses and systems deficiencies. Organizational risk is the risk of loss or cost to the company due to the organizational environment (people and skills, incentives, culture and values). Business risk is the potential for loss relating to EDC’s external environment or to its relations with stakeholders.
EDC manages and monitors these three types of risk and strives to develop tools and techniques based on best-in-class practice. To manage its operational risks, EDC has policies and procedures in place that establish clear segregation of responsibilities and timely internal reporting to management. To mitigate risks associated with its organizational and business environment, EDC makes use of a broad array of policies, practices, statements of corporate vision and values and business strategies and plans.
51
Market Risk
Market risk is the likelihood of loss to EDC as a result of movements in interest and foreign exchange rates and the risk that funds will not be available to meet corporate obligations. This risk is mitigated through the management of EDC’s asset/liability positions, through the use of derivatives, and through the maintenance of sufficient liquidity.
The Corporation manages its exposure to market risk using policy limits developed in consultation with the Department of Finance, overseen by the Risk Management Committee of the Board of Directors and approved by the Board of Directors. The Corporation’s Capital Markets group meets weekly to discuss market and credit risks and to analyze borrowing requirements. These activities and the asset/liability positions are reported monthly (or more frequently as required) to EDC’s Asset/Liability Management Committee, and quarterly to its Risk Management Committee of the Board, and to the Board of Directors.
The likelihood of loss to EDC as a result of possible movements in interest and foreign exchange rates is monitored and managed within operational guidelines and Board-approved policies. Market risk is aggregated and managed on an integrated basis. Limits exist for interest rate and foreign exchange rate shock effects in relation to projected net interest income and economic value. Exposures are classified, calculated and limited on a consolidated Canadian dollar equivalent basis, covering EDC’s lending, investing, funding and derivative transactions.
EDC continues to improve analytical techniques, information systems and reporting to enhance the evaluation and control of risk. The Market Risk Management Policies are reviewed annually with the Corporation’s Board of Directors, and compliance is reviewed quarterly with the Risk Management Committee of the Board of Directors.
Asset/Liability Management
Asset terms are set to meet the needs of external parties. EDC arranges its liabilities accordingly but must balance the need to match its assets and liabilities with opportunities to obtain optimal funding levels. In doing so, EDC may expose itself to interest rate and foreign exchange risk. Asset/liability gaps are measured against policy limits and reported to senior management on a monthly basis.
Interest Rate Risk
Interest rate risk is the exposure of the Corporation’s market value and net interest income to adverse movements in interest rates. Interest rate risk exists where there is a mismatch between maturities or interest rate resets between assets and liabilities.
EDC manages its interest rate risk in accordance with guidelines established by the Department of Finance, as well as policies set by the Board of Directors. EDC reports on its interest rate risk on a monthly basis to the Asset/Liability Management Committee, and on a quarterly basis to the Risk Management Committee of the Board.
The table below is an aging distribution of EDC’s fixed and floating rate financial instruments as at December 31, 2002. All figures are present values translated into Canadian dollars. Since capital, which bears no interest, is used to fund a portion of the interest-earning assets of the Corporation, there will always be a sensitivity to interest rates. EDC has chosen, strategically, to use its capital to fund the longest-term fixed rate assets, therefore its interest rate sensitivity is in the longer-dated fixed rate maturities.
Interest Rate Sensitivity
(Present Value $ in millions)
| | | | | | | | | | | | | | | | | | | | | | | | | | | | | |
| | | 1d-6m | | 6m-12m | | 12m-5y | | 5y-10y | | 10y-15y | | 15y+ | | Total |
| | |
| |
| |
| |
| |
| |
| |
|
Assets | | | | | | | | | | | | | | | | | | | | | | | | | | | | |
| Fixed rate | | | 679 | | | | 362 | | | | 4,420 | | | | 5,095 | | | | 4,022 | | | | 963 | | | | 15,541 | |
| Floating rate | | | 14,939 | | | | — | | | | — | | | | — | | | | — | | | | — | | | | 14,939 | |
| Investments | | | 3,107 | | | | — | | | | — | | | | — | | | | — | | | | — | | | | 3,107 | |
| | | |
| | | |
| | | |
| | | |
| | | |
| | | |
| | | |
| |
| Total | | $ | 18,725 | | | $ | 362 | | | $ | 4,420 | | | $ | 5,095 | | | $ | 4,022 | | | $ | 963 | | | $ | 33,587 | |
| | | |
| | | |
| | | |
| | | |
| | | |
| | | |
| | | |
| |
Liabilities | | | | | | | | | | | | | | | | | | | | | | | | | | | | |
| Fixed rate | | | 1,063 | | | | 173 | | | | 3,601 | | | | 327 | | | | 660 | | | | 42 | | | | 5,866 | |
| Floating rate | | | 12,042 | | | | — | | | | — | | | | — | | | | — | | | | — | | | | 12,042 | |
| Commercial paper | | | 5,251 | | | | — | | | | — | | | | — | | | | — | | | | — | | | | 5,251 | |
| | | |
| | | |
| | | |
| | | |
| | | |
| | | |
| | | |
| |
| Total | | $ | 18,356 | | | $ | 173 | | | $ | 3,601 | | | $ | 327 | | | $ | 660 | | | $ | 42 | | | $ | 23,159 | |
| | | |
| | | |
| | | |
| | | |
| | | |
| | | |
| | | |
| |
| Interest rate sensitivity position | | | 369 | | | | 189 | | | | 819 | | | | 4,768 | | | | 3,362 | | | | 921 | | | | 10,428 | |
| | | |
| | | |
| | | |
| | | |
| | | |
| | | |
| | | |
| |
| Cumulative position | | $ | 369 | | | $ | 558 | | | $ | 1,377 | | | $ | 6,145 | | | $ | 9,507 | | | $ | 10,428 | | | | | |
| | | |
| | | |
| | | |
| | | |
| | | |
| | | |
| | | |
| |
52
Foreign Exchange Risk
Foreign exchange risk is the exposure of the Corporation’s net interest income and market value to adverse movements in foreign exchange rates. Foreign exchange risk exists where there is a mismatch between assets and liabilities in any currency. EDC manages foreign exchange risk within Board approved policies with the objective of minimizing foreign exchange losses.
EDC’s foreign exchange risk is managed in accordance with guidelines established by the Department of Finance, as well as policies set by the Board of Directors. EDC reports on its foreign exchange risk on a monthly basis to the Asset/Liability Management Committee, and on a quarterly basis to the Risk Management Committee of the Board.
Derivatives
EDC uses a variety of derivatives to manage costs, returns and levels of financial risk associated with its funding, investment and risk management activities. EDC’s use of derivatives may include, but is not restricted to, currency and interest rate swaps, foreign exchange contracts and equity index swaps. EDC does not use derivatives for speculative purposes.
EDC does not engage in the use of derivatives whose value and financial risks cannot be measured, monitored and managed on a timely basis. The Market Risk Management department formally reviews EDC derivative financial instrument transactions at time of inception, and on an ongoing basis, to provide an independent verification on the valuation of transaction structures, and of associated financial risks.
The use of any new derivative products is reviewed and reported separately by the Market Risk Management department to the Treasurer and the Senior Vice-President and Chief Financial Officer. Financial risks associated with derivatives are controlled and reported as specified in Market Risk Management Policies approved by the Board of Directors. EDC’s use of derivatives is typically linked to the following activities:
Funding
Derivatives are used to achieve reduced fixed rate or sub-LIBOR floating rate funding costs. An example would be issuing an EDC bond in a foreign currency, on a fixed interest rate basis, and entering into a currency and interest rate swap with a credit worthy counterparty to achieve low-cost floating rate U.S. dollar denominated debt, thereby replacing the foreign currency denominated payment obligations with U.S. dollar denominated obligations. The combination of the bond issue and swap would deliver a more favourable cost of funding than could be achieved using a straight U.S. dollar floating rate bond issue.
Investing
Derivatives are used to maximize yields on investments. For example, rather than invest directly in a three month U.S. dollar treasury bill, EDC may obtain a higher yield by investing in a Japanese yen swapped deposit, where U.S. dollars are converted to yen and invested in a three-month yen deposit. At maturity, the maturing term deposit plus interest is swapped back into U.S. dollars. This structure uses a forward foreign exchange contract to enhance the investment yield.
Risk Management
Derivatives are used to hedge risks by diversifying concentrated exposures. For example, EDC might balance the proportion of fixed to floating rate assets in its investment book, using interest rate swaps, in order to diversify interest rate risk.
Liquidity Risk
Liquidity risk is the risk that funds will not be available to meet current and future cash outflow requirements. Pursuant to its risk management policies, EDC must maintain enough liquidity to meet the following six months’ net cash outflow requirements without accessing the capital markets (i.e., bond issuance). This is ensured by measuring and reporting to senior management EDC’s actual liquidity position against this minimum limit on a monthly basis.
EDC maintains liquidity through a variety of methods:
| • | | Access to Commercial Paper Markets: In the course of EDC’s normal activities, the Corporation’s commercial paper programs provide it with the necessary liquidity to meet its cash requirements on a daily basis. During 2002, the average balance of short-term debt was $3,443 million (2001 — $3,313 million) with a turnover of 16 times (2001 — 17 times). |
| |
| • | | Cash and Marketable Securities: EDC holds cash and marketable securities to ensure that sufficient liquidity is available, if required, to meet forecasted cash requirements. During 2002, the average balance of cash and marketable securities was $2,759 million (2001 — $2,840 million) |
| |
| • | | Standby Credit Facility: As a contingency, EDC also maintains a U.S. $2 billion standby revolving credit facility to further ensure its liquidity. To date, it has not been necessary to use this facility. |
53
Financial Reporting Responsibility

Peter Allen
Senior Vice-President and
Chief Financial Officer
The consolidated financial statements contained in this Annual Report have been prepared by management in accordance with generally accepted accounting principles appropriate in the circumstances and consistently applied. The integrity and objectivity of the data in these consolidated financial statements are management’s responsibility. The consolidated financial statements include some amounts, such as the allowances for losses on loans, the allowance for loan commitments and guarantees and the allowance for claims on insurance, that are necessarily based on management’s best estimates and judgment. Management is also responsible for all other information in the Annual Report and for ensuring that this information is consistent, where appropriate, with the information and data contained in the consolidated financial statements.
In support of its responsibility, management maintains financial, management control and information systems and management practices to provide reasonable assurance that the financial information is reliable, that the assets are safeguarded and that the operations are carried out effectively. The Corporation has an internal audit department whose functions include reviewing internal controls and their application, on an ongoing basis.
The Board of Directors of EDC is responsible for the management of the business and activities of the Corporation. In particular, it is responsible for ensuring that management fulfills its responsibilities for financial reporting and internal control and exercises this responsibility through the Audit Committee of the Board, which is composed of Directors who are not employees of the Corporation. The Audit Committee meets with management, the internal auditors and the Auditor General of Canada on a regular basis.
Contracts which, in the opinion of EDC, involve risks in excess of that which the Corporation would normally undertake, may be entered into under the authority of the Minister for International Trade and the Minister of Finance where the Minister for International Trade considers them to be in the national interest. Funds required for such contracts are paid to the Corporation by the Minister of Finance out of the Consolidated Revenue Fund, and funds recovered are remitted to the Consolidated Revenue Fund, net of amounts withheld to cover related administrative expenses. These transactions, which are known as Canada Account transactions, are shown in note 21 to the Corporation’s consolidated financial statements, and the responsibility of the Board of Directors for these transactions is limited to the management of the administration thereof by EDC.
The Auditor General of Canada conducts an independent audit, in accordance with generally accepted auditing standards, and expresses her opinion on the consolidated financial statements. Her report is presented on the following page.
| | | |
A. Ian Gillespie
President and
Chief Executive Officer | | 
Peter Allen
Senior Vice-President and
Chief Financial Officer |
54
Auditor’s Report
AUDITOR GENERAL OF CANADA  VÉRIFICATEUR GÉNÉRAL DU CANADA
To the Minister for International Trade
I have audited the consolidated balance sheet of Export Development Canada as at December 31, 2002 and the consolidated statements of income and retained earnings and cash flows for the year then ended. These financial statements are the responsibility of the Corporation’s management. My responsibility is to express an opinion on these financial statements based on my audit.
I conducted my audit in accordance with Canadian generally accepted auditing standards. Those standards require that I plan and perform an audit to obtain reasonable assurance whether the financial statements are free of material misstatement. An audit includes examining, on a test basis, evidence supporting the amounts and disclosures in the financial statements. An audit also includes assessing the accounting principles used and significant estimates made by management, as well as evaluating the overall financial statement presentation.
In my opinion, these consolidated financial statements present fairly, in all material respects, the financial position of the Corporation as at December 31, 2002 and the results of its operations and its cash flows for the year then ended in accordance with Canadian generally accepted accounting principles. As required by the Financial Administration Act, I report that, in my opinion, these principles have been applied on a basis consistent with that of the preceding year.
Further, in my opinion, the transactions of the Corporation and of its wholly-owned subsidiary that have come to my notice during my audit of the consolidated financial statements have, in all significant respects, been in accordance with Part X of the Financial Administration Act and regulations, the Export Development Act and regulations and the by-laws of the Corporation and its wholly-owned subsidiary.

Sheila Fraser, FCA
Auditor General of Canada
Ottawa, Canada
February 12, 2003
55
Consolidated Financial Statements
Consolidated Balance Sheet
| | | | | | | | | | |
| as at December 31 | | | | | | | | |
| ($ in millions) | | 2002 | | 2001 |
| |
| |
|
Assets | | | | | | | | |
| | Cash and Investments | | | | | | | | |
| | Cash and cash equivalents | | | 271 | | | | 612 | |
| | Marketable securities (note 3) | | | 2,553 | | | | 1,562 | |
| | Investments (note 4) | | | 75 | | | | 172 | |
| | Accrued interest | | | 9 | | | | 9 | |
| | | | |
| | | |
| |
| | | | 2,908 | | | | 2,355 | |
| | | | |
| | | |
| |
| | Loans Receivable | | | | | | | | |
| | Net loans receivable (notes 5, 6 and 7) | | | 21,010 | | | | 20,826 | |
| | Accrued interest and fees | | | 295 | | | | 269 | |
| | | | |
| | | |
| |
| | | | 21,305 | | | | 21,095 | |
| | | | |
| | | |
| |
| | Other | | | | | | | | |
| | Recoverable insurance claims (note 10) | | | 90 | | | | 96 | |
| | Derivative related amounts (note 17) | | | 171 | | | | 167 | |
| | Other assets | | | 80 | | | | 80 | |
| | | | |
| | | |
| |
| | | | 341 | | | | 343 | |
| | | | |
| | | |
| |
Total Assets | | $ | 24,554 | | | $ | 23,793 | |
| | | | |
| | | |
| |
Liabilities and Shareholder’s Equity | | | | | | | | |
| | Loans Payable (notes 13 and 14) | | | | | | | | |
| | Loans payable | | | 20,828 | | | | 19,609 | |
| | Accrued interest | | | 254 | | | | 415 | |
| | | | |
| | | |
| |
| | | | 21,082 | | | | 20,024 | |
| | | | |
| | | |
| |
| | Other Liabilities and Deferred Revenue | | | | | | | | |
| | Accounts payable and other credits | | | 155 | | | | 131 | |
| | Deferred insurance premiums | | | 19 | | | | 20 | |
| | Derivative related amounts (note 17) | | | 384 | | | | 516 | |
| | Allowance for loan commitments and guarantees (note 7) | | | 377 | | | | 588 | |
| | Allowance for claims on insurance (note 11) | | | 460 | | | | 464 | |
| | | | |
| | | |
| |
| | | | 1,395 | | | | 1,719 | |
| | | | |
| | | |
| |
| | Loan Commitments and Contingent Liabilities (notes 8 and 9) | | | | | | | | |
| | Shareholder’s Equity (note 15) | | | | | | | | |
| | Share capital | | | 983 | | | | 983 | |
| | Retained earnings | | | 1,094 | | | | 1,067 | |
| | | | |
| | | |
| |
| | | | 2,077 | | | | 2,050 | |
| | | | |
| | | |
| |
Total Liabilities and Shareholder’s Equity | | $ | 24,554 | | | $ | 23,793 | |
| | | | |
| | | |
| |
See accompanying notes.
Approved by the Board of Directors
| | | |
 | | |
R. Fung
Director | | A. Ian Gillespie
Director |
56
Consolidated Statement of Income and Retained Earnings
| | | | | | | | | |
| for the year ended December 31 | | | | | | | | |
| ($ in millions) | | 2002 | | 2001 |
| |
| |
|
| Interest income: | | | | | | | | |
| Loans | | | 1,404 | | | | 1,620 | |
| Debt relief (note 19) | | | 96 | | | | 1 | |
| Investment portfolio | | | 69 | | | | 127 | |
| | | |
| | | |
| |
| | | | 1,569 | | | | 1,748 | |
| Interest expense | | | 580 | | | | 934 | |
| | | |
| | | |
| |
Net Interest Income | | | 989 | | | | 814 | |
Insurance Premiums and Guarantee Fees | | | 147 | | | | 134 | |
Provision for Credit Losses (note 12) | | | 840 | | | | 741 | |
| | | |
| | | |
| |
| Income after provision for credit losses | | | 296 | | | | 207 | |
Administrative Expenses | | | 174 | | | | 149 | |
| | | |
| | | |
| |
Net Income | | | 122 | | | | 58 | |
Retained Earnings | | | | | | | | |
| Beginning of year | | | 1,067 | | | | 1,009 | |
| Dividend paid (note 19) | | | 95 | | | | — | |
| | | |
| | | |
| |
| End of year | | $ | 1,094 | | | $ | 1,067 | |
| | | |
| | | |
| |
See accompanying notes.
57
Consolidated Statement of Cash Flows
| | | | | | | | | | |
| for the year ended December 31 | | | | | | | | |
| ($ in millions) | | 2002 | | 2001 |
| |
| |
|
Operating Activities | | | | | | | | |
| Net income | | | 122 | | | | 58 | |
| Items not affecting cash and cash equivalents | | | | | | | | |
| | Provision for credit losses | | | 840 | | | | 741 | |
| | Net increase in accrued interest and fees receivable | | | (272 | ) | | | (149 | ) |
| | Net decrease in accrued interest and fees payable | | | (163 | ) | | | (50 | ) |
| | Net (increase)/decrease in derivative related amounts receivable | | | (13 | ) | | | 110 | |
| | Net increase/(decrease) in derivative related amounts payable | | | 28 | | | | (358 | ) |
| | Other changes | | | (63 | ) | | | (90 | ) |
| | | |
| | | |
| |
| Cash flows from operating activities | | | 479 | | | | 262 | |
| | | |
| | | |
| |
Investing Activities | | | | | | | | |
| Loan disbursements | | | (6,028 | ) | | | (8,085 | ) |
| Loan repayments | | | 5,157 | | | | 6,243 | |
| (Increase)/decrease in marketable securities | | | (980 | ) | | | 548 | |
| Increase/(decrease) in investments | | | 97 | | | | (2 | ) |
| | | |
| | | |
| |
| Cash flows used in investing activities | | | (1,754 | ) | | | (1,296 | ) |
| | | |
| | | |
| |
Financing Activities | | | | | | | | |
| Issue of long-term loans payable | | | 6,134 | | | | 5,398 | |
| Repayment of long-term loans payable | | | (5,277 | ) | | | (4,203 | ) |
| Increase in short-term loans payable | | | 177 | | | | 329 | |
| Dividend paid | | | (95 | ) | | | — | |
| | | |
| | | |
| |
| Cash flows from financing activities | | | 939 | | | | 1,524 | |
| | | |
| | | |
| |
| Effect of exchange rate changes on cash and cash equivalents | | | (5 | ) | | | 18 | |
| | | |
| | | |
| |
| Net (decrease)/increase in cash and cash equivalents | | | (341 | ) | | | 508 | |
Cash and Cash Equivalents | | | | | | | | |
| Beginning of year | | | 612 | | | | 104 | |
| | | |
| | | |
| |
| End of year | | $ | 271 | | | $ | 612 | |
| | | |
| | | |
| |
Represented by | | | | | | | | |
| Cash | | | 34 | | | | 81 | |
| Treasury bills | | | 237 | | | | 531 | |
| | | |
| | | |
| |
| | | $ | 271 | | | $ | 612 | |
| | | |
| | | |
| |
Supplemental Information | | | | | | | | |
| Cash paid for interest | | $ | 616 | | | $ | 1,034 | |
| | | |
| | | |
| |
See accompanying notes.
58
Notes to the Consolidated Financial Statements
1. Corporate Mandate and Activities
Export Development Canada (the “Corporation” or “EDC”), which prior to December 21, 2001 was named Export Development Corporation, was established on October 1, 1969 by the Export Development Act (the “Act”), a statute of the Parliament of Canada that was last amended effective December 21, 2001. The Act provides that the Corporation was established for the purposes of supporting and developing, directly or indirectly, Canada’s export trade and Canadian capacity to engage in that trade and to respond to international business opportunities. The Corporation is accountable for its affairs to Parliament through the Minister for International Trade.
EDC incorporated Exinvest Inc. as a wholly-owned subsidiary (the “Subsidiary”) under the Canada Business Corporations Act in 1995. The activities of the Subsidiary have been consolidated with those of the Corporation.
The earnings of the Corporation and its Subsidiary are not subject to the requirements of the Income Tax Act.
The Corporation is subject to a limit imposed by the Act on its contingent liability programs. The Act specifies that the limit applies to the principal amount owing under all outstanding arrangements which have the effect of providing, to any person, any insurance, reinsurance, indemnity or guarantee. This limit shall at no time exceed the greater of an amount equal to 10 times the authorized capital of the Corporation and $17.5 billion, which amount may be varied in an appropriation Act. During 2002, the amount of $17.5 billion was increased to $20.0 billion by an appropriation Act (Bill C-21). As at December 31, 2002, the amount of these contingent liabilities is $15.3 billion (2001 — $14.5 billion restated — see note 9).
EDC is for all purposes an agent of Her Majesty in right of Canada. As a result, all obligations under debt instruments issued by the Corporation are obligations of Canada. The Act allows the Corporation to borrow and have outstanding borrowings up to a maximum of 15 times the aggregate of its (a) current paid-in capital and (b) the retained earnings of the Corporation determined in accordance with the previous year’s audited financial statements. The maximum applicable to December 31, 2002 is $30.8 billion (2001 — $29.9 billion), against which borrowings amounted to $20.8 billion (2001 — $19.6 billion).
2. Summary of Significant Accounting Policies
Cash and Cash Equivalents
Cash equivalents represent short-term highly liquid investments that are readily convertible into known amounts of cash and that are subject to an insignificant risk of changes in value. Cash and cash equivalents on EDC’s balance sheet comprise cash and treasury bills. Cash flows arising from transactions in a foreign currency are translated at the yearly average exchange rate. As well, investing or financing transactions that do not require the use of cash or cash equivalents are excluded from the statement of cash flows and disclosed elsewhere in the financial statements.
Marketable Securities and Investments
Securities and investments that are being held to maturity are carried at cost. Gains and losses on these securities and investments are recognized in income only when they are realized and the asset is removed from the balance sheet. In the case of a significant and other than temporary loss in the value of a security or investment carried at cost, the security or investment would be written down in value at the time of impairment. Temporary investments are carried at market value. The gains and losses arising from securities carried at market value are included in investment portfolio income.
Net Loans Receivable
Net loans receivable are stated net of non-accrued capitalized interest, deferred loan revenue, and the allowance for losses on loans. Non-accrued capitalized interest represents contractual interest capitalized according to rescheduling agreements with sovereign borrowers during which time the loans are classified as impaired, but not recognized for financial statement purposes. Rescheduled loans are considered performing unless they meet the criteria of impaired loans.
59
Loan interest is recorded on an accrual basis until such time as management determines that a loan should be classified as impaired. Loans are classified as impaired when circumstances indicate that the Corporation no longer has reasonable assurance that the full amount of principal and interest will be collected on a timely basis in accordance with the terms of the loan agreement. Commercial loans are made impaired when there are payment overdues of 90 days or more, or if the counterparty is in bankruptcy protection. Amounts received for impaired loans are credited to the book value of the loans. No portion of cash received on a loan subsequent to its classification as impaired is recorded as interest income until such time as any specific allowance has been reversed, and it is determined that the loan principal is fully collectible in accordance with the contractual terms of the loan. An impaired loan is restored to a performing basis after a pattern of regular payments has been established, normally three years. When the Corporation restores the impaired loan to an accrual basis, previously non-accrued capitalized interest is recognized over the remaining term of the loan.
Deferred Revenue
Deferred loan revenue, comprised of exposure fees and administration fees, is recognized as interest income and amortized as a yield increment over the term of the related loan. Guarantee fee revenue is recognized as income together with insurance premium revenue and is amortized over the term of the related guarantee.
Measurement Uncertainty
To prepare the Corporation’s financial statements in accordance with Canadian generally accepted accounting principles, it is necessary for management to make assumptions and estimates based on information available as at the date of the financial statements. The most material of these estimates are the allowance for losses on loans, loan commitments and guarantees (note 7) and the allowance for claims on insurance (note 11). Management determines the allowances using various assumptions, based on its assessment of the impact of recent events and changes in economic conditions and trends. These estimates are reviewed periodically during the course of the year as required and in detail as at the date of the financial statements. Actual losses on loans and liabilities for contingencies incurred may vary significantly from management’s estimates. The uncertainty in the estimation process arises, in part, from the use of historical data to identify and quantify credit deterioration. While historical data may be the most reliable basis available to calculate these amounts, economic events may occur in the near term that render previous assumptions invalid and cause a material change to management’s estimates.
The general allowance for losses on loans, loan commitments and guarantees is estimated using historical loan default and recovery rates. For specifically identified impaired loans, recoverable amounts are calculated using the best estimates of the timing and amount of future cash flows for each borrower.
The allowance for claims on insurance is calculated by discounting estimated future net claims less future net premiums, based on assumptions consistent with the Corporation’s past experience. Additional amounts are provided for possible adverse deviation from best estimate assumptions. While these amounts vary with the degree of uncertainty inherent in each program and with the homogeneity of policies (size and term) within each portfolio, the valuation process conforms to the recommendations of the Canadian Institute of Actuaries.
Allowance for Losses on Loans, Loan Commitments and Guarantees
The allowance for losses on loans, loan commitments and guarantees is based on a review of all loans, loan guarantees and commitments to commercial and sovereign borrowers and represents management’s best estimate of probable credit losses. The allowance includes both general and specific allowances.
General allowances are comprised of the base allowance calculated based on counterparty credit ratings, market overlays, and a counterparty concentration allowance. General allowances are calculated based on probable credit losses for performing loans, loan guarantees, and loan commitments (including letters of offer). Amounts for loan commitments are factored to provide for the estimated usage rate of the commitment.
For the base allowance, EDC classifies its performing loans, loan guarantees and commitments into seven categories. The first six categories represent groups of performing loans that share the same credit rating. The Corporation categorizes its performing commercial and sovereign loans using a rating system of 6 credit grades (AA grade to C grade), then establishes an appropriate general allowance based on expected credit losses for each performing risk category. The seventh category represents loan assets that have been designated as watch list items, which require a higher degree of monitoring and loan allowance. These seven categories, as well as the counterparty ratings, are consistent with the categorization and ratings used by EDC’s credit risk management policies. These categories are further segregated between commercial and sovereign exposures, OECD and emerging market countries, and secured and unsecured exposures. Loss rates are determined for each category based on estimates of default rates and loss severity. Default rates are based on the average of Moody’s and Standard and Poor’s default tables. Loss severity is determined based on EDC’s historical loan loss rates. These rates are then applied to the segregated categories to form the general allowance.
In addition, market overlays are provided for those countries and industries which are currently experiencing downward trends. These overlays are needed because of the time delay that exists between market events and announcement of credit rating changes.
60
EDC has significant single name counterparty concentrations. A counterparty concentration allowance is established for counterparties whose exposure is deemed by management to represent an increased amount of risk. At December 31, 2002, this level was assessed at 10% of shareholder’s equity.
Specific allowances are established on an individual loan basis to recognize credit losses. When a loan is considered impaired, the carrying value of the loan is reduced to its estimated realizable value using appropriate market values. When market values are not available, the estimated realizable value is determined by discounting expected cash flows at rates inherent in the loan. The amount of initial impairment and any subsequent changes due to the re-evaluation of estimated future cash flows are recorded through the provision for credit losses as an adjustment to the specific allowance for impaired loans.
The general allowances for performing loans and specific allowances for impaired loans are shown as a reduction in gross loans receivable in note 5 to arrive at net loans receivable which is an asset on the balance sheet. General allowances for loan guarantees and loan commitments are shown as a liability on the balance sheet.
Recoverable Insurance Claims
Recoverable insurance claim payments are recorded at estimated recoverable values. Subsequent net gains or losses on recovery are credited or charged to the allowance for claims on insurance when recoverable values are re-estimated.
Allowance for Claims on Insurance
The allowance for claims on insurance is based on an actuarial review of net loss experience and potential net losses and represents management’s best estimate of the net present value of the liability under existing policies. The related provision is recorded through the provision for credit losses.
Insurance Premiums
For short-term insurance policies, premiums are taken into income at the commencement of coverage. Premiums on other export insurance policies are taken into income using methods that generally reflect the exposures over the terms of the policies and are amortized over the life of the policies on a straight line basis. Reinsurance premiums and recoveries on losses incurred are recorded as reductions of the respective income and balance sheet accounts. Unearned premiums on insurance transferred to reinsurers and estimates of amounts recoverable from reinsurers on unpaid claims are deducted from deferred premiums and recoverable claims respectively.
Derivative Financial Instruments
The Corporation uses a variety of derivative financial instruments (“derivatives”) to manage market risk, which includes foreign exchange fluctuations and changes in interest rates. These derivatives are only contracted with creditworthy counterparties. The counterparty must have a minimum credit rating of A3 where EDC has a collateral agreement with the counterparty. In transactions where EDC does not have a collateral agreement with the counterparty, the counterparty must have a minimum credit rating of A2 for transactions of less than three years, and a minimum credit rating of Aa3 for transactions greater than three years.
Derivatives are recognized on the balance sheet upon issuance, and removed from the balance sheet when they expire or are terminated. Both on initial recognition and subsequently, each derivative is recognized as either an asset or a liability on the balance sheet at its accrual basis value. The derivative is an asset when the accrual basis value indicates that the counterparty owes EDC. The derivative is a liability when the accrual basis value indicates that EDC owes the counterparty. Assets are disclosed on the balance sheet as a separate component of other assets, while liabilities are disclosed on the balance sheet as a separate component of other liabilities and deferred revenue. Premiums paid or discounts received on these instruments are deferred and amortized over the life of the contract. Net receipts or payments are recognized in income on an accrual basis in the same period and the same financial statement category to which the contract is related. Where the interest payment amount is known in advance, as is the case with fixed and floating rate payments, the accrual allocates the income (or expense) over the period to payment. Where the interest payment amount is not known in advance, an appropriate interest accrual is determined by reference to market prices. Changes in the accrual basis values of derivatives are reported in the statement of cash flows as operating activities.
Translation of Foreign Currency
All monetary assets and liabilities denominated in foreign currencies are translated into Canadian dollars at exchange rates prevailing at the end of the year. Income and expenses are translated at monthly average exchange rates in effect during the year. Exchange gains and losses resulting from the translation of foreign currency balances and transactions are included with interest expense.
Interest Expense
Interest expense includes expenses of commercial paper, bonds, derivative financial instruments, the amortization of debt discount and issue expenses, and foreign exchange gains and losses. Gains or losses incurred when the Corporation repurchases its bonds, and unwinds any swaps related to those bonds, are either taken into income at the time of the transaction, or deferred and amortized over the life of a replacement debt issue, should one be issued.
61
Employee Benefits
The Corporation maintains a defined benefit pension plan to provide retirement benefits to its employees. Pension costs are actuarially determined using the projected benefit method pro rated on service and management’s best estimate assumptions. The latest valuation was completed by an independent actuary as at December 31, 2002. The discount rate used to determine the accrued benefit obligation was based on market rates for long-term high-quality bonds. Pension fund assets are valued at fair value for the purpose of calculating the expected return on plan assets.
The net pension plan expense consists of the actuarially determined pension benefits for the current year’s service, imputed interest on projected pension obligations net of interest earned on plan assets and the amortization of actuarial gains or losses and other items over the average remaining service period of active employees expected to receive benefits under the plan. Actuarial gains or losses are amortized only if the net actuarial gain or loss at the beginning of the year is in excess of 10% of the greater of the accrued benefit obligation and the fair value of plan assets.
The cumulative difference between the pension expense and funding contributions is included in accounts payable and other credits.
The Corporation also provides other non-pension post-retirement benefits for employees including a retiring allowance plan and life insurance and health and dental care benefits. The cost of these benefits is accrued for as earned by the employees and is actuarially determined in a manner consistent with the method used for the pension benefits.
Adoption in fiscal 2000 of the CICA’s new standard for recording employee future benefits resulted in a transitional obligation with respect to the non-pension post-retirement benefit plans. The transitional obligations with respect to the retiring allowance plan and the other post-retirement benefit plans are being amortized into income over 14 and 20 years respectively.
3. Marketable Securities
The Corporation maintains liquidity sufficient to meet general operating requirements, to maintain stability in the short-term borrowing program and to provide flexibility in achieving corporate objectives. In order to meet these varied needs, marketable securities are held in either the investment portfolio or the temporary investment portfolio. Investment portfolio securities are held for liquidity as well as for the longer term. Temporary investments will either mature or be sold within a year. Credit exposure related to securities held in the investment portfolio and the temporary investment portfolio is represented by their carrying value.
| | | | | | | | | | | | | | | | | | |
| ($ in millions) | | 2002 | | 2001 |
| |
| |
|
| | | | Portfolio | | | | | | | | |
| | | |
| | | | | | | | |
| | | | | | | | Temporary | | | | | | | | |
| Issued or guaranteed by: | | Investments | | Investments | | Total | | Total |
| |
| |
| |
| |
|
| | Canadian government* | | | 397 | | | | — | | | | 397 | | | | 284 | |
| | Corporate | | | 407 | | | | 72 | | | | 479 | | | | 501 | |
| | Financial institutions | | | 1,196 | | | | 314 | | | | 1,510 | | | | 767 | |
| | Other sovereign | | | 167 | | | | — | | | | 167 | | | | 10 | |
| | | |
| | | |
| | | |
| | | |
| |
| Total Marketable Securities | | $ | 2,167 | | | $ | 386 | | | $ | 2,553 | | | $ | 1,562 | |
| | | |
| | | |
| | | |
| | | |
| |
| * | | Canadian government includes federal, provincial, and municipal governments and Crown corporations. |
62
The table below shows yields on EDC’s marketable securities and how derivative financial instruments have been used to manage interest rate and foreign currency exposures of the Corporation’s investment portfolio.
| | | | | | | | | | | | | | | | | | | | | | |
| ($ in millions) | | 2002 | | 2001 |
| |
| |
|
| | | | Remaining Term to Maturity | | | | | | | | |
| | | |
| | | | | | | | |
| | | | Under | | 1 to 3 | | Over 3 | | | | | | | | |
| | | | 1 Year | | Years | | Years | | Total | | Total |
| | | |
| |
| |
| |
| |
|
Investment portfolio | | | | | | | | | | | | | | | | | | | | |
| Fixed rate securities | | | 135 | | | | 62 | | | | 353 | | | | 550 | | | | 423 | |
| Swap contracts | | | (95 | ) | | | (26 | ) | | | (33 | ) | | | (154 | ) | | | (193 | ) |
| | | |
| | | |
| | | |
| | | |
| | | |
| |
| Subtotal | | | 40 | | | | 36 | | | | 320 | | | | 396 | | | | 230 | |
| | | |
| | | |
| | | |
| | | |
| | | |
| |
| | Yield to maturity % | | | 5.24 | | | | 5.03 | | | | 5.00 | | | | 5.00 | | | | 4.82 | |
| Floating rate securities | | | 1,417 | | | | 184 | | | | 16 | | | | 1,617 | | | | 618 | |
| Swap contracts | | | 100 | | | | 25 | | | | 30 | | | | 155 | | | | 199 | |
| | | |
| | | |
| | | |
| | | |
| | | |
| |
| Subtotal | | | 1,517 | | | | 209 | | | | 46 | | | | 1,772 | | | | 817 | |
| | | |
| | | |
| | | |
| | | |
| | | |
| |
| | Yield to reset % | | | 1.72 | | | | 2.10 | | | | 1.77 | | | | 1.81 | | | | 2.24 | |
| Total investment portfolio | | | 1,557 | | | | 245 | | | | 366 | | | | 2,168 | | | | 1,047 | |
| | | |
| | | |
| | | |
| | | |
| | | |
| |
Temporary investments | | | | | | | | | | | | | | | | | | | | |
| Floating rate securities | | | 386 | | | | — | | | | — | | | | 386 | | | | 521 | |
| | Spot yield % | | | | | | | | | | | | | | | 2.86 | | | | 2.13 | |
| | Value at purchase | | | | | | | | | | | | | | | 384 | | | | 519 | |
| | | |
| | | |
| | | |
| | | |
| | | |
| |
| Total portfolio | | | 1,943 | | | | 245 | | | | 366 | | | | 2,554 | | | | 1,568 | |
| Derivative related amounts | | | (5 | ) | | | 1 | | | | 3 | | | | (1 | ) | | | (6 | ) |
| | | |
| | | |
| | | |
| | | |
| | | |
| |
| Total Marketable Securities | | $ | 1,938 | | | $ | 246 | | | $ | 369 | | | $ | 2,553 | | | $ | 1,562 | |
| | | |
| | | |
| | | |
| | | |
| | | |
| |
Credit exposure for swap contracts is a fraction of the notional amount of the instruments shown above, and is represented by the replacement cost of those contracts. Credit exposure for swap contracts held in the investment portfolio is included as part of note 17.
4. Investments
Investments comprise $33 million (2001 — $127 million) of restricted cash and securities held by EDC’s subsidiary Exinvest Inc. and notes issued by Vancouver Port Authority (formerly Vancouver Port Corporation) and the Royal Canadian Mint, totaling $42 million (2001 — $45 million). EDC intends to hold these notes to maturity. The Royal Canadian Mint is a Crown corporation and is related to EDC as a result of common ownership. The investment with the Royal Canadian Mint was transacted at fair value, made on the same terms as those with third parties with similar credit risk, and is recorded at cost.
| | | | | | | | | | | | | | | | | | | | | |
| ($ in millions) | | 2002 | | 2001 |
| |
| |
|
| | | Remaining Term to Maturity | | | | | | | | |
| | |
| | | | | | | | |
| | | Under | | 1 to 3 | | Over 3 | | | | | | | | |
| | | 1 Year | | Years | | Years | | Total | | Total |
| | |
| |
| |
| |
| |
|
| Fixed rate investments | | | 4 | | | | 9 | | | | 42 | | | | 55 | | | | 45 | |
| Floating rate investments | | | 3 | | | | — | | | | 17 | | | | 20 | | | | 127 | |
| | | |
| | | |
| | | |
| | | |
| | | |
| |
| Total Investments | | $ | 7 | | | $ | 9 | | | $ | 59 | | | $ | 75 | | | $ | 172 | |
Yield % * | | | 6.26 | | | | 6.36 | | | | 4.86 | | | | 4.97 | | | | 6.32 | |
| | | |
| | | |
| | | |
| | | |
| | | |
| |
| * | | Refers to yield to maturity for fixed rate investments, and yield to reset for floating rate investments. |
63
5. Net Loans Receivable
The following table shows the contractual maturity and related contractual effective yields for gross loans receivable. The yields are computed on a weighted average basis by amount and term. Floating rate yields are expressed as spreads over base rates which consist mainly of LIBOR for U.S. dollars and Prime for Canadian dollars.
| | | | | | | | | | | | | | | | | | | | | | | | | | | | | | | | | | | | | | | | | | |
| ($ in millions) | | 2002 | | 2001 |
| |
| |
|
| | | | | | | | Yield to | | | | | | | | | | | | | | | | | | Yield to | | | | | | | | | | | | |
| | | | Fixed | | Maturity | | Floating | | Spread | | Total | | Fixed | | Maturity | | Floating | | Spread | | Total |
| | | | $ | | % | | $ | | % | | $ | | $ | | % | | $ | | % | | $ |
| | | |
| |
| |
| |
| |
| |
| |
| |
| |
| |
|
| Performing: | | | | | | | | | | | | | | | | | | | | | | | | | | | | | | | | | | | | | | | | |
| | Overdue | | | 93 | | | | 7.67 | | | | 8 | | | | 2.64 | | | | 101 | | | | 39 | | | | 9.44 | | | | 126 | | | | .43 | | | | 165 | |
| | 2002 | | | — | | | | — | | | | — | | | | — | | | | — | | | | 1,092 | | | | 7.80 | | | | 2,801 | | | | 1.46 | | | | 3,893 | |
| | 2003 | | | 947 | | | | 7.55 | | | | 2,716 | | | | 2.05 | | | | 3,663 | | | | 946 | | | | 7.44 | | | | 1,624 | | | | 1.95 | | | | 2,570 | |
| | 2004 | | | 917 | | | | 7.65 | | | | 1,994 | | | | 2.00 | | | | 2,911 | | | | 864 | | | | 7.66 | | | | 1,547 | | | | 2.09 | | | | 2,411 | |
| | 2005 | | | 866 | | | | 7.53 | | | | 1,417 | | | | 2.14 | | | | 2,283 | | | | 803 | | | | 7.55 | | | | 1,374 | | | | 1.95 | | | | 2,177 | |
| | 2006 | | | 807 | | | | 7.43 | | | | 1,154 | | | | 1.64 | | | | 1,961 | | | | 725 | | | | 7.47 | | | | 1,090 | | | | 1.54 | | | | 1,815 | |
| | 2007 | | | 882 | | | | 7.52 | | | | 836 | | | | 1.49 | | | | 1,718 | | | | 774 | | | | 7.62 | | | | 687 | | | | 1.52 | | | | 1,461 | |
| | 2008-2012 | | | 4,220 | | | | 7.20 | | | | 2,414 | | | | 1.38 | | | | 6,634 | | | | 3,559 | | | | 7.30 | | | | 1,941 | | | | 1.54 | | | | 5,500 | |
| 2013 and beyond | | | 3,850 | | | | 7.11 | | | | 961 | | | | 1.42 | | | | 4,811 | | | | 3,193 | | | | 7.38 | | | | 391 | | | | 1.37 | | | | 3,584 | |
| | | |
| | | |
| | | |
| | | |
| | | |
| | | |
| | | |
| | | |
| | | |
| | | |
| |
Performing gross
loans receivable | | | 12,582 | | | | 7.18 | | | | 11,500 | | | | 1.74 | | | | 24,082 | | | | 11,995 | | | | 7.42 | | | | 11,581 | | | | 1.69 | | | | 23,576 | |
| | | |
| | | |
| | | |
| | | |
| | | |
| | | |
| | | |
| | | |
| | | |
| | | |
| |
| Impaired (note 6) | | | 201 | | | | 5.34 | | | | 2,058 | | | | 1.71 | | | | 2,259 | | | | 234 | | | | | | | | 1,416 | | | | | | | | 1,650 | |
| | | |
| | | |
| | | |
| | | |
| | | |
| | | |
| | | | | | | |
| | | | | | | |
| |
| Gross loans receivable | | $ | 12,783 | | | | | | | $ | 13,558 | | | | | | | $ | 26,341 | | | $ | 12,229 | | | | | | | $ | 12,997 | | | | | | | $ | 25,226 | |
| | | |
| | | | | | | |
| | | | | | | |
| | | |
| | | | | | | |
| | | | | | | |
| |
| Less: Non-accrued capitalized interest on | | | | | | | | | | | | | | | | | | | | | | | | | | | | | | | | |
| Impaired loans (note 6) | | | | | | | | | | | 1,001 | | | | | | | | | | | | | | | | | | | | 742 | |
| Performing loans* | | | | | | | | | | | 425
| | | | | | | | | | | | | | | | | | | | 499
| |
| Loans receivable | | | | | | | | | | | | | | | | | | | 24,915 | | | | | | | | | | | | | | | | | | | | 23,985 | |
| Less: Allowance for losses on loans (note 7) | | | | | | | | | | | 3,613 | | | | | | | | | | | | | | | | | | | | 2,892 | |
| | Deferred loan revenue | | | | | | | | | | | | | | | | | | | 292 | | | | | | | | | | | | | | | | | | | | 267 | |
| | | | | | | | | | | | | | | | | | | |
| | | | | | | | | | | | | | | | | | | |
| |
| Net Loans Receivable | | | | | | | | | | | | | | | | | | $ | 21,010 | | | | | | | | | | | | | | | | | | | $ | 20,826 | |
| | | | | | | | | | | | | | | | | | | |
| | | | | | | | | | | | | | | | | | | |
| |
| * | | Represents the unamortized balance that accrued while the loan was impaired. |
At December 31, 2002, the floating rate performing gross loans receivable are yielding 3.76% (2001 — 4.63%) with an average term to reset of 103 days (2001 — 107 days).
The breakdown of the Corporation’s performing gross loans receivable between sovereign and commercial is as follows:
| | | | | | | | | | | | | | | | | | | | | | | | | | | | | | | | | | | | | | | | | | |
| ($ in millions) | | 2002 | | 2001 |
| |
| |
|
| | | | | | | | Yield to | | | | | | | | | | | | | | | | | | Yield to | | | | | | | | | | | | |
| | | | Fixed | | Maturity | | Floating | | Spread | | Total | | Fixed | | Maturity | | Floating | | Spread | | Total |
| | | | $ | | % | | $ | | % | | $ | | $ | | % | | $ | | % | | $ |
| | | |
| |
| |
| |
| |
| |
| |
| |
| |
| |
|
| Sovereign | | | 3,046 | | | | 8.37 | | | | 2,473 | | | | 1.11 | | | | 5,519 | | | | 3,241 | | | | 8.31 | | | | 2,989 | | | | 1.23 | | | | 6,230 | |
| Commercial | | | 9,536 | | | | 6.89 | | | | 9,027 | | | | 1.93 | | | | 18,563 | | | | 8,754 | | | | 7.09 | | | | 8,592 | | | | 1.85 | | | | 17,346 | |
| | | |
| | | |
| | | |
| | | |
| | | |
| | | |
| | | |
| | | |
| | | |
| | | |
| |
| Total Performing | | | | | | | | | | | | | | | | | | | | | | | | | | | | | | | | | | | | | | | | |
| | Gross Loans Receivable | | $ | 12,582 | | | | 7.18 | | | $ | 11,500 | | | | 1.74 | | | $ | 24,082 | | | $ | 11,995 | | | | 7.42 | | | $ | 11,581 | | | | 1.69 | | | $ | 23,576 | |
| | | |
| | | |
| | | |
| | | |
| | | |
| | | |
| | | |
| | | |
| | | |
| | | |
| |
The Corporation has significant geographic concentrations in certain countries as outlined below.
| | | | | | | | | | | | | | | | | | | | | | | | | | | | | |
| ($ in millions) | | 2002 | | | | | | 2001 |
| |
| | | | | |
|
| | | Performing | | | | | | | | | | | Performing | | | | | |
| | | Gross Loans | | | | | | | | | | | Gross Loans | | | | | |
| Country | | Receivable | | | % | | Country | | Receivable | | | % |
| |
| | |
| |
| |
| | |
|
| United States | | | 11,689 | | | | | | | | 49 | | | United States | | | 10,169 | | | | | | | | 43 | |
| Canada | | | 2,088 | | | | | | | | 9 | | | Canada | | | 2,201 | | | | | | | | 9 | |
| Mexico | | | 1,426 | | | | | | | | 6 | | | Mexico | | | 1,322 | | | | | | | | 6 | |
| United Kingdom | | | 987 | | | | | | | | 4 | | | China | | | 1,090 | | | | | | | | 5 | |
| China | | | 973 | | | | | | | | 4 | | | Peru | | | 932 | | | | | | | | 4 | |
| Other | | | 6,919 | | | | | | | | 28 | | | Other | | | 7,862 | | | | | | | | 33 | |
| | | |
| | | | | | | |
| | | | | | | |
| | | | | | | |
| |
| Total | | $ | 24,082 | | | | | | | | 100 | | | Total | | $ | 23,576 | | | | | | | | 100 | |
| | | |
| | | | | | | |
| | | | | | | |
| | | | | | | |
| |
64
In addition, the Corporation has single counterparty gross loans receivables totaling $4,610 million (2001 — $3,386 million) with five airlines, $1,258 million (2001 — $1,293 million) with a ground transportation entity and $1,779 million (2001 — $1,206 million) with an automotive entity. All of these counterparties are located in the United States.
Non-accrued capitalized interest represents contractual interest capitalized according to rescheduling agreements with sovereign borrowers during which time the loans are classified as impaired.
The following reflects the movement of non-accrued capitalized interest during the year:
| | | | | | | | | | |
| ($ in millions) | | 2002 | | 2001 |
| |
| |
|
| Balance at beginning of year | | | 1,241 | | | | 1,165 | |
| | Capitalized interest | | | 343 | | | | 92 | |
| | Amortization | | | (76 | ) | | | (83 | ) |
| | Debt relief | | | (81 | ) | | | (1 | ) |
| | Foreign exchange translation | | | (1 | ) | | | 68 | |
| | | |
| | | |
| |
| Balance at end of year | | $ | 1,426 | | | $ | 1,241 | |
6. Impaired Loans Receivable
The Corporation has $2,259 million (2001 — $1,650 million) of impaired gross loans receivable, of which $1,421 million (2001 — $1,320 million) is sovereign and $838 million (2001 — $330 million) is commercial. The following table shows the amount of gross loans receivable, net of non-accrued capitalized interest and the specific allowance, which represents net impaired loans receivable.
| | | | | | | | | | |
| ($ in millions) | | 2002 | | 2001 |
| |
| |
|
| Gross impaired loans receivable | | | | | | | | |
| | Sovereign | | | 1,421 | | | | 1,320 | |
| | Commercial | | | 838 | | | | 330 | |
| | | | |
| | | |
| |
| | | | 2,259 | | | | 1,650 | |
| Less: | Non-accrued capitalized interest | | | 1,001 | | | | 742 | |
| | Specific allowance (note 7) | | | 582 | | | | 370 | |
| | | | |
| | | |
| |
| Net Impaired Loans Receivable | | $ | 676 | | | $ | 538 | |
| | | | |
| | | |
| |
The following reflects the movement in impaired gross loans receivable during the year:
| | | | | | | | | | |
| ($ in millions) | | 2002 | | 2001 |
| |
| |
|
| Balance at beginning of year | | | 1,650 | | | | 1,323 | |
| | Loans classified as impaired | | | 840 | | | | 482 | |
| | Loans reinstated to performing | | | — | | | | (44 | ) |
| | Loans written off | | | (194 | ) | | | (191 | ) |
| | Capitalized interest | | | 343 | | | | 94 | |
| | Principal repayments | | | (109 | ) | | | (15 | ) |
| | Receipts from the Government of Canada for sovereign debt relief | | | (311 | ) | | | (13 | ) |
| | Receivable from the Government of Canada for sovereign debt relief | | | — | | | | (81 | ) |
| | Foreign exchange translation | | | 40 | | | | 95 | |
| | | |
| | | |
| |
| Balance at end of year | | $ | 2,259 | | | $ | 1,650 | |
| | | |
| | | |
| |
Impaired loans to five commercial borrowers in the United States totaling $82 million, one commercial loan in Germany for $41 million, one commercial loan in Brazil for $39 million and sovereign loans in Yugoslavia totaling $32 million were written off against the allowance for loan losses. These loans were written off after all collection methods had been exhausted and no further prospect of recovery was likely. Included in the write-offs of $194 million are loans totaling $128 million which were made impaired in 2002. For the five years ending December 31, 2002, cumulative loan write-offs totaled $490 million, of which 79% occurred in the past two years.
During 2002, payments of principal and interest from borrowers for impaired loans were $109 million (2001 — $34 million). These amounts were applied to the book value of the impaired loans and did not affect interest income.
65
7. Allowance for Losses on Loans, Loan Commitments and Guarantees
The composition of the allowance for losses on loans, loan commitments and guarantees is as follows:
| | | | | | | | | | | |
| ($ in millions) | | 2002 | | 2001 |
| |
| |
|
General allowance | | | | | | | | |
| Base Allowance | | | | | | | | |
| | | Investment grade exposure | | | 125 | | | | 104 | |
| | | Non-investment grade exposure | | | 1,895 | | | | 1,819 | |
| | | | | |
| | | |
| |
| | | Total base allowance | | | 2,020 | | | | 1,923 | |
| | | | | |
| | | |
| |
| Counterparty Concentration | | | | | | | | |
| | | Investment grade exposure | | | 64 | | | | 60 | |
| | | Non-investment grade exposure | | | 497 | | | | 466 | |
| | | | | |
| | | |
| |
| | | Total counterparty concentration | | | 561 | | | | 526 | |
| | | | | |
| | | |
| |
| Allowance Overlays | | | | | | | | |
| | Country | | | | | | | | |
| | | United States | | | 138 | | | | 130 | |
| | | Venezuela | | | 57 | | | | 12 | |
| | | Brazil | | | 37 | | | | 41 | |
| | | Indonesia | | | 20 | | | | 28 | |
| | | Turkey | | | 10 | | | | 19 | |
| | | Argentina | | | 7 | | | | 19 | |
| | | Other | | | 21 | | | | 44 | |
| | | | | |
| | | |
| |
| Total country overlay | | | 290 | | | | 293 | |
| | | | | |
| | | |
| |
| Industry | | | | | | | | |
| | | Aerospace | | | 382 | | | | 267 | |
| | | Telecom | | | 110 | | | | 87 | |
| | | Power | | | 45 | | | | — | |
| | | Other | | | — | | | | 14 | |
| | | | | |
| | | |
| |
| Total industry overlay | | | 537 | | | | 368 | |
| | | | | |
| | | |
| |
| Total general allowance | | | 3,408 | | | | 3,110 | |
Specific allowance for impaired loans | | | 582 | | | | 370 | |
| | | | | |
| | | |
| |
| Allowance for Losses on Loans, Loan Commitments and Guarantees | | $ | 3,990 | | | $ | 3,480 | |
| | | | | |
| | | |
| |
The classification of the allowance for losses on loans, loan commitments and guarantees is as follows:
| | | | | | | | | |
| ($ in millions) | | 2002 | | 2001 |
| |
| |
|
| Allowance for losses on loans | | | 3,613 | | | | 2,892 | |
| Allowance for loan commitments | | | 284 | | | | 521 | |
| Allowance for loan guarantees | | | 93 | | | | 67 | |
| | | |
| | | |
| |
| Total | | $ | 3,990 | | | $ | 3,480 | |
| | | |
| | | |
| |
The allowance for losses on loans is shown as a reduction of gross loans receivable in note 5 to arrive at net loans receivable which is an asset on the balance sheet. The allowance for loan commitments and guarantees is reported as a liability in the financial statements.
During the year, changes to the allowance for losses on loans, loan commitments and guarantees were as follows:
| | | | | | | | | | | | | | | | | | | | | | | | | | |
| ($ in millions) | | 2002 | | 2001 |
| |
| |
|
| | | | Specific | | General | | Total | | Specific | | General | | Total |
| | | |
| |
| |
| |
| |
| |
|
| Balance at beginning of year | | | 370 | | | | 3,110 | | | | 3,480 | | | | 431 | | | | 2,399 | | | | 2,830 | |
| | Provision for loan losses | | | 409 | | | | 316 | | | | 725 | | | | 106 | | | | 552 | | | | 658 | |
| | Write-offs* | | | (194 | ) | | | — | | | | (194 | ) | | | (191 | ) | | | — | | | | (191 | ) |
| | Foreign exchange translation | | | (3 | ) | | | (18 | ) | | | (21 | ) | | | 24 | | | | 159 | | | | 183 | |
| | | |
| | | |
| | | |
| | | |
| | | |
| | | |
| |
| Balance at end of year | | $ | 582 | | | $ | 3,408 | | | $ | 3,990 | | | $ | 370 | | | $ | 3,110 | | | $ | 3,480 | |
| | | |
| | | |
| | | |
| | | |
| | | |
| | | |
| |
*See note 6 for more information on loan write-offs.
66
8. Loan Commitments
The Corporation has two types of loan commitments. The first type are undisbursed amounts on signed loan agreements. The second type of commitment represents commitments made by EDC, for which terms related to the transaction such as interest rate type and disbursement schedule have not yet been determined. This category includes letters of offer accepted and outstanding of $3,225 million as well as unallocated, confirmed lines of credit of $590 million.
The Corporation has undisbursed signed loan commitments of $3,512 million (2001 — $4,938 million). Over the next two years, management estimates that the Corporation will disburse 65% of the remaining undisbursed commitments.
The projected disbursement of the signed loan commitments is as follows:
| | | | | | | | | | | | | | | | | |
| ($ in millions) | | 2002 | | 2001 |
| |
| |
|
| | | Projected | | | | | | Projected | | | | |
| Year | | Disbursements | | | % | | | Disbursements | | | % | |
| |
| |
| |
| |
|
| 2002 | | | — | | | | — | | | | 2,207 | | | | 45 | |
| 2003 | | | 1,962 | | | | 56 | | | | 487 | | | | 10 | |
| 2004 | | | 319 | | | | 9 | | | | 93 | | | | 2 | |
| 2005 and beyond | | | 1,231 | | | | 35 | | | | 2,151 | | | | 43 | |
| | | |
| | | |
| | | |
| | | |
| |
| Total | | $ | 3,512 | | | | 100 | | | $ | 4,938 | | | | 100 | |
| | | |
| | | |
| | | |
| | | |
| |
Undisbursed commitments with their committed fixed rates or committed floating rate spreads are outlined in the following table. All yields are computed on a weighted average basis and the spreads over floating interest rates are represented mainly by LIBOR for U.S. dollars.
| | | | | | | | | | | | | | | | | | | | | | | | | | | | | | | | | |
| ($ in millions) | | 2002 | | 2001 |
| |
| |
|
| | | | | | | Estimated | | | | | | | | | | | | | | Estimated | | | | | | | | |
| | | | | | | Spot | | | | | | | | | | | | | | Spot | | | | | | | | |
| | | Fixed | | Yield | | Floating | | Spread | | Fixed | | Yield | | Floating | | Spread |
| | | $ | | % | | $ | | % | | $ | | % | | $ | | % |
| | |
| |
| |
| |
| |
| |
| |
| |
|
| Sovereign | | | 466 | | | | 8.12 | | | | 249 | | | | 2.69 | | | | 988 | | | | 8.31 | | | | 237 | | | | 2.10 | |
| Commercial | | | 105 | | | | 3.68 | | | | 2,692 | | | | 1.28 | | | | 930 | | | | 6.13 | | | | 2,783 | | | | 1.99 | |
| | | |
| | | |
| | | |
| | | |
| | | |
| | | |
| | | |
| | | |
| |
| Total | | $ | 571 | | | | 7.31 | | | $ | 2,941 | | | | 1.40 | | | $ | 1,918 | | | | 7.26 | | | $ | 3,020 | | | | 2.00 | |
9. Contingent Liabilities
Note 1 states that the Corporation is subject to a limit imposed by the Act on its contingent liability programs. The contingent liability as reported in prior years did not adjust the liability to reflect policy maximums. In 2002, the Corporation refined its estimates of the contingent liabilities to reflect policy maximums and 2001 has been restated accordingly.
The Corporation’s contingent liabilities include both short-term and medium-term insurance policies and guarantees. The short-term program protects exporters of goods and services trading on credit terms of up to a year against non-payment due to commercial and political risks. Commercial risks covered include buyer insolvency, default, repudiation of goods by buyer and contract cancellation. Political risks covered by EDC are conversion and risk transfer, cancellation of export or import permits, or war-related risks. The medium-term program provides cover for sales on credit terms greater than one year and includes export credits insurance and guarantees, loan guarantees, performance insurance extending cover for risks inherent in performance and bid guarantees, and political risk insurance, which provides political risk protection for equity and other investments abroad.
67
Insurance Policies and Guarantees
As at December 31, 2002, the Corporation has insurance policies and guarantees outstanding of $15,263 million (2001 — $14,511 million) which mature as follows:
| | | | | | | | | | | | | | | | | | | | | | | | | | | | | | | | | |
| ($ in millions) | | 2002 | | 2001 |
| |
| |
|
| | | Short-term | | Medium-term | | | | | | | | | | Short-term | | Medium-term | | | | | | | | |
| | | Insurance | | Insurance | | Guarantees | | Total | | Insurance | | Insurance | | Guarantees | | Total |
| | |
| |
| |
| |
| |
| |
| |
| |
|
| 2002 | | | — | | | | — | | | | — | | | | — | | | | 6,255 | | | | 1,079 | | | | 759 | | | | 8,093 | |
| 2003 | | | 7,097 | | | | 1,568 | | | | 2,116 | | | | 10,781 | | | | — | | | | 1,582 | | | | 1,419 | | | | 3,001 | |
| 2004 | | | — | | | | 804 | | | | 356 | | | | 1,160 | | | | — | | | | 599 | | | | 269 | | | | 868 | |
| 2005 | | | — | | | | 484 | | | | 186 | | | | 670 | | | | — | | | | 682 | | | | 214 | | | | 896 | |
| 2006 | | | — | | | | 264 | | | | 115 | | | | 379 | | | | — | | | | 194 | | | | 110 | | | | 304 | |
| 2007 | | | — | | | | 214 | | | | 441 | | | | 655 | | | | — | | | | 46 | | | | 25 | | | | 71 | |
| 2008 — 2012 | | | — | | | | 525 | | | | 328 | | | | 853 | | | | — | | | | 348 | | | | 103 | | | | 451 | |
| 2013 and beyond | | | — | | | | 111 | | | | 654 | | | | 765 | | | | — | | | | 13 | | | | 814 | | | | 827 | |
| | | |
| | | |
| | | |
| | | |
| | | |
| | | |
| | | |
| | | |
| |
| Total | | $ | 7,097 | | | $ | 3,970 | | | $ | 4,196 | | | $ | 15,263 | | | $ | 6,255 | | | $ | 4,543 | | | $ | 3,713 | | | $ | 14,511 | |
| | | |
| | | |
| | | |
| | | |
| | | |
| | | |
| | | |
| | | |
| |
The major concentrations by location of risk are as follows:
| | | | | | | | | | | | | | | | | | | | | | | | | | | | | | | | | | | | | |
| ($ in millions) | | 2002 | | | | | | 2001 |
| |
| | | | | |
|
| | | Short-term | | Medium-term | | | | | | | | | | | | | | Short-term | | Medium-term | | | | | | | | |
| | | Insurance | | Insurance | | Guarantees | | Total | | | | | | Insurance | | Insurance | | Guarantees | | Total |
| | |
| |
| |
| |
| | | | | |
| |
| |
| |
|
| U.S. | | | 4,226 | | | | 115 | | | | 3,082 | | | | 7,423 | | | | U.S. | | | | 3,450 | | | | 68 | | | | 2,474 | | | | 5,992 | |
| Canada | | | 93 | | | | 2,410 | | | | 156 | | | | 2,659 | | | Canada | | | 194 | | | | 2,387 | | | | 131 | | | | 2,712 | |
| Mexico | | | 147 | | | | 219 | | | | 35 | | | | 401 | | | Brazil | | | 237 | | | | 323 | | | | 1 | | | | 561 | |
| Brazil | | | 188 | | | | 181 | | | | 1 | | | | 370 | | | Mexico | | | 152 | | | | 273 | | | | 55 | | | | 480 | |
| China | | | 182 | | | | 149 | | | | 23 | | | | 354 | | | China | | | 163 | | | | 209 | | | | 29 | | | | 401 | |
| Other | | | 2,261 | | | | 896 | | | | 899 | | | | 4,056 | | | Other | | | 2,059 | | | | 1,283 | | | | 1,023 | | | | 4,365 | |
| | | |
| | | |
| | | |
| | | |
| | | |
| | | |
| | | |
| | | |
| | | |
| |
| Total | | $ | 7,097 | | | $ | 3,970 | | | $ | 4,196 | | | $ | 15,263 | | | Total | | $ | 6,255 | | | $ | 4,543 | | | $ | 3,713 | | | $ | 14,511 | |
| | | |
| | | |
| | | |
| | | |
| | | | | | | |
| | | |
| | | |
| | | |
| |
Reinsurance of $2,026 million (2001 — $1,618 million) has been deducted from the insurance policies outstanding.
Reinsurance premiums of $24 million were deducted from total premiums earned for the year ended December 31, 2002 (2001 — $21 million).
Guarantees
The Corporation issues bid security guarantees and performance security guarantees which provide insurance coverage to the exporter’s bank for 100% of the bid or performance letter of guarantee value in the event of any call by the buyer. Each insurance guarantee issued stipulates a recovery provision whereby the third party, the exporter, agrees to indemnify the Corporation should a payment be made under the guarantee. Loan guarantees are issued by the Corporation and cover non-payment of principal, interest and fees due to banks and financial institutions providing loans to buyers of Canadian goods and services. Calls on guarantees result in the recognition by EDC of a loan asset on the balance sheet and become a direct obligation of the buyer.
As at December 31, 2002, the Corporation has insurance and loan guarantees outstanding of $4,196 million (2001 — $3,713 million).
| | | | | | | | | |
| ($ in millions) | | 2002 | | 2001 |
| |
| |
|
| Loan Guarantees | | | 2,998 | | | | 2,567 | |
| Performance Security Guarantees | | | 1,182 | | | | 1,134 | |
| Bid Security Guarantees | | | 11 | | | | 7 | |
| Specific Transaction Guarantees | | | 5 | | | | 5 | |
| | | |
| | | |
| |
| Total | | $ | 4,196 | | | $ | 3,713 | |
| | | |
| | | |
| |
68
10. Recoverable Insurance Claims
During the year, changes to the recoverable insurance claims were as follows:
| | | | | | | | | | |
| ($ in millions) | | 2002 | | 2001 |
| |
| |
|
| Balance at beginning of year | | | 96 | | | | 74 | |
| | Claims paid | | | 144 | | | | 144 | |
| | Claims recovered | | | (39 | ) | | | (51 | ) |
| | Write-off of recoverable claims | | | (111 | ) | | | (74 | ) |
| | Foreign exchange translation | | | — | | | | 3 | |
| | | |
| | | |
| |
| Balance at end of year | | $ | 90 | | | $ | 96 | |
| | | |
| | | |
| |
Of the $144 million in claim payments made during 2002, 78% were related to the short-term program. The largest concentrations of claim payments and recoveries were in the following countries:
| | | | | | | | | | | | | | | | | | | | | | | | | |
| ($ in millions) | | 2002 | | | | | | 2001 |
| |
| | | | | |
|
| | | Claims | | | | | | Claims | | | | | | Claims | | Claims |
| | | Paid | | | | | | Recovered | | | | | | Paid | | Recovered |
| | |
| | | | | |
| | | | | |
| |
|
| U.S. | | | 63 | | | | | | | | 8 | | | U.S. | | | | | 46 | | | | 6 | |
| Mexico | | | 19 | | | | | | | | 1 | | | Virgin Islands (British)*
| | | 45 | | | | 34 | |
| Argentina | | | 18 | | | | | | | | 1 | | | Pakistan
| | | 9 | | | | — | |
| Germany | | | 8 | | | | | | | | 4 | | | Canada
| | | 7 | | | | — | |
| Belgium | | | 5 | | | | | | | | — | | | Argentina
| | | 6 | | | | — | |
| Other | | | 31 | | | | | | | | 25 | | | Other
| | | 31 | | | | 11 | |
| | | |
| | | | | | | |
| | | | | | | |
| | | |
| |
| Total | | $ | 144 | | | | | | | $ | 39 | | | Total
| | $ | 144 | | | $ | 51 | |
| | | |
| | | | | | | |
| | | | | | | |
| | | |
| |
| * | | Loss relates to financial difficulties of a parent company based in Singapore. |
11. Allowance for Claims on Insurance
During the year, changes to the allowance for claims on insurance were as follows:
| | | | | | | | | | |
| ($ in millions) | | 2002 | | 2001 |
| |
| |
|
| Balance at beginning of year | | | 464 | | | | 439 | |
| | Provision for claims on insurance | | | 115 | | | | 83 | |
| | Write-off of recoverable claims | | | (111 | ) | | | (74 | ) |
| | Claims expense | | | (8 | ) | | | (7 | ) |
| | Foreign exchange translation | | | — | | | | 23 | |
| | | |
| | | |
| |
| Balance at end of year | | $ | 460 | | | $ | 464 | |
| | | |
| | | |
| |
12. Provision for Credit Losses
The composition of the provision for credit losses, expressed in the income statement, is comprised as follows:
| | | | | | | | | |
| ($ in millions) | | 2002 | | 2001 |
| |
| |
|
| Provision for losses on loans | | | 930 | | | | 208 | |
| Provision for claims on insurance | | | 115 | | | | 83 | |
| Provision for loan commitments | | | (231 | ) | | | 521 | |
| Provision for loan guarantees | | | 26 | | | | (71 | ) |
| | | |
| | | |
| |
| Provision for Credit Losses | | $ | 840 | | | $ | 741 | |
| | | |
| | | |
| |
69
13. Debt Instruments
The Corporation issues debt instruments in world capital markets. Short-term payables consist of commercial paper and other short-term debt related instruments that are issued by EDC with maturities under one year. Long-term payables represent bonds and other long-term instruments issued by the Corporation in Canadian dollars, U.S. dollars and other currencies. EDC uses currency swaps to convert foreign denominated fixed rate notes primarily to U.S. dollars. Interest rate swaps are principally used to convert fixed rate instruments to floating rates primarily related to LIBOR. EDC uses derivative contracts and structured notes to minimize market risk and also for asset/liability management purposes.
Loans Payable
Loans payable (excluding derivatives) are comprised as follows:
| | | | | | | | | | |
| ($ in millions) | | 2002 | | 2001 |
| |
| |
|
| Short-term payables | | | 3,909 | | | | 3,723 | |
| Long-term payables | | | | | | | | |
| | - due within current year | | | 3,671 | | | | 2,926 | |
| | - over one year | | | 13,254 | | | | 12,965 | |
| | | |
| | | |
| |
| Total long-term payables | | | 16,925 | | | | 15,891 | |
| | | |
| | | |
| |
| Subtotal | | | 20,834 | | | | 19,614 | |
| Plus: unamortized discounts and premiums | | | 1 | | | | 4 | |
| | deferrals | | | (7 | ) | | | (9 | ) |
| | | |
| | | |
| |
| Total Loans Payable | | $ | 20,828 | | | $ | 19,609 | |
| | | |
| | | |
| |
Unamortized discounts and premiums are associated with the issue of long-term debt and swaps. The amount of a discount or premium recorded represents the difference between the face value of an instrument and the actual cash flow at the time of settlement. Deferrals include gains incurred upon debt repurchases and swap unwinds. Such amounts are recorded as an asset or liability at the settlement date and amortized over the life of the instrument (in the case of discounts and premiums) or over the life of the replacement instrument (in the case of deferrals).
Accrued Interest
Accrued interest reflects corporate cash flow obligations and rights. Accrued interest is comprised as follows:
| | | | | | | | | |
| ($ in millions) | | 2002 | | 2001 |
| |
| |
|
| Short-term | | | 6 | | | | 12 | |
| Long-term | | | 248 | | | | 403 | |
| | | |
| | | |
| |
| Total Accrued Interest Payable | | $ | 254 | | | $ | 415 | |
| | | |
| | | |
| |
Where the interest payment amount is known in advance, as is the case with fixed and floating rate payments, the interest accrual allocates the cost over the period to payment. Where the interest payment amount is not known in advance an appropriate interest accrual is determined by reference to market prices.
70
Structured Notes
EDC has entered into a number of structured notes as part of its funding program. Structured notes are hybrid securities that combine fixed income products with derivative components.
Structured notes outstanding, included in loans payable, are as follows:
| | | | | | | | | |
| ($ in millions) | | 2002 | | 2001 |
| |
| |
|
| Callable/extendible | | | 2,251 | | | | 1,850 | |
| Inverse floating rate note | | | 564 | | | | 567 | |
| Equity index | | | 441 | | | | 541 | |
| Dual currency | | | 140 | | | | 244 | |
| Other | | | 209 | | | | 178 | |
| | | |
| | | |
| |
| Total | | $ | 3,605 | | | $ | 3,380 | |
| | | |
| | | |
| |
The Corporation has executed swap contracts to mitigate market risk on these structured borrowings. These contracts ensure that EDC will receive proceeds from the swap to meet the requirements of settling and servicing the debt obligation. The Corporation has in substance created floating rate debt by issuing bonds at fixed rates and entering into swap contracts whereby EDC receives fixed rate interest and pays interest at a floating rate. In swapping out of the underlying bond issue, the potential market risk has been converted to credit risk. Credit risk is managed by contracting with counterparties evaluated as creditworthy, based on treasury limits and policy guidelines as approved by the Board of Directors. Credit exposure on derivative financial instruments is further discussed in note 17.
14. Debt Instrument Maturities
EDC often combines debt instruments with derivative financial instruments to generate lower-cost funding. For example, a fixed rate debt issue can be combined with an interest rate swap to generate floating rate funding at a lower cost than issuing a floating rate note. The following table shows EDC’s resulting net fixed and floating rate debt positions, as well as yields on those net positions.
| | | | | | | | | | | | | | | | | | | | | | | | | |
| ($ in millions) | | | | 2002 | | | | | | 2001 |
| |
| |
|
| | | Debt | | Swap | | | | | | Yield* | | | | | | Yield* |
| Year of Maturity | | Issues | | Contracts | | Net | | (%) | | Net | | (%) |
| |
| |
| |
| |
| |
| |
|
Fixed Rate Issues | | | | | | | | | | | | | | | | | | | | | | | | |
| 2002 | | | — | | | | — | | | | — | | | | — | | | | 956 | | | | 7.04 | |
| 2003 | | | 2,415 | | | | (1,210 | ) | | | 1,205 | | | | 6.46 | | | | 1,215 | | | | 6.09 | |
| 2004 | | | 2,816 | | | | (1,971 | ) | | | 845 | | | | 5.91 | | | | 852 | | | | 6.13 | |
| 2005 | | | 1,470 | | | | (1,470 | ) | | | — | | | | — | | | | — | | | | — | |
| 2006 | | | 1,518 | | | | (1,518 | ) | | | — | | | | — | | | | — | | | | — | |
| 2007 | | | 1,170 | | | | (380 | ) | | | 790 | | | | 4.05 | | | | — | | | | — | |
| 2008 to 2012 | | | 5,101 | | | | (4,852 | ) | | | 249 | | | | 8.47 | | | | 251 | | | | 8.14 | |
| 2013 and beyond | | | 115 | | | | (83 | ) | | | 32 | | | | 8.16 | | | | 32 | | | | 8.16 | |
| | | |
| | | |
| | | |
| | | |
| | | |
| | | |
| |
| Subtotal | | | 14,605 | | | | (11,484 | ) | | | 3,121 | | | | 5.73 | | | | 3,306 | | | | 6.92 | |
| | | |
| | | |
| | | |
| | | |
| | | |
| | | |
| |
Floating Rate Issues | | | | | | | | | | | | | | | | | | | | | | | | |
| 2002 | | | — | | | | — | | | | — | | | | | | | | 5,795 | | | | | |
| 2003 | | | 5,165 | | | | 1,261 | | | | 6,426 | | | | | | | | 2,198 | | | | | |
| 2004 | | | 214 | | | | 2,019 | | | | 2,233 | | | | | | | | 1,773 | | | | | |
| 2005 | | | 49 | | | | 1,479 | | | | 1,528 | | | | | | | | 258 | | | | | |
| 2006 | | | 97 | | | | 1,553 | | | | 1,650 | | | | | | | | 1,745 | | | | | |
| 2007 | | | 75 | | | | 388 | | | | 463 | | | | | | | | 181 | | | | | |
| 2008 to 2012 | | | 223 | | | | 4,957 | | | | 5,180 | | | | | | | | 4,550 | | | | | |
| 2013 and beyond | | | 406 | | | | 67 | | | | 473 | | | | | | | | 380 | | | | | |
| | | |
| | | |
| | | |
| | | |
| | | |
| | | |
| |
| Subtotal | | | 6,229 | | | | 11,724 | | | | 17,953 | | | | 1.27 | | | | 16,880 | | | | 2.21 | |
| | | |
| | | |
| | | |
| | | |
| | | |
| | | |
| |
| Total | | $ | 20,834 | | | $ | 240 | | | $ | 21,074 | | | | | | | $ | 20,186 | | | | | |
| | | |
| | | |
| | | |
| | | |
| | | |
| | | |
| |
| * | | Refers to yield to maturity for fixed rate issues, and yield to reset for floating rate issues. |
Credit exposure and other details on swap contracts are included as part of note 17.
71
15. Shareholder’s Equity
The authorized share capital is $1.5 billion consisting of 15 million shares with a par value of $100 each. The number of shares issued and fully paid is 9.8 million (2001 — 9.8 million). No shares were issued in 2002 (2001 — nil). At the request of the shareholder, EDC paid a dividend of $95 million during the year (2001 — nil).
16. Foreign Currency Balances
The Corporation has substantial assets and liabilities in U.S. dollars and in other currencies. In addition, EDC has derivative financial instruments denominated in various currencies. The purpose of these derivative financial instruments is to minimize the cost of capital and optimize yields for the Corporation, while remaining within treasury guidelines and limits approved by the Board of Directors.
The table below shows where EDC has used derivative financial instruments to manage the foreign currency exposures of its asset and liability positions. The resulting net foreign currency exposure as at December 31 (expressed in Canadian equivalent dollars) is as follows:
| | | | | | | | | | | | | | | | | | | | | | | | | | | | | | | | | | | | | | | | | |
| ($ in millions) | | 2002 | | 2001 |
| |
| |
|
| | | Assets | | Liabilities | | Net Foreign | | | | | | Net Foreign | | | | |
| | |
| |
| | Currency | | | | | | Currency | | | | |
| | | Gross | | DFI* | | Net | | Gross | | DFI* | | Net | | Exposure | | Rate | | Exposure | | Rate |
| | |
| |
| |
| |
| |
| |
| |
| |
| |
| |
|
| U.S. Dollars | | | 19,981 | | | | 714 | | | | 20,695 | | | | (12,183 | ) | | | (8,503 | ) | | | (20,686 | ) | | | 9 | | | | 1.5796 | | | | (58 | ) | | | 1.5926 | |
| Euro | | | 461 | | | | — | | | | 461 | | | | (234 | ) | | | (223 | ) | | | (457 | ) | | | 4 | | | | 1.6564 | | | | 2 | | | | 1.4185 | |
| British Pounds | | | 984 | | | | — | | | | 984 | | | | (4 | ) | | | (976 | ) | | | (980 | ) | | | 4 | | | | 2.5428 | | | | 3 | | | | 2.3160 | |
| Japanese Yen | | | 108 | | | | (55 | ) | | | 53 | | | | (663 | ) | | | 610 | | | | (53 | ) | | | — | | | | 0.0133 | | | | — | | | | 0.0122 | |
| New Zealand Dollars | | | — | | | | — | | | | — | | | | (207 | ) | | | 207 | | | | — | | | | — | | | | 0.8276 | | | | — | | | | 0.6636 | |
| Norwegian Krone | | | — | | | | — | | | | — | | | | (803 | ) | | | 803 | | | | — | | | | — | | | | 0.2278 | | | | — | | | | 0.1779 | |
| Australian Dollars | | | — | | | | — | | | | — | | | | (124 | ) | | | 124 | | | | — | | | | — | | | | 0.8890 | | | | — | | | | 0.8156 | |
| Swedish Krona | | | 52 | | | | — | | | | 52 | | | | — | | | | (52 | ) | | | (52 | ) | | | — | | | | 0.1818 | | | | — | | | | 0.1525 | |
| Danish Krone | | | 28 | | | | (28 | ) | | | — | | | | — | | | | — | | | | — | | | | — | | | | 0.2230 | | | | — | | | | 0.1908 | |
| | | |
| | | |
| | | |
| | | |
| | | |
| | | |
| | | |
| | | |
| | | |
| | | |
| |
| * | | DFI (Derivative Financial Instruments) includes swaps and foreign exchange contracts. See note 17. |
The Corporation experienced a foreign exchange gain of $2.6 million in 2002 (2001 — gain of $75 thousand). This amount is included in interest expense. Throughout the year, EDC’s assets and liabilities were denominated mainly in U.S. dollars, euro and British pounds.
17. Derivative Financial Instruments
The Corporation actively manages its exposure to market risk through the use of derivative financial instruments. Treasury policy and guidelines limit the use of derivatives. EDC does not use derivatives for speculative purposes. It uses a variety of these instruments to manage funding costs and investment returns, and to implement asset/liability management strategies in order to minimize market risks in EDC’s portfolios. The credit risk in these instruments is managed in accordance with policies established in EDC’s Market Risk Management Department and approved by the Board of Directors.
EDC currently uses, but is not limited to, the following types of instruments:
Interest rate swaps — transactions in which two parties exchange interest flows on a specified notional amount on predetermined dates for a specified period of time using agreed-upon fixed or floating rates of interest. Notional amounts upon which interest payments/receipts are based are not exchanged.
Currency swaps — transactions in which two parties exchange currencies at inception and at maturity, as well as interest flows on the exchanged amounts on predetermined dates for a specified period of time using agreed-upon fixed or floating rates of interest.
72
Equity index swaps — transactions used to eliminate exposure to movements in an equity index on a debt issue undertaken by the Corporation. Two counterparties agree to exchange payments, one of which represents the percentage change in an agreed-upon equity index and the other a short-term interest rate index. The principal may either resemble an interest rate swap, in that no exchange of notional amounts occurs, or a currency swap, in which currencies will be exchanged at both inception and maturity.
Foreign exchange contracts — commitments to purchase or sell foreign currencies for delivery at a specified date in the future at a fixed rate.
In any transaction there is a potential for loss. This loss potential is represented by (1) credit risk, wherein the counterparty fails to perform an obligation as agreed upon, causing the other party to incur a financial loss, and (2) market risk, where an exposure exists as a result of changes in foreign exchange rates or interest rates.
The Corporation manages its exposure to credit risk by contracting only with creditworthy counterparties, and in certain cases entering into collateral agreements with those counterparties. Collateral agreements provide for the posting of collateral by the counterparty when EDC’s exposure to that entity exceeds a certain threshold. Where EDC has a collateral agreement with a counterparty, the counterparty must have a minimum credit rating of A3. Where EDC does not have a collateral agreement with a counterparty, the counterparty must have a minimum credit rating of A2 for transactions of less than three years, and a minimum credit rating of Aa3 for transactions of greater than three years. Internal policies and procedures establish credit approvals, controls and monitoring. The Corporation does not anticipate any significant non-performance by the counterparties.
The Corporation manages its exposure to market risk (interest rate and foreign exchange) using limits developed in consultation with the Department of Finance and approved by the Board of Directors.
Credit impairment in the derivative financial instruments, marketable securities and investments has been estimated not to exceed $20 million. Accordingly, an allowance for credit risk of $20 million (2001 — $20 million) has been established. This amount is included in accounts payable.
Notional principal amounts outstanding as at December 31 are listed below for interest rate, currency swap and foreign exchange contracts entered into by the Corporation.
| | | | | | | | | | | | | | | | | | | | | |
| ($ in millions) | | 2002 | | 2001 |
| |
| |
|
| | | Remaining Term to Maturity | | | | | | | | |
| | |
| | | | | | | | |
| | | Under 1 Year | | 1 to 3 Years | | Over 3 Years | | Total | | Total |
| | |
| |
| |
| |
| |
|
| Currency swaps | | | 620 | | | | 1,644 | | | | 6,472 | | | | 8,736 | | | | 8,811 | |
| Interest rate swaps | | | 2,063 | | | | 3,864 | | | | 1,729 | | | | 7,656 | | | | 5,416 | |
| Foreign exchange contracts | | | 3,248 | | | | — | | | | — | | | | 3,248 | | | | 3,149 | |
| | |
| | |
| | |
| | |
| | |
| | |
| Total Derivative Financial Instruments | | $ | 5,931 | | | $ | 5,508 | | | $ | 8,201 | | | $ | 19,640 | | | $ | 17,376 | |
| | |
| | |
| | |
| | |
| | |
| | |
These same derivatives can be measured by book value and fair value.
| | | | | | | | | | |
| | | | 2002 | | 2001 |
| | | |
| |
|
Book value: | | | | | | | | |
| | Asset | | | 171 | | | | 167 | |
| | Liability | | | (384 | ) | | | (516 | ) |
| | | | |
| | | |
| |
Fair value: | | | | | | | | |
| | Positive | | | 543 | | | | 293 | |
| | Negative | | | (424 | ) | | | (532 | ) |
| | | | |
| | | |
| |
Swaps that have a positive fair value are those contracts that, if settled immediately, would result in a gain. Conversely, immediate settlement of a swap with a negative fair value would result in a loss.
73
18. �� Fair Value of Financial Instruments
The following chart outlines the book values and the fair values of the Corporation’s financial instruments. As with any estimate, uncertainty is inherent due to the unpredictability of future events. In the case of estimating the fair value of the Corporation’s financial instruments, this uncertainty is magnified due to the large number of assumptions used and the wide range of acceptable valuation techniques. Estimates of fair values are based on market conditions at a certain point in time, and may not be reflective of future market conditions. Thus, the estimates of the value of financial instruments outlined as follows do not necessarily reflect the actual values that may occur should the instruments be exchanged in the market. It is not the Corporation’s intent to settle these items in the market before they mature.
The aggregate of the estimates of the fair value of financial instruments presented as follows does not reflect an estimate of the underlying value of the Corporation.
| | | | | | | | | | | | | | | | | | |
| ($ in millions) | | 2002 | | 2001 |
| |
| |
|
| Balance Sheet Financial Instruments | | Book Value | | Fair Value | | Book Value | | Fair Value |
| |
| |
| |
| |
|
| Cash and marketable securities: | | | | | | | | | | | | | | | | |
| | Fixed rate securities | | | 557 | | | | 575 | | | | 430 | | | | 438 | |
| | Floating rate securities | | | 2,276 | | | | 2,276 | | | | 1,752 | | | | 1,753 | |
| Investments | | | 75 | | | | 75 | | | | 173 | | | | 173 | |
| Performing fixed rate loans | | | 12,703 | | | | 12,261 | | | | 12,132 | | | | 11,160 | |
| Performing floating rate loans | | | 11,674 | | | | 9,123 | | | | 11,713 | | | | 10,252 | |
| Impaired loans (net of specific allowance and non-accrued capitalized interest) | | | 676 | | | | 676 | | | | 538 | | | | 538 | |
| | | |
| | | |
| | | |
| | | |
| |
| Subtotal | | | 27,961 | | | | 24,986 | | | | 26,738 | | | | 24,314 | |
| | | |
| | | |
| | | |
| | | |
| |
| Less: Non-accrued capitalized interest on | | | | | | | | | | | | | | | | |
| | Performing Loans* | | | 425 | | | | — | | | | 499 | | | | — | |
| | General allowance for loan losses (note 7) | | | 3,031 | | | | — | | | | 2,522 | | | | — | |
| | | |
| | | |
| | | |
| | | |
| |
| Total | | $ | 24,505 | | | $ | 24,986 | | | $ | 23,717 | | | $ | 24,314 | |
| | | |
| | | |
| | | |
| | | |
| |
| Accounts payable | | | 155 | | | | 155 | | | | 131 | | | | 131 | |
| Loans payable: | | | | | | | | | | | | | | | | |
| | Fixed rate | | | 14,855 | | | | 15,518 | | | | 12,992 | | | | 13,276 | |
| | Floating rate | | | 6,233 | | | | 6,496 | | | | 7,037 | | | | 7,042 | |
| | | |
| | | |
| | | |
| | | |
| |
| Total | | $ | 21,243 | | | $ | 22,169 | | | $ | 20,160 | | | $ | 20,449 | |
| | | |
| | | |
| | | |
| | | |
| |
| * | | Represents the unamortized balance that accrued while the loan was impaired. |
Note: The book value of assets and liabilities shown above differs slightly from the balances on the financial statements due to the exclusion of deferrals that do not have a fair value.
| | | | | | | | | |
| ($ in millions) | | 2002 | | 2001 |
| |
| |
|
| Off-Balance Sheet Financial Instruments | | Fair Value | | Fair Value |
| |
| |
|
| Currency swap contracts | | | 102 | | | | (319 | ) |
| Interest rate swap contracts | | | 57 | | | | 107 | |
| Foreign exchange contracts | | | (40 | ) | | | (27 | ) |
| Undisbursed loan commitments: | | | | | | | | |
| Fixed rate | | | 180 | | | | 251 | |
| Floating rate | | | 368 | | | | 221 | |
| | | |
| | | |
| |
The fair values of marketable securities and investments are estimated using observable market prices. If such prices are not available, a valuation technique is used that is consistent with accepted economic pricing methodologies.
In order to estimate the fair value of its performing loans receivable, the Corporation separates its loans into risk pools and calculates the net present value of cash flows of principal and interest. The discount rate for the fixed rate portfolio is derived by taking the base rate, U.S. Treasury for U.S. dollar fixed rate cash flows, for example, to which a spread for credit risk is added to each credit pool. The discount rate for the floating rate portfolio is derived similarly by adding to the base rate a spread for credit risk depending on the grade of credit. The fair value of undisbursed loan commitments is estimated using the same methodology used in the performing loans receivable estimate.
74
Accounts payable are outstanding for only a short period of time. Thus, the fair value of accounts payable is estimated to be equal to their book value.
The estimate of the fair value of loans payable is based on a discounted cash flow approach using current market rates.
The estimate of the fair value of the foreign exchange contracts is calculated using the current market spot and forward exchange rates at the end of the year. Currency swap contracts and interest rate swap contracts are valued using a discounted cash flow approach. The discount rate used to estimate the fair value of the swap contracts is based on the current market swap rates at the end of the year as issued by Reuters and Telerate. These rates are used to calculate the present value of future interest payments and principal cash flows related to the swap contracts.
19. Related Party Transactions
The Corporation enters into transactions with other government departments, agencies and Crown corporations in the normal course of business.
Canada Account Administrative Expense Recovery
As described in note 21, EDC administers certain financial and contingent liability transactions on behalf of the Government of Canada, known as the “Canada Account”. EDC receives compensation for expenses and overhead relating to Canada Account activities. In 2002, EDC retained $7 million (2001 — $12 million) from Canada Account receipts and recoveries for these expenses and overhead.
Loan with Recourse to the Consolidated Revenue Fund
The Corporation has loans receivable of $1,368 million (2001 — $1,222 million) and undisbursed commitments of $130 million (2001 — $275 million), for which it has recourse to the Consolidated Revenue Fund of Canada in the event of a loan default.
Debt Relief
When sovereign borrowers experience financial difficulties and are unable to meet their debt obligations, sovereign creditors, including the Government of Canada, agree at an international forum, the Paris Club, to formally reschedule the borrower’s debt obligations. From time to time and on a case-by-case basis, the most heavily indebted sovereign borrowers are granted debt reduction or debt service relief by the Government of Canada. The granting of debt reduction or relief by the Paris Club is contingent upon the sovereign borrower’s ability to implement and maintain economic programs outlined by the International Monetary Fund.
In the past, the Government of Canada has reimbursed the Corporation an amount equal to the debt relief granted by the Government of Canada to the Corporation’s sovereign borrowers. The formula for calculating the amount to be paid to the Corporation was amended effective April 1, 2001 in two ways. Firstly, for new loans issued by the Corporation to sovereign borrowers which were on the Paris Club debt relief list as at April 1, 2001, the Government of Canada has no obligation to compensate the Corporation for further debt relief granted to such borrowers. Secondly, for any debt reduction for new loans resulting from unilateral debt relief measures or new debt reduction for obligations contracted prior to April 1, 2001, EDC will share in the costs of debt forgiveness to the amount of its appropriate specific allowances.
Amounts received for debt relief arrangements on sovereign impaired loans are credited to the book value of the loans similar to the treatment accorded to other receipts on impaired loans. To the extent that amounts received exceed the book value of the loans as a result of non-accrued capitalized interest, debt relief income is recorded, and any provisions are returned to income.
Debt relief in the amount of $96 million (2001 — $1 million) was recognized as income. During the year, the Corporation received in total $402 million (2001 — $13 million) pursuant to debt relief arrangements, and of this amount, $96 million represented the non-accrued capitalized interest associated with these loans and was recognized as debt relief income in the income statement.
Dividend
EDC paid a dividend to the Government of Canada in the amount of $95 million during the year (2001 — nil) at the request of the shareholder.
75
20. Employee Benefits
Pension Plan
Effective April 24, 2000, the Corporation established a pension plan for its employees. The plan is a defined benefit plan, providing benefits to retirees based on years of service and the best five consecutive years’ average salary of the employees. All permanent employees of EDC are members of the pension plan, however, employee contributions to the plan are optional.
The benefits that were transferred from the Public Service Superannuation Fund with respect to both the Registered Plan and the Supplementary Plan are included in the projected obligation as at December 2002. As of December 31, 2002, the Government of Canada had transferred a total of $110 million to the Corporation’s registered pension plan to fund the pension obligation that was transferred. Included in pension assets is $14 million owing from the Government of Canada to fund the balance of this obligation. Also included in pension assets is $33 million owing from the Government of Canada to fund the liabilities transferred to the Supplementary Plan. The PSSA is in the process of establishing the Regulation required to enable it to transfer the obligation and the corresponding assets with respect to the Supplementary Plan. It is anticipated that the regulation will be in place and the transfer will occur in 2003.
Other Benefits Plan
The Corporation maintains a retiring allowance program and provides certain life insurance, health and dental care benefits to retired employees. This plan is unfunded.
The following presents the financial position of EDC’s Employee Benefit Plans at December 31, 2002.
| | | | | | | | | | | | | | | | | |
| ($ in thousands) | | 2002 | | 2001 |
| |
| |
|
| | | Pension | | Other | | Pension | | Other |
| | | Benefits | | Benefits | | Benefits | | Benefits |
| | | Plan | | Plan | | Plan | | Plan |
| | |
| |
| |
| |
|
Accrued Benefit Obligation: | | | | | | | | | | | | | | | | |
| Obligation beginning of year | | | 126,604 | | | | 28,604 | | | | 6,689 | | | | 22,474 | |
| Current service costs | | | 12,733 | | | | 2,881 | | | | 11,087 | | | | 1,879 | |
| Interest cost on benefit obligation | | | 10,114 | | | | 2,256 | | | | 1,214 | | | | 1,743 | |
| Buyback contributions | | | 722 | | | | — | | | | — | | | | — | |
| Obligation transferred from PSSA | | | 4,982 | | | | — | | | | 123,227 | | | | — | |
| Actuarial (gain)/loss including change in basis | | | 3,665 | | | | 1,215 | | | | (13,941 | ) | | | 2,687 | |
| Benefits paid | | | (1,100 | ) | | | (659 | ) | | | (1,672 | ) | | | (179 | ) |
| | | |
| | | |
| | | |
| | | |
| |
| Accrued benefit obligation at end of year | | | 157,720 | | | | 34,297 | | | | 126,604 | | | | 28,604 | |
| | | |
| | | |
| | | |
| | | |
| |
Fair Value of Plan Assets: | | | | | | | | | | | | | | | | |
| Fair value at beginning of year | | | 137,786 | | | | — | | | | 6,070 | | | | — | |
| Actual return on plan assets | | | (4,764 | ) | | | — | | | | (556 | ) | | | — | |
| Transfer from PSSA | | | — | | | | — | | | | 80,000 | | | | — | |
| Receivable from PSSA | | | 30,749 | | | | — | | | | 43,227 | | | | — | |
| Employer contributions | | | 7,618 | | | | 659 | | | | 7,641 | | | | 179 | |
| Employee contributions | | | 3,771 | | | | — | | | | 3,076 | | | | — | |
| Benefits paid | | | (1,100 | ) | | | (659 | ) | | | (1,672 | ) | | | (179 | ) |
| | | |
| | | |
| | | |
| | | |
| |
| Fair value at end of year | | | 174,060 | | | | — | | | | 137,786 | | | | — | |
| | | |
| | | |
| | | |
| | | |
| |
Funded Status — plan surplus/(deficit) | | | 16,340 | | | | (34,297 | ) | | | 11,182 | | | | (28,604 | ) |
| Unamortized net actuarial (gain)/loss | | | (15,466 | ) | | | 3,756 | | | | (12,541 | ) | | | 2,576 | |
| Unamortized transitional obligation | | | — | | | | 9,004 | | | | — | | | | 9,608 | |
| | | |
| | | |
| | | |
| | | |
| |
Accrued benefit asset/(liability) | | $ | 874 | | | $ | (21,537 | ) | | $ | (1,359 | ) | | $ | (16,420 | ) |
| | | |
| | | |
| | | |
| | | |
| |
Included in the accrued benefit obligation is an amount of $8,023 thousand (2001 — $1,905 thousand) and included in the fair value of plan assets is $34,221 thousand (2001 — $1,372 thousand),both in respect to the Supplementary plan.
76
Net Employee Benefits Expense
| | | | | | | | | | | | | | | | | |
| ($ in thousands) | | 2002 | | 2001 |
| |
| |
|
| | | Pension | | Other | | Pension | | Other |
| | | Benefits | | Benefits | | Benefits | | Benefits |
| | | Plan | | Plan | | Plan | | Plan |
| | |
| |
| |
| |
|
| Current service costs (net of employee contributions) | | | 9,684 | | | | 2,881 | | | | 8,011 | | | | 1,879 | |
| Interest cost on benefit obligation | | | 10,114 | | | | 2,256 | | | | 1,214 | | | | 1,743 | |
| Expected return on plan assets | | | (12,608 | ) | | | — | | | | (800 | ) | | | — | |
| Amortization of transitional obligation | | | — | | | | 604 | | | | — | | | | 604 | |
| Amortization of net actuarial (gain)/loss | | | (1,806 | ) | | | 30 | | | | — | | | | — | |
| | | |
| | | |
| | | |
| | | |
|
| Total | | $ | 5,384 | | | $ | 5,771 | | | $ | 8,425 | | | $ | 4,226 | |
| | | |
| | | |
| | | |
| | | |
|
Assumptions
| | | | | | | | | | | | | | | | | |
| | | 2002 | | 2001 |
| | |
| |
|
| | | Pension | | Other | | Pension | | Other |
| | | Benefits | | Benefits | | Benefits | | Benefits |
| | | Plan | | Plan | | Plan | | Plan |
| | |
| |
| |
| |
|
| Expected long-term rate of return on assets | | | 7.5 | % | | | n/a | | | | 8.0 | % | | | n/a | |
| Discount rate on projected benefit obligation | | | 6.75 | % | | | 6.75 | % | | | 7.0 | % | | | 7.0 | % |
| Inflation | | | 3.0 | % | | | 3.0 | % | | | 3.0 | % | | | 3.0 | % |
| Rate of compensation increase | | Inflation + 1% | | Inflation + 1% | | Inflation + 1% | | Inflation + 1% |
| | | productivity + | | productivity + | | productivity + | | productivity + |
| | | merit | | merit | | merit | | merit |
| | |
| |
| |
| |
|
The initial annual rate of increase for covered medical care benefits is assumed to be 8%. This rate is projected to trend down over 7 years to an ultimate rate of 4%. For dental care, the trend rate used was 4%.
21. Canada Account Transactions
Pursuant to the Act, the Minister for International Trade, with the concurrence of the Minister of Finance, may authorize the Corporation to undertake certain financial and contingent liability transactions on behalf of the Government of Canada. These transactions and the legislative authorities that underlie them have come to be known collectively as the “Canada Account”. The Board of Directors is responsible only for ensuring that the transactions made by the Corporation under the Canada Account are administered appropriately. Accounts for these transactions are maintained separately from the Corporation’s accounts and are consolidated annually as at March 31 with the financial statements of the Government of Canada, which are reported upon separately by the Government and audited by the Auditor General of Canada. The assets under the Canada Account, mainly loans receivable and accrued interest and fees recorded in accordance with the accounting policies and practices of the Government of Canada, amounted to $3,069 million at December 31,2002 (2001 — $2,774 million).
The Act allows the Canada Account to have outstanding loans and commitments to foreign borrowers, and liabilities under contracts of insurance and other agreements up to a maximum of $13 billion. The position against this limit, determined in accordance with the requirements of the Act, is $10,305 million (2001 — $5,030 million).
As at the end of December 2002, total Ministerial Authorizations (M.A.’s) issued and approved totaled $490 million and unallocated amounts under Lines of Credit totaled $187 million for Canada Account. These amounts have been approved by the Minister of International Trade and the Minister of Finance in support of potential new transactions to be signed. The position against the statutory limit will increase accordingly as each new obligation is signed by the Corporation that has the effect of extending credit.
During 2001, a new methodology to compensate EDC for expenses and overhead related to Canada Account activities was instituted. This resulted in the Corporation retaining $7 million (2001 — $12 million) from Canada Account receipts and recoveries for these expenses and overhead.
22. Reclassification of Comparative Figures
Certain 2001 comparative figures have been reclassified to conform to the presentation adopted in 2002.
77
Five-Year Review
Balance Sheets
as at December 31
| | | | | | | | | | | | | | | | | | | | | |
| ($ in millions) | | 2002 | | 2001 | | 2000 | | 1999 | | 1998 |
| |
| |
| |
| |
| |
|
| Gross loans receivable | | | 26,341 | | | | 25,226 | | | | 22,023 | | | | 18,598 | | | | 16,524 | |
| Less: non-accrued capitalized interest | | | 1,426 | | | | 1,241 | | | | 1,165 | | | | 1,182 | | | | 1,255 | |
| Less: allowance for losses on loans | | | 3,613 | | | | 2,892 | | | | 2,700 | | | | 2,324 | | | | 2,060 | |
| Less: deferred loan revenue | | | 292 | | | | 267 | | | | 272 | | | | 248 | | | | 220 | |
| | | |
| | | |
| | | |
| | | |
| | | |
| |
| Net loans receivable | | | 21,010 | | | | 20,826 | | | | 17,886 | | | | 14,844 | | | | 12,989 | |
| Cash and investments | | | 2,899 | | | | 2,346 | | | | 2,357 | | | | 3,417 | | | | 1,730 | |
| Accrued interest and other assets | | | 645 | | | | 621 | | | | 747 | | | | 1,253 | | | | 761 | |
| | | |
| | | |
| | | |
| | | |
| | | |
| |
| Total assets | | $ | 24,554 | | | $ | 23,793 | | | $ | 20,990 | | | $ | 19,514 | | | $ | 15,480 | |
| | | |
| | | |
| | | |
| | | |
| | | |
| |
| Loans payable | | | 20,828 | | | | 19,609 | | | | 17,583 | | | | 16,325 | | | | 12,636 | |
| Accrued interest and other liabilities | | | 812 | | | | 1,082 | | | | 846 | | | | 937 | | | | 728 | |
| Allowance for loan commitments and guarantees | | | 377 | | | | 588 | | | | 130 | | | | 115 | | | | 129 | |
| Allowance for claims on insurance | | | 460 | | | | 464 | | | | 439 | | | | 339 | | | | 307 | |
| | | |
| | | |
| | | |
| | | |
| | | |
| |
| Total liabilities | | | 22,477 | | | | 21,743 | | | | 18,998 | | | | 17,716 | | | | 13,800 | |
| | | |
| | | |
| | | |
| | | |
| | | |
| |
| Share capital | | | 983 | | | | 983 | | | | 983 | | | | 983 | | | | 983 | |
| Retained earnings | | | 1,094 | | | | 1,067 | | | | 1,009 | | | | 815 | | | | 697 | |
| | | |
| | | |
| | | |
| | | |
| | | |
| |
| Shareholder’s equity | | | 2,077 | | | | 2,050 | | | | 1,992 | | | | 1,798 | | | | 1,680 | |
| | | |
| | | |
| | | |
| | | |
| | | |
| |
| Total liabilities and shareholder’s equity | | $ | 24,554 | | | $ | 23,793 | | | $ | 20,990 | | | $ | 19,514 | | | $ | 15,480 | |
| | | |
| | | |
| | | |
| | | |
| | | |
| |
Income Statements
for the year ended December 31
| | | | | | | | | | | | | | | | | | | | | |
| ($ in millions) | | 2002 | | 2001 | | 2000 | | 1999 | | 1998 |
| |
| |
| |
| |
| |
|
| Interest income — loans | | | 1,404 | | | | 1,620 | | | | 1,585 | | | | 1,256 | | | | 1,055 | |
| Interest income — debt relief | | | 96 | | | | 1 | | | | — | | | | 2 | | | | — | |
| Interest income — investment portfolio | | | 69 | | | | 127 | | | | 197 | | | | 146 | | | | 126 | |
| | | |
| | | |
| | | |
| | | |
| | | |
| |
| Less: interest expense | | | 580 | | | | 934 | | | | 1,066 | | | | 796 | | | | 642 | |
| | | |
| | | |
| | | |
| | | |
| | | |
| |
| Net interest income | | | 989 | | | | 814 | | | | 716 | | | | 608 | | | | 539 | |
| | | |
| | | |
| | | |
| | | |
| | | |
| |
| Insurance premiums and guarantee fees | | | 147 | | | | 134 | | | | 144 | | | | 133 | | | | 110 | |
| Provision for credit losses | | | 840 | | | | 741 | | | | 549 | | | | 523 | | | | 433 | |
| | | |
| | | |
| | | |
| | | |
| | | |
| |
| Income after provision for credit losses | | | 296 | | | | 207 | | | | 311 | | | | 218 | | | | 216 | |
| Administrative expenses | | | 174 | | | | 149 | | | | 117 | | | | 100 | | | | 81 | |
| | | |
| | | |
| | | |
| | | |
| | | |
| |
| Net income | | $ | 122 | | | $ | 58 | | | $ | 194 | | | $ | 118 | | | $ | 135 | |
| | | |
| | | |
| | | |
| | | |
| | | |
| |
78
Corporate Account
Financial Arrangements Facilitated
| | | | | | | | | | | | | | | | | | | | | |
| ($ in millions) | | 2002 | | 2001 | | 2000 | | 1999 | | 1998 |
| |
| |
| |
| |
| |
|
Export Financing | | | | | | | | | | | | | | | | | | | | |
| Direct financing | | | 7,381 | | | | 8,419 | | | | 7,657 | | | | 6,060 | | | | 6,639 | |
| | | |
| | | |
| | | |
| | | |
| | | |
| |
Export Insurance | | | | | | | | | | | | | | | | | | | | |
| Short-term insurance* | | | 34,532 | | | | 26,776 | | | | 25,807 | | | | 23,792 | | | | 20,660 | |
| Medium-term insurance | | | 8,638 | | | | 8,555 | | | | 7,080 | | | | 5,914 | | | | 3,933 | |
| Guarantees | | | 689 | | | | 597 | | | | 325 | | | | 456 | | | | 189 | |
| | | |
| | | |
| | | |
| | | |
| | | |
| |
| Subtotal | | | 43,859 | | | | 35,928 | | | | 33,212 | | | | 30,162 | | | | 24,782 | |
| | | |
| | | |
| | | |
| | | |
| | | |
| |
| Total | | $ | 51,240 | | | $ | 44,347 | | | $ | 40,869 | | | $ | 36,222 | | | $ | 31,421 | |
| | | |
| | | |
| | | |
| | | |
| | | |
| |
Short-term domestic insurance not included above | | $ | 298 | | | $ | 1,157 | | | $ | 3,996 | | | $ | 3,833 | | | $ | 3,330 | |
| | | |
| | | |
| | | |
| | | |
| | | |
| |
Financial and Other Data | | | | | | | | | | | | | | | | | | | | |
Export Financing | | | | | | | | | | | | | | | | | | | | |
| Number of transactions financed | | | 397 | | | | 556 | | | | 458 | | | | 372 | | | | 351 | |
| Value of total obligations on loans receivable | | | 26,341 | | | | 25,226 | | | | 22,023 | | | | 18,598 | | | | 16,524 | |
| Value of undisbursed loans | | | 3,512 | | | | 4,938 | | | | 4,825 | | | | 5,345 | | | | 5,813 | |
| Value of disbursements | | | 6,028 | | | | 8,085 | | | | 7,210 | | | | 6,374 | | | | 5,822 | |
| Value of liability on loan guarantees | | | 2,699 | | | | 2,212 | | | | 1,795 | | | | 1,643 | | | | 1,723 | |
| Undisbursed amounts on loan guarantees | | | 299 | | | | 355 | | | | 112 | | | | 123 | | | | 150 | |
| Number of current lines of credit and protocols | | | 47 | | | | 40 | | | | 44 | | | | 55 | | | | 52 | |
| Amounts available for allocation | | | 1,655 | | | | 1,476 | | | | 1,176 | | | | 1,659 | | | | 1,320 | |
| Loan amounts rescheduled | | | 775 | | | | 290 | | | | 264 | | | | 720 | | | | 237 | |
| Loan amounts written off | | | 194 | | | | 191 | | | | 105 | | | | — | | | | — | |
| | | |
| | | |
| | | |
| | | |
| | | |
| |
Export Insurance | | | | | | | | | | | | | | | | | | | | |
| Number of policies issued | | | 6,351 | | | | 5,090 | | | | 3,951 | | | | 3,879 | | | | 3,345 | |
| Number of insurance policies and guarantees in force | | | 11,686 | | | | 9,982 | | | | 8,264 | | | | 7,190 | | | | 6,272 | |
| Value of liability on insurance and guarantees** | | | 12,265 | | | | 11,944 | | | | 12,495 | | | | 10,955 | | | | 9,921 | |
| Value of claims paid | | | 144 | | | | 144 | | | | 84 | | | | 134 | | | | 72 | |
| Value of claims recovered/rescheduled | | | 39 | | | | 51 | | | | 30 | | | | 17 | | | | 19 | |
| Value of claims outstanding at end of year | | | 344 | | | | 298 | | | | 246 | | | | 234 | | | | 164 | |
| Value of claims under consideration at end of year | | | 35 | | | | 48 | | | | 36 | | | | 38 | | | | 62 | |
| | | |
| | | |
| | | |
| | | |
| | | |
| |
Average employee strength during year | | | 992 | | | | 939 | | | | 838 | | | | 778 | | | | 698 | |
| | | |
| | | |
| | | |
| | | |
| | | |
| |
| * | | Excludes domestic insurance. |
| |
| ** | | Figures prior to 2000 were not restated to reflect current presentation as the information was not reasonably determinable. |
79
Canada Account
Financial Arrangements Facilitated
| | | | | | | | | | | | | | | | | | | | | |
| ($ in millions) | | 2002 | | 2001 | | 2000 | | 1999 | | 1998 |
| |
| |
| |
| |
| |
|
Export Financing | | | | | | | | | | | | | | | | | | | | |
| Direct financing | | | 527 | | | | 135 | | | | 38 | | | | 67 | | | | 9 | |
Export Insurance | | | | | | | | | | | | | | | | | | | | |
| Short-term insurance | | | 1 | | | | — | | | | — | | | | — | | | | — | |
| Medium-term insurance | | | 5 | | | | 16 | | | | 224 | | | | 247 | | | | 497 | |
| Guarantees | | | — | | | | — | | | | — | | | | — | | | | 12 | |
| | | |
| | | |
| | | |
| | | |
| | | |
| |
| Subtotal | | | 6 | | | | 16 | | | | 224 | | | | 247 | | | | 509 | |
| | | |
| | | |
| | | |
| | | |
| | | |
| |
| Total | | $ | 533 | | | $ | 151 | | | $ | 262 | | | $ | 314 | | | $ | 518 | |
| | | |
| | | |
| | | |
| | | |
| | | |
| |
Financial and Other Data | | | | | | | | | | | | | | | | | | | | |
Export Financing | | | | | | | | | | | | | | | | | | | | |
| Number of transactions financed | | | 28 | | | | 8 | | | | 11 | | | | 12 | | | | 5 | |
| Value of total obligations on loans receivable | | | 2,968 | | | | 2,682 | | | | 2,490 | | | | 2,599 | | | | 2,904 | |
| Value of undisbursed loans | | | 5,123 | | | | 101 | | | | 192 | | | | 183 | | | | 194 | |
| Value of disbursements | | | 534 | | | | 203 | | | | 76 | | | | 66 | | | | 100 | |
| Number of current lines of credit and protocols | | | 2 | | | | 2 | | | | 3 | | | | 2 | | | | 2 | |
| Amounts available for allocation | | | 109 | | | | 88 | | | | 73 | | | | 73 | | | | 87 | |
| Loan amounts rescheduled | | | 25 | | | | 43 | | | | 3 | | | | 45 | | | | 45 | |
| | | |
| | | |
| | | |
| | | |
| | | |
| |
Export Insurance | | | | | | | | | | | | | | | | | | | | |
| Number of policies issued | | | 1 | | | | 1 | | | | 1 | | | | 4 | | | | 12 | |
| Number of insurance policies and guarantees in force | | | 1 | | | | 4 | | | | 5 | | | | 20 | | | | 25 | |
| Value of liability on insurance and guarantees | | | 4 | | | | 56 | | | | 170 | | | | 199 | | | | 299 | |
| Value of claims paid | | | — | | | | — | | | | — | | | | 8 | | | | 4 | |
| Value of claims recovered | | | — | | | | — | | | | — | | | | — | | | | 7 | |
| Value of claims outstanding at end of year | | | 47 | | | | 47 | | | | 46 | | | | 46 | | | | 38 | |
| | | |
| | | |
| | | |
| | | |
| | | |
| |
80
Board of Directors
Members of the Board of Directors
As at December 31, 2002
| | | |
Mr. J. Bernard Boudreau
President
Radcliffe Consulting and Investment Ltd.
Halifax, Nova Scotia | | Mr. A. Ian Gillespie
President and Chief Executive Officer
Export Development Canada
Ottawa, Ontario
|
| | | |
Ms Dorothy E. Byrne, Q.C.
President
Eagle Island Consulting Corp.
Corporate Secretary
Vancouver/Whistler 2010 Bid Corporation
Vancouver, British Columbia
| | Mr. Paul Gobeil
Chairman of the Board
Export Development Canada
Montreal, Quebec
|
| | | |
Mr. Rayburn D. Doucett
President
Crosswaters Trade Brokers Limited
Belledune, New Brunswick
| | Mr. Robert J. Holt
President
Applied Common Sense Solutions Inc.
Saltspring Island, British Columbia
|
| | | |
Mr. Leonard J. Edwards
Deputy Minister for International Trade
Ottawa, Ontario
| | Mr. Pierre MacDonald
President and Chief Executive Officer
MacD Consult Inc.
Verdun, Quebec
|
| | | |
Mr. Rowland W. Fleming
President
Vergemount Inc.
Creemore, Ontario
| | Mr. James A. Pattillo
President
Advance Film Group
Calgary, Alberta
|
| | | |
Mr. Jonathan T. Fried
Sr. Assistant Deputy Minister of Finance
and G-7 Deputy for Canada
Department of Finance
Ottawa, Ontario
| | Mr. Ajay K. Virmani
President
Cargo Jet Canada Ltd.
Mississauga, Ontario
|
| | | |
Mr. Robert A. Fung
Deputy Chairman
Yorkton Financial Inc.
Toronto, Ontario | | Ms. Margriet Zwarts
General Counsel and Secretary
Telesystem International Wireless Inc.
Montreal, Quebec
(1 Vacancy)
|
| | | |
| | | During 2002, the following changes occurred
on the Board of Directors: |
| | | |
| | | • Pierre MacDonald reappointed April 30, 2002 |
| | | |
| | | • A. Ian Gillespie reappointed August 27, 2002 |
| | | |
| | | • Rayburn D. Doucett reappointed on November 5, 2002 |
| | | |
| | | • Dominique Vachon resigned on December 4, 2002 |
81
Corporate Governance Practices
Over the year 2002, the leadership and stewardship shown by EDC’s Board of Directors (the “Board”) and its various committees largely focused on consolidation and renewal, bridging past initiatives and future direction.
Consolidation took the form of putting into full operation policy decisions, including those arising from legislative changes, which the Board had overseen in previous years, such as EDC’s new corporate identity and Corporate Social Responsibility (CSR) initiatives. Renewal related to the efforts of the Board, under the direction of a new Chairperson, to ensure that the focus on the future did not stop with the legislative review that concluded in 2001, and that the corporation’s activities remained effective in providing the best possible service to Canada’s exporters. It also involved steps by the Board and its Human Resources Committee to ensure appropriate succession planning, both with respect to the President, who was re-appointed during the year, and senior management. Informed by this dual focus, the Board and its committees, in the 42 meetings held during the year, gave direction and guidance to EDC’s management on key features of EDC’s operations.
This ongoing work by the Board in demonstrating leadership of the corporation related to and helped ensure compliance with the guidelines set out by Treasury Board in its publication entitled Corporate Governance in Crown Corporations and Other Public Enterprises (the “Guidelines”).
The Guidelines related to the Board’s activities in 2002 as indicated below:
Board Stewardship
As a key responsibility of the Board, the stewardship of the corporation remained a major focus of Board activities, with the following initiatives undertaken in 2002:
Strategic Direction: The legislative review process, which had been the focus of the Board’s strategic activities over several years, ended in December 2001 with the amendment of the Export Development Act, but this by no means marked the end of the Board’s involvement in strategic issues. Rather, the Board took active steps in 2002 to continue the consideration and discussion of the strategic direction of the corporation, and in furtherance of this discussion held special sessions at its regular meetings, convened a meeting devoted to strategic review, and constituted an ad hoc committee of the Board dedicated to that purpose. The original themes identified were: application of EDC’s mandate to meet customer needs, customer service and business development, the risk element, including risk management, risk appetite and the profitability of the corporation, and people in senior management positions. However, the scope of the study has evolved to include a much broader examination of Canada’s export credit system and the corporation’s place and function within that system. The Board approved the 2003-2007 Corporate Plan of the corporation, which recognized that the development of a longer-term strategy remained ongoing.
Identifying and Managing Risks: 2002 proved to be a year of continuing financial and economic turmoil in countries in which the corporation has exposure, especially in sectors such as the telecommunications, airline and United States power industries. In light of this ongoing uncertainty, the Risk Management Committee of the Board (RMC) continued to play an active role in ensuring that the Board remained aware of the status of the corporation’s portfolio, including those assets considered impaired or at risk, and in refining the examination and monitoring of risk and the reporting of results. The Board also reviewed the corporation’s capabilities and the systems in place to ensure that the operations of the corporation could continue in the event of disaster, and toured the special facilities established to aid in this purpose.
82
Succession Planning: Both the Board and the Human Resources Committee (HRC) of the Board had roles to play in connection with the position of President of the corporation and the renewal of the incumbent for a further two-year term. In addition, the HRC took on the responsibility of satisfying itself that a proper system existed within the corporation to ensure appropriate succession planning as well as a sharing and distribution of responsibilities in this regard. The year concluded with an approval by the HRC of the framework outlining where the responsibility for various appointments will lie, and the manner in which the succession plan will be approved and monitored.
Importance of Information Flow: Efforts continued in 2002 to ensure that EDC’s information systems and management practices met the Board’s needs, with continued improvement in the usability of the reporting provided to the Board and its committees. During the year, the Board requested and received a number of enhancements to the information flow, including systems to avoid duplication in reports and presentation material received by the Board. Monthly reporting to all directors regarding credit risk exposures, including policy compliance and changes to country and obligor ratings, which had been initiated following the events of September 11, 2001, continued to be provided, and this reporting enhanced the currency of the information Board members have at hand.
Public Policy Objectives: As noted, the corporation’s mandate will be examined as part of the strategic review. The other significant public policy matters monitored by the Board together constituted initiatives to implement the corporation’s CSR program. Specific activities in this regard included: public consultations and resulting amendments both to the Disclosure Policy and the Environment Review Directive (ERD), both of which had been approved in 2001; implementation and communication of the role of the Compliance Officer which had been established in 2001 to ensure accountability and compliance in specific CSR matters and to assist EDC in responding to the concerns of stakeholders in these matters; the formation of a CSR Advisory Council which met twice in 2002; workshops held across the country with respect to new anti-corruption legislation; staff training on the ERD and on anti-corruption legislation; and, finally, strengthened channels of communications between EDC and the Department of Foreign Affairs and International Trade (DFAIT) so as to provide EDC with information and guidance from DFAIT with respect to human rights developments in relevant countries, and ways in which such information may be integrated into EDC’s political risk assessment.
Communications and Stakeholder Relations: In 2002, all areas of communication and engagement with the main stakeholders of the corporation, the Crown and parliamentarians, public interest groups, the media, key business associations, and the public at large, were centralized within one area of the corporation under the responsibility of the Vice-President for Corporate Communications and External Relations. The resulting regrouping helped to ensure consistency and a better level of communication, including a proactive role in engaging public interest groups by means ranging from the formal public consultation process used in connection with the ERD and the Disclosure Policy, and public interest group membership on the CSR Advisory Council to less formal dialogue.
83
Working with Management
Activities in 2002 involving the relationship between EDC’s Board and its management, and the ability of the Board to function independently included the following:
Working Relationships: The Board continued in 2002, through management systems including its Delegation of Authority and policy frameworks, to enhance its ability to focus on the corporation’s directions and objectives and to monitor the management of the business activities and other affairs of the corporation. The Board placed significant importance on maintaining an effective working relationship and accountability structure between the Board and management, as evidenced by the involvement of both the HRC and the Board itself in establishing and approving, in agreement with the President, his objectives for the year and in measuring his performance against these objectives.
Board Independence: The Board continued to meet in-camera for a portion of each meeting of the Board, as it has done for several years, and some meetings of committees continued to include sessions without management presence. In 2002, the Audit Committee established regular in camera discussions with the corporation’s internal Corporate Auditor, and with representatives of the corporation’s external auditor, the Auditor General of Canada. With respect to other issues related to its independent functioning, the Board was briefed on conflict of interest concerns and, in addition, the directors received an annual refresher with respect to the applicability of the Corporation’s Code of Conduct and relevant provisions of the Financial Administration Act, and filed declarations with respect thereto. The corporation’s committee structure remains robust and continues to evolve, with Terms of Reference for the committees reviewed periodically and revised when appropriate, as was the case with several committees in 2002. The Board and committees received external independent advice where such advice was necessary or desirable in connection with issues under their consideration.
Functioning of the Board
Matters related to Board functioning were primarily concerned with education, and consideration of ways in which the Board could appropriately assess its own effectiveness. The newly appointed Chairperson of the Board received an orientation on the corporation, its business and practices, and the operations of the Board at the time of his appointment, and the Board continues to ensure that, as vacancies are filled, new directors will receive similar orientation. In addition, a focus in 2002 was the provision of ongoing education to all directors by means of background presentations on specific EDC policies and practices, and the history of their development.
Finally, in 2002 the Board made a commitment to continue the process of renewal and evaluation of Board effectiveness by undertaking every two years a formal survey to assess the Board’s capacity and evaluate its performance, as well as that of its committees. The next such survey will take place in the first half of 2003. During the course of 2002, however, Board members did have a vehicle by which they could express their views as to what they need to receive in order to enhance the functioning of the Board and its committees.
84
Committees of the Board of Directors
The Audit Committee assists the Board in fulfilling its responsibilities in relation to: financial reporting and performance measurement; financial and management control systems and practices; the safeguarding of assets of the corporation and the management of its resources; corporate financing; internal and external audits; EDC’s Code of Business Ethics and Code of Conduct; its Environmental Review Directive (ERD); and overseeing the activities of the Compliance Officer. Areas of particular focus in 2002 included the implementation of ERD reporting and operational guidelines for the compliance program; emerging accounting principles regarding accounting for derivatives; EDC’s information technology infrastructure and systems and related costs; and a review and recommendations for revision of the Committee’s Terms of Reference. In 2002, the Committee held five meetings.
Members: R.A. Fung (Chair), R.J. Holt, P. MacDonald, J.A. Pattillo, and A.K. Virmani.
The Business Development Committee assists the Board by providing policy direction to enhance EDC’s ability to meet the evolving needs of the market, taking into account factors related to industrial sector and/or regional economy. Areas of particular focus in 2002 included: eBusiness strategies and achievements; support for emerging exporters; EDC market size and the goal of 10,000 customers by 2004; new EDC representation for Central and Eastern Europe; and a program, in partnership with Canadian banks, focusing on working capital requirements of small- and medium-sized enterprises. In 2002, the Committee held five meetings.
Members: R.D. Doucett (Chair), J.B. Boudreau, D.E. Byrne, R.A. Fung, and A.K. Virmani.
The Corporate Governance Committee is responsible for, and makes recommendations to the Board on, matters relating to EDC’s corporate governance regime, including the development and implementation of methods to ensure good Board performance; and the determination of the structure, responsibility and composition of the various committees of the Board. The Committee’s activities in 2002 consisted of reviewing and recommending updates to the Terms of Reference of several committees of the Board, and reviewing the corporate governance sections of the corporation’s annual report. In 2002, the Committee held one meeting.
Members: The Chairperson of the Board, D.E. Byrne, R.D. Doucett, R.W. Fleming and J.A. Pattillo.
The Executive Committee has the authority to exercise all the powers of the Board with the exception of: declaring dividends; approving any corporate plan, budget, financial statement or report required by any statute or under EDC’s By-Laws; and making, amending or repealing EDC’s By-Laws. This Committee is intended to meet to handle only those urgent matters that may arise between meetings of the Board. In 2002, the Committee held four meetings and one joint meeting with the Risk Management Committee.
Members: The Chairperson of the Board, L.J. Edwards, A.I. Gillespie, P. MacDonald and J.A. Pattillo.
85
The Human Resources Committee assists the Board by reviewing and making recommendations to the Board on EDC’s Human Resources strategic plan, succession planning for the Corporation’s senior management, and EDC’s compensation policy; approving, on the recommendation of the President, the annual budget for both base pay and variable pay, and the annual cash compensation paid to senior executives; and working with the Pension Committee in making recommendations to the Board on any changes to the design of the pension plan for EDC employees. Areas of particular focus in 2002 included: a review of the President’s performance against objectives; the reappointment of the President and consideration of succession issues with respect to that office; succession planning for senior management positions; official languages and the development of a new policy in this regard; and approval of EDC’s compensation plan for 2002. In 2002, the Committee held five meetings and one joint meeting with the Pension Committee.
Members: R.J. Holt (Chair), R.D. Doucett, L.J. Edwards, A.I. Gillespie, P. MacDonald and the Chairperson of the Board.
The Pension Committee assists the Board in overseeing the administration of the pension plan for EDC employees including ensuring the component plans are properly administered and funded in accordance with applicable legislation, required documents are filed with appropriate authorities and all activities of the plan are monitored on an ongoing basis, as well as working with the Human Resources Committee in making recommendations to the Board on any changes to the design of the plan. In 2002, the Committee having completed the implementation phase, focused much of its activities on ensuring that adequate management systems were in place for it to assist the Board in fulfilling its oversight role, and in this regard approved changes to the investment policies for the plan, recommended changes to its own Terms of Reference, and periodically met and reviewed the performance of the plan’s investment managers, as well as approving plan text amendments of an administrative nature reflecting two full years of experience with the plan. In 2002, the Committee held five meetings and one joint meeting with the Human Resources Committee.
Members: R.W. Fleming (Chair), D.E. Byrne, A.I. Gillespie, R.J. Holt and the Chairperson of the Board.
The Risk Management Committee assists the Board in fulfilling its oversight responsibilities with respect to the management of the financial and other enterprise risks, including direct and contingent credit exposures undertaken by the Corporation in the conduct of its business activities, including establishing and updating, as required, an effective and flexible regime governing the authorizations required by the Corporation to undertake such activities; the risks to the Corporation’s financial resources and value from exposure to changes in market risk factors such as interest rates, foreign exchange rates and equity indices; and availability of liquid diversified financial resources to call upon in the event that market conditions do not permit access to funding. Areas of particular focus in 2002 included: implementation of economic capital measurement within the credit risk framework; continued refinement of the risk frameworks, including consideration of additional elements such as operational risk; establishment of an enterprise risk management timetable and work-plan spanning several years; and reviewing and satisfying itself that the Committee’s Terms of Reference were appropriate and that no amendments were necessary, with a recommendation to the Board to that effect. In 2002, the Committee held four meetings and one joint meeting with the Executive Committee.
Members: P. MacDonald (Chair), J.B. Boudreau, R.W. Fleming, A.I. Gillespie, R.J. Holt and the Chairperson of the Board.
86
The Ad Hoc Strategic Review Committee was formally constituted as an ad hoc committee of the Board in order to determine a work plan for, and oversee the carrying out of, a strategic review, the objective of which is to see if Canadian exporters and foreign investors have the required trade finance related products, services and capacity available to them in order to realize their full potential in an increasingly competitive global marketplace thereby ensuring long term prosperity for Canada. A significant focus of this review will be the extent to which EDC, as the principal instrument of public policy to achieve this end, can further enhance its overall effectiveness for Canadian exporters and investors taking into account their views and those of other stakeholders. In 2002, the Committee held two meetings.
Members: R.W. Fleming (Chair), J.B. Boudreau, P. MacDonald and J. Pattillo.
All committees are required to report to the Board of Directors on their activities on a regular and timely basis.
The remuneration of directors falls under the authority of the Governor General in Council, which has also set guidelines governing the payment of fees to the Chairperson of the Board and to the other private sector directors. The Chairperson of the Board is paid an annual fee of $12,400 and a per diem of $485, and the other private sector directors are paid an annual fee of $6,200 and a per diem of $485. In addition, private sector directors, other than the Chairperson of the Board, receive annual fees of $2,000 when they hold office as Vice Chairperson of the Board or Chairperson of a committee of the Board. Public service directors are not paid for their services as directors.
The total aggregate remuneration paid to EDC’s private sector directors for their service in 2002 was approximately $247,500 compared to $279,000 in 2001. The directors served, on average, on three committees of the Board, and attended a total of 42 Board and committee meetings in 2002. The total costs incurred by the Board, including business travel and promotion as well as meeting expenses, were $235,124 for 2002 compared to $262,774 for 2001.
Finally, attendance at meetings of the Board and its Committees during the year was as indicated in the following table.
Table of Directors’ attendance at meetings of the Board, and of Board Committees in 2002
| | | | | | | | | | | | | | | | | | | | | | | | | | | | | | | | | | | | | |
| | | | | | | | | | | Corp. | | | | | | | | | | | | | | | | | | Strategic | | | | |
| | | Audit-5 | | BDC-5 | | Gov.-1 | | Exec.-5 | | HR-6 | | Pension-6 | | Risk-5 | | Review-2 | | Board-7 |
| | |
| |
| |
| |
| |
| |
| |
| |
| |
|
| Boudreau | | | n/a | | | | 5/5 | | | | n/a | | | | n/a | | | | n/a | | | | n/a | | | | 4/5 | | | | 2/2 | | | | 7/7 | |
| Byrne | | | n/a | | | | 4/5 | | | | 1/1 | | | | n/a | | | | n/a | | | | 4/6 | | | | n/a | | | | n/a | | | | 3/7 | |
| Doucett | | | n/a | | | | 5/5 | | | | 1/1 | | | | n/a | | | | 6/6 | | | | n/a | | | | n/a | | | | n/a | | | | 7/7 | |
| Edwards | | | n/a | | | | n/a | | | | n/a | | | | 4/5 | | | | 5/6 | | | | n/a | | | | n/a | | | | n/a | | | | 6/7 | |
| Fleming | | | n/a | | | | n/a | | | | n/a | | | | n/a | | | | n/a | | | | 6/6 | | | | 4/5 | | | | 2/2 | | | | 6/7 | |
| Fried | | | n/a | | | | n/a | | | | n/a | | | | n/a | | | | n/a | | | | n/a | | | | n/a | | | | n/a | | | | 7/7 | |
| Fung | | | 5/5 | | | | 4/5 | | | | n/a | | | | n/a | | | | n/a | | | | n/a | | | | n/a | | | | n/a | | | | 7/7 | |
| Gillespie | | | n/a | | | | n/a | | | | n/a | | | | 5/5 | | | | 5/6 | | | | 3/6 | | | | 5/5 | | | | n/a | | | | 7/7 | |
| Gobeil | | | n/a | | | | n/a | | | | 1/1 | | | | 5/5 | | | | 6/6 | | | | 5/6 | | | | 5/5 | | | | n/a | | | | 7/7 | |
| Holt | | | 5/5 | | | | n/a | | | | n/a | | | | n/a | | | | 6/6 | | | | 6/6 | | | | 5/5 | | | | n/a | | | | 7/7 | |
| MacDonald | | | 5/5 | | | | n/a | | | | n/a | | | | 5/5 | | | | 5/6 | | | | n/a | | | | 4/5 | | | | 2/2 | | | | 7/7 | |
| Pattillo | | | 5/5 | | | | n/a | | | | 1/1 | | | | 5/5 | | | | n/a | | | | n/a | | | | n/a | | | | 2/2 | | | | 7/7 | |
| Vachon | | | n/a | | | | 1/5 | | | | 0/1 | | | | n/a | | | | n/a | | | | n/a | | | | n/a | | | | n/a | | | | 0/7 | |
| Virmani | | | 0/5 | | | | 0/5 | | | | n/a | | | | n/a | | | | n/a | | | | n/a | | | | n/a | | | | n/a | | | | 4/7 | |
| Zwarts | | | n/a | | | | n/a | | | | n/a | | | | n/a | | | | n/a | | | | n/a | | | | n/a | | | | n/a | | | | 7/7 | |
87
Code of Business Ethics
Commitment to legal and ethical conduct
EDC will conduct its business and affairs in accordance with the letter and spirit of all applicable laws in the countries in which it does business. If any EDC employee or representative is ever uncertain as to the interpretation or application of a particular law, he or she must seek advice from Legal Services before taking action. Compliance with the law may, however, fall short of the standard of ethical conduct expected by EDC.
Accordingly, it is EDC’s policy that each of its directors, employees and representatives conduct EDC’s business with honesty, integrity and fairness. It is also corporate policy that communication and relationships with stakeholders be truthful and transparent in a way that will withstand the highest degree of public scrutiny. Working relationships will be based on candor and openness, treating each other fairly and with respect, while acting with integrity, and weighing responsibilities to all stakeholders.
The environment
In considering transactions, EDC examines environmental risk along with any other risk. EDC has developed its own environmental assessment procedure in consultation with Canadian exporters, environmental organizations and other stakeholders. This procedure will support EDC’s desire to conserve and enhance environmental quality and to advocate concern for the environmental impact of projects it supports in foreign jurisdictions. EDC will encourage best practices among those with whom it does business, with the aim of raising international environmental standards. EDC will strive for high standards of environmental conservation while ensuring that this does not unduly hinder EDC’s ability to support Canadian exporters to compete on a global scale.
Prohibitions against bribery and corruption
Basic criminal statutes of virtually all countries prohibit extortion and bribery. Under no circumstances will EDC, directly or indirectly, knowingly offer or give a bribe. Further, EDC will not support a transaction that involves the offer or giving of a bribe, and will exercise reasonable diligence and care not to support unknowingly such a transaction.
88
Human rights
EDC values human rights and promotes the protection of internationally recognized human rights, consistent with the policies of the Government of Canada. EDC recognizes the sovereignty of other national governments with respect to human rights and conducts business with them where doing so is consistent with the policies of the Government of Canada.
EDC employees, representatives and other stakeholders are entitled to have their dignity as human beings respected and to work in an environment free from intimidation, hostility or offensiveness. EDC is therefore committed to creating and maintaining a work and business environment that is free from harassment and discrimination on prohibited grounds. These prohibited grounds include age, race, colour, religion, creed, sex, nationality, ethnic or place of origin, citizenship, language, political belief, marital or family status, pregnancy, sexual orientation and disability.
Avoiding conflicts of interest
Employees and representatives of EDC have a duty to act in the best interests of EDC at all times. A conflict of interest arises when an employee must choose between EDC’s best interests and his/her own. The judgment of EDC employees and representatives must be, and must be seen to be, independent of any personal or financial interests that arise from business dealings, social ties, or other personal considerations.
EDC has adopted a Code of Conduct that requires employees and representatives of EDC to adhere to the highest standards of conduct with respect to conflicts of interest. Compliance with these standards is achieved through avoidance, disclosure, discontinuance or divestment.
Maintaining confidentiality of information
EDC will respect the privacy rights of its stakeholders, including their right to security of information. EDC will preserve confidential information in its possession, and use such information only for corporate purposes.
Some employees have access to sensitive or confidential information that, if released, could significantly harm EDC, its employees or other stakeholders. Therefore, employees and other representatives of EDC must use extreme care when handling such information. As a general rule, such information shall not be provided to EDC employees or representatives other than on a need-to-know basis or to anyone outside EDC who is not authorized or legally entitled to receive it.
89
Glossary of Financial Terms
Actuarial Gains and Losses — Changes in the value of the accrued benefit obligation and the plan assets resulting from actual results differing from those assumed or changes in an actuarial assumption.
Actuarial Valuation (re: Employee Benefits Plan) — An assessment of the financial status of a benefit plan performed by an independent actuary. It includes the valuation of any plan assets and the accrued benefit obligation using estimates of future events that will affect the costs and obligation for employee future benefits.
Basis Point — One one-hundredth of a percentage point.
Contingent Liability — Potential debt which may become an actual financial obligation if certain events occur or fail to occur. Contingent liability is also referred to as insurance policies and guarantees outstanding.
Credit Risk — Credit risk is the possibility that a loss may be incurred if a counterparty fails to meet its financial commitments.
Internal Efficiency Ratio — Gross administrative expenses expressed as a percentage of net revenue excluding debt relief.
Financial Sustainability Ratio — Adjusted operating income (operating income net of debt relief) as a percentage of the year’s average capital and allowances.
Foreign Exchange Risk — Foreign exchange risk is the possibility that a loss may result from exchange rate movements.
Gross Loans Receivable — Principal amounts outstanding, including any non-accrued capitalized interest, under existing loan agreements.
Hedge — A risk management practice used to manage interest rate or foreign exchange exposures arising from the normal course of business operations.
Impaired Loans — Loans that no longer have reasonable assurance of collection of interest and principal.
Interest Rate Risk — Interest rate risk is the potential impact on the Corporation due to changes in interest rates.
LIBOR — London Inter-Bank Offered Rate — The interest rate at which banks in London are prepared to lend funds to first-class banks.
Liquidity Risk — Liquidity risk is the chance that funds will not be available to meet the Corporation’s obligations.
Market Risk — Market risk is the likelihood of a loss to the Corporation as a result of possible movements in interest and foreign exchange rates.
Net Interest Income — The difference between the interest earned on assets and interest expense on borrowings.
Net Margin — Net interest income expressed as a percentage of average assets employed.
Net Revenue — Net income excluding the provision for credit losses and administrative expenses.
Off-Balance Sheet Financial Instrument — An asset or liability that is not recorded on the balance sheet, but has the potential to impact cash flows in the future if a contingent event occurs.
Operating Income — Net income excluding the provision for credit losses.
Operational Risk — Operational risk is the potential loss that may result from human error, internal control weaknesses and system deficiencies.
Projected Benefit Method Pro Rated on Services — An actuarial valuation method in which an equal portion of the total estimated future benefit is attributed to each year of service.
Projected Benefit Obligation — The actuarial present value of benefits attributed to employee services rendered to a particular date.
Return on Equity — Net income expressed as a percentage of shareholder’s equity.
Undisbursed Loan Commitments — A contractual amount under an existing loan agreement that has yet to be advanced to the borrower.
90
Corporate Offices
| | | | | | | |
Head Office
Export Development Canada
151 O’Connor Street
Ottawa, Canada
K1A 1K3
| | Winnipeg Office
Commodity Exchange Tower
Suite 2075
360 Main Street
Winnipeg, Manitoba
R3C 3Z3
| | Quebec City Office
Suite 1300
2875 Laurier Boulevard
Ste-Foy, Quebec
G1V 2M2
| | Brazil and Southern Cone
Av. das Nações Unidas 12901
Cenu Torre Norte, Andar 16
CEP 04578-000, São Paulo — SP
Brazil
|
| | | | | | | |
Tel.: (613) 598-2500
Fax: (613) 237-2690
| | Tel.: (204) 975-5090
Fax: (204) 975-5094
| | Tel.: (418) 266-6130
Fax: (418) 266-6131
| | Tel.: 011-5511-5509-4320, ext. 3320
Fax: 011-5511-5509-4275 |
| | | | | | | |
| Web site: www.edc.ca | | | | | | |
| | | | | | | |
Vancouver Office
Suite 1030, One Bentall Centre
505 Burrard Street, Box 58
Vancouver, British Columbia
V7X 1M5
| | London Office
Suite 1512
148 Fullarton Street
London, Ontario
N6A 5P3
| | Moncton Office
Suite 400
735 Main Street
Moncton, New Brunswick
E1C 1E5
| | China
c/o Canadian Embassy
19 Dongzhimenwai Street
Chaoyang District
Beijing, 100600
China |
| | | | | | | |
Tel.: (604) 638-6950
Fax: (604) 638-6955
| | Tel.: (519) 963-5400
Fax: (519) 963-5407
| | Tel.: (506) 851-6066
Fax: (506) 851-6406
| | Tel.: 86-10-6532-3536, ext. 3357
Fax: 86-10-6532-4072 |
| | | | | | | |
Edmonton Office
Suite 905
10010 — 106th Street
Edmonton, Alberta
T5J 3L8
| | Toronto Office
Suite 810
150 York Street
P.O. Box 810
Toronto, Ontario
M5H 3S5
| | Halifax Office
Purdy’s Wharf Tower II
Suite 1410
1969 Upper Water Street
Halifax, Nova Scotia
B3J 3R7
| | Mexico
Calle Schiller 529
Rincón del Bosque
Colonia Polanco
México, D.F. 11560
Mexico |
| | | | | | | |
Tel.: (780) 702-5233
Fax: (780) 702-5235
| | Tel.: (416) 640-7600
Fax: (416) 862-1267
| | Tel.: (902) 442-5205
Fax: (902) 442-5204
| | Tel.: 011-5255-5387-9316
Fax: 011-5255-5387-9317
|
| | | | | | | |
Calgary Office
Home Oil Tower
Suite 606
324 — 8th Avenue S.W.
Calgary, Alberta
T2P 2Z2
| | Montreal Office
Tour de la Bourse
Suite 4520
800 Victoria Square
P.O. Box 124
Montreal, Quebec
H4Z 1C3
| | St. John’s Office
90 O’Leary Avenue
St. John’s, Newfoundland
A1B 2C7
| | Edificio Kalos
Piso c-1, Local 108-A
Zaragoza 1300 Sur y Constitucion
64000 Monterrey, N.L. México
|
| | | | | | | |
Tel.: (403) 537-9800
Fax: (403) 537-9811
| | Tel.: (514) 908-9200
Fax: (514) 878-9891
| | Tel.: (709) 772-8808
Fax: (709) 772-8693
| | Tel.: 011-52-81-8344-3200, ext. 3360
Fax: 011-52-81-8340-7703 |
| | | | | | | |
| | | | | | | Poland
c/o Canadian Embassy
ul. Jana Matejki 1/5
00-481 Warsaw
Poland
|
| | | | | | | Tel.: 011-48-22-584-3240
Fax: 011-48-22-584-3277 |
ce document existe également en version française.

Printed in Canada on Canadian recycled and recyclable paper.
Vision
EDC will be the recognized leader in providing ground-breaking commercial financial solutions to companies of all sizes, helping them succeed in the global marketplace and create enduring prosperity for Canada.
Values
People
We are the heart and soul of EDC. Our diversity enriches us all. Each one of us deserves respect and makes a difference. Working together is fundamental to our success.
Excellence
We are responsible for excellence in everything we do. We believe in personal accountability and the power of challenging the status quo.
Passion
Initiative and enthusiasm characterize the way we work. We take satisfaction in the quality of what we do. We are here because we want to be here.
Learning
We believe that learning is an invigorating and continuous process. We seek out and embrace personal and professional development, and the invaluable lessons that come from experience.
www.edc.ca