EXHIBIT 3
ANNUAL REPORT 2005
It’s About Creating
Value for Canadian
Exporters and Investors
Canadian exporters, investors and their foreign customers face a stressful and rapidly changing environment, with little relief in sight. Under these conditions, EDC is improving its products and services to keep pace with their changing needs.
It’s about supporting Canadian exporters in the development of global supply chains.
It’s about helping Canadian companies penetrate emerging markets.
It’s about bringing buyers and sellers together.
It’s about ensuring Canadian exporters and investors have access to the financial resources they need.
PERFORMANCE HIGHLIGHTS
Corporate Profile
At EDC our mandate — to support and develop, directly or indirectly, Canada’s export trade and Canadian capacity to engage in that trade as well as respond to international business opportunities — guides everything we do.
This Makes us a partner in Canada’s international business development initiatives. EDC is a Crown corporation reporting to Parliament, and operating on commercial principles. We work in partnership with government and the private sector to enhance the visibility and success of Canadian companies abroad.
Our risk management strategies and treasury operations allow us to provide this support without relying on tax dollars. We raise funds by charging fees for our services and interest on our loans, as well as issuing debt in capital markets. These instruments represent the irrevocable full faith and credit obligation of the Canadian government.
This financial strength combined with innovative products, international networks, in-depth analysis of global economic conditions — sector by sector, country by country — helps us to focus on the needs and opportunities of Canadian exporters and investors.
2005 ACHIEVEMENTS
Observing the challenges faced by our customers and surveying the global export environment in which they operate, EDC accelerated the review of its products and services in 2005 to find better ways to serve Canadian exporters and investors. Highlights of EDC’s performance in 2005 include:
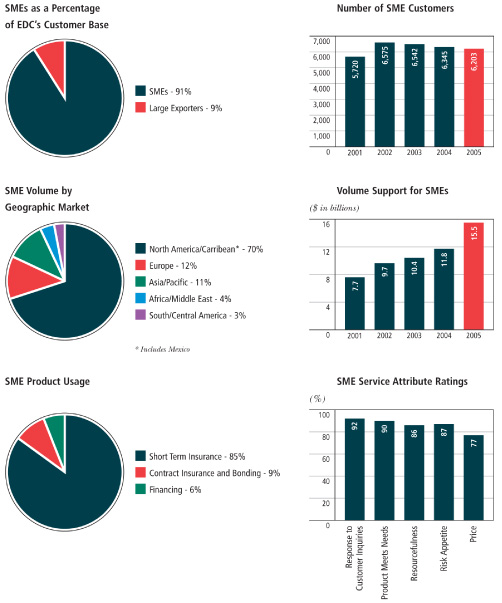
| • | | 6,828 customers served; 6,203 were small- and medium-sized exporters. |
| |
| • | | $57.4 billion in exports and international investments in 171 markets facilitated by EDC; approximately 12 per cent of Canada’s exports of goods and services. |
| |
| • | | $13.3 billion in exports and investments in 137 emerging markets; more than 30 per cent of Canada’s exports of goods and services to emerging markets. |
| |
| • | | $15.5 billion in exports and investments by small- and medium-sized exporters. |
| |
| • | | 37 per cent of Canada’s exports to Brazil, Russia, India, China and Mexico facilitated by EDC. |
| |
| • | | $1.29 billion net income. |
| |
| • | | $2.6 billion in new foreign direct investment facilitated by EDC. |
| |
| • | | $19.7 billion total assets. |
| |
| • | | 5th consecutive year that EDC was recognized as one of Canada’s Top 100 Employers, as reported in Maclean’s magazine. |
| |
| | |
|
It’s About More Than Exporting
2
PERFORMANCE HIGHLIGHTS
2005 Corporate Account Highlights
Five-Year Review Highlights
EDC Annual Report 2005
3
Highlights of EDC’s performance in 2005 include a record volume of export sales and foreign investments facilitated by EDC, record volume in emerging markets, and record volume achieved with private sector financial partners. But our customers’ challenges are greater than ever as they contend with global competition. That’s why EDC is improving its services — to ensure it continues to meet the rapidly changing needs of its customers.
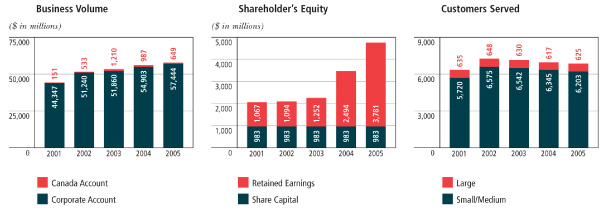
Canadian exporters and investors continued to benefit from a healthy global economy throughout most of 2005 despite the challenges posed by a high Canadian dollar and high energy prices. But the confidence of Canada’s exporters faltered towards year-end as Canadian companies began to feel the effects of a slowing world economy. In this environment, 6,828 Canadian companies turned to EDC for help with their exports and foreign investments. Collectively, they achieved $57.4 billion in export sales and international investments, a 4.6 per cent increase over 2004. This volume of business helped generate $37.4 billion of Canada’s GDP, or about 3.4 per cent of the country’s total GDP for 2005. Trade and investment facilitated by EDC was associated with sustaining more than 457,000 jobs, approximately 2.8 per cent of national employment.
I am very pleased with EDC’s performance in 2005. With a total of 2,300 new customers, we achieved an 11 per cent increase in customer acquisition spread across all product lines. Continued visits to our short-term insurance customers paid off handsomely with 90 per cent of them choosing to stay with EDC in 2005, a record retention rate. As exporters and investors ventured into emerging markets, EDC facilitated more activity, with volume of business growing by 15 per cent over 2004 to reach $13.3 billion. All product lines registered volume gains in emerging markets in 2005.
Our partnership volume, measuring the business we conduct with banks and sureties through our medium- and long-term financing and documentary credit insurance programs, reached a record $9.5 billion in 2005, 20 per cent more than 2004. When all EDC programs are considered, more than half of EDC’s total business volume is achieved in collaboration with Canadian and international financial institutions. A healthy financial environment and careful oversight of administrative expenses contributed to strong year-end results in our claims ratio, financial sustainability ratio and gross efficiency ratio.
Finally, EDC’s net income for 2005 is $1.29 billion. This is the second consecutive year EDC has reported a net income greater than $1 billion which, in both years, was due to a reduced loans portfolio as well as improved global credit conditions which resulted in a release of provisions for credit losses. This is not unusual and reflects the cyclical nature of economic and credit cycles, the fortunes of our customers and new business demands. Currently, EDC finds itself with capital beyond what we have traditionally needed as a cushion against the risks of our business. EDC will draw on this capital as it increases support for exporters and investors, particularly as they pursue opportunities in emerging markets in which risks are inherently greater.
It’s About More Than Exporting
4
Our business plan for 2006, strongly endorsed by our Board and our shareholder, sets forth our determination to do more for Canadian exporters and investors. We are resolved to connect better with exporters and investors, to leverage our capital, to facilitate integrative trade and expand our global market reach. Each of these objectives leads to a single goal: to do more business, with more Canadian companies, in more markets around the globe.
Connecting better with exporters and investors is about making sure we know all of our customers’ needs and help them in every way we can. We have implemented a reorganization that builds upon our industry-sector expertise to better integrate EDC’s core business lines and business development group. We will be leveraging our capital base to support transactions previously beyond the scope of our risk management framework. We will increase our support for foreign investments, recognizing that in an integrated global marketplace investments abroad are essential to the productivity and competitiveness of many Canadian companies.
And we will extend our global reach to increase support for business in Brazil, Russia, India, China and Mexico, and any emerging market where there is an opportunity for Canadians to succeed, while continuing to support growth in exports to established markets such as the United States. It’s an ambitious agenda, but an essential one to ensure EDC evolves in pace with the changing needs of our customers and becomes ever more relevant to their success.
In closing, I would like to offer a tribute to Gilles Ross, EDC’s Senior Vice-President of Legal Services and Secretary, who retired in February 2006 after 36 years with EDC, including a term as Acting President just prior to my appointment. I benefited tremendously from Gilles’ counsel during my first year at EDC and we will all sorely miss his wisdom and experience. Gilles was truly passionate about our mandate to help Canadian companies succeed internationally and his example inspires us all. We wish him all the best for his retirement and thank him for his dedicated service on behalf of Canadian exporters and investors.
Rob Wright
President and CEO
EDC Annual Report 2005
5
2005 was a busy year for EDC’s Board of Directors and for its senior management team. Amidst record results against several performance measures, the Corporation engaged a new President and CEO, initiated a significant reorganization to ensure it serves exporters and investors as effectively as possible, and enhanced its environmental and disclosure policies. I am satisfied that these activities and many other achievements discussed in this annual report demonstrate that EDC is effectively fulfilling its mandate to support Canadian exporters and investors. I am also satisfied that EDC is meeting the shareholder’s expectations such as they were conveyed to the Board by the Minister of International Trade in the fall of 2005.
It was in April 2005 that a new permanent President and CEO was appointed by the Canadian government on the recommendation of the Board of Directors and took over the leadership of EDC. I was very pleased to welcome Mr. Rob Wright to EDC to continue his distinguished career in public service. Mr. Wright assumed this responsibility from Mr. Gilles Ross, who served his seven-month term as Acting President with characteristic professionalism and efficiency. On behalf of the entire Board of Directors, I would also like to thank Mr. Ross for keeping EDC on course during a critical transition period, as well as for his 36 years of dedicated service to the Corporation.
EDC’s management team and the Board are seeking better alignment of EDC’s services and business units in order to help customers cope with the challenges of tomorrow. This is a top priority as Canada’s trade has become more than the export of hard goods between two countries. Canadians are competing against companies that have invested in global supply chains to bolster their productivity and sharpen their competitive edge. An increasing number of Canadian companies are making foreign direct investments to respond to this challenge, and it is critical for EDC to have the tools and the team to help all its customers succeed in a highly interconnected world.
EDC’s shareholder has given its full backing to EDC’s ambitious plan to connect better with exporters and investors; leverage its strong capital base; facilitate integrative trade and expand its global market reach. As more and more of our customers grasp the importance of ‘going global’ in order to stand up to their competitors, EDC must continue to adapt its services and in-market support to meet their rapidly changing needs. The Board was very active in shaping and approving EDC’s Corporate Plan, the primary vehicle for communicating the Corporation’s strategy to the shareholder and in ensuring it was aligned with the shareholder’s international commerce priorities. Overseeing the realization of this plan will be top of mind for EDC’s Board of Directors in 2006.
It’s About More Than Exporting
6
The Board is well positioned to ensure that EDC fulfills its mandate. It is geographically diverse; it represents a broad scope of private and public sector expertise; and it is representative of the men and women who lead Canadian companies of all sizes. As well, it is a team of individuals devoted to rigorous governance, willing to improve its practices to ensure it does an even better job of overseeing EDC’s management and performance. Last year, the Board surveyed its members on governance issues and this survey revealed strong results, but also identified areas for improvement. The Board will act on recommendations based on this survey to ensure its practices continue to evolve in step with best practices for Canada’s Crown corporations.
I would like to take the opportunity to thank the directors who will prolong their valuable service to the Board, to support the oversight of EDC’s business plan in 2006. As well, I would like to acknowledge those who have left the Board over the past year and whose contributions will serve us long into the future: Pierre MacDonald; Rayburn Doucett; James Pattillo, Robert Holt and Paul Boothe. Finally, the Board welcomes incoming Board members Rob Wright, President and CEO of EDC, David Unruh of British Columbia, Marcella Szel of Alberta, Irene So of Ontario, Lise Lachapelle of Quebec and Jocelyne Landry from New Brunswick, each of whom reinforces the regional and technical character of our Board.
Finally, I wish to congratulate, on behalf of the Board, the EDC management team for helping EDC achieve recognition as one of Canada’s 100 Best Employers for the fifth consecutive year. It should be noted that the enthusiasm, professionalism and esprit de corps of EDC employees was instrumental in receiving this noteworthy distinction.
As global economic performance continues to moderate, we predict new challenges for Canada’s exporters and investors. The Board of Directors, the Management Team and the employees of EDC are confident that the right steps are being taken to give EDC customers the tools to keep succeeding in an ever-changing global marketplace. We are jointly focused on the influential role of foreign direct investment on the productivity and competitiveness of Canadian companies, and the Board of Directors will give its full support to EDC’s efforts to help Canadians make the best investments in their future.
Paul Gobeil
Chariperson
EDC Annual Report 2005
7
Canadian exporters and investors had a good year in 2005, despite starting on a pessimistic note related to rising interest rates and an appreciating Canadian dollar. The global economic and financial environment is forecast to be less supportive in 2006, leading to more moderate growth in Canada’s exports.
Canadian exports grew by almost six per cent in 2005, driven by a strong world economy. Global economic growth was 4.4 per cent, down from 2004 but still well above trend. The expansion exceeded economists’ expectations in a number of countries, including the United States, Japan, China, India and Russia.
This growth was not shared equally among Canada’s export sectors. Leading the way were energy, metals, chemicals and plastics, as well as rail and telecommunications equipment. On the other side of the ledger, Canadian exports of forestry products, and consumer goods and services were weaker than expected.
Overall, Canada’s exports have momentum heading into 2006. Even so, many would simply note that export growth has been mostly about energy, because of high oil and gas prices. Indeed, something like 80 per cent of the year’s growth came from this source. But looking beneath this, and correcting for price fluctuations, reveals an entirely different story. After adjusting for price increases, it turns out that exporters saw growth of 3.6 per cent in 2005, a respectable number. And, virtually none of this growth was due to increased shipments of energy. In fact, 80 per cent of the growth in export shipments came from machinery and equipment and the auto sector. This is very surprising in light of the dollar’s big increase.
ADAPTING TO A HIGHER CANADIAN DOLLAR
Canada’s export sales demonstrated surprising resiliency in 2005 in the face of the strong Canadian dollar. The most important reason for this was growing demand from consumers in the United States and overseas countries for Canadian goods and services. Rising foreign demand translates into higher utilization of a company’s plants and equipment. This translates into higher productivity and lower costs, which helps companies deal with tougher foreign competition.
Strong global demand also boosted prices for a wide range of Canadian resource exports. For exporters of oil or zinc, for example, the rise in U.S. dollar prices has far exceeded the rise in the Canadian dollar, thereby boosting revenues significantly. Furthermore, increased globalization has enabled Canadian companies to import a rising share of the inputs used in their production processes. A strong Canadian dollar means that these imported inputs cost less, which helps enhance the competitiveness of exported goods. A soaring currency also helps in another way -by reducing the cost of imported machinery and equipment, the strong dollar makes it easier for companies to lower production costs and boost their productivity.
It’s About More Than Exporting
8
2006: YEAR OF THE DOWNGRADE
We expect global economic growth to continue to moderate through 2006, averaging 4.2 per cent, and a further gradual easing is in store for 2007.
Two factors are driving this slower rate of growth. First, central banks are expected to continue raising interest rates — and therefore dampen consumer spending and business investment — to pre-empt any inflationary pressures. Second, sustained high energy prices will see the continued transfer of purchasing power to the energy sector from all other sectors of the global economy.
This moderation in economic growth will be accompanied by softer gains in corporate earnings worldwide, outside of the energy sector. Slower economic growth and higher interest rates will also make debt service more difficult for highly indebted countries, and a busy global electoral calendar will bring these issues into sharper focus for investors. In these circumstances, we expect a general repricing of risk around the world, with interest rate spreads widening for both emerging market bonds and corporate bonds. The global credit cycle has peaked, along with the economic cycle, and during the next 12 to 18 months credit downgrades are expected to outnumber upgrades by a wide margin.
In this context, Canada’s export sales are forecast to ease back to growth of around 3 per cent in 2006, interest rates will rise a little further, and the Canadian dollar should ease back to around U.S. 82 cents by year end. Although down from early 2006 levels, this is still a lofty height, reflecting our dollar’s evolution to a petrocurrency. It would require oil prices in the USD 50 range or lower to cause the dollar to ease back below 80 cents.
High commodity prices will continue to power exports of energy and various other resource-based goods. However, those elevated commodity prices will keep the dollar high, putting additional competitive stress on the manufacturing sector. The manufacturing sub-sectors that are feeling these stresses the most include forestry products, consumer goods, appliances, furniture, textiles and clothing. Other manufacturers have been able to grow their export sales despite these competitive pressures by using the strong dollar to invest in new equipment and to build out global supply chains. Telecom equipment, chemicals, plastics, industrial machinery, aerospace components, heavy-duty trucks and pharmaceuticals have shown particular success in growing their exports.
THE BOTTOM LINE?
Canadian exporters and their foreign customers will find themselves in an increasingly stressful economic and financial environment in 2006. EDC has the tools and the balance sheet to meet the evolving needs of Canadian exporters and investors as they try to cope with an increasingly demanding global marketplace.
Stephen Poloz
Senior Vice-President, Corporate Affairs and Chief Economist
EDC Annual Report 2005
9
CUSTOMER PROFILE
Martinrea
International Inc.
Headquartered in Vaughan, Ontario, Martinrea supplies parts, systems and assemblies to original equipment manufacturers (OEMs) such as General Motors, Ford and DaimlerChrysler, and has facilities in Canada, Mexico, the United Kingdom and the United States.
Martinrea International has been a global company right from the start, and the payoffs have been startling. Since its inception in late 2001, Martinrea has evolved into one of the world’s fastest-growing auto parts companies, with annual revenues in excess of $600 million and a staff of more than 3,000 people worldwide, more than half of which are based in Canada.
It’s About More Than Exporting
10
“Financial strength is critical to compete successfully.”
The year 2002 was pivotal for Martinrea with the acquisition of Rea international and Pilot Industries, which had operations in North America, Mexico, Europe and the United Kingdom. The company has since built another Mexican plant and taken over a new one in Indiana. “These international acquisitions are a testament to Martinrea’s prudent, profitable growth strategy,” says EDC Financial Services Manager, Alison Nankivell.
Martinrea is confident about increasing its revenue and profits over time through further foreign investment. “Our customers are moving to global platforms and more commonality of product,” says Rob Wildeboer, Martinrea’s Executive Chairman. “We plan to take advantage of these trends by either establishing a local presence when appropriate, or teaming up with local partners.” Sales outside of Canada currently account for more than half of Martinrea’s business.
Maintaining close proximity between the finished products and the client is a crucial aspect of the company’s business strategy. “Automotive is a “just in time” industry,” explains Wildeboer. “Our facilities in the United States and Mexico help us to better serve our customers and keep our competitive edge. GM, for instance, has operations in many regions. Without our international presence, we may not get the job.”
“The markets for our products and services are highly competitive and rapidly changing,” adds Wildeboer, “so financial strength is critical to compete successfully. In this respect, EDC’s Tooling Buildout Facility (TBF) has been key in allowing us to finance our growth.” Because OEMs in the automotive sector no longer provide progress payments for tooling — which includes tools such as dies, jigs, fixtures, gauges, moulds, and robotics — parts suppliers and their tool shops often face financial difficulty during the buildout period. EDC consequently developed the TBF to provide a funding vehicle to support the production of Canadian-sourced tooling for the benefit of both the parts maker and their tooling suppliers. The latter obtain working capital through progress payments from EDC during the build period, which is repaid once Production Part Approval Process is achieved. The benefits to parts suppliers such as Martinrea include an improved relationship with their toolers, reduced financing costs for the tooling and ultimately a stronger supply base.
Martinrea first approached EDC in 2003 to inquire about its TBF program. Since then, the relationship has become an important factor in the company’s growth. “This program has been extremely beneficial for us,” says Wildeboer. “Instead of tying up our operating cash in tooling payments, we can use it to fund our expansion. Furthermore, EDC’s rate is very competitive and we don’t have to negotiate as much with our suppliers. This program will continue to help us go forward.”
Among its international achievements, Martinrea was named Supplier of the Year by GM and received a Gold World Excellence Award from Ford Motor Company. Most recently, the company won a contract to supply GM with a new engine cradle and rear cross member modules, against stiff international competition from major industry players.
EDC Annual Report 2005
11
CUSTOMER PROFILE
Dessau-Soprin
For Montreal-based Dessau-Soprin, providing clients with a full package of solutions, including financing, is a basic business strategy. The company credits much of its success over the years to EDC services. Without them, several of its major projects in developing countries just wouldn’t have happened.
Dessau-Soprin first entered the international arena with its feasibility and engineering studies in the early 1970s. Today, the Montreal-based firm carries out capital projects worldwide and exports more than 20 per cent of its products and services, mainly to Latin America, the Caribbean and North Africa.
It’s About More Than Exporting
12
Dessau-Soprin plans to be even more aggressive
in its exporting ventures in the coming years,
in collaboration with EDC.
Canadian know-how is playing an important role in infrastructure projects that improve the daily life of people in many developing countries. As a prime example, Dessau-Soprin —one of Canada’s largest engineering and construction firms — implements projects that open up remote areas, supply water and electricity, and create optimum conditions for economic development, while making the environment a top priority.
“Overseas markets enable us to leverage our expertise and present great potential for growth,” says President Jean-Pierre Sauriol. According to Sauriol, a key factor in the company’s international success is its one-stop-shop capabilities, in which EDC’s involvement is critical. “Developing countries look to Canadian companies for integrated solutions for their projects,” explains Sauriol. “We offer them everything from A to Z, from feasibility studies to delivering the solution and coordinating and putting in place the financing. That is why EDC is so important. If we couldn’t expedite the financing, our clients would struggle. When we offer them the full package, it closes the loop, allowing them to proceed with the project.”
EDC is playing a pivotal role, for example, in Dessau-Soprin’s ongoing projects in the Dominican Republic, where mini hydro plants are being built to deliver energy to rural communities. By transforming water energy from existing irrigation systems into hydro electricity, some villages are gaining power for the first time. In a poor section of the capital city of Santo Domingo where flooding has caused many deaths, Dessau-Soprin is reconstructing canals and building roads.
In these and many other undertakings, EDC has done much more than boost Dessau-Soprin’s sales through buyer financing. It has also freed up corporate working capital, provided loan guarantees, supported the firm’s bonding needs and supplied valuable intelligence on local regulations and buyers. As part of the firm’s comprehensive package of services to clients, EDC guarantees a large portion of loans from international banks in developing countries and provides accounts receivable insurance to Canadian suppliers. EDC has also supplied Dessau-Soprin with bonding insurance, and, in countries such as Algeria, with insurance on letters of credit.
Other international projects currently underway — most of them with EDC involvement —are a highway in Trinidad & Tobago; a water treatment plant in Venezuela; and transportation infrastructure in Algeria including railroads and a ring road around Algiers. In September 2005, Dessau-Soprin secured a major contract for supervising the construction of a 230-KV power transmission line over a distance of more than 1,800 km from Guatemala to Panama.
Dessau-Soprin plans to be even more aggressive in its exporting ventures in the coming years, in collaboration with EDC. “It costs a lot of money to develop these markets and we need to be very selective about where to invest,” says Sauriol. “Knowing EDC is behind us is crucial to our long-term strategy. We are now looking into other countries in Central America and are consulting with EDC. They make us more efficient.”
EDC Annual Report 2005
13
CUSTOMER PROFILE
Terralog
Technologies Inc.
All over the world, governments, industries and the public are becoming acutely aware of the importance of managing waste in environmentally responsible ways. Regulatory pressures are increasing and, for oil producers, this means finding new solutions for an old problem: the disposal of heavy-oil wastes.
In Terralog’s Slurry Fracture Injection (SFI) technology, the waste material is slurried (mixed) with a stream of water at as high a waste concentration as possible. Then it’s pumped down a waste disposal well at high rates and pressures, with the whole operation being intensively monitored to ensure effective process control. This process provides greater environmental security than alternative surface pit or landfill disposal, and at a much lower cost than off-site transport and disposal options.
It’s About More Than Exporting
14
“Financing such a project in Indonesia was
considered a very high risk by traditional
creditors at the time.”
As it turns out, Terralog Technologies Inc. of Calgary, Alberta has just the solution these oil producers need: Slurry Fraction Injection™ (SFI)™ technology — a permanent, environmentally-friendly way of disposing of various types of waste.
SFI was successfully developed and tested in 1994, and was first applied commercially in western Canada in 1995. In SFI, the wastes are mixed with water to form a slurry, which is then pumped down a well that is typically more than 300 metres deep. The technology eliminates the need for surface disposal of the wastes in landfills or lagoons, because it provides “zero discharge,” meaning that the waste has no contact with ground water, surface soils or the atmosphere. Moreover, SFI reduces greenhouse gas emissions and can be used year-round, no matter what the local climate.
Most of Terralog’s work is with the petroleum industry, where SFI is especially effective for disposing of wastes such as produced solids, oily viscous fluids and sludges, drill cuttings and fluids, tank bottoms and naturally-occurring radioactive materials.
The intersection of Terralog’s SFI technology with the increasing global need for clean waste disposal has spelled success for the company, which now has a subsidiary in the United States and an operating project in Indonesia. Terralog provides a full range of SFI services and products, including feasibility studies and regulatory support, project design and implementation. Ever since its first commercial application in 1995, Terralog’s technology has been in increasing demand, and the company got its first international exposure with the remediation of an urban oilfield in California in 1998.
But in 2001, when Terralog won a large contract to provide SFI for Chevron Pacific Indonesia’s vast Duri oilfield in Sumatra, things started to get difficult. That was when EDC entered the picture.
“EDC played a pivotal role in helping us set up the Duri project,” says Terralog’s President, Roman Bilak. “Financing such a project in Indonesia was considered a very high risk by traditional creditors at the time, and we were having a lot of trouble putting together the financing requirements. Fortunately, EDC came through for us. We used their Pre-Shipment Financing to give us the working capital to build the equipment for Duri, and their Political Risk Insurance to cover us against potential problems like political violence, expropriation or the inability to repatriate funds.”
With full SFI operations starting in late 2002, the Duri project is the world’s largest deep-well facility for disposing of oil-production wastes: to date, Terralog has used SFI to dispose of 327,000 cubic metres of waste and 1.15 million cubic metres of production water. Now, with its technology conclusively proven in the field, Terralog is developing further projects in its core markets, the Middle East and the Asia-Pacific region, including Kuwait, Saudi Arabia, the United Arab Emirates and Singapore. And in these places too, says Bilak, Terralog will be using EDC’s services to help the company build on its success.
EDC Annual Report 2005
15
CUSTOMER PROFILE
ArtFX
They’re a familiar sight in shopping malls throughout Canada and the United States — those kiosks and booths that sell everything from decorator candles to satellite TV services. They’re called retail merchandising units (RMUs), and many of them are the products of a creative and energetic Canadian company called ArtFX.
Founded in 1988 and based in Moncton, New Brunswick, ArtFX didn’t begin as an RMU business but as a supplier of seasonal decor to malls in Atlantic Canada. The company did well in the region, but it wasn’t until 1999 that its founder and President, Annette Bourque, decided that ArtFX had a good chance of success on a much larger scale than the Maritimes.
It’s About More Than Exporting
16
At the same time, the sheer size and competitiveness
of the U.S. market was a big challenge to a Canadian
company with only 35 employees.
Export deals now account for about 70 per cent of ArtFX’s average annual sales, so it’s clear that the company’s tight focus on the U.S. is continuing to pay off. One result of this expansion has been that ArtFX’s RMUs, originally intended to smooth out the company’s seasonal operations, have become its core product. And as of December 2005, the firm said goodbye to the seasonal decor business.
Would Bourque recommend EDC to other small enterprises like ArtFX? “Absolutely,” she says. “Whenever we can, we let people know what EDC has done for us. I think there are a lot of companies that don’t take advantage of EDC as much as they could, and we’d definitely encourage them to do so.”
“In 1988,” says Bourque, “we realized that we needed a product that wasn’t as seasonal as our décor business. It also had to be something we could market to the shopping centre industry, which we knew well, and which knew us. We’d built a few RMUs in the late 1980s, so we decided to look at that market again. We designed some prototypes for a trade show, and it turned out that the industry was ready for a new player — us.”
Bourque concluded that exporting to the United States was an obvious move, given that many American states — Florida for example — have more shopping centres than all of Canada. At the same time, the sheer size and competitiveness of the U.S. market was a big challenge to a Canadian company with only 35 employees. Nevertheless, since it began exporting, ArtFX has proven itself in no uncertain terms. In 2003, for example, it won out over six American companies for a very large contract to provide RMUs for the new Philadelphia International Airport.
It was also in 2003 that the relationship between ArtFX and EDC began to take shape. “We’d already been in touch with EDC to find out what they could offer us,” says Bourque. “That turned out to be fortunate, because when the big Philadelphia Airport contract came along, we were working on another U.S. mall project as well. We used EDC’s Contract Frustration Insurance to protect ourselves from potential contract difficulties in both projects, and we also tapped into EDC’s Pre-Shipment Financing services for the extra working capital we needed for Philadelphia.”
The company has been growing ever since, and is now working on two major projects for large developers in New York and Orlando. With multi-million-dollar contracts like these, notes Bourque, knowing that ArtFX has the option of EDC support is a great comfort. “Being able to insure our contracts and obtain additional working capital is a fantastic service for a small company like ours,” she says. “It helps eliminate our concerns about potential non-payment, and gives us the confidence to go after some very big export deals.”
EDC Annual Report 2005
17
PARTNER PROFILE
Scotiabank and EDC:
An Enduring Partnership
Scotiabank s international network of branches and subsidiaries provides trade services to more than 80 world markets. And for more than 40 years, Scotiabank and EDC have been working together to help Canadian exporters gain the competitive advantage that’s crucial to global success.
EDC and Scotiabank subsidiaries in Mexico, El Salvador, Trinidad and Tobago, Jamaica, Chile and Peru also work together to provide medium-term financing to importers of Canadian capital equipment. The Americas Capital Equipment Purchase (ACE) Program, a joint Scotiabank-EDC initiative, provides a simple export financing solution for Canadian exporters with capital equipment contracts of USD 5 million or less.
(left to right) Bala Naidoo, Senior Manager Trade Finance, ScotiaBank; Michael Harkins, Financial Services Manager, Financial Institutions, EDC; Richard McCorkindale, Senior Manager Trade Finance, ScotiaBank.
It’s About More Than Exporting
18
EDC has partnered very actively with Scotiabank
during this time, providing a complementary range
of instruments that help the bank leverage its financial
services and products to meet customer demand.
Scotiabank’s widespread network is a major reason for its leadership in trade finance, but it’s not the only one. The bank also brings to its customers its record of being Canada’s most international bank, its enormous on-the-ground expertise in foreign trade, and its highly experienced relationship managers. In recognition of this, Global Finance Magazine in 2006, named Scotiabank as Canada’s “Best Trade Finance Bank” and Scotia Capital as the country’s “Best Foreign Exchange Bank.”
These strengths allow Scotiabank to help exporters reduce risk, and secure the credit lines and other types of support they need to obtain working capital. In the area of letters of credit (LCs), Scotiabank helps exporters ensure that LCs are correctly prepared and presented, and provides its new “Tradexpress Elite” technology to increase the speed and efficiency of LC paper flow. The bank’s international experience also helps it identify foreign financial institutions that might present unacceptable risks to an exporter.
For the past several years, the need for export support has been growing rapidly because of Canada’s increased international trade. EDC has partnered very actively with Scotiabank during this time, providing a complementary range of instruments that help the bank leverage its financial services and products to meet customer demand. For example, EDC’s Documentary Credit Insurance Policy (DCIP) covers political and sovereign risk, as well as risks for banks that deal with exporters purely on an LC basis. Other EDC products help mitigate the risk of non-payment in overseas markets and offer the bank the security it requires to increase working-capital credit lines.
Such EDC support, combined with Scotiabank’s trade expertise and its worldwide financial services, has significantly increased the bank’s ability to meet the needs of its customer base. Because the bank is accustomed to exposure to foreign financial institutions, it can work with EDC to expand such exposure and support further transactions. This adds financial capacity to the market and helps Canadian exporters complete more deals.
With the increase in trade, exporters are also becoming more innovative about their financing methods and risk management. To accommodate this, Scotiabank and EDC have developed the new Foreign Banks Obligation Policy. While it resembles the DCIP, it’s more flexible and can be used in a wider range of transactions, and will help the bank support its customers as they shift from traditional LCs toward more complex export structures.
Scotiabank is also a major corporate and commercial lender, and its international network actively markets EDC’s medium-term guarantee program to potential borrowers to encourage purchases of Canadian capital equipment. Moreover, because of its international presence, Scotiabank is well positioned to provide down-payment financing, local-cost financing and local-currency financing to complement the export credits provided by EDC’s medium-term guarantees.
In short, the partnership of Scotiabank and EDC is a manifest success. It’s allowing the bank to support exporters more aggressively as they enter the world’s more volatile markets, and is helping them prosper there. And that’s good for everybody — for our exporters, for Scotiabank, for EDC, and for Canada.
EDC Annual Report 2005
19
OPERATING PRINCIPLES
Operating Principles
Every successful company lives by its core principles. These principles guide the company’s strategic direction and goals. EDC’s framework is built on three fundamental principles: EDC is committed to conducting its business in a way that is respectful of Canada’s international agreements, is consistent with its Corporate Social Responsibility commitments and ensures sound financial management.
Respecting International Agreements
EDC supports business in more than 170 markets on terms that are consistent with and respectful of Canada’s international obligations. These include the World Trade Organization (WTO) Agreement on Subsidies and Countervailing Measures (ASCM) and the Organization for Economic Co-operation and Development’s (OECD) Arrangement on Officially Supported Export Credits (OECD Arrangement).
The WTO and its related agreements, including the ASCM, spell out principles for trade liberalization. These principles include individual countries’ commitments to lower custom tariffs and other trade barriers; as well as outlining procedures for settling disputes. The purpose of the OECD Arrangement is to eliminate trade distortions among the world’s most industrialized nations, such as export credit subsidies and trade-related aid. In 2005, EDC actively encouraged the introduction of changes to the OECD Arrangement to make progress towards pricing to risk and to market.
The Corporation also engaged in the review of the OECD Sector Understanding on Export Credits for Civil Aircraft. The objective of these discussions is to modernize the text of the agreement, which was originally drafted in 1992. The major country producers of aircraft, including Brazil which was not originally a party to this agreement and is now a major player in this sector, are involved in these discussions.
EDC was also instrumental in the adoption of a new OECD Sector Understanding for renewable energy projects, which now also applies to hydro-power projects. This agreement will promote the use of renewable energies and water projects by allowing extended repayment terms of up to 15 years for projects in these sectors.
EDC also participates in the review of the OECD Action Statement on Bribery in Officially Supported Export Credits which is currently underway and which aims to strengthen international efforts to combat bribery in export contracts. These efforts support Canada’s commitment to combat bribery in international transactions as provided for under the OECD’s 1997 Convention on Combating Bribery of Foreign Public Officials in International Transactions.
EDC also contributes to Canada’s participation in WTO discussions on agriculture with particular focus on export credits.
Canada has, as per its obligations under the United Nations Security Council Resolution against terrorism, enacted legislation, the United Nations Suppression of Terrorism Regulations, which criminalizes the perpetration of terrorist acts and the provision of financing and related services to individuals or entities suspected of being involved in terrorist activity. The Corporation has implemented processes to ensure that it does not transact business with individuals or entities listed in such Regulation as well as in the Anti-Terrorism Act.
EDC is also a member of the Berne Union, whose mandate is to foster international acceptance of sound principles of export credit insurance and foreign investment insurance among the 52 members. EDC is one of the largest members of the Berne Union and actively participates in the various activities of the association.
It’s About More Than Exporting
20
Corporate Social Responsibility
EDC is committed to conducting business in a socially responsible manner consistent with its corporate values. EDC’s Statement of Commitment on Corporate Social Responsibility (CSR) incorporates the operating principles for its conduct in relation to business ethics, transparency, the environment, the community and its employees.
CONDUCT AND ETHICS
EDC’s Code of Business Ethics and Code of Conduct guide the actions of EDC and its employees, officers and directors to ensure they continue to live up to EDC’s global reputation as an ethical organization. The codes define EDC’s commitment to legal and ethical conduct, the environment, prohibitions against bribery and corruption, human rights, avoiding conflicts of interest and maintaining confidentiality of information. The Code of Business Ethics is available at www.edc.ca/ethics and the Code of Conduct is available at www.edc.ca/conduct.
EDC’s Code of Conduct rejects standards of conduct to which employees and management are continually attentive. Employees are required to sign an annual Statement of Compliance indicating their understanding and commitment to abide by EDC’s Code of Conduct.
In 2005, EDC developed a Disclosure of Wrongdoings policy to enhance existing mechanisms that support reporting and response to wrongdoing in the Corporation, including serious violations of the Code of Conduct. The policy, implemented in the first quarter of 2006, states that employees have a duty to report any suspected or potential wrongdoing, while affirming that they can do so confidentially without fear of reprisal and that, where appropriate, their report will be investigated and dealt with by EDC. Responding to reports of wrongdoings is the responsibility of EDC’s Compliance Officer.
The role of EDC’s Compliance Officer is to enhance existing transparency and accountability practices in areas such as public disclosure of information, environmental reviews, human rights and business ethics. The Compliance Officer is responsible for responding to wrongdoings reported internally under the Disclosure of Wrongdoings policy, as well as complaints made by third parties, including EDC customers, public interest organizations or other members of the public. The Compliance Officer provides a centralized function for receipt and review of complaints, independent from EDC management. More information on the role of the Compliance Officer is available at www.edc.ca/compliance.
EDC continued to train employees on its Anti-Corruption Program and to inform customers of its policies and obligations, including a requirement that customers submit anti-corruption declarations and/or accept relevant representations and covenants in appropriate documentation. A total of 1,404 Anti-Corruption brochures were delivered to new customers, to inform them of relevant legal requirements of conducting business outside of Canada. Furthermore, in 2005, EDC worked towards enhancing its internal systems to improve its monitoring of due diligence undertaken in connection with its Anti-Corruption Program.
EDC Annual Report 2005
21
OPERATING PRINCIPLES
THE ENVIRONMENT AND TRANSPARENCY
Canadian companies that operate abroad have established a reputation for conducting business in a fair, open and responsible manner. As a partner that facilitates international business for Canadian companies, EDC shares responsibility for, and seeks through its operating principles and policies, to maintain and enhance that reputation.
EDC’s environmental responsibility includes the EnviroExports initiative supporting the export of Canadian goods and services for remediating environmental problems and developing new clean technologies. In 2005, EDC facilitated $1.24 billion in export sales under this program.
In 2005, EDC announced an updated and strengthened environmental policy framework, including the introduction of an umbrella Environmental Policy and amendments to its Environmental Review Directive (ERD) and Disclosure Policy following a public comment period. The policy review was initiated to reflect changes to the OECD Common Approaches on Environment and Officially Supported Export Credits, recommendations from the Office of the Auditor General in its 2004 examination of EDC’s environmental practices; and EDC’s implementation experience since 2001. These amendments will ensure that EDC customers have more clarity and predictability about EDC’s environmental expectations and requirements for the business it is asked to support.
Key changes to environmental practices include:
| • | | the adoption of a new Environmental Policy extending the principles of sound environmental management to the entirety of EDC’s business activities; and |
| |
| • | | amendments to the ERD that clarify how and when it is implemented, including benchmarking project categorizations against the practices used by other international financial institutions and export credit agencies; applying the same environmental review process used for projects in the U.S. and Canada to projects located in all G7 countries; and, excluding credit facilities used for non-project-related procurement or investment from the ERD. |
These policies and the comments received during the public comment period are available at www.edc.ca/public_comment.
| | | Key Disclosure Policy changes include: |
| |
| • | | a requirement that project sponsors provide environmental information 30 days before signing for projects in countries outside the G7. EDC reserves the right to waive the 30-day requirement, but will publicly disclose the explanation justifying any exemptions; |
| |
| • | | publication of the environmental standards used in EDC’s review of environmental information; and |
| |
| • | | narrowing the dollar ranges when reporting the volume of an individual transaction. |
EDC’s website has been updated to reflect the changes introduced by the new Disclosure Policy at www.edc.ca/disclosure.
It’s About More Than Exporting
22
OPERATING PRINCIPLES
REPORTING EDC’S CSR EFFORTS
In 2005, EDC produced its first ever CSR Report, available at www.edc.ca/csr. The central feature of the report was the introduction of performance measures against which EDC will measure the fulfillment of its commitment to CSR. EDC’s performance against these measures will be reported in the 2006 CSR Report.
EDC activities related to its environmental commitments, including projects reviewed under the ERD, are reported in the Chief Environmental Advisor’s annual report available at www.edc.ca/environment.
EDC also seeks opportunities to discuss its experiences on CSR issues with peers. For example, at the Inter-American Development Bank-organized CSRAmericas conference held in Santiago, Chile, EDC participated on an international markets panel outlining what export credit agencies are doing to promote responsible trade through enhanced environmental review practices. EDC also participated in a course on managing social and environmental risk in the mineral exploration sector as part of the annual convention of the Prospectors and Developers Association of Canada.
THE COMMUNITY
EDC’s Education and Youth Employment (EYE) Strategy enables EDC to connect to tomorrow’s business leaders by supporting education and employment opportunities related to international trade for Canadian students. In partnership with Canadian educational institutions and other associations such as AIESEC and the Forum for International Trade Training, the EYE Strategy encourages studies in international business in order to build a more trade-focused next generation of business leaders.
In 2005, EDC celebrated the 5th anniversary of the EYE Strategy. Since its inception, 140 scholarships have been awarded and 325 work terms at EDC were provided to Canadian students.
An integral part of the EYE Strategy’s outreach activities is the Speaker’s Series, designed to transfer knowledge of EDC expertise through in-class presentations in the areas of international trade, corporate social responsibility and political risk. In 2005, Canadian students and faculty benefited from 93 presentations by EDC employees. More information about the EYE Strategy is available at www.edc.ca/youth.
EDC employees continue to make a contribution to local and national communities. EDC supported employee efforts to organize the Government of Canada Workplace Charitable Campaign which raised $167,477 dollars — a record year. Employees also participated in the United Way Day of Caring™ where more than 100 EDC employees participated in local community development activities.
EDC’s Employee Volunteer Charitable Donations Policy represents a central pillar of EDC’s support for the community. Under this policy, donations are made to eligible charities where EDC employees volunteer. In 2005, more than 15 organizations ranging from Médecins sans frontières to the Canadian National Institute for the Blind, received contributions.
EDC Annual Report 2005
23
OPERATING PRINCIPLES
OUR PEOPLE
| | | | | | | | | | | | | | | |
| Measure | | 2005 plan | | | | 2005 results | | | | 2006 plan | |
| | | | | | | |
Voluntary turnover rate | | | < 8.0 | % | | | | 5.8 | % | | | | 7.5 | % |
| | | | | | | |
Average number of training days per employee | | | 5.0 | | | | 6.83 | | | | 5.0 |
| | | | | | | |
Rank above high performing organizations in EDC’s employee survey | | Achieve | | | Not achieved | | | | n/a* |
| | | | | | | |
| | |
| * | | EDC’s employee survey is conducted on a biennial basis |
EDC’s commitment to being a responsible corporate citizen extends to its employees.
The Corporation strives to have the right people available and trained to serve EDC customers, and to provide a climate that stimulates and supports employee performance and development. These efforts are measured through internal indicators such as voluntary employee turnover, learning and development programming and employee opinion.
A total of 6,848 training days were delivered in 2005, for an average of 6.83 days per employee. Much of this training is technical or product knowledge based and requires the support of many EDC employee-experts. Serving customers in the official language of their choice is a priority and to this end, 25 per cent of overall training activity is dedicated to official languages training. In 2003, EDC set an objective to achieve a corporate bilingualism level of 60 per cent by 2008. While this level was achieved by year end 2005, official languages training remains a priority for EDC. The Corporation will continue with its approach of setting personalized language training goals and systematic assessments of employee capacity in both official languages to further its overall bilingual capacity.
While EDC did not achieve a ranking above high performing organizations on its 2005 Employee Opinion Survey, overall results remain above the North American norm as calculated by the Hay Group. EDC employees show a high level of pride and a deep commitment to the mandate and our customers. In this survey, 88 per cent of employees responded favourably to the question, “I feel proud to work for EDC.” And 100 per cent of respondents indicated that it was important to them to work for an organization that contributes to the public good.
Areas for improvement identified in the survey include communication, performance management, customer focus and innovation, and decision making. Detailed survey results were compiled for each EDC team and communicated to senior leaders in late 2005. A number of 2005 and 2006 corporate priorities respond directly to issues raised by employees in this survey. These include enhancements to EDC’s performance management program, and significant organizational and process changes aimed at strengthening EDC’s ability to serve customers.
EDC employees represent a range of backgrounds, cultures, experiences and education, and speak more than 35 languages. In recognition of the tremendous asset that this diversity brings to EDC, in 2005, an annual Corporate Diversity Award was introduced to be presented to the team that best reflects the values of people, customer service and innovation.
EDC was honored this year by the Ottawa Citizen as one of the National Capital Region’s Top 10 Employers. And, for the fifth consecutive year, EDC was named as one of Canada’s Top 100 Employers as reported in Maclean’s magazine.
It’s About More Than Exporting
24
OPERATING PRINCIPLES
Sound Financial Management
| | | | | | | | | | | | | | | |
| Measure | | 2005 plan | | | | 2005 results | | | | 2006 plan | |
| | | | | | | |
| Net income ($ millions) | | | 162 | | | | | 1,287 | | | | | 892 | |
| | | | | | | |
| Return on equity % | | | 4.8 | | | | | 27.0 | | | | | 16.2 | |
| | | | | | | |
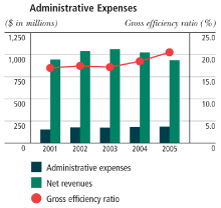
| Gross efficiency ratio % | | | 21.5 | | | | | 20.5 | | | | | 26.3 | |
| | | | | | | |
| Financial sustainability ratio % | | | 10.2 | | | | | 10.2 | | | | | 8.7 | |
| | | | | | | |
Through sound financial management, EDC ensures that it has an adequate capital base to fulfill its mandate now and in the future. Operating on a self-sustaining basis with no appropriations from Parliament, the Corporation achieves self-sustainability by obtaining adequate return for risks taken, containing costs and appropriately managing risk. This approach has enabled EDC to support more than $550 billion in exports and investments from the approximately $1 billion in share capital invested in the Corporation by the Government of Canada since 1944.
EDC tracks its financial performance in four key performance measures; net income, return on equity, gross efficiency and financial sustainability ratios.
As was the case in 2004, higher than anticipated net income was due to a reduced loans portfolio as well as improved credit conditions which resulted in a release of provisions for credit losses. Also impacting the net income was a lower unrealized fair value adjustment on derivative financial instruments. Accounting standards require EDC to report derivative financial instruments at fair value and record unrealized gains and losses on the income statement.
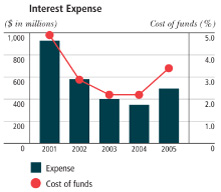
Return on equity was 27 per cent, which was higher than the Corporate Plan target due to significantly higher net income. The gross efficiency ratio was 20.5 per cent, which was lower than the Corporate Plan target of 21.5 percent due to lower administrative expenses, partially offset by lower net revenue. Administrative expenses of $182 million in 2005 were $14 million lower than the Corporate Plan figure of $196 million. The financial sustainability ratio met the Corporate Plan forecast of 10.2 per cent due to the operating income and capital coming in approximately at plan levels.
EDC Annual Report 2005
25
| | | | | | | | | | | | | | | |
| Measure | | 2005 plan | | | | 2005 results | | | | 2006 plan | |
| | | | | | | |
| Business volume $B* | | | 57.8 | | | | | 57.4 | | | | | 59.6 | |
| | | | | | | |
| Number of customers served | | | 7,500 | | | | | 6,828 | | | | | — | ** |
| | | | | | | |
| Customer satisfaction | | | 80.0 | | | | | 84.8 | | | | | 80 | |
| | | | | | | |
| Partnership volume | | | 8.8 | | | | | 9.5 | | | | | 9.0 | |
| | | | | | | |
| | |
| * | | Excludes domestic insurance volume. |
| |
| ** | | A new customer measure has been developed therefore a target was not set for this measure for 2006. |
While slightly below target at $57.4 billion, EDC supported the highest volume of export sales and investments ever in 2005 and Canadian exporters and investors reported a record high level of satisfaction with EDC’s service. But the dynamics of global trade are placing greater strains on EDC’s customers, and EDC is adapting its services to ensure it meets their rapidly changing needs.
ALIGNING SERVICES TO CUSTOMER NEEDS
EDC achieved its highest ever level of overall customer satisfaction in 2005, registering a rating of 84.8 on its Customer Satisfaction Index (CSI) which is compiled from monthly surveys, a significant increase from 81.8 in 2004. The 2005 CSI score was buoyed by higher ratings on EDC staff response to customer enquiries and on products and services that meet customer needs.
Recognizing that the needs of its customers continue to change as global market dynamics evolve, EDC initiated a review of its business structure in 2005 to determine how best to meet those needs, now and in the future. EDC is reorganizing to build upon its industry-sector expertise to better integrate EDC’s core business lines and business development group to the benefit of customers.
These measures will provide customers with a single point of contact in the organization, responsibile for engaging with the customer on an ongoing basis, listening to and understanding their evolving needs, and ensuring that the right expertise and solutions are delivered in a consistent and predictable fashion. This new customer service model will be fully implemented during 2006.
HELPING MAJOR INDUSTRIES ADAPT TO CHALLENGES
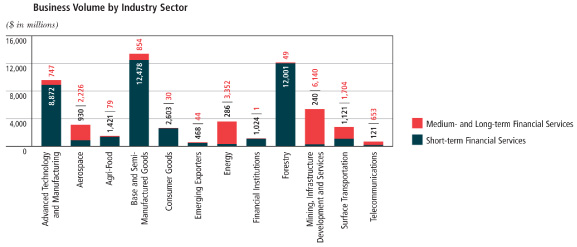
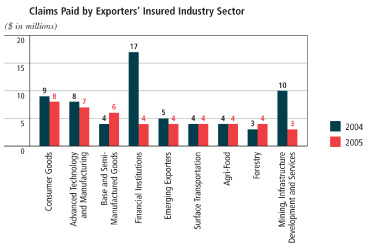
EDC’s mandate includes staying the course with large companies that employ tens of thousands of Canadians in industry sectors that are adapting to global market challenges. In Canada’s aerospace, telecommunications and forestry sectors for example, EDC facilitated $3 billion, $774 million and $12 billion in exports respectively in 2005.
The aerospace sector provides a unique case study of EDC’s strategically important role during challenging times. Despite recent strong performances of many large and small Canadian aircraft and parts assemblers, the maturity of the regional jet market and declining sales remain a problem for the industry’s bottom line. This was compounded by bankruptcies among several United States airlines in 2005 which resulted in a number of aircraft being returned to EDC for re-marketing
It’s About More Than Exporting
26
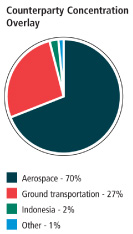
to other airlines. EDC is able to continue facilitating transactions in this sector during this turn of events because as a senior lender, its exposure is secured by the re-sale value of the aircraft. EDC is well-provisioned for potential losses and has the added protection of a strong balance sheet. These provisions and capital protect the Corporation against potential losses that might be sustained in its support for some 200 aerospace exporters employing more than 70,000 Canadians.
ADDING FINANCIAL CAPACITY
More than 50 per cent of EDC’s total business volume is achieved in partnership with other financial institutions in Canada and internationally. EDC credit enhancements make it more attractive for financial institutions to extend financing or coverage to Canadian exporters and investors. EDC concluded $9.5 billion of partnership volume, through its medium- and long-term financing and documentary credit insurance program in 2005, against a target of $8.8 billion, a 20 per cent increase over 2004.
EDC partnerships with financial institutions help exporters to free up access to working capital with solutions such as pre-shipment financing, performance guarantees and accounts receivables insurance. New in 2005 was the Foreign Exchange Facility Guarantee (FXG) enabling exporters to forego their financial institution’s requirement to put up 10 per cent collateral on currency forward contracts. EDC partnered with four financial institutions to conduct a limited pilot test of this product in fall 2005. These facilities assisted a group of Canadian exporters to enter into roughly $80 million of forward contracts. Additional financial institutions are expected to partner with EDC for a full launch this spring.
EDC also created a more effective way of delivering Performance Security Guarantee (PSG) support for exporters having to issue multiple letters of guarantee to support export contract requirements. A pre-committed bonding line for each eligible exporter can now be put in place for a year, and individual bank instrument coverage will now take just hours with little administration for the exporter, their bank and EDC. This new product, Account PSG, has become a value-added option to many of our financial institution partners and Canadian exporters. In 2005, the program supported the issuance of close to 250 letters of guarantee for more than 15 Canadian companies.
In June 2005, EDC entered into an agreement with Compagnie Française d’Assurance pour le Commerce Extérieur SA (Coface) for the provision of domestic receivables cover to EDC’s short-term insurance customers. This agreement provides a one-stop shopping solution for Canadian exporters needing both domestic and export insurance; their export receivables can be covered by EDC and their domestic receivables by Coface.
WORKING WITH PARTNERS
EDC’s partnerships with 15 industry groups and business associations focus on industries and markets where EDC can make a strategic difference. New in 2005, an agreement with the Canadian International Freight Forwarding Association will enable EDC to understand the needs of these key trade intermediaries and offer services to help them meet new security requirements for shipping to the United States. Building on these partnerships, EDC will establish a stakeholder panel of key players in Canada’s export and foreign investment sector in 2006 to gather further insight and recommendations on the needs of Canadian companies in order to serve them better.
EDC Annual Report 2005
27
| | | | | | | | | | | | | | | |
| Measure | | 2005 plan | | | | 2005 results | | | | 2006 plan | |
| | | | | | | |
| Volume in emerging markets ($B) | | | 117 | | | | | 13.3 | | | | | 14.2 | |
| | | | | | | |
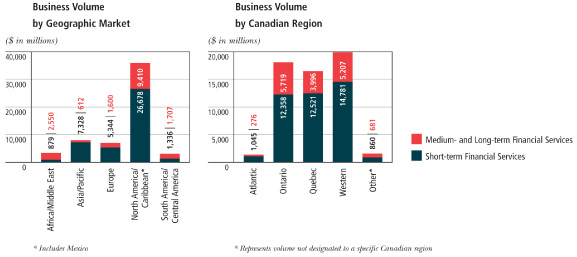
EDC helped to support a record high of $13.3 billion in export sales and investments to emerging markets in 2005, 23 per cent of EDC’s total business volume for the year. EDC facilitated 37 per cent of all Canadian exports to the large and fast-growing markets of Brazil, Russia, India, China and Mexico.
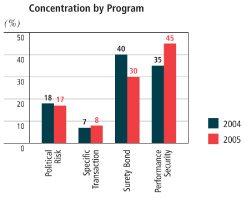
EDC’s 2005 emerging market results were buoyed by strong growth in EDC’s portfolio of Political Risk Insurance products, tools which help manage the risks of investing abroad. Growth in EDC’s portfolio of short-term credit insurance products, tools used by exporters to help mitigate the risk of non-payment or default, also contributed to EDC’s strong results in emerging markets.
More than half this volume, or $7.9 billion, was in fast-growing Asia-Pacific markets, where EDC’s business volume for China grew more than 26 per cent, or more than $480 million, to reach $1.8 billion. EDC’s business in Russia grew 148 per cent from $202 million in 2004 to $501 million, and in Africa and the Middle East, business volumes grew 70 per cent to $3.4 billion from $2 billion in 2004. EDC-facilitated exports to Brazil increased $20 million to more than $1 billion. EDC facilitated an estimated 70 per cent of all Canadian exports of goods and services to Brazil; 64 per cent of those to Russia; 29 per cent of those to India; 25 per cent of those to China and 47 per cent of those to Mexico.
DIVERSIFYING OUR MARKETS
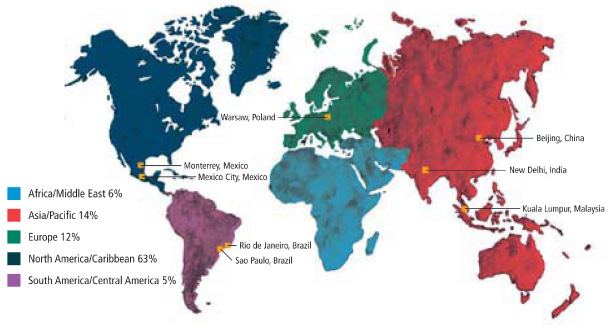
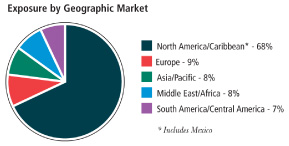
The United States remains Canada’s most important market and draws more than $31.9 billion of EDC-facilitated exports and investments. But EDC is playing an important role in helping more Canadian companies to pursue opportunities in other critical markets. EDC research indicates that reluctance to enter emerging markets stems from a range of factors including lack of awareness of the opportunities, heightened perception of the risks, and the perceived increased time and cost to convert long-term business prospects. EDC helps Canadian companies to adapt and overcome these obstacles through a network of eight representations located in major business centres worldwide.
In 2005, EDC appointed a permanent representative to India, joining other EDC representatives located in Mexico, Brazil, Central Europe, Southeast Asia and China. EDC’s foreign representations focus on building long-term relationships with key local buyers, seeking opportunities to match the procurement needs of these buyers to Canadian expertise. EDC’s local presence helps Canadian customers enter key markets by providing important contacts, market intelligence and financial tools that help to close deals. In 2006, EDC is reviewing market needs to determine if additional EDC foreign representations are warranted to drive further business to Canadian exporters and investors.
It’s About More Than Exporting
28
FACILITATING INVESTMENT
EDC is committed to increasing its support for Canadian investment in emerging markets where there is a clear Canadian benefit. EDC is focused on helping facilitate new Canadian investments and helping Canadian companies grow once they are established in new markets. For example, Canadian affiliates exporting from China will be helped by EDC’s new co-operation with Sinosure, China’s export and credit insurance corporation. Once operational, the arrangement with Sinosure will allow affiliates of Canadian firms operating in China better access to accounts receivables insurance and bonding support, facilitating their ability to access working capital from local banks. In 2005, EDC conducted primary research on the needs of Canadian affiliates operating in Mexico and found that they rely heavily on intra-company financing and that local financing solutions available in Mexico are not meeting their needs. Based on this research, EDC will develop services adapted to their needs for sales financing, bonding and credit support.
PRODUCTS THAT MEET MARKET REQUIREMENTS
During 2005, EDC redesigned its Bank Guarantee Program in response to changing needs of foreign buyers, in particular for the financing of local costs, and the influence of financing in buyers’ procurement decisions. The program received significant interest among Canadian and international banks across many industry sectors during the initial months of its implementation, and at year-end the pipeline included transactions in Kazakhstan, Mexico, and Venezuela valued at a combined total of $120 million. Developing tools that facilitate exports and investments is a priority for EDC, which began offering Non-Honouring Sovereign (NHS) political risk insurance coverage to cover both the willingness and ability of sovereign obligors to meet contractual obligations, including payment. NHS coverage is available for banks lending to sovereign borrowers, state-owned enterprises, and sub-sovereign obligors. EDC’s willingness to front NHS policies in partnership with the private sector eliminates the need for EDC customers to deal with multiple insurers to achieve full coverage. EDC supported many banks with more than $200 million in NHS cover in 2005, and is entering 2006 with a pipeline of transactions exceeding $400 million.
DOING MORE IN EMERGING MARKETS
EDC is increasingly targeting its international business development efforts to foreign buyers and borrowers, understanding that long-term relationships with these key foreign customers and local market intermediaries bring tremendous value to Canadian exporters and investors. In December 2005, EDC signed a USD 15 million Line of Credit with the Joint Stock Company State Export-Import Bank of Ukraine (JSC Ukreximbank) to facilitate the procurement of Canadian goods and services, particularly in the agricultural equipment sector. By developing such key relationships and providing timely transaction support, EDC will continue to help Canadian companies to maximize their emerging market export and investment opportunities in 2006.
EDC Annual Report 2005
29
| | | | | | | | | | | | | | | |
| Measure | | 2005 plan | | | | 2005 results | | | | 2006 plan | |
| | | | | | | |
| Number of SMEs served | | | 6,750 | | | | | 6,203 | | | | | — | * |
| | | | | | | |
| | |
| * | | New customer measures are being developed therefore a target was not set for this measure for 2006. |
EDC facilitated a record $15.5 billion in exports by small- and medium-sized Canadian enterprises in 2005, a 31 per cent jump from $11.8 billion in 2004 and more than a quarter of the Corporation’s total business volume for the year.
CONNECTING WITH MORE SMALL BUSINESSES
To succeed in the globally competitive marketplace, smaller exporters often make up in ingenuity and daring what they may lack in size. Helping small businesses take that leap of confidence to grow and prosper internationally is at the heart of EDC’s mandate. Considering that small- and medium-sized enterprises (SMEs) — companies with sales up to $25 million — are predominant in Canada’s business landscape, it is not surprising that they make up 91 per cent of EDC’s total customers.
In 2005, EDC saw its business volume with SME exporters and investors jump to an unprecedented high of $15.5 billion. SME usage of EDC financing services, from contract insurance and bonding to direct buyer financing, grew significantly in all categories compared to 2004 results. Looking purely at number of customers, EDC served 6,203 SMEs, a small decline over 2004 and below EDC’s target, as a stronger Canadian dollar and higher energy costs cut into export sales of many SME businesses, particularly smaller companies using EDC’s short-term insurance products. To increase its customer reach in the future, EDC recognizes the need to develop new products and build greater awareness among the smallest companies in Canada, that is, the vast majority of exporting companies, which have annual sales of less than $5 million. Almost 10 per cent of SMEs served in 2005 were new EDC customers, and a third more companies used EDC’s financing services than in 2004. Ninety per cent of SME customers used EDC’s accounts receivables insurance, up from 85 per cent in 2004.
MORE CUSTOMIZED SERVICES
For the past decade, EDC has tailored many of its products and services to smaller businesses, through its Emerging Exporter and Small Business Financial Solutions teams. This has meant providing SMEs with faster, more affordable and more flexible risk protection and lending services, along with easier access to more working capital.
Many service innovations and new business partnerships in 2005 contributed to the spectacular growth in the use of EDC’s financing services. For example, EDC increased its loan guarantees and other transaction activities with Scotiabank, CIBC and new partners such as Mercantile Financial Services, helping Canadian exporters get more working capital. EDC expanded its term loan guarantee to cover commercialization expenses, useful to the advanced technology sector, and
It’s About More Than Exporting
30
established a line of credit in Kazakhstan which opened new agricultural trade opportunities. And, service speed increased through automation of guarantee documents and greater consistency in deal turnaround-times, among many other improvements.
Building on this experience in 2005, EDC created a Small Business Development Group to further increase its understanding of small businesses with annual sales of less than $5 million. The goal is to provide even more product options to these businesses, in a more coordinated way, through all of EDC’s channels — web, phone, person-to-person contact, mail and through third parties, such as banks and accounting firms.
EDC’s analysis of data from Statistics Canada and its own sources estimates that of the close to 35,000 Canadian exporters, approximately 28,000 have annual sales of less than $5 million. Its research also shows that while EDC has good market penetration among exporters with a commercial banking relationship, this is more challenging to achieve among entrepreneurs who finance their export activities through personal or small business lines of credit. These companies may be able to benefit from some of EDC’s services to compete internationally, and represent untapped potential for Canada to grow its vital export base.
In 2005, EDC conducted focus groups with customers and other small exporters to better understand their banking relationships and evolving financial needs. Based on this and other research, EDC will be able to reach out to more exporters with new and enhanced products and services in 2006.
MORE FOR THE MONEY
One service channel in particular that has experienced year-over-year growth is EDC’s website. Edc.ca is, for most small businesses, the first point of contact with EDC. The web also is playing a growing role in EDC sales and post-sales activity. For example, in 2005, approximately 55 per cent of EDC’s short-term insurance customers, most of whom are SMEs, used EDC Direct, a web section for insurance policy renewals and related tasks.
Another priority is making sure EDC understands all the needs of its SME customers and offers a variety of products and services to help them succeed in export markets. During 2005, EDC started examining how to best integrate all its services for small business, so that EDC can connect better with these customers, increase its understanding of their export patterns and improve customers’ knowledge of what EDC can offer them.
MORE TO LOOK FOR IN 2006
After a year spent scrutinizing many of the internal and external processes, challenges and opportunities in dealing with small business, EDC is now well positioned to connect with more small exporters. In 2006, EDC will launch new financial products and delivery channels specifically targeted to the smallest exporters. EDC will review pricing of the small business insurance program and strive to develop an export locator service to help small businesses identify realistic opportunities in foreign markets. EDC will also automate more processes and improve its online services to provide time-crunched entrepreneurs with faster, more affordable and more efficient access to EDC.
EDC Annual Report 2005
31
PERFORMANCE AGAINST OBJECTIVES
SME Scorecard
| | | | | | | | | | | | | | | |
| Measure | | 2005 plan | | | | 2005 results | | | | 2006 plan | |
| | | | | | | |
| Emerging Exporters (EE) — number of new customers | | | 615 | | | | | 601 | | | | | — | * |
| | | | | | | |
| EE — average credit approval turnaround time | | | — | | | | 2.1 days | | | | — | |
| | | | | | | |
| | |
| | | * New customer measures are being developed therefore a target was not set for this measure for 2006. |
It’s About More Than Exporting
32
2006 STRATEGIC OBJECTIVES
2006 Strategic Objectives
Globalization has created a larger and more dynamic marketplace for goods and services and intensified international competition. To succeed, companies worldwide are adapting their business models to optimize productivity and lower production costs. EDC is also adapting its business model to ensure our products and services remain a valuable addition to the international success of Canadian companies.
IT’S ABOUT STRATEGY
EDC’s business strategy is focused on developing a deeper knowledge of the needs of Canadian companies and a stronger connection between EDC and the marketplace.
There are four key elements to EDC’s business strategy:
| | 1 | | Connect with exporters and investors: edc win organize itself around customer needs in order to deepen its knowledge of how Canadian companies do business internationally and what challenges they face, so as to offer the right tools and services to help them succeed. EDC will do more for SMEs, focus on industry sectors strategically important to Canada (such as agri-food, aerospace, automotive, energy, forestry, manufacturing and services) as well as ensure greater and further alignment of EDC’s business structure and processes. |
| |
| | 2 | | Facilitate integrative trade: EDC is developing more innovative products and services related to Canadian direct investment abroad and equity investments in order to assist companies in establishing global supply and distribution chains. This approach recognizes the need to help Canadian companies successfully compete with foreign companies in Canada as well as abroad. |
| |
| | 3 | | Expand EDC’S global market reach: It is especially important for Canadian companies both to secure and increase trade in their traditional export markets such as the United States and to expand their international trade in emerging markets. EDC will continue to work closely with International Trade Canada officials by providing input and aligning its activities with government priorities. EDC will further implement its strategy to make financing commitments to foreign buyers in advance of firm procurement from Canada to influence the buyers’ procurement decisions. This “pull” strategy has been used very successfully by EDC in the past with buyers in, for example, Mexico, Brazil and Chile. |
| |
| | 4 | | Leverage EDC’S balance sheet: The foundation of EDC’s business strategy is leveraging its balance sheet. EDC’s ability to contribute to the growth of Canada’s exports and investments is linked to its success at assessing and managing risk. EDC’s risk management policies and practices enabled the organization to “weather the storm” in the turbulent 1997-2004 economic cycle. Today, EDC has the financial capacity to broaden its risk appetite to fully respond to the needs of Canadian companies. |
EDC Annual Report 2005
33
2006 STRATEGIC OBJECTIVES
1. CONNECT WITH EXPORTERS AND INVESTORS
The varying and evolving needs of Canadian exporters and investors are based on many factors including size, market of interest and international experience. In 2006, EDC will adapt its business development and delivery approach to connect better with Canadian companies and improve customer service.
Building on its sector-based business structure, and to achieve this customer-integrated approach, EDC will introduce new tools and processes including:
| • | | a revised customer relationship model organized according to customer needs instead of product lines; |
| |
| • | | revised customer service standards that reflect the service model; and |
| |
| • | | new account management tools to enhance service efficiency and trend analysis. |
Leveraging Partnerships
Central to EDC’s strengthened approach to customer service will be its ongoing efforts to increase capacity in the market and serve customers as they want to be served. EDC has built extensive relationships with financial institutions to reach more exporters and investors, often delivering its products and services through the financial institutions with whom its customers have their primary banking relationship. In 2006, EDC will:
| • | | establish additional mechanisms to leverage partnerships with various financial intermediaries; |
| |
| • | | implement a broker strategy that coordinates and utilizes brokers as a distribution channel for all EDC’s insurance services to Canadian exporters; |
| |
| • | | work with private sector insurers to expand their role in meeting the accounts receivable needs of Canadian companies; and |
| |
| • | | enhance the information and services available from its website. |
Connecting with Small Business
While all EDC’s programs and services are available to small companies, experience has shown that they benefit more from activities and tools specifically designed to meet their needs. As such, EDC created a Small Business Development Group in 2005, to bring together business development activities focused on small businesses whose annual revenues are less than $5 million. In 2006, this group will:
| • | | increase the range of small business services available from our website; |
| |
| • | | develop an “export locator” program to help small exporters identify business opportunities in foreign markets; and |
| |
| • | | form new partnerships with private sector financial institutions. |
2. FACILITATE INTEGRATIVE TRADE
Canadian companies today face tough competition in well-established export markets and are increasingly challenged by foreign competitors when trying to get established in promising emerging markets. In addition, many Canadian companies must now compete at home in their domestic markets against new players from emerging markets that can produce goods and services at a lower cost. As such, the line between domestic and international activities is increasingly blurry and Canadian companies must adapt their business model to increase their productivity and lower production costs to compete in this crowded marketplace.
It’s About More Than Exporting
34
2006 STRATEGIC OBJECTIVES
Canadian companies can increase productivity by investing in equipment or production facilities in Canada and abroad, and through R & D investments. In the past few years, EDC has evolved its offering to facilitate investments made by Canadian companies to increase their export readiness. In 2006, EDC will expand its support of Canadian businesses investing in foreign markets by:
| • | | extending existing political risk insurance and project finance programs to a broader base of customers and sponsors; |
| |
| • | | increasing support for international acquisitions and expansions to help companies access new markets, increase their scope of operation or integrate supply inputs; |
| |
| • | | developing and delivering solutions for foreign affiliates of Canadian companies; and |
| |
| • | | enhancing its Equity Program in order to grow and extend its support of “next generation” exporters by bridging financing, experience and networking gaps. |
3. EXPAND EDC’S GLOBAL MARKET REACH
EDC is active in more than 170 markets, supporting Canadian companies that are trading or investing in traditional markets or broadening their reach to emerging markets. EDC’s strategy for expanding its global market reach supports the Government of Canada’s international commerce priorities which are implemented jointly by the International Trade portfolio, comprising the Department of International Trade, EDC and the Canadian Commercial Corporation.
In 2005, the government asked EDC to pay particular attention to securing Canada’s place in the United States market and to developing trade and investment links with China, India and Brazil. EDC has been asked to consider how it might expand its equity financing program, and assist Canadian businesses to develop technologies enhancing Canada’s reputation as a technology and commercialization leader. The Government asked that EDC pursue these objectives by making full use of its capital while continuing to operate on a self-sustaining basis. In 2006, EDC will:
| • | | continue building long-term relationships with foreign buyers and borrowers; |
| |
| • | | optimize efforts to match foreign procurement needs to Canadian expertise; |
| |
| • | | develop an account management strategy that targets select foreign buyers; |
| |
| • | | examine market needs for additional EDC foreign representation; and |
| |
| • | | develop services to assist Canadian affiliates operating in other countries. |
4. LEVERAGE THE BALANCE SHEET
EDC’s ability to contribute to the growth of Canada’s exports and investments is linked to its success at assessing and managing risk. This success has enabled the organization to weather the storm during the turbulent 1997-2004 economic cycle. Today, EDC has the financial capacity to broaden its risk appetite and respond to the needs of Canadian exporters and investors. This is particularly important at a time when companies need to expand their international footprint in markets that carry a higher level of risk and uncertainty.
Within the Corporation’s existing risk management framework, it will actively seek and support as fully as possible transactions that have higher potential risks. The business plan for 2006 also includes the creation of a pool of strategic risk capital to be used to facilitate additional business of a higher risk and/or an innovative nature that is outside the scope of EDC’s current risk management framework. Priority usage of the strategic risk capital will be focused on the key strategic emerging markets of Brazil, Russia, India, China, and Mexico, and on strategically important industry sectors.
EDC Annual Report 2005
35
2006 STRATEGIC OBJECTIVES
Supporting the Business Strategy
EDC’s business strategy is supported by the Corporation’s approach to sound financial management, its people and its use of technology. The ultimate goal of sound financial management at EDC is to ensure that the Corporation has an adequate capital base to deliver on its public policy mandate. In this regard, EDC’s self-sustainability is achieved by obtaining adequate returns for risks taken, containing costs and appropriately managing risk.
As a knowledge-based organization, EDC’s success is primarily accomplished through the quality and performance of its people, and by the efficient use of technology. The Corporation is therefore committed to creating a sustainable and desirable work climate by enhancing EDC’s reputation as a compelling career choice and deploying talent-management strategies which target career development, succession planning and learning and development.
EDC is also committed to providing its employees with the tools they need to support Canadian exporters and investors, and ultimately serve Canadians the way they want to be served. The Corporation’s Information Technology strategy facilitates EDC’s response to the opportunities and challenges of a rapidly evolving global market. Priorities for 2006 include initiatives that will enhance the customer experience with technology supporting front-line sales; improve connections with EDC’s customers, stakeholders and financial partners; and provide enhanced gathering and analysis of corporate intelligence on customers, markets, risks and financial performance in order to facilitate decision-making.
Measuring Success
EDC’s business strategy is focused on the customer and how EDC delivers trade finance and risk management services to help Canadian exporters and investors succeed. The following measures will be used to gauge EDC’s success in supporting the business strategy.
| | | | | |
| Performance Measures | | 2006 Plan | |
| |
Connecting with Customers | | | | |
| Customers Acquired and Retained | | | 6,400 | |
| Customer Satisfaction | | | 80.0 | |
Facilitating Trade and Investment | | | | |
| Total volume of business ($B) | | | 59.6 | |
| Volume in emerging markets ($B) | | | 14.2 | |
| Partnership volume ($B) | | | 9.0 | |
| Investment volume ($B) | | | 5.0 | |
Sound Financial Management | | | | |
| Net Income ($M) | | | 892 | |
| Return on Equity (%) | | | 16.2 | |
| Gross Efficiency Ratio (%) | | | 26.3 | |
| Financial Sustainability Ratio (%) | | | 8.7 | |
Resourcing to Deliver Results | | | | |
| Voluntary Turnover Rate (%) | | | 7.5 | |
| Average number of training days per employee | | | 5 | |
| Rank above high-quality organizations in EDC’s employee survey | | | n/a | * |
| | |
| * | | EDC’s employee survey is conducted on a biennial basis |
It’s About More Than Exporting
36
2005 was an interesting year for EDC in the global capital markets. As we are all aware, there were many events that impacted the markets and despite challenging conditions, EDC was a consistent performer.
I am pleased to report on some of our accomplishments. We proceeded with a balanced approach to strengthen our presence in major markets, broaden our investor base by type and region, while acquiring cost-effective funding. The overall strategy is based on remaining attentive to key accounts and continuously undertaking efforts to expand our global reach.
With respect to our global reach, EDC maintained its strategy of steady issuance in core markets and a regular placement of bonds which contributed to our penetration into new markets in South East Asia and the Middle East. EDC also made great efforts to secure our presence and position in traditional strategic markets such as Asia, Europe and North America, thus solidifying our long-term relationships with institutional and retail investors through our uniquely tailored issues.
Going forward, EDC’s Treasury will capitalize on the Corporation’s success in global markets through our ever-growing foreign representation. We will expand treasury capabilities to retain funding in emerging market currencies for subsequent lending in those currencies as a demonstration of our commitment to the developing capital markets and, as always, responding to investor demand. That said, we will of course continue with our balanced strategy of supporting corporate priorities and funding initiatives while solidifying and strengthening our presence in traditional global financial markets in support of our customers.
I would like to express my appreciation to all of EDC’s investors, both new and existing. I welcomed the opportunities to meet so many new investors who generously gave their time to understand how EDC securities could enhance the value of their portfolios. I look forward to continuing those beneficial relationships and building on future opportunities.
Sincerely,
Marie MacDougall
Vice-President and Treasurer
EDC Annual Report 2005
37
MESSAGE TO INVESTORS
MANDATE, OBJECTIVES & STRATEGIC DIRECTION
EDC’s mandate is to support and develop Canada’s export trade performance and help our customers respond to international business opportunities.
| | | EDC’s business strategy focuses on: |
| |
| • | | connecting with exporters and investors |
| |
| • | | facilitating integrative trade |
| |
| • | | expanding our global market reach |
| |
| • | | leveraging our balance sheet |
STRENGTH OF CAPITAL BASE
EDC’s business model is to manage risks and support the growth of Canada’s export trade performance. Prudent risk management ensures the long-term financial viability of EDC, and this well-managed business model has enabled the Corporation to strengthen its capital adequacy.
Strong capitalization ensures EDC is well positioned to provide a wide range of products to assist Canadian exporters with their sales of goods and services to foreign buyers in markets worldwide.
“AAA RATING” OF THE HIGHEST QUALITY
EDC received the highest ratings from all credit rating agencies. As an agent of Her Majesty in right of Canada,
EDC debt securities carry a zero BIS risk weighting for capital applications, according to Basel II, the revised international capital framework.
| | | | | | | | | |
| | | Domestic Currency | | Foreign Currency |
| | | Long-term | | Short-term | | Long-term | | Short-term |
| |
| Moody’s | | Aaa | | P1 | | Aaa | | P1 |
| Standard & Poor’s | | AAA | | A-1 + | | AAA | | A-1 + |
| DBRS | | AAA | | R-1 (high) | | | | R-1 (high) |
| JCR | | AAA | | | | AAA | | |
2005 BORROWING PROGRAMME
EDC has been an active issuer in the global capital markets for more than 30 years. With more than USD 13 billion in outstanding debt represented by more than 200 transactions in nine currencies, it is a testament to the success of our borrowing programme.
The core elements of the funding strategy have been consistent over time and include building strong relationships with investors and our dealer network, enhancing our position as a structured MTN issuer, periodic issuance of global bonds, establishing a world class investor relations strategy and expanding our global reach.
It’s About More Than Exporting
38
MESSAGE TO INVESTORS
2005 has been another interesting year in the global capital markets. As we started the year, our expectation was to raise upwards of USD 4.0 billion to support the lending and insurance operations. As the year progressed, a number of existing transactions were not called due to market conditions and therefore investors continue to hold EDC in their portfolios. Although this did not allow EDC to issue new transactions with these core investors, we are confident they will have an opportunity to participate in our debt issues in 2006.
| | | | | | | | | |
| Marketing to Investors | | 2005 goal | | �� | 2005 results | |
| |
| Number of presentations to investors | | | 100 | | | | 100 | |
| Increase penetration to new investors | | | 50 | % | | | 60 | % |
| Market inquiries | | | | | | increased 20% |
| Visits to IR website | | | 24,000 | | | | 28,239 | |
GLOBAL STRATEGIC MARKETING INITIATIVES IN SUPPORT OF
INVESTORS AND CUSTOMERS
Marketing to Canadian Investors
EDC targeted fixed income portfolio managers through direct meetings and conferences to further their understanding of our market approach and provide them with an update on new initiatives. EDC’s Vice-President and Treasurer also provided investors with an overview of EDC’s corporate strategy, the funding programme and our ability to buy back outstanding debt issues to enhance liquidity of its debt. EDC welcomed the opportunity to hear what investors expected within the Canadian financial markets. The exchange of information helps strengthen relationships and enables EDC to better understand how to modify our programme to accommodate their interests.
Expanding EDC’s Global Reach
Japan EDC has been very attentive to the Japanese market for decades and has earned a strong name recognition among investors. In 2005, EDC specifically targeted Japanese investors who are not familiar with EDC debt securities through a combination of targeted meetings and presentations, including a reception at the Canadian embassy in Tokyo. As a result, EDC executed transactions with Japanese city and regional financial banks as well as traditional buy and hold investors.
South East Asia Through visits to Singapore, Thailand and Malaysia in order to meet with various Central Banks of the region, EDC successfully raised awareness of its funding programme as well as its relationship to Canada to an audience that, prior to this visit, was not participating in EDC’s debt issues. As a result, we anticipate increased participation in future global bonds.
EDC Annual Report 2005
39
MESSAGE TO INVESTORS
Middle East Many of the largest investors in the sovereign, supra and agency sector are situated in the Middle East. As our first foray into this market, EDC undertook visits to Bahrain and the United Arab Emirates, to meet with Central banks and major financial institutions of the region. As a new market for EDC, these visits proved to be beneficial in that we were shown offers to execute transactions with the targeted accounts and garnered interest in participating in our global commercial paper programme. EDC will be highly attentive to this market and anticipates future transactions.
Turkish Currency Issuance Turkish currency reform came into effect in January and opened a new market for frequent issuers. EDC seized an opportunity to fulfill investor demand and came to market with a Turkish Lira 50 million two-year issue. Given EDC’s strong name recognition, investors were enthusiastic to participate and the transaction was upsized twice. International Financial Review (IFR) published a special report in April 2005 on Turkey and a profile of EDC was included.
Europe A key objective for EDC is to increase distribution into Europe. To that effect, throughout 2005 EDC assessed the viability of a new programme to issue exclusively to retail investors. This initiative represents EDC’s commitment to pursue new and unexplored niches by targeting and assessing the viability of the private banking network in Europe. We anticipate that these efforts will come to fruition in 2006, enabling us to place bonds with retail investors and allow us to tap into high net-worth individuals.
FOREIGN MARKET REPRESENTATION
EDC’s global reach has continuously evolved to keep pace with the changing needs of Canadian exporters and investors, and its growth strategy places great emphasis on identifying opportunities in developing markets. This strategy is proving to be very effective by generating a number of pull opportunities for our customers and as it gains momentum it will translate into more opportunities for investors to participate in EDC issues.
EDC is expanding its treasury capabilities to retain funding in emerging market currencies for subsequent lending in those currencies, as a demonstration of its commitment to developing the capital markets and responding to investor demand.
Business Volume by Geographic Market
The map highlights the locations of our foreign offices which are ideally situated to support future business for EDC customers.
It’s About More Than Exporting
40
MESSAGE TO INVESTORS
2006 STRATEGY
Global Bonds EDC will issue fairly priced securities through a transparent process, secure primary placement with a globally diversified investor base, acquire full support from underwriters and maintain a strong focus on secondary market performance.
MTNs EDC will develop investor-oriented structured notes and euro medium term notes targeted to market segments and tailored to meet investors’ specific demands with respect to currencies, structures, maturities and size. EDC will also continue to provide quick turnaround times for investor inquiries as well as provide enhanced liquidity through a buy back programme.
Private Placements EDC will continue to respond to one-off opportunities at the request of investors who have a particular portfolio requirement that cannot be accommodated through the public market.
Investor Marketing EDC’s consistent approach to investor marketing is well received by investors and we seek their feedback and incorporate their suggestions which helps build EDC’s strong worldwide brand. In 2006, this will include high frequency visits, one-to-one visits and road shows in order to listen to investors and fulfill their needs.
Strategic Marketing EDC will continue to support the efforts of our customers and investors by maintaining and expanding a regular presence in global financial markets.
Global Commercial Paper programme (CP) — managing three forms:
| | | |
| USD CP | | • US dollars |
| | | • overnight to a maximum maturity of 270 day(s) |
| | | • prices available on Bloomberg, DOCP <GO> |
| | | |
| CAD CP | | • Canadian dollars |
| | | • overnight to a maximum maturity of 364 day(s) |
| | | |
| Euro CP | | • variety of currencies |
| | | • overnight to a maximum maturity of 364 day(s) |
EDC Annual Report 2005
41
Board of Directors
Board of Directors
As at December 31, 2005
| | | |
J. Bernard Boudreau
President
Keata Pharma Inc.
Halifax, Nova Scotia | | Mr. Boudreau has had an extensive career in law, as senior partner and Counsel, and in politics. He was elected to the Nova Scotia Legislature in 1988 and held several portfolios including Minister of Finance. In 1999 he was appointed Leader of the Government in the Senate and the Federal Minister Responsible for Nova Scotia and subsequently, Minister of State, Atlantic Canada Opportunities Agency. He has held and continues to hold management and Board positions in a number of organizations. |
| | | |
Rowland W. Fleming
President
Vergemount Inc.
Creemore, Ontario | | Mr. Fleming has significant private sector experience in the financial services industry having held senior executive positions with a major Canadian bank, as well as being CEO of a large insurance company and a major trust company for a number of years. He also serves as a director with private and public institutions and from 1995 to 1999 he was President and CEO of the Toronto Stock Exchange. |
| | | |
Robert Fonberg
Deputy Minister of
International Trade
Ottawa, Ontario | | Mr. Fonberg has senior executive experience in the public sector including terms as Deputy Secretary to the Cabinet, Assistant Secretary in the Privy Council Office and Senior Vice-President of the Business Development Bank of Canada. He also has private sector experience having been a principal in the consulting firm Ernst and Young. |
| | | |
Robert A. Fung
Orion Securities Inc.
Toronto, Ontario | | Mr. Fung has extensive expertise in the investment industry and specializes in corporate finance acquisitions in the natural resources sector, particularly in the oil and gas industry. He has held positions as chair, senior executive and director with a number of private, public and charitable organizations, and currently chairs the Toronto Waterfront Revitalization Corporation. |
| | | |
Paul Gobeil
Chairperson
Export Development Canada
Montreal, Quebec | | Mr. Gobeil has been a member of the Ordre des comptables agréés du Québec since 1965 and a Fellow since 1986. From 1974 to 1985, he held a number of executive positions at Provigo Inc. Elected to the Quebec legislature in 1985, he served as Minister Responsible for Administration, Chair of the Conseil du Trésor and Minister of International Affairs in the Quebec government. He is currently Vice-Chairman of the Board of Metro Inc. and Chairman of the Board of Diagnocure Inc. He is also a Director of the National Bank of Canada, the Canam Group Inc., Hudson’s Bay Company and Yellow Pages Income Fund. He holds a Master of Commerce and a Master of Accounting from Université de Sherbrooke, and completed the Advanced Management Program at Harvard Business School. He was first appointed Chairperson of EDC’s board in 2002, and reappointed in 2005. |
| | | |
Brian G. Heffernan
Partner
Collins Barrow Calgary LLP
Calgary, Alberta | | Mr. Heffernan is a chartered accountant and at present is a client services partner and Treasurer of Collins Barrow Calgary LLP. Also a certified financial planner, he has a broad public practice background including auditing, accounting and taxation services. |
| | | |
Lise Lachapelle
Consultant
Montreal, Quebec | | Mrs. Lachapelle worked for nearly 20 years in the Federal civil service where she served as Commercial Counselor at the Canadian Embassy in Paris and as Assistant Deputy Minister in Industry Canada. She has been a Senior Vice President of the Montreal Stock Exchange and President and CEO of the Canadian Pulp and Paper Association, and is currently a strategic and economic consultant. She sits on the Boards of Abitibi-Consolidated Inc., BNP-Paribas (Canada), Industrielle Alliance, Assurances et services financiers Inc., Innergex Energie, Fiducie d’exploitation, Mirabaud Canada Inc.. and Russel Metals Inc. |
It’s About More Than Exporting
42
| | | |
| Mrs. Landry has been the Director of the « Centre de Commercialisation International » at the Université de Moncton since 1996. There she has coordinated and participated in trade missions involving students, businesses and government departments. She has also been the President and founder of two small private companies involved in adult training and employment preparation. | | Jocelyne Landry
Directrice
Centre de commercialisation
internationale
Université de Moncton
Moncton, New Brunswick |
| | | |
| Mr. Setlakwe is President and CEO of a retail chain and has been a director of the Retail Council of Quebec. He has also been a board chair and director of private and public sector organizations and charities. He served as a member of the Senate of Canada for three years, retiring in 2003. | | Raymond C. Setlakwe
President
A. Setlakwe Ltd
Thetford Mines, Quebec |
| | | |
| Mrs. So is a Chartered Financial Analyst and has a Certified Management Accountant designation. Currently a Senior Vice-President and Associate Portfolio Manager of RBC Dominion Securities, she has a varied background in the investment business in Canada and abroad. In her work promoting trade and economic development between China and North America, she has spoken at various conferences and written three books. | | Irene So
Senior Vice-President,
Director and Portfolio Manager
RBC Dominion Securities
North York, Ontario |
| | | |
| Ms. Szel holds a law degree from the University of Alberta. Since 1985 she has been with Canadian Pacific Railway where she served as Alberta general and regional counsel followed by other senior appointments, including her current position in which she is a member of the Executive Committee. Throughout her career, she has focused on change initiatives. She has been a Chair and Director of the Canadian Chamber of Commerce and serves on many business and advisory councils, associations, and boards. | | Marcella Szel
Senior Vice-President,
Marketing and Sales
Canadian Pacific Railway
Calgary, Alberta |
| | | |
| Mr. Unruh, who obtained his law degree from the University of Manitoba, practiced business law in Winnipeg before moving to Vancouver as Senior Vice President, Law and Corporate Secretary of Westcoast Energy Inc. When that company became part of the Duke Energy group, he continued in senior positions at several Canadian and US companies within the group. In retirement, Mr. Unruh remains with the Duke Energy group as a Director of Westcoast Energy Inc. and Union Gas Limited, and he has also served as a Director of numerous energy and insurance companies. | | David G. Unruh
Duke Energy Gas Transmission
Vancouver, British Columbia |
| | | |
| Mr. Wright began his Federal government career in 1975 as an economist with the Department of External Affairs and held positions at the National Energy Board, the Department of Energy, Mines and Resources, and the Department of Finance. He has served in Deputy Minister positions including High Commissioner to New Zealand, Deputy Minister of Revenue Canada; Commissioner of the Canada Customs and Revenue Agency, and National Security Advisor to the Prime Minister. He was appointed as President and CEO of EDC in April of 2005. | | Rob Wright
President and
Chief Executive Officer
Export Development Canada
Ottawa, Ontario |
| | | |
| Ms. Zwarts has more than 20 years experience as a corporate lawyer, having practiced with private sector firms Fasken Martineau DuMoulin LLP and as a partner with Ogilvy Renault. She subsequently joined Telesystem International Wireless Inc. where she served as Secretary and General Counsel from 1998 until the end of 2005. | | Margriet Zwarts
Lawyer
Montreal, Quebec |
EDC Annual Report 2005
43
| Executive Management Team |
(left to right)
Rob Wright
President and Chief Executive Officer
Eric D. Siegel
Chief Operating Officer
Susanne Laperle
Senior Vice-President, Human Resources
Stephen S. Poloz
Senior Vice-President, Corporate Affairs & Chief Economist
Sherry Noble
Senior Vice-President, Business Solutions and Technology
Peter Allen
Executive Vice-President & Chief Financial Officer
Gilles Ross
Senior Vice-President, Legal Services & Secretary
Pierre Gignac
Senior Vice-President, Short-Term Financial Services
Benoit Daignault
Senior Vice-President, Business Development
It’s About More Than Exporting
44
CORPORATE GOVERNANCE
Corporate Governance
The governance of Crown corporations remained a major focus of attention for EDC’s Board in 2005. This focus was seen both internally, with the Board endorsing the start of a business integration project focused on positioning EDC to accomplish even more successfully its mandate and externally in assessing EDC’s performance against the most recent government governance initiatives. Chief among these was the Treasury Board Secretariat report on its review of the governance framework for Canada’s Crown corporations. This report outlined 31 measures, or recommendations, designed to improve the effectiveness of the governance framework.
The Board reviewed EDC’s practices against the best practices and recommendations in the report and confirmed that EDC’s activities remain very much in line with the Treasury Board recommendations. EDC was fully compliant with six of the nine measures for which Crown corporations were primarily responsible, which measures related to audit committees, and procedures for selecting chief executive officers. For the remaining three measures where EDC was only partially compliant, action plans, including working closely with the government and other Crowns, were approved with a view to meeting recommendations regarding: more clearly articulating Board roles and responsibilities by way of a Board Charter; convening annual public meetings; and including assessments of individual directors in the regular assessments of overall Board effectiveness which EDC already carries out. EDC also took the initiative of providing input into certain government-led measures with potential significant impact for EDC, such as CEO/CFO certification and extension of access to information legislation.
EDC’s ongoing work to fully align its governance policies and practices with government guidelines and directions demonstrates the importance that EDC’s Board has long placed on effective corporate governance and its role in transparency and accountability. The Board will continue to review its governance practices as part of positioning itself to build EDC’s own capacity to support Canada’s export trade, and to reflect government priorities.
BOARD MANDATE AND PUBLIC POLICY ROLE:
The Board is ultimately responsible for EDC’s management and closely reviews its performance. The Board sets the strategic direction of EDC to ensure that EDC meets its public policy objectives in the most effective manner. This public policy role was emphasized in the Treasury Board report, and the Board’s efforts are consistently geared to further developing ways in which EDC can meet its public policy objectives. For example, the Board, as part of its ongoing role, reviewed the development and refinement of the trade finance and risk management services EDC offers to Canadian companies, and authorized certain transactions, all with a view to enhancing EDC’s public policy goals. The Board also continued to ensure appropriate transparency, paying close attention to relations and communication with the shareholder and other stakeholders of EDC. The Board, in monitoring the financial management, reporting and auditing of the Corporation’s performance, reinforced EDC’s strong accountability structure. Risk management and risk assessment remained major focuses of the Board, as it ensured that the rigorous processes and frameworks in place to identify and manage various elements of risk remained relevant and effective, and that the processes and frameworks were refined so that additional business could be supported while maintaining the Corporation’s financial integrity. The Board continued to review and update Corporate Social Responsibility initiatives of EDC.
EDC Annual Report 2005
45
CORPORATE GOVERNANCE
STRATEGIC PLANNING:
The strategic direction of EDC is developed with the input and guidance of the Board. Management consults regularly with directors as well as representatives from the shareholder. In 2005, the Board’s influence resulted in an increased focus on how EDC could leverage its assets to best support customers. This issue served as the backdrop for major matters brought to the Board’s attention in 2005 including EDC’s Corporate Plan; business integration and internal re-alignment; and the consideration of new risk arrangements and initiatives.
EDC’s Corporate Plan (“Plan”) is the Corporation’s primary strategic vehicle and EDC’s Board plays an active role in its development. The Plan is a forward-looking document that outlines EDC’s business strategy for a five-year period. Directors provide strategic direction in the development and creation of the Plan. The Board fully supported EDC’s strategy to connect with customers and to adapt to market realities in the current economy. Directors provided their insight at each Board meeting and encouraged management to find ways to strategically utilize EDC’s expertise, knowledge and financial capacity to make an even bigger difference to Canadian exporters.
The Board was also instrumental in ensuring that the Plan was aligned with the principles and guidelines suggested by the government. An initiative arising from the Treasury Board report involved the responsible minister issuing to each Crown corporation a statement of priorities and accountabilities that formalizes government expectations for that corporation. EDC’s Board was pleased to note that regular consultations with government departments resulted in strong alignment between the Plan and the statement of priorities and accountabilities related to EDC. This is especially important since the Board is the primary conduit for communication with the shareholder, and the statement of priorities and accountabilities outlines expectations on how EDC can best contribute to the government’s international commerce priorities.
After extensive review of the Plan elements, the Board was satisfied with the Plan, including its measurable targets to assess performance, and endorsed it fully. Following Board approval, EDC’s 2006-2010 Corporate Plan was approved by all necessary governmental departments. At that time the 2005-2009 Corporate Plan, which had previously been deferred, was also approved by the government.
In keeping with the Board’s engagement in finding ways to leverage EDC’s significant net income and capital base for the benefit of the Canadian export community, the Board guided EDC in numerous strategic activities related to risk and portfolio management with potential to significantly increase the availability of capital to support integrative trade, key industries and developing markets. Development of a fully integrated economic capital model, incorporating a strategic portfolio and capital management is underway, and the Board will continue to influence the development of strategies to leverage EDC’s balance sheet while ensuring alignment of proposed applications thereof with government direction regarding international commerce.
Another key strategic initiative in 2005 and an underpinning of the Plan was the integration and realignment of EDC’s business structures and processes in order to optimize service to customers — one of the four key elements of EDC’s business strategy. This project was reviewed and endorsed by the Board and will be fully implemented in 2006.
The Board also reviewed and supported EDC’s information technology strategy, which is seen as a key tool to assist EDC in attaining the four elements of its business strategy.
BOARD RENEWAL, APPOINTMENTS AND FUNCTIONING:
2005 was an active year of Board renewal in which the Chair of the Board, along with several directors, were reappointed in accordance with recommendations made by the Board and the Nominating and Corporate Governance Committee with a view to maintaining continuity and ensuring consistent monitoring of particular corporate initiatives. Five new directors were also appointed, replacing several long-serving Board members who had made valuable contributions to EDC during their tenures.
It’s About More Than Exporting
46
CORPORATE GOVERNANCE
The President and the Chair, who are Governor in Council appointees, together with 13 other directors, make up EDC’s Board. Other director appointments are made by the Minister of International Trade with the approval of the Governor in Council. Directors’ terms are up to three years, with the possibility of re-appointment. The Nominating and Corporate Governance Committee reviewed and affirmed a composite director profile, which was submitted to the government for use in evaluating potential candidates for future vacancies.
Membership on Committees was restructured during the year, enhancing their functioning by aligning the expertise of directors to the needs of the Committees and permitting concurrent meetings to take place.
SUCCESSION PLANNING AND SENIOR APPOINTMENTS:
EDC started the second quarter of 2005 with a new President. The Nominating and Corporate Governance Committee’s previous work in the search for candidates for the position was instrumental in this appointment. In the interim, EDC had been under the direction of its Senior Vice President, Legal Services and Secretary, Gilles Ross, whose exceptional leadership skills and unsurpassed dedication to EDC ensured that business continued uninterrupted during this transition period.
This year also saw other changes in EDC’s Executive team with a view to a re-alignment of EDC’s business teams, all in furtherance of EDC’s strategy to better support Canadian exporters. The Board approved the creation of the new position of Chief Operating Officer responsible for business development as well as line-of-business functions, which was filled by a senior member of the Executive. The Chief Financial Officer became Executive Vice-President; and the Chief Economist was given additional responsibilities as Senior Vice-President, Corporate Affairs. These changes clarified EDC’s direction and set the scene for organizational re-engineering to better integrate EDC’s core business lines and business development efforts for the benefit of customers.
As part of the succession planning process, the Human Resources Committee conducted its annual review of the senior management succession plan including leadership development initiatives. Such reviews enable the Board to assess and satisfy itself that succession planning remains well-aligned with EDC’s business strategy.
Several other senior appointments, most of which were pursuant to EDC’s succession plan, were made by or on the recommendation of the Human Resources Committee.
BOARD INDEPENDENCE AND ETHICS:
The Treasury Board report described best practices which dictate that, to be effective, directors must approach their work objectively and with decision-making independence, and that Boards must function independently from management. At EDC, all Board members other than the President are independent of management. EDC’s Executive team attends Board and Committee meetings, as do other EDC personnel when appropriate, and discussions with management are open and frank. A portion of each Board meeting is reserved for in camera discussions and most Committees periodically hold in camera sessions alone or with invited EDC representatives. The Audit Committee regularly holds two private meetings: one with representatives of the Office of the Auditor General and another with only the Vice President in charge of EDC’s internal audit team.
Another best practice by which the Board promotes a culture of ethical business conduct involves adherence to a written code of conduct or ethics. EDC has both a Code of Business Ethics and a Code of Conduct, the spirit and certain relevant provisions of which are applicable to members of the Board of Directors. Also applicable are Board-specific procedures relating to conflict of interest and insider trading, which supplement the Code of Conduct and are intended to assist directors in arranging their private affairs so as to ensure compliance with statutory and other legal standards and to maintain public confidence and trust in the integrity, objectivity and impartiality of EDC and its directors.
An integral part of EDC’s ethics program is an annual sign-off by directors confirming that they understand their obligations under the foregoing codes and procedures, and that they are in compliance with applicable provisions. Directors annually receive full briefings reminding them of their ethical obligations. They also receive confirmation that the EDC values and ethics which they verify and demonstrate are carried through to the operational level by way of reports on corresponding training of and sign-off by all employees.
EDC Annual Report 2005
47
CORPORATE GOVERNANCE
DIRECTOR ORIENTATION, CONTINUING EDUCATION AND
PERFORMANCE EVALUATION:
With the appointment of five new directors in 2005, EDC’s director orientation program was heavily utilized. This program, made available to new directors shortly after their appointment, includes several days of presentations on every aspect of EDC’s operations including corporate policies, and provides the occasion for questions and discussions. The curriculum for the orientation program, previously endorsed by the Nominating and Corporate Governance Committee, was used by EDC Executives and other management members in delivering the program.
In addition to this one-time orientation, directors are, on a continuing basis, updated on operations and policies during regular Board and Committee meetings, as necessary. Directors are also invited to attend other training programs on corporate governance, including sessions offered by the Canadian government. Three directors were able to take advantage of the government program in 2005, and found it valuable.
EDC’s orientation and continuing education programs are integral to the activities of the Board and help directors understand the environment within which EDC operates. Equally important is determining the effectiveness of the Board so that it can guide a business strategy to provide continued support for Canadian exporters. To this end, the Board surveyed directors on governance issues, in particular those identified as key in Treasury Board guidelines and measures, obtaining directors’ self-assessments of Board and Committee functioning.
Individual director profile surveys were also conducted to identify the strengths of directors, as well as their specific skills and knowledge, leadership expertise, industry experience and regional representation so as to flag any gaps in the overall composition of the Board. These two performance evaluation tools will be used to develop a work plan for 2006. The Board also agreed that governance surveys would in future be conducted on an annual rather than bi-annual basis.
TRANSPARENCY AND COMMUNICATION WITH STAKEHOLDERS:
A Crown corporation’s corporate plan is acknowledged by Treasury Board to be the basis for both the Board of Directors and the shareholder to better judge subsequent decisions and to evaluate performance. EDC’s Board ensured that communications with the government regarding the Plan were frequent. As part of the Plan approval process, EDC management met with representatives from the Department of International Trade, the Department of Finance and Treasury Board Secretariat to consult on all aspects of EDC’s Plan, including the business strategy and public policy adherence. As noted, these consultations resulted in strong alignment between the Plan and the statement of priorities and accountabilities issued by the Minister of International Trade.
Crown corporations were invited to provide input into the on-going work in response to the Treasury Board’s review of the governance framework for Crown corporations. EDC management actively participated in these meetings, as did EDC’s President and the Chair of the Board, and reported on them to the Nominating and Corporate Governance Committee.
With regard to transparency vis-a-vis non-governmental stakeholders, the integration of business development and lines of business functions undertaken during 2005 is expected to enhance communication with current and potential EDC customers. In addition, the new disclosure policy approved by the Board will increase transparency and address the evolving requirements of international common approaches, providing greater openness to the public while respecting customer confidentiality.
EDC has an extensive outreach program through which it engages with the public, including non-governmental organizations. EDC’s Advisory Council on Corporate Social Responsibility also provides valuable independent advice and is an integral part of the outreach program. Membership of the Council, which was established in 2001, was renewed in 2005 to ensure continued vitality. A member of EDC’s Board participates in the Advisory Council as an observer and provides feedback to the Board as to the Council’s activities and views.
It’s About More Than Exporting
48
CORPORATE GOVERNANCE
FINANCIAL ACCOUNTABILITY:
The Audit Committee aids the Board in maintaining the integrity of EDC’s internal controls and management information systems. The Board is committed to continuing the financial transparency and accountability on which EDC prides itself. Financial accountability, and in particular audit committees, were a major focus of the Treasury Board report. The Nominating and Corporate Governance Committee confirmed EDC’s compliance with the specific measures dealing with the functioning of audit committees. EDC has long had an Audit Committee, made up of six members all of whom are financially literate as well as independent of management, and the Committee’s current Chair is an experienced chartered accountant. EDC management participated in discussions of the possible development of a CEO/CFO certification process, another measure in the Treasury Board report, with the Board supporting the approach that any such process must be aligned with EDC’s needs.
Other initiatives to enhance financial accountability included: approval of a disclosure of wrongdoings policy and related procedures for EDC personnel; review of implementation of changes to accounting standards to ensure continued fair presentation of EDC’s financial situation; appointment of a new Vice-President responsible for internal audit; and the approval of a corporate information technology strategy and related governance structure.
RISK MANAGEMENT:
The Board was instrumental in developing several strategic steps in the evolution of EDC’s risk management framework. Implementation of an innovative risk transfer arrangement provided benefits in terms of additional capacity.
The Board recognized that limits within the existing risk management framework could restrict expansion and plans for increased leverage of capital, and it accordingly strategized with management in the ongoing project of refining the framework to utilize a more comprehensive economic capital model that would integrate the concepts of capital adequacy, dividend eligibility and strategic risk. Advancing its capital management policies and practices is expected to place EDC in a stronger position to provide more risk-responsive support to its customers.
Underlying the evolution was a continued prudent approach to risk. With the assistance of the Risk Management Committee, the Board continued to review the operation of EDC’s Risk Management Framework in order to satisfy itself that all types of risks were properly identified and managed and that appropriate authorities and controls were in place. Implementation of a more sophisticated economic capital model would increase EDC’s ability to confidently forecast and stress test EDC’s portfolios. This ability is based on business development plans, sensitivity to changing credit quality, interest rates and foreign exchange rates, and would allow for more comprehensive capital budgeting and planning.
BOARD COMMITTEES’ MANDATE, ACTIVITIES AND MEMBERSHIP:
Each Board Committee operates in accordance with a written mandate (Terms of Reference) summarized below, that is reviewed regularly and updated as required. The updating process involves the Nominating and Corporate Governance Committee reviewing proposed changes and then recommending amendments to the Board for approval. All directors receive copies of Committee minutes in a timely fashion after each meeting.
All Audit Committee members are independent of EDC management. The Committee meets regularly with representatives from the Office of the Auditor General and also with EDC’s Vice President of Internal Audit and Evaluation. This Committee assists the Board in fulfilling its responsibilities relating to a variety of financial matters, as well as issues regarding business ethics and environmental review and monitoring the compliance program. In 2005, the Audit Committee particularly focused on:
| • | | the creation of a new Environmental Policy; |
| |
| • | | revisions to the Environmental Review Directive; and |
| |
| • | | revisions to the Disclosure Policy and ensured the comments or concerns of all stakeholders were brought to the attention of the Board, and encouraged EDC to maintain its open and broad-based consultation process. |
EDC Annual Report 2005
49
CORPORATE GOVERNANCE
The Committee also:
| • | | reviewed and approved important capital and administrative expenditures; |
| |
| • | | reviewed the new Accounting Standards; |
| |
| • | | reviewed and approved the travel and hospitality expenses of key personnel; |
| |
| • | | recommended changes to its Terms of Reference; and |
| |
| • | | reviewed the financial statements and recommended approval by the Board. |
The Committee held six meetings.
Members: B.G. Heffernan (Chair), R. Fleming, R. Fung, L. Lachapelle, M. Szel and M. Zwarts.
The Business Development Committee assists the Board by providing policy direction to enhance EDC’s ability to meet the ever-evolving needs of Canadian exporters and investors, taking into account factors related to industrial sector and/or regional economy. The Committee is responsible for annually reviewing the impact of business facilitated by EDC on Canada’s economy. Major focuses of the Business Development Committee were:
| • | | a proposed re-alignment and integration of EDC’s business teams to better serve customers; |
| |
| • | | the proposed business development strategy, including small business models, and related elements of the proposed Corporate Plan; |
| |
| • | | targeted activities to increase business in developing markets, including the appointment of EDC representatives in these markets; and |
| |
| • | | EDC’s information technology strategy and other product initiatives. |
The Committee held six meetings.
Members: R.C. Setlakwe (Chair), J.B. Boudreau, R. Fleming, R. Fung, M. Szel and R. Wright.
The Executive Committee has the authority to exercise many of the Board’s powers and handles urgent matters that may arise between Board meetings. This year the Executive Committee held five meetings to consider transactions and budgetary matters and to receive updates on the activities in key portfolios.
Members: P. Gobeil (Chair), J.B. Boudreau, R. Fleming, R. Fonberg and R. Wright.
The Human Resources Committee assists the Board in connection with human resources strategic planning, succession planning, compensation, input into pension plan design changes and assessment of the CEO’s performance. Areas of particular focus included:
| • | | reviewing corporate succession plans and approving and/or recommending several senior appointments; |
| |
| • | | approving EDC’s compensation plan and corporate incentive program; |
| |
| • | | receiving the annual update on the Corporation’s official languages program; |
| |
| • | | approving changes to certain benefits programs; and |
| |
| • | | recommending changes to the Committee’s Terms of Reference. |
The Committee held seven meetings.
Members: J.B. Boudreau (Chair), R. Fonberg P. Gobeil, R.C. Setlakwe, I. So, D.G. Unruh and R. Wright.
The Nominating and Corporate Governance Committee is responsible for matters relating to EDC’s corporate governance regime. It has input into the establishment of selection criteria for appointments of directors, the President and the Chair, as well as training, performance assessment and Committee composition. Areas of particular focus in 2005 included:
| • | | initiating the individual skills profile survey of current Board members as well as the corporate governance survey; |
| |
| • | | reviewing the Treasury Board report on Crown governance, and assessing EDC’s compliance with and activities related to this report and specific measures; and |
| |
| • | | updating and approving a composite Board competency profile. |
The committee held five meetings.
Members: P. Gobeil (Chair), J.B. Boudreau, R.C. Setlakwe, I. So and M. Zwarts.
It’s About More Than Exporting
50
CORPORATE GOVERNANCE
The Pension Committee helps the Board monitor the administration of the pension plan for EDC employees. This includes ensuring its proper administration and funding of the component plans in accordance with applicable legislation, and input into plan design changes. Areas of particular focus included:
| • | | reviewing and recommending plan amendments; |
| |
| • | | reviewing the performance of the plan’s investment managers, including annual meetings with managers and the external investment performance monitor; |
| |
| • | | reviewing proposed appointments of external service providers; |
| |
| • | | overseeing the annual review of the investment policies, which included a comprehensive asset-liability modelling exercise, and considering proposed changes to the plan’s asset mix and investment mandates; |
| |
| • | | monitoring the actuarial, financial and legal compliance of the plan; and |
| |
| • | | recommending changes to its Terms of Reference. |
The Committee held six meetings.
Members: M. Zwarts (Chair), P. Gobeil, B.G. Heffernan, J. Landry and D.G. Unruh.
The Risk Management Committee assists the Board in overseeing the management of credit, market and other enterprise risks, including establishing and updating an effective regime governing authorizations required by EDC to undertake its business activities. Areas of particular focus included:
| • | | reviewing the status of various portfolio management activities and initiatives; |
| |
| • | | reviewing particulars of the renewal of a reinsurance treaty covering the short-term insurance portfolio; |
| |
| • | | reviewing and recommending re-approval of risk management policy frameworks; |
| |
| • | | reviewing progress towards implementation of strategic portfolio and capital management under a fully integrated economic capital model, which would include elements of both business risk and strategic risk in a comprehensive capital management project; and |
| |
| • | | reviewing progress towards implementation of an Operational Risk Management framework. |
The Committee held nine meetings.
Members: R. Fleming (Chair), R. Fung, B.G. Heffernan, L. Lachapelle, J. Landry and R. Wright.
BOARD REMUNERATION:
Directors from the private sector including the Chair are paid an annual retainer as well as a per diem for meetings they attend and for other executive responsibilities as the Board determines. Public service directors receive no remuneration. Retainer and per diem amounts are set by Order in Council supplemented by government guidelines. The following guidelines apply:
| • | | Chair of the Board: retainer of $12,400 and per diem of $485. |
| |
| • | | Other Board members: retainer of $6,200 and per diem of $485. |
| |
| • | | Chairs of Committees (other than the Executive Committee) and Vice-Chair of the Board: additional retainer of $2,000 per position.
|
| |
| • | | Directors are also reimbursed for reasonable out-of-pocket expenses including travel, accommodation and meals while performing their duties. |
On average, private sector directors served on 2.6 committees of the Board. There were six Board meetings in 2005 and 44 Committee meetings. The total remuneration (consisting of annual retainers which are pro-rated for the portion of the year each director was a member or chaired a Committee plus per diems which are paid for attendance at and preparation for meetings) that was paid to private sector directors was $237,531 compared to $278,083 in 2004. The total business travel and promotion expenses paid to members of the Board as well as meeting expenses for the Board and Committees were $158,320 compared to $161,175 recorded in 2004 (both figures being exclusive of the expenses of the President). The total expenses for business promotion, travel, conference and Team Canada fees for EDC’s President and CEO was $60,160 compared to $59,340 in 2004.
EDC Annual Report 2005
51
CORPORATE GOVERNANCE
Table of Directors’ attendance at meetings of the Board, and of Board Committees in 2005
| | | | | | | | | | | | | | | | | | | | | | | | | | | | | | | | | |
| | | | | | | | | | | Nominating | | | | | | | | | | | | | | | | |
| | | | | | | | | | | & Corporate | | | | | | | | | | | | | | | | |
| | | Audit-6 | | | BDC-6 | | | Governance-5 | | | Exec-5 | | | HR-7 | | | Pension-6 | | | Risk-9 | | | Board-6 | |
Boothe1 | | | n/a | | | | n/a | | | | n/a | | | | n/a | | | | n/a | | | | n/a | | | | n/a | | | | 4/4 | |
| Boudreau | | | n/a | | | | 5/6 | | | | 3/3 | | | | 2/2 | | | | 4/4 | | | | n/a | | | | n/a | | | | 5/6 | |
Doucett2 | | | n/a | | | | 1/1 | | | | 1/1 | | | | n/a | | | | 2/2 | | | | n/a | | | | n/a | | | | 1/1 | |
| Fleming | | | 5/6 | | | | 4/4 | | | | 2/2 | | | | 3/3 | | | | n/a | | | | 2/2 | | | | 9/9 | | | | 6/6 | |
| Fonberg | | | n/a | | | | n/a | | | | n/a | | | | 5/5 | | | | 5/7 | | | | n/a | | | | n/a | | | | 5/6 | |
| Fung | | | 3/6 | | | | 5/6 | | | | n/a | | | | n/a | | | | n/a | | | | n/a | | | | 4/6 | | | | 5/6 | |
Gobeil13 | | | 2/2 | | | | 1/1 | | | | 4/4 | | | | 3/3 | | | | 5/5 | | | | 4/5 | | | | 5/5 | | | | 5/5 | |
| Heffernan | | | 6/6 | | | | n/a | | | | n/a | | | | n/a | | | | n/a | | | | 6/6 | | | | 5/6 | | | | 6/6 | |
Holt3 | | | 2/2 | | | | n/a | | | | n/a | | | | n/a | | | | 3/3 | | | | 2/2 | | | | 3/3 | | | | 2/2 | |
Lachapelle4 | | | 2/2 | | | | n/a | | | | n/a | | | | n/a | | | | n/a | | | | n/a | | | | 3/3 | | | | 3/3 | |
Landry5 | | | n/a | | | | n/a | | | | n/a | | | | n/a | | | | n/a | | | | 3/4 | | | | 5/6 | | | | 5/5 | |
MacDonald6 | | | 1/3 | | | | 2/3 | | | | 1/1 | | | | 1/2 | | | | 3/3 | | | | 1/1 | | | | 3/4 | | | | 2/3 | |
Pattillo7 | | | 0/1 | | | | n/a | | | | 1/1 | | | | 2/2 | | | | n/a | | | | n/a | | | | n/a | | | | 2/3 | |
Ross8 | | | n/a | | | | n/a | | | | n/a | | | | 2/2 | | | | 1/1 | | | | 1/1 | | | | 2/2 | | | | 1/1 | |
| Setlakwe | | | n/a | | | | 6/6 | | | | 3/3 | | | | n/a | | | | 6/7 | | | | n/a | | | | n/a | | | | 6/6 | |
So9 | | | n/a | | | | n/a | | | | 3/3 | | | | n/a | | | | 3/3 | | | | n/a | | | | n/a | | | | 4/4 | |
Szel10 | | | 4/4 | | | | 4/4 | | | | n/a | | | | n/a | | | | n/a | | | | n/a | | | | n/a | | | | 4/5 | |
Unruh11 | | | n/a | | | | n/a | | | | n/a | | | | n/a | | | | 2/3 | | | | 1/2 | | | | n/a | | | | 3/3 | |
Wright12 | | | n/a | | | | 4/5 | | | | n/a | | | | 2/3 | | | | 5/5 | | | | n/a | | | | 6/7 | | | | 5/5 | |
| Zwarts | | | 4/4 | | | | 1/2 | | | | 4/5 | | | | n/a | | | | n/a | | | | 4/4 | | | | n/a | | | | 5/6 | |
| | |
| 1 | | Mr. Boothe ceased to be a member of the Board October 30. |
| |
| 2 | | Mr. Doucett ceased to be a member of the Board February 23. |
| |
| 3 | | Mr. Holt ceased to be a member of the Board May 11. |
| |
| 4 | | Mrs. Lachapelle was appointed to the Board June 23 and to the Audit Committee and Risk Management Committee September 7.
|
| |
| 5 | | Ms. Landry was appointed to the Board February 24 and to the Pension Committee and Risk Management Committee May 6. |
| |
| 6 | | Mr. MacDonald was appointed Acting Chairperson from January 1 to March 29 and he ceased to be a member of the Board June 22. |
| |
| 7 | | Mr. Pattillo ceased to be a member of the Board April 25. |
| |
| 8 | | Mr. Ross ceased to be Acting President April 7.
|
| |
| 9 | | Ms. So was appointed to the Board May 12 and to the Nominating and Corporate Governance Committee and the Human Resources Committee June 22. |
| |
| 10 | | Ms. Szel was appointed to the Board April 26 and to the Audit Committee and Business Development Committee May 6. |
| |
| 11 | | Mr. Unruh was appointed to the Board August 29 Human Resources Committee and Pension Committee September 7. |
| |
| 12 | | Mr. Wright was appointed President and to the Board of Directors April 8. |
| |
| 13 | | Pursuant to EDC’s by-law the Chair is counted as a member when he attends meetings of Committees to which he has not been officially appointed. Mr. Gobeil’s previous appointment expired December 31, 2004 and he was reappointed March 29, 2005. |
It’s About More Than Exporting
52
2005 FINANCIAL REVIEW
2005 Financial Review
EDC Annual Report 2005
53
MANAGEMENT’S DISCUSSION AND ANALYSIS
Operating Highlights
INCOME STATEMENT DISCUSSION
NET INCOME
EDC’s net income in 2005 was $1,287 million, an increase from $1,242 million in 2004. Key components affecting net income were:
| • | | reduction in net financing and investment income |
| |
| • | | sovereign loan prepayments |
| |
| • | | reversal of provisions |
| |
| • | | an unrealized fair value adjustment |
Each of these components is more fully described below.
Reduction in Net Financing and Investment Income — EDC’s net financing and investment income for 2005 declined by 7% to $848 million from the 2004 level of $909 million. Excluding the effect of sovereign loan prepayments discussed below, the decline was actually 18%. The decrease is primarily due to an overall reduction of interest earning assets, higher funding costs and a stronger Canadian dollar. This is discussed in more detail on page 55.
Sovereign Loan Prepayments — The reductions in net financing and investment income as discussed above were partially offset by a $94 million increase in income as a result of sovereign loan prepayments. This relates to the recognition of non-accrued capitalized interest as a result of sovereign loan prepayments of $424 million during 2005.
Reversal of Provisions — EDC reversed provisions for credit losses in 2005 of $513 million compared to a $214 million reversal in 2004. The 2005 reversal of provisions is primarily due to:
| • | | Improvements in the credit environment. During the past year, with the exception of the aerospace industry, the credit environment has generally improved resulting in a release of provisions of $145 million. The impact of the improved credit environment is more fully described in the allowance section on page 74. |
| |
| • | | Reduced loans portfolio. In 2005 EDC’s loan portfolio was reduced as a result of loan repayments exceeding disbursements by $1,274 million thereby resulting in an additional release of provisions of $124 million. |
| |
| • | | EDC’s aerospace portfolio. During 2005, three of EDC’s airline obligors, Delta Airlines, Northwest Airlines, and Flyi Inc. (Delta, Northwest and Flyi) went into bankruptcy protection. EDC was already adequately provisioned in its aerospace portfolio and these bankruptcies did not result in a charge to the income statement as no additional provisions were required to be taken. The details of these airline bankruptcies are more fully described on page 70. Also in 2005, EDC entered into an insurance policy to insure a material portion of EDC’s aerospace portfolio relating to regional jets. The insurance policy effectively upgraded the credit quality of $1.1 billion of EDC’s exposure in the aerospace sector which resulted in a release of provisions of $124 million. This insurance policy is more fully described on page 76. |
Unrealized Fair Value Adjustment — EDC’s income for 2005 includes an unrealized fair value loss of $48 million compared to an unrealized fair value gain of $143 million reported in 2004. Accounting standards require derivative financial instruments which do not qualify as hedges to be carried at fair value on the balance sheet with changes in fair value reflected on the income statement. While this may appear to create gains and losses at any given reporting date throughout the life of the derivative, these are unrealized gains and losses. EDC does not anticipate realizing any gains or losses on these derivatives since they are intended to be held to maturity and cumulative unrealized fair value adjustments on individual derivative instruments will net to zero over the life of the instrument. The Canadian Institute of Chartered Accountants (CICA) has introduced a new accounting standard for financial instruments which will become effective for EDC in 2007. This new standard will allow the financial instruments with which the derivatives are associated, to be measured at fair value, thereby reducing the income volatility resulting from carrying derivatives at fair value. The new accounting standard is more fully described in the future accounting changes section on page 83.
Administrative expenses, another component of operating income, were $182 million in 2005, an increase of only 2% over the 2004 level of $178 million despite a 5% increase in business volume in 2005.
The following table outlines net income and return on shareholder’s equity over the last five years:
| | | | | | | | | | | | | | | | | | | | | |
| ($ in millions) | | 2005 | | | 2004 | | | 2003 | | | 2002 | | | 2001 | |
| |
| Net income | | | 1,287 | | | | 1,242 | | | | 158 | | | | 122 | | | | 58 | |
| Shareholder’s equity | | | 4,764 | | | | 3,477 | | | | 2,235 | | | | 2,077 | | | | 2,050 | |
| |
| Return (%) on shareholder’s equity | | | 27.0 | % | | | 35.7 | % | | | 7.1 | % | | | 5.9 | % | | | 2.8 | % |
| |
It’s About More Than Exporting
54
MANAGEMENT’S DISCUSSION AND ANALYSIS
IMPACT OF FOREIGN EXCHANGE TRANSLATION ON 2005 RESULTS
The following table illustrates the impact of foreign exchange on EDC’s balance sheet and income statement items that were significantly affected by the strengthening of the Canadian dollar in 2005. As a result of the stronger Canadian dollar, the average US dollar exchange rate declined from $1.30 in 2004 to $1.21 in 2005. The impact of this decline reduced net income as well as assets and liabilities which are primarily denominated in US dollars. The other (non foreign exchange related) factors which contributed to the variances will be discussed as applicable throughout the management’s discussion and analysis.
| | | | | | | | | | | | | | | | | |
| | | | | | | Increase/ | | | Foreign | | | | |
| | | | | | | (decrease) | | | exchange | | | | |
| ($ in millions) | | 2005 | | | from 2004 | | | impact | | | Other | |
| |
Income statement components | | | | | | | | | | | | | | | | |
| Financing and investment income | | | 1,342 | | | | 88 | | | | (68 | ) | | | 156 | |
| Interest expense | | | 494 | | | | 149 | | | | (40 | ) | | | 189 | |
| |
| Net financing and investment income | | | 848 | | | | (61 | ) | | | (28 | ) | | | (33 | ) |
| Provision for (reversal of) credit losses | | | (513 | ) | | | 299 | | | | 51 | | | | 248 | |
| Net income | | | 1,287 | | | | 45 | | | | (98 | ) | | | 143 | |
| |
| | | | | | | | | | | | | | | | | |
Balance sheet components | | | | | | | | | | | | | | | | |
| Gross loans receivable | | | 17,350 | | | | (2,113 | ) | | | (669 | ) | | | (1,444 | ) |
| Total allowance for losses on loans, loan commitments and guarantees | | | 2,379 | | | | (743 | ) | | | (85 | ) | | | (658 | ) |
| Loans payable | | | 13,424 | | | | (2,121 | ) | | | (602 | ) | | | (1,519 | ) |
| Total assets | | | 19,729 | | | | (1,021 | ) | | | (635 | ) | | | (386 | ) |
| |
NET FINANCING AND INVESTMENT INCOME
Net Finance Margin
The net finance margin represents net financing and investment income expressed as a percentage of average performing assets employed. Net financing and investment income, which in prior years was referred to as net interest income, represents loan income and investment portfolio income net of interest expense. Although the spread between loan income and interest expense declined as a result of higher funding costs, EDC’s overall net finance margin increased from 4.12% in 2004 to 4.18%. This increase in the net finance margin can be attributed to two atypical events that occurred in 2005, most notably the recognition of non-accrued capitalized interest resulting from large unprecedented sovereign loan prepayments and an increase in debt relief income. Excluding the effect of these two events, the net finance margin actually declined by 55 basis points.
The following table provides a breakdown of the items that contributed to the change in the net finance margin compared to 2004:
| | | | | |
| Basis points | | 2005 | |
| |
| Decrease due to higher funding costs | | | (78 | ) |
| Increase in interest reversals on impaired loans | | | (6 | ) |
| Decrease in impaired income | | | (3 | ) |
| Increase in investment portfolio income | | | 32 | |
| |
| Subtotal: | | | (55 | ) |
| | | | | |
| Increase in income from sovereign loan prepayments | | | 48 | |
| Increase in debt relief income | | | 13 | |
| |
| Net increase in net finance margin | | 6 | bp |
| |
EDC Annual Report 2005
55
MANAGEMENT’S DISCUSSION AND ANALYSIS
In 2005 EDC continued to fund a portion of its fixed rate borrowing requirements with short-term debt. Although this was still advantageous, the benefit was somewhat diminished because of higher short-term interest rates. Short-term debt is much more sensitive to interest rate changes than the corresponding loan assets which it funds. As a result of increasing market rates, funding costs increased faster than loan yields, reducing the margin by 78 basis points. Increased interest reversals on loan impairments, which were mainly related to EDC’s aerospace portfolio, further reduced the net finance margin by 6 basis points. These negative forces on the margin were partially offset by investment portfolio income, which increased significantly primarily as a result of a larger portfolio and a shift to higher yielding longer-term investments. This resulted in a 32 basis point increase to the overall finance margin.
Increased recognition of income from the amortization of non-accrued capitalized interest resulted in a 48 basis point increase in the net finance margin. This increase was due to large unprecedented sovereign loan prepayments of $424 million in 2005 from Peru, Poland and Russia.
Increased debt relief income in 2005 pertaining to amounts received for Cameroon, Honduras and Democratic Republic of the Congo, contributed an additional 13 basis points to the net finance margin.
| | | | | | | | | | | | | | | | | | | | | |
| ($ in millions) | | 2005 | | | 2004 | | | 2003 | | | 2002 | | | 2001 | |
| |
| Average gross loans receivable | | | 18,820 | | | | 20,716 | | | | 23,493 | | | | 24,790 | | | | 22,982 | |
| Average investment portfolio balance | | | 3,980 | | | | 3,104 | | | | 2,669 | | | | 2,759 | | | | 2,840 | |
| Less: average impaired loans | | | 2,531 | | | | 1,747 | | | | 2,031 | | | | 1,914 | | | | 1,596 | |
| |
| Total average assets employed | | | 20,269 | | | | 22,073 | | | | 24,131 | | | | 25,635 | | | | 24,226 | |
| |
| Financing and investment income: | | | | | | | | | | | | | | | | | | | | |
| Loans | | | 1,155 | | | | 1,148 | | | | 1,249 | | | | 1,400 | | | | 1,618 | |
| Debt relief | | | 64 | | | | 43 | | | | 56 | | | | 96 | | | | 1 | |
| Investment portfolio | | | 123 | | | | 63 | | | | 60 | | | | 69 | | | | 127 | |
| |
| Total financing and investment income | | | 1,342 | | | | 1,254 | | | | 1,365 | | | | 1,565 | | | | 1,746 | |
| Interest expense | | | 494 | | | | 345 | | | | 404 | | | | 583 | | | | 934 | |
| |
| Net financing and investment income | | $ | 848 | | | $ | 909 | | | $ | 961 | | | $ | 982 | | | $ | 812 | |
| |
| Net finance margin | | | 4.18 | % | | | 4.12 | % | | | 3.98 | % | | | 3.83 | % | | | 3.35 | % |
| |
Loan Income
The following table analyzes loan income as a percentage of the average loans receivable:
| | | | | | | | | | | | | | | | | | | | | |
| ($ in millions) | | 2005 | | | 2004 | | | 2003 | | | 2002 | | | 2001 | |
| |
| Gross loans receivable: | | | | | | | | | | | | | | | | | | | | |
| Average performing fixed rate | | | 9,028 | | | | 10,298 | | | | 11,110 | | | | 11,969 | | | | 10,235 | |
| Average performing floating rate | | | 7,261 | | | | 8,671 | | | | 10,352 | | | | 10,907 | | | | 11,151 | |
| |
| Average performing gross loans receivable | | | 16,289 | | | | 18,969 | | | | 21,462 | | | | 22,876 | | | | 21,386 | |
| |
| Loan income: | | | | | | | | | | | | | | | | | | | | |
| Performing fixed rate interest | | | 566 | | | | 678 | | | | 757 | | | | 837 | | | | 736 | |
| Performing floating rate interest | | | 327 | | | | 273 | | | | 320 | | | | 401 | | | | 684 | |
| Other loan income | | | 262 | | | | 197 | | | | 172 | | | | 162 | | | | 198 | |
| |
| Loan income | | | 1,155 | | | | 1,148 | | | | 1,249 | | | | 1,400 | | | | 1,618 | |
| Debt relief income | | | 64 | | | | 43 | | | | 56 | | | | 96 | | | | 1 | |
| |
| Loan income (including debt relief) | | $ | 1,219 | | | $ | 1,191 | | | $ | 1,305 | | | $ | 1,496 | | | $ | 1,619 | |
| |
| Yields — performing loans | | | | | | | | | | | | | | | | | | | | |
| Performing fixed rate coupon | | | 6.27 | % | | | 6.58 | % | | | 6.81 | % | | | 6.99 | % | | | 7.19 | % |
| Performing floating rate coupon | | | 4.50 | % | | | 3.15 | % | | | 3.09 | % | | | 3.68 | % | | | 6.13 | % |
| Total loan interest yield | | | 7.48 | % | | | 6.28 | % | | | 6.08 | % | | | 6.54 | % | | | 7.57 | % |
| |
The overall average performing loans receivable balance declined 14% from $18,969 million in 2004 to $16,289 million in 2005 primarily as a result of loan repayments exceeding disbursements, impairments in the aerospace portfolio and the stronger Canadian dollar. Despite this decrease, loan income actually increased by 2% or $28 million to $1,219 million. This increase was due to two atypical events during the year which are discussed on the following page. Excluding these events, loan income actually decreased by $87 million in 2005.
It’s About More Than Exporting
56
MANAGEMENT’S DISCUSSION AND ANALYSIS
Components of the change in loan income from 2004
| | | | | |
| ($ in millions) | | 2005 | |
| |
| Volume decreases | | | (95 | ) |
| Foreign exchange impact | | | (64 | ) |
| Decrease in impaired income from revaluations | | | (28 | ) |
| Loan yield increases | | | 83 | |
| Increase in other impaired income | | | 17 | |
| |
| Decrease before effect of prepayments | | | (87 | ) |
| Increase in income from sovereign prepayments | | | 94 | |
| Increase in debt relief income | | | 21 | |
| |
| Net change in loan income | | $ | 28 | |
| |
The $87 million decrease in loan income was a result of several offsetting factors. There was a decrease in loan interest revenue and fees of $95 million due to a reduction in the average volume of the performing loan portfolio from 2004, while the strengthening of the Canadian dollar accounted for an additional reduction in loan income of $64 million. Periodically the Corporation revalues its impaired sovereign loans to ensure that their carrying value is appropriate, as further discussed on page 71. Income recognized as a result of this revaluation was $28 million lower than in 2004. Offsetting these reductions in loan income were increased interest rates mainly on EDC’s floating rate portfolio which contributed $83 million more loan revenue in 2005 versus 2004. The reductions in loan income were further offset by $17 million mainly resulting from payments received on impaired loans that were subsequently made performing.
Two events which impacted loan income in 2005 were a $94 million increase in income from the amortization of non-accrued capitalized interest as a result of the prepayments on sovereign performing loans as discussed below and an increase of $21 million in debt relief income.
Performing fixed rate loans receivable averaged $9,028 million in 2005 down from $10,298 million in 2004. Loan repayments exceeding disbursements and impairments in EDC’s aerospace portfolio contributed to a $671 million reduction in the fixed rate average balance, while the stronger Canadian dollar accounted for an additional $599 million decrease. The average coupon yield was down in 2005 to 6.27% (2004 — 6.58%), earning interest of $566 million (2004 — $678 million). The coupon on performing fixed rate loans receivable decreased over last year as older loans earning higher interest rates were repaid and replaced by current loan disbursements carrying lower interest rates. Disbursements during the year yielded 5.60% while existing loans repaid carried a yield of 6.79%. New fixed rate loans signed in 2005 yielded 5.13%.
Performing floating rate loans receivable averaged $7,261 million in 2005 down from $8,671 million in 2004. As in the fixed rate portfolio above, net repayments and impairments contributed to a $956 million reduction in the floating rate average balance, while the stronger Canadian dollar accounted for an additional $454 million reduction. However, unlike the fixed rate portfolio, the floating rate portfolio earned higher interest in 2005 versus 2004 ($327 million versus $273 million). This was a result of the increase in the average coupon rate from 3.15% in 2004 to 4.50% in 2005. Increases in both LIBOR and the spread EDC earned on its floating rate loans contributed to the overall increase in the average coupon rate. The six month moving average US dollar LIBOR was 3.34% in 2005, an increase of 179 basis points from the 2004 average. Disbursements on floating rate loans yielded 1.72% over LIBOR while repayments carried a yield of 1.65% over LIBOR. New floating rate loans signed in 2005 yielded 1.64% over LIBOR compared with 1.50% in 2004.
Other loan income increased from $197 million in 2004 to $262 million in 2005 primarily due to the $94 million increase in the amortization of non-accrued capitalized interest in 2005 as a result of large loan prepayments from Peru, Poland and Russia. The impact of the loan prepayments was partially offset by decreases in fees, impaired and other loan income of $29 million. This includes $17 million (2004 — $45 million) related to non-accrued capitalized interest income resulting from the revaluation of impaired loans with Serbia-Montenegro ($11 million), Ecuador ($3 million) and Gabon ($3 million).
EDC Annual Report 2005
57
MANAGEMENT’S DISCUSSION AND ANALYSIS
Investment Portfolio Income
EDC’s investment portfolio income consists of income earned on marketable securities, investments and government treasury bills. Investment portfolio income was $123 million in 2005, an increase of $60 million from 2004. As shown in the table below, increasing interest rates was the primary driver behind the increase in income in 2005. Higher volumes also contributed to the increase. These factors were partially offset by the continued strength of the Canadian dollar relative to the US dollar.
Investment yields increased from 2.02% in 2004 to 3.08% in 2005. This increase reflects higher average US and Canadian interest rates during 2005 as well as a shift to higher yielding long term investments.
The Corporation maintains an investment portfolio to support the liquidity requirements of EDC. EDC’s liquidity policy requires that the Corporation maintain, at a minimum, enough liquidity to satisfy six months of anticipated cash flows plus a buffer of 10% to 15% for any unanticipated requirements.
The average investment balances increased from $3,104 million in 2004 to $3,980 million in 2005. Traditionally EDC’s borrowings to support cash requirements are largely executed in the first half of the year as market conditions are generally more favourable during this time frame. The proceeds from these borrowings are used to support loan disbursements as forecasted in the Corporate Plan. In 2005, disbursements were lower than projected and there was an unprecedented level of prepayments. As a result, the borrowing proceeds were temporarily placed in high quality investments and will be used to support future loan disbursement activity.
Components of the change in investment portfolio income from 2004
| | | | | |
| ($ in millions) | | 2005 | |
| |
| Yield increases | | | 42 | |
| Volume increases | | | 22 | |
| Foreign exchange impact on investment portfolio income | | | (4 | ) |
| |
| Net change in investment portfolio income | | $ | 60 | |
| |
Interest Expense
Interest expense totaled $494 million in 2005, an increase of $149 million from 2004. This change is largely a result of an increase in the general level of interest rates partially offset by the stronger Canadian dollar in 2005.
Average cost of funds increased from 2.20% in 2004 to 3.44% in 2005. This increase reflects the higher levels of interest rates both in Canada and the United States in 2005 relative to 2004.
Continued strengthening of the Canadian dollar during 2005 decreased interest expense on foreign currency denominated debt by $40 million.
Components of the change in interest expense from 2004
| | | | | |
| ($ in millions) | | 2005 | |
| |
| Cost of funds increases | | | 193 | |
| Foreign exchange impact on interest expense | | | (40 | ) |
| Volume change impact on interest expense | | | (4 | ) |
| |
| Net change in interest expense | | $ | 149 | |
| |
It’s About More Than Exporting
58
MANAGEMENT’S DISCUSSION AND ANALYSIS
Floating rate debt averaged $11,961 million in 2005 (2004 — $12,759 million). The increase in the general level of interest rates had a significant impact on the floating rate debt portfolio with the average cost of funds increasing from 1.41% in 2004 to 3.10% in 2005, resulting in interest expense of $371 million in 2005 (2004 — $180 million). The stronger Canadian dollar in 2005 resulted in a $988 million decrease in the average balance. This was partially offset by an increase of $190 million in volume of short-term debt.
Fixed rate debt averaged $2,406 million for the year (2004 — $2,944 million) at an average cost of 5.06% (2004 — 5.33%), resulting in interest expense of $122 million (2004 — $157 million). Reduced borrowing requirements accounted for $357 million of the decrease in the average fixed rate debt balance. The remaining $181 million of the decrease is the result of the strengthening of the Canadian dollar.
Total interest expense includes other costs of $1 million (2004 — $8 million).
INSURANCE PREMIUMS AND GUARANTEE FEES
The following table analyzes the average premium rate for insurance premiums and guarantee fees:
| | | | | | | | | | | | | | | | | |
| ($ in millions) | | 2005 | | | 2004 | |
| | | $ | | | % | | | $ | | | % | |
| |
| Short-term insurance program: | | | | | | | | | | | | | | | | |
| Short-term insurance average exposure | | | 46,719 | | | | | | | | 45,010 | | | | | |
| Premiums and fees earned | | | 110 | | | | | | | | 113 | | | | | |
| |
| Average short-term premium rate | | | | | | | 0.24 | | | | | | | | 0.25 | |
| |
| Medium-term insurance program: | | | | | | | | | | | | | | | | |
| Medium-term insurance average exposure | | | 6,247 | | | | | | | | 5,661 | | | | | |
| Premiums and fees earned | | | 37 | | | | | | | | 40 | | | | | |
| |
| Average medium-term premium rate | | | | | | | 0.59 | | | | | | | | 0.71 | |
| |
| Loan guarantees: | | | | | | | | | | | | | | | | |
| Loan guarantees average exposure | | | 2,758 | | | | | | | | 2,582 | | | | | |
| Loan guarantee fees earned | | | 9 | | | | | | | | 8 | | | | | |
| |
| Average loan guarantee fee rate | | | | | | | 0.33 | | | | | | | | 0.31 | |
| |
While the insurance portfolio experienced growth in 2005, the impact of this growth in volumes was partially offset by the strengthening of the Canadian dollar. Short-term average exposure was reduced by approximately $2,336 million from 2004 and the average exposure for the medium-term insurance program decreased by approximately $345 million from 2004 due to the impact of foreign exchange translation.
Short-term insurance premium revenue decreased by $3 million over 2004, $1 million of which can be attributed to a decline in revenue on the St. Paul Guarantee Insurance Company (SPG) reinsured domestic policies. The SPG reinsurance agreement, effective September 1, 2003, was put in place as a bridging arrangement after SPG announced its intention to withdraw from the domestic accounts receivable insurance business. The agreement allowed for continued domestic cover for qualified export policyholders while EDC put in place a longer term solution for the provision of domestic cover. EDC entered into an agreement with its new domestic partner, Compagnie Franchise d’Assurance pour le Commerce Exterieur SA (Coface), on July 1, 2005. Under the agreement EDC will cease to offer domestic cover, as Coface will cover domestic receivables while EDC covers export receivables under a joint policy administered by EDC. As a result of the Coface agreement, the reinsurance assumed through the SPG bridging agreement will decrease substantially in 2006 as policies with domestic cover are migrated to joint Coface/EDC cover on their anniversary date. The migration should be completed by 2007. No new policies with domestic cover involving SPG have been issued since July 1, 2005 and the reinsurance agreement will end when all existing policies have been migrated. The short-term insurance average exposure increased by $1,709 million for 2005 over 2004 due to large increases in volume reported for energy sector policies.
Medium-term insurance premium revenue for the year totaled $37 million, a decrease of 8% over 2004. The average exposure in the medium-term insurance programs increased by $586 million or 10% over 2004 results, primarily due to increases in exposure in the performance security, specific transaction, and political risk insurance programs.
Over the past two years, signings of new loan guarantees outpaced loan guarantee maturities by $294 million, resulting in an increase in the average balance of loan guarantees in 2005. This was partially offset by the strengthening of the Canadian dollar.
EDC Annual Report 2005
59
MANAGEMENT’S DISCUSSION AND ANALYSIS
OTHER INCOME (EXPENSE)
The following table breaks down the components of other income (expense):
| | | | | | | | | |
| ($ in millions) | | 2005 | | | 2004 | |
| |
| Foreign exchange translation gain (loss) | | | 7 | | | | (10 | ) |
| Post-maturity interest gains on claims recoveries | | | 2 | | | | 3 | |
| Unrealized gain (loss) on marketable securities | | | (5 | ) | | | 2 | |
| Realized loss on the sale of marketable securities | | | (4 | ) | | | (1 | ) |
| Realized loss on the sale of financing assets | | | — | | | | (1 | ) |
| |
| Total other income (expense) | | $ | — | | | $ | (7 | ) |
| |
Other income in 2005 includes a foreign exchange translation gain of $7 million and a $2 million post-maturity interest gain on claims recoveries. These amounts were offset by an unrealized loss of $5 million due to the change in fair value of marketable securities in EDC’s trading portfolio and a loss of $4 million on the sale of marketable securities with a face value of $574 million, from both the trading and held-to-maturity portfolios.
EDC’s liquidity policy exists to enhance the ability to meet liquidity demands in US dollars in the event of unexpected disruptions in the capital markets. As part of the implementation of the liquidity policy, the sale of marketable securities in 2005 was done in order to re-balance the portfolio to the benchmark index. Re-balancing the portfolio requires the sale of securities that could result in a gain or loss. Given the rise in yields since the inception of the liquidity investment portfolio, most of the portfolio’s securities are below par value and sales have been required to minimize the duration risk (interest rate risk) of the portfolio relative to the benchmark index.
Post-maturity interest gains on claims recoveries are defined as the penalty rate of interest charged in the event of default in payments under the terms of the insurance agreement and are recognized when the Corporation has recovered the entire principal amount of a claim.
PROVISION FOR (REVERSAL OF) CREDIT LOSSES
The following table provides a breakdown of the provision for (reversal of) credit losses over the last five years:
| | | | | | | | | | | | | | | | | | | | | |
| ($ in millions) | | 2005 | | | 2004 | | | 2003 | | | 2002 | | | 2001 | |
| |
| Provision for (reversal of) credit losses pertaining to: | | | | | | | | | | | | | | | | | | | | |
| Loans | | | (471 | ) | | | (361 | ) | | | 471 | | | | 930 | | | | 208 | |
| Loan commitments | | | (34 | ) | | | 10 | | | | 84 | | | | (231 | ) | | | 521 | |
| Loan guarantees | | | (49 | ) | | | 39 | | | | 89 | | | | 26 | | | | (71 | ) |
| |
| Total loan related provisions | | | (554 | ) | | | (312 | ) | | | 644 | | | | 725 | | | | 658 | |
| Insurance provision | | | 41 | | | | 98 | | | | 140 | | | | 115 | | | | 83 | |
| |
| Total provision for (reversal of) credit losses | | $ | (513 | ) | | $ | (214 | ) | | $ | 784 | | | $ | 840 | | | $ | 741 | |
| |
A net reversal of loan related provisions of $554 million (2004 — $312 million provision reversal) was made to the income statement to reflect a reduction in the estimated level of impairment to the loans portfolio. The reversal was primarily the result of a shrinking portfolio, improving credit quality and the effect of the risk mitigation insurance (further discussed on page 76).
During the year, there was a $41 million charge (2004 — $98 million charge) to the income statement for the provision for insurance claims mainly due to increased exposure resulting from increased volumes in the medium-term and political risk insurance programs. This was partially offset by a decrease in the short-term insurance program and by a decrease in the reinsurers’ share of EDC’s allowance for claims as a result of an actuarial review of the portfolio. As part of normal business practices, EDC reviews the allowance regularly to ensure it is aligned with standard actuarial practices in the insurance industry. In addition, $20 million of the provision charge was due to the write-off of recoverable claims in 2005 (2004 — $48 million).
It’s About More Than Exporting
60
MANAGEMENT’S DISCUSSION AND ANALYSIS
ADMINISTRATIVE EXPENSES
Net administrative expenses for 2005 totaled $182 million, an increase of $4 million from the prior year. The increase is primarily the result of a 5% increase in human resources costs.
Expressed as a percentage of net revenue excluding debt relief (gross efficiency ratio), administrative expenses increased to 20.5% in 2005, from 18.5% in 2004. Gross efficiency ratio (GER) measures the operational efficiency of EDC as investments in people and technology are required to keep pace with the growth and complexity of the business. As illustrated in the graph, the GER has increased steadily since 2003, due to the decrease in net revenues.
CORPORATE PLAN DISCUSSION
COMPARISON WITH 2005 PLAN
Total export business volume for 2005 reached $57.4 billion which was slightly lower than the 2005 Corporate Plan volume of $57.8 billion. However, the Corporate Plan assumed an average US dollar exchange rate of 1.29 for the year, while the actual average exchange rate was 1.21. Had the US dollar remained at 1.29 during 2005, the actual reported business volume would have been approximately $60.3 billion, as over 75% of EDC’s business volume is denominated in US dollars.
Financing and leasing assets and loans payable were lower than Corporate Plan due to the appreciation of the Canadian dollar as well as lower loan disbursements and higher repayments in 2005.
Net income at $1,287 million in 2005 was $1,125 million higher than the 2005 Corporate Plan amount of $162 million.
Of this variance, $872 million is due to a reduction in credit loss provisioning requirements. Lower growth in the loans portfolio coupled with lower provisions required for credit migration resulted in a reduced requirement for loan provisions.
In addition, the 2005 unrealized fair value adjustment was a loss of $48 million compared to the 2005 Corporate Plan forecast loss of $335 million, resulting in net income increasing by $287 million.
Net finance and investment income of $848 million was $51 million lower than the Corporate Plan figure of $899 million mainly as a result of the appreciation of the Canadian dollar as well as the reduction in the size of the loan portfolio.
Administrative expenses of $182 million in 2005 were $14 million lower than the Corporate Plan figure of $196 million. Management worked diligently to keep administrative expenses lower than plan during 2005 in view of the decline occurring in net financing and investment income as discussed above. The gross efficiency ratio was 20.5%, which was lower than the Corporate Plan of 21.5% due to lower administrative expenses, partially offset by lower net revenues.
2006 CORPORATE PLAN
The Corporate Plan for 2006 projects export business volume to increase to $59.6 billion from $57.4 billion in 2005 primarily due to projected increases in financing and short-term export insurance volumes. Domestic insurance volumes are projected to decline by $3.2 billion in 2006 as this insurance business is being transferred to EDC’s new domestic partner, Coface.
The financing and leasing assets and loans payable balances are expected to increase from 2005 actuals by $3,064 million and $3,291 million respectively. This is mainly due to a projection of higher net disbursements in 2006.
Net income for 2006 is planned at $892 million. The decrease in net income compared to 2005 is mainly due to a smaller provision reversal in 2006 compared to 2005.
Administrative expenses are expected to increase by $30 million. An increase in human resources costs of $22 million represents the largest increase, of which, $13 million is due to an increase in pension costs, mainly due to a decrease in the discount rate to ensure management’s assumptions are consistent with current market conditions. In addition, continued focus on the customer will require more activity domestically as well as in foreign representations, resulting in an increase of approximately $3 million in areas such as travel, sales support and communication. Technology costs will also increase by approximately $3 million due to increased software maintenance and new IT subscription services around risk management. Other areas of increased spending relate to occupancy costs and insurance.
EDC Annual Report 2005
61
MANAGEMENT’S DISCUSSION AND ANALYSIS
| | | | | | | | | | | | | |
| | | 2006 | | | 2005 | | | 2005 | |
| | | Corporate Plan | | | Actual Results | | | Corporate Plan | |
| |
Volume | | | | | | | | | | | | |
($ in billions) | | | | | | | | | | | | |
| Financing | | | 6.3 | | | | 5.1 | | | | 6.3 | |
| Contract insurance and bonding | | | 5.8 | | | | 6.9 | | | | 5.7 | |
| Political risk insurance | | | 4.0 | | | | 3.9 | | | | 3.4 | |
| Short-term insurance * | | | 43.5 | | | | 41.5 | | | | 42.4 | |
| |
| Total export volume | | | 59.6 | | | | 57.4 | | | | 57.8 | |
| Domestic insurance | | | 2.2 | | | | 5.4 | | | | 2.7 | |
| |
| Total business volume | | $ | 61.8 | | | $ | 62.8 | | | $ | 60.5 | |
| |
| | | | | | | | | | | | | |
Balance Sheet | | | | | | | | | | | | |
($ in millions) | | | | | | | | | | | | |
| Assets | | | | | | | | | | | | |
| Financing and leasing assets | | | 19,475 | | | | 16,411 | | | | 21,223 | |
| Allowance for losses on loans** | | | (1,123 | ) | | | (2,024 | ) | | | (3,282 | ) |
| |
| | | | 18,352 | | | | 14,387 | | | | 17,941 | |
| Cash and marketable securities | | | 3,300 | | | | 3,182 | | | | 2,495 | |
| Investments | | | 70 | | | | 64 | | | | 70 | |
| Accrued interest and other assets | | | 480 | | | | 331 | | | | 621 | |
| Derivative related amounts | | | 1,785 | | | | 1,725 | | | | 1,293 | |
| Reinsurers’ share of allowance for claims | | | 59 | | | | 40 | | | | 120 | |
| |
| Total Assets | | $ | 24,046 | | | $ | 19,729 | | | $ | 22,540 | |
| |
| | | | | | | | | | | | | |
Liabilities and Shareholder’s Equity | | | | | | | | | | | | |
| Loans payable | | | 16,715 | | | | 13,424 | | | | 17,295 | |
| Accrued interest and other liabilities | | | 302 | | | | 317 | | | | 314 | |
| Allowance for loan commitments and guarantees | | | 610 | | | | 355 | | | | 493 | |
| Allowance for claims on insurance | | | 618 | | | | 536 | | | | 608 | |
| Derivative related amounts | | | 298 | | | | 333 | | | | 449 | |
| |
| Total Liabilities | | | 18,543 | | | | 14,965 | | | | 19,159 | |
| |
| Share capital | | | 983 | | | | 983 | | | | 983 | |
| Retained earnings | | | 4,520 | | | | 3,781 | | | | 2,398 | |
| |
| Shareholder’s Equity | | | 5,503 | | | | 4,764 | | | | 3,381 | |
| |
| Total Liabilities and Shareholder’s Equity | | $ | 24,046 | | | $ | 19,729 | | | $ | 22,540 | |
| |
| | | | | | | | | | | | | |
Statement of Income | | | | | | | | | | | | |
($ in millions) | | | | | | | | | | | | |
| Finance and investment income | | | | | | | | | | | | |
| Finance income | | | 1,226 | | | | 1,155 | | | | 1,223 | |
| Debt relief | | | 58 | | | | 64 | | | | 83 | |
| Investment portfolio income | | | 119 | | | | 123 | | | | 90 | |
| |
| Total finance and investment income | | | 1,403 | | | | 1,342 | | | | 1,396 | |
| Interest expense | | | 637 | | | | 494 | | | | 497 | |
| |
| Net finance and investment income | | | 766 | | | | 848 | | | | 899 | |
| Insurance premiums and guarantee fees | | | 151 | | | | 156 | | | | 147 | |
| Other income (expense) | | | (10 | ) | | | — | | | | 6 | |
| Provision for (reversal of) credit losses | | | (184 | ) | | | (513 | ) | | | 359 | |
| |
| Income after provision for (reversal of) credit losses | | | 1,091 | | | | 1,517 | | | | 693 | |
| Administrative expenses | | | 212 | | | | 182 | | | | 196 | |
| |
| Income before unrealized fair value adjustment | | | 879 | | | | 1,335 | | | | 497 | |
| Unrealized fair value adjustment | | | 13 | | | | (48 | ) | | | (335 | ) |
| |
| Net income | | $ | 892 | | | $ | 1,287 | | | $ | 162 | |
| |
| | |
| * | | excludes domestic insurance |
| |
| ** | | includes the offset for risk mitigation insurer’s share of loan allowance |
It’s About More Than Exporting
62
MANAGEMENT’S DISCUSSION AND ANALYSIS
Risk Management
ENTERPRISE RISK MANAGEMENT PROCESS
OVERVIEW
EDC strives to ensure that on a self-sustaining basis the Corporation has at all times sufficient financial capacity to support the ongoing fulfillment of its mandate and respond to the evolving needs of Canadian exporters and investors.
EDC’s risk management practices are guided by an Enterprise Risk Management Framework that provides a comprehensive view of the key risks it faces and tools to measure, monitor and manage them. At the corporate level, EDC produces a risk map which is updated every two years through a management survey to provide guidance in the management of risks that may impact EDC in the achievement of its business objectives.
Under the Enterprise Risk Management Framework, key risks are identified and managed under three risk pillars: credit, market and operational. The management of these risks is accomplished through EDC’s governance structure, policies and internal controls.
RISK GOVERNANCE
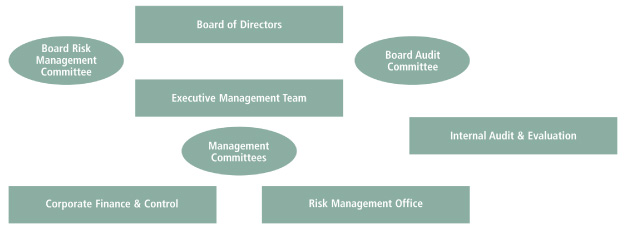
While the ongoing responsibilities for risk management are shared throughout the Corporation, they are clearly articulated with explicit accountability. The Board maintains overall responsibility for approval of risk management policies including the policies inherent in the Credit Risk Management Framework and the Market Risk Management Framework. The Board of Directors maintains oversight responsibilities for the management of the credit, market and other enterprise risks of the Corporation, as well as oversight of the appropriateness of internal control systems and policies governing Corporate Social Responsibility. The Risk Management Committee of the Board assists the Board in fulfilling its oversight responsibilities. The Board maintains overall responsibility for approval of the Corporation’s Code of Business Ethics and Code of Conduct and the Environmental Review Directive and also receives updates on internal and external audit work processes. The Audit Committee of the Board assists the Board in fulfilling its oversight responsibilities with respect to the Corporation’s standards of integrity and behaviour, financial reporting, internal control systems and environmental risk.
EDC Annual Report 2005
63
MANAGEMENT’S DISCUSSION AND ANALYSIS
The Executive Management Team has primary responsibility for the management of the Corporation’s risks, standards of integrity and behaviour, financial reporting, and internal control systems. The Executive Management Team undertakes this responsibility through various management oversight committees, by ensuring an appropriate organizational structure and governing policies are in place, and through independent validation by audit. The key Management Committees involved in the management of risk at EDC are highlighted below:
Management Risk Management Committee — provides an independent endorsement as to the acceptability of credit commitments and acts as the authority for recommending risk policies to the Board for approval, and establishing internal risk management policies and procedures.
Asset Liability Management Committee — acts as authority for recommending Market Risk Management policies to the Board for approval, and ensuring that policies are supported by appropriate procedures and practices for the measurement, management and reporting of market risk.
Risk Transfer Committee — acts as authority to approve recommendations for secondary risk transfer activities.
Mandate Committee — provides guidance on mandate and regulatory issues.
While all areas of EDC have some responsibility for risk management, three areas have primary responsibility: the Risk Management Office, Corporate Finance and Control, and Internal Audit and Evaluation.
CREDIT RISK
Credit Risk is the risk of loss incurred if a counterparty fails to meet its financial commitments. EDC is exposed to credit risk under its loans and insurance programs and treasury activities.
The foundation of credit risk management at EDC is the Credit Risk Management Framework which outlines the Corporation’s credit granting, concentration limits, risk rating, monitoring, portfolio management and risk transfer policies. This framework is reviewed annually by the Management Risk Management Committee and the Board Risk Management Committee and requires annual Board re-approval of the policies contained therein. In addition, the Market Risk Management Framework outlines the Corporation’s management of Credit Risk related to Treasury Counterparties.
Credit Granting
In order to better understand the credit risk associated with EDC’s individual credit commitments, the Corporation is organized into business teams along industry sectors. The business teams are responsible for the proper due diligence associated with each credit commitment. Within the business team structure, individuals have a delegation of approval authority based on relevant expertise and experience. Every credit commitment (except for very small amounts) requires the approval of at least two individuals with delegated approval authority.
The Endorsement Risk Classification System defines criteria for transaction endorsement based upon the principle that the higher the credit risk and/or exposure amount of a transaction, the higher it must be elevated for endorsement and authorization. The credit rating of a transaction and/or the dollar amount of exposure at risk therefore determines whether endorsement must be provided by the Management Risk Management Committee or the Risk Management Office. The purpose of the endorsement is to ensure all relevant, tangible risks in the proposed credit commitment have been identified and appropriately mitigated. Generally, financing/bonding requests with an internal or external credit rating below BBB, and below BB for short-term insurance limits, with exposures above US $25 million are endorsed by the Management Risk Management Committee prior to authorization. The Risk Management Office endorses transactions with higher credit ratings and lower dollar exposures. All transactions above US $200 million require authorization by the Board of Directors.
Treasury counterparties are analyzed and credit limits are recommended by Market Risk Management, a team within the Risk Management Office. Recommended counterparties are endorsed by either the Risk Management Office or Management’s Risk Management Committee. Every Treasury credit commitment requires the approval of at least two individuals with delegated approval authority. All Treasury credit exposures are measured on a mark to market basis and compliance with policy and operational limits is measured daily. The Department of Finance sets out guidelines that define the minimum acceptable counterparty credit rating pertaining to EDC’s investments and derivative financial instruments. In addition, EDC has policies and procedures in place to limit and to manage the credit risk associated with these financial instruments.
The Board of Directors receives reporting of the significant lending and insurance credits approved by management every quarter.
Concentration Limits
To ensure diversification of risks within EDC’s credit commitments, EDC has established risk limits in place to protect against over concentration to any one geographical area (i.e. country), industry sector and/or obligor. All limits are determined based on the Corporation’s capital base and risk factors associated with the exposure including, the obligor rating, country rating, associated collateral and product type. Exposures in excess of these limits require review by the Board Risk Management Committee and approval of the Board of Directors.
Risk Ratings
EDC has developed risk rating methodologies for all of its product lines. Many of the obligor risk rating methodologies use a combination of Moody’s and/or Standard & Poor’s external ratings and/or EDC’s internal ratings based (IRB) methodologies. Some of EDC’s IRB methodologies use vendor provided credit risk analysis/ratings tools such as Moody’s Financial Analyst, Risk Advisor, and RiskCalc. At the credit granting stage, substantially all obligors are rated (except for obligors with very small exposures typically representing less than 1% of total exposure).
It’s About More Than Exporting
64
MANAGEMENT’S DISCUSSION AND ANALYSIS
The obligor risk ratings are reviewed on a regular basis. The Economics Department is responsible for country ratings. Country risk is continually reviewed by the department to take into consideration any changes in the world environment or a specific country. EDC rates its obligors on a rating scale of between 8 and 16 credit grades depending on the product type.
With respect to Treasury related counterparties, each counterparty must be rated by at least two external rating agencies (i.e. Moody’s and Standard & Poor’s). The risk rating for Treasury counterparties is determined by the external ratings.
Monitoring
Operating practices at EDC include ongoing monitoring of credit exposures. Specialized teams have been created to monitor credit exposure within the different product lines which includes monitoring of events in the country and industry of the obligor. The Asset Management Team is responsible for managing the credit quality and financial performance of EDC’s portfolio of commercial loans and guarantees both at the transaction and portfolio levels. This specialized team undertakes loan reviews and risk ratings, and regularly monitors borrowers and the credit risk environment including research and assessment of financial, operating and industry trends. In addition, deteriorating credits are managed by teams that specialize in restructurings, Paris Club reschedulings, claims, and recoveries. Management and the Board of Directors are frequently apprised on the credit quality of the portfolio through regular reporting including quarterly detailed reporting on the breakdown of the portfolio by risk ratings, impaired obligors, loan write-offs and claims information.
Portfolio Management
The goal of portfolio management is to ensure the ability of EDC to pursue mandate related opportunities without being unduly constrained by a lack of financial resources or by limit constraints. Management and the Board of Directors are regularly updated on the Corporation’s portfolio of credit exposures through monthly compliance reporting against concentration limits. EDC uses both primary and secondary portfolio management activities to address imbalances or excess concentrations including, but not limited to, syndication at credit origination, the sale of assets, insurance, reinsurance, derivatives and a collateral program for swap counterparties.
CONCENTRATION OF EXPOSURE
The major concentrations of total gross commercial and sovereign exposure in the geographic market and country in which the risk resided at the end of 2005 are outlined as follows:
| | | | | | | | | | | | | | | | | | | | | | | | | | | | | | | | | |
| | | Loans portfolio | | | Contingent liabilities | | | Investments | | | | |
| | | | | | | | | | | | | | | | | | | | | | | and derivative | | | | |
| | | Gross loans | | | | | | | Short-term | | | Medium-term | | | Medium-term | | | financial | | | | |
| Country | | receivable | | | Commitments | | | insurance | | | insurance | | | guarantees(1) | | | instruments(2) | | | 2005 Exposure | |
| ($ in millions) | | | | | | | | | | | | | | | | | | | | | | | | | | $ | | | % | |
| |
| United States | | | 8,170 | | | | 1,321 | | | | 2,791 | | | | 244 | | | | 3,179 | | | | 1,942 | | | | 17,647 | | | | 41 | |
| Canada | | | 1,716 | (3) | | | 833 | | | | 848 | | | | 2,367 | (4) | | | 564 | | | | 2,833 | | | | 9,161 | | | | 21 | |
| Mexico | | | 1,038 | | | | 391 | | | | 109 | | | | 157 | | | | 41 | | | | — | | | | 1,736 | | | | 4 | |
| Algeria | | | 308 | | | | — | | | | 12 | | | | 37 | | | | 707 | | | | — | | | | 1,064 | | | | 2 | |
| China | | | 399 | | | | 24 | | | | 188 | | | | 82 | | | | 172 | | | | — | | | | 865 | | | | 2 | |
| Brazil | | | 378 | | | | 227 | | | | 146 | | | | 72 | | | | — | | | | — | | | | 823 | | | | 2 | |
| United Kingdom | | | 437 | | | | 52 | | | | 121 | | | | 15 | | | | 66 | | | | 25 | | | | 716 | | | | 2 | |
| Chile | | | 480 | | | | 13 | | | | 26 | | | | 143 | | | | 2 | | | | — | | | | 664 | | | | 2 | |
| Indonesia | | | 506 | | | | 13 | | | | 22 | | | | 5 | | | | 1 | | | | — | | | | 547 | | | | 1 | |
| India | | | 336 | | | | 81 | | | | 53 | | | | 2 | | | | 21 | | | | — | | | | 493 | | | | 1 | |
Other(5) | | | 3,582 | | | | 1,668 | | | | 2,022 | | | | 1,261 | | | | 1,058 | | | | 117 | | | | 9,708 | | | | 22 | |
| |
| Total | | $ | 17,350 | | | $ | 4,623 | | | $ | 6,338 | | | $ | 4,385 | | | $ | 5,811 | | | $ | 4,917 | | | $ | 43,424 | | | | 100 | |
| |
| | |
| | | |
| (1) | | Includes $2,474 million of loan guarantees. |
| |
| (2) | | Investments include amounts represented by cash, marketable securities and investments. Exposure does not take into consideration any collateral or the effect of any master netting agreements with derivative counterparties. |
| |
| (3) | | Includes the impact of one transaction for $820 million with recourse to the Consolidated Revenue Fund of Canada in the event of a loan default. |
| |
| (4) | | Includes $2,321 million of surety bond insurance where risk rests with the exporter. A total of 75% of the exports insured in the surety bond program are to the United States. The balance represents exports to other countries. |
| |
| (5) | | Includes 163 countries with total exposure ranging from $0.001 million to $471 million. |
EDC Annual Report 2005
65
MANAGEMENT’S DISCUSSION AND ANALYSIS
CONCENTRATION OF EXPOSURE — LOANS PORTFOLIO
As a result of lower financing volumes and a stronger Canadian dollar, gross loans receivable has been declining steadily since the end of 2002. At the end of 2005 gross loans receivable totaled $17,350 million, a decrease of $2,113 million from 2004. This is primarily due to the high level of loan prepayments and reduced financing volumes in 2005 which resulted in repayments exceeding disbursements by $1,274 million. The strengthening of the Canadian dollar also contributed $669 million to this decline, due to the fact that 88% of EDC’s loans are denominated in US dollars.
The mix between commercial and sovereign loans has continued to shift towards commercial loans. In 2001, the ratio of commercial to sovereign was 70:30, while by 2005 it had shifted to 78:22. In 2005, new signing volume to commercial borrowers accounted for 99% of total signing volume (2004 — 98%). Although signing volumes declined from $6,152 million in 2004 to $5,091 million in 2005, both the number of financing transactions and the customers supported actually increased in 2005. The number of financing transactions signed increased 16% to 735 in 2005 (2004 — 635) and the number of customers supported increased 19% to 385 (2004—323).
The table below shows the five year trend in financing transactions and customers supported.
| | | | | | | | | | | | | | | | | | | | | |
| | | 2005 | | | 2004 | | | 2003 | | | 2002 | | | 2001 | |
| |
| Number of financing transactions signed | | | 735 | | | | 635 | | | | 571 | | | | 397 | | | | 556 | |
Average transaction value ($ in millions) | | $ | 7 | | | $ | 10 | | | $ | 10 | | | $ | 19 | | | $ | 15 | |
| Number of customers supported | | | 385 | | | | 323 | | | | 254 | | | | 332 | | | | 252 | |
| |
Commercial Loans and Loan Guarantees
The Corporation has the following commercial risk concentrations for its commercial loans and guarantees:
| | | | | | | | | | | | | | | | | | | | | | | | | | | | | |
| | | Gross loans | | | | | | | Loan | | | Total | | | | | | | Total | | | | |
| ($ in millions) | | receivable | | | Commitments | | | guarantees | | | exposure | | | 2005 | | | exposure | | | 2004 | |
| Gross commercial exposure | | | | | | | | | | $ | | | % | | | $ | | | % | | | | | |
| |
| Surface transportation | | | 4,312 | | | | 816 | | | | 1,737 | | | | 6,865 | | | | 35 | | | | 7,255 | | | | 35 | |
| Aerospace | | | 5,521 | | | | 1,088 | | | | 58 | | | | 6,667 | | | | 33 | | | | 6,789 | | | | 33 | |
| Energy | | | 1,549 | | | | 780 | | | | 208 | | | | 2,537 | | | | 13 | | | | 2,571 | | | | 13 | |
| Telecommunications | | | 793 | | | | 282 | | | | 14 | | | | 1,089 | | | | 5 | | | | 1,482 | | | | 7 | |
| Other | | | 1,368 | | | | 1,111 | | | | 263 | | | | 2,742 | | | | 14 | | | | 2,428 | | | | 12 | |
| |
| Total | | $ | 13,543 | | | $ | 4,077 | | | $ | 2,280 | | | $ | 19,900 | | | | 100 | | | $ | 20,525 | | | | 100 | |
| |
The commercial loans and guarantees portfolio has decreased by $625 million from 2004, or 3%. This reduction is attributed to the decline in gross loans receivable and the strengthening of the Canadian dollar. This was partially offset by an increase in loan commitments, as a result of a higher volume of letters of offer accepted and outstanding of $495 million at the end of 2005.
As depicted above, the surface transportation and aerospace sectors continue to represent the largest proportion of EDC’s commercial exposure. Together, these two sectors accounted for 68% of EDC’s total commercial exposure (2004 — 68%). This is reflective of the importance of these two exporting sectors in the Canadian economy whose share of total Canadian exports was 22.9% in 2005 (2004 — 24.7%). The exposure in the aerospace and surface transportation sectors primarily reflects business volumes of prior years and the tenure of these loans tends to be long in duration. Over time, the concentration in these sectors will diminish since EDC’s current business volumes are more diversified.
It’s About More Than Exporting
66
MANAGEMENT’S DISCUSSION AND ANALYSIS
The Corporation’s largest commercial exposure in 2005 resided with five US counterparties, which collectively represented $6,697 million, or 34% of the total commercial exposure. The five counterparties are included in the aerospace and surface transportation sectors and are broken down as follows: within the aerospace sector, two airlines totaled $3,078 million or 16%. Of these, one airline is an impaired obligor representing 5% of the total commercial exposure. Although impaired, this obligor continues to make payments to EDC. Within the surface transportation sector, one transit authority totaled $1,486 million or 7%, one automotive company totaled $1,375 million or 7% and one railcar leasing company totaled $758 million or 4%.
The ratio of below investment grade loans to total commercial exposure increased from 51% in 2004 to 60% in 2005. Credit rating downgrades mainly in the automotive sector of the surface transportation portfolio accounted for the majority of this increase.
Sovereign Loans and Loan Guarantees
The Corporation has the following sovereign risk concentrations for its sovereign loans and guarantees:
| | | | | | | | | | �� | | | | | | | | | | | | | | | | | | | | | | | |
| | | Gross loans | | | | | | | Loan | | | Total | | | | | | | | | | | Total | | | | |
| ($ in millions) | | receivable | | | Commitments | | | guarantees | | | exposure | | | 2005 | | | | | | | exposure | | | 2004 | |
| Gross sovereign exposure | | | | | | | | | | | | | | $ | | | % | | | | | | | $ | | | % | |
| |
| Canada | | | 820 | | | | — | | | | 46 | | | | 866 | | | | 19 | | | Canada | | | 917 | | | | 16 | |
| China | | | 384 | | | | 16 | | | | — | | | | 400 | | | | 9 | | | China | | | 449 | | | | 8 | |
| Indonesia | | | 347 | | | | 13 | | | | — | | | | 360 | | | | 8 | | | Peru | | | 401 | | | | 7 | |
| Cameroon | | | 211 | | | | — | | | | — | | | | 211 | | | | 5 | | | Indonesia | | | 337 | | | | 6 | |
| Iran | | | 21 | | | | 188 | | | | — | | | | 209 | | | | 5 | | | Algeria | | | 312 | | | | 5 | |
| Algeria | | | 208 | | | | — | | | | — | | | | 208 | | | | 4 | | | Mexico | | | 272 | | | | 5 | |
| Peru | | | 205 | | | | — | | | | — | | | | 205 | | | | 4 | | | Venezuela | | | 261 | | | | 4 | |
| Other | | | 1,611 | | | | 329 | | | | 148 | | | | 2,088 | | | | 46 | | | Other | | | 2,804 | | | | 49 | |
| |
| Total | | $ | 3,807 | | | $ | 546 | | | $ | 194 | | | $ | 4,547 | | | | 100 | | | Total | | $ | 5,753 | | | | 100 | |
| |
The sovereign loans and guarantees portfolio decreased by $1,206 million or 21% from 2004. This decline is attributable to an unprecedented volume of prepayments, a decrease in the volume of new signings, and the strengthening of the Canadian dollar. In 2005, investment grade exposure accounted for 42% of the total sovereign portfolio (2004 — 45%), while the remaining 58% (2004 — 55%) of the sovereign portfolio represented exposure with below investment grade counterparties.
CONCENTRATION OF EXPOSURE — INSURANCE PORTFOLIO
Contingent Liabilities under Insurance Policies
In the ordinary course of business, EDC assumes exposure from other insurers to fulfill the Corporation’s mandate to support Canadian exporters. EDC also cedes reinsurance to other insurance companies to mitigate its risk. The ceding arrangements provide greater diversification of the business and minimize the net loss potential arising from large risks. The table below depicts the impact of these reinsurance agreements on the Corporation’s exposure.
| | | | | | | | | |
| ($ in millions) | | 2005 | | | 2004 | |
| |
| Short-term | | | | | | | | |
| Direct insurance | | | 5,539 | | | | 5,321 | |
| Reinsurance assumed | | | 846 | | | | 1,003 | |
| Reinsurance ceded | | | (47 | ) | | | (62 | ) |
| |
| Total short-term | | | 6,338 | | | | 6,262 | |
| |
| Medium-term | | | | | | | | |
| Direct insurance | | | 6,292 | | | | 5,017 | |
| Reinsurance assumed | | | 2,417 | | | | 1,981 | |
| Reinsurance ceded | | | (987 | ) | | | (1,085 | ) |
| |
| Total medium-term | | | 7,722 | | | | 5,913 | |
| |
| Total contingent liabilities under insurance policies | | $ | 14,060 | | | $ | 12,175 | |
| |
While the insurance portfolio experienced growth in 2005, the impact of this growth was partially offset by the strengthening of the Canadian dollar. The foreign exchange impact reduced 2005 contingent liabilities under insurance policies by $337 million.
At December 31,2005, contingent liability with exposure terms of less than one year comprised 65% of the total exposure, consistent with 2004.
EDC Annual Report 2005
67
MANAGEMENT’S DISCUSSION AND ANALYSIS
Short-term Insurance Program
Size Concentration
The following table breaks down the number of foreign buyers and the respective exposure for the year classified by exposure size within the short-term insurance portfolio:
| | | | | | | | | | | | | | | | | |
| | | 2005 | | | 2004 | |
| $ Value of foreign exposure | | Total number | | | Exposure | | | Total number | | | Exposure | |
| ($ in thousands) | | of foreign buyers | | | ($ in millions) | | | of foreign buyers | | | ($ in millions) | |
| |
| 1-500 | | | 45,210 | | | | 4,837 | | | | 44,025 | | | | 4,678 | |
| 501-2,000 | | | 3,265 | | | | 3,064 | | | | 2,927 | | | | 2,785 | |
| 2,001-5,000 | | | 778 | | | | 2,381 | | | | 698 | | | | 2,187 | |
| 5,001-10,000 | | | 267 | | | | 1,798 | | | | 239 | | | | 1,633 | |
| 10,001 and over | | | 277 | | | | 6,501 | | | | 230 | | | | 5,440 | |
| |
| Total | | | 49,797 | | | $ | 18,581 | | | | 48,119 | | | $ | 16,723 | |
| |
During 2005, the short-term insurance program supported 5,907 customers (2004 — 6,169). Of the total customers supported, 5,503 were small- and medium-sized exporters (SMEs) (2004 — 5,542). In terms of total insured volume, the top five customers represented 32% of the total 2005 insured volume (2004 — 29%).
Country Concentration
The largest concentrations within the short-term insurance program are in the following countries:
| | |
| * | | Includes 141 countries with concentrations ranging from $0.001 million to $146 million (2004 — 141 countries with concentrations ranging from $0.001 million to $197 million). |
Industry Concentration
The contingent liability in terms of exporters’ insured industry sector is as follows:
Medium-term Insurance Program
Size Concentration
During 2005, 670 customers (529 SMEs) were supported in the medium-term insurance program (2004 — 709 of which 541 were SMEs). The top five customers in terms of insurance policies and guarantees outstanding represented 45% of the 2005 medium-term insurance policies and guarantees outstanding (2004 — 42%). The largest exposure within the top five customers is $1,056 million. The five largest policies at December 31, 2005, represented 17% (2004 — 16%) of the total medium-term policies and guarantees outstanding.
It’s About More Than Exporting
68
MANAGEMENT’S DISCUSSION AND ANALYSIS
Country Concentration
At December 31, 2005, the medium-term insurance policies and guarantees outstanding included 4,435 policies in 136 countries (2004 — 3,698 policies in 136 countries) with an average exposure of $1.7 million (2004 — $1.6 million).
The largest insurance policies and guarantees outstanding in terms of the countries in which the risk resided within the medium-term portfolio are as follows:
| | | | | | | | | | | | | | | | | | | | | | | | | | | | | | | | | | | | | | | | | | | | | | | | | | | |
| ($ in millions) | | 2005 | | 2004 | |
| | | | | | | Reinsurance | | | | | | | | | | | | | | | | | | | | | Reinsurance | | | | | | | | | | |
| | | | | | | | | | | | | | | Insurance | | | | | | | | | | | | | | | | | | | | | | | | | Insurance | | | | | | | |
| Country | | Insurance | | | assumed | | | ceded | | | guarantees | | | $ | | | % | | Country | | | Insurance | | | assumed | | | ceded | | | guarantees | | | $ | | | % | |
| |
Canada | | | 202 | | | | 2,165 | | | | – | | | | 92 | | | | 2,459 | | | 32 | | Canada | | | 402 | | | | 1,940 | | | | – | | | | 67 | | | | 2,409 | | | | 41 | |
United States | | | 57 | | | | 187 | | | | – | | | | 1,597 | | | | 1,841 | | | 24 | | United States | | | 132 | | | | 6 | | | | – | | | | 821 | | | | 959 | | | | 16 | |
Algeria | | | 37 | | | | – | | | | – | | | | 520 | | | | 557 | | | 7 | | Algeria | | | 53 | | | | – | | | | – | | | | 411 | | | | 464 | | | | 8 | |
China | | | 82 | | | | – | | | | – | | | | 171 | | | | 253 | | | 3 | | Mexico | | | 663 | | | | – | | | | (486 | ) | | | 28 | | | | 205 | | | | 3 | |
Poland | | | 1 | | | | – | | | | – | | | | 240 | | | | 241 | | | 3 | | Chile | | | 148 | | | | – | | | | – | | | | 1 | | | | 149 | | | | 3 | |
Other* | | | 2,576 | | | | 65 | | | | (987 | ) | | | 717 | | | | 2,371 | | | 31 | | Other* | | | 1,756 | | | | 35 | | | | (599 | ) | | | 535 | | | | 1,727 | | | | 29 | |
| |
Total | | $ | 2,955 | | | $ | 2,417 | | | $ | (987 | ) | | $ | 3,337 | | | $ | 7,722 | | | 100 | | Total | | $ | 3,154 | | | $ | 1,981 | | | $ | (1,085 | ) | | $ | 1,863 | | | $ | 5,913 | | | | 100 | |
| |
| | |
| * | | Includes 131 countries with concentrations ranging from $0.01 million to $189 million (2004 — 131 countries with concentrations ranging from $0.0029 million to $124 million). |
Exposure in Canada is made up largely ($2,321 million) of surety bond insurance (2004 — $2,329 million), 75% of which is to support exports to the United States (2004 — 64%).
Program Concentration
Total medium-term insurance exposure increased by $1,809 million or 31% over 2004 results. The largest increases were in the performance security program of $1,382 million (67%) and the specific transaction program of $246 million (58%) largely due to new policy issuances. Exposure also increased in the political risk program by $196 million or 18% over 2004 results, mainly due to new policy issuances.
CREDIT QUALITY — LOANS
EDC categorizes its loans receivable into three classifications: investment grade performing, below investment grade performing and impaired. The risk profile of EDC’s loans receivable portfolio saw a decrease in the portion of the portfolio classified as investment grade performing and an increase in the portion of the portfolio classified as impaired in 2005.
Investment grade loans decreased from 42% in 2004 to 36% of the portfolio in 2005 mainly due to credit downgrades on loans related to EDC’s ground transportation portfolio. The resulting shift into the below investment grade category was offset by a shift of a portion of EDC’s aerospace portfolio out of the below investment grade category to impaired status. The effect of these shifts into and out of the below investment grade category resulted in this portion of the portfolio remaining fairly constant in 2005 at 46% (2004 — 47%). The portion of the loans portfolio classified as impaired rose from 11% in 2004 to 18% in 2005 due primarily to the credit deterioration and the resulting bankruptcy filings in the aerospace portfolio.
Along with the effect of the above mentioned credit migration, the impact of the strengthening of the Canadian dollar and repayments exceeding disbursements resulted in an 18% decrease in total performing gross loans receivable from $17,308 million in 2004 to $14,153 million in 2005.
EDC Annual Report 2005
69
MANAGEMENT’S DISCUSSION AND ANALYSIS
Loan Commitments
Loan commitments include undisbursed amounts on signed loans, letters of offer outstanding and unallocated confirmed lines of credit.
The level of loan commitments outstanding at the end of 2005 was $537 million higher than at the end of 2004. This was mainly due to an increase in the volume of letters of offer accepted and outstanding. Letters of offer accepted and outstanding were $1,312 million at the end of 2005 (2004 — $817 million). The increase in commitments outstanding at the end of 2005 was partially offset by a decrease of $163 million in foreign exchange translation due to the strengthening of the Canadian dollar.
The increase in loan commitments during the year was mainly concentrated in below investment grade financing. In 2005, loan commitments on below investment grade financing accounted for 59% of the total as compared to 54% in 2004.
Impaired Loans
Impaired loans represent loans for which the Corporation no longer has reasonable assurance that the full amount of principal and interest will be collected on a timely basis in accordance with the terms of the loan agreement. Impaired loans as a percentage of total gross loans receivable increased from 11.1% in 2004 to 18.4% in 2005 reflecting additional impairment that occurred in the year primarily within the aerospace industry.
In 2005, loans totaling $2,025 million became impaired (2004 — $760 million). In total there were 17 commercial loans primarily in the United States. Included in this amount was $1,855 million which pertained to collateralized loans with two commercial airlines.
During the year, $275 million of commercial aerospace loans in the United States and $42 million of commercial loans in the telecommunications industry in Argentina were reclassified from impaired to performing.
Additional disbursements made in relation to impaired obligors totaled $15 million (2004 — $34 million). These included four commercial loans in the United States ($11 million) and Canada ($4 million).
Impaired loans to 12 commercial borrowers totaling $39 million were written off during the year compared to $75 million in loan write-offs in 2004. Non-accrued capitalized interest of $4 million associated with these loans was also written off.
Airline Bankruptcies
EDC’s mandate is to facilitate Canadian export sales and investment abroad. Canada has the world’s fourth largest aerospace industry, and therefore EDC has a long history in the development of this important export sector. EDC has provided financing to a wide range of foreign airlines enabling them to purchase Canadian-made aircraft, engines and parts.
In financing aircraft sales, the risk of return of aircraft is inherent in every transaction. EDC is protected as the senior principal lender through a secured mortgage on the aircraft itself, enabling it to take possession if required.
During 2005, the airline industry continued to struggle to control costs in a very competitive environment with record high fuel prices. Early in the year, as part of a restructuring initiative, a number of aircraft were returned to EDC by Flyi. EDC was able to place these aircraft with two other airlines. In the latter part of 2005, Flyi and two additional airlines, Northwest, and Delta (and its wholly owned subsidiary Comair), filed for Chapter 11 bankruptcy protection in the United States. At the time of their filing for bankruptcy, EDC’s total exposure to these airlines was $2,225 million.
Upon filing for bankruptcy, the airlines can elect to reject all or a portion of their aircraft and return them to the lenders. In November and December of 2005, a number of aircraft were returned to EDC from two of the bankrupt airlines (Delta and Flyi). EDC recorded the aircraft as assets on its balance sheet at their fair value of $123 million. No gain or loss was recorded, as the fair market value of the aircraft was equivalent to the carrying value of the related loans. This resulted in a $218 million reduction in impaired gross loans receivable; the reversal of $78 million of the allowance for losses on loans and the reversal of $17 million of non-accrued capitalized interest. In January 2006, additional aircraft were returned from Flyi with a fair market value of $112 million.
In the airline industry, it is not unusual for approximately 10% of a fleet (a specific aircraft type) to be in a transitory position. Subsequent to the return of aircraft discussed above, the regional jets in EDC’s possession account for only 2.1% of the total fleet, well within industry norms.
It is possible that as part of the restructuring negotiations with these obligors additional aircraft may be returned to EDC over the course of 2006 and certain lease rate concessions may be agreed to as part of the restructurings.
EDC has implemented a number of portfolio management activities to manage the evolving needs surrounding its aerospace portfolio.
| • | | The Corporation is working closely with these bankrupt obligors to arrive at acceptable outcomes to all of the parties involved. |
| |
| • | | EDC is actively assessing the global airline industry and remains confident in the ongoing demand for regional jets. |
| |
| • | | The Corporation has engaged various external aviation asset management services to provide repossession, storage, remarketing and operating lease services for the returned jets. EDC remains confident that over a reasonable period of time, all the aircraft returned to EDC will be placed in the market. |
| |
| • | | EDC has instituted a comprehensive inspection program on the aircraft it supports to ensure the aircraft are properly maintained and that record keeping is in line with required standards. |
It’s About More Than Exporting
70
MANAGEMENT’S DISCUSSION AND ANALYSIS
Concentration of Impaired Loans
The largest concentrations of gross loans receivable for impaired loans are listed in the following table:
| | | | | | | | | | | | | | | | | | | | | | | | | |
| ($ in millions) | | 2005 | | | 2004 | |
| | | Impaired | | | | | | | Impaired | | | Impaired | | | | | | | Impaired | |
| | | gross | | | Non-accrued | | | net | | | gross | | | Non-accrued | | | net | |
| | | loans | | | capitalized | | | loans | | | loans | | | capitalized | | | loans | |
| | | receivable | | | interest | | | receivable | | | receivable | | | interest | | | receivable | |
| |
Sovereign | | | | | | | | | | | | | | | | | | | | | | | | |
| Cameroon | | | 211 | | | | 211 | | | | — | | | | 239 | | | | 239 | | | | — | |
| Serbia-Montenegro | | | 169 | | | | 136 | | | | 33 | | | | 196 | | | | 168 | | | | 28 | |
| Ivory Coast | | | 146 | | | | 146 | | | | — | | | | 151 | | | | 151 | | | | — | |
| Argentina | | | 52 | | | | 3 | | | | 49 | | | | 53 | | | | 3 | | | | 50 | |
| Democratic Republic of the Congo | | | 46 | | | | 46 | | | | — | | | | 46 | | | | 46 | | | | — | |
| Other | | | 186 | | | | 86 | | | | 100 | | | | 214 | | | | 96 | | | | 118 | |
| |
| Subtotal | | | 810 | | | | 628 | | | | 182 | | | | 899 | | | | 703 | | | | 196 | |
| |
| | | | | | | | | | | | | | | | | | | | | | | | | |
Commercial | | | | | | | | | | | | | | | | | | | | | | | | |
| Aerospace | | | 2,059 | | | | 15 | | | | 2,044 | | | | 697 | | | | 1 | | | | 696 | |
| Advanced Technology and Manufacturing | | | 170 | | | | 10 | | | | 160 | | | | 189 | | | | 4 | | | | 185 | |
| Energy | | | 75 | | | | 1 | | | | 74 | | | | 189 | | | | 1 | | | | 188 | |
| Telecommunications | | | 50 | | | | 3 | | | | 47 | | | | 120 | | | | 5 | | | | 115 | |
| Surface Transportation | | | 26 | | | | 1 | | | | 25 | | | | 54 | | | | — | | | | 54 | |
| Other | | | 7 | | | | 1 | | | | 6 | | | | 7 | | | | — | | | | 7 | |
| |
| Subtotal | | | 2,387 | | | | 31 | | | | 2,356 | | | | 1,256 | | | | 11 | | | | 1,245 | |
| |
| | | | | | | | | | | | | | | | | | | | | | | | | |
| Total impaired | | | 3,197 | | | | 659 | | | | 2,538 | | | | 2,155 | | | | 714 | | | | 1,441 | |
| Less: specific allowance | | | | | | | | | | | 914 | | | | | | | | | | | | 556 | |
| |
| Impaired net loans receivable | | | | | | | | | | $ | 1,624 | | | | | | | | | | | $ | 885 | |
| |
Subsequent to a review of discounted expected future cash flows on loans totaling $240 million, to Serbia-Montenegro ($169 million), Gabon ($40 million) and Ecuador ($31 million), non-accrued capitalized interest of $17 million was recognized as impaired income thereby increasing loans receivable from $64 million in 2004 to $81 million in 2005.
When sovereign borrowers experience financial difficulties and are unable to meet their debt obligations, sovereign creditors, including the Government of Canada, agree at an international forum, the Paris Club, to formally reschedule the borrower’s debt obligations. From time to time and on a case-by-case basis, the most heavily indebted sovereign borrowers are granted debt reduction or debt service relief by the Government of Canada. The granting of debt reduction or relief by the Paris Club is contingent upon the sovereign borrower’s ability to implement and maintain economic programs outlined by the International Monetary Fund.
In the past, the Government of Canada has reimbursed the Corporation an amount equal to the debt relief granted by the Government of Canada to the Corporation’s sovereign borrowers. The formula for calculating the amount to be paid to the Corporation was amended effective April 1, 2001 in two ways. Firstly, for new loans issued by the Corporation after March 31, 2001 to sovereign borrowers which were on the Paris Club debt relief list as at April 1, 2001, the Government of Canada has no obligation to compensate the Corporation for further debt relief granted to such borrowers. Secondly, for any debt reduction on new loans resulting from unilateral debt relief measures or new debt reduction for obligations contracted prior to April 1, 2001, EDC will share in the costs of debt forgiveness to the amount of its appropriate specific allowances on the loans.
Amounts received for debt relief arrangements on sovereign impaired loans are credited to the book value of the loans similar to the treatment accorded to other receipts on impaired loans. To the extent that amounts received exceed the book value of the loans as a result of non-accrued capitalized interest, debt relief income is recorded, and any provisions are returned to income.
Payments received from the Government of Canada for debt relief on sovereign loans totaled $75 million in 2005 (2004 — $62 million) and related to Cameroon ($30 million), Congo ($23 million), Honduras ($20 million) and Democratic Republic of the Congo ($2 million). These amounts are not included as receipts from borrower countries in the table on the following page since the payments were received from the Government of Canada, not the borrower country.
EDC Annual Report 2005
71
MANAGEMENT’S DISCUSSION AND ANALYSIS
The following cash flows pertain to impaired loan debtors and represent, in the case of sovereign receipts, the long-term efforts of multilateral rescheduling arrangements through the Paris Club. The largest receipts for impaired loans including contractual principal and interest from borrowers were as noted:
| | | | | | | | | | | |
| ($ in millions) | | 2005 | | | | | 2004 | |
Sovereign | | | | | | Sovereign | | | | |
| Congo | | | 6 | | | Ecuador | | | 5 | |
| Ecuador | | | 4 | | | Kenya | | | 2 | |
| Gabon | | | 3 | | | Gabon | | | 2 | |
| Other | | | 3 | | | Other | | | 3 | |
| |
| Subtotal | | | 16 | | | Subtotal | | | 12 | |
Commercial | | | 396 | | | Commercial | | | 146 | |
| |
| Total | | $ | 412 | | | Total | | $ | 158 | |
| |
CREDIT QUALITY — INSURANCE
The contingent liability by country risk rating for the insurance portfolio is comprised primarily of investment grade exposure. Within the short-term program, investment grade accounted for 88% (2004 — 88%) of the total. The proportion of investment grade exposure in the medium-term program increased slightly in 2005 to 85% (2004 — 82%). This increase was mainly due to the signing of large policies in the United States, Poland, China and Algeria.
Claims Experience
| | | | | | | | | |
| ($ in millions) | | 2005 | | | 2004 | |
| |
| Claims paid | | | 44 | | | | 64 | |
| Claims recovered | | | 31 | | | | 24 | |
| |
| Net claims | | $ | 13 | | | $ | 40 | |
| |
In 2005, the Corporation paid 1,317 claims in 64 countries. During the same period in 2004, the Corporation paid 1,609 claims in 61 countries.
There was a 31% decrease in the dollar value of claims payments to $44 million in 2005 and an 18% decrease in the number of claims paid from 2004. The average amount paid per claim decreased to $34 thousand in 2005 from $40 thousand in 2004.
The year over year decrease in claims activity can be attributed to the continuing strong economic environments in the majority of EDC’s trading partner nations, especially in the United States. In addition, there was a foreign exchange impact due to a stronger Canadian dollar with respect to US dollar claim payments. Over 86% of the dollar amounts paid were in US dollars.
In 2005, EDC recovered in total $32 million (2004 — $26 million) of which $1 million was refunded to exporters (2004 — $2 million).
It’s About More Than Exporting
72
MANAGEMENT’S DISCUSSION AND ANALYSIS
Size Concentration
| | | | | | | | | | | | | | | | | | | | | | | | | |
| ($ in millions) | | 2005 | | | 2004 | |
| | | $ of claims | | | Number of | | | Claims | | | $ of claims | | | Number of | | | Claims | |
| | | paid | | | claims paid | | | recovered | | | paid | | | claims paid | | | recovered | |
| |
| $0 - $100,000 | | | 17 | | | | 1,231 | | | | 30 | | | | 18 | | | | 1,530 | | | | 20 | |
| $100,001 - $1 million | | | 21 | | | | 81 | | | | 1 | | | | 15 | | | | 68 | | | | 2 | |
| Over $1 million | | | 6 | | | | 5 | | | | – | | | | 31 | | | | 11 | | | | 2 | |
| |
| Total | | $ | 44 | | | | 1,317 | | | $ | 31 | | | $ | 64 | | | | 1,609 | | | $ | 24 | |
| |
Insurance Claims Paid by Geographic Market
| | | | | | | | | | | | | | | | | | | | | | | | | | | | | | | | | | | | | | | | | |
| ($ in millions) | | 2005 | | | 2004 | |
| | | | | | | | | | | Call on | | | | | | | | | | | | | | | | | | | Call on | | | | | | | |
| Geographic market | | Default | | | Insolvency | | | a bond | | | Other | | | Total | | | Default | | | Insolvency | | | a bond | | | Other | | | Total | |
| |
| North America/Caribbean* | | | 22 | | | | 8 | | | | 2 | | | | – | | | | 32 | | | | 37 | | | | 8 | | | | 5 | | | | – | | | | 50 | |
| Europe | | | 3 | | | | 2 | | | | – | | | | – | | | | 5 | | | | 4 | | | | – | | | | 4 | | | | – | | | | 8 | |
| South America/ Central America | | | 5 | | | | – | | | | – | | | | – | | | | 5 | | | | 1 | | | | – | | | | – | | | | 1 | | | | 2 | |
| Middle East/Africa | | | 1 | | | | – | | | | – | | | | – | | | | 1 | | | | – | | | | – | | | | 3 | | | | – | | | | 3 | |
| Asia/Pacific | | | 1 | | | | – | | | | – | | | | – | | | | 1 | | | | 1 | | | | – | | | | – | | | | – | | | | 1 | |
| |
| Total | | $ | 32 | | | $ | 10 | | | $ | 2 | | | $ | – | | | $ | 44 | | | $ | 43 | | | $ | 8 | | | $ | 12 | | | $ | 1 | | | $ | 64 | |
| |
Default Risk
Default is defined as the failure of the buyer to pay by the due date all or any part of the gross invoice value of goods delivered to and accepted by the buyer.
Default claim payments with respect to losses in the United States decreased from 2004 ($12 million) and decreased payments for losses in Mexico ($2 million) account for most of the change in claim payments in North America/Caribbean.
The majority of the increase in claim payments in South America is due to an increase in losses from 2004 in Brazil ($3 million).
Insolvency Risk
Insolvency of the customer occurs when the customer has reorganized his/her financial affairs under the bankruptcy or insolvency laws of his/her country.
The increase in insolvency claims paid within Europe was mainly due to an increase in claim payments for losses in Poland ($1 million).
Call on a Bond
Call on a bond is the unilateral decision by the beneficiary of a stand-by letter of credit (the bond), issued on behalf of an exporter and in relation to its contract obligations, to demand the immediate payment of the face amount thereof.
The claim payments for losses in the United States have decreased from 2004 ($4 million) while the claim payments for losses in Canada have increased from 2004 ($1 million), which accounts for the change in claim payments in North America/Caribbean.
The decrease in claim payments in Europe is mainly due to a decrease in payments for losses in France ($3 million).
The decrease in claim payments in Middle East/Africa is mainly due to a decrease in payments for losses in Saudi Arabia ($2 million).
EDC Annual Report 2005
73
MANAGEMENT’S DISCUSSION AND ANALYSIS
Industry Concentration
The largest portion of claims paid in 2005 was related to the consumer goods sector, primarily in the United States ($7 million). Within the base and semi-manufactured goods sector, claims paid were mainly in the United States ($6 million).
In 2004 the largest portion of claims paid related to the financial institutions sector, mainly in the United States ($8 million) and France ($3 million).
Claims Submitted
Over the past five years, the value of claims submitted has decreased from $232 million in 2001 to $75 million in 2005, mainly due to the stronger economic environments in the majority of EDC’s trading partner nations. In addition, the number of claims submitted decreased from 2,571 in 2001 to 2,076 in 2005. The five countries with the largest claims submitted in 2005 were the United States ($49 million), Brazil ($5 million), Canada ($3 million), Mexico ($3 million) and France ($2 million).
At the end of 2005, the value of claims requests that were still under consideration was $25 million (2004 — $38 million). The largest concentrations were related to claims pending for losses in Iran ($18 million), the United States ($4 million) and France ($1 million).
ALLOWANCE FOR LOSSES ON LOANS, LOAN COMMITMENTS AND GUARANTEES
EDC’s total allowance for losses on loans, loan commitments and guarantees was $2,379 million at December 31, 2005. This includes an offset of $124 million as a result of the risk mitigation insurance transaction which is described on page 76.
The decrease from 2004 was due to a reversal of provision for loan losses of $430 million, foreign exchange translation of $85 million, and write-offs of $35 million (2004 — $70 million). Loans foreclosed during the year resulted in an additional decrease in the allowance of $78 million (2004 — nil) due to the removal of the loans from EDC’s books. These decreases were slightly offset by $9 million of recoveries of amounts written off in prior years. The reversal of the provision was mainly due to improvements in the credit quality of EDC’s borrowers, a decline in the size of the loans portfolio, with repayments exceeding disbursements by $1,274 million and the effect of the risk mitigation insurance. During the past year, the credit environment has generally improved, with the exception of the aerospace industry, for which EDC was adequately provisioned.
The allowance as a percentage of total exposure has decreased to 9.7% in 2005 (2004 — 11.9%). The reduction of 2.2% can be attributed to the improved credit environment, a reduction in the average term-to-maturity on performing loans by one year and the impact on the total allowance of the new risk mitigation insurance.
It’s About More Than Exporting
74
MANAGEMENT’S DISCUSSION AND ANALYSIS
Components of the Allowance
| | | | | | | | | |
| ($ in millions) | | 2005 | | | 2004 | |
| |
| Base allowance | | | 1,257 | | | | 1,707 | |
| Counterparty concentration | | | 236 | | | | 513 | |
| Country overlay | | | (66 | ) | | | 57 | |
| Industry overlay | | | 141 | | | | 226 | |
| |
| Total general allowance | | | 1,568 | | | | 2,503 | |
| Specific allowances | | | 935 | | | | 619 | |
| |
| | | | 2,503 | | | | 3,122 | |
| Risk mitigation insurer’s share of loan allowance | | | (124 | ) | | | – | |
| |
| | | | | | | | | |
| Total allowance for losses on loans,loan commitments and guarantees | | $ | 2,379 | | | $ | 3,122 | |
| |
EDC’s provisioning methodology ensures that appropriate allowances representing management’s best estimate of probable credit losses are established. The various components of the allowance are explained in the following sections.
Base Allowance
The base allowance decreased $450 million in 2005 to $1,257 million. During the year the independent variables used in the base allowance calculation were reviewed and updated, where appropriate, to reflect current data. Updating the probability of default rates resulted in an increase in the base provision rates used for 2005. However, this increase was offset by the results of updating the other factors used to calculate the base allowance, including the average term to maturity and the loss given default factors resulting in an overall decline in the base allowance.
Impairments of airlines in the United States also caused a decrease in the base allowance. Upon classifying a loan as impaired, the related exposure is removed from the calculation of the general allowance and replaced by a specific allowance.
Counterparty Concentration Overlay
A concentration component is added to adequately provision for sovereign and commercial counterparties whose level of exposure is deemed by management to represent an increased amount of risk. A counterparty whose exposure exceeds 10% of EDC’s shareholder’s equity will attract a concentration component calculated on the portion of exposure over that threshold. The allowance on this portion of exposure is calculated at the base allowance rate for that counterparty. The threshold is set based on external benchmarks for commercial chartered banks.
EDC had a concentration overlay of $236 million at the end of 2005 compared to $513 million a year earlier. In 2005, several aerospace obligors were classified as impaired. The impact of these impairments resulted in a decrease in the concentration overlay by $277 million. The decrease in the base allowance and concentration overlays were offset by the establishment of specific provisions for these obligors. A stronger Canadian dollar also caused a reduction of $16 million to the overlay. In addition, a shrinking portfolio and the strengthening of the Canadian dollar resulted in fewer counterparties exceeding the threshold in 2005 resulting in a reduced overlay compared to 2004. The main reason for this is that the threshold is based on EDC’s shareholder’s equity, which is denominated in Canadian dollars, while the counterparty exposure is denominated in US dollars.
EDC Annual Report 2005
75
MANAGEMENT’S DISCUSSION AND ANALYSIS
Country Overlay
A country overlay component is added for exposure to countries with negative outlooks that are experiencing economic downturns or recession. Correspondingly, a country overlay component is removed from the allowance for exposure to those countries with positive outlooks that are showing positive economic conditions. For countries with either negative or positive outlooks, the full impact of the economic downturn or upswing is often not reflected in current credit ratings. This is due to timing issues for financial uncertainties that are often not reflected in credit ratings for up to two years after this economic condition begins. The amount of overlay is directly related to the amount of exposure, both sovereign and commercial, in every country with a negative or positive outlook. The country overlay is based on the current allowance and probability of a downgrade. When a country’s outlook changes to stable, a reversal of the overlay is amortized over the subsequent two years.
Country overlays decreased by $123 million in 2005 reflecting an overall improvement in economic conditions. The Corporation has recorded a net positive overlay of $66 million for 2005 versus a net negative overlay of $57 million in 2004. The net positive overlay contributed to the overall reduction of the general allowance in 2005. The largest component of the shift from a negative to a positive overlay was due to the removal of the $63 million overlay for the United States that was in place in 2004.
Industry Overlay
An industry overlay component is added to reflect the risk of economic downturns being experienced by companies in certain industries that are on credit watch or have negative outlooks. It is believed that companies in these industries have a greater risk than is reflected in current credit ratings. This is due to timing issues for financial difficulties that may not be reflected in current financial results, or for companies that are expected to be downgraded in the near future. The amount of overlay is directly related to the amount of exposure to each company and the likelihood of a subsequent downgrade. Based on the probability of the downgrade and the likely credit rating, an appropriate amount of incremental allowance is added.
The aerospace industry comprises 74% (2004 — 81%) of the total industry overlay. The decrease in the aerospace industry overlay from $182 million in 2004, to $104 million in 2005, was primarily due to the impairment of a number of aerospace obligors and the removal of their related exposure from the performing loan portfolio. The current aerospace overlay reflects the financial uncertainty that performing aerospace obligors continue to experience and which may result in further credit deterioration. The telecommunications overlay was removed in 2005 reflecting an overall improvement in this portfolio. An automotive overlay equal to 18% of the total industry overlay was added in the fourth quarter of 2005 to reflect uncertainty in this industry.
Specific Allowances
Specific allowances increased from $619 million in 2004 to $935 million in 2005. The increase is primarily the result of the impairment of two U.S. airlines during the latter part of the year. Upon classifying a loan as impaired the various components of its related allowance are removed from the general allowance and replaced by a specific allowance that reflects management’s estimate of the net realizable value of the loan.
Risk Mitigation Insurance
In the first quarter of 2005 EDC entered into a risk mitigation insurance transaction to insure a portion of EDC’s aerospace portfolio relating to regional jets effectively upgrading the credit quality of $1.1 billion of EDC’s exposure to this sector. As a result of this transaction, EDC has offset the allowance by $124 million, which contributed to an overall decrease in the allowance as a percentage of total exposure in the aerospace sector from 24% in 2004 to 19% in 2005.
The agreement provides EDC with protection in the event of default by an obligor, which has the effect of locking in future cash flows on this portion of EDC’s aerospace loan portfolio. It also reduces the risk concentration issues that have resulted from EDC’s role as a significant provider of financing arrangements to the North American regional airline industry in support of sales by the Canadian aerospace sector.
It’s About More Than Exporting
76
MANAGEMENT’S DISCUSSION AND ANALYSIS
ALLOWANCE FOR CLAIMS ON INSURANCE
At December 31, 2005, the allowance for claims on insurance was $536 million, a decrease of $12 million or 2% over the 2004 allowance of $548 million. During 2005, $41 million was charged to the income statement for the provision for credit losses relating to claims on insurance. This was offset by charges to the allowance of $20 million due to write-offs of recoverable claims paid, a decrease in reinsurance of $19 million, claims expenses of $4 million and a foreign exchange translation impact of $10 million due to the stronger Canadian dollar.
Included in the allowance for claims on insurance was $40 million (2004 — $59 million) which represented the allowance for potential claims on insurance policies that have been ceded by EDC to reinsurance companies. These amounts were also recorded as an asset on the balance sheet as they represented the reinsurers’ share of EDC’s allowance for claims. If EDC were required to pay out a claim on these policies EDC would recover this claim payment from the reinsurer. The decrease from 2004 was mainly due to a reduction in concentration risk within the short-term insurance and the political risk insurance programs. The allowance for claims on insurance net of reinsurers’ share was $496 million (2004 — $489 million).
Ninety-six per cent ($20 million) of the total unrecoverable portion of the claims paid amount was attributed to short-term insurance claims.
The net allowance as a percentage of contingent liability remained within a range of 3.5% to 4.1% averaging 3.9% over the last five years. The allowance is based on an actuarial valuation of the insurance policy and claim liabilities. The actuarial valuation uses simulation techniques and is based on assumptions (frequency of claim and severity of loss) relevant for each insurance program separately and is derived from the Corporation’s own experience. As previously discussed in the provision for (reversal of) credit losses section on page 60, the allowance was reviewed in 2005 and a refined actuarial methodology was used. In the past, the allowance included a provision for adverse deviation such that it would be sufficient to cover all expected losses 19 times out of 20. The level of provision for adverse deviation was reviewed in 2005 resulting in a reduction in the net allowance for all insurance lines.
CREDIT QUALITY — INVESTMENTS AND DERIVATIVE FINANCIAL INSTRUMENTS
The Department of Finance sets out guidelines that define the minimum acceptable counterparty credit rating pertaining to EDC’s investments and derivative financial instruments. In addition, EDC has policies which are reviewed and re-approved annually by the Board, and procedures which establish credit limits for each counterparty, which are reviewed by management no less than annually. These policies and procedures are designed to limit and manage the credit risk associated with these financial instruments.
EDC’s interest-bearing deposits and investment portfolio expose EDC to the risk that the deposit-taking institutions or the investment issuer will not repay EDC in accordance with contractual terms. EDC’s potential deposit and investment credit exposure is represented by the carrying value of the financial instruments.
The following table provides a breakdown, by credit rating and term to maturity, of EDC’s deposit and investment credit exposure.
| | | | | | | | | | | | | | | | | | | | | |
| ($ in millions) | | | | | | | | | |
| | | Remaining term to maturity | | | | | | | |
| | | Under 1 | | | 1 to 3 | | | Over 3 | | | 2005 | | | 2004 | |
| Credit rating | | year | | | years | | | years | | | net exposure | | | net exposure | |
| |
| AAA | | | 639 | | | | 516 | | | | 466 | | | | 1,621 | | | | 1,697 | |
| AA+ | | | 29 | | | | — | | | | — | | | | 29 | | | | 3 | |
| AA | | | 199 | | | | 7 | | | | 15 | | | | 221 | | | | 223 | |
| AA- | | | 731 | | | | 6 | | | | 47 | | | | 784 | | | | 498 | |
| A+ | | | 397 | | | | 54 | | | | 35 | | | | 486 | | | | 473 | |
| A | | | 86 | | | | 36 | | | | — | | | | 122 | | | | — | |
| |
| Total | | $ | 2,081 | | | $ | 619 | | | $ | 563 | | | $ | 3,263 | | | $ | 2,894 | |
| |
Derivatives expose EDC to the risk that the counterparty will not repay EDC in accordance with contractual terms. EDC’s potential derivative credit exposure is represented by the replacement cost of contracts that have a positive fair value. For a more in-depth discussion on EDC’s use of derivatives, please refer to page 79.
EDC Annual Report 2005
77
MANAGEMENT’S DISCUSSION AND ANALYSIS
EDC operates a collateral program to mitigate credit exposure related to swaps used to hedge risk within EDC’s funding program. All swaps are transacted with high credit quality financial institutions. As market rates move between the settlement date and maturity date of the swap, the financial instrument attains value such that to terminate the swap early, one counterparty would need to make payment to the other to compensate for the movement in rates. In order to mitigate this risk, EDC has entered into collateral agreements with financial institutions with whom EDC undertakes swap transactions. Under the terms of the swap agreements, when the credit exposure surpasses an agreed upon threshold, collateral in the form of government securities are posted with an independent third party. At December 31, 2005, $1,080 million was posted as collateral by EDC’s counterparties to mitigate credit risk associated with swap agreements.
The following table provides a breakdown, by credit rating and term to maturity, of EDC’s derivative credit exposure and how it is offset against exposure netting amounts and collateral held. Exposure netting amounts represent derivative contracts where there is an agreement with the counterparty (master netting agreement) that allows EDC to offset the counterparty’s derivative credit exposure to EDC against EDC’s credit exposure to that same counterparty. After applying both exposure netting and collateral held EDC’s net exposure is $479 million (2004-$632 million).
| | | | | | | | | | | | | | | | | | | | | | | | | | | | | | | | | |
| ($ in millions) | | | | | | | | | | | | | | | | | | |
| | | Remaining term to maturity | | | | | | | | | | | | | | | | |
| | | Under 1 | | | 1 to 3 | | | Over 3 | | | Gross | | | Exposure | | | Collateral | | | 2005 net | | | 2004 net | |
| Credit rating | | year | | | years | | | years | | | exposure | | | netting* | | | held | | | exposure | | | exposure | |
| |
| AAA | | | 3 | | | | — | | | | 12 | | | | 15 | | | | (19 | ) | | | — | | | | (4 | ) | | | 96 | |
| AA+ | | | — | | | | — | | | | 17 | | | | 17 | | | | (7 | ) | | | — | | | | 10 | | | | 6 | |
| AA | | | 57 | | | | 69 | | | | 14 | | | | 140 | | | | (3 | ) | | | — | | | | 137 | | | | 124 | |
| AA- | | | 175 | | | | 121 | | | | 912 | | | | 1,208 | | | | (26 | ) | | | (917 | ) | | | 265 | | | | 325 | |
| A+ | | | 28 | | | | 29 | | | | 217 | | | | 274 | | | | (40 | ) | | | (163 | ) | | | 71 | | | | 76 | |
| A | | | — | | | | — | | | | — | | | | — | | | | — | | | | — | | | | — | | | | 5 | |
| |
| Total | | $ | 263 | | | $ | 219 | | | $ | 1,172 | | | $ | 1,654 | | | $ | (95 | ) | | $ | (1,080 | ) | | $ | 479 | | | $ | 632 | |
| |
| | |
| * As a result of master netting agreements |
Credit risk for investments and derivative financial instruments is reported on a quarterly basis to the Asset Liability Management Committee and to the Risk Management Committee of the Board.
MARKET RISK
Market risk is the likelihood of loss to EDC as a result of movements in interest and foreign exchange rates.
The foundation of market risk management at EDC is the Market Risk Management Framework which outlines the Corporation’s interest rate and foreign exchange limits; liquidity; investment; debt funding; derivatives and structured notes policies; and credit granting, monitoring and limits for Treasury counterparties. The management of credit risk related to Treasury counterparties has been discussed under the Credit Risk section. The framework is reviewed annually by Management’s Asset Liability Management Committee and the Board Risk Management Committee and requires annual Board re-approval of the policies contained therein.
ASSET LIABILITY MANAGEMENT
Asset liability management consists of managing the market risks of EDC’s borrowing and lending activities. The Asset Liability Management Committee, which is chaired by the Chief Financial Officer oversees and directs the management of market risks inherent within EDC’s normal business activities. The Risk Management Committee of the Board reviews all market risk management risk policies annually.
Interest Rate Risk
Interest rate risk is the risk inherent within the asset liability management activities of EDC. Interest rate risk results from differences in the maturities or repricing dates of assets and liabilities both on and off-balance sheet, as well as from embedded optionality in those assets and liabilities.
The objective of interest rate risk management is to manage the risk in line with the Corporation’s risk appetite and to safeguard from undesired volatility in both earnings and shareholder value. When asset and liability principal and interest cash flows have different interest payment or maturity dates, EDC is exposed to interest rate risk.
EDC’s exposure to interest rate risk depends upon the size and maturity of the mismatched positions. New business volumes and how actively borrowers exercise options also impact exposure.
EDC’s interest rate risk is managed in accordance with guidelines established by the Department of Finance as well as policies set by the Board of Directors. EDC reports on its interest rate risk on a quarterly basis to the Asset Liability Management Committee and to the Risk Management Committee of the Board.
Interest rate swaps are the primary instrument used to modify the characteristics of balance sheet instruments and to hedge interest rate exposures.
EDC’s interest rate risk policy limits are tested on a monthly basis to ensure they are compliant. Interest rate risk is measured by simulating the impact of a 100 basis point change on both EDC’s net financing and investment income and economic value.
It’s About More Than Exporting
78
MANAGEMENT’S DISCUSSION AND ANALYSIS
Interest Rate Sensitivity
| | | | | | | | | |
| ($ in millions) | | | | | | |
| Interest rate change | | +100 Basis Points | | | -100 Basis Points | |
| |
| Change in net financing and investment income | | | 8 | | | | (8 | ) |
| Change in economic value | | | (432 | ) | | | 467 | |
| |
Foreign Exchange Risk
Foreign exchange risk is the exposure of the Corporation’s net financing and investment income and economic value to adverse movements in foreign exchange rates. Foreign exchange risk exists where there is a mismatch between assets and liabilities in any currency. EDC manages foreign exchange risk within Board approved policies with the objective of measuring, monitoring and managing the effects of currency fluctuations on the company’s earnings.
EDC’s foreign exchange risk is managed in accordance with guidelines established by the Department of Finance as well as policies set by the Board of Directors. EDC reports on its foreign exchange risk on a quarterly basis to the Asset Liability Management Committee and to the Risk Management Committee of the Board.
In addition to managing within the guidelines and policies described above, EDC also has supplemental operational limits and reporting requirements. Management of foreign exchange rate risk is enabled through monthly risk position monitoring and reporting.
DERIVATIVES
EDC uses a variety of derivatives to manage costs, returns and levels of financial risk associated with its funding, investment and risk management activities. The principal purpose of EDC’s use of derivatives is to hedge against foreign exchange and interest rate risk. EDC’s use of derivatives may include, but is not restricted to, currency and interest rate swaps, foreign exchange contracts, futures, options and equity index swaps. EDC does not use derivatives for speculative purposes.
EDC does not engage in the use of derivatives whose value and financial risks cannot be measured, monitored and managed on a timely basis. The Market Risk Management department formally reviews EDC derivative financial instrument transactions at time of inception, and on an ongoing basis to provide an independent verification on the valuation of transaction structures and of associated financial risks.
The use of any new derivative product is reviewed and reported separately by the Market Risk Management department. The Corporation’s Derivatives and Structured Notes Policy requires that transactions deemed to be new transaction types be endorsed by a cross-functional New Transaction Type Panel prior to execution.
Funding
Derivatives are used to achieve reduced fixed rate or sub-LIBOR floating rate funding costs. An example would be issuing an EDC bond in a foreign currency on a fixed interest rate basis and entering into a currency and interest swap with a creditworthy counterparty to achieve low-cost floating rate US dollar denominated debt. The combination of the bond issue and swap would deliver a more favourable cost of funding than could be achieved using a straight US dollar floating rate bond issue.
Investing
Derivatives are used to maximize yields on investments. For example, EDC may obtain a higher yield by investing in a Euro term deposit, where US dollars are converted to Euros, rather than invest directly in a US dollar treasury bill. At maturity the maturing term deposit is swapped back into US dollars. This structure uses a forward foreign exchange contract to enhance the investment yield.
Derivatives are also used to offset or reduce risk of investments. For example, EDC may use a foreign exchange contract to hedge the foreign exchange risk inherent in the maintenance of a US dollar liquidity portfolio. This is accomplished by entering into foreign exchange contracts that guarantee a conversion rate from US dollars to Canadian dollars.
Risk Management
Derivatives are used to hedge risks by diversifying concentrated exposures. For example, EDC might balance the proportion of fixed to floating assets in its portfolio using interest rate swaps in order to diversify interest rate risk.
The following table indicates the fair value based upon maturity of EDC’s derivatives:
| | | | | | | | | | | | | |
| ($ in millions) | | Positive | | | Negative | | | Net | |
| |
| Maturity less than 1 year | | | 263 | | | | (16 | ) | | | 247 | |
| Maturity 1 - 3 years | | | 219 | | | | (7 | ) | | | 212 | |
| Maturity 4 - 5 years | | | 521 | | | | (19 | ) | | | 502 | |
| Maturity in excess of 5 years | | | 651 | | | | (104 | ) | | | 547 | |
| |
| Gross fair value of contracts | | $ | 1,654 | | | $ | (146 | ) | | $ | 1,508 | |
| |
EDC Annual Report 2005
79
MANAGEMENT’S DISCUSSION AND ANALYSIS
LIQUIDITY RISK
Liquidity risk is the risk that EDC would be unable to honour daily cash outflow commitments or the risk that EDC would have to obtain funds rapidly, possibly at an excessively high premium during severe market conditions. Liquidity risk arises from two sources: mismatched cash flows related to assets and liabilities; and liquidity risk due to the characteristics of credit commitments.
Liquidity management for EDC is the responsibility of Treasury. The established framework consists of policies, limits and independent monitoring of liquidity. Pursuant to its risk management policies, EDC must maintain sufficient liquidity to meet the following six months’ forecasted net cash outflow requirements without accessing the capital markets (i.e. bond issuance).
The size of the liquidity held in excess of policy limits increased in the first half of 2005 largely as a result of lower than projected loan disbursements. However, following an increase in loan signing activity and the repayment of maturing short-term debt in the amount of US $1.0 billion in the second half of 2005, the excess of liquidity position over the policy limit returned to within the historical average.
Within the overall policy framework, EDC manages its liquidity risk both within the overall policy limits and also within supplemental operational limits and reporting. The Market Risk Management department provides ongoing measuring and reporting to senior management on EDC’s actual liquidity position against this minimum limit on a monthly basis and to the Risk Management Committee of the Board on a quarterly basis.
EDC maintains liquidity through a variety of methods:
| • | | Cash and Marketable Securities: EDC holds cash and marketable securities to ensure that sufficient liquidity is available if required to meet forecasted cash requirements. During 2005, the average balance of cash and marketable securities was $3,980 million. |
| |
| • | | Access to Commercial Paper Markets: In the course of EDC’s normal activities, the Corporation’s commercial paper programs provide it with the necessary liquidity to meet its cash requirements on a daily basis. During 2005, the average balance of short-term debt was $2,695 million with a turnover of 15 times. |
| |
| • | | Standby Credit Facility: As a contingency, EDC also maintains a minimum US $1 billion standby revolving credit facility to further ensure its liquidity. To date, it has not been necessary to use this facility. |
OPERATIONAL RISK
Operational risk is defined as the risk of direct or indirect loss resulting from the organizational environment, or external events and relations, or inadequate internal processes, people or systems. Operational risk includes risk to EDC’s reputation and the risk of not meeting EDC’s mandate or regulatory requirements.
Management is directly responsible for all activities of the entity, including management of operational risk. Senior management is responsible for managing risks related to their units’ objectives. Primary responsibility for the day-to-day management of operational risk lies with business unit management with support from specialist groups such as Information Systems, Human Resources, Corporate Finance and Control, and Legal. Business unit management is responsible for ensuring that appropriate procedures, internal controls and processes are established to manage operational risks and to comply with corporate policies. A variety of supporting programs are in place to provide additional assurance that operational risks are appropriately managed. Some of these programs are highlighted below.
The Risk Management Office is responsible for working with management to establish effective risk management. The Chief Risk Officer has the ultimate responsibility for establishing the Operational Risk Management program, as well as a supplementary reporting channel.
SELF-ASSESSMENT OF RISK AND CONTROLS
Control Self-Assessment (CSA) is a common tool available to financial institutions in the evaluation and management of operational risk. Utilizing the Committee of Sponsoring Organizations of the Treadway Commission framework (COSO), such assessment is conducted across products, processes, functions, activities or projects.
To date, EDC has utilized CSA in a limited manner. CSA has been tested within selected business units to determine its benefits in assisting leaders managing these units. The need for, and benefits of, a more rigorous and broader corporate wide application of CSA have yet to be proven. However, the pending integration of the Business Development Group, Medium- and Long-Term Financial Services and Short-Term Financial Services will create a new set of business units and processes for which CSA may well be a beneficial tool to assist management in evaluating and monitoring the operational risks associated with such new units and modified processes.
In the meantime, the more immediate focus for operational risk assessment relates to financial reporting and disclosure as discussed below.
INTERNAL CONTROL CERTIFICATION
In conjunction with the Treasury Board’s Report on Crown Corporation Governance, EDC has commenced preliminary activities exploring the area of Internal Control Certification (ICC). In addition to work surrounding the scoping of such an exercise, EDC has commenced a small pilot project to look into how a certification regime might be implemented should the Corporation decide to pursue further undertakings within this area.
INDEPENDENT EVALUATION
EDC’s Internal Audit & Evaluation (IAE) group independently monitors and reports on the effectiveness, adequacy and sustainability of business processes, risk management processes and related internal controls used by management to achieve its business objectives. All activities within the entity are within the scope of the internal audit group’s responsibility, including the processes designed by management to manage operational risk. IAE uses a risk-based audit methodology that is reflective of the Institute of Internal Auditor’s best practices. IAE reports directly to the Audit Committee of the Board of Directors, in addition to communicating results to executive management.
IAE’s risk-based audit methodology includes input from management self-assessment, as well as the results of ICC initiatives.
It’s About More Than Exporting
80
MANAGEMENT’S DISCUSSION AND ANALYSIS
BUSINESS CONTINUITY PLAN
EDC has had a mature and comprehensive Business Continuity Plan (BCP) in place since 1998. Diligent testing has been performed covering all aspects of the BCP on a regular basis, including command and control, supplier performance, infrastructure restart and recovery and, most importantly, the effectiveness and viability of the plans for the business teams. EDC has activated its BCP plan on more than one occasion and it has performed extremely well, maintaining the business and service to the customers with minimal disruption.
CORPORATE SOCIAL RESPONSIBILITY
EDC’s commitment to Corporate Social Responsibility (CSR) is built upon five essential pillars: business ethics, the environment, transparency, community investment and organizational climate. EDC has made a significant investment in time and resources on all of these fronts and has made CSR a central part of its ongoing business strategy. We recognize that growth and sustainability must be addressed simultaneously and that CSR is intrinsic to achieving sustainable trade. EDC strives to maximize Canadian exporter growth potential, while promoting a cleaner environment and acting in accordance with the highest ethical standards, as well as investing in our communities and our employees.
EMPLOYEE OPINION SURVEY
A key method by which EDC monitors its exposure to people-related operational risks is the bi-annual Employee Opinion Survey. This survey gives EDC a mechanism to gather employee input on climate conditions that enable or inhibit key drivers of performance. These results drive action plans to build on EDC’s strengths and support the corporate values.
CAPITAL MANAGEMENT
Capital adequacy is a measurement of the demand for capital, that is, the amount of capital required to cover the credit, market and operational risks taken by the Corporation compared to the supply of capital or the existing capital base. The demand is calculated by a model which estimates the capital required to cover the extreme value of potential losses (including both expected and unexpected losses) arising from credit, market and operational risk on lending, insurance and treasury operations. The supply is determined by EDC’s financial statements and consists of paid-in share capital, retained earnings (excluding the impact of unrealized fair value adjustments) and allowances. EDC targets a level of capitalization sufficient to cover potential losses consistent with a rating standard of AAA.
The following table represents the breakdown of the demand on EDC’s capital by type of risk in comparison to the supply of capital. Over the last 12 months EDC’s capital position has significantly overachieved its AAA solvency rating target. This was partially due to the introduction of risk mitigation insurance in the aerospace portfolio.
| | | | | | | | | |
| ($ in millions) | | | | | | |
| Demand for Capital | | 2005 | | | 2004 | |
| |
| Credit risk | | | 4,617 | | | | 5,017 | |
| Market risk | | | 1,274 | | | | 1,435 | |
| Operational risk | | | 301 | | | | 319 | |
| |
| Total demand | | $ | 6,192 | | | $ | 6,771 | |
| |
| | | | | | | | | |
Supply of capital | | $ | 7,564 | | | $ | 6,965 | |
| |
| EDC rating | | AAA | | AAA |
| |
| | | | | | | | | |
Capital Ratios | | | | | | | | |
| |
Tier 1 capital | | | | | | | | |
| Paid in share capital | | | 983 | | | | 983 | |
| Retained earnings* | | | 3,686 | | | | 2,351 | |
| |
Total tier 1 capital | | | 4,669 | | | | 3,334 | |
| | | | | | | | | |
Tier 2 capital | | | | | | | | |
| Allowances | | | 2,895 | | | | 3,631 | |
| |
Total capital | | $ | 7,564 | | | $ | 6,965 | |
| |
| Tier 1 to risk weighted assets (exposure)** | | | 19.4 | % | | | 13.2 | % |
| Total capital to risk weighted assets | | | 31.4 | % | | | 27.5 | % |
| Total equity to total assets | | | 23.7 | % | | | 16.1 | % |
| |
| | |
| * | | Retained earnings excludes the impact of unrealized fair value adjustment. |
| |
| ** | | Risk weighted exposure: Internally developed models are used to determine the risk weights to reflect five risk parameters: probability of default, severity of loss in the event of default, term of the exposure, size of the exposure and spread of risk concentration. Risk weighted exposures are then measured based on the risk weights. |
EDC Annual Report 2005
81
MANAGEMENT’S DISCUSSION AND ANALYSIS
FUTURE DIRECTION
Risk Management practices across the global banking industry continue to evolve in sophistication and relevance to decision making. The Bank for International Settlements’ Capital Accord, commonly referred to as Basel I (International Convergence of Capital Measurement and Capital Standards; Basel Committee on Banking Supervision (July 1988), as amended) originally developed in 1988 by the Basel Committee on Banking Supervision, marked the first step toward soundness and stability of the international banking system. More recently, the Basel Committee on Banking Supervision has developed a revised framework, Basel II (International Convergence of Capital Measurement and Capital Standards: A Revised Framework; Basel Committee on Banking Supervision — June 2004), designed to promote the adoption of stronger risk management practices. The coincident evolution of the Basel II Capital Framework and the development of capital modeling applications, have elevated the role of capital management in financial institution risk management and business decision making.
Though EDC is not subject to the regulatory requirements applicable to the commercial banking industry, the Basel II framework is an important guideline and reference point in the ongoing development of EDC’s risk management practices and policies.
The heart of such practices is capital adequacy. The goal of the risk management practices and processes of EDC is to ensure that EDC has at all times sufficient capital to fulfill its mandate and sustain continued risk capacity for Canadian exporters and investors.
While risk management is a continually evolving competency for EDC, the goal of risk management is a constant. The ability to fully characterize, quantify and manage risk in capital terms is the guiding objective for all future enhancements.
EDC’s plans call for the development of an updated and expanded Capital Management Framework setting forth a governance process for the management of capital. Central to this framework is a comprehensive Capital Adequacy Policy which will include a forward-looking capital-based Dividend Policy, to ensure that EDC is appropriately capitalized to meet its current and future business requirements in support of its mandate. The Capital Adequacy Policy will also allow for the strategic allocation of capital in response to: customer needs during volatile market conditions; support for higher risk business; and, support for strategically important market development initiatives, all in a financially sustainable manner. More advanced technology solutions enabling advanced capital modeling and forecasting capabilities will be introduced to fully support the evolving needs of EDC’s customers.
Critical Accounting Policies and Estimates
A summary of EDC’s significant accounting policies can be found in note 2 to the December 31, 2005 consolidated financial statements. The accounting policies discussed below are considered particularly important, as they require management to make certain assumptions and estimates based on information available as at the date of the financial statements. EDC has established procedures to ensure that accounting policies are applied consistently and that the process for changing methodologies is well controlled, and occurs in an appropriate and systematic manner. Critical accounting estimates include the allowance for losses on loans, loan commitments and guarantees, the allowance for claims on insurance and financial instruments measured at fair value. Assumptions made for pension and other benefit plans are discussed in the Employee Future Benefits and Other Benefit Plans section in note 25 of the financial statements.
ALLOWANCE FOR LOSSES ON LOANS, LOAN COMMITMENTS AND GUARANTEES
The allowance for losses on loans, loan commitments and guarantees represents management’s best estimate of probable credit losses. The allowance includes both general and specific components. Management determines the allowances using various assumptions based on its assessment of the impact of recent events and changes in economic conditions and trends. These estimates are reviewed periodically during the year and in detail as at the date of the financial statements.
The purpose of the general allowance is to provide an estimate of probable incurred losses inherent in the loans portfolio that as yet have not been identified on an individual loan basis. Management judgment is required with respect to management’s assessment of probabilities of default, loss severity in the event of default, review of credit quality for internally rated obligors as well as the impact of industry trends and risk concentrations on the portfolio and the required allowance.
Specific allowances are established on an individual basis for loans that management has determined to be impaired. When a loan is considered impaired the carrying value of the loan is reduced to its net realizable value. Management is required to make a number of estimates including the timing and amount of future cash flows, residual values of underlying security, as well as the initial judgment as to whether the loan is impaired or performing.
Additional information on the methodology for determining allowances for losses on loans, loan commitments and guarantees can be found in note 2 to the financial statements.
ALLOWANCE FOR CLAIMS ON INSURANCE
The allowance for claims on insurance represents the estimated future claims of the Corporation under the terms and conditions of its insurance policies. The allowance is based on an actuarial valuation of the insurance policy and claim liabilities. This valuation uses simulation techniques and management’s assumptions relevant for each insurance program separately and is derived from the Corporation’s own experience. Management judgment is required in estimating the variables that are part of the actuarial calculation of the allowance. These variables include the frequency of claims, severity of loss and discount rates used. Management judgment is also used in selecting the confidence level for adverse deviation.
FINANCIAL INSTRUMENTS MEASURED AT FAIR VALUE
In accordance with GAAP, certain financial instruments are recognized on the balance sheet at their fair value. These financial instruments are comprised of trading portfolio securities and derivative financial instruments. Fair value is defined as the amount of the consideration that would be agreed upon in an arm’s length transaction between knowledgeable, willing parties who are under no compulsion to act.
It’s About More Than Exporting
82
MANAGEMENT’S DISCUSSION AND ANALYSIS
The fair value of trading portfolio securities is estimated using observable market prices. If such prices are not available, a valuation model is used that is consistent with accepted economic pricing methodologies. The fair value of derivative financial instruments is calculated using established industry-standard pricing models since these derivative financial instruments are not actively quoted in the market. In determining the assumptions to be used in these pricing models, EDC relies primarily on observable market inputs including current market spot and forward exchange rates as well as current market swap rates.
The use of methodologies, models and assumptions in measuring the fair value of these financial assets and liabilities is governed by the Corporation’s Market Risk Management department, which is not involved in trading the financial assets and liabilities and therefore provides an independent valuation. The Corporation’s accounting functions utilize these independent valuations in recognizing and measuring the transactions of the Corporation.
FUTURE ACCOUNTING CHANGES
FINANCIAL INSTRUMENTS
The CICA has issued three new accounting standards: Section 1530, Comprehensive Income, Section 3855 Financial Instruments — Recognition and Measurement and Section 3865, Hedges. These pronouncements establish standards for the recognition and measurement of financial instruments. They are effective for fiscal years beginning on or after October 1, 2006. EDC is currently assessing the impact of these standards.
Section 1530 introduces a new component of the balance sheet entitled Comprehensive Income. Comprehensive income is classified as part of shareholder’s equity and includes net income and other comprehensive income. Other comprehensive income holds any gains and losses resulting from the change in market value on assets that are classified as available-for-sale. Upon settlement of these assets, any of the associated gains or losses are removed from other comprehensive income and brought into the current period’s income.
Upon initial adoption of the new Section 3855, EDC will be required to classify each of its financial assets as held-for-trading, available-for-sale, held-to-maturity or loans and receivables and prospectively apply the appropriate accounting treatment for each.
EDC’s loan assets will likely be classified as loans and receivables and accounted for on an amortized cost basis. Since EDC currently uses this method of accounting for its loans, no significant accounting impact is anticipated. EDC’s trading portfolio, which is currently accounted for on a fair value basis, will likely be classified as held-for-trading. Held-for-trading financial assets will be accounted for on a fair value basis with both realized and unrealized gains and losses being recorded in income. It is anticipated that EDC’s investments and its existing held-to-maturity portfolio securities will be classified as available-for-sale. Financial assets classified as available-for-sale will be accounted for on a fair value basis with unrealized gains and losses being recorded in other comprehensive income.
The new standards permit any financial instrument to be designated as held-for-trading. It is anticipated that EDC will designate a portion of its debt instruments as held-for-trading and thereby measure them at fair value with any gains or losses offsetting the gains or losses on their related derivatives. As discussed in the net income analysis on page 54, it is anticipated that this will reduce the income volatility resulting from the implementation of Emerging Issues Committee Abstract 128 — Accounting for Trading, Speculative or Non-Hedging Derivative Financial Instruments (EIC-128) in 2004. EIC-128 requires that all derivatives be recorded at fair value, while not allowing for the underlying bonds to be accounted for in the same manner. The remaining financial liabilities will be measured at cost.
CONTRACTUAL OBLIGATIONS
In the normal course of business, EDC enters into contracts that give rise to commitments of future minimum payments.
EDC has two types of loan commitments. The first type is undisbursed amounts on signed loan agreements. The second type represents commitments made by EDC, for which terms related to the transaction such as interest rate type and disbursement schedule have not yet been determined. This category includes letters of offer accepted and outstanding as well as unallocated, confirmed lines of credit.
Purchase obligations include those obligations that are legally binding agreements whereby EDC has agreed to purchase products or services with specific minimum quantities defined as fixed, minimum or variable in price over a specified period of time.
The table below provides a summary of the Corporation’s future contractual funding commitments.
| | | | | | | | | | | | | | | | | | | | | |
| ($ in millions) | | Under 1 | | | 1 to 3 | | | 3 to 5 | | | Over 5 | | | | |
| At December 31,2005 | | year | | | years | | | years | | | years | | | Total | |
| |
| Long-term debt | | | 4,814 | | | | 2,032 | | | | 2,297 | | | | 2,479 | | | | 11,622 | |
| Undisbursed loan commitments | | | — | | | | 2,517 | | | | 329 | | | | 32 | | | | 2,878 | |
| Letters of offer accepted and outstanding | | | — | | | | 1,312 | | | | — | | | | — | | | | 1,312 | |
| Confirmed LOC | | | 205 | | | | 60 | | | | 37 | | | | 131 | | | | 433 | |
| Operating leases | | | 13 | | | | 27 | | | | 28 | | | | 14 | | | | 82 | |
| Purchase obligations | | | 6 | | | | 4 | | | | — | | | | — | | | | 10 | |
| |
| Total | | $ | 5,038 | | | $ | 5,952 | | | $ | 2,691 | | | $ | 2,656 | | | $ | 16,337 | |
| |
EDC Annual Report 2005
83
The consolidated financial statements contained in this Annual Report have been prepared by management in accordance with Canadian generally accepted accounting principles appropriate in the circumstances. The integrity and objectivity of the data in these consolidated financial statements are management’s responsibility. It is necessary for management to make assumptions and estimates based on information available as at the date of the financial statements. Areas where management has made significant estimates and assumptions include the determination of the primary beneficiary of variable interest entities, the allowance for losses on loans, the allowance for loan commitments and guarantees, the allowance for claims on insurance, financial instruments measured at fair value, and employee future benefits. Management is also responsible for all other information in the Annual Report and for ensuring that this information is consistent, where appropriate, with the information and data contained in the consolidated financial statements.
In support of its responsibility, management maintains financial, management control and information systems and management practices to provide reasonable assurance that the financial information is reliable, that the assets are safeguarded and that the operations are carried out effectively. The Corporation has an internal audit department whose functions include reviewing internal controls and their application, on an ongoing basis.
The Board of Directors of EDC is responsible for the management of the business and activities of the Corporation. In particular, it is responsible for ensuring that management fulfills its responsibilities for financial reporting and internal control and exercises this responsibility through the Audit Committee of the Board, which is composed of Directors who are not employees of the Corporation. The Audit Committee meets with management, the internal auditors and the Auditor General of Canada on a regular basis.
Contracts which, in the opinion of EDC, involve risks in excess of that which the Corporation would normally undertake, may be entered into under the authority of the Minister of International Trade and the Minister of Finance where the Minister of International Trade considers them to be in the national interest. Funds required for such contracts are paid to the Corporation by the Minister of Finance out of the Consolidated Revenue Fund, and funds recovered are remitted to the Consolidated Revenue Fund, net of amounts withheld to cover related administrative expenses. These transactions, which are known as Canada Account transactions, are shown in note 26 to the Corporation’s consolidated financial statements, and the responsibility of the Board of Directors for these transactions is limited to the management of the administration thereof by EDC.
The Auditor General of Canada conducts an independent audit, in accordance with Canadian generally accepted auditing standards, and expresses her opinion on the consolidated financial statements. Her report is presented on the following page.
| | | |
| |  |
Rob Wright | | Peter Allen, FCA |
| President and Chief Executive Officer | | Executive Vice-President and Chief Financial Officer |
February 17, 2006
It’s About More Than Exporting
84
I have audited the consolidated balance sheet of Export Development Canada as at December 31, 2005 and the consolidated statements of income and retained earnings and cash flows for the year then ended. These financial statements are the responsibility of the Corporation’s management. My responsibility is to express an opinion on these financial statements based on my audit.
I conducted my audit in accordance with Canadian generally accepted auditing standards. Those standards require that I plan and perform an audit to obtain reasonable assurance whether the financial statements are free of material misstatement. An audit includes examining, on a test basis, evidence supporting the amounts and disclosures in the financial statements. An audit also includes assessing the accounting principles used and significant estimates made by management, as well as evaluating the overall financial statement presentation.
In my opinion, these consolidated financial statements present fairly, in all material respects, the financial position of the Corporation as at December 31, 2005 and the results of its operations and its cash flows for the year then ended in accordance with Canadian generally accepted accounting principles. As required by the Financial Administration Act, I report that, in my opinion, these principles have been applied on a basis consistent with that of the preceding year.
Further, in my opinion, the transactions of the Corporation and of its wholly-owned subsidiary that have come to my notice during my audit of the consolidated financial statements have, in all significant respects, been in accordance with Part X of the Financial Administration Act and regulations, the Export Development Act and regulations, the by-laws of the Corporation and the charter and the by-laws of its wholly-owned subsidiary.
| | | |
| | |
Sheila Fraser, FCA | | |
| Auditor General of Canada | | |
Ottawa, Canada
February 17, 2006
EDC Annual Report 2005
85
CONSOLIDATED FINANCIAL STATEMENTS
Consolidated Balance Sheet
| | | | | | | | | |
| as at December 31 | | | | | | |
| ($ in millions) | | 2005 | | | 2004 | |
| |
Assets | | | | | | | | |
Cash and Investments | | | | | | | | |
| Cash and cash equivalents | | | 152 | | | | 74 | |
| Marketable securities (note 3) | | | 3,030 | | | | 2,742 | |
| Investments (note 4) | | | 64 | | | | 68 | |
| Accrued interest | | | 17 | | | | 10 | |
| |
| | | | 3,263 | | | | 2,894 | |
| |
| | | | | | | | | |
Financing and Leasing Assets | | | | | | | | |
| Loans receivable (notes 5 and 6) | | | 16,297 | | | | 18,174 | |
| Allowance for losses on loans (note 7) | | | (2,148 | ) | | | (2,674 | ) |
| Risk mitigation insurer’s share of loan allowance (note 8) | | | 124 | | | | — | |
| Equipment available for lease (note 6) | | | 114 | | | | — | |
| Accrued interest and fees | | | 182 | | | | 227 | |
| |
| | | | 14,569 | | | | 15,727 | |
| |
| | | | | | | | | |
Other | | | | | | | | |
| Recoverable insurance claims (note 13) | | | 67 | | | | 68 | |
| Reinsurers’ share of allowance for claims (note 14) | | | 40 | | | | 59 | |
| Derivative related amounts (note 22) | | | 1,725 | | | | 1,953 | |
| Other assets | | | 65 | | | | 49 | |
| |
| | | | 1,897 | | | | 2,129 | |
| |
Total Assets | | $ | 19,729 | | | $ | 20,750 | |
| |
| | | | | | | | | |
Liabilities and Shareholder’s Equity | | | | | | | | |
Loans Payable (note 17) | | | | | | | | |
| Loans payable | | | 13,424 | | | | 15,545 | |
| Accrued interest | | | 153 | | | | 126 | |
| |
| | | | 13,577 | | | | 15,671 | |
| |
| | | | | | | | | |
Other Liabilities and Deferred Revenue | | | | | | | | |
| Accounts payable and other credits | | | 110 | | | | 112 | |
| Deferred insurance premiums | | | 54 | | | | 36 | |
| Derivative related amounts (note 22) | | | 333 | | | | 458 | |
| Allowance for loan commitments and guarantees (note 7) | | | 355 | | | | 448 | |
| Allowance for claims on insurance (note 14) | | | 536 | | | | 548 | |
| |
| | | | 1,388 | | | | 1,602 | |
| |
Loan Commitments and Contingent Liabilities (notes 9 and 11) | | | | | | | | |
Shareholder’s Equity (note 20) | | | | | | | | |
| Share capital | | | 983 | | | | 983 | |
| Retained earnings | | | 3,781 | | | | 2,494 | |
| |
| | | | 4,764 | | | | 3,477 | |
| |
Total Liabilities and Shareholder’s Equity | | $ | 19,729 | | | $ | 20,750 | |
| |
See accompanying notes.
Approved by the Board of Directors
| | | |
| |  |
Brian G. Heffernan | | Rob Wright |
| Director | | Director |
It’s About More Than Exporting
86
CONSOLIDATED FINANCIAL STATEMENTS
Consolidated Statement of Income and Retained Earnings
| | | | | | | | | |
| for the year ended December 31 | | | | | | |
| ($ in millions) | | 2005 | | | 2004 | |
| |
| Financing and investment income: | | | | | | | | |
| Loans | | | 1,155 | | | | 1,148 | |
| Debt relief (note 24) | | | 64 | | | | 43 | |
| Investment portfolio | | | 123 | | | | 63 | |
| |
| | | | 1,342 | | | | 1,254 | |
| | | | | | | | | |
| Interest expense | | | 494 | | | | 345 | |
| |
Net Financing and Investment Income | | | 848 | | | | 909 | |
Insurance Premiums and Guarantee Fees (note 12) | | | 156 | | | | 161 | |
Other Income (Expense) (note 15) | | | — | | | | (7 | ) |
Provision for (Reversal of) Credit Losses (note 16) | | | (513 | ) | | | (214 | ) |
| Income after provision for (reversal of) credit losses | | | 1,517 | | | | 1,277 | |
| |
Administrative Expenses | | | 182 | | | | 178 | |
| Income before unrealized fair value adjustment | | | 1,335 | | | | 1,099 | |
Unrealized fair value adjustment (note 22) | | | (48 | ) | | | 143 | |
| |
| | | | | | | | | |
Net Income | | | 1,287 | | | | 1,242 | |
| | | | | | | | | |
Retained Earnings | | | | | | | | |
| Beginning of year | | | 2,494 | | | | 1,252 | |
| |
| End of year | | $ | 3,781 | | | $ | 2,494 | |
| |
See accompanying notes.
EDC Annual Report 2005
87
CONSOLIDATED FINANCIAL STATEMENTS
Consolidated Statement of Cash Flows
| | | | | | | | | |
| for the year ended December 31 | | | | | | |
| ($ in millions) | | 2005 | | | 2004 | |
| |
Cash Flows from (used in) Operating Activities | | | | | | | | |
| Net income | | | 1,287 | | | | 1,242 | |
| Adjustments to determine net cash from (used in) operating activities | | | | | | | | |
| Provision for (reversal of) credit losses | | | (513 | ) | | | (214 | ) |
| Unrealized fair value adjustment | | | 48 | | | | (143 | ) |
| Changes in operating assets and liabilities | | | | | | | | |
| Accrued interest and fees receivable | | | (247 | ) | | | (207 | ) |
| Accrued interest and fees payable | | | 31 | | | | (81 | ) |
| Derivative related interest receivable | | | 10 | | | | 79 | |
| Derivative related interest payable | | | (3 | ) | | | (10 | ) |
| Other | | | 15 | | | | (55 | ) |
| |
| Net cash from operating activities | | | 628 | | | | 611 | |
| |
| | | | | | | | | |
Cash Flows from (used in) Investing Activities | | | | | | | | |
| Loan disbursements | | | (4,574 | ) | | | (4,172 | ) |
| Loan repayments | | | 5,848 | | | | 4,934 | |
| Purchases of marketable securities | | | (45,795 | ) | | | (43,351 | ) |
| Sales/maturities of marketable securities | | | 45,439 | | | | 42,686 | |
| Maturities of investments | | | 4 | | | | 3 | |
| |
| Net cash from investing activities | | | 922 | | | | 100 | |
| |
| | | | | | | | | |
Cash Flows from (used in) Financing Activities | | | | | | | | |
| Issue of long-term loans payable | | | 1,008 | | | | 2,978 | |
| Repayment of long-term loans payable | | | (2,265 | ) | | | (4,351 | ) |
| Change in derivative related principal receivable | | | 109 | | | | (195 | ) |
| Change in derivative related principal payable | | | 104 | | | | 444 | |
| Change in short-term loans payable | | | (420 | ) | | | 163 | |
| |
| Net cash used in financing activities | | | (1,464 | ) | | | (961 | ) |
| |
| | | | | | | | | |
| Effect of exchange rate changes on cash and cash equivalents | | | (8 | ) | | | (2 | ) |
| |
| Net increase/(decrease) in cash and cash equivalents | | | 78 | | | | (252 | ) |
| | | | | | | | | |
Cash and Cash Equivalents | | | | | | | | |
| Beginning of year | | | 74 | | | | 326 | |
| |
| End of year | | $ | 152 | | | $ | 74 | |
| |
| | | | | | | | | |
Represented by | | | | | | | | |
| Cash | | | 152 | | | | 44 | |
| Treasury bills | | | — | | | | 30 | |
| |
| | | $ | 152 | | | $ | 74 | |
| |
| | | | | | | | | |
Supplemental Information | | | | | | | | |
| |
| Cash paid for interest | | $ | 455 | | | $ | 347 | |
| |
See accompanying notes.
It’s About More Than Exporting
88
CONSOLIDATED FINANCIAL STATEMENTS
Notes to the Consolidated Financial Statements
1. CORPORATE MANDATE
Export Development Canada (the “Corporation” or “EDC”), was established on October 1, 1969 by the Export Development Act (the “Act”), a statute of the Parliament of Canada that was last amended effective December 21, 2001. The Act provides that the Corporation was established for the purposes of supporting and developing, directly or indirectly, Canada’s export trade and Canadian capacity to engage in that trade and to respond to international business opportunities. The Corporation is named in Part I of Schedule III to the Financial Administration Act and is accountable for its affairs to Parliament through the Minister of International Trade.
EDC incorporated Exinvest Inc. as a wholly-owned subsidiary (the “Subsidiary”) under the Canada Business Corporations Act in 1995. The activities of the Subsidiary have been consolidated with those of the Corporation.
The earnings of the Corporation and its Subsidiary are not subject to the requirements of the Income Tax Act.
The Corporation is subject to a limit imposed by the Act on its contingent liability arrangements. The Act specifies that the limit applies to the principal amount owing under all outstanding arrangements which have the effect of providing, to any person, any insurance, reinsurance, indemnity or guarantee. This limit shall at no time exceed the greater of an amount equal to 10 times the authorized capital of the Corporation, and $20.0 billion which amount may be varied in an appropriation act. As at December 31, 2005, the amount of these contingent liabilities is $16.5 billion (2004 — $14.9 billion).
EDC is for all purposes an agent of Her Majesty in right of Canada. As a result, all obligations under debt instruments issued by the Corporation are obligations of Canada. The Act allows the Corporation to borrow and have outstanding borrowings up to a maximum of 15 times the aggregate of (a) its current paid-in capital and (b) the retained earnings of the Corporation determined in accordance with the previous year’s audited financial statements. The maximum applicable to December 31, 2005 is $52.2 billion (2004 — $33.5 billion), against which borrowings amounted to $13.4 billion (2004 — $15.5 billion).
2. SUMMARY OF SIGNIFICANT ACCOUNTING POLICIES
BASIS OF PRESENTATION
The consolidated financial statements of Export Development Canada have been prepared in accordance with Canadian generally accepted accounting principles (GAAP). The significant accounting policies used in the preparation of these consolidated financial statements are summarized on the following pages and conform in all material respects to Canadian GAAP.
MEASUREMENT UNCERTAINTY
To prepare the Corporation’s financial statements in accordance with Canadian GAAP, it is necessary for management to make assumptions and estimates based on information available as at the date of the financial statements. Areas where management has made significant estimates and assumptions include the determination of the primary beneficiary of variable interest entities (note 10), the allowance for losses on loans, loan commitments and guarantees (note 7), the allowance for claims on insurance (note 14), financial instruments measured at fair value (note 23) and employee future benefits (note 25).
Management determines the allowances using various assumptions, based on its assessment of the impact of recent events and changes in economic conditions and trends. These assumptions include probability of default, loss severity in the event of default and various formulas based on credit quality of counterparties. The allowance estimates are reviewed periodically during the course of the year as required and in detail as at the date of the financial statements. Actual losses on loans and liabilities for contingencies incurred may vary significantly from management’s estimates. The uncertainty in the estimation process arises, in part, from the use of historical data to identify and quantify credit deterioration. While historical data may be the most reliable basis available to calculate these amounts, economic events may occur in the near term that render previous assumptions invalid and cause a material change to management’s estimates.
Estimates are also made in the determination of the fair values of the Corporation’s financial instruments, particularly concerning the amount and timing of future cash flows and discount rates. The uncertainty in this valuation process arises mainly from the use of rates including forward exchange rates and swap rates which are current at a point in time but change as financial market conditions change. Actual results may differ significantly from estimates, the impact of which would be recorded in future periods.
CASH AND CASH EQUIVALENTS
Cash equivalents represent short-term highly liquid investments that are readily convertible into cash and that are subject to an insignificant risk of changes in value. Cash and cash equivalents on EDC’s balance sheet include cash and treasury bills. Cash flows arising from transactions in a foreign currency are translated at the yearly average exchange rate on the consolidated statement of cash flows.
EDC Annual Report 2005
89
CONSOLIDATED FINANCIAL STATEMENTS
MARKETABLE SECURITIES
The Corporation holds marketable securities for liquidity purposes. The size and nature of the marketable securities portfolio is governed by Board approved policy. EDC’s marketable securities are held with creditworthy counterparties that must have a minimum credit rating from an external credit rating agency (Standard & Poor’s (S&P), Moody’s or Dominion Bond Rating Service (DBRS)) of A for transactions of less than three years, and a minimum external credit rating of AA- for transactions greater than three years.
Marketable securities are divided into two portfolios, the held-to-maturity portfolio and the trading portfolio, to reflect management’s intent with respect to these securities. Performance for both portfolios is measured against appropriate benchmarks.
Held-to-maturity portfolio securities are comprised of debt securities originally purchased with the intention of being held to maturity but may be sold in response to changes in liquidity needs, changes in interest rates, changes in credit risk or to rebalance the portfolio to better match its benchmark index. These securities are carried at amortized cost, with coupon interest and straight-line amortization of premiums and discounts recorded in investment portfolio income. Gains and losses on sales of these securities are recognized as other income. In the case of a significant and other than temporary loss in the value of a held-to-maturity portfolio security, the security would be written down to its fair value at the time of impairment, with the adjustment charged to other income.
Trading securities are comprised of debt securities bought and held principally for the purpose of selling them in the near term. These securities are carried at fair value. Realized and unrealized gains and losses on the short-term securities are included in investment portfolio income while gains and losses on the long-term securities are included in other income. For the purposes of determining gains and losses, the carrying cost of trading securities is calculated on an average cost basis.
INVESTMENTS
Investments are comprised of restricted cash and debt securities held by EDC’s subsidiary Exinvest and notes issued by related parties. The debt securities and notes are intended to be held to maturity and are carried at amortized cost, with coupon interest and straight-line amortization of premiums and discounts recorded in investment portfolio income. In the case of a significant and other than temporary loss in the value of an investment, the investment would be written down to its fair value at the time of impairment, with the adjustment charged to other income.
LOANS RECEIVABLE
Loans receivable are stated net of non-accrued capitalized interest and deferred loan revenue. Non-accrued capitalized interest is a contractually determined amount typically representing rescheduled interest that would have been recognized on loans to borrowers if those loans were performing. These amounts are not recognized as income while a loan is impaired, unless the carrying value of a loan is determined to be unreasonably low based on estimated discounted cash flows. Rescheduled loans are considered performing unless they meet the criteria of impaired loans. Loan income is recorded on an accrual basis, except for impaired loans. While it is generally EDC’s intention to hold performing loan assets until maturity, in some cases the loans are sold prior to maturity for risk mitigation purposes. Gains and losses on the sale of performing loans and gains on the sale of impaired loans are included in other income. Losses on sales of impaired loans are reported in the provision for credit losses.
IMPAIRED LOANS
Loans are classified as impaired when, in the opinion of management, any of the following criteria are met:
| • | | there has been a deterioration in credit quality to the extent that there is no longer reasonable assurance of the timely collection of the full amount of principal and interest; |
| |
| • | | for commercial loans, when there are payment overdues of 90 days or more, unless the loan is fully secured or collection efforts are reasonably expected to result in repayment of debt; or |
| |
| • | | management considers it prudent to cease accruing interest on the loan. |
When a loan is classified as impaired, the accrual of interest ceases, and any previously accrued but unpaid interest is reversed against loan income. Payments received on a loan that has been classified as impaired are credited to the book value of the loan. No portion of cash received on a loan subsequent to its classification as impaired is recorded as loan income until such time as the loan is restored to performing status, or the book value of the loan reaches zero or is determined to be unreasonably low based on estimated discounted future cash flows.
Loans are restored to performing status when it is determined that there is a reasonable assurance of full and timely collection of principal and interest. When the Corporation restores the impaired loans to an accrual basis, previously non-accrued capitalized interest is recognized over the remaining term of the loan.
FORECLOSED ASSETS
Assets that are returned to EDC because of default under loan agreements are classified as held for use or available for sale according to management’s intention. Those classified as held for use are recorded at fair value and included in equipment available for lease. Those classified as available for sale are recorded at fair value less costs to sell and included in other assets. Any write-downs at recognition are reported in the provision for credit losses and any gains recorded in other income. Fair value is determined based on market prices obtained from an independent appraiser.
It’s About More Than Exporting
90
CONSOLIDATED FINANCIAL STATEMENTS
ALLOWANCE FOR LOSSES ON LOANS, LOAN COMMITMENTS AND GUARANTEES
The allowance for losses on loans, loan commitments and guarantees is based on a review of all loans, loan guarantees and commitments to commercial and sovereign borrowers and represents management’s best estimate of probable credit losses. The allowance includes both general and specific allowances.
General allowances are comprised of the base allowance calculated using counterparty credit ratings, market overlays, and a counterparty concentration allowance. General allowances are calculated using probable credit losses for performing loans, loan guarantees, and loan commitments (including letters of offer). Amounts for loan commitments are factored to provide for the estimated usage rate of the commitment.
For the base allowance, EDC classifies its performing loans, loan commitments and guarantees into seven categories. The first six categories represent groups of performing loans that share the same credit rating. The Corporation categorizes its performing commercial and sovereign loans using a rating system of six credit grades (AA grade to C grade), then establishes an appropriate general allowance based on expected credit losses for each performing risk category. The seventh category represents loan assets that have been designated as watchlist items, which require a higher degree of monitoring and loan allowance. These seven categories, as well as the counterparty ratings, are consistent with the categorization and ratings used by EDC’s credit risk management policies. These categories are further segregated between commercial and sovereign exposures, low risk countries (greater than A) and emerging market countries, and secured and unsecured exposures. Loss rates are determined for each category based on estimates of default rates and loss severity. Default rates are based on the average of Moody’s and Standard & Poor’s default tables. Loss severity is determined based on EDC’s historical loan loss rates. These rates are then applied to the segregated categories to form the general allowance.
In addition, market overlays are provided for those countries and industries which are currently experiencing downward or upward trends. These overlays are needed because of the time delay that exists between market events and announcement of credit rating changes.
EDC has significant single name counterparty concentrations. A counterparty concentration allowance is established for counterparties whose exposure is deemed by management to represent an increased amount of risk. This level is assessed at 10% of EDC’s shareholder’s equity before the impact of the unrealized fair value adjustment determined in accordance with the previous year’s audited financial statements.
Specific allowances are established on an individual loan basis to recognize credit losses. When a loan is considered impaired, the carrying value of the loan is reduced to its estimated realizable value using appropriate market values. When market values are not available, the estimated realizable value is determined by discounting expected cash flows at rates inherent in the loan. The amount of initial impairment and any subsequent changes due to the re-evaluation of estimated future cash flows are recorded through the provision for credit losses as an adjustment to the specific allowance for impaired loans.
Loans are written off when all collection methods have been exhausted and no further prospect of recovery is likely. Loan write-offs are charged against the allowance for losses on loans.
The general allowances for performing loans and specific allowances for impaired loans are shown as a reduction to loans receivable on the balance sheet. General and specific allowances for loan commitments and guarantees are shown as a liability on the balance sheet.
RISK MITIGATION INSURANCE
In order to create capacity for new financing transactions, EDC purchased risk mitigation insurance that would provide a pre-determined level of cash flows on an existing pool of secured financing transactions in the event of default by an obligor. The effect of this insurance policy is to offset a portion of EDC’s loan allowance. The offset is determined by calculating the amount of loan allowance related to the insured amount, based on a pro rata credit risk allocation from the pool of insured assets. The exposure to the airlines is replaced by EDC’s exposure to the insurer. An allowance on this new exposure and an estimate of the outlays required by EDC to maintain the assets in a saleable condition are subtracted from the amount calculated above to arrive at the overall offset to the loan allowance. The premiums paid are deducted from loan revenue.
EQUIPMENT AVAILABLE FOR LEASE
Equipment available for lease consists of aircraft that were returned to EDC because of default under the related obligors’ loan agreements. Depreciation is calculated on a straight-line basis over the remaining useful life of the aircraft after consideration of any residual value. The maximum remaining useful life is 20 years. While EDC does not in the ordinary course of business act as lessor, from time to time the Corporation may engage in leasing activities for asset management purposes to maximize recoveries on returned aircraft and minimize potential losses.
DEFERRED REVENUE
Deferred loan revenue included in loans receivable, comprised of exposure fees and administration fees, is recognized as loan income and amortized as a yield increment over the term of the related loan. Guarantee fee revenue is recognized as income together with insurance premium revenue and is amortized over the term of the related guarantee.
RECOVERABLE INSURANCE CLAIMS
Recoverable insurance claims represent the portion of insurance claims paid that are expected to be recovered from third parties net of any recovery through reinsurance agreements and are recorded at estimated recoverable values. Subsequent net gains or losses on recovery are credited or charged to the allowance for claims on insurance when recoverable values are re-estimated.
EDC Annual Report 2005
91
CONSOLIDATED FINANCIAL STATEMENTS
ALLOWANCE FOR CLAIMS ON INSURANCE
The allowance for claims on insurance represents the estimated future claims of the Corporation under the terms and conditions of its insurance policies. Included in the allowance are amounts for reported claims, incurred but not reported claims, and management’s best estimate of the net present value of net future claims under existing policies. Amounts are determined based on an actuarial valuation and the allowance is reviewed continuously by management. The valuation process conforms to the recommendations of the Canadian Institute of Actuaries. Any adjustments are reflected in the provision for credit losses in the period in which they become known. Future developments may result in claims which are materially different than the allowance provided.
INSURANCE PREMIUMS
Short-term insurance premiums are taken into income when underlying sales are declared by the policyholders. Premiums on other insurance policies are deferred and taken into income using methods that generally reflect the exposures over the terms of the policies and are amortized over the life of the policies on a straight line basis.
REINSURANCE
In the ordinary course of business, the Corporation assumes and cedes reinsurance with other insurance companies. EDC cedes reinsurance to mitigate its risk. The ceding arrangements provide greater diversification of the business and minimize the net loss potential arising from large risks. Ceded reinsurance contracts do not relieve the Corporation of its obligations to the insured. EDC also assumes reinsurance and thereby takes on risk. EDC enters into these arrangements to fulfill the Corporation’s mandate to support Canadian exporters. Reinsurance premiums and recoveries on claims incurred are recorded to their respective income and balance sheet accounts. Unearned premiums ceded to reinsurers and estimates of amounts recoverable from reinsurers on paid claims are deducted from deferred premiums and recoverable claims respectively. Amounts recoverable from the reinsurers are estimated in a manner consistent with the claims liability associated with the reinsured policy.
DERIVATIVE FINANCIAL INSTRUMENTS
The Corporation uses a variety of derivative financial instruments (“derivatives”) to manage market risk, which includes foreign exchange fluctuations and changes in interest rates (see note 22). These derivatives are only contracted with creditworthy counterparties. The counterparty must have a minimum credit rating from an external credit rating agency (S&P, Moody’s or DBRS) of A- where EDC has a collateral agreement with the counterparty. In transactions where EDC does not have a collateral agreement with the counterparty, the counterparty must have a minimum external credit rating of A for transactions of less than three years, and a minimum external credit rating of AA- for transactions greater than three years.
The Corporation does not apply hedge accounting to its derivatives. Derivatives are recognized on the balance sheet upon the settlement date, and removed from the balance sheet when they expire or are terminated. Both on initial recognition and subsequently, each derivative is recognized as either an asset or a liability on the balance sheet at its fair value. Derivatives with a positive fair value are reported as derivative related amounts as a component of total assets. Derivatives with a negative fair value are reported as derivative related amounts as a component of liabilities and shareholder’s equity.
UNREALIZED FAIR VALUE ADJUSTMENT
Under Canadian generally accepted accounting principles, separate line item disclosure before net income would normally only be provided in the case of an extraordinary item or from an item resulting from transactions or events that have some but not all the characteristics of extraordinary items. The unrealized fair value adjustment is neither an extraordinary item nor an item resulting from transactions or events that have some but not all the characteristics of extraordinary items. However, in management’s view, this presentation provides better disclosure of the nature and impact of this amount.
The change in the fair value of derivatives is recognized in income in the period in which it occurs. Income and expenses determined using the accrued cost measurement basis are included with the income and expenses of the operations to which the derivative relates. The remaining change in fair value is reported separately in the income statement, before net income, as “unrealized fair value adjustment”. Management’s intention is to hold derivatives to maturity resulting in the cumulative unrealized gains and losses on individual derivative instruments netting to zero over the life of the instrument.
TRANSLATION OF FOREIGN CURRENCY
All monetary assets and liabilities denominated in foreign currencies are translated into Canadian dollars at exchange rates prevailing at the end of the year. Income and expenses are translated at either daily or monthly average exchange rates in effect during the year. Exchange gains and losses resulting from the translation of foreign currency balances and transactions are included with other income.
It’s About More Than Exporting
92
CONSOLIDATED FINANCIAL STATEMENTS
INTEREST EXPENSE
Interest expense is recorded on an accrual basis. Interest expense includes expenses of commercial paper, bonds and derivative financial instruments.
Interest expense also includes straight-line amortization of issue expenses and any debt premium or discount. Gains and losses incurred when the Corporation repurchases its bonds or unwinds its swaps related to those bonds, are credited or charged to interest expense at the time of settlement.
EMPLOYEE FUTURE BENEFITS
The Corporation maintains defined benefit pension plans and other post-retirement benefit plans including a retiring allowance plan and life insurance, health and dental care benefits.
The accrued benefit obligations are actuarially determined using the projected benefit method prorated on service (which incorporates management’s best estimate of future salary levels, retirement ages of employees and other actuarial factors).
The discount rate used to determine the accrued benefit obligations was 5.1% for 2005 (2004 — 6.1%) based on market rates for long-term high-quality bonds. Pension fund assets are valued at fair value for the purpose of calculating the expected return on plan assets.
The defined benefits costs consist of the actuarially determined retirement benefits for the current year’s service, imputed interest on projected benefit obligations net of interest earned on any plan assets and the amortization of actuarial gains or losses and other items over the average remaining service period of active employees expected to receive benefits under the plans. For 2005 the average remaining service period of the active employees covered by the pension plans was 13 years (2004 — 13 years). For the other benefit plans it was 13 years (2004 — 14 years).
Actuarial gains or losses arise from the difference between actual long-term rate of return and the expected long-term rate of return on plan assets for that period and from changes in actuarial assumptions used to determine the accrued benefit obligation. They are amortized over the average remaining service period of active employees expected to receive benefits under the plans only if the net actuarial gain or loss at the beginning of the year is in excess of 10% of the greater of the accrued benefit obligation and the fair value of plan assets.
The cumulative difference between the defined benefits pension plans costs and funding contributions is included in other assets or accounts payable and other credits as applicable.
Adoption in fiscal 2000 of the Canadian Institute of Chartered Accountants (CICA) new standard for recording employee future benefits resulted in a transitional obligation with respect to the non-pension post-retirement benefit plans. The transitional obligations with respect to the retiring allowance plan and the other post-retirement benefit plans are being amortized into income over 14 and 20 years respectively.
FUTURE ACCOUNTING CHANGES — FINANCIAL INSTRUMENTS
In January 2005, the CICA issued three new accounting standards: Section 1530, Comprehensive Income; Section 3855, Financial Instruments — Recognition and Measurement; and Section 3865, Hedges. These pronouncements establish standards for the recognition and measurement of financial instruments. They are effective for fiscal years beginning on or after October 1, 2006. EDC is currently assessing the impact of these standards for its 2007 financial statements.
Section 1530 introduces a new component of the balance sheet entitled Comprehensive Income. This is classified as part of shareholder’s equity and includes net income and other comprehensive income. Other comprehensive income holds any gains and losses resulting from the change in market value on assets that are classified as available-for-sale. Upon settlement of these assets, any of the associated gains or losses are brought into the current period’s income.
Upon initial adoption of the new Section 3855, EDC will be required to classify each of its financial assets as held-for-trading, available-for-sale, held-to-maturity, or loans and receivables and prospectively apply the appropriate accounting treatment for each.
EDC’s loan assets will likely be classified as loans and receivables and accounted for on an amortized cost basis. Since EDC currently uses this method of accounting for its loans, no significant accounting impact is anticipated. EDC’s trading portfolio, which is currently accounted for on a fair value basis, will likely be classified as held-for-trading. Held-for-trading financial assets will be accounted for on a fair value basis with both realized and unrealized gains and losses being recorded in income. It is anticipated that EDC’s investments and its existing held-to-maturity portfolio securities will be classified as available-for-sale. Financial assets classified as available-for-sale will be accounted for on a fair value basis with unrealized gains and losses being recorded in other comprehensive income.
The new standards permit any financial instrument to be designated as held-for-trading. It is anticipated that EDC will designate a portion of its debt instruments as held-for-trading and thereby measure them at fair value with any gains or losses offsetting the gains or losses on their related derivatives. It is anticipated that this will reduce the income volatility resulting from the implementation of Emerging Issues Committee Abstract 128 —Accounting for Trading, Speculative or Non-Hedging Derivative Financial Instruments (EIC-128) in 2004. EIC-128 requires that all derivatives be recorded at fair value, while not allowing for the underlying bonds to be accounted for in the same manner. The remaining financial liabilities will be measured at cost.
EDC Annual Report 2005
93
CONSOLIDATED FINANCIAL STATEMENTS
3. MARKETABLE SECURITIES
The Corporation maintains liquidity sufficient to meet general operating requirements, to maintain stability in the short-term borrowing program and to provide flexibility in achieving corporate objectives. In order to meet these varied needs, marketable securities are held in either the held-to-maturity portfolio or the trading portfolio. Held-to-maturity securities are purchased with the intention of being held to maturity but may be sold in response to changes in liquidity needs, changes in interest rates, changes in credit risk or to rebalance the portfolio to better match its benchmark index. Trading securities are those bought and held principally for the purpose of selling them in the near term.
| | | | | | | | | | | | | | | | | |
| ($ in millions) | | | | | | | | | | 2005 | | | 2004 | |
| | | Portfolio | | | | | | | |
| Issued or guaranteed by: | | Held-to-maturity | | | Trading | | | Total | | | Total | |
| |
| Financial institutions | | | 618 | | | | 825 | | | | 1,443 | | | | 1,047 | |
| U.S. government | | | 403 | | | | 166 | | | | 569 | | | | 560 | |
| U.S. agency | | | 205 | | | | 130 | | | | 335 | | | | 252 | |
| Asset backed trusts | | | 72 | | | | 260 | | | | 332 | | | | 582 | |
| Corporate | | | 266 | | | | 46 | | | | 312 | | | | 271 | |
| Canadian government* | | | 32 | | | | 7 | | | | 39 | | | | 30 | |
| |
| Total marketable securities | | $ | 1,596 | | | $ | 1,434 | | | $ | 3,030 | | | $ | 2,742 | |
| |
| | |
| * | | Canadian government includes federal, provincial, and municipal governments and Crown corporations. |
The table below provides a breakdown of the Corporation’s marketable securities by remaining term to maturity and shows how derivative financial instruments have been used to manage the interest rate and foreign currency exposures of the marketable securities in the Corporation’s held-to-maturity portfolio. Although the Corporation measures its derivative financial instruments at their fair value in the financial statements, they are shown below at their accrued cost (the same measurement basis as the held-to-maturity portfolio) in order to provide an appropriate basis for comparison.
| | | | | | | | | | | | | | | | | | | | | |
| ($ in millions) | | | | | | | | | | | | | | 2005 | | | 2004 | |
| | | Remaining term to maturity | | | | | | | |
| | | Under 1 | | | 1 to 3 | | | Over 3 | | | | | | | |
| | | year | | | years | | | years | | | Total | | | Total | |
| |
Held-to-maturity portfolio | | | | | | | | | | | | | | | | | | | | |
| Fixed rate securities | | | 43 | | | | 391 | | | | 367 | | | | 801 | | | | 571 | |
| Derivative financial instruments | | | (17 | ) | | | (7 | ) | | | — | | | | (24 | ) | | | (27 | ) |
| |
| Subtotal | | | 26 | | | | 384 | | | | 367 | | | | 777 | | | | 544 | |
| |
Yield to maturity % | | | 1.29 | | | | 3.70 | | | | 4.41 | | | | 4.21 | | | | 3.57 | |
| Floating rate securities | | | 795 | | | | — | | | | — | | | | 795 | | | | 732 | |
| Derivative financial instruments | | | 18 | | | | 6 | | | | — | | | | 24 | | | | 27 | |
| |
| Subtotal | | | 813 | | | | 6 | | | | — | | | | 819 | | | | 759 | |
| |
Yield to reset % | | | 3.55 | | | | 4.67 | | | | — | | | | 3.56 | | | | 2.24 | |
| Total held-to-maturity portfolio | | | 839 | | | | 390 | | | | 367 | | | | 1,596 | | | | 1,303 | |
| |
| | | | | | | | | | | | | | | | | | | | | |
Trading portfolio | | | | | | | | | | | | | | | | | | | | |
| Fixed rate securities | | | — | | | | 190 | | | | 189 | | | | 379 | | | | 239 | |
| Floating rate securities | | | 1,055 | | | | — | | | | — | | | | 1,055 | | | | 1,200 | |
| |
| Total trading portfolio | | | 1,055 | | | | 190 | | | | 189 | | | | 1,434 | | | | 1,439 | |
| |
| Total portfolio before derivative related amounts | | | 1,893 | | | | 581 | | | | 556 | | | | 3,030 | | | | 2,742 | |
| Derivative related amounts | | | 1 | | | | (1 | ) | | | — | | | | — | | | | — | |
| |
| Total marketable securities | | $ | 1,894 | | | $ | 580 | | | $ | 556 | | | $ | 3,030 | | | $ | 2,742 | |
| |
Credit exposure for swap contracts is a fraction of the notional amount of the instruments shown above, and is represented by the replacement cost of those contracts. Credit exposure for swap contracts held in the investment portfolio is included as part of note 22.
It’s About More Than Exporting
94
CONSOLIDATED FINANCIAL STATEMENTS
4. INVESTMENTS
Investments include $36 million (2004 — $35 million) of restricted cash and securities held by EDC’s subsidiary Exinvest Inc., and notes issued by the Vancouver Port Authority and the Royal Canadian Mint, totaling $28 million (2004 — $33 million). EDC intends to hold these notes to maturity. The Royal Canadian Mint and the Vancouver Port Authority are related to EDC as a result of common ownership. These investments were transacted at fair value, made on the same terms as those with third parties with similar credit risk, and are recorded at cost.
| | | | | | | | | | | | | | | | | |
| ($ in millions) | | 2005 | | 2004 | |
| | | Remaining term to maturity | | | | | | | |
| | | Under 1 | | | 1 to 3 | | | | | | | |
| | | year | | | years | | | Total | | | Total | |
| |
| Fixed rate investments | | | 28 | | | | 14 | | | | 42 | | | | 47 | |
| Floating rate investments | | | 4 | | | | 18 | | | | 22 | | | | 21 | |
| |
| Total investments | | $ | 32 | | | $ | 32 | | | $ | 64 | | | $ | 68 | |
| |
Yield % * | | | 6.28 | | | | 2.35 | | | | 3.50 | | | | 4.73 | |
| |
| | |
| * | | Refers to yield to maturity for fixed rate investments, and yield to reset for floating rate investments. |
5. LOANS RECEIVABLE
The following table shows the contractual maturity and related contractual effective yields for gross loans receivable. The yields are computed on a weighted average basis by amount and term. Floating rate yields are expressed as spreads over base rates which consist mainly of LIBOR for US dollars and Prime for Canadian dollars.
| | | | | | | | | | | | | | | | | | | | | | | | | | | | | | | | | | | | | | | | | |
| ($ in millions) | | 2005 | | 2004 | |
| | | | | | | Yield to | | | | | | | | | | | | | | | | | | | Yield to | | | | | | | | | | |
| | | Fixed | | | maturity | | | Floating | | | Spread | | | Total | | | Fixed | | | maturity | | | Floating | | | Spread | | | Total | |
| | | $ | | | % | | | $ | | | % | | | $ | | | $ | | | % | | | $ | | | % | | | $ | |
| |
| Performing: | | | | | | | | | | | | | | | | | | | | | | | | | | | | | | | | | | | | | | | | |
| Overdue | | | 24 | | | | 5.54 | | | | 11 | | | | 3.81 | | | | 35 | | | | 3 | | | | 6.88 | | | | 35 | | | | 1.77 | | | | 38 | |
| 2005 | | | — | | | | — | | | | — | | | | — | | | | — | | | | 776 | | | | 6.74 | | | | 1,725 | | | | 1.74 | | | | 2,501 | |
| 2006 | | | 722 | | | | 6.69 | | | | 1,176 | | | | 2.12 | | | | 1,898 | | | | 676 | | | | 7.14 | | | | 1,180 | | | | 1.92 | | | | 1,856 | |
| 2007 | | | 726 | | | | 7.01 | | | | 728 | | | | 1.97 | | | | 1,454 | | | | 752 | | | | 7.26 | | | | 958 | | | | 1.90 | | | | 1,710 | |
| 2008 | | | 684 | | | | 6.74 | | | | 891 | | | | 1.78 | | | | 1,575 | | | | 713 | | | | 6.95 | | | | 918 | | | | 1.64 | | | | 1,631 | |
| 2009 | | | 686 | | | | 6.76 | | | | 890 | | | | 1.52 | | | | 1,576 | | | | 729 | | | | 6.87 | | | | 817 | | | | 1.62 | | | | 1,546 | |
| 2010 | | | 690 | | | | 6.71 | | | | 704 | | | | 1.69 | | | | 1,394 | | | | 711 | | | | 6.92 | | | | 530 | | | | 1.81 | | | | 1,241 | |
| 2011-2015 | | | 3,177 | | | | 6.60 | | | | 1,387 | | | | 1.46 | | | | 4,564 | | | | 3,364 | | | | 6.84 | | | | 1,461 | | | | 1.49 | | | | 4,825 | |
| 2016 and beyond | | | 1,196 | | | | 6.73 | | | | 461 | | | | 1.32 | | | | 1,657 | | | | 1,361 | | | | 6.91 | | | | 599 | | | | 1.41 | | | | 1,960 | |
| |
| Performing gross loans receivable | | | 7,905 | | | | 6.67 | | | | 6,248 | | | | 1.53 | | | | 14,153 | | | | 9,085 | | | | 6.89 | | | | 8,223 | | | | 1.59 | | | | 17,308 | |
| |
| Impaired (note 6) | | | 1,616 | | | | 6.75 | | | | 1,581 | | | | 1.37 | | | | 3,197 | | | | 708 | | | | 6.64 | | | | 1,447 | | | | 1.25 | | | | 2,155 | |
| |
| Gross loans receivable | | $ | 9,521 | | | | | | | $ | 7,829 | | | | | | | $ | 17,350 | | | $ | 9,793 | | | | | | | $ | 9,670 | | | | | | | $ | 19,463 | |
| |
| Non-accrued capitalized interest on Impaired loans (note 6) | | | | | | | | | | | | | | | | | | | (659 | ) | | | | | | | | | | | | | | | | | | | (714 | ) |
| Performing loans * | | | | | | | | | | | | | | | | | | | (147 | ) | | | | | | | | | | | | | | | | | | | (313 | ) |
| Deferred loan revenue | | | | | | | | | | | | | | | | | | | (247 | ) | | | | | | | | | | | | | | | | | | | (262 | ) |
| |
| Loans receivable | | | | | | | | | | | | | | | | | | $ | 16,297 | | | | | | | | | | | | | | | | | | | $ | 18,174 | |
| |
| | |
| * | | Represents the unamortized balance that accrued while the loan was impaired. |
EDC Annual Report 2005
95
CONSOLIDATED FINANCIAL STATEMENTS
At December 31, 2005, the floating rate performing gross loans receivable are yielding 5.81% (2004 — 4.19%) with an average term to reset of 110 days (2004 — 114 days).
The breakdown of the Corporation’s performing gross loans receivable between sovereign and commercial is as follows:
| | | | | | | | | | | | | | | | | | | | | | | | | | | | | | | | | | | | | | | | | |
| ($ in millions) | | 2005 | | | 2004 | |
| | | | | | | Yield to | | | | | | | | | | | | | | | | | | | Yield to | | | | | | | | | | |
| | | Fixed | | | maturity | | | Floating | | | Spread | | | Total | | | Fixed | | | maturity | | | Floating | | | Spread | | | Total | |
| | | $ | | | % | | | $ | | | % | | | $ | | | $ | | | % | | | $ | | | % | | | $ | |
| |
| Sovereign | | | 1,572 | | | | 8.32 | | | | 1,425 | | | | 1.11 | | | | 2,997 | | | | 1,837 | | | | 8.34 | | | | 2,000 | | | | 1.12 | | | | 3,837 | |
| Commercial | | | 6,333 | | | | 6.30 | | | | 4,823 | | | | 1.69 | | | | 11,156 | | | | 7,248 | | | | 6.57 | | | | 6,223 | | | | 1.73 | | | | 13,471 | |
| |
| Total performing gross loans receivable | | $ | 7,905 | | | | 6.67 | | | $ | 6,248 | | | | 1.53 | | | $ | 14,153 | | | $ | 9,085 | | | | 6.89 | | | $ | 8,223 | | | | 1.59 | | | $ | 17,308 | |
| |
The Corporation has country risk concentrations as outlined below.
| | | | | | | | | | | | | | | | | | | |
| ($ in millions) | | 2005 | | | 2004 | |
| | | Performing gross | | | | | | | | | Performing gross | | | | |
| Country | | loans receivable | | | % | | | Country | | loans receivable | | | % | |
| |
| United States | | | 6,037 | | | | 43 | | | United States | | | 8,210 | | | | 47 | |
| Canada | | | 1,696 | | | | 12 | | | Canada | | | 2,066 | | | | 12 | |
| Mexico | | | 1,038 | | | | 7 | | | Mexico | | | 965 | | | | 6 | |
| Chile | | | 480 | | | | 3 | | | United Kingdom | | | 713 | | | | 4 | |
| United Kingdom | | | 437 | | | | 3 | | | Peru | | | 517 | | | | 3 | |
| Other | | | 4,465 | | | | 32 | | | Other | | | 4,837 | | | | 28 | |
| |
| Total | | $ | 14,153 | | | | 100 | | | Total | | $ | 17,308 | | | | 100 | |
| |
The Corporation has single counterparty performing gross loans receivable totaling $2,251 million with three airlines (2004 — $4,207 million with five airlines), $3,600 million (2004 — $3,461 million) with five surface transportation entities, and $463 million (2004 — $2 million) with an oil and gas entity. Six of these counterparties are located in the United States, one in Canada, one in the United Kingdom and one in Mexico.
EDC sold $219 million in loans to various counterparties in 2005 (2004 — $212 million). The loans were sold without recourse. The loan sales included performing loans totaling $32 million (2004 — $124 million). The sales were done essentially for an amount equal to the loans’ carrying value resulting in no material gain or loss being recorded in other income (2004 — nil).
Non-accrued capitalized interest is a contractually determined amount typically representing rescheduled interest that would have been recognized on loans to borrowers if those loans were performing.
The following reflects the movement of non-accrued capitalized interest during the year:
| | | | | | | | | |
| ($ in millions) | | 2005 | | | 2004 | |
| |
| Balance at beginning of year | | | 1,027 | | | | 1,211 | |
| Capitalized during the year | | | 62 | | | | 26 | |
| Impaired interest and fees received | | | 67 | | | | 21 | |
| Amortization | | | (160 | ) | | | (66 | ) |
| Debt relief | | | (64 | ) | | | (43 | ) |
| Write-off | | | (4 | ) | | | (6 | ) |
| Foreclosed loans | | | (17 | ) | | | — | |
| Net loan book value adjustment | | | (51 | ) | | | (57 | ) |
| Foreign exchange translation | | | (54 | ) | | | (59 | ) |
| |
| Balance at end of year | | $ | 806 | | | $ | 1,027 | |
| |
It’s About More Than Exporting
96
CONSOLIDATED FINANCIAL STATEMENTS
6. IMPAIRED LOANS RECEIVABLE
The following table shows the amount of impaired gross loans receivable, net of non-accrued capitalized interest and the specific allowance, which represents impaired net loans receivable.
| | | | | | | | | |
| ($ in millions) | | 2005 | | | 2004 | |
| |
| Impaired gross loans receivable | | | | | | | | |
| Sovereign | | | 810 | | | | 899 | |
| Commercial | | | 2,387 | | | | 1,256 | |
| |
| | | | 3,197 | | | | 2,155 | |
| Less: Non-accrued capitalized interest | | | 659 | | | | 714 | |
| Specific allowance | | | 914 | | | | 556 | |
| |
| Impaired net loans receivable | | $ | 1,624 | | | $ | 885 | |
| |
The following reflects the movement in impaired gross loans receivable during the year:
| | | | | | | | | |
| ($ in millions) | | 2005 | | | 2004 | |
| |
| Balance at beginning of year | | | 2,155 | | | | 1,876 | |
| Loans classified as impaired | | | 2,025 | | | | 760 | |
| Loans reinstated to performing | | | (317 | ) | | | (195 | ) |
| Additional disbursements | | | 15 | | | | 34 | |
| Loans written off | | | (39 | ) | | | (75 | ) |
| Capitalized interest | | | 62 | | | | 26 | |
| Principal repayments | | | (345 | ) | | | (137 | ) |
| Receipts from the Government of Canada for sovereign debt relief | | | (75 | ) | | | (53 | ) |
| Foreclosed loans | | | (218 | ) | | | — | |
| Foreign exchange translation | | | (66 | ) | | | (81 | ) |
| |
| Balance at end of year | | $ | 3,197 | | | $ | 2,155 | |
| |
The $2,025 million in new impaired loans in 2005 includes $1,855 million which pertains to collateralized loans with two commercial airlines in the United States which became impaired in 2005.
Impaired loans to one commercial borrower in the United Kingdom ($22 million), three in Canada ($5 million), two in the United States ($3 million), two in Argentina ($2 million), one in Thailand ($1 million), and three commercial loans in other countries ($6 million) were written off during the year. These loans were written off after all collection methods had been exhausted and no further prospect of recovery was likely. Included in the above write-offs of $39 million is one loan ($22 million) which was made impaired in 2005. For the five years ending December 31, 2005, cumulative write-offs totaled $612 million, of which 37% occurred in the past three years.
During 2005, payments of principal and interest from borrowers for impaired loans were $412 million (2004 — $163 million). These amounts were applied to the book value of the impaired loans and did not affect interest income.
Loans foreclosed during 2005 totaled $218 million (2004 — nil) which resulted in the reversal of $78 million (2004 — nil) of the allowance for losses on loans and the reversal of $17 million (2004 — nil) of non-accrued capitalized interest. As a result of these foreclosures, aircraft were returned to EDC by two impaired obligors who entered bankruptcy protection in 2005. There was no gain or loss recognized upon foreclosure since the net book value of the related loans was equivalent to the fair value of the aircraft.
Some of the aircraft are classified as held for use, and included in equipment available for lease with a fair value of approximately $114 million. As at December 31, 2005 none of the aircraft were subject to lease arrangements, however, EDC is actively searching for lessees and expects to have leases in place for some of these aircraft within the next 12 months. The remaining aircraft are classified as held for sale and included in other assets with a fair value of approximately $9 million. EDC is actively searching for buyers and it is anticipated that during the next 12 months they will be sold.
EDC Annual Report 2005
97
CONSOLIDATED FINANCIAL STATEMENTS
7. ALLOWANCE FOR LOSSES ON LOANS, LOAN COMMITMENTS AND GUARANTEES
The composition of the allowance for losses on loans, loan commitments and guarantees is as follows:
| | | | | | | | | |
| ($ in millions) | | 2005 | | | 2004 | |
| |
| Base allowance | | | | | | | | |
| Investment grade exposure | | | 74 | | | | 105 | |
| Non-investment grade exposure | | | 1,183 | | | | 1,602 | |
| |
| Total base allowance | | | 1,257 | | | | 1,707 | |
| |
| Counterparty concentration | | | | | | | | |
| Investment grade exposure | | | 18 | | | | 40 | |
| Non-investment grade exposure | | | 218 | | | | 473 | |
| |
| Total counterparty concentration | | | 236 | | | | 513 | |
| |
| Market overlays | | | | | | | | |
| Country | | | | | | | | |
| Philippines | | | 3 | | | | 7 | |
| United States | | | — | | | | 63 | |
| Dominican Republic | | | (12 | ) | | | 12 | |
| Indonesia | | | (12 | ) | | | — | |
| Brazil | | | (8 | ) | | | — | |
| Venezuela | | | (3 | ) | | | (9 | ) |
| Other | | | (34 | ) | | | (16 | ) |
| |
| Total country overlay | | | (66 | ) | | | 57 | |
| |
| Industry | | | | | | | | |
| Aerospace | | | 104 | | | | 182 | |
| Telecommunications | | | — | | | | 19 | |
| Automotive | | | 25 | | | | — | |
| Other | | | 12 | | | | 25 | |
| |
| Total industry overlay | | | 141 | | | | 226 | |
| |
| Total general allowance | | | 1,568 | | | | 2,503 | |
| Specific allowance for losses on guarantee with subsidiary (note 24) | | | 14 | | | | 45 | |
| Specific allowance for impaired loans, loan commitments and guarantees | | | 921 | | | | 574 | |
| |
| | | | 2,503 | | | | 3,122 | |
| Risk mitigation insurer’s share of loan allowance (note 8) | | | (124 | ) | | | — | |
| |
| Total allowance for losses on loans, loan commitments and guarantees | | $ | 2,379 | | | $ | 3,122 | |
| |
The classification of the allowance for losses on loans, loan commitments and guarantees is as follows:
| | | | | | | | | |
| ($ in millions) | | 2005 | | | 2004 | |
| |
| Allowance for losses on loans | | | 2,148 | | | | 2,674 | |
| Allowance for loan commitments | | | 261 | | | | 303 | |
| Allowance for loan guarantees | | | 94 | | | | 145 | |
| Risk mitigation insurer’s share of loan allowance | | | (124 | ) | | | — | |
| |
| Total | | $ | 2,379 | | | $ | 3,122 | |
| |
It’s About More Than Exporting
98
CONSOLIDATED FINANCIAL STATEMENTS
The allowance for losses on loans is shown as a reduction to loans receivable on the balance sheet. The allowance for loan commitments and guarantees is reported as a liability in the financial statements.
As described in note 8, in 2005 EDC entered into a risk mitigation insurance transaction to insure $1.1 billion of aerospace exposure relating to regional jets. This transaction effectively upgrades the credit quality of this portion of EDC’s aerospace portfolio, resulting in an offset to the allowance of $124 million.
During the year, changes to the allowance for losses on loans, loan commitments and guarantees were as follows:
| | | | | | | | | | | | | | | | | | | | | | | | | |
| ($ in millions) | | 2005 | | | 2004 | |
| | | General | | | Specific | | | Total | | | General | | | Specific | | | Total | |
| |
| Balance at beginning of year | | | 2,503 | | | | 619 | | | | 3,122 | | | | 3,136 | | | | 626 | | | | 3,762 | |
| Provision for losses on loans, loan commitments and guarantees | | | (878 | ) | | | 448 | | | | (430 | ) | | | (412 | ) | | | 100 | | | | (312 | ) |
| Write-offs* | | | — | | | | (35 | ) | | | (35 | ) | | | (6 | ) | | | (64 | ) | | | (70 | ) |
| Recovery of amounts written-off in prior years | | | — | | | | 9 | | | | 9 | | | | — | | | | — | | | | — | |
| Foreclosed loans | | | — | | | | (78 | ) | | | (78 | ) | | | — | | | | — | | | | — | |
| Foreign exchange translation | | | (57 | ) | | | (28 | ) | | | (85 | ) | | | (215 | ) | | | (43 | ) | | | (258 | ) |
| |
| Balance at end of year | | $ | 1,568 | | | $ | 935 | | | $ | 2,503 | | | $ | 2,503 | | | $ | 619 | | | $ | 3,122 | |
| | | | | | | | | | | | | | | | | | | | | | | | | |
| Risk mitigation insurer’s share of loan allowance | | | | | | | | | | | (124 | ) | | | | | | | | | | | — | |
| |
| Total | | | | | | | | | | $ | 2,379 | | | | | | | | | | | $ | 3,122 | |
| |
| | |
| * | | See note 6 for more information on loan write-offs. |
8. RISK MITIGATION INSURANCE
In 2005 EDC entered into an agreement to insure $1.1 billion of its aerospace loan portfolio exposure. The agreement provides EDC with protection in the event of default by an obligor, which has the effect of locking in future cash flows on this portion of EDC’s aerospace loan portfolio.
The insurance policy effectively upgrades the credit quality of this portion of EDC’s aerospace portfolio, thus reducing the amount of capital that EDC is required to set aside for potential losses on this portion of the portfolio. In 2005, the transaction resulted in an offset to the allowance for loan losses of $124 million.
The policy reduces the concentration of risk that has resulted from EDC’s role as a significant provider of financing arrangements to the North American airline industry in support of sales by the Canadian aerospace sector.
9. LOAN COMMITMENTS
The Corporation has two types of loan commitments. The first type is undisbursed amounts on signed loan agreements. The second type of commitment represents commitments made by EDC, for which terms related to the transaction such as interest rate type and disbursement schedule have not yet been determined. This category includes letters of offer accepted and outstanding of $1,312 million (2004 — $817 million) as well as unallocated, confirmed lines of credit of $433 million (2004 — $475 million).
The Corporation has undisbursed signed loan commitments of $2,878 million (2004 — $2,794 million). Over the next two years, management estimates that the Corporation will disburse 80% of the remaining undisbursed commitments.
The projected disbursements of the signed loan commitments are as follows:
| | | | | | | | | | | | | | | | | |
| ($ in millions) | | 2005 | | | 2004 | |
| | | Projected | | | | | | | Projected | | | | |
| | | disbursements | | | % | | | disbursements | | | % | |
| |
| 2005 | | | — | | | | — | | | | 2,004 | | | | 71 | |
| 2006 | | | 1,943 | | | | 67 | | | | 522 | | | | 19 | |
| 2007 | | | 363 | | | | 13 | | | | 77 | | | | 3 | |
| 2008 and beyond | | | 572 | | | | 20 | | | | 191 | | | | 7 | |
| |
| Total | | $ | 2,878 | | | | 100 | | | $ | 2,794 | | | | 100 | |
| |
EDC Annual Report 2005
99
CONSOLIDATED FINANCIAL STATEMENTS
Undisbursed commitments with their committed fixed rates or committed floating rate spreads are outlined in the following table. All yields are computed on a weighted average basis and the spreads over floating interest rates are represented mainly by LIBOR for US dollars.
| | | | | | | | | | | | | | | | | | | | | | | | | | | | | | | | | |
| ($ in millions) | | 2005 | | | 2004 | |
| | | | | | | Estimated | | | | | | | | | | | | | | | Estimated | | | | | | | |
| | | Fixed | | | spot yield | | | Floating | | | Spread | | | Fixed | | | spot yield | | | Floating | | | Spread | |
| | | $ | | | % | | | $ | | | % | | | $ | | | % | | | $ | | | % | |
| |
| Sovereign | | | 24 | | | | 6.49 | | | | 95 | | | | 3.30 | | | | 205 | | | | 6.14 | | | | 188 | | | | 3.45 | |
| Commercial | | | 299 | | | | 3.44 | | | | 2,460 | | | | 1.23 | | | | 259 | | | | 4.04 | | | | 2,142 | | | | 1.55 | |
| |
| Total | | $ | 323 | | | | 3.66 | | | $ | 2,555 | | | | 1.31 | | | $ | 464 | | | | 4.97 | | | $ | 2,330 | | | | 1.70 | |
| |
10. VARIABLE INTEREST ENTITIES
On January 1, 2005, EDC prospectively adopted Accounting Guideline 15, Consolidation of Variable Interest Entities (AcG-15), issued by the Canadian Institute of Chartered Accountants (CICA). AcG-15 provides guidance for applying consolidation principles found in the CICA Handbook Section 1590, Subsidiaries, to those entities defined as variable interest entities (VIEs). A variable interest entity is an entity in which the total equity investment at risk is not sufficient to finance its activities without additional subordinated financial support or where the holders of the equity at risk lack the characteristics of a controlling financial interest. The new guideline requires consolidation of an entity by the primary beneficiary and defines a primary beneficiary to be the enterprise that absorbs or receives the majority of the VIE’s expected losses or gains, or both. AcG-15 also requires specific disclosure for VIEs that are not consolidated but in which the entity has a significant variable interest.
In accordance with the requirements of the standard, EDC identified VIEs in which it has an interest and in each case it was determined that EDC was not the primary beneficiary and therefore not required to consolidate these entities. EDC does have significant interests in VIEs where it is not considered the primary beneficiary. These VIEs include secured leveraged lease financing transactions in the aerospace and rail transportation industries in which EDC has lent funds through special purpose entities, and in some cases provided guarantees to the equity-holders of these entities. These VIEs had assets of approximately $7,457 million at December 31, 2005. The VIEs in the rail transportation industry were created in the 1999 to 2002 timeframe, while the VIEs in the aerospace industry were created in the 1995 to 2005 timeframe.
EDC’s maximum exposure to loss as a result of involvement with these VIEs was approximately $4,125 million at December 31, 2005. Of this amount, $3,652 million relates to the net loans receivable (gross loans receivable less the total allowance for loan losses) and $473 million relates to the guarantees provided to the equity-holders.
11. CONTINGENT LIABILITIES
The Corporation’s contingent liabilities include both short-term and medium-term insurance policies and guarantees which represents direct risks taken by EDC. EDC increases its contingent liability by assuming short-term and medium-term exposure from other insurers. EDC reduces its contingent liability by ceding reinsurance in both the short-term and medium-term programs to other insurance companies.
The short-term program protects exporters of goods and services trading on credit terms of up to a year against non-payment due to commercial and political risks. Commercial risks covered include buyer insolvency, default, repudiation of goods by buyer and contract cancellation. Political risks covered by EDC are conversion and risk transfer, cancellation of export or import permits, or war-related risks. The medium-term program provides cover for sales on credit terms greater than one year and includes export credits insurance and guarantees, loan guarantees, performance insurance extending cover for risks inherent in performance guarantees, and political risk insurance, which provides political risk protection for equity and other investments abroad.
At December 31, 2005, the Corporation has contingent liabilities of $16,534 million (2004 — $14,904 million) which mature as follows:
| | | | | | | | | | | | | | | | | | | | | | | | | | | | | | | | | |
| ($ in millions) | | 2005 | | | 2004 | |
| | | Short-term | | | Medium-term | | | | | | | | | | | Short-term | | | Medium-term | | | | | | | |
| | | insurance | | | insurance | | | Guarantees | | | Total | | | insurance | | | insurance | | | Guarantees | | | Total | |
| |
| 2005 | | | — | | | | — | | | | — | | | | — | | | | 6,262 | | | | 1,241 | | | | 1,680 | | | | 9,183 | |
| 2006 | | | 6,338 | | | | 1,432 | | | | 1,761 | | | | 9,531 | | | | — | | | | 975 | | | | 980 | | | | 1,955 | |
| 2007 | | | — | | | | 687 | | | | 1,653 | | | | 2,340 | | | | — | | | | 375 | | | | 555 | | | | 930 | |
| 2008 | | | — | | | | 376 | | | | 634 | | | | 1,010 | | | | — | | | | 234 | | | | 385 | | | | 619 | |
| 2009 | | | — | | | | 362 | | | | 160 | | | | 522 | | | | — | | | | 188 | | | | 123 | | | | 311 | |
| 2010 | | | — | | | | 231 | | | | 755 | | | | 986 | | | | — | | | | 517 | | | | 50 | | | | 567 | |
| 2011—2015 | | | — | | | | 972 | | | | 201 | | | | 1,173 | | | | — | | | | 409 | | | | 177 | | | | 586 | |
| 2016 and beyond | | | — | | | | 325 | | | | 647 | | | | 972 | | | | — | | | | 111 | | | | 642 | | | | 753 | |
| |
| Total | | $ | 6,338 | | | $ | 4,385 | | | $ | 5,811 $ | | | | 16,534 | | | $ | 6,262 | | | $ | 4,050 | | | $ | 4,592 | | | $ | 14,904 | |
| |
It’s About More Than Exporting
100
CONSOLIDATED FINANCIAL STATEMENTS
INSURANCE POLICIES
The major concentrations by location of risk are as follows:
Short-term Insurance
| | | | | | | | | | | | | | | | | | | | | | | | | | | | | | | | | | | |
| ($ in millions) | | 2005 | | | 2004 | |
| | | | | | | | | | | | | | | Net | | | | | | | | | | | | | | | | | Net | |
| | | Short-term | | | Reinsurance | | | Reinsurance | | | short-term | | | | | Short-term | | | Reinsurance | | | Reinsurance | | | short-term | |
| | | insurance | | | assumed | | | ceded | | | insurance | | | | | insurance | | | assumed | | | ceded | | | insurance | |
| |
| United States | | | 2,794 | | | | 14 | | | | (17 | ) | | | 2,791 | | | United States | | | 2,866 | | | | 32 | | | | (25 | ) | | | 2,873 | |
| Canada | | | 42 | | | | 832 | | | | (26 | ) | | | 848 | | | Canada | | | 44 | | | | 964 | | | | (24 | ) | | | 984 | |
| Turkey | | | 228 | | | | — | | | | — | | | | 228 | | | China | | | 213 | | | | — | | | | — | | | | 213 | |
| China | | | 188 | | | | — | | | | — | | | | 188 | | | Brazil | | | 200 | | | | 1 | | | | (4 | ) | | | 197 | |
| Japan | | | 153 | | | | — | | | | — | | | | 153 | | | Japan | | | 153 | | | | — | | | | — | | | | 153 | |
| Other | | | 2,134 | | | | — | | | | (4 | ) | | | 2,130 | | | Other | | | 1,845 | | | | 6 | | | | (9 | ) | | | 1,842 | |
| |
| Total | | $ | 5,539 | | | $ | 846 | | | $ | (47 | ) | | $ | 6,338 | | | Total | | $ | 5,321 | | | $ | 1,003 | | | $ | (62 | ) | | $ | 6,262 | |
| |
Medium-term Insurance
| | | | | | | | | | | | | | | | | | | | | | | | | | | | | | | | | | | |
| ($ in millions) | | 2005 | | | 2004 | |
| | | | | | | | | | | | | | | Net | | | | | | | | | | | | | | | | | Net | |
| | | Medium- | | | | | | | | | | | medium- | | | | | Medium- | | | | | | | | | | | medium- | |
| | | term | | | Reinsurance | | | Reinsurance | | | term | | | | | term | | | Reinsurance | | | Reinsurance | | | term | |
| | | insurance | | | assumed | | | ceded | | | insurance | | | | | insurance | | | assumed | | | ceded | | | insurance | |
| |
| Canada | | | 202 | | | | 2,165 | | | | — | | | | 2,367 | | | Canada | | | 402 | | | | 1,940 | | | | — | | | | 2,342 | |
| United States | | | 57 | | | | 187 | | | | — | | | | 244 | | | Mexico | | | 663 | | | | — | | | | (486 | ) | | | 177 | |
| Mexico | | | 614 | | | | — | | | | (457 | ) | | | 157 | | | Chile | | | 148 | | | | — | | | | — | | | | 148 | |
| Chile | | | 143 | | | | — | | | | — | | | | 143 | | | United States | | | 132 | | | | 6 | | | | — | | | | 138 | |
| Peru | | | 117 | | | | — | | | | — | | | | 117 | | | South Africa | | | 111 | | | | — | | | | — | | | | 111 | |
| Other | | | 1,822 | | | | 65 | | | | (530 | ) | | | 1,357 | | | Other | | | 1,698 | | | | 35 | | | | (599 | ) | | | 1,134 | |
| |
| Total | | $ | 2,955 | | | $ | 2,417 | | | $ | (987 | ) | | $ | 4,385 | | | Total | | $ | 3,154 | | | $ | 1,981 | | | $ | (1,085 | ) | | $ | 4,050 | |
| |
GUARANTEES
The Corporation issues performance security guarantees which provide coverage to the exporter’s bank for up to 100% of the guarantee value in the event of any call by the buyer. Foreign exchange guarantees are also issued which provide a guarantee to secure the closing risks associated with foreign exchange forward contracts. Each guarantee issued stipulates a recovery provision whereby the third party, the exporter, agrees to indemnify the Corporation should a payment be made under the guarantee. Unless otherwise stated, the indemnification agreement generally ranks as an unsecured liability of the exporter. An amount related to these guarantees has been reflected on the financial statements as part of the allowance for claims on insurance.
Loan guarantees are issued by the Corporation and cover non-payment of principal, interest and fees due to banks and financial institutions providing loans to buyers of Canadian goods and services. Calls on guarantees result in the recognition by EDC of a loan asset on the balance sheet and become a direct obligation of the buyer. At December 31, 2005, loan guarantees on secured loans totaled $322 million (2004 — $335 million) and guarantees with impaired obligors totaled $7 million (2004 — $13 million).
At December 31, 2005, the Corporation has guarantees outstanding of $5,811 million (2004— $4,592 million).
| | | | | | | | | |
| ($ in millions) | | 2005 | | | 2004 | |
| |
| Performance security guarantees | | | 3,326 | | | | 1,852 | |
| Loan guarantees | | | 2,474 | | | | 2,729 | |
| Foreign exchange guarantees | | | 7 | | | | — | |
| Specific transaction guarantees | | | 4 | | | | 2 | |
| Bid security guarantees | | | — | | | | 9 | |
| |
| Total | | $ | 5,811 | | | $ | 4,592 | |
| |
EDC Annual Report 2005
101
CONSOLIDATED FINANCIAL STATEMENTS
The major concentrations for guarantees by location of risk are as follows:
| | | | | | | | | | | |
| ($ in millions) | | 2005 | | | | | 2004 | |
| |
| United States | | | 3,179 | | | United States | | | 2,809 | |
| Algeria | | | 707 | | | Algeria | | | 589 | |
| Canada | | | 564 | | | Canada | | | 406 | |
| Poland | | | 240 | | | United Kingdom | | | 95 | |
| China | | | 172 | | | Dominican Republic | | | 88 | |
| Other | | | 949 | | | Other | | | 605 | |
| |
| Total | | $ | 5,811 | | | Total | | $ | 4,592 | |
| |
12. REINSURANCE AGREEMENTS
EDC cedes reinsurance to limit exposure to large losses. Reinsurance contracts do not relieve the Corporation of its obligations to the insured. However they do provide for the recovery of claims arising from the liabilities ceded. The Corporation has a reinsurance treaty agreement for the short-term insurance portfolio, as well as some facultative cover arrangements. Within the medium-term insurance program there is no reinsurance treaty. Reinsurance is acquired on a transaction by transaction basis.
Reinsurance is also assumed by the Corporation. Effective September 1, 2003, the Corporation assumed reinsurance for joint short-term policy domestic transactions underwritten by St. Paul Guarantee Insurance Company. EDC entered into an agreement with its new domestic partner, Compagnie Française d’Assurance pour le Commerce Extérieur SA, on July 1, 2005. The reinsurance agreement with St. Paul Guarantee Insurance Company will end when all existing policies have been migrated to the new domestic partner. Within the medium-term program, for the surety bond insurance line of business, the Corporation has general reinsurance agreements with several surety companies.
The effect of reinsurance on the Corporation’s contingent liability is disclosed in note 11 and the impact on premiums is as follows:
| | | | | | | | | |
| ($ in millions) | | 2005 | | | 2004 | |
| |
| Insurance premiums and guarantee fees | | | 146 | | | | 158 | |
| Reinsurance assumed | | | 23 | | | | 22 | |
| Reinsurance ceded | | | (13 | ) | | | (19 | ) |
| |
| Total | | $ | 156 | | | $ | 161 | |
| |
13. RECOVERABLE INSURANCE CLAIMS
During the year, changes to the recoverable insurance claims were as follows:
| | | | | | | | | |
| ($ in millions) | | 2005 | | | 2004 | |
| |
| Balance at beginning of year | | | 68 | | | | 74 | |
| Claims paid | | | 44 | | | | 64 | |
| Net reinsured claims paid * | | | 12 | | | | 5 | |
| Claims recovered | | | (31 | ) | | | (24 | ) |
| Write-off of recoverable claims | | | (20 | ) | | | (48 | ) |
| Foreign exchange translation | | | (6 | ) | | | (3 | ) |
| |
| Balance at end of year | | $ | 67 | | | $ | 68 | |
| |
| | |
| * | | Represents the net claims paid related to the agreement with St. Paul Guarantee Insurance Company effective September 1, 2003 whereby the Corporation assumes reinsurance for joint policy domestic transactions underwritten by St. Paul Guarantee Insurance Company. |
It’s About More Than Exporting
102
CONSOLIDATED FINANCIAL STATEMENTS
Of the $44 million in claim payments made during 2005, 86% were related to the short-term insurance program. The largest concentrations of claim payments and recoveries were in the following countries:
| | | | | | | | | | | | | | | | | | | |
| ($ in millions) | | 2005 | | | | | 2004 | |
| |
| | | Claims | | | Claims | | | | | Claims | | | Claims | |
| | | paid | | | recovered | | | | | paid | | | recovered | |
| |
| United States | | | 26 | | | | 8 | | | United States | | | 43 | | | | 9 | |
| Canada | | | 4 | | | | 1 | | | Mexico | | | 4 | | | | 1 | |
| Brazil | | | 3 | | | | 1 | | | France | | | 4 | | | | — | |
| Mexico | | | 2 | | | | 2 | | | Canada | | | 2 | | | | — | |
| Venezuela | | | 1 | | | | — | | | Saudi Arabia | | | 2 | | | | — | |
| Other | | | 8 | | | | 19 | | | Other | | | 9 | | | | 14 | |
| |
| Total | | $ | 44 | | | $ | 31 | | | Total | | $ | 64 | | | $ | 24 | |
| |
14. ALLOWANCE FOR CLAIMS ON INSURANCE
During the year, changes to the allowance for claims on insurance were as follows:
| | | | | | | | | |
| ($ in millions) | | 2005 | | | 2004 | |
| |
| Balance at beginning of year | | | 548 | | | | 592 | |
| Provision for claims on insurance | | | 41 | | | | 98 | |
| Write-off of recoverable claims | | | (20 | ) | | | (48 | ) |
| Decrease in reinsurance | | | (19 | ) | | | (61 | ) |
| Foreign exchange translation | | | (10 | ) | | | (27 | ) |
| Claims expense | | | (4 | ) | | | (6 | ) |
| |
| Balance at end of year | | $ | 536 | | | $ | 548 | |
| |
The allowance for claims on insurance broken down by risk insured is as follows:
| | | | | | | | | | | | | | | | | | | | | | | | | |
| ($ in millions) | | 2005 | | | 2004 | |
| |
| | | | | | | | | | | Total | | | | | | | | | | | Total | |
| | | Insurance | | | Reinsurance | | | allowance | | | Insurance | | | Reinsurance | | | allowance | |
| |
| Allowance for claims for: | | | | | | | | | | | | | | | | | | | | | | | | |
| Credit risk | | | 250 | | | | (2 | ) | | | 248 | | | | 245 | | | | (15 | ) | | | 230 | |
| Political risk | | | 160 | | | | (38 | ) | | | 122 | | | | 198 | | | | (44 | ) | | | 154 | |
| Other risks | | | 126 | | | | — | | | | 126 | | | | 105 | | | | — | | | | 105 | |
| |
| Total | | $ | 536 | | | $ | (40 | ) | | $ | 496 | | | $ | 548 | | | $ | (59 | ) | | $ | 489 | |
| |
15. OTHER INCOME (EXPENSE)
The following table provides a breakdown of the components of other income (expense) on the income statement:
| | | | | | | | | |
| ($ in millions) | | 2005 | | | 2004 | |
| |
| Foreign exchange translation gain (loss) | | | 7 | | | | (10 | ) |
| Post-maturity interest gains on claims recoveries | | | 2 | | | | 3 | |
| Unrealized gain (loss) on marketable securities | | | (5 | ) | | | 2 | |
| Realized loss on the sale of marketable securities | | | (4 | ) | | | (1 | ) |
| Realized loss on the sale of financing assets | | | — | | | | (1 | ) |
| |
| Total other income (expense) | | $ | — | | | $ | (7 | ) |
| |
Post-maturity interest gains on claims recoveries are defined as the penalty rate of interest charged in the event of default in payments under the terms of the insurance agreement and are recognized when the Corporation has recovered the entire principal amount of a claim.
EDC Annual Report 2005
103
CONSOLIDATED FINANCIAL STATEMENTS
16. PROVISION FOR (REVERSAL OF) CREDIT LOSSES
The composition of the provision for (reversal of) credit losses, expressed in the income statement, is comprised as follows:
| | | | | | | | | |
| ($ in millions) | | 2005 | | | 2004 | |
| |
| Reversal of losses on loans | | | (471 | ) | | | (361 | ) |
| Provision for (reversal of) loan guarantees | | | (49 | ) | | | 39 | |
| Provision for (reversal of) loan commitments | | | (34 | ) | | | 10 | |
| Provision for claims on insurance | | | 41 | | | | 98 | |
| |
| Provision for (reversal of) credit losses | | $ | (513 | ) | | $ | (214 | ) |
| |
17. DEBT INSTRUMENTS
The Corporation issues debt instruments in global capital markets. Short-term payables consist of commercial paper and other short-term debt related instruments that are issued by EDC with maturities under one year. Long-term payables represent bonds and other long-term instruments issued by the Corporation in Canadian dollars, US dollars and other currencies. EDC uses currency swaps to convert Canadian dollar and foreign currency denominated notes primarily to US dollars. Interest rate swaps are principally used to convert fixed rate instruments to floating rates primarily related to LIBOR. EDC uses derivative contracts and structured notes to minimize market risk and also for asset liability management purposes.
LOANS PAYABLE
Loans payable (excluding derivatives) are comprised as follows:
| | | | | | | | | |
| ($ in millions) | | 2005 | | | 2004 | |
| |
| Short-term payables | | | 1,802 | | | | 2,260 | |
| |
| Long-term payables | | | | | | | | |
| - due within current year | | | 2,637 | | | | 1,349 | |
| - over one year | | | 8,986 | | | | 11,937 | |
| |
| Total long-term payables | | | 11,623 | | | | 13,286 | |
| |
| Subtotal | | | 13,425 | | | | 15,546 | |
| Less: unamortized discounts and premiums | | | 1 | | | | 1 | |
| |
| Total loans payable | | $ | 13,424 | | | $ | 15,545 | |
| |
Unamortized discounts and premiums are associated with the issue of long-term debt and swaps. The amount of a discount or premium recorded represents the difference between the face value of an instrument and the actual cash flow at the time of settlement. Deferrals include the costs of debt issuance, such as commissions. Such amounts are recorded as an asset or liability at the settlement date and amortized over the life of the instrument.
ACCRUED INTEREST
Accrued interest reflects corporate cash flow obligations. Accrued interest is comprised as follows:
| | | | | | | | | |
| ($ in millions) | | 2005 | | | 2004 | |
| |
| Short-term | | | 12 | | | | 5 | |
| Long-term | | | 141 | | | | 121 | |
| |
| Total accrued interest payable | | $ | 153 | | | $ | 126 | |
| |
Where the interest payment amount is known in advance, as is the case with fixed and floating rate payments, the interest accrual allocates the cost over the period of payment. Where the interest payment amount is not known in advance an appropriate interest accrual is determined by reference to market prices.
It’s About More Than Exporting
104
CONSOLIDATED FINANCIAL STATEMENTS
STRUCTURED NOTES
EDC has entered into a number of structured notes as part of its funding program. Structured notes are hybrid securities that combine fixed income products with derivative components. These embedded derivatives are not accounted for at fair value and are not accounted for separately from their host contract.
Structured notes outstanding, included in loans payable, are as follows:
| | | | | | | | | |
| ($ in millions) | | 2005 | | | 2004 | |
| |
| Callable/extendible | | | 1,720 | | | | 2,056 | |
| Inverse floating rate note | | | 582 | | | | 781 | |
| Equity index | | | 237 | | | | 278 | |
| Dual currency | | | 136 | | | | 162 | |
| |
| Total | | $ | 2,675 | | | $ | 3,277 | |
| |
The Corporation has executed swap contracts to mitigate market risk on these structured borrowings. These contracts ensure that EDC will receive proceeds from the swap to meet the requirements of settling and servicing the debt obligation. The Corporation has in substance created floating rate debt by issuing bonds at fixed rates and entering into swap contracts whereby EDC receives fixed rate interest and pays interest at a floating rate. In swapping out of the underlying bond issue, the potential market risk has been converted to credit risk. Credit risk is managed by contracting with counterparties evaluated as creditworthy, based on treasury limits and policy guidelines as approved by the Board of Directors. Credit exposure on derivative financial instruments is further discussed in note 22.
18. DEBT INSTRUMENT MATURITIES
EDC often combines debt instruments with derivative financial instruments to generate lower-cost funding. For example, a fixed rate debt issue can be combined with an interest rate swap to generate floating rate funding at a lower cost than issuing a floating rate note. The following table shows EDC’s resulting net fixed and floating rate debt positions, as well as the maturities and yields of those net positions. Although the Corporation measures its derivative financial instruments at their fair value in the financial statements, they are shown below at their accrued cost (the same measurement basis as the debt instruments) in order to provide an appropriate basis for comparison.
| | | | | | | | | | | | | | | | | | | | | | | | | |
| ($ in millions) | | 2005 | | | 2004 | |
| | | Debt | | | Swap | | | | | | | Yield* | | | | | | | Yield* | |
| Year of maturity | | issues | | | contracts | | | Net | | | (%) | | | Net | | | (%) | |
| |
Fixed rate issues | | | | | | | | | | | | | | | | | | | | | | | | |
| 2006 | | | 2,465 | | | | (2,465 | ) | | | — | | | | — | | | | — | | | | — | |
| 2007 | | | 1,662 | | | | (1,079 | ) | | | 583 | | | | 4.05 | | | | 602 | | | | 4.05 | |
| 2008 | | | 344 | | | | (344 | ) | | | — | | | | — | | | | — | | | | — | |
| 2009 | | | 970 | | | | (970 | ) | | | — | | | | — | | | | — | | | | — | |
| 2010 | | | 1,767 | | | | (1,583 | ) | | | 184 | | | | 8.14 | | | | 190 | | | | 8.14 | |
| 2011 to 2015 | | | 2,983 | | | | (2,983 | ) | | | — | | | | — | | | | — | | | | — | |
| 2016 and beyond | | | 302 | | | | (278 | ) | | | 24 | | | | 8.16 | | | | 24 | | | | 8.16 | |
| |
| Subtotal | | | 10,493 | | | | (9,702 | ) | | | 791 | | | | 6.40 | | | | 816 | | | | 5.87 | |
| |
| | | | | | | | | | | | | | | | | | | | | | | | | |
Floating rate issues | | | | | | | | | | | | | | | | | | | | | | | | |
| 2005 | | | — | | | | — | | | | — | | | | | | | | 3,588 | | | | | |
| 2006 | | | 1,974 | | | | 2,273 | | | | 4,247 | | | | | | | | 2,361 | | | | | |
| 2007 | | | 67 | | | | 949 | | | | 1,016 | | | | | | | | 1,048 | | | | | |
| 2008 | | | 74 | | | | 275 | | | | 349 | | | | | | | | 386 | | | | | |
| 2009 | | | 35 | | | | 827 | | | | 862 | | | | | | | | 960 | | | | | |
| 2010 | | | 26 | | | | 1,329 | | | | 1,355 | | | | | | | | 1,400 | | | | | |
| 2011 to 2015 | | | 512 | | | | 2,526 | | | | 3,038 | | | | | | | | 3,292 | | | | | |
| 2016 and beyond | | | 243 | | | | 279 | | | | 522 | | | | | | | | 314 | | | | | |
| |
| Subtotal | | | 2,931 | | | | 8,458 | | | | 11,389 | | | | 4.30 | | | | 13,349 | | | | 2.25 | |
| |
Total | | $ | 13,424 | | | $ | (1,244 | ) | | $ | 12,180 | | | | | | | $ | 14,165 | | | | | |
| |
| | |
| * | | Refers to yield to maturity for fixed rate issues, and yield to reset for floating rate issues. |
Credit exposure and other details of derivative financial instruments are included as part of note 22.
EDC Annual Report 2005
105
CONSOLIDATED FINANCIAL STATEMENTS
19. INTEREST RATE RISK
The following table summarizes EDC’s interest rate risk based on the gap between the carrying value of assets and liabilities and equity, grouped by the earlier of contractual re-pricing or maturity dates. The effective interest rates shown indicate historical rates for fixed rate and floating rate instruments.
| | | | | | | | | | | | | | | | | | | | | | | | | | | | | |
| | | Immediately | | | Up to 6 | | | Over 6 to | | | Over 1 to | | | Over 5 | | | Non-interest | | | | |
| ($ in millions) | | rate-sensitive | | | months | | | 12 months | | | 5 years | | | years | | | sensitive | | | Total | |
| |
Assets | | | | | | | | | | | | | | | | | | | | | | | | | | | | |
| Cash and cash equivalents, marketable securities and investments | | | 152 | | | | 1,872 | | | | 62 | | | | 850 | | | | 305 | | | | 5 | | | | 3,246 | |
| | | | | | | | | | | | | | | | | | | | | | | | | | | | | |
| Gross loans receivable | | | 22 | | | | 6,618 | | | | 322 | | | | 2,781 | | | | 4,371 | | | | 3,236 | | | | 17,350 | |
Effective interest rate % | | | 7.36 | | | | 5.90 | | | | 6.80 | | | | 6.88 | | | | 6.67 | | | | | | | | | |
| | | | | | | | | | | | | | | | | | | | | | | | | | | | | |
| Less: | | | | | | | | | | | | | | | | | | | | | | | | | | | | |
| Deferred revenue and non-accrued capitalized interest | | | | | | | | | | | | | | | | | | | | | | | (1,053 | ) | | | (1,053 | ) |
| Net allowance for losses on loans | | | | | | | | | | | | | | | | | | | | | | | (2,024 | ) | | | (2,024 | ) |
| | | | | | | | | | | | | | | | | | | | | | | | | | | | | |
| Other assets and accrued interest | | | | | | | | | | | | | | | | | | | | | | | 2,210 | | | | 2,210 | |
| |
| Total assets | | $ | 174 | | | $ | 8,490 | | | $ | 384 | | | $ | 3,631 | | | $ | 4,676 | | | $ | 2,374 | | | $ | 19,729 | |
| |
| | | | | | | | | | | | | | | | | | | | | | | | | | | | | |
Liabilities and shareholder’s equity | | | | | | | | | | | | | | | | | | | | | | | | | | | | |
| Loans payable | | | | | | | 5,608 | | | | 890 | | | | 4,210 | | | | 2,479 | | | | 237 | | | | 13,424 | |
Effective interest rate % | | | | | | | 3.77 | | | | 4.44 | | | | 5.34 | | | | 5.52 | | | | | | | | | |
| | | | | | | | | | | | | | | | | | | | | | | | | | | | | |
Total pay side instruments on swap contracts (1) | | | | | | | 13,648 | | | | 425 | | | | 648 | | | | 496 | | | | | | | | 15,217 | |
Effective interest rate % (2) | | | | | | | 4.30 | | | | 3.86 | | | | 3.92 | | | | 5.00 | | | | | | | | | |
| | | | | | | | | | | | | | | | | | | | | | | | | | | | | |
Total receive side instruments on swap contracts (1) | | | | | | | (9,193 | ) | | | (1,125 | ) | | | (3,514 | ) | | | (2,397 | ) | | | (237 | ) | | | (16,466 | ) |
Effective interest rate % (2) | | | | | | | 3.93 | | | | 4.43 | | | | 5.23 | | | | 5.57 | | | | | | | | | |
| | | | | | | | | | | | | | | | | | | | | | | | | | | | | |
Cumulative foreign exchange translation on currency swaps (3) | | | | | | | | | | | | | | | | | | | | | | | 1,249 | | | | 1,249 | |
| | | | | | | | | | | | | | | | | | | | | | | | | | | | |
| | | | | | | | | | | | | | | | | | | | | | | | | | | | | |
| Total loans payable | | | | | | | | | | | | | | | | | | | | | | | | | | | 13,424 | |
| | | | | | | | | | | | | | | | | | | | | | | | | | | | |
| | | | | | | | | | | | | | | | | | | | | | | | | | | | | |
| Other liabilities, accrued interest and deferred revenue | | | | | | | | | | | | | | | | | | | | | | | 1,541 | | | | 1,541 | |
| | | | | | | | | | | | | | | | | | | | | | | | | | | | | |
| Shareholder’s equity | | | | | | | | | | | | | | | | | | | | | | | 4,764 | | | | 4,764 | |
| |
| Total liabilities and shareholder’s equity | | $ | — | | | $ | 10,063 | | | $ | 190 | | | $ | 1,344 | | | $ | 578 | | | $ | 7,554 | | | $ | 19,729 | |
| |
| | | | | | | | | | | | | | | | | | | | | | | | | | | | | |
At December 31, 2005 | | | | | | | | | | | | | | | | | | | | | | | | | | | | |
| | | | | | | | | | | | | | | | | | | | | | | | | | | | | |
| Total gap | | | 174 | | | | (1,573 | ) | | | 194 | | | | 2,287 | | | | 4,098 | | | | (5,180 | ) | | | — | |
| Cumulative gap | | | 174 | | | | (1,399 | ) | | | (1,205 | ) | | | 1,082 | | | | 5,180 | | | | — | | | | — | |
| |
| | | | | | | | | | | | | | | | | | | | | | | | | | | | | |
| Canadian dollar | | | 28 | | | | 3,985 | | | | 268 | | | | 197 | | | | 71 | | | | (11,607 | ) | | | (7,058 | ) |
| Foreign currency | | | 146 | | | | (5,558 | ) | | | (74 | ) | | | 2,090 | | | | 4,027 | | | | 6,427 | | | | 7,058 | |
| |
| Total gap | | | 174 | | | | (1,573 | ) | | | 194 | | | | 2,287 | | | | 4,098 | | | | (5,180 | ) | | | — | |
| |
| | | | | | | | | | | | | | | | | | | | | | | | | | | | | |
At December 31, 2004 | | | | | | | | | | | | | | | | | | | | | | | | | | | | |
| | | | | | | | | | | | | | | | | | | | | | | | | | | | | |
| Total gap | | | 67 | | | | (1,804 | ) | | | (203 | ) | | | 2,642 | | | | 5,213 | | | | (5,915 | ) | | | — | |
| Cumulative gap | | | 67 | | | | (1,737 | ) | | | (1,940 | ) | | | 702 | | | | 5,915 | | | | — | | | | — | |
| |
| | |
| (1) | | Represents notional principal amounts. |
| |
| (2) | | Represents the effective yield to maturity on the notional amount of pay and receive side instruments on swap contracts. |
| |
| (3) | | Due to foreign exchange translation, the pay and receive side instruments may not net to zero. This amount represents the difference caused by foreign exchange translation on the pay and receive side instruments on swap contracts. |
It’s About More Than Exporting
106
CONSOLIDATED FINANCIAL STATEMENTS
20. SHAREHOLDER’S EQUITY
The authorized share capital is $1.5 billion consisting of 15 million shares with a par value of $100 each. The number of shares issued and fully paid is 9.8 million (2004 — 9.8 million). No shares were issued in 2005 (2004 — nil).
21. FOREIGN CURRENCY BALANCES
The Corporation has substantial assets and liabilities in US dollars and in other currencies. In addition, EDC has derivative financial instruments denominated in various currencies. The purpose of these derivative financial instruments is to minimize the cost of capital and optimize yields for the Corporation, while remaining within treasury guidelines and limits approved by the Board of Directors.
The table below shows where EDC has used derivative financial instruments to manage the foreign currency exposures of its asset and liability positions. Although the Corporation measures its derivative financial instruments at their fair value in the financial statements, they are shown below at their accrued cost (the same measurement basis as the non-derivative assets and liabilities) in order to provide an appropriate basis for comparison. The resulting net foreign currency exposure at December 31 (expressed in Canadian equivalent dollars) is as follows:
| | | | | | | | | | | | | | | | | | | | | | | | | | | | | | | | | | | | | | | | | |
| ($ in millions) | | 2005 | | | 2004 | |
| | | | | | | | | | | | | | | | | | | | | | | | | | | Net | | | | | | | Net | | | | |
| | | | | | | | | | | | | | | | | | | | | | | | | | | foreign | | | Foreign | | | foreign | | | Foreign | |
| | | Assets | | | Liabilities | | | currency | | | exchange | | | currency | | | exchange | |
| | | Gross | | | DFI* | | | Net | | | Gross | | | DFI* | | | Net | | | exposure | | | rate | | | exposure | | | rate | |
| |
| US dollars | | | 14,893 | | | | 100 | | | | 14,993 | | | | (6,207 | ) | | | (8,613 | ) | | | (14,820 | ) | | | 173 | | | | 1.1659 | | | | 210 | | | | 1.2036 | |
| Euros | | | 371 | | | | — | | | | 371 | | | | (194 | ) | | | (174 | ) | | | (368 | ) | | | 3 | | | | 1.3797 | | | | 4 | | | | 1.6292 | |
| British pounds | | | 532 | | | | — | | | | 532 | | | | — | | | | (530 | ) | | | (530 | ) | | | 2 | | | | 2.0036 | | | | 3 | | | | 2.3062 | |
| Australian dollars | | | 29 | | | | — | | | | 29 | | | | (931 | ) | | | 903 | | | | (28 | ) | | | 1 | | | | 0.8550 | | | | 1 | | | | 0.9397 | |
| Swedish krona | | | 1 | | | | — | | | | 1 | | | | — | | | | — | | | | — | | | | 1 | | | | 0.1466 | | | | 1 | | | | 0.1811 | |
| Japanese yen | | | 17 | | | | (17 | ) | | | — | | | | (464 | ) | | | 464 | | | | — | | | | — | | | | 0.0099 | | | | 1 | | | | 0.0118 | |
| Mexican peso | | | 18 | | | | — | | | | 18 | | | | — | | | | (18 | ) | | | (18 | ) | | | — | | | | 0.1098 | | | | — | | | | 0.1152 | |
| New Zealand dollars | | | — | | | | — | | | | — | | | | (379 | ) | | | 379 | | | | — | | | | — | | | | 0.7956 | | | | — | | | | 0.8662 | |
| Hong Kong dollars | | | 25 | | | | — | | | | 25 | | | | (75 | ) | | | 50 | | | | (25 | ) | | | — | | | | 0.1504 | | | | — | | | | 0.1549 | |
| Norwegian krone | | | — | | | | — | | | | — | | | | (173 | ) | | | 173 | | | | — | | | | — | | | | 0.1727 | | | | — | | | | 0.1983 | |
| Polish zloty | | | 8 | | | | — | | | | 8 | | | | — | | | | (8 | ) | | | (8 | ) | | | — | | | | 0.3585 | | | | — | | | | 0.3579 | |
| Turkish lira | | | — | | | | — | | | | ��� | | | | (97 | ) | | | 97 | | | | — | | | | — | | | | 0.8649 | | | | — | | | | 0.9124 | |
| |
| | |
| * | | DFI (Derivative Financial Instruments) includes swaps and foreign exchange contracts. See note 22. |
The Corporation recognized a foreign exchange translation gain of $7 million in 2005 (2004 — loss of $10 million). This amount is included in other income. Throughout the year, EDC’s assets and liabilities were denominated mainly in US dollars, euros and British pounds.
22. DERIVATIVE FINANCIAL INSTRUMENTS
In order to maximize capital available to support EDC’s mandate, EDC reduces its exposure to currency and interest rate risk through the use of derivative financial instruments. Treasury policy and guidelines limit the use of derivatives. EDC does not use derivatives for speculative purposes. It uses a variety of these instruments to manage costs, returns and levels of financial risk associated with its funding, investment and risk management activities. The credit risk in these instruments is managed in accordance with policies established in EDC’s Market Risk Management Department and approved by the Board of Directors.
EDC currently uses, but is not limited to, the following types of instruments:
Interest rate swaps — transactions in which two parties exchange interest flows on a specified notional amount on predetermined dates for a specified period of time using agreed-upon fixed or floating rates of interest. Notional amounts upon which interest payments/ receipts are based are not exchanged.
Currency swaps — transactions in which two parties exchange currencies at inception and at maturity, as well as interest flows on the exchanged amounts on predetermined dates for a specified period of time using agreed-upon fixed or floating rates of interest.
Equity index swaps — transactions used to eliminate exposure to movements in an equity index on a debt issue undertaken by the Corporation. Two counterparties agree to exchange payments, one of which represents the percentage change in an agreed-upon equity index and the other a short-term interest rate index. The principal may either resemble an interest rate swap, in that no exchange of notional amounts occurs, or a currency swap, in which currencies will be exchanged at both inception and maturity.
Foreign exchange contracts — commitments to purchase or sell foreign currencies for delivery at a specified date in the future at a fixed rate.
EDC Annual Report 2005
107
CONSOLIDATED FINANCIAL STATEMENTS
In any transaction there is a potential for loss. This loss potential is represented by (1) credit risk, wherein the counterparty fails to perform an obligation as agreed upon, causing the other party to incur a financial loss, and (2) market risk, where an exposure exists as a result of changes in foreign exchange rates or interest rates.
The Corporation manages its exposure to derivative counterparty credit risk by contracting only with creditworthy counterparties, and in certain cases entering into collateral agreements with those counterparties. Collateral agreements provide for the posting of collateral by the counterparty when EDC’s exposure to that entity exceeds a certain threshold. Collateral is held by a third party and at December 31, 2005 totaled $1,080 million (2004 — $1,123 million). Where EDC has a collateral agreement with a counterparty, the counterparty must have a minimum credit rating of A- from an external credit rating agency (S&P, Moody’s or DBRS). Where EDC does not have a collateral agreement with a counterparty, the counterparty must have a minimum external credit rating of A for transactions of less than three years, and a minimum external credit rating of AA- for transactions of greater than three years. Internal policies and procedures establish credit approvals, controls and monitoring. The Corporation does not anticipate any significant non-performance by the counterparties.
The Corporation manages its exposure to market risk (interest rate and foreign exchange) using limits developed in consultation with the Department of Finance and approved by the Board of Directors.
Credit impairment in the derivative financial instruments, marketable securities and investments has been estimated at $20 million. Accordingly, an allowance for credit risk of $20 million (2004 — $20 million) has been established. This amount is included in accounts payable.
Notional principal amounts outstanding at December 31 are listed below for interest rate, currency swap and foreign exchange contracts entered into by the Corporation.
| | | | | | | | | | | | | | | | | | | | | |
| ($ in millions) | | 2005 | | | 2004 | |
| | | Remaining term to maturity | | | | | | | |
| | | Under 1 | | | 1 to 3 | | | Over 3 | | | | | | | |
| | | year | | | years | | | years | | | Total | | | Total | |
| |
| Currency swaps | | | 1,380 | | | | 1,426 | | | | 5,009 | | | | 7,815 | | | | 8,244 | |
| Interest rate swaps | | | 4,063 | | | | — | | | | — | | | | 4,063 | | | | 5,474 | |
| Foreign exchange contracts | | | 1,527 | | | | 671 | | | | 2,390 | | | | 4,588 | | | | 2,068 | |
| |
| Total derivative financial instruments | | $ | 6,970 | | | $ | 2,097 | | | $ | 7,399 | | | $ | 16,466 | | | $ | 15,786 | |
| |
Prior to January 1, 2004, the Corporation did not measure derivative financial instruments at fair value but rather on an accrual basis. In accordance with the implementation of Accounting Guideline 13 — Hedging Relationships and EIC-128 on January 1, 2004, the Corporation now recognizes and measures all of its derivative financial instruments at fair value, with changes in fair value being charged or credited to income. The difference between the accrued cost and fair value of each derivative at January 1, 2004 has been deferred and is being amortized on a straight-line basis over the remaining life of each instrument. Where that difference has resulted in a deferred gain, the deferral is included in derivative related amounts within total liabilities and shareholder’s equity. Where that difference has resulted in a deferred loss, the deferral is included in derivative related amounts within total assets.
A total loss of $48 million in unrealized fair value adjustment has been recognized in the income statement for 2005 (2004 — $143 million gain). This amount represents the total change in the fair value of derivatives during 2005, net of the accrued cost amounts recorded with the income and expenses of the operations to which the derivative relates (see note 2), as well as the amortization of the deferred gains and losses. In the ordinary course of business the Corporation would not realize gains or losses on the fair values of the derivative financial instruments since it is the Corporation’s intention to hold the derivatives to maturity and any cumulative unrealized gains or losses would net to zero over the life of the derivative.
The table below provides the balance sheet disclosure of derivative financial instruments using fair value measurement.
| | | | | | | | | |
| ($ in millions) | | 2005 | | | 2004 | |
| |
| Derivative related amounts — asset: | | | | | | | | |
| Derivatives with a positive value | | | 1,654 | | | | 1,829 | |
| Unamortized deferred losses on derivatives | | | 71 | | | | 124 | |
| |
| | | $ | 1,725 | | | $ | 1,953 | |
| |
| | | | | | | | | |
| Derivative related amounts — liability: | | | | | | | | |
| Derivatives with a negative value | | | 146 | | | | 193 | |
| Unamortized deferred gains on derivatives | | | 187 | | | | 265 | |
| |
| | | $ | 333 | | | $ | 458 | |
| |
It’s About More Than Exporting
108
CONSOLIDATED FINANCIAL STATEMENTS
23. FAIR VALUE OF FINANCIAL INSTRUMENTS
The following chart outlines the book values and the estimated fair values of the Corporation’s financial instruments. As with any estimate, uncertainty is inherent due to the unpredictability of future events. In the case of estimating the fair value of the Corporation’s financial instruments, this uncertainty is magnified due to the large number of assumptions used and the wide range of acceptable valuation techniques. Estimates of fair values are based on market conditions at a certain point in time, and may not be reflective of future market conditions. Thus, the estimates of the value of financial instruments outlined as follows do not necessarily reflect the actual values that may occur should the instruments be exchanged in the market.
| | | | | | | | | | | | | | | | | |
| ($ in millions) | | 2005 | | | 2004 | |
| | | Book value | | | Fair value | | | Book value | | | Fair value | |
| |
| Performing fixed rate loans | | | 7,317 | | | | 7,539 | | | | 8,089 | | | | 8,971 | |
| Performing floating rate loans | | | 5,514 | | | | 5,971 | | | | 6,753 | | | | 7,093 | |
| |
| Total performing loans receivable | | | 12,831 | | | | 13,510 | | | | 14,842 | | | | 16,064 | |
| Impaired loans (less specific allowance and non-accrued capitalized interest) | | | 1,624 | | | | 1,624 | | | | 885 | | | | 885 | |
| |
| Loans receivable and accrued interest and fees | | | 14,455 | | | | 15,134 | | | | 15,727 | | | | 16,949 | |
| Cash and marketable securities: | | | | | | | | | | | | | | | | |
| Fixed rate securities | | | 1,169 | | | | 1,161 | | | | 818 | | | | 809 | |
| Floating rate securities | | | 2,030 | | | | 2,024 | | | | 2,008 | | | | 2,005 | |
| Investments | | | 64 | | | | 65 | | | | 68 | | | | 69 | |
| Accounts payable | | | 109 | | | | 109 | | | | 112 | | | | 112 | |
| Loans payable: | | | | | | | | | | | | | | | | |
| Fixed rate | | | 10,602 | | | | 10,807 | | | | 12,067 | | | | 12,392 | |
| Floating rate | | | 2,975 | | | | 3,010 | | | | 3,604 | | | | 3,581 | |
| Currency swap contracts | | | 1,521 | | | | 1,521 | | | | 1,680 | | | | 1,680 | |
| Interest rate swap contracts | | | 36 | | | | 36 | | | | (12 | ) | | | (12 | ) |
| Foreign exchange contracts | | | (49 | ) | | | (49 | ) | | | (32 | ) | | | (32 | ) |
| Undisbursed loan commitments: | | | | | | | | | | | | | | | | |
| Fixed rate | | | 323 | | | | 289 | | | | 464 | | | | 491 | |
| Floating rate | | | 2,555 | | | | 2,512 | | | | 2,330 | | | | 2,398 | |
| |
The fair values of marketable securities and investments are estimated using observable market prices. If such prices are not available, a valuation technique is used that is consistent with accepted economic pricing methodologies.
The book value of EDC’s loan assets represents loans receivable less the total allowance for losses on loans offset by the risk mitigation insurer’s share of the allowance plus accrued interest and fees receivable. In order to estimate the fair value of its performing loans receivable (including accrued interest receivable), the Corporation separates its loans into risk pools and calculates the net present value of cash flows of principal and interest. The discount rates are obtained from yield curves for each risk pool and are specific to the credit risk and term to maturity associated with each principal and interest cash flow. The fair value of undisbursed loan commitments is estimated using the same methodology used in the performing loans receivable estimate. The fair value of impaired loans is considered to be equal to their book value.
Accounts payable are outstanding for only a short period of time. Thus, the fair value of accounts payable is estimated to be equal to their book value.
The estimate of the fair value of loans payable is based on a discounted cash flow approach using current market rates.
The estimate of the fair value of the foreign exchange contracts is calculated using the current market spot and forward exchange rates at the end of the year. Currency swap contracts and interest rate swap contracts are valued using a discounted cash flow approach. The discount rate used to estimate the fair value of the swap contracts is based on the current market swap rates at the end of the year as issued by Reuters and Telerate. These rates are used to calculate the present value of future interest payments and principal cash flows related to the swap contracts.
24. RELATED PARTY TRANSACTIONS
The Corporation enters into transactions with other government departments, agencies and Crown corporations in the normal course of business, under the terms and conditions similar to those that apply to unrelated parties. The following disclosure is in addition to the related party disclosure provided elsewhere in these financial statements. All material related party transactions are either disclosed on the following page or in the relevant notes.
EDC Annual Report 2005
109
CONSOLIDATED FINANCIAL STATEMENTS
CANADA ACCOUNT ADMINISTRATIVE EXPENSE RECOVERY
As described in note 26, EDC administers certain financial and contingent liability transactions on behalf of the Government of Canada and EDC is for the purposes of the paragraph below entitled Subsidiary Contingent Liability referred to as “Canada Account”. EDC receives compensation for expenses and overhead relating to Canada Account activities. In 2005, EDC retained $11 million (2004 — $11 million) from Canada Account receipts and recoveries for these expenses and overhead. These amounts are netted against administrative expenses on the income statement.
LOAN WITH RECOURSE TO THE CONSOLIDATED REVENUE FUND
The Corporation has a loan receivable of $820 million (2004 — $916 million) for which it has recourse to the Consolidated Revenue Fund of Canada in the event of a loan default.
SUBSIDIARY CONTINGENT LIABILITY
The consolidated contingent liabilities of the Corporation include $46 million (2004 — $47 million) which represents the potential claim that the Canada Account could make against the two entities in which EDC’s subsidiary Exinvest has an ownership interest. These two entities were established for the purposes of financing the sale of regional jet aircraft. There is a Tripartite Indemnity Agreement in place between these two entities and the Canada Account related to guarantees that the Canada Account provided to third parties. During 2003, the ultimate obligor to which the Canada Account guarantees pertained became impaired which resulted in a call against the guarantees and the Canada Account has since paid out on the guarantees and is now in a position to make a call against the two entities in which EDC’s subsidiary Exinvest has an ownership interest. A specific allowance of $14 million (2004- $45 million) has been set up to provide against this potential call on the Indemnity.
DEBT RELIEF
When sovereign borrowers experience financial difficulties and are unable to meet their debt obligations, sovereign creditors, including the Government of Canada, agree at an international forum, the Paris Club, to formally reschedule the borrower’s debt obligations. From time to time and on a case-by-case basis, the most heavily indebted sovereign borrowers are granted debt reduction or debt service relief by the Government of Canada. The granting of debt reduction or relief by the Paris Club is contingent upon the sovereign borrower’s ability to implement and maintain economic programs outlined by the International Monetary Fund.
In the past, the Government of Canada has reimbursed the Corporation an amount equal to the debt relief granted by the Government of Canada to the Corporation’s sovereign borrowers. The formula for calculating the amount to be paid to the Corporation was amended effective April 1, 2001 in two ways. Firstly, for new loans issued by the Corporation after March 31, 2001 to sovereign borrowers which were on the Paris Club debt relief list as at April 1, 2001, the Government of Canada has no obligation to compensate the Corporation for further debt relief granted to such borrowers. Secondly, for any debt reduction for new loans resulting from unilateral debt relief measures or new debt reduction for obligations contracted prior to April 1, 2001, EDC will share in the costs of debt forgiveness to the amount of its appropriate specific allowances on the loans.
Amounts received for debt relief arrangements on sovereign impaired loans are credited to the book value of the loans similar to the treatment accorded to other receipts on impaired loans. To the extent that amounts received exceed the book value of the loans as a result of non-accrued capitalized interest, debt relief income is recorded, and any provisions are returned to income.
During the year, the Corporation received in total $75 million (2004 — $62 million) pursuant to debt relief arrangements, and of this amount, $64 million (2004 — $43 million) represented the non-accrued capitalized interest associated with these loans and was recognized as debt relief income in the income statement.
25. EMPLOYEE FUTURE BENEFITS
PENSION PLANS
Effective April 24, 2000, the Corporation established pension benefit plans for its employees. The plans are defined benefit plans, providing benefits to retirees based on years of service and the best five consecutive years’ average salary of the employees. Upon retirement, the benefits are fully indexed to inflation. All permanent employees of EDC are members of the Registered Pension Plan, however, employee contributions to the plan are optional.
Upon the establishment of the pension plans, employees made an election to transfer their benefits from the Public Service Superannuation Fund. The related obligation and the assets to fund the plans that were transferred from the Government of Canada are included in the obligation and assets shown on the following page.
The Corporation’s independent actuaries measure the accrued benefit obligations and the fair value of the plans’ assets for accounting purposes as at December 31 of each year. The most recent funding valuation for the Registered Pension Plan was as at December 31, 2004. The next required valuation, to be completed in 2006, will be as at December 31, 2005. For the Supplementary Plan, an annual funding valuation is prepared as at December 31 each year.
It’s About More Than Exporting
110
CONSOLIDATED FINANCIAL STATEMENTS
OTHER BENEFIT PLANS
The Corporation maintains a retiring allowance program and provides certain life insurance, health and dental care benefits to retired employees. These plans are unfunded and costs are accrued based on actuarial calculations.
The following table presents the financial position of EDC’s Employee Benefit Plans at December 31, 2005.
| | | | | | | | | | | | | | | | | | | | | | | | | |
| ($ in millions) | | 2005 | | | 2004 | |
| | | Registered | | | Supplementary | | | Other | | | Registered | | | Supplementary | | | Other | |
| | | pension plan | | | pension plan | | | benefit plans | | | pension plan | | | pension plan | | | benefit plans | |
| |
Accrued benefit obligation: | | | | | | | | | | | | | | | | | | | | | | | | |
| Obligation beginning of year | | | 220 | | | | 9 | | | | 48 | | | | 184 | | | | 8 | | | | 42 | |
| Current service costs | | | 15 | | | | 1 | | | | 4 | | | | 14 | | | | 1 | | | | 4 | |
| Interest cost on benefit obligation | | | 14 | | | | 1 | | | | 3 | | | | 13 | | | | — | | | | 3 | |
| Actuarial loss | | | 72 | | | | 3 | | | | 10 | | | | 12 | | | | — | | | | — | |
| Benefits paid | | | (5 | ) | | | — | | | | (1 | ) | | | (3 | ) | | | — | | | | (1 | ) |
| |
| Accrued benefit obligation at end of year | | | 316 | | | | 14 | | | | 64 | | | | 220 | | | | 9 | | | | 48 | |
| |
Fair value of plan assets: | | | | | | | | | | | | | | | | | | | | | | | | |
| Fair value at beginning of year | | | 197 | | | | 41 | | | | — | | | | 166 | | | | 38 | | | | — | |
| Actual return on plan assets | | | 26 | | | | 3 | | | | — | | | | 22 | | | | 3 | | | | — | |
| Employer contributions | | | 16 | | | | — | | | | 1 | | | | 8 | | | | — | | | | 1 | |
| Employee contributions | | | 4 | | | | — | | | | — | | | | 4 | | | | — | | | | — | |
| Benefits paid | | | (5 | ) | | | — | | | | (1 | ) | | | (3 | ) | | | — | | | | (1 | ) |
| |
| Fair value at end of year | | | 238 | | | | 44 | | | | — | | | | 197 | | | | 41 | | | | — | |
| |
| | | | | | | | | | | | | | | | | | | | | | | | | |
Funded status - plan (deficit) surplus | | | (78 | ) | | | 30 | | | | (64 | ) | | | (23 | ) | | | 32 | | | | (48 | ) |
| Unamortized net actuarial loss (gain) | | | 83 | | | | (25 | ) | | | 17 | | | | 22 | | | | (29 | ) | | | 6 | |
| Unamortized transitional obligation | | | — | | | | — | | | | 7 | | | | — | | | | — | | | | 8 | |
| |
Accrued benefit asset (liability) | | $ | 5 | | | $ | 5 | | | $ | (40 | ) | | $ | (1 | ) | | $ | 3 | | | $ | (34 | ) |
| |
The unamortized net actuarial loss in the Corporation’s Registered Pension Plan was $83 million (2004 — $22 million) which exceeded 10% of the accrued benefit obligation by $51 million as at December 31, 2005. The excess amount will be amortized to pension expense over the expected average remaining service period of active employees, commencing January 1, 2006. As a result of this change, pension cost for the Registered Pension Plan is expected to increase by approximately $4 million in fiscal year 2006. Amortization of accumulated net actuarial losses in periods subsequent to December 31, 2005 will be affected principally by the discount rate used to estimate benefit obligations and by the difference between future investment results and the expected return on plan assets.
The accrued benefit asset (liability) is included on the Corporation’s balance sheet in accounts payable and other credits.
Plans with accrued benefit obligations in excess of plan assets:
| | | | | | | | | | | | | | | | | |
| ($ in millions) | | 2005 | | | 2004 | |
| | | Registered | | | Other | | | Registered | | | Other | |
| | | pension plan | | | benefit plans | | | pension plan | | | benefit plans | |
| |
| Accrued benefit obligations | | | 316 | | | | 64 | | | | 220 | | | | 48 | |
| Fair value of plan assets | | | 238 | | | | — | | | | 197 | | | | — | |
| |
| Funded status — plan deficit | | $ | (78 | ) | | $ | (64 | ) | | $ | (23 | ) | | $ | (48 | ) |
| |
ASSET MIX
Plan assets are invested in debt securities and equity securities and held in cash. For the Registered Pension Plan, the target allocation percentages are 40% in debt securities and 60% in equity securities. The actual percentages at December 31, 2005 are 39% in debt securities and 61 % in equity securities (2004 — 41 % and 59% respectively). For the Supplementary Pension Plan, the target is 100% in equity securities, net of the cash in a Refundable Tax Account as prescribed by Canada Revenue Agency. This resulted in actual percentages of 46% in cash and 54% in equity securities at the end of 2005 (2004 — 45% and 55% respectively).
EDC Annual Report 2005
111
CONSOLIDATED FINANCIAL STATEMENTS
DEFINED BENEFIT COSTS
| | | | | | | | | | | | | | | | | | | | | | | | | |
| ($ in millions) | | 2005 | | | 2004 | |
| | | Registered | | | Supplementary | | | Other | | | Registered | | | Supplementary | | | Other | |
| | | pension plan | | | pension plan | | | benefit plans | | | pension plan | | | pension plan | | | benefit plans | |
| |
| Current service costs (net of employee contributions) | | | 11 | | | | 1 | | | | 4 | | | | 10 | | | | 1 | | | | 4 | |
| Interest cost on benefit obligation | | | 14 | | | | 1 | | | | 3 | | | | 13 | | | | — | | | | 3 | |
| Actual return on plan assets | | | (26 | ) | | | (3 | ) | | | — | | | | (22 | ) | | | (3 | ) | | | — | |
| Actuarial loss | | | 72 | | | | 3 | | | | 10 | | | | 12 | | | | — | | | | — | |
| |
| Benefit costs before adjustments to recognize the long-term nature of employee future benefit costs | | | 71 | | | | 2 | | | | 17 | | | | 13 | | | | (2 | ) | | | 7 | |
| |
| Adjustments: | | | | | | | | | | | | | | | | | | | | | | | | |
| Difference between expected return and actual return on plan assets | | | 11 | | | | 2 | | | | — | | | | 8 | | | | 2 | | | | — | |
| Difference between actuarial loss recognized for the year and actual actuarial loss on accrued benefit obligation for the year | | | (72 | ) | | | (6 | ) | | | (10 | ) | | | (12 | ) | | | (2 | ) | | | — | |
| Amortization of transitional obligation | | | — | | | | — | | | | 1 | | | | — | | | | — | | | | 1 | |
| |
| Total | | $ | 10 | | | $ | (2 | ) | | $ | 8 | | | $ | 9 | | | $ | (2 | ) | | $ | 8 | |
| |
TOTAL CASH PAYMENTS
Total cash payments for employee future benefits for 2005 totaled $17 million (2004 — $9 million). The payments consisted of cash contributions to the Pension Plans and payments paid directly to beneficiaries for the unfunded Other Benefit plans. Included in total cash payments in 2005 was $7 million (2004 — nil) in additional contributions to the Registered Pension Plan in relation to a plan deficit identified as a result of the 2004 funding valuation.
ASSUMPTIONS
| | | | | | | | | | | | | | | | | | | | | | | | | |
| | | 2005 | | | 2004 | |
| | | Registered | | | Supplementary | | | Other | | | Registered | | | Supplementary | | | Other | |
| (Weighted average) | | pension plan | | | pension plan | | | benefit plans | | | pension plan | | | pension plan | | | benefit plans | |
| |
| Accrued benefit obligation: | | | | | | | | | | | | | | | | | | | | | | | | |
| Discount rate | | | 5.1 | % | | | 5.1 | % | | | 5.1 | % | | | 6.1 | % | | | 6.1 | % | | | 6.1 | % |
| Rate of compensation increase | | Inflation | | Inflation | | Inflation | | Inflation | | Inflation | | Inflation |
| | | + productivity | | + productivity | | + productivity | | + productivity | | + productivity | | + productivity |
| | | + merit | | + merit | | + merit | | + merit | | + merit | | + merit |
| | | | | | | | | | | | | | | | | | | | | | | | | |
| Benefit costs: | | | | | | | | | | | | | | | | | | | | | | | | |
| Expected long-term rate of return on assets | | | 7.50 | % | | | 3.75 | % | | | n/a | | | | 7.50 | % | | | 3.75 | % | | | n/a | |
| Discount rate on projected benefit obligation | | | 6.10 | % | | | 6.10 | % | | | 6.10 | % | | | 6.40 | % | | | 6.40 | % | | | 6.40 | % |
| Inflation | | | 3.0 | % | | | 3.0 | % | | | 3.0 | % | | | 3.0 | % | | | 3.0 | % | | | 3.0 | % |
| Rate of compensation increase | | Inflation | | Inflation | | Inflation | | Inflation | | Inflation | | Inflation |
| | | + productivity | | + productivity | | + productivity | | + productivity | | + productivity | | + productivity |
| | | + merit | | + merit | | + merit | | + merit | | + merit | | + merit |
| |
The initial annual rate of increase for covered medical care benefits is assumed to be 7.43% (2004 — 8%). This rate is projected to trend down over six years to an ultimate rate of 4% for 2011 (2004 — 4% for 2011) and subsequent years. For dental care, the trend rate used was 4% (2004 — 4%).
A one percentage point increase in assumed health care cost trends would have increased the service and interest costs and the obligation by $1.2 million and $11.2 million, respectively. A one percentage point decrease in assumed health care cost trends would have decreased the service and interest costs and the obligation by $0.9 million and $8.4 million, respectively.
It’s About More Than Exporting
112
CONSOLIDATED FINANCIAL STATEMENTS
26. CANADA ACCOUNT TRANSACTIONS
Pursuant to the Act, the Minister of International Trade, with the concurrence of the Minister of Finance, may authorize the Corporation to undertake certain financial and contingent liability transactions on behalf of the Government of Canada. These transactions and the legislative authorities that underlie them have come to be known collectively as the “Canada Account”. The Board of Directors is responsible only for ensuring that the transactions made by the Corporation under the Canada Account are administered appropriately. Accounts for these transactions are maintained separately from the Corporation’s accounts and are consolidated annually as at March 31 with the financial statements of the Government of Canada, which are reported upon separately by the Government and audited by the Auditor General of Canada. The assets under the Canada Account, mainly loans receivable and accrued interest and fees recorded in accordance with the accounting policies and practices of the Government of Canada, amounted to $4,150 million at December 31, 2005 (2004 — $3,898 million).
The Act allows the Canada Account to have outstanding loans and commitments to borrowers, and arrangements giving rise to contingent liabilities under contracts of insurance and other agreements up to a maximum of $13 billion. The position against this limit, determined in accordance with the requirements of the Act, is $6.9 billion (2004 — $7.7 billion).
As at the end of December 2005, total Ministerial Authorizations (M.A.’s) issued and approved totaled $226 million (2004 — $260 million) and unallocated amounts under Lines of Credit totaled $39 million (2004 — $52 million) for Canada Account. These amounts have been approved by the Minister of International Trade and the Minister of Finance in support of potential new transactions to be signed. The position against the statutory limit will increase accordingly as each new obligation is signed by the Corporation that has the effect of extending credit or giving rise to a contingent liability.
27. SUBSEQUENT EVENT
On January 5, 2006, the US bankruptcy courts approved a motion for the rejection of additional aircraft by a bankrupt obligor. The aircraft were returned to EDC by January 20, 2006. The current fair value of the aircraft approximated the net book value of their related loans receivable of $112 million. Upon receipt of the aircraft subsequent to December 31, they were classified as held for use, and recorded as equipment available for lease.
28. RECLASSIFICATION OF COMPARATIVE FIGURES
Certain 2004 comparative figures have been reclassified to conform to the presentation adopted in 2005.
EDC Annual Report 2005
113
TEN-YEAR REVIEW
Balance Sheet
| | | | | | | | | | | | | |
| as at December 31 | | | | | | | | | |
| ($ in millions) | | 2005 | | | 2004 | | | 2003 | |
| |
| Gross loans receivable | | | 17,350 | | | | 19,463 | | | | 21,499 | |
| Less: non-accrued capitalized interest | | | (806 | ) | | | (1,027 | ) | | | (1,211 | ) |
| Less: allowance for losses on loans | | | (2,148 | ) | | | (2,674 | ) | | | (3,290 | ) |
| Less: deferred loan revenue | | | (247 | ) | | | (262 | ) | | | (276 | ) |
| Risk mitigation insurer’s share of loan allowance | | | 124 | | | | — | | | | — | |
| |
| | | | 14,273 | | | | 15,500 | | | | 16,722 | |
| Equipment available for lease | | | 114 | | | | — | | | | — | |
| Cash and investments | | | 3,246 | | | | 2,884 | | | | 2,573 | |
| Reinsurers’ share of allowance for claims | | | 40 | | | | 59 | | | | 120 | |
| Accrued interest and other assets | | | 2,056 | | | | 2,307 | | | | 1,742 | |
| |
| Total assets | | $ | 19,729 | | | $ | 20,750 | | | $ | 21,157 | |
| |
| | | | | | | | | | | | | |
| Loans payable | | | 13,424 | | | | 15,545 | | | | 17,325 | |
| Accrued interest and other liabilities | | | 650 | | | | 732 | | | | 533 | |
| Allowance for loan commitments and guarantees | | | 355 | | | | 448 | | | | 472 | |
| Allowance for claims on insurance | | | 536 | | | | 548 | | | | 592 | |
| |
| Total liabilities | | | 14,965 | | | | 17,273 | | | | 18,922 | |
| |
| Share capital | | | 983 | | | | 983 | | | | 983 | |
| Retained earnings | | | 3,781 | | | | 2,494 | | | | 1,252 | |
| |
| Shareholder’s equity | | | 4,764 | | | | 3,477 | | | | 2,235 | |
| |
| Total liabilities and shareholder’s equity | | $ | 19,729 | | | $ | 20,750 | | | $ | 21,157 | |
| |
Statement of Income
| | | | | | | | | | | | | |
| for the year ended December 31 | | | | | | | | | |
| ($ in millions) | | 2005 | | | 2004 | | | 2003 | |
| |
| Loans income | | | 1,155 | | | | 1,148 | | | | 1,249 | |
| Debt relief income | | | 64 | | | | 43 | | | | 56 | |
| Investment portfolio income | | | 123 | | | | 63 | | | | 60 | |
| |
| Total financing and investment income | | | 1,342 | | | | 1,254 | | | | 1,365 | |
| Less: interest expense | | | 494 | | | | 345 | | | | 404 | |
| |
| Net financing and investment income | | | 848 | | | | 909 | | | | 961 | |
| |
| | | | | | | | | | | | | |
| Insurance premiums and guarantee fees | | | 156 | | | | 161 | | | | 147 | |
| Other income (expense) | | | — | | | | (7 | ) | | | 7 | |
| Provision for (reversal of) credit losses | | | (513 | ) | | | (214 | ) | | | 784 | |
| |
| Income after provision for (reversal of) credit losses | | | 1,517 | | | | 1,277 | | | | 331 | |
| Administrative expenses | | | 182 | | | | 178 | | | | 173 | |
| |
| Income before unrealized fair value adjustment | | | 1,335 | | | | 1,099 | | | | 158 | |
| Unrealized fair value adjustment | | | (48 | ) | | | 143 | | | | — | |
| |
| Net income | | $ | 1,287 | | | $ | 1,242 | | | $ | 158 | |
| |
It’s About More Than Exporting
114
TEN-YEAR REVIEW
| | | | | | | | | | | | | | | | | | | | | | | | | | | | | |
| | | 2002 | | | 2001 | | | 2000 | | | 1999 | | | 1998 | | | 1997 | | | 1996 | |
| |
| | | | 26,341 | | | | 25,226 | | | | 22,023 | | | | 18,598 | | | | 16,524 | | | | 12,373 | | | | 10,504 | |
| | | | (1,426 | ) | | | (1,241 | ) | | | (1,165 | ) | | | (1,182 | ) | | | (1,255 | ) | | | (1,082 | ) | | | (998 | ) |
| | | | (3,613 | ) | | | (2,892 | ) | | | (2,700 | ) | | | (2,324 | ) | | | (2,060 | ) | | | (1,628 | ) | | | (1,423 | ) |
| | | | (292 | ) | | | (267 | ) | | | (272 | ) | | | (248 | ) | | | (220 | ) | | | (207 | ) | | | (160 | ) |
| | | | — | | | | — | | | | — | | | | — | | | | — | | | | — | | | | — | |
| |
| | | | 21,010 | | | | 20,826 | | | | 17,886 | | | | 14,844 | | | | 12,989 | | | | 9,456 | | | | 7,923 | |
| | | | — | | | | — | | | | — | | | | — | | | | — | | | | — | | | | — | |
| | | | 2,899 | | | | 2,346 | | | | 2,357 | | | | 3,417 | | | | 1,730 | | | | 1,927 | | | | 1,444 | |
| | | | 195 | | | | 179 | | | | 48 | | | | 21 | | | | 2 | | | | 3 | | | | 3 | |
| | | | 645 | | | | 621 | | | | 747 | | | | 1,253 | | | | 761 | | | | 262 | | | | 214 | |
| |
| | | $ | 24,749 | | | $ | 23,972 | | | $ | 21,038 | | | $ | 19,535 | | | $ | 15,482 | | | $ | 11,648 | | | $ | 9,584 | |
| |
| | | | | | | | | | | | | | | | | | | | | | | | | | | | | |
| | | | 20,828 | | | | 19,609 | | | | 17,583 | | | | 16,325 | | | | 12,636 | | | | 9,556 | | | | 7,735 | |
| | | | 812 | | | | 1,082 | | | | 846 | | | | 937 | | | | 728 | | | | 208 | | | | 189 | |
| | | | 377 | | | | 588 | | | | 130 | | | | 115 | | | | 129 | | | | 90 | | | | 35 | |
| | | | 655 | | | | 643 | | | | 487 | | | | 360 | | | | 309 | | | | 249 | | | | 208 | |
| |
| | | | 22,672 | | | | 21,922 | | | | 19,046 | | | | 17,737 | | | | 13,802 | | | | 10,103 | | | | 8,167 | |
| |
| | | | 983 | | | | 983 | | | | 983 | | | | 983 | | | | 983 | | | | 983 | | | | 983 | |
| | | | 1,094 | | | | 1,067 | | | | 1,009 | | | | 815 | | | | 697 | | | | 562 | | | | 434 | |
| |
| | | | 2,077 | | | | 2,050 | | | | 1,992 | | | | 1,798 | | | | 1,680 | | | | 1,545 | | | | 1,417 | |
| |
| | | $ | 24,749 | | | $ | 23,972 | | | $ | 21,038 | | | $ | 19,535 | | | $ | 15,482 | | | $ | 11,648 | | | $ | 9,584 | |
| |
| | | | | | | | | | | | | | | | | | | | | | | | | | | | | |
| | | 2002 | | | 2001 | | | 2000 | | | 1999 | | | 1998 | | | 1997 | | | 1996 | |
| |
| | | | 1,400 | | | | 1,618 | | | | 1,578 | | | | 1,256 | | | | 1,053 | | | | 779 | | | | 688 | |
| | | | 96 | | | | 1 | | | | — | | | | 2 | | | | — | | | | 3 | | | | — | |
| | | | 69 | | | | 127 | | | | 197 | | | | 146 | | | | 126 | | | | 92 | | | | 99 | |
| |
| | | | 1,565 | | | | 1,746 | | | | 1,775 | | | | 1,404 | | | | 1,179 | | | | 874 | | | | 787 | |
| | | | 583 | | | | 934 | | | | 1,068 | | | | 784 | | | | 655 | | | | 489 | | | | 448 | |
| |
| | | | 982 | | | | 812 | | | | 707 | | | | 620 | | | | 524 | | | | 385 | | | | 339 | |
| |
| | | | | | | | | | | | | | | | | | | | | | | | | | | | | |
| | | | 147 | | | | 134 | | | | 144 | | | | 133 | | | | 110 | | | | 99 | | | | 92 | |
| | | | 7 | | | | 2 | | | | 9 | | | | (12 | ) | | | 15 | | | | 8 | | | | 11 | |
| | | | 840 | | | | 741 | | | | 549 | | | | 523 | | | | 433 | | | | 295 | | | | 270 | |
| |
| | | | 296 | | | | 207 | | | | 311 | | | | 218 | | | | 216 | | | | 197 | | | | 172 | |
| | | | 174 | | | | 149 | | | | 117 | | | | 100 | | | | 81 | | | | 69 | | | | 60 | |
| |
| | | | 122 | | | | 58 | | | | 194 | | | | 118 | | | | 135 | | | | 128 | | | | 112 | |
| | | | — | | | | — | | | | — | | | | — | | | | — | | | | — | | | | — | |
| |
| | | $ | 122 | | | $ | 58 | | | $ | 194 | | | $ | 118 | | | $ | 135 | | | $ | 128 | | | $ | 112 | |
| |
EDC Annual Report 2005
115
TEN-YEAR REVIEW
Corporate Account
FINANCIAL ARRANGEMENTS FACILITATED
| | | | | | | | | | | | | |
| ($ in millions) | | 2005 | | | 2004 | | | 2003 | |
| |
Export Financing | | | | | | | | | | | | |
| Direct financing | | | 5,091 | | | | 6,152 | | | | 5,939 | |
| |
| | | | | | | | | | | | | |
Export Insurance | | | | | | | | | | | | |
| Short-term insurance * | | | 41,565 | | | | 40,177 | | | | 37,267 | |
| Medium-term insurance | | | 8,458 | | | | 6,951 | | | | 7,410 | |
| Guarantees | | | 2,330 | | | | 1,623 | | | | 1,244 | |
| |
| Subtotal | | | 52,353 | | | | 48,751 | | | | 45,921 | |
| |
| Total | | $ | 57,444 | | | $ | 54,903 | | | $ | 51,860 | |
| |
Short-term domestic insurance not included above | | $ | 5,412 | | | $ | 4,899 | | | $ | 1,791 | |
| |
FINANCIAL AND OTHER DATA
| | | | | | | | | | | | | |
Export Financing ($ in millions) | | | | | | | | | | | | |
| Value of total obligations on loans receivable | | | 17,350 | | | | 19,463 | | | | 21,499 | |
| Value of undisbursed loans | | | 2,878 | | | | 2,794 | | | | 3,040 | |
| Value of disbursements | | | 4,574 | | | | 4,172 | | | | 4,194 | |
| Value of liability on loan guarantees | | | 1,470 | | | | 1,909 | | | | 1,820 | |
| Undisbursed amounts on loan guarantees | | | 1,004 | | | | 820 | | | | 509 | |
| Amounts available for allocation | | | 2,550 | | | | 1,682 | | | | 1,732 | |
| Loan amounts rescheduled | | | 128 | | | | 64 | | | | 232 | |
| Loan amounts written off | | | 39 | | | | 81 | | | | 113 | |
| |
| Number of transactions financed | | | 735 | | | | 635 | | | | 571 | |
| Number of current lines of credit and protocols | | | 60 | | | | 47 | | | | 61 | |
| |
| | | | | | | | | | | | | |
Export Insurance ($ in millions) | | | | | | | | | | | | |
| Value of liability on insurance and guarantees ** | | | 14,060 | | | | 12,175 | | | | 11,468 | |
| Value of claims paid | | | 44 | | | | 64 | | | | 76 | |
| Value of claims recovered/rescheduled | | | 31 | | | | 24 | | | | 30 | |
| Value of claims outstanding at end of year | | | 221 | | | | 261 | | | | 282 | |
| Value of claims under consideration at end of year | | | 25 | | | | 38 | | | | 52 | |
| |
| Number of policies issued | | | 10,427 | | | | 10,756 | | | | 10,184 | |
| Number of insurance policies and guarantees in force | | | 8,748 | | | | 8,209 | | | | 7,491 | |
| |
Average employee strength during the year | | | 1,002 | | | | 994 | | | | 1,003 | |
| |
| | |
| * | | Excludes domestic insurance. |
| |
| ** | | Figures prior to 2002 were not restated to reflect current presentation as the information was not reasonably determinable. |
It’s About More Than Exporting
116
TEN-YEAR REVIEW
| | | | | | | | | | | | | | | | | | | | | | | | | | | | | |
| | | 2002 | | | 2001 | | | 2000 | | | 1999 | | | 1998 | | | 1997 | | | 1996 | |
| |
| | | | 7,381 | | | | 8,419 | | | | 7,657 | | | | 6,060 | | | | 6,639 | | | | 5,454 | | | | 3,678 | |
| |
| | | | | | | | | | | | | | | | | | | | | | | | | | | | | |
| | | | 34,532 | | | | 26,776 | | | | 25,807 | | | | 23,792 | | | | 20,660 | | | | 17,356 | | | | 14,139 | |
| | | | 8,638 | | | | 8,555 | | | | 7,080 | | | | 5,914 | | | | 3,933 | | | | 2,629 | | | | 2,464 | |
| | | | 689 | | | | 597 | | | | 325 | | | | 456 | | | | 189 | | | | 221 | | | | 132 | |
| |
| | | | 43,859 | | | | 35,928 | | | | 33,212 | | | | 30,162 | | | | 24,782 | | | | 20,206 | | | | 16,735 | |
| |
| | | $ | 51,240 | | | $ | 44,347 | | | $ | 40,869 | | | $ | 36,222 | | | $ | 31,421 | | | $ | 25,660 | | | $ | 20,413 | |
| |
| | | $ | 298 | | | $ | 1,157 | | | $ | 3,996 | | | $ | 3,833 | | | $ | 3,330 | | | $ | 2,976 | | | $ | 1,617 | |
| |
| | | | | | | | | | | | | | | | | | | | | �� | | | | | | | | |
| | | | 26,341 | | | | 25,226 | | | | 22,023 | | | | 18,598 | | | | 16,524 | | | | 12,469 | | | | 10,517 | |
| | | | 3,512 | | | | 4,938 | | | | 4,825 | | | | 5,345 | | | | 5,813 | | | | 6,482 | | | | 2,863 | |
| | | | 6,028 | | | | 8,085 | | | | 7,210 | | | | 6,374 | | | | 5,822 | | | | 3,295 | | | | 2,437 | |
| | | | 2,699 | | | | 2,212 | | | | 1,795 | | | | 1,643 | | | | 1,723 | | | | 416 | | | | 347 | |
| | | | 299 | | | | 355 | | | | 112 | | | | 123 | | | | 150 | | | | 145 | | | | 85 | |
| | | | 1,655 | | | | 1,476 | | | | 1,176 | | | | 1,659 | | | | 1,320 | | | | 1,356 | | | | 1,570 | |
| | | | 775 | | | | 290 | | | | 264 | | | | 720 | | | | 237 | | | | 158 | | | | 464 | |
| | | | 194 | | | | 191 | | | | 105 | | | | — | | | | — | | | | 18 | | | | — | |
| |
| | | | 397 | | | | 556 | | | | 458 | | | | 372 | | | | 351 | | | | 242 | | | | 172 | |
| | | | 47 | | | | 40 | | | | 44 | | | | 55 | | | | 52 | | | | 44 | | | | 50 | |
| |
| | | | | | | | | | | | | | | | | | | | | | | | | | | | | |
| | | | 12,265 | | | | 11,944 | | | | 12,495 | | | | 10,955 | | | | 9,921 | | | | 8,163 | | | | 7,000 | |
| | | | 144 | | | | 144 | | | | 84 | | | | 134 | | | | 72 | | | | 43 | | | | 60 | |
| | | | 39 | | | | 51 | | | | 30 | | | | 17 | | | | 19 | | | | 16 | | | | 11 | |
| | | | 344 | | | | 298 | | | | 246 | | | | 234 | | | | 164 | | | | 119 | | | | 100 | |
| | | | 35 | | | | 48 | | | | 36 | | | | 38 | | | | 62 | | | | 15 | | | | 14 | |
| |
| | | | 6,351 | | | | 5,090 | | | | 3,951 | | | | 3,879 | | | | 3,345 | | | | 3,021 | | | | 2,591 | |
| | | | 6,968 | | | | 6,002 | | | | 5,187 | | | | 4,873 | | | | 4,462 | | | | 4,045 | | | | 3,493 | |
| |
| | | | 992 | | | | 939 | | | | 838 | | | | 778 | | | | 698 | | | | 650 | | | | 602 | |
| |
EDC Annual Report 2005
117
TEN-YEAR REVIEW
Canada Account
FINANCIAL ARRANGEMENTS FACILITATED
| | | | | | | | | | | | | |
| ($ in millions) | | 2005 | | | 2004 | | | 2003 | |
| |
Export Financing | | | | | | | | | | | | |
| Direct financing | | | 649 | | | | 987 | | | | 1,209 | |
| |
| | | | | | | | | | | | | |
Export Insurance | | | | | | | | | | | | |
| Short-term insurance | | | — | | | | — | | | | 1 | |
| Medium-term insurance | | | — | | | | — | | | | — | |
| Guarantees | | | — | | | | — | | | | — | |
| |
| Subtotal | | | — | | | | — | | | | 1 | |
| |
| Total | | $ | 649 | | | $ | 987 | | | $ | 1,210 | |
| |
FINANCIAL AND OTHER DATA
| | | | | | | | | | | | | |
Export Financing ($ in millions) | | | | | | | | | | | | |
| Value of total obligations on loans receivable | | | 3,994 | | | | 3,786 | | | | 3,219 | |
| Value of undisbursed loans | | | 1,526 | | | | 2,368 | | | | 3,303 | |
| Value of disbursements | | | 736 | | | | 1,091 | | | | 981 | |
| Amounts available for allocation | | | 39 | | | | 52 | | | | 61 | |
| Loan amounts rescheduled | | | 41 | | | | 6 | | | | 31 | |
| |
| Number of transactions financed | | | 37 | | | | 55 | | | | 45 | |
| Number of current lines of credit and protocols | | | 1 | | | | 2 | | | | 2 | |
| |
| | | | | | | | | | | | | |
Export Insurance ($ in millions) | | | | | | | | | | | | |
| Value of liability on insurance and guarantees | | | — | | | | — | | | | — | |
| Value of claims paid | | | — | | | | — | | | | — | |
| Value of claims recovered | | | — | | | | — | | | | — | |
| Value of claims outstanding at end of year | | | 44 | | | | 44 | | | | 45 | |
| |
| Number of policies issued | | | — | | | | — | | | | 2 | |
| Number of insurance policies and guarantees in force | | | — | | | | — | | | | — | |
| |
It’s About More Than Exporting
118
TEN-YEAR REVIEW
| | | | | | | | | | | | | | | | | | | | | | | | | | | | | |
| | | 2002 | | | 2001 | | | 2000 | | | 1999 | | | 1998 | | | 1997 | | | 1996 | |
| |
| | | | 527 | | | | 135 | | | | 38 | | | | 67 | | | | 9 | | | | 1,584 | | | | 131 | |
| |
| | | | 1 | | | | — | | | | — | | | | — | | | | — | | | | — | | | | 6 | |
| | | | 5 | | | | 16 | | | | 224 | | | | 247 | | | | 497 | | | | 283 | | | | 299 | |
| | | | — | | | | — | | | | — | | | | — | | | | 12 | | | | 34 | | | | — | |
| |
| | | | 6 | | | | 16 | | | | 224 | | | | 247 | | | | 509 | | | | 317 | | | | 305 | |
| |
| | | $ | 533 | | | $ | 151 | | | $ | 262 | | | $ | 314 | | | $ | 518 | | | $ | 1,901 | | | $ | 436 | |
| |
| | | | | | | | | | | | | | | | | | | | | | | | | | | | | |
| | | | 2,968 | | | | 2,682 | | | | 2,490 | | | | 2,599 | | | | 2,904 | | | | 2,799 | | | | 2,753 | |
| | | | 5,123 | | | | 101 | | | | 192 | | | | 183 | | | | 194 | | | | 309 | | | | 373 | |
| | | | 534 | | | | 203 | | | | 76 | | | | 66 | | | | 100 | | | | 112 | | | | 171 | |
| | | | 109 | | | | 88 | | | | 73 | | | | 73 | | | | 87 | | | | 20 | | | | 20 | |
| | | | 25 | | | | 43 | | | | 3 | | | | 45 | | | | 45 | | | | 136 | | | | 9 | |
| |
| | | | 28 | | | | 8 | | | | 11 | | | | 12 | | | | 5 | | | | 7 | | | | 29 | |
| | | | 2 | | | | 2 | | | | 3 | | | | 2 | | | | 2 | | | | 1 | | | | 1 | |
| |
| | | | | | | | | | | | | | | | | | | | | | | | | | | | | |
| | | | 4 | | | | 56 | | | | 170 | | | | 199 | | | | 299 | | | | 241 | | | | 456 | |
| | | | — | | | | — | | | | — | | | | 8 | | | | 4 | | | | 6 | | | | — | |
| | | | — | | | | — | | | | — | | | | — | | | | 7 | | | | — | | | | 4 | |
| | | | 47 | | | | 47 | | | | 46 | | | | 46 | | | | 38 | | | | 41 | | | | 34 | |
| |
| | | | 1 | | | | 1 | | | | 1 | | | | 4 | | | | 12 | | | | 12 | | | | 7 | |
| | | | 1 | | | | 4 | | | | 5 | | | | 20 | | | | 25 | | | | 23 | | | | 22 | |
| |
EDC Annual Report 2005
119
GLOSSARY OF FINANCIAL TERMS
Actuarial Gains and Losses — Changes in the value of the accrued benefit obligation and the plan assets resulting from actual results differing from those assumed or changes in an actuarial assumption.
Actuarial Valuation (re: Employee Benefit Plans) — An assessment of the financial status of a benefit plan performed by an independent actuary. It includes the valuation of any plan assets and the accrued benefit obligation using estimates of future events that will affect the costs and obligation for employee future benefits.
Basis Point — One one-hundredth of a percentage point.
Canadian GAAP — Canadian generally accepted accounting principles.
Contingent Liability — Potential debt which may become an actual financial obligation if certain events occur or fail to occur. Contingent liability is also referred to as insurance policies and guarantees outstanding.
Credit Risk — Credit risk is the possibility that a loss may be incurred if a counterparty fails to meet its financial commitments.
Derivative Financial Instruments — Financial contracts that derive their value from changes in interest rates, foreign exchange rates, credits spreads, commodity prices, equities, market indexes or other financial measures. Such instruments include futures, interest rate, foreign exchange, equity, commodity and credit derivative contracts.
Facultative Reinsurance — Reinsurance provided on a transactional basis.
Financial Sustainability Ratio — Adjusted operating income (operating income net of debt relief) as a percentage of the year’s average capital and allowances. This ratio provides a measure of the generation of cash from operations relative to capital and allowances.
Foreign Exchange Risk — Foreign exchange risk is the possibility that a loss may result from exchange rate movements.
Gross Administrative Expenses — Administrative expenses before accounting for recovery of expenses related to Canada Account transactions.
Gross Efficiency Ratio — Gross administrative expenses expressed as a percentage of net revenue excluding debt relief.
Gross Loans Receivable — Principal amounts outstanding, including any non-accrued capitalized interest, under existing loan agreements.
Hedge — A risk management practice used to manage interest rate or foreign exchange exposures arising from the normal course of business operations.
Impaired Loans — Loans where, in management’s opinion, there has been a deterioration of credit quality to the extent that the Corporation no longer has reasonable assurance as to the timely collection of the full amount of principal and interest.
Interest Rate Risk — Interest rate risk is the potential impact on the Corporation due to changes in interest rates.
LIBOR — London Inter-Bank Offered Rate — The interest rate at which banks in London are prepared to lend funds to first-class banks.
Liquidity Risk — Liquidity risk is the chance that funds will not be available to meet the Corporation’s obligations.
Market Risk — Market risk is the likelihood of a loss to the Corporation as a result of possible movements in interest and foreign exchange rates.
Net Financing and Investment Income — The difference between the interest earned on assets and interest expense on borrowings.
Net Margin — Net financing and investment income expressed as a percentage of average assets employed.
Net Revenue — Net income excluding the provision for credit losses, administrative expenses and the unrealized fair value adjustment.
Operating Income — Net income excluding the provision for credit losses and the unrealized fair value adjustment.
Operational Risk — Operational risk is the potential loss that may result from human error, internal control weaknesses and system deficiencies.
Projected Benefit Method Pro Rated on Services — An actuarial valuation method in which an equal portion of the total estimated future benefit is attributed to each year of service.
Projected Benefit Obligation — The actuarial present value of benefits attributed to employee services rendered to a particular date.
Return on Equity — Net income expressed as a percentage of shareholder’s equity.
Undisbursed Loan Commitments — A contractual amount under an existing loan agreement that has yet to be advanced to the borrower.
Variable Interest Entities (VIEs) — VIEs are entities in which equity investors do not have the characteristics of a controlling financial interest or do not have sufficient equity at risk for the entity to finance its activities without additional subordinate financial support from other parties.
It’s About More Than Exporting
120
CORPORATE REPRESENTATIVES
Head OfficeExport Development Canada
151 O’Connor Street
Ottawa, Ontario
K1A 1K3
Tel.: (613) 598-2500
Fax: (613) 237-2690
Web site: www.edc.ca
Vancouver Office
Suite 1030, One Bentall Centre
505 Burrard Street, Box 58
Vancouver, British Columbia
V7X 1M5
Tel.: (604) 638-6950
Fax: (604) 638-6955
Edmonton Office
Suite 1000
10180 — 101 Street
Edmonton, Alberta
T5J 3S4
Tel.: (780) 702-5233
Fax: (780) 702-5235
Calgary Office
Home Oil Tower
Suite 606
324 — 8th Avenue S.W.
Calgary, Alberta
T2P 2Z2
Tel.: (403) 537-9800
Fax: (403) 537-9811
Winnipeg Office
Commodity Exchange Tower
Suite 2075
360 Main Street
Winnipeg, Manitoba
R3C 3Z3
Tel.: (204) 975-5090
Fax: (204) 975-5094
London Office
Suite 1512
148 Fullarton Street
London, Ontario
N6A 5P3
Tel.: (519) 963-5400
Fax: (519) 963-5407
Mississauga*
Suite 805
1 City Centre Dr.
Mississauga, Ontario
L5B 1M2
Toronto Office
Suite 810
150 York Street
P.O. Box 810
Toronto, Ontario
M5H 3S5
Tel.: (416) 640-7600
Fax: (416) 862-1267
Montreal Office
Tour de la Bourse
Suite 4520
800 Victoria Square
P.O. Box 124
Montreal, Quebec
H4Z 1C3
Tel.: (514) 908-9200
Fax: (514) 878-9891
Quebec City Office
Suite 1340
2875 Laurier Boulevard
Ste-Foy, Quebec
G1V 2M2
Tel.: (418) 266-6130
Fax: (418) 266-6131
Moncton Office
Suite 400
735 Main Street
Moncton, New Brunswick
E1C 1E5
Tel.: (506) 851-6066
Fax: (506) 851-6406
Halifax Office
Suite 1406
1959 Upper Water Street
Halifax, Nova Scotia
B3J 3N2
Tel.: (902) 442-5205
Fax: (902) 442-5204
St. John’s Office
90 O’Leary Avenue
First Floor
St. John’s, Newfoundland
A1B 2C7
Tel.: (709) 772-8808
Fax: (709) 772-8693
Brazil and Southern Cone
c/o Canadian Consulate General
in São Paulo
Av. das Nações Unidas 12901
Cenu Torre Norte, 16° Andar
CEP 04578-000, Sao Paulo — SP
Brazil
Tel.: 011-5511-5509-4320, ext. 3320
Fax: 011-5511-5509-4275
c/o Canadian Consulate General
in Rio de Janeiro
Av. Atlantica, 1130 5° Andar
22021-000
Rio de Janeiro, RJ
Brazil
Tel.: 011-5521-2295-0391
Fax: 011-5521-2275-5735
China
c/o Canadian Embassy
19 Dongzhimenwai Street
Chaoyang District
Beijing, 100600
China
Tel.: 011-86-10-6532-3536, ext. 3357
Fax: 011-86-10-6532-2754
Mexico
c/o Canadian Embassy in Mexico
Calle Schiller 529
Rincón del Bosque
Colonia Polanco
México, D.F. 11560
Mexico
Tel.: 011-5255-5387-9316
Fax: 011-5255-5387-9317
c/o Canadian Consulate General
in Monterrey
Edificio Kalos
Piso C-1, Local 108-A
Zaragoza 1300 Sur y Constitucion
Monterrey, N.L. 64000
México
Tel.: 011-52-81-8344-3200, ext. 3360
Fax: 011-52-81-8340-7703
Poland
c/o Canadian Embassy
ul. Jana Matejki 1/5
00-481 Warsaw
Poland
Tel.: 011-48-22-584-3240
Fax: 011-48-22-584-3277
Malaysia
c/o Canadian High Commission
17th Floor, Menara Tan & Tan
207 Jalan Tun Razak
50400 Kuala Lumpur
Malaysia
Tel.: 011-(60-3) 2718-3366
Fax: 011-(60-3) 2718-3313
India
c/o Canadian High Commission
7/8 Shantipath, Chanakyapuri
New Delhi 110 021
India
Tel.: 011+91 (11)4178-2000
Fax: 011+91 (11)4178-2607
* Opening June 1, 2006
Ce document existe également en version françhise.
All photography by Martin Lipman unless otherwise indicated.
Printed in Canada.
Pages 1 to 52 printed on FSC-certified Canadian paper.
Pages 53 to 120 printed on Canadian recycled paper.
Vision
EDC will be the recognized leader in providing groundbreaking commercial financial solutions to companies of all sizes, helping them succeed in the global marketplace and create enduring prosperity for Canada.
Values
People
We are the heart and soul of EDC. Our diversity enriches us all. Each one of us deserves respect and makes a difference. Working together is fundamental to our success.
Excellence
We are responsible for excellence in everything we do. We believe in personal accountability and the power of challenging the status quo.
Passion
Initiative and enthusiasm characterize the way we work. We take satisfaction in the quality of what we do. We are here because we want to be here.
Learning
We believe that learning is an invigorating and continuous process. We seek out and embrace personal and professional development, and the invaluable lessons that come from experience.
www.edc.ca