EXHIBIT 3
EXPORT DEVELOPMENT CANADA
2008 ANNUAL REPORT
EDC’s mandate — to support and develop, directly or indirectly, Canada’s export trade and Canadian capacity to engage in that trade as well as respond to international business opportunities — guides everything we do.
Contents
Cover photo: © Ryan McVay/Getty Images
2008 PERFORMANCE MEASURES
| | | | | | | | | |
| | | 2008 Corporate Plan | | | 2008 Results | |
Connecting with exporters and investors | | | | | | | | |
| Customers served | | 3% growth | | | 11% growth – 8,312 | |
| Number of multiple program users | | 15% growth | | | 19% growth – 1,000 | |
| Net Promoter Score | | 64.5 – 67.3 | | | 62.1 | |
Facilitating integrative trade | | | | | | | | |
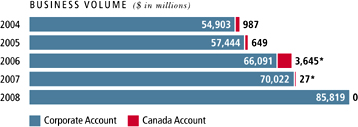
Total business volume 1 | | 7% growth | | | 23% growth – $85.8 billion | |
Volume in emerging markets 1 | | 8% growth | | | 31% growth – $22 billion | |
Volume of foreign investments 1 | | 5% decline | | | 15.5% decline – $4.7 billion | |
Number of investment transactions 2 | | 12% growth | | | 16% growth – 383 | |
Partnership volume1 | | 8% growth | | | 20% growth – $14.1 billion | |
| Number of partnership transactions | | | n/a | | | 4,450 | |
Leveraging the organization | | | | | | | | |
VfM to TCO ratio 3 | | 43:57 | | | 43:57 | |
Employee engagement 4 | | | n/a | | | | n/a | |
Employee retention (%) 5 | | > CB rate | | | 91.83% | |
Sound financial management | | | | | | | | |
| Net income ($M) | | | 543 | | | | 206 | |
| Return on Equity (ROE) | | | 8.6 | % | | | 3.4 | % |
| Gross Efficiency Ratio | | | 25.3 | % | | | 23.3 | % |
| Financial sustainability ratio | | | 8.7 | % | | | 9.1 | % |
| | |
| 1 | | In 2008, EDC began reporting some of its Credit Insurance volume on a net basis, and began reporting its Political Risk Insurance volume net of reinstatements. In order to provide an appropriate year-over-year comparison, all business volume results are shown on a basis consistent with these changes in reporting. |
| |
| 2 | | The 12% growth rate shown in the table incorporates the original Corporate Plan 30% growth targeted for transactions under the Financing and PRI programs, as well as 5% growth under the ARI program. |
| |
| 3 | | Value for Money (VfM) — investments in IT that increase business performance. Total cost of ownership (TCO) — the costs of maintaining core business infrastructure and technology assets. |
| |
| 4 | | Measured on the climate assessment independently reported by Hay. The next survey will be conducted in 2009. |
| |
| 5 | | Conference Board data for financial institutions suggests a rate of 90.4%. |
EDC Annual Report 2008 | 1
2008 PERFORMANCE HIGHLIGHTS
Canadian exports maintain 1 out of 5 jobs in Canada and generate nearly 25% of national income
The business EDC facilitated during 2008 helped generate $57.8 billion of Canadian GDP, about 4.4% of GDP, and supported 572,000 jobs
Canada’s total exports of goods and services reached $522 billion in 2008
EDC served 8,312 customers
EDC facilitated $85.8 billion in exports and investments in 184 markets, a 23% increase over 2007
| | | 4 $22 billion in 145 emerging markets, up 31% over 2007 |
| |
| | | 4 $17.8 billion in exports and investments by small- and medium-sized businesses |
| |
| | | 4 $4.7 billion in Canadian direct investment abroad |
| |
| | | 4 $14 billion done in partnership with financial institutions |
EDC was named one of Canada’s Best Diversity Employers as reported in Maclean’s Magazine, the only Crown corporation out of 25 winning companies
2 | Managing Risk. Maximizing Opportunities.
2008 PERFORMANCE HIGHLIGHTS
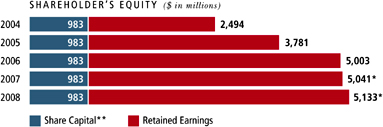
FIVE-YEAR REVIEW
| | |
| * | | Includes activity pursuant to the softwood lumber deposit refund mechanism transactions. |
| | |
| * | | Includes accumulated other comprehensive income. |
| |
| ** | | In late 2008, the Minister of Finance announced that EDC would receive a $350 million injection of new capital in exchange for 3.5 million shares with a par value of $100 each. The additional capital will increase EDC’s credit capacity during this period of global economic uncertainty. The $350 million was received from the Government of Canada in January 2009. |
EDC Annual Report 2008 | 3
Message from the Chair
SERVING EXPORTERS IN TIMES OF NEED
As we report on 2008, I am mindful that the world economy — and EDC’s role within it — has dramatically changed, and that new challenges we can’t yet predict will have arrived by the time you read this.
Last year, we could not have known the depth and severity of the economic recession Canadians would face today. We’re fortunate that EDC entered this global crisis in a strong financial position, backed by more than six decades of proven risk management practices. This experience served EDC well at a time when so many once-trusted financial institutions started to crumble under the weight of the U.S. sub-prime mortgage crisis.
Given our Board members’ diverse make-up, we could offer EDC’s executives a broad range of risk management experience as we worked together to make sense of a financial environment that was changing daily. We rolled up our sleeves to debate tough issues around tight credit markets and plunging industry sectors. Our goals were to minimize the impact on EDC’s customers, manage our own credit exposures and enhance EDC’s capital strength.
In this wavering landscape, what remained rock-solid was our common purpose to support and develop Canada’s much-needed international trade. I believe this shared vision, determination and bank of knowledge underpins EDC’s strength and capacity to serve Canadian business and the people of Canada alike.
As you’ll read in this report, EDC reached or exceeded nearly all the performance targets set out in its Corporate Plan for 2008. We take pride in having grown the number of customers served to over 8,300, an 11% increase over 2007. Our volume of business in emerging markets grew 31% to reach $22 billion. That’s more than a quarter of the $85.8 billion in business volume EDC facilitated, vitally important as exports to the United States fall off.
EDC’s results stem from a well thought-out strategic plan. Early in 2008 the Board provided guidance on EDC’s five-year rolling business plan for 2009-2013. By the time the Board approved the plan in late October, the financial turmoil was in full motion and the economic picture had completely shifted. Clearly, the challenges of long-term planning were exceptional this past year.
Still, EDC’s goals remain valid: connecting even more closely with exporters and investors; continuing to facilitate Canadian participation in integrative trade; and leveraging the full weight of EDC, its capital and its people. Those goals set the stage for success beyond this recession.
As the credit crunch continues so will the heightened demand — and the risks that come with it. Now more than ever, it’s essential the Board remains focused on our stewardship role, especially our active oversight of EDC’s risk management practices.
Much of the Board’s work is about setting the right goals; inspiring the organization to exceed them; upholding the values befitting a public sector corporation; and holding management accountable for performance. We’re proud of EDC’s high standards of ethical business conduct and its commitment to transparency, while respecting commercial confidentiality. We work hard to ensure EDC is aligned with the Government’s trade agenda through our relations with the Minister of International Trade and his key staff. We appreciate the Government’s confidence in EDC by signaling new domestic responsibilities and greater capacity to assist Canadian companies during this credit crisis. We welcome the challenge.
4 | Managing Risk. Maximizing Opportunities.
EDC’s new responsibilities build on the partnerships we’ve developed with our colleagues at the Business Development Bank of Canada (BDC) and Canada’s banks. We’re proud of these vital partnerships because they mean better services for Canadian companies. And they’re working. 2008 saw a 20% increase in EDC-facilitated transactions with our banking partners.
The Board monitored EDC’s participation in the Government’s independent review of the Export Development Act through a special sub-committee. The independent review team’s key recommendations are well aligned with EDC’s new responsibilities.
EDC reached out to more stakeholders last year by web-casting its Annual Public Meeting, held in Ottawa. That event, along with directors’ meetings in Toronto and Calgary, gave our Board members an opportunity to meet and hear from our customers and other stakeholders. EDC’s 2009 Annual Public Meeting will be held in Toronto.
As we conduct our business, we are fortunate to have a strong and diverse Board of Directors. Four highly skilled Canadians became directors this year: Jeff Burghardt of British Columbia, Adam Chowaniec and Ajit Someshwar of Ontario and Donald A. MacLeod of Nova Scotia. They are valuable additions to EDC’s Board. We also appreciate the contributions made by those directors whose terms expired in 2008: J. Bernard Boudreau of Nova Scotia, Lise Lachapelle of Quebec and Rowland W. Fleming, Robert A. Fung and Irene So of Ontario. These remarkable men and women gave generously over their years of service and their hard work has made EDC a stronger institution.
We also appreciate the support we received throughout 2008 from the Ministers of International Trade, including our collaborative relationship with former Minister David Emerson and now with Minister Stockwell Day.
Our real strength is the people who work at EDC. They are a talented team of professionals who don’t waver in the face of this financial crisis. They’re capably led by Eric Siegel and his remarkable executive team focused on doing the right things right. As directors, we’re fortunate to work with the talent spread across the corporation. Their efforts earned EDC membership in the ranks of Canada’s Top 100 Employers for the eighth year in a row. Not to be outdone, EDC became the first Crown corporation to be named Best Diversity Employer in 2008.
On behalf of the Board, I want to thank the EDC team for an exceptional year. We challenged them and they exceeded expectations. Now we ask them to “step it up a notch” in both the domestic and international markets and help Canadian companies get past this tsunami so they can thrive and be ready for whatever comes next.
 Jim Dinning
Chair
EDC Annual Report 2008 | 5
Message to the Shareholder
MANAGING RISK. MAXIMIZING OPPORTUNITIES.
In 2008 we all witnessed global financial turmoil that in scope, complexity and breadth of impact was unprecedented.
What started as a U.S. economic slowdown triggered by the sub-prime mortgage crisis transformed into a full blown credit crunch touching every economy. Virtually every national government has had to take unprecedented measures to bolster their financial systems.
Trade is vital to Canada’s prosperity. Access to credit keeps that trade flowing. As 2008 began we had anticipated lower business volumes as economic conditions softened, slowing export growth. By the last quarter, the extent of the slowdown had created an escalating demand for our services far beyond any prediction, in an environment of far greater risk. Like our customers, we have done our best to rise to the challenge.
EDC’s vision is to be a trusted partner for Canada’s exporters and investors, the financial industry and Canada’s customers worldwide. Our focus is on our customers: to know their business, understand their international needs, connect them with buyers and partners and offer the best financial solutions. We have the capital, financial and human resources, to make that difference.
In 2008 we facilitated trade for more companies than ever — 8,312 firms in 184 markets. That 11% jump is the largest annual increase in our history. Our combined financing and insurance volumes reached $85.8 billion, a 23% increase from 2007. While some of the growth can be explained by higher commodity prices through much of the year and a weaker Canadian dollar at year’s end, it mainly reflects higher demand for EDC programs as liquidity in the private sector tightened.
The results underscore something we always believed at EDC: while our services are needed in good times, they are needed even more when times are difficult.
We were able to meet this surge in large part because of the work begun over the past two years to enhance customer focus and increase productivity. We modeled those changes on the best practices of our customers — investing wisely, and taking advantage of technology to work as efficiently as we can in a competitive world. These changes produced important results. In applying Lean Methodology to our organization, for example, the streamlining accomplished through our Loans Transformation Project reduced issuance times for term sheets by 82% and overall processing times on loans by 60%. The result was increased productivity at every stage of our loans processes. Similarly, the launch of our Customer Relationship Management system helps us better capture and share customer information to serve our customers more effectively with relevant solutions.
Our goal was to increase value to customers. When the credit crunch hit, it meant we were ready with the latest information, our best advice, faster responses, and more effective service delivery. Our internal decision making has improved through greater delegation, engaging all relevant players on a just-in-time basis. This provides customers with greater clarity and consistency while improving the timeliness of decisions in a period of high risk and greater uncertainty.
We are now better aligned with our customers’ processes and their structures. They have changed the way we work and think. Like our customers, we are a business operating on commercial principles. We too are accountable to our shareholder, who measures our success by how successful we make our customers. We will continue to innovate and change in anticipation of customer needs.
A measure of that success is our performance in the eyes of our customers as evidenced by the Net Promoter Score (NPS). A customer’s willingness to recommend is a leading recognized industry measure of satisfaction. EDC already enjoyed a high level in this score, and hoped to raise it further in 2008. While we fell short of our target, our results improved steadily over the year, and we expect our continued investment in service standards and continuing improvement of processes will raise the NPS in 2009.
Risk management is a core competency and at the heart of EDC’s ability to perform its mandate. In a year of market turmoil, new market gaps emerged and EDC was being asked to fill them. We proceeded expeditiously, aggressively, but wisely. EDC’s capability is guided by
6 | Managing Risk. Maximizing Opportunities.
our Credit Risk Management and Capital Adequacy policies supported by extensive investments in processes, technology and people. Asset and portfolio management took on a heightened importance for EDC in 2008 and we actively benchmark our capabilities against international leaders incorporating new tools wherever appropriate.
EDC kept in close contact with Canada’s financial institutions and business and industry associations to identify where EDC capabilities could be better utilized to meet growing needs. In 2008, $14.1 billion of EDC’s business volume was facilitated in partnership with financial institutions, a 20% increase over 2007. In its January 2009 Budget, the Government has broadened our mandate for at least two years to increase our role in domestic financing and insurance to help fill additional gaps occurring under current market conditions. Our efforts will complement those of Canada’s private financial institutions and other Crown corporations like the Business Development Bank of Canada (BDC).
In 2008 we continued to expand our representation across Canada and abroad. We opened new offices in Regina and Windsor, and placed additional small business representatives in Montreal, Halifax and Calgary. We introduced underwriting capability in the regions to bring that process closer to customers and produce faster turnaround times in our approval process. Our investment in new wireless technologies to support our Mobile Workforce Project gives our employees access to corporate systems from anywhere, making frontline staff highly mobile. They now spend the majority of their time on the road with customers.
Internationally, we established representation in Mumbai, Santiago and Abu Dhabi and relocated our South East Asia representation to the region’s financial hub, Singapore. EDC has located foreign representatives in 14 centres in high-growth markets to build relationships with potential buyers of Canadian goods and services. That representation has helped grow our emerging market business volume to $22 billion in 2008, a 31% increase. Much of that was in the high-growth markets of India, Brazil, China, Russia and Mexico. In Brazil in 2008 we saw a 131% increase to $3.4 billion, in China 56% to $2.6 billion and in India 50% to $1.7 billion.
As the global financial crisis escalated in the last months of 2008, EDC was an integral part of the Government’s response. To ensure we would be able to meet our customers’ increasing credit needs, the Government authorized an increase in our short-term borrowing authority from USD 4 billion to USD 6 billion. Additionally, the Government’s November Fiscal Update announced its decision to subscribe for an additional $350 million in share capital in anticipation of a continuing credit crisis.
The Government also involved EDC in its program to assist Canada’s auto sector, including its emergency loans to the Canadian subsidiaries of Chrysler and General Motors through the mechanism of the Canada Account. In 2008, EDC provided over $4.2 billion in support to the sector through its financing and insurance products and services.
In 2009 the Government will proceed with the Parliamentary phase of its legislative review of the Export Development Act, following last year’s public consultations. EDC’s business now contributes to 14% of Canada’s total exports and direct investment abroad, generates an estimated $57.8 billion in Canadian GDP, and supports an estimated 572,000 jobs. It is a highly appropriate time for the Government to engage stakeholders in a discussion of our performance and our potential to contribute more, not only through the lens of the present economic situation, but for the long term.
I would like to thank our Chair, Jim Dinning, and our Board for their commitment and guidance, our shareholder for its support, and of course our many customers for the privilege of working with them to develop solutions in a very volatile year.
I also thank the employees of EDC for the exceptional knowledge, commitment and passion they brought to the workplace to help our customers succeed. While Canadian companies will find 2009 extremely challenging, we believe there are excellent opportunities for growth and significant business to be won. We will be there to support their success — managing their risks, and maximizing their opportunities.
 Eric D. Siegel
President and CEO
EDC Annual Report 2008 | 7
Message from the Chief Economist
EXPORTERS’ PROSPECTS NOT EXTINGUISHED BY TRYING TIMES
Canadian exporters and investors were harshly affected by the global economy in 2008.
Economic conditions deteriorated steadily throughout the year, and the severity of the downturn became fully evident when financial markets, and demand, collapsed in the fall. By year-end, it was clear that a deep recession was underway, further eroding confidence among lenders, exporters, and investors.
The deep and rapid descent was extraordinary. At the beginning of the year, optimists believed signs of trouble in the United States were localized, and economic data from early months of 2008 seemed to confirm that the rest of the world was decoupling from its sputtering growth engine. Commodity prices soared and central banks the world over were preoccupied with inflationary pressures. However, 16 years of virtually uninterrupted global expansion came to a halt in the second half of the year.
Triggering the crisis was the bursting U.S. housing bubble and the decline in U.S. consumer spending that accompanied it. As the number of mortgage defaults reached critical mass, the toxicity of investment products derived from the bundling of high-risk mortgages became apparent. Investors were saddled with substantial bad assets, and a shocking number of respected corporations and financial institutions were crippled by their exposure. Capital quickly became constrained, further increasing pressure on companies using credit to finance their operations and growth. Needing more credit than was available from private sector financial institutions, Canadian exporters and investors turned to EDC in greater numbers than ever.
Beyond the credit crunch, the global malaise hit Canadian exporters in other ways. Removing the effect of wild swings in prices, merchandise exports fell 6%. Commodity prices were extremely volatile, reaching unprecedented heights at mid-year but crashing towards year-end, driving uncertainty about prices of inputs and inflation, and raising concerns that speculative investing was masking estimates of true demand. Where commodities go, the Canadian dollar follows, and after weathering five years of relentless Canadian dollar appreciation, exporters saw the dollar drop late in the year, a result that was also influenced by a resurgent U.S. dollar.
In response to the crisis, governments around the world announced hefty fiscal stimulus programs and accepted short-run deficits as unavoidable. Shared concern about the marked deterioration of the global financial system led to massive and coordinated liquidity injections. At the same time, central banks sharply reduced interest rates at the tail end of 2008 to historically low levels.
8 | Managing Risk. Maximizing Opportunities.
Time will tell just how much bottom-line impact these measures will have over the next two years. Much depends on the willingness of consumers and businesses to spend and borrow, and on the willingness of financial institutions to lend. Given global conditions, a further 10 to 15% drop in Canadian merchandise exports is forecast for 2009, followed by modest growth in 2010. Most industry sectors will follow this near-term pattern.
In the current environment, the sheer number of opportunities for Canadian exporters and investors is lower. However, opportunities do exist on a few fronts.
First, Canadian exporters have a much lower dollar. The loonie is likely to stay in the USD 80 to 85 cent level for the next two years, which will have a direct effect on profit margins. Second, although lower, the Canadian dollar will still be high enough to help companies pursue globalization initiatives such as the creation and expansion of global supply chains and distribution networks. Third, input costs, especially for primary goods, will be lower.
Fourth, sales prospects are grim for Canada’s traditional markets, such as the United States, which are experiencing the worst of the global slowdown. However, non-traditional emerging markets are still a good bet. Although affected by the general recession, growth in these markets will still outperform the average. Add modest market share gains, and Canadian export growth prospects look decent.
Finally, governments worldwide have announced intentions to dedicate a significant portion of their stimulus spending to infrastructure development. In some cases, grand-scale infrastructure projects are occurring in economies that have very little domestic production to draw on. As such, these projects do not simply require construction and engineering services companies, but also a wide array of goods and services that could well be supplied by Canadian enterprises. Many Canadian companies have the needed products, knowledge, and experience to participate in the substantial near-term demand generated by these projects.
The next two years will hold many challenges for Canadian exporters. The risks will be higher, and exporters will not be able to rely on traditional markets. Prospering in this environment almost certainly requires breaking new ground.
In normal times, necessity is often the mother of invention. It could well be said that crisis is the mother of transformation; heeding this adage will be critical to short-term success.
 Peter G. Hall
Vice-President and Chief Economist
EDC Annual Report 2008 | 9
Risk-taking is integral to EDC’s mandate to help expand Canada’s international trade. The financial and economic turmoil of 2008 called on EDC to broaden its risk management approach, sharpen its effectiveness and stretch its risk capacity as never before.
Many businesses thrive on risk. But when U.S. and global financial conditions started spiraling downward at an unprecedented pace in fall 2008, the risk became more than businesses bargained for — often more than they could bear.
Before the U.S. sub-prime mortgage crisis led to a series of financial institution failures, the U.S. financial sector was one of the most dependable in the world. As the situation worsened, financial institutions everywhere were managing greatly increased risks and doing far less lending. While private sector financial institutions were retrenching, Canadian companies continued to need credit to manage their operations and carry out their growth strategies. A record 8,312 companies used EDC to help them manage their credit risk during the unusual circumstances of 2008.
EDC’s 64 years of prudent risk management practices and steady revenue growth, especially when Canada’s economy was booming, allowed it to enter the downturn in a strong financial position. In essence, EDC had the cash and capabilities to help Canadian firms cope with the latest set of market challenges. In addition, EDC’s exposure to some of the hardest-hit financial institutions was minimal and EDC did not experience major losses as a result of any defaults in 2008.
10 | Managing Risk. Maximizing Opportunities.
The ongoing recession brings to the forefront the importance of EDC’s risk management expertise and strategies. EDC has the policies, procedures and knowledge in place to regularly monitor, report on and manage our loan and credit insurance risks, market risks (treasury-related investments) and capital position in a timely way.
In 2008, those policies and practices continued to evolve, particularly in two key areas: managing our mounting volume of transactions more efficiently without compromising oversight, and setting the groundwork for a more proactive approach to asset management for the difficult times still to come.
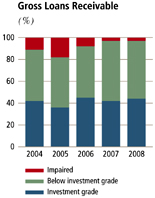
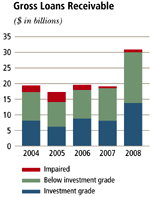
To illustrate, our Risk Management Office (RMO) handled 968 transaction approvals in 2008, nearly a third more than in 2007. This represents $62 billion of financing and insurance volume that required credit authorization, up from $44 billion the year before. The risk profile of transactions also increased, reflecting the deteriorating environment — 64% of loans and 34% of accounts receivable insurance policies approved in 2008 were in higher risk categories (based on borrowers or buyers with lower credit ratings).
Risk management is about constant balance. It’s about managing the amount of risk we take on and the capacity to carry that level of risk for a greater number of clients, while maintaining enough capital to serve future clients. It means taking a measured approach to existing risks and anticipating what could go wrong in the future.
– Derek Layne
EDC, Vice-President and Chief Risk Officer,
Risk Management Office
Over the past two years, EDC improved its ability to handle the increased workload on financing deals through what EDC calls the Loans Transformation Project. Applying a step-by-step diagnosis and streamlining of the corporate lending process, EDC accelerated loan turnaround and customer response times by up to 80%, compared to 2007.
On the insurance side, EDC also tiered transactions according to risk level and pushed more decision-making closer to the working level, within defined parameters. Overall, this freed up time for senior management to focus on the more complex financing, insurance, contract bonding and guarantee activities.
As a result, EDC can respond more quickly to customers in this volatile environment. In achieving these results, EDC retained the integrity of its risk management process, ensuring that at least two pairs of eyes are on every deal.
In 2008, EDC also started to see the impact of the credit crunch and economic slowdown on its existing portfolios and expects greater challenges ahead. For example, EDC experienced a 75% increase in requests for loan changes and extensions (waivers, amendments and consents to terms and conditions) by existing borrowers. It also saw an increase in impaired borrowers from 33 to 58. Insurance claims were up 73% in value.
In anticipation of further challenges to loan and insurance portfolios, RMO made process changes in 2008 to ensure its people are deployed as needed to where they can have the greatest impact.
EDC has also put in place a new process and systems to manage its credit portfolio and capital more effectively. This means EDC will be better able to anticipate the sectors and companies where new risks could emerge, track how loans are trading in secondary markets and do more hedging — selling or swapping — of EDC ‘s large credit exposures.
In addition, EDC executives are meeting regularly with their counterparts in Canadian-based banks to develop new ways to help viable Canadian businesses export and invest more abroad. Through greater public-private cooperation and risk sharing, EDC can help sustain Canada’s essential global trade activities, even in these turbulent times.
EDC is as well-prepared as possible under the circumstances to manage increasing levels of risk — in its own portfolio, with its financial partners and for its customers.
EDC Annual Report 2008 | 11
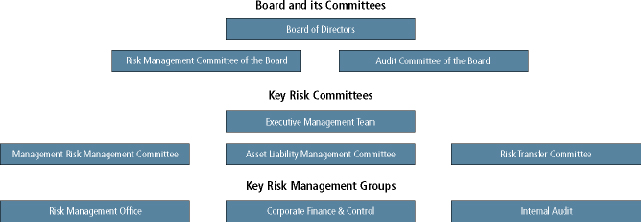
RISK MANAGEMENT OVERSIGHT
Essya Ferjani
Special Risks Manager, Special Risks
Special Risks maximizes recovery on EDC’s current portfolio of distressed loans and guarantees.
“We are a small group of experienced lenders who manage the most challenging assets in EDC’s portfolio. We have an extensive network of global financial contacts who help each other understand and mitigate the risks of distressed assets. In 2008, we were able to rapidly assess the needs of external parties, which is key to finding a resolution to an impaired loan/guarantee — either by restructuring the debt, selling the asset or managing the loan through the bankruptcy process. We are now starting to see a dramatic increase in borrowers who need to have their financial profile restructured.”
The vast majority of EDC’s employees participate in some form of risk management, whether they are assessing commercial, technical, environmental or country risk for EDC or our customers. At an organization-wide level, EDC’s Risk Management Office (RMO) manages our overall financial risk, including timely reporting of major exposures to EDC’s management and the Board. RMO establishes the credit and market risk policies and strategies that maintain sufficient capital and the solvency of EDC. Here, we look at a small cross-section of the expertise, responsibilities and challenges of managing financial risk today.
David Stevenson
Loan Portfolio Manager, Asset Management (Equipment & Services)
Asset Management supervises EDC’s loan and guarantee assets, after their first disbursement, using strategies that mitigate the risks, preserve capital and optimize the portfolio, ensuring further risk capacity to support EDC’s mandate.
“In 2008, we saw a large increase in requests to restructure loan agreements across the entire portfolio, especially among automotive parts makers and our small business clients. In many cases, we supported increased flexibility to allow for companies to restructure or to give them more time to pay. As risk continues to increase across our portfolio, many of our clients have to renegotiate their existing loans. Just managing the workload is one of the biggest challenges facing us in 2009.”
12 | Managing Risk. Maximizing Opportunities.
Viren Joshi
Senior Corporate Risk Manager, Credit Authorization
Credit Authorization works with EDC’s Business Teams to provide independent confirmation of risk acceptability consistent with our risk appetite and policy guidelines. Credit Authorization also shares its expertise on best practices from its broad sector perspective.
“At the beginning of 2008, transactions were being underwritten in the market with longer tenors and weaker structures. Refinancing risk was not a key concern with so much access to capital globally. It was a borrower’s market. By the end of the year the trend had reversed to a lender’s market; deals were being structured more prudently. Through daily interactions with the business teams, our credit authorization group was able to help our colleagues understand the current credit market and deal with difficult transactions. This integration with the underwriting function was key to our success in 2008.”
David Ford
Director, Market Risk Management
Market Risk Management enhances EDC’s risk-taking capacity by actively managing market and treasury credit risk, including analyzing treasury counterparties and setting credit limits. EDC’s goal in managing market risks (liquidity, interest rate and foreign exchange risks) is to ensure the financial sustainability to fulfill our mandate.
“Like all market investors, EDC faced increased risk in 2008 as many top-rated U.S. institutions in which we had investment holdings or other exposure experienced serious credit problems. In this scenario, EDC was served well by the diversification in our portfolio of risks, the different sources and methods we used to determine credit risk and our conservative risk management practices, including collateral requirements. This strategy means that we were not heavily exposed to the most troubled institutions in 2008 and we are well positioned for any surprises going forward.”
Robert Kelly
Senior Risk Transfer Manager, Risk Transfer
Risk Transfer implements strategies and transactions that transfer risk in EDC’s commercial loan portfolio to other counterparties through the secondary market. EDC may reallocate risk for reasons such as mitigating asset-specific risks, strengthening the portfolio, preserving capital or increasing risk capacity.
“In previous years we were able to mitigate our exposure to key sectors, such as aerospace, by insuring or selling portions of our loans to the secondary market (hedging). Our transfer activity was greatly reduced last year because the cost of executing our hedging strategies increased dramatically. As a result our efforts were mainly focused on developing a framework for future hedging so that we can act quickly when the right opportunities arise.”
EDC Annual Report 2008 | 13
MANAGING ACCELERATED RISK IN THE AUTOMOTIVE SECTOR
In 2008 the automotive sector reached an uncommon depth of distress after more than a year of steady sales declines. In the midst of this turbulence, EDC provided $4.2 billion in financing and insurance services to some 595 auto parts and tooling suppliers.
By the end of 2008, the slump in the U.S. automotive sector had reverberated throughout the North American automotive industry and abroad. Declines in sales of cars and light trucks reached a massive 18% in the U.S. In Canada, the overall decline was 1% for 2008, but results were far worse in the latter months of the year and the slide is not abating.
The global credit crunch has been particularly hard on this industry, reflected in severely reduced financing and credit insurance being offered by banks and insurers worldwide. In this environment, EDC clearly demonstrated its commitment to Canada’s automotive sector — mainly Tier 1, 2 and 3* auto parts and tooling suppliers to the Big Three (GM, Chrysler and Ford) and other original equipment manufacturers (OEMs) — by providing $4.2 billion in commercial loans, guarantees and credit insurance last year to some 595 customers.
EDC maintained existing insurance coverage, and continued to do new business where it made sense. EDC’s Transportation Credit Insurance team assisted policyhold-ers through various buyer bankruptcy or workout arrangements. Similarly, EDC’s Financing team was swamped with requests for increased and new financing, while Asset Management was kept busy restructuring many existing loans, mainly to Tier 1 and 2 players. This often meant amending loan terms and conditions or giving customers more time to repay.
To protect both our ability to serve these companies now and in the future, and our fiscal responsibility to Canadian citizens, EDC reinforced two key areas of its automotive risk management strategy in 2008:
More collaboration and monitoring
EDC is in constant contact with bankers, insurers and brokers, exporters and automotive industry experts to monitor the credit situation as it happens. EDC’s management reviews automotive transactions and risk strategy for the sector on a weekly basis.
EDC’s ability to stretch its support to exporters also stems from the increased integration of our teams involved in the automotive value chain. The collaborative approach between risk management, financing, insurance and business development lets us see the whole picture and do more for our customers.
| | |
| * | | Tier 1 — design and manufacture of large sub-assembled vehicle parts and sections. |
| |
| | | Tier 2 — producer of vehicle parts, including minor sub-assembly. |
| |
| | | Tier 3 — engineered materials & special services, from sheet-steel to surface treatments. |
14 | Managing Risk. Maximizing Opportunities.
More strategic use of capital
By thoroughly understanding the sector, predicting potential future problems, and tracking our exposure to the sector as a whole, EDC can deploy our expertise and capital more strategically.
For example, EDC recognizes that many suppliers are strategically important to the supply chain and therefore have good leverage with their buyers. Those companies have the potential to successfully transition through the industry’s current turmoil with EDC’s insurance and other financial backing.
We also worked with our policyholders to ensure that existing coverages continued to meet their needs and any surplus coverage identified was re-deployed to other suppliers.
With these strategies in place, EDC was able to take on more risk for our customers and financial partners.
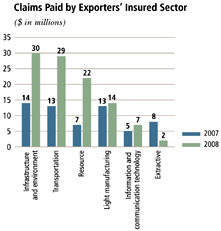
In 2008, EDC saw its policyholders throughout the auto sector reporting more overdue invoices and bankruptcies. This translated into a five-fold increase in insurance claims.
EDC’s risk management advice and claim payments have helped several policyholders avert bankruptcy, reducing the domino effect in the supply chain. For example, when a large U.S. auto parts maker went into bankruptcy protection last year, several Canadian tooling policyholders had millions of dollars in accounts receivable outstanding. EDC’s insurance proceeds buffered the smaller suppliers from the short-term impact of their buyer declaring bankruptcy. Several of our policyholders also placed liens on the tooling equipment, which gave them more leverage to maximize their recoveries.
In some cases, by working closely with the customer, EDC was able to assist in recovering not only the losses on claims already paid to the policyholder, but also the policyholder’s 10% uninsured portion. That’s a material amount for most companies in the automotive supply chain.
The situation in the automotive sector will remain fluid in 2009. Working together, EDC’s various risk assessment, portfolio management and business sector teams on both the credit insurance and financing side will continue to monitor the volatile situation daily and examine each exporter’s situation individually. This will allow for continued flexibility and prudent risk management.
EDC Annual Report 2008 | 15
OPERATING PRINCIPLES
RESPECTING INTERNATIONAL AGREEMENTS
EDC conducts its business in a manner that is respectful of applicable international agreements to which Canada is a party, consistent with its Corporate Social Responsibility commitments, and ensures the sound financial management of its activities.
EDC supports business on terms consistent with and respectful of Canada’s international obligations related to trade. These include the World Trade Organization’s (WTO) Agreement on Subsidies and Countervailing Measures and the Organization for Economic Co-operation and Development’s Arrangement on Officially Supported Export Credits (OECD Arrangement).
In 2008 we marked the first year in the implementation of the revised OECD Sector Understanding on Export Credits for Civil Aircraft under the OECD Arrangement and EDC was actively involved in follow up discussions related to the monitoring and implementation of the agreement.
EDC also supported OECD discussions that led to the adoption of principles and guidelines to promote sustainable lending practices in the provision of official export credits to low-income countries. An agreement was concluded in April 2008, and EDC put in place internal procedures to ensure the provisions were implemented.
As a member of the OECD Export Credit Group, EDC participates in the ongoing monitoring and reporting on the implementation of the OECD Recommendation on Bribery in Officially Supported Export Credits. This Recommendation strengthens international efforts to combat bribery in export contracts and supports Canada’s commitment to combat bribery in international transactions as per the OECD’s 1997 Convention on Combating Bribery of Foreign Public Officials in International Transactions.
2008 also marked the first year of implementation of the revised OECD Recommendation on Common Approaches on Environment and Officially Supported Export Credits, which was adopted in 2007. The revised Recommendation, which is more aligned with EDC environmental review practices, provides a more level playing field for Canadian exporters in the area of export credits. EDC also participates in the ongoing reporting on the implementation for the OECD Common Approaches on Environment. The next review of the Common Approaches is scheduled for 2010.
The current text of the Sector Understanding on Export Credits for Nuclear Power Plant (NSU) under the OECD Arrangement on Officially Supported Export Credits was adopted in the 1980s. Given the renewed interest, OECD participants identified a need to update the NSU. Initial discussions on the NSU took place in late 2008 and negotiations are expected to conclude in 2009. EDC is working closely with The Department of Foreign Affairs and International Trade (DFAIT) and the Department of Finance to develop Canada’s position for this negotiation.
EDC is actively involved in OECD discussions related to the monitoring and implementation of the OECD Arrangement on Officially Supported Export Credits. In 2008 EDC was actively involved in discussions on the development of a mandate for the OECD Working Group on Premia to give a new impetus to these negotiations with a view to achieving a breakthrough in 2009. Since the adoption of this new mandate, EDC has been promoting compromises among participants. The achievement of an agreement on buyer risk premia will provide a more level playing field for our exporters, which is critical in times of financial crisis where officially supported export credits are playing an increasingly important role in supporting international trade flows.
EDC is a member of the Berne Union, whose mandate is to foster international acceptance of sound principles of export credit and foreign investment insurance. In October 2008, EDC hosted the 65th Annual General Meeting of the Berne Union in Banff, Alberta. The event provided a timely opportunity for Berne Union Members to discuss the financial crisis and members’ own experience. This was also the first Berne Union meeting designed to minimize the environmental footprint of the event, and as such, discussions also focused on how members can minimize their impact on the environment.
16 | Managing Risk. Maximizing Opportunities.
CORPORATE SOCIAL RESPONSIBILITY
At EDC, Corporate Social Responsibility (CSR) is an operating principle that guides all of our business decisions and enables us to build public confidence and trust in what we do to facilitate Canada’s international trade. Our commitment to CSR is rooted in five pillars: business ethics, the environment, transparency, community investment and organizational climate.
In 2008, we focused on refining our structures, systems, practices and training in order to strengthen and reinforce our commitment to CSR. Specifically, we created a distinct Corporate Responsibility team and established a new senior role of Chief CSR Advisor. The role of the team is to support all business teams throughout the corporation to ensure our commitments to CSR are fulfilled.
The Corporate Responsibility team also developed a new strategy to further embed CSR principles into EDC’s corporate and business strategy. In developing this strategy we sought external expertise from various sources including Dirk Matten, Hewlett Packard Chair in CSR at the Schulich School of Business.
CSR Advisory Council
Our CSR Advisory Council also played a pivotal role in advancing our CSR practices throughout 2008. The Advisory Council, comprised of accomplished Canadians with diverse backgrounds representing the private sector, academia and civil society, guided us on best practices on key CSR issues such as the development of a statement on human rights, the consultation process for a review of our environmental policy, support for environmental technologies and CSR practices in emerging markets.
With Maureen O’Neil, former President of the International Development Research Centre, serving as Chair, the Advisory Council also included Dr. Randy Gossen, Vice President, Safety, Environment and Social Responsibility at Nexen Inc.; Jean-Claude Villiard, a retired public servant currently serving as an Associate Professor at the École nationale d’administration publique; Ed Waitzer, Senior Partner at the law firm Stikeman Elliott LLP; David Runnalls, President and CEO of the International Institute for Sustainable Development; and David Zussman, Jarislowsky Chair in Public Sector Management, University of Ottawa.
Statement of Commitment on Human Rights
In accordance with its social responsibilities as a Crown corporation and as a good corporate citizen, EDC values and promotes the protection of internationally recognized human rights, consistent with the policies of the Government of Canada. In April 2008, following recommendations by the UN Special Representative of the Secretary General on Human Rights that outlined a role for Export Credit Agencies, EDC released a Statement of Commitment on Human Rights. The statement defines EDC’s current practices in considering human rights issues associated with potential business:
“EDC values human rights and provides its financing and insurance services with a view to the promotion and protection of internationally recognized human rights. Investment projects may have potentially significant impacts on the human rights of individuals. EDC recognizes that financial institutions must endeavour to assess the potential for adverse human rights outcomes for individuals directly affected by such projects.” For more information, please visit www.edc.ca/ethics.
Forum on Socially Responsible Mining in Peru
While emerging markets present many opportunities for Canadian companies, they also present higher levels of risk with respect to corporate social responsibility. In May 2008, EDC hosted a Forum on Best Practices for Socially Responsible Mining in Peru. The forum encouraged the discussion of divergent views and the development of networks among stakeholders, including representatives from governments, financial institutions, NGOs and the private sector. The objective was to help EDC make informed decisions on how best to conduct business in challenging markets to the benefit of all stakeholders, including local communities. Moving forward, EDC will continue the dialogue with a variety of stakeholders in order to refine its understanding of the challenges facing sustainable mining in difficult environments.
EDC Annual Report 2008 | 17
Operating Principles
Evolving environmental policies and practices
Our Environmental Policy, introduced in 2005, outlines the environmental review processes that are applied to EDC’s financial products and the markets we serve across all industry sectors to ensure our environmental commitments are fulfilled. Since that time, our environmental procedures and policies have evolved significantly. We initiated a review of the Environmental Policy in the fall of 2008, which will include a comprehensive public consultation process in the first half 2009. We plan to introduce a revised Policy later in 2009. Key issues for discussion throughout the consultation process will include project benchmarking standards, community engagement, project conditions and monitoring, disclosure practices, climate change and EDC’s environmental footprint. More information is available at www.edc.ca/environment.
Conducting business in an ethical manner
EDC’s Code of Business Ethics and Code of Conduct guide the actions of EDC and its employees, officers and directors to ensure they continue to live up to EDC’s reputation as an ethical organization. The codes define EDC’s obligation to ethical business conduct, the environment, prohibitions against bribery and corruption, promoting the protection of human rights, avoiding conflicts of interest and maintaining confidentiality of information. EDC requires that directors and employees be familiar with and adhere to the standard of conduct reflected in the Code of Conduct and sign an annual Statement of Compliance to this effect.

In the first year of our partnership with CARE Canada, EDC will assign volunteers to provide business development assistance to small businesses in Peru. Future assignments might see EDC staff assisting in various CARE Canada-sponsored micro-financing projects, such as helping small agricultural enterprises develop their business and expand into larger supply chains.
Transparency
Public accountability guides the Corporation’s reporting and Communications Policy. We disclose a wide range of information on our services, programs and activities and make this information publicly accessible through our website, publications, correspondence and an ongoing program of consultation and engagement with customers, partners and stakeholders.
Under our Disclosure Policy we provide, ex ante, details on our Category A projects (those likely to have significant, adverse environmental impacts), as well as environmental information for Category B projects (projects that are less likely to have adverse affects), such as the type of information we review and the environmental standards we apply. For information on EDC’s disclosure practices and the disclosure of transactions, visit www.edc.ca/disclosure.
The Access to Information Act (ATI) makes documents under EDC’s control accessible to the public, subject to exemptions provided under ATI and the Export Development Act. In 2008, EDC processed 37 ATI-related requests.
EDC also produces an annual Corporate Social Responsibility Report, available at www.edc.ca/csr.
EDC’s commitment to the community
In 2008, EDC shifted community investment initiatives towards global projects and increased employee involvement in these initiatives.
Partnership with CARE Canada
In October 2008, EDC announced that it was sponsoring a four-year community investment partnership with CARE Canada for small business enterprise development and micro-financing related projects in emerging markets. EDC has long been an advocate for community investment, and, through this initiative, has broadened its notion of “community” by extending the scope of its community involvement to those markets where we conduct business.
In mid-2009, EDC volunteers will be assigned to CARE projects, beginning in Peru. Projects could include developing marketing plans for small exporters, developing a risk assessment program for a micro-finance lender, or improving information technology systems, among others. Given CARE Canada’s enterprise development initiatives in emerging markets and EDC’s own skill sets and mandate, this partnership is an ideal alignment of expertise to contribute to poverty alleviation through business development.
Local and national communities
Our employees continue to make a contribution to local and national communities. EDC supported employee efforts to organize our Government of Canada Workplace Charitable Campaign, which raised $249,350. Employees also participated in the United Way Day of Caring™, where EDC employees participated in local community development activities.
18 | Managing Risk. Maximizing Opportunities.
Education & Youth Employment Strategy
Our Education and Youth Employment (EYE) Strategy focuses on educating and building knowledge of international business issues among Canadian students and other stakeholders. The goal of the program is to prepare Canada’s youth for careers in international trade. Scholarships, research and trade education are the principal tools for delivering on this strategy. In 2008, we awarded 30 scholarships, 25 of which went to undergraduate university students pursuing a career or furthering their studies in international business, and five new scholarships to students enrolled in combined environment and business studies. The new emphasis on combined studies brings attention and support to Canada’s future capacity to engage in international trade in an environmentally responsible manner. We work with partners such as AIESEC and the Forum for International Trade Training (FITT) to increase knowledge of international trade among Canadian university students. More information about the EYE Strategy is available at www.edc.ca/youth.
EDC Research Chair in Environmental Finance
In 2008, the Faculty of the Environment at the University of Waterloo and EDC announced the creation of a new research chair, funded by EDC, to identify financial trends, tools and practices that will help businesses develop “green” technologies, services and market opportunities. The EDC Research Chair in Environmental Finance, based in Waterloo’s Centre for Environment and Business, will explore financial tools such as carbon financing and clean energy funds.
SOUND FINANCIAL MANAGEMENT
| | | | | | | | | | | | | |
| | | 2008 Plan | | | 2008 Results | | | 2009 Plan | |
Measure | | | | | | | | | | | | |
| Net income ($ millions) | | | 543 | | | | 206 | | | | 148 | |
| Return on equity % | | | 8.6 | | | | 3.4 | | | | 2.4 | |
| Gross efficiency ratio % | | | 25.3 | | | | 23.3 | | | | 27.6 | |
| Financial sustainability ratio %* | | | 8.7 | | | | 9.1 | | | | — | |
| | |
| * | | Beginning in 2009, FSR will no longer be used by the Corporation as a performance ratio. |
Through sound financial management, we ensure that we have an adequate capital base to fulfill our mandate now and in the future. Operating on a self-sustaining basis with no annual appropriations from Parliament, we achieve self-sustainability by obtaining adequate return for risks taken, containing costs and appropriately managing risk. This approach has enabled us to support more than $770 billion in exports and investments from the approximately $1 billion in share capital* invested in the Corporation by the Government of Canada since 1944.
We track our financial performance in four key performance measures: net income, return on equity, gross efficiency and financial sustainability ratios.
Net income in 2008 of $206 million was $337 million below the 2008 Corporate Plan. The lower net income was primarily due to an increased provision for credit losses and higher claims-related expenses reflecting the impact of the difficult economic environment on our financing and insurance portfolios. In addition, we received no debt relief in 2008, whereas the Plan assumed $124 million. The reduction in net income had a corresponding impact on the return on equity ratio, reducing the ratio to 3.4% versus the Plan amount of 8.6%
| | |
| * | | In late 2008, the Minister of Finance announced that EDC would receive a $350 million injection of new capital in exchange for 3.5 million shares with a par value of $100 each. The additional capital will increase EDC’s credit capacity during this period of global economic uncertainty. The $350 million injection was received from the Government of Canada in January 2009. |
EDC Annual Report 2008 | 19
PERFORMANCE VS OBJECTIVES
OBJECTIVE 1: CONNECTING WITH EXPORTERS AND INVESTORS
| | | | | | | | | | | | | | | | | |
| | | 2007 Result | | | 2008 Plan | | | 2008 Result | | | 2009 Plan | |
Performance measures | | | | | | | | | | | | | | | | |
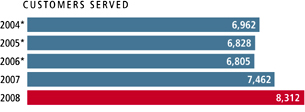
| Customers served | | | 7,462 | * | | 3% growth | | | 11% growth (8,312) | | | Maintain | |
| Number of multiple program users | | | 841 | ** | | 15% growth | | | 19% growth (1,000) | | | 10% growth | |
| Net Promoter Score*** | | | n/a | | | | 64.5 – 67.3 | | | | 62.1 | | | | 61.1 | |
| | |
| * | | In 2008, we revised the calculation of Customers served to include the number of customers who may have been acquired in previous years, but who continue to be served by the Corporation through, for example, disbursements, or policy coverage. To allow for an appropriate year-over-year comparison, the 2007 Customers served result has been shown on a basis consistent with 2008. |
| |
| ** | | For 2007, the number of multiple program users reported was 513. In 2008, we revised the calculation of MPU to include the total number of active policies or products used by a customer, regardless of the start date. Previously, MPU scores were calculated based on products initiated within one calendar year. |
| |
| *** | | New measure introduced in 2008. |
Connecting with exporters and investors means that we put our customers at the centre of everything we do, focus all of our finance and risk management expertise and our sector and market knowledge on their needs.
In 2008, we faced higher demand than we forecast across all our programs and services as constraints on liquidity in the private sector drove more companies to seek our assistance. EDC served 8,312 customers in 2008, 11% more than 2007.
To better serve our customers in Canada and around the world, we broadened our network of Canadian and international representatives, improved our processes and account management and worked with our private sector partners to bring Canadian companies the services they need. These efforts helped us to increase our customers’ knowledge of the full breadth of our products and services. As a result, the total of multiple program users — customers that use more than one product or service — increased by 19% over 2007 to 1,000.
In 2008, we introduced a new customer satisfaction measure, the Net Promoter Score (NPS), which replaced Customer Service and Customer Value indices. NPS measures the likelihood that our customers would recommend EDC to other businesses; the results provide a better reflection of how customers perceive the value that EDC brings to their business. Based on monthly surveys, NPS provides us with ongoing feedback on how well we are connecting with customers and how improvements to our products and services are perceived by them. We did not meet our projected target for the initial year of this measure, however, monthly results did show progress towards the end of the year. One of the tools we are using to improve our connections to customers is C3, the technology that supports our Customer Relationship Management system. Phase 1 of C3 was launched in 2008 and is providing employees with a more effective means to capture, share and translate customer intelligence into relevant solutions.
Strengthening our representation in Canada and internationally
Our network of offices across Canada allows us to connect and respond locally to our customers’ needs. This is particularly relevant for our mid-market customers. In 2008, the Commercial Markets & Small Business team deployed 10 new account managers, opened new offices in Regina and Windsor, and placed additional small business representatives in Montreal, Halifax and Calgary, bringing our regional representation to 90 staff located in 14 offices across the country.
20 | Managing Risk. Maximizing Opportunities.
| | |
| * | | Figures prior to 2007 were not restated. |
We also expanded our regional underwriting capability by placing local underwriters in Montreal, Mississauga and Vancouver, in order to address customers’ underwriting needs more effectively on a local basis.
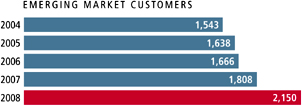
EDC has 14 permanent representations located in the world’s fastest growing emerging markets, who are charged with developing relationships with foreign buyers of Canadian goods and services. We connected 2,150 Canadian companies to opportunities in these markets in 2008, 19% more than in 2007.
We added to our network of representations in 2008, placing representatives in Mumbai, Santiago and in Abu Dhabi, to serve the Gulf Cooperation Council (GCC). We announced a representation in Peru that will be established early in 2009, and moved our representative in Kuala Lumpur to Singapore, a key financial hub in Asia. We also established a representative in Beijing to focus exclusively on EDC’s portfolio of equity investments in Asia. We will continue to expand this international network, and by 2010 we plan to have 20 foreign representations in place.
A strong network of partners
EDC has built extensive relationships with a wide range of partners from the private and public sector to better serve the needs of our customers. By leveraging this network in 2008, we were able to enhance market capacity in support of trade and investment, and share information and expertise related to international business.
National Industry Stakeholder Panel: Our National Industry Stakeholder Panel brings together 18 key national business and trade association leaders from across Canada to discuss trade and investment challenges facing business and provide us with feedback on their needs. In 2008 the panel discussed what Canadian companies will need to succeed under the intensifying pressures of global competition, and how EDC can continue to respond to these changing needs.
Partnering with the Public Sector: EDC continued to work with partners from the Government of Canada to raise awareness regarding the services available to Canadian companies. We strengthened our partnership with DFAIT’s Trade Commissioner Service (TCS) through training sessions, providing information about EDC, our solutions and how they can benefit Canadian companies. We also launched the Trade Commissioner Service Partner website to provide a more streamlined process for Trade Commissioners to access information about EDC’s products and services while receiving priority service on their requests.
In 2008, we led a trade mission to the United Arab Emirates and Saudi Arabia in collaboration with Industry Canada, DFAIT, Canada Mortgage and Housing Corporation (CHMC), the Canadian Embassies in Abu Dhabi and Saudi Arabia, and the Canadian Consulate in Dubai. The purpose of the mission was to introduce qualified Canadian companies in construction and related fields to buyers in the Middle East that are involved in the large number of infrastructure projects currently underway in the region.
We also increased collaboration and information sharing with other financial Crown corporations such as the Business Development Bank of Canada (BDC) and the Canadian Commercial Corporation (CCC). Working in partnership with the Trade Commissioner Service, CCC and BDC, we hosted an outbound Heads of Mission training session in 2008 to generate awareness and identify potential areas for collaboration to promote international trade.
In partnership with DFAIT, EDC offers employees the opportunity to participate in a secondment program. Through this partnership, DFAIT employees can spend work terms at EDC, enhancing their technical skills in export trade, and EDC employees have the opportunity to gain front-line experience in a DFAIT foreign assignment. To date, EDC has welcomed two DFAIT employees in work terms, while one EDC employee is currently on assignment abroad for DFAIT.
Our Canadian regional offices work closely with provincial trade groups and officials to promote international trade opportunities and the complementary services available to assist companies. For example, EDC began discussions with Investissement Quebec (IQ) about providing Quebec companies with solutions to finance their Research and Development tax credits.
EDC Annual Report 2008 | 21
Performance vs Objectives
OBJECTIVE 2: FACILITATING INTEGRATI VE TRADE
| | | | | | | | | | | | | | | | | |
| Performance measures | | 2007 Result | | | 2008 Plan | | | 2008 Result | | 2009 Plan |
Business volume | | | | | | | | | | | | | | | | |
| Total business volume ($B)* | | | 70.0 | | | 7% growth | | 23% growth (85.8) | | 8% decline |
| Volume in emerging markets* | | | 16.7 | | | 8% growth | | 31% growth (22.0) | | 5% growth |
Investments facilitated | | | | | | | | | | | | | | | | |
| Volume of foreign investments ($B)* | | | 5.6 | | | 5% decline | | 15.5% decline (4.7) | | 3% growth |
| Number of investment transactions** | | | 329 | | | 12% growth | | 16% growth (383) | | 5% growth |
Partnerships with financial institutions | | | | | | | | | | | | | | | | |
| Partnership volume ($B)* | | | 11.7 | | | 8% growth | | 20% growth (14.1) | | 7% growth |
| Number of partnership transactions*** | | | n/a | | | | | | | | 4,450 | | 6% growth |
| | |
| * | | In 2008, EDC began reporting some of its Credit Insurance volume on a net basis, and began reporting its Political Risk Insurance volume net of reinstatements. Due to these changes in reporting, and in order to provide an appropriate year-over-year comparison, all business volume results for 2007 in this table are shown on a basis consistent with 2008. |
| |
| ** | | The 12% growth rate shown in the table incorporates the original Corporate Plan 30% growth targeted for transactions under the Financing and PRI programs, as well as 5% growth under the ARI program. |
| |
| *** | | The 2008-2012 Corporate Plan indicated that EDC would be introducing a new partnership transaction measure but gave no target at that time. The 2007 Annual Report indicated that Number of partnership transactions would be introduced as a new measure during 2008 with a growth target of 6%. Subsequently, this performance measure was formally introduced in the 2009-2013 Corporate Plan and the 2008 result is the baseline for the 2009 growth rate. |
Integrative trade means that companies separate production processes into a series of activities — such as R&D, procurement, manufacturing, marketing and sales, distribution and logistics, and after-sale support — then locate those activities wherever it is most efficient to do so. Companies use advanced communications technologies and transportation logistics to integrate all these activities into global supply chains. This integration requires companies to invest in operations in foreign markets and/or partner with other companies in order to save costs and get closer to their customers and suppliers.
Maximizing global opportunities
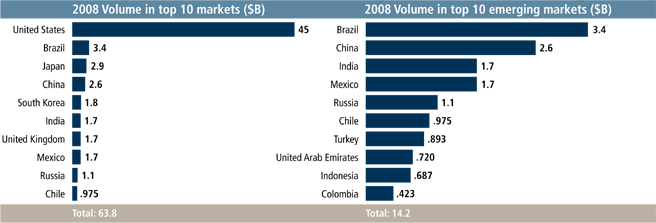
EDC facilitated a total of $85.8 billion in exports and investments in 2008, a 23% increase over 2007 and higher than our forecast. This result was driven by higher demand for EDC’s programs that intensified towards the end of the year as liquidity in the private sector became severely constrained. Record-high commodity prices for much of the year, and the Canadian dollar’s drop in value towards year-end also greatly boosted our export volumes.
It was urgent that we adapt to these circumstances and respond rapidly to our customers’ needs. Helping us to react quickly were changes made at EDC in recent years that we modeled on our customers’ best practices in efficiency and process improvement. Other recent changes also created efficiencies such as our reorganization according to industry sectors and supply chains in which our customers operate.
One-quarter of our total business volume — $22 billion — took place in emerging markets that continue to show strong economic growth and rising demand for the goods and services Canadian companies provide. Business volumes were particularly strong in those emerging markets where we have had permanent representatives in place for several years, reflecting the strong relationships we have developed with foreign buyers of Canadian goods and services.
Brazil, Russia and the Commonwealth of Independent States (CIS), India, China and Mexico remained the priority emerging markets for Canadian companies, and EDC business volumes in those markets totalled $11 billion, a 45% increase over 2007. We expect that new representations established in Chile and the Gulf Cooperation Council (GCC) in 2008 will be instrumental in growing opportunities in those regions for Canadian companies. In 2008, we facilitated $975 million in trade with Chile and a combined $1.3 billion with the United Arab Emirates, Saudi Arabia and Qatar.
Canadian companies are also investing in emerging markets as a means to lower costs, improve productivity, get closer to their customers or to link into the supply chains of their larger partners. Through our financing, credit insurance and political risk insurance programs, we completed 383 transactions in support of Canadian Direct Investment Abroad. Our efforts to increase customer awareness of our foreign affiliate coverage contributed to a 16% increase in investment transactions over 2007. The dollar value of foreign investments declined 15.5% to $4.7 billion in 2008, as some Canadian companies did not pursue or divested themselves of large investments, reducing the total dollar value of the investments facilitated by EDC.
22 | Managing Risk. Maximizing Opportunities.
Maximizing financial capacity
EDC is a key part of the network of financial institutions serving Canadian exporters and investors. Working in partnership with Canadian banks, sureties and other financial institutions worldwide, we add to the financial capacity available to Canadian businesses through a range of financial services including loan and contract bonding guarantees, shared financing, and insurance programs.
The volume of business EDC conducted through these partnerships reached $14.1 billion in 2008, 20% more than in 2007. We also facilitated 4,450 partnership transactions, a new performance measure introduced in 2008 to track our support for mid-market companies and our success at identifying opportunities to partner with private sector financial institutions.
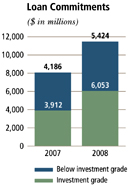
Contributing to these results, our Canadian Financial Intermediaries Group (CFIG) continued its work with Canadian financial institutions to improve their understanding of and access to EDC products and services, and to improve EDC’s own understanding of their needs and expectations and to develop joint business strategies. Our Financial Institutions Team (FIT) also contributed to these results by providing risk management solutions to Canadian banks, which help mitigate their foreign bank counterparty risk in international trade transactions. In that regard, FIT supported 1,501 partnership transactions and partnership volume of $5.4 billion in 2008, 80% more than in 2007 for both measures.
A key partnership initiative of 2008 was the introduction of enhancements to our Export Guarantee Program (EGP) that is designed to encourage financial institutions to advance loans to small- and medium-sized enterprises (SMEs) in Canada. The enhanced EGP increases the coverage we provide to banks that are financing export transactions or investments. The program now provides greater coverage for a broader range of client needs such as financing support for single and multiple export contracts, financing of work in progress and the purchase of equipment related to exports, and margining of foreign accounts receivables, working capital financing for foreign- domiciled inventory, and Canadian Direct Investments abroad. In 2008, reflecting growing demand for this type of support, approximately 314 SMEs benefited from the EGP product, compared to 172 in 2007. The overall guarantee coverage provided in partnership with Canadian financial institutions was valued at over $323 million, an increase from $220 million in 2007. More than 22 financial institutions took advantage of the program to help meet the needs of their clients.
Venture capital and private equity are essential sources of capital for small- and mid-sized enterprises, especially those in new technology sectors. EDC’s Equity Investment Program enables qualified companies to leverage our access to a unique combination of financial tools, expertise and international networks, and acquire the private equity and venture capital they need to grow their export business. EDC adds capacity to domestic private equity firms by investing in a variety of professionally managed funds that provide equity and venture capital to small- and medium-sized companies with fast-growth potential and that are exporting next generation technologies.
We also invest in foreign private equity and infrastructure funds that help us open up new networks of potential partners and customers for Canadian companies. In 2008, 66 Canadian companies benefited from investments made by EDC through our Equity Program. EDC completed approximately $224 million in investment commitments. Of these commitments, $169 million were in international funds, $28 million were in domestic venture capital and $27 million were in domestic middle-market private equity.
EDC Annual Report 2008 | 23
Performance vs Objectives
OBJECTIVE 3: LEVERAGING THE ORGANIZATION
| | | | | | | | | | | | | |
| | | 2007 Result | | 2008 Plan | | 2008 Result | | 2009 Plan |
Performance measures | | | | | | | | | | | | |
| VfM to TCO ratio* | | | 58:42 | | 43:57 | | | 43:57 | | 52:48 |
| Employee engagement** | | rank same as
high-quality organizations | | n/a | | | n/a | | rank same as
high-quality organizations |
| Employee retention (%)*** | | | | 94.88% | | > CB rate | | | | 91.83% | | > CB rate |
| | |
| * | | Value for Money (VfM) — investments in IT that increase business performance. Total cost of ownership (TCO) — the costs of maintaining core business infrastructure and technology assets. |
| |
| ** | | Measured on the climate assessment independently reported by Hay. The next biennial survey will be conducted in 2009. |
| |
| *** | | Conference Board data for financial institutions suggests a rate of 90.4%. |
Our ability to help Canadian companies succeed in international trade is rooted in the strengths of our organization, our knowledge of global markets and our customers, and our ability to provide innovative solutions and to manage risk. We leverage our capital, processes, technology and, most importantly, our people in serving the trade needs of thousands of Canadian companies.
Leveraging capital
Canadian exporters and investors need timely and predictable access to capital or other financial instruments in order to build their business and stay competitive. Our contribution to their growth is directly tied to our ability to manage and assess risk. This was particularly true in 2008, a year when growth slowed dramatically and capital became increasingly difficult to access.
EDC entered the financial downturn with a very strong capital position; our portfolio was well-diversified and our exposure to some of the hardest-hit financial institutions was limited. As a result of this position we were able to take on more risk for our customers and financial partners, serving 11% more companies in 2008. Our Risk Management Office handled 968 transaction approvals in 2008, nearly a third more than in 2007.
To continue to leverage our strong capital position, we also allocate a portion of capital as Strategic Risk Capital (SRC), to support higher-risk opportunities of strategic importance but outside our typical operations.
In 2008, EDC facilitated $1.8 billion of trade and investment through the use of SRC. This was primarily allocated to initiatives that included equity investments, unsecured loans to small businesses, financing to sub-sovereign obligors and transactions in certain emerging markets where the legal and regulatory systems are undeveloped.
Leaner processes, faster response
EDC continuously looks for ways to refine processes and create efficiencies. Throughout 2008, we continued to apply the Lean Methodology to various aspects of our organization, and the impact was significant, specifically with respect to our loans process. After full implementation of the Loans Transformation Project (LTP), which involved a comprehensive streamlining of the lending process, we were able to reduce processing times on loan transactions by about 60% and we were able to service an average of 63% more loan deals.
In addition, the New Deal Clearing House (NDCH) became an integral element of the new loans process in 2008. The NDCH operates as an upfront clearing forum made up of a cross-section of decision makers such as our Chief Risk Officer and representatives from key groups within the loans underwriting process. Deals being brought into the loans process are now “triaged” before the underwriting process begins to determine the most efficient process, enabling us to be more responsive to customer needs.
The LTP was the first step in a corporate-wide initiative to streamline our service delivery processes. Our Process Management Office, which led the LTP initiative, will be expanded to drive change through the entire Business Development & Operations group, with the continued application of Lean and other process management tools.
Leveraging technology
Technology is essential to success in business and in recent years, communications, transportation and logistics technologies have driven the globalization of trade. Like any business, EDC must optimize the use of technology in order to help Canadian companies compete in today’s challenging, 24/7 market, and ensure our employees can respond with agility — around the world and around the clock.
24 | Managing Risk. Maximizing Opportunities.
For the eighth year in a row, EDC was recognized as one of Canada’s Top 100 Employers, as reported in Maclean’s magazine.
In 2008 we invested in new wireless technologies to support the Mobile Workforce Project, which enables employees to access corporate systems from anywhere in the world. The reality is that our frontline staff is increasingly mobile — more than 50% of their time is spent on the road — so immediate access to information is essential to improving our responsiveness to our customers.
We evaluate how our information technology (IT) budgets are divided between total cost of owner- ship (TCO), the costs of maintaining core business infrastructure and technology assets, and Value for Money (VfM), investments in IT that increase business performance, such as programs that track and help manage customer relationships. To support our improved processes and focus on customer needs, our expenditures on VfM initiatives have been growing as a percentage of total IT investment for the last few years. The result for 2008 was 43:57. The VfM component was driven by major business value initiatives such as our Customer Relationship Management system as well as projects designed to enhance the delivery of both client-facing and support services. The TCO component was driven by a significant investment in upgrades to our desktop environments and network to ensure the continued security of our data, as well as support for international business development and regional office communications.
Leveraging People
To be successful, EDC must attract and retain top talent. In 2008, we introduced several initiatives aimed at fostering greater employee engagement and developing a more flexible and efficient work environment.
Fostering Employee Engagement
An engaged workforce is more productive. EDC measures employee engagement through its biennial employee survey. While these survey results have consistently ranked EDC among Canada’s high-quality organizations, our 2007 employee survey also identified three key drivers of engagement as vulnerabilities for EDC; career development, an enabling environment, and value of work and contribution. Over the course of 2008, EDC worked to build these drivers into strengths rather than vulnerabilities. Our employee retention rate was close to 92%.
An effective training program is key to ensuring we provide employees with a work environment that stimulates and supports their development and performance. In 2008, a total of 5,815 training days were delivered, for an average of 5.5 days per employee, of which 22% was dedicated to language training.
Flexible Work Arrangements
EDC is committed to providing flexible work arrangements that encourage work/life balance and enhanced productivity. In 2008, we developed a framework for flexible work arrangements including flexible work hours, compressed work weeks, part-time work, job sharing and teleworking. We plan to implement this throughout 2009.
Developing an Employment Value Proposition
An Employment Value Proposition (EVP) is a set of attributes that employees and potential employees perceive to be the value they gain through working at EDC. Based on the results of a 2008 survey conducted with roughly half of our employees, we identified those attributes as: job impact, development opportunities, respect, corporate social responsibility and co-worker quality. These attributes are now being used to strengthen our recruitment and development activities.
One of Canada’s Top Employers
In 2008, EDC was named one of Canada’s Best Diversity Employers by Maclean’s magazine. EDC is the only Crown corporation to have won the award. And for the eighth year in a row, EDC was recognized as one of Canada’s Top 100 Employers, as reported in Maclean’s magazine.
E-HR
In 2008, Human Resources developed a five year e-HR strategy and roadmap to enable employee performance and effective management decisions through delivery of high quality, accessible information.
EDC Annual Report 2008 | 25
2009 STRATEGIC OBJECTIVES
The following is an overview of the business strategy and performance measures of the 2009-2013 Corporate Plan, a summary of which is available at www.edc.ca/corporateplan
The Planning Environment
There is a significant degree of uncertainty in the planning environment. Tightened credit conditions, fluctuating commodity prices and rising levels of risk have brought tremendous volatility to global markets. This market uncertainty is reflected in exporter and consumer confidence, which have fallen dramatically. In this challenging environment, EDC will focus on how best to use its knowledge, services and capacity to respond to the needs of its customers.
EDC’s Business Strategy
Built upon our expertise in risk management and commitment to sound financial management, our business strategy ensures that the Corporation effectively and efficiently serves Canadian companies so that we can help them to succeed internationally. In our business plan we commit to:
| ► | | Putting customers at the centre of everything we do. |
| ► | | Ensuring that EDC stands behind our partners during this difficult period, enabling them to continue to serve Canadian companies. |
| ► | | Investing in our organizational structure, people and technology to maintain a strong platform from which to help companies navigate through these challenging times. |
The business strategy is rooted in three pillars:
| ► | | Connecting with exporters and investors — EDC will reach out to Canadian companies to better understand their needs and bring all of its expertise, relationships and solutions to serve them, directly or in partnership. |
| ► | | Facilitating integrative trade — EDC will increase the competitiveness of Canadian exporters and investors by providing a wide range of trade finance and risk management solutions aimed at export sales, foreign investments and supply chain management. |
| ► | | Leveraging the organization — EDC will make optimal use of its capital, technology, people and processes so that it can best serve the needs of Canadian companies. |
Connecting with Canadian Exporters and Investors
EDC’s ability to serve Canadian companies benefits from the investments the Corporation has made in recent years in its structure, in Canada and around the world. These investments include:
Strengthening Account Management
EDC has invested in the development of a customer relationship model, or CRM. This technology tool will enable employees to better connect with companies by creating a central repository of customer information, and will contribute to the development of a 360-degree view of the customer.
In 2008, Phase 1 of C3, the associated technology application of our Customer Relationship Management system, was launched to provide employees with a more effective means to capture, share and translate customer intelligence into relevant solutions. As a result, we were able to improve collaboration and communication across the organization. Further refinements to the technology are in process in order to further integrate the C3 application into our workflows.
26 | Managing Risk. Maximizing Opportunities.
Strengthening Representation
Canadian Network
In 2009, the Corporation will be further expanding its network with the opening of an office in Ville St. Laurent, with other locations in Quebec, Ontario and British Columbia also being considered.
Foreign Representatives
EDC’s Foreign Representatives are responsible for developing and maintaining value-added financial relationships with the Corporation’s international customers — foreign buyers of Canadian goods and services.
While enhancing our international network has been a priority for a number of years, EDC’s overall objective is to have 20 foreign representatives in place by 2010. This will be complemented with a focus on placing more people in our already existing overseas representations.
A Strong Network of Partners
Partnering with the Private Sector EDC works with private sector financial institutions to provide Canadian exporters and investors with the financial services they need. This is done in several ways:
| ► | | Providing risk-sharing solutions to enhance capacity in the market |
| |
| ► | | Working with banks through their Treasury operations to raise funds |
| |
| ► | | Providing solutions to facilitate banks in globalizing their operations |
| |
| ► | | Reviewing EDC’s documentary credits products in collaboration with the banks |
Collaboration with the Public Sector EDC works closely with its public-sector partners and in particular with DFAIT to leverage resources and align business strategies to serve Canadian companies.
EDC and the Business Development Bank of Canada (BDC) continue to engage at both the senior management and operational levels on potential opportunities for collaboration in areas such as strengthening product awareness and referral potential.
EDC will continue to engage with its Government partners on how best to provide companies with information about and access to the Government of Canada’s trade and investment services.
Facilitating Integrative Trade
For EDC, all trade is considered integrative trade whether it comes in the form of traditional export trade or trade through global supply chains. The majority of Canadian export activity is what can be described as traditional trade. EDC’s solutions are extremely responsive to such demands and are continually being reviewed and refined, based on feedback from exporters, their customers and their financial partners.
In responding to customer needs, the Corporation must remain mindful of market risks and how changes in the economic environment could affect its ability to provide Canadian companies with the services they need, while at the same time remaining financially self-sustaining. To that end, the Corporation will continue to be guided by its discipline in risk management and its commitment to sound financial management.
EDC facilitates integrative trade in a number of ways. Its solutions facilitate traditional export trade and enable CDIA, for companies of all sizes and in markets across the globe. Looking ahead, EDC has identified a growing demand from institutional investors such as pension funds, for investment facilitation solutions. These institutions are looking for reliable and knowledgeable partners to assist them in their international business activities.
The Corporation also improves Canadian exporters’ and investors’ access to risk capital through its Equity Program. Growing the private equity market in order to help diversify Canada’s economy is a priority. EDC and BDC are working together to play a valuable role in helping companies access equity, with BDC focusing on company building and EDC focusing on assisting companies to expand beyond Canadian borders and enter the international marketplace.
EDC Annual Report 2008 | 27
2009 Strategic Ojectives
Leveraging the Organization
EDC’s ability to serve Canadian companies depends on more than just its knowledge of the market and its customers, or its ability to develop and deploy innovative solutions. The continued relevance of the Corporation is also rooted in its commitment to ensuring its viability over the long term; to ensuring that EDC is run efficiently as a business so that it can continue to meet the expectations of its customers, its partners and its shareholder, the Government of Canada.
EDC is therefore committed to effectively leveraging its resources. This means leveraging its capital, processes, technology and people to facilitate the global business of Canadian companies at a time when risks are on the rise and competition is increasing.
EDC’s success in developing and deploying its solutions is driven by its commitment to excellence in capital, processes, technology and people. In 2009, EDC will leverage the organization through:
Capital
The effective use of capital EDC has exercised over the past number of years has positioned the Corporation to be able to respond to the needs of Canadian exporters and investors in this difficult period. EDC’s expertise in risk assessment and management will be critical in support of accomplishing these objectives as economic conditions fluctuate.
EDC is committed to supporting the higher-risk business opportunities of strategic importance to our customers by continuing to expand its risk appetite. However, as market conditions grow more challenging, EDC will need to balance its expansion of risk appetite while at the same time managing its existing financial obligations.
Processes
EDC continues to refine and adapt its service offerings and processes in an effort to improve its value to the customer. Continuing with the adoption of lean operating principles, EDC will implement a corporate-wide initiative to streamline all service delivery processes encompassing loans, guarantees and insurance. A Process Management Office, within a newly established Customer Experience Group, was given a mandate to develop and strengthen process expertise in the organization.
Technology
EDC is working to build online portals that personalize EDC’s interaction with its customers and partners, improving their accessibility to the full range of EDC’s solutions and intelligence in a coordinated and secure way. Other initiatives include launching an enterprise data quality program, delivering an enterprise document management system, and leveraging the use of existing business intelligence tools.
People
EDC will continue to improve its service delivery, foster greater employee engagement and support the development of a more flexible and efficient work environment through initiatives such as:
| ► | | The Employee Value Proposition — with benefits such as increasing the size of EDC’s talent pool, increasing the likelihood of fit between candidates and EDC, and improving employee performance and retention. |
| ► | | Continuing to develop the telework program to enable employees to flexibly, securely and efficiently interact with one another and customers. |
Measuring Success
EDC tracks its performance against the three pillars of its Business Strategy using various measures that are reviewed periodically to ensure they remain in line with our objectives.
Connecting with Exporters and Investors
Customers Served measures the number of customers who may have been acquired in previous years but who continue to be served by the Corporation through, for example, disbursements or policy coverage.
Number of Multiple Program Users (MPU) — MPU measures EDC’s success in meeting the needs of individual customers by calculating the number of different products customers choose to use.
28 | Managing Risk. Maximizing Opportunities.
In 2009, EDC will measure its success at connecting with its customers through the Net Promoter Score (NPS), which is calculated from the results of customer surveys. The NPS is viewed as a highly effective tool for measuring customer satisfaction and for driving improvements in how EDC connects with customers.
Facilitating Integrative Trade
Total Business Volume – This is the total volume of exports and investments facilitated by EDC across all product lines.
Volume in Emerging Markets – Based on the International Monetary Fund (IMF) definition of an “emerging economy”, this measures the total volume of exports and investments facilitated by EDC in emerging markets.
Canadian Direct Investment Abroad (CDIA) – This measure will track both the volume and the number of transactions under EDC’s programs related to financing and political risk insurance.
Partnership Volume – This is the amount of contracted risk that EDC takes upon itself on behalf of financial institutions under all of the programs offered by EDC, except credit insurance.
In addition to these measures, EDC will also be tracking the number of Partnership Transactions it concludes during the year. This measure will quantify the number of transactions related to EDC’s partnerships with private institutions.
Leveraging the Organization
Value for Money (VfM) to Total Cost of Ownership (TCO) Ratio – EDC gauges the dollars spent on discretionary and non-discretionary information technology investments that drive business value and investments necessary to keep core assets and infrastructure in place. In this way, EDC differentiates the allocations between Value for Money initiatives and the Total Cost of Ownership (TCO).
Employee Retention – EDC measures its success in retaining the personnel resources needed to ensure the successful implementation of its Business Strategy by comparing its retention rates to financial services industry retention data compiled by the Conference Board of Canada.
| | | | | |
| Performance measures | | 2009 Plan |
| |
Connecting with exporters and investors | | | | |
| |
| Customers served | | maintain |
| |
| Number of multiple program users | | 10% growth |
| |
| Net Promoter Score | | maintain |
| |
Facilitating integrative trade | | | | |
| |
| Total business volume ( $B) | | 8% decline |
| |
| Volume in emerging markets ($B) | | 5% growth |
| |
| Volume of foreign investments ($B) | | 3% growth |
| |
| Number of investment transactions | | 5% growth |
| |
| Partnership volume ($B) | | 7% growth |
| |
| Number of partnership transactions | | 6% growth |
| |
Leveraging the organization | | | | |
| |
| VfM to TCO ratio | | | 52:48 |
| |
| Employee engagement | | Rank same as high-quality organizations* |
| |
| Employee retention (%) | | ≥ CB rate** |
| |
Sound financial management | | | | |
| |
| Net income | | $148 million |
| |
| Return on Equity (ROE) | | | 2.4% |
| |
| Gross Efficiency Ratio | | | 27.6% |
| | |
| * | | Measured on Climate Assessment independently by Hay. |
| |
| ** | | Conference Board data for financial institutions suggests a rate of 90.4%. |
EDC Annual Report 2008 | 29
BOARD OF DIRECTORS
| | | |
Norman M. Betts
Associate Professor
University of New Brunswick
Faculty of Business Administration
Fredericton, New Brunswick | | Dr. Betts has an extensive record of public service and scholarship in the fields of accounting and finance. Currently an associate professor with the Faculty of Business Administration, Dr. Betts has been associated with the University of New Brunswick in Fredericton since 1981. He is a past member of the New Brunswick Legislature and served as Minister of Finance and Minister of Business New Brunswick between 1999 and 2003. Dr. Betts also serves on the boards of several public corporations. |
| | | |
Jeff Burghardt
President and CEO
Prince Rupert Grain Ltd.
Prince Rupert, British Columbia | | Mr. Burghardt has worked in the agricultural industry for more than 25 years. He has been an advocate of more sustained business activity in Prince Rupert and the Northwest Transportation Corridor route. He is a leading advocate for his region, an involved community member and has served as an industry advisor to both federal and provincial governments on initiatives including transportation, economic development, health, education and investment issues. |
| | | |
Adam Chowaniec
Chair
Tundra Semiconductor Corporation
Ottawa, Ontario | | With undergraduate and graduate degrees in Engineering, Dr. Chowaniec began as an assistant professor at Acadia University. However, he has spent most of his career in scientific and executive positions within the high-tech industry, primarily in Ottawa but also in the U.S. A key spokesperson, he has been recognized for his leadership, business excellence and innovation. In 1998, the Ottawa-Carleton Research Institute honoured him with its prestigious Chairman’s Award. From 2006 to 2007, he was Chair of the Ontario Premier’s Research and Innovation Council. |
| | | |
Jim Dinning
Chair
Western Financial Group
Calgary, Alberta | | Mr. Dinning was appointed Chair of Export Development Canada in 2007. He is the non-executive Chair of Western Financial Group and a director of several public/private companies and not-for-profit organizations. Mr. Dinning served in senior public sector leadership roles as Provincial Treasurer and Minister in key ministries during his 11-year tenure as a member of the legislative assembly of Alberta. |
| | | |
Linda M. O. Hohol
Calgary, Alberta | | Ms. Hohol has significant experience in the financial sector and expertise in venture capital financing and wealth management. From 2002 to 2007, Ms. Hohol was President of the TSX Venture Exchange following a long career with CIBC. She is a director with several for-profit and non-profit corporations and was recognized by The Globe & Mail newspaper as one of the 100 Most Powerful Women in Canada. |
| | | |
Jocelyne Landry
Assistant Director to Educational Services
Campbellton Campus,
Collège communautaire
du Nouveau Brunswick
Campbellton, New Brunswick | | Prior to assuming her current position, Mme. Landry was the Director of the Centre de Commer- cialisation Internationale at the Université de Moncton from 1996 to 2007. There she coordinated and participated in trade missions involving students, businesses and government departments. She is also the President and founder of small private companies. |
30 | Managing Risk. Maximizing Opportunities.
| | | |
Donald A. MacLeod
Vice President and Senior Counsel
J. Ray McDermott Canada, Ltd. (Secunda
Marine Services) Dartmouth, Nova Scotia | | Since 1989, Mr. MacLeod has held senior management positions with Secunda and its predeces- sors, and has had extensive involvement in commercial transactions in Canada and internationally within the shipping and offshore oil and gas sector. He is Chair of the Shipowners’ Mutual Protection & Indemnity Association (Luxembourg), and holds positions on several of its affiliates and management committees. Mr. MacLeod is a member of the Nova Scotia Barristers Society. |
| | | |
John R. Rooney
Chief Executive Officer
TUSK Energy Corporation
Calgary, Alberta | | Mr. Rooney is a Calgary-based entrepreneurial executive with technical background in finance and as a Chartered Accountant and Chartered Business Valuator. He has over 20 years’ experience primarily in the oil and gas industry, either in the role of CEO or CFO of public companies listed on the Toronto Stock Exchange. He serves as a director of several public and private companies and a not-for-profit organization. |
| | | |
Eric Siegel
President and Chief Executive Officer
Export Development Canada
Ottawa, Ontario | | Mr. Siegel has served in a variety of increasingly senior roles since joining the organization in 1979. Mr. Siegel was appointed Senior Vice-President of Medium- and Long-Term Financial Services in 1995, and then Executive Vice-President in 1997. Mr. Siegel was named Chief Operating Officer in September 2005, assuming leadership for EDC’s business development and transacting. He was appointed President and CEO on December 8, 2006. The appointment was effective January 1, 2007. |
| | | |
Ajit Someshwar
Chief Executive Officer
CSI Consulting Inc.
Toronto, Ontario | | Mr. Someshwar obtained chartered accountancy qualifications from both India and the U.K . and has worked in senior capacities within the insurance sector. He is currently the founding President & C.E.O. of CSI Group of Companies, the parent of several technology and management solutions companies with Fortune 500 clients in Canada and the U.S. Mr. Someshwar is also the National Convener of the Canada India Foundation, a public policy advocacy group promoting strong bilateral relations between Canada and India. He was president of the Indo-Canada Chamber of Commerce from 1991-93, and introduced an awards program to recognize Indo-Canadian contribution to Canada. Mr. Someshwar was recently appointed to the Economic Advisory Council established by the federal Minister of Finance. |
| | | |
Margriet Zwarts
Corporate Director
Montreal, Quebec | | Ms. Zwarts has more than 25 years’ experience as a corporate lawyer, having practiced with private sector firm Fasken Martineau DuMoulin LLP and as a partner with Ogilvy Renault. She subsequently joined Telesystem International Wireless Inc. where she served as Secretary and General Counsel from 1998 until the end of 2005. |
EDC Annual Report 2008 | 31
EXECUTIVE MANAGEMENT TEAM
| | | |
(Front, left to right) | | |
| | | |
Stephen Poloz | | Senior Vice-President, Financing Products Group |
| | | |
Sherry Noble | | Senior Vice-President, Business Solutions and Technology |
| | | |
Eric D. Siegel | | President and Chief Executive Officer |
| | | |
Susanne Laperle | | Senior Vice-President, Human Resources |
| | | |
(Back, left to right) | | |
| | | |
Benoit Daignault | | Senior Vice-President, Business Development |
| | | |
Pierre Gignac | | Senior Vice-President, Insurance |
| | | |
Jim McArdle | | Senior Vice-President, Legal Services & Secretary |
| | | |
Kevin O’Brien | | Senior Vice-President and Chief Financial Officer |
32 | Managing Risk. Maximizing Opportunities.
CORPORATE GOVERNANCE PRACTICES AT EDC
Stewardship
The stewardship of EDC resides with the Board of Directors. Each director brings unique perspectives, experience and expertise to the Board’s oversight activities. This is vitally important in the current economic crisis as EDC is expected to meet trading companies’ financial needs – through traditional loans and insurance coverage – and to be flexible in “stepping up” to meet Canadian exporters’ and investors’ changing needs. In this unsettled economic environment, EDC can draw on the breadth of experience its directors bring to the table.
The Board approves EDC’s Corporate Plan, a five-year rolling business plan. In providing input at the early stages, the Board provides guidance on EDC’s strategic direction.
Throughout the year, the Board focused its discussions on the difficult issues around the credit markets, industry sectors such as the automotive, aerospace and high-tech industries, and a highly risky and uncertain business environment. Individual directors made themselves available in areas of their expertise (for example, venture capital and risk management).
EDC’s risk management strategies and strong due-diligence practices are well-established and stood up well through the current market cycle. As market risk increases, so too does credit risk. As a result, EDC continues to allocate additional capital to support risks already on its books. The Board paid particular attention to reviewing the Corporation’s risk management practices to ensure rigour.
During 2008, the Board advised management on the independent review of EDC’s primary legislation. A Board sub-committee was struck and provided input to EDC’s submission to the review.
The Board also focused its stewardship on EDC’s internal operations. Of special interest were EDC’s information systems and management practices, which the Board reviewed so as to ensure a high level of integrity in the information produced. The Board’s Audit Committee reviewed and endorsed the annual audit plan for the Internal Audit Group, and received regular reports on internal audit projects undertaken. The Board reviewed and updated its approval process for major capital expenditures. As well, the Audit Committee and the Board were kept informed throughout the special examination (as required per Section 138 of the Financial Administration Act) by the Auditor General of Canada. Also underway in 2008 was the Auditor General’s audit of the design and implementation of EDC’s environmental review directive. Both of these audits are required to be carried out by the Auditor General of Canada every five years, and final reports are expected in 2009.
The Board also devoted its energies to ensuring compliance with government guidelines relating to EDC’s governance, in the following areas:
Accountability and Operations
EDC’s Board functions independently of management. At each Board and committee meeting, independent directors meet in camera, with no management present. The Audit Committee meets in camera in two sessions: one with the Auditor General’s representatives and another with EDC’s Vice-President, Internal Audit. The roles of the Chair and the CEO (President) are separate. All Board members other than the CEO are independent of EDC management.
The Board has an effective working relationship with EDC’s management. The allocation of responsibilities between the Board and management was reviewed on a regular basis.
EDC Annual Report 2008 | 33
Corporate Governance
EDC’s approach to governance continues to be shaped by active Board involvement and input. As has been the case for several years, the results of the Board governance survey led to development of a governance work plan for the coming year.
The Board promotes a culture of ethical business conduct, leading by example in following supplemental procedures that regulate conflict of interest and insider trading, and that go beyond the requirements of EDC’s Code of Conduct. EDC directors have long followed a practice of filing standing declarations of interest, and refraining from discussions or voting where a real or potential conflict of interest exists. In 2008, at the Board’s request, an additional step was added where Board documents are screened for matches with companies listed in directors’ standing declarations. As a result, transaction documents can be withheld from any directors who have declared interests in a party related to that transaction.
Communication with Stakeholders
Effective communication among EDC and its stakeholders, including the Crown and the public, was monitored and, in some cases, facilitated by the Board. EDC’s second annual public meeting was held on April 30, 2008 with several directors in attendance. The Board was informed of ongoing outreach activities that help EDC obtain stakeholder input and feedback, including the National Stakeholder Panel and the Corporate Social Responsibility Advisory Group. Periodic meetings among EDC Board and Executive members and government international trade personnel, including meetings with Ministers and Deputy Ministers, helped enhance communication. EDC’s reports to the government and to the public continued to fully address significant issues the corporation was facing.
Senior Management Evaluation and Succession
The Board has a process for assessing and evaluating the performance of the CEO, which it followed once again in 2008. The CEO’s objectives are directly related to achievement of the corporate objectives, as described in the Corporate Plan.
The Board also continued to oversee senior management succession. The Human Resources Committee annually approves the corporate succession plan, including related processes for selection, training and monitoring. In 2008, the Board focused more on succession planning, with a full presentation on the succession plan, and increased opportunities to meet and assess the capabilities of successor candidates.
Board Education and Evaluation
Orientation and education programs for EDC’s directors were refined to meet their needs. The Nominating and Corporate Governance Committee reviewed and were satisfied with the orientation curriculum. Four new directors appointed during the year participated in orientation sessions. Regular education sessions for all directors were held the day prior to most Board meetings and, as in the past, focused on particular EDC product lines and other aspects of its business.
The Board ensures that the effectiveness of the Board and its committees is evaluated annually, and that individual directors self-assess their effectiveness. In 2008, the Board engaged a consultant to carry out an evaluation of the Board’s governance practices. The consultant conducted in-depth interviews with each director and concluded that the level of effectiveness of the Board was strong. The consultant also formulated a series of recommendations to help the Board improve the use of its time and the expertise of directors. Several of these recommendations form the basis of the Board’s governance work plan for the coming period.
Committee Mandates
The Audit Committee helps the Board fulfill its mandate in financial matters as well as issues regarding business ethics, declaration of dividends, internal and external auditor terms of engagement, and monitoring the corporate compliance program. It approves and monitors important capital and administrative expenditures, reviews the implications for EDC of new accounting guidelines, and reviews internal and external audit results. All Audit Committee members are independent of EDC management, and committee members include financial experts.
The committee held four meetings. It is chaired by J. Rooney who succeeded L. Lachapelle in this role on April 1, 2008.
The Business Development Committee provides direction that strengthens EDC’s ability to meet ongoing needs of Canadian exporters and investors. The committee reviews the Corporate Plan throughout development, oversees
34 | Managing Risk. Maximizing Opportunities.
management activities in analyzing market conditions and developing responses, and monitors corporate performance against business development plans and related frameworks. The committee also reviews sector strategies and new product initiatives, and annually reviews the impact on Canada’s economy of business that EDC facilitates.
The committee held six meetings. It is chaired by N. Betts, who succeeded M. Zwarts in this role on April 1, 2008.
The Executive Committee has the authority to exercise many Board powers, and meets only if necessary to deal with urgent matters that arise between Board meetings. The Executive Committee did not meet in 2008.
J. Dinning, as Chair of the Board, chairs the Executive Committee.
The Human Resources Committee helps the Board with human resources strategic planning, annually approves the management succession plan and employee and executive compensation, including approving the measures and targets for the corporate incentive program. The Committee sets objectives and recommends the CEO’s performance assessment, and oversees the design and investment of the pension plans for EDC employees.
The committee held six meetings. It is chaired by L. Hohol, who succeeded J. Boudreau in this role on April 1, 2008.
The Nominating and Corporate Governance Committee deals with matters relating to EDC’s corporate governance regime. It provides input into the ethics program for directors, selection criteria for appointments of the CEO and the Chair, profiles of the desirable skills and experience required of directors, consideration of Board candidates, and orientation and education programs. It oversees the Board governance survey, monitors relations with management, and reviews the membership and mandates of committees.
The committee, chaired by J. Dinning, held four meetings in 2008.
The Risk Management Committee helps the Board with oversight of the management of credit, market and other enterprise risks, including establishing and updating an effective regime governing the authorizations EDC needs to undertake its business activities, and has input into any policy changes in these areas. It also reviews and recommends all transactions and policy increases that require Board approval, monitors compliance with the Environmental Review Directive, and has a role in the Capital Adequacy Policy. It receives periodic updates on various portfolio management activities and initiatives.
The committee held seven meetings. It is currently chaired by A. Chowaniec, who succeeded L. Lachapelle in this role on October 22, 2008. Mrs. Lachapelle had succeeded R. Fleming as chair on April 1, 2008.
Director Remuneration
Compensation paid to directors is set by Order in Council. The Chair and directors from the private sector receive an annual retainer for their services to EDC, plus a fixed per diem for travel time, attending committee and Board meetings and other responsibilities as they arise:
| ► | | Chair of the Board: annual retainer of $12,400; $485 per diem |
| |
| ► | | Other directors: annual retainer of $6,200; $485 per diem |
| |
| ► | | Chairs of committees (other than Executive Committee) and Vice-Chair of the Board: base retainer plus $2,000 |
| |
| ► | | Directors also receive reimbursement for reasonable out-of-pocket expenses, including travel, accommodation and meals, while performing their duties. |
Most members of the Board serve on three committees. There were nine Board meetings in 2008 and 28 committee meetings. The total remuneration paid to private sector directors including the Chair (annual retainers, pro-rated for the portion of the year each director was a member of or chaired a committee, plus per diems) was $212,393 compared to $200,711 in 2007. The total business travel, promotion and meeting expenses paid to members of the Board as well as meeting expenses for the Board and committees were $202,225 compared to $147,303 in 2007 (both figures exclusive of the expenses of the CEO). The total expenses for hospitality and travel for EDC’s CEO in 2008 were $94,982 compared to $100,709 for business promotion, travel and conference fees in 2007.
EDC Annual Report 2008 | 35
Corporate Governance
MEMBERSHIP AND ATTENDANCE AT MEETINGS OF THE BOARD AND BOARD COMMITTEES IN 2008
| | | | | | | | | | | | | | | | | | | | | | | | | |
| | | | | | | Business | | | Nominating | | | Human | | | Risk | | | | |
| | | Audit | | | Development | | | & Corporate | | | Resources | | | Management | | | Board | |
| | | (5) | | | (6) | | | Governance (4) | | | (6) | | | (7) | | | (9) | |
| |
| Betts | | | 5/5 | | | | 6/6 | | | | n/a | | | | n/a | | | | 7/7 | | | | 9/9 | |
| |
Boudreau1 | | | n/a | | | | n/a | | | | n/a | | | | 2/3 | | | | 2/4 | | | | 3/4 | |
| |
Burghardt2 | | | 2/2 | | | | 3/3 | | | | n/a | | | | 2/3 | | | | n/a | | | | 3/5 | |
| |
Charpentier 3 | | | n/a | | | | 2/5 | | | | 1/4 | | | | 1/3 | | | | n/a | | | | 3/6 | |
| |
Chowaniec4 | | | n/a | | | | 2/3 | | | | n/a | | | | 2/3 | | | | 3/3 | | | | 5/7 | |
| |
| Dinning | | | n/a | | | | n/a | | | | 4/4 | | | | 6/6 | | | | 6/7 | | | | 9/9 | |
| |
Fleming5 | | | n/a | | | | n/a | | | | n/a | | | | n/a | | | | 1/2 | | | | 1/2 | |
| |
Fung6 | | | n/a | | | | n/a | | | | n/a | | | | n/a | | | | 1/3 | | | | 1/3 | |
| |
| Hohol | | | n/a | | | | n/a | | | | n/a | | | | 5/5 | | | | 5/5 | | | | 8/9 | |
| |
Lachapelle7 | | | 4/4 | | | | n/a | | | | n/a | | | | n/a | | | | 5/5 | | | | 5/5 | |
| |
| Landry | | | n/a | | | | 5/6 | | | | 3/4 | | | | 4/6 | | | | n/a | | | | 7/9 | |
| |
MacLeod8 | | | n/a | | | | 3/3 | | | | n/a | | | | 3/3 | | | | 3/3 | | | | 5/5 | |
| |
| Rooney | | | 5/5 | | | | 6/6 | | | | n/a | | | | n/a | | | | 7/7 | | | | 9/9 | |
| |
| Siegel | | | 5/5 | | | | 6/6 | | | | n/a | | | | 6/6 | | | | 7/7 | | | | 9/9 | |
| |
So9 | | | n/a | | | | n/a | | | | 2/2 | | | | 3/3 | | | | n/a | | | | 4/4 | |
| |
Someshwar10 | | | 1/2 | | | | n/a | | | | 2/2 | | | | n/a | | | | 2/3 | | | | 5/6 | |
| |
| Zwarts | | | 5/5 | | | | 5/6 | | | | 4/4 | | | | n/a | | | | n/a | | | | 9/9 | |
| | |
| 1 | | Mr. Boudreau ceased to be a member of the Board on June 18, 2008. |
| |
| 2 | | Mr. Burghardt was appointed to the Board on June 18, 2008 and became a member of the Audit, Business Development and Human Resources Committees on September 3, 2008. |
| |
| 3 | | Mr. Charpentier was on leave of absence from the Board commencing November 5, 2008. |
| |
| 4 | | Dr. Chowaniec was appointed to the Board on April 11, 2008 and became a member of the Business Development, Human Resources and Risk Management Committees on September 3, 2008. |
| |
| 5 | | Mr. Fleming ceased to be a member of the Board on April 13, 2008. |
| |
| 6 | | Mr. Fung ceased to be a member of the Board on May 9, 2008. |
| |
| 7 | | Mrs. Lachapelle ceased to be a member of the Board on September 5, 2008. |
| |
| 8 | | Mr. MacLeod was appointed to the Board on June 18, 2008 and became a member of the Business Development, Human Resources and Risk Management Committees on September 3, 2008. |
| |
| 9 | | Ms. So ceased to be a member of the Board on June 18, 2008. |
| |
| 10 | | Mr. Someshwar was appointed to the Board on May 9, 2008 and became a member of the Audit, Nominating & Corporate Governance and Risk Management Committees on September 3, 2008. |
36 | Managing Risk. Maximizing Opportunities.
2008 FINANCIAL REVIEW
Contents
| | | |
| 38 | | |
| 38 | | |
| 48 | | |
| 69 | | |
| 72 | | |
| 73 | | |
| 74 | | |
| 74 | | |
| 75 | | |
| 76 | | |
| 76 | | |
| 77 | | |
| 78 | | |
| 78 | | |
| 78 | | |
| 85 | | |
| 86 | | |
| 88 | | |
| 89 | | |
| 90 | | |
| 91 | | |
| 91 | | |
| 92 | | |
| 92 | | |
| 93 | | |
| 94 | | |
| 96 | | |
| 96 | | |
| 97 | | |
| 98 | | |
| 100 | | |
| 100 | | |
| 100 | | |
| 101 | | |
| 103 | | |
| 104 | | |
| 105 | | |
| 106 | | |
| 107 | | |
| 107 | | |
| 107 | | |
| 108 | | |
| 108 | | |
| 108 | | |
| 109 | | |
| 110 | | |
| 112 | | |
| 113 | | |
| 113 | | |
| 113 | | |
| 114 | | |
| 114 | | |
| 116 | | |
| 118 | | |
| 120 | | |
EDC Annual Report 2008 | 37
| Management’s Discussion and Analysis |
Management’s Discussion and Analysis
OPERATING HIGHLIGHTS
The financial and economic turmoil experienced in 2008 presented increased challenges for Canadian companies and as economic conditions deteriorated EDC was able to help them respond and assist them in managing their risks. As a result, we facilitated record business volume of $85.8 billion in 2008. We exceeded our 2007 volume by 23% and our 2008 Corporate Plan by 16%. Volume in our insurance programs totaled $71.8 billion, a 25% increase over 2007, while financing volume totaled $14.0 billion, an 11% increase. Our business volume in emerging markets grew by 31% over 2007, reaching $22 billion and comprising 25.6% of our total business.
Economic Environment
2008 has turned out to be an unprecedented year for the global economy. What began as a sub-prime mortgage problem in the U.S. housing market in 2007 rapidly became a worldwide financial meltdown, affecting virtually all sectors of the economy and leading to the demise or restructuring of several large global financial institutions. This has been accompanied by credit markets seizing up, commodity prices plummeting, economic contraction in most markets, and confidence evaporating. Governments have responded with financial sector bailouts, interest rate cuts, provision of liquidity to the market, and massive stimulus packages.
The unfolding economic turmoil has changed the landscape on a number of fronts for EDC, including:
| ► | | Our customers |
| |
| ► | | Funding and liquidity |
| |
| ► | | Counterparty credit risk |
| |
| ► | | Federal Government Budget 2009 Response |
Impact on our Customers
EDC’s customers have been significantly impacted by this challenging economic environment. Access to credit has dried up, falling commodity prices have reduced profits, and now falling global consumption has reduced demand across the economy. The weakening of the Canadian dollar in the last half of the year provided some relief, but the arrival of the global slowdown meant it was short-lived. The capacity of the private sector to provide credit has tightened and as risks have increased, companies who previously self-insured have turned to EDC. This has lead to greater utilization of EDC’s services by customers across most programs. In particular, we saw significantly increased demand in programs such as credit insurance as the level of corporate defaults began to rise in the fourth quarter.
Impact on EDC’s Funding and Liquidity
While the difficulties in the global financial markets limited the availability of credit to many borrowers, EDC was able to obtain the funding required to meet record demand for our financing products. As a result of the tightening of credit markets, investors’ preference shifted to securities issued by higher quality entities. This positively impacted our ability to obtain funding at favourable rates.
In response to market conditions, our commercial paper and capital market funding limits were increased by the Department of Finance in order to ensure that we are in a position to access capital markets to meet our growing requirements and ensure that we have adequate flexibility to obtain funding efficiently at an appropriate cost.
We maintain a portfolio of marketable securities for liquidity purposes. During the year, in response to the sub-prime crisis and in order to improve the credit quality and the liquidity of our portfolio, we divested our portfolio of securities issued by institutions which were more heavily exposed to sub-prime assets including U.S. government sponsored entities. Our investments were shifted mainly to lower yielding, shorter-term government and supranational securities which improved the credit quality of this portfolio.
Counterparty Credit Risk
We are exposed to credit risk within our loan and insurance programs and within our treasury activities. During 2008, an area of significant concern was with financial institutions counterparty risk. We have exposure to financial institutions within all three areas noted above; however, our principal exposure is through counterparties within our treasury investment and derivative portfolios.
Throughout 2008, we closely monitored the credit quality of our treasury counterparties. We eliminated or reduced our exposure and avoided taking on additional exposures to a number of financial institutions which were experiencing problems. Additionally, we have agreements in place with all of our derivative counterparties which enable EDC to terminate contracts should the counterparty be downgraded below a certain credit rating. We also have collateral agreements in place that require counterparties to post collateral should our credit exposure to them exceed certain levels.
At the end of 2008, we assessed the impact of the difficult economic environment on our exposure under both our loan and insurance portfolios. We took a close look at our exposure to the automotive sector since economic conditions, particularly in the fourth quarter of 2008, heavily impacted this sector. Auto sales have sharply declined and both Canadian and U.S. assembly plants are scaling back operations. This is impacting auto parts suppliers to which EDC has substantial exposure. We were concerned that current credit ratings might not be fully reflective of these recent events and therefore, it is likely that at our balance sheet date, there are losses within our portfolio which have been incurred but not yet identified. We also determined that in addition to the automotive sector there were additional areas in our portfolio impacted by the difficult economic conditions. To address these concerns we increased our loan related allowance which resulted in a higher provision for credit losses and we also made adjustments to our assumptions for frequency of loss, severity of loss and claims incurred but not reported for the actuarial valuation of insurance policy and claim liabilities which led to increased claims-related expenses in 2008.
38 | Managing Risk. Maximizing Opportunities.
Management’s Discussion and Analysis
Federal Government Budget 2009 Initiatives in Response to the Current Situation
Pressure on the global economy is expected to continue in 2009 with most industries feeling the effects. World economic growth continues to weaken, particularly among Canada’s traditional trading partners and liquidity has tightened globally. The Government of Canada’s Budget in January 2009 included a number of measures to increase EDC’s capacity to assist Canadian exporters and investors during this difficult period. These measures will require legislative changes and Parliamentary approval and include:
| ► | | The broadening of EDC’s mandate and removal of certain restrictions in applicable regulations for at least two years to enable us to support financing and insurance in the domestic market, in a manner that complements Canada’s commercial financial institutions, the Business Development Bank of Canada (BDC), and commercial insurance providers. |
| |
| ► | | EDC’s Authorized Capital Limit will be raised from $1.5 billion to $3 billion. This will allow the Government to invest more share capital into EDC if required. |
| |
| ► | | EDC’s Contingent Liability Limit will be raised from $30 billion to $45 billion, allowing EDC to issue more insurance and guarantees if there is an increase in demand. |
| |
| ► | | The Canada Account1 portfolio limit will be raised from $13 billion to $20 billion. EDC administers the Canada Account on behalf of the Government. |
| |
| ► | | EDC and BDC will jointly provide up to $5 billion in loans at market rates in partnership with Canada’s banks under a newly created Business Credit Availability Program. These loans are meant to complement private credit activities and will only be available to creditworthy clients and transactions. |
Once these measures come into effect in 2009, we expect to see an increase in the business volume facilitated by EDC as well as increased exposures in our loan and insurance portfolios. This increased exposure may result in increased risk for EDC. We will continue to closely monitor our credit, liquidity and funding risks.
Net Income
Net income for 2008 was $206 million, a decrease of $267 million from 2007. The lower net income was primarily due to an increased provision for credit losses and higher claims-related expenses reflecting the impact of the difficult global economic conditions on our financing and insurance portfolios. Items of note impacting net income include:
Provision for Credit Losses – We recorded a provision for credit losses of $346 million in 2008 compared to $196 million in 2007. As a result of the current economic environment, increases in provisioning were required for our automotive portfolio as well as other portions of our commercial unsecured portfolio to reflect recent losses we estimate to have occurred in these portfolios that are not yet reflected in the associated credit ratings.
Claims-Related Expenses – Claims-related expenses were $222 million in 2008, a $90 million increase from 2007 primarily due to higher claim payments and an increased allowance for claims on insurance policies at the end of the year. The increase in claim payments is a reflection of the difficult economic environment during 2008, and the increased allowance was a result of both the current economic difficulties, particularly within the automotive and retail sectors, as well as growth in our insurance portfolio.
Net Financing and Investment Income – Net financing and investment income increased to $834 million in 2008, a slight increase over the $811 million reported in 2007. The impact of growth in our portfolio in 2008 was largely offset by reduced yields as a result of a decline in interest rates in 2008.
Insurance Premiums and Guarantee fees – Insurance premiums and guarantee fees totaled $172 million in 2008, an increase of 15% from 2007 as a result of the increased business volume in 2008, primarily in the credit insurance program.
Administrative Expenses – Administrative expenses were $240 million in 2008, an increase of $21 million, or 10% over the 2007 level of $219 million. The increase was the result of higher human resources costs in addition to an overall increase in costs required to manage the higher business volume. During 2008 management focused on cost containment as our business grew and as a result, although business volume exceeded our Corporate Plan by 16%, our administrative expenses were 2% below plan.
Impact of Foreign Exchange Translation on Financial Results
Toward the end of 2008 we saw a weakening of the Canadian dollar relative to the U.S. dollar. The impact of the weaker Canadian dollar was an increase in our assets and liabilities which are primarily denominated in U.S. dollars and are translated to Canadian dollars at rates prevailing at the balance sheet date. Our business volume and the components of net income are translated into Canadian dollars at average exchange rates. Since the weakening of the Canadian dollar did not happen until the latter part of the year the foreign exchange impact on these items was minimal as there was very little movement in the average rate between 2007 and 2008.
Had the Canadian dollar remained stable relative to the U.S. dollar during 2008:
| ► | | Gross loans receivable would have been $25.4 billion, instead of $30.9 billion, a decrease of 18% |
| |
| ► | | Total assets would have been $29.5 billion, instead of $35.3 billion, a decrease of 16% |
| |
| ► | | Total business volume would have been $86.4 billion, instead of $85.8 billion, an increase of less than 1% |
| | |
| 1 | | Under Canada Account, the Government of Canada is able to authorize support for transactions which, on the basis of EDC’s risk management practices, would not be supported under EDC’s Corporate Account and are in the national interest. |
EDC Annual Report 2008 | 39
Management’s Discussion and Analysis
Income Statement Discussion
Net Financing and Investment Income
Net Finance Margin
The net finance margin represents net financing and investment income expressed as a percentage of average performing assets. Net financing and investment income consists of loan, leasing and investment revenues net of interest expense and leasing and financing related expenses. Our net finance margin decreased from 3.80% in 2007 to 3.25% in 2008.
Our net finance margin in 2008 was 55 basis points lower than 2007 primarily due to the recognition of additional loan revenue in 2007 as a result of the restructuring of impaired loans and the recognition in income of non-accrued capitalized interest1 due to a sovereign loan prepayment. Excluding these items from the analysis, the underlying net finance margin was in-line with that experienced in 2007. Lower interest rates and a shift in our investment portfolio to higher quality, lower yielding instruments due to the difficult financial market conditions, impacted the yield on our performing assets. This was largely offset by a reduction in our cost of funds as a result of the decline in interest rates, as well as our ability to obtain financing at more attractive rates due to the demand for securities issued by higher quality entities.
The variability in the net finance margin over the past five years is largely a result of the impact of debt relief revenue on our margin.
| | | | | | | | | | | | | | | | | | | | | |
| (in millions of Canadian dollars) | | 2008 | | | 2007 | | | 2006 | | | 2005 | | | 2004 | |
| |
| Average gross loans receivable | | | 23,108 | | | | 19,110 | | | | 18,057 | | | | 18,776 | | | | 20,671 | |
| Average capital lease assets | | | 128 | | | | 129 | | | | — | | | | — | | | | — | |
| Average operating lease assets | | | 430 | | | | 395 | | | | 223 | | | | — | | | | — | |
| Average investment portfolio balance | | | 2,731 | | | | 2,553 | | | | 2,827 | | | | 3,980 | | | | 3,104 | |
| Less: average impaired loans | | | 726 | | | | 853 | | | | 2,494 | | | | 2,526 | | | | 1,733 | |
| |
| Total average income earning assets | | $ | 25,671 | | | $ | 21,334 | | | $ | 18,613 | | | $ | 20,230 | | | $ | 22,042 | |
| |
| Financing and investment revenue: | | | | | | | | | | | | | | | | | | | | |
| Loan | | | 1,350 | | | | 1,405 | | | | 1,174 | | | | 1,155 | | | | 1,148 | |
| Debt relief | | | — | | | | 1 | | | | 261 | | | | 64 | | | | 43 | |
| Capital lease | | | 9 | | | | 8 | | | | — | | | | — | | | | — | |
| Operating lease | | | 43 | | | | 37 | | | | 4 | | | | — | | | | — | |
| Investment | | | 81 | | | | 123 | | | | 123 | | | | 123 | | | | 63 | |
| |
| Total financing and investment revenue | | | 1,483 | | | | 1,574 | | | | 1,562 | | | | 1,342 | | | | 1,254 | |
| Interest expense | | | 611 | | | | 717 | | | | 628 | | | | 494 | | | | 345 | |
| Leasing and financing related expenses | | | 38 | | | | 46 | | | | 19 | | | | — | | | | — | |
| |
| Net financing and investment income | | $ | 834 | | | $ | 811 | | | $ | 915 | | | $ | 848 | | | $ | 909 | |
| |
| Net finance margin | | | 3.25 | % | | | 3.80 | % | | | 4.92 | % | | | 4.19 | % | | | 4.12 | % |
| |
Loan Revenue
Loan revenue was $1,350 million in 2008, a decrease of $55 million from 2007. The decrease was the result of several offsetting factors.
Performing loan interest revenue increased by $42 million over 2007. Growth, primarily in the floating rate portfolio, resulted in a $280 million increase in performing loan revenue, which was partially offset by a $229 million reduction due to lower yields.
The increase in interest revenue on performing loans was offset by a reduction in the amount of non-accrued capitalized interest amortized, in addition to a decrease in impaired revenue. The reduction of $67 million in the recognition of revenue from the amortization of non-accrued capitalized interest was the result of a loan prepayment from Peru in 2007. Impaired revenue decreased by $53 million from 2007. In 2007, impaired revenue totaled $109 million as a result of the restructuring of impaired loans. Impaired revenue totaled $56 million in 2008 which included $38 million in income recognized as a result of sovereign impaired loan revaluations, and $14 million recognized due to a loan prepayment from Jordan.
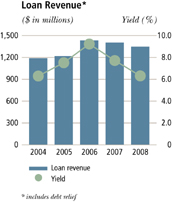
| | |
| 1 | | Non-accrued capitalized interest represents interest that was capitalized as principal through the rescheduling of loans while they were impaired. This interest was not recognized as income while the loan was classified as impaired and upon reinstatement of the loan to performing status the non-accrued capitalized interest is recognized into income over the remaining term of the loan. |
40 | Managing Risk. Maximizing Opportunities.
Management’s Discussion and Analysis
Components of the change in loan revenue from 2007
| | | | | |
| (in millions of Canadian dollars) | | 2008 | |
| |
| Revenue from portfolio growth | | | 280 | |
| Decrease in revenue from lower yield | | | (229 | ) |
| Foreign exchange impact on loan revenue | | | (9 | ) |
| |
| | | | 42 | |
| Decrease in amortization of non-accrued capitalized interest due to a sovereign prepayment | | | (67 | ) |
| Decrease in impaired revenue | | | (53 | ) |
| Increase in loan fees and other loan revenue | | | 23 | |
| |
| Net change in loan revenue | | $ | (55 | ) |
| |
Loan Interest Yield
The total loan yield was 6.03% for 2008, a decrease from the 2007 yield of 7.70% primarily as a result of lower interest rates, lower impaired revenue, and a reduction in the recognition of income from the amortization of non-accrued capitalized interest.
| | | | | | | | | | | | | | | | | | | | | |
| (in millions of Canadian dollars) | | 2008 | | | 2007 | | | 2006 | | | 2005 | | | 2004 | |
| |
| Gross loans receivable: | | | | | | | | | | | | | | | | | | | | |
| Average performing floating rate | | | 13,635 | | | | 10,336 | | | | 7,858 | | | | 7,230 | | | | 8,645 | |
| Average performing fixed rate | | | 8,747 | | | | 7,921 | | | | 7,705 | | | | 9,020 | | | | 10,293 | |
| |
| Average performing gross loans receivable | | $ | 22,382 | | | $ | 18,257 | | | $ | 15,563 | | | $ | 16,250 | | | $ | 18,938 | |
| |
| Loan revenue: | | | | | | | | | | | | | | | | | | | | |
| Performing floating rate interest | | | 672 | | | | 667 | | | | 498 | | | | 327 | | | | 273 | |
| Performing fixed rate interest | | | 544 | | | | 507 | | | | 501 | | | | 566 | | | | 678 | |
| Other loan revenue | | | 134 | | | | 231 | | | | 175 | | | | 262 | | | | 197 | |
| |
| Loan revenue | | | 1,350 | | | | 1,405 | | | | 1,174 | | | | 1,155 | | | | 1,148 | |
| Debt relief revenue | | | — | | | | 1 | | | | 261 | | | | 64 | | | | 43 | |
| |
| Loan revenue (including debt relief) | | $ | 1,350 | | | $ | 1,406 | | | $ | 1,435 | | | $ | 1,219 | | | $ | 1,191 | |
| |
| Yields – performing loans | | | | | | | | | | | | | | | | | | | | |
| Performing floating rate coupon | | | 4.93 | % | | | 6.46 | % | | | 6.34 | % | | | 4.52 | % | | | 3.16 | % |
| Performing fixed rate coupon | | | 6.22 | % | | | 6.40 | % | | | 6.50 | % | | | 6.27 | % | | | 6.59 | % |
| Total loan yield | | | 6.03 | % | | | 7.70 | % | | | 9.22 | % | | | 7.50 | % | | | 6.29 | % |
| |
The average performing loans receivable balance increased by 23% from $18,257 million in 2007 to $22,382 million in 2008, as a result of record disbursements in 2008.
Performing floating rate loans receivable averaged $13,635 million in 2008, a 32% increase from $10,336 million in 2007. Net disbursements for performing floating rate loans of $5,651 million were the primary contributor to the increase in the floating rate average balance. The increase in the average balance did not translate into a corresponding increase in revenue. The floating rate portfolio earned $672 million in revenue in 2008 compared to $667 million in 2007. The impact of increased loan volume was significantly offset by a decrease in the average coupon rate from 6.46% in 2007 to 4.93% in 2008. The six-month moving average U.S. dollar LIBOR was 3.47% in 2008, a decrease of 187 basis points from the 2007 average contributing to the overall decrease in the average coupon rate. Disbursements on floating rate loans yielded 1.45% over LIBOR while repayments carried a yield of 1.91% over LIBOR. New floating rate loans signed in 2008 yielded 1.83% over LIBOR compared with 1.24% in 2007.
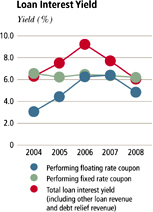
Performing fixed rate loans receivable averaged $8,747 million in 2008, a 10% increase from $7,921 million in 2007. Net disbursements for performing fixed rate loans during the year were $1,143 million which resulted in the increase in the fixed rate average balance. The fixed rate portfolio earned interest revenue of $544 million in 2008, an increase from $507 million in 2007 as a result of growth in the portfolio. The impact on loan revenue from portfolio growth was partially offset by a decrease in the average coupon yield to 6.22% (2007 – 6.40%). The coupon rate on performing fixed rate loans receivable decreased over last year as older loans earning higher interest rates were repaid and replaced by current loan disbursements carrying lower interest rates. Disbursements during the year yielded 5.46% while existing loans repaid carried a yield of 6.38%. New fixed rate loans signed in 2008 had a yield of 5.40% (2007 – 6.66%) which is slightly lower than the current yield on loan disbursements.
EDC Annual Report 2008 | 41
Management’s Discussion and Analysis
Investment Revenue
We maintain an investment portfolio in order to meet our liquidity requirements. Our liquidity policy requires that we maintain, at a minimum, enough liquidity to satisfy three months of anticipated cash flows. We typically carry a buffer of USD 100 million over our policy requirements for any unanticipated demand.
Our investment revenue consists of income earned on marketable securities, investments, and government treasury bills held during the year. Investment revenue was $81 million in 2008, a decrease of $42 million from 2007.
Although the average investment balance increased slightly from $2,553 million in 2007 to $2,731 million in 2008, a reduction in yield resulted in lower revenue.
The yield on our investment portfolio decreased from 4.82% in 2007 to 2.97% in 2008. This decrease in yield was primarily due to the combined effect of lower interest rates and a shift to lower yielding U.S. government securities in order to reduce the credit risk of the portfolio. During 2008, we divested our portfolio of securities issued by institutions that were more heavily exposed to the troubled mortgage backed securities including U.S. government sponsored entities.
Components of the change in investment revenue from 2007
| | | | | |
| (in millions of Canadian dollars) | | 2008 | |
| |
| Revenue from decreased yield | | | (50 | ) |
| Impact of volume increases | | | 8 | |
| |
| Net change in investment revenue | | $ | (42 | ) |
| |
Interest Expense
Interest expense totaled $611 million in 2008, a decrease of $106 million from 2007. This change was largely due to decreasing interest rates partially offset by an increase in our average debt balance.
Our average cost of funds decreased from 5.32% in 2007 to 3.54% in 2008, which reduced interest expense by $308 million. This was reflective of the lower average interest rates in Canada and the United States as well as the impact of tightening credit conditions on debt issuances. There was an increased demand for securities issued by high quality entities which allowed us to obtain financing at more attractive rates.
Our average debt balance for 2008 was $17,281 million (2007 – $13,488 million) which increased interest expense by $205 million. Proceeds from the increased issuance of debt were used to fund the increase in loan disbursements.
Our floating rate average debt balance was $15,473 million in 2008, an increase of $3,653 million from $11,820 million in 2007. The average cost of floating rate debt decreased from 5.30% in 2007 to 3.28% in 2008 resulting in interest expense of $507 million (2007 – $626 million).
Fixed rate debt averaged $1,808 million in 2008, an increase of $140 million from the 2007 average of $1,668 million. The average cost of fixed rate debt was 5.36% in 2008 compared to 5.21% in 2007. This resulted in interest expense of $97 million (2007 – $87 million).
Total interest expense includes other costs of $7 million (2007 – $4 million). The $3 million increase was primarily due to additional transaction costs, a result of the increased debt issuance activity in 2008.
Components of the change in interest expense from 2007
| | | | | |
| (in millions of Canadian dollars) | | 2008 | |
| |
| Decrease in cost of funds | | | (308 | ) |
| Impact of volume increases | | | 205 | |
| Foreign exchange impact | | | (3 | ) |
| |
| Net change in interest expense | | $ | (106 | ) |
| |
42 | Managing Risk. Maximizing Opportunities.
Management’s Discussion and Analysis
Loan Guarantee Fees
The following table analyzes the average premium rate for loan guarantee fees:
| | | | | | | | | | | | | | | | | |
| (in millions of Canadian dollars) | | 2008 | | | % | | | 2007 | | | % | |
| |
| Loan guarantees average exposure | | $ | 3,456 | | | | | | | $ | 2,970 | | | | | |
| Loan guarantee fees earned | | $ | 19 | | | | | | | $ | 14 | | | | | |
| |
| Average loan guarantee fee rate | | | | | | | 0.55 | | | | | | | | 0.47 | |
| |
Signings of new loan guarantees outpaced loan guarantee maturities by $882 million, resulting in an increase in the loan guarantee average exposure in 2008.
Our exposure to below investment grade guarantees increased by $538 million, which represented 36% of the total exposure in 2008, compared to 32% in 2007. The shift in the portfolio concentration explains the increase in the average loan guarantee fee rate from 0.47% in 2007 to 0.55% in 2008.
The breakdown of our loan guarantee portfolio by credit quality is as follows:
| | | | | | | | | | | | | | | | | |
| (in millions of Canadian dollars) | | 2008 | | | % | | | 2007 | | | % | |
| |
| Investment grade | | | 2,552 | | | | 63 | | | | 2,012 | | | | 68 | |
| Below investment grade | | | 1,488 | | | | 36 | | | | 950 | | | | 32 | |
| Impaired | | | 25 | | | | 1 | | | | 5 | | | | — | |
| |
| Total | | $ | 4,065 | | | | 100 | | | $ | 2,967 | | | | 100 | |
| |
Insurance Premiums and Guarantee Fees
The following table analyzes the average premium rate for insurance premiums and guarantee fees:
| | | | | | | | | | | | | | | | | |
| (in millions of Canadian dollars) | | 2008 | | | | | | | 2007 | | | | | |
| |
| | | $ | | | | | % | | | $ | | | | | % | |
| |
| Credit insurance program: | | | | | | | | | | | | | | | | |
| Credit insurance volume net of reinsurance* | | | 61,479 | | | | | | | | 46,895 | | | | | |
| Premiums and fees earned | | | 117 | | | | | | | | 98 | | | | | |
| |
| Average credit insurance premium rate | | | | | | | 0.19 | | | | | | | | 0.21 | |
| |
| Contract insurance and bonding program: | | | | | | | | | | | | | | | | |
| Contract insurance and bonding average exposure | | | 9,043 | | | | | | | | 7,832 | | | | | |
| Premiums and fees earned | | | 43 | | | | | | | | 39 | | | | | |
| |
| Average contract insurance and bonding premium rate | | | | | | | 0.48 | | | | | | | | 0.50 | |
| |
| Political risk insurance program: | | | | | | | | | | | | | | | | |
| Political risk insurance average exposure | | | 1,402 | | | | | | | | 1,232 | | | | | |
| Premiums and fees earned | | | 12 | | | | | | | | 12 | | | | | |
| |
| Average political risk insurance premium rate | | | | | | | 0.86 | | | | | | | | 0.97 | |
| |
| | |
| * | | Credit insurance volume net of reinsurance has been restated for 2007 to reflect the change in the reporting basis on a certain type of credit insurance account from gross receivables to net receivables. |
Credit insurance volume net of reinsurance increased by $14,584 million, or 31% in 2008. This was primarily due to several strategic accounts reporting significantly higher volume than in previous years, which resulted in an increase in premium revenue, but was the main contributor to a decrease in the average premium rate from 0.21% in 2007 to 0.19% in 2008. The decrease in the average premium rate was also impacted by a shift in volume to lower risk markets and to the continued effects of lower market rates experienced in 2007.
The average exposure in the contract insurance and bonding programs increased by $1,211 million or 15% over 2007, primarily due to increases in exposure in the performance security, and surety insurance programs. Contract insurance and bonding premium revenue for the year totaled $43 million, an increase of 10% over 2007.
The average exposure in the political risk insurance program increased by $170 million, or 14% over 2007. During 2007, we reinsured an additional $476 million of liability on a temporary basis, resulting in a decrease in average exposure and an increase in the average premium rate when compared to the current year.
EDC Annual Report 2008 | 43
Management’s Discussion and Analysis
Claims-Related Expenses
The composition of the claims-related expenses is as follows:
| | | | | | | | | |
| (in millions of Canadian dollars) | | 2008 | | | 2007 | |
| |
| Claims paid | | | 104 | | | | 60 | |
| Net reinsured claims paid* | | | — | | | | 2 | |
| Claims recovered | | | (24 | ) | | | (15 | ) |
| Actuarial increase in the net allowance for claims on insurance | | | 146 | | | | 54 | |
| Decrease (increase) in recoverable insurance claims** | | | (7 | ) | | | 28 | |
| Claims handling expenses | | | 3 | | | | 3 | |
| |
| Total | | $ | 222 | | | $ | 132 | |
| |
| | |
| * | | Represents the net claims paid related to the agreement with Travelers Guarantee Insurance Company whereby we assume reinsurance for joint policy domestic transactions underwritten by Travelers Guarantee Insurance Company. |
| |
| ** | | Includes change in recoverable insurance claims related to the agreement with Travelers Guarantee Insurance Company whereby we assume reinsurance for joint policy domestic transactions underwritten by Travelers Guarantee Insurance Company. |
Claims-related expenses totaled $222 million (2007 — $132 million). Included in claims-related expenses is $146 million (2007 — $54 million) for the actuarial increase in the net allowance for claims on insurance. The increase was primarily the result of our annual review of the actuarial valuation assumptions as well as due to changes in the portfolio and risk ratings. Our review of actuarial assumptions took into account the current economic environment and in particular the difficulties in the automotive and retail sectors and as a result, adjustments were made to our frequency and severity of loss assumptions and our claims incurred but not reported assumptions.
Provision for (Reversal of) Credit Losses
| | | | | | | | | | | | | | | | | | | | | |
| (in millions of Canadian dollars) | | 2008 | | | 2007 | | | 2006 | | | 2005 | | | 2004 | |
| |
| Provision for (reversal of) credit losses pertaining to: | | | | | | | | | | | | | | | | | | | | |
| Loans | | | 249 | | | | (44 | ) | | | (338 | ) | | | (471 | ) | | | (361 | ) |
| Loan commitments | | | 2 | | | | 215 | | | | 23 | | | | (34 | ) | | | 10 | |
| Loan guarantees | | | 95 | | | | 45 | | | | 14 | | | | (49 | ) | | | 39 | |
| |
| Total loan related provisions (reversal of) | | | 346 | | | | 216 | | | | (301 | ) | | | (554 | ) | | | (312 | ) |
| Reversal of provision for credit impairment in derivative financial instruments and marketable securities | | | — | | | | (20 | ) | | | — | | | | — | | | | — | |
| |
| Total provision for (reversal of) credit losses | | $ | 346 | | | $ | 196 | | | $ | (301 | ) | | $ | (554 | ) | | $ | (312 | ) |
| |
In 2008 we recorded a provision charge of $346 million related to our loan portfolio (2007 — $216 million). The provision charge was the result of portfolio growth, negative credit migration and additional allowances required due to the current global economic environment. These were partially offset by the impact of revisions made to our allowance methodology in 2008 and the annual updating of the independent variables within the allowance calculation. The revisions to our allowance methodology are more fully discussed in the section on the allowance for losses on loans, loan commitments and guarantees on page 61.
Administrative Expenses
Expressed as a percentage of adjusted net revenue (gross efficiency ratio), administrative expenses increased to 23.3% in 2008 from 22.0% in 2007. The gross efficiency ratio (GER) measures our operational efficiency as investments in people and technology are required to keep pace with the growth and complexity of the business. The change in GER in 2008 was primarily the result of an increase in administrative expenses.
Net administrative expenses for 2008 totaled $240 million, an increase of $21 million from the prior year. The increase was primarily the result of an increase in both human resources and general office costs.
In the calculation of the GER, net revenue is adjusted to exclude debt relief and the unrealized gains and losses on long-term debt and derivatives. We also adjust the net revenue to include any foreign exchange gains or losses on our available-for-sale marketable securities which are reported in other comprehensive income.
44 | Managing Risk, Maximizing Opportunities.
Management’s Discussion and Analysis
Corporate Plan Discussion
Comparison with 2008 Plan
Total export business volume for 2008 was $85.8 billion, an increase of 16% over the 2008 Corporate Plan volume of $73.7 billion. The Corporate Plan assumed an average U.S. dollar exchange rate of 1.15 for the year, while the actual average exchange rate was 1.07. Had the actual U.S. dollar average rate been 1.15 for 2008, the reported business volume would have been approximately $89.6 billion, an increase of 22% over Plan, as more than 76% of our business volume is denominated in U.S. dollars.
The increase in our total business volume was attributable to both financing and credit insurance volume exceeding the Plan. Total financing volume reached a record $14.0 billion in 2008, a 17% increase over the Corporate Plan volume of $12.0 billion while credit insurance volume exceeded the Plan by $13.4 billion or 28%. These increases were partially offset by lower than planned volume in our contract insurance and bonding, and political risk insurance programs.
Net income of $206 million in 2008 was $337 million below the 2008 Corporate Plan amount of $543 million. The major causes of this variance were lower debt relief, higher provisions for credit losses and higher claims-related expenses. The 2008 Corporate Plan forecasted $124 million in debt relief. No debt relief was received in 2008, resulting in lower net income, when compared to the Corporate Plan. The provision for credit losses was $123 million higher than the Corporate Plan, and the claims-related expenses were $131 million higher than the Plan. Both increases were the result of the current economic environment.
Administrative expenses were $240 million, $4 million lower than the Corporate Plan, primarily a result of lower than planned technology, accommodation and marketing costs, partially offset by higher than planned general office costs.
As a result of our strong operating results combined with our ability to contain administrative expenses, the gross efficiency ratio in 2008 was 23.3%, which was more favourable than the Corporate Plan of 25.3%.
In accordance with our Capital Adequacy Policy, we paid a dividend of $250 million in 2008, related to our 2007 fiscal year.
Financing and leasing assets and loans payable were higher than the Corporate Plan as a result of higher financing volume and a weaker Canadian dollar at the end of 2008 than anticipated in the Corporate Plan.
The 2008 investment balance of $3.8 billion was $1.4 billion higher than the 2008 Corporate Plan primarily as a result of maintaining extra liquidity in response to tightening credit conditions. In addition, several loan disbursements that were forecast for December did not materialize as expected and are now anticipated to occur in 2009.
2009 Corporate Plan
The 2009-2013 Corporate Plan and its underlying assumptions were developed over the summer and fall of 2008, during a period of tremendous volatility in the global economy. While the Plan and its underlying assumptions were aligned with the economic environment at the time they were developed, persistent volatility in the global economy has continued to impact the economic landscape and the assumptions on which the Corporate Plan was based. In this regard, not reflected in the Plan is $350 million in additional share capital that the Government of Canada announced it would invest in EDC in response to the current economic difficulties. The additional capital will increase EDC’s credit capacity during this period of global economic uncertainty. The $350 million was received from the Government of Canada in January 2009. Additional measures were announced in the Government of Canada’s 2009 Budget to increase EDC’s capacity to assist Canadian companies as outlined on page 39. Once implemented, these changes will likely impact EDC’s 2009 results.
Our Corporate Plan for 2009 projects export business volume of $72.4 billion, $13.4 billion lower than the 2008 volume of $85.8 billion. In 2008 the global economy changed direction after several years of growth. With prospects for recession in a growing number of countries in 2009, falling consumer confidence, tightened credit conditions, together with volatile oil prices and declining commodity prices, the 2009 Corporate Plan forecasts a slowdown in business volume.
Financing and leasing assets and loans payable balances are forecasted to remain relatively close to their 2008 levels. While on a U.S. dollar basis these amounts are forecast to increase as a result of new business volume, the increases are offset by a forecast strengthening of the Canadian dollar by the end of 2009 when compared to the actual 2008 year end exchange rate.
Net income for 2009 is planned at $148 million, a decrease of $58 million from 2008. The decrease in net income is mainly due to lower net financing and investment income, insurance premiums and guarantee fees, and other income combined with increased administrative expenses. Administrative expenses are expected to increase by $18 million to $258 million in 2009. Higher human resources costs of $9 million represent the largest component of the increase. The additional human resources costs are largely associated with higher employee staffing and benefit costs. Training, technology, accommodation and depreciation costs are also expected to increase in 2009, partially offset by a decrease in general office costs.
The 2009 Corporate Plan forecast for the gross efficiency ratio is 27.6%, an increase over the 23.3% reported for 2008. The gross efficiency ratio is not expected to be as favourable in 2009 due to increased administrative expenses and lower net revenue.
EDC Annual Report 2008 | 45
Management’s Discussion and Analysis
Volume
| | | | | | | | | | | | | |
| | | 2009 | | | 2008 | | | 2008 | |
| (in billions of Canadian dollars) | | Corporate Plan | | | Actual Results | | | Corporate Plan | |
| |
Export Financing | | | | | | | | | | | | |
| Financing | | | 11.8 | | | | 13.8 | | | | 11.8 | |
| Equity | | | 0.2 | | | | 0.2 | | | | 0.2 | |
| |
| Total financing | | | 12.0 | | | | 14.0 | | | | 12.0 | |
| |
Export Insurance | | | | | | | | | | | | |
| Contract insurance and bonding | | | 7.5 | | | | 8.0 | | | | 9.7 | |
| Political risk insurance* | | | 2.4 | | | | 2.4 | | | | 4.0 | |
| Credit insurance** | | | 50.5 | | | | 61.4 | | | | 48.0 | |
| |
| Total insurance | | | 60.4 | | | | 71.8 | | | | 61.7 | |
| |
| Total business volume | | $ | 72.4 | | | $ | 85.8 | | | $ | 73.7 | |
| |
| | | | | | | | | | | | | |
Domestic insurance not included above | | $ | 0.1 | | | $ | 0.1 | | | $ | — | |
| |
| | |
| * | | In 2008, we began reporting political risk insurance volume net of reinstatements. The 2008 Corporate Plan has been restated to remove reinstatements of $4.8 billion. |
| |
| ** | | A certain type of credit insurance account previously reported on a gross basis was reported on a net basis in 2008. |
Consolidated Statement of Income
| | | | | | | | | | | | | |
| | | 2009 | | | 2008 | | | 2008 | |
| (in millions of Canadian dollars) | | Corporate Plan | | | Actual Results | | | Corporate Plan | |
| |
| Financing and investment revenue | | | | | | | | | | | | |
| Loan | | | 1,502 | | | | 1,350 | | | | 1,496 | |
| Capital lease | | | 9 | | | | 9 | | | | 9 | |
| Operating lease | | | 32 | | | | 43 | | | | 49 | |
| Debt relief | | | 8 | | | | — | | | | 124 | |
| Investment | | | 73 | | | | 81 | | | | 104 | |
| |
| | | | 1,624 | | | | 1,483 | | | | 1,782 | |
| Interest expense | | | 783 | | | | 611 | | | | 839 | |
| Leasing and financing related expenses | | | 47 | | | | 38 | | | | 37 | |
| |
| Net financing and investment income | | | 794 | | | | 834 | | | | 906 | |
| Loan guarantee fees | | | 17 | | | | 19 | | | | 17 | |
| Insurance premiums and guarantee fees | | | 162 | | | | 172 | | | | 182 | |
| Other income (expense) | | | (15 | ) | | | (11 | ) | | | (4 | ) |
| |
| | | | 958 | | | | 1,014 | | | | 1,101 | |
| Provision for credit losses | | | 464 | | | | 346 | | | | 223 | |
| Claims-related expenses | | | 88 | | | | 222 | | | | 91 | |
| Administrative expenses | | | 258 | | | | 240 | | | | 244 | |
| |
| Net income | | $ | 148 | | | $ | 206 | | | $ | 543 | |
| |
Certain Corporate Plan amounts have been reclassified to conform to the current presentation
Consolidated Statement of Comprehensive Income
| | | | | | | | | | | | | |
| (in millions of Canadian dollars) | | | | | | | | | | | | |
| |
Net Income | | | 148 | | | | 206 | | | | 543 | |
| |
| | | | | | | | | | | | | |
Other Comprehensive Income | | | | | | | | | | | | |
| Net unrealized gains (losses) on available-for-sale marketable securities | | | (14 | ) | | | 152 | | | | (6 | ) |
| Reclassification of gains on available-for-sale marketable securities to income | | | — | | | | (16 | ) | | | — | |
| |
| Other comprehensive income (loss) | | | (14 | ) | | | 136 | | | | (6 | ) |
| |
| Comprehensive Income | | $ | 134 | | | $ | 342 | | | $ | 537 | |
| |
46 | Managing Risk, Maximizing Opportunities.
Management’s Discussion and Analysis
Consolidated Balance Sheet
| | | | | | | | | | | | | |
| | | 2009 | | | 2008 | | | 2008 | |
| (in millions of Canadian dollars) | | Corporate Plan | | | Actual Results | | | Corporate Plan | |
| |
Assets | | | | | | | | | | | | |
| Cash and marketable securities | | | 2,098 | | | | 3,843 | | | | 2,423 | |
| |
| | | | | | | | | | | | | |
Financing and Leasing Assets | | | | | | | | | | | | |
| Loans receivable | | | 29,762 | | | | 30,209 | | | | 25,878 | |
| Allowance for losses on loans | | | (2,117 | ) | | | (1,928 | ) | | | (1,306 | ) |
| Risk mitigation insurer’s share of loan allowance | | | 45 | | | | — | | | | 22 | |
| Equity financing designated as held-for-trading | | | 306 | | | | 150 | | | | 254 | |
| Net investment in capital leases | | | 121 | | | | 142 | | | | 116 | |
| Equipment available for lease | | | 254 | | | | 334 | | | | 390 | |
| |
| | | | 28,371 | | | | 28,907 | | | | 25,354 | |
| |
| | | | | | | | | | | | | |
Other | | | | | | | | | | | | |
| Accrued interest and other assets | | | 445 | | | | 468 | | | | 464 | |
| Derivative instruments | | | 1,849 | | | | 1,830 | | | | 1,801 | |
| Reinsurers’ share of allowance for claims | | | 109 | | | | 157 | | | | 78 | |
| Property, plant and equipment | | | 22 | | | | 15 | | | | 12 | |
| Intangible assets | | | 42 | | | | 36 | | | | 29 | |
| |
| | | | 2,467 | | | | 2,506 | | | | 2,384 | |
| |
| Total Assets | | $ | 32,936 | | | $ | 35,256 | | | $ | 30,161 | |
| |
| |
Liabilities and Shareholder’s Equity | | | | | | | | | | | | |
| Loans payable | | | 24,964 | | | | 25,882 | | | | 21,994 | |
| Accounts payable and other liabilities | | | 219 | | | | 296 | | | | 298 | |
| Derivative instruments | | | 317 | | | | 1,400 | | | | 222 | |
| Allowance for losses on loan commitments and guarantees | | | 647 | | | | 807 | | | | 784 | |
| Allowance for claims on insurance | | | 580 | | | | 755 | | | | 546 | |
| |
| Total Liabilities | | | 26,727 | | | | 29,140 | | | | 23,844 | |
| |
| | | | | | | | | | | | | |
Shareholder’s Equity | | | | | | | | | | | | |
| Share capital | | | 983 | | | | 983 | | | | 983 | |
| Retained earnings | | | 5,254 | | | | 5,077 | | | | 5,415 | |
| Accumulated other comprehensive income | | | (28 | ) | | | 56 | | | | (81 | ) |
| |
| Shareholder’s Equity | | | 6,209 | | | | 6,116 | | | | 6,317 | |
| |
| Total Liabilities and Shareholder’s Equity | | $ | 32,936 | | | $ | 35,256 | | | $ | 30,161 | |
| |
Certain Corporate Plan amounts have been reclassified to conform to the current presentation.
EDC Annual Report 2008 | 47
Management’s Discussion and Analysis
RISK MANAGEMENT
Overview
We ensure that on a self-sustaining basis we have sufficient financial capacity to support risks acquired in the ongoing fulfillment of our mandate and in responding to the evolving needs of Canadian exporters and investors. The risk environment in 2008 was very volatile and management expects such volatility to continue in 2009.
Through our business activities, we are exposed to a broad number of risks that have been identified and defined in our Enterprise Risk Management Framework. This Framework forms the foundation for appropriate risk oversight processes and the consistent communication and reporting of key risks that could have an impact on our execution of corporate strategies and our achievement of business objectives.
Under the Enterprise Risk Management Framework, key risks are identified and managed under the risk categories of credit, market, and operational (which includes organizational and business risks). The management of these risks is accomplished through the development and communication of policies, the establishment of formal risk review and approval processes, and the establishment of delegated authorities and limits.
Management is surveyed annually with respect to the risks or challenges facing our organization and results are detailed in an Enterprise Risk Management Report along with a risk map and presented to the Board of Directors.
Risk Governance Structure
The responsibilities of the various stakeholders of risk management are as follows:
Board of Directors
The Board of Directors (the “Board”) provides oversight and carries out its mandate with respect to risk and capital management through the Risk Management Committee of the Board and the Audit Committee of the Board. The Board of Directors maintains overall responsibility for approval of (i) risk management and accounting policies, (ii) our Code of Business Ethics and Code of Conduct and (iii) the Environmental Review Directive. The Board of Directors also maintains oversight responsibilities for the management of the credit, market and other enterprise risks of the Corporation, as well as oversight of the appropriateness of internal control systems and policies governing Corporate Social Responsibility.
Risk Management Committee of the Board
This Committee assists the Board in fulfilling its oversight responsibilities with respect to the prudent management of our capital structure, including the management of the credit, market and other enterprise risks of the Corporation.
Audit Committee of the Board
This Committee assists the Board in fulfilling its oversight responsibilities with respect to our standards of integrity and behaviour, financial reporting, and internal control systems. The Audit Committee also monitors our corporate compliance program.
Executive Management Team
The Executive Management team has primary responsibility for the management of our risks, standards of integrity and behaviour, financial reporting, and internal control systems. The Executive Management team undertakes this responsibility through various management oversight committees, by ensuring an appropriate organizational structure and governing policies are in place, and through independent validation by audit.
Management Risk Management Committee
This committee provides an independent endorsement as to the acceptability of certain credit commitments and acts as the authority for recommending risk policies to the Board for approval, and establishing internal risk management policies and procedures.
48 | Managing Risk, Maximizing Opportunities.
Management’s Discussion and Analysis
Asset Liability Management Committee
This committee acts as authority for recommending Market Risk Management policies to the Board for approval, and ensuring that policies are supported by appropriate procedures and practices for the measurement, management and reporting of market risk. In addition, the committee ensures that treasury risk positions are managed within policy limits, and addresses such risk practices as diversification requirements, and reporting and monitoring of guidelines.
Risk Transfer Committee
This committee acts as authority to approve recommendations for certain secondary risk transfer activities for portfolio management purposes.
While all areas of EDC have some responsibility for risk management, the three key risk management groups are the Risk Management Office, Corporate Finance and Control, and Internal Audit.
Risk Management Office (RMO)
RMO is responsible for risk policy and management of the financial risks impacting the Corporation including credit risk, market risk, capital adequacy and liquidity risk. This includes developing and maintaining policies and standards that reflect our risk appetite and comprehensive and timely reporting to management and the Board on major risks being assumed or facing the organization. RMO also identifies and reports to the Board on broader enterprise wide risks including operational and organizational risks.
Corporate Finance and Control (CFC)
CFC is responsible for financial planning, accounting, financial reporting, procurement, as well as cash receipts and disbursements. CFC ensures that appropriate controls exist to ensure complete and accurate financial reporting and effective cash management.
Internal Audit (IA)
IA independently monitors and reports on the effectiveness, adequacy and sustainability of business processes, risk management processes and related internal controls used by management to achieve our business objectives. All activities of the organization are within the scope of the internal audit group’s responsibility. IA uses a risk-based audit methodology that is reflective of the Institute of Internal Auditors standards, incorporates Enterprise Risk Management and includes input from management. IA reports directly to the Audit Committee of the Board of Directors, in addition to communicating results to auditees, leaders and executive management.
As permitted by the Canadian Institute of Chartered Accountants (CICA) Handbook Section 3862 — Financial Instruments — Disclosures, we have displayed certain parts of our Management’s Discussion and Analysis, which discuss the nature, extent and management of credit, liquidity and market risks, in a brown-tinted font. These disclosures form an integral part of our audited consolidated financial statements for the year ended December 31, 2008.
Credit Risk Management
Credit risk is the risk of loss incurred if a counterparty fails to meet its financial commitments. We are exposed to credit risk under our loans and insurance programs and treasury activities. Credit risk market conditions deteriorated throughout 2008 resulting in reduced market liquidity and increased defaults.
We manage credit risk in the organization through policy requirements, established authorities and limits, mitigation activities and reporting. Our Credit Risk Management Policy sets out our requirements on credit granting, concentration, counterparty and country limits, risk rating, exposure measurement, monitoring and review, portfolio management and risk transfer, as well as management and Board reporting.
Credit Granting
We deliver our products and services through sector-based business teams grouped under insurance or financing. The business teams are responsible for the proper due diligence associated with each credit commitment. Every credit commitment requires recommendation and approval. Credit commitments in excess of certain thresholds also require independent endorsement by the Risk Management Office (RMO) or the Management Risk Management Committee. The purpose of endorsement is to ensure that all relevant, tangible risks in the proposed credit commitment have been identified, assessed and mitigated where possible. The credit rating of a transaction and/or the dollar amount of exposure at risk determines whether endorsement must be provided by the Management Risk Management Committee or the RMO. All transactions above U.S. $300 million require authorization by the Board of Directors. However, this threshold can be reduced as low as U.S. $200 million for transactions with lower credit quality. In 2008 we implemented improvements to our credit approval process as part of a broader initiative to improve the efficiency of our loan underwriting process while retaining our quality standards. The principal elements of this new process include early involvement of a senior management committee in the transaction review process and more integrated engagement on transactions between our risk management, underwriting, and business development professionals.
An area of significant concern in 2008 was financial institution counterparty risk. We bear counterparty risk through our treasury liquidity and derivative portfolios. Treasury counterparties are analyzed and credit limits are recommended by Market Risk Management (MRM), a team within the RMO. Recommended counterparties are endorsed by either the RMO or Management Risk Management Committee. Every treasury credit commitment requires the approval of at least two individuals with delegated approval authority. All treasury credit exposures are measured on a fair value basis and compliance with policy and operational limits is measured daily. The Department of Finance sets out guidelines that define the minimum acceptable counterparty credit rating pertaining to our investments and derivative financial instruments. In addition, we have policies and procedures in place to limit and to manage the credit risk associated with these financial instruments and to define collateral requirements for treasury counterparties.
EDC Annual Report 2008 | 49
Management’s Discussion and Analysis
Concentration Limits
To ensure diversification of risks within our credit commitments, we have established risk limits in place to protect against being overly concentrated to any one country, industry sector or commercial obligor. All limits are determined based on our capital base and risk factors associated with the exposure including, the obligor rating, country rating, associated collateral and EDC product type. Exposures beyond the risk limits require either Presidential approval within discretionary limits or review by the Risk Management Committee and approval of the Board of Directors.
Risk Ratings
We have developed risk rating methodologies for all of our product lines. Many of the obligor risk rating methodologies use a combination of Moody’s and/or Standard & Poor’s external ratings and/or our internal ratings based (IRB) methodologies. Some of our IRB methodologies use vendor provided credit risk analysis/ratings tools such as Moody’s Financial Analyst, Risk Advisor, and RiskCalc. At the credit granting stage, all obligors are rated except for obligors with very small exposures (typically representing less than 1% of total exposure). We rate our obligors on a rating scale of between 8 and 16 credit grades depending on the product type. The obligor risk ratings are reviewed on a regular basis. Our Economics team is responsible for establishing, monitoring and approving country risk ratings. The country risk ratings are based on a letter grade rating system, like that of the external rating agencies; and correspond to the OECD’s zero to seven scale. Country risk is continually reviewed by the department to take into consideration any changes in the world environment or a specific country.
With respect to treasury related counterparties, each counterparty must be rated by at least two external rating agencies for credit exposure of greater than one year term to maturity, and at least one external rating agency for credit exposure of less than one year term to maturity. The risk rating for treasury counterparties is determined by the external ratings.
Exposure Measurement
To ensure that the level of credit risk is transparent to both Management and the Board of Directors, our credit exposure measurement guideline requires information reporting and comparison of the aggregated exposures within a portfolio against prescribed limits such as country, industry, and commercial obligor. We also report on approved short-term buyer limits under our accounts receivable insurance program.
Monitoring and Review
Our operating practices include ongoing monitoring of credit exposures. Specialized teams have been created to monitor and manage credit exposure within the different product lines which include monitoring of events in the country and industry of the obligor. The Asset Management team within the RMO is responsible for managing the credit quality and financial performance of our portfolio of commercial loans and guarantees both at the transaction and portfolio levels. This specialized team undertakes loan reviews and risk ratings, and regularly monitors borrowers and the credit risk environment including research and assessment of financial, operating and industry trends. Our portfolio of credit insurance counterparties is actively monitored by our Risk Assessment and Portfolio Management team. In addition, deteriorating credits are managed by teams that specialize in restructurings, Paris Club reschedulings, claims, and recoveries. Management and the Board of Directors are frequently apprised on the credit quality of the portfolio through regular reporting including quarterly detailed reporting on the breakdown of the portfolio by risk ratings, impaired obligors, loan write-offs and claims information.
Portfolio Management and Risk Transfer
The goal of portfolio management is to ensure our ability to pursue mandate related opportunities while taking into consideration the availability of financial resources and limit constraints. Management and our Board of Directors are regularly updated on our portfolio of credit exposures through quarterly compliance reporting against concentration limits. We use both primary and secondary portfolio management activities to address imbalances or excess concentrations including, but not limited to, syndication at credit origination, the sale of assets, insurance, reinsurance and hedging using credit derivatives.
We introduced further polices and procedures in 2008 to facilitate somewhat more extensive use of credit derivatives for risk mitigation purposes. We also implemented various process changes in our Portfolio Management group in anticipation of greater levels of portfolio issues resulting from the deteriorating economic and credit market environment.
Management and Board Reporting
RMO provides timely and comprehensive risk reporting to Management and the Board on major risks being assumed by or facing EDC, enabling appropriate management and oversight. This reporting includes, but is not limited to a (i) quarterly risk management report, (ii) monthly credit risk policy compliance report, (iii) monthly capital adequacy report, and (iv) monthly report detailing our liquidity position. In addition, significant credit risk issues and action plans are tracked and reported to ensure management accountability and attention are maintained.
50 | Managing Risk, Maximizing Opportunities.
Management’s Discussion and Analysis
Concentration of Exposure
The major concentrations of total gross commercial and sovereign exposure in the geographic market and country in which the risk resided at the end of 2008 are outlined below:
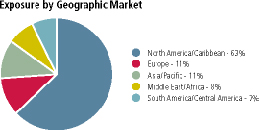
| | | | | | | | | | | | | | | | | | | | | | | | | | | | | | | | | | | | | |
| | | Financing portfolio | | | Contingent liabilities | | | | | | | |
| (in millions of | | Financing | | | | | | | Credit Contract insurance | | | | | | | Political risk | | | Investments and | | | | |
| Canadian dollars) | | assets(1) | | | Commitments(2) | | | insuranCe | | | and bonding | | | Guarantees(3) | | | insurance | | | derivative instruments(4) | | | 2008 Exposure | |
| |
Country | | | | | | | | | | | | | | | | | | | | | | | | | | | | | | | $ | | | | % | |
| |
| United States | | | 14,099 | | | | 5,035 | | | | 4,000 | | | | 861 | | | | 5,274 | | | | — | | | | 1,885 | | | | 31,154 | | | | 40 | |
| Canada | | | 2,542 | | | | 1,972 | | | | 88 | | | | 4,103 | (5) | | | 1,097 | | | | — | | | | 2,856 | | | | 12,658 | | | | 16 | |
| Mexico | | | 2,138 | | | | 427 | | | | 251 | | | | 49 | | | | 214 | | | | — | | | | — | | | | 3,079 | | | | 4 | |
| Brazil | | | 1,123 | | | | 250 | | | | 771 | | | | 25 | | | | 33 | | | | 51 | | | | — | | | | 2,253 | | | | 3 | |
| India | | | 1,372 | | | | 474 | | | | 336 | | | | 2 | | | | 54 | | | | — | | | | — | | | | 2,238 | | | | 3 | |
| China | | | 984 | | | | 15 | | | | 697 | | | | 51 | | | | 174 | | | | 12 | | | | — | | | | 1,933 | | | | 3 | |
| United Kingdom | | | 822 | | | | 116 | | | | 214 | | | | 17 | | | | 78 | | | | — | | | | 224 | | | | 1,471 | | | | 2 | |
| Chile | | | 945 | | | | 260 | | | | 189 | | | | 6 | | | | 33 | | | | — | | | | — | | | | 1,433 | | | | 2 | |
| Russia | | | 652 | | | | 151 | | | | 454 | | | | 12 | | | | 48 | | | | 47 | | | | — | | | | 1,364 | | | | 2 | |
| United Arab Emirates | | | 474 | | | | 370 | | | | 226 | | | | 17 | | | | 173 | | | | — | | | | — | | | | 1,260 | | | | 2 | |
Other(6) | | | 6,095 | | | | 2,686 | | | | 4,531 | | | | 255 | | | | 2,353 | | | | 1,444 | | | | 708 | | | | 18,072 | | | | 23 | |
| |
| Total | | $ | 31,246 | | | $ | 11,756 | | | $ | 11,757 | | | $ | 5,398 | | | $ | 9,531 | | | $ | 1,554 | | | $ | 5,673 | | | $ | 76,915 | | | | 100 | |
| |
| | |
| (1) | | Includes gross loans receivable, equity financing and gross investment in capital leases. |
| |
| (2) | | Includes $279 million of equity financing commitments and $149 million of letters of offer for loan guarantees. |
| |
| (3) | | Includes $4,065 million of loan guarantees. |
| |
| (4) | | Investments include amounts represented by cash and marketable securities. Exposure does not take into consideration any collateral or the effect of any master netting agreements with derivative counterparties. |
| |
| (5) | | Includes $4,101 million of surety bond insurance where risk rests with the exporter. A total of 83% of the exports insured in the surety bond program are to the United States. The balance represents exports to other countries. |
| |
| (6) | | Includes 173 countries with total exposure ranging from $0.001 million to $889 million. |
The major concentrations of total gross exposure by industry in which the risk resided at the end of 2008 are outlined below:
| | | | | | | | | | | | | | | | | | | | | | | | | | | | | | | | | | | | | |
| | | Financing portfolio | | | Contingent liabilities | | | | | | | |
| (in millions of | | Financing | | | | | | | Credit Contract insurance | | | | | | | Political risk | | | Investments and | | | | |
| Canadian dollars) | | assets(1) | | | Commitments(2) | | | insurance | | | and bonding | | | Guarantees(3) | | | insurance | | | derivative instruments(4) | | | 2008 Exposure | |
| |
Industry | | | | | | | | | | | | | | | | | | | | | | | | | | | | | | | $ | | | | % | |
| |
| Commercial | | | | | | | | | | | | | | | | | | | | | | | | | | | | | | | | | | | | |
| Transportation | | | 13,871 | | | | 3,359 | | | | 894 | | | | 1,329 | | | | 2,929 | | | | 89 | | | | — | | | | 22,471 | | | | 29 | |
| Extractive | | | 5,546 | | | | 3,833 | | | | 2,997 | | | | 120 | | | | 662 | | | | 802 | | | | — | | | | 13,960 | | | | 18 | |
Infrastructure and environment(5) | | | 2,427 | | | | 1,702 | | | | 609 | | | | 3,216 | | | | 4,479 | | | | 483 | | | | — | | | | 12,916 | | | | 17 | |
| Financial institutions | | | 1,265 | | | | 758 | | | | 4,080 | | | | — | | | | 196 | | | | — | | | | 3,812 | | | | 10,111 | | | | 13 | |
| Information and communication technology | | | 4,862 | | | | 1,313 | | | | 809 | | | | 474 | | | | 354 | | | | 85 | | | | — | | | | 7,897 | | | | 10 | |
| Resource | | | 642 | | | | 149 | | | | 1,538 | | | | 57 | | | | 295 | | | | 54 | | | | — | | | | 2,735 | | | | 4 | |
| Light manufacturing | | | 104 | | | | 199 | | | | 830 | | | | 202 | | | | 339 | | | | 41 | | | | — | | | | 1,715 | | | | 2 | |
| Other | | | 115 | | | | 278 | | | | — | | | | — | | | | 277 | | | | — | | | | 146 | | | | 816 | | | | 1 | |
| |
| Total commercial | | | 28,832 | | | | 11,591 | | | | 11,757 | | | | 5,398 | | | | 9,531 | | | | 1,554 | | | | 3,958 | | | | 72,621 | | | | 94 | |
| Sovereign | | | 2,414 | | | | 165 | | | | — | | | | — | | | | — | | | | — | | | | 1,715 | | | | 4,294 | | | | 6 | |
| |
| Total | | $ | 31,246 | | | $ | 11,756 | | | $ | 11,757 | | | $ | 5,398 | | | | $9,531 | | | $ | 1,554 | | | $ | 5,673 | | | $ | 76,915 | | | | 100 | |
| |
| | |
| (1) | | Includes gross loans receivable, equity financing and gross investment in capital leases. |
| |
| (2) | | Includes $279 million of equity financing commitments and $149 million of letters of offer for loan guarantees. |
| |
| (3) | | Includes $4,065 million of loan guarantees. |
| |
| (4) | | Investments include amounts represented by cash and marketable securities. Exposure does not take into consideration any collateral or the effect of any master netting agreements with derivative counterparties. |
| |
| (5) | | Excludes financial institution exposure which is disclosed separately in this table. |
EDC Annual Report 2008 | 51
Management’s Discussion and Analysis
Concentration of Exposure — Loan Portfolio
Our gross loans receivable grew by 62% to $30,898 million at the end of December 2008. Net loan disbursements were $6,735 million, more than double the $2,794 million experienced in 2007. In addition to the significant increase in disbursements, foreign exchange translation accounted for $5,025 million of the overall increase of $11,790 million.
The growth in loans receivable continued to be entirely within our commercial loan portfolio. Loan signings with commercial borrowers accounted for 99% of the total signing volume of $13,793 million in 2008 and 100% of the total signing volume of $12,468 million in 2007. As a result, over the past five years, commercial loans as a percentage of total loans receivable increased from 76% in 2004 to 92% in 2008. A continuing trend of net repayments experienced in the sovereign loan portfolio has also contributed to increased concentration of commercial loans over the past five years. Although the balance of sovereign loans increased slightly from $2,244 million in 2007 to $2,414 million in 2008, this increase was due to the impact of foreign exchange translation offsetting the net repayments within the sovereign portfolio.
The table below shows the five-year trend in loan-related financing transactions and customers supported.
| | | | | | | | | | | | | | | | | | | | | |
| | | 2008 | | | 2007 | | | 2006 | | | 2005 | | | 2004 | |
| |
| Number of financing transactions signed | | | 1,246 | | | | 1,156 | | | | 1,054 | | | | 730 | | | | 632 | |
Average transaction value (in millions of Canadian dollars) | | $ | 11 | | | $ | 11 | | | $ | 9 | | | $ | 7 | | | $ | 10 | |
| Number of customers supported | | | 543 | | | | 594 | | | | 515 | | | | 380 | | | | 320 | |
Commercial Loans and Loan Guarantees
We have the following industry of risk concentrations for our commercial loans and guarantees:
| | | | | | | | | | | | | | | | | | | | | | | | | | | | | |
| | | Gross loans | | | | | | | Loan | | | Total | | | | | | | Total | | | | |
| (in millions of Canadian dollars) | | receivable | | | Commitments | | | guarantees | | | exposure | | | 2008 | | | exposure | | | 2007 | |
| |
Industry | | | | | | | | | | | | | | | $ | | | | % | | | | $ | | | | % | |
| |
| Aerospace | | | 8,818 | | | | 2,674 | | | | 82 | | | | 11,574 | | | | 27 | | | | 7,932 | | | | 29 | |
| Extractive | | | 5,546 | | | | 3,833 | | | | 269 | | | | 9,648 | | | | 22 | | | | 5,463 | | | | 20 | |
| Surface transportation | | | 4,852 | | | | 685 | | | | 2,293 | | | | 7,830 | | | | 18 | | | | 6,453 | | | | 23 | |
| Infrastructure and environment | | | 3,688 | | | | 2,458 | | | | 537 | | | | 6,683 | | | | 15 | | | | 3,198 | | | | 12 | |
| Information and communication technology | | | 4,834 | | | | 1,311 | | | | 162 | | | | 6,307 | | | | 14 | | | | 3,675 | | | | 13 | |
| Other | | | 746 | | | | 351 | | | | 445 | | | | 1,542 | | | | 4 | | | | 921 | | | | 3 | |
| |
| Total | | $ | 28,484 | | | $ | 11,312 | | | $ | 3,788 | | | $ | 43,584 | | | | 100 | | | $ | 27,642 | | | | 100 | |
| |
The commercial loans and guarantees portfolio has increased by $15,942 million or 58% from 2007, as a result of higher net disbursements and higher signing volume in 2008, and foreign exchange translation due to the weakening of the Canadian dollar. Disbursements on commercial loans exceeded repayments by $6,973 million, contributing to an increase in gross loans receivable. Higher signing volume in 2008 also resulted in an increase in undisbursed amounts on signed commercial loan agreements of $1,956 million.
This growth resulted in greater diversification as seen in the distribution of exposure among the five largest industry sectors. The sector showing the largest change from 2007 was the infrastructure and environment sector which more than doubled from 2007 and now accounts for 15% of the total exposure compared to 12% in 2007. This increase reflected in part, the results of concerted efforts to develop corporate financing opportunities with several strategic accounts as well as greater support for the foreign investment activity of various Canadian investors.
52 | Managing Risk, Maximizing Opportunities.
Management’s Discussion and Analysis
As depicted here, the aerospace, extractive and surface transportation sectors represented the largest proportion of our commercial exposure. Together, these three sectors accounted for 67% of our total commercial exposure (2007 — 72%). This is reflective of the importance of these three exporting sectors in the Canadian economy, whose share of total Canadian exports was 59% in 2008 (2007 — 56%). Our exposure in all sectors increased due to overall portfolio growth and foreign exchange translation due to the weakening of the Canadian dollar.
Our largest commercial exposures in 2008 resided with 11 U.S. counterparties, one Algerian counterparty, one Brazilian counterparty and one Indian counterparty, which collectively represented $14,194 million, or 33% of the total commercial exposure. These exposures are broken down as follows: within the aerospace sector, five airlines totaled $6,384 million (15%), within the surface transportation sector, one passenger rail company totaled $1,324 million (3%), one automotive company totaled $974 million (2%) relating to an automotive company guarantee of a transaction with a Class 1 U.S. railroad, one transit authority totaled $941 million (2%), and one railcar leasing company totaled $804 million (2%). In the information and communication technology sector, three telecommunication companies totaled $2,347 million (5%) and in the extractive sector, two oil and gas companies totaled $1,420 million (4%).
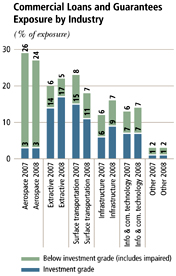
The ratio of below investment grade exposure to total commercial exposure decreased from 54% in 2007 to 52% in 2008, reflecting a higher ratio of investment grade signings during the year.
Sovereign Loans and Loan Guarantees
We have the following risk concentrations for our sovereign loans and guarantees:
| | | | | | | | | | | | | | | | | | | | | | | | | | | | | | | |
| | | Gross loans | | | | | | | Loan | | | Total | | | | | | | | | Total | | | | |
| (in millions of Canadian dollars) | | receivable | | | Commitments | | | guarantees | | | exposure | | | 2008 | | | | | exposure | | | 2007 | |
| |
Country | | | | | | | | | | | | | | | $ | | | | % | | | | | | $ | | | | % | |
| |
| China | | | 947 | | | | 2 | | | | — | | | | 949 | | | | 33 | | | China | | | 850 | | | | 34 | |
| Indonesia | | | 208 | | | | 15 | | | | — | | | | 223 | | | | 8 | | | Indonesia | | | 215 | | | | 8 | |
| Mexico | | | 120 | | | | 103 | | | | — | | | | 223 | | | | 8 | | | Mexico | | | 193 | | | | 8 | |
| Uruguay | | | — | | | | — | | | | 174 | | | | 174 | | | | 6 | | | Dominican Republic | | | 155 | | | | 6 | |
| Dominican Republic | | | 96 | | | | — | | | | 65 | | | | 161 | | | | 6 | | | Serbia | | | 125 | | | | 5 | |
| Ivory Coast | | | 153 | | | | — | | | | — | | | | 153 | | | | 5 | | | Ivory Coast | | | 124 | | | | 5 | |
| Serbia | | | 145 | | | | — | | | | — | | | | 145 | | | | 5 | | | India | | | 109 | | | | 4 | |
| Other | | | 745 | | | | 45 | | | | 38 | | | | 828 | | | | 29 | | | Other | | | 760 | | | | 30 | |
| |
| Total | | $ | 2,414 | | | $ | 165 | | | $ | 277 | | | $ | 2,856 | | | | 100 | | | Total | | $ | 2,531 | | | | 100 | |
| |
The sovereign loans and guarantees portfolio increased by $325 million or 13% from 2007. This increase was primarily due to foreign exchange translation as a result of the weakening of the Canadian dollar and higher signing volume in 2008. These increases were partially offset by repayments exceeding disbursements by $238 million.
In 2008 below investment grade exposure accounted for 48% of the total sovereign portfolio (2007 — 46%).
Equity Financing
We maintain a portfolio of equity investments focused on promising Canadian late-stage start-ups or established small and mid-sized entities to aid these companies in growing and expanding beyond the Canadian border. In addition, we invest offshore with an emphasis on emerging markets where such investment can serve to facilitate the connection of Canadian business activity into international markets. Our investments are made both directly into Canadian businesses and into funds which in turn invest in Canadian or international businesses.
With the goal of growing Canadian exporters and facilitating foreign business connections, investments are normally held for periods greater than five years. Divestitures are generally made through the sale of our investment interests to third parties or through listing on public markets.
EDC Annual Report 2008 | 53
Management’s Discussion and Analysis
The exposure for our equity investments is broken down as follows:
| | | | | | | | | | | | | | | | | | | | | | | | | |
| | | Equity | | | Undisbursed | | | Total | | | | | | | Total | | | | |
| (in millions of Canadian dollars) | | financing | | | commitments | | | exposure | | | 2008 | | | exposure | | | 2007 | |
| |
Gross exposure | | | | | | | | | | | $ | | | | % | | | | $ | | | | % | |
| |
| Domestic market | | | 81 | | | | 100 | | | | 181 | | | | 42 | | | | 125 | | | | 53 | |
| Other advanced economies | | | 39 | | | | 55 | | | | 94 | | | | 22 | | | | 70 | | | | 29 | |
| Emerging markets | | | 30 | | | | 124 | | | | 154 | | | | 36 | | | | 43 | | | | 18 | |
| |
| Total | | $ | 150 | | | $ | 279 | | | $ | 429 | | | | 100 | | | $ | 238 | | | | 100 | |
| |
Consistent with our business goal of growing equity investments, the portfolio increased by $191 million from 2007 or 80%. This was the result of new investments in 2008 and foreign exchange translation, partially offset by negative changes in fair value. During the year, we signed an additional $208 million of equity financing arrangements (2007 — $116 million).
The domestic market and the other advanced economies represent the largest proportion of our exposure. These sectors accounted for 64% of our total exposure (2007 — 82%). Emerging markets represented 36% of our exposure (2007 — 18%) reflecting our increased emphasis on this segment.
In 2008 we recognized an unrealized loss of $45 million representing the change in fair value of the equity portfolio (2007 — nil). This was the result of both the initial negative returns frequently experienced with new fund investments, and the deteriorating business environment due to the difficult global economic conditions. We also recognized a loss of $4 million on the conversion of preferred shares and debentures into common shares for one of our direct investments. These amounts are included in other income.
In 2008 we recognized $2 million of investment revenue related to our equity portfolio (2007 — $1 million). This amount is included in other income.
Capital Leases
We have a gross investment in capital leases of $198 million (2007 — $176 million) concentrated with one obligor in the aerospace industry in the United States. This exposure is below investment grade.
Concentration of Exposure — Insurance Portfolio
Contingent Liabilities under Insurance Policies
In the ordinary course of business, we assume exposure from other insurers to fulfill our mandate to support Canadian exporters. We also cede reinsurance to other insurance companies to mitigate our risk. The ceding arrangements provide greater diversification of the business and minimize the net loss potential arising from large risks.
The following table depicts the impact of these reinsurance agreements on our exposure at December 31.
| | | | | | | | | |
| (in millions of Canadian dollars) | | 2008 | | | 2007 | |
| |
| Credit insurance | | | | | | | | |
| Direct insurance | | | 12,138 | | | | 7,558 | |
| Reinsurance ceded | | | (381 | ) | | | (111 | ) |
| |
| Total credit insurance | | | 11,757 | | | | 7,447 | |
| |
| Contract insurance and bonding* | | | | | | | | |
| Direct insurance | | | 6,292 | | | | 5,254 | |
| Reinsurance assumed | | | 4,572 | | | | 3,622 | |
| |
| Total contract insurance and bonding | | | 10,864 | | | | 8,876 | |
| |
| Political risk insurance | | | | | | | | |
| Direct insurance | | | 2,450 | | | | 2,150 | |
| Reinsurance assumed | | | 85 | | | | 68 | |
| Reinsurance ceded | | | (981 | ) | | | (932 | ) |
| |
| Total political risk insurance | | | 1,554 | | | | 1,286 | |
| |
| Total contingent liabilities under insurance policies | | $ | 24,175 | | | $ | 17,609 | |
| |
| | |
| * | | Includes contract insurance and bonding and insurance guarantees. |
54 | Managing Risk, Maximizing Opportunities.
Management’s Discussion and Analysis
Contingent liabilities under insurance policies totaled $24,175 million, an increase of 37% from 2007, mainly due to an increase in volume in the credit insurance program and an increase of $3,666 million due to the weakening of the Canadian dollar.
At the end of December 2008, contingent liabilities with exposure terms of less than one year comprised 68% of the total exposure, compared to 54% in 2007.
Credit Insurance Program
Size Concentration
The following table breaks down the number of buyers and the respective exposure for the year where the exposure is the total of buyer credit limits, classified by exposure size within the credit insurance portfolio:
| | | | | | | | | | | | | | | | | |
| 2008 | | | 2007 | |
| | | | | | | Total buyer | | | | | | | Total buyer | |
| | | Total | | | credit limits | | | Total | | | credit limits | |
| $ Value of exposure | | number of | | | (in millions of | | | number of | | | (in millions of | |
| (in thousands of Canadian dollars) | | buyers | | | Canadian dollars) | | | buyers | | | Canadian dollars) | |
| |
| 1-500 | | | 58,925 | | | | 6,773 | | | | 55,754 | | | | 5,787 | |
| 501-2,000 | | | 5,704 | | | | 5,261 | | | | 3,759 | | | | 3,666 | |
| 2,001-5,000 | | | 1,108 | | | | 3,459 | | | | 875 | | | | 2,857 | |
| 5,001-10,000 | | | 429 | | | | 2,956 | | | | 309 | | | | 2,301 | |
| 10,001 and over | | | 503 | | | | 16,859 | | | | 316 | | | | 8,931 | |
| |
| Total | | | 66,669 | | | $ | 35,308 | | | | 61,013 | | | $ | 23,542 | |
| |
During 2008, the credit insurance program supported 6,137 customers (2007 — 5,825). Of the total customers supported, 5,295 were small- and medium-sized exporters (SMEs) (2007 — 5,028). In terms of total insured volume, the five customers with the largest volume represented 40% of the total 2008 insured volume (2007 — 35%).
Country Concentration
The largest concentrations in terms of the countries in which the risk resided were as follows:
| | | |
| * | | Includes 154 countries with concentrations ranging from $0.001 million to $454 million (2007 – 154 countries with concentrations ranging from $0.001 million to $449 million). |
Industry Concentration
The contingent liability in terms of exporters’ insured industry sector is as follows:
EDC Annual Report 2008 | 55
Management’s Discussion and Analysis
Contract Insurance and Bonding
Size Concentration
During 2008, 698 customers (468 SMEs) were supported in the contract insurance and bonding program (2007 — 645, of which 456 were SMEs). The five customers with the largest level of insurance policies and guarantees outstanding represented 50% of the 2008 contract insurance and bonding policies and guarantees outstanding (2007 — 54%). Among these five customers, the largest exposure was $2,467 million.
Country Concentration
At the end of December 2008, contract insurance and bonding included 4,974 policies in 144 countries (2007 — 5,104 policies in 138 countries) with an average exposure by policy of $2.2 million (2007 — $1.7 million).
The largest concentrations of insurance policies and guarantees outstanding in terms of the countries in which the risk resided within contract insurance and bonding were as follows:
| | | | | | | | | | | | | | | | | | | | | | | | | | | | | | | | | | | | | | | | | | | |
| (in millions of Canadian dollars) | | | 2008 | | | 2007 | |
| | | | | | | Reinsurance | | | Insurance | | | Total | | | Total | | | | | | | | | Reinsurance | | | Insurance | | | Total | | | Total | |
| Country | | Insurance | | | assumed | | | guarantees | | | $ | | | % | | | Country | | Insurance | | | assumed | | | guarantees | | | $ | | | % | |
| |
Canada | | | 249 | | | | 3,854 | | | | 200 | | | | 4,303 | | | | 40 | | | Canada | | | 137 | | | | 3,032 | | | | 182 | | | | 3,351 | | | | 38 | |
United States | | | 154 | | | | 707 | | | | 3,130 | | | | 3,991 | | | | 37 | | | United States | | | 104 | | | | 570 | | | | 2,104 | | | | 2,778 | | | | 31 | |
Algeria | | | 14 | | | | — | | | | 456 | | | | 470 | | | | 4 | | | Algeria | | | 10 | | | | — | | | | 830 | | | | 840 | | | | 9 | |
China | | | 51 | | | | — | | | | 174 | | | | 225 | | | | 2 | | | China | | | 35 | | | | — | | | | 162 | | | | 197 | | | | 2 | |
United Arab Emirates | | 17 | | | | — | | | | 169 | | | | 186 | | | | 2 | | | Saudi Arabia | | | 1 | | | | — | | | | 149 | | | | 150 | | | | 2 | |
Other* | | | 341 | | | | 11 | | | | 1,337 | | | | 1,689 | | | | 15 | | | Other* | | | 334 | | | | 20 | | | | 1,206 | | | | 1,560 | | | | 18 | |
| |
Total | | $ | 826 | | | $ | 4,572 | | | $ | 5,466 | | | $ | 10,864 | | | | 100 | | | Total | | $ | 621 | | | $ | 3,622 | | | $ | 4,633 | | | $ | 8,876 | | | | 100 | |
| |
| | |
| * | | Includes 139 countries with concentrations ranging from $0.015 million to $139 million (2007 — 133 countries with concentrations ranging from $0.005 million to $148 million). |
Exposure in Canada consists largely of $4,101 million of surety bond insurance (2007 — $3,165 million), 83% of which is to support exports to the United States (2007 — 83%).
Program Concentration
Concentration by program for contract insurance and bonding remained consistent from the prior year, however the exposure increased by $1,988 million or 22% over 2007. The largest increases were in surety bonding of $936 million (47%) and performance security program of $839 million (42%) primarily due to the issuance of new policies.
Political Risk Insurance
Size Concentration
During 2008, 42 customers (17 SMEs) were supported in the political risk program (2007 — 41, of which 15 were SMEs). The five customers with the largest level of insurance policies represented 57% of the 2008 political risk policies outstanding (2007 — 62%). Among these five customers, the largest exposure was $300 million.
56 | Managing Risk, Maximizing Opportunities.
Management’s Discussion and Analysis
Country Concentration
At the end of December 2008, political risk insurance included 140 policies in 38 countries (2007 — 114 policies in 54 countries).
The largest concentrations of insurance policies outstanding in terms of the countries in which the risk resided within political risk insurance were as follows:
| | | | | | | | | | | | | | | | | | | | | | | | | | | | | | | | | | | | | | | | | | | |
| (in millions of Canadian dollars) | | 2008 | | | | 2007 | |
| | | | | | | Reinsurance | | | Total | | | Total | | | | | | | | | Reinsurance | | | Total | | | Total | |
| Country | | Insurance | | | assumed | | | ceded | | | $ | | | % | | | Country | | Insurance | | | assumed | | | ceded | | | $ | | | % | |
| |
Libya | | | 300 | | | | — | | | | — | | | | 300 | | | | 19 | | | Libya | | | 300 | | | | — | | | | — | | | | 300 | | | | 23 | |
Peru | | | 393 | | | | — | | | | (100 | ) | | | 293 | | | | 19 | | | Dominican Republic | | | 133 | | | | 23 | | | | (42 | ) | | | 114 | | | | 9 | |
Papua New Guinea | | | 245 | | | | — | | | | (122 | ) | | | 123 | | | | 8 | | | Colombia | | | 178 | | | | — | | | | (76 | ) | | | 102 | | | | 8 | |
Colombia | | | 231 | | | | — | | | | (116 | ) | | | 115 | | | | 8 | | | Venezuela | | | 130 | | | | — | | | | (47 | ) | | | 83 | | | | 6 | |
Dominican Republic | | | 101 | | | | 27 | | | | (28 | ) | | | 100 | | | | 6 | | | South Africa | | | 96 | | | | — | | | | (48 | ) | | | 48 | | | | 4 | |
Other* | | | 1,180 | | | | 58 | | | | (615 | ) | | | 623 | | | | 40 | | | Other* | | | 1,313 | | | | 45 | | | | (719 | ) | | | 639 | | | | 50 | |
| |
Total | | $ | 2,450 | | | $ | 85 | | | $ | (981 | ) | | $ | 1,554 | | | | 100 | | | Total | | $ | 2,150 | | | $ | 68 | | | $ | (932 | ) | | $ | 1,286 | | | | 100 | |
| |
| | |
| * | | Includes 33 countries with concentrations ranging from $0.103 million to $67 million (2007 — 49 countries with concentrations ranging from $0.083 million to $47 million). |
Credit Quality — Loans
In assessing the credit risk profile of our loan portfolio, we rate obligors using our risk rating methodology. These ratings are reviewed on a regular basis. Based on the obligor ratings, we then categorize our loans receivable into three risk classifications: investment grade performing, below investment grade performing and impaired. Consistent with 2007, 97% of our loan portfolio was categorized as performing in 2008.
The growth in our gross loans receivable in 2008 was distributed fairly evenly between investment grade and below investment grade loans. Investment grade loans grew by $5,673 million representing a 70% increase from 2007. Below investment grade loans grew by $5,824 million during 2008 which resulted in a 56% increase from the previous year. Impaired loans increased by $293 million in 2008 to $883 million. This increase was mainly due to new impairments and foreign exchange translation.
Loan Commitments
Commitments include undisbursed amounts on signed loans, letters of offer outstanding on loans and guarantees and unallocated confirmed lines of credit.
The level of commitments outstanding at the end of 2008 was $3,379 million higher than at the end of 2007. This was mainly due to an increase in the undisbursed amounts on signed loan agreements from $6,096 million in 2007 to $8,024 million at the end of 2008. Growth in the undisbursed commitment level was due to the increase in loan signings volume experienced in 2008.
The increase in commitments during the year was mainly concentrated in investment grade financing. In 2008, commitments on investment grade financing accounted for 53% of the total as compared to 48% in 2007.
Impaired Loans
Impaired loans represent loans for which we no longer have reasonable assurance that the full amount of principal and interest will be collected on a timely basis in accordance with the terms of the loan agreement. At the end of 2008, impaired gross loans receivable totaled $883 million compared to $590 million at the end of 2007. Impaired loans as a percentage of total gross loans receivable decreased from 3.1% in 2007 to 2.9% in 2008.
In 2008, 16 commercial loans in six countries totaling $219 million became impaired (2007 — $38 million) while one loan totaling $1 million was reclassified to performing status (2007 — $182 million).
EDC Annual Report 2008 | 57
Management’s Discussion and Analysis
Concentration of Impaired Loans
The largest concentration of impaired loans receivable are listed in the following table:
| | | | | | | | | | | | | | | | | | | | | | | | | |
| (in millions of Canadian dollars) | | 2008 | | | 2007 | |
| | | Impaired | | | | | | | Impaired | | | Impaired | | | | | | | Impaired | |
| | | gross | | | Non-accrued | | | net | | | gross | | | Non-accrued | | | net | |
| | | loans | | | capitalized | | | loans | | | loans | | | capitalized | | | loans | |
| | | receivable | | | interest | | | receivable | | | receivable | | | interest | | | receivable | |
| |
Sovereign | | | | | | | | | | | | | | | | | | | | | | | | |
| Ivory Coast | | | 153 | | | | 153 | | | | — | | | | 124 | | | | 124 | | | | — | |
| Serbia | | | 145 | | | | 59 | | | | 86 | | | | 126 | | | | 74 | | | | 52 | |
| Argentina | | | 54 | | | | 3 | | | | 51 | | | | 45 | | | | 2 | | | | 43 | |
| Democratic Republic of the Congo | | | 46 | | | | 46 | | | | — | | | | 46 | | | | 46 | | | | — | |
| Congo | | | 31 | | | | 31 | | | | — | | | | 25 | | | | 25 | | | | — | |
| Gabon | | | 27 | | | | 9 | | | | 18 | | | | 26 | | | | 10 | | | | 16 | |
| Other | | | 72 | | | | 17 | | | | 55 | | | | 87 | | | | 25 | | | | 62 | |
| |
| Subtotal | | | 528 | | | | 318 | | | | 210 | | | | 479 | | | | 306 | | | | 173 | |
| |
| | | | | | | | | | | | | | | | | | | | | | | | | |
Commercial | | | | | | | | | | | | | | | | | | | | | | | | |
| Aerospace | | | 236 | | | | 11 | | | | 225 | | | | 42 | | | | 1 | | | | 41 | |
| Information and communication technology | | | 57 | | | | 8 | | | | 49 | | | | 44 | | | | 5 | | | | 39 | |
| Surface transportation | | | 43 | | | | 3 | | | | 40 | | | | 16 | | | | 2 | | | | 14 | |
| Extractive | | | 9 | | | | — | | | | 9 | | | | 7 | | | | — | | | | 7 | |
| Light manufacturing | | | 6 | | | | — | | | | 6 | | | | 1 | | | | — | | | | 1 | |
| Other | | | 4 | | | | — | | | | 4 | | | | 1 | | | | — | | | | 1 | |
| |
| Subtotal | | | 355 | | | | 22 | | | | 333 | | | | 111 | | | | 8 | | | | 103 | |
| |
| Total impaired | | | 883 | | | | 340 | | | | 543 | | | | 590 | | | | 314 | | | | 276 | |
| Less: specific allowance | | | | | | | | | | | 152 | | | | | | | | | | | | 101 | |
| |
| Impaired net loans receivable | | | | | | | | | | $ | 391 | | | | | | | | | | | $ | 175 | |
| |
Non-accrued capitalized interest of $38 million was recognized as impaired revenue as a result of our review of discounted expected future cash flows on loans to Serbia ($145 million), Gabon ($27 million) and Angola ($4 million) totaling $176 million. An additional $14 million of non-accrued capitalized interest was recognized as impaired revenue as a result of a prepayment from Jordan.
When sovereign borrowers experience financial difficulties and are unable to meet their debt obligations, sovereign creditors, including the Government of Canada, agree at an international forum, the Paris Club, to formally reschedule the borrower’s debt obligations. From time to time and on a case-by-case basis, the most heavily indebted sovereign borrowers are granted debt reduction or debt service relief by the Government of Canada. The granting of debt reduction or relief by the Paris Club is contingent upon the sovereign borrower’s ability to implement and maintain economic programs outlined by the International Monetary Fund.
Prior to April 2001, we were reimbursed by the Government of Canada an amount equal to the debt relief granted by the Government of Canada to our sovereign borrowers. The formula for calculating the amount to be paid to us was amended effective April 1, 2001 in two ways. Firstly, for new loans we issued after March 31, 2001 to sovereign borrowers which were on the Paris Club debt relief list as at April 1, 2001, the Government of Canada has no obligation to compensate us for further debt relief granted to such borrowers. Secondly, for any debt reduction on new loans resulting from unilateral debt relief measures or new debt reduction for obligations contracted prior to April 1, 2001, we will share in the costs of debt forgiveness to the amount of our appropriate specific allowances on the loans.
Amounts received for debt relief arrangements on sovereign impaired loans are credited to the book value of the loans similar to the treatment accorded to other receipts on impaired loans. To the extent that amounts received exceed the book value of the loans as a result of non-accrued capitalized interest, debt relief income is recorded, and any provisions are returned to income.
There were no payments received from the Government of Canada for debt relief on sovereign loans in 2008 (2007 — $1 million).
58 | Managing Risk, Maximizing Opportunities.
Management’s Discussion and Analysis
The following cash flows pertain to impaired loan obligors and represent, in the case of sovereign receipts, the long-term efforts of multilateral rescheduling arrangements through the Paris Club. The largest receipts for impaired loans including contractual principal and interest from borrowers and from commercial loan sales were as follows:
| | | | | | | | | | | |
| (in millions of Canadian dollars) | | 2008 | | | | | 2007 | |
| |
Sovereign | | | | | | Sovereign | | | | |
| Jordan | | | 22 | | | Serbia | | | 6 | |
| Serbia | | | 9 | | | Gabon | | | 6 | |
| Gabon | | | 6 | | | Congo | | | 6 | |
| Other | | | 8 | | | Other | | | 8 | |
| |
| Subtotal | | | 45 | | | Subtotal | | | 26 | |
Commercial | | | 47 | | | Commercial | | | 408 | |
| |
| Total | | $ | 92 | | | Total | | $ | 434 | |
| |
Credit Quality – Insurance
The contingent liability by country risk rating for the insurance portfolio is comprised primarily of investment grade exposure. Within the credit insurance program, the proportion of investment grade exposure increased to 88% (2007 – 83%) mainly due to an increase in exposure for Brazil combined with their change to investment grade exposure. The political risk insurance portfolio also experienced an increase in the proportion of investment grade insurance to 39% (2007 – 18%) primarily as a result of increased exposure in Peru as well as their change to investment grade exposure. Within the contract insurance and bonding portfolio, investment grade exposure remained relatively constant at 94% (2007 – 95%).
Claims Experience
| | | | | | | | | |
| (in millions of Canadian dollars) | | 2008 | | | 2007 | |
| |
| Claims paid | | | 104 | | | | 60 | |
| Claims recovered | | | 24 | | | | 15 | |
| |
| Net claims | | $ | 80 | | | $ | 45 | |
| |
In 2008, we paid 1,467 claims in 66 countries. In 2007, we paid 1,341 claims in 66 countries.
There was a 73% increase in the dollar value of claim payments to $104 million in 2008 and a 9% increase in the number of claims paid from 2007. The increase in claims paid was due to the weakening economic environment in the majority of our trading partner nations. The average amount paid per claim increased to $71 thousand in 2008 from $45 thousand in 2007.
The dollar value of claims increased over 2007 at a higher rate than the number of claims paid due to an increase in the number of claims paid over $1 million.
In 2008, we recovered in total $26 million (2007 – $16 million) of which $2 million was disbursed to exporters (2007 – $1 million). In 2008, there were 10 recoveries in excess of $1 million, whereas in 2007, there was one.
Size Concentration
| | | | | | | | | | | | | | | | | | | | | | | | | | | | | | | | | |
| (in millions of Canadian dollars) | | 2008 | | | 2007 | |
| | | $ of | | | Number | | | $ of | | | Number | | | $ of | | | Number | | | $ of | | | Number | |
| | | claims | | | of claims | | | claims | | | of claims | | | claims | | | of claims | | | claims | | | of claims | |
| | paid | | | paid | | | recovered | | | recovered | | | paid | | | paid | | | recovered | | | recovered | |
| |
| $0 – $100,000 | | | 18 | | | | 1,341 | | | | 4 | | | | 454 | | | | 17 | | | | 1,250 | | | | 5 | | | | 487 | |
| $100,001 – $1 million | | | 32 | | | | 114 | | | | 10 | | | | 34 | | | | 22 | | | | 84 | | | | 9 | | | | 32 | |
| Over $1 million | | | 54 | | | | 12 | | | | 10 | | | | 2 | | | | 21 | | | | 7 | | | | 1 | | | | 1 | |
| |
| Total | | $ | 104 | | | | 1,467 | | | $ | 24 | | | | 490 | | | $ | 60 | | | | 1,341 | | | $ | 15 | | | | 520 | |
| |
EDC Annual Report 2008 | 59
Management’s Discussion and Analysis
Insurance Claims Paid by Geographic Market
| | | | | | | | | | | | | | | | | | | | | | | | | | | | | | | | | | | | | | | | | | | | | |
| (in millions | | | | | | |
| of Canadian dollars) | | 2008 | | | 2007 |
| | | | | | | | | | | | | | | Failure to | | | | | | | | | | | | | | | | | | | | | | | Failure to | | | | |
| | | | | | | | | | | Call | | | perform | | | Wrongful | | | | | | | | | | | | | | | Call | | | perform | | | | |
| | | | | | | | | | | on | | | under | | | call on | | | | | | | | | | | | | | | on | | | under | | | | |
| Geographic market | | Insolvency | | | Default | | | a bond | | | a bond | | | a bond | | | Total | | | Insolvency | | | Default | | | a bond | | | a bond | | | Total | |
| |
| North America/Caribbean | | | 52 | | | | 25 | | | | 6 | | | | 2 | | | | — | | | | 85 | | | | 18 | | | | 20 | | | | — | | | | 1 | | | | 39 | |
| Europe | | | 2 | | | | 4 | | | | — | | | | — | | | | — | | | | 6 | | | | 1 | | | | 9 | | | | — | | | | 3 | | | | 13 | |
| Asia/Pacific | | | — | | | | 5 | | | | 1 | | | | — | | | | — | | | | 6 | | | | — | | | | 1 | | | | — | | | | — | | | | 1 | |
| Middle East/Africa | | | — | | | | 1 | | | | 4 | | | | — | | | | 1 | | | | 6 | | | | — | | | | 1 | | | | 3 | | | | — | | | | 4 | |
| South America/Central America | | | — | | | | 1 | | | | — | | | | — | | | | — | | | | 1 | | | | — | | | | 3 | | | | — | | | | — | | | | 3 | |
| |
| Total | | $ | 54 | | | $ | 36 | | | $ | 11 | | | $ | 2 | | | $ | 1 | | | $ | 104 | | | $ | 19 | | | $ | 34 | | | $ | 3 | | | $ | 4 | | | $ | 60 | |
| |
Insolvency Risk
Insolvency of the customer occurs when a debtor is either winding up or financially re-organizing under the bankruptcy or insolvency laws of the debtor’s country.
The increase in insolvency claims paid in North America and the Caribbean was due to an increase in claim payments for losses in the United States of $32 million.
Default Risk
Default is defined as the failure of the buyer to pay by the due date all or any part of the gross invoice value of goods delivered to and accepted by the buyer.
The increase in losses in North America and the Caribbean was a result of an increase in losses in North America of $5 million. In Asia and Pacific the increase was due to losses in Australia, China and Taiwan. The decrease in claim payments due to default in Europe was a result of a $5 million decrease in losses in Kazakhstan.
Call on a Bond
Call on a bond is the unilateral decision by the beneficiary of a stand-by letter of credit (the bond), issued on behalf of an exporter and in relation to its contract obligations, to demand the immediate payment of the face amount thereof.
There has been an increase in the number of claims including three in excess of $1 million.
Failure to Perform Under a Bond
Failure to perform occurs in cases where a guarantee has been provided relating to the contract performance of the exporter (surety bond). If the exporter fails to perform its contract obligations, the foreign buyer can make a claim on the associated surety bond.
The decrease in claim payments in Europe was due to a $3 million decrease in losses in the Netherlands.
Wrongful call on a bond
Wrongful call on a bond is defined as a situation where the liquidation by the beneficiary of a contract performance bond was undertaken despite the fact that contract performance has been rendered or for reasons beyond the control of the insured supplier.
Industry Concentration
The largest portion of claims paid in 2008 related to the infrastructure and environment sector, mainly in North America ($21 million). Within the transportation sector, claims paid were mainly in the United States ($24 million).
In 2007 the largest portion of claims paid related to the infrastructure and environment sector, mainly in Kazakhstan ($5 million) and the United States ($4 million).
60 | Managing Risk. Maximizing Opportunities.
Management’s Discussion and Analysis
Claims Submitted
The value of claims submitted has increased from $88 million in 2007 to $178 million in 2008, mainly due to the weakening economic environments in the majority of our trading partner nations. In addition, the number of claims submitted has increased from 2,071 in 2007 to 2,343 in 2008. The five countries with the largest claims submitted in 2008 were the United States ($112 million), Canada ($14 million), Venezuela ($11 million), the United Kingdom ($7 million) and Iran ($6 million).
At the end of 2008, the value of claims requests that were still under consideration was $32 million (2007 – $5 million). Of this amount, $12 million represented one claim in Venezuela.
Allowance for Losses on Loans, Loan Commitments and Guarantees
The total allowance for losses on loans, loan commitments and guarantees was $2,735 million at the end of 2008, an increase of $855 million from the 2007 allowance of $1,880 million.
The key components impacting the increase in the allowance in 2008 are as follows: growth ($ 380 million), deteriorating credit conditions ($118 million), additional market overlays ($370 million), and the weaker Canadian dollar in the latter part of 2008 which resulted in a $495 million increase in our allowance. These increases were partially offset by the revisions made to our loan allowance methodology which resulted in a $357 million release of allowance and updates to the independent variables used in the base allowance calculation which resulted in an additional release of $199 million.
The total allowance as a percentage of exposure as at the end of 2008 declined to 5.9% from 6.2%, largely as a result of the revisions made to our loan allowance methodology as discussed in the following section.
Components of the Allowance
| | | | | | | | | |
| (in millions of Canadian dollars) | | 2008 | | | 2007 | |
| |
| Base allowance | | | 1,860 | | | | 1,571 | |
| Counterparty concentration | | | 282 | | | | 144 | |
| Market overlays: | | | | | | | | |
| Commercial unsecured portfolio | | | 203 | | | | — | |
| Automotive | | | 195 | | | | — | |
| Aerospace | | | — | | | | 40 | |
| Other | | | 22 | | | | 10 | |
| |
| Total general allowance | | | 2,562 | | | | 1,765 | |
| Specific allowances | | | 173 | | | | 115 | |
| |
| Total allowance for losses on loans, loan commitments and guarantees | | $ | 2,735 | | | $ | 1,880 | |
| |
Our provisioning methodology ensures that an appropriate allowance representing management’s best estimate of probable credit losses is established. The allowance is based on a review of all loans, loan guarantees and commitments that have been individually or collectively assessed for impairment and includes both general and specific allowances.
During the year we completed a review of the assumptions and variables used within our general loan allowance calculation and as a result there were modifications made to our loan allowance model. Some of the more significant changes include the removal of an adjustment that was made to reflect the added inherent risks in emerging markets which were previously not fully reflected in the country ratings; consideration of the fair value of any collateral held in determining the loss severity on our secured loan portfolio; and the incorporation of the loss emergence period into the calculation. Another key change to our loan allowance methodology in 2008 was the segmenting of our portfolio by industry rather than by geography to reflect common risk characteristics.
EDC Annual Report 2008 | 61
Management’s Discussion and Analysis
General Allowance by Industry Sector
The following table shows the general allowance by industry sector for performing loans, guarantees and commitments. The components of the general allowance take into account the base allowance, concentration and market overlays.
| | | | | | | | | | | | | | | | | | | | | | | | | |
| (in millions of Canadian dollars) | | 2008 | | | 2007 | |
| | | | | | | | | | | General allowance | | | | | | | | | | | General allowance | |
| | | Provision | | | General | | | as a % | | | Provision | | | General | | | as a % | |
| Industry of risk | | exposure* | | | allowance | | | of exposure | | | exposure* | | | allowance | | | of exposure | |
| |
| Commercial: | | | | | | | | | | | | | | | | | | | | | | | | |
| Aerospace | | | 11,090 | | | | 1,019 | | | | 9.2 | | | | 7,650 | | | | 818 | | | | 10.7 | |
| Surface transportation** | | | 7,695 | | | | 421 | | | | 5.5 | | | | 6,406 | | | | 189 | | | | 3.0 | |
| Information and communication technology | | | 6,091 | | | | 327 | | | | 5.4 | | | | 3,533 | | | | 214 | | | | 6.1 | |
| Infrastructure and environment | | | 6,087 | | | | 292 | | | | 4.8 | | | | 3,053 | | | | 166 | | | | 5.4 | |
| Extractive | | | 9,349 | | | | 256 | | | | 2.7 | | | | 5,200 | | | | 165 | | | | 3.2 | |
| Other | | | 1,431 | | | | 146 | | | | 10.2 | | | | 867 | | | | 103 | | | | 11.9 | |
| |
| Total commercial | | | 41,743 | | | | 2,461 | | | | 5.9 | | | | 26,709 | | | | 1,655 | | | | 6.2 | |
| Sovereign | | | 2,168 | | | | 101 | | | | 4.7 | | | | 1,930 | | | | 110 | | | | 5.7 | |
| |
| Total | | $ | 43,911 | | | $ | 2,562 | | | | 5.8 | | | $ | 28,639 | | | $ | 1,765 | | | | 6.2 | |
| |
| | |
| * | | calculated using factored exposure |
| |
| ** | | includes automotive exposure |
Base Allowance
The base allowance increased by $289 million in 2008 to $1,860 million primarily as a result of portfolio growth, negative credit migration and foreign exchange. These impacts were partially offset by the revisions made to our loan allowance methodology and by updates made to the independent variables. During the year the independent variables used in the base allowance calculation were reviewed and updated where appropriate, to reflect current data.
Sensitivity Analysis
We assign credit ratings to our obligors using a system of fifteen credit ratings. To highlight the sensitivity of our base allowance to a weakening credit environment we shocked our entire performing loan exposure to determine the impact of a one notch downgrade. A one notch downgrade would increase our base allowance by $754 million.
Allowance Overlays
In addition to the base allowance, we add overlays as required to the general allowance. A concentration overlay is added to reflect the additional risk that we incur when our exposure to a specific counterparty is over a certain threshold. Market overlays are also established to take into consideration that current financial uncertainties are not always reflected in current credit ratings. The overlays are more fully explained in the following sections. Prior to 2007, our allowance methodology included country overlays which provided for those countries experiencing a downward or upward trend. Country overlays are no longer part of our estimate.
Counterparty Concentration Overlay
A concentration component is added to adequately provision for sovereign and commercial counterparties whose level of exposure is deemed by management to represent an increased amount of risk. A counterparty whose exposure exceeds 10% of our shareholder’s equity based on the previous year’s audited financial statements, will attract a concentration component calculated on the portion of exposure over the threshold. The allowance on this portion of exposure is calculated at the base allowance rate for that counterparty.
We had a concentration overlay of $282 million at the end of 2008 compared to $144 million a year earlier. The increase was primarily due to an increased number of counterparties exceeding the threshold as well as increased exposure for a number of counterparties subject to a concentration overlay.
62 | Managing Risk. Maximizing Opportunities.
Management’s Discussion and Analysis
Market Overlays
Market overlays are added to reflect the risk that the impact of recent economic events is not fully captured in current credit ratings. Due to the economic events that occurred in the latter part of 2008, management concluded that current credit ratings might not be fully reflective of these recent events and therefore, it is likely that, at our balance sheet date, there are additional losses within our portfolio which have been incurred but not yet identified and not captured in our base allowance. To address this concern, market overlays were established on certain sectors assessed to be most at risk of further credit downgrades and potential default. The amount of the overlay is directly related to the amount of exposure to each obligor and the likelihood of a subsequent downgrade. Based on the probability of a downgrade and the likely credit rating, an appropriate amount of incremental allowance is added.
Automotive
Economic conditions in 2008, particularly in the fourth quarter, have heavily impacted the auto sector. There has been a sharp decline in auto sales and both Canadian and U.S. assembly plants are scaling back operations. This is impacting auto parts suppliers, to which EDC has significant exposure. As a result, we determined that an additional overlay was required. We reviewed our automotive portfolio and increased the probability of default where we expect losses have occurred which are not currently reflected in credit ratings. As a result of this analysis we recorded an overlay of $195 million.
Commercial Unsecured Portfolio
The impact of the current economic difficulties is global and is impacting companies in all sectors. In addition to the analysis of the automotive portfolio discussed above, we analyzed the remainder of our unsecured portfolio and increased the probability of default on obligors rated BB- and lower to reflect the increased risk of unidentified losses within this portion of our portfolio. As a result of this analysis, we recorded an additional overlay of $203 million on the remainder of our unsecured portfolio.
Specific Allowances
We establish specific allowances for impaired loans on an individual loan basis to recognize impairment losses. Specific allowances increased from $115 million in 2007 to $173 million in 2008. This was primarily the result of an increase in our impaired portfolio in 2008 as well as increases to specific allowances on existing obligors.
Allowance for Claims on Insurance
At the end of December 2008, the allowance for claims on insurance was $755 million, an increase of $281 million or 59% over the 2007 allowance of $474 million.
The allowance for potential claims on insurance policies that we have ceded to reinsurance companies totaled $157 million (2007 – $88 million) and is included in the allowance for claims on insurance. These amounts were also recorded as an asset on the balance sheet as they represent the reinsurers’ share of our allowance for claims. If we were required to pay out a claim on these policies we would recover this claim payment from the reinsurer. The increase in the reinsurers’ share from 2007 was mainly due to the movement of foreign exchange rates in addition to the update of actuarial assumptions.
The allowance for claims on insurance net of reinsurers’ share was $598 million, an increase of $212 million or 55% over the 2007 net allowance of $386 million. The increase was due to changes in the portfolio make-up and risk ratings ($49 million), updating of the actuarial assumptions which includes the impacts of the difficult financial market environment, particularly in the auto and retail sectors ($97 million), and foreign exchange translation of $66 million.
The net allowance as a percentage of contingent liability related to insurance policies and guarantees was 2.5% for 2008, an increase from the 2007 rate of 2.2%. In 2008 the ratio increased mainly as a result of the update of the assumptions in the actuarial valuation.
The allowance is based on an actuarial valuation of the insurance policy and claim liabilities. The actuarial valuation uses simulation techniques and is based on assumptions (frequency of claim, severity of loss, loss development and discount rates used) relevant to the insurance programs and is derived from our own experience.
EDC Annual Report 2008 | 63
Management’s Discussion and Analysis
Credit Quality – Investments and Derivative Financial Instruments
The Department of Finance sets out guidelines that define the minimum acceptable counterparty credit rating pertaining to our investments and derivative financial instruments. In addition, we have policies which are reviewed and re-approved annually by the Board, and procedures which establish credit limits for each counterparty, and are reviewed by management no less than annually. These policies and procedures are designed to limit and manage the credit risk associated with these financial instruments.
Our interest-bearing deposits and investment portfolio expose us to the risk that the deposit-taking institutions or the investment issuer will not repay us in accordance with contractual terms. Our potential deposit and investment credit exposure is represented by the carrying value of the financial instruments.
The following table provides a breakdown, by credit rating and term to maturity, of our deposits, investments, and their related derivatives credit exposure.
| | | | | | | | | | | | | | | | | | | | | |
| (in millions of Canadian dollars) | | | | | | | | | |
| | | Remaining term to maturity | | | | | | | |
| | | Under 1 | | | 1 to 3 | | | Over 3 | | | 2008 | | | 2007 | |
| Credit rating | | year | | | years | | | years | | | net exposure | | | net exposure | |
| |
| AAA | | | 1,287 | | | | 316 | | | | 405 | | | | 2,008 | | | | 1,266 | |
| AA+ | | | 20 | | | | 13 | | | | 32 | | | | 65 | | | | 67 | |
| AA | | | 606 | | | | — | | | | 15 | | | | 621 | | | | 541 | |
| AA- | | | 976 | | | | 24 | | | | — | | | | 1,000 | | | | 591 | |
| A+ | | | 123 | | | | — | | | | — | | | | 123 | | | | 42 | |
| A | | | — | | | | 16 | | | | 11 | | | | 27 | | | | 23 | |
| |
| Total | | $ | 3,012 | | | $ | 369 | | | $ | 463 | | | $ | 3,844 | | | $ | 2,530 | |
| |
Derivatives expose us to the risk that the counterparty will not repay us in accordance with contractual terms. Our potential derivative credit exposure is represented by the replacement cost of contracts that have a positive fair value. For a more in-depth discussion on the use of derivatives, please refer to the section on derivatives (see page 66).
All swaps are transacted with high credit quality financial institutions. We operate a collateral program to mitigate credit exposure related to swaps used to hedge risk within our funding program. As market rates move between the settlement date and maturity date of the swap, the financial instrument attains value such that to terminate the swap early, one counterparty would need to make a payment to the other to compensate for the movement in rates. In order to mitigate the credit risk, we often enter into collateral agreements with financial institutions with whom we undertake swap transactions. Under the terms of the swap agreements, when the credit exposure surpasses an agreed upon threshold, collateral in the form of government securities is posted with an independent third party by our swap counterparty. At the end of December 2008, $726 million was posted as collateral by our counterparties to mitigate credit risk associated with swap agreements.
The following table provides a breakdown, by credit rating and term to maturity, of our derivative credit exposure and how it is offset against exposure netting amounts and collateral held. Exposure netting amounts represent derivative contracts where there is an agreement with the counterparty (master netting agreement) that allows us to offset the counterparty’s derivative credit exposure to us against our credit exposure to that same counterparty. After applying both exposure netting and collateral held our net exposure is $685 million (2007 – $889 million).
| | | | | | | | | | | | | | | | | | | | | | | | | | | | | | | | | |
| (in millions of Canadian dollars) | | | | | | | | | |
| | | Remaining term to maturity | | | | | | | | | | | | | | | | |
| | | Under 1 | | | 1 to 3 | | | Over 3 | | | Gross | | | Exposure | | | Collateral | | | 2008 net | | | 2007 net | |
| Credit rating | | year | | | years | | | years | | | exposure | | | netting* | | | held | | | exposure | | | exposure | |
| |
| AAA | | | — | | | | 11 | | | | 35 | | | | 46 | | | | (14 | ) | | | — | | | | 32 | | | | 68 | |
| AA+ | | | — | | | | — | | | | — | | | | — | | | | — | | | | — | | | | — | | | | – | |
| AA | | | 55 | | | | 400 | | | | 188 | | | | 643 | | | | (304 | ) | | | (23 | ) | | | 316 | | | | 304 | |
| AA- | | | 172 | | | | 514 | | | | 395 | | | | 1,081 | | | | (101 | ) | | | (703 | ) | | | 277 | | | | 310 | |
| A+ | | | — | | | | — | | | | 28 | | | | 28 | | | | — | | | | — | | | | 28 | | | | 196 | |
| A | | | 22 | | | | — | | | | 10 | | | | 32 | | | | — | | | | — | | | | 32 | | | | 11 | |
| |
| Total | | $ | 249 | | | $ | 925 | | | $ | 656 | | | $ | 1,830 | | | $ | (419 | ) | | $ | (726 | ) | | $ | 685 | | | $ | 889 | |
| |
| | |
| * | | As a result of master netting agreements |
Credit risk for investments and derivative financial instruments is reported on a quarterly basis to the Asset Liability Management Committee and to the Risk Management Committee of the Board.
Our credit risk policies, processes and methodologies have not changed materially from 2007.
64 | Managing Risk. Maximizing Opportunities.
Management’s Discussion and Analysis
Market Risk Management
Market risk is the risk that the fair value or future cash flows of a financial instrument will fluctuate because of changes in market prices. Market risk comprises three types of risk: foreign exchange risk, interest rate risk, and other price risk. We are exposed to potential losses as a result of movements in interest and foreign exchange rates.
Through our policies and procedures, we ensure that market risks are identified, measured, managed, and regularly reported to Management and the Board of Directors. Our Market Risk Management Policy sets out our requirements on interest rate and foreign exchange exposure limits, liquidity, investment, debt funding, derivatives and structured notes, management of the credit risk for treasury counterparties, and management and Board reporting. The Asset Liability Management Committee, which is chaired by the Chief Financial Officer, oversees and directs the management of market risks inherent within our normal business activities. Risk oversight is provided by the MRM team within the Risk Management Office.
Interest Rate Risk
Interest rate risk is the risk that the fair value or future cash flows of a financial instrument will fluctuate because of changes in market interest rates. We are exposed to potential adverse impacts on the value of financial instruments resulting from differences in the maturities or repricing dates of assets and liabilities both on and off-balance sheet, as well as from embedded optionality in those assets and liabilities.
Our interest rate risk is managed in accordance with guidelines established by the Department of Finance as well as policies set by the Board of Directors. We report interest rate risk on a quarterly basis to the Asset Liability Management Committee and to the Risk Management Committee of the Board.
Our interest rate risk policy limits are tested on a monthly basis to ensure compliance with our policy. Interest rate risk is measured by simulating the impact of a 100 basis point change on our net financing and investment income.
Interest Rate Sensitivity
The table below presents the sensitivity of the net financing and investment income, the net income and the other comprehensive income to a parallel 100 basis point change in interest rates given the outstanding positions as of December 31, 2008.
| | | | | | | | | |
| (in millions of Canadian dollars) | |
| Interest rate change | | +100 Basis Points | | | –100 Basis Points | |
| |
| Change in net financing and investment income | | | 7 | | | | (7 | ) |
| Change in net income | | | (6 | ) | | | 6 | |
| Change in other comprehensive income | | | (18 | ) | | | 19 | |
| |
Foreign Exchange Risk
Foreign exchange risk is the potential adverse impact on the value of financial instruments resulting from exchange rate movements. We are exposed to foreign exchange rate risk when there is a mismatch between assets and liabilities in any currency. We manage foreign exchange risk with the objective of measuring, monitoring and managing the effects of currency fluctuations on our earnings.
Our foreign exchange risk is managed in accordance with guidelines established by the Department of Finance as well as policies approved by the Board. We report our foreign exchange risk on a quarterly basis to the Asset Liability Management Committee and to the Risk Management Committee of the Board.
In addition to the guidelines and policies described above, we also have supplemental operational limits and reporting requirements. Management of foreign exchange risk is enabled through monthly risk position monitoring and reporting.
As per our policy, the potential translation loss impact to one month’s net financing and investment income (NFII) as measured by a two standard deviation change in foreign exchange rates is limited to 2.5% of projected 12 month NFII, on a consolidated Canadian dollar equivalent.
The table below presents the sensitivity of the net income and the other comprehensive income to changes in the value of the Canadian dollar versus the other currencies we are exposed to given the outstanding positions as of December 31, 2008.
| | | | | | | | | |
| (in millions of Canadian dollars) | |
| Canadian dollar relative to other currencies | | Increases by 1% | | | Decreases by 1% | |
| |
| Change in net income | | | 7 | | | | (7 | ) |
| Change in other comprehensive income | | | (4 | ) | | | 4 | |
| |
EDC Annual Report 2008 | 65
Management’s Discussion and Analysis
Derivatives
We use a variety of derivatives to manage costs, returns and levels of financial risk associated with funding, investment and risk management activities. The principal purpose for which we use derivatives is to hedge against foreign exchange and interest rate risk. Our use of derivatives may include, but is not restricted to, currency and interest rate swaps, foreign exchange swaps, futures and options. We do not use derivatives for speculative purposes.
We do not engage in the use of derivatives whose value and financial risks cannot be measured, monitored and managed on a timely basis. The MRM team formally reviews our derivative financial instrument transactions at time of inception, and on an ongoing basis to provide an independent verification on the valuation of transaction structures and of associated financial risks.
Derivatives are used to hedge risks by diversifying concentrated exposures. For example, we may balance the proportion of fixed to floating assets in our portfolio using interest rate swaps in order to diversify interest rate risk.
The following table indicates the fair value of our derivatives based upon maturity:
| | | | | | | | | | | | | |
| (in millions of Canadian dollars) | | Positive | | | Negative | | | Net | |
| |
| Maturity less than 1 year | | | 250 | | | | (901 | ) | | | (651 | ) |
| Maturity 1 – 3 years | | | 924 | | | | (355 | ) | | | 569 | |
| Maturity 4 – 5 years | | | 305 | | | | (135 | ) | | | 170 | |
| Maturity in excess of 5 years | | | 351 | | | | (9 | ) | | | 342 | |
| |
| Gross fair value of contracts | | $ | 1,830 | | | $ | (1,400 | ) | | $ | 430 | |
| |
Liquidity Risk
Liquidity risk is the risk that we would be unable to honour daily cash outflow commitments or the risk that we would have to obtain funds rapidly, possibly at an excessively high premium during severe market conditions. Liquidity risk arises from two sources: mismatched cash flows related to assets and liabilities; and liquidity risk due to the characteristics of credit commitments.
Our treasury department is responsible for our liquidity management and the MRM team is responsible for monitoring compliance with our policies and procedures. Pursuant to our risk management policies, we must maintain sufficient liquidity to meet a prescribed minimum level, based on forecasted three month cash requirements and one month of commercial paper obligations.
Within the overall policy framework, we manage our liquidity risk both within the overall policy limits and also within supplemental limits. The MRM team measures our position on a daily basis and provides a monthly report to senior management on our actual liquidity position against this minimum limit, as well as a quarterly report to the Risk Management Committee of the Board.
We maintain liquidity through a variety of methods:
| 4 | | Cash and Marketable Securities: We hold cash and marketable securities to ensure that sufficient liquidity is available if required to meet forecasted cash requirements. During 2008, the average balance of cash and marketable securities was $2,815 million. |
| |
| 4 | | Access to Commercial Paper Markets: In the course of our normal activities, our commercial paper programs provide us with the necessary liquidity to meet our cash requirements on a daily basis. During 2008, the average balance of short-term debt was $3,149 million with a turnover of 13 times. |
| |
| 4 | | Standby Credit Facility: As a contingency, we also maintain a minimum U.S. $900 million standby revolving credit facility to further ensure our liquidity. To date, it has not been necessary to use this facility. |
Investment Risk
The Investment Policy defines the investments that we may undertake in the market place by instrument type. The investment of corporate cash holdings is governed by Section 10(1.1)(h) of the Export Development Act (ED Act), Section 128 of the Financial Administration Act, and the Corporation’s Investment Authorities approved by the Minister of Finance.
Debt Funding
The Export Development Act places limitations on our borrowings. The Act allows us to borrow and have outstanding borrowings up to a maximum of 15 times the aggregate of (a) our current paid-in capital and (b) our retained earnings determined in accordance with the previous year’s audited financial statements.
The Minister of Finance, pursuant to the requirements of the Financial Administration Act, annually approves the borrowings of the Corporation. The Debt Funding Policy is monitored on a monthly basis and reported to management and the Board on a quarterly basis.
66 | Managing Risk. Maximizing Opportunities.
Management’s Discussion and Analysis
Operational Risk Management
Operational risk is defined as the risk of direct or indirect loss resulting from the organizational environment, external events, inadequate internal processes, people, or systems. Operational risk includes risk to our reputation and the risk of not meeting our mandate or regulatory requirements.
Management is directly responsible for all activities of the Corporation, including management of operational risk. Senior management is responsible for managing risks related to their units’ objectives. Primary responsibility for the day-to-day management of operational risk lies with business unit management. Business unit management is responsible for ensuring that appropriate procedures, internal controls and processes are established to manage operational risks and to comply with corporate policies. Specialist groups such as Information Systems, Human Resources, Corporate Finance and Control, and Legal provide support and are responsible for maintaining oversight in areas such as technology, corporate data, Code of Conduct requirements, financial controls, corporate insurance and legal compliance.
We also employ a variety of programs to provide additional assurance that operational risks are appropriately managed such as the Risk Management Office’s annual Enterprise Risk Management Report based on interviews with management and the Internal Audit team’s independent and comprehensive review of the processes designed by management to manage operational risk.
In the event of an external disruption, we have a mature and comprehensive Business Continuity Plan (BCP) which has been in place since 1998. Diligent testing is performed periodically covering all aspects of the BCP, including command and control, supplier performance, infrastructure restart and recovery and, most importantly, the effectiveness and viability of the plans for the business teams. We have activated the BCP plan on more than one occasion and it has performed extremely well, maintaining the business and service to our customers with minimal disruption.
A key method by which we monitor our exposure to employee related operational risks is the biennial Employee Opinion Survey. This survey provides us with a mechanism to gather employee input on climate conditions that enable or inhibit key drivers of performance. These results drive action plans to build on our strengths and support corporate values.
As business practices evolve to address new operating environments with respect to reputational risk, we have strengthened our commitment to Corporate Social Responsibility (CSR), which is built on five essential pillars: business ethics, the environment, transparency, community investment and organizational climate. We have made a significant investment in time and resources on all of these fronts and have made CSR a central part of our ongoing business strategy. We recognize that growth and sustainability must be addressed simultaneously and that CSR is intrinsic to achieving sustainable trade. We strive to maximize Canadian exporter growth potential, while being conscientious of the environmental impacts of our business and acting in accordance with the highest ethical standards, as well as investing in our communities and our employees.
Our mandate guidelines ensure that we continue to respond to the needs of Canadian exporters and investors while satisfying our mandate. Issues of mandate that are unique or complex are referred to an internal legal committee.
Capital Management
Our Capital Adequacy Policy ensures that we are appropriately capitalized and that our capital position is identified, measured, managed, and regularly reported to the Board.
Capital adequacy is a measurement of the demand for capital, that is, the amount of capital required to cover the credit, market, operational, business, and strategic risks we have undertaken compared to the supply of capital or the existing capital base. The demand is calculated by a model which estimates the capital required to cover the extreme value of potential losses (including both expected and unexpected losses) arising from credit, market and operational risk, and business risk along with a designated capital allocation for strategic initiatives under strategic risk. The supply is determined by our financial statements and consists of paid-in share capital, retained earnings and allowances. We target a level of capitalization sufficient to cover potential losses consistent with a rating standard of AA. This solvency standard aligns with best-in-class practices of leading financial institutions and with the key principles of financial self-sufficiency.
EDC Annual Report 2008 | 67
Management’s Discussion and Analysis
The following table represents the breakdown of the demand on capital by type of risk in comparison to the supply of capital.
| | | | | | | | | |
| (in millions of Canadian dollars) | | 2008 | | | 2007 | |
| |
Demand for capital | | | | | | | | |
| Credit risk | | | 6,581 | | | | 4,157 | |
| Market risk | | | 2,063 | | | | 981 | |
| Operational risk | | | 304 | | | | 306 | |
| Business risk | | | — | | | | — | |
| Strategic risk | | | 472 | | | | 1,244 | |
| |
Total demand for capital | | $ | 9,420 | | | $ | 6,688 | |
| | | | | | | | | |
Supply of capital | | $ | 9,449 | | | $ | 8,290 | |
| | | | | | | | | |
| |
| EDC rating | | AA | | | AAA | |
| |
We strive to ensure that our risk and capital management policies are aligned with industry standards and are appropriately sophisticated relative to our risk profile and business operations. While we are not subject to Basel II requirements, we are taking steps to ensure that the Corporation’s risk and capital management approaches evolve commensurately where appropriate.
Being appropriately capitalized has allowed us to fulfill our mandate and sustain continued risk capacity for Canadian exporters and investors despite a more difficult credit environment.
Our capital is first and foremost available to support Canadian exporters and investors for the benefit of Canada and it is our express intention to maximize the utilization of our capital in support of our mandate. The Capital Adequacy Policy does, however, recognize that there may be situations in which the Board of Directors may wish to authorize a dividend payment. Therefore, the Capital Adequacy Policy includes a potential dividend methodology to guide the Board of Directors in determining the dividend amount that EDC can afford to pay.
Our Capital Adequacy Policy has enabled us to improve strategy development and decision making including forward looking capital based planning and allocation. This capability is aligned with the more advanced approaches under Basel II which promote, among other things, a more forward looking measure of capital adequacy.
We monitor our credit portfolios on an ongoing basis and evaluate the impact of potential credit migration on our capital adequacy.
68 | Managing Risk. Maximizing Opportunities.
Management’s Discussion and Analysis
CRITICAL ACCOUNTING POLICIES AND ESTIMATES
A summary of our significant accounting policies can be found in note 2 of our 2008 consolidated financial statements. The accounting policies discussed below are considered particularly important, as they require management to make certain assumptions and estimates based on information available as at the date of the financial statements. We have established procedures to ensure that accounting policies are applied consistently and that the process for changing methodologies is well controlled, and occurs in an appropriate and systematic manner. Critical accounting estimates include the allowance for losses on loans, loan commitments and guarantees, the determination of the primary beneficiary of variable interest entities, the allowance for claims on insurance, employee future benefits and financial instruments measured at fair value.
Allowance for Losses on Loans, Loan Commitments and Guarantees
The allowance for losses on loans, loan commitments and guarantees represents management’s best estimate of probable credit losses. The allowance includes both general and specific components. Management determines the allowances using various assumptions based on its assessment of the impact of recent events and changes in economic conditions and trends. These estimates are reviewed periodically during the year and in detail as at the date of the financial statements.
The purpose of the general allowance is to provide an estimate of probable incurred losses inherent in the loan portfolio that as yet have not been identified on an individual loan basis. Management judgment is required with respect to management’s assessment of probabilities of default, loss severity in the event of default, review of credit quality for internally rated obligors as well as the impact of industry trends and risk concentrations on the portfolio and the required allowance.
Specific allowances are established on an individual basis for loans that management has determined to be impaired. When a loan is considered impaired the carrying value of the loan is reduced to its net realizable value. Management is required to make a number of estimates including the timing and amount of future cash flows, residual values of underlying security, as well as the initial judgment as to whether the loan is impaired or performing.
Additional information on the methodology for determining allowances for losses on loans, loan commitments and guarantees can be found in note 2 of our consolidated financial statements.
Allowance for Claims on Insurance
The allowance for claims on insurance represents our estimated future claims under the terms and conditions of our insurance policies.
The allowance is based on an actuarial valuation of the insurance policy and claim liabilities. The actuarial valuation uses simulation techniques and is based on assumptions relevant to the insurance programs and is derived from our own experience. Management judgment is required in estimating the variables that are part of the actuarial calculation of the allowance. These variables include severity of loss, loss development, frequency of claim and discount rates used. Management judgment is also used in selecting the confidence level for adverse deviation.
Employee Future Benefits
EDC maintains defined benefit pension plans and other benefit plans. Our defined benefit pension plans provide benefits to retirees based on years of service, the best five consecutive years’ average salary of the retirees while they were employees, and a fixed percentage that varies depending on whether or not the retiree was a contributory or non-contributory member of the plan. We fund our defined benefit pension plans in accordance with actuarially determined amounts required to satisfy employee benefit obligations under current federal pension regulations, and we fund the other benefit plans as the cost of benefits are incurred.
Canadian generally accepted accounting principles require that management measure the plans’ accrued benefit obligations and annual costs using assumptions that reflect best estimates, which are generally regarded as long-term in nature. We review key assumptions on an annual basis with our actuaries by using relevant experience, in conjunction with market related data. The key assumptions include expected long-term rate of return on plan assets, rate of compensation increase, and the discount rate. The management assumption with the greatest potential impact on our pension benefit obligation is the discount rate. The discount rate is determined by reference to the yield of a portfolio of high quality fixed income instruments (rated AA or higher), which has the same duration as the plan’s accrued benefit obligation. Information on high quality Canadian corporate bonds is generally available from independent sources, and serves as a starting point in determining the discount rate. Actual results that differ from these long-term assumptions used are accumulated and amortized over future periods into pension expense and therefore, affect the recorded obligations in future periods.
EDC Annual Report 2008 | 69
Management’s Discussion and Analysis
Sensitivity Analysis
The following table outlines the potential impact of changes in certain key assumptions used in measuring the accrued benefit obligations and benefit costs. The sensitivity analysis contained in this table is hypothetical and should be used with caution.
| | | | | | | | | | | | | | | | | | | | | | | | | |
| | | | | | | | | | | | | | | | | | |
| (in millions of Canadian dollars) | | | | | | | | | | | | | | | | | | As at December 31, 2008 |
| | | Registered pension plan | | Supplementary pension plan | | Other benefit plans |
| | | Obligation | | Expense | | Obligation | | Expense | | Obligation | | Expense |
| |
| Sensitivity of Assumptions Discount rate | | | 7.0 | % | | | 5.5 | % | | | 7.0 | % | | | 5.5 | % | | | 7.0 | % | | | 5.5 | % |
| Impact of: 1% increase ($) | | | (42 | ) | | | (6 | ) | | | (2 | ) | | | — | | | | (10 | ) | | | (2 | ) |
| 1% decrease($) | | | 55 | | | | 12 | | | | 3 | | | | — | | | | 12 | | | | 3 | |
| |
| Expected long-term rate of return on assets | | | n/a | | | | 7.5 | % | | | n/a | | | | 3.75 | % | | | n/a | | | | — | |
| Impact of: 1% increase ($) | | | n/a | | | | (3 | ) | | | n/a | | | | — | | | | n/a | | | | — | |
| 1% decrease($) | | | n/a | | | | 3 | | | | n/a | | | | — | | | | n/a | | | | — | |
| |
| Rate of compensation increase | | | 4.0 | % | | | 4.0 | % | | | 4.0 | % | | | 4.0 | % | | | 4.0 | % | | | 4.0 | % |
| Impact of: 1% increase ($) | | | 10 | | | | 4 | | | | 2 | | | | 1 | | | | 1 | | | | — | |
| 1% decrease($) | | | (10 | ) | | | (3 | ) | | | (1 | ) | | | — | | | | (1 | ) | | | — | |
| |
As a result of the volatility in the capital markets during 2008, the performance of our pension plans’ assets was negatively impacted, resulting in a decrease in the fair value of our plans’ assets of $71 million. During the same period, bond yields increased in response to the uncertainty and volatility in the global financial markets which impacted the discount rate used to measure EDC’s plans benefit obligations and pension plans’ assets. The discount rate has increased to 7.00% (2007 – 5.50%). The 2008 discount rate has decreased the accrued benefit obligations of the plans by $107 million; this has offset the plans’ negative performance, and ultimately has reduced the overall plans’ liability at December 31, 2008. These two factors will also impact the benefit expenses for fiscal years 2009 and beyond.
The financial health of a pension plan is measured by actuarial valuations, which are prepared on both an on-going and a solvency basis. The EDC registered pension plan ratios as at December 31, 2007 were 117% on an on-going basis and 85% on a solvency basis. Since EDC’s solvency ratio is less than 100%, we are required by federal pension legislation to make special quarterly solvency contributions to return the solvency ratio to 100% within five years. During 2008 we contributed special payments of $14 million into the plan and will continue to remit all required solvency payments. The next formal valuations will be conducted by the plans’ actuaries in 2009 and will be as at December 31, 2008.
Further detail of our employee future benefits costs and liability can be found in Note 33 to the consolidated financial statements. Additional information on the significant accounting policies underlying the accounting for employee future benefits is provided in Note 2.
Financial Instruments Measured at Fair Value
In accordance with generally accepted accounting principles, the majority of financial instruments are recognized on the balance sheet at their fair value. These financial instruments include held-for-trading and available-for-sale marketable securities, derivative financial instruments, loans payable designated as held-for-trading, equity financing designated as held-for-trading, recoverable insurance claims, and loan guarantees. Fair value is defined as the amount of the consideration that would be agreed upon in an arm’s length transaction between knowledgeable, willing parties who are under no compulsion to act.
The fair value of marketable securities is estimated using observable market prices. If such prices are not available, a valuation model is used that is consistent with accepted pricing methodologies.
The fair value of derivative financial instruments is estimated using various methods depending on the nature of the derivative instruments. Generally, these methods involve using models which are developed from recognized valuation techniques to discount the cash flows related to the derivative financial instruments.
The fair value of our loans payable is estimated using the valuation models such as the discounted cash flow method when independent market prices are not available.
The fair value of equity investments is estimated from observed market prices when such prices are available. When market prices are not available, discounted earnings or cash flow approaches, as well as liquidation or asset-based methods are used.
70 | Managing Risk. Maximizing Opportunities.
Management’s Discussion and Analysis
The fair value of recoverable insurance claims and of loan guarantees represents management’s best estimate of probable recovery and probable credit losses.
We have controls and policies in place to ensure that our valuations are appropriate and realistic. In general, the use of methodologies, models and assumptions to measure the fair value of our financial assets and liabilities are determined by our MRM team, which is not involved in the initiation of the transactions. The models, valuation methodologies, and market-based parameters and inputs that are used, are subject to a regular review and validation, including a comparison with values from outside agencies. In limited circumstances where the valuation of a financial instrument is not independent from the initiation of the transaction, the resulting valuation is subject to review by a valuation committee.
Future Accounting Changes
International Financial Reporting Standards
In 2006 the Accounting Standards Board (AcSB) of Canada announced its intention to adopt International Financial Reporting Standards (IFRS) as Canadian GAAP for publicly accountable entities. In early 2008, the AcSB announced that the changeover date for full adoption of IFRS will be January 1, 2011. To be compliant with IFRS standards, we will be required to prepare an opening balance sheet as at January 1, 2010, as well as 2010 IFRS comparatives. We are currently assessing the impact to our financial statements of adopting IFRS. More detail on our IFRS implementation plan can be found in Note 2 to the consolidated financial statements.
Contractual Obligations
In the normal course of business, we enter into contracts that give rise to commitments of future minimum payments.
Future payments on our long-term debt and our other long-term payable over the next five years are depicted below.
We have two types of loan commitments. The first type is undisbursed amounts on signed loan agreements. The second type represents commitments we made, for which terms related to the transaction such as interest rate type and disbursement schedule have not yet been determined. This category includes letters of offer accepted and outstanding for loans and guarantees as well as unallocated, confirmed lines of credit.
Purchase obligations include those obligations that are legally binding agreements whereby we have agreed to purchase products or services with specific minimum quantities defined as fixed, minimum or variable in price over a specified period of time.
The following table provides a summary of our future contractual commitments.
| | | | | | | | | | | | | | | | | | | | | |
| | | Under | | | 1 to 3 | | | 3 to 5 | | | Over | | | | |
| (in millions of Canadian dollars) | | 1 year | | | years | | | years | | | 5 years | | | Total | |
| |
| Long-term debt | | | 2,522 | | | | 10,652 | | | | 3,332 | | | | 1,892 | | | | 18,398 | |
| Other long-term payable | | | 8 | | | | 16 | | | | 16 | | | | 67 | | | | 107 | |
| Undisbursed loan commitments | | | 3,839 | | | | 2,265 | | | | 1,697 | | | | 223 | | | | 8,024 | |
| Undisbursed equity commitments | | | 62 | | | | 80 | | | | 135 | | | | 2 | | | | 279 | |
| Letters of offer accepted and outstanding | | | — | | | | 2,795 | | | | — | | | | — | | | | 2,795 | |
| Confirmed LOC | | | 59 | | | | 34 | | | | 12 | | | | 404 | | | | 509 | |
| Operating leases | | | 16 | | | | 42 | | | | 47 | | | | 504 | | | | 609 | |
| Purchase obligations | | | 23 | | | | 9 | | | | 1 | | | | 7 | | | | 40 | |
| |
| Total | | $ | 6,529 | | | $ | 15,893 | | | $ | 5,240 | | | $ | 3,099 | | | $ | 30,761 | |
| |
EDC Annual Report 2008 | 71
Financial Reporting Responsibility
The consolidated financial statements contained in this Annual Report have been prepared by management in accordance with Canadian generally accepted accounting principles appropriate in the circumstances. The integrity and objectivity of the data in these consolidated financial statements are management’s responsibility. It is necessary for management to make assumptions and estimates based on information available as at the date of the financial statements. Areas where management has made significant estimates and assumptions include the determination of the primary beneficiary of variable interest entities, the allowance for losses on loans, the allowance for losses on loan commitments and guarantees, the allowance for claims on insurance, financial instruments measured at fair value and employee future benefits. Management is also responsible for all other information in the Annual Report and for ensuring that this information is consistent, where appropriate, with the information and data contained in the consolidated financial statements.

Kevin O’Brien,
Senior Vice-President and
Chief Financial Officer
In support of its responsibility, management maintains financial, management control and information systems and management practices to provide reasonable assurance that the financial information is reliable, that the assets are safeguarded and that the operations are carried out effectively. We have an internal audit department whose functions include reviewing internal controls and their application, on an ongoing basis.
The Board of Directors is responsible for the management of our business and activities. In particular, it is responsible for ensuring that management fulfills its responsibilities for financial reporting and internal control and exercises this responsibility through the Audit Committee of the Board, which is composed of Directors who are not employees of EDC. The Audit Committee meets with management, the internal auditors and the Auditor General of Canada on a regular basis.
Contracts which, in our opinion, involve risks in excess of that which we would normally undertake, may be entered into under the authority of the Minister of International Trade and the Minister of Finance where the Minister of International Trade considers them to be in the national interest. Funds required for such contracts are paid to EDC by the Minister of Finance out of the Consolidated Revenue Fund, and funds recovered are remitted to the Consolidated Revenue Fund, net of amounts withheld to cover related administrative expenses. These transactions, which are known as Canada Account transactions, are shown in note 35 to our consolidated financial statements, and the responsibility of the Board of Directors for these transactions is limited to the management of the administration thereof by EDC.
The Auditor General of Canada conducts an independent audit, in accordance with Canadian generally accepted auditing standards, and expresses her opinion on the consolidated financial statements. Her report is presented on the following page.
| | | |
| |  |
Eric Siegel | | Kevin O’Brien |
| President and Chief Executive Officer | | Senior Vice-President and Chief Financial Officer |
| | | |
| February 13, 2009 | | |
72 | Managing Risk. Maximizing Opportunities.
| To the Minister of International Trade |
To the Minister of International Trade
I have audited the consolidated balance sheet of Export Development Canada as at December 31, 2008 and the consolidated statements of income, changes in shareholder’s equity, comprehensive income and cash flows for the year then ended. These financial statements are the responsibility of the Corporation’s management. My responsibility is to express an opinion on these financial statements based on my audit.
I conducted my audit in accordance with Canadian generally accepted auditing standards. Those standards require that I plan and perform an audit to obtain reasonable assurance whether the financial statements are free of material misstatement. An audit includes examining, on a test basis, evidence supporting the amounts and disclosures in the financial statements. An audit also includes assessing the accounting principles used and significant estimates made by management, as well as evaluating the overall financial statement presentation.
In my opinion, these consolidated financial statements present fairly, in all material respects, the financial position of the Corporation as at December 31, 2008 and the results of its operations and its cash flows for the year then ended in accordance with Canadian generally accepted accounting principles. As required by the Financial Administration Act, I report that, in my opinion, these principles have been applied on a basis consistent with that of the preceding year.
Further, in my opinion, the transactions of the Corporation and of its wholly-owned subsidiary that have come to my notice during my audit of the financial statements have, in all significant respects, been in accordance with Part X of the Financial Administration Act and regulations, the Export Development Act and regulations, the by-laws of the Corporation, the charter and by-laws of its subsidiary, and the directive issued pursuant to Section 89 of the Financial Administration Act described in note 1 to the financial statements.
 Sheila Fraser, FCA
Auditor General of Canada
Ottawa, Canada
February 13, 2009
EDC Annual Report 2008 | 73
Consolidated Financial Statements
Export Development Canada
Consolidated Balance Sheet
| | | | | | | | | |
| as at December 31 | | | | | | |
| (in millions of Canadian dollars) | | 2008 | | | 2007 | |
| |
Assets | | | | | | | | |
Cash and Investments | | | | | | | | |
| Cash | | | 188 | | | | 173 | |
| Marketable securities: (note 3) | | | | | | | | |
| Held-for-trading | | | 3,193 | | | | 1,600 | |
| Available-for-sale | | | 462 | | | | 755 | |
| |
| | | | 3,843 | | | | 2,528 | |
| |
| | | | | | | | | |
Financing and Leasing Assets | | | | | | | | |
| Loans receivable (notes 4 and 5) | | | 30,209 | | | | 18,519 | |
| Allowance for losses on loans (note 6) | | | (1,928 | ) | | | (1,316 | ) |
| Equity financing designated as held-for-trading (note 7) | | | 150 | | | | 95 | |
| Net investment in capital leases (note 8) | | | 142 | | | | 122 | |
| Equipment available for lease (note 9) | | | 334 | | | | 372 | |
| Accrued interest and fees | | | 299 | | | | 229 | |
| |
| | | | 29,206 | | | | 18,021 | |
| |
| | | | | | | | | |
Other | | | | | | | | |
| Recoverable insurance claims (note 31) | | | 39 | | | | 27 | |
| Reinsurers’ share of allowance for claims (note 15) | | | 157 | | | | 88 | |
| Derivative instruments (note 13) | | | 1,830 | | | | 2,242 | |
| Property, plant and equipment (note 10) | | | 15 | | | | 7 | |
| Intangible assets (note 11) | | | 36 | | | | 32 | |
| Other assets | | | 130 | | | | 144 | |
| |
| | | | 2,207 | | | | 2,540 | |
| |
Total Assets | | $ | 35,256 | | | $ | 23,089 | |
| |
| | | | | | | | | |
Liabilities and Shareholder’s Equity | | | | | | | | |
| Loans Payable: (note 12) | | | | | | | | |
| Designated as held-for-trading | | | 24,426 | | | | 14,408 | |
| Other financial liabilities | | | 1,456 | | | | 1,175 | |
| |
| | | | 25,882 | | | | 15,583 | |
| |
| | | | | | | | | |
Other Liabilities and Deferred Revenue | | | | | | | | |
| Accounts payable and other credits | | | 227 | | | | 209 | |
| Deferred insurance premiums | | | 69 | | | | 69 | |
| Derivative instruments (note 13) | | | 1,400 | | | | 166 | |
| Allowance for losses on loan commitments and guarantees (note 6) | | | 807 | | | | 564 | |
| Allowance for claims on insurance (note 15) | | | 755 | | | | 474 | |
| |
| | | | 3,258 | | | | 1,482 | |
| |
Financing Commitments and Contingent Liabilities (notes 16 and 17) | | | | | | | | |
Shareholder’s Equity (note 19) | | | | | | | | |
| Share capital | | | 983 | | | | 983 | |
| Retained earnings | | | 5,077 | | | | 5,121 | |
| Accumulated other comprehensive income | | | 56 | | | | (80 | ) |
| |
| | | | 6,116 | | | | 6,024 | |
| |
Total Liabilities and Shareholder’s Equity | | $ | 35,256 | | | $ | 23,089 | |
| |
The accompanying notes are an integral part of these consolidated financial statements.
| | | |
| Approved by the Board of Directors | | |
| | | |
| | |
John Rooney | | Eric Siegel |
| | | |
| Director | | Director |
74 | Managing Risk. Maximizing Opportunities.
Consolidated Financial Statements
Consolidated Statement of Income
| | | | | | | | | |
| for the year ended December 31 | | | | | | |
| (in millions of Canadian dollars) | | 2008 | | | 2007 | |
| |
Financing and investment revenue | | | | | | | | |
| Loan (note 26) | | | 1,350 | | | | 1,405 | |
| Capital lease (note 8) | | | 9 | | | | 8 | |
| Operating lease (note 9) | | | 43 | | | | 37 | |
| Debt relief (note 34) | | | — | | | | 1 | |
| Investment (note 27) | | | 81 | | | | 123 | |
| |
| | | | 1,483 | | | | 1,574 | |
| Interest expense (note 28) | | | 611 | | | | 717 | |
| Leasing and financing related expenses (note 29) | | | 38 | | | | 46 | |
| |
| | | | | | | | | |
Net Financing and Investment Income | | | 834 | | | | 811 | |
| |
Loan Guarantee Fees | | | 19 | | | | 14 | |
| |
Insurance Premiums and Guarantee Fees (note 18) | | | 172 | | | | 149 | |
| |
Other Income (Expense) (note 32) | | | (11 | ) | | | 46 | |
| |
| | | | 1,014 | | | | 1,020 | |
| |
Provision for Credit Losses (note 30) | | | 346 | | | | 196 | |
| |
Claims-Related Expenses (note 31) | | | 222 | | | | 132 | |
| |
Administrative Expenses | | | 240 | | | | 219 | |
| |
Net Income | | $ | 206 | | | $ | 473 | |
| |
The accompanying notes are an integral part of these consolidated financial statements.
EDC Annual Report 2008 | 75
Consolidated Financial Statements
Consolidated Statement of Changes in Shareholder’s Equity
| | | | | | | | | |
| for the year ended December 31 | | | | | | |
| (in millions of Canadian dollars) | | 2008 | | | 2007 | |
| |
Share Capital | | | 983 | | | | 983 | |
| |
| | | | | | | | | |
Retained Earnings | | | | | | | | |
| Balance beginning of year | | | 5,121 | | | | 5,003 | |
| Transition adjustment on adoption of financial instruments standards | | | — | | | | (5 | ) |
| Net income | | | 206 | | | | 473 | |
| Dividend paid | | | (250 | ) | | | (350 | ) |
| |
| Balance end of year | | | 5,077 | | | | 5,121 | |
| |
| | | | | | | | | |
Accumulated Other Comprehensive Income | | | | | | | | |
| Balance beginning of year | | | (80 | ) | | | — | |
| Transition adjustment on adoption of financial instruments standards | | | — | | | | (10 | ) |
| Other comprehensive income (loss) | | | 136 | | | | (70 | ) |
| |
| Balance end of year | | | 56 | | | | (80 | ) |
| |
| Retained earnings and accumulated other comprehensive income | | | 5,133 | | | | 5,041 | |
| |
Total Shareholder’s Equity at End of Year | | $ | 6,116 | | | $ | 6,024 | |
| |
Consolidated Statement of Comprehensive Income
| | | | | | | | | |
| for the year ended December 31 | | | | | | |
| (in millions of Canadian dollars) | | 2008 | | | 2007 | |
| |
Net Income | | | 206 | | | | 473 | |
| |
Other Comprehensive Income | | | | | | | | |
| Net unrealized gains (losses) on available-for-sale marketable securities | | | 152 | | | | (72 | ) |
| Reclassification of (gains) losses on available-for-sale marketable securities to income | | | (16 | ) | | | 2 | |
| |
| Other comprehensive income (loss) | | | 136 | | | | (70 | ) |
| |
Comprehensive Income | | $ | 342 | | | $ | 403 | |
| |
The accompanying notes are an integral part of these consolidated financial statements.
76 | Managing Risk. Maximizing Opportunities.
Consolidated Financial Statements
Consolidated Statement of Cash Flows
| | | | | | | | | |
| for the year ended December 31 | | | | | | |
| (in millions of Canadian dollars) | | 2008 | | | 2007 | |
| |
Cash Flows from (used in) Operating Activities | | | | | | | | |
| Net income | | | 206 | | | | 473 | |
| Adjustments to determine net cash from (used in) operating activities | | | | | | | | |
| Provision for credit losses | | | 346 | | | | 196 | |
| Actuarial increase in the allowance for claims | | | 146 | | | | 54 | |
| Depreciation and amortization | | | 29 | | | | 30 | |
| Changes in operating assets and liabilities | | | | | | | | |
| Increase in accrued interest and fees receivable | | | (49 | ) | | | (131 | ) |
| Change in fair value of marketable securities | | | 221 | | | | 3 | |
| Change in fair value of loans payable | | | 494 | | | | 52 | |
| Change in derivative instruments receivable | | | (168 | ) | | | (283 | ) |
| Change in derivative instruments payable | | | (1,147 | ) | | | 1,270 | |
| Other | | | 193 | | | | (97 | ) |
| |
| Net cash from (used in) operating activities | | | 271 | | | | 1,567 | |
| |
| | | | | | | | | |
Cash Flows from (used in) Investing Activities | | | | | | | | |
| Financing disbursements | | | (13,324 | ) | | | (9,972 | ) |
| Financing repayments | | | 6,597 | | | | 7,184 | |
| Equity financing disbursements | | | (96 | ) | | | (56 | ) |
| Equity financing receipts | | | 5 | | | | 3 | |
| Purchases of held-for-trading marketable securities | | | (46,735 | ) | | | (42,729 | ) |
| Sales/maturities of held-for-trading marketable securities | | | 45,378 | | | | 43,308 | |
| Purchases of available-for-sale marketable securities | | | (385 | ) | | | (303 | ) |
| Sales/maturities of available-for-sale marketable securities | | | 716 | | | | 248 | |
| |
| Net cash used in investing activities | | | (7,844 | ) | | | (2,317 | ) |
| |
| | | | | | | | | |
Cash Flows from (used in) Financing Activities | | | | | | | | |
| Issues of long-term loans payable – held-for-trading | | | 7,255 | | | | 4,247 | |
| Repayment of long-term loans payable – held-for-trading | | | (3,320 | ) | | | (2,144 | ) |
| Issues of long-term loans payable – other financial liabilities | | | — | | | | 1,074 | |
| Repayment of long-term loans payable – other financial liabilities | | | — | | | | (537 | ) |
| Change in short-term loans payable | | | 2,972 | | | | (1,063 | ) |
| Change in derivative instruments receivable | | | 613 | | | | (477 | ) |
| Change in derivative instruments payable | | | 305 | | | | (23 | ) |
| Dividend paid | | | (250 | ) | | | (350 | ) |
| |
| Net cash from financing activities | | | 7,575 | | | | 727 | |
| |
| Effect of exchange rate changes on cash | | | 13 | | | | (27 | ) |
| |
| Net increase (decrease) in cash | | | 15 | | | | (50 | ) |
| | | | | | | | | |
Cash | | | | | | | | |
| Beginning of year | | | 173 | | | | 223 | |
| |
| End of year | | $ | 188 | | | $ | 173 | |
| |
| | | | | | | | | |
Supplemental Disclosure of Cash Flow Information | | | | | | | | |
| Cash paid for interest | | $ | 624 | | | $ | 695 | |
| |
The accompanying notes are an integral part of these consolidated financial statements.
EDC Annual Report 2008 | 77
| Notes to the Consolidated Financial Statements |
Consolidated Financial Statements
Notes to the Consolidated Financial Statements
1. Corporate Mandate
Export Development Canada (the “Corporation” or “EDC”), was established on October 1, 1969 by the Export Development Act (the “Act”), a statute of the Parliament of Canada that was last amended effective December 21, 2001. The Act provides that the Corporation was established for the purposes of supporting and developing, directly or indirectly, Canada’s export trade and Canadian capacity to engage in that trade and to respond to international business opportunities. The Corporation is named in Part I of Schedule III to the Financial Administration Act and is accountable for its affairs to Parliament through the Minister of International Trade.
In September, 2008, the Corporation, together with Business Development Bank of Canada, Canada Mortgage and Housing Corporation, Canadian Commercial Corporation and Farm Credit Canada, was issued a directive (P.C. 2008-1598) pursuant to Section 89 of the Financial Administration Act, entitled Order giving a direction to parent Crown corporations involved in commercial lending to give due consideration to the personal integrity of those they lend to or provide benefits to, in accordance with Government’s policy to improve the accountability and integrity of federal institutions. The Corporation is finalizing its review of its policies and programs and, as per the requirements of section 89(6) of the Financial Administration Act, will be notifying the Minister of International Trade forthwith that the directive has been implemented.
We incorporated Exinvest Inc. as a wholly-owned subsidiary (the “Subsidiary”) under the Canada Business Corporations Act in 1995.
Our earnings and those of our Subsidiary are not subject to the requirements of the Income Tax Act.
We are subject to a limit imposed by the Act on our contingent liability arrangements. The Act specifies that the limit applies to the principal amount owing under all outstanding arrangements which have the effect of providing, to any person, any insurance, reinsurance, indemnity or guarantee. This limit shall at no time exceed the greater of an amount equal to 10 times our authorized capital, and $30.0 billion which amount may be varied in an Appropriation Act. At the end of December 2008, the amount of these contingent liabilities was $28.2 billion (2007 – $20.6 billion).
We are for all purposes an agent of Her Majesty in right of Canada. As a result, all obligations under debt instruments we issue are obligations of Canada. The Act allows us to borrow and have outstanding borrowings up to a maximum of 15 times the aggregate of (a) our current paid-in capital and (b) our retained earnings determined in accordance with the previous year’s audited financial statements. The maximum applicable to December 31, 2008 is $90.4 billion (2007 – $89.8 billion), against which borrowings amounted to $25.9 billion (2007 – $15.6 billion).
2. Summary of Significant Accounting Policies
Basis of Presentation
Our consolidated financial statements have been prepared in accordance with Canadian generally accepted accounting principles (GAAP). The significant accounting policies used in the preparation of these consolidated financial statements are summarized on the following pages and conform in all material respects to Canadian GAAP.
Basis of Consolidation
Our consolidated financial statements include the assets, liabilities, results of operations and cash flows of our subsidiary and variable interest entities (VIEs) for which we are determined to be the primary beneficiary. Intercompany transactions and balances have been eliminated.
Change in Accounting Standards
Effective January 1, 2008, we adopted the Canadian Institute of Chartered Accountants (CICA) Section 3862, Financial Instruments – Disclosures, and Section 3863, Financial Instruments – Presentation which replaced Section 3861, Financial Instruments – Disclosure and Presentation which was adopted on January 1, 2007. The presentation requirements prescribed by Section 3863 are consistent with those of Section 3861. The adoption of Section 3862 resulted in additional disclosures with respect to risk management policies as well as the nature and extent of risks arising from financial instruments.
Effective January 1, 2008, we also adopted the CICA Section 1535 – Capital Disclosures. As a result of the adoption of this new section, we have increased disclosures regarding our objectives, policies and processes for the management of capital, as well as disclosures of summary quantitative information about what we manage as capital.
In October 2008, the CICA issued amendments to Section 3855 – Financial Instruments – Recognition and Measurement, and Section 3862 – Financial Instruments – Disclosure. These amendments permit the reclassification of non-derivative financial assets out of the held-for-trading and available-for-sale categories under specified circumstances. We did not reclassify any of our non-derivative financial assets, and therefore, there is no impact on our financial statements from these amendments.
In November 2007, the CICA issued a new accounting standard, Section 3064 – Goodwill and Intangible Assets, which replaces Section 3062 – Goodwill and Other Intangible Assets. The standard defines the recognition and measurement criteria for intangible assets and, in particular, for intangible assets that are internally generated. Section 3064 is effective for periods beginning on or after October 1, 2008, however, we have adopted this section early, effective January 1, 2008. There was no impact on our financial statements from the adoption of this new standard.
78 | Managing Risk. Maximizing Opportunities.
Consolidated Financial Statements
Use of Estimates and Assumptions
To prepare our financial statements in accordance with Canadian GAAP, it is necessary for management to make assumptions and estimates based on information available as at the date of the financial statements. Areas where management has made significant estimates and assumptions include the allowance for losses on loans, loan commitments and guarantees (note 6), the allowance for claims on insurance (note 15), financial instruments measured at fair value (note 23), the determination of the primary beneficiary of variable interest entities (note 25), and employee future benefits (note 33).
Management determines the allowances using various assumptions, based on its assessment of the impact of recent events and changes in economic conditions and trends. These assumptions include probability of default, loss severity in the event of default and various formulas based on credit quality of counterparties. The allowance estimates are reviewed periodically during the course of the year as required and in detail as at the date of the financial statements. Actual losses on loans and liabilities for contingencies incurred may vary significantly from management’s estimates. The uncertainty in the estimation process arises, in part, from the use of historical data to identify and quantify credit deterioration. While historical data may be the most reliable basis available to calculate these amounts, economic events may occur in the near term that render previous assumptions invalid and cause a material change to management’s estimates.
Estimates are also made in the determination of the fair values of our financial instruments, particularly concerning the amount and timing of future cash flows and discount rates. The valuation process uses market rates at a current point in time, however the amounts paid or received on an actual transaction may differ significantly from these estimates, the impact of which would be recorded in future periods.
Marketable Securities
We hold marketable securities for liquidity purposes. The size and nature of the marketable securities portfolio is governed by Board approved policies. Our marketable securities are held with creditworthy counterparties that must have a minimum credit rating from an external credit rating agency of A for transactions of less than three years, and a minimum external credit rating of AA- for transactions greater than three years.
Marketable securities are divided into two portfolios, the available-for-sale portfolio and the held-for-trading portfolio, to reflect management’s intent with respect to these securities. We measure performance for both portfolios against appropriate benchmarks. Purchases and sales of these investments are recorded on the trade date and the transaction costs are expensed as incurred.
Debt securities which we have purchased with the intention of being held-to-maturity but may be sold in response to changes in liquidity needs, interest rates, credit risk or to rebalance the portfolio to better match its benchmark index are classified as available-for-sale and accounted for at fair value. Interest income is calculated using the effective interest method and is recorded in investment revenue. Unrealized gains and losses due to the change in value of available-for-sale securities are recorded in other comprehensive income and realized gains or losses are recorded in other income. In the case of a significant and other than temporary decline in the fair value of an available-for-sale security, the cumulative loss that had been recorded in other comprehensive income is removed from accumulated other comprehensive income and recorded in other income even though the financial instrument has not been derecognized.
Debt securities which we have purchased principally for the purpose of selling in the near-term are classified as held-for-trading and accounted for at fair value. Realized and unrealized gains and losses on the short-term securities are included in investment revenue while gains and losses on the long-term securities are included in other income. Interest revenue is recorded in investment revenue.
Loans Receivable
Loans receivable are recorded at fair value upon initial recognition and are subsequently carried at amortized cost using the effective interest method. Loans receivable are stated net of non-accrued capitalized interest and deferred loan revenue. Loan revenue is recorded on an accrual basis, except for impaired loans as further described. While it is generally our intention to hold performing loan assets until maturity, in some cases the loans are sold prior to maturity for risk mitigation purposes. Gains and losses on the sale of performing loans and gains on the sale of impaired loans are included in other income. Losses on sales of impaired loans are reported in the provision for credit losses.
EDC Annual Report 2008 | 79
Consolidated Financial Statements
Impaired Loans
Loans are classified as impaired when, in the opinion of management, any of the following criteria are met:
| 4 | | there has been a deterioration in credit quality to the extent that there is no longer reasonable assurance of the timely collection of the full amount of principal and interest; |
| |
| 4 | | for commercial loans, when there are payment overdues of 90 days or more, unless the loan is fully secured or collection efforts are reasonably expected to result in repayment of debt; or |
| |
| 4 | | management considers it prudent to cease accruing interest on the loan. |
When a loan is classified as impaired, the accrual of interest ceases, and any previously accrued but unpaid interest is reversed against loan revenue. Any payments received on a loan that has been classified as impaired are credited to the carrying value of the loan including interest payments which are recorded as non-accrued capitalized interest. Interest and fees that have been capitalized as principal through the rescheduling or restructuring of an impaired loan are also credited to the carrying value of the loan by recording them as non-accrued capitalized interest.
No portion of cash received on a loan subsequent to its classification as impaired is recorded as loan revenue until such time as the loan is restored to performing status or the carrying value of the loan is determined to be unreasonably low compared to its net realizable value which is calculated using the estimated discounted future cash flows. Cash received on an impaired loan with a carrying value of zero is recorded as income. When either of these specific criteria for revenue recognition on impaired loans is met, the income is recorded in impaired revenue and is part of total loan revenue.
Loans are restored to performing status when it is determined that there is reasonable assurance of full and timely collection of principal and interest. Rescheduled loans are considered performing unless they meet the criteria of impaired loans. When we restore an impaired loan to an accrual basis, any non-accrued capitalized interest as a result of cash payments received is recognized in income immediately and any remaining non-accrued capitalized interest is recognized over the remaining term of the loan using the effective interest method.
Foreclosed Assets
Assets that are returned to us1 because of default under loan agreements are classified as held-for-use or available-for-sale according to management’s intention. Those classified as held-for-use are initially recorded at fair value and included in equipment available for lease or reclassified as capital leases. Those classified as available-for-sale are initially recorded at fair value less costs to sell and included in other assets. Any write-downs at recognition are reported in the provision for credit losses and any gains are recorded in other income. We generally determine fair value based on market prices obtained from an independent appraiser.
Property, Plant and Equipment
Property, plant and equipment are carried at cost less accumulated depreciation and accumulated impairment losses. Depreciation is charged on a straight-line basis over the estimated useful lives of the assets or the term of the relevant lease. The estimated useful lives and depreciation methods are reviewed at the end of each year, with the effect of any changes in estimate being accounted for on a prospective basis. The useful life used in the calculation of depreciation for furniture and equipment is five years and three years for computer hardware. Leasehold improvements are depreciated over the shorter of the term of the respective lease or the useful economic life of the leasehold improvement.
The gain or loss arising on the disposal or retirement of an item of property, plant and equipment is determined as the difference between the sale proceeds and the carrying amount of the asset, and is recognized in other income.
Intangible Assets
Intangible assets are identifiable non-monetary assets without physical substance. They are carried at cost less accumulated amortization and accumulated impairment losses. Amortization is charged on a straight-line basis over the estimated useful lives of the intangible assets. The estimated useful lives and amortization methods are reviewed at the end of each year, with the effect of any changes in estimate being accounted for on a prospective basis. The useful life used in the calculation of amortization for internally developed software and computer software is five years.
Allowance for Losses on Loans, Loan Commitments and Guarantees
The allowance for losses on loans, loan commitments and guarantees represents management’s best estimate of probable credit losses. The allowance is based on a review of all loans, loan guarantees and commitments that have been individually or collectively assessed for impairment and includes both general and specific allowances.
| | |
| 1 | | All aircraft returned to us for which the equity interest in the leveraged lease structure has been foreclosed have been registered with a number of trusts, of which we are the sole beneficiary. |
80 | Managing Risk. Maximizing Opportunities.
Consolidated Financial Statements
General Allowance
In 2008 we completed a review of our general loan allowance, which resulted in some changes to the methodology. The purpose of the review was to ensure that the assumptions and variables within our methodology remain relevant. The change in methodology represents a change in estimate of the amount of losses on loans, loan commitments and guarantees. Prior periods have not been restated.
Our methodology is based on an incurred loss model. The key changes to our allowance methodology in 2008 include the following: incorporating into the calculation the loss emergence period, which is the lag between the occurrence of a loss event and the classification of the obligor as impaired requiring a specific allowance; segmenting our portfolio by industry rather than by geography; the removal of an adjustment that was made to reflect the added inherent risks in emerging markets which were previously not fully reflected in the country ratings; and consideration of the fair value of any collateral held in determining the loss severity on our secured loan portfolio.
Performing loans, loan guarantees and commitments (including letters of offer) are assessed collectively for impairment. The assessment is based on events that have occurred as of the reporting date and include factors such as business cycle trends and the fair value of collateral. A general allowance is established for losses which we estimate to have occurred, but have not yet been individually identified within our portfolio. It is comprised of the base allowance, calculated using counterparty credit ratings, factored exposure, loss severity and probability of default factors; and a concentration overlay. The general allowance may also include market overlays.
For the base allowance we group our commercial performing loans, loan commitments and guarantees by industry of risk and then by secured and unsecured exposures. Sovereign exposures are classified into one portfolio. We assign credit ratings to our commercial and sovereign obligors using a system of fifteen credit ratings (AA to Watchlist) which are consistent with ratings used by our credit risk management policies. For secured portfolios, the exposure for each obligor is reduced by the fair value of collateral adjusted for estimated repossession costs. Based on these exposures we determine the appropriate base allowance. Loss severity is determined based on historical loan loss rates and by management estimates for each of our exposure categories and default rates are based on a weighted average of Moody’s and Standard & Poor’s default tables.
We have a number of significant single name counterparty concentrations as a result of our mandate. A counterparty concentration allowance is established for counterparties whose exposure is deemed by management to represent an increased amount of risk. This allowance is applied to counterparties whose exposure exceeds 10% of our shareholder’s equity determined in accordance with the previous year’s audited financial statements.
We determine the general allowance using various assumptions based upon current counterparty credit ratings. We also assess the extent to which these ratings do not reflect recent economic events that may result in credit deterioration. In these cases we will estimate the potential impact on our allowances and apply market overlays to specific industries or other exposure categories that we deem appropriate.
Specific Allowances
Specific allowances are established on an individual loan basis to recognize impairment losses. If there is objective evidence that an impairment loss has occurred on an individual loan, the principal portion of the carrying amount of the loan is reduced through the use of a specific allowance. The specific allowance is the difference between the carrying value of the loan and the present value of the estimated future cash flows discounted at the loan’s original effective interest rate. The calculation of the estimated future cash flows takes into account the fair value of any collateral held on secured loans. The amount of initial impairment and any subsequent changes due to the reevaluation of estimated future cash flows are recognized in the income statement as part of the provision for credit losses.
Loans are written off when all collection methods have been exhausted and no further prospect of recovery is likely. Loan write-offs are charged against the specific allowance.
The general allowances for performing loans and specific allowances for impaired loans are shown as a reduction to loans receivable on the balance sheet. General and specific allowances for loan commitments and guarantees are shown as a liability on the balance sheet.
Risk Mitigation Insurance
In order to create capacity for new financing transactions in portfolios with significant concentrations, we purchased risk mitigation insurance that would provide a pre-determined level of cash flows on an existing pool of secured financing transactions in case of a loss due to default by an obligor. The premiums paid for this insurance are deducted from loan revenue.
We estimate the impact of this insurance in terms of reducing our requirement for an allowance on the loan assets covered under the policy. The impact of the insurance is calculated by comparing the present value of the expected cash flows under the policy to the collateral values used in setting our allowance on an obligor-by-obligor basis. Any reduction to our allowance is called the risk mitigation insurer’s share of loan allowance and is calculated by applying the obligor’s provisioning rate to the excess of the present value of the expected cash flows less the collateral value. When the collateral value exceeds the net present value of the cash flows, the policy does not contribute to a release of allowance.
EDC Annual Report 2008 | 81
Consolidated Financial Statements
Equity Financing
Equity financing investments are comprised of direct investments that we have made in private and public companies and investments in private equity funds. They are designated as held-for-trading financial instruments and are measured at fair value. The fair values of these investments are reliably determinable. Realized and unrealized gains or losses are recorded in other income and transaction costs are expensed as incurred. Purchases and sales of these investments are recorded on a trade-date basis.
Equipment Available for Lease
Equipment available for lease consists of aircraft that were returned to us because of default under the related obligors’ loan agreements. While we do not in the ordinary course of business act as a lessor, from time to time we may engage in leasing activities for asset management purposes to maximize recoveries on returned aircraft and minimize potential losses.
Returned aircraft are initially recorded at fair value and then subsequently recorded net of any impairment losses. Depreciation is calculated on a straight-line basis over the remaining useful life of the aircraft after consideration of any residual value. The maximum remaining useful life is 19 years. Depreciation as well as insurance and other costs related to the equipment available for lease are included in leasing and financing related expenses. Lease set-up costs are recorded in other assets and are deferred and amortized over a period equaling the term of the specific lease. Operating lease revenue is recognized on a straight-line basis over the terms of the underlying leases.
A review for impairment of equipment available for lease is performed when events or changes in circumstances indicate that the carrying amount may not be recoverable. The carrying amount is not recoverable when it exceeds the sum of the undiscounted cash flows expected to result from its use and eventual disposition. Current lease rentals, as well as market information on projected future rentals and fair values, form the basis of this calculation. An impairment loss is recognized when the carrying amount of the asset is not recoverable and exceeds the fair value of the asset. Fair value is based on market prices obtained from an independent appraiser. The amount of the impairment loss is calculated as the difference between the carrying amount of the asset and its fair value and is included in other income.
Capital Leases
Capital leases relate to aircraft that were returned to us due to default under the related obligor’s loan agreements and were subsequently placed back with the obligor under long-term, direct-financing leases. Direct-financing leases are recorded at the aggregate future minimum lease payments plus estimated residual values less unearned finance income. Residual values are based on independent appraisals and are reviewed periodically.
Capital lease revenue is recognized in a manner that produces a constant rate of return on the investment in the lease.
Deferred Revenue
Deferred loan revenue, which consists of exposure, administration, and other upfront loan fees, is included in loans receivable and amortized as a yield increment over the term of the related loan. Guarantee fee revenue and certain insurance premium revenue are recognized as deferred revenue and are amortized over the term of the related guarantee or insurance policy.
Recoverable Insurance Claims
Recoverable insurance claims represent the portion of insurance claims paid that are expected to be recovered net of any recovery through reinsurance agreements. Recoverable insurance claims are financial instruments which we have classified as loans and receivables and are recorded at amortized cost. Subsequent net gains or losses on recovery are credited or charged to the claims-related expenses when recoverable values are re-estimated.
Allowance for Claims on Insurance
The allowance for claims on insurance represents our estimate of future claims under the terms and conditions of our insurance policies. Included in the allowance are amounts for reported claims, incurred but not reported claims, and management’s best estimate of the net present value of net future claims under existing policies. The allowance is based on an actuarial valuation of the insurance policy and claim liabilities and is reviewed continuously by management. The actuarial valuation uses simulation techniques and is based on assumptions (severity of loss, loss development, frequency of claim, and discount rates used) relevant to the insurance programs which are derived from our own experience. The valuation process conforms to the recommendations of the Canadian Institute of Actuaries. Any adjustments are reflected in claims-related expenses in the period in which they become known. Future developments may result in claims which are materially different than the allowance provided.
82 | Managing Risk. Maximizing Opportunities.
Consolidated Financial Statements
Insurance Premiums
Premiums for credit insurance are recognized in income when underlying sales are declared by the policyholders. Premiums on other insurance policies are deferred and recognized in income using methods that generally reflect the exposures over the terms of the policies and are amortized over the life of the policies on a straight-line basis.
Reinsurance
In the ordinary course of business, we assume and cede reinsurance with other insurance companies. We cede reinsurance to mitigate our risk. The ceding arrangements provide greater diversification of the business and minimize the net loss potential arising from large risks. Ceded reinsurance contracts do not relieve us of our obligations to the insured but they do provide for the recovery of claims arising from the liabilities ceded. We also assume reinsurance and thereby take on risk. Reinsurance premiums and recoveries on claims incurred are recorded to their respective income and balance sheet accounts. Unearned premiums ceded to reinsurers and estimates of amounts recoverable from reinsurers on paid claims are deducted from deferred premiums and recoverable claims respectively. Amounts recoverable from the reinsurers are estimated in a manner consistent with the claims liability associated with the reinsured policy.
Derivative Financial Instruments
Derivative financial instruments (“derivatives”) are financial contracts that derive their value from underlying changes in interest rates, foreign exchange rates, equities, credit spreads or other financial measures. Derivatives that we currently use include interest rate swaps, cross currency interest rate swaps, equity index swaps, foreign exchange swaps, foreign exchange forwards, non-deliverable forwards and credit derivatives.
We use derivatives to manage interest rate risk, foreign exchange risk, and credit risk. These derivatives are only contracted with creditworthy counterparties in accordance with policies established in the Risk Management Office and approved by our Board of Directors.
We do not apply hedge accounting to our derivatives. Derivatives are accounted for at fair value and are recognized on the balance sheet upon the trade date and are removed from the balance sheet when they expire or are terminated. Derivatives with a positive fair value are reported as derivative instruments within assets, while derivatives with a negative fair value are reported as derivative instruments within liabilities. Realized and unrealized gains or losses due to a change in fair value of derivatives associated with long-term loans payable are recorded in other income, while the gains and losses on derivatives associated with our marketable securities and our short-term debt are recorded in investment revenue or interest expense as appropriate. Realized and unrealized gains and losses due to changes in fair value of credit default swaps are included in other income.
We also hold a portfolio of derivatives which we use to manage the foreign exchange risk associated with our operations being largely denominated in U.S. dollars. All income and expenses associated with this portfolio are included in interest expense, while realized and unrealized gains and losses are recorded in other income.
Long-term currency swaps are considered part of the financing cash flows on the consolidated statement of cash flows, as they are necessary to make funding available in the currency required whenever funds are initially raised in a different currency. All other swaps are included in operating cash flows as they are used to alter the interest rate risk profile of the portfolio.
Loans Payable
We have designated our commercial paper debt as held-for-trading and account for it at fair value. Coupon interest and any changes in fair value are recorded in interest expense. We have also designated the majority of our bonds, including our structured debt as held-for-trading and record them at fair value. Contractual interest is recorded on an accrual basis in interest expense and realized and unrealized gains and losses are recorded in other income.
Our bonds which do not have derivatives associated with them are classified as other financial liabilities and are carried at amortized cost using the effective interest rate method with interest recorded in interest expense.
Accounts Payable
Accounts payable and other credits are classified as other financial liabilities and are carried at amortized cost.
EDC Annual Report 2008 | 83
Consolidated Financial Statements
Translation of Foreign Currency
All monetary assets and liabilities denominated in foreign currencies are translated into Canadian dollars at exchange rates prevailing at the end of the year. Income and expenses are translated at either daily or monthly average exchange rates in effect during the year. Exchange gains and losses resulting from the translation of foreign currency balances and transactions are included in other income except for unrealized foreign exchange gains and losses on available-for-sale financial instruments which are recorded in other comprehensive income.
Employee Future Benefits
We maintain defined benefit pension plans and other post-retirement benefit plans including a retiring allowance plan and life insurance, health and dental care benefits.
The accrued benefit obligations are actuarially determined using the projected benefit method prorated on service (which incorporates management’s best estimate of future salary levels, retirement ages of employees and other actuarial factors).
Pension fund assets are valued at fair value for the purpose of calculating the expected return on plan assets.
The defined benefit expense (included in administrative expenses) consists of the actuarially determined retirement benefits for the current year’s service, imputed interest on projected benefit obligations net of interest earned on any plan assets and the amortization of actuarial gains or losses and other items over the average remaining service period of active employees expected to receive benefits under the plans.
Actuarial gains or losses arise from the difference between actual long-term rate of return and the expected long-term rate of return on plan assets for that period and from changes in actuarial assumptions used to determine the accrued benefit obligation. They are amortized on a straight-line basis over the average remaining service period of active employees expected to receive benefits under the plans only if the net actuarial gain or loss at the beginning of the year is in excess of 10% of the greater of the accrued benefit obligation and the fair value of plan assets. Amounts below the 10% threshold are not recognized in income.
The cumulative difference between the defined benefits pension plans’ costs and funding contributions is included in other assets or accounts payable and other credits as applicable.
Adoption in fiscal 2000 of the CICA’s new standard for recording employee future benefits resulted in a transitional obligation with respect to the non-pension post-retirement benefit plans. The transitional obligations with respect to the retiring allowance plan and the other post-retirement benefit plans are being amortized on a straight-line basis into income over 14 and 20 years.
Future Accounting Changes
International Financial Reporting Standards
Effective January 1, 2011, the CICA will adopt International Financial Reporting Standards (IFRS) as Canadian GAAP for publicly accountable enterprises. We are in the process of assessing the differences between current Canadian GAAP and IFRS and the impact to EDC’s financial statements.
During 2008 we completed a high-level diagnostic during which each standard was considered and given a ranking based on its potential impact to our financial results and the level of implementation difficulty that could be expected. By the end of 2008, more than 20 standards were identified that could potentially have an impact on our financial statements, including property, plant and equipment; financial instruments; leases; employee benefits; impairment of assets; and insurance contracts.
Based on the diagnostic described above, a project plan was developed to implement IFRS by January 1, 2011, including an IFRS opening balance sheet as at January 1, 2010 as well as 2010 IFRS comparatives. We have established a project management office responsible for oversight of our progress against the plan. We have also retained an independent national accounting firm to provide technical interpretation and project management advice on an as needed basis.
We have completed our in-depth analysis on a number of the standards applicable to EDC and based on our review to date, we do not expect the required changes to our accounting policies to have a significant impact on our financial results. However, there will also be changes to our financial statement presentation and additional disclosures will be required in our notes to the financial statements. We are currently assessing the impact of these accounting policy changes and new disclosures on our internal systems, processes and procedures to identify modifications which may need to be made. At the end of 2008, we are on track with our IFRS project plan. In addition, to the extent that the IFRS required disclosures are not contrary to Canadian GAAP, we are incorporating some of them into our financial statements in advance of the required implementation date.
The International Accounting Standards Board (IASB) has several projects underway, some of which will impact the standards relevant to EDC. In particular, we are closely monitoring the progress of the projects on insurance contracts, leases and revenue which may result in revised standards being issued before 2011. Any revisions made to these standards could potentially have a significant impact on EDC’s financial statements and may cause us to revisit our conclusions.
84 | Managing Risk. Maximizing Opportunities.
Consolidated Financial Statements
3. Marketable Securities
We maintain liquidity sufficient to meet general operating requirements, to maintain stability in our short-term borrowing program and to provide flexibility in achieving corporate objectives. In order to meet these varied needs, marketable securities are held in either the available-for-sale or held-for-trading portfolio.
| | | | | | | | | | | | | | | | | | | | | | | | | |
| (in millions of Canadian dollars) | | 2008 | | | 2007 | |
| Issued or guaranteed by: | | Held-for-trading | | | Available-for-sale | | | Total | | | Held-for-trading | | | Available-for-sale | | | Total | |
| |
| Financial institutions | | | 1,653 | | | | 94 | | | | 1,747 | | | | 980 | | | | 141 | | | | 1,121 | |
| U.S. government | | | 954 | | | | 266 | | | | 1,220 | | | | 163 | | | | 394 | | | | 557 | |
| U.S. Agency | | | — | | | | — | | | | — | | | | 87 | | | | 160 | | | | 247 | |
| Corporate | | | 196 | | | | 56 | | | | 252 | | | | 340 | | | | 33 | | | | 373 | |
| Canadian government* | | | 371 | | | | 46 | | | | 417 | | | | 15 | | | | 27 | | | | 42 | |
| Other government | | | 19 | | | | — | | | | 19 | | | | 15 | | | | — | | | | 15 | |
| |
| Total marketable securities | | $ | 3,193 | | | $ | 462 | | | $ | 3,655 | | | $ | 1,600 | | | $ | 755 | | | $ | 2,355 | |
| |
| * | | Canadian government includes federal, provincial, and municipal governments and Crown corporations. |
Available-for-sale marketable securities include $40 million (2007 — $39 million) of securities held by our subsidiary Exinvest Inc.
The following table provides a breakdown of our marketable securities by remaining term to maturity.
| | | | | | | | | | | | | | | | | | | | | | | | | | | | | | | | | |
| | | | | | |
| (in millions of Canadian dollars) | | 2008 | | | 2007 | |
| | | Remaining term to maturity | | | Remaining term to maturity | |
| | | Under | | | 1 to 3 | | | Over 3 | | | | | | | Under | | | 1 to 3 | | | Over 3 | | | | |
| | | 1 year | | | years | | | years | | | Total | | | 1 year | | | years | | | years | | | Total | |
| |
Held-for-trading securities | | | | | | | | | | | | | | | | | | | | | | | | | | | | | | | | |
| Short-term instruments | | | 2,654 | | | | — | | | | — | | | | 2,654 | | | | 1,246 | | | | — | | | | — | | | | 1,246 | |
| Long-term fixed rate securities | | | 129 | | | | 248 | | | | 162 | | | | 539 | | | | — | | | | 130 | | | | 224 | | | | 354 | |
| |
| Total held-for-trading | | | 2,783 | | | | 248 | | | | 162 | | | | 3,193 | | | | 1,246 | | | | 130 | | | | 224 | | | | 1,600 | |
| |
Available-for-sale securities | | | | | | | | | | | | | | | | | | | | | | | | | | | | | | | | |
| Long-term fixed rate securities | | | 13 | | | | 120 | | | | 302 | | | | 435 | | | | 6 | | | | 282 | | | | 441 | | | | 729 | |
| Long-term floating rate securities | | | 27 | | | | — | | | | — | | | | 27 | | | | 26 | | | | — | | | | — | | | | 26 | |
| |
| Total available-for-sale | | | 40 | | | | 120 | | | | 302 | | | | 462 | | | | 32 | | | | 282 | | | | 441 | | | | 755 | |
| |
| Total marketable securities before derivatives | | | 2,823 | | | | 368 | | | | 464 | | | | 3,655 | | | | 1,278 | | | | 412 | | | | 665 | | | | 2,355 | |
| Derivative instruments | | | 1 | | | | — | | | | — | | | | 1 | | | | 2 | | | | — | | | | — | | | | 2 | |
| |
| Total marketable securities including derivatives | | $ | 2,824 | | | $ | 368 | | | $ | 464 | | | $ | 3,656 | | | $ | 1,280 | | | $ | 412 | | | $ | 665 | | | $ | 2,357 | |
| |
EDC Annual Report 2008 | 85
Consolidated Financial Statements
4. Loans Receivable
The following table presents the various components of loans receivable and the contractual maturity and related contractual effective yields for gross loans receivable. The yields are computed on a weighted average basis by amount and term. Floating rate yields are expressed as spreads over base rates which consist mainly of LIBOR for U.S. dollars and Prime for Canadian dollars.
| | | | | | | | | | | | | | | | | | | | | | | | | | | | | | | | | | | | | | | | | |
| (in millions of | | | | | | | | | | | | | | | | | | | | | | | | | | | | | | | | | | | | | | |
| Canadian dollars) | | | | | | | | | | | | | | | | | | 2008 | | | | | | | | | | | | | | | | | | | 2007 | |
| | | | | | | | | | | | | | | Yield to | | | | | | | | | | | | | | | | | | | Yield to | | | | |
| | | Floating | | | Spread | | | Fixed | | | maturity | | | Total | | | Floating | | | Spread | | | Fixed | | | maturity | | | Total | |
| | | $ | | | % | | | $ | | | % | | | $ | | | $ | | | % | | | $ | | | % | | | $ | |
| |
| Performing: | | | | | | | | | | | | | | | | | | | | | | | | | | | | | | | | | | | | | | | | |
| Past due | | | 36 | | | | 0.96 | | | | 3 | | | | 6.80 | | | | 39 | | | | 8 | | | | 1.65 | | | | 6 | | | | 5.92 | | | | 14 | |
| 2008 | | | — | | | | — | | | | — | | | | — | | | | — | | | | 1,980 | | | | 1.80 | | | | 774 | | | | 6.35 | | | | 2,754 | |
| 2009 | | | 3,644 | | | | 1.42 | | | | 1,010 | | | | 6.19 | | | | 4,654 | | | | 1,167 | | | | 1.72 | | | | 722 | | | | 6.51 | | | | 1,889 | |
| 2010 | | | 2,245 | | | | 1.81 | | | | 1,056 | | | | 6.28 | | | | 3,301 | | | | 1,045 | | | | 1.75 | | | | 757 | | | | 6.46 | | | | 1,802 | |
| 2011 | | | 3,286 | | | | 1.49 | | | | 1,053 | | | | 6.38 | | | | 4,339 | | | | 1,486 | | | | 1.39 | | | | 798 | | | | 6.47 | | | | 2,284 | |
| 2012 | | | 3,283 | | | | 1.77 | | | | 1,064 | | | | 6.29 | | | | 4,347 | | | | 2,112 | | | | 1.00 | | | | 761 | | | | 6.44 | | | | 2,873 | |
| 2013 | | | 2,201 | | | | 1.60 | | | | 1,027 | | | | 6.27 | | | | 3,228 | | | | 869 | | | | 1.45 | | | | 725 | | | | 6.43 | | | | 1,594 | |
| 2014 – 2018 | | | 3,400 | | | | 1.92 | | | | 3,794 | | | | 6.38 | | | | 7,194 | | | | 1,841 | | | | 1.86 | | | | 2,414 | | | | 6.64 | | | | 4,255 | |
| 2019 and beyond | | | 1,362 | | | | 1.33 | | | | 1,551 | | | | 5.92 | | | | 2,913 | | | | 500 | | | | 1.09 | | | | 553 | | | | 6.52 | | | | 1,053 | |
| |
| Performing gross loans receivable | | | 19,457 | | | | 1.65 | | | | 10,558 | | | | 6.22 | | | | 30,015 | | | | 11,008 | | | | 1.46 | | | | 7,510 | | | | 6.55 | | | | 18,518 | |
| Impaired (note 5) | | | 676 | | | | 0.76 | | | | 207 | | | | 5.63 | | | | 883 | | | | 552 | | | | 0.62 | | | | 38 | | | | 3.51 | | | | 590 | |
| |
| Gross loans receivable | | $ | 20,133 | | | | | | | $ | 10,765 | | | | | | | $ | 30,898 | | | $ | 11,560 | | | | | | | $ | 7,548 | | | | | | | $ | 19,108 | |
| Non-accrued capitalized interest on: | | | | | | | | | | | | | | | | | | | | | | | | | | | | | | | | | | | | | | | | |
Impaired loans
(note 5) | | | | | | | | | | | | | | | | | | | (340 | ) | | | | | | | | | | | | | | | | | | | (314 | ) |
| Performing loans* | | | | | | | | | | | | | | | | | | | (35 | ) | | | | | | | | | | | | | | | | | | | (37 | ) |
| Deferred loan revenue and other credits | | | | | | | | | | | | | | | | | | | (314 | ) | | | | | | | | | | | | | | | | | | | (238 | ) |
| |
| Loans receivable | | | | | | | | | | | | | | | | | | $ | 30,209 | | | | | | | | | | | | | | | | | | | $ | 18,519 | |
| |
| * | | Represents the unamortized balance that accrued while the loan was impaired. |
At the end of December 2008, the floating rate performing gross loans receivable yield was 4.39% (2007 — 6.48%) with an average term to reset of 76 days (2007 — 88 days).
The breakdown of our performing gross loans receivable between sovereign and commercial is as follows:
| | | | | | | | | | | | | | | | | | | | | | | | | | | | | | | | | | | | | | | | | |
| | | | | | |
| (in millions of | | | | | | |
| Canadian dollars) | | 2008 | | | 2007 | |
| | | | | | | | | | | | | | | Yield to | | | | | | | | | | | | | | | | | | | Yield to | | | | |
| | | Floating | | | Spread | | | Fixed | | | maturity | | | Total | | | Floating | | | Spread | | | Fixed | | | maturity | | | Total | |
| | | $ | | | % | | | $ | | | % | | | $ | | | $ | | | % | | | $ | | | % | | | $ | |
| |
| Commercial | | | 18,809 | | | | 1.68 | | | | 9,320 | | | | 6.04 | | | | 28,129 | | | | 10,393 | | | | 1.48 | | | | 6,360 | | | | 6.33 | | | | 16,753 | |
| Sovereign | | | 648 | | | | 0.97 | | | | 1,238 | | | | 8.02 | | | | 1,886 | | | | 615 | | | | 1.10 | | | | 1,150 | | | | 7.98 | | | | 1,765 | |
| |
| Total performing gross loans receivable | | $ | 19,457 | | | | 1.65 | | | $ | 10,558 | | | | 6.22 | | | $ | 30,015 | | | $ | 11,008 | | | | 1.46 | | | $ | 7,510 | | | | 6.55 | | | $ | 18,518 | |
| |
86 | Managing Risk. Maximizing Opportunities.
Consolidated Financial Statements
We have country risk concentrations as outlined below.
| | | | | | | | | | | | | | | | | | | |
| | | | | | |
| (in millions of Canadian dollars) | | 2008 | | 2007 | |
| | | Performing gross | | | | | | | | | Performing gross | | | | |
| Country | | loans receivable | | | % | | | Country | | loans receivable | | | % | |
| |
| United States | | | 13,693 | | | | 46 | | | United States | | | 8,745 | | | | 47 | |
| Canada | | | 2,407 | | | | 8 | | | Canada | | | 1,263 | | | | 7 | |
| Mexico | | | 2,103 | | | | 7 | | | Mexico | | | 1,218 | | | | 7 | |
| India | | | 1,369 | | | | 4 | | | United Kingdom | | | 974 | | | | 5 | |
| Brazil | | | 1,123 | | | | 4 | | | China | | | 859 | | | | 5 | |
| Other | | | 9,320 | | | | 31 | | | Other | | | 5,459 | | | | 29 | |
| |
| Total | | $ | 30,015 | | | | 100 | | | Total | | $ | 18,518 | | | | 100 | |
| |
We have single counterparty performing gross loans receivable totaling $4,709 million with three airlines (2007 — $1,900 million with one airline), $2,487 million (2007 — $2,087 million) with three surface transportation entities, $807 million (2007 — $524 million) with an oil and gas entity and $918 million (2007 — $741 million) with a telecom and media entity. Seven of these counterparties are located in the United States and one in Brazil.
We sold $11 million in loans to various counterparties in 2008 (2007 — $46 million). This amount included one performing loan totaling $0.4 million (2007 — $44 million). The performing loans were sold without recourse and the sales were done for an amount approximate to the loans’ carrying value resulting in no material gain or loss.
The breakdown of our gross loans receivable by credit grade is as follows:
| | | | | | | | | | | | | | | | | |
| | | | | | |
| (in millions of Canadian dollars) | | 2008 | | | 2007 | |
| | | $ | | | % of total | | | $ | | | % of total | |
| |
| Investment grade | | | 13,758 | | | | 44 | | | | 8,085 | | | | 42 | |
| Below investment grade | | | 16,257 | | | | 53 | | | | 10,433 | | | | 55 | |
| Impaired | | | 883 | | | | 3 | | | | 590 | | | | 3 | |
| |
| Total gross loans receivable | | $ | 30,898 | | | | 100 | | | $ | 19,108 | | | | 100 | |
| |
A loan payment is considered past due when the obligor has failed to make the payment by the contractual due date. The breakdown of our gross loans receivable that are past due but not impaired is as follows:
| | | | | | | | | | | | | | | | | | | | | | | | | | | | | | | | | |
| | | | | | |
| (in millions of Canadian dollars) | | 2008 | | | 2007 | |
| | | Less than | | | 30 to | | | Greater than | | | | | | | Less than | | | 30 to | | | Greater than | | | | |
| | | 30 days | | | 180 days | | | 180 days | | | Total | | | 30 days | | | 180 days | | | 180 days | | | Total | |
| |
| Commercial | | | 34 | | | | 1 | | | | 2 | | | | 37 | | | | 11 | | | | 2 | | | | — | | | | 13 | |
| Sovereign | | | 1 | | | | — | | | | 1 | | | | 2 | | | | — | | | | 1 | | | | — | | | | 1 | |
| |
| Total past due but not impaired | | $ | 35 | | | $ | 1 | | | $ | 3 | | | $ | 39 | | | $ | 11 | | | $ | 3 | | | $ | — | | | $ | 14 | |
| |
Where feasible, we seek to restructure loans which are in default. This may involve renegotiation of the terms of the loan which could include extending payment terms and amending interest rates. Once the new terms have been negotiated and all conditions have been met, the loan is no longer considered to be in default. We continually review these loans to ensure all conditions are being met. These loans continue to be subject to an individual or collective impairment assessment.
Loans renegotiated during 2008 which would otherwise be impaired or past due, totaled $1 million (2007 — $153 million).
Non-accrued capitalized interest is a contractually determined amount typically representing rescheduled interest that would have been recognized on loans to borrowers if those loans were performing.
EDC Annual Report 2008 | 87
Consolidated Financial Statements
The following reflects the movement of non-accrued capitalized interest during the year:
| | | | | | | | | |
| | | | | | |
| (in millions of Canadian dollars) | | 2008 | | | 2007 | |
| |
| Balance at beginning of year | | | 351 | | | | 492 | |
| Impaired interest and fees received | | | 24 | | | | 85 | |
| Capitalized during the year | | | 5 | | | | 4 | |
| Revaluation of sovereign impaired loans | | | (38 | ) | | | (16 | ) |
| Impaired interest and fees recognized | | | (19 | ) | | | (83 | ) |
| Amortization | | | (7 | ) | | | (74 | ) |
| Write-off | | | (4 | ) | | | (2 | ) |
| Foreign exchange translation | | | 63 | | | | (54 | ) |
| Debt relief | | | — | | | | (1 | ) |
| |
| Balance at end of year | | $ | 375 | | | $ | 351 | |
| |
5. Impaired Loans Receivable
The following table shows the amount of impaired gross loans receivable, net of non-accrued capitalized interest and the specific allowance, which represents impaired net loans receivable.
| | | | | | | | | |
| | | | | | |
| (in millions of Canadian dollars) | | 2008 | | | 2007 | |
| |
| Impaired gross loans receivable | | | | | | | | |
| Sovereign | | | 528 | | | | 479 | |
| Commercial | | | 355 | | | | 111 | |
| |
| | | | 883 | | | | 590 | |
| Less: Non-accrued capitalized interest | | | 340 | | | | 314 | |
| Specific allowance | | | 152 | | | | 101 | |
| |
| Impaired net loans receivable | | $ | 391 | | | $ | 175 | |
| |
The following reflects the movement in impaired gross loans receivable during the year:
| | | | | | | | | |
| | | | | | |
| (in millions of Canadian dollars) | | 2008 | | | 2007 | |
| |
| Balance at beginning of year | | | 590 | | | | 1,614 | |
| Loans classified as impaired | | | 219 | | | | 38 | |
| Additional disbursements | | | 10 | | | | — | |
| Capitalized interest | | | 5 | | | | 1 | |
| Principal repayments | | | (58 | ) | | | (116 | ) |
| Principal recoveries from loan sales | | | (11 | ) | | | (2 | ) |
| Loans written off | | | (5 | ) | | | (21 | ) |
| Loans reinstated to performing | | | (1 | ) | | | (182 | ) |
| Foreign exchange translation | | | 134 | | | | (98 | ) |
| Foreclosed loans | | | — | | | | (339 | ) |
| Proceeds from foreclosure auction | | | — | | | | (304 | ) |
| Receipts from the Government of Canada for sovereign debt relief | | | — | | | | (1 | ) |
| |
| Balance at end of year | | $ | 883 | | | $ | 590 | |
| |
During the year, impaired loans to 11 commercial borrowers totaling $5 million (2007 — $21 million) were written off. These loans were written off after all collection methods had been exhausted and no further prospect of recovery was likely. For the five years ended December 2008, cumulative write-offs of impaired loans totaled $152 million, of which 21% occurred in the past three years.
During 2008, payments of principal and interest from borrowers, as well as proceeds from sales of impaired loans were $92 million (2007 — $434 million, including proceeds from a foreclosure auction). These amounts were applied against the carrying value of the impaired loans and did not affect interest income.
We employ a range of policies to mitigate credit risk on our commercial loans which includes obtaining certain forms of security interest. The principal types of security interest are mortgages on equipment (mainly aircraft and rolling stock) and real estate, assignments or pledges on various business assets such as equity shares, trade receivables and bank accounts. Other principal forms of credit enhancement include guarantees from counterparties with higher credit ratings who may be related to the borrower, such as a parent company.
In connection with our impaired loans we currently hold collateral consisting entirely of aircraft, valued at $223 million.
88 | Managing Risk. Maximizing Opportunities.
Consolidated Financial Statements
6. Allowance for Losses on Loans, Loan Commitments and Guarantees
The composition of the allowance for losses on loans, loan commitments and guarantees is as follows:
| | | | | | | | | |
| (in millions of Canadian dollars) | | 2008 | | | 2007 | |
| |
| Base allowance | | | | | | | | |
| Investment grade exposure | | | 153 | | | | 121 | |
| Non-investment grade exposure | | | 1,707 | | | | 1,450 | |
| |
| Total base allowance | | | 1,860 | | | | 1,571 | |
| |
| Counterparty concentration | | | | | | | | |
| Investment grade exposure | | | 11 | | | | 7 | |
| Non-investment grade exposure | | | 271 | | | | 137 | |
| |
| Total counterparty concentration | | | 282 | | | | 144 | |
| |
| Market overlays | | | | | | | | |
| Commercial unsecured portfolio | | | 203 | | | | — | |
| Automotive | | | 195 | | | | — | |
| Aerospace | | | — | | | | 40 | |
| Other | | | 22 | | | | 10 | |
| |
| Total market overlays | | | 420 | | | | 50 | |
| |
| |
| Total general allowance | | | 2,562 | | | | 1,765 | |
| Specific allowance for call of indemnity with subsidiary (note 34) | | | 13 | | | | 11 | |
| Specific allowance for impaired loans, loan commitments and guarantees | | | 160 | | | | 104 | |
| |
| Total allowance for losses on loans, loan commitments and guarantees | | $ | 2,735 | | | $ | 1,880 | |
| |
The review of the methodology used in calculating the allowance for losses on loans, loan commitments and guarantees, as discussed in note 2, resulted in a revised methodology for the calculation of the general allowance.
The following table provides a breakdown of our allowance for losses on loans, loan commitments and guarantees by commercial and sovereign risk:
| | | | | | | | | | | | | | | | | | | | | | | | | |
| | | | | | |
| (in millions of Canadian dollars) | | 2008 | | | 2007 | |
| | | General | | | Specific | | | Total | | | General | | | Specific | | | Total | |
| |
| Commercial | | | 2,461 | | | | 138 | | | | 2,599 | | | | 1,655 | | | | 86 | | | | 1,741 | |
| Sovereign | | | 101 | | | | 35 | | | | 136 | | | | 110 | | | | 29 | | | | 139 | |
| |
| Total allowance | | $ | 2,562 | | | $ | 173 | | | $ | 2,735 | | | $ | 1,765 | | | $ | 115 | | | $ | 1,880 | |
| |
The allowance for losses on loans, loan commitments and guarantees is as follows:
| | | | | | | | | |
| | | | | | |
| (in millions of Canadian dollars) | | 2008 | | | 2007 | |
| |
| Allowance for losses on loans | | | 1,928 | | | | 1,316 | |
| Allowance for losses on loan commitments | | | 532 | | | | 429 | |
| Allowance for losses on loan guarantees | | | 275 | | | | 135 | |
| |
| Total | | $ | 2,735 | | | $ | 1,880 | |
| |
The allowance for losses on loans is shown as a reduction to loans receivable on the balance sheet and the allowance for losses on loan commitments and guarantees is reported as a liability.
EDC Annual Report 2008 | 89
Consolidated Financial Statements
During the year, changes to the allowance for losses on loans, loan commitments and guarantees were as follows:
| | | | | | | | | | | | | | | | | | | �� | | | | | | | | | | |
| | | | | | |
| (in millions of Canadian dollars) | | 2008 | | | 2007 | |
| | | | | | | | | | | | | | | | | | | | | | | Risk mitigation | | | | |
| | | | | | | | | | | | | | | | | | | | | | | insurer’s share of | | | | |
| | | General | | | Specific | | | Total | | | General | | | Specific | | | loan allowance | | | Total | |
| |
| Balance at beginning of year | | | 1,765 | | | | 115 | | | | 1,880 | | | | 1,716 | | | | 352 | | | | (61 | ) | | | 2,007 | |
| Provision for (reversal of) losses on loans, loan commitments and guarantees | | | 340 | | | | 6 | | | | 346 | | | | 335 | | | | (184 | ) | | | 65 | | | | 216 | |
| Write-offs | | | — | | | | (2 | ) | | | (2 | ) | | | — | | | | (19 | ) | | | — | | | | (19 | ) |
| Recovery of amounts written-off in prior years | | | — | | | | 16 | | | | 16 | | | | — | | | | 18 | | | | — | | | | 18 | |
| Equity adjustment | | | — | | | | — | | | | — | | | | (20 | ) | | | (3 | ) | | | — | | | | (23 | ) |
| Foreign exchange translation | | | 457 | | | | 38 | | | | 495 | | | | (266 | ) | | | (49 | ) | | | (4 | ) | | | (319 | ) |
| |
| Total | | $ | 2,562 | | | $ | 173 | | | $ | 2,735 | | | $ | 1,765 | | | $ | 115 | | | $ | — | | | $ | 1,880 | |
| |
The specific provision for 2008 of $6 million (2007 — release of $184 million) is comprised of a charge of $42 million (2007 — $25 million) as a result of new impairments and increases to allowances on existing impaired obligors which was partially offset by reversals of $36 million (2007 — $209 million) due to changes in the estimated future cash flows or recoveries anticipated from existing impaired obligors and the return of impaired obligors to performing status.
The allowance for losses on loans is one of the more significant management estimates within these financial statements. Our determination of the allowance includes various assumptions about the timing and risk of default and the severity of loss in the event of default; and thus is subject to significant measurement uncertainty. Due to the current economic environment this uncertainty is elevated and the actual amounts could differ significantly from our estimates.
At the end of 2008, in consideration of the elevated risk of uncertainty, in particular that current credit ratings may not reflect the impact of recent market events, we reviewed our unsecured portfolio and established market overlays on certain sectors assessed to be most at risk of further credit downgrades and potential default.
Risk Mitigation Insurance
In 2005 we entered into an insurance policy to insure a portion of our aerospace loan portfolio. The policy limit is currently $1.3 billion. The policy provides us with protection in the event of default by an obligor which has the effect of locking in future cash flows on this portion of our aerospace loan portfolio. As part of our allowance methodology we compare the aircraft collateral values to the maximum benefit that could be realized under the policy. If this benefit is greater than the collateral values the allowance impact is calculated and recorded as the risk mitigation insurer’s share of the loan allowance. At December 31, 2008, the impact of this insurance on our allowance was determined to be nil (2007 — nil).
7. Equity Financing Designated as Held-For-Trading
The equity financing portfolio is carried at fair value and is comprised of the following:
| | | | | | | | | | | | | | | | | |
| (in millions of Canadian dollars) | | | | | | 2008 | | | | | | | 2007 | |
| | | Cost | | | Fair value | | | Cost | | | Fair value | |
| |
| Direct investments | | | | | | | | | | | | | | | | |
| Loans and debt securities | | | 21 | | | | 14 | | | | 15 | | | | 15 | |
| Equity interests | | | 37 | | | | 21 | | | | 30 | | | | 26 | |
| |
| | | | 58 | | | | 35 | | | | 45 | | | | 41 | |
| Fund investments | | | 152 | | | | 115 | | | | 61 | | | | 54 | |
| |
| Total equity financing | | $ | 210 | | | $ | 150 | | | $ | 106 | | | $ | 95 | |
| |
There was an unrealized loss of $45 million resulting from the change in fair value of equity financing in 2008 (2007 — no material gain or loss). We also recognized a loss of $4 million on the conversion of preferred shares and debentures into common shares for one of our direct investments.
90 | Managing Risk. Maximizing Opportunities.
Consolidated Financial Statements
8. Capital Leases
The net investment in capital leases includes the following:
| | | | | | | | | |
| (in millions of Canadian dollars) | | 2008 | | | 2007 | |
| |
| Total minimum lease payments receivable: | | | | | | | | |
| 2008 | | | — | | | | 16 | |
| 2009 | | | 20 | | | | 16 | |
| 2010 | | | 20 | | | | 16 | |
| 2011 | | | 20 | | | | 16 | |
| 2012 | | | 20 | | | | 16 | |
| 2013 | | | 20 | | | | 16 | |
| 2014 and beyond | | | 57 | | | | 47 | |
| |
| | | | 157 | | | | 143 | |
| Estimated residual values of leased aircraft | | | 41 | | | | 33 | |
| |
| Gross investment in capital leases | | | 198 | | | | 176 | |
| Unearned income | | | (56 | ) | | | (54 | ) |
| |
| Net investment in capital leases | | $ | 142 | | | $ | 122 | |
| |
Capital lease revenue for the year was $9 million (2007 — $8 million). At the end of December 2008, 13 aircraft were subject to capital leases with one airline (2007 — 13 aircraft with one airline). The remaining lease terms range from seven to nine years.
9. Equipment Available for Lease
Equipment available for lease consists of aircraft that were returned to us because of default under the related obligors’ loan agreements. The aircraft were initially recognized at fair value and are carried net of impairment losses.
| | | | | | | | | |
| (in millions of Canadian dollars) | | 2008 | | | 2007 | |
| |
| Regional aircraft | | | 371 | | | | 395 | |
| Accumulated depreciation | | | 37 | | | | 23 | |
| |
| | | $ | 334 | | | $ | 372 | |
| |
| Number of aircraft | | | 41 | | | | 41 | |
| |
In 2008, due to changing market conditions, a review for impairment was done on all 41 aircraft, and analyses of future cash flows were performed where necessary. As a result, we reduced the carrying value of 14 aircraft by $23 million (2007 — $35 million), to reflect adjustments to fair value.
Operating lease revenue for the year was $43 million (2007 — $37 million). At the end of December 2008, 30 of our 41 aircraft were subject to operating leases with four airlines (2007 — 41 aircraft). The lease terms range from 24 to 36 months.
The following table presents minimum future lease payments receivable:
| | | | | | | | | |
| (in millions of Canadian dollars) | | 2008 | | | 2007 | |
| |
| 2008 | | | — | | | | 40 | |
| 2009 | | | 23 | | | | 24 | |
| 2010 | | | 7 | | | | 10 | |
| 2011 | | | 1 | | | | 5 | |
| 2012 | | | — | | | | 5 | |
| 2013 and beyond | | | — | | | | 3 | |
| |
| Total | | $ | 31 | | | $ | 87 | |
| |
EDC Annual Report 2008 | 91
Consolidated Financial Statements
10. Property, Plant and Equipment
During the year, changes to property, plant and equipment were as follows:
| | | | | | | | | | | | | | | | | | | | | | | | | | | | | | | | | |
| (in millions of | | | | | | |
| Canadian dollars) | | 2008 | | | 2007 | |
| | | Computer | | | Furniture & | | | Leasehold | | | | | | | Computer | | | Furniture & | | | Leasehold | | | | |
| | | hardware | | | equipment | | | improvements | | | Total | | | hardware | | | equipment | | | improvements | | | Total | |
| |
| Cost: | | | | | | | | | | | | | | | | | | | | | | | | | | | | | | | | |
| Balance at beginning of year | | | 56 | | | | 28 | | | | 13 | | | | 97 | | | | 54 | | | | 27 | | | | 12 | | | | 93 | |
| Additions | | | 7 | | | | 2 | | | | 2 | | | | 11 | | | | 2 | | | | 1 | | | | 1 | | | | 4 | |
| |
| Balance at end of year | | | 63 | | | | 30 | | | | 15 | | | | 108 | | | | 56 | | | | 28 | | | | 13 | | | | 97 | |
| |
| Accumulated depreciation: | | | | | | | | | | | | | | | | | | | | | | | | | | | | | | | | |
| Balance at beginning of year | | | (53 | ) | | | (26 | ) | | | (11 | ) | | | (90 | ) | | | (51 | ) | | | (25 | ) | | | (10 | ) | | | (86 | ) |
| Depreciation expense | | | (1 | ) | | | (1 | ) | | | (1 | ) | | | (3 | ) | | | (2 | ) | | | (1 | ) | | | (1 | ) | | | (4 | ) |
| |
| Balance at end of year | | | (54 | ) | | | (27 | ) | | | (12 | ) | | | (93 | ) | | | (53 | ) | | | (26 | ) | | | (11 | ) | | | (90 | ) |
| |
| Carrying amount | | $ | 9 | | | $ | 3 | | | $ | 3 | | | $ | 15 | | | $ | 3 | | | $ | 2 | | | $ | 2 | | | $ | 7 | |
| |
11. Intangible Assets
During the year, changes to intangible assets were as follows:
| | | | | | | | | | | | | | | | | | | | | | | | | |
| | | | | | |
| (in millions of Canadian dollars) | | 2008 | | | 2007 | |
| | | Internally developed | | | Computer | | | | | | | Internally developed | | | Computer | | | | |
| | | software | | | software | | | Total | | | software | | | software | | | Total | |
| |
| Cost: | | | | | | | | | | | | | | | | | | | | | | | | |
| Balance at beginning of year | | | 69 | | | | 39 | | | | 108 | | | | 59 | | | | 34 | | | | 93 | |
| Additions | | | 6 | | | | 10 | | | | 16 | | | | 10 | | | | 5 | | | | 15 | |
| |
| Balance at end of year | | | 75 | | | | 49 | | | | 124 | | | | 69 | | | | 39 | | | | 108 | |
| |
| Accumulated amortization: | | | | | | | | | | | | | | | | | | | | | | | | |
| Balance at beginning of year | | | (48 | ) | | | (28 | ) | | | (76 | ) | | | (40 | ) | | | (25 | ) | | | (65 | ) |
| Amortization expense | | | (8 | ) | | | (4 | ) | | | (12 | ) | | | (8 | ) | | | (3 | ) | | | (11 | ) |
| |
| Balance at end of year | | | (56 | ) | | | (32 | ) | | | (88 | ) | | | (48 | ) | | | (28 | ) | | | (76 | ) |
| |
| Carrying amount | | $ | 19 | | | $ | 17 | | | $ | 36 | | | $ | 21 | | | $ | 11 | | | $ | 32 | |
| |
92 | Managing Risk. Maximizing Opportunities.
Consolidated Financial Statements
12. Debt Instruments
We issue debt instruments in global capital markets. Short-term payables consist of commercial paper and other short-term debt related instruments that we issue with maturities under one year. Long-term payables represent bonds and other long-term instruments which we issue in Canadian dollars, U.S. dollars and other currencies. We use foreign exchange swaps as well as cross currency interest rate swaps to convert Canadian dollar and foreign currency denominated notes primarily to U.S. dollars. Interest rate swaps are principally used to convert fixed rate instruments to floating rates primarily related to LIBOR. We use derivative contracts and structured notes to manage interest rate risk and foreign exchange risk, and also for asset liability management purposes.
Loans Payable
Loans payable (excluding derivatives) are comprised as follows:
| | | | | | | | | | | | | | | | | | | | | | | | | |
| | | | | | |
| (in millions of Canadian dollars) | | 2008 | | | 2007 | |
| | | Held-for- | | | Other financial | | | | | | | Held-for- | | | Other financial | | | | |
| | | trading* | | | liabilities** | | | Total | | | trading* | | | liabilities** | | | Total | |
| |
| Short-term payables | | | 6,646 | | | | — | | | | 6,646 | | | | 2,638 | | | | — | | | | 2,638 | |
| |
| Long-term payables | | | | | | | | | | | | | | | | | | | | | | | | |
| - due within current year | | | 2,563 | | | | — | | | | 2,563 | | | | 1,581 | | | | — | | | | 1,581 | |
| - over one year | | | 15,217 | | | | 1,442 | | | | 16,659 | | | | 10,189 | | | | 1,164 | | | | 11,353 | |
| |
| Total long-term payables | | | 17,780 | | | | 1,442 | | | | 19,222 | | | | 11,770 | | | | 1,164 | | | | 12,934 | |
| |
| Accrued interest | | | — | | | | 14 | | | | 14 | | | | — | | | | 11 | | | | 11 | |
| |
| Total loans payable | | $ | 24,426 | | | $ | 1,456 | | | $ | 25,882 | | | $ | 14,408 | | | $ | 1,175 | | | $ | 15,583 | |
| |
| * | | Accounted for at fair value |
| |
| ** | | Accounted for at amortized cost |
The amount to be paid at maturity on the debt designated as held-for-trading is $23,577 million (2007 — $14,080 million), $849 million less than the December 2008 fair value (2007 — $328 million less than the December 2007 fair value).
Structured Notes
We have entered into a number of structured notes as part of our funding program. Structured notes are hybrid securities that combine debt instruments with derivative components.
Structured notes outstanding, included in loans payable, are as follows:
| | | | | | | | | |
| (in millions of Canadian dollars) | | 2008 | | | 2007 | |
| |
| Callable/extendible | | | 1,234 | | | | 1,789 | |
| Inverse floating rate note | | | 340 | | | | 449 | |
| Dual currency | | | 300 | | | | 180 | |
| Zero coupon | | | 51 | | | | — | |
| Equity index | | | — | | | | 76 | |
| |
| Total | | $ | 1,925 | | | $ | 2,494 | |
| |
We have executed swap contracts to mitigate interest rate risk and foreign exchange risk on these structured borrowings. These contracts ensure that we will receive proceeds from the swap to meet the requirements of settling and servicing the debt obligation. We have in substance created floating rate debt by issuing bonds at fixed rates and entering into swap contracts whereby we receive fixed rate interest and pay interest at a floating rate. In swapping out of the underlying bond issue, the potential interest rate risk has been converted to credit risk. Credit exposure on derivative financial instruments is further discussed in note 13.
EDC Annual Report 2008 | 93
Consolidated Financial Statements
13. Derivative Financial Instruments
We use a variety of derivative financial instruments to manage costs, returns and levels of financial risk associated with our funding, investment and risk management activities.
We currently use, but are not limited to, the following types of instruments:
Interest rate swaps — transactions in which two parties exchange interest flows on a specified notional amount on predetermined dates for a specified period of time using agreed-upon fixed or floating rates of interest. Notional amounts upon which interest payments/receipts are based are not exchanged.
Cross currency interest rate swaps — transactions in which two parties exchange currencies at inception and at maturity, as well as interest flows on the exchanged amounts on predetermined dates for a specified period of time using agreed-upon fixed or floating rates of interest.
Equity index swaps — transactions used to eliminate exposure to movements in an equity index on a debt issue undertaken. Two counterparties agree to exchange payments, one of which represents the percentage change in an agreed-upon equity index and the other a short-term interest rate index. The principal may either resemble an interest rate swap, in that no exchange of notional amounts occurs, or a cross currency interest rate swap, in which currencies will be exchanged at both inception and maturity.
Foreign exchange swaps — commitments to exchange cash flows in different currencies where there are two exchanges, the first is made at the spot rate at inception and the second at a predetermined rate on a specified date in the future.
Foreign exchange forwards — commitments to exchange cash flows in different currencies, for which the foreign exchange rate is predetermined, at a specified date in the future.
Non deliverable forwards — cash-settled, short-term forward contract, where the profit or loss at settlement date is calculated by taking the difference between the agreed upon exchange rate and the spot rate at the time of settlement, for an agreed upon notional amount of funds.
Credit default swaps — transactions between two counterparties that allow credit risks of a third-party reference entity or entities to be traded and managed. The buyer of credit protection pays a periodic fee to the protection seller over a specified term in return for compensation should a credit event (such as default or failure to pay) occur with the reference entity.
In any transaction there is a potential for loss. This loss potential is represented by (1) credit risk, wherein the counterparty fails to perform an obligation as agreed upon, causing the other party to incur a financial loss, and (2) interest rate risk and foreign exchange risk, where an exposure exists as a result of changes in foreign exchange rates or interest rates.
We manage our exposure to interest rate risk and foreign exchange risk using limits developed in consultation with the Department of Finance and approved by our Board of Directors.
Both our internal policies and guidelines (established in the Risk Management Office and approved by our Board of Directors) and those set by the Minister of Finance limit our use of derivatives. We do not use derivatives for speculative purposes. We manage our exposure to derivative counterparty credit risk by contracting only with creditworthy counterparties, and in certain cases entering into collateral agreements with those counterparties. Collateral agreements provide for the posting of collateral by the counterparty when our exposure to that entity exceeds a certain threshold. Collateral is held by a third party and at the end of December 2008 totaled $726 million (2007 — $1,278 million). Where we have a collateral agreement with a counterparty, the counterparty must have a minimum credit rating of A- from an external credit rating agency. Where we do not have a collateral agreement with a counterparty, the counterparty must have a minimum external credit rating of A for transactions of less than three years, and a minimum external credit rating of AA- for transactions of greater than three years. Internal policies and procedures establish credit approvals, controls and monitoring. We do not anticipate any significant non-performance by the counterparties.
In 2008, we reviewed our embedded derivatives and determined they were immaterial and consequently bifurcation was not required.
Notional amounts are not recorded as assets or liabilities on our balance sheet as they represent the face amount of the contract to which a rate or a price is applied to determine the amount of cash flows to be exchanged.
94 | Managing Risk. Maximizing Opportunities.
Consolidated Financial Statements
The remaining term to maturity for our derivative contracts is as follows:
| | | | | | | | | | | | | | | | | | | | | | | | | | | | | | | | | |
| | | | | | |
| (in millions of Canadian dollars) | | 2008 | | | 2007 | |
| | | Remaining term to maturity | | | Remaining term to maturity | |
| | | Under | | | 1 to 3 | | | Over 3 | | | | | | | Under | | | 1 to 3 | | | Over 3 | | | | |
| | | 1 year | | | years | | | years | | | Total | | | 1 year | | | years | | | years | | | Total | |
| |
| Cross currency interest rate swaps | | | 1,122 | | | | 3,815 | | | | 2,680 | | | | 7,617 | | | | 1,147 | | | | 3,157 | | | | 3,776 | | | | 8,080 | |
| Interest rate swaps | | | 5,346 | | | | 7,964 | | | | 1,565 | | | | 14,875 | | | | 543 | | | | 2,183 | | | | 1,454 | | | | 4,180 | |
| Equity index swaps | | | — | | | | — | | | | — | | | | — | | | | 53 | | | | — | | | | — | | | | 53 | |
| Foreign exchange swaps | | | 7,436 | | | | — | | | | — | | | | 7,436 | | | | 5,980 | | | | 305 | | | | — | | | | 6,285 | |
| Foreign exchange forwards | | | 224 | | | | — | | | | — | | | | 224 | | | | 139 | | | | — | | | | — | | | | 139 | |
| Non-deliverable forwards | | | 15 | | | | 152 | | | | — | | | | 167 | | | | — | | | | — | | | | — | | | | — | |
| Credit default swaps – protection sold | | | — | | | | — | | | | (147 | ) | | | (147 | ) | | | — | | | | — | | | | (118 | ) | | | (118 | ) |
| Credit default swaps – protection purchased | | | 24 | | | | — | | | | 147 | | | | 171 | | | | — | | | | 20 | | | | 118 | | | | 138 | |
| |
| Total derivative financial instruments | | $ | 14,167 | | | $ | 11,931 | | | $ | 4,245 | | | $ | 30,343 | | | $ | 7,862 | | | $ | 5,665 | | | $ | 5,230 | | | $ | 18,757 | |
| |
To diversify and reduce credit risk within our loan portfolio, we entered into credit default swap transactions which provide us with protection on six single-name entities to which we have exposure through our loan portfolio. To offset the cost of these transactions, we sold credit default swap protection on a series of collateralized debt obligations which contain a diversified group of corporate names.
The following table provides the fair values for each category of derivative financial instrument.
| | | | | | | | | |
| (in millions of Canadian dollars) | | 2008 | | | 2007 | |
| |
| Cross currency interest rate swaps | | | 903 | | | | 1,762 | |
| Interest rate swaps | | | 368 | | | | 4 | |
| Equity index swaps | | | — | | | | 76 | |
| Foreign exchange swaps | | | (722 | ) | | | 255 | |
| Foreign exchange forwards | | | (11 | ) | | | (10 | ) |
| Credit default swaps — protection sold | | | (119 | ) | | | (11 | ) |
| Credit default swaps — protection purchased | | | 11 | | | | — | |
| |
| Total derivative financial instruments | | $ | 430 | | | $ | 2,076 | |
| |
The change in the fair value of the derivatives recognized in net income in 2008 amounted to a gain of $526 million (2007 — loss of $22 million).
The following table provides the balance sheet disclosure of our derivative financial instruments.
| | | | | | | | | |
| (in millions of Canadian dollars) | | 2008 | | | 2007 | |
| |
| Derivative instruments — asset | | $ | 1,830 | | | $ | 2,242 | |
| Derivative instruments — liability | | $ | 1,400 | | | $ | 166 | |
| |
EDC Annual Report 2008 | 95
Consolidated Financial Statements
14. Debt Instrument Maturities
We often combine debt instruments with derivative financial instruments to generate lower-cost funding. For example, a fixed rate debt issue can be combined with an interest rate swap to generate floating rate funding at a lower cost than issuing a floating rate note. The following table shows our resulting net fixed and floating rate debt positions, as well as the maturities and yields of those net positions. Although we measure our swaps and the majority of debt instruments at their fair value on the financial statements, they are shown below at their notional amounts in order to provide information on cash requirements at maturity of the instruments.
| | | | | | | | | | | | | | | | | | | | | | | | | | | | | | | | | |
| (in millions of | | | | | | |
| Canadian dollars) | | 2008 | | | 2007 | |
| | | Debt | | | Swap | | | | | | | Yield* | | | Debt | | | Swap | | | | | | | Yield* | |
| Year of maturity | | issues | | | contracts | | | Net | | | (%) | | | issues | | | contracts | | | Net | | | (%) | |
| |
Fixed rate issues | | | | | | | | | | | | | | | | | | | | | | | | | | | | | | | | |
| 2008 | | | — | | | | — | | | | — | | | | — | | | | 1,478 | | | | (1,478 | ) | | | — | | | | — | |
| 2009 | | | 2,135 | | | | (2,135 | ) | | | — | | | | — | | | | 991 | | | | (991 | ) | | | — | | | | — | |
| 2010 | | | 4,253 | | | | (4,060 | ) | | | 193 | | | | 8.14 | | | | 4,271 | | | | (4,115 | ) | | | 156 | | | | 8.14 | |
| 2011 | | | 6,293 | | | | (6,293 | ) | | | — | | | | — | | | | 1,368 | | | | (1,368 | ) | | | — | | | | — | |
| 2012 | | | 2,076 | | | | (851 | ) | | | 1,225 | | | | 4.64 | | | | 1,967 | | | | (979 | ) | | | 988 | | | | 4.64 | |
| 2013 | | | 1,235 | | | | (1,235 | ) | | | — | | | | — | | | | 54 | | | | (54 | ) | | | — | | | | — | |
| 2014 to 2018 | | | 1,220 | | | | (1,196 | ) | | | 24 | | | | 8.16 | | | | 1,612 | | | | (1,592 | ) | | | 20 | | | | 8.16 | |
| 2019 and beyond | | | 234 | | | | (234 | ) | | | — | | | | — | | | | 192 | | | | (192 | ) | | | — | | | | — | |
| |
| Subtotal | | | 17,446 | | | | (16,004 | ) | | | 1,442 | | | | 4.78 | | | | 11,933 | | | | (10,769 | ) | | | 1,164 | | | | 4.88 | |
| |
Floating rate issues | | | | | | | | | | | | | | | | | | | | | | | | | | | | | | | | |
| 2008 | | | — | | | | — | | | | — | | | | | | | | 2,681 | | | | 1,301 | | | | 3,982 | | | | | |
| 2009 | | | 7,008 | | | | 2,085 | | | | 9,093 | | | | | | | | 10 | | | | 725 | | | | 735 | | | | | |
| 2010 | | | 70 | | | | 4,147 | | | | 4,217 | | | | | | | | 23 | | | | 3,745 | | | | 3,768 | | | | | |
| 2011 | | | 35 | | | | 6,142 | | | | 6,177 | | | | | | | | 10 | | | | 1,011 | | | | 1,021 | | | | | |
| 2012 | | | — | | | | 777 | | | | 777 | | | | | | | | 14 | | | | 754 | | | | 768 | | | | | |
| 2013 | | | 23 | | | | 1,233 | | | | 1,256 | | | | | | | | 57 | | | | 47 | | | | 104 | | | | | |
| 2014 to 2018 | | | 413 | | | | 1,117 | | | | 1,530 | | | | | | | | 496 | | | | 1,307 | | | | 1,803 | | | | | |
| 2019 and beyond | | | 24 | | | | 190 | | | | 214 | | | | | | | | 20 | | | | 186 | | | | 206 | | | | | |
| |
| Subtotal | | | 7,573 | | | | 15,691 | | | | 23,264 | | | | 2.46 | | | | 3,311 | | | | 9,076 | | | | 12,387 | | | | 4.84 | |
| |
| Total | | $ | 25,019 | | | $ | (313 | ) | | $ | 24,706 | | | | | | | $ | 15,244 | | | $ | (1,693 | ) | | $ | 13,551 | | | | | |
| |
| * | | Refers to yield to maturity for fixed rate issues, and yield to reset for floating rate issues. |
| |
| Credit exposure and other details of derivative financial instruments are included as part of note 13. |
15. Allowance for Claims on Insurance
The allowance for claims on insurance broken down by program is as follows:
| | | | | | | | | | | | | | | | | | | | | | | | | |
| (in millions of Canadian dollars) | | 2008 | | | 2007 | |
| | | Insurance | | | Reinsurance | | | Net allowance | | | Insurance | | | Reinsurance | | | Net allowance | |
| |
| Credit insurance | | | 276 | | | | (13 | ) | | | 263 | | | | 156 | | | | (9 | ) | | | 147 | |
| Contract insurance and bonding and political risk insurance | | | 479 | | | | (144 | ) | | | 335 | | | | 318 | | | | (79 | ) | | | 239 | |
| |
| Total | | $ | 755 | | | $ | (157 | ) | | $ | 598 | | | $ | 474 | | | $ | (88 | ) | | $ | 386 | |
| |
96 | Managing Risk. Maximizing Opportunities.
Consolidated Financial Statements
During the year, the net allowance for claims was impacted by the following factors:
| | | | | | | | | |
| (in millions of Canadian dollars) | | 2008 | | | 2007 | |
| |
| Balance at beginning of year | | | 386 | | | | 379 | |
| Change in portfolio make-up and risk ratings | | | 49 | | | | 76 | |
| Update of actuarial assumptions | | | 97 | | | | (22 | ) |
| Foreign exchange translation | | | 66 | | | | (47 | ) |
| |
| Balance at end of year | | $ | 598 | | | $ | 386 | |
| |
16. Financing Commitments
We have three types of financing commitments.
The first type is undisbursed amounts on signed loan agreements totaling $8,024 million (2007 - $6,096 million). Over the next two years, we estimate that we will disburse 65% of the remaining undisbursed commitments.
The projected disbursements of the signed loan commitments are as follows:
| | | | | | | | | | | | | | | | | |
| (in millions of Canadian dollars) | | 2008 | | | 2007 | |
| | | Projected | | | | | | | Projected | | | | |
| | | disbursements | | | % | | | disbursements | | | % | |
| |
| 2008 | | | — | | | | — | | | | 2,221 | | | | 36 | |
| 2009 | | | 3,839 | | | | 48 | | | | 1,385 | | | | 23 | |
| 2010 | | | 1,371 | | | | 17 | | | | 834 | | | | 14 | |
| 2011 and beyond | | | 2,814 | | | | 35 | | | | 1,656 | | | | 27 | |
| |
| Total | | $ | 8,024 | | | | 100 | | | $ | 6,096 | | | | 100 | |
| |
Undisbursed amounts on signed loan agreements with their committed fixed rates or committed floating rate spreads are outlined in the following table. All yields are computed on a weighted average basis and the spreads over floating interest rates represent the spreads over base rates which consist mainly of LIBOR for U.S. dollars.
| | | | | | | | | | | | | | | | | | | | | | | | | | | | | | | | | |
| | | | | | |
| (in millions of Canadian dollars) | | 2008 | | | 2007 | |
| | | | | | | Estimated | | | | | | | | | | | | | | | Estimated | | | | | | | |
| | | Fixed | | | spot yield | | | Floating | | | Spread | | | Fixed | | | spot yield | | | Floating | | | Spread | |
| | | $ | | | % | | | $ | | | % | | | $ | | | % | | | $ | | | % | |
| |
| Commercial | | | 148 | | | | 5.56 | | | | 7,854 | | | | 1.87 | | | | 574 | | | | 6.69 | | | | 5,472 | | | | 1.42 | |
| Sovereign | | | 16 | | | | 5.47 | | | | 6 | | | | 2.53 | | | | 15 | | | | 7.02 | | | | 35 | | | | 2.17 | |
| |
| Total | | $ | 164 | | | | 5.55 | | | $ | 7,860 | | | | 1.87 | | | $ | 589 | | | | 6.70 | | | $ | 5,507 | | | | 1.43 | |
| |
We also have loan commitments for which terms related to the transaction such as interest rate type and disbursement schedule have not yet been determined. This category of commitments includes letters of offer accepted and outstanding for loans of $2,795 million (2007 — $1,365 million) and guarantees of $149 million (2007 — $250 million) as well as unallocated, confirmed lines of credit of $509 million (2007 — $387 million).
The third type of financing commitments relate to equity investments and total $279 million (2007 — $143 million). Of this amount, commitments to investment funds total $278 million and the remaining $1 million relates to direct investments in Canadian companies. The timing of the disbursements is not readily determinable. Commitments are generally drawn down over a five-year period and draw downs are normally at the discretion of the fund managers.
EDC Annual Report 2008 | 97
Consolidated Financial Statements
17. Contingent Liabilities
Our contingent liabilities include credit, contract insurance and bonding and political risk insurance policies and guarantees which represent direct risks undertaken. We increase our contingent liability by assuming exposure from other insurers. We reduce our contingent liability by ceding reinsurance in both the credit insurance and political risk insurance programs to other insurance companies.
The credit insurance program protects exporters of goods and services trading on credit terms of up to a year against non-payment due to commercial and political risks. Commercial risks covered include buyer insolvency, default, repudiation of goods by buyer and contract cancellation. Political risks that we cover include conversion and risk transfer, cancellation of export or import permits, or war-related risks. The contract insurance and bonding program provides cover for sales on exposure terms usually greater than one year and includes export credit insurance and guarantees, performance guarantees and surety, extending cover for risks inherent in performance related obligations. Political risk insurance provides risk protection for equity and other investments abroad.
At the end of December 2008, we had contingent liabilities of $28,240 million (2007 — $20,576 million) which mature as follows:
| | | | | | | | | | | | | | | | | | | | | | | | | | | | | | | | | | | | | | | | | |
| (in millions of | | | | | | |
| Canadian dollars) | | 2008 | | | 2007 | |
| | | | | | | Contract | | | Political | | | | | | | | | | | | | | | Contract | | | Political | | | | | | | |
| | | Credit | | | insurance | | | risk | | | | | | | | | | | Credit | | | insurance | | | risk | | | | | | | |
| | | insurance | | | and bonding | | | insurance | | | Guarantees | | | Total | | | insurance | | | and bonding | | | insurance | | | Guarantees | | | Total | |
| |
| 2008 | | | — | | | | — | | | | — | | | | — | | | | — | | | | 7,447 | | | | 1,229 | | | | 13 | | | | 2,495 | | | | 11,184 | |
| 2009 | | | 11,757 | | | | 2,120 | | | | 46 | | | | 2,352 | | | | 16,275 | | | | — | | | | 1,072 | | | | 110 | | | | 2,163 | | | | 3,345 | |
| 2010 | | | — | | | | 1,185 | | | | 218 | | | | 4,502 | | | | 5,905 | | | | — | | | | 633 | | | | 112 | | | | 1,386 | | | | 2,131 | |
| 2011 | | | — | | | | 1,126 | | | | 120 | | | | 678 | | | | 1,924 | | | | — | | | | 650 | | | | 73 | | | | 379 | | | | 1,102 | |
| 2012 | | | — | | | | 343 | | | | 89 | | | | 602 | | | | 1,034 | | | | — | | | | 80 | | | | 87 | | | | 429 | | | | 596 | |
| 2013 | | | — | | | | 415 | | | | 47 | | | | 311 | | | | 773 | | | | — | | | | 411 | | | | 33 | | | | 63 | | | | 507 | |
| 2014 – 2018 | | | — | | | | 13 | | | | 807 | | | | 429 | | | | 1,249 | | | | — | | | | 10 | | | | 731 | | | | 266 | | | | 1,007 | |
| 2019 and beyond | | | — | | | | 196 | | | | 227 | | | | 657 | | | | 1,080 | | | | — | | | | 158 | | | | 127 | | | | 419 | | | | 704 | |
| |
| Total | | $ | 11,757 | | | $ | 5,398 | | | $ | 1,554 | | | $ | 9,531 | | | $ | 28,240 | | | $ | 7,447 | | | $ | 4,243 | | | $ | 1,286 | | | $ | 7,600 | | | $ | 20,576 | |
| |
Insurance Policies
The major concentrations by location of risk are as follows:
Credit Insurance
| | | | | | | | | | | | | | | | | | | | | | | | | | | |
| (in millions of | | | | | | |
| Canadian dollars) | | 2008 | | | 2007 | |
| | | Credit | | | Reinsurance | | | Net credit | | | | | Credit | | | Reinsurance | | | Net credit | |
| | | insurance | | | ceded | | | insurance | | | | | insurance | | | ceded | | | insurance | |
| |
| United States | | | 4,093 | | | | (93 | ) | | | 4,000 | | | United States | | | 3,000 | | | | (24 | ) | | | 2,976 | |
| Brazil | | | 812 | | | | (41 | ) | | | 771 | | | Russia | | | 449 | | | | — | | | | 449 | |
| China | | | 697 | | | | — | | | | 697 | | | Turkey | | | 432 | | | | — | | | | 432 | |
| Turkey | | | 588 | | | | — | | | | 588 | | | Brazil | | | 340 | | | | — | | | | 340 | |
| South Korea | | | 582 | | | | — | | | | 582 | | | China | | | 289 | | | | — | | | | 289 | |
| Other | | | 5,366 | | | | (247 | ) | | | 5,119 | | | Other | | | 3,048 | | | | (87 | ) | | | 2,961 | |
| |
| Total | | $ | 12,138 | | | $ | (381 | ) | | $ | 11,757 | | | Total | | $ | 7,558 | | | $ | (111 | ) | | $ | 7,447 | |
| |
Contract Insurance and Bonding
| | | | | | | | | | | | | | | | | | | | | | | | | | | |
| (in millions of | | | | | | | | | | | | | | | | | | | | | | | | |
| Canadian dollars) | | | | | | | | | | 2008 | | | | | | | | | | | | | 2007 | |
| | | Contract | | | | | | | Net contract | | | | | Contract | | | | | | | Net contract | |
| | | insurance | | | Reinsurance | | | insurance | | | | | insurance | | | Reinsurance | | | insurance | |
| | | and bonding | | | assumed | | | and bonding | | | | | and bonding | | | assumed | | | and bonding | |
| |
| Canada | | | 249 | | | | 3,854 | | | | 4,103 | | | Canada | | | 137 | | | | 3,032 | | | | 3,169 | |
| United States | | | 154 | | | | 707 | | | | 861 | | | United States | | | 104 | | | | 570 | | | | 674 | |
| China | | | 51 | | | | — | | | | 51 | | | Mexico | | | 47 | | | | 1 | | | | 48 | |
| Mexico | | | 48 | | | | 1 | | | | 49 | | | Russia | | | 40 | | | | 4 | | | | 44 | |
| Venezuela | | | 38 | | | | — | | | | 38 | | | China | | | 35 | | | | — | | | | 35 | |
| Other | | | 286 | | | | 10 | | | | 296 | | | Other | | | 258 | | | | 15 | | | | 273 | |
| |
| Total | | $ | 826 | | | $ | 4,572 | | | $ | 5,398 | | | Total | | $ | 621 | | | $ | 3,622 | | | $ | 4,243 | |
| |
98 | Managing Risk. Maximizing Opportunities.
Consolidated Financial Statements
Political Risk Insurance
| | | | | | | | | | | | | | | | | | | | | | | | | | | | | | | | | | | |
| (in millions of | | | | | | |
| Canadian dollars) | | 2008 | | | 2007 | |
| | | | | | | | | | | | | | | Net | | | | | | | | | | | | | | | | | Net | |
| | | Political | | | | | | | | | | | Political | | | | | Political | | | | | | | | | | | Political | |
| | | risk | | | Reinsurance | | | Reinsurance | | | risk | | | | | risk | | | Reinsurance | | | Reinsurance | | | risk | |
| | | insurance | | | assumed | | | ceded | | | insurance | | | | | insurance | | | assumed | | | ceded | | | insurance | |
| |
| Libya | | | 300 | | | | — | | | | — | | | | 300 | | | Libya | | | 300 | | | | — | | | | — | | | | 300 | |
| Peru | | | 393 | | | | — | | | | (100 | ) | | | 293 | | | Dominican Republic | | | 133 | | | | 23 | | | | (42 | ) | | | 114 | |
| Papua New Guinea | | | 245 | | | | — | | | | (122 | ) | | | 123 | | | Colombia | | | 178 | | | | — | | | | (76 | ) | | | 102 | |
| Colombia | | | 231 | | | | — | | | | (116 | ) | | | 115 | | | Venezuela | | | 130 | | | | — | | | | (47 | ) | | | 83 | |
| Dominican Republic | | | 101 | | | | 27 | | | | (28 | ) | | | 100 | | | South Africa | | | 96 | | | | — | | | | (48 | ) | | | 48 | |
| Other | | | 1,180 | | | | 58 | | | | (615 | ) | | | 623 | | | Other | | | 1,313 | | | | 45 | | | | (719 | ) | | | 639 | |
| |
| Total | | $ | 2,450 | | | $ | 85 | | | $ | (981 | ) | | $ | 1,554 | | | Total | | $ | 2,150 | | | $ | 68 | | | $ | (932 | ) | | $ | 1,286 | |
| |
Guarantees
We issue performance security guarantees which provide coverage to the exporter’s bank for up to 100% of the guarantee value in the event of any call by the buyer. Financial security guarantees are issued to provide coverage to the exporter’s bank for up to 100% of the guarantee value in the event of any call by the supplier and any foreign bank. Foreign exchange guarantees are also issued which provide a guarantee to secure the closing risks associated with foreign exchange forward contracts. Each guarantee issued stipulates a recovery provision whereby the third party, the exporter, agrees to indemnify us should a payment be made under the guarantee. Unless otherwise stated, the indemnification agreement generally ranks as an unsecured liability of the exporter.
We issue loan guarantees to cover non-payment of principal, interest and fees due to banks and financial institutions providing loans to buyers of Canadian goods and services. Calls on guarantees result in our recognition of a loan asset on the balance sheet and become a direct obligation of the buyer. At the end of December 2008, loan guarantees on secured loans totaled $85 million (2007 — $300 million) and guarantees with impaired obligors totaled $25 million (2007 — $5 million).
At the end of December 2008, we have guarantees outstanding of $9,531 million (2007 — $7,600 million).
| | | | | | | | | |
| (in millions of Canadian dollars) | | 2008 | | | 2007 | |
| |
| Performance security guarantees | | | 5,089 | | | | 4,467 | |
| Loan guarantees | | | 4,065 | | | | 2,967 | |
| Financial security guarantees | | | 265 | | | | 137 | |
| Foreign exchange guarantees | | | 110 | | | | 27 | |
| Specific transaction guarantees* | | | 2 | | | | 2 | |
| |
| Total | | $ | 9,531 | | | $ | 7,600 | |
| |
| | |
| * | | We no longer issue specific transaction guarantees. |
The major concentrations for guarantees by location of risk are as follows:
| | | | | | | | | | | |
| (in millions of Canadian dollars) | | 2008 | | | | | 2007 | |
| |
| United States | | | 5,274 | | | United States | | | 3,788 | |
| Canada | | | 1,097 | | | Algeria | | | 976 | |
| Algeria | | | 613 | | | Canada | | | 861 | |
| Mexico | | | 214 | | | China | | | 162 | |
| Uruguay | | | 182 | | | Saudi Arabia | | | 149 | |
| Other | | | 2,151 | | | Other | | | 1,664 | |
| |
| Total | | $ | 9,531 | | | Total | | $ | 7,600 | |
| |
We are involved in various legal proceedings in the ordinary course of business. Management does not expect the outcome of any of these proceedings to have a material effect on our consolidated financial position or our results of operations.
EDC Annual Report 2008 | 99
Consolidated Financial Statements
18. Reinsurance Agreements
We cede reinsurance to limit exposure to large losses. Reinsurance contracts do not relieve us of our obligations to the insured. However, they do provide for the recovery of claims arising from the liabilities ceded. We have a reinsurance treaty agreement for the credit insurance portfolio, as well as some facultative cover arrangements. Within the contract insurance and bonding and political risk insurance programs there are no reinsurance treaties, however, reinsurance is acquired on a transaction by transaction basis. Management has assessed the creditworthiness of the reinsurers and has determined that no additional allowance is required by EDC for this ceded exposure.
We have assumed export risks for a number of Canadian exporters under facultative arrangements with private credit insurers. For the surety bond insurance line of business, within the contract insurance and bonding program, we have general reinsurance agreements with several surety companies. In addition, we have assumed reinsurance positions under our contract frustration line of business.
The effect of reinsurance on our contingent liability is disclosed in note 17 and the impact on premiums is as follows:
| | | | | | | | | | | | | | | | | | | | | | | | | | | | | | | | | |
| (in millions of Canadian dollars) | | 2008 | | | 2007 | |
| | | | | | | Reinsurance | | | Reinsurance | | | | | | | | | | | Reinsurance | | | Reinsurance | | | | |
| | | Direct | | | premium | | | premium | | | Total | | | Direct | | | premium | | | premium | | | Total | |
| | | premium | | | assumed | | | ceded | | | premium | | | premium | | | assumed | | | ceded | | | premium | |
| |
| Credit insurance | | | 120 | | | | — | | | | (3 | ) | | | 117 | | | | 102 | | | | — | | | | (4 | ) | | | 98 | |
| Contract insurance and bonding | | | 28 | | | | 15 | | | | — | | | | 43 | | | | 25 | | | | 14 | | | | — | | | | 39 | |
| Political risk insurance | | | 18 | | | | 1 | | | | (7 | ) | | | 12 | | | | 24 | | | | — | | | | (12 | ) | | | 12 | |
| |
| Total | | $ | 166 | | | $ | 16 | | | $ | (10 | ) | | $ | 172 | | | $ | 151 | | | $ | 14 | | | $ | (16 | ) | | $ | 149 | |
| |
19. Shareholder’s Equity
EDC’s authorized share capital is $1.5 billion consisting of 15 million shares with a par value of $100 each. The number of shares issued and fully paid is 9.8 million (2007 — 9.8 million). No shares were issued in 2008 (2007 — nil). In March 2008, a dividend of $250 million was paid to the Government of Canada (2007 — $350 million).
In late 2008, the Minister of Finance announced that EDC would receive a $350 million injection of new capital in exchange for 3.5 million shares with a par value of $100 each. The additional capital will increase EDC’s credit capacity during this period of global economic uncertainty. The $350 million was received from the Government of Canada in January 2009, bringing the total number of shares issued and fully paid to 13.3 million.
20. Capital Management
EDC has a capital management process in place to ensure that we are appropriately capitalized and that our capital position is identified, measured, managed and regularly reported to the Board of Directors.
Our primary objective with respect to capital management is to ensure that EDC has adequate capital to support the evolving needs of Canadian exporters and investors while remaining financially self-sustaining.
We manage our capital through a Board approved capital adequacy policy. Under our capital adequacy policy we determine whether we have adequate capital by comparing the supply of capital to the demand for capital. Demand for capital is calculated by a model which estimates the capital required to cover the extreme value of potential losses (including both expected and unexpected losses) arising from credit, interest rate, foreign exchange, operational and business risk. Additional capital, beyond that required to support these core risks, is designated as strategic risk capital and is made available for strategic initiatives and possible volatility in core risk capital. The supply of capital is determined by our financial statements and consists of paid-in share capital, retained earnings, accumulated other comprehensive income and allowances.
A key principle in our capital management is the establishment of a target solvency standard or credit rating which determines the level of demand for capital that is required to cover EDC’s exposures in exceptional circumstances. We target a level of capitalization sufficient to cover potential losses consistent with a rating standard of AA.
The following table represents the breakdown of EDC’s supply of capital at December 31.
| | | | | | | | | |
| (in millions of Canadian dollars) | | 2008 | | | 2007 | |
| |
| Allowance for losses on loans | | | 1,928 | | | | 1,316 | |
| Allowance for losses on loan commitments and guarantees | | | 807 | | | | 564 | |
| Allowance for claims on insurance | | | 755 | | | | 474 | |
| Reinsurers’ share of allowance for claims | | | (157 | ) | | | (88 | ) |
| Share capital | | | 983 | | | | 983 | |
| Retained earnings | | | 5,077 | | | | 5,121 | |
| Accumulated other comprehensive income | | | 56 | | | | (80 | ) |
| |
| Supply of capital | | $ | 9,449 | | | $ | 8,290 | |
| |
100 | Managing Risk. Maximizing Opportunities.
Consolidated Financial Statements
21. Interest Rate Risk
The following table summarizes our interest rate risk based on the gap between the notional amount of assets and liabilities grouped by the earlier of contractual re-pricing or maturity dates. Notional amounts reflect our true exposure to re-pricing at various maturities. The differences between the notional amounts and the carrying values, the positions not subject to re-pricing risk, and shareholder’s equity are presented in the non-interest rate sensitive column to ensure comparability with the balance sheet. The effective interest rates shown indicate historical rates for fixed rate and floating rate instruments.
| | | | | | | | | | | | | | | | | | | | | | | | | | | | | |
| | | Immediately | | | Up to | | | Over 6 to | | | Over 1 to | | | Over | | | Non-interest | | | 2008 | |
| (in millions of Canadian dollars) | | rate-sensitive | | | 6 months | | | 12 months | | | 5 years | | | 5 years | | | rate sensitive(2) | | | Total | |
| |
Assets | | | | | | | | | | | | | | | | | | | | | | | | | | | | |
| Cash and marketable securities | | | 189 | | | | 2,800 | | | | 16 | | | | 515 | | | | 261 | | | | 62 | | | | 3,843 | |
| Gross loans receivable | | | 163 | | | | 19,845 | | | | 462 | | | | 4,200 | | | | 5,345 | | | | 883 | | | | 30,898 | |
Effective interest rate % | | | 6.45 | | | | 4.40 | | | | 6.24 | | | | 6.35 | | | | 6.26 | | | | | | | | | |
| | | | | | | | | | | | | | | | | | | | | | | | | | | | | |
| Less: | | | | | | | | | | | | | | | | | | | | | | | | | | | | |
| Deferred revenue and non-accrued capitalized interest | | | | | | | | | | | | | | | | | | | | | | | (689 | ) | | | (689 | ) |
| Net allowance for losses on loans | | | | | | | | | | | | | | | | | | | | | | | (1,928 | ) | | | (1,928 | ) |
| | | | | | | | | | | | | | | | | | | | | | | | | | | | | |
| Capital leases | | | — | | | | 5 | | | | 5 | | | | 47 | | | | 85 | | | | — | | | | 142 | |
Effective interest rate % | | | — | | | | 7.31 | | | | 7.31 | | | | 7.31 | | | | 7.32 | | | | | | | | | |
| |
| Equity financing | | | | | | | | | | | | | | | | | | | | | | | 150 | | | | 150 | |
| Equipment available for lease, other assets and accrued interest | | | | | | | | | | | | | | | | | | | | | | | 2,840 | | | | 2,840 | |
| |
Total assets | | $ | 352 | | | $ | 22,650 | | | $ | 483 | | | $ | 4,762 | | | $ | 5,691 | | | $ | 1,318 | | | $ | 35,256 | |
| |
| | | | | | | | | | | | | | | | | | | | | | | | | | | | | |
Liabilities and shareholder’s equity | | | | | | | | | | | | | | | | | | | | | | | | | | | | |
| Loans payable | | | | | | | 8,560 | | | | 1,569 | | | | 13,754 | | | | 1,136 | | | | 863 | | | | 25,882 | |
Effective interest rate % | | | | | | | 3.36 | | | | 2.53 | | | | 4.20 | | | | 4.66 | | | | | | | | | |
| | | | | | | | | | | | | | | | | | | | | | | | | | | | | |
| Total pay side instruments on swap contracts | | | | | | | 24,378 | | | | — | | | | 559 | | | | — | | | | 5,765 | | | | 30,702 | |
Effective interest rate % | | | | | | | 2.50 | | | | — | | | | 4.85 | | | | — | | | | | | | | | |
| | | | | | | | | | | | | | | | | | | | | | | | | | | | | |
| Total receive side instruments on swap contracts | | | | | | | (10,158 | ) | | | (1,559 | ) | | | (12,437 | ) | | | (1,111 | ) | | | (5,054 | ) | | | (30,319 | ) |
Effective interest rate % | | | | | | | 2.67 | | | | 2.05 | | | | 4.13 | | | | 4.57 | | | | | | | | | |
| | | | | | | | | | | | | | | | | | | | | | | | | | | | | |
Cumulative foreign exchange translation on cross currency interest rate swaps(1) | | | | | | | | | | | | | | | | | | | | | | | (383 | ) | | | (383 | ) |
| | | | | | | | | | | | | | | | | | | | | | | | | | | | | |
| | | | | | | | | | | | | | | | | | | | | | | | | | | | | |
| Total loans payable | | | | | | | | | | | | | | | | | | | | | | | | | | | 25,882 | |
| | | | | | | | | | | | | | | | | | | | | | | | | | | | | |
| | | | | | | | | | | | | | | | | | | | | | | | | | | | | |
| Other liabilities and deferred revenue | | | | | | | | | | | | | | | | | | | | | | | 3,258 | | | | 3,258 | |
| | | | | | | | | | | | | | | | | | | | | | | | | | | | | |
Shareholder’s equity | | | | | | | | | | | | | | | | | | | | | | | 6,116 | | | | 6,116 | |
| |
Total liabilities and shareholder’s equity | | | | | | $ | 22,780 | | | $ | 10 | | | $ | 1,876 | | | $ | 25 | | | $ | 10,565 | | | $ | 35,256 | |
| |
| | | | | | | | | | | | | | | | | | | | | | | | | | | | | |
At December 31, 2008 | | | | | | | | | | | | | | | | | | | | | | | | | | | | |
| | | | | | | | | | | | | | | | | | | | | | | | | | | | | |
| Total gap | | | 352 | | | | (130 | ) | | | 473 | | | | 2,886 | | | | 5,666 | | | | (9,247 | ) | | | — | |
| Cumulative gap | | | 352 | | | | 222 | | | | 695 | | | | 3,581 | | | | 9,247 | | | | — | | | | — | |
| |
| Canadian dollar | | | 36 | | | | 814 | | | | 22 | | | | 79 | | | | 88 | | | | (10,262 | ) | | | (9,223 | ) |
| Foreign currency | | | 316 | | | | (944 | ) | | | 451 | | | | 2,807 | | | | 5,578 | | | | 1,015 | | | | 9,223 | |
| |
| Total gap | | | 352 | | | | (130 | ) | | | 473 | | | | 2,886 | | | | 5,666 | | | | (9,247 | ) | | | — | |
| |
| | |
| (1) | | Due to foreign exchange translation, the pay and receive side instruments may not net to zero. This amount represents the difference caused by foreign exchange translation on the pay and receive side instruments on swap contracts. |
| |
| (2) | | Included in non-interest rate sensitive amounts are the differences between the carrying amounts and the notional amounts, foreign exchange contracts and foreign exchange forwards not sensitive to interest rates. |
EDC Annual Report 2008 | 101
Consolidated Financial Statements
| | | | | | | | | | | | | | | | | | | | | | | | | | | | | |
| | | Immediately | | | Up to | | | Over 6 to | | | Over 1 to | | | Over | | | Non-interest | | | 2007 | |
| (in millions of Canadian dollars) | | rate-sensitive | | | 6 months | | | 12 months | | | 5 years | | | 5 years | | | rate sensitive(2) | | | Total | |
| |
Assets | | | | | | | | | | | | | | | | | | | | | | | | | | | | |
| Cash and marketable securities | | | 174 | | | | 1,263 | | | | 5 | | | | 689 | | | | 350 | | | | 47 | | | | 2,528 | |
| Gross loans receivable | | | 44 | | | | 11,385 | | | | 358 | | | | 3,037 | | | | 3,694 | | | | 590 | | | | 19,108 | |
Effective interest rate % | | | 9.12 | | | | 6.46 | | | | 6.33 | | | | 6.50 | | | | 6.55 | | | | | | | | | |
| | | | | | | | | | | | | | | | | | | | | | | | | | | | | |
| Less: | | | | | | | | | | | | | | | | | | | | | | | | | | | | |
| Deferred revenue and non-accrued capitalized interest | | | | | | | | | | | | | | | | | | | | | | | (589 | ) | | | (589 | ) |
| Net allowance for losses on loans | | | | | | | | | | | | | | | | | | | | | | | (1,316 | ) | | | (1,316 | ) |
| | | | | | | | | | | | | | | | | | | | | | | | | | | | | |
| Capital Leases | | | — | | | | 4 | | | | 4 | | | | 35 | | | | 79 | | | | — | | | | 122 | |
Effective interest rate % | | | — | | | | 7.31 | | | | 7.31 | | | | 7.31 | | | | 7.32 | | | | | | | | | |
| | | | | | | | | | | | | | | | | | | | | | | | | | | | | |
| Equity Financing | | | | | | | | | | | | | | | | | | | | | | | 95 | | | | 95 | |
| Equipment available for lease, other assets and accrued interest | | | | | | | | | | | | | | | | | | | | | | | 3,141 | | | | 3,141 | |
| |
| Total assets | | $ | 218 | | | $ | 12,652 | | | $ | 367 | | | $ | 3,761 | | | $ | 4,123 | | | $ | 1,968 | | | $ | 23,089 | |
| |
| | | | | | | | | | | | | | | | | | | | | | | | | | | | | |
Liabilities and shareholder’s equity | | | | | | | | | | | | | | | | | | | | | | | | | | | | |
| Loans payable | | | | | | | 4,308 | | | | 1,680 | | | | 7,934 | | | | 1,269 | | | | 392 | | | | 15,583 | |
Effective interest rate % | | | | | | | 3.32 | | | | 3.93 | | | | 5.38 | | | | 4.79 | | | | | | | | | |
| | | | | | | | | | | | | | | | | | | | | | | | | | | | | |
| Total pay side instruments on swap contracts | | | | | | | 12,279 | | | | 33 | | | | 427 | | | | — | | | | 4,036 | | | | 16,775 | |
Effective interest rate % | | | | | | | 4.78 | | | | 4.39 | | | | 4.77 | | | | — | | | | | | | | | |
| | | | | | | | | | | | | | | | | | | | | | | | | | | | | |
| Total receive side instruments on swap contracts | | | | | | | (4,634 | ) | | | (1,688 | ) | | | (6,799 | ) | | | (1,250 | ) | | | (4,366 | ) | | | (18,737 | ) |
Effective interest rate % | | | | | | | 4.39 | | | | 3.94 | | | | 5.56 | | | | 4.73 | | | | | | | | | |
| | | | | | | | | | | | | | | | | | | | | | | | | | | | | |
Cumulative foreign exchange translation on cross currency interest rate swaps(1) | | | | | | | | | | | | | | | | | | | | | | | 1,962 | | | | 1,962 | |
| | | | | | | | | | | | | | | | | | | | | | | | | | | | | |
| Total loans payable | | | | | | | | | | | | | | | | | | | | | | | | | | | 15,583 | |
| | | | | | | | | | | | | | | | | | | | | | | | | | | | | |
| Other liabilities, accrued interest and deferred revenue | | | | | | | | | | | | | | | | | | | | | | | 1,482 | | | | 1,482 | |
| | | | | | | | | | | | | | | | | | | | | | | | | | | | | |
Shareholder’s equity | | | | | | | | | | | | | | | | | | | | | | | 6,024 | | | | 6,024 | |
| |
Total liabilities and shareholder’s equity | | | | | | $ | 11,953 | | | $ | 25 | | | $ | 1,562 | | | $ | 19 | | | $ | 9,530 | | | $ | 23,089 | |
| |
| | | | | | | | | | | | | | | | | | | | | | | | | | | | | |
At December 31, 2007 | | | | | | | | | | | | | | | | | | | | | | | | | | | | |
| Total gap | | | 218 | | | | 699 | | | | 342 | | | | 2,199 | | | | 4,104 | | | | (7,562 | ) | | | — | |
| Cumulative gap | | | 218 | | | | 917 | | | | 1,259 | | | | 3,458 | | | | 7,562 | | | | — | | | | — | |
| |
| | | | | | | | | | | | | | | | | | | | | | | | | | | | | |
| Canadian dollar | | | 17 | | | | 1,351 | | | | 12 | | | | 65 | | | | 43 | | | | (8,732 | ) | | | (7,244 | ) |
| Foreign currency | | | 201 | | | | (652 | ) | | | 330 | | | | 2,134 | | | | 4,061 | | | | 1,170 | | | | 7,244 | |
| |
| Total gap | | | 218 | | | | 699 | | | | 342 | | | | 2,199 | | | | 4,104 | | | | (7,562 | ) | | | — | |
| |
| | |
| (1) | | Due to foreign exchange translation, the pay and receive side instruments may not net to zero. This amount represents the difference caused by foreign translation on the pay and receive side instruments on swap contracts. |
| |
| (2) | | Included in non-interest rate sensitive amounts are the differences between the carrying amounts and the notional amounts, foreign exchange contracts and foreign exchange forwards not sensitive to interest rates. |
102 | Managing Risk. Maximizing Opportunities.
Consolidated Financial Statements
22. Foreign Currency Balances
We have substantial assets and liabilities in U.S. dollars and in other currencies. In addition, we have derivative financial instruments denominated in various currencies. The purpose of these derivative financial instruments is to minimize our cost of capital and optimize our yields, while remaining within treasury guidelines and limits approved by our Board of Directors.
The following table shows where we have used derivative financial instruments to manage the foreign currency exposures of our asset and liability positions. The net foreign currency exposure at the end of December 2008 (expressed in Canadian equivalent dollars) is as follows:
| | | | | | | | | | | | | | | | | | | | | | | | | | | | | | | | | |
| (in millions of Canadian dollars) | | 2008 | |
| | | Assets | | | Liabilities | | | Net foreign | | | Foreign | |
| | | | | | | | | | | | | | | | | | | | | | | | | | | currency | | | exchange | |
| | | Gross | | | DI* | | | Net | | | Gross | | | DI* | | | Net | | | exposure | | | rate | |
| |
| U.S. dollars | | | 28,230 | | | | 121 | | | | 28,351 | | | | (18,548 | ) | | | (10,083 | ) | | | (28,631 | ) | | | (280 | ) | | | 1.2246 | |
| Japanese yen | | | 496 | | | | — | | | | 496 | | | | (666 | ) | | | 187 | | | | (479 | ) | | | 17 | | | | 0.0135 | |
| New Zealand dollars | | | 37 | | | | — | | | | 37 | | | | (808 | ) | | | 775 | | | | (33 | ) | | | 4 | | | | 0.7125 | |
| Mexican peso | | | 125 | | | | — | | | | 125 | | | | (46 | ) | | | (81 | ) | | | (127 | ) | | | (2 | ) | | | 0.0886 | |
| Euros | | | 1,206 | | | | — | | | | 1,206 | | | | (261 | ) | | | (943 | ) | | | (1,204 | ) | | | 2 | | | | 1.7046 | |
| Norwegian krone | | | — | | | | — | | | | — | | | | (407 | ) | | | 409 | | | | 2 | | | | 2 | | | | 0.1760 | |
| Tanzanian schilling | | | 49 | | | | — | | | | 49 | | | | — | | | | (47 | ) | | | (47 | ) | | | 2 | | | | 0.0009 | |
| Australian dollars | | | 121 | | | | — | | | | 121 | | | | (151 | ) | | | 31 | | | | (120 | ) | | | 1 | | | | 0.8550 | |
| British pounds | | | 1,038 | | | | — | | | | 1,038 | | | | (1,435 | ) | | | 397 | | | | (1,038 | ) | | | — | | | | 1.7896 | |
| Czech koruna | | | 58 | | | | — | | | | 58 | | | | — | | | | (58 | ) | | | (58 | ) | | | — | | | | 0.0638 | |
| Hong Kong dollars | | | 147 | | | | — | | | | 147 | | | | — | | | | (147 | ) | | | (147 | ) | | | — | | | | 0.1580 | |
| Hungarian forint | | | 46 | | | | — | | | | 46 | | | | (38 | ) | | | (8 | ) | | | (46 | ) | | | — | | | | 0.0064 | |
| Polish zloty | | | 64 | | | | — | | | | 64 | | | | (41 | ) | | | (23 | ) | | | (64 | ) | | | — | | | | 0.4137 | |
| Singapore dollars | | | 54 | | | | — | | | | 54 | | | | — | | | | (54 | ) | | | (54 | ) | | | — | | | | 0.8521 | |
| Swiss franc | | | — | | | | — | | | | — | | | | (303 | ) | | | 303 | | | | — | | | | — | | | | 1.1479 | |
| |
| | |
| * | | DI represents derivative instruments. See note 13. |
| | | | | | | | | | | | | | | | | | | | | | | | | | | | | | | | | |
| (in millions of Canadian dollars) | | | | | | | | | | | 2007 | |
| | | Assets | | | Liabilities | | | Net foreign | | | Foreign | |
| | | | | | | | | | | | | | | | | | | | | | | | | | | currency | | | exchange | |
| | | Gross | | | DI* | | | Net | | | Gross | | | DI* | | | Net | | | exposure | | | rate | |
| |
| U.S. dollars | | | 15,935 | | | | 195 | | | | 16,130 | | | | (7,921 | ) | | | (8,153 | ) | | | (16,074 | ) | | | 56 | | | | 0.9881 | |
| Euros | | | 957 | | | | — | | | | 957 | | | | 3 | | | | (958 | ) | | | (955 | ) | | | 2 | | | | 1.4428 | |
| Hong Kong dollars | | | 109 | | | | — | | | | 109 | | | | (117 | ) | | | 10 | | | | (107 | ) | | | 2 | | | | 0.1267 | |
| Australian dollars | | | 24 | | | | — | | | | 24 | | | | (196 | ) | | | 173 | | | | (23 | ) | | | 1 | | | | 0.8659 | |
| British pounds | | | 971 | | | | — | | | | 971 | | | | (1,002 | ) | | | 32 | | | | (970 | ) | | | 1 | | | | 1.9600 | |
| Japanese yen | | | 284 | | | | — | | | | 284 | | | | (975 | ) | | | 692 | | | | (283 | ) | | | 1 | | | | 0.0088 | |
| Czech koruna | | | 49 | | | | — | | | | 49 | | | | — | | | | (49 | ) | | | (49 | ) | | | — | | | | 0.0542 | |
| Hungarian forint | | | 40 | | | | — | | | | 40 | | | | — | | | | (40 | ) | | | (40 | ) | | | — | | | | 0.0057 | |
| Iceland krona | | | — | | | | — | | | | — | | | | (82 | ) | | | 82 | | | | — | | | | — | | | | 0.0157 | |
| Mexican peso | | | 128 | | | | — | | | | 128 | | | | — | | | | (128 | ) | | | (128 | ) | | | — | | | | 0.0905 | |
| Norwegian krone | | | — | | | | — | | | | — | | | | (368 | ) | | | 368 | | | | — | | | | — | | | | 0.1816 | |
| New Zealand dollars | | | 39 | | | | — | | | | 39 | | | | (585 | ) | | | 546 | | | | (39 | ) | | | — | | | | 0.7579 | |
| Polish zloty | | | 2 | | | | — | | | | 2 | | | | — | | | | (2 | ) | | | (2 | ) | | | — | | | | 0.4005 | |
| Singapore dollars | | | 45 | | | | — | | | | 45 | | | | — | | | | (45 | ) | | | (45 | ) | | | — | | | | 0.6874 | |
| South African rand | | | — | | | | — | | | | — | | | | (35 | ) | | | 35 | | | | — | | | | — | | | | 0.1444 | |
| |
| | |
| * | | DI represents derivative instruments. See note 13. |
We recognized a foreign exchange translation loss of $116 million in 2008 (2007 — gain of $87 million) which is included in other income. Included in this amount is a loss on the financial instruments funding our available-for-sale securities. There is a foreign exchange gain of $131 million (2007 — loss of $97 million) associated with marketable securities classified as available-for-sale and recorded in other comprehensive income. Throughout the year, our assets and liabilities were denominated mainly in U.S. dollars, euros and British pounds.
EDC Annual Report 2008 | 103
Consolidated Financial Statements
23. Fair Value of Financial Instruments
Fair value represents our estimate of the amount of consideration that would be agreed upon to exchange a financial instrument in an arm’s length transaction between knowledgeable, willing parties who are under no compulsion to act.
As with any estimate, uncertainty is inherent due to the unpredictability of future events. In the case of estimating the fair value of our financial instruments, this uncertainty is magnified due to the large number of assumptions used and the wide range of acceptable valuation techniques. Estimates of fair values are based on market conditions at a certain point in time, and may not be reflective of future market conditions. Therefore, the estimates of the fair value of financial instruments outlined as follows do not necessarily reflect the actual values that may occur should the instruments be exchanged in the market.
| | | | | | | | | | | | | | | | | |
| (in millions of Canadian dollars) | | 2008 | | | 2007 | |
| | | Carrying | | | Fair | | | Carrying | | | Fair | |
| | | value | | | value | | | value | | | value | |
| |
Assets | | | | | | | | | | | | | | | | |
| Performing fixed rate loans* | | | 10,008 | | | | 8,522 | | | | 7,094 | | | | 7,007 | |
| Performing floating rate loans* | | | 18,216 | | | | 14,788 | | | | 10,178 | | | | 10,594 | |
| |
| Total performing loans receivable | | | 28,224 | | | | 23,310 | | | | 17,272 | | | | 17,601 | |
| Impaired loans (less specific allowance and non-accrued capitalized interest) | | | 391 | | | | 391 | | | | 175 | | | | 175 | |
| |
| Loans receivable and accrued interest and fees | | | 28,615 | | | | 23,701 | | | | 17,447 | | | | 17,776 | |
| |
| Cash | | | 188 | | | | 188 | | | | 173 | | | | 173 | |
| Marketable securities: | | | | | | | | | | | | | | | | |
| Held-for-trading | | | 3,193 | | | | 3,193 | | | | 1,600 | | | | 1,600 | |
| Available-for-sale | | | 462 | | | | 462 | | | | 755 | | | | 755 | |
| Equity financing designated as held-for-trading | | | 150 | | | | 150 | | | | 95 | | | | 95 | |
| Recoverable insurance claims | | | 39 | | | | 39 | | | | 27 | | | | 27 | |
| Derivative instruments | | | 1,830 | | | | 1,830 | | | | 2,242 | | | | 2,242 | |
| |
Liabilities | | | | | | | | | | | | | | | | |
| Accounts payable | | | 227 | | | | 227 | | | | 209 | | | | 209 | |
| Loans payable: | | | | | | | | | | | | | | | | |
| Designated as held-for-trading | | | 24,426 | | | | 24,426 | | | | 14,408 | | | | 14,408 | |
| Other financial liabilities | | | 1,456 | | | | 1,575 | | | | 1,175 | | | | 1,226 | |
| Derivative instruments | | | 1,400 | | | | 1,400 | | | | 166 | | | | 166 | |
| Loan guarantees | | | 275 | | | | 275 | | | | 135 | | | | 135 | |
| |
| | |
| * | | The carrying and fair value of loans includes deferred guarantee fees of $80 million (2007 — $ 65 million). |
The assumptions and valuation techniques that we use to estimate fair values are as follows:
Loans Receivable
In order to estimate the fair value of our performing loans receivable (including accrued interest receivable), we separate them into risk pools and calculate the net present value of principal and interest cash flows. The discount rates are obtained from yield curves for each risk pool and are specific to the credit risk and term to maturity associated with each principal and interest cash flow.
The fair value of impaired loans is considered to be equal to their carrying value.
Marketable Securities
We estimate the fair value of marketable securities using observable market prices. If such prices are not available, we determine the fair value by discounting future cash flows using an appropriate yield curve.
Equity Financing
Depending on the type of investment, we estimate fair value using one of the following: (i) market-based methodologies, such as the quoted share price or the price of recent investments; (ii) discounted earnings or cash flow approaches; or (iii) liquidation or asset-based methods. Significant assumptions used in the determination of fair value can include discount or capitalization rate, rate of return and the weighting of forecasted earnings.
104 | Managing Risk. Maximizing Opportunities.
Consolidated Financial Statements
Loans Payable
The fair value of our less complex loans payable is determined using the discounted cash flow method. Forward rates are used to value floating rate cash flows occurring in the future. Cash flows are discounted using the respective currency’s yield curve. Inputs to the models are market observable and may include interest rate yield curves and foreign exchange rates.
For our more complex loans payable which may include optionality, we estimate fair value using valuation models when independent market prices are not available. Inputs to these models include option volatilities and correlations in addition to interest rate yield curves and foreign exchange rates.
Derivatives
Foreign exchange forwards and foreign exchange swaps are valued by discounting the notional amounts using the respective currency’s yield curve and converting the amounts using the spot Canadian dollar exchange rate.
Interest rate and cross currency interest rate swaps are valued using a discounted cash flow method. Forward rates are used to determine floating rate cash flows occurring in the future. Cash flows are discounted using the respective currency’s yield curve. Inputs to the models are market observable and may include interest rate yield curves and foreign exchange rates.
For more complex swaps which may include optionality, including cross currency interest rate swaps, interest rate swaps, non-deliverable forwards and equity-linked swaps, the fair value is determined using models which are developed from recognized valuation techniques. Inputs to these models include option volatilities and correlations in addition to interest rate yield curves and foreign exchange rates. Credit default swaps are valued with the additional input of market based par credit default swap spreads or by using quoted prices from dealers where appropriate.
Financial Instruments with book value approximating fair value
Fair value is assumed to equal book value for accounts payable due to the short term nature of these instruments. Fair value is also assumed to equal book value for cash, recoverable insurance claims and loan guarantees.
24. Financial Instrument Risks
Our risk management practices are guided by an Enterprise Risk Management Framework which identifies the key risks that EDC faces and the tools used to measure, monitor, and manage them. The principal risks that we are exposed to as a result of holding financial instruments, are credit, market and liquidity risk.
Credit Risk
Credit risk is the risk of loss incurred if a counterparty fails to meet its financial commitments. We are exposed to credit risk on financial instruments under both our loans program and our treasury activities. Our objectives, policies and processes for managing credit risk as well as the methods we use to measure this risk are disclosed in the notes related to our derivative financial instruments and debt instruments, as well as in the text and tables displayed in a brown-tinted font in management’s discussion and analysis on pages 49 to 64 of this annual report.
Concentration of Credit Risk
Concentration of credit risk exposure exists when a number of counterparties operate in the same geographical market or industry, or engage in similar activities. Changes in economic or political conditions may affect their ability to meet obligations in a similar manner. We have limits in place to ensure that our exposure is not overly concentrated in any one country, industry or counterparty. Exposure in excess of these limits requires approval of our Board of Directors.
The following table provides a breakdown, by the country in which the risk resides, of the maximum gross exposure to credit risk of financial instruments:
| | | | | | | | | | | | | | | | | | | | | | | | | | | | | | | | | |
| | | Gross | | | | | | | | | | | Investments and | | | | | | | | | | | | | |
| | | loans | | | Loan | | | Equity | | | derivative | | | | | | | | | | | | | |
| (in millions of Canadian dollars) | | receivable | | | guarantees | | | financing | | | instruments | | | 2008 | | | Exposure | | | 2007 | | | Exposure | |
| |
Country | | | | | | | | | | | | | | | | | | | $ | | | | % | | | | $ | | | | % | |
| |
| United States | | | 13,889 | | | | 2,144 | | | | 12 | | | | 1,885 | | | | 17,930 | | | | 44 | | | | 12,100 | | | | 45 | |
| Canada | | | 2,461 | | | | 897 | | | | 81 | | | | 2,856 | | | | 6,295 | | | | 15 | | | | 4,496 | | | | 17 | |
| Mexico | | | 2,134 | | | | 159 | | | | 4 | | | | — | | | | 2,297 | | | | 6 | | | | 1,275 | | | | 5 | |
| India | | | 1,369 | | | | 4 | | | | 3 | | | | — | | | | 1,376 | | | | 3 | | | | 765 | | | | 3 | |
| Brazil | | | 1,123 | | | | 21 | | | | — | | | | — | | | | 1,144 | | | | 3 | | | | 393 | | | | 1 | |
| United Kingdom | | | 799 | | | | 4 | | | | 23 | | | | 224 | | | | 1,050 | | | | 3 | | | | 1,273 | | | | 5 | |
| China | | | 975 | | | | — | | | | 9 | | | | — | | | | 984 | | | | 2 | | | | 859 | | | | 3 | |
| Chile | | | 945 | | | | 2 | | | | — | | | | — | | | | 947 | | | | 2 | | | | 453 | | | | 2 | |
| Russia | | | 652 | | | | 24 | | | | — | | | | — | | | | 676 | | | | 2 | | | | 303 | | | | 1 | |
| Netherlands | | | 517 | | | | 61 | | | | — | | | | — | | | | 578 | | | | 1 | | | | 403 | | | | 1 | |
| Other | | | 6,034 | | | | 749 | | | | 18 | | | | 708 | | | | 7,509 | | | | 19 | | | | 4,620 | | | | 17 | |
| |
| Total | | $ | 30,898 | | | $ | 4,065 | | | $ | 150 | | | $ | 5,673 | | | $ | 40,786 | | | | 100 | | | $ | 26,940 | | | | 100 | |
| |
EDC Annual Report 2008 | 105
Consolidated Financial Statements
The concentration of credit risk by industry sector for our financial instruments is as follows:
| | | | | | | | | | | | | | | | | | | | | | | | | | | | | | | | | |
| | | Gross | | | | | | | | | | | Investments and | | | | | | | | | | | | | |
| | | loans | | | Loan | | | Equity | | | derivative | | | | | | | | | | | | | |
| (in millions of Canadian dollars) | | receivable | | | guarantees | | | financing | | | instruments | | | 2008 | | | Exposure | | | 2007 | | | Exposure | |
| |
Industry | | | | | | | | | | | | | | | | | | | $ | | | | % | | | | $ | | | | % | |
| |
| Commercial: | | | | | | | | | | | | | | | | | | | | | | | | | | | | | | | | |
| Aerospace | | | 8,818 | | | | 82 | | | | 3 | | | | — | | | | 8,903 | | | | 22 | | | | 5,606 | | | | 21 | |
| Surface transportation | | | 4,852 | | | | 2,293 | | | | — | | | | — | | | | 7,145 | | | | 18 | | | | 5,772 | | | | 21 | |
| Extractive | | | 5,546 | | | | 269 | | | | — | | | | — | | | | 5,815 | | | | 14 | | | | 2,653 | | | | 10 | |
| Financial institutions | | | 1,265 | | | | 196 | | | | — | | | | 3,812 | | | | 5,273 | | | | 13 | | | | 4,683 | | | | 18 | |
| Information and communication technology | | | 4,834 | | | | 162 | | | | 28 | | | | — | | | | 5,024 | | | | 12 | | | | 2,754 | | | | 10 | |
| Infrastructure and environment* | | | 2,423 | | | | 341 | | | | 4 | | | | — | | | | 2,768 | | | | 7 | | | | 1,398 | | | | 5 | |
| Other | | | 746 | | | | 445 | | | | 115 | | | | 146 | | | | 1,452 | | | | 3 | | | | 814 | | | | 3 | |
| |
| Total commercial | | | 28,484 | | | | 3,788 | | | | 150 | | | | 3,958 | | | | 36,380 | | | | 89 | | | | 23,680 | | | | 88 | |
| Sovereign | | | 2,414 | | | | 277 | | | | — | | | | 1,715 | | | | 4,406 | | | | 11 | | | | 3,260 | | | | 12 | |
| |
| Total | | $ | 30,898 | | | $ | 4,065 | | | $ | 150 | | | $ | 5,673 | | | $ | 40,786 | | | | 100 | | | $ | 26,940 | | | | 100 | |
| |
| | |
| * | | Excludes financial institution exposure which is disclosed separately in this table |
Market risk
Market risk is the risk that the fair value or future cash flows of a financial instrument will fluctuate because of changes in market prices. Market risk comprises three types of risk: foreign exchange risk, interest rate risk, and other price risk. We are exposed to potential negative impacts on the value of financial instruments resulting from adverse movements in interest and foreign exchange rates. We have policies and procedures in place to ensure that interest rate and foreign exchange risks are identified, measured, managed and regularly reported to management and the Board of Directors.
Interest Rate Risk
Interest rate risk is the risk that the fair value or future cash flows of a financial instrument will fluctuate because of changes in market interest rates. We are exposed to potential adverse impacts on the value of financial instruments resulting from differences in the maturities or repricing dates of assets and liabilities both on and off-balance sheet, as well as from embedded optionality in those assets and liabilities.
Foreign Exchange Risk
Foreign exchange risk is the potential adverse impact on the value of financial instruments resulting from exchange rate movements. We are exposed to foreign exchange rate risk when there is a mismatch between assets and liabilities in any currency.
Our objectives, policies and processes for managing market risk as well as a sensitivity analysis for our exposure to both interest rate and foreign exchange risk is disclosed in the text and tables displayed in a brown-tinted font in management’s discussion and analysis on page 65 of this annual report.
Liquidity Risk
Liquidity risk is the risk that we would be unable to honour daily cash commitments or the risk that we would have to obtain funds rapidly, possibly at an excessively high premium during severe market conditions. We maintain liquidity through a variety of methods such as holding cash and marketable securities, having access to commercial paper markets and a standby credit facility.
Our objectives, policies and processes for managing liquidity risk as well as the methods we use to measure this risk is disclosed in the text and tables displayed in a brown-tinted font in management’s discussion and analysis on page 66 of this annual report.
25. Variable Interest Entities
A variable interest entity (“VIE”) is an entity in which the total equity investment at risk is not sufficient to finance its activities without additional subordinated financial support or where the holders of the equity at risk lack the characteristics of a controlling financial interest. We identify VIEs in which we have an interest and determine whether we are the primary beneficiary of the VIE and if so, consolidate the VIE under Accounting Guideline 15, Consolidation of Variable Interest Entities (AcG-15). The primary beneficiary is the enterprise that absorbs or receives the majority of the VIE’s expected losses or gains, or both. AcG-15 also requires specific disclosure for VIEs that are not consolidated but in which the entity has a significant variable interest.
106 | Managing Risk. Maximizing Opportunities.
Consolidated Financial Statements
We have identified VIEs for which we are the primary beneficiary and have consolidated these entities. In the 2005 to 2007 timeframe, we foreclosed on a number of aircraft loans and as a result, various aircraft for which we were a secured lender, were returned to us. During 2006 and 2007, these aircraft were placed into trusts designated as VIEs for which we are the primary beneficiary. These trusts have therefore been consolidated and have total assets of approximately $457 million at the end of December 2008 (2007 — $478 million) and are included in equipment available for lease and net investment in capital leases.
We also have significant interests in VIEs where we are not considered the primary beneficiary. These VIEs include secured leveraged lease financing transactions in the aerospace and rail transportation industries in which we have lent funds through special purpose entities and in some cases provided guarantees to the equity-holders of these entities. These VIEs had assets of approximately $7,547 million at the end of December 2008 (2007 — $6,212 million). The VIEs in the rail transportation industry were created in the 1999 to 2008 timeframe, while the VIEs in the aerospace industry were created in the 1995 to 2008 timeframe.
Our maximum exposure to loss as a result of involvement with non-consolidated VIEs was approximately $4,955 million at the end of December 2008 (2007 — $4,153 million). Of this amount, $4,380 million (2007 — $3,687 million) relates to the net loans receivable (gross loans receivable less the total allowance for loan losses) and $575 million (2007 — $466 million) relates to the guarantees provided to the equity holders.
26. Loan Revenue
| | | | | | | | | |
| (in millions of Canadian dollars) | | 2008 | | | 2007 | |
| |
| Loan interest — floating rate | | | 672 | | | | 667 | |
| Loan interest — fixed rate | | | 544 | | | | 507 | |
| Amortization of performing non-accrued capitalized interest | | | 7 | | | | 74 | |
| Impaired revenue | | | 56 | | | | 109 | |
| Loan fee revenue | | | 58 | | | | 50 | |
| Other loan revenue | | | 13 | | | | (2 | ) |
| |
| Total loan revenue | | $ | 1,350 | | | $ | 1,405 | |
| |
27. Investment Revenue
| | | | | | | | | |
| (in millions of Canadian dollars) | | 2008 | | | 2007 | |
| |
| Held-for-trading instruments | | | | | | | | |
| Short-term | | | 37 | | | | 68 | |
| Long-term fixed | | | 14 | | | | 18 | |
| Other | | | 1 | | | | 1 | |
| Available-for-sale instruments | | | | | | | | |
| Long-term fixed | | | 28 | | | | 34 | |
| Other | | | 1 | | | | 2 | |
| |
| Total investment revenue | | $ | 81 | | | $ | 123 | |
| |
28. Interest Expense
| | | | | | | | | |
| (in millions of Canadian dollars) | | 2008 | | | 2007 | |
| |
| Designated as held-for-trading instruments | | | | | | | | |
| Short-term debt | | | 98 | | | | 203 | |
| Long-term debt — floating | | | 409 | | | | 423 | |
| Long-term debt — fixed | | | 32 | | | | 50 | |
| Other financial liabilities | | | | | | | | |
| Long-term debt — fixed | | | 65 | | | | 37 | |
| Other | | | 7 | | | | 4 | |
| |
| Total interest expense | | $ | 611 | | | $ | 717 | |
| |
EDC Annual Report 2008 | 107
Consolidated Financial Statements
29. Leasing and Financing Related Expenses
| | | | | | | | | |
| (in millions of Canadian dollars) | | 2008 | | | 2007 | |
| |
| Maintenance and technical costs | | | 16 | | | | 23 | |
| Depreciation | | | 14 | | | | 15 | |
| Other | | | 8 | | | | 8 | |
| |
| Total leasing and financing related expenses | | $ | 38 | | | $ | 46 | |
| |
30. Provision for Credit Losses
The composition of the provision for credit losses, expressed on the income statement, is as follows:
| | | | | | | | | |
| (in millions of Canadian dollars) | | 2008 | | | 2007 | |
| |
| Provision for (reversal of) losses on loans | | | 249 | | | | (44 | ) |
| Provision for losses on loan commitments | | | 2 | | | | 215 | |
| Provision for losses on loan guarantees | | | 95 | | | | 45 | |
| |
| | | | 346 | | | | 216 | |
| | | | | | | | | |
| Reversal of provision for credit impairment in derivative financial instruments and marketable securities | | | — | | | | (20 | ) |
| |
| Provision for credit losses | | $ | 346 | | | $ | 196 | |
| |
31. Claims-Related Expenses
The composition of the claims-related expenses, expressed on the income statement, is as follows:
| | | | | | | | | |
| (in millions of Canadian dollars) | | 2008 | | | 2007 | |
| |
| Claims paid | | | 104 | | | | 60 | |
| Net reinsured claims paid* | | | — | | | | 2 | |
| Claims recovered | | | (24 | ) | | | (15 | ) |
| Actuarial increase in the net allowance for claims on insurance | | | 146 | | | | 54 | |
| Decrease (increase) in recoverable insurance claims** | | | (7 | ) | | | 28 | |
| Claims handling expenses | | | 3 | | | | 3 | |
| |
| Total claims-related expenses | | $ | 222 | | | $ | 132 | |
| |
| | |
| * | | Represents the net claims paid related to the agreement with Travelers Guarantee Insurance Company whereby we assume reinsurance for joint policy domestic transactions underwritten by Travelers Guarantee Insurance Company. |
| |
| ** | | Includes change in recoverable insurance claims related to the agreement with Travelers Guarantee Insurance Company whereby we assume reinsurance for joint policy domestic transactions underwritten by Travelers Guarantee Insurance Company. |
The actuarial increase in the allowance for claims on insurance was primarily the result of our annual review of the actuarial assumptions, as well as changes in the portfolio and risk ratings. Our review of the actuarial assumptions took into account the current economic difficulties, particularly within the automotive and retail sectors, and as a result, adjustments were made to our frequency and severity of loss assumptions.
During the year, changes to the recoverable insurance claims were as follows:
| | | | | | | | | |
| (in millions of Canadian dollars) | | 2008 | | | 2007 | |
| |
| Balance at beginning of year | | | 27 | | | | 61 | |
| Claims paid | | | 104 | | | | 60 | |
| Claims recovered | | | (24 | ) | | | (15 | ) |
| Net reinsured claims paid* | | | — | | | | 2 | |
| Unrecoverable portion of claims paid | | | (72 | ) | | | (73 | ) |
| Foreign exchange | | | 4 | | | | (8 | ) |
| |
| Balance at end of year | | $ | 39 | | | $ | 27 | |
| |
| | |
| * | | Represents the net claims paid related to the agreement with Travelers Guarantee Insurance Company whereby we assume reinsurance for joint policy domestic transactions underwritten by Travelers Guarantee Insurance Company. |
108 | Managing Risk. Maximizing Opportunities.
Consolidated Financial Statements
Of the $104 million (2007 — $60 million) in claim payments made during 2008, 80% (2007 — 84%) were related to the credit insurance program. The largest concentrations of claim payments and recoveries were in the following countries:
| | | | | | | | | | | | | | | | | | | |
| (in millions of Canadian dollars) | | 2008 | | | 2007 | |
| | | Claims | | | Claims | | | | | Claims | | | Claims | |
| | | paid | | | recovered | | | | | paid | | | recovered | |
| |
| United States | | | 67 | | | | 16 | | | United States | | | 34 | | | | 6 | |
| Canada | | | 12 | | | | 1 | | | Kazakhstan | | | 5 | | | | — | |
| Mexico | | | 5 | | | | 1 | | | Mexico | | | 3 | | | | 3 | |
| Iran | | | 4 | | | | 1 | | | Netherlands | | | 3 | | | | — | |
| China | | | 2 | | | | — | | | Canada | | | 2 | | | | — | |
| Other | | | 14 | | | | 5 | | | Other | | | 13 | | | | 6 | |
| |
| Total | | $ | 104 | | | $ | 24 | | | Total | | $ | 60 | | | $ | 15 | |
| |
32. Other Income (Expense)
| | | | | | | | | |
| (in millions of Canadian dollars) | | 2008 | | | 2007 | |
| |
| Unrealized loss on loan related credit default swaps | | | (82 | ) | | | (11 | ) |
| Unrealized and realized gain (loss) on unsecured claims receivable | | | (11 | ) | | | 57 | |
| Net realized and unrealized losses on equity investments | | | (49 | ) | | | — | |
| Impairment loss on equipment available for lease* | | | (23 | ) | | | (35 | ) |
| Foreign exchange translation gain (loss) | | | (116 | ) | | | 87 | |
| Realized gain (loss) on available-for-sale marketable securities | | | 16 | | | | (2 | ) |
| Net realized and unrealized losses on loans payable designated as held-for-trading | | | (388 | ) | | | (65 | ) |
| Realized and unrealized gains (losses) on derivatives | | | 628 | | | | (6 | ) |
| Net realized and unrealized gains on held-for-trading marketable securities | | | 15 | | | | 12 | |
| Gain on the sale of financing assets | | | — | | | | 6 | |
| Other | | | (1 | ) | | | 3 | |
| |
| Total other income (expense) | | $ | (11 | ) | | $ | 46 | |
| |
We recognized an unrealized loss of $82 million in 2008 (2007 — $11 million) on our portfolio of loan related credit default swaps. The unfavourable market conditions experienced during 2008 in the financial markets triggered significant credit downgrades of many of the underlying credits on swaps where we sold protection. As a result, the fair value of these instruments decreased significantly during the year.
We have $108 million of unsecured claims outstanding related to the Comair restructuring which was finalized in 2007. These claims account for 46% of the total claims we were granted by the bankruptcy court for concessions we provided to Comair to assist them in exiting bankruptcy. Settlement of these claims is made through the issuance of shares from Comair’s parent company, Delta Airlines Inc. During 2007, 24% of the claims were settled and the proceeds from the sale of shares received were first applied to outstanding balances of foreclosed loans. The remaining $9 million was recognized as income. At the end of 2007, the remaining claims were valued at their fair value of $48 million. During 2008, an additional 30% of the claims were settled and the proceeds from the sale of shares resulted in a realized loss of $5 million. The remaining claims are carried at their fair value based on quoted market prices in the secondary market. We recorded an unrealized loss of $6 million in 2008 on the remaining claims due to a decline in the fair value during the year.
We recognized a foreign exchange translation loss of $116 million in 2008 (2007 — gain of $87 million). Included in this amount is a loss on the financial instruments funding our available-for-sale marketable securities. In accordance with the accounting standards for financial instruments, the foreign exchange gain of $131 million (2007 — $97 million loss) on our available-for-sale marketable securities was recognized in other comprehensive income.
We have designated the majority of our long-term bonds as held-for-trading in order to obtain the same accounting treatment as their related derivatives. In general, these derivatives are entered into to manage interest and foreign exchange rate risk on the related bonds. At the end of December 2008, realized and unrealized losses on loans payable designated as held-for-trading totaled $388 million and the realized and unrealized gains on the derivatives associated with the loans payable totaled $628 million. This difference is mainly due to the the fact that our debt is valued on the basis of our own credit rating (AAA) while the related derivatives are valued based on AA curves due to market conventions. In 2008, while both the AA and AAA curves shifted downward, the AA curves to which we were exposed decreased more significantly compared to the AAA curves to which we were exposed, resulting in realized and unrealized gains on our derivatives which more than offset the losses related to the long-term bonds. We do not anticipate realizing gains or losses on this debt and the associated derivatives since it is generally our intent to hold them to maturity at which time the unrealized gains and losses will net to zero.
EDC Annual Report 2008 | 109
Consolidated Financial Statements
33. Employee Future Benefits
Pension Plans
Effective April 24, 2000, we established pension benefit plans for our employees. The plans are defined benefit plans, providing benefits to retirees based on years of service and the best five consecutive years’ average salary of the employees. Upon retirement, the benefits are fully indexed to inflation. All permanent employees are members of the Registered Pension Plan, however, employee contributions to the plan are optional.
Upon the establishment of the pension plans, employees made an election to transfer their benefits from the Public Service Superannuation Fund. The related obligation and the assets to fund the plans that were transferred from the Government of Canada are included in the obligation and assets shown in the following table.
We maintain a registered defined benefit pension plan and a supplemental defined benefit pension plan. The purpose of the Supplementary Retirement Plan is to supplement benefits to those of its members whose benefits and/or contributions under the registered plan are affected by Income Tax Act maximums. It does so by increasing their benefits to the level which would be payable under the registered pension plan if these maximums did not apply. For 2008 the average remaining service period of the active employees covered by the pension plans was 11 years (2007 — 12 years).
Our appointed actuaries measure the accrued benefit obligations and the fair value of the plans’ assets for accounting purposes as at December 31 of each year. The most recent funding valuation for the Registered Pension Plan was as at December 31, 2007. The next required valuation, to be completed in 2009, will be as at December 31, 2008. For the Supplementary Plan, an annual funding valuation is prepared as at December 31 each year. The discount rate used to determine the accrued benefit obligations was 7.0% for 2008 (2007 — 5.5%) based on market rates for long-term high-quality bonds.
Other Benefit Plans
We maintain a retiring allowance program and provide certain life insurance, health and dental care benefits to retired employees. These plans are unfunded and costs are accrued based on actuarial calculations.
For 2008 the average remaining service period of the active employees covered by the other benefit plans was 13 years (2007 — 13 years).
The following table presents the financial position of our employee benefit plans at the end of December:
| | | | | | | | | | | | | | | | | | | | | | | | | |
| (in millions of Canadian dollars) | | 2008 | | | 2007 | |
| | | Registered | | | Supplementary | | | Other | | | Registered | | | Supplementary | | | Other | |
| | | pension | | | pension | | | benefit | | | pension | | | pension | | | benefit | |
| | | plan | | | plan | | | plans | | | plan | | | plan | | | plans | |
| |
Accrued benefit obligation: | | | | | | | | | | | | | | | | | | | | | | | | |
| Obligation beginning of year | | | 337 | | | | 19 | | | | 83 | | | | 319 | | | | 16 | | | | 73 | |
| Current service costs | | | 19 | | | | 1 | | | | 6 | | | | 19 | | | | 1 | | | | 6 | |
| Interest cost on benefit obligation | | | 19 | | | | 1 | | | | 5 | | | | 17 | | | | 1 | | | | 4 | |
| Actuarial loss (gain) | | | (82 | ) | | | (3 | ) | | | (22 | ) | | | (12 | ) | | | 2 | | | | 1 | |
| Benefits paid | | | (7 | ) | | | (1 | ) | | | (1 | ) | | | (6 | ) | | | (1 | ) | | | (1 | ) |
| |
| Accrued benefit obligation at end of year | | | 286 | | | | 17 | | | | 71 | | | | 337 | | | | 19 | | | | 83 | |
| |
| | | | | | | | | | | | | | | | | | | | | | | | | |
Fair value of plan assets: | | | | | | | | | | | | | | | | | | | | | | | | |
| Fair value at beginning of year | | | 306 | | | | 49 | | | | — | | | | 289 | | | | 49 | | | | — | |
| Actual return on plan assets | | | (64 | ) | | | (7 | ) | | | — | | | | (3 | ) | | | — | | | | — | |
| Employer contributions | | | 24 | | | | 1 | | | | 1 | | | | 22 | | | | 1 | | | | 1 | |
| Employee contributions | | | 5 | | | | — | | | | — | | | | 4 | | | | — | | | | — | |
| Benefits paid | | | (7 | ) | | | (1 | ) | | | (1 | ) | | | (6 | ) | | | (1 | ) | | | (1 | ) |
| |
| Fair value at end of year | | | 264 | | | | 42 | | | | — | | | | 306 | | | | 49 | | | | — | |
| |
| | | | | | | | | | | | | | | | | | | | | | | | | |
Funded status — plan (deficit) surplus | | | (22 | ) | | | 25 | | | | (71 | ) | | | (31 | ) | | | 30 | | | | (83 | ) |
| Unamortized net actuarial loss (gain) | | | 59 | | | | (14 | ) | | | (5 | ) | | | 56 | | | | (21 | ) | | | 17 | |
| Unamortized transitional obligation | | | — | | | | — | | | | 5 | | | | — | | | | — | | | | 6 | |
| |
Accrued benefit asset (liability) | | $ | 37 | | | $ | 11 | | | $ | (71 | ) | | $ | 25 | | | $ | 9 | | | $ | (60 | ) |
| |
The unamortized net actuarial loss in our Registered Pension Plan was $59 million (2007 — $56 million) which exceeded 10% of the accrued benefit obligation by $30 million (2007 — $21 million) at the end of December 2008. The excess amount is being amortized on a straight-line basis to pension expense over the expected average remaining service period of active employees. Amortization of accumulated net actuarial losses in periods subsequent to December 2008 will be affected primarily by the discount rate used to estimate benefit obligations and by the difference between future investment results and the expected return on plan assets.
The accrued benefit asset (liability) is included on our balance sheet in accounts payable and other credits.
110 | Managing Risk. Maximizing Opportunities.
Consolidated Financial Statements
Asset Mix
Plan assets are invested in debt securities, equity securities, inflation sensitive categories and held in cash. For the Registered Pension Plan, the target allocation percentages are 30% in debt securities, 57% in equity securities and 13% in inflation-sensitive categories. Until we are fully transitioned to inflation-sensitive categories, 3.5% has been added to the above equities allocation (2007 – 9.0%) and 2.5% to the debt allocation above (2007 – 4.0%). The actual percentages at the end of December 2008 were 41% in debt securities, 54% in equity securities (2007 – 35% and 65%) and 5% in inflation-sensitive categories (2007 – nil). For the Supplementary Pension Plan, the target is 100% in equity securities, net of the cash in a refundable tax account as prescribed by Canada Revenue Agency. This resulted in actual percentages of 58% in cash and 42% in equity securities at the end of 2008 (2007 – 47% and 53%).
Defined Benefit Expense
| | | | | | | | | | | | | | | | | | | | | | | | | |
| (in millions of Canadian dollars) | | | | | | | | | | 2008 | | | | | | | | | | | 2007 | |
| | | Registered | | | Supplementary | | | Other | | | Registered | | | Supplementary | | | Other | |
| | | pension | | | pension | | | benefit | | | pension | | | pension | | | benefit | |
| | | plan | | | plan | | | plans | | | plan | | | plan | | | plans | |
| |
Current service costs
(net of employee contributions) | | | 14 | | | | 1 | | | | 6 | | | | 15 | | | | 1 | | | | 6 | |
| Interest cost on benefit obligation | | | 19 | | | | 1 | | | | 5 | | | | 17 | | | | 1 | | | | 4 | |
| Actual return on plan assets | | | 64 | | | | 7 | | | | — | | | | 3 | | | | — | | | | — | |
| Actuarial loss (gain) | | | (82 | ) | | | (3 | ) | | | (22 | ) | | | (12 | ) | | | 2 | | | | 1 | |
| |
| Benefit costs (gain) before adjustments to recognize the long-term nature of employee future benefit costs | | | 15 | | | | 6 | | | | (11 | ) | | | 23 | | | | 4 | | | | 11 | |
| |
| Adjustments: | | | | | | | | | | | | | | | | | | | | | | | | |
| Difference between expected return and actual return on plan assets | | | (87 | ) | | | (9 | ) | | | — | | | | (25 | ) | | | (3 | ) | | | — | |
| Difference between actuarial loss recognized for the year and actual actuarial loss on accrued benefit obligation for the year | | | 84 | | | | 2 | | | | 22 | | | | 13 | | | | (3 | ) | | | — | |
| Amortization of transitional obligation | | | — | | | | — | | | | 1 | | | | — | | | | — | | | | 1 | |
| |
| Total expense | | $ | 12 | | | $ | (1 | ) | | $ | 12 | | | $ | 11 | | | $ | (2 | ) | | $ | 12 | |
| |
Total Cash Payments
Total cash payments for employee future benefits in 2008 totaled $26 million (2007 – $24 million). The payments consisted of cash contributions to the Pension Plans and payments paid directly to beneficiaries for the unfunded Other Benefit plans. Included in total cash payments in 2008 was $14 million (2007 – $12 million) in additional contributions to the Registered Pension Plan in relation to a plan deficit identified as a result of the funding valuation for 2005, 2006 and 2007.
| | | | | | | | | | | | | | | | | | | | | | | | | |
| Assumptions | | | | | | | | | | 2008 | | | | | | | | | | | 2007 | |
| | | Registered | | | Supplementary | | | Other | | | Registered | | | Supplementary | | | Other | |
| (Weighted average) | | pension plan | | | pension plan | | | benefit plans | | | pension plan | | | pension plan | | | benefit plans | |
| |
| Accrued benefit obligation: | | | | | | | | | | | | | | | | | | | | | | | | |
| Discount rate | | | 7.00 | % | | | 7.00 | % | | | 7.00 | % | | | 5.50 | % | | | 5.50 | % | | | 5.50 | % |
| Rate of compensation increase | | Inflation | | Inflation | | Inflation | | Inflation | | Inflation | | Inflation |
| | | + productivity | | + productivity | | + productivity | | + productivity | | + productivity | | + productivity |
| | | + merit | | + merit | | + merit | | + merit | | + merit | | + merit |
| | | | | | | | | | | | | | | | | | | | | | | | | |
| Benefit costs: | | | | | | | | | | | | | | | | | | | | | | | | |
| Expected long-term rate of return on assets | | | 7.50 | % | | | 3.75 | % | | | n/a | | | | 7.50 | % | | | 3.75 | % | | | n/a | |
| Discount rate on projected benefit obligation | | | 5.50 | % | | | 5.50 | % | | | 5.50 | % | | | 5.20 | % | | | 5.20 | % | | | 5.20 | % |
| Inflation | | | 2.50 | % | | | 2.50 | % | | | n/a | | | | 2.50 | % | | | 2.50 | % | | | n/a | |
| Rate of compensation increase | | Inflation | | Inflation | | Inflation | | Inflation | | Inflation | | Inflation |
| | | + productivity | | + productivity | | + productivity | | + productivity | | + productivity | | + productivity |
| | | + merit | | + merit | | + merit | | + merit | | + merit | | + merit |
| |
| | | | | | | | | | | | | | | | | | | | | | | | | |
EDC Annual Report 2008 | 111
Consolidated Financial Statements
The initial annual rate of increase for covered medical care benefits is assumed to be 10% (2007 – 10%). This rate is projected to trend down over seven years to an ultimate rate of 4% for 2014 (2007 – 4% for 2014) and subsequent years. For dental care, the trend rate used was 4% (2007 – 4%).
A one percentage point increase in assumed health care cost trends would have increased the service and interest costs by $2.0 million (2007 – $2.0 million) and the obligation by $10.6 million (2007 – $14.5 million). A one percentage point decrease in assumed health care cost trends would have decreased the service and interest costs and the obligation by $1.6 million (2007 – $1.5 million) and $8.3 million (2007 – $11.1 million).
34. Related Party Transactions
We enter into transactions with other government departments, agencies and Crown corporations in the normal course of business, under terms and conditions similar to those that apply to unrelated parties. The following disclosure is in addition to the related party disclosure provided elsewhere in these financial statements. All material related party transactions are either disclosed below or in the relevant notes. These transactions are measured at their exchange amounts.
Canada Account Administrative Expense Recovery
As described in note 35, we enter into certain financial and contingent liability transactions on behalf of the Government of Canada, through a program referred to as “Canada Account”. We are compensated for expenses and overhead relating to Canada Account activities. In 2008, we incurred $4 million (2007 – $6 million) against Canada Account receipts and recoveries for these expenses and overhead. These amounts are netted against administrative expenses on the income statement.
Subsidiary Contingent Liability
Our consolidated contingent liabilities include $44 million (2007 – $36 million) which represents the potential claim that the Canada Account could make against the two entities in which our subsidiary Exinvest has an ownership interest. These two entities were established for the purposes of financing the sale of regional jet aircraft. There is a Tripartite Indemnity Agreement in place between these two entities and the Canada Account related to guarantees that the Canada Account provided to third parties. During 2003, the ultimate obligor to which the Canada Account guarantees pertained became impaired which resulted in a call against the guarantees and the Canada Account has since paid out on the guarantees and is now in a position to make a call against the two entities in which our subsidiary Exinvest has an ownership interest. A specific allowance of $13 million (2007 – $11 million) has been set up to provide against this potential call on the indemnity.
Debt Relief
When sovereign borrowers experience financial difficulties and are unable to meet their debt obligations, sovereign creditors, including the Government of Canada, agree at an international forum, the Paris Club, to formally reschedule the borrower’s debt obligations. From time to time and on a case-by-case basis, the most heavily indebted sovereign borrowers are granted debt reduction or debt service relief by the Government of Canada. The granting of debt reduction or relief by the Paris Club is contingent upon the sovereign borrower’s ability to implement and maintain economic programs outlined by the International Monetary Fund.
Prior to April 2001, the Government of Canada has reimbursed to us an amount equal to the debt relief granted by the Government of Canada to our sovereign borrowers. The formula for calculating the amount to be paid to us was amended effective April 1, 2001 in two ways. Firstly, for new loans issued by us after March 31, 2001 to sovereign borrowers which were on the Paris Club debt relief list as at April 1, 2001, the Government of Canada has no obligation to compensate us for further debt relief granted to such borrowers. Secondly, for any debt reduction for new loans resulting from unilateral debt relief measures or new debt reduction for obligations contracted prior to April 1, 2001, we will share in the costs of debt forgiveness to the amount of our appropriate specific allowances on the loans.
Amounts received for debt relief arrangements on sovereign impaired loans are credited to the book value of the loans similar to the treatment accorded to other receipts on impaired loans. To the extent that amounts received exceed the book value of the loans as a result of non-accrued capitalized interest, debt relief income is recorded, and any provisions are returned to income.
No debt relief payments were received in 2008 (2007 – $1 million).
112 | Managing Risk. Maximizing Opportunities.
Consolidated Financial Statements
35. Canada Account Transactions
Pursuant to the Act, the Minister of International Trade, with the concurrence of the Minister of Finance, may authorize us to undertake certain financial and contingent liability transactions on behalf of the Government of Canada. These transactions and the legislative authorities that underlie them have come to be known collectively as the “Canada Account”. Our Board of Directors is responsible only for ensuring that transactions we make under the Canada Account are administered appropriately. Accounts for these transactions are maintained separately from our accounts and are consolidated annually as at March 31 with the financial statements of the Government of Canada, which are reported upon separately by the Government and audited by the Auditor General of Canada. The assets under the Canada Account, mainly loans receivable and accrued interest and fees recorded in accordance with the accounting policies and practices of the Government of Canada, amounted to $3,405 million at the end of December 2008 (2007 – $2,902 million).
The Act allows the Canada Account to have outstanding loans and commitments to borrowers, and arrangements giving rise to contingent liabilities under contracts of insurance and other agreements up to a maximum of $13 billion. The position against this limit at December 31, determined in accordance with the requirements of the Act, was $3.7 billion (2007 – $3.3 billion). The position against the statutory limit increases accordingly as we sign each new obligation that has the effect of extending credit or giving rise to a contingent liability.
At the end of December 2008, there were two Ministerial Authorizations (M.A.’s) issued and approved totaling $4,025 million (2007 – nil). One of these authorizations was for General Motors of Canada Limited and Chrysler Canada Inc. in support of their Canadian operations. This support is shared between the Government of Canada and the Government of Ontario. In addition, a third M.A. was approved in January 2009 which provides $367 million to support the construction of five ships by Davie Yards Inc. for two foreign buyers. Canada Account transactions must be approved by the Minister of International Trade with the concurrence of the Minister of Finance in support of potential new transactions to be signed.
36. Subsequent Event
A number of measures were announced in the Government of Canada’s Budget in January 2009 that will increase EDC’s capacity to assist Canadian exporters and investors during the current challenging economic environment.
The measures will require legislative changes and Parliamentary approval and include the following:
| 4 | | EDC’s authorized capital limit will be raised from $1.5 billion to $3.0 billion. This will allow the Government to invest more share capital into EDC if required. |
| |
| 4 | | EDC’s contingent liability limit will be raised from $30 billion to $45 billion, allowing EDC to take on more insurance and guarantees if there is an increase in demand. |
| |
| 4 | | The Canada Account portfolio limit will be raised from $13 billion to $20 billion. |
37. Reclassification of Comparative Figures
Certain 2007 comparative figures have been reclassified to conform to the presentation adopted in 2008.
EDC Annual Report 2008 | 113
Ten-Year Review
Balance Sheet
| | | | | | | | | | | | | |
| as at December 31 | �� | | | | | | | | |
| (in millions of Canadian dollars) | | 2008 | | | 2007 | | | 2006 | |
| |
| Gross loans receivable* | | | 30,898 | | | | 19,108 | | | | 19,581 | |
| Less: non-accrued capitalized interest | | | (375 | ) | | | (351 | ) | | | (492 | ) |
| Less: allowance for losses on loans | | | (1,928 | ) | | | (1,316 | ) | | | (1,674 | ) |
| Less: deferred loan revenue | | | (314 | ) | | | (238 | ) | | | (333 | ) |
| Risk mitigation insurer’s share of loan allowance | | | — | | | | — | | | | 61 | |
| |
| | | | 28,281 | | | | 17,203 | | | | 17,143 | |
| Equipment available for lease | | | 334 | | | | 372 | | | | 233 | |
| Net investment in capital leases | | | 142 | | | | 122 | | | | — | |
| Equity financing designated as held-for-trading | | | 150 | | | | 95 | | | | 58 | |
| Cash and marketable securities | | | 3,843 | | | | 2,528 | | | | 3,353 | |
| Reinsurers’ share of allowance for claims | | | 157 | | | | 88 | | | | 67 | |
| Property, plant and equipment | | | 15 | | | | 7 | | | | 7 | |
| Intangible assets | | | 36 | | | | 32 | | | | 28 | |
| Other assets | | | 2,298 | | | | 2,642 | | | | 1,936 | |
| |
| Total assets | | $ | 35,256 | | | $ | 23,089 | | | $ | 22,825 | |
| |
| | | | | | | | | | | | | |
| Loans payable | | | 25,882 | | | | 15,583 | | | | 15,140 | |
| Other liabilities | | | 1,696 | | | | 444 | | | | 859 | |
| Allowance for losses on loan commitments and guarantees | | | 807 | | | | 564 | | | | 394 | |
| Allowance for claims on insurance | | | 755 | | | | 474 | | | | 446 | |
| |
| Total liabilities | | | 29,140 | | | | 17,065 | | | | 16,839 | |
| |
| Share capital | | | 983 | | | | 983 | | | | 983 | |
| Retained earnings | | | 5,077 | | | | 5,121 | | | | 5,003 | |
| Accumulated other comprehensive loss (income) | | | 56 | | | | (80 | ) | | | — | |
| |
| Shareholder’s equity | | | 6,116 | | | | 6,024 | | | | 5,986 | |
| |
| Total liabilities and shareholder’s equity | | $ | 35,256 | | | $ | 23,089 | | | $ | 22,825 | |
| |
| | |
| * | | Equity financing is included in gross loans receivable prior to 2003 |
Statement of Income
| | | | | | | | | | | | | |
| for the year ended December 31 | | | | | | | | | |
| (in millions of Canadian dollars) | | 2008 | | | 2007 | | | 2006 | |
| |
| Financing and investment revenue: | | | | | | | | | | | | |
| Loan | | | 1,350 | | | | 1,405 | | | | 1,174 | |
| Capital lease | | | 9 | | | | 8 | | | | — | |
| Operating lease | | | 43 | | | | 37 | | | | 4 | |
| Debt relief | | | — | | | | 1 | | | | 261 | |
| Investment | | | 81 | | | | 123 | | | | 123 | |
| |
| | | | 1,483 | | | | 1,574 | | | | 1,562 | |
| Interest expense | | | 611 | | | | 717 | | | | 628 | |
| Leasing and financing related expenses | | | 38 | | | | 46 | | | | 19 | |
| |
| Net financing and investment income | | | 834 | | | | 811 | | | | 915 | |
| | | | | | | | | | | | | |
| Loan guarantee fees | | | 19 | | | | 14 | | | | 12 | |
| Insurance premiums and guarantee fees | | | 172 | | | | 149 | | | | 147 | |
| Other income (expense) | | | (11 | ) | | | 46 | | | | 9 | |
| |
| | | | 1,014 | | | | 1,020 | | | | 1,083 | |
| | | | | | | | | | | | | |
| Provision for (reversal of) credit losses | | | 346 | | | | 196 | | | | (301 | ) |
| Claims-related expenses | | | 222 | | | | 132 | | | | (75 | ) |
| Administrative expenses | | | 240 | | | | 219 | | | | 203 | |
| |
| Income before unrealized fair value adjustment | | | 206 | | | | 473 | | | | 1,256 | |
| Unrealized fair value adjustment | | | — | | | | — | | | | (34 | ) |
| |
| Net income | | $ | 206 | | | $ | 473 | | | $ | 1,222 | |
| |
114 | Managing Risk. Maximizing Opportunities.
Ten-Year Review
| | | | | | | | | | | | | | | | | | | | | | | | | | | | | |
| | | 2005 | | | 2004 | | | 2003 | | | 2002 | | | 2001 | | | 2000 | | | 1999 | |
| |
| | | | 17,306 | | | | 19,419 | | | | 21,459 | | | | 26,341 | | | | 25,226 | | | | 22,023 | | | | 18,598 | |
| | | | (806 | ) | | | (1,027 | ) | | | (1,211 | ) | | | (1,426 | ) | | | (1,241 | ) | | | (1,165 | ) | | | (1,182 | ) |
| | | | (2,148 | ) | | | (2,674 | ) | | | (3,290 | ) | | | (3,613 | ) | | | (2,892 | ) | | | (2,700 | ) | | | (2,324 | ) |
| | | | (247 | ) | | | (262 | ) | | | (276 | ) | | | (292 | ) | | | (267 | ) | | | (272 | ) | | | (248 | ) |
| | | | 124 | | | | — | | | | — | | | | — | | | | — | | | | — | | | | — | |
| |
| | | | 14,229 | | | | 15,456 | | | | 16,682 | | | | 21,010 | | | | 20,826 | | | | 17,886 | | | | 14,844 | |
| | | | 114 | | | | — | | | | — | | | | — | | | | — | | | | — | | | | — | |
| | | | — | | | | — | | | | — | | | | — | | | | — | | | | — | | | | — | |
| | | | 44 | | | | 44 | | | | 40 | | | | — | | | | — | | | | — | | | | — | |
| | | | 3,263 | | | | 2,894 | | | | 2,576 | | | | 2,908 | | | | 2,355 | | | | 2,375 | | | | 3,442 | |
| | | | 40 | | | | 59 | | | | 120 | | | | 195 | | | | 179 | | | | 48 | | | | 21 | |
| | | | 9 | | | | 10 | | | | 13 | | | | 20 | | | | 25 | | | | 16 | | | | 18 | |
| | | | 31 | | | | 37 | | | | 44 | | | | 43 | | | | 34 | | | | 24 | | | | 19 | |
| | | | 1,999 | | | | 2,250 | | | | 1,682 | | | | 573 | | | | 553 | | | | 689 | | | | 1,191 | |
| |
| | | $ | 19,729 | | | $ | 20,750 | | | $ | 21,157 | | | $ | 24,749 | | | $ | 23,972 | | | $ | 21,038 | | | $ | 19,535 | |
| |
| | | | | | | | | | | | | | | | | | | | | | | | | | | | | |
| | | | 13,424 | | | | 15,545 | | | | 17,325 | | | | 20,828 | | | | 19,609 | | | | 17,583 | | | | 16,325 | |
| | | | 650 | | | | 732 | | | | 533 | | | | 812 | | | | 1,082 | | | | 846 | | | | 937 | |
| | | | 355 | | | | 448 | | | | 472 | | | | 377 | | | | 588 | | | | 130 | | | | 115 | |
| | | | 536 | | | | 548 | | | | 592 | | | | 655 | | | | 643 | | | | 487 | | | | 360 | |
| |
| | | | 14,965 | | | | 17,273 | | | | 18,922 | | | | 22,672 | | | | 21,922 | | | | 19,046 | | | | 17,737 | |
| |
| | | | 983 | | | | 983 | | | | 983 | | | | 983 | | | | 983 | | | | 983 | | | | 983 | |
| | | | 3,781 | | | | 2,494 | | | | 1,252 | | | | 1,094 | | | | 1,067 | | | | 1,009 | | | | 815 | |
| | | | — | | | | — | | | | — | | | | — | | | | — | | | | — | | | | — | |
| |
| | | | 4,764 | | | | 3,477 | | | | 2,235 | | | | 2,077 | | | | 2,050 | | | | 1,992 | | | | 1,798 | |
| |
| | | $ | 19,729 | | | $ | 20,750 | | | $ | 21,157 | | | $ | 24,749 | | | $ | 23,972 | | | $ | 21,038 | | | $ | 19,535 | |
| |
| | | | | | | | | | | | | | | | | | | | | | | | | | | | | |
| | | 2005 | | | 2004 | | | 2003 | | | 2002 | | | 2001 | | | 2000 | | | 1999 | |
| |
| | | | 1,155 | | | | 1,148 | | | | 1,249 | | | | 1,400 | | | | 1,618 | | | | 1,578 | | | | 1,256 | |
| | | | — | | | | — | | | | — | | | | — | | | | — | | | | — | | | | — | |
| | | | — | | | | — | | | | — | | | | — | | | | — | | | | — | | | | — | |
| | | | 64 | | | | 43 | | | | 56 | | | | 96 | | | | 1 | | | | — | | | | 2 | |
| | | | 123 | | | | 63 | | | | 60 | | | | 69 | | | | 127 | | | | 197 | | | | 146 | |
| |
| | | | 1,342 | | | | 1,254 | | | | 1,365 | | | | 1,565 | | | | 1,746 | | | | 1,775 | | | | 1,404 | |
| | | | 494 | | | | 345 | | | | 404 | | | | 583 | | | | 934 | | | | 1,068 | | | | 784 | |
| | | | — | | | | — | | | | — | | | | — | | | | — | | | | — | | | | — | |
| |
| | | | 848 | | | | 909 | | | | 961 | | | | 982 | | | | 812 | | | | 707 | | | | 620 | |
| | | | | | | | | | | | | | | | | | | | | | | | | | | | | |
| | | | 9 | | | | 8 | | | | 7 | | | | 9 | | | | 8 | | | | 7 | | | | 8 | |
| | | | 147 | | | | 153 | | | | 140 | | | | 138 | | | | 126 | | | | 137 | | | | 125 | |
| | | | — | | | | (7 | ) | | | 7 | | | | 7 | | | | 2 | | | | 9 | | | | (12 | ) |
| |
| | | | 1,004 | | | | 1,063 | | | | 1,115 | | | | 1,136 | | | | 948 | | | | 860 | | | | 741 | |
| | | | (554 | ) | | | (312 | ) | | | 644 | | | | 725 | | | | 658 | | | | 391 | | | | 390 | |
| | | | 41 | | | | 98 | | | | 140 | | | | 115 | | | | 83 | | | | 158 | | | | 133 | |
| | | | 182 | | | | 178 | | | | 173 | | | | 174 | | | | 149 | | | | 117 | | | | 100 | |
| |
| | | | 1,335 | | | | 1,099 | | | | 158 | | | | 122 | | | | 58 | | | | 194 | | | | 118 | |
| | | | (48 | ) | | | 143 | | | | — | | | | — | | | | — | | | | — | | | | — | |
| |
| | | $ | 1,287 | | | $ | 1,242 | | | $ | 158 | | | $ | 122 | | | $ | 58 | | | $ | 194 | | | $ | 118 | |
| |
EDC Annual Report 2008 | 115
Ten-Year Review
Corporate Account
Financial Arrangements Facilitated
| | | | | | | | | | | | | |
| (in millions of Canadian dollars) | | 2008 | | | 2007 | | | 2006 | |
| |
Export Financing | | | | | | | | | | | | |
| Direct financing | | | 14,001 | | | | 12,584 | | | | 9,978 | |
| |
| | | | | | | | | | | | | |
Export Insurance | | | | | | | | | | | | |
Credit insurance(1) | | | 61,428 | | | | 47,437 | | | | 42,916 | |
| Contract insurance and bonding | | | 3,821 | | | | 3,935 | | | | 5,494 | |
Political risk insurance(2) | | | 2,432 | | | | 2,989 | | | | 4,845 | |
| Guarantees | | | 4,137 | | | | 3,077 | | | | 2,858 | |
| |
| Subtotal | | | 71,818 | | | | 57,438 | | | | 56,113 | |
| |
| Total | | $ | 85,819 | | | $ | 70,022 | | | $ | 66,091 | |
| |
Domestic insurance not included above | | $ | 74 | | | $ | 219 | | | $ | 2,355 | |
| |
| | | | | | | | | | | | | |
Financial and Other Data | | | | | | | | | | | | |
| | | | | | | | | | | | | |
Export Financing (in millions of Canadian dollars) | | | | | | | | | | | | |
| Value of total obligations on loans receivable | | | 30,898 | | | | 19,108 | | | | 19,581 | |
| Value of total obligations on equity | | | 150 | | | | 95 | | | | 58 | |
Value of undisbursed loans(3) | | | 8,024 | | | | 6,096 | | | | 3,913 | |
| Value of undisbursed equity | | | 279 | | | | 143 | | | | 85 | |
| Value of disbursements | | | 13,420 | | | | 10,028 | | | | 8,343 | |
| Value of liability on loan guarantees | | | 3,512 | | | | 2,549 | | | | 2,442 | |
| Undisbursed amounts on loan guarantees | | | 553 | | | | 418 | | | | 537 | |
| Amounts available for allocation | | | 509 | | | | 2,373 | | | | 2,607 | |
| Loan amounts rescheduled | | | — | | | | 2 | | | | 251 | |
| Loan amounts written off | | | 5 | | | | 21 | | | | 6 | |
| |
| Number of transactions financed | | | 1,266 | | | | 1,175 | | | | 1,065 | |
| Number of current lines of credit and protocols | | | 72 | | | | 65 | | | | 69 | |
| |
| | | | | | | | | | | | | |
Export Insurance (in millions of Canadian dollars) | | | | | | | | | | | | |
Value of liability on insurance and guarantees(4) | | | 24,175 | | | | 17,609 | | | | 16,299 | |
| Value of claims paid | | | 104 | | | | 60 | | | | 59 | |
| Value of claims recovered | | | 24 | | | | 15 | | | | 38 | |
| Value of claims outstanding at end of year | | | 266 | | | | 171 | | | | 199 | |
| Value of claims under consideration at end of year | | | 32 | | | | 5 | | | | 17 | |
| |
| Number of policies issued | | | 10,120 | | | | 9,708 | | | | 10,458 | |
| Number of insurance policies and guarantees in force | | | 9,328 | | | | 9,330 | | | | 9,104 | |
| |
Average employee strength during the year | | | 1,063 | | | | 1,073 | | | | 1,038 | |
| |
| | |
| (1) | | Excludes domestic insurance. Figures prior to 2007 were not restated to reflect current presentation. |
| |
| (2) | | Figures prior to 2007 were not restated to reflect current presentation. |
| |
| (3) | | Includes equity prior to 2006. |
| |
| (4) | | Figures prior to 2002 were not restated to reflect current presentation as the information was not reasonably determinable. |
116 | Managing Risk. Maximizing Opportunities.
Ten-Year Review
| | | | | | | | | | | | | | | | | | | | | | | | | | | | | |
| | | 2005 | | | 2004 | | | 2003 | | | 2002 | | | 2001 | | | 2000 | | | 1999 | |
| |
| | | | 5,091 | | | | 6,152 | | | | 5,939 | | | | 7,381 | | | | 8,419 | | | | 7,657 | | | | 6,060 | |
| |
| | | | | | | | | | | | | | | | | | | | | | | | | | | | | |
| | | | 41,565 | | | | 40,177 | | | | 37,267 | | | | 34,532 | | | | 26,776 | | | | 25,807 | | | | 23,792 | |
| | | | 4,566 | | | | 3,450 | | | | 4,078 | | | | 5,128 | | | | 4,488 | | | | 3,913 | | | | 3,494 | |
| | | | 3,892 | | | | 3,501 | | | | 3,332 | | | | 3,510 | | | | 4,067 | | | | 3,167 | | | | 2,420 | |
| | | | 2,330 | | | | 1,623 | | | | 1,244 | | | | 689 | | | | 597 | | | | 325 | | | | 456 | |
| |
| | | | 52,353 | | | | 48,751 | | | | 45,921 | | | | 43,859 | | | | 35,928 | | | | 33,212 | | | | 30,162 | |
| |
| | | $ | 57,444 | | | $ | 54,903 | | | $ | 51,860 | | | $ | 51,240 | | | $ | 44,347 | | | $ | 40,869 | | | $ | 36,222 | |
| |
| | | $ | 5,412 | | | $ | 4,899 | | | $ | 1,791 | | | $ | 298 | | | $ | 1,157 | | | $ | 3,996 | | | $ | 3,833 | |
| |
| | | | | | | | | | | | | | | | | | | | | | | | | | | | | |
| | | | 17,306 | | | | 19,419 | | | | 21,459 | | | | 26,341 | | | | 25,226 | | | | 22,023 | | | | 18,598 | |
| | | | 44 | | | | 44 | | | | 40 | | | | — | | | | — | | | | — | | | | — | |
| | | | 2,994 | | | | 2,794 | | | | 3,040 | | | | 3,512 | | | | 4,938 | | | | 4,825 | | | | 5,345 | |
| | | | — | | | | — | | | | — | | | | — | | | | — | | | | — | | | | — | |
| | | | 4,574 | | | | 4,172 | | | | 4,194 | | | | 6,028 | | | | 8,085 | | | | 7,210 | | | | 6,374 | |
| | | | 1,470 | | | | 1,909 | | | | 1,820 | | | | 2,699 | | | | 2,212 | | | | 1,795 | | | | 1,643 | |
| | | | 1,004 | | | | 820 | | | | 509 | | | | 299 | | | | 355 | | | | 112 | | | | 123 | |
| | | | 2,550 | | | | 1,682 | | | | 1,732 | | | | 1,655 | | | | 1,476 | | | | 1,176 | | | | 1,659 | |
| | | | 128 | | | | 64 | | | | 232 | | | | 775 | | | | 290 | | | | 264 | | | | 720 | |
| | | | 39 | | | | 81 | | | | 113 | | | | 194 | | | | 191 | | | | 105 | | | | — | |
| |
| | | | 735 | | | | 635 | | | | 571 | | | | 397 | | | | 556 | | | | 458 | | | | 372 | |
| | | | 60 | | | | 47 | | | | 61 | | | | 47 | | | | 40 | | | | 44 | | | | 55 | |
| |
| | | | | | | | | | | | | | | | | | | | | | | | | | | | | |
| | | | 14,060 | | | | 12,175 | | | | 11,468 | | | | 12,265 | | | | 11,944 | | | | 12,495 | | | | 10,955 | |
| | | | 46 | | | | 68 | | | | 80 | | | | 143 | | | | 141 | | | | 83 | | | | 138 | |
| | | | 32 | | | | 25 | | | | 31 | | | | 39 | | | | 50 | | | | 31 | | | | 15 | |
| | | | 221 | | | | 261 | | | | 282 | | | | 344 | | | | 298 | | | | 246 | | | | 234 | |
| | | | 25 | | | | 38 | | | | 52 | | | | 35 | | | | 48 | | | | 36 | | | | 38 | |
| |
| | | | 10,427 | | | | 10,756 | | | | 10,184 | | | | 6,351 | | | | 5,090 | | | | 3,951 | | | | 3,879 | |
| | | | 8,748 | | | | 8,209 | | | | 7,491 | | | | 6,968 | | | | 6,002 | | | | 5,187 | | | | 4,873 | |
| |
| | | | 1,002 | | | | 994 | | | | 1,003 | | | | 992 | | | | 939 | | | | 838 | | | | 778 | |
| |
EDC Annual Report 2008 | 117
Ten-Year Review
Canada Account
Financial Arrangements Facilitated
| | | | | | | | | | | | | |
| (in millions of Canadian dollars) | | 2008 | | | 2007 | | | 2006 | |
| |
Export Financing | | | | | | | | | | | | |
| Direct financing | | | — | | | | 27 | * | | | 3,645 | * |
| |
| | | | | | | | | | | | | |
Export Insurance | | | | | | | | | | | | |
| Credit insurance | | | — | | | | — | | | | — | |
| Contract insurance and bonding | | | — | | | | — | | | | — | |
| Political risk insurance | | | — | | | | — | | | | — | |
| Guarantees | | | — | | | | — | | | | — | |
| |
| Subtotal | | | — | | | | — | | | | — | |
| |
| Total | | $ | — | | | $ | 27 | * | | $ | 3,645 | * |
| |
| | | | | | | | | | | | | |
Financial And Other Data | | | | | | | | | | | | |
| | | | | | | | | | | | | |
Export Financing (in millions of Canadian dollars) | | | | | | | | | | | | |
| Value of total obligations on loans receivable | | | 3,226 | | | | 2,765 | | | | 3,592 | * |
| Value of undisbursed loans | | | 1 | | | | 2 | | | | 1,516 | * |
| Value of loan disbursements (net of guarantees) | | | — | | | | 31 | * | | | 3,647 | * |
| Value of liability on loan guarantees | | | 457 | | | | 462 | | | | 535 | |
| Undisbursed amounts on loan guarantees | | | — | | | | — | | | | 15 | |
| Amounts available for allocation | | | — | | | | — | | | | — | |
| Loan amounts rescheduled | | | — | | | | — | | | | 15 | |
| |
| Number of transactions financed | | | — | | | | 27 | * | | | 803 | * |
| Number of current lines of credit and protocols | | | — | | | | — | | | | — | |
| |
| | | | | | | | | | | | | |
Export Insurance (in millions of Canadian dollars) | | | | | | | | | | | | |
| Value of liability on insurance and guarantees | | | — | | | | — | | | | — | |
| Value of claims paid | | | — | | | | — | | | | — | |
| Value of claims recovered | | | 15 | | | | 8 | | | | — | |
| Value of claims outstanding at end of year | | | 22 | | | | 35 | | | | 44 | |
| |
| Number of policies issued | | | — | | | | — | | | | — | |
| Number of insurance policies and guarantees in force | | | — | | | | — | | | | — | |
| |
| | |
| * | | Includes activity pursuant to the Softwood Lumber deposit refund mechanism transactions. |
118 | Managing Risk. Maximizing Opportunities.
Ten-Year Review
| | | | | | | | | | | | | | | | | | | | | | | | | | | | | |
| | | 2005 | | | 2004 | | | 2003 | | | 2002 | | | 2001 | | | 2000 | | | 1999 | |
| |
| | | | 649 | | | | 987 | | | | 1,209 | | | | 527 | | | | 135 | | | | 38 | | | | 67 | |
| |
| | | | — | | | | — | | | | 1 | | | | 1 | | | | — | | | | — | | | | — | |
| | | | — | | | | — | | | | — | | | | — | | | | 9 | | | | 1 | | | | 23 | |
| | | | — | | | | — | | | | — | | | | 5 | | | | 7 | | | | 223 | | | | 224 | |
| | | | — | | | | — | | | | — | | | | — | | | | — | | | | — | | | | — | |
| |
| | | | — | | | | — | | | | 1 | | | | 6 | | | | 16 | | | | 224 | | | | 247 | |
| |
| | | $ | 649 | | | $ | 987 | | | $ | 1,210 | | | $ | 533 | | | $ | 151 | | | $ | 262 | | | $ | 314 | |
| |
| | | | | | | | | | | | | | | | | | | | | | | | | | | | | |
| | | | 3,994 | | | | 3,786 | | | | 3,219 | | | | 2,968 | | | | 2,682 | | | | 2,490 | | | | 2,599 | |
| | | | 1,526 | | | | 2,368 | | | | 3,303 | | | | 5,123 | | | | 101 | | | | 141 | | | | 183 | |
| | | | 650 | | | | 1,020 | | | | 981 | | | | 533 | | | | 203 | | | | 76 | | | | 66 | |
| | | | 1,311 | | | | 1,341 | | | | 1,486 | | | | 1,968 | | | | 1,747 | | | | 1,358 | | | | 1,140 | |
| | | | 59 | | | | 145 | | | | 225 | | | | 195 | | | | 334 | | | | 603 | | | | 908 | |
| | | | 39 | | | | 52 | | | | 61 | | | | 109 | | | | 88 | | | | 73 | | | | 73 | |
| | | | 41 | | | | 6 | | | | 31 | | | | 25 | | | | 43 | | | | 3 | | | | 45 | |
| |
| | | | 37 | | | | 55 | | | | 45 | | | | 28 | | | | 8 | | | | 11 | | | | 12 | |
| | | | 1 | | | | 2 | | | | 2 | | | | 2 | | | | 2 | | | | 3 | | | | 2 | |
| |
| | | | | | | | | | | | | | | | | | | | | | | | | | | | | |
| | | | — | | | | — | | | | — | | | | 4 | | | | 56 | | | | 170 | | | | 199 | |
| | | | — | | | | — | | | | — | | | | — | | | | — | | | | — | | | | 8 | |
| | | | — | | | | — | | | | — | | | | — | | | | — | | | | — | | | | — | |
| | | | 44 | | | | 44 | | | | 45 | | | | 47 | | | | 47 | | | | 46 | | | | 46 | |
| |
| | | | — | | | | — | | | | 2 | | | | 1 | | | | 1 | | | | 1 | | | | 4 | |
| | | | — | | | | — | | | | — | | | | 1 | | | | 4 | | | | 5 | | | | 20 | |
| |
EDC Annual Report 2008 | 119
| Glossary of Financial Terms |
Glossary of Financial Terms
Actuarial Gains and Losses – Changes in the value of the accrued benefit obligation and the plan assets resulting from actual results differing from those assumed or changes in an actuarial assumption.
Actuarial Valuation (re: Employee Benefit Plans) – An assessment of the financial status of a benefit plan performed by an independent actuary. It includes the valuation of any plan assets and the accrued benefit obligation using estimates of future events that will affect the costs and obligation for employee future benefits.
Amortized Cost – The amount at which the financial asset or financial liability is measured at initial recognition minus principal repayments, plus or minus the cumulative amortization using the effective interest method of any difference between that initial amount and the maturity amount, and minus any reduction (directly or through the use of an allowance account) for impairment or uncollectability.
Basis Point – One one-hundredth of a percentage point.
Canadian GAAP – Canadian generally accepted accounting principles.
Contingent Liability – Potential debt which may become an actual financial obligation if certain events occur or fail to occur. Contingent liability is also referred to as insurance policies and guarantees outstanding.
Credit Risk – Credit risk is the possibility that a loss may be incurred if a counterparty fails to meet its financial commitments.
Derivative Financial Instruments – Financial contracts that derive their value from changes in interest rates, foreign exchange rates, credit spreads, commodity prices, equities, market indexes or other financial measures. Such instruments include futures, interest rate, foreign exchange, equity, commodity and credit derivative contracts.
Effective Interest Rate – The rate that exactly discounts estimated future cash payments or receipts through the expected life of the financial instrument or, when appropriate, a shorter period, to the net carrying amount of the financial asset or financial liability.
Facultative Reinsurance – Reinsurance provided on a transactional basis.
Fair Value – The amount of the consideration that would be agreed upon in an arm’s length transaction between knowledgeable, willing parties who are under no compulsion to act.
Financial Sustainability Ratio – Net income excluding debt relief, provision for credit losses and claims-related expenses as a percentage of the year’s average capital and allowances. This ratio provides a measure of the generation of cash from operations relative to capital and allowances.
Foreign Exchange Risk – Foreign exchange risk is the possibility that a loss may result from exchange rate movements.
Gross Administrative Expenses – Administrative expenses before accounting for recovery of expenses related to Canada Account transactions.
Gross Efficiency Ratio – Gross administrative expenses expressed as a percentage of net revenue excluding debt relief.
Gross Loans Receivable – Principal amounts outstanding, including any non-accrued capitalized interest, under existing loan agreements.
Hedge – A risk management practice used to manage interest rate or foreign exchange exposures arising from the normal course of business operations.
Impaired Loans – Loans where, in management’s opinion, there has been a deterioration of credit quality to the extent that the Corporation no longer has reasonable assurance as to the timely collection of the full amount of principal and interest.
Interest Rate Risk – Interest rate risk is the potential impact on the Corporation due to changes in interest rates.
LIBOR – London Inter-Bank Offered Rate – The interest rate at which banks in London are prepared to lend funds to first-class banks.
Liquidity Risk – Liquidity risk is the chance that funds will not be available to meet the Corporation’s obligations.
Market Risk – Market risk is the risk that the fair value or future cash flows of a financial instrument will fluctuate because of changes in market prices. Market risk comprises three types of risk: foreign exchange risk, interest rate risk, and other price risk.
Net Financing and Investment Income – Revenue earned on leasing and financing assets, less interest and leasing and financing related expenses.
Net Margin – Net financing and investment income expressed as a percentage of average assets employed.
Net Revenue – Net income excluding the provision for credit losses, claims-related expenses and administrative expenses.
Operational Risk – Operational risk is the potential loss that may result from human error, internal control weaknesses and system deficiencies.
Projected Benefit Method Pro Rated on Services – An actuarial valuation method in which an equal portion of the total estimated future benefit is attributed to each year of service.
Projected Benefit Obligation – The actuarial present value of benefits attributed to employee services rendered to a particular date.
Return on Equity – Net income expressed as a percentage of shareholder’s equity.
Undisbursed Loan Commitments – A contractual amount under an existing loan agreement that has yet to be advanced to the borrower.
Variable Interest Entities (VIEs) – VIEs are entities in which equity investors do not have the characteristics of a controlling financial interest or do not have sufficient equity at risk for the entity to finance its activities without additional subordinate financial support from other parties.
120 | Managing Risk. Maximizing Opportunities.
CORPORATE REPRESENTATION
National
Head Office
Export Development Canada
151 O’Connor Street
Ottawa, Ontario
K1A 1K3
Tel.: (613) 598-2500
Fax: (613) 237-2690
Web site: www.edc.ca
Vancouver
1055 Dunsmuir Street
Suite 400, Bentall Four
PO Box 49086
Vancouver, British Columbia
V7X 1G4
Tel.: (604) 638-6950
Fax: (604) 638-6955
Edmonton
Suite 1000
10180 – 101 Street
Edmonton, Alberta
T5J 3S4
Tel.: (780) 702-5233
Fax: (780) 702-5235
Calgary
Home Oil Tower
Suite 606
324 – 8th Avenue S.W.
Calgary, Alberta
T2P 2Z2
Tel.: (403) 537-9800
Fax: (403) 537-9811
Regina
Suite 300
1914 Hamilton Street
Regina, Saskatchewan
S4P 3N6
Tel.: (306) 586-1727
Fax: (306) 586-1725
Winnipeg
Commodity Exchange Tower
Suite 2075
360 Main Street
Winnipeg, Manitoba
R3C 3Z3
Tel.: (204) 975-5090
Fax: (204) 975-5094
London
Suite 1512
148 Fullarton Street
London, Ontario
N6A 5P3
Tel.: (519) 963-5400
Fax: (519) 963-5407
Mississauga
Suite 805
1 City Centre Drive
Mississauga, Ontario
L5B 1M2
Tel.: (905) 366-0300
Fax: (905) 366-0332
Toronto
Suite 810
150 York Street
P. O. Box 810
Toronto, Ontario
M5H 3S5
Tel.: (416) 640-7600
Fax: (416) 862-1267
Windsor
3270 Electricity Drive
Suite 209
Walker Industrial Park
Windsor, Ontario
N8W 5J1
Tel.: (519) 974-7674
Fax: (519) 974-9753
Montreal
Tour de la Bourse
Suite 4520
800 Victoria Square
P.O. Box 124
Montreal, Quebec
H4Z 1C3
Tel.: (514) 908-9200
Fax: (514) 878-9891
Quebec City
Suite 1340
2875 Laurier Boulevard
Ste-Foy, Quebec
G1V 2M2
Tel.: (418) 266-6130
Fax: (418) 266-6131
Moncton
Suite 400
735 Main Street
Moncton, New Brunswick
E1C 1E5
Tel.: (506) 851-6066
Fax: (506) 851-6406
Halifax
Suite 1605
1969 Upper Water Street,
Tower 2
Halifax, Nova Scotia
B3J 3R7
Tel.: (902) 442-5205
Fax: (902) 442-5204
St. John’s
90 O’Leary Avenue
First Floor
St. John’s, Newfoundland
A1B 2C7
Tel.: (709) 772-8808
Fax: (709) 772-8693
International
Brazil and Southern Cone
c/o The Consulate General of Canada
in São Paulo
Av. das Nações Unidas, 12901
Cenu Torre Norte, 16º Andar
CEP 04578-000, São Paulo – SP
Brazil
Tel.: (011)-5511-5509-4320, ext. 3320
Fax: (011)-5511-5509-4275
c/o The Consulate General of Canada
in Rio de Janeiro
Av. Atlântica, 1130-5º Andar
Copacabana 22021-000
Rio de Janeiro, RJ
Brazil
Tel.: (011)-5521-2295-0391
Fax: (011)-5521-2275-5735
Chile
c/o The Embassy of Canada in Chile
Nueva Tajamar 481 — Piso 12,
Torre Norte (Edificio World Trade Center)
Santiago, Chile
Tel: (011)-56-2-652-3807
Fax: (011)-56-2-652-3803
India
c/o The High Commission of Canada,
New Delhi
7/8 Shantipath, Chanakyapuri
New Delhi 110 021
India
Tel.: (011)-91-11- 4178-2000, ext. 3660
Tel. (Dir): (011) 91-11-4178-2603
Fax: (011)-91-11- 4178-2607
c/o Consulate General of Canada, Mumbai
6th Floor, Fort House
221, Dr. D.N. Road
Mumbai 400 001, India
Tel. (Dir): (011)-91-22-6749-4480
Fax: (011)-91-22-6749-4481
Mexico
c/o The Embassy of Canada in Mexico City
Schiller 529, Col Bosque de Chapultepec
Del. Miguel Hidalgo
México, D.F. 11580
México
Tel.: (011)-5255-5387-9316
Fax: (011)-5255-5387-9317
c/o The Consulate General of Canada
in Monterrey
Edificio Kalos
Piso C-1, Local 108-A
Zaragoza 1300 Sur y Constitución
Monterrey, Nuevo León 64000
México
Tel.: (011)-52-81-8344-3200, ext. 3360
Fax: (011)-52-81-8340-7703
People’s Republic of China
c/o The Embassy of Canada to the
People’s Republic of China
19 Dongzhimenwai Dajie
Chao Yang District
Beijing, 100600
People’s Republic of China
Tel.: (011)-86-10-5139-4126
Fax: (011)-86-10-5139-4463
c/o The Consulate General of Canada
in Shanghai
West Tower, Suite 604
1376 Nanjing Xi Lu
Shanghai, 200040
People’s Republic of China
Tel.: (011)-86-21-3279-2832
Fax: (011)-86-21-3279-2837
Peru
c/o The Embassy of Canada in Peru
Calle Bolognesi 228, Miraflores
Lima 18, Peru
Tel.: (011)-51-1-319-3200
Fax: (011)-51-1-446-4912
Poland
c/o The Embassy of Canada to Poland
ul. Jana Matejki 1/5
00-481 Warsaw
Poland
Tel.: (011)-48-22-584-3240
Fax: (011)-51-1-446-4912
Russia
c/o The Embassy of Canada in Russia
23 Starokonyushenny Pereulok
Moscow 119002
Russia
Tel: (011)-7-495-925-6095
Fax: (011)-7-495-925-5667
Singapore
c/o The High Commission of Canada
to Singapore
One George Street, #11-01
Singapore 049145
Tel.: (011)-65-6854-5949
Fax: (011)-65-6854-5848
United Arab Emirates
c/o The Canadian Embassy in Abu Dhabi
Abu Dhabi Trade Towers, West Tower
P.O. Box 6970
Abu Dhabi, United Arab Emirates
Tel.: (011)-971-2-694-0376
Fax: (011)-971-2-694-0389
| | | |
| Ce document existe | | Printed in Canada. |
| également en version | | Cover and pages 1 to 36 printed on Chorus Art Gloss. |
| française. | | Pages 37 to 120 printed on Rolland Opaque. |
VISION
EDC will be the recognized leader in providing groundbreaking commercial financial solutions to companies of all sizes, helping them succeed in the global marketplace and create enduring prosperity for Canada.
VALUES
People
We are the heart and soul of EDC. Our diversity enriches us all. Each one of us deserves respect and makes a difference. Working together is fundamental to our success.
Excellence
We are responsible for excellence in everything we do. We believe in personal accountability and the power of challenging the status quo.
Passion
Initiative and enthusiasm characterize the way we work. We take satisfaction in the quality of what we do. We are here because we want to be here.
Learning
We believe that learning is an invigorating and continuous process. We seek out and embrace personal and professional development, and the invaluable lessons that come from experience.
www.edc.ca