Exhibit 99(c)(2)
The Seibels Bruce Group, Inc. |
| CONFIDENTIAL |
11.06.03
PRESENTATION TO THE BOARD OF DIRECTORS
This presentation and its analyses are only for the use of the Board of Directors and are not intended to, nor should they be, relied upon by any other party, including shareholders of The Seibels Bruce Group, Inc. The consent of Capitalink is required prior to the disclosure to any third party of this presentation, its analyses, or of the assessments made by Capitalink. These materials are based solely on information contained in publicly available documents and certain other information provided to Capitalink by management and the Board of Directors. Capitalink has not attempted to investigate or verify the accuracy or completeness of such publicly available information or other information provided to Capitalink. Capitalink has relied upon the accuracy and completeness of such publicly available information and other information supplied to Capitalink. These materials are being furnished, and should be considered only in connection with, the oral presentation being provided by Capitalink in connection herewith. The preparation of these materials was completed on November 4, 2003 based on information publicly available or supplied to Capitalink through such date. Capitalink is not obligated to update this presentation or its analyses to reflect any information that becomes publicly available or that is provided to Capitalink after such date.
|
|
|


TABLE OF CONTENTS
|
|
|
|
|
|
|
|
2
TRANSACTION OVERVIEW
3
INTRODUCTION
• The Board of Directors of The Seibels Bruce Group, Inc. (“Seibels” or the “Company”) has retained Capitalink, L.C. (“Capitalink”) as financial advisor and to render an opinion as to the fairness, from a financial point of view, to the Company’s shareholders of a proposal by the Company to undertake a reverse stock split (the “Reverse Split”) in which all shareholders whose shares are converted into less than 1 share in the Reverse Split will receive a per share cash payment (the “Fractional Share Consideration”) (the Reverse Split and the Fractional Share Consideration are collectively the “Transaction”).
• As a result of the Transaction, it is anticipated that there will be less than 300 shareholders of record. Therefore, the Company intends to make the appropriate filings with the United States Securities and Exchange Commission (the “SEC”) and thereafter will no longer be required to file annual and periodic reports under the federal securities laws that are applicable to public companies. Additionally, the Company’s common stock will no longer be traded on the OTC Bulletin Board.
• As of November 4, 2003, there were 7,816,044 shares of the Company’s common stock outstanding.
• The closing price of the Company’s common stock on November 3, 2003 (date presentation materials completed) was $2.00.
4
TRANSACTION RATIONALE
• Public company costs are high:
• Costs associated with retaining public status, servicing shareholders and continuing public communication.
• Additional costs related to Sarbanes-Oxley, increasing D&O insurance expenses and audit costs.
• Time demands on management and employees associated with public status are significant:
• Investor relations and communications.
• Preparing public reports, filings, press releases and Regulation FD compliance.
• Shareholders are unable to benefit fully from public company status due to limited liquidity and micro-cap classification resulting in issues relating to:
• Shareholders ability to move into or out of large positions.
• The Company’s ability to use shares for acquisitions and raise capital in public markets.
• The Company’s attractiveness as an investment vehicle for institutional investors.
• Maintaining the status quo and continuing to bear public company costs do not present any tangible benefits.
• The Transaction provides several benefits:
• Reduces direct and indirect costs.
• Saves management and employee time.
• Small shareholders can exit their investment in the Company at a premium to current market prices.
• Small shareholders are able to sell without a commission.
• Small shareholders can retain ownership by acquiring additional shares.
5
BACKGROUND OF THE TRANSACTION
• At a meeting of the Company’s Board of Directors on May 7, 2003, the Board discussed generally the concept of going private and authorized one of its directors to undertake research on the topic and prepare a report for the Board.
• The Board’s interest in a going private transaction at that time was precipitated by the substantial new internal and external accounting requirements and procedures imposed by the Sarbanes-Oxley legislation that would be expected to have a direct impact on the Company’s 2003 audit. The Company had also received communications from both its securities counsel and accountants about the increased burdens, time and expense the new legislation and related regulations would be expected to impose on public companies.
• During Summer 2003, the Company received an unsolicited letter from an investment banking firm offering to make a presentation and consult with the Board about various possible transactions, including a going private transaction. The Board decided to accept the offered presentation and it was made on August 14, 2003. Based on the information presented at that meeting and consultations with the Company’s accountants and securities lawyers, the Board decided to pursue the possibility of a going private transaction further.
• The Board instructed management to contact other investment bankers and offer them the opportunity to make presentations and bid on offering advisory services. On September 4, 2003, Capitalink and one additional investment banker made presentations along with the original investment banker, and subsequently the Board retained Capitalink to advise it with respect to the Transaction and to render an opinion as to its fairness from a financial point of view.
6
SHAREHOLDER DISTRIBUTION ANALYSIS
• The shareholder distribution analysis provides the Company with data setting forth the number of record holders of its common stock at varying share distributions. The information provides the Board with information to determine the most appropriate ratio necessary to effectuate the Reverse Split in order to reduce the number of record holders to less than 300.
• Information is presented on both a record and beneficial ownership basis. Approximately 1,579,000 shares are owned by shareholders who have not provided the Company with specific shareholding data. Therefore, all beneficial shareholder distribution calculations are estimated.
• It is noted that shareholders owning less than 1,000 shares represent approximately 89.5% and 81.0% of record and beneficial shareholders, respectively, and such holders own approximately only 1.2% and 4.1%, respectively, of the Company’s common stock.
7
(Shares in thousands)
|
| Record Shareholders |
| Benefical Shareholders (1) |
| ||||||||||||||||||||
Share |
| Holders |
| Shares Owned |
| Holders |
| Shares Owned |
| ||||||||||||||||
Distribution |
| Number |
| Cumulative |
| Cum % |
| Number |
| Cumulative |
| Cum % |
| Number |
| Cumulative |
| Cum % |
| Number |
| Cumulative |
| Cum % |
|
|
|
|
|
|
|
|
|
|
|
|
|
|
|
|
|
|
|
|
|
|
|
|
|
|
|
0 - 99 |
| 546 |
| 546 |
| 59.1 | % | 14 |
| 14 |
| 0.2 | % | 920 |
| 920 |
| 39.0 | % | 29 |
| 29 |
| 0.4 | % |
100 - 249 |
| 154 |
| 700 |
| 75.8 | % | 24 |
| 38 |
| 0.5 | % | 463 |
| 1,383 |
| 58.7 | % | 69 |
| 98 |
| 1.2 | % |
250 - 499 |
| 81 |
| 781 |
| 84.5 | % | 26 |
| 64 |
| 0.8 | % | 331 |
| 1,714 |
| 72.7 | % | 101 |
| 198 |
| 2.5 | % |
500 - 749 |
| 31 |
| 812 |
| 87.9 | % | 17 |
| 81 |
| 1.0 | % | 144 |
| 1,858 |
| 78.8 | % | 80 |
| 278 |
| 3.6 | % |
750 - 999 |
| 15 |
| 827 |
| 89.5 | % | 12 |
| 93 |
| 1.2 | % | 52 |
| 1,910 |
| 81.0 | % | 41 |
| 319 |
| 4.1 | % |
1,000 - 1,999 |
| 32 |
| 859 |
| 93.0 | % | 43 |
| 137 |
| 1.7 | % | 196 |
| 2,106 |
| 89.3 | % | 232 |
| 552 |
| 7.1 | % |
2,000 - 2,999 |
| 5 |
| 864 |
| 93.5 | % | 11 |
| 148 |
| 1.9 | % | 81 |
| 2,187 |
| 92.7 | % | 177 |
| 728 |
| 9.3 | % |
3,000 - 3,999 |
| 5 |
| 869 |
| 94.0 | % | 16 |
| 164 |
| 2.1 | % | 32 |
| 2,219 |
| 94.1 | % | 102 |
| 831 |
| 10.6 | % |
4,000 - 4,999 |
| 2 |
| 871 |
| 94.3 | % | 10 |
| 173 |
| 2.2 | % | 19 |
| 2,238 |
| 94.9 | % | 81 |
| 912 |
| 11.7 | % |
5,000 - 9,999 |
| 13 |
| 884 |
| 95.7 | % | 83 |
| 256 |
| 3.3 | % | 48 |
| 2,286 |
| 96.9 | % | 288 |
| 1,200 |
| 15.4 | % |
10,000 - 19,999 |
| 8 |
| 892 |
| 96.5 | % | 114 |
| 370 |
| 4.7 | % | 35 |
| 2,321 |
| 98.4 | % | 433 |
| 1,633 |
| 20.9 | % |
20,000 - 29,999 |
| 2 |
| 894 |
| 96.8 | % | 53 |
| 423 |
| 5.4 | % | 5 |
| 2,326 |
| 98.6 | % | 122 |
| 1,755 |
| 22.5 | % |
30,000 - 39,999 |
| 4 |
| 898 |
| 97.2 | % | 142 |
| 565 |
| 7.2 | % | 4 |
| 2,330 |
| 98.8 | % | 138 |
| 1,893 |
| 24.2 | % |
40,000 - 49,999 |
| 1 |
| 899 |
| 97.3 | % | 42 |
| 606 |
| 7.8 | % | 4 |
| 2,334 |
| 99.0 | % | 165 |
| 2,057 |
| 26.3 | % |
50,000 - 74,999 |
| 9 |
| 908 |
| 98.3 | % | 578 |
| 1,185 |
| 15.2 | % | 7 |
| 2,341 |
| 99.3 | % | 434 |
| 2,492 |
| 31.9 | % |
75,000 - 99,999 |
| — |
| 908 |
| 98.3 | % | — |
| 1,185 |
| 15.2 | % | 3 |
| 2,344 |
| 99.4 | % | 258 |
| 2,749 |
| 35.2 | % |
100,000 - 249,999 |
| 9 |
| 917 |
| 99.2 | % | 1,300 |
| 2,485 |
| 31.8 | % | 6 |
| 2,350 |
| 99.7 | % | 900 |
| 3,650 |
| 46.7 | % |
250,000 - 499,999 |
| 4 |
| 921 |
| 99.7 | % | 1,279 |
| 3,764 |
| 48.2 | % | 5 |
| 2,355 |
| 99.9 | % | 1,352 |
| 5,002 |
| 64.0 | % |
500,000 - 999,999 |
| 1 |
| 922 |
| 99.8 | % | 894 |
| 4,658 |
| 59.6 | % | 1 |
| 2,356 |
| 99.9 | % | 529 |
| 5,531 |
| 70.8 | % |
1,000,000 > |
| 2 |
| 924 |
| 100.0 | % | 3,158 |
| 7,816 |
| 100.0 | % | 2 |
| 2,358 |
| 100.0 | % | 2,285 |
| 7,816 |
| 100.0 | % |
|
|
|
|
|
|
|
|
|
|
|
|
|
|
|
|
|
|
|
|
|
|
|
|
|
|
|
| 924 |
|
|
|
|
| 7,816 |
|
|
|
|
| 2,358 |
|
|
|
|
| 7,816 |
|
|
|
|
|
(1) Company stock benefit plan is included as one stockholder. In addition, may include shareholders with holdings in multiple accounts.
Sources of information: Company management, American Stock Transfer and CEDE.
8
PRO FORMA SHAREHOLDER AND FRACTIONAL SHARE CONSIDERATION ANALYSIS
• The pro forma shareholder analysis provides data at various split ratios and prices per share relating to (i) the estimated number of record holders remaining subsequent to the Transaction, (ii) the resulting fractional number of shares required to be purchased as part of the Transaction, and (iii) the expected aggregate cost of such Fractional Share Consideration.
9
($ and shares in thousands, except per share)
Reverse |
| Pro Forma Shareholders |
| Pro Forma |
| Pro Forma Aggregate Fractional Share Consideration (1) (2) |
| |||||||||||||||
Split |
| Record |
| Beneficial (1) (2) |
| Purchased (1) |
| $2.75 |
| $2.87 |
| $3.00 |
| $3.12 |
| $3.25 |
| |||||
|
|
|
|
|
|
|
|
|
|
|
|
|
|
|
|
|
| |||||
100 |
| 378 |
| 1,438 |
| 77 |
| $ | 212 |
| $ | 221 |
| $ | 231 |
| $ | 240 |
| $ | 250 |
|
250 |
| 224 |
| 975 |
| 154 |
| $ | 423 |
| $ | 441 |
| $ | 461 |
| $ | 480 |
| $ | 500 |
|
500 |
| 143 |
| 644 |
| 271 |
| $ | 745 |
| $ | 777 |
| $ | 812 |
| $ | 845 |
| $ | 880 |
|
750 |
| 112 |
| 500 |
| 428 |
| $ | 1,176 |
| $ | 1,228 |
| $ | 1,283 |
| $ | 1,335 |
| $ | 1,390 |
|
1,000 |
| 97 |
| 448 |
| 413 |
| $ | 1,135 |
| $ | 1,185 |
| $ | 1,238 |
| $ | 1,288 |
| $ | 1,341 |
|
2,000 |
| 65 |
| 252 |
| 696 |
| $ | 1,913 |
| $ | 1,997 |
| $ | 2,087 |
| $ | 2,171 |
| $ | 2,261 |
|
(1) Company stock benefit plan is included as one stockholder. In addition, may include shareholders with holdings in multiple accounts.
(2) Range of Fractional Share Consideration is based upon analyses provided hereafter.
Sources of information: Company management, American Stock Transfer and CEDE.
10
PRO FORMA BOOK VALUE AND EARNINGS PER SHARE ANALYSIS
• The pro forma book value analysis provides a range of pro forma net common book value and net tangible common book value per share at various split ratios and ranges of Fractional Share Consideration per share prices.
• It is noted that the minor movement of the net common book value per share subsequent to the Transaction (at both varying levels of the ratio in the Reverse Split and the range of the Fractional Share Consideration) is due to the large number of holders that maintain small shareholdings prior to the Transaction (see the shareholder distribution analysis).
• The pro forma earnings per share analysis provides a pro forma adjusted basic earnings per share (“EPS”) for the latest twelve month (“LTM”) period ended September 30, 2003 and the year ended December 31, 2002 at various split ratios.
11
($ and shares in thousands, except per share)
|
|
|
| Reverse Split |
| Pro Forma |
| Pro Forma Value Per Share at Fractional Share Consideration (1) (2) |
| ||||||||||||||
$ 2.75 |
| $ 2.87 |
| $ 3.00 |
| $ 3.12 |
| $ 3.25 | |||||||||||||||
|
|
|
|
|
|
|
|
|
|
|
|
|
|
|
|
|
| ||||||
Net Common Book Value as of Sept 30, 2003 |
|
|
|
|
|
|
|
|
|
|
|
|
|
|
|
|
| ||||||
|
|
|
|
|
|
|
|
|
|
|
|
|
|
|
|
|
| ||||||
Net Common Book Value |
| $ | 23,085 |
| 100 |
| 7,739 |
| $ | 2.96 |
| $ | 2.95 |
| $ | 2.95 |
| $ | 2.95 |
| $ | 2.95 |
|
Shares Outstanding |
| 7,816 |
| 250 |
| 7,662 |
| $ | 2.96 |
| $ | 2.96 |
| $ | 2.95 |
| $ | 2.95 |
| $ | 2.95 |
| |
Net Common Book Value per Share |
| $ | 2.95 |
| 500 |
| 7,545 |
| $ | 2.96 |
| $ | 2.96 |
| $ | 2.95 |
| $ | 2.95 |
| $ | 2.94 |
|
|
|
|
| 750 |
| 7,388 |
| $ | 2.97 |
| $ | 2.96 |
| $ | 2.95 |
| $ | 2.94 |
| $ | 2.94 |
| |
|
|
|
| 1,000 |
| 7,403 |
| $ | 2.96 |
| $ | 2.96 |
| $ | 2.95 |
| $ | 2.94 |
| $ | 2.94 |
| |
|
|
|
| 2,000 |
| 7,120 |
| $ | 2.97 |
| $ | 2.96 |
| $ | 2.95 |
| $ | 2.94 |
| $ | 2.92 |
| |
|
|
|
|
|
|
|
|
|
|
|
|
|
|
|
|
|
| ||||||
Net Tangible Common Book Value as of |
|
|
|
|
|
|
|
|
|
|
|
|
|
|
|
|
| ||||||
|
|
|
|
|
|
|
|
|
|
|
|
|
|
|
|
|
| ||||||
Net Tangible Common Book Value |
| $ | 19,272 |
| 100 |
| 7,739 |
| $ | 2.46 |
| $ | 2.46 |
| $ | 2.46 |
| $ | 2.46 |
| $ | 2.46 |
|
Shares Outstanding |
| 7,816 |
| 250 |
| 7,662 |
| $ | 2.46 |
| $ | 2.46 |
| $ | 2.45 |
| $ | 2.45 |
| $ | 2.45 |
| |
Net Tangible Common Book Value per Share |
| $ | 2.47 |
| 500 |
| 7,545 |
| $ | 2.46 |
| $ | 2.45 |
| $ | 2.45 |
| $ | 2.44 |
| $ | 2.44 |
|
|
|
|
| 750 |
| 7,388 |
| $ | 2.45 |
| $ | 2.44 |
| $ | 2.43 |
| $ | 2.43 |
| $ | 2.42 |
| |
|
|
|
| 1,000 |
| 7,403 |
| $ | 2.45 |
| $ | 2.44 |
| $ | 2.44 |
| $ | 2.43 |
| $ | 2.42 |
| |
|
|
|
| 2,000 |
| 7,120 |
| $ | 2.44 |
| $ | 2.43 |
| $ | 2.41 |
| $ | 2.40 |
| $ | 2.39 |
| |
(1) Company stock benefit plan is included as one stockholder. In addition, may include shareholders with holdings in multiple accounts.
(2) Range of Fractional Share Consideration is based upon analyses provided hereafter.
Sources of information: Company management, American Stock Transfer and CEDE.
12
|
|
|
| Reverse |
| Pro Forma |
| Pro Forma |
| ||
|
|
|
|
|
|
|
|
|
| ||
Basic Earnings Per Share for LTM September 30, 2003 |
|
|
|
|
|
|
|
|
| ||
|
|
|
|
|
|
|
|
|
| ||
Adjusted Net Income |
| $ | (2,379 | ) | 100 |
| 7,739 |
| $ | (0.31 | ) |
Weighted Average Shares Outstanding |
| 7,674 |
| 250 |
| 7,662 |
| $ | (0.31 | ) | |
Adjusted Earnings (Loss) per Share |
| $ | (0.31 | ) | 500 |
| 7,545 |
| $ | (0.32 | ) |
|
|
|
| 750 |
| 7,388 |
| $ | (0.32 | ) | |
|
|
|
| 1,000 |
| 7,403 |
| $ | (0.32 | ) | |
|
|
|
| 2,000 |
| 7,120 |
| $ | (0.33 | ) | |
|
|
|
|
|
|
|
|
|
| ||
Basic Earnings Per Share for FYE December 31, 2002 |
|
|
|
|
|
|
|
|
| ||
|
|
|
|
|
|
|
|
|
| ||
Adjusted Net Income |
| $ | 2,302 |
| 100 |
| 7,739 |
| $ | 0.30 |
|
Weighted Average Shares Outstanding |
| 7,832 |
| 250 |
| 7,662 |
| $ | 0.30 |
| |
Adjusted Earnings (Loss) per Share |
| $ | 0.29 |
| 500 |
| 7,545 |
| $ | 0.31 |
|
|
|
|
| 750 |
| 7,388 |
| $ | 0.31 |
| |
|
|
|
| 1,000 |
| 7,403 |
| $ | 0.31 |
| |
|
|
|
| 2,000 |
| 7,120 |
| $ | 0.32 |
| |
(1) Company stock benefit plan is included as one stockholder. In addition, may include shareholders with holdings in multiple accounts.
Sources of information: Company management, American Stock Transfer and CEDE.
13
SCOPE OF ENGAGEMENT
• In arriving at its analysis and opinion, Capitalink took into account its assessment of general economic, market and financial conditions as well as its experience in connection with similar transactions and securities valuations generally and, among other things:
• Reviewed documents relating to the Transaction.
• Reviewed publicly available financial information and other data with respect to the Company, including the Annual Report on Form 10-K for the fiscal year ended December 31, 2002, and the draft Quarterly Report on Form 10-Q for the nine months ended September 30, 2003.
• Reviewed and analyzed a range of Fractional Share Consideration at various different possible per share prices, a range of pro forma shares outstanding at various different Reverse Split a range of ratios, a range of pro forma common book values per share and a range of pro forma earnings per share.
• Reviewed and analyzed the Company’s projected unlevered free cash flows and prepared discounted cash flows.
• Reviewed and analyzed certain financial characteristics of companies that were deemed to have characteristics comparable to those of the Company.
• Reviewed and analyzed certain financial characteristics of comparable transactions that involved the acquisition of companies that were deemed to have characteristics comparable to those of the Company.
• Reviewed and analyzed recent transaction premiums paid in going-private transactions involving a reverse stock split.
• Reviewed and analyzed the premiums implied by the Fractional Share Consideration.
• Reviewed and discussed with representatives of the management of the Company certain financial and operating information furnished by them, including financial analyses and projections and related assumptions with respect to the business, operations and prospects of the Company.
• Considered the historical financial results and present financial condition of the Company.
• Reviewed certain publicly available information concerning the trading of, and the trading market for, the common stock of the Company.
• Inquired about and discussed the Transaction and other matters related thereto with Company management, the Board of Directors and its legal counsel.
• Performed such other analyses and examinations as were deemed appropriate.
14
• The Capitalink analysis and opinion are necessarily based upon market, economic and other conditions, as they exist on, and could be evaluated as of November 6, 2003. Accordingly, although subsequent developments may affect its opinion, Capitalink does not assume any obligation to update, review or reaffirm its opinion.
• Capitalink assumes that the Transaction will be consummated substantially in accordance with the terms set forth, without any further amendments thereto, and without waiver by the Company of any of the conditions to any obligations or in the alternative that any such amendments, revisions or waivers thereto will not be detrimental to the Company or the shareholders of the Company.
• Capitalink has relied upon and assumed the accuracy and completeness of all of the financial and other information that was used by it without assuming any responsibility for any independent verification of any such information and has further relied upon the assurances of Company management that it is not aware of any facts or circumstances that would make any such information inaccurate or misleading. With respect to the financial projections utilized, Capitalink assumed that such projections have been reasonably prepared on a basis reflecting the best currently available estimates and judgments, and that such projections provide a reasonable basis upon which it could make its analysis and form an opinion.
• Capitalink has not made a physical inspection of the properties and facilities of the Company and has not made or obtained any evaluations or appraisals of the assets and liabilities (contingent or otherwise) of the Company.
• Capitalink assumed that the Transaction will be consummated in a manner that complies in all respects with the applicable provisions of the Securities Act of 1933, as amended, the Securities Exchange Act of 1934, as amended, and all other applicable federal and state statutes, rules and regulations. In addition, based upon discussions with the Company, it is assumed that the receipt of the Fractional Share Consideration will be a taxable event to the Company’s shareholders that receive such consideration.
• Capitalink has not been requested to opine as to, and the opinion does not in any manner address, the underlying business decision of the Company to proceed with or affect the Transaction.
15
• Capitalink was not asked to consider, and its opinion does not address, the relative merits of the Transaction as compared to any alternative business strategy that might exist for the Company. Capitalink was not engaged to seek alternatives to the Transaction that might exist for the Company.
• The opinion is for the use and benefit of the Board of Directors in connection with its consideration of the Transaction and is not intended to be and does not constitute a recommendation to any shareholder of the Company as to how such shareholder should vote with respect to the Transaction. We do not express any opinion as to the underlying valuation or future performance of the Company or the price at which the Company’s common stock would trade at any time in the future.
16
17
SUMMARY
• Seibels, a South Carolina corporation, is a provider of a wide range of services to the insurance industry, as well as a provider of automobile, flood and other property and casualty insurance products.
• The Company is a holding company for four property and casualty insurance companies that offer commercial and non-standard automobile insurance. In addition, Seibels offers claim administration services to insurance companies and other businesses through Insurance Network Services, Inc. (“INS”), flood zone determination and related services through America’s Flood Services, Inc. (“AFS”), and managing general agency services through Seibels, Bruce & Company (“SBC”).
• The Company seeks to balance its fee-based operations with selective risk underwriting in an effort to increase value for its shareholders, agents and employees by pursuing growth with an element of limited risk exposure. The Company’s risk-bearing property and casualty insurance operations include non-standard automobile, commercial lines and workers’ compensation.
• The Company’s operations can be described within five main categories:
• Automobile – Includes Universal Insurance Company’s (“UIC”) retained risk nonstandard automobile and run-off premium finance operations, Catawba Insurance Company’s (“Catawba”) retained risk non-owners and non-standard automobile programs, the runoff of the Company’s retained risk Nashville and South Carolina automobile operations, and the fee-based NC Facility, SC Facility and South Carolina Associated Auto Insurers Plan operations.
• Flood – Includes the fee-based flood zone determinations and flood zone mapping services of AFS, and the fee based flood insurance agency of AFS.
• Commercial – Includes the retained risk commercial operations of Catawba and UIC, the fee-based commercial automobile activity for the NC Facility and SC Facility, and the runoff retained risk commercial operations of South Carolina Insurance Company.
18
• Adjusting Services – Includes all the fee-based operations of INS, a full claims organization that conducts automobile appraisals, catastrophe claims adjusting and glass claim services
• Other – Includes various runoff risk bearing environmental, workers compensation programs, and the fee-based managing general agency services of SBC.
• INS’ primary operation includes the claim administration services to QualSure Holdings Corporation, under a reduced rate contract that expires from October 4, 2005 through January 21, 2010. The Company is currently seeking to renew this contract on more favorable terms and/or seek other similar contracts in different regions.
• In January 2002, the Company issued two workers compensation insurance master policies to Human Dynamics Corporation (“HDC”), a professional employment organization. The Company did not obtain the approval of the South Carolina Department of Insurance (“SCDOI”) prior to issuing the master policies and therefore subsequently canceled them. Litigation was brought against the Company by HDC for breach of contract, good faith and fair dealing and is seeking actual and punitive damages. Litigation is currently ongoing with the Company presenting numerous counterclaims.
• In August 2002, the SCDOI issued an order imposing administrative supervision for at least six months as a result of the disputes associated with the HDC program. Provisions of the administrative order provided for the Company’s subsidiaries to immediately cease writing risk-bearing business and to immediately cease renewal of existing risk-bearing business.
• In September 2002, the SCDOI provided approval to Catawba to write new and renewal premiums on both automobile and commercial lines of business in the states of South Carolina, Georgia and Tennessee. Additional approval was given to UIC to renew the North Carolina commercial lines businesses of SCIC. However, Catawba’s application to the Kentucky Department of Insurance was withdrawn and this business is currently being runoff.
19
• In November 2002, the Company sold the renewal rights to its National Flood Insurance Program (“NFIP”) business to The Hartford Financial Services Group, Inc (“Hartford”) for $3.8 million. Provisions of the underlying sales agreement provide that Hartford administer the Company’s business to the NFIP over the transition period that ends September 30, 2003.
• The Company’s operations have reduced significantly over the past year as a result of the SCDOI Order, the sale of its NFIP book of business, the runoff of its managing general agent operations, the final runoff of the SC Facility and the SCAAIP, and the loss of its commercial lines business in the state of Kentucky. The Company has been forced to scale back its operations significantly, and is currently exploring opportunities for additional sources of revenue. This includes gaining approval to write additional lines of insurance in both South Carolina and North Carolina, and to obtain additional claims-adjusting service contracts in other regions.
• In April 2003, the Company announced an odd-lot tender offer for shareholders with less than 100 shares at $2.50 per share. The tender offer was completed on July 31, 2003 with 15,646 shares purchased.
• In November 2003, the Company entered into letters of intent with unaffiliated third parties pursuant to which the Company will sell 100% of the common stock of South Carolina Insurance Company and Consolidated American Insurance Company. These transactions are subject to due diligence, approval by the respective board of directors and approval by the SCDOI.
• Capitalink noted several general factors to be considered in connection with the status of Seibels as a publicly traded company:
• The Company’s common stock historically has a limited trading volume and therefore a lack of liquidity for the Company’s shareholders.
• The Company is not part of a high-growth industry that attracts investor interest and a high trading multiple.
20
• The Company has a significant number of shareholders with small holdings in the Company’s stock. The cost of servicing the large number of shareholders are high relative to the size of their holdings and the market valuation of the Company.
• The Company has not realized the benefits of public company status (i.e., ability to raise capital, use of stock as currency in acquisitions), but incurs the increased expenses necessary to comply with reporting requirements and other public company obligations.
21
22
• Capitalink reviewed the Company’s historical and draft financial data for the five fiscal years (“FY”) ended December 31, 2002, and the nine months ended September 30, 2003. In addition, Capitalink reviewed the Company’s projections for the FY ending December 31, 2004 through December 31, 2008.
• The Company’s revenues and earnings are adjusted to remove any unusual or extraordinary sources of revenue and expenses. The adjustments provide a more accurate portrayal of the Company’s underlying earnings.
• Seibels’s revenues are derived from four main sources: (i) net premium revenue from the writing of premiums for the automobile, commercial and homeowners markets, (ii) commission and service income, (iii) investment income, and (iv) other income which includes various run-off risk bearing activities. For the nine months ended September 30, 2003, net premiums and commission and service income made up 45.1% and 46.2%, respectively of total adjusted revenue.
• The Company’s revenue streams (as a percentage of total revenue for the nine months ended September 30, 2003) can also be grouped into five main categories; (i) automobile-35.1%, (ii) flood-9.5%, (iii) commercial-24.5%, (iv) adjusting services-16.8%, and (v) other-3.8%.
• Revenue for the Company fell significantly over the reviewed period – from a high of $108.3 million in FY1999 to $29.4 million for the LTM ended September 30, 2003. The fall in revenues was primarily due to several factors including the discontinuation of two of its unprofitable, nonstandard automobile insurance operations in Nashville (Graward) and South Carolina. In addition, the sale of the Company’s NFIP business, the discontinuation of the HDC workers compensation program and other unprofitable service lines, and the Company’s problems with respect to the SCDOI administrative order, have also contributed to the fall in revenues and earnings.
• The Company’s adjusted earning before interest, taxes, depreciation and amortization (“EBITDA”) has been extremely volatile over the past five years and has ranged from a high of $4.8 million for FY2001 to $(3.9) million for FY2000. The EBITDA for the LTM ended September 30, 2003 was $(1.2) million. The Company’s losses in FY2000 were primarily attributable to the unprofitable nonstandard automobile insurance operations in Nashville and South Carolina, which have since been discontinued.
23
• On March 28, 2002, the Company issued $8.0 million in adjustable rate cumulative non-voting, non-convertible, non-redeemable preferred special stock to Charles H. Powers, the Company’s Chairman and Chief Executive Officer. As of September 30, 2003, the Company had no other interest bearing obligations.
• In connection with a potential new investment in a Florida based operation, the Company has negotiated a new $2.5 million credit facility. In addition, the Company expects to fund the Transaction from an additional credit facility.
• The Company’s net premiums written to surplus ratio has been relatively low and has ranged from a high of 1.72 times in FY1999 to 0.28 times for the LTM period ended September 30, 2003. Although the low ratio suggests the significant ability of the Company to write additional insurance policies, it is understated on an aggregate basis because of the significant portion of the Company’s operations derived from commission and fees.
• The Company’s average loss ratio has also fallen significantly from a high of 110.7% for FY1998 to 53.4% for the LTM period ended September 30, 2003. The improvement in the loss ratio is caused by steps taken by the Company, to discontinue unprofitable lines of business.
• The Company’s common shareholders equity has also improved significantly from $11.9 million as of December 31, 2000 to $23.1 million as of September 30, 2003. The improvement in the Company’s common shareholders equity is primarily a result of several unusual items including the gain on the sale of stock in Insurance Services Offices, Inc. of $2.1 million, the gain on the sale to Hartford, and the sale and leaseback of the corporate office building.
• The Company’s net book value and net tangible book value per share as of September 30, 2003 was $2.95 and $2.47, respectively.
24
Normalized Comparative Summary Income Statements
($ in thousands except per share)
|
| for years ended December 31, |
| for the 9 months ended |
| LTM |
| ||||||||||||||||||
|
| 1998 |
| 1999 |
| 2000 |
| 2001 |
| 2002 |
| 2002 |
| 2003 |
| 2003 |
| ||||||||
|
|
|
|
|
|
|
|
|
|
|
|
|
|
|
|
|
| ||||||||
Revenue |
|
|
|
|
|
|
|
|
|
|
|
|
|
|
|
|
| ||||||||
Net Premiums |
| $ | 22,775 |
| $ | 53,344 |
| $ | 25,137 |
| $ | 14,433 |
| $ | 15,661 |
| $ | 20,726 |
| $ | 11,443 |
| $ | 6,378 |
|
Commission and Service Income |
| 49,298 |
| 45,652 |
| 35,890 |
| 36,272 |
| 33,853 |
| 26,490 |
| 11,701 |
| 19,064 |
| ||||||||
Investment Income |
| 4,699 |
| 4,558 |
| 4,593 |
| 3,205 |
| 2,843 |
| 1,769 |
| 1,452 |
| 2,526 |
| ||||||||
Other |
| 4,645 |
| 4,779 |
| 4,502 |
| 2,767 |
| 1,398 |
| 737 |
| 758 |
| 1,419 |
| ||||||||
Total Revenue |
| 81,417 |
| 108,333 |
| 70,122 |
| 56,677 |
| 53,755 |
| 49,722 |
| 25,354 |
| 29,387 |
| ||||||||
|
|
|
|
|
|
|
|
|
|
|
|
|
|
|
|
|
| ||||||||
Expenses |
|
|
|
|
|
|
|
|
|
|
|
|
|
|
|
|
| ||||||||
Losses and Loss Adjustment Expenses |
| 25,223 |
| 46,010 |
| 24,445 |
| 7,740 |
| 9,434 |
| 15,164 |
| 9,137 |
| 3,407 |
| ||||||||
Policy Acquisition Costs |
| 10,222 |
| 33,721 |
| 25,003 |
| 23,162 |
| 22,814 |
| 18,600 |
| 7,307 |
| 11,521 |
| ||||||||
Other Operating Costs and Expenses |
| 46,823 |
| 34,885 |
| 26,461 |
| 21,438 |
| 18,625 |
| 13,547 |
| 11,328 |
| 16,406 |
| ||||||||
Total Operating Expenses |
| 82,268 |
| 114,616 |
| 75,909 |
| 52,340 |
| 50,873 |
| 47,311 |
| 27,772 |
| 31,334 |
| ||||||||
Operating Income (Loss) |
| (851 | ) | (6,283 | ) | (5,787 | ) | 4,337 |
| 2,882 |
| 2,411 |
| (2,418 | ) | (1,947 | ) | ||||||||
|
|
|
|
|
|
|
|
|
|
|
|
|
|
|
|
|
| ||||||||
Interest Income (Expense) |
| (981 | ) | (1,216 | ) | (1,436 | ) | (728 | ) | (180 | ) | (164 | ) | (9 | ) | (25 | ) | ||||||||
Pre-tax Income (Loss) |
| (1,832 | ) | (7,499 | ) | (7,223 | ) | 3,609 |
| 2,702 |
| 2,247 |
| (2,427 | ) | (1,972 | ) | ||||||||
Income Tax (Benefit) |
| (85 | ) | 37 |
| — |
| 30 |
| (30 | ) | (30 | ) | 15 |
| 15 |
| ||||||||
After-tax Income (Loss) |
| (1,747 | ) | (7,536 | ) | (7,223 | ) | 3,579 |
| 2,732 |
| 2,277 |
| (2,442 | ) | (1,987 | ) | ||||||||
|
|
|
|
|
|
|
|
|
|
|
|
|
|
|
|
|
| ||||||||
Preferred Stock dividends |
| (160 | ) | (168 | ) | (168 | ) | (161 | ) | (430 | ) | (323 | ) | (285 | ) | (392 | ) | ||||||||
Normalized Net Income to Common |
| $ | (1,907 | ) | $ | (7,704 | ) | $ | (7,391 | ) | $ | 3,418 |
| $ | 2,302 |
| $ | 1,954 |
| $ | (2,727 | ) | $ | (2,379 | ) |
|
|
|
|
|
|
|
|
|
|
|
|
|
|
|
|
|
| ||||||||
Normalized EBIT |
| $ | (851 | ) | $ | (6,283 | ) | $ | (5,787 | ) | $ | 4,337 |
| $ | 2,882 |
| $ | 2,411 |
| $ | (2,418 | ) | $ | (1,947 | ) |
Total Depreciation & Amortization |
| $ | 2,115 |
| $ | 2,552 |
| $ | 1,847 |
| $ | 496 |
| $ | 488 |
| $ | 391 |
| $ | 626 |
| $ | 723 |
|
Normalized EBITDA |
| $ | 1,264 |
| $ | (3,731 | ) | $ | (3,940 | ) | $ | 4,833 |
| $ | 3,370 |
| $ | 2,802 |
| $ | (1,792 | ) | $ | (1,224 | ) |
Capital Expenditures, net of Disposals (CAPEX, net) |
| $ | 1,392 |
| $ | 1,506 |
| $ | 212 |
| $ | 581 |
| $ | 655 |
| $ | 655 |
| $ | 253 |
| $ | 253 |
|
Normalized EBITDA - CAPEX |
| $ | (128 | ) | $ | (5,237 | ) | $ | (4,152 | ) | $ | 4,252 |
| $ | 2,715 |
| $ | 2,147 |
| $ | (2,045 | ) | $ | (1,477 | ) |
|
|
|
|
|
|
|
|
|
|
|
|
|
|
|
|
|
| ||||||||
Earnings per Share |
|
|
|
|
|
|
|
|
|
|
|
|
|
|
|
|
| ||||||||
Basic Normalized EPS |
| $ | (0.25 | ) | $ | (0.99 | ) | $ | (0.94 | ) | $ | 0.44 |
| $ | 0.29 |
| $ | 0.25 |
| $ | (0.35 | ) | $ | (0.31 | ) |
Basic Reported EPS |
| $ | (0.39 | ) | $ | (0.99 | ) | $ | (1.98 | ) | $ | 0.54 |
| $ | 0.73 |
| $ | 0.64 |
| $ | 0.04 |
| $ | 0.13 |
|
Weighted Average Shares Outstanding (thousands) |
| 7,763 |
| 7,774 |
| 7,832 |
| 7,832 |
| 7,832 |
| 7,832 |
| 7,825 |
|
|
| ||||||||
|
|
|
|
|
|
|
|
|
|
|
|
|
|
|
|
|
| ||||||||
Diluted Normalized EPS |
| $ | (0.25 | ) | $ | (0.99 | ) | $ | (0.94 | ) | $ | 0.42 |
| $ | 0.28 |
| $ | 0.24 |
| $ | (0.35 | ) | $ | (0.31 | ) |
Diluted Reported EPS |
| $ | (0.39 | ) | $ | (0.99 | ) | $ | (1.98 | ) | $ | 0.51 |
| $ | 0.70 |
| $ | 0.61 |
| $ | 0.04 |
| $ | 0.13 |
|
Weighted Average Shares Outstanding (thousands) |
| 7,763 |
| 7,774 |
| 7,832 |
| 8,206 |
| 8,088 |
| 8,164 |
| 7,854 |
|
|
| ||||||||
|
|
|
|
|
|
|
|
|
|
|
|
|
|
|
|
|
| ||||||||
Normalizing Reconciliation |
|
|
|
|
|
|
|
|
|
|
|
|
|
|
|
|
| ||||||||
Restructuring/Goodwill Impairment |
| $ | (546 | ) | $ | — |
| $ | — |
| $ | — |
| $ | — |
| $ | — |
| $ | (700 | ) | $ | (700 | ) |
Other Unusual (Expense) Gain Items |
| — |
| — |
| (8,138 | ) | 787 |
| 3,391 |
| 3,041 |
| 3,779 |
| 4,129 |
| ||||||||
Income Tax Shelter (Charge) from Unusual Items |
| — |
| — |
| — |
| — |
| — |
| — |
| — |
| — |
| ||||||||
Unusual (Expense) Gain Items, net of Taxes |
| (546 | ) | — |
| (8,138 | ) | 787 |
| 3,391 |
| 3,041 |
| 3,079 |
| 3,429 |
| ||||||||
Accounting Changes, net of Taxes |
| (601 | ) | — |
| — |
| — |
| — |
| — |
| — |
| — |
| ||||||||
Total Reconciling Items, net of Taxes |
| $ | (1,147 | ) | $ | — |
| $ | (8,138 | ) | $ | 787 |
| $ | 3,391 |
| $ | 3,041 |
| $ | 3,079 |
| $ | 3,429 |
|
|
|
|
|
|
|
|
|
|
|
|
|
|
|
|
|
|
| ||||||||
Reported Income Tax (Benefit) |
| $ | (85 | ) | $ | 37 |
| $ | — |
| $ | 30 |
| $ | (30 | ) | $ | (30 | ) | $ | 15 |
| $ | 15 |
|
Reported Net Income (Loss) to Common |
| $ | (3,054 | ) | $ | (7,704 | ) | $ | (15,529 | ) | $ | 4,205 |
| $ | 5,693 |
| $ | 4,995 |
| $ | 352 |
| $ | 1,050 |
|
Comprehensive Gain/(Loss) |
| $ | 860 |
| $ | (1,512 | ) | $ | 962 |
| $ | 777 |
| $ | 557 |
| $ | 776 |
| $ | (450 | ) | $ | (669 | ) |
Reported Comprehensive Net Income (Loss) to Common |
| $ | (2,194 | ) | $ | (9,216 | ) | $ | (14,567 | ) | $ | 4,982 |
| $ | 6,250 |
| $ | 5,771 |
| $ | (98 | ) | $ | 381 |
|
Sources of information: Company financial statements and management
25
Normalized Common Sized Summary Income Statements
|
| for years ended December 31, |
| for the 9 months ended |
| LTM |
| ||||||||||
|
| 1998 |
| 1999 |
| 2000 |
| 2001 |
| 2002 |
| 2002 |
| 2003 |
| 2003 |
|
|
|
|
|
|
|
|
|
|
|
|
|
|
|
|
|
|
|
Revenue |
|
|
|
|
|
|
|
|
|
|
|
|
|
|
|
|
|
Net Premiums |
| 28.0 | % | 49.2 | % | 35.8 | % | 25.5 | % | 29.1 | % | 41.7 | % | 45.1 | % | 21.7 | % |
Commission and Service Income |
| 60.6 | % | 42.1 | % | 51.2 | % | 64.0 | % | 63.0 | % | 53.3 | % | 46.2 | % | 64.9 | % |
Investment Income |
| 5.8 | % | 4.2 | % | 6.6 | % | 5.7 | % | 5.3 | % | 3.6 | % | 5.7 | % | 8.6 | % |
Other |
| 5.7 | % | 4.4 | % | 6.4 | % | 4.9 | % | 2.6 | % | 1.5 | % | 3.0 | % | 4.8 | % |
Total Revenue |
| 100.0 | % | 100.0 | % | 100.0 | % | 100.0 | % | 100.0 | % | 100.0 | % | 100.0 | % | 100.0 | % |
|
|
|
|
|
|
|
|
|
|
|
|
|
|
|
|
|
|
Expenses |
|
|
|
|
|
|
|
|
|
|
|
|
|
|
|
|
|
Losses and Loss adjustment expenses |
| 31.0 | % | 42.5 | % | 34.9 | % | 13.7 | % | 17.5 | % | 30.5 | % | 36.0 | % | 11.6 | % |
Policy Acquisition Costs |
| 12.6 | % | 31.1 | % | 35.7 | % | 40.9 | % | 42.4 | % | 37.4 | % | 28.8 | % | 39.2 | % |
Other Operating Costs and Expenses |
| 57.5 | % | 32.2 | % | 37.7 | % | 37.8 | % | 34.6 | % | 27.2 | % | 44.7 | % | 55.8 | % |
Total Operating Expenses |
| 101.0 | % | 105.8 | % | 108.3 | % | 92.3 | % | 94.6 | % | 95.2 | % | 109.5 | % | 106.6 | % |
Operating Income (Loss) |
| -1.0 | % | -5.8 | % | -8.3 | % | 7.7 | % | 5.4 | % | 4.8 | % | -9.5 | % | -6.6 | % |
|
|
|
|
|
|
|
|
|
|
|
|
|
|
|
|
|
|
Interest Income (Expense) |
| -1.2 | % | -1.1 | % | -2.0 | % | -1.3 | % | -0.3 | % | -0.3 | % | 0.0 | % | -0.1 | % |
Pre-tax Income (Loss) |
| -2.3 | % | -6.9 | % | -10.3 | % | 6.4 | % | 5.0 | % | 4.5 | % | -9.6 | % | -6.7 | % |
Income Tax (Benefit) |
| -0.1 | % | 0.0 | % | 0.0 | % | 0.1 | % | -0.1 | % | -0.1 | % | 0.1 | % | 0.1 | % |
After-tax Income (Loss) |
| -2.1 | % | -7.0 | % | -10.3 | % | 6.3 | % | 5.1 | % | 4.6 | % | -9.6 | % | -6.8 | % |
|
|
|
|
|
|
|
|
|
|
|
|
|
|
|
|
|
|
Preferred Stock dividends |
| -0.2 | % | -0.2 | % | -0.2 | % | -0.3 | % | -0.8 | % | -0.6 | % | -1.1 | % | -1.3 | % |
Normalized Net Income to Common |
| -2.3 | % | -7.1 | % | -10.5 | % | 6.0 | % | 4.3 | % | 3.9 | % | -10.8 | % | -8.1 | % |
|
|
|
|
|
|
|
|
|
|
|
|
|
|
|
|
|
|
Normalized EBIT |
| -1.0 | % | -5.8 | % | -8.3 | % | 7.7 | % | 5.4 | % | 4.8 | % | -9.5 | % | -6.6 | % |
Total Depreciation & Amortization |
| 2.6 | % | 2.4 | % | 2.6 | % | 0.9 | % | 0.9 | % | 0.8 | % | 2.5 | % | 2.5 | % |
Normalized EBITDA |
| 1.6 | % | -3.4 | % | -5.6 | % | 8.5 | % | 6.3 | % | 5.6 | % | -7.1 | % | -4.2 | % |
Capital Expenditures, net of Disposals (CAPEX, net) |
| 1.7 | % | 1.4 | % | 0.3 | % | 1.0 | % | 1.2 | % | 1.3 | % | 1.0 | % | 0.9 | % |
Normalized EBITDA - CAPEX |
| -0.2 | % | -4.8 | % | -5.9 | % | 7.5 | % | 5.1 | % | 4.3 | % | -8.1 | % | -5.0 | % |
|
|
|
|
|
|
|
|
|
|
|
|
|
|
|
|
|
|
Normalizing Reconciliation |
|
|
|
|
|
|
|
|
|
|
|
|
|
|
|
|
|
Restructuring/Goodwill Impairment |
| 0.0 | % | 0.0 | % | 0.0 | % | 0.0 | % | 0.0 | % | 0.0 | % | 0.0 | % | 0.0 | % |
Other Unusual (Expense) Gain Items |
| -0.7 | % | 0.0 | % | 0.0 | % | 0.0 | % | 0.0 | % | 0.0 | % | -2.8 | % | -2.4 | % |
Income Tax Shelter (Charge) from Unusual Items |
| 0.0 | % | 0.0 | % | 0.0 | % | 0.0 | % | 0.0 | % | 0.0 | % | 0.0 | % | 0.0 | % |
Unusual (Expense) Gain Items, net of Taxes |
| -0.7 | % | 0.0 | % | -11.6 | % | 1.4 | % | 6.3 | % | 6.1 | % | 12.1 | % | 11.7 | % |
Accounting Changes, net of Taxes |
| -0.7 | % | 0.0 | % | 0.0 | % | 0.0 | % | 0.0 | % | 0.0 | % | 0.0 | % | 0.0 | % |
Discontinued Operations, net of Taxes |
| 0.0 | % | 0.0 | % | 0.0 | % | 0.0 | % | 0.0 | % | 0.0 | % | 0.0 | % | 0.0 | % |
Extraordinary Items, net of Taxes |
| 0.0 | % | 0.0 | % | 0.0 | % | 0.0 | % | 0.0 | % | 0.0 | % | 0.0 | % | 0.0 | % |
Total Reconciling Items, net of Taxes |
| -1.4 | % | 0.0 | % | -11.6 | % | 1.4 | % | 6.3 | % | 6.1 | % | 12.1 | % | 11.7 | % |
|
|
|
|
|
|
|
|
|
|
|
|
|
|
|
|
|
|
Reported Income Tax (Benefit) |
| -0.1 | % | 0.0 | % | 0.0 | % | 0.1 | % | -0.1 | % | -0.1 | % | 0.1 | % | 0.1 | % |
Reported Net Income (Loss) to Common |
| -3.8 | % | -7.1 | % | -22.1 | % | 7.4 | % | 10.6 | % | 10.0 | % | 1.4 | % | 3.6 | % |
Comprehensive Gain/(Loss) |
| 1.1 | % | -1.4 | % | 1.4 | % | 1.4 | % | 1.0 | % | 1.6 | % | -1.8 | % | -2.3 | % |
Reported Comprehensive Net Income (Loss) to Common |
| -3.8 | % | -7.1 | % | -22.1 | % | 7.4 | % | 10.6 | % | 10.0 | % | 1.4 | % | 1.3 | % |
Sources of information: Company financial statements and management
26
Comparative Summary Balance Sheets
($ in thousands, except per share)
|
| as of December 31, |
| as of September 30, |
| |||||||||||||||||
|
| 1998 |
| 1999 |
| 2000 |
| 2001 |
| 2002 |
| 2002 |
| 2003 |
| |||||||
Assets |
|
|
|
|
|
|
|
|
|
|
|
|
|
|
| |||||||
Cash & Equivalents |
| $ | 23,141 |
| $ | 26,722 |
| $ | 10,410 |
| $ | 6,375 |
| $ | 10,423 |
| $ | 5,561 |
| $ | 8,711 |
|
Investments |
| 41,109 |
| 32,892 |
| 38,297 |
| 39,499 |
| 39,216 |
| 41,305 |
| 39,272 |
| |||||||
Premium Receivables |
| 19,334 |
| 11,591 |
| 6,897 |
| 6,272 |
| 3,492 |
| 3,511 |
| 4,743 |
| |||||||
Reinsurance Recoverable on Paid Losses & LAE |
| 29,972 |
| 18,528 |
| 14,031 |
| 10,246 |
| 7,289 |
| 10,121 |
| 6,739 |
| |||||||
Reinsurance Recoverable on Unpaid Losses & LAE |
| 83,654 |
| 74,017 |
| 50,012 |
| 40,832 |
| 30,786 |
| 33,991 |
| 28,078 |
| |||||||
Prepaid Reinsurance Premiums |
| 59,619 |
| 56,724 |
| 40,997 |
| 36,548 |
| 30,224 |
| 35,000 |
| 8,844 |
| |||||||
Deferred Policy Acquisition Costs |
| 2,472 |
| 1,373 |
| 400 |
| 1,200 |
| 1,168 |
| 1,525 |
| 1,490 |
| |||||||
Property & Equipment |
| 6,028 |
| 5,421 |
| 917 |
| 807 |
| 993 |
| 1,146 |
| 699 |
| |||||||
Intangible Assets, net |
| 20,892 |
| 19,876 |
| 4,638 |
| 4,513 |
| 4,513 |
| 4,513 |
| 3,813 |
| |||||||
Other Assets |
| 9,342 |
| 7,659 |
| 4,067 |
| 4,346 |
| 5,570 |
| 12,460 |
| 2,568 |
| |||||||
Total Assets |
| $ | 295,563 |
| $ | 254,803 |
| $ | 170,666 |
| $ | 150,638 |
| $ | 133,674 |
| $ | 149,133 |
| $ | 104,957 |
|
Liabilities & Stockholders’ Equity |
|
|
|
|
|
|
|
|
|
|
|
|
|
|
| |||||||
|
|
|
|
|
|
|
|
|
|
|
|
|
|
|
| |||||||
Loss and Loss Adjustment Expenses: |
|
|
|
|
|
|
|
|
|
|
|
|
|
|
| |||||||
Reported & Est. Claims & Losses - Retained |
| $ | 28,950 |
| $ | 34,733 |
| $ | 30,574 |
| $ | 21,334 |
| $ | 18,857 |
| $ | 25,857 |
| $ | 19,260 |
|
Reported & Est. Claims & Losses - Ceded |
| 74,746 |
| 67,904 |
| 46,612 |
| 38,785 |
| 29,717 |
| 32,753 |
| 27,417 |
| |||||||
Adj Expenses - Retained |
| 7,372 |
| 5,100 |
| 5,247 |
| 4,709 |
| 4,067 |
| 5,175 |
| 3,849 |
| |||||||
Adj Expenses - Ceded |
| 8,908 |
| 6,113 |
| 3,400 |
| 2,047 |
| 1,069 |
| 1,238 |
| 661 |
| |||||||
Unearned Premiums - Retained |
| 12,919 |
| 5,796 |
| 5,056 |
| 6,116 |
| 6,134 |
| 7,232 |
| 6,918 |
| |||||||
Unearned Premiums - Ceded |
| 59,619 |
| 56,724 |
| 40,997 |
| 36,548 |
| 30,224 |
| 35,000 |
| 8,844 |
| |||||||
Accounts Payable & Accrued Expenses |
| 39,024 |
| 20,460 |
| 4,592 |
| 3,372 |
| 3,158 |
| 5,632 |
| 1,449 |
| |||||||
Interest Bearing Debt |
| 16,250 |
| 14,986 |
| 10,159 |
| 7,721 |
| — |
| — |
| — |
| |||||||
Other Liabilities |
| 9,487 |
| 13,730 |
| 9,337 |
| 10,442 |
| 9,224 |
| 5,501 |
| 5,474 |
| |||||||
Total Liabilities |
| 257,275 |
| 225,546 |
| 155,974 |
| 131,074 |
| 102,450 |
| 118,388 |
| 73,872 |
| |||||||
|
|
|
|
|
|
|
|
|
|
|
|
|
|
|
| |||||||
Preferred Stock |
| 2,700 |
| 2,700 |
| 2,700 |
| 2,590 |
| 8,000 |
| 8,000 |
| 8,000 |
| |||||||
|
|
|
|
|
|
|
|
|
|
|
|
|
|
|
| |||||||
Common Stockholders’ Equity |
|
|
|
|
|
|
|
|
|
|
|
|
|
|
| |||||||
Common Stock |
| 7,773 |
| 7,831 |
| 7,832 |
| 7,832 |
| 7,832 |
| 7,832 |
| 7,816 |
| |||||||
Paid in Capital |
| 61,861 |
| 61,988 |
| 61,989 |
| 61,989 |
| 61,989 |
| 61,989 |
| 61,964 |
| |||||||
Accumulated Earnings (Deficit) |
| (34,046 | ) | (43,262 | ) | (57,829 | ) | (52,847 | ) | (46,597 | ) | (47,076 | ) | (46,695 | ) | |||||||
Total Stockholders’ Equity |
| 35,588 |
| 26,557 |
| 11,992 |
| 16,974 |
| 23,224 |
| 22,745 |
| 23,085 |
| |||||||
|
| $ | 295,563 |
| $ | 254,803 |
| $ | 170,666 |
| $ | 150,638 |
| $ | 133,674 |
| $ | 149,133 |
| $ | 104,957 |
|
|
|
|
|
|
|
|
|
|
|
|
|
|
|
|
| |||||||
Common Shares Outstanding (thousands) |
| 7,773 |
| 7,831 |
| 7,832 |
| 7,832 |
| 7,832 |
| 7,832 |
| 7,816 |
| |||||||
Book Value per Common Share |
| $ | 4.58 |
| $ | 3.39 |
| $ | 1.53 |
| $ | 2.17 |
| $ | 2.97 |
| $ | 2.90 |
| $ | 2.95 |
|
Tangible Book Value Per Common Share |
| $ | 1.89 |
| $ | 0.85 |
| $ | 0.94 |
| $ | 1.59 |
| $ | 2.39 |
| $ | 2.33 |
| $ | 2.47 |
|
Sources of information: Company financial statements and management
27
Common Sized Summary Balance Sheets
|
| as of December 31, |
| as of September 30, |
| ||||||||||
|
| 1998 |
| 1999 |
| 2000 |
| 2001 |
| 2002 |
| 2002 |
| 2003 |
|
Assets |
|
|
|
|
|
|
|
|
|
|
|
|
|
|
|
|
|
|
|
|
|
|
|
|
|
|
|
|
|
|
|
Cash & Equivalents |
| 7.8 | % | 10.5 | % | 6.1 | % | 4.2 | % | 7.8 | % | 3.7 | % | 8.3 | % |
Investments |
| 13.9 | % | 12.9 | % | 22.4 | % | 26.2 | % | 29.3 | % | 27.7 | % | 37.4 | % |
Premium Receivables |
| 6.5 | % | 4.5 | % | 4.0 | % | 4.2 | % | 2.6 | % | 2.4 | % | 4.5 | % |
Reinsurance Recoverable on Paid Losses & LAE |
| 10.1 | % | 7.3 | % | 8.2 | % | 6.8 | % | 5.5 | % | 6.8 | % | 6.4 | % |
Reinsurance Recoverable on Unpaid Losses & LAE |
| 28.3 | % | 29.0 | % | 29.3 | % | 27.1 | % | 23.0 | % | 22.8 | % | 26.8 | % |
Prepaid Reinsurance Premiums |
| 20.2 | % | 22.3 | % | 24.0 | % | 24.3 | % | 22.6 | % | 23.5 | % | 8.4 | % |
Deferred Policy Acquisition Costs |
| 0.8 | % | 0.5 | % | 0.2 | % | 0.8 | % | 0.9 | % | 1.0 | % | 1.4 | % |
Property & Equipment |
| 2.0 | % | 2.1 | % | 0.5 | % | 0.5 | % | 0.7 | % | 0.8 | % | 0.7 | % |
Intangible Assets, net |
| 7.1 | % | 7.8 | % | 2.7 | % | 3.0 | % | 3.4 | % | 3.0 | % | 3.6 | % |
Other Assets |
| 3.2 | % | 3.0 | % | 2.4 | % | 2.9 | % | 4.2 | % | 8.4 | % | 2.4 | % |
Total Assets |
| 100.0 | % | 100.0 | % | 100.0 | % | 100.0 | % | 100.0 | % | 100.0 | % | 100.0 | % |
Liabilities & Stockholders’ Equity |
|
|
|
|
|
|
|
|
|
|
|
|
|
|
|
|
|
|
|
|
|
|
|
|
|
|
|
|
|
|
|
Loss and Loss Adjustment Expenses: |
|
|
|
|
|
|
|
|
|
|
|
|
|
|
|
Reported & Est. Claims & Losses - Retained |
| 9.8 | % | 13.6 | % | 17.9 | % | 14.2 | % | 14.1 | % | 17.3 | % | 18.4 | % |
Reported & Est. Claims & Losses - Ceded |
| 25.3 | % | 26.6 | % | 27.3 | % | 25.7 | % | 22.2 | % | 22.0 | % | 26.1 | % |
Adj Expenses - Retained |
| 2.5 | % | 2.0 | % | 3.1 | % | 3.1 | % | 3.0 | % | 3.5 | % | 3.7 | % |
Adj Expenses - Ceded |
| 3.0 | % | 2.4 | % | 2.0 | % | 1.4 | % | 0.8 | % | 0.8 | % | 0.6 | % |
Unearned Premiums - Retained |
| 4.4 | % | 2.3 | % | 3.0 | % | 4.1 | % | 4.6 | % | 4.8 | % | 6.6 | % |
Unearned Premiums - Ceded |
| 20.2 | % | 22.3 | % | 24.0 | % | 24.3 | % | 22.6 | % | 23.5 | % | 8.4 | % |
Accounts Payable & Accrued Expenses |
| 13.2 | % | 8.0 | % | 2.7 | % | 2.2 | % | 2.4 | % | 3.8 | % | 1.4 | % |
Interest Bearing Debt |
| 5.5 | % | 5.9 | % | 6.0 | % | 5.1 | % | 0.0 | % | 0.0 | % | 0.0 | % |
Other Liabilities |
| 3.2 | % | 5.4 | % | 5.5 | % | 6.9 | % | 6.9 | % | 3.7 | % | 5.2 | % |
Total Liabilities |
| 87.0 | % | 88.5 | % | 91.4 | % | 87.0 | % | 76.6 | % | 79.4 | % | 70.4 | % |
|
|
|
|
|
|
|
|
|
|
|
|
|
|
|
|
Preferred Stock |
| 0.9 | % | 1.1 | % | 1.6 | % | 1.7 | % | 6.0 | % | 5.4 | % | 7.6 | % |
|
|
|
|
|
|
|
|
|
|
|
|
|
|
|
|
Common Stockholders’ Equity |
|
|
|
|
|
|
|
|
|
|
|
|
|
|
|
Common Stock |
| 2.6 | % | 3.1 | % | 4.6 | % | 5.2 | % | 5.9 | % | 5.3 | % | 7.4 | % |
Paid in Capital |
| 20.9 | % | 24.3 | % | 36.3 | % | 41.2 | % | 46.4 | % | 41.6 | % | 59.0 | % |
Accumulated Earnings (Deficit) |
| -11.5 | % | -17.0 | % | -33.9 | % | -35.1 | % | -34.9 | % | -31.6 | % | -44.5 | % |
Total Stockholders’ Equity |
| 12.0 | % | 10.4 | % | 7.0 | % | 11.3 | % | 17.4 | % | 15.3 | % | 22.0 | % |
|
| 100.0 | % | 100.0 | % | 100.0 | % | 100.0 | % | 100.0 | % | 100.0 | % | 100.0 | % |
Sources of information: Company financial statements and management
28
Comparative Financial Analysis
($ in thousands, except per share)
|
| as of & for years ended December 31, |
| as of & for the 9 months ended |
| as of & for LTM |
| ||||||||||||||||||
1998 |
| 1999 |
| 2000 |
| 2001 |
| 2002 | 2002 |
| 2003 | 2003 | |||||||||||||
Financial Review |
|
|
|
|
|
|
|
|
|
|
|
|
|
|
|
|
| ||||||||
Revenue |
| $ | 81,417 |
| $ | 108,333 |
| $ | 70,122 |
| $ | 56,677 |
| $ | 53,755 |
| $ | 49,722 |
| $ | 25,354 |
| $ | 29,387 |
|
Total Operating Expenses |
| $ | 82,268 |
| $ | 114,616 |
| $ | 75,909 |
| $ | 52,340 |
| $ | 50,873 |
| $ | 47,311 |
| $ | 27,772 |
| $ | 31,334 |
|
Operating Income |
| $ | (851 | ) | $ | (6,283 | ) | $ | (5,787 | ) | $ | 4,337 |
| $ | 2,882 |
| $ | 2,411 |
| $ | (2,418 | ) | $ | (1,947 | ) |
Pre-tax Income (Loss) |
| $ | (1,832 | ) | $ | (7,499 | ) | $ | (7,223 | ) | $ | 3,609 |
| $ | 2,702 |
| $ | 2,247 |
| $ | (2,427 | ) | $ | (1,972 | ) |
Normalized Net Income (Loss) |
| $ | (1,907 | ) | $ | (7,704 | ) | $ | (7,391 | ) | $ | 3,418 |
| $ | 2,302 |
| $ | 1,954 |
| $ | (2,727 | ) | $ | (2,379 | ) |
Normalized EBIT |
| $ | (851 | ) | $ | (6,283 | ) | $ | (5,787 | ) | $ | 4,337 |
| $ | 2,882 |
| $ | 2,411 |
| $ | (2,418 | ) | $ | (1,947 | ) |
Normalized EBITDA |
| $ | 1,264 |
| $ | (3,731 | ) | $ | (3,940 | ) | $ | 4,833 |
| $ | 3,370 |
| $ | 2,802 |
| $ | (1,792 | ) | $ | (1,224 | ) |
Normalized Basic EPS |
| $ | (0.25 | ) | $ | (0.99 | ) | $ | (0.94 | ) | $ | 0.44 |
| $ | 0.29 |
| $ | 0.25 |
| $ | (0.35 | ) | $ | (0.31 | ) |
Normalized Diluted EPS |
| $ | (0.25 | ) | $ | (0.99 | ) | $ | (0.94 | ) | $ | 0.42 |
| $ | 0.28 |
| $ | 0.24 |
| $ | (0.35 | ) | $ | (0.31 | ) |
Total Assets |
| $ | 295,563 |
| $ | 254,803 |
| $ | 170,666 |
| $ | 150,638 |
| $ | 133,674 |
| $ | 149,133 |
| $ | 104,957 |
| $ | 104,957 |
|
Net Worth |
| $ | 35,588 |
| $ | 26,557 |
| $ | 11,992 |
| $ | 16,974 |
| $ | 23,224 |
| $ | 22,745 |
| $ | 23,085 |
| $ | 23,085 |
|
Tangible Net Worth |
| $ | 14,696 |
| $ | 6,681 |
| $ | 7,354 |
| $ | 12,461 |
| $ | 18,711 |
| $ | 18,232 |
| $ | 19,272 |
| $ | 19,272 |
|
Total Interest Bearing Debt |
| $ | 18,950 |
| $ | 17,686 |
| $ | 12,859 |
| $ | 10,311 |
| $ | 8,000 |
| $ | 8,000 |
| $ | 8,000 |
| $ | 8,000 |
|
Total Capitalization |
| $ | 54,538 |
| $ | 44,243 |
| $ | 24,851 |
| $ | 27,285 |
| $ | 31,224 |
| $ | 30,745 |
| $ | 31,085 |
| $ | 31,085 |
|
|
|
|
|
|
|
|
|
|
|
|
|
|
|
|
|
|
| ||||||||
Financial Strength |
|
|
|
|
|
|
|
|
|
|
|
|
|
|
|
|
| ||||||||
Net Premiums Written to Surplus |
| na |
| 1.72 |
| 1.30 |
| 1.00 |
| 0.78 |
| na |
| na |
| 0.28 |
| ||||||||
Total Liabilities to Net Worth |
| 722.9 | % | 849.3 | % | 1300.7 | % | 772.2 | % | 441.1 | % | 520.5 | % | 320.0 | % | 320.0 | % | ||||||||
Total Interest Bearing Debt to Net Worth |
| 53.2 | % | 66.6 | % | 107.2 | % | 60.7 | % | 34.4 | % | 35.2 | % | 34.7 | % | 34.7 | % | ||||||||
Total Interest Bearing Debt to Total Capitalization |
| 34.7 | % | 40.0 | % | 51.7 | % | 37.8 | % | 25.6 | % | 26.0 | % | 25.7 | % | 25.7 | % | ||||||||
Interest Expense to Interest Bearing Debt |
| 5.2 | % | 6.9 | % | 11.2 | % | 7.1 | % | 2.3 | % | 2.1 | % | 0.1 | % | 0.3 | % | ||||||||
Total Interest Bearing Debt to Normalized EBITDA |
| 15.0 |
| na |
| na |
| 2.1 |
| 2.4 |
| 2.9 |
| na |
| na |
| ||||||||
|
|
|
|
|
|
|
|
|
|
|
|
|
|
|
|
|
| ||||||||
Effectiveness and Efficiency |
|
|
|
|
|
|
|
|
|
|
|
|
|
|
|
|
| ||||||||
Premiums Receivable Turnover |
| na |
| 3.4 |
| 2.7 |
| 2.2 |
| 3.2 |
| 4.2 |
| 2.8 |
| 1.5 |
| ||||||||
Asset Turnover |
| na |
| 0.4 |
| 0.3 |
| 0.4 |
| 0.4 |
| 0.3 |
| 0.2 |
| 0.2 |
| ||||||||
Days Sales Outstanding |
| na |
| 105.8 |
| 134.2 |
| 166.5 |
| 113.8 |
| 64.4 |
| 98.2 |
| 236.2 |
| ||||||||
Days Payable Outstanding |
| na |
| 94.7 |
| 60.2 |
| 27.8 |
| 23.4 |
| 26.0 |
| 22.6 |
| 41.2 |
| ||||||||
Normalized EBIT to Average Assets |
| na |
| -2.3 | % | -2.7 | % | 2.7 | % | 2.0 | % | na |
| na |
| -1.5 | % | ||||||||
Normalized EBIT to Net Worth |
| na |
| -20.2 | % | -30.0 | % | 29.9 | % | 14.3 | % | na |
| na |
| -8.5 | % | ||||||||
Normalized EBITDA to Average Assets |
| na |
| -1.4 | % | -1.9 | % | 3.0 | % | 2.4 | % | na |
| na |
| -1.0 | % | ||||||||
Normalized EBITDA to Net Worth |
| na |
| -12.0 | % | -20.4 | % | 33.4 | % | 16.8 | % | na |
| na |
| -5.3 | % | ||||||||
Normalized Net Income to Average Assets |
| na |
| -2.8 | % | -3.5 | % | 2.1 | % | 1.6 | % | na |
| na |
| -1.9 | % | ||||||||
Normalized Net Income to Net Worth |
| na |
| -24.8 | % | -38.3 | % | 23.6 | % | 11.5 | % | na |
| na |
| -10.4 | % | ||||||||
Net Investment Yield |
| na |
| 7.4 | % | 8.5 | % | 6.8 | % | 6.0 | % | na |
| na |
| 5.2 | % | ||||||||
Loss Ratio |
| 110.7 | % | 86.3 | % | 97.2 | % | 53.6 | % | 60.2 | % | 73.2 | % | 79.8 | % | 53.4 | % | ||||||||
Sources of information: Company financial statements and management
29
|
| as of & for years ended December 31, |
| as of & for the 9 months ended |
| as of & for LTM |
| ||||||||||
|
| 1998 |
| 1999 |
| 2000 |
| 2001 |
| 2002 |
| 2002 |
| 2003 |
| 2003 |
|
Profitability Ratios (as % of Revenue) |
|
|
|
|
|
|
|
|
|
|
|
|
|
|
|
|
|
Loss & Loss Adjustment Expenses |
| 31.0 | % | 42.5 | % | 34.9 | % | 13.7 | % | 17.5 | % | 30.5 | % | 36.0 | % | 11.6 | % |
Total Operating Expenses |
| 101.0 | % | 105.8 | % | 108.3 | % | 92.3 | % | 94.6 | % | 95.2 | % | 109.5 | % | 106.6 | % |
Operating Income |
| -1.0 | % | -5.8 | % | -8.3 | % | 7.7 | % | 5.4 | % | 4.8 | % | -9.5 | % | -6.6 | % |
Pre-tax Income (Loss) |
| -2.3 | % | -6.9 | % | -10.3 | % | 6.4 | % | 5.0 | % | 4.5 | % | -9.6 | % | -6.7 | % |
Normalized Net Income (Loss) |
| -2.3 | % | -7.1 | % | -10.5 | % | 6.0 | % | 4.3 | % | 3.9 | % | -10.8 | % | -8.1 | % |
Normalized EBIT |
| -1.0 | % | -5.8 | % | -8.3 | % | 7.7 | % | 5.4 | % | 4.8 | % | -9.5 | % | -6.6 | % |
Normalized EBITDA |
| 1.6 | % | -3.4 | % | -5.6 | % | 8.5 | % | 6.3 | % | 5.6 | % | -7.1 | % | -4.2 | % |
|
|
|
|
|
|
|
|
|
|
|
|
|
|
|
|
|
|
Growth Rates |
|
|
|
|
|
|
|
|
|
|
|
|
|
|
|
|
|
Revenue |
| na |
| na |
| -13.9 | % | -19.2 | % | -5.2 | % | na |
| -49.0 | % | -45.3 | % |
Operating Income |
| na |
| na |
| na |
| na |
| -33.5 | % | na |
| -200.3 | % | -167.6 | % |
Pre-tax Income (Loss) |
| na |
| na |
| na |
| na |
| -25.1 | % | na |
| -208.0 | % | -173.0 | % |
Normalized Net Income (Loss) |
| na |
| na |
| na |
| na |
| -32.7 | % | na |
| -239.6 | % | -203.3 | % |
Normalized EBIT |
| na |
| na |
| na |
| na |
| -33.5 | % | na |
| -200.3 | % | -167.6 | % |
Normalized EBITDA |
| na |
| na |
| -411.7 | % | na |
| -30.3 | % | na |
| -164.0 | % | -136.3 | % |
Normalized Basic EPS |
| na |
| na |
| na |
| na |
| -34.1 | % | na |
| -240.0 | % | -206.9 | % |
Normalized Diluted EPS |
| na |
| na |
| na |
| na |
| -33.3 | % | na |
| -245.8 | % | -210.7 | % |
Total Assets |
| na |
| na |
| -42.3 | % | -11.7 | % | -11.3 | % | na |
| -29.6 | % | -21.5 | % |
Net Worth |
| na |
| na |
| -66.3 | % | 41.5 | % | 36.8 | % | na |
| 1.5 | % | -0.6 | % |
Tangible Net Worth |
| na |
| na |
| -50.0 | % | 69.4 | % | 50.2 | % | na |
| 5.7 | % | 3.0 | % |
CAPEX, net |
| na |
| na |
| -84.8 | % | 174.1 | % | 12.7 | % | na |
| -61.4 | % | -61.4 | % |
|
|
|
|
|
|
|
|
|
|
|
|
|
|
|
|
|
|
Cumulative Average Growth Rate (CAGR) Statistics |
|
|
|
|
|
|
|
|
|
|
|
|
|
|
|
|
|
Revenue |
| na |
| 33.1 | % | -7.2 | % | -11.4 | % | -9.9 | % | na |
| na |
| na |
|
Operating Income |
| na |
| na |
| na |
| na |
| na |
| na |
| na |
| na |
|
Pre-tax Income (Loss) |
| na |
| na |
| na |
| na |
| na |
| na |
| na |
| na |
|
Normalized Net Income (Loss) |
| na |
| na |
| na |
| na |
| na |
| na |
| na |
| na |
|
Normalized EBIT |
| na |
| na |
| na |
| na |
| na |
| na |
| na |
| na |
|
Normalized EBITDA |
| na |
| na |
| na |
| 56.4 | % | 27.8 | % | na |
| na |
| na |
|
Normalized Basic EPS |
| na |
| na |
| na |
| na |
| na |
| na |
| na |
| na |
|
Normalized Diluted EPS |
| na |
| na |
| na |
| na |
| na |
| na |
| na |
| na |
|
Total Assets |
| na |
| -13.8 | % | -24.0 | % | -20.1 | % | -18.0 | % | na |
| na |
| na |
|
Net Worth |
| na |
| -25.4 | % | -42.0 | % | -21.9 | % | -10.1 | % | na |
| na |
| na |
|
Tangible Net Worth |
| na |
| -54.5 | % | -29.3 | % | -5.4 | % | 6.2 | % | na |
| na |
| na |
|
CAPEX, net |
| na |
| 8.2 | % | -61.0 | % | -25.3 | % | -17.2 | % | na |
| na |
| na |
|
|
|
|
|
|
|
|
|
|
|
|
|
|
|
|
|
|
|
Depreciation & Capital Spending |
|
|
|
|
|
|
|
|
|
|
|
|
|
|
|
|
|
Depreciation to CAPEX, net |
| 151.9 | % | 169.5 | % | 871.2 | % | 85.4 | % | 74.5 | % | 59.7 | % | 247.4 | % | 285.8 | % |
CAPEX, net to Revenue |
| 1.7 | % | 1.4 | % | 0.3 | % | 1.0 | % | 1.2 | % | 1.3 | % | 1.0 | % | 0.9 | % |
Sources of information: Company financial statements and management
30
Selected Normalized Income Statement Graphs
($ in thousands, except per share)
| |
|
|
|
|
|
|
|
|
Sources of information: Company financial statements and management
31
Selected Normalized Profitability Cost (as % of Revenue) Graphs
|
|
|
|
|
|
|
|


32
Selected Normalized Financial Strength Graphs
($ in thousands)
|
|
|
|
|
|

Sources of information: Company financial statements and management
33
Selected Normalized Efficiency Graphs
|
|
|
|
|
|
|
|
|
|

Sources of information: Company financial statements and management
34
COMPANY MARKET PERFORMANCE
35
• Capitalink reviewed the daily closing market price and trading volume of the Company’s common stock over the one-year period ended November 3, 2003.
• Capitalink compared the daily closing market price performance of the Company’s common stock for the one-year period to both the Comparable Companies (as defined below) and the Russell 3000 Index.
• Capitalink calculated total trading volumes at various closing price ranges of the Company’s common stock. In addition, the number of trading days, and the respective percentages, at certain trading volumes, was set forth.
• Capitalink noted the following characteristics of the Company’s common stock:
• The Company’s stock has experienced limited liquidity with the average and median daily number of shares traded was 4,679 and 1,200 respectively. It was further noted that there was no volume on 69 trading days or approximately 27.3% of the available trading days.
• The Company’s average share price was $1.57 and ranged from a high of $2.05 to a low of $1.05 over the period. The Company’s common stock closed at $2.00 on November 3, 2003.
• The Company’s common stock increased 70.9%, while the Comparable Companies index rose 45.2% and the Russell 3000 Index rose 20.4%.
36
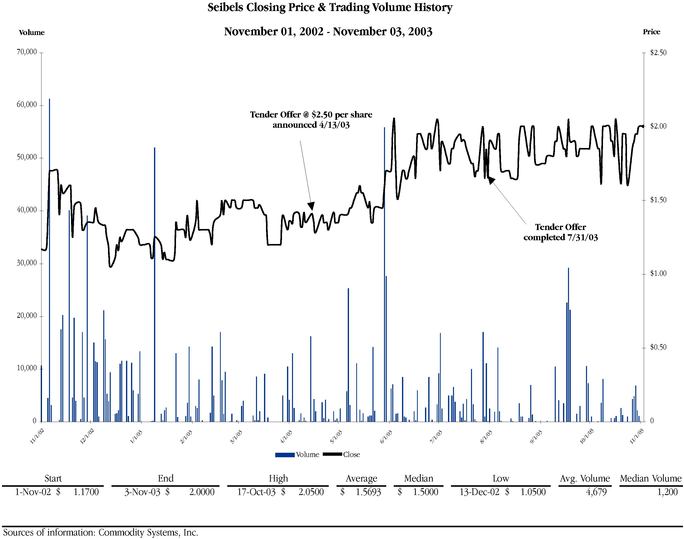
37

38
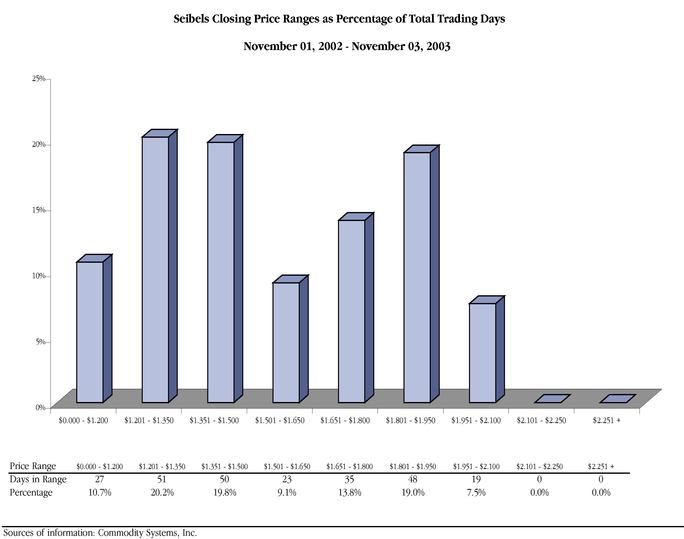
39
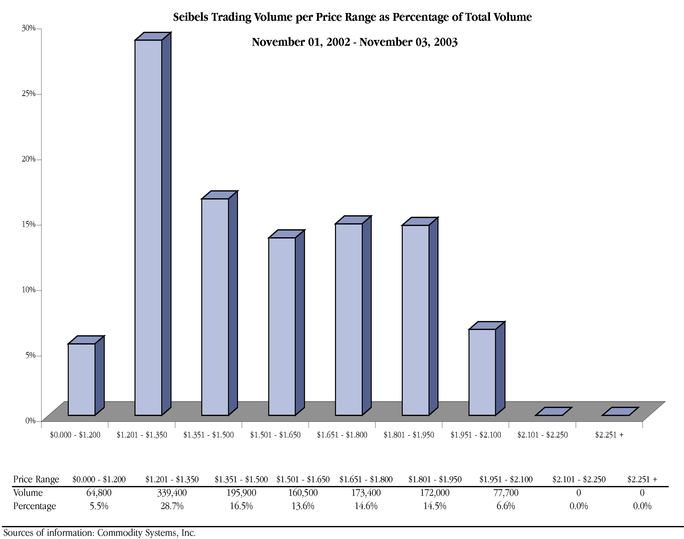
40
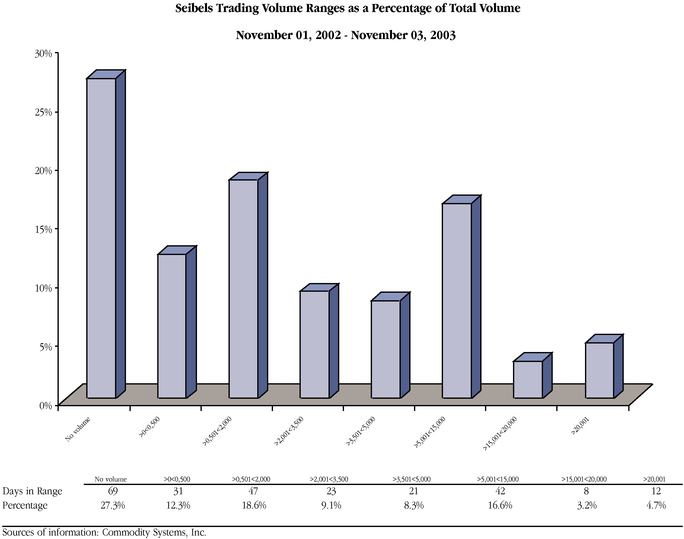
41
VALUATION ANALYSIS
42
METHODOLOGIES
• Based upon a review of the Company’s historical financial data, projections, and certain other qualitative data, Capitalink utilized several valuation methodologies to determine a range of values for the Company.
• Capitalink did not form a conclusion as to whether any individual analysis, considered in isolation, supported or failed to support its valuation range and its opinion as to the fairness of the Transaction, from a financial point of view, to the Company��s shareholders.
• Capitalink did not place any particular reliance or weight on any individual analysis, but instead concluded that the analyses, taken as a whole, supported its determination. Accordingly, the analyses must be considered as a whole and selecting portions of analyses or the factors considered, without considering all analyses and factors collectively, could create an incomplete and incorrect view of the process underlying the analyses in connection the valuation range and with the preparation of the opinion.
• The financial reviews and analyses include information presented in tabular format. In order to fully understand Capitalink’s financial review and analyses, the tables must be read together with the text of the presentation. The tables alone are not a complete description of the financial review and analyses and considering the tables alone could create a misleading or incomplete view of Capitalink’s financial review and analyses.
• The methodologies utilized by Capitalink included:
• A review of the historical and projected financial information of the Company as prepared by management.
• A review and comparison of the trading of, and the trading market for, the common stock of the Company, the Comparable Companies and a general market index over the last twelve months.
• A review of a discounted cash flow analysis of the Company, with sensitivity analyses based on a range of assumptions.
• A review and comparison of trading multiples for deemed comparable publicly-traded companies for the Company.
• A review and comparison of transaction multiples for deemed comparable transactions for the Company.
43
• A review and comparison of the premiums paid in recent going private transactions involving a reverse stock split.
• A review of the premiums implied by the Fractional Share Consideration.
• Capitalink noted that Instruction 2 to Item 1014 of SEC Regulation MA refers to certain factors that are important in determining the fairness of a transaction. It should be noted that this presentation does not present a liquidation analysis. Based upon discussions with management, and the regulatory nature of the Company’s operations, Capitalink determined that a liquidation analysis would not derive an indicated value in excess of book value and therefore such analysis was not warranted.
44
SUMMARY
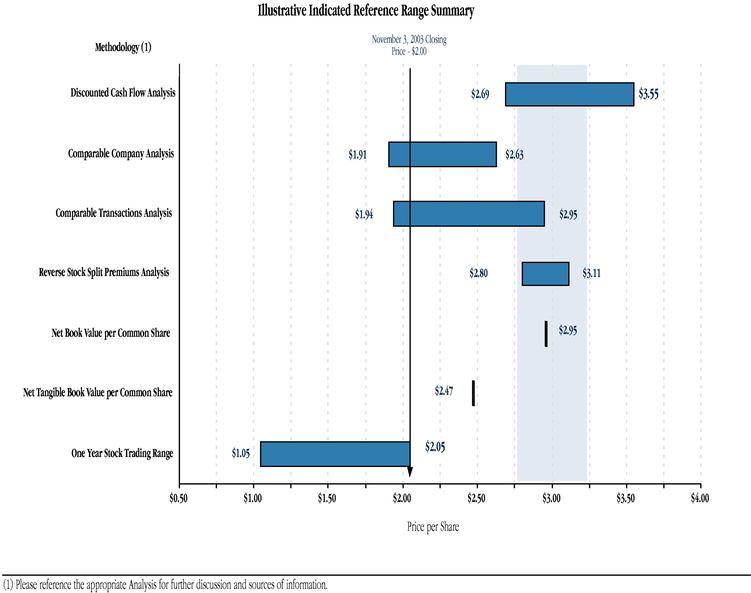
45
Indicated Reference Range Summary
($ in thousands, except per share)
Methodology (1) |
| Statistic |
| Selected Multiple Range |
| Indicated TIC Value |
| Indicated Equity Value |
| Indicated Share Price |
| |||||||||||||||
|
|
|
|
|
|
|
|
|
|
|
|
|
|
|
|
|
|
|
| |||||||
Discounted Cash Flow Analysis |
|
|
|
|
|
|
|
|
|
|
|
|
|
|
|
|
|
|
| |||||||
Revenue Terminal Multiple |
|
|
|
|
|
|
| $ | 29,369 | - | $ | 34,951 |
| $ | 21,369 | - | $ | 26,951 |
| $ | 2.68 | - | $ | 3.38 |
| |
EBITDA Terminal Multiple |
|
|
|
|
|
|
| $ | 29,858 | - | $ | 35,363 |
| $ | 21,858 | - | $ | 27,363 |
| $ | 2.74 | - | $ | 3.43 |
| |
Perpetual Growth Terminal Value |
|
|
|
|
|
|
| $ | 29,206 | - | $ | 38,656 |
| $ | 21,206 | - | $ | 30,656 |
| $ | 2.66 | - | $ | 3.84 |
| |
Indicated Reference Range |
|
|
|
|
|
|
|
|
|
|
|
|
|
|
| $ | 2.69 | - | $ | 3.55 |
| |||||
|
|
|
|
|
|
|
|
|
|
|
|
|
|
|
|
|
|
|
| |||||||
Comparable Company Analysis |
|
|
|
|
|
|
|
|
|
|
|
|
|
|
|
|
|
|
| |||||||
Market Value as a Multiple of: |
|
|
|
|
|
|
|
|
|
|
|
|
|
|
|
|
|
|
| |||||||
Net Tangible Equity 9/30/03 |
| $ | 19,272 |
| 1.0x | - | 1.2x |
|
|
|
|
| $ | 19,272 | - | $ | 22,498 |
| $ | 2.41 | - | $ | 2.82 |
| ||
Total Invested Capital as Multiple of: |
|
|
|
|
|
|
|
|
|
|
|
|
|
|
|
|
|
|
| |||||||
LTM Revenue 9/30/03 |
| $ | 29,387 |
| 0.72x | - | 0.89x |
| $ | 21,049 | - | $ | 26,050 |
| $ | 13,049 | - | $ | 18,050 |
| $ | 1.64 | - | $ | 2.26 |
|
Average Revenue (FY2001-LTM 2003) |
| $ | 46,606 |
| 0.72x | - | 0.89x |
| $ | 33,383 | - | $ | 41,313 |
| $ | 25,383 | - | $ | 33,313 |
| $ | 3.18 | - | $ | 4.17 |
|
Average EBITDA (FY2001-LTM 2003) |
| $ | 2,326 |
| 8.0x | - | 11.0x |
| $ | 18,608 | - | $ | 25,656 |
| $ | 10,608 | - | $ | 17,656 |
| $ | 1.33 | - | $ | 2.21 |
|
Average EBIT (FY2001-LTM 2003) |
| $ | 1,757 |
| 9.0x | - | 12.1x |
| $ | 15,813 | - | $ | 21,337 |
| $ | 7,813 | - | $ | 13,337 |
| $ | 0.98 | - | $ | 1.67 |
|
Indicated Reference Range |
|
|
|
|
|
|
|
|
|
|
|
|
|
|
| $ | 1.91 | - | $ | 2.63 |
| |||||
|
|
|
|
|
|
|
|
|
|
|
|
|
|
|
|
|
|
|
| |||||||
Comparable Transactions Analysis |
|
|
|
|
|
|
|
|
|
|
|
|
|
|
|
|
|
|
| |||||||
Market Value as a Multiple of: |
|
|
|
|
|
|
|
|
|
|
|
|
|
|
|
|
|
|
| |||||||
Net Common Equity 9/30/03 |
| $ | 23,085 |
| 0.8x | - | 1.2x |
|
|
|
|
| $ | 18,468 | - | $ | 27,702 |
| $ | 2.31 | - | $ | 3.47 |
| ||
Total Invested Capital as Multiple of: |
|
|
|
|
|
|
|
|
|
|
|
|
|
|
|
|
|
|
| |||||||
LTM Revenue 9/30/03 |
| $ | 29,387 |
| 0.65x | - | 0.94x |
| $ | 19,216 | - | $ | 27,708 |
| $ | 11,216 | - | $ | 19,708 |
| $ | 1.41 | - | $ | 2.47 |
|
Average Revenue (FY2001-LTM 2003) |
| $ | 46,606 |
| 0.65x | - | 0.94x |
| $ | 30,475 | - | $ | 43,944 |
| $ | 22,475 | - | $ | 35,944 |
| $ | 2.82 | - | $ | 4.50 |
|
Average EBITDA (FY2001-LTM 2003) |
| $ | 2,326 |
| 7.6x | - | 8.1x |
| $ | 17,629 | - | $ | 18,783 |
| $ | 9,629 | - | $ | 10,783 |
| $ | 1.21 | - | $ | 1.35 |
|
Indicated Reference Range |
|
|
|
|
|
|
|
|
|
|
|
|
|
|
| $ | 1.94 | - | $ | 2.95 |
| |||||
|
|
|
|
|
|
|
|
|
|
|
|
|
|
|
|
|
|
|
| |||||||
Reverse Stock Split Premiums Analysis |
|
|
|
|
|
|
|
|
|
|
|
|
|
|
|
|
|
|
| |||||||
Prior One Day |
| $ | 2.00 |
| 44.8% | - | 68.6% |
|
|
|
|
|
|
|
|
| $ | 2.90 | - | $ | 3.37 |
| ||||
Prior Five Day |
| $ | 1.85 |
| 44.3% | - | 65.4% |
|
|
|
|
|
|
|
|
| $ | 2.67 | - | $ | 3.06 |
| ||||
Prior 30 Day |
| $ | 2.00 |
| 42.2% | - | 45.2% |
|
|
|
|
|
|
|
|
| $ | 2.84 | - | $ | 2.90 |
| ||||
Indicated Reference Range |
|
|
|
|
|
|
|
|
|
|
|
|
|
|
| $ | 2.80 | - | $ | 3.11 |
| |||||
|
|
|
|
|
|
|
|
|
|
|
|
|
|
|
|
|
|
|
| |||||||
Net Book Value Review (as of September 30, 2003) |
|
|
|
|
|
|
|
|
|
|
|
|
|
|
|
|
|
|
| |||||||
Net Book Value per Common Share |
| $ | 2.95 |
|
|
|
|
|
|
|
|
|
|
|
|
|
|
|
|
| ||||||
Net Tangible Book Value per Common Share |
| $ | 2.47 |
|
|
|
|
|
|
|
|
|
|
|
|
|
|
|
|
| ||||||
(1) Please reference the appropriate Analysis for further discussion and sources of information.
46
DISCOUNTED CASH FLOW ANALYSIS
• The discounted cash flow analysis estimates value based upon a company’s projected future free cash flow discounted at a rate reflecting risks inherent in its business and capital structure. Unlevered free cash flow represents the amount of cash generated and available for principal, interest and dividend payments after providing for ongoing business operations.
• While the discounted cash flow analysis is the most scientific of the methodologies, it is dependent on projections and is further dependent on numerous industry-specific and macroeconomic factors.
• Capitalink utilized the forecasts provided by Company management, which show a gradual increase in revenue between 2004 and 2008 from $42.6 million to $61.7 million. For the forecast period, the Company projects an increase in EBITDA from approximately $255,000 for FY2004, to approximately $5.9 million for FY2008.
• The projected change in working capital was also estimated based on the projected cash inflows and outflows of the Company’s risk bearing and non-risk bearing operations.
• In order to arrive at a present value, Capitalink utilized discount rates ranging from 14.5% to 16.5%. This was based on an estimated weighted average cost of capital (“WACC”) of 15.7% (based on the Company’s 4.9% cost of preferred stock and 19.5% estimated cost of equity).
• Capitalink presented a range of terminal values at the end of the forecast period by applying a range of multiples to each of the operations FY2008 projected revenue and EBITDA.
• In addition, Capitalink presented a perpetual growth scenario whereby ranges of growth rates were applied to the operation’s FY2008 free cash flows in order to determine a terminal value, rather than multiples.
• In each of the scenarios noted above, a range of total invested capital (“TIC”) values was derived for the Company’s business.
47
• The results of the discounted cash flow analysis under the three terminal value scenarios were as follows:
• Utilizing the revenue terminal scenario (range of 0.65 times to 0.75 times), Capitalink calculated a range of indicated TIC values from $29.4 million to $35.0 million.
• Utilizing the EBITDA terminal scenario (range of 7.0 times to 8.0 times), Capitalink calculated a range of indicated TIC values from $29.9 million to $35.4 million.
• Utilizing a perpetual growth scenario (growth rates of 5.0% to 6.0%), Capitalink calculated a range of indicated TIC values from $29.2 million to $38.7 million.
• The total enterprise values above were then reduced by the Company’s preferred stock of $8.0 million to arrive at an equity value range.
• Taking into account the TIC value ranges in all three terminal value scenarios, the Company’s preferred stock of $8.0 million, and common stock equivalents of 7.98 million, including in-the-money (“ITM”) options, Capitalink determined a range of indicated common stock shares prices of between $2.69 and $3.55.
48
DCF Analysis - Indicated Reference Range
($ in thousands, except per share)
|
| Selected Multiple Range |
| Indicated TIC Value |
| Indicated Equity Value (1) |
| Indicated Share Price (2) |
| ||||||||||||||
|
|
|
|
|
|
|
|
|
|
|
|
|
|
|
|
|
| ||||||
LTM Revenue Terminal Multiple |
| 0.65x | - | 0.75x |
| $ | 29,369 | - | $ | 34,951 |
| $ | 21,369 |
| $ | 26,951 |
| $ | 2.68 | - | $ | 3.38 |
|
|
|
|
|
|
|
|
|
|
|
|
|
|
|
|
|
|
| ||||||
LTM EBITDA Terminal Multiple |
| 7.0x | - | 8.0x |
| $ | 29,858 | - | $ | 35,363 |
| $ | 21,858 |
| $ | 27,363 |
| $ | 2.74 | - | $ | 3.43 |
|
|
|
|
|
|
|
|
|
|
|
|
|
|
|
|
|
|
| ||||||
Perpetual Growth Method |
| 5.0% | - | 6.0% |
| $ | 29,206 | - | $ | 38,656 |
| $ | 21,206 |
| $ | 30,656 |
| $ | 2.66 | - | $ | 3.84 |
|
|
|
|
|
|
|
|
|
|
|
|
|
|
|
|
|
|
| ||||||
Indicated Reference Range |
|
|
|
|
|
|
|
|
|
|
|
|
| $ | 2.69 | - | $ | 3.55 |
| ||||
(1) Adjusted for $8,000 total debt as of September 30, 2003.
(2) Based upon and assumes 7,981 shares and in the money options/warrants outstanding.
49
DCF Analysis - Estimated Ranges
($ in thousands, except per share)
Revenue Terminal Value Analysis
Discount |
| Estimated Range of Enterprise Values |
| Estimated Range of Equity Values |
| Estimated Range of Equity Values Per Share |
| |||||||||||||||||||||||||||||||||||||||
|
| 0.650x |
| 0.675x |
| 0.700x |
| 0.725x |
| 0.750x |
| 0.650x |
| 0.675x |
| 0.700x |
| 0.725x |
| 0.750x |
| 0.650x |
| 0.675x |
| 0.700x |
| 0.725x |
| 0.750x |
| |||||||||||||||
|
|
|
|
|
|
|
|
|
|
|
|
|
|
|
|
|
|
|
|
|
|
|
|
|
|
|
|
|
|
|
| |||||||||||||||
14.5% |
| $ | 32,086 |
| $ | 32,802 |
| $ | 33,518 |
| $ | 34,235 |
| $ | 34,951 |
| $ | 24,086 |
| $ | 24,802 |
| $ | 25,518 |
| $ | 26,235 |
| $ | 26,951 |
| $ | 3.02 |
| $ | 3.11 |
| $ | 3.20 |
| $ | 3.29 |
| $ | 3.38 |
|
15.0% |
| $ | 31,380 |
| $ | 32,079 |
| $ | 32,777 |
| $ | 33,476 |
| $ | 34,175 |
| $ | 23,380 |
| $ | 24,079 |
| $ | 24,777 |
| $ | 25,476 |
| $ | 26,175 |
| $ | 2.93 |
| $ | 3.02 |
| $ | 3.10 |
| $ | 3.19 |
| $ | 3.28 |
|
15.5% |
| $ | 30,692 |
| $ | 31,374 |
| $ | 32,056 |
| $ | 32,737 |
| $ | 33,419 |
| $ | 22,692 |
| $ | 23,374 |
| $ | 24,056 |
| $ | 24,737 |
| $ | 25,419 |
| $ | 2.84 |
| $ | 2.93 |
| $ | 3.01 |
| $ | 3.10 |
| $ | 3.18 |
|
16.0% |
| $ | 30,022 |
| $ | 30,687 |
| $ | 31,352 |
| $ | 32,018 |
| $ | 32,683 |
| $ | 22,022 |
| $ | 22,687 |
| $ | 23,352 |
| $ | 24,018 |
| $ | 24,683 |
| $ | 2.76 |
| $ | 2.84 |
| $ | 2.93 |
| $ | 3.01 |
| $ | 3.09 |
|
16.5% |
| $ | 29,369 |
| $ | 30,018 |
| $ | 30,667 |
| $ | 31,317 |
| $ | 31,966 |
| $ | 21,369 |
| $ | 22,018 |
| $ | 22,667 |
| $ | 23,317 |
| $ | 23,966 |
| $ | 2.68 |
| $ | 2.76 |
| $ | 2.84 |
| $ | 2.92 |
| $ | 3.00 |
|
|
|
|
|
|
|
|
|
|
|
|
|
|
|
|
|
|
|
|
|
|
|
|
|
|
|
|
|
|
|
|
| |||||||||||||||
|
|
|
| Average |
| $ | 32,074 |
|
|
|
|
|
|
| Average |
| $ | 24,074 |
|
|
|
|
|
|
| Average |
| $ | 3.02 |
|
|
|
|
| ||||||||||||
EBITDA Terminal Value Analysis
Discount |
| Estimated Range of Enterprise Values |
| Estimated Range of Equity Values |
| Estimated Range of Equity Values Per Share |
| |||||||||||||||||||||||||||||||||||||||
|
| 7.00x |
| 7.25x |
| 7.50x |
| 7.75x |
| 8.00x |
| 7.00x |
| 7.25x |
| 7.50x |
| 7.75x |
| 8.00x |
| 7.00x |
| 7.25x |
| 7.50x |
| 7.75x |
| 8.00x |
| |||||||||||||||
|
|
|
|
|
|
|
|
|
|
|
|
|
|
|
|
|
|
|
|
|
|
|
|
|
|
|
|
|
|
|
| |||||||||||||||
14.5% |
| $ | 32,625 |
| $ | 33,310 |
| $ | 33,994 |
| $ | 34,678 |
| $ | 35,363 |
| $ | 24,625 |
| $ | 25,310 |
| $ | 25,994 |
| $ | 26,678 |
| $ | 27,363 |
| $ | 3.09 |
| $ | 3.17 |
| $ | 3.26 |
| $ | 3.34 |
| $ | 3.43 |
|
15.0% |
| $ | 31,906 |
| $ | 32,574 |
| $ | 33,241 |
| $ | 33,909 |
| $ | 34,577 |
| $ | 23,906 |
| $ | 24,574 |
| $ | 25,241 |
| $ | 25,909 |
| $ | 26,577 |
| $ | 3.00 |
| $ | 3.08 |
| $ | 3.16 |
| $ | 3.25 |
| $ | 3.33 |
|
15.5% |
| $ | 31,205 |
| $ | 31,857 |
| $ | 32,508 |
| $ | 33,160 |
| $ | 33,811 |
| $ | 23,205 |
| $ | 23,857 |
| $ | 24,508 |
| $ | 25,160 |
| $ | 25,811 |
| $ | 2.91 |
| $ | 2.99 |
| $ | 3.07 |
| $ | 3.15 |
| $ | 3.23 |
|
16.0% |
| $ | 30,523 |
| $ | 31,159 |
| $ | 31,794 |
| $ | 32,430 |
| $ | 33,066 |
| $ | 22,523 |
| $ | 23,159 |
| $ | 23,794 |
| $ | 24,430 |
| $ | 25,066 |
| $ | 2.82 |
| $ | 2.90 |
| $ | 2.98 |
| $ | 3.06 |
| $ | 3.14 |
|
16.5% |
| $ | 29,858 |
| $ | 30,478 |
| $ | 31,099 |
| $ | 31,719 |
| $ | 32,339 |
| $ | 21,858 |
| $ | 22,478 |
| $ | 23,099 |
| $ | 23,719 |
| $ | 24,339 |
| $ | 2.74 |
| $ | 2.82 |
| $ | 2.89 |
| $ | 2.97 |
| $ | 3.05 |
|
|
|
|
|
|
|
|
|
|
|
|
|
|
|
|
|
|
|
|
|
|
|
|
|
|
|
|
|
|
|
|
| |||||||||||||||
|
|
|
| Average |
| $ | 32,527 |
|
|
|
|
|
|
| Average |
| $ | 24,527 |
|
|
|
|
|
|
| Average |
| $ | 3.07 |
|
|
|
|
| ||||||||||||
Perpetual Growth Terminal Value Analysis
Discount |
| Estimated Range of Enterprise Values |
| Estimated Range of Equity Values |
| Estimated Range of Equity Values Per Share |
| |||||||||||||||||||||||||||||||||||||||
|
| 5.00% |
| 5.25% |
| 5.50% |
| 5.75% |
| 6.00% |
| 5.00% |
| 5.25% |
| 5.50% |
| 5.75% |
| 6.00% |
| 5.00% |
| 5.25% |
| 5.50% |
| 5.75% |
| 6.00% |
| |||||||||||||||
|
|
|
|
|
|
|
|
|
|
|
|
|
|
|
|
|
|
|
|
|
|
|
|
|
|
|
|
|
|
|
| |||||||||||||||
14.5% |
| $ | 35,788 |
| $ | 36,447 |
| $ | 37,143 |
| $ | 37,878 |
| $ | 38,656 |
| $ | 27,788 |
| $ | 28,447 |
| $ | 29,143 |
| $ | 29,878 |
| $ | 30,656 |
| $ | 3.48 |
| $ | 3.56 |
| $ | 3.65 |
| $ | 3.74 |
| $ | 3.84 |
|
15.0% |
| $ | 33,903 |
| $ | 34,485 |
| $ | 35,097 |
| $ | 35,743 |
| $ | 36,425 |
| $ | 25,903 |
| $ | 26,485 |
| $ | 27,097 |
| $ | 27,743 |
| $ | 28,425 |
| $ | 3.25 |
| $ | 3.32 |
| $ | 3.40 |
| $ | 3.48 |
| $ | 3.56 |
|
15.5% |
| $ | 32,193 |
| $ | 32,709 |
| $ | 33,252 |
| $ | 33,822 |
| $ | 34,422 |
| $ | 24,193 |
| $ | 24,709 |
| $ | 25,252 |
| $ | 25,822 |
| $ | 26,422 |
| $ | 3.03 |
| $ | 3.10 |
| $ | 3.16 |
| $ | 3.24 |
| $ | 3.31 |
|
16.0% |
| $ | 30,633 |
| $ | 31,094 |
| $ | 31,577 |
| $ | 32,083 |
| $ | 32,615 |
| $ | 22,633 |
| $ | 23,094 |
| $ | 23,577 |
| $ | 24,083 |
| $ | 24,615 |
| $ | 2.84 |
| $ | 2.89 |
| $ | 2.95 |
| $ | 3.02 |
| $ | 3.08 |
|
16.5% |
| $ | 29,206 |
| $ | 29,619 |
| $ | 30,050 |
| $ | 30,502 |
| $ | 30,975 |
| $ | 21,206 |
| $ | 21,619 |
| $ | 22,050 |
| $ | 22,502 |
| $ | 22,975 |
| $ | 2.66 |
| $ | 2.71 |
| $ | 2.76 |
| $ | 2.82 |
| $ | 2.88 |
|
|
|
|
|
|
|
|
|
|
|
|
|
|
|
|
|
|
|
|
|
|
|
|
|
|
|
|
|
|
|
|
| |||||||||||||||
|
|
|
| Average |
| $ | 33,453 |
|
|
|
|
|
|
| Average |
| $ | 25,453 |
|
|
|
|
|
|
| Average |
| $ | 3.19 |
|
|
|
|
| ||||||||||||
All Discounted amounts have been calculated utilizing a mid-year convention.
Sources of information: Company financials, projections and management.
50
DCF Analysis - Free Cash Flow Projections
($ in thousands)
|
| Historical |
| Projected |
| |||||||||||||||||
|
| FYE |
| LTM |
| FYE Dec 31 |
| |||||||||||||||
2004 |
| 2005 |
| 2006 |
| 2007 |
| 2008 | ||||||||||||||
|
|
|
|
|
|
|
|
|
|
|
|
|
|
|
| |||||||
Free Cash Flows |
|
|
|
|
|
|
|
|
|
|
|
|
|
|
| |||||||
|
|
|
|
|
|
|
|
|
|
|
|
|
|
|
| |||||||
Net Premiums |
| $ | 15,661 |
| $ | 6,378 |
| $ | 18,279 |
| $ | 21,886 |
| $ | 24,959 |
| $ | 28,238 |
| $ | 31,661 |
|
Comm & Service Income |
| 33,853 |
| 19,064 |
| 22,106 |
| 25,007 |
| 23,097 |
| 24,887 |
| 27,429 |
| |||||||
Investment Income |
| 5,254 |
| 2,526 |
| 1,641 |
| 1,695 |
| 1,751 |
| 1,808 |
| 1,867 |
| |||||||
Other |
| 1,398 |
| 1,419 |
| 557 |
| 610 |
| 665 |
| 701 |
| 751 |
| |||||||
|
| 56,166 |
| 29,387 |
| 42,583 |
| 49,198 |
| 50,472 |
| 55,634 |
| 61,708 |
| |||||||
|
|
|
|
|
|
|
|
|
|
|
|
|
|
|
| |||||||
Losses & LAE |
| 9,434 |
| 3,407 |
| 12,344 |
| 14,338 |
| 16,243 |
| 18,219 |
| 20,342 |
| |||||||
Other Costs |
| 40,951 |
| 27,772 |
| 29,984 |
| 31,948 |
| 31,875 |
| 33,773 |
| 35,470 |
| |||||||
|
| 50,385 |
| 31,179 |
| 42,328 |
| 46,286 |
| 48,118 |
| 51,992 |
| 55,812 |
| |||||||
|
|
|
|
|
|
|
|
|
|
|
|
|
|
|
| |||||||
EBITDA |
| 5,781 |
| (1,792 | ) | 255 |
| 2,912 |
| 2,354 |
| 3,642 |
| 5,896 |
| |||||||
|
|
|
|
|
|
|
|
|
|
|
|
|
|
|
| |||||||
Deprec. & Amort. |
| 488 |
| 723 |
| 316 |
| 233 |
| 203 |
| 111 |
| 100 |
| |||||||
|
|
|
|
|
|
|
|
|
|
|
|
|
|
|
| |||||||
EBIT |
| 5,293 |
| (2,515 | ) | (61 | ) | 2,679 |
| 2,151 |
| 3,531 |
| 5,796 |
| |||||||
|
|
|
|
|
|
|
|
|
|
|
|
|
|
|
| |||||||
Income Taxes |
| — |
| — |
| — |
| — |
| — |
| — |
| — |
| |||||||
|
|
|
|
|
|
|
|
|
|
|
|
|
|
|
| |||||||
Unlevered After-tax Income |
| 5,293 |
| (2,515 | ) | (61 | ) | 2,679 |
| 2,151 |
| 3,531 |
| 5,796 |
| |||||||
|
|
|
|
|
|
|
|
|
|
|
|
|
|
|
| |||||||
Add: Deprec. & Amort. |
| 488 |
| 723 |
| 316 |
| 233 |
| 203 |
| 111 |
| 100 |
| |||||||
Add: Change in Net WC |
| — |
| (2,511 | ) | (5,539 | ) | 1,721 |
| 3,853 |
| 4,402 |
| 4,879 |
| |||||||
Less: Capital Expenditures |
| 655 |
| 253 |
| 100 |
| 100 |
| 100 |
| 100 |
| 100 |
| |||||||
|
|
|
|
|
|
|
|
|
|
|
|
|
|
|
| |||||||
Unlevered Free Cash Flows |
| $ | 5,126 |
| $ | (4,556 | ) | $ | (5,384 | ) | $ | 4,533 |
| $ | 6,107 |
| $ | 7,944 |
| $ | 10,675 |
|
|
|
|
|
|
|
|
|
|
|
|
|
|
|
|
| |||||||
Losses & LAE % Net Prem |
| 60.2 | % | 53.4 | % | 67.5 | % | 65.5 | % | 65.1 | % | 64.5 | % | 64.2 | % | |||||||
|
| Historical |
| Projected |
| ||||||||
FYE Dec 31 | |||||||||||||
2004 |
| 2005 |
| 2006 |
| 2007 |
| 2008 | |||||
|
|
|
|
|
|
|
|
|
|
|
|
|
|
Growth Analysis |
|
|
|
|
|
|
|
|
|
|
|
|
|
|
|
|
|
|
|
|
|
|
|
|
|
|
|
Net Premiums |
| na |
| 186.6 | % | 19.7 | % | 14.0 | % | 13.1 | % | 12.1 | % |
Comm & Service Income |
| na |
| 16.0 | % | 13.1 | % | -7.6 | % | 7.7 | % | 10.2 | % |
Investment Income |
| na |
| -35.0 | % | 3.3 | % | 3.3 | % | 3.3 | % | 3.3 | % |
Other |
| na |
| -60.7 | % | 9.5 | % | 9.0 | % | 5.4 | % | 7.1 | % |
|
| na |
| 44.9 | % | 15.5 | % | 2.6 | % | 10.2 | % | 10.9 | % |
|
|
|
|
|
|
|
|
|
|
|
|
|
|
Losses & LAE |
| na |
| 262.3 | % | 16.2 | % | 13.3 | % | 12.2 | % | 11.7 | % |
Other Costs |
| na |
| 8.0 | % | 6.6 | % | -0.2 | % | 6.0 | % | 5.0 | % |
|
| na |
| 35.8 | % | 9.4 | % | 4.0 | % | 8.1 | % | 7.3 | % |
|
|
|
|
|
|
|
|
|
|
|
|
|
|
EBITDA |
| na |
| na |
| 1042.0 | % | -19.2 | % | 54.7 | % | 61.9 | % |
|
|
|
|
|
|
|
|
|
|
|
|
|
|
Deprec. & Amort. |
| na |
| -56.3 | % | -26.3 | % | -12.9 | % | -45.3 | % | -9.9 | % |
|
|
|
|
|
|
|
|
|
|
|
|
|
|
EBIT |
| na |
| na |
| na |
| -19.7 | % | 64.2 | % | 64.1 | % |
|
|
|
|
|
|
|
|
|
|
|
|
|
|
Income Taxes |
| na |
| na |
| na |
| na |
| na |
| na |
|
|
|
|
|
|
|
|
|
|
|
|
|
|
|
Unlevered After-tax Income |
| na |
| na |
| na |
| -19.7 | % | 64.2 | % | 64.1 | % |
|
|
|
|
|
|
|
|
|
|
|
|
|
|
Add: Deprec. & Amort. |
| na |
| -56.3 | % | -26.3 | % | -12.9 | % | -45.3 | % | -9.9 | % |
Add: Change in Net WC |
| na |
| na |
| na |
| 123.9 | % | 14.2 | % | 10.8 | % |
Less: Capital Expenditures |
| na |
| -60.5 | % | 0.0 | % | 0.0 | % | 0.0 | % | 0.0 | % |
|
|
|
|
|
|
|
|
|
|
|
|
|
|
Unlevered Free Cash Flows |
| na |
| na |
| na |
| 34.7 | % | 30.1 | % | 34.4 | % |
|
|
|
|
|
|
|
|
|
|
|
|
|
|
Profitability Analysis |
|
|
|
|
|
|
|
|
|
|
|
|
|
|
|
|
|
|
|
|
|
|
|
|
|
|
|
EBITDA |
| 10.3 | % | 0.6 | % | 5.9 | % | 4.7 | % | 6.5 | % | 9.6 | % |
EBIT |
| 9.4 | % | -0.1 | % | 5.4 | % | 4.3 | % | 6.3 | % | 9.4 | % |
Unlevered After-tax Income |
| 9.4 | % | -0.1 | % | 5.4 | % | 4.3 | % | 6.3 | % | 9.4 | % |
Sources of information: Company financials, projections and management.
51
DCF Analysis - Working Capital and Income Tax
($ in thousands)
|
| Historical |
| Projected |
| |||||||||||||||||
|
| FYE |
| LTM |
| FYE Dec 31 |
| |||||||||||||||
2004 |
| 2005 |
| 2006 |
| 2007 |
| 2008 | ||||||||||||||
|
|
|
|
|
|
|
|
|
|
|
|
|
|
|
| |||||||
Net Working Capital |
|
|
|
|
|
|
|
|
|
|
|
|
|
|
| |||||||
|
|
|
|
|
|
|
|
|
|
|
|
|
|
|
| |||||||
Total Receivables |
| 41,567 |
| 39,560 |
|
|
|
|
|
|
|
|
|
|
| |||||||
Other Assets |
| 36,962 |
| 12,902 |
|
|
|
|
|
|
|
|
|
|
| |||||||
Loss Adjustment Expenses |
| 53,710 |
| 51,187 |
|
|
|
|
|
|
|
|
|
|
| |||||||
Unearned Premiums |
| 36,358 |
| 15,762 |
|
|
|
|
|
|
|
|
|
|
| |||||||
Other Liabilities |
| 12,382 |
| 6,923 |
|
|
|
|
|
|
|
|
|
|
| |||||||
Non-Cash Net WC |
| $ | (23,921 | ) | $ | (21,410 | ) |
|
|
|
|
|
|
|
|
|
| |||||
|
|
|
|
|
|
|
|
|
|
|
|
|
|
|
| |||||||
Working Capital % Sales |
| -42.6 | % | -72.9 | % |
|
|
|
|
|
|
|
|
|
| |||||||
|
|
|
|
|
|
|
|
|
|
|
|
|
|
|
| |||||||
Change in Working Capital |
|
|
| $ | (2,511 | ) |
|
|
|
|
|
|
|
|
|
| ||||||
|
|
|
|
|
|
|
|
|
|
|
|
|
|
|
| |||||||
Projected Net Operating Cash Flow |
|
|
|
|
| $ | (5,284 | ) | $ | 4,633 |
| $ | 6,207 |
| $ | 8,044 |
| $ | 10,775 |
| ||
Less EBITDA |
|
|
|
|
| 255 |
| 2,912 |
| 2,354 |
| 3,642 |
| 5,896 |
| |||||||
Change in Working Capital |
|
|
|
|
| $ | (5,539 | ) | $ | 1,721 |
| $ | 3,853 |
| $ | 4,402 |
| $ | 4,879 |
| ||
|
| Historical |
| Projected |
| |||||||||||||||||
|
| FYE |
| LTM |
| FYE Dec 31 |
| |||||||||||||||
2004 |
| 2005 |
| 2006 |
| 2007 |
| 2008 | ||||||||||||||
|
|
|
|
|
|
|
|
|
|
|
|
|
|
|
| |||||||
Income Tax Expense and Assumptions |
|
|
|
|
|
|
|
|
|
|
|
|
|
|
| |||||||
|
|
|
|
|
|
|
|
|
|
|
|
|
|
|
| |||||||
Statutory Tax Rate |
| 34.0 | % | 34.0 | % | 34.0 | % | 34.0 | % | 34.0 | % | 34.0 | % | 34.0 | % | |||||||
Effective Tax Rate |
| 0.0 | % | 0.0 | % | 0.0 | % | 0.0 | % | 0.0 | % | 0.0 | % | 0.0 | % | |||||||
|
|
|
|
|
|
|
|
|
|
|
|
|
|
|
| |||||||
EBT |
| $ | 5,293 |
| $ | (2,515 | ) | $ | (61 | ) | $ | 2,679 |
| $ | 2,151 |
| $ | 3,531 |
| $ | 5,796 |
|
|
|
|
|
|
|
|
|
|
|
|
|
|
|
|
| |||||||
Current Period Tax |
| $ | 1,800 |
| $ | (855 | ) | $ | (21 | ) | $ | 911 |
| $ | 731 |
| $ | 1,201 |
| $ | 1,971 |
|
NOL Usage |
| (1,800 | ) | 855 |
| 21 |
| (911 | ) | (731 | ) | (1,201 | ) | (1,971 | ) | |||||||
|
|
|
|
|
|
|
|
|
|
|
|
|
|
|
| |||||||
Income Tax Expense |
| $ | — |
| $ | — |
| $ | — |
| $ | — |
| $ | — |
| $ | — |
| $ | — |
|
|
|
|
|
|
|
|
|
|
|
|
|
|
|
|
| |||||||
NOL Balance |
|
|
|
|
|
|
|
|
|
|
|
|
|
|
| |||||||
Pre-1998 |
|
|
| $ | 2,205 |
| $ | 2,205 |
| $ | 2,205 |
| $ | 2,205 |
| $ | 2,205 |
| $ | 2,205 |
| |
Post 1998 |
|
|
| 6,428 |
| 6,489 |
| 6,015 |
| 6,015 |
| 4,689 |
| 1,098 |
| |||||||
Useable NOL Balance |
|
|
| $ | 8,633 |
| $ | 8,694 |
| $ | 8,220 |
| $ | 8,220 |
| $ | 6,894 |
| $ | 3,303 |
| |
Sources of information: Company financials, projections and management.
52
DCF Analysis - Cost of Capital, Net Debt & Stock Equivalents
($ in thousands, except per share)
Cost of Equity
Riskless (1) |
|
|
|
20 year treasury coupon (Rf) |
| 5.2 | % |
Risk (2) |
|
|
|
Equity risk premium (EP) |
| 7.0 | % |
Industry risk premium (IP) |
| -3.9 | % |
Size Premium (SP) |
| 9.2 | % |
Company Specific |
| 2.0 | % |
Litigation |
|
|
|
Replacement & new revenue sources |
|
|
|
Regulatory oversight |
|
|
|
|
| 19.5 | % |
Cost of Debt
Type of Debt |
| Nominal |
| Amount |
| % of |
| Weighted |
| |
|
|
|
|
|
|
|
|
|
| |
Preferred Stock |
| 4.90 | % | $ | 8,000 |
| 100.0 | % | 4.9 | % |
|
|
|
|
|
|
|
|
|
| |
Replacement & new revenue sources |
|
|
| $ | 8,000 |
| 100.0 | % | 4.9 | % |
Weighted Average Cost of Capital
|
| Shares Outs. |
| Stock Price |
| Market |
| % of |
| Industry Avg. |
| Nominal |
| Effective |
| Cost of |
| Weighted |
| ||
|
|
|
|
|
|
|
|
|
|
|
|
|
|
|
|
|
|
|
| ||
Debt |
|
|
|
|
| $ | 8,000 |
| 33.9 | % | 23.6 | % | 4.9 | % | 34.0 | % | 3.2 | % | 0.8 | % | |
Equity |
| 7,816 |
| $ | 2.0000 |
| 15,632 |
| 66.1 | % | 76.4 | % | 19.5 | % |
|
| 19.5 | % | 14.9 | % | |
|
|
|
|
|
| $ | 23,632 |
| 100.0 | % | 100.0 | % |
|
|
|
|
|
| 15.7 | % | |
Net Debt
|
| as of |
| |
Debt & Other Obligations |
|
|
| |
Interest Bearing Debt |
| $ | 8,000 |
|
Minority Interests |
| — |
| |
Preferred Stock |
| — |
| |
Total Debt |
| $ | 8,000 |
|
Common Stock Equivalents
|
| as of |
|
Common Stock Equivalents (in thousands) |
|
|
|
Common Stock Outstanding |
| 7,816 |
|
ITM Options (Treasury Stock Method) |
| 165 |
|
Total Common Stock Equivalents |
| 7,981 |
|
(1) As reported by the Federal Reserve Board on a weekly-average basis for the week ended October 31, 2003.
(2) Sourced from the Ibbotson SBBI Valuation Edition 2003 Yearbook. Industry risk premium based on SIC 633 (Fire, Marine and Casualty Insurance).
(3) Sourced from Ibbotson 2002 Cost of Capital Yearbook, based on average small composite debt to total capital ratio for SIC 6331.
Sources of information: Company financials, projections & management, Ibbotson 2003 SBBI and Federal Reserve Board.
53
SELECTED COMPARABLE COMPANY ANALYSIS
• The selected comparable company analysis compares the trading multiples of the Company with those of other publicly traded companies that are similar with respect to business and revenue model, operating sector, size and target customer base.
• Capitalink located six companies that it deemed comparable to the Company with respect to their industry sector and operating model (the “Comparable Companies”). All of the Comparable Companies are small regional based insurance companies that write property and casualty insurance and are classified under the SIC code 6331 (fire, marine, and casualty insurance), which includes insurance related to automobiles, burglary and theft, property damage, fire, marine, and workers compensation.
• Financial information as of and for the September 30, 2003 interim period has not yet been released into the public domain, and therefore Capitalink utilized June 30, 2003 information comparable company review. However, Capitalink utilized the September 30, 2003 financial information when implying indicated values based upon multiples derived from the Comparable Companies.
• A significant portion of Seibels’ revenues is derived from commission and fees from its INS adjusting services, automobile and flood insurance businesses rather than from net premiums earned. For the LTM ended June 30, 2003, net premium revenue was 35.6% of total revenue. The Comparable Companies had an average net premium percentage of 76.1% for the same period.
• Based on size (in terms of TIC value and revenues), Seibels is in the lower range of the Comparable Companies. As of November 3, 2003, the total invested capital for the Comparable Companies ranged from approximately $25.6 million to approximately $817.1 million and revenue ranged from approximately $45.9 million to approximately $259.3 million. In comparison, Seibels had TIC and revenue for the LTM period June 30, 2003 of approximately $23.6 million and $45.7 million, respectively.
• Multiples utilizing market value, and TIC value were used in the analyses. The differences between the two are as follows:
54
• Market value equals price per share times number of shares outstanding,
• TIC equals market value plus interest bearing debt, preferred stock and minority interest.
• Market values were used to calculate multiples of EPS, common equity, and net tangible common equity, while TIC values were used to calculate multiples of LTM revenue, LTM EBIT, LTM EBITDA, and total assets.
• For comparison purposes, all operating profits including EBITDA were normalized to exclude unusual and extraordinary expenses and income.
• The Comparable Company analysis generated a wide range of multiples:
• The median market value to net tangible common equity multiple was 1.2 times for the Comparable Companies and 0.8 times for the Company.
• The mean and median TIC value to LTM revenue was 1.21 and 0.89 times, respectively, for the Comparable Companies. As of November 3, 2003, the same multiple for the Company was 0.52 times.
• The mean and median TIC value to LTM EBITDA was 11.0 and 11.4 times, respectively, for the Comparable Companies. As of November 3, 2003, the same multiple for the Company was 10.2 times.
• The mean and median TIC value to LTM EBIT was 12.1 and 12.9 times, respectively, for the Comparable Companies. As of November 3, 2003, the same multiple for the Company was 13.0 times.
• Capitalink noted that the EBITDA margin for the Company was at the low end of the Comparable Companies (5.1% compared with a range of 4.7% to 28.4%). In addition, the average change in revenues for the latest financial year for the Comparable Companies was an increase of 14.4%, compared with a fall of 5.2% for the Company. For the nine months ended September 30, 2003, total revenues for the Company fell approximately 49.0% compared to the same period last year with a negative EBITDA of approximately $1.8 million. This information has not been released into the public domain as of November 3, 2003 and is therefore not reflected in the Company’s share price.
55
• Capitalink also noted that the net investment yield for the Company was just above the average of the Comparable Companies at 5.8%. In addition, the total loss ratio for the LTM period 62.3% for the Company (slightly below the average of the Comparable Companies of 70.8%).
• Capitalink expects Seibels’ valuation multiples to be below the Comparable Companies’ due to the smaller size of the Company, significant decline in revenues, risks with respect to the Company’s ability to write policies in the future, ability to obtain additional profitable contracts for INS, and legal risks with respect to HDC. In addition, many of the Comparable Companies have favorable AM Best ratings. Only one of the Company’s subsidiaries has an AM Best rating (UIC has a rating of C+), which continues to affect their respective abilities to grow business.
• Capitalink selected an appropriate multiple range for the Company by examining the range provided by the Comparable Companies and taking into account the Company specific factors as previously discussed. Capitalink then applied this multiple range to Seibels’ net tangible equity (as of September 30, 2003), LTM revenue (as of September 30, 2003), average revenue (FY2001-LTM 2003), average EBITDA (FY2001-LTM 2003) and average EBIT (FY2001-LTM 2003) as follows:
• Between 1.0 times and 1.2 times net tangible equity.
• Between 0.72 times and 0.89 times LTM revenue.
• Between 0.72 times and 0.89 times average revenue (FY2001 – LTM 2003)
• Between 8.0 times and 11.0 times average EBITDA (FY2001 – LTM 2003)
• Between 9.0 times and 12.1 times average EBIT (FY2001 – LTM 2003).
• Average EBITDA and EBIT were used in this analysis because the Company’s EBITDA and EBIT were negative for the LTM September 30, 2003. Capitalink also believes that given the recent volatility in the Company’s earnings, the average for the prior 3 years would be a more appropriate normalized number in which to apply multiples.
56
• Based on the selected multiple ranges, Capitalink calculated a range of TIC values between $22.2 million and $28.6 million for the Company. After deducting preferred stock of $8.0 million, dividing by approximately 7.98 million shares outstanding (including ITM options), Capitalink calculated a range of indicated common stock share prices of between $1.91 and $2.63.
• An analysis of publicly traded comparable companies is not mathematical; rather it involves complex consideration and judgments concerning differences in financial and operating characteristics of the Comparable Companies and other factors that could affect the public trading of the Comparable Companies.
57
Comparable Company Analysis - Indicated Reference Range
($ in thousands, except per share)
|
|
|
| Selected Multiple Range |
|
|
|
|
|
|
|
|
|
|
|
|
| |||||||||
|
| Statistic |
| Low | - | High |
| Indicated TIC Value |
| Indicated Equity Value (1) |
| Indicated Share Price (2) |
| |||||||||||||
|
|
|
|
|
|
|
|
|
|
|
|
|
|
|
|
|
|
|
| |||||||
Market Value Multiple |
|
|
|
|
|
|
|
|
|
|
|
|
|
|
|
|
|
|
| |||||||
Net Tangible Equity 9/30/03 |
| $ | 19,272 |
| 1.0x | - | 1.2x |
|
|
|
|
| $ | 19,272 | - | $ | 22,498 |
| $ | 2.41 | - | $ | 2.82 |
| ||
|
|
|
|
|
|
|
|
|
|
|
|
|
|
|
|
|
|
|
| |||||||
Total Invested Capital (TIC) Multiple |
|
|
|
|
|
|
|
|
|
|
|
|
|
|
|
|
|
|
| |||||||
LTM Revenue 9/30/03 |
| $ | 29,387 |
| 0.72x | - | 0.89x |
| $ | 21,049 | - | $ | 26,050 |
| $ | 13,049 | - | $ | 18,050 |
| $ | 1.64 | - | $ | 2.26 |
|
Average Revenue (FY2001-LTM 2003) |
| $ | 46,606 |
| 0.72x | - | 0.89x |
| $ | 33,383 | - | $ | 41,313 |
| $ | 25,383 | - | $ | 33,313 |
| $ | 3.18 | - | $ | 4.17 |
|
Average EBITDA (FY2001-LTM 2003) |
| $ | 2,326 |
| 8.0x | - | 11.0x |
| $ | 18,608 | - | $ | 25,656 |
| $ | 10,608 | - | $ | 17,656 |
| $ | 1.33 | - | $ | 2.21 |
|
Average EBIT (FY2001-LTM 2003) |
| $ | 1,757 |
| 9.0x | - | 12.1x |
| $ | 15,813 | - | $ | 21,337 |
| $ | 7,813 | - | $ | 13,337 |
| $ | 0.98 | - | $ | 1.67 |
|
|
|
|
|
|
|
|
|
|
|
|
|
|
|
|
|
|
|
|
| |||||||
Indicated Reference Range |
|
|
|
|
|
|
| $ | 22,213 | - | $ | 28,589 |
| $ | 15,225 | - | $ | 20,971 |
| $ | 1.91 | - | $ | 2.63 |
| |
(1) Adjusted for $8,000 debt as of September 30, 2003.
(2) Based upon and assumes 7,981 common shares, including in the money options/warrants outstanding using the treasury stock method.
58
Comparable Company Analysis - Valuation Multiples
($ in thousands, except per share data)
Company |
| Ticker |
| Stock Price |
| % Below/Above |
| Market |
| Total |
|
|
|
|
|
|
|
|
| |||||||||
MV as a Multiple of | TIC as a Multiple of | |||||||||||||||||||||||||||
LTM |
| Common |
| Net Tang | LTM |
| LTM |
| Total | |||||||||||||||||||
EBIT |
| EBITDA | ||||||||||||||||||||||||||
|
|
|
|
|
|
|
|
|
|
|
|
|
|
|
|
|
|
|
|
|
|
|
|
|
| |||
Direct General Corp |
| DRCT |
| $ | 29.900 |
| 0.9% - 29.9% |
| $ | 638,395 |
| $ | 817,134 |
| 1.1 | x | 8.1 | x | 8.9 | x | 3.15 | x | 11.9 | x | 11.1 | x | 1.2 | x |
|
|
|
|
|
|
|
|
|
|
|
|
|
|
|
|
|
|
|
|
|
|
|
|
|
| |||
Merchants Group Inc |
| MGP |
| 22.620 |
| 6.5% - 15.7% |
| 47,728 |
| 59,420 |
| 13.9 |
| 0.7 |
| 0.7 |
| 0.72 |
| 13.8 |
| 13.7 |
| 0.2 |
| |||
|
|
|
|
|
|
|
|
|
|
|
|
|
|
|
|
|
|
|
|
|
|
|
|
|
| |||
21st Century Holding |
| TCHC |
| 18.030 |
| 15.0% - 153.6% |
| 56,254 |
| 60,926 |
| 6.7 |
| 2.2 |
| 2.3 |
| 1.10 |
| 4.8 |
| 4.6 |
| 0.6 |
| |||
|
|
|
|
|
|
|
|
|
|
|
|
|
|
|
|
|
|
|
|
|
|
|
|
|
| |||
National Security Group |
| NSEC |
| 18.250 |
| 0.0% - 52.2% |
| 45,078 |
| 48,301 |
| 17.5 |
| 1.0 |
| 1.0 |
| 1.05 |
| 11.7 |
| 11.5 |
| 0.4 |
| |||
|
|
|
|
|
|
|
|
|
|
|
|
|
|
|
|
|
|
|
|
|
|
|
|
|
| |||
Unico American Corp |
| UNAM |
| 4.661 |
| 10.5% - 102.7% |
| 25,589 |
| 25,589 |
| 23.3 |
| 0.7 |
| 0.7 |
| 0.54 |
| 14.1 |
| 11.4 |
| 0.2 |
| |||
|
|
|
|
|
|
|
|
|
|
|
|
|
|
|
|
|
|
|
|
|
|
|
|
|
| |||
Hallmark Financial Services |
| HAF |
| 0.800 |
| 30.4% - 166.7% |
| 29,054 |
| 36,914 |
| 16.0 |
| 1.1 |
| 1.3 |
| 0.72 |
| 16.6 |
| 13.9 |
| 0.4 |
| |||
|
|
|
|
|
|
|
|
|
|
|
|
|
|
|
|
|
|
|
|
|
|
|
|
|
| |||
|
|
|
|
|
| High |
| $ | 638,395 |
| $ | 817,134 |
| 23.3 | x | 8.1 | x | 8.9 | x | 3.15 | x | 16.6 | x | 13.9 | x | 1.2 | x | |
|
|
|
|
|
| Mean |
| 140,350 |
| 174,714 |
| 13.1 |
| 2.3 |
| 2.5 |
| 1.21 |
| 12.1 |
| 11.0 |
| 0.5 |
| |||
|
|
|
|
|
| Median |
| 46,403 |
| 53,860 |
| 14.9 |
| 1.0 |
| 1.2 |
| 0.89 |
| 12.9 |
| 11.4 |
| 0.4 |
| |||
|
|
|
|
|
| Low |
| 25,589 |
| 25,589 |
| 1.1 |
| 0.7 |
| 0.7 |
| 0.54 |
| 4.8 |
| 4.6 |
| 0.2 |
| |||
|
|
|
|
|
|
|
|
|
|
|
|
|
|
|
|
|
|
|
|
|
|
|
|
|
| |||
Seibels Bruce Group |
| SBIG |
| $ | 2.000 |
| 7.0% - 98.0% |
| $ | 15,632 |
| $ | 23,632 |
| 13.3 | x | 0.6 | x | 0.8 | x | 0.52 | x | 13.0 | x | 10.2 | x | 0.2 | x |
(1) Total Invested Capital equals Market Value plus total debt, preferred stock, and minority interests.
Sources of information: SEC Edgar filings, Multex, Capital IQ, Yahoo and Commodity Systems.
59
Comparable Company Analysis - Margin and Other Analyses
($ in thousands)
|
| LTM (1) |
| as of Latest Available Filing |
| |||||||||||||||||||||||||
Company |
| Revenue |
| as Percentage of Revenue |
| Return on |
| Net |
| Loss |
| Net Premiums |
| Total Debt |
| Total Debt |
| Latest FY |
| |||||||||||
Net |
| Operating |
| EBITDA |
| EBIT |
| Net | Average |
| Average | |||||||||||||||||||
|
|
|
|
|
|
|
|
|
|
|
|
|
|
|
|
|
|
|
|
|
|
|
|
|
|
|
|
|
| |
Direct General Corp |
| $ | 259,290 |
| 69.5 | % | 26.4 | % | 28.4 | % | 26.4 | % | 15.4 | % | 6.3 | % | 58.0 | % | 3.5 | % | 71.3 | % | 2.6 | x | 69.4 | % | 2.4 | x | 37.8 | % |
|
|
|
|
|
|
|
|
|
|
|
|
|
|
|
|
|
|
|
|
|
|
|
|
|
|
|
|
|
| |
Merchants Group Inc |
| 82,488 |
| 85.8 | % | 5.2 | % | 5.3 | % | 5.2 | % | 4.2 | % | 1.2 | % | 5.0 | % | 5.3 | % | 76.8 | % | 1.0 |
| 14.3 | % | 2.7 |
| -11.4 | % | |
|
|
|
|
|
|
|
|
|
|
|
|
|
|
|
|
|
|
|
|
|
|
|
|
|
|
|
|
|
| |
21st Century Holding |
| 55,468 |
| 76.2 | % | 23.0 | % | 23.7 | % | 23.0 | % | 14.8 | % | 9.4 | % | 37.2 | % | 7.3 | % | 61.2 | % | 1.9 |
| 15.2 | % | 0.4 |
| 14.4 | % | |
|
|
|
|
|
|
|
|
|
|
|
|
|
|
|
|
|
|
|
|
|
|
|
|
|
|
|
|
|
| |
National Security Group |
| 45,890 |
| 85.6 | % | 8.8 | % | 9.1 | % | 9.0 | % | 5.6 | % | 2.4 | % | 5.9 | % | 4.8 | % | 80.6 | % | 0.9 |
| 6.7 | % | 0.8 |
| 19.2 | % | |
|
|
|
|
|
|
|
|
|
|
|
|
|
|
|
|
|
|
|
|
|
|
|
|
|
|
|
|
|
| |
Unico American Corp |
| 47,757 |
| 71.6 | % | 3.8 | % | 4.7 | % | 3.8 | % | 2.4 | % | 0.8 | % | 2.9 | % | 5.8 | % | 64.5 | % | 0.9 |
| 0.0 | % | — |
| 9.3 | % | |
|
|
|
|
|
|
|
|
|
|
|
|
|
|
|
|
|
|
|
|
|
|
|
|
|
|
|
|
|
| |
Hallmark Financial Services |
| 51,536 |
| 68.0 | % | 4.3 | % | 5.2 | % | 4.3 | % | 1.0 | % | 0.6 | % | 2.9 | % | 3.8 | % | 70.6 | % | 1.9 |
| 22.2 | % | 3.0 |
| 17.2 | % | |
|
|
|
|
|
|
|
|
|
|
|
|
|
|
|
|
|
|
|
|
|
|
|
|
|
|
|
|
|
| |
High |
| $ | 259,290 |
| 85.8 | % | 26.4 | % | 28.4 | % | 26.4 | % | 15.4 | % | 9.4 | % | 58.0 | % | 7.3 | % | 80.6 | % | 2.6 | x | 69.4 | % | 3.0 | x | 37.8 | % |
Mean |
| 90,405 |
| 76.1 | % | 11.9 | % | 12.7 | % | 12.0 | % | 7.2 | % | 3.4 | % | 18.6 | % | 5.1 | % | 70.8 | % | 1.5 |
| 21.3 | % | 1.5 |
| 14.4 | % | |
Median |
| 53,502 |
| 73.9 | % | 7.0 | % | 7.2 | % | 7.1 | % | 4.9 | % | 1.8 | % | 5.4 | % | 5.1 | % | 70.9 | % | 1.5 |
| 14.7 | % | 1.6 |
| 15.8 | % | |
Low |
| 45,890 |
| 68.0 | % | 3.8 | % | 4.7 | % | 3.8 | % | 1.0 | % | 0.6 | % | 2.9 | % | 3.5 | % | 61.2 | % | 0.9 |
| 0.0 | % | — |
| -11.4 | % | |
|
|
|
|
|
|
|
|
|
|
|
|
|
|
|
|
|
|
|
|
|
|
|
|
|
|
|
|
|
| |
Seibels Bruce Group |
| $ | 45,656 |
| 35.6 | % | 4.0 | % | 5.1 | % | 4.0 | % | 2.7 | % | 1.0 | % | 5.1 | % | 5.8 | % | 62.3 | % | 0.7 | x | 24.1 | % | 3.5 | x | -5.2 | % |
(1) May exclude special items, such as extraordinary and non-recurring expenses. See individual company overviews for details of exclusions, if any.
Sources of information: SEC Edgar filings, Multex, Capital IQ, Yahoo and Commodity Systems.
60
Comparable Company Analysis - Income Statement Overview
($ in thousands, except per share data)
Company |
| Revenue |
| EBITDA (1) |
| EBIT (1) |
| Net Income (1) |
| EPS (1) |
| Latest |
| Latest |
| ||||||||||||||||||||
LTM |
| Latest |
| LTM |
| Latest |
| LTM |
| Latest |
| LTM |
| Latest |
| LTM |
| Latest | |||||||||||||||||
|
|
|
|
|
|
|
|
|
|
|
|
|
|
|
|
|
|
|
|
|
|
|
|
|
| ||||||||||
Direct General Corp |
| $ | 259,290 |
| $ | 213,138 |
| $ | 73,693 |
| $ | 58,100 |
| $ | 68,437 |
| $ | 52,715 |
| $ | 40,049 |
| $ | 30,476 |
| $ | 28.44 |
| $ | 27.57 |
| 30-Jun-03 |
| 31-Dec-02 |
|
|
|
|
|
|
|
|
|
|
|
|
|
|
|
|
|
|
|
|
|
|
|
|
|
|
| ||||||||||
Merchants Group Inc |
| 82,488 |
| 95,111 |
| 4,340 |
| 4,290 |
| 4,317 |
| 4,267 |
| 3,431 |
| 2,538 |
| 1.63 |
| 1.19 |
| 30-Jun-03 |
| 31-Dec-02 |
| ||||||||||
|
|
|
|
|
|
|
|
|
|
|
|
|
|
|
|
|
|
|
|
|
|
|
|
|
| ||||||||||
21st Century Holding |
| 55,468 |
| 40,580 |
| 13,119 |
| 8,592 |
| 12,774 |
| 8,215 |
| 8,213 |
| 4,570 |
| 2.69 |
| 1.52 |
| 30-Sep-03 |
| 31-Dec-02 |
| ||||||||||
|
|
|
|
|
|
|
|
|
|
|
|
|
|
|
|
|
|
|
|
|
|
|
|
|
| ||||||||||
National Security Group |
| 45,890 |
| 39,085 |
| 4,192 |
| 1,771 |
| 4,115 |
| 1,576 |
| 2,562 |
| 908 |
| 1.04 |
| 0.37 |
| 30-Jun-03 |
| 31-Dec-02 |
| ||||||||||
|
|
|
|
|
|
|
|
|
|
|
|
|
|
|
|
|
|
|
|
|
|
|
|
|
| ||||||||||
Unico American Corp |
| 47,757 |
| 46,028 |
| 2,252 |
| (4,352 | ) | 1,818 |
| (4,814 | ) | 1,127 |
| (3,225 | ) | 0.20 |
| (0.59 | ) | 30-Jun-03 |
| 31-Dec-02 |
| ||||||||||
|
|
|
|
|
|
|
|
|
|
|
|
|
|
|
|
|
|
|
|
|
|
|
|
|
| ||||||||||
Hallmark Financial Services |
| 51,536 |
| 25,797 |
| 2,661 |
| 1,214 |
| 2,227 |
| 1,019 |
| 524 |
| 23 |
| 0.05 |
| — |
| 30-Jun-03 |
| 31-Dec-02 |
| ||||||||||
|
|
|
|
|
|
|
|
|
|
|
|
|
|
|
|
|
|
|
|
|
|
|
|
|
| ||||||||||
High |
| $ | 259,290 |
| $ | 213,138 |
| $ | 73,693 |
| $ | 58,100 |
| $ | 68,437 |
| $ | 52,715 |
| $ | 40,049 |
| $ | 30,476 |
| $ | 28.44 |
| $ | 27.57 |
|
|
|
|
|
Mean |
| 90,405 |
| 76,623 |
| 16,710 |
| 11,603 |
| 15,615 |
| 10,496 |
| 9,318 |
| 5,882 |
| 5.68 |
| 5.01 |
|
|
|
|
| ||||||||||
Median |
| 53,502 |
| 43,304 |
| 4,266 |
| 3,031 |
| 4,216 |
| 2,922 |
| 2,997 |
| 1,723 |
| 1.34 |
| 0.78 |
|
|
|
|
| ||||||||||
Low |
| 45,890 |
| 25,797 |
| 2,252 |
| (4,352 | ) | 1,818 |
| (4,814 | ) | 524 |
| (3,225 | ) | 0.05 |
| (0.59 | ) |
|
|
|
| ||||||||||
|
|
|
|
|
|
|
|
|
|
|
|
|
|
|
|
|
|
|
|
|
|
|
|
|
| ||||||||||
Seibels Bruce Group |
| $ | 45,656 |
| $ | 53,755 |
| $ | 2,318 |
| $ | 3,370 |
| $ | 1,820 |
| $ | 2,882 |
| $ | 1,243 |
| $ | 2,302 |
| $ | 0.15 |
| $ | 0.29 |
| 30-Jun-03 |
| 31-Dec-02 |
|
(1) May exclude special items, such as extraordinary and non-recurring expenses. See individual company overviews for details of exclusions, if any.
Sources of information: SEC Edgar filings, Multex, Capital IQ, Yahoo and Commodity Systems.
61
Comparable Company Analysis - Balance Sheet Overview
($ in thousands)
|
| As of Latest Available Filing |
| Latest |
| ||||||||||||||||||||||||||||||||
Company |
| Cash & |
| Investments |
| Premium |
| Total |
| Deferred Policy |
| Intangibles, |
| Total |
| Loss & Loss |
| Total |
| Total |
| Net Tangible |
|
| |||||||||||||
|
|
|
|
|
|
|
|
|
|
|
|
|
|
|
|
|
|
|
|
|
|
|
|
|
| ||||||||||||
Direct General Corp |
| $ | 111,372 |
| $ | 174,207 |
| $ | 203,992 |
| $ | 256,602 |
| $ | 8,853 |
| $ | 7,409 |
| $ | 708,479 |
| $ | 101,456 |
| $ | 178,739 |
| $ | 78,835 |
| $ | 71,426 |
| 30-Jun-03 |
| |
|
|
|
|
|
|
|
|
|
|
|
|
|
|
|
|
|
|
|
|
|
|
|
|
|
| ||||||||||||
Merchants Group Inc |
| 10 |
| 218,404 |
| 17,112 |
| 37,200 |
| 8,756 |
| — |
| 282,804 |
| 147,254 |
| 11,692 |
| 70,357 |
| 70,357 |
| 30-Jun-03 |
| ||||||||||||
|
|
|
|
|
|
|
|
|
|
|
|
|
|
|
|
|
|
|
|
|
|
|
|
|
| ||||||||||||
21st Century Holding |
| — |
| 52,717 |
| 8,412 |
| 25,380 |
| 829 |
| 1,739 |
| 100,068 |
| 24,041 |
| 4,672 |
| 26,094 |
| 24,355 |
| 30-Sep-03 |
| ||||||||||||
|
|
|
|
|
|
|
|
|
|
|
|
|
|
|
|
|
|
|
|
|
|
|
|
|
| ||||||||||||
National Security Group |
| 743 |
| 96,388 |
| — |
| 1,917 |
| 6,015 |
| — |
| 111,011 |
| 36,520 |
| 3,223 |
| 44,816 |
| 44,816 |
| 30-Jun-03 |
| ||||||||||||
|
|
|
|
|
|
|
|
|
|
|
|
|
|
|
|
|
|
|
|
|
|
|
|
|
| ||||||||||||
Unico American Corp |
| 61 |
| 112,377 |
| 8,203 |
| 26,862 |
| 6,761 |
| — |
| 149,442 |
| 73,722 |
| — |
| 39,309 |
| 39,309 |
| 30-Jun-03 |
| ||||||||||||
|
|
|
|
|
|
|
|
|
|
|
|
|
|
|
|
|
|
|
|
|
|
|
|
|
| ||||||||||||
Hallmark Financial Services |
| 31,888 |
| 16,032 |
| 11,148 |
| 29,121 |
| 2,030 |
| 5,715 |
| 103,961 |
| 30,866 |
| 7,860 |
| 27,577 |
| 21,862 |
| 30-Jun-03 |
| ||||||||||||
|
|
|
|
|
|
|
|
|
|
|
|
|
|
|
|
|
|
|
|
|
|
|
|
|
| ||||||||||||
| High |
| $ | 111,372 |
| $ | 218,404 |
| $ | 203,992 |
| $ | 256,602 |
| $ | 8,853 |
| $ | 7,409 |
| $ | 708,479 |
| $ | 147,254 |
| $ | 178,739 |
| $ | 78,835 |
| $ | 71,426 |
|
|
|
| Mean |
| 24,012 |
| 111,688 |
| 41,478 |
| 62,847 |
| 5,541 |
| 2,477 |
| 242,628 |
| 68,977 |
| 34,364 |
| 47,831 |
| 45,354 |
|
|
| |||||||||||
| Median |
| 402 |
| 104,383 |
| 9,780 |
| 27,992 |
| 6,388 |
| 870 |
| 130,227 |
| 55,121 |
| 6,266 |
| 42,063 |
| 42,063 |
|
|
| |||||||||||
| Low |
| — |
| 16,032 |
| — |
| 1,917 |
| 829 |
| — |
| 100,068 |
| 24,041 |
| — |
| 26,094 |
| 21,862 |
|
|
| |||||||||||
|
|
|
|
|
|
|
|
|
|
|
|
|
|
|
|
|
|
|
|
|
|
|
|
|
|
| |||||||||||
Seibels Bruce Group |
| $ | 4,676 |
| $ | 45,495 |
| $ | 4,323 |
| $ | 42,588 |
| $ | 1,320 |
| $ | 4,513 |
| $ | 117,336 |
| $ | 53,306 |
| $ | 8,000 |
| $ | 25,158 |
| $ | 20,645 |
| 30-Jun-03 |
| |
Sources of information: SEC Edgar filings, Multex, Capital IQ, Yahoo and Commodity Systems.
62
Direct General Corp Overview |
| ($ in thousands, except per share) |
Company Information
Name |
| Direct General Corp |
| Address |
| 1281 Murfreesboro Road, 5-01 |
Symbol |
| DRCT |
| City, State Zip |
| Nashville, TN 37217 |
Latest Fiscal YE |
| 31-Dec-02 |
| Telephone |
| (615) 399-0900 |
Latest Rprt Per |
| 30-Jun-03 |
| Website |
| http://www.direct-general.com/ |
Market Information
As of Date |
| 3-Nov-03 |
| |
Exchange |
| NYSE |
| |
Stock Price |
| $ | 29.90 |
|
52 Week High |
| $ | 30.16 |
|
52 Week Low |
| $ | 23.01 |
|
Avg. Daily Volume (000’s) |
| 70 |
| |
Beta |
| na |
| |
Shares Outstanding (000’s) |
| 21,351 |
| |
|
|
|
| |
Market Cap |
| $ | 638,395 |
|
Total Invested Capital (TIC) |
| $ | 817,134 |
|
Enterprise Value (EV) |
| $ | 705,762 |
|
|
|
|
| |
Insider Ownership |
| 39.05 | % | |
Institutional |
|
|
| |
% Owned |
| 0.00 | % | |
Number of Institutions |
| — |
| |
Valuation Analysis
|
| Multiple of |
| ||||
|
| Market Cap |
| TIC |
| EV |
|
Latest Twelve Months |
|
|
|
|
|
|
|
Revenue |
| 2.46 | x | 3.15 | x | 2.72 | x |
EBIT |
| 9.3 | x | 11.9 | x | 10.3 | x |
EBITDA |
| 8.7 | x | 11.1 | x | 9.6 | x |
Normalized Net Income |
| 15.9 | x | 20.4 | x | 17.6 | x |
Basic Normalized EPS |
| 1.1 | x | na |
| na |
|
Projected |
|
|
|
|
|
|
|
Jan-00 Mean Revenue |
| na |
| na |
| na |
|
Jan-00 Mean Revenue |
| na |
| na |
| na |
|
Jan-00 Mean EBITDA |
| na |
| na |
| na |
|
Jan-00 Mean EBITDA |
| na |
| na |
| na |
|
Jan-00 Mean EPS |
| na |
| na |
| na |
|
Jan-00 Mean EPS |
| na |
| na |
| na |
|
Most Recent Filing |
|
|
|
|
|
|
|
Assets |
| 0.9 | x | 1.2 | x | 1.0 | x |
Common Equity |
| 8.1 | x | na |
| na |
|
Tangible Common Equity |
| 8.9 | x | na |
| na |
|
Income and Cashflow Statement Data
|
| LTM |
| Six Months Ended |
| Fiscal Years Ended |
| |||||||||
|
| Jun-03 |
| Jun-03 |
| Jun-02 |
| Dec-02 |
| Dec-01 |
| |||||
Revenue |
| $ | 259,290 |
| $ | 144,748 |
| $ | 98,596 |
| $ | 213,138 |
| $ | 154,692 |
|
Less Expenses |
|
|
|
|
|
|
|
|
|
|
| |||||
Losses and loss adjustment expenses |
| 128,521 |
| 74,989 |
| 47,151 |
| 100,683 |
| 93,859 |
| |||||
Amortization deferred policy acq. Costs |
| 62,332 |
| 34,982 |
| 32,390 |
| 59,740 |
| 53,814 |
| |||||
Other Underwriting & Operating |
| — |
| — |
| — |
| — |
| — |
| |||||
Operating Income |
| 68,437 |
| 34,777 |
| 19,055 |
| 52,715 |
| 7,019 |
| |||||
Interest Income / (Expense), net |
| (6,297 | ) | (3,372 | ) | (3,235 | ) | (6,160 | ) | (7,646 | ) | |||||
Other Income / (Expense), net |
| — |
| — |
| — |
| — |
| — |
| |||||
Pre-tax Income |
| 62,140 |
| 31,405 |
| 15,820 |
| 46,555 |
| (627 | ) | |||||
Taxes |
| 21,530 |
| 11,461 |
| 5,449 |
| 15,518 |
| (1,075 | ) | |||||
After-tax Income |
| 40,610 |
| 19,944 |
| 10,371 |
| 31,037 |
| 448 |
| |||||
Minority Interest |
| — |
| — |
| — |
| — |
| — |
| |||||
Equity in Affiliates |
| — |
| — |
| — |
| — |
| — |
| |||||
Normalized Net Income |
| 40,610 |
| 19,944 |
| 10,371 |
| 31,037 |
| 448 |
| |||||
Dividends/Other Non-Common Dist |
| 561 |
| 281 |
| 281 |
| 561 |
| 561 |
| |||||
Normalized Net Income to Common |
| $ | 40,049 |
| $ | 19,663 |
| $ | 10,090 |
| $ | 30,476 |
| $ | (113 | ) |
|
|
|
|
|
|
|
|
|
|
|
| |||||
Normalized EBIT |
| $ | 68,437 |
| $ | 34,777 |
| $ | 19,055 |
| $ | 52,715 |
| $ | 7,019 |
|
Depreciation & Amortization |
| $ | 5,256 |
| $ | 2,341 |
| $ | 2,470 |
| $ | 5,385 |
| $ | 5,610 |
|
Normalized EBITDA |
| $ | 73,693 |
| $ | 37,118 |
| $ | 21,525 |
| $ | 58,100 |
| $ | 12,629 |
|
CAPEX |
| $ | 4,786 |
| $ | 1,698 | �� | $ | 1,763 |
| $ | 4,851 |
| $ | 2,918 |
|
EBITDA - CAPEX |
| $ | 68,907 |
| $ | 35,420 |
| $ | 19,762 |
| $ | 53,249 |
| $ | 9,711 |
|
GAAP Operating Cash Flow |
| $ | 64,205 |
| $ | 30,256 |
| $ | 18,498 |
| $ | 52,447 |
| $ | 45,520 |
|
|
|
|
|
|
|
|
|
|
|
|
| |||||
Basic Reported Weighted Avg Shares Out (000’s) |
|
|
| 12,119 |
| 13,384 |
| 1,105 |
| 1,114 |
| |||||
Basic Normalized EPS |
| $ | 28.44 |
| $ | 1.62 |
| $ | 0.75 |
| $ | 27.57 |
| $ | (0.10 | ) |
Basic Reported EPS |
| $ | 28.44 |
| $ | 1.62 |
| $ | 0.75 |
| $ | 27.57 |
| $ | (0.10 | ) |
|
|
|
|
|
|
|
|
|
|
|
| |||||
Diluted Reported Weighted Avg Shares Out (000’s) |
|
|
| 17,694 |
| 18,841 |
| 1,561 |
| 1,577 |
| |||||
Diluted Normalized EPS |
| $ | 20.09 |
| $ | 1.11 |
| $ | 0.54 |
| $ | 19.52 |
| $ | (0.07 | ) |
Diluted Reported EPS |
| $ | 20.09 |
| $ | 1.11 |
| $ | 0.54 |
| $ | 19.52 |
| $ | (0.07 | ) |
|
|
|
|
|
|
|
|
|
|
|
| |||||
Normalized Reconciliation | ||||||||||||||||
|
|
|
|
|
|
|
|
|
|
|
| |||||
Restructuring/Goodwill Impairment |
| $ | — |
| $ | — |
| $ | — |
| $ | — |
| $ | — |
|
Other Unusual (Expense) Gain Items |
| — |
| — |
| — |
| — |
| — |
| |||||
Tax Shelter (Charge) on Unusual Items |
| — |
| — |
| — |
| — |
| — |
| |||||
Unusual (Exp) Gain Items, net of Taxes |
| — |
| — |
| — |
| — |
| — |
| |||||
Accounting Changes, net of Taxes |
| — |
| — |
| — |
| — |
| — |
| |||||
Discontinued Operations, net of Taxes |
| — |
| — |
| — |
| — |
| — |
| |||||
Extraordinary Items, net of Taxes |
| — |
| — |
| — |
| — |
| — |
| |||||
Total Reconciling Items, net of Taxes |
| $ | — |
| $ | — |
| $ | — |
| $ | — |
| $ | — |
|
|
|
|
|
|
|
|
|
|
|
|
| |||||
Reported Income Tax (Benefit) |
| $ | 21,530 |
| $ | 11,461 |
| $ | 5,449 |
| $ | 15,518 |
| $ | (1,075 | ) |
Reported Net Income (Loss) |
| $ | 40,049 |
| $ | 19,663 |
| $ | 10,090 |
| $ | 30,476 |
| $ | (113 | ) |
|
|
|
|
|
|
|
|
|
|
|
| |||||
Revenue Breakdown | ||||||||||||||||
| ||||||||||||||||
Net Premiums |
| $ | 180,322 |
| $ | 101,451 |
| $ | 66,104 |
| $ | 144,975 |
| $ | 98,029 |
|
Fees, Commissions & Other |
| 70,303 |
| 38,445 |
| 31,035 |
| 62,893 |
| 49,335 |
| |||||
Investment Income |
| 8,665 |
| 4,852 |
| 1,457 |
| 5,270 |
| 7,328 |
| |||||
|
| $ | 259,290 |
| $ | 144,748 |
| $ | 98,596 |
| $ | 213,138 |
| $ | 154,692 |
|
Net Premiums |
| 69.5 | % | 70.1 | % | 67.0 | % | 68.0 | % | 63.4 | % | |||||
Fees, Commissions & Other |
| 27.1 | % | 26.6 | % | 31.5 | % | 29.5 | % | 31.9 | % | |||||
Investment Income |
| 3.3 | % | 3.4 | % | 1.5 | % | 2.5 | % | 4.7 | % | |||||
Sources of information: SEC Edgar filings, Multex, Capital IQ, Yahoo and Commodity Systems.
63
Balance Sheet Data
|
| Jun-03 |
| Dec-02 |
| Dec-01 |
| |||
Cash |
| $ | 111,372 |
| $ | 87,027 |
| $ | 39,458 |
|
Investments |
| 174,207 |
| 126,321 |
| 105,791 |
| |||
Premium Receivables |
| 203,992 |
| 166,935 |
| 121,931 |
| |||
Reinsurance Balance Receivable |
| 52,610 |
| 50,874 |
| 49,582 |
| |||
Reinsurance Recoverable |
| — |
| — |
| — |
| |||
Prepaid Reinsurance Premiums |
| 102,498 |
| 82,648 |
| 67,777 |
| |||
Deferred Policy Acquisition Costs |
| 8,853 |
| 8,165 |
| 6,020 |
| |||
PPE, net |
| 12,148 |
| 12,791 |
| 13,324 |
| |||
Intangibles, net |
| 7,409 |
| 7,409 |
| 7,409 |
| |||
Other Assets |
| 35,390 |
| 26,950 |
| 21,753 |
| |||
Total Assets |
| $ | 708,479 |
| $ | 569,120 |
| $ | 433,045 |
|
|
|
|
|
|
|
|
| |||
Losses and Loss Adjustment expense |
| $ | 101,456 |
| $ | 86,898 |
| $ | 77,541 |
|
Unearned Premiums |
| 215,318 |
| 172,971 |
| 122,112 |
| |||
Other Policy Liabilities |
| 90,412 |
| 76,722 |
| 59,647 |
| |||
Account Payables & Accrued Expenses |
| 12,665 |
| 13,629 |
| 9,544 |
| |||
Other Liabilties |
| 31,054 |
| 22,830 |
| 16,615 |
| |||
Interest Bearing Debt |
| 168,895 |
| 126,880 |
| 105,338 |
| |||
Capital Leases |
| 4,159 |
| 4,310 |
| 5,556 |
| |||
Minority Interests |
| — |
| — |
| — |
| |||
Pref Stock (Liq Value) |
| 5,685 |
| 5,685 |
| 5,685 |
| |||
Total Liabilities & Pref Stock |
| 629,644 |
| 509,925 |
| 402,038 |
| |||
Common Equity |
| 78,835 |
| 59,195 |
| 31,007 |
| |||
Total Liabilities & Equity |
| $ | 708,479 |
| $ | 569,120 |
| $ | 433,045 |
|
|
|
|
|
|
|
|
| |||
Common Shares Outstanding (000’s) |
| 12,119 |
| 12,119 |
| 1,010 |
| |||
Cash Value per share |
| $ | 9.19 |
| $ | 7.18 |
| $ | 39.07 |
|
Common Book Value per share |
| $ | 6.51 |
| $ | 4.88 |
| $ | 30.70 |
|
Common Tangible Book Value per share |
| $ | 5.89 |
| $ | 4.27 |
| $ | 23.36 |
|
Total Debt |
| $ | 178,739 |
| $ | 136,875 |
| $ | 116,579 |
|
Net Debt |
| $ | 67,367 |
| $ | 49,848 |
| $ | 77,121 |
|
Total Capitalization |
| $ | 257,574 |
| $ | 196,070 |
| $ | 147,586 |
|
|
|
|
|
|
|
|
| |||
Balance Sheet Analysis | ||||||||||
|
|
|
|
|
|
|
| |||
Effectiveness and Efficiency |
|
|
|
|
|
|
| |||
Premium Receivable Turnover |
| 1.0 | x | 1.0 | x | 0.8 | x | |||
Asset Turnover |
| 0.4 | x | 0.4 | x | 0.4 | x | |||
Days Sales Outstanding |
| 375.4 |
| 363.6 |
| 454.0 |
| |||
Normalized Return on Avg Assets |
| 6.3 | % | 6.1 | % | na |
| |||
Normalized Return on Avg Common Equity |
| 58.0 | % | 67.6 | % | na |
| |||
Net Investment Yield |
| 3.5 | % | 2.9 | % | na |
| |||
Financial Strength |
|
|
|
|
|
|
| |||
Net Premiums Written to Surplus |
| 2.6 | x | 3.2 | x | na |
| |||
Total Debt/Total Capitalization |
| 69.4 | % | 69.8 | % | 79.0 | % | |||
Total Debt/TIC |
| 21.9 | % | 16.8 | % | 14.3 | % | |||
Total Debt/EBITDA |
| 2.4 | x | 2.4 | x | 9.2 | x | |||
Total Debt/EBITDA-CAPEX |
| 2.6 | x | 2.6 | x | 12.0 | x | |||
EBITDA/Interest Expense |
| 11.7 | x | 9.4 | x | 1.7 | x | |||
EBITDA-CAPEX/Interest Expense |
| 10.9 | x | 8.6 | x | 1.3 | x | |||
Income and Cashflow Analysis
|
| LTM |
| Six Months Ended |
| Fiscal Years Ended |
| ||||
|
| Jun-03 |
| Jun-03 |
| Jun-02 |
| Dec-02 |
| Dec-01 |
|
Profitability & Cost Ratios (as % of Revenue) |
|
|
|
|
|
|
|
|
|
|
|
S,G & A |
| 24.0 | % | 24.2 | % | 32.9 | % | 28.0 | % | 34.8 | % |
Operating Income |
| 26.4 | % | 24.0 | % | 19.3 | % | 24.7 | % | 4.5 | % |
Pre-Tax |
| 24.0 | % | 21.7 | % | 16.0 | % | 21.8 | % | -0.4 | % |
EBIT |
| 26.4 | % | 24.0 | % | 19.3 | % | 24.7 | % | 4.5 | % |
EBITDA |
| 28.4 | % | 25.6 | % | 21.8 | % | 27.3 | % | 8.2 | % |
Normalized Net Income to Common |
| 15.4 | % | 13.6 | % | 10.2 | % | 14.3 | % | -0.1 | % |
Reported Net Income |
| 15.4 | % | 13.6 | % | 10.2 | % | 14.3 | % | -0.1 | % |
CAPEX |
| 1.8 | % | 1.2 | % | 1.8 | % | 2.3 | % | 1.9 | % |
|
|
|
|
|
|
|
|
|
|
|
|
Industry Underwriting Performance Ratios |
|
|
|
|
|
|
|
|
|
|
|
Loss Ratio |
| 71.3 | % | 73.9 | % | 71.3 | % | 69.4 | % | 95.7 | % |
Total Expense Ratio |
| 76.2 | % | 78.6 | % | 81.9 | % | 77.2 | % | 100.2 | % |
|
|
|
|
|
|
|
|
|
|
|
|
Period Growth Rates |
|
|
|
|
|
|
|
|
|
|
|
Revenue |
|
|
| 46.8 | % |
|
| 37.8 | % |
|
|
EBIT |
|
|
| 82.5 | % |
|
| 651.0 | % |
|
|
EBITDA |
|
|
| 72.4 | % |
|
| 360.1 | % |
|
|
Notes
DRCT had their IPO on August 12, 2003 at $21 per share.
AM Best Rating: B
Company Description
Direct General Corporation is a provider of non-standard personal automobile insurance, premium finance and other insurance and non-insurance products and services. The Company’s operations are concentrated in the southeastern part of the United States. As of December 31, 2002, the Company distributed its products and services through more than 320 neighborhood sales offices. Direct General’s core business involves issuing non-standard personal automobile insurance policies. These policies, which generally are issued for the minimum limits of coverage required by state laws, provide coverage to drivers who cannot obtain insurance from standard carriers due to a variety of factors, including the lack of flexible payment plans, the failure to maintain continuous coverage, age, prior accidents, driving violations, occupation and type of vehicle.
Sources of information: SEC Edgar filings, Multex, Capital IQ, Yahoo and Commodity Systems.
64
Merchants Group Inc Overview |
| ($ in thousands, except per share) | ||||||
|
|
| ||||||
Company Information | ||||||||
|
|
| ||||||
Name |
| Merchants Group Inc |
| Address |
| 250 Main Street |
| |
Symbol |
| MGP |
| City, State Zip |
| Buffalo, NY 14202 |
| |
Latest Fiscal YE |
| 31-Dec-02 |
| Telephone |
| (716) 849-3331 |
| |
Latest Rprt Per |
| 30-Jun-03 |
| Website |
| www.merchantsgroup.com |
| |
Market Information
As of Date |
| 3-Nov-03 |
| |
Exchange |
| AMEX |
| |
Stock Price |
| $ | 22.62 |
|
52 Week High |
| $ | 24.20 |
|
52 Week Low |
| $ | 19.55 |
|
Avg. Daily Volume (000’s) |
| 1 |
| |
Beta |
| (0.10 | ) | |
Shares Outstanding (000’s) |
| 2,110 |
| |
Market Cap |
| $ | 47,728 |
|
Total Invested Capital (TIC) |
| $ | 59,420 |
|
Enterprise Value (EV) |
| $ | 59,410 |
|
|
|
|
| |
Insider Ownership |
| 19.43 | % | |
Institutional |
|
|
| |
% Owned |
| 41.80 | % | |
Number of Institutions |
| — |
| |
|
|
|
| |
Valuation Analysis | ||||
|
| Multiple of |
| ||||
|
| Market Cap |
| TIC |
| EV |
|
Latest Twelve Months |
|
|
|
|
|
|
|
Revenue |
| 0.58 | x | 0.72 | x | 0.72 | x |
EBIT |
| 11.06 | x | 13.76 | x | 13.76 | x |
EBITDA |
| 11.00 | x | 13.69 | x | 13.69 | x |
Normalized Net Income |
| 13.91 | x | 17.32 | x | 17.32 | x |
Basic Normalized EPS |
| 13.88 | x | na |
| na |
|
Projected |
|
|
|
|
|
|
|
Jan-00 Mean Revenue |
| na |
| na |
| na |
|
Jan-00 Mean Revenue |
| na |
| na |
| na |
|
Jan-00 Mean EBITDA |
| na |
| na |
| na |
|
Jan-00 Mean EBITDA |
| na |
| na |
| na |
|
Jan-00 Mean EPS |
| na |
| na |
| na |
|
Jan-00 Mean EPS |
| na |
| na |
| na |
|
Most Recent Filing |
|
|
|
|
|
|
|
Assets |
| 0.17 | x | 0.21 | x | 0.21 | x |
Common Equity |
| 0.68 | x | na |
| na |
|
Tangible Common Equity |
| 0.68 | x | na |
| na |
|
Income and Cashflow Statement Data
|
| LTM |
| Six Months Ended |
| Fiscal Years Ended |
| |||||||||
|
| Jun-03 |
| Jun-03 |
| Jun-02 |
| Dec-02 |
| Dec-01 |
| |||||
Revenue |
| $ | 82,488 |
| $ | 39,193 |
| $ | 51,816 |
| $ | 95,111 |
| $ | 107,296 |
|
Less Expenses |
|
|
|
|
|
|
|
|
|
|
| |||||
Losses and loss adjustment expenses |
| 54,392 |
| 25,268 |
| 33,749 |
| 62,873 |
| 75,144 |
| |||||
Amortization deferred policy acq. Costs |
| 18,813 |
| 8,431 |
| 11,845 |
| 22,227 |
| 24,880 |
| |||||
Other Underwriting & Operating |
| 4,966 |
| 2,364 |
| 3,142 |
| 5,744 |
| 6,017 |
| |||||
Operating Income |
| 4,317 |
| 3,130 |
| 3,080 |
| 4,267 |
| 1,255 |
| |||||
Interest Income / (Expense), net |
| — |
| — |
| — |
| — |
| — |
| |||||
Other Income / (Expense), net |
| — |
| — |
| — |
| — |
| — |
| |||||
Pre-tax Income |
| 4,317 |
| 3,130 |
| 3,080 |
| 4,267 |
| 1,255 |
| |||||
Taxes |
| 886 |
| 391 |
| 1,234 |
| 1,729 |
| 434 |
| |||||
After-tax Income |
| 3,431 |
| 2,739 |
| 1,846 |
| 2,538 |
| 821 |
| |||||
Minority Interest |
| — |
| — |
| — |
| — |
| — |
| |||||
Equity in Affiliates |
| — |
| — |
| — |
| — |
| — |
| |||||
Normalized Net Income |
| 3,431 |
| 2,739 |
| 1,846 |
| 2,538 |
| 821 |
| |||||
Dividends/Other Non-Common Dist |
| — |
| — |
| — |
| — |
| — |
| |||||
Normalized Net Income to Common |
| $ | 3,431 |
| $ | 2,739 |
| $ | 1,846 |
| $ | 2,538 |
| $ | 821 |
|
|
|
|
|
|
|
|
|
|
|
|
| |||||
Normalized EBIT |
| $ | 4,317 |
| $ | 3,130 |
| $ | 3,080 |
| $ | 4,267 |
| $ | 1,255 |
|
Depreciation & Amortization |
| $ | 23 |
| $ | — |
| $ | — |
| $ | 23 |
| $ | (1,104 | ) |
Normalized EBITDA |
| $ | 4,340 |
| $ | 3,130 |
| $ | 3,080 |
| $ | 4,290 |
| $ | 151 |
|
CAPEX |
| $ | — |
| $ | — |
| $ | — |
| $ | — |
| $ | — |
|
EBITDA - CAPEX |
| $ | 4,340 |
| $ | 3,130 |
| $ | 3,080 |
| $ | 4,290 |
| $ | 151 |
|
GAAP Operating Cash Flow |
| $ | (4,384 | ) | $ | (4,344 | ) | $ | (5,939 | ) | $ | (5,979 | ) | $ | (1,549 | ) |
|
|
|
|
|
|
|
|
|
|
|
| |||||
Basic Reported Weighted Avg Shares Out (000’s) |
|
|
| 2,110 |
| 2,141 |
| 2,125 |
| 2,343 |
| |||||
Basic Normalized EPS |
| $ | 1.63 |
| $ | 1.30 |
| $ | 0.86 |
| $ | 1.19 |
| $ | 0.35 |
|
Basic Reported EPS |
| $ | 1.63 |
| $ | 1.30 |
| $ | 0.86 |
| $ | 1.19 |
| $ | 0.35 |
|
Diluted Reported Weighted Avg Shares Out (000’s) |
|
|
| 2,111 |
| 2,145 |
| 2,129 |
| 2,343 |
| |||||
Diluted Normalized EPS |
| $ | 1.63 |
| $ | 1.30 |
| $ | 0.86 |
| $ | 1.19 |
| $ | 0.35 |
|
Diluted Reported EPS |
| $ | 1.63 |
| $ | 1.30 |
| $ | 0.86 |
| $ | 1.19 |
| $ | 0.35 |
|
|
|
|
|
|
|
|
|
|
|
|
| |||||
Normalized Reconciliation | ||||||||||||||||
| ||||||||||||||||
Restructuring/Goodwill Impairment |
| $ | — |
| $ | — |
| $ | — |
| $ | — |
| $ | — |
|
Other Unusual (Expense) Gain Items |
| — |
| — |
| — |
| — |
| — |
| |||||
Tax Shelter (Charge) on Unusual Items |
| — |
| — |
| — |
| — |
| — |
| |||||
Unusual (Exp) Gain Items, net of Taxes |
| — |
| — |
| — |
| — |
| — |
| |||||
Accounting Changes, net of Taxes |
| — |
| — |
| — |
| — |
| — |
| |||||
Discontinued Operations, net of Taxes |
| — |
| — |
| — |
| — |
| — |
| |||||
Extraordinary Items, net of Taxes |
| — |
| — |
| — |
| — |
| — |
| |||||
Total Reconciling Items, net of Taxes |
| $ | — |
| $ | — |
| $ | — |
| $ | — |
| $ | — |
|
|
|
|
|
|
|
|
|
|
|
|
| |||||
Reported Income Tax (Benefit) |
| $ | 886 |
| 391 |
| 1,234 |
| 1,729 |
| 434 |
| ||||
Reported Net Income (Loss) |
| $ | 3,431 |
| $ | 2,739 |
| $ | 1,846 |
| $ | 2,538 |
| $ | 821 |
|
|
|
|
|
|
|
|
|
|
|
|
| |||||
Revenue Breakdown | ||||||||||||||||
| ||||||||||||||||
Net Premiums |
| $ | 70,777 |
| $ | 32,356 |
| $ | 44,699 |
| $ | 83,120 |
| $ | 93,885 |
|
Fees, Commissions & Other |
| 355 |
| 157 |
| 437 |
| 635 |
| 696 |
| |||||
Investment Income |
| 11,356 |
| 6,680 |
| 6,680 |
| 11,356 |
| 12,715 |
| |||||
|
| $ | 82,488 |
| $ | 39,193 |
| $ | 51,816 |
| $ | 95,111 |
| $ | 107,296 |
|
Net Premiums |
| 85.8 | % | 82.6 | % | 86.3 | % | 87.4 | % | 87.5 | % | |||||
Fees, Commissions & Other |
| 0.4 | % | 0.4 | % | 0.8 | % | 0.7 | % | 0.6 | % | |||||
Investment Income |
| 13.8 | % | 17.0 | % | 12.9 | % | 11.9 | % | 11.9 | % | |||||
Sources of information: SEC Edgar filings, Multex, Capital IQ, Yahoo and Commodity Systems.
65
Balance Sheet Data
|
| Jun-03 |
| Dec-02 |
| Dec-01 |
| |||||||
Cash |
| $ | 10 |
| $ | 9 |
| $ | 1,197 |
| ||||
Investments |
| 218,404 |
| 209,397 |
| 213,132 |
| |||||||
Premium Receivables |
| 17,112 |
| 14,496 |
| 21,685 |
| |||||||
Reinsurance Balance Receivable |
| 20,088 |
| 19,086 |
| 18,810 |
| |||||||
Reinsurance Recoverable |
| — |
| — |
| — |
| |||||||
Prepaid Reinsurance Premiums |
| 948 |
| 1,091 |
| 3,559 |
| |||||||
Deferred Policy Acquisition Costs |
| 8,756 |
| 8,817 |
| 12,354 |
| |||||||
PPE, net |
| — |
| — |
| — |
| |||||||
Intangibles, net |
| — |
| — |
| — |
| |||||||
Other Assets |
| 17,486 |
| 15,820 |
| 15,826 |
| |||||||
Total Assets |
| $ | 282,804 |
| $ | 268,716 |
| $ | 286,563 |
| ||||
|
|
|
|
|
|
|
| |||||||
Losses and Loss Adjustment expense |
| $ | 147,254 |
| $ | 147,136 |
| $ | 151,355 |
| ||||
Unearned Premiums |
| 34,565 |
| 35,119 |
| 50,179 |
| |||||||
Other Policy Liabilities |
| — |
| — |
| — |
| |||||||
Account Payables & Accrued Expenses |
| 4,612 |
| 3,237 |
| 852 |
| |||||||
Other Liabilties |
| 14,324 |
| 15,300 |
| 15,426 |
| |||||||
Interest Bearing Debt |
| 11,692 |
| — |
| 200 |
| |||||||
Capital Leases |
| — |
| — |
| — |
| |||||||
Minority Interests |
| — |
| — |
| — |
| |||||||
Pref Stock (Liq Value) |
| — |
| — |
| — |
| |||||||
Total Liabilities & Pref Stock |
| 212,447 |
| 200,792 |
| 218,012 |
| |||||||
Common Equity |
| 70,357 |
| 67,924 |
| 68,551 |
| |||||||
Total Liabilities & Equity |
| $ | 282,804 |
| $ | 268,716 |
| $ | 286,563 |
| ||||
|
|
|
|
|
|
|
| |||||||
Common Shares Outstanding (000’s) |
| 2,110 |
| 2,110 |
| 2,224 |
| |||||||
Cash Value per share |
| $ | 0.00 |
| $ | 0.00 |
| $ | 0.54 |
| ||||
Common Book Value per share |
| $ | 33.34 |
| $ | 32.19 |
| $ | 30.82 |
| ||||
Common Tangible Book Value per share |
| $ | 33.34 |
| $ | 32.19 |
| $ | 30.82 |
| ||||
Total Debt |
| $ | 11,692 |
| $ | — |
| $ | 200 |
| ||||
Net Debt |
| $ | 11,682 |
| $ | (9 | ) | $ | (997 | ) | ||||
Total Capitalization |
| $ | 82,049 |
| $ | 67,924 |
| $ | 68,751 |
| ||||
|
|
|
|
|
|
|
| |||||||
Balance Sheet Analysis |
|
|
|
|
|
|
| |||||||
|
|
|
|
|
|
|
| |||||||
Effectiveness and Efficiency |
|
|
|
|
|
|
| |||||||
Premium Receivable Turnover |
| 4.5 | x | 4.6 | x | 4.3 | x | |||||||
Asset Turnover |
| 0.3 | x | 0.3 | x | 0.4 | x | |||||||
Days Sales Outstanding |
| 81.5 |
| 79.4 |
| 84.3 |
| |||||||
Normalized Return on Avg Assets |
| 1.2 | % | 0.9 | % | na |
| |||||||
Normalized Return on Avg Common Equity |
| 5.0 | % | 3.7 | % | na |
| |||||||
Net Investment Yield |
| 5.3 | % | 5.4 | % | na |
| |||||||
Financial Strength |
|
|
|
|
|
|
| |||||||
Net Premiums Written to Surplus |
| 1.0 | x | 1.2 | x | na |
| |||||||
Total Debt/Total Capitalization |
| 14.3 | % | 0.0 | % | 0.3 | % | |||||||
Total Debt/TIC |
| 19.7 | % | 0.0 | % | 0.3 | % | |||||||
Total Debt/EBITDA |
| 2.7 | x | — |
| 1.3 | x | |||||||
Total Debt/EBITDA-CAPEX |
| 2.7 | x | — |
| 1.3 | x | |||||||
EBITDA/Interest Expense |
| na |
| na |
| na |
| |||||||
EBITDA-CAPEX/Interest Expense |
| na |
| na |
| na |
| |||||||
|
|
|
|
|
|
|
| |||||||
Income and Cashflow Analysis | ||||||||||||||
| ||||||||||||||
|
| LTM |
| Six Months Ended |
| Fiscal Years Ended |
| |||||||
|
| Jun-03 |
| Jun-03 |
| Jun-02 |
| Dec-02 |
| Dec-01 |
| |||
Profitability & Cost Ratios (as % of Revenue) |
|
|
|
|
|
|
|
|
|
|
| |||
S,G & A |
| 22.8 | % | 21.5 | % | 22.9 | % | 23.4 | % | 23.2 | % | |||
Operating Income |
| 5.2 | % | 8.0 | % | 5.9 | % | 4.5 | % | 1.2 | % | |||
Pre-Tax |
| 5.2 | % | 8.0 | % | 5.9 | % | 4.5 | % | 1.2 | % | |||
EBIT |
| 5.2 | % | 8.0 | % | 5.9 | % | 4.5 | % | 1.2 | % | |||
EBITDA |
| 5.3 | % | 8.0 | % | 5.9 | % | 4.5 | % | 0.1 | % | |||
Normalized Net Income to Common |
| 4.2 | % | 7.0 | % | 3.6 | % | 2.7 | % | 0.8 | % | |||
Reported Net Income |
| 4.2 | % | 7.0 | % | 3.6 | % | 2.7 | % | 0.8 | % | |||
CAPEX |
| 0.0 | % | 0.0 | % | 0.0 | % | 0.0 | % | 0.0 | % | |||
|
|
|
|
|
|
|
|
|
|
|
| |||
Industry Underwriting Performance Ratios |
|
|
|
|
|
|
|
|
|
|
| |||
Loss Ratio |
| 76.8 | % | 78.1 | % | 75.5 | % | 75.6 | % | 80.0 | % | |||
Total Expense Ratio |
| 109.9 | % | 110.9 | % | 108.0 | % | 108.5 | % | 112.1 | % | |||
|
|
|
|
|
|
|
|
|
|
|
| |||
Period Growth Rates |
|
|
|
|
|
|
|
|
|
|
| |||
Revenue |
|
|
| -24.4 | % |
|
| -11.4 | % |
|
| |||
EBIT |
|
|
| 1.6 | % |
|
| 240.0 | % |
|
| |||
EBITDA |
|
|
| 1.6 | % |
|
| 2741.1 | % |
|
| |||
| ||||||||||||||
Notes | ||||||||||||||
Company has no PPE or CAPEX, and no depreciation and amortization expense for stub periods.
Company Description
Merchants Group Inc. offers property and casualty insurance to preferred risk individuals and small to medium sized businesses in the northeastern United States through its wholly owned subsidiary, Merchants Insurance Company of New Hampshire Inc. (MNH). The Company and MNH operate and manage their business in conjunction with Merchants Mutual Insurance Company (Mutual), a mutual property and casualty insurance company, under a management agreement (the Management Agreement). As of December 31, 2002, Mutual owned 12.1% of the Company’s issued and outstanding common stock. Under the Management Agreement, Mutual provides the Company and MNH with the facilities, management and personnel required to operate their day-to-day business.
Sources of information: SEC Edgar filings, Multex, Capital IQ, Yahoo and Commodity Systems.
66
21st Century Holding Overview |
| ($ in thousands, except per share) | ||||||
|
|
| ||||||
Company Information | ||||||||
|
|
| ||||||
Name |
| 21st Century Holding |
| Address |
| 4161 N.W. 5th Street | ||
Symbol |
| TCHC |
| City, State Zip |
| Plantation, FL 33317 | ||
Latest Fiscal YE |
| 31-Dec-02 |
| Telephone |
| (954) 581-9993 | ||
Latest Rprt Per |
| 30-Sep-03 |
| Website |
| http://www.fedusa.com | ||
|
|
|
|
|
|
| ||
Market Information | ||||||||
|
|
|
|
|
|
| ||
As of Date |
| 3-Nov-03 |
| |
Exchange |
| NASDAQ |
| |
Stock Price |
| $ | 18.03 |
|
52 Week High |
| $ | 21.20 |
|
52 Week Low |
| $ | 7.11 |
|
Avg. Daily Volume (000’s) |
| 35 |
| |
Beta |
| 0.49 |
| |
Shares Outstanding (000’s) |
| 3,120 |
| |
|
|
|
| |
Market Cap |
| $ | 56,254 |
|
Total Invested Capital (TIC) |
| $ | 60,926 |
|
Enterprise Value (EV) |
| $ | 60,926 |
|
|
|
|
| |
Insider Ownership |
| 42.40 | % | |
Institutional |
|
|
| |
% Owned |
| 1.28 | % | |
Number of Institutions |
| — |
| |
|
|
|
| |
Valuation Analysis |
|
|
| |
|
|
|
| |
|
| Multiple of |
| ||||
|
| Market Cap |
| TIC |
| EV |
|
Latest Twelve Months |
|
|
|
|
|
|
|
Revenue |
| 1.01 | x | 1.10 | x | 1.10 | x |
EBIT |
| 4.40 | x | 4.77 | x | 4.77 | x |
EBITDA |
| 4.29 | x | 4.64 | x | 4.64 | x |
Normalized Net Income |
| 6.85 | x | 7.42 | x | 7.42 | x |
Basic Normalized EPS |
| 6.70 | x | na |
| na |
|
Projected |
|
|
|
|
|
|
|
Jan-00 Mean Revenue |
| na |
| na |
| na |
|
Jan-00 Mean Revenue |
| na |
| na |
| na |
|
Jan-00 Mean EBITDA |
| na |
| na |
| na |
|
Jan-00 Mean EBITDA |
| na |
| na |
| na |
|
Jan-00 Mean EPS |
| na |
| na |
| na |
|
Jan-00 Mean EPS |
| na |
| na |
| na |
|
Most Recent Filing |
|
|
|
|
|
|
|
Assets |
| 0.56 | x | 0.61 | x | 0.61 | x |
Common Equity |
| 2.16 | x | na |
| na |
|
Tangible Common Equity |
| 2.31 | x | na |
| na |
|
Income and Cashflow Statement Data
|
| LTM |
| Nine Months Ended |
| Fiscal Years Ended |
| |||||||||
|
| Sep-03 |
| Sep-03 |
| Sep-02 |
| Dec-02 |
| Dec-01 |
| |||||
Revenue |
| $ | 55,468 |
| $ | 44,828 |
| $ | 29,940 |
| $ | 40,580 |
| $ | 35,477 |
|
Less Expenses |
|
|
|
|
|
|
|
|
|
|
| |||||
Losses and loss adjustment expenses |
| 25,848 |
| 20,604 |
| 10,743 |
| 15,987 |
| 16,155 |
| |||||
Amortization deferred policy acq. Costs |
| (3,239 | ) | (914 | ) | 261 |
| (2,064 | ) | 1,467 |
| |||||
Other Underwriting & Operating |
| 20,085 |
| 15,023 |
| 13,380 |
| 18,442 |
| 19,531 |
| |||||
Operating Income |
| 12,774 |
| 10,115 |
| 5,556 |
| 8,215 |
| (1,676 | ) | |||||
Interest Income / (Expense), net |
| (334 | ) | (287 | ) | (295 | ) | (342 | ) | (592 | ) | |||||
Other Income / (Expense), net |
| — |
| — |
| — |
| — |
| — |
| |||||
Pre-tax Income |
| 12,440 |
| 9,828 |
| 5,261 |
| 7,873 |
| (2,268 | ) | |||||
Taxes |
| 4,227 |
| 3,415 |
| 2,491 |
| 3,303 |
| (631 | ) | |||||
After-tax Income |
| 8,213 |
| 6,413 |
| 2,770 |
| 4,570 |
| (1,637 | ) | |||||
Minority Interest |
| — |
| — |
| — |
| — |
| — |
| |||||
Equity in Affiliates |
| — |
| — |
| — |
| — |
| — |
| |||||
Normalized Net Income |
| 8,213 |
| 6,413 |
| 2,770 |
| 4,570 |
| (1,637 | ) | |||||
Dividends/Other Non-Common Dist |
| — |
| — |
| — |
| — |
| — |
| |||||
Normalized Net Income to Common |
| $ | 8,213 |
| $ | 6,413 |
| $ | 2,770 |
| $ | 4,570 |
| $ | (1,637 | ) |
|
|
|
|
|
|
|
|
|
|
|
| |||||
Normalized EBIT |
| $ | 12,774 |
| $ | 10,115 |
| $ | 5,556 |
| $ | 8,215 |
| $ | (1,676 | ) |
Depreciation & Amortization |
| $ | 345 |
| $ | 226 |
| $ | 258 |
| $ | 377 |
| $ | 396 |
|
Normalized EBITDA |
| $ | 13,119 |
| $ | 10,341 |
| $ | 5,814 |
| $ | 8,592 |
| $ | (1,280 | ) |
CAPEX |
| $ | 444 |
| $ | 262 |
| $ | 127 |
| $ | 309 |
| $ | 153 |
|
EBITDA - CAPEX |
| $ | 12,675 |
| $ | 10,079 |
| $ | 5,687 |
| $ | 8,283 |
| $ | (1,433 | ) |
GAAP Operating Cash Flow |
| na |
| na |
| na |
| $ | 14,965 |
| $ | (946 | ) | |||
|
|
|
|
|
|
|
|
|
|
|
| |||||
Basic Reported Weighted Avg Shares Out (000’s) |
|
|
| 3,075 |
| 3,012 |
| 3,006 |
| 3,153 |
| |||||
Basic Normalized EPS |
| $ | 2.69 |
| $ | 2.09 |
| $ | 0.92 |
| $ | 1.52 |
| $ | (0.52 | ) |
Basic Reported EPS |
| $ | 2.69 |
| $ | 2.09 |
| $ | 0.92 |
| $ | 1.52 |
| $ | (0.31 | ) |
Diluted Reported Weighted Avg Shares Out (000’s) |
|
|
| 3,249 |
| 3,012 |
| 3,006 |
| 3,153 |
| |||||
Diluted Normalized EPS |
| $ | 2.57 |
| $ | 1.97 |
| $ | 0.92 |
| $ | 1.52 |
| $ | (0.52 | ) |
Diluted Reported EPS |
| $ | 2.57 |
| $ | 1.97 |
| $ | 0.92 |
| $ | 1.52 |
| $ | (0.31 | ) |
|
|
|
|
|
|
|
|
|
|
|
| |||||
Normalized Reconciliation | ||||||||||||||||
|
|
|
|
|
|
|
|
|
|
|
| |||||
Restructuring/Goodwill Impairment |
| $ | — |
| $ | — |
| $ | — |
| $ | — |
| $ | (540 | ) |
Other Unusual (Expense) Gain Items |
| — |
| — |
| — |
| — |
| — |
| |||||
Tax Shelter (Charge) on Unusual Items |
| — |
| — |
| — |
| — |
| — |
| |||||
Unusual (Exp) Gain Items, net of Taxes |
| — |
| — |
| — |
| — |
| (540 | ) | |||||
Accounting Changes, net of Taxes |
| — |
| — |
| — |
| — |
| — |
| |||||
Discontinued Operations, net of Taxes |
| — |
| — |
| — |
| — |
| — |
| |||||
Extraordinary Items, net of Taxes |
| — |
| — |
| — |
| — |
| 1,185 |
| |||||
Total Reconciling Items, net of Taxes |
| $ | — |
| $ | — |
| $ | — |
| $ | — |
| $ | 645 |
|
|
|
|
|
|
|
|
|
|
|
|
| |||||
Reported Income Tax (Benefit) |
| $ | 4,227 |
| $ | 3,415 |
| $ | 2,491 |
| $ | 3,303 |
| $ | (631 | ) |
Reported Net Income (Loss) |
| $ | 8,213 |
| $ | 6,413 |
| $ | 2,770 |
| $ | 4,570 |
| $ | (992 | ) |
|
|
|
|
|
|
|
|
|
|
|
| |||||
Revenue Breakdown | ||||||||||||||||
|
|
|
|
|
|
|
|
|
|
|
| |||||
Net Premiums |
| $ | 42,265 |
| $ | 33,257 |
| $ | 20,385 |
| $ | 29,393 |
| $ | 20,256 |
|
Fees, Commissions & Other |
| 10,194 |
| 8,889 |
| 9,998 |
| 11,303 |
| 17,066 |
| |||||
Investment Income |
| 3,009 |
| 2,682 |
| (443 | ) | (116 | ) | (1,845 | ) | |||||
|
| $ | 55,468 |
| $ | 44,828 |
| $ | 29,940 |
| $ | 40,580 |
| $ | 35,477 |
|
Net Premiums |
| 76.2 | % | 74.2 | % | 68.1 | % | 72.4 | % | 57.1 | % | |||||
Fees, Commissions & Other |
| 18.4 | % | 19.8 | % | 33.4 | % | 27.9 | % | 48.1 | % | |||||
Investment Income |
| 5.4 | % | 6.0 | % | -1.5 | % | -0.3 | % | -5.2 | % | |||||
Sources of information: SEC Edgar filings, Multex, Capital IQ, Yahoo and Commodity Systems.
67
Balance Sheet Data
|
| Sep-03 |
| Dec-02 |
| Dec-01 |
| ||||||||
Cash |
| $ | — |
| $ | 4,478 |
| $ | 2,151 |
| |||||
Investments |
| 52,717 |
| 25,378 |
| 17,507 |
| ||||||||
Premium Receivables |
| 8,412 |
| 8,373 |
| 1,561 |
| ||||||||
Reinsurance Balance Receivable |
| 4,886 |
| 7,218 |
| 10,814 |
| ||||||||
Reinsurance Recoverable |
| 12,082 |
| 7,857 |
| 7,053 |
| ||||||||
Prepaid Reinsurance Premiums |
| 8,734 |
| 11,251 |
| 5,560 |
| ||||||||
Deferred Policy Acquisition Costs |
| 829 |
| 8 |
| 12 |
| ||||||||
PPE, net |
| 4,877 |
| 4,820 |
| 5,087 |
| ||||||||
Intangibles, net |
| 1,739 |
| 1,789 |
| 1,789 |
| ||||||||
Other Assets |
| 5,792 |
| 4,146 |
| 4,694 |
| ||||||||
Total Assets |
| $ | 100,068 |
| $ | 75,318 |
| $ | 56,228 |
| |||||
|
|
|
|
|
|
|
| ||||||||
Losses and Loss Adjustment expense |
| $ | 24,041 |
| $ | 16,984 |
| $ | 11,005 |
| |||||
Unearned Premiums |
| 28,999 |
| 28,935 |
| 14,951 |
| ||||||||
Other Policy Liabilities |
| — |
| — |
| — |
| ||||||||
Account Payables & Accrued Expenses |
| 2,836 |
| 3,794 |
| 3,532 |
| ||||||||
Other Liabilties |
| 13,426 |
| 2,351 |
| 2,332 |
| ||||||||
Interest Bearing Debt |
| 4,672 |
| 5,156 |
| 10,199 |
| ||||||||
Capital Leases |
| — |
| — |
| — |
| ||||||||
Minority Interests |
| — |
| — |
| — |
| ||||||||
Pref Stock (Liq Value) |
| — |
| — |
| — |
| ||||||||
Total Liabilities & Pref Stock |
| 73,974 |
| 57,220 |
| 42,019 |
| ||||||||
Common Equity |
| 26,094 |
| 18,098 |
| 14,209 |
| ||||||||
Total Liabilities & Equity |
| $ | 100,068 |
| $ | 75,318 |
| $ | 56,228 |
| |||||
|
|
|
|
|
|
|
| ||||||||
Common Shares Outstanding (000’s) |
| 3,114 |
| 2,990 |
| 3,030 |
| ||||||||
Cash Value per share |
| $ | — |
| $ | 1.50 |
| $ | 0.71 |
| |||||
Common Book Value per share |
| $ | 8.38 |
| $ | 6.05 |
| $ | 4.69 |
| |||||
Common Tangible Book Value per share |
| $ | 7.82 |
| $ | 5.45 |
| $ | 4.10 |
| |||||
Total Debt |
| $ | 4,672 |
| $ | 5,156 |
| $ | 10,199 |
| |||||
Net Debt |
| $ | 4,672 |
| $ | 678 |
| $ | 8,048 |
| |||||
Total Capitalization |
| $ | 30,766 |
| $ | 23,254 |
| $ | 24,408 |
| |||||
|
|
|
|
|
|
|
| ||||||||
Balance Sheet Analysis | |||||||||||||||
|
|
|
|
|
|
|
| ||||||||
Effectiveness and Efficiency |
|
|
|
|
|
|
| ||||||||
Premium Receivable Turnover |
| 5.0 | x | 5.9 | x | 13.0 | x | ||||||||
Asset Turnover |
| 0.6 | x | 0.6 | x | 0.6 | x | ||||||||
Days Sales Outstanding |
| 72.5 |
| 61.7 |
| 28.1 |
| ||||||||
Normalized Return on Avg Assets |
| 9.4 | % | 6.9 | % | na |
| ||||||||
Normalized Return on Avg Common Equity |
| 37.2 | % | 28.3 | % | na |
| ||||||||
Net Investment Yield |
| 7.3 | % | -0.5 | % | na |
| ||||||||
Financial Strength |
|
|
|
|
|
|
| ||||||||
Net Premiums Written to Surplus |
| 1.9 | x | 1.8 | x | na |
| ||||||||
Total Debt/Total Capitalization |
| 15.2 | % | 22.2 | % | 41.8 | % | ||||||||
Total Debt/TIC |
| 7.7 | % | 8.5 | % | 16.7 | % | ||||||||
Total Debt/EBITDA |
| 0.4 | x | 0.6 | x | na |
| ||||||||
Total Debt/EBITDA-CAPEX |
| 0.4 | x | 0.6 | x | na |
| ||||||||
EBITDA/Interest Expense |
| 39.3 | x | 25.1 | x | na |
| ||||||||
EBITDA-CAPEX/Interest Expense |
| 37.9 | x | 24.2 | x | na |
| ||||||||
|
|
|
|
|
|
|
| ||||||||
Income and Cashflow Analysis | |||||||||||||||
|
|
|
|
|
|
|
|
|
|
|
| ||||
|
| LTM |
| Nine Months Ended |
| Fiscal Years Ended |
| ||||||||
|
| Sep-03 |
| Sep-03 |
| Sep-02 |
| Dec-02 |
| Dec-01 |
| ||||
Profitability & Cost Ratios (as % of Revenue) |
|
|
|
|
|
|
|
|
|
|
| ||||
S,G & A |
| -5.8 | % | -2.0 | % | 0.9 | % | -5.1 | % | 4.1 | % | ||||
Operating Income |
| 23.0 | % | 22.6 | % | 18.6 | % | 20.2 | % | -4.7 | % | ||||
Pre-Tax |
| 22.4 | % | 21.9 | % | 17.6 | % | 19.4 | % | -6.4 | % | ||||
EBIT |
| 23.0 | % | 22.6 | % | 18.6 | % | 20.2 | % | -4.7 | % | ||||
EBITDA |
| 23.7 | % | 23.1 | % | 19.4 | % | 21.2 | % | -3.6 | % | ||||
Normalized Net Income to Common |
| 14.8 | % | 14.3 | % | 9.3 | % | 11.3 | % | -4.6 | % | ||||
Reported Net Income |
| 14.8 | % | 14.3 | % | 9.3 | % | 11.3 | % | -2.8 | % | ||||
CAPEX |
| 0.8 | % | 0.6 | % | 0.4 | % | 0.8 | % | 0.4 | % | ||||
|
|
|
|
|
|
|
|
|
|
|
| ||||
Industry Underwriting Performance Ratios |
|
|
|
|
|
|
|
|
|
|
| ||||
Loss Ratio |
| 61.2 | % | 62.0 | % | 52.7 | % | 54.4 | % | 79.8 | % | ||||
Total Expense Ratio |
| 81.4 | % | 82.4 | % | 80.3 | % | 79.5 | % | 99.5 | % | ||||
|
|
|
|
|
|
|
|
|
|
|
| ||||
Period Growth Rates |
|
|
|
|
|
|
|
|
|
|
| ||||
Revenue |
|
|
| 49.7 | % |
|
| 14.4 | % |
|
| ||||
EBIT |
|
|
| 82.1 | % |
|
| -590.2 | % |
|
| ||||
EBITDA |
|
|
| 77.9 | % |
|
| -771.3 | % |
|
| ||||
Notes
AM Best Rating for Federated National, B, and B+ for American Vehicle.
September 30 numbers based on information contained in press release dated October 30, 2003.
Company Description
21st Century Holding Company is a vertically integrated insurance holding company that controls substantially all aspects of the insurance underwriting, distribution and the claims process through its subsidiaries. The Company underwrites personal automobile insurance, homeowners insurance and mobile home property and casualty insurance in the State of Florida through its wholly owned subsidiaries, Federated National Insurance Company and American Vehicle Insurance Company. The Company internally processes claims through a wholly owned claims adjusting company, Superior Adjusting, Inc. 21st Century also offers premium financing to its own and third-party insureds through its wholly owned subsidiary, Federated Premium Finance Inc. 21st Century, through its wholly owned subsidiary, FedUSA Inc., franchises agencies under the FedUSA name.
Sources of information: SEC Edgar filings, Multex, Capital IQ, Yahoo and Commodity Systems.
68
National Security Group Overview |
| ($ in thousands, except per share) | ||||||||||
|
|
| ||||||||||
Company Information | ||||||||||||
|
|
| ||||||||||
Name |
| National Security Group |
| Address |
| 661 East Davis Street | ||||||
Symbol |
| NSEC |
| City, State Zip |
| Elba, AL 36323 | ||||||
Latest Fiscal YE |
| 31-Dec-02 |
| Telephone |
| (334) 897-2273 | ||||||
Latest Rprt Per |
| 30-Jun-03 |
| Website |
|
| ||||||
|
|
|
|
|
|
| ||||||
Market Information | ||||||||||||
|
|
|
|
|
|
| ||||||
As of Date |
| 3-Nov-03 |
| |||||||||
Exchange |
| NASDAQ |
| |||||||||
Stock Price |
| $ | 18.25 |
| ||||||||
52 Week High |
| $ | 18.25 |
| ||||||||
52 Week Low |
| $ | 11.99 |
| ||||||||
Avg. Daily Volume (000’s) |
| 1 |
| |||||||||
Beta |
| 0.01 |
| |||||||||
Shares Outstanding (000’s) |
| 2,470 |
| |||||||||
|
|
|
| |||||||||
Market Cap |
| $ | 45,078 |
| ||||||||
Total Invested Capital (TIC) |
| $ | 48,301 |
| ||||||||
Enterprise Value (EV) |
| $ | 47,558 |
| ||||||||
|
|
|
| |||||||||
Insider Ownership |
| 39.20 | % | |||||||||
Institutional |
|
|
| |||||||||
% Owned |
| 3.44 | % | |||||||||
Number of Institutions |
| — |
| |||||||||
|
|
|
| |||||||||
Valuation Analysis | ||||||||||||
|
|
|
| |||||||||
|
| Multiple of |
| ||||
|
| Market Cap |
| TIC |
| EV |
|
Latest Twelve Months |
|
|
|
|
|
|
|
Revenue |
| 0.98 | x | 1.05 | x | 1.04 | x |
EBIT |
| 10.95 | x | 11.74 | x | 11.56 | x |
EBITDA |
| 10.75 | x | 11.52 | x | 11.34 | x |
Normalized Net Income |
| 17.59 | x | 18.85 | x | 18.56 | x |
Basic Normalized EPS |
| 17.55 | x | na |
| na |
|
Projected |
|
|
|
|
|
|
|
Jan-00 Mean Revenue |
| na |
| na |
| na |
|
Jan-00 Mean Revenue |
| na |
| na |
| na |
|
Jan-00 Mean EBITDA |
| na |
| na |
| na |
|
Jan-00 Mean EBITDA |
| na |
| na |
| na |
|
Jan-00 Mean EPS |
| na |
| na |
| na |
|
Jan-00 Mean EPS |
| na |
| na |
| na |
|
Most Recent Filing |
|
|
|
|
|
|
|
Assets |
| 0.41 | x | 0.44 | x | 0.43 | x |
Common Equity |
| 1.01 | x | na |
| na |
|
Tangible Common Equity |
| 1.01 | x | na |
| na |
|
Income and Cashflow Statement Data
|
| LTM |
| Six Months Ended |
| Fiscal Years Ended |
| |||||||||
|
| Jun-03 |
| Jun-03 |
| Jun-02 |
| Dec-02 |
| Dec-01 |
| |||||
Revenue |
| $ | 45,890 |
| $ | 25,521 |
| $ | 18,716 |
| $ | 39,085 |
| $ | 32,783 |
|
Less Expenses |
|
|
|
|
|
|
|
|
|
|
| |||||
Losses and loss adjustment expenses |
| 25,342 |
| 13,583 |
| 11,004 |
| 22,763 |
| 13,516 |
| |||||
Amortization deferred policy acq. Costs |
| 2,405 |
| 4,486 |
| 3,487 |
| 1,406 |
| 1,778 |
| |||||
Other Underwriting & Operating |
| 14,111 |
| 4,349 |
| 3,714 |
| 13,476 |
| 11,776 |
| |||||
Operating Income |
| 4,032 |
| 3,103 |
| 511 |
| 1,440 |
| 5,713 |
| |||||
Interest Income / (Expense), net |
| (246 | ) | — |
| — |
| (246 | ) | (243 | ) | |||||
Other Income / (Expense), net |
| — |
| — |
| — |
| — |
| — |
| |||||
Pre-tax Income |
| 3,786 |
| 3,103 |
| 511 |
| 1,194 |
| 5,470 |
| |||||
Taxes |
| 1,307 |
| 990 |
| 105 |
| 422 |
| 1,392 |
| |||||
After-tax Income |
| 2,479 |
| 2,113 |
| 406 |
| 772 |
| 4,078 |
| |||||
Minority Interest |
| — |
| — |
| — |
| — |
| — |
| |||||
Equity in Affiliates |
| 83 |
| (17 | ) | 36 |
| 136 |
| 52 |
| |||||
Normalized Net Income |
| 2,562 |
| 2,096 |
| 442 |
| 908 |
| 4,130 |
| |||||
Dividends/Other Non-Common Dist |
| — |
| — |
| — |
| — |
| — |
| |||||
Normalized Net Income to Common |
| $ | 2,562 |
| $ | 2,096 |
| $ | 442 |
| $ | 908 |
| $ | 4,130 |
|
|
|
|
|
|
|
|
|
|
|
|
| |||||
Normalized EBIT |
| $ | 4,115 |
| $ | 3,086 |
| $ | 547 |
| $ | 1,576 |
| $ | 5,765 |
|
Depreciation & Amortization |
| $ | 77 |
| $ | (191 | ) | $ | (73 | ) | $ | 195 |
| $ | (42 | ) |
Normalized EBITDA |
| $ | 4,192 |
| $ | 2,895 |
| $ | 474 |
| $ | 1,771 |
| $ | 5,723 |
|
CAPEX |
| $ | 1,189 |
| $ | 241 |
| $ | 91 |
| $ | 1,039 |
| $ | 335 |
|
EBITDA - CAPEX |
| $ | 3,003 |
| $ | 2,654 |
| $ | 383 |
| $ | 732 |
| $ | 5,388 |
|
GAAP Operating Cash Flow |
| $ | 11,480 |
| $ | 5,854 |
| $ | (1,305 | ) | $ | 4,321 |
| $ | 2,913 |
|
|
|
|
|
|
|
|
|
|
|
|
| |||||
Basic Reported Weighted Avg Shares Out (000’s) |
|
|
| 2,467 |
| 2,467 |
| 2,467 |
| 2,467 |
| |||||
Basic Normalized EPS |
| $ | 1.04 |
| $ | 0.85 |
| $ | 0.18 |
| $ | 0.37 |
| $ | 1.67 |
|
Basic Reported EPS |
| $ | 1.04 |
| $ | 0.85 |
| $ | 0.18 |
| $ | 0.37 |
| $ | 1.67 |
|
Diluted Reported Weighted Avg Shares Out (000’s) |
|
|
| 2,467 |
| 2,467 |
| 2,467 |
| 2,467 |
| |||||
Diluted Normalized EPS |
| $ | 1.04 |
| $ | 0.85 |
| $ | 0.18 |
| $ | 0.37 |
| $ | 1.67 |
|
Diluted Reported EPS |
| $ | 1.04 |
| $ | 0.85 |
| $ | 0.18 |
| $ | 0.37 |
| $ | 1.67 |
|
|
|
|
|
|
|
|
|
|
|
|
| |||||
Normalized Reconciliation | ||||||||||||||||
|
|
|
|
|
|
|
|
|
|
|
| |||||
Restructuring/Goodwill Impairment |
| $ | — |
| $ | — |
| $ | — |
| $ | — |
| $ | — |
|
Other Unusual (Expense) Gain Items |
| — |
| — |
| — |
| — |
| — |
| |||||
Tax Shelter (Charge) on Unusual Items |
| — |
| — |
| — |
| — |
| — |
| |||||
Unusual (Exp) Gain Items, net of Taxes |
| — |
| — |
| — |
| — |
| — |
| |||||
Accounting Changes, net of Taxes |
| — |
| — |
| — |
| — |
| — |
| |||||
Discontinued Operations, net of Taxes |
| — |
| — |
| — |
| — |
| — |
| |||||
Extraordinary Items, net of Taxes |
| — |
| — |
| — |
| — |
| — |
| |||||
Total Reconciling Items, net of Taxes |
| $ | — |
| $ | — |
| $ | — |
| $ | — |
| $ | — |
|
|
|
|
|
|
|
|
|
|
|
|
| |||||
Reported Income Tax (Benefit) |
| $ | 1,307 |
| $ | 990 |
| $ | 105 |
| $ | 422 |
| $ | 1,392 |
|
Reported Net Income (Loss) |
| $ | 2,562 |
| $ | 2,096 |
| $ | 442 |
| $ | 908 |
| $ | 4,130 |
|
|
|
|
|
|
|
|
|
|
|
|
| |||||
Revenue Breakdown | ||||||||||||||||
|
|
|
|
|
|
|
|
|
|
|
| |||||
Net Premiums |
| $ | 39,277 |
| $ | 21,952 |
| $ | 15,306 |
| $ | 32,631 |
| $ | 25,357 |
|
Fees, Commissions & Other |
| 1,197 |
| 666 |
| 520 |
| 1,051 |
| 1,280 |
| |||||
Investment Income |
| 5,416 |
| 2,903 |
| 2,890 |
| 5,403 |
| 6,146 |
| |||||
|
| $ | 45,890 |
| $ | 25,521 |
| $ | 18,716 |
| $ | 39,085 |
| $ | 32,783 |
|
Net Premiums |
| 85.6 | % | 86.0 | % | 81.8 | % | 83.5 | % | 77.3 | % | |||||
Fees, Commissions & Other |
| 2.6 | % | 2.6 | % | 2.8 | % | 2.7 | % | 3.9 | % | |||||
Investment Income |
| 11.8 | % | 11.4 | % | 15.4 | % | 13.8 | % | 18.7 | % | |||||
Sources of information: SEC Edgar filings, Multex, Capital IQ, Yahoo and Commodity Systems.
69
|
| Jun-03 |
| Dec-02 |
| Dec-01 |
| |||
Cash |
| $ | 743 |
| $ | 805 |
| $ | 1,595 |
|
Investments |
| 96,388 |
| 88,183 |
| 85,496 |
| |||
Premium Receivables |
| — |
| 2,273 |
| 1,913 |
| |||
Reinsurance Balance Receivable |
| — |
| — |
| — |
| |||
Reinsurance Recoverable |
| 1,917 |
| 1,699 |
| 3,524 |
| |||
Prepaid Reinsurance Premiums |
| 355 |
| 343 |
| 291 |
| |||
Deferred Policy Acquisition Costs |
| 6,015 |
| 5,243 |
| 4,615 |
| |||
PPE, net |
| — |
| 1,798 |
| 966 |
| |||
Intangibles, net |
| — |
| — |
| — |
| |||
Other Assets |
| 5,593 |
| 1,258 |
| 1,084 |
| |||
Total Assets |
| $ | 111,011 |
| $ | 101,602 |
| $ | 99,484 |
|
|
|
|
|
|
|
|
| |||
Losses and Loss Adjustment expense |
| $ | 36,520 |
| $ | 34,723 |
| $ | 41,739 |
|
Unearned Premiums |
| 12,936 |
| 10,331 |
| — |
| |||
Other Policy Liabilities |
| 6,098 |
| 3,972 |
| 3,408 |
| |||
Account Payables & Accrued Expenses |
|
|
|
|
|
|
| |||
Other Liabilties |
| 7,418 |
| 7,037 |
| 7,345 |
| |||
Interest Bearing Debt |
| 3,223 |
| 3,380 |
| 2,108 |
| |||
Capital Leases |
| — |
| — |
| — |
| |||
Minority Interests |
| — |
| — |
| — |
| |||
Pref Stock (Liq Value) |
| — |
| — |
| — |
| |||
Total Liabilities & Pref Stock |
| 66,195 |
| 59,443 |
| 54,600 |
| |||
Common Equity |
| 44,816 |
| 42,159 |
| 44,884 |
| |||
Total Liabilities & Equity |
| $ | 111,011 |
| $ | 101,602 |
| $ | 99,484 |
|
|
|
|
|
|
|
|
| |||
|
|
|
|
|
|
|
| |||
Common Shares Outstanding (000’s) |
| 2,467 |
| 2,467 |
| 2,467 |
| |||
Cash Value per share |
| $ | 0.30 |
| $ | 0.33 |
| $ | 0.65 |
|
Common Book Value per share |
| $ | 18.17 |
| $ | 17.09 |
| $ | 18.19 |
|
Common Tangible Book Value per share |
| $ | 18.17 |
| $ | 17.09 |
| $ | 18.19 |
|
Total Debt |
| $ | 3,223 |
| $ | 3,380 |
| $ | 2,108 |
|
Net Debt |
| $ | 2,480 |
| $ | 2,575 |
| $ | 513 |
|
Total Capitalization |
| $ | 48,039 |
| $ | 45,539 |
| $ | 46,992 |
|
Balance Sheet Analysis
Effectiveness and Efficiency |
|
|
|
|
|
|
|
Premium Receivable Turnover |
| 34.6 | x | 15.6 | x | 13.3 | x |
Asset Turnover |
| 0.4 | x | 0.4 | x | 0.3 | x |
Days Sales Outstanding |
| 10.6 |
| 23.4 |
| 27.5 |
|
Normalized Return on Avg Assets |
| 2.4 | % | 0.9 | % | na |
|
Normalized Return on Avg Common Equity |
| 5.9 | % | 2.1 | % | na |
|
Net Investment Yield |
| 5.8 | % | 6.1 | % | na |
|
Financial Strength |
|
|
|
|
|
|
|
Net Premiums Written to Surplus |
| 0.9 | x | 0.7 | x | na |
|
Total Debt/Total Capitalization |
| 6.7 | % | 7.4 | % | 4.5 | % |
Total Debt/TIC |
| 6.7 | % | 7.0 | % | 4.4 | % |
Total Debt/EBITDA |
| 0.8 | x | 1.9 | x | 0.4 | x |
Total Debt/EBITDA-CAPEX |
| 1.1 | x | 4.6 | x | 0.4 | x |
EBITDA/Interest Expense |
| 17.0 | x | 7.2 | x | 23.6 | x |
EBITDA-CAPEX/Interest Expense |
| 12.2 | x | 3.0 | x | 22.2 | x |
Income and Cashflow Analysis
|
| LTM |
| Six Months Ended |
| Fiscal Years Ended |
| ||||
|
| Jun-03 |
| Jun-03 |
| Jun-02 |
| Dec-02 |
| Dec-01 |
|
Profitability & Cost Ratios (as % of Revenue) |
|
|
|
|
|
|
|
|
|
|
|
S,G & A |
| 5.2 | % | 17.6 | % | 18.6 | % | 3.6 | % | 5.4 | % |
Operating Income |
| 8.8 | % | 12.2 | % | 2.7 | % | 3.7 | % | 17.4 | % |
Pre-Tax |
| 8.3 | % | 12.2 | % | 2.7 | % | 3.1 | % | 16.7 | % |
EBIT |
| 9.0 | % | 12.1 | % | 2.9 | % | 4.0 | % | 17.6 | % |
EBITDA |
| 9.1 | % | 11.3 | % | 2.5 | % | 4.5 | % | 17.5 | % |
Normalized Net Income to Common |
| 5.6 | % | 8.2 | % | 2.4 | % | 2.3 | % | 12.6 | % |
Reported Net Income |
| 5.6 | % | 8.2 | % | 2.4 | % | 2.3 | % | 12.6 | % |
CAPEX |
| 2.6 | % | 0.9 | % | 0.5 | % | 2.7 | % | 1.0 | % |
|
|
|
|
|
|
|
|
|
|
|
|
Industry Underwriting Performance Ratios |
|
|
|
|
|
|
|
|
|
|
|
Loss Ratio |
| 64.5 | % | 61.9 | % | 71.9 | % | 69.8 | % | 53.3 | % |
Total Expense Ratio |
| 103.4 | % | 99.1 | % | 115.0 | % | 111.8 | % | 101.6 | % |
|
|
|
|
|
|
|
|
|
|
|
|
Period Growth Rates |
|
|
|
|
|
|
|
|
|
|
|
Revenue |
|
|
| 36.4 | % |
|
| 19.2 | % |
|
|
EBIT |
|
|
| 464.2 | % |
|
| -72.7 | % |
|
|
EBITDA |
|
|
| 510.8 | % |
|
| -69.1 | % |
|
|
Notes
Company Description
The National Security Group, Inc. is an insurance holding company that offers property and casualty insurance and life insurance. The Company, through its property and casualty subsidiaries, writes primarily dwelling fire and windstorm, homeowners, mobile homeowners, and personal non-standard automobile lines of insurance. Through its life insurance subsidiary, the Company offers a basic line of life, and health and accident insurance products. Property-casualty insurance is the most significant segment, accounting for 84% of total premium revenues.
Sources of information: SEC Edgar filings, Multex, Capital IQ, Yahoo and Commodity Systems.
70
Unico American Corp Overview | ($ in thousands, except per share) |
Company Information
Name |
| Unico American Corp | Address |
| 23251 Mulholland Drive |
Symbol |
| UNAM | City, State Zip |
| Woodland Hills, CA 91364 |
Latest Fiscal YE |
| 31-Dec-02 | Telephone |
| (818) 591-9800 |
Latest Rprt Per |
| 30-Jun-03 | Website |
|
|
|
|
|
|
|
|
Market Information
As of Date |
| 3-Nov-03 |
| |
Exchange |
| NASDAQ |
| |
Stock Price |
| $ | 4.66 |
|
52 Week High |
| $ | 5.21 |
|
52 Week Low |
| $ | 2.30 |
|
Avg. Daily Volume (000’s) |
| 2 |
| |
Beta |
| 0.02 |
| |
Shares Outstanding (000’s) |
| 5,490 |
| |
Market Cap |
| $ | 25,589 |
|
Total Invested Capital (TIC) |
| $ | 25,589 |
|
Enterprise Value (EV) |
| $ | 25,528 |
|
|
|
|
|
|
Insider Ownership |
| 58.11 | % | |
Institutional |
|
|
| |
% Owned |
| 32.48 | % | |
Number of Institutions |
| — |
| |
Valuation Analysis
|
| Multiple of |
| ||||
|
| Market Cap |
| TIC |
| EV |
|
Latest Twelve Months |
|
|
|
|
|
|
|
Revenue |
| 0.54 | x | 0.54 | x | 0.53 | x |
EBIT |
| 14.08 | x | 14.08 | x | 14.04 | x |
EBITDA |
| 11.36 | x | 11.36 | x | 11.34 | x |
Normalized Net Income |
| 22.71 | x | 22.71 | x | 22.65 | x |
Basic Normalized EPS |
| 23.31 | x | na |
| na |
|
Projected |
|
|
|
|
|
|
|
Jan-00 Mean Revenue |
| na |
| na |
| na |
|
Jan-00 Mean Revenue |
| na |
| na |
| na |
|
Jan-00 Mean EBITDA |
| na |
| na |
| na |
|
Jan-00 Mean EBITDA |
| na |
| na |
| na |
|
Jan-00 Mean EPS |
| na |
| na |
| na |
|
Jan-00 Mean EPS |
| na |
| na |
| na |
|
Most Recent Filing |
|
|
|
|
|
|
|
Assets |
| 0.17 | x | 0.17 | x | 0.17 | x |
Common Equity |
| 0.65 | x | na |
| na |
|
Tangible Common Equity |
| 0.65 | x | na |
| na |
|
Income and Cashflow Statement Data
|
| LTM |
| Six Months Ended |
| Fiscal Years Ended |
| |||||||||
|
| Jun-03 |
| Jun-03 |
| Jun-02 |
| Dec-02 |
| Dec-01 |
| |||||
Revenue |
| $ | 47,757 |
| $ | 23,709 |
| $ | 21,980 |
| $ | 46,028 |
| $ | 42,117 |
|
Less Expenses |
|
|
|
|
|
|
|
|
|
|
| |||||
Losses and loss adjustment expenses |
| 27,577 |
| 13,676 |
| 18,826 |
| 32,727 |
| 41,677 |
| |||||
Amortization deferred policy acq. Costs |
| 8,499 |
| 3,654 |
| 4,429 |
| 9,274 |
| 8,695 |
| |||||
Other Underwriting & Operating |
| 9,863 |
| 5,147 |
| 4,125 |
| 8,841 |
| 8,468 |
| |||||
Operating Income |
| 1,818 |
| 1,232 |
| (5,400 | ) | (4,814 | ) | (16,723 | ) | |||||
Interest Income / (Expense), net |
| — |
| — |
| — |
| — |
| — |
| |||||
Other Income / (Expense), net |
| — |
| — |
| — |
| — |
| — |
| |||||
Pre-tax Income |
| 1,818 |
| 1,232 |
| (5,400 | ) | (4,814 | ) | (16,723 | ) | |||||
Taxes |
| 691 |
| 437 |
| (1,843 | ) | (1,589 | ) | (5,853 | ) | |||||
After-tax Income |
| 1,127 |
| 795 |
| (3,557 | ) | (3,225 | ) | (10,870 | ) | |||||
Minority Interest |
| — |
| — |
| — |
| — |
| — |
| |||||
Equity in Affiliates |
| — |
| — |
| — |
| — |
| — |
| |||||
Normalized Net Income |
| 1,127 |
| 795 |
| (3,557 | ) | (3,225 | ) | (10,870 | ) | |||||
Dividends/Other Non-Common Dist |
| — |
| — |
| — |
| — |
| — |
| |||||
Normalized Net Income to Common |
| $ | 1,127 |
| $ | 795 |
| $ | (3,557 | ) | $ | (3,225 | ) | $ | (10,870 | ) |
|
|
|
|
|
|
|
|
|
|
|
| |||||
Normalized EBIT |
| $ | 1,818 |
| $ | 1,232 |
| $ | (5,400 | ) | $ | (4,814 | ) | $ | (16,723 | ) |
Depreciation & Amortization |
| $ | 434 |
| $ | 200 |
| $ | 228 |
| $ | 462 |
| $ | 417 |
|
Normalized EBITDA |
| $ | 2,252 |
| $ | 1,432 |
| $ | (5,172 | ) | $ | (4,352 | ) | $ | (16,306 | ) |
CAPEX |
| $ | 66 |
| $ | 25 |
| $ | 131 |
| $ | 172 |
| $ | 225 |
|
EBITDA – CAPEX |
| $ | 2,186 |
| $ | 1,407 |
| $ | (5,303 | ) | $ | (4,524 | ) | $ | (16,531 | ) |
GAAP Operating Cash Flow |
| $ | 9,732 |
| $ | 5,791 |
| $ | 4,072 |
| $ | 8,013 |
| $ | (1,289 | ) |
|
|
|
|
|
|
|
|
|
|
|
| |||||
Basic Reported Weighted Avg Shares Out (000’s) |
|
|
| 5,490 |
| 5,485 |
| 5,487 |
| 5,505 |
| |||||
Basic Normalized EPS |
| $ | 0.20 |
| $ | 0.14 |
| $ | (0.65 | ) | $ | (0.59 | ) | $ | (1.97 | ) |
Basic Reported EPS |
| $ | 0.20 |
| $ | 0.14 |
| $ | (0.65 | ) | $ | (0.59 | ) | $ | (1.97 | ) |
Diluted Reported Weighted Avg Shares Out (000’s) |
|
|
| 5,517 |
| 5,485 |
| 5,487 |
| 5,505 |
| |||||
Diluted Normalized EPS |
| $ | 0.20 |
| $ | 0.14 |
| $ | (0.65 | ) | $ | (0.59 | ) | $ | (1.97 | ) |
Diluted Reported EPS |
| $ | 0.20 |
| $ | 0.14 |
| $ | (0.65 | ) | $ | (0.59 | ) | $ | (1.97 | ) |
Normalized Reconciliation
Restructuring/Goodwill Impairment |
| $ | — |
| $ | — |
| $ | — |
| $ | — |
| $ | — |
|
Other Unusual (Expense) Gain Items |
| — |
| — |
| — |
| — |
| — |
| |||||
Tax Shelter (Charge) on Unusual Items |
| — |
| — |
| — |
| — |
| — |
| |||||
Unusual (Exp) Gain Items, net of Taxes |
| — |
| — |
| — |
| — |
| — |
| |||||
Accounting Changes, net of Taxes |
| — |
| — |
| — |
| — |
| — |
| |||||
Discontinued Operations, net of Taxes |
| — |
| — |
| — |
| — |
| — |
| |||||
Extraordinary Items, net of Taxes |
| — |
| — |
| — |
| — |
| — |
| |||||
Total Reconciling Items, net of Taxes |
| $ | — |
| $ | — |
| $ | — |
| $ | — |
| $ | — |
|
|
|
|
|
|
|
|
|
|
|
|
| |||||
Reported Income Tax (Benefit) |
| $ | 691 |
| $ | 437 |
| $ | (1,843 | ) | $ | (1,589 | ) | $ | (5,853 | ) |
Reported Net Income (Loss) |
| $ | 1,127 |
| $ | 795 |
| $ | (3,557 | ) | $ | (3,225 | ) | $ | (10,870 | ) |
Revenue Breakdown
Net Premiums |
| $ | 34,206 |
| $ | 16,694 |
| $ | 15,847 |
| $ | 33,359 |
| $ | 29,894 |
|
Fees, Commissions & Other |
| 8,283 |
| 4,465 |
| 3,340 |
| 7,158 |
| 6,409 |
| |||||
Investment Income |
| 5,268 |
| 2,550 |
| 2,793 |
| 5,511 |
| 5,814 |
| |||||
|
| $ | 47,757 |
| $ | 23,709 |
| $ | 21,980 |
| $ | 46,028 |
| $ | 42,117 |
|
Net Premiums |
| 71.6 | % | 70.4 | % | 72.1 | % | 72.5 | % | 71.0 | % | |||||
Fees, Commissions & Other |
| 17.3 | % | 18.8 | % | 15.2 | % | 15.6 | % | 15.2 | % | |||||
Investment Income |
| 11.0 | % | 10.8 | % | 12.7 | % | 12.0 | % | 13.8 | % | |||||
Sources of information: SEC Edgar filings, Multex, Capital IQ, Yahoo and Commodity Systems.
71
Balance Sheet Data
|
| Jun-03 |
| Dec-02 |
| Dec-01 |
| |||
Cash |
| $ | 61 |
| $ | 20 |
| $ | 45 |
|
Investments |
| 112,377 |
| 107,398 |
| 97,492 |
| |||
Premium Receivables |
| 8,203 |
| 6,700 |
| 6,248 |
| |||
Reinsurance Balance Receivable |
| — |
| — |
| — |
| |||
Reinsurance Recoverable |
| 18,659 |
| 24,113 |
| 11,480 |
| |||
Prepaid Reinsurance Premiums |
| 50 |
| 95 |
| 38 |
| |||
Deferred Policy Acquisition Costs |
| 6,761 |
| 5,947 |
| 5,079 |
| |||
PPE, net |
| 334 |
| 354 |
| 267 |
| |||
Intangibles, net |
| — |
| — |
| — |
| |||
Other Assets |
| 2,997 |
| 4,059 |
| 8,174 |
| |||
Total Assets |
| $ | 149,442 |
| $ | 148,686 |
| $ | 128,823 |
|
|
|
|
|
|
|
|
| |||
Losses and Loss Adjustment expense |
| $ | 73,722 |
| $ | 74,905 |
| $ | 60,534 |
|
Unearned Premiums |
| 28,494 |
| 24,382 |
| 19,329 |
| |||
Other Policy Liabilities |
| — |
| — |
| — |
| |||
Account Payables & Accrued Expenses |
| 6,439 |
| 8,633 |
| 7,256 |
| |||
Other Liabilties |
| 1,478 |
| 1,607 |
| 1,084 |
| |||
Interest Bearing Debt |
| — |
| 750 |
| — |
| |||
Capital Leases |
| — |
| — |
| — |
| |||
Minority Interests |
| — |
| — |
| — |
| |||
Pref Stock (Liq Value) |
| — |
| — |
| — |
| |||
Total Liabilities & Pref Stock |
| 110,133 |
| 110,277 |
| 88,203 |
| |||
Common Equity |
| 39,309 |
| 38,409 |
| 40,620 |
| |||
Total Liabilities & Equity |
| $ | 149,442 |
| $ | 148,686 |
| $ | 128,823 |
|
|
|
|
|
|
|
|
| |||
Common Shares Outstanding (000’s) |
| 5,489 |
| 5,489 |
| 5,481 |
| |||
Cash Value per share |
| $ | 0.01 |
| $ | 0.00 |
| $ | 0.01 |
|
Common Book Value per share |
| $ | 7.16 |
| $ | 7.00 |
| $ | 7.41 |
|
Common Tangible Book Value per share |
| $ | 7.16 |
| $ | 7.00 |
| $ | 7.41 |
|
Total Debt |
| $ | — |
| $ | 750 |
| $ | — |
|
Net Debt |
| $ | (61 | ) | $ | 730 |
| $ | (45 | ) |
Total Capitalization |
| $ | 39,309 |
| $ | 39,159 |
| $ | 40,620 |
|
Balance Sheet Analysis
Effectiveness and Efficiency |
|
|
|
|
|
|
|
Premium Receivable Turnover |
| 4.6 | x | 5.2 |
| 4.8 | x |
Asset Turnover |
| 0.3 | x | 0.3 |
| 0.3 | x |
Days Sales Outstanding |
| 79.5 |
| 70.8 |
| 76.3 |
|
Normalized Return on Avg Assets |
| 0.8 | % | -2.3 | % | na |
|
Normalized Return on Avg Common Equity |
| 2.9 | % | -8.2 | % | na |
|
Net Investment Yield |
| 4.8 | % | 5.4 | % | na |
|
|
|
|
|
|
|
|
|
Financial Strength |
|
|
|
|
|
|
|
Net Premiums Written to Surplus |
| 0.9 | x | 0.8 | x | na |
|
Total Debt/Total Capitalization |
| 0.0 | % | 1.9 | % | 0.0 | % |
Total Debt/TIC |
| 0.0 | % | 2.9 | % | 0.0 | % |
Total Debt/EBITDA |
| — |
| na |
| na |
|
Total Debt/EBITDA-CAPEX |
| — |
| na |
| na |
|
EBITDA/Interest Expense |
| na |
| na |
| na |
|
EBITDA-CAPEX/Interest Expense |
| na |
| na |
| na |
|
Income and Cashflow Analysis
|
| LTM |
| Six Months Ended |
| Fiscal Years Ended |
| ||||
|
| Jun-03 |
| Jun-03 |
| Jun-02 |
| Dec-02 |
| Dec-01 |
|
Profitability & Cost Ratios (as % of Revenue) |
|
|
|
|
|
|
|
|
|
|
|
S,G & A |
| 17.8 | % | 15.4 | % | 20.2 | % | 20.1 | % | 20.6 | % |
Operating Income |
| 3.8 | % | 5.2 | % | -24.6 | % | -10.5 | % | -39.7 | % |
Pre-Tax |
| 3.8 | % | 5.2 | % | -24.6 | % | -10.5 | % | -39.7 | % |
EBIT |
| 3.8 | % | 5.2 | % | -24.6 | % | -10.5 | % | -39.7 | % |
EBITDA |
| 4.7 | % | 6.0 | % | -23.5 | % | -9.5 | % | -38.7 | % |
Normalized Net Income to Common |
| 2.4 | % | 3.4 | % | -16.2 | % | -7.0 | % | -25.8 | % |
Reported Net Income |
| 2.4 | % | 3.4 | % | -16.2 | % | -7.0 | % | -25.8 | % |
CAPEX |
| 0.1 | % | 0.1 | % | 0.6 | % | 0.4 | % | 0.5 | % |
|
|
|
|
|
|
|
|
|
|
|
|
Industry Underwriting Performance Ratios |
|
|
|
|
|
|
|
|
|
|
|
Loss Ratio |
| 80.6 | % | 81.9 | % | 118.8 | % | 98.1 | % | 139.4 | % |
Total Expense Ratio |
| 108.1 | % | 106.2 | % | 142.7 | % | 125.5 | % | 162.1 | % |
|
|
|
|
|
|
|
|
|
|
|
|
Period Growth Rates |
|
|
|
|
|
|
|
|
|
|
|
Revenue |
|
|
| 7.9 | % |
|
| 9.3 | % |
|
|
EBIT |
|
|
| -122.8 | % |
|
| -71.2 | % |
|
|
EBITDA |
|
|
| -127.7 | % |
|
| -73.3 | % |
|
|
Notes
AM Best Rating of B+ for Crusader Insurance Company.
Company Description
Unico American Corporation is an insurance holding company that underwrites property and casualty insurance through its insurance company subsidiary; provides property, casualty, health and life insurance through its agency subsidiaries, and provides insurance premium financing, claim administration services and membership association services through its other subsidiaries. The Company’s operations are categorized between its major segment, its insurance company operation, and all other revenues from insurance operations. The insurance operation is conducted via Crusader Insurance Company, Unico’s property and casualty insurance subsidiary. Unico’s remaining operations constitute a variety of specialty insurance services. As of December 31, 2002, Crusader was licensed as an admitted insurance carrier in the states of Arizona, California, Colorado, Idaho, Montana, Nevada, Ohio, Oregon and Washington.
Sources of information: SEC Edgar filings, Multex, Capital IQ, Yahoo and Commodity Systems.
72
Hallmark Financial Services Overview | ($ in thousands, except per share) |
Company Information
Name |
| Hallmark Financial Services | Address |
| 777 Main Street, Suite 100 |
Symbol |
| HAF | City, State Zip |
| Fort Worth, TX 76102 |
Latest Fiscal YE |
| 31-Dec-02 | Telephone |
| (817) 348-1600 |
Latest Rprt Per |
| 30-Jun-03 | Website |
| http://www.hallmarkgrp.com/ |
Market Information
As of Date |
| 3-Nov-03 |
| |
Exchange |
| ECM |
| |
Stock Price |
| $ | 0.80 |
|
52 Week High |
| $ | 1.15 |
|
52 Week Low |
| $ | 0.30 |
|
Avg. Daily Volume (000’s) |
| — |
| |
Beta |
| (0.06 | ) | |
Shares Outstanding (000’s) (1) |
| 36,318 |
| |
Market Cap |
| $ | 29,054 |
|
Total Invested Capital (TIC) |
| $ | 36,914 |
|
Enterprise Value (EV) |
| $ | 5,026 |
|
|
|
|
| |
Insider Ownership |
| 46.10 | % | |
Institutional |
|
|
| |
% Owned |
| 1.02 | % | |
Number of Institutions |
| — |
| |
Valuation Analysis
|
| Multiple of |
| ||||
|
| Market Cap |
| TIC |
| EV |
|
Latest Twelve Months |
|
|
|
|
|
|
|
Revenue |
| 0.56 | x | 0.72 | x | 0.10 | x |
EBIT |
| 13.05 | x | 16.58 | x | 2.26 | x |
EBITDA |
| 10.92 | x | 13.87 | x | 1.89 | x |
Normalized Net Income |
| 55.45 | x | 70.45 | x | 9.59 | x |
Basic Normalized EPS |
| 16.00 | x | na |
| na |
|
Projected |
|
|
|
|
|
|
|
Jan-00 Mean Revenue |
| na |
| na |
| na |
|
Jan-00 Mean Revenue |
| na |
| na |
| na |
|
Jan-00 Mean EBITDA |
| na |
| na |
| na |
|
Jan-00 Mean EBITDA |
| na |
| na |
| na |
|
Jan-00 Mean EPS |
| na |
| na |
| na |
|
Jan-00 Mean EPS |
| na |
| na |
| na |
|
Most Recent Filing |
|
|
|
|
|
|
|
Assets |
| 0.28 | x | 0.36 | x | 0.05 | x |
Common Equity |
| 1.05 | x | na |
| na |
|
Tangible Common Equity |
| 1.33 | x | na |
| na |
|
CHART NOT AVAILABLE
Income and Cashflow Statement Data
|
| LTM |
| Six Months Ended |
| Fiscal Years Ended |
| |||||||||
|
| Jun-03 |
| Jun-03 |
| Jun-02 |
| Dec-02 |
| Dec-01 |
| |||||
Revenue |
| $ | 51,536 |
| $ | 36,765 |
| $ | 11,026 |
| $ | 25,797 |
| $ | 22,002 |
|
Less Expenses |
|
|
|
|
|
|
|
|
|
|
| |||||
Losses and loss adjustment expenses |
| 24,749 |
| 16,441 |
| 6,994 |
| 15,302 |
| 15,878 |
| |||||
Amortization deferred policy acq. Costs |
| 6,877 |
| 14 |
| — |
| 6,863 |
| 3,274 |
| |||||
Other Underwriting & Operating |
| 17,683 |
| 18,165 |
| 3,095 |
| 2,613 |
| 3,503 |
| |||||
Operating Income |
| 2,227 |
| 2,145 |
| 937 |
| 1,019 |
| (653 | ) | |||||
Interest Income / (Expense), net |
| (1,432 | ) | (875 | ) | (426 | ) | (983 | ) | (1,021 | ) | |||||
Other Income / (Expense), net |
| — |
| — |
| — |
| — |
| — |
| |||||
Pre-tax Income |
| 795 |
| 1,270 |
| 511 |
| 36 |
| (1,674 | ) | |||||
Taxes |
| 271 |
| 432 |
| 174 |
| 13 |
| (544 | ) | |||||
After-tax Income |
| 524 |
| 838 |
| 337 |
| 23 |
| (1,130 | ) | |||||
Minority Interest |
| — |
| — |
| — |
| — |
| — |
| |||||
Equity in Affiliates |
| — |
| — |
| — |
| — |
| — |
| |||||
Normalized Net Income |
| 524 |
| 838 |
| 337 |
| 23 |
| (1,130 | ) | |||||
Dividends/Other Non-Common Dist |
| — |
| — |
| — |
| — |
| — |
| |||||
Normalized Net Income to Common |
| $ | 524 |
| $ | 838 |
| $ | 337 |
| $ | 23 |
| $ | (1,130 | ) |
|
|
|
|
|
|
|
|
|
|
|
| |||||
Normalized EBIT |
| $ | 2,227 |
| $ | 2,145 |
| $ | 937 |
| $ | 1,019 |
| $ | (653 | ) |
Depreciation & Amortization |
| $ | 434 |
| $ | 322 |
| $ | 83 |
| $ | 195 |
| $ | 296 |
|
Normalized EBITDA |
| $ | 2,661 |
| $ | 2,467 |
| $ | 1,020 |
| $ | 1,214 |
| $ | (357 | ) |
CAPEX |
| $ | 390 |
| $ | 231 |
| $ | 95 |
| $ | 254 |
| $ | 268 |
|
EBITDA - CAPEX |
| $ | 2,271 |
| $ | 2,236 |
| $ | 925 |
| $ | 960 |
| $ | (625 | ) |
GAAP Operating Cash Flow |
| $ | 7,503 |
| $ | 3,910 |
| $ | (1,644 | ) | $ | 1,949 |
| $ | (1,386 | ) |
|
|
|
|
|
|
|
|
|
|
|
| |||||
Basic Reported Weighted Avg Shares Out (000’s) |
|
|
| 11,147 |
| 11,049 |
| 11,049 |
| 11,049 |
| |||||
Basic Normalized EPS |
| $ | 0.05 |
| $ | 0.08 |
| $ | 0.03 |
| $ | — |
| $ | (0.10 | ) |
Basic Reported EPS |
| $ | 0.77 |
| $ | 0.80 |
| $ | (0.12 | ) | $ | (0.15 | ) | $ | (0.10 | ) |
Diluted Reported Weighted Avg Shares Out (000’s) |
|
|
| 11,549 |
| 11,252 |
| 11,049 |
| 11,049 |
| |||||
Diluted Normalized EPS |
| $ | 0.04 |
| $ | 0.07 |
| $ | 0.03 |
| $ | — |
| $ | (0.10 | ) |
Diluted Reported EPS |
| $ | 0.75 |
| $ | 0.78 |
| $ | (0.12 | ) | $ | (0.15 | ) | $ | (0.10 | ) |
Normalized Reconciliation
Restructuring/Goodwill Impairment |
| $ | — |
| $ | — |
| $ | — |
| $ | — |
| $ | — |
|
Other Unusual (Expense) Gain Items |
| — |
| — |
| — |
| — |
| — |
| |||||
Tax Shelter (Charge) on Unusual Items |
| — |
| — |
| — |
| — |
| — |
| |||||
Unusual (Exp) Gain Items, net of Taxes |
| — |
| — |
| — |
| — |
| — |
| |||||
Accounting Changes, net of Taxes |
| — |
| — |
| (1,694 | ) | (1,694 | ) | — |
| |||||
Discontinued Operations, net of Taxes |
| — |
| — |
| — |
| — |
| — |
| |||||
Extraordinary Items, net of Taxes |
| 8,116 |
| 8,116 |
| — |
| — |
| — |
| |||||
Total Reconciling Items, net of Taxes |
| $ | 8,116 |
| $ | 8,116 |
| $ | (1,694 | ) | $ | (1,694 | ) | $ | — |
|
|
|
|
|
|
|
|
|
|
|
|
| |||||
Reported Income Tax (Benefit) |
| $ | 271 |
| $ | 432 |
| $ | 174 |
| $ | 13 |
| $ | (544 | ) |
Reported Net Income (Loss) |
| $ | 8,640 |
| $ | 8,954 |
| $ | (1,357 | ) | $ | (1,671 | ) | $ | (1,130 | ) |
Revenue Breakdown
Net Premiums |
| $ | 35,058 |
| $ | 23,930 |
| $ | 9,085 |
| $ | 20,213 |
| $ | 16,376 |
|
Fees, Commissions & Other |
| 15,059 |
| 12,062 |
| 1,505 |
| 4,502 |
| 4,215 |
| |||||
Investment Income |
| 1,419 |
| 773 |
| 436 |
| 1,082 |
| 1,411 |
| |||||
|
| $ | 51,536 |
| $ | 36,765 |
| $ | 11,026 |
| $ | 25,797 |
| $ | 22,002 |
|
Net Premiums |
| 68.0 | % | 65.1 | % | 82.4 | % | 78.4 | % | 74.4 | % | |||||
Fees, Commissions & Other |
| 29.2 | % | 32.8 | % | 13.6 | % | 17.5 | % | 19.2 | % | |||||
Investment Income |
| 2.8 | % | 2.1 | % | 4.0 | % | 4.2 | % | 6.4 | % | |||||
Sources of information: SEC Edgar filings, Multex, Capital IQ, Yahoo and Commodity Systems.
73
Balance Sheet Data
|
| Jun-03 |
| Dec-02 |
| Dec-01 |
| |||
Cash |
| $ | 31,888 |
| $ | 9,525 |
| $ | 7,523 |
|
Investments |
| 16,032 |
| 16,728 |
| 16,223 |
| |||
Premium Receivables |
| 11,148 |
| 12,605 |
| 14,154 |
| |||
Reinsurance Balance Receivable |
| — |
| — |
| — |
| |||
Reinsurance Recoverable |
| 17,973 |
| 12,929 |
| 16,871 |
| |||
Prepaid Reinsurance Premiums |
| 3,887 |
| 8,550 |
| 11,611 |
| |||
Deferred Policy Acquisition Costs |
| 2,030 |
| 1,367 |
| 761 |
| |||
PPE, net |
| — |
| — |
| — |
| |||
Intangibles, net |
| 5,715 |
| 5,711 |
| 4,431 |
| |||
Other Assets |
| 15,288 |
| 15,940 |
| 2,031 |
| |||
Total Assets |
| $ | 103,961 |
| $ | 83,355 |
| $ | 73,605 |
|
|
|
|
|
|
|
|
| |||
Losses and Loss Adjustment expense |
| $ | 30,866 |
| $ | 17,667 |
| $ | 20,089 |
|
Unearned Premiums |
| 13,474 |
| 15,551 |
| 16,793 |
| |||
Other Policy Liabilities |
| — |
| — |
| — |
| |||
Account Payables & Accrued Expenses |
| 13,313 |
| 9,054 |
| 7,996 |
| |||
Other Liabilties |
| 10,871 |
| 11,240 |
| 4,426 |
| |||
Interest Bearing Debt (1) |
| 7,860 |
| 21,308 |
| 13,933 |
| |||
Capital Leases |
| — |
| — |
| — |
| |||
Minority Interests |
| — |
| — |
| — |
| |||
Pref Stock (Liq Value) |
| — |
| — |
| — |
| |||
Total Liabilities & Pref Stock |
| 76,384 |
| 74,820 |
| 63,237 |
| |||
Common Equity (1) |
| 27,577 |
| 8,535 |
| 10,368 |
| |||
Total Liabilities & Equity |
| $ | 103,961 |
| $ | 83,355 |
| $ | 73,605 |
|
|
|
|
|
|
|
|
| |||
Common Shares Outstanding (000’s) |
| 36,319 |
| 11,049 |
| 11,049 |
| |||
Cash Value per share |
| $ | 0.88 |
| $ | 0.86 |
| $ | 0.68 |
|
Common Book Value per share |
| $ | 0.76 |
| $ | 0.77 |
| $ | 0.94 |
|
Common Tangible Book Value per share |
| $ | 0.60 |
| $ | 0.26 |
| $ | 0.54 |
|
Total Debt |
| $ | 7,860 |
| $ | 21,308 |
| $ | 13,933 |
|
Net Debt |
| $ | (24,028 | ) | $ | 11,783 |
| $ | 6,410 |
|
Total Capitalization |
| $ | 35,437 |
| $ | 29,843 |
| $ | 24,301 |
|
Balance Sheet Analysis
Effectiveness and Efficiency |
|
|
|
|
|
|
|
Premium Receivable Turnover |
| 3.0 | x | 1.5 | x | 1.2 | x |
Asset Turnover |
| 0.6 | x | 0.3 | x | 0.3 | x |
Days Sales Outstanding |
| 123.7 |
| 241.6 |
| 315.5 |
|
Normalized Return on Avg Assets |
| 0.6 | % | 0.0 | % | na |
|
Normalized Return on Avg Common Equity |
| 2.9 | % | 0.2 | % | na |
|
Net Investment Yield |
| 3.8 | % | 4.3 | % | na |
|
Financial Strength |
|
|
|
|
|
|
|
Net Premiums Written to Surplus |
| 1.9 | x | 2.1 | x | na |
|
Total Debt/Total Capitalization |
| 22.2 | % | 71.4 | % | 57.3 | % |
Total Debt/TIC |
| 21.3 | % | 57.7 | % | 37.7 | % |
Total Debt/EBITDA |
| 3.0 | x | 17.6 | x | na |
|
Total Debt/EBITDA-CAPEX |
| 3.5 | x | 22.2 | x | na |
|
EBITDA/Interest Expense |
| 1.9 | x | 1.2 | x | na |
|
EBITDA-CAPEX/Interest Expense |
| 1.6 | x | 1.0 | x | na |
|
Income and Cashflow Analysis
|
| LTM |
| Six Months Ended |
| Fiscal Years Ended |
| ||||
|
| Jun-03 |
| Jun-03 |
| Jun-02 |
| Dec-02 |
| Dec-01 |
|
Profitability & Cost Ratios (as % of Revenue) |
|
|
|
|
|
|
|
|
|
|
|
S,G & A |
| 13.3 | % | 0.0 | % | 0.0 | % | 26.6 | % | 14.9 | % |
Operating Income |
| 4.3 | % | 5.8 | % | 8.5 | % | 4.0 | % | -3.0 | % |
Pre-Tax |
| 1.5 | % | 3.5 | % | 4.6 | % | 0.1 | % | -7.6 | % |
EBIT |
| 4.3 | % | 5.8 | % | 8.5 | % | 4.0 | % | -3.0 | % |
EBITDA |
| 5.2 | % | 6.7 | % | 9.3 | % | 4.7 | % | -1.6 | % |
Normalized Net Income to Common |
| 1.0 | % | 2.3 | % | 3.1 | % | 0.1 | % | -5.1 | % |
Reported Net Income |
| 16.8 | % | 24.4 | % | -12.3 | % | -6.5 | % | -5.1 | % |
CAPEX |
| 0.8 | % | 0.6 | % | 0.9 | % | 1.0 | % | 1.2 | % |
|
|
|
|
|
|
|
|
|
|
|
|
Industry Underwriting Performance Ratios |
|
|
|
|
|
|
|
|
|
|
|
Loss Ratio |
| 70.6 | % | 68.7 | % | 77.0 | % | 75.7 | % | 97.0 | % |
Total Expense Ratio |
| 98.4 | % | 96.2 | % | 95.3 | % | 100.3 | % | 110.0 | % |
|
|
|
|
|
|
|
|
|
|
|
|
Period Growth Rates |
|
|
|
|
|
|
|
|
|
|
|
Revenue |
|
|
| 233.4 | % |
|
| 17.2 | % |
|
|
EBIT |
|
|
| 128.9 | % |
|
| -256.0 | % |
|
|
EBITDA |
|
|
| 141.9 | % |
|
| -440.1 | % |
|
|
Notes
HFS acquired Phoenix on January 27, 2003. LTM numbers reflect aprox. 5 months of revenue and earnings.
Extraordinary item reflects gain from acquisition of Phoenix (FMV over purchase price).
Separation between acquisition costs and other operating expenses unavailable for stub periods.
July 30, 2003, the Company announced a $10m rights offering at 40c per share to shareholders of record Total Issue was 25.0 million shares.
Offer was completed and successful on September 5, 2003.
(1) Adjusted for rights offering
Company Description
Hallmark Financial Services, Inc. (HFS) is engaged, with its wholly owned subsidiaries, in the sale of property and casualty insurance products. Its business involves marketing, underwriting and premium financing of non-standard personal automobile insurance in Texas; commercial insurance in Texas, New Mexico, Idaho, Oregon and Washington; third-party claims administration and other insurance-related services. HFS pursues its business activities through integrated insurance groups handling non-standard personal automobile insurance (the personal lines group) and commercial insurance (the commercial lines group). The members of the personal lines group are American Hallmark Insurance Company of Texas, American Hallmark General Agency, Inc., American Hallmark Agencies, Hallmark Finance Corporation and Hallmark Claims Service, Inc. The members of the commercial lines group are Millers General Agency, Financial and Actuarial Resources, Inc. and Effective Litigation Management, Inc.
Sources of information: SEC Edgar filings, Multex, Capital IQ, Yahoo and Commodity Systems.
74
Seibels Bruce Group Overview | ($ in thousands, except per share) |
Company Information
Name |
| Seibels Bruce Group | Address |
| 1501 Lady Street, PO Box 1 |
Symbol |
| SBIG | City, State Zip |
| Columbia, SC 29201 |
Latest Fiscal YE |
| 31-Dec-02 | Telephone |
| (803)748-2000 |
Latest Rprt Per |
| 30-Jun-03 | Website |
| www.seibels.com |
Market Information
As of Date |
| 3-Nov-03 |
| |
Exchange |
| OTC |
| |
Stock Price |
| $ | 2.00 |
|
52 Week High |
| $ | 2.15 |
|
52 Week Low |
| $ | 1.01 |
|
Avg. Daily Volume (000’s) |
| 3 |
| |
Beta |
| 1.03 |
| |
Shares Outstanding (000’s) |
| 7,816 |
| |
Market Cap |
| $ | 15,632 |
|
Total Invested Capital (TIC) |
| $ | 23,632 |
|
Enterprise Value (EV) |
| $ | 18,956 |
|
|
|
|
| |
Insider Ownership |
| 50.10 | % | |
Institutional |
|
|
| |
% Owned |
| 0.63 | % | |
Number of Institutions |
| — |
| |
Valuation Analysis
|
| Multiple of |
| ||||
|
| Market Cap |
| TIC |
| EV |
|
Latest Twelve Months |
|
|
|
|
|
|
|
Revenue |
| 0.34 | x | 0.52 | x | 0.42 | x |
EBIT |
| 8.59 | x | 12.98 | x | 10.42 | x |
EBITDA |
| 6.74 | x | 10.19 | x | 8.18 | x |
Normalized Net Income |
| 12.58 | x | 19.01 | x | 15.25 | x |
Basic Normalized EPS |
| 13.33 | x | na |
| na |
|
Projected |
|
|
|
|
|
|
|
Jan-00 Mean Revenue |
| na |
| na |
| na |
|
Jan-00 Mean Revenue |
| na |
| na |
| na |
|
Jan-00 Mean EBITDA |
| na |
| na |
| na |
|
Jan-00 Mean EBITDA |
| na |
| na |
| na |
|
Jan-00 Mean EPS |
| na |
| na |
| na |
|
Jan-00 Mean EPS |
| na |
| na |
| na |
|
Most Recent Filing |
|
|
|
|
|
|
|
Assets |
| 0.13 | x | 0.20 | x | 0.16 | x |
Common Equity |
| 0.62 | x | na |
| na |
|
Tangible Common Equity |
| 0.76 | x | na |
| na |
|
Income and Cashflow Statement Data
|
| LTM |
| Six Months Ended |
| Fiscal Years Ended |
| |||||||||
|
| Jun-03 |
| Jun-03 |
| Jun-02 |
| Dec-02 |
| Dec-01 |
| |||||
Revenue |
| $ | 45,656 |
| $ | 17,798 |
| $ | 25,897 |
| $ | 53,755 |
| $ | 56,677 |
|
Less Expenses |
|
|
|
|
|
|
|
|
|
|
| |||||
Losses and loss adjustment expenses |
| 10,137 |
| 4,889 |
| 4,186 |
| 9,434 |
| 7,740 |
| |||||
Amortization deferred policy acq. Costs |
| 16,466 |
| 5,063 |
| 11,411 |
| 22,814 |
| 23,162 |
| |||||
Other Underwriting & Operating |
| 17,233 |
| 8,085 |
| 9,477 |
| 18,625 |
| 21,438 |
| |||||
Operating Income |
| 1,820 |
| (239 | ) | 823 |
| 2,882 |
| 4,337 |
| |||||
Interest Income / (Expense), net |
| (180 | ) | — |
| — |
| (180 | ) | (728 | ) | |||||
Other Income / (Expense), net |
| — |
| — |
| — |
| — |
| — |
| |||||
Pre-tax Income |
| 1,640 |
| (239 | ) | 823 |
| 2,702 |
| 3,609 |
| |||||
Taxes |
| (30 | ) | — |
| — |
| (30 | ) | 30 |
| |||||
After-tax Income |
| 1,670 |
| (239 | ) | 823 |
| 2,732 |
| 3,579 |
| |||||
Minority Interest |
| — |
| — |
| — |
| — |
| — |
| |||||
Equity in Affiliates |
| — |
| — |
| — |
| — |
| — |
| |||||
Normalized Net Income |
| 1,670 |
| (239 | ) | 823 |
| 2,732 |
| 3,579 |
| |||||
Dividends/Other Non-Common Dist |
| 427 |
| 192 |
| 195 |
| 430 |
| 161 |
| |||||
Normalized Net Income to Common |
| $ | 1,243 |
| $ | (431 | ) | $ | 628 |
| $ | 2,302 |
| $ | 3,418 |
|
|
|
|
|
|
|
|
|
|
|
|
| |||||
Normalized EBIT |
| $ | 1,820 |
| $ | (239 | ) | $ | 823 |
| $ | 2,882 |
| $ | 4,337 |
|
Depreciation & Amortization |
| $ | 498 |
| $ | 289 |
| $ | 279 |
| $ | 488 |
| $ | 496 |
|
Normalized EBITDA |
| $ | 2,318 |
| $ | 50 |
| $ | 1,102 |
| $ | 3,370 |
| $ | 4,833 |
|
CAPEX |
| $ | 338 |
| $ | 49 |
| $ | 366 |
| $ | 655 |
| $ | 581 |
|
EBITDA - CAPEX |
| $ | 1,980 |
| $ | 1 |
| $ | 736 |
| $ | 2,715 |
| $ | 4,252 |
|
GAAP Operating Cash Flow |
| $ | 10,592 |
| $ | (1,276 | ) | $ | (3,970 | ) | $ | 7,898 |
| $ | (2,670 | ) |
|
|
|
|
|
|
|
|
|
|
|
| |||||
Basic Reported Weighted Avg Shares Out (000’s) |
|
|
| 7,829 |
| 7,832 |
| 7,832 |
| 7,832 |
| |||||
Basic Normalized EPS |
| $ | 0.15 |
| $ | (0.06 | ) | $ | 0.08 |
| $ | 0.29 |
| $ | 0.44 |
|
Basic Reported EPS |
| $ | 0.55 |
| $ | 0.25 |
| $ | 0.43 |
| $ | 0.73 |
| $ | 0.54 |
|
Diluted Reported Weighted Avg Shares Out (000’s) |
|
|
| 7,854 |
| 8,232 |
| 8,088 |
| 8,206 |
| |||||
Diluted Normalized EPS |
| $ | 0.15 |
| $ | (0.05 | ) | $ | 0.08 |
| $ | 0.28 |
| $ | 0.42 |
|
Diluted Reported EPS |
| $ | 0.54 |
| $ | 0.25 |
| $ | 0.41 |
| $ | 0.70 |
| $ | 0.51 |
|
Normalized Reconciliation
Restructuring/Goodwill Impairment |
| $ | — |
| $ | — |
| $ | — |
| $ | — |
| $ | — |
|
Other Unusual (Expense) Gain Items |
| 3,079 |
| 2,414 |
| 2,726 |
| 3,391 |
| 631 |
| |||||
Tax Shelter (Charge) on Unusual Items |
| — |
| — |
| — |
| — |
| — |
| |||||
Unusual (Exp) Gain Items, net of Taxes |
| 3,079 |
| 2,414 |
| 2,726 |
| 3,391 |
| 631 |
| |||||
Accounting Changes, net of Taxes |
| — |
| — |
| — |
| — |
| — |
| |||||
Discontinued Operations, net of Taxes |
| — |
| — |
| — |
| — |
| — |
| |||||
Extraordinary Items, net of Taxes |
| — |
| — |
| — |
| — |
| 156 |
| |||||
Total Reconciling Items, net of Taxes |
| $ | 3,079 |
| $ | 2,414 |
| $ | 2,726 |
| $ | 3,391 |
| $ | 787 |
|
|
|
|
|
|
|
|
|
|
|
|
| |||||
Reported Income Tax (Benefit) |
| $ | (30 | ) | $ | — |
| $ | — |
| $ | (30 | ) | $ | 30 |
|
Reported Net Income (Loss) |
| $ | 4,322 |
| $ | 1,983 |
| $ | 3,354 |
| $ | 5,693 |
| $ | 4,205 |
|
Revenue Breakdown
Net Premiums |
| $ | 16,269 |
| $ | 7,652 |
| $ | 7,044 |
| $ | 15,661 |
| $ | 14,433 |
|
Fees, Commissions & Other |
| 26,497 |
| 8,915 |
| 15,258 |
| 32,840 |
| 39,039 |
| |||||
Investment Income |
| 2,890 |
| 1,231 |
| 3,595 |
| 5,254 |
| 3,205 |
| |||||
|
| $ | 45,656 |
| $ | 17,798 |
| $ | 25,897 |
| $ | 53,755 |
| $ | 56,677 |
|
Net Premiums |
| 35.6 | % | 43.0 | % | 27.2 | % | 29.1 | % | 25.5 | % | |||||
Fees, Commissions & Other |
| 58.0 | % | 50.1 | % | 58.9 | % | 61.1 | % | 68.9 | % | |||||
Investment Income |
| 6.3 | % | 6.9 | % | 13.9 | % | 9.8 | % | 5.7 | % | |||||
Sources of information: SEC Edgar filings, Multex, Capital IQ, Yahoo and Commodity Systems.
75
Balance Sheet Data
|
| Jun-03 |
| Dec-02 |
| Dec-01 |
| |||
Cash |
| $ | 4,676 |
| $ | 10,423 |
| $ | 6,375 |
|
Investments |
| 45,495 |
| 39,216 |
| 39,499 |
| |||
Premium Receivables |
| 4,323 |
| 3,492 |
| 6,272 |
| |||
Reinsurance Balance Receivable |
| — |
| — |
| — |
| |||
Reinsurance Recoverable |
| 38,265 |
| 38,075 |
| 51,078 |
| |||
Prepaid Reinsurance Premiums |
| 14,687 |
| 30,224 |
| 36,548 |
| |||
Deferred Policy Acquisition Costs |
| 1,320 |
| 1,168 |
| 1,200 |
| |||
PPE, net |
| 778 |
| 993 |
| 807 |
| |||
Intangibles, net |
| 4,513 |
| 4,513 |
| 4,513 |
| |||
Other Assets |
| 3,279 |
| 5,570 |
| 4,346 |
| |||
Total Assets |
| $ | 117,336 |
| $ | 133,674 |
| $ | 150,638 |
|
|
|
|
|
|
|
|
| |||
Losses and Loss Adjustment expense |
| $ | 53,306 |
| $ | 53,710 |
| $ | 66,875 |
|
Unearned Premiums |
| 21,054 |
| 36,358 |
| 42,664 |
| |||
Other Policy Liabilities |
| — |
| — |
| — |
| |||
Account Payables & Accrued Expenses |
| 2,203 |
| 3,158 |
| 3,372 |
| |||
Other Liabilties |
| 7,615 |
| 9,224 |
| 10,442 |
| |||
Interest Bearing Debt |
| — |
| — |
| 7,721 |
| |||
Capital Leases |
| — |
| — |
| — |
| |||
Minority Interests |
| — |
| — |
| — |
| |||
Pref Stock (Liq Value) |
| 8,000 |
| 8,000 |
| 2,590 |
| |||
Total Liabilities & Pref Stock |
| 92,178 |
| 110,450 |
| 133,664 |
| |||
Common Equity |
| 25,158 |
| 23,224 |
| 16,974 |
| |||
Total Liabilities & Equity |
| $ | 117,336 |
| $ | 133,674 |
| $ | 150,638 |
|
|
|
|
|
|
|
|
| |||
Common Shares Outstanding (000’s) |
| 7,824 |
| 7,832 |
| 7,832 |
| |||
Cash Value per share |
| $ | 0.60 |
| $ | 1.33 |
| $ | 0.81 |
|
Common Book Value per share |
| $ | 3.22 |
| $ | 2.97 |
| $ | 2.17 |
|
Common Tangible Book Value per share |
| $ | 2.64 |
| $ | 2.39 |
| $ | 1.59 |
|
Total Debt |
| $ | 8,000 |
| $ | 8,000 |
| $ | 10,311 |
|
Net Debt |
| $ | 3,324 |
| $ | (2,423 | ) | $ | 3,936 |
|
Total Capitalization |
| $ | 33,158 |
| $ | 31,224 |
| $ | 27,285 |
|
Balance Sheet Analysis
Effectiveness and Efficiency |
|
|
|
|
|
|
|
Premium Receivable Turnover |
| 4.2 | x | 3.2 | x | 2.3 | x |
Asset Turnover |
| 0.4 | x | 0.4 | x | 0.4 | x |
Days Sales Outstanding |
| 87.7 |
| 113.8 |
| 158.6 |
|
Normalized Return on Avg Assets |
| 1.0 | % | 1.6 | % | na |
|
Normalized Return on Avg Common Equity |
| 5.1 | % | 11.5 | % | na |
|
Net Investment Yield |
| 5.8 | % | 11.0 | % | na |
|
Financial Strength |
|
|
|
|
|
|
|
Net Premiums Written to Surplus |
| 0.7 | x | 0.8 | x | na |
|
Total Debt/Total Capitalization |
| 24.1 | % | 25.6 | % | 37.8 | % |
Total Debt/TIC |
| 33.9 | % | 33.9 | % | 43.6 | % |
Total Debt/EBITDA |
| 3.5 | x | 2.4 | x | 2.1 | x |
Total Debt/EBITDA-CAPEX |
| 4.0 | x | 2.9 | x | 2.4 | x |
EBITDA/Interest Expense |
| 12.9 | x | 18.7 | x | 6.6 | x |
EBITDA-CAPEX/Interest Expense |
| 11.0 | x | 15.1 | x | 5.8 | x |
Income and Cashflow Analysis
|
| LTM |
| Six Months Ended |
| Fiscal Years Ended |
| ||||
|
| Jun-03 |
| Jun-03 |
| Jun-02 |
| Dec-02 |
| Dec-01 |
|
Profitability & Cost Ratios (as % of Revenue) |
|
|
|
|
|
|
|
|
|
|
|
S,G & A |
| 36.1 | % | 28.4 | % | 44.1 | % | 42.4 | % | 40.9 | % |
Operating Income |
| 4.0 | % | -1.3 | % | 3.2 | % | 5.4 | % | 7.7 | % |
Pre-Tax |
| 3.6 | % | -1.3 | % | 3.2 | % | 5.0 | % | 6.4 | % |
EBIT |
| 4.0 | % | -1.3 | % | 3.2 | % | 5.4 | % | 7.7 | % |
EBITDA |
| 5.1 | % | 0.3 | % | 4.3 | % | 6.3 | % | 8.5 | % |
Normalized Net Income to Common |
| 2.7 | % | -2.4 | % | 2.4 | % | 4.3 | % | 6.0 | % |
Reported Net Income |
| 9.5 | % | 11.1 | % | 13.0 | % | 10.6 | % | 7.4 | % |
CAPEX |
| 0.7 | % | 0.3 | % | 1.4 | % | 1.2 | % | 1.0 | % |
|
|
|
|
|
|
|
|
|
|
|
|
Industry Underwriting Performance Ratios |
|
|
|
|
|
|
|
|
|
|
|
Loss Ratio |
| 62.3 | % | 63.9 | % | 59.4 | % | 60.2 | % | 53.6 | % |
Total Expense Ratio |
| 102.5 | % | 108.9 | % | 112.4 | % | 104.9 | % | 97.9 | % |
|
|
|
|
|
|
|
|
|
|
|
|
Period Growth Rates |
|
|
|
|
|
|
|
|
|
|
|
Revenue |
|
|
| -31.3 | % |
|
| -5.2 | % |
|
|
EBIT |
|
|
| -129.0 | % |
|
| -33.5 | % |
|
|
EBITDA |
|
|
| -95.5 | % |
|
| -30.3 | % |
|
|
Notes
Unusal gain includes gain on sale of NFIP renewal rights for June period 2003, gain on settlement on life insurance policy and gain on sale of Insurance Services Officers, Inc. stock of $2.1 million for FY2002 and June period 2002.
Company Description
The Seibels Bruce Group, Inc. (Seibels Bruce) is a provider of property and casualty insurance products and related services. Seibels Bruce retains risk on commercial lines insurance, which it writes in Georgia, North Carolina and South Carolina. The Company is a holding company for four property and casualty insurance companies that offer commercial and non-standard automobile insurance. In addition, Seibels Bruce offers claim administration services to insurance companies and other businesses through Insurance Network Services, Inc., flood zone determination and related services through America’s Flood Services, Inc., and managing general agency services through Seibels, Bruce & Company. The Company conducts business in two primary categories: fee-based property and casualty insurance operations and risk-bearing property and casualty insurance operations.
Sources of information: SEC Edgar filings, Multex, Capital IQ, Yahoo and Commodity Systems.
76
• The comparable transaction analysis involves a review of merger, acquisition and asset purchase transactions involving target companies that are in related industries to Seibels.
• The comparable transaction analysis generally provides the widest range of value due to the varying importance of an acquisition to a buyer (i.e., a strategic buyer willing to pay more than a financial buyer) in addition to the potential differences in the transaction process (i.e., competitiveness among potential buyers).
• Information is typically not disclosed for transactions involving a private seller, even when the buyer is a public company, unless the acquisition is deemed to be “material” for the acquirer. As a result, the selected comparable transaction analysis is limited to transactions involving the acquisition of a public company, or substantially all of its assets, or the acquisition of a large private company, or substantially all of its assets, by a public company.
• Capitalink located fourteen transactions announced since May 2000 involving target companies in related industries to Seibels (the “Comparable Transactions”) and for which detailed financial information was available. Target companies were involved in the writing of property and casualty insurance and were classified under the SIC 6331 (fire, marine and casualty insurance).
• Based on the information disclosed with respect to the targets in the each of the Comparable Transactions, Capitalink calculated and compared total price paid as a multiple of net common equity, and TIC values as multiples of LTM revenue, LTM EBITDA and total assets.
• A review of the analysis indicates mean TIC value multiples to LTM revenue, LTM EBITDA and total assets of 0.96 times, 8.1 times and 0.5 times, respectively. The mean total price paid to net common equity multiple was 1.4 times.
• Capitalink determined a range of indicated TIC values for Seibels by selecting a range of valuation multiples based on the Comparable Transactions, and applying them to the Company’s net common equity (as of
77
September 30, 2003), LTM revenue (as of September 30, 2003), average revenue (FY2001 to LTM 2003), and average EBITDA (FY2001 to LTM 2003).
• As with the Comparable Company analysis, Seibels’ unique characteristics, declining revenue, regulatory risk, AFS contract risk and legal risk with HDC would suggest the Company be valued below the average of the Comparable Transaction multiples.
• Therefore taking into account those factors, Capitalink selected an appropriate multiple range for the Company as follows:
• Between 0.8 times and 1.2 times net common equity.
• Between 0.65 times and 0.94 times LTM revenue.
• Between 0.65 times and 0.94 times average revenue (FY2001-LTM 2003)
• Between 7.6 times and 8.1 times average EBITDA (FY FY2001-LTM 2003)
• Based on the selected multiple ranges, Capitalink calculated a range of TIC values between $22.4 million and $30.1 million for the Company. After deducting preferred stock of $8.0 million and dividing by approximately 7.98 million shares outstanding (including ITM options), Capitalink calculated a range of indicated common stock prices of between $1.94 and $2.95.
• None of the Comparable Transactions involve a reverse split transaction nor have other characteristics perfectly identical to the Company. Accordingly, an analysis of comparable business combinations is not mathematical; rather it involves complex considerations and judgments concerning differences in financial and operating characteristics of the Comparable Transactions and other factors that could affect the respective acquisition values.
78
Comparable Transaction Analysis - Indicated Reference Range
($ in thousands, except per share)
|
|
|
| Selected Multiple Range |
|
|
|
|
|
|
|
|
|
|
|
|
| |||||||||
|
| Statistic |
| Low | - | High |
| Indicated TIC Value |
| Indicated Equity Value (1) |
| Indicated Share Price (2) |
| |||||||||||||
|
|
|
|
|
|
|
|
|
|
|
|
|
|
|
|
|
|
|
| |||||||
Market Value Multiple |
|
|
|
|
|
|
|
|
|
|
|
|
|
|
|
|
|
|
| |||||||
Net Common Equity 9/30/03 |
| $ | 23,085 |
| 0.8x | - | 1.2x |
|
|
|
|
| $ | 18,468 | - | $ | 27,702 |
| $ | 2.31 | - | $ | 3.47 |
| ||
|
|
|
|
|
|
|
|
|
|
|
|
|
|
|
|
|
|
|
| |||||||
Total Invested Capital (TIC) Multiple |
|
|
|
|
|
|
|
|
|
|
|
|
|
|
|
|
|
|
| |||||||
LTM Revenue 9/30/03 |
| $ | 29,387 |
| 0.65x | - | 0.94x |
| $ | 19,216 | - | $ | 27,708 |
| $ | 11,216 | - | $ | 19,708 |
| $ | 1.41 | - | $ | 2.47 |
|
Average Revenue (FY2001-LTM 2003) |
| $ | 46,606 |
| 0.65x | - | 0.94x |
| $ | 30,475 | - | $ | 43,944 |
| $ | 22,475 | - | $ | 35,944 |
| $ | 2.82 | - | $ | 4.50 |
|
Average EBITDA (FY2001-LTM 2003) |
| $ | 2,326 |
| 7.6x | - | 8.1x |
| $ | 17,629 | - | $ | 18,783 |
| $ | 9,629 | - | $ | 10,783 |
| $ | 1.21 | - | $ | 1.35 |
|
|
|
|
|
|
|
|
|
|
|
|
|
|
|
|
|
|
|
|
| |||||||
Indicated Reference Range |
|
|
|
|
|
|
| $ | 22,440 | - | $ | 30,145 |
| $ | 15,447 | - | $ | 23,534 |
| $ | 1.94 | - | $ | 2.95 |
| |
(1) Adjusted for $8,000 debt as of September 30, 2003.
(2) Based upon and assumes 7,981 common shares, including in the money options/warrants outstanding using the treasury stock method.
79
Comparable Transaction Analysis
($ in millions)
Announced |
| Closing |
| Acquiror |
| Target/Transaction Description |
| TTM |
| MRQ |
| Total |
| Total |
| TPP |
| TIC Multiple of |
| ||||||||
Revenue |
| EBITDA | Total Assets |
| Net Common |
|
|
| Revenue |
| EBITDA |
| Total Assets |
| |||||||||||||
|
|
|
|
|
|
|
|
|
|
|
|
|
|
|
|
|
|
|
|
|
|
|
|
|
|
|
|
3-Oct-03 |
| TBD |
| CompManagement Inc |
| St. Paul’s Companies - Octagon Risk Services |
| $30.00 |
| na |
| na |
| na |
| $30.00 |
| $30.00 |
| na |
| 1.00x |
| na |
| na |
|
|
|
|
|
|
|
|
|
|
|
|
|
|
|
|
|
|
|
|
|
|
|
|
|
|
|
|
|
4-Sep-03 |
| TBD |
| Donegal Group Inc |
| Le Mars Mutual Insurance Co of Iowa |
| 21.00 |
| na |
| na |
| na |
| 8.20 |
| 12.20 |
| na |
| 0.58 |
| na |
| na |
|
|
|
|
|
|
|
|
|
|
|
|
|
|
|
|
|
|
|
|
|
|
|
|
|
|
|
|
|
10-Apr-03 |
| 10-Apr-03 |
| Strongwood Ins. Holdings Corp |
| PICO Holdings - Sequoia Ins. Co |
| 49.00 |
| na |
| na |
| na |
| 42.50 |
| 42.50 |
| na |
| 0.87 |
| na |
| na |
|
|
|
|
|
|
|
|
|
|
|
|
|
|
|
|
|
|
|
|
|
|
|
|
|
|
|
|
|
9-Apr-03 |
| 24-Sep-03 |
| Fiserv Inc. |
| Insurance Mgmt Solutions Group, Inc. |
| 24.70 |
| (1.20 | ) | 35.00 |
| 31.30 |
| 40.00 |
| 40.00 |
| 1.3 |
| 1.62 |
| na |
| 1.1 |
|
|
|
|
|
|
|
|
|
|
|
|
|
|
|
|
|
|
|
|
|
|
|
|
|
|
|
|
|
1-Jan-03 |
| 1-Jan-03 |
| Hallmark Financial Services, Inc |
| Phoenix Indemnity Insurance Co |
| 17.30 |
| (0.94 | ) | 32.30 |
| 11.50 |
| 7.00 |
| 7.00 |
| 0.6 |
| 0.40 |
| na |
| 0.2 |
|
|
|
|
|
|
|
|
|
|
|
|
|
|
|
|
|
|
|
|
|
|
|
|
|
|
|
|
|
27-Feb-02 |
| 2-Apr-02 |
| Kingsway Financial Services Inc |
| American Country Holdings, Inc. |
| 74.41 |
| (10.31 | ) | 212.65 |
| 31.76 |
| 22.94 |
| 30.99 |
| 0.7 |
| 0.42 |
| na |
| 0.1 |
|
|
|
|
|
|
|
|
|
|
|
|
|
|
|
|
|
|
|
|
|
|
|
|
|
|
|
|
|
20-Jul-01 |
| 4-Jan-02 |
| Alleghany Corp |
| Capitol Transamerica Corp |
| 109.07 |
| 14.74 |
| 283.09 |
| 144.51 |
| 180.71 |
| 180.71 |
| 1.3 |
| 1.66 |
| 12.3 |
| 0.6 |
|
|
|
|
|
|
|
|
|
|
|
|
|
|
|
|
|
|
|
|
|
|
|
|
|
|
|
|
|
8-May-01 |
| 15-Aug-01 |
| Argonaut Group, Inc. |
| Front Royal Inc |
| 144.33 |
| 80.81 |
| 464.90 |
| na |
| 165.00 |
| 165.00 |
| na |
| 1.14 |
| 2.0 |
| 0.4 |
|
|
|
|
|
|
|
|
|
|
|
|
|
|
|
|
|
|
|
|
|
|
|
|
|
|
|
|
|
23-Jan-01 |
| 23-Jan-01 |
| Hub Int’l Limited |
| Kaye Group, Inc. |
| 78.40 |
| 19.10 |
| 173.00 |
| 44.50 |
| 120.50 |
| 123.00 |
| 2.7 |
| 1.57 |
| 6.4 |
| 0.7 |
|
|
|
|
|
|
|
|
|
|
|
|
|
|
|
|
|
|
|
|
|
|
|
|
|
|
|
|
|
31-Oct-00 |
| 10-Apr-01 |
| American National Ins. Co |
| Farm Family Holdings, Inc. |
| 301.33 |
| 85.98 |
| 1,295.23 |
| 197.66 |
| 270.23 |
| 270.23 |
| 1.4 |
| 0.90 |
| 3.1 |
| 0.2 |
|
|
|
|
|
|
|
|
|
|
|
|
|
|
|
|
|
|
|
|
|
|
|
|
|
|
|
|
|
25-Oct-00 |
| 1-Jun-01 |
| State Auto Financial Corp |
| Meridian Insurance Group, Inc. |
| 239.47 |
| 57.97 |
|
|
| 119.80 |
| 237.00 |
| 236.83 |
| 2.0 |
| 0.99 |
| 4.1 |
| na |
|
|
|
|
|
|
|
|
|
|
|
|
|
|
|
|
|
|
|
|
|
|
|
|
|
|
|
|
|
27-Nov-00 |
| 29-Mar-01 |
| Private Group |
| Chandler Insurance Co Ltd |
| 115.71 |
| 6.41 |
|
|
| 50.74 |
| 33.00 |
| 56.95 |
| 0.7 |
| 0.49 |
| 8.9 |
| na |
|
|
|
|
|
|
|
|
|
|
|
|
|
|
|
|
|
|
|
|
|
|
|
|
|
|
|
|
|
18-Aug-00 |
| 22-Nov-00 |
| American International Group |
| HSB Group |
| 766.60 |
| 129.90 |
| 1,953.20 |
| 382.30 |
| 1,132.51 |
| 1,132.51 |
| 3.0 |
| 1.48 |
| 8.7 |
| 0.6 |
|
|
|
|
|
|
|
|
|
|
|
|
|
|
|
|
|
|
|
|
|
|
|
|
|
|
|
|
|
10-May-00 |
| 29-Sep-00 |
| Westfield Cos |
| Old Guard Group Inc |
| 122.35 |
| 2.34 |
| 202.15 |
| 70.49 |
| 44.53 |
| 44.53 |
| 0.6 |
| 0.36 |
| 19.0 |
| 0.2 |
|
|
|
|
|
|
|
|
|
|
|
|
|
|
|
|
|
|
|
|
|
|
|
|
|
|
|
|
|
|
|
|
|
|
|
|
|
|
|
|
|
|
| High |
| $1,132.51 |
| $1,132.51 |
| 3.0 | x | 1.66 | x | 19.0 | x | 1.1 | x |
|
|
|
|
|
|
|
|
|
|
|
|
|
| Mean |
| 166.72 |
| 169.46 |
| 1.4 |
| 0.96 |
| 8.1 |
| 0.5 |
|
|
|
|
|
|
|
|
|
|
|
|
|
|
| Median |
| 43.52 |
| 50.74 |
| 1.3 |
| 0.94 |
| 7.6 |
| 0.4 |
|
|
|
|
|
|
|
|
|
|
|
|
|
|
| Low |
| 7.00 |
| 7.00 |
| 0.6 |
| 0.36 |
| 2.0 |
| 0.1 |
|
(1) Total Price Paid equals common equity value of interest acquired.
(2) Total Invested Capital equals Total Price Paid plus total debt, preferred stock, and minority interests.
Sources of information: SEC Edgar Filings, Press Releases, CapitalIQ, Multex, Mergerstat, Thomson Financial, & Done Deals.
80
REVERSE STOCK SPLIT PREMIUMS ANALYSIS
• The reverse stock split premiums analysis involves the comparison of the premium derived in the Fractional Share Consideration to cash-out premiums in other reverse stock split transactions where the objective was to affect a going-private transaction.
• Capitalink reviewed nine reverse stock split transactions since March 2003 and calculated the mean and median of the one day, five day and 30 day premiums. Excluding the outlier of Telesoft Corp., the mean and median premiums were 76.7% and 68.6%, respectively, for the one-day premium, 80.3% and 65.4%, respectively, for the five-day premium, and 77.4% and 45.2%, respectively, for the 30-day premium.
• Capitalink also noted that the majority of the companies reviewed had an implied market capitalization of below $10.0 million (seven of the nine companies reviewed). Garden State Vinters and Cal-Maine Foods, Inc., had implied market valuations of $309.1 million and $86.6 million, respectively. The average premiums for these two companies ranged from 44.8% for the one-day premium to 42.2% for the 30-day premium.
• Based on the premiums paid, Capitalink derived an indicated range of per share market values for the Company using the prior one-day, five-day and 30-day share price as of November 3, 2003. Based on the selected multiple ranges, Capitalink calculated a range of indicated common stock share prices of $2.80 to $3.11 per share.
81
Indicated Reference Range - Reverse Stock Split Premiums Analysis
|
| Statistic |
| Selected Multiple Range |
| Indicated Share Price |
| |||||
|
|
|
|
|
|
|
|
|
| |||
Reverse Stock Premiums |
|
|
|
|
|
|
|
|
| |||
Prior One Day |
| $ | 2.00 |
| 44.8 % - 68.6% |
| $ | 2.90 | - | $ | 3.37 |
|
Prior 5 Day |
| $ | 1.85 |
| 44.3 % - 65.4% |
| $ | 2.67 | - | $ | 3.06 |
|
Prior 30 Day |
| $ | 2.00 |
| 42.2 % - 45.2% |
| $ | 2.84 | - | $ | 2.90 |
|
|
|
|
|
|
|
|
|
|
| |||
Indicated Reference Range |
|
|
|
|
| $ | 2.80 | - | $ | 3.11 |
| |
Sources of information: Yahoo Finance, CapitalIQ, SEC Filings, Commodity Systems and Press Releases.
82
Reverse Stock Split Premiums Analysis
(S in thousands, except per share)
Announc. |
| Seller |
| Shares |
| Reverse Stock |
| Proposed |
| Implied |
|
|
| ||||||
Premiums | |||||||||||||||||||
1 Day |
| 5 Day |
| 30 Day | |||||||||||||||
|
|
|
|
|
|
|
|
|
|
|
|
|
|
|
|
|
| ||
24-Oct-03 |
| SourcingLink.net, Inc. (SNET) |
| 9,365,461 |
| 1 for 5,100 |
| $ | 0.15 |
| $ | 1,405 |
| 200.00 | % | 200.00 | % | 200.00 | % |
24-Oct-03 |
| Telesoft Corp. (TSFT) |
| 1,280,000 |
| 1 for 110,000 |
| $ | 1.82 |
| 2,330 |
| 506.67 | % | 506.67 | % | 727.27 | % | |
12-Sep-03 |
| Garden State Vinters (VINT) |
| 95,100,000 |
| 1 for 5,900 |
| $ | 3.25 |
| 309,075 |
| 56.25 | % | 54.76 | % | 50.46 | % | |
11-Jul-03 |
| Cal-Maine Foods, Inc. (CALM) |
| 11,780,000 |
| 1 for 2,500 |
| $ | 7.35 |
| 86,583 |
| 33.39 | % | 33.88 | % | 33.88 | % | |
10-Jun-03 |
| Siera Holdings (SIEN) |
| 6,000,000 |
| 1 for 500,000 |
| $ | 1.43 |
| 8,580 |
| 34.91 | % | 34.91 | % | 30.00 | % | |
29-May-03 |
| Avery Communications (AVYC) |
| 888,483 |
| 1 for 5,000 |
| $ | 1.27 |
| 1,128 |
| 97.00 | % | 97.00 | % | 112.00 | % | |
16-May-03 |
| Kimmins Corporation (KMMN) |
| 6,538,704 |
| 1 for 100 |
| $ | 1.00 |
| 6,539 |
| 82.00 | % | 113.00 | % | 186.00 | % | |
25-Apr-03 |
| PML Inc (PMLI) |
| 2,193,992 |
| 1 for 150 |
| $ | 1.50 |
| 3,291 |
| 81.00 | % | 76.00 | % | 40.00 | % | |
17-Mar-03 |
| IFX Corporation (FUTR) |
| 11,963,399 |
| 1 for 300 |
| $ | 0.12 |
| 1,436 |
| 28.91 | % | 33.20 | % | -33.40 | % | |
|
|
|
|
|
|
|
|
|
|
|
|
|
|
|
|
|
| ||
All Transactions |
|
|
|
|
|
|
|
|
| ||||||||||
|
|
|
|
|
|
|
| High |
| $ | 309,075 |
| 506.7 | % | 506.7 | % | 727.3 | % | |
|
|
|
|
|
|
|
| Mean |
| 46,707 |
| 124.5 | % | 127.7 | % | 149.6 | % | ||
|
|
|
|
|
|
|
| Median |
| 3,291 |
| 81.0 | % | 76.0 | % | 50.5 | % | ||
|
|
|
|
|
|
|
| Low |
| 1,128 |
| 28.9 | % | 33.2 | % | -33.4 | % | ||
|
|
|
|
|
|
|
|
|
|
|
|
|
|
|
|
|
| ||
Excluding Telesoft |
|
|
|
|
|
|
|
|
| ||||||||||
|
|
|
|
|
|
|
| High |
| $ | 309,075 |
| 200.0 | % | 200.0 | % | 200.0 | % | |
|
|
|
|
|
|
|
| Mean |
| 52,255 |
| 76.7 | % | 80.3 | % | 77.4 | % | ||
|
|
|
|
|
|
|
| Median |
| 4,915 |
| 68.6 | % | 65.4 | % | 45.2 | % | ||
|
|
|
|
|
|
|
| Low |
| 1,128 |
| 28.9 | % | 33.2 | % | -33.4 | % | ||
|
|
|
|
|
|
|
|
|
|
|
|
|
|
|
|
|
| ||
Companies Implied Market Value >$10.0 million |
|
|
|
|
| ||||||||||||||
|
|
|
|
|
|
|
| High |
| $ | 309,075 |
| 56.3 | % | 54.8 | % | 50.5 | % | |
|
|
|
|
|
|
|
| Mean |
| 197,829 |
| 44.8 | % | 44.3 | % | 42.2 | % | ||
|
|
|
|
|
|
|
| Median |
| 197,829 |
| 44.8 | % | 44.3 | % | 42.2 | % | ||
|
|
|
|
|
|
|
| Low |
| 86,583 |
| 33.4 | % | 33.9 | % | 33.9 | % | ||
Sources of information: Yahoo Finance, CapitalIQ, SEC Filings, Commodity Systems and Press Releases.
83
PREMIUMS PAID ANALYSIS
• The premiums paid analysis involves the comparison of a range of Fractional Share Consideration to the average closing price of the Company’s common stock over varying time periods prior to November 3, 2003.
• The analysis suggests that for the periods calculated, a range of Fractional Share Consideration between $2.75 and $3.25 would all represent a significant premium over the average closing share price for each period.
• In addition, the daily premium or discount over the period November 1, 2002 to November 3, 2003 was graphed based on the Fractional Share Consideration. For the full prior one-year period, the Fractional Share Consideration range represented a significant premium for all of the prevailing daily share prices.
84
Premiums Paid Analysis
|
| Closing Price |
| Fractional Share Consideration Implied Premium/(Discount) @ |
| ||||||||||||||
$ | 2.75 |
| $ | 2.87 |
| $ | 3.00 |
| $ | 3.12 |
| $ | 3.25 | ||||||
|
|
|
|
|
|
|
|
|
|
|
|
|
| ||||||
As of November 03, 2003 |
| $ | 2.0000 |
| 37.5 | % | 43.5 | % | 50.0 | % | 56.0 | % | 62.5 | % | |||||
|
|
|
|
|
|
|
|
|
|
|
|
|
| ||||||
Sensitivity Analysis: |
|
|
|
|
|
|
|
|
|
|
|
|
| ||||||
Prior Day Closing Price |
| $ | 2.0000 |
| 37.5 | % | 43.5 | % | 50.0 | % | 56.0 | % | 62.5 | % | |||||
|
|
|
|
|
|
|
|
|
|
|
|
|
| ||||||
Prior 5 Trading Day Average Closing Price |
| $ | 1.9600 |
| 40.3 | % | 46.4 | % | 53.1 | % | 59.2 | % | 65.8 | % | |||||
|
|
|
|
|
|
|
|
|
|
|
|
|
| ||||||
Prior 10 Trading Day Average Closing Price |
| $ | 1.9100 |
| 44.0 | % | 50.3 | % | 57.1 | % | 63.4 | % | 70.2 | % | |||||
|
|
|
|
|
|
|
|
|
|
|
|
|
| ||||||
Prior 20 Trading Day Average Closing Price |
| $ | 1.8910 |
| 45.4 | % | 51.8 | % | 58.6 | % | 65.0 | % | 71.9 | % | |||||
|
|
|
|
|
|
|
|
|
|
|
|
|
| ||||||
Prior 30 Trading Day Average Closing Price |
| $ | 1.8840 |
| 46.0 | % | 52.3 | % | 59.2 | % | 65.6 | % | 72.5 | % | |||||
|
|
|
|
|
|
|
|
|
|
|
|
|
| ||||||
Prior 60 Trading Day Average Closing Price |
| $ | 1.8620 |
| 47.7 | % | 54.1 | % | 61.1 | % | 67.6 | % | 74.5 | % | |||||
|
|
|
|
|
|
|
|
|
|
|
|
|
| ||||||
Prior 90 Trading Day Average Closing Price |
| $ | 1.8527 |
| 48.4 | % | 54.9 | % | 61.9 | % | 68.4 | % | 75.4 | % | |||||
|
|
|
|
|
|
|
|
|
|
|
|
|
| ||||||
Prior Six Month Average Closing Price |
| $ | 1.7677 |
| 55.6 | % | 62.4 | % | 69.7 | % | 76.5 | % | 83.9 | % | |||||
|
|
|
|
|
|
|
|
|
|
|
|
|
| ||||||
Prior Year Average Closing Price |
| $ | 1.5693 |
| 75.2 | % | 82.9 | % | 91.2 | % | 98.8 | % | 107.1 | % | |||||
Sources of information: Share price data provided by Commodity Systems, Inc.
85
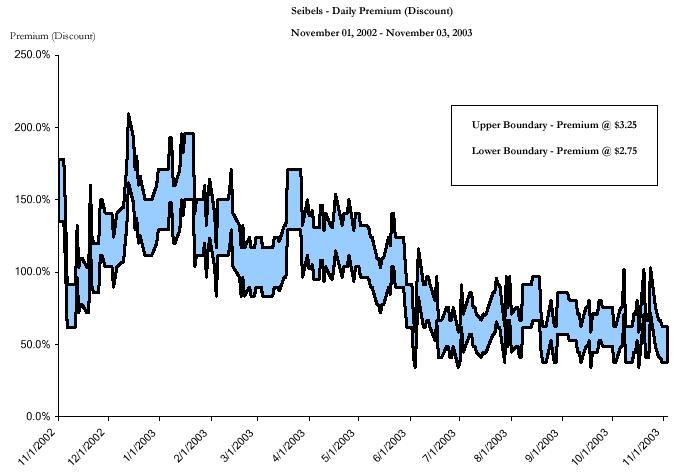
86