UNITED STATES SECURITIES AND EXCHANGE COMMISSION
WASHINGTON, D. C. 20549
FORM 10-K
| | | |
| þ | | ANNUAL REPORT PURSUANT TO SECTION 13 OR 15(d) OF THE SECURITIES EXCHANGE ACT OF 1934 |
For the fiscal year ended December 31, 2006
or
| | | |
| o | | TRANSITION REPORT PURSUANT TO SECTION 13 OR 15(d) OF THE SECURITIES EXCHANGE ACT OF 1934 |
For the transition period from to
Commission file number0-8738
BANCINSURANCE CORPORATION
(Exact name of registrant as specified in its charter)
| | | |
| Ohio | | 31-0790882 |
| | | |
| (State or other jurisdiction of incorporation or organization) | | (I.R.S. Employer Identification No.) |
| | | |
| 250 East Broad Street, Columbus, Ohio | | 43215 |
| | | |
| (Address of principal executive offices) | | (Zip Code) |
Registrant’s telephone number, including area code(614) 220-5200
Securities registered pursuant to Section 12(b) of the Act:
| | | |
| Title of each class | | Name of each exchange |
| | | on which registered |
| | | |
| NONE | | NONE |
| | | |
Securities registered pursuant to Section 12(g) of the Act:
COMMON SHARES, WITHOUT PAR VALUE
(Title of Class)
Indicate by check mark if the registrant is a well-known seasoned issuer, as defined in Rule 405 of the Securities Act.
YESo NOþ
Indicate by check mark if the registrant is not required to file reports pursuant to Section 13 or Section 15(d) of the Act.
YESo NOþ
Indicate by check mark whether the registrant (1) has filed all reports required to be filed by Section 13 or 15(d) of the Securities Exchange Act of 1934 during the preceding 12 months (or for such shorter period that the registrant was required to file such reports), and (2) has been subject to such filing requirements for the past 90 days.
YESþ NOo
Indicate by check mark if disclosure of delinquent filers pursuant to Item 405 of Regulation S-K is not contained herein, and will not be contained, to the best of the registrant’s knowledge, in definitive proxy or information statements incorporated by reference in Part III of this Form 10-K or any amendment to this Form 10-K.o
Indicate by check mark whether the registrant is a large accelerated filer, an accelerated filer, or a non-accelerated filer. See definition of “accelerated filer and large accelerated filer” in Rule 12b-2 of the Exchange Act. (Check one):
Large accelerated filero Accelerated filero Non-accelerated filerþ
Indicate by check mark whether the registrant is a shell company (as defined in Rule 12b-2 of the Exchange Act).
YESo NOþ
The aggregate market value of the registrant’s common shares held by non-affiliates of the registrant as of the last business day of the registrant’s most recently completed second fiscal quarter (June 30, 2006) was $11,989,326.
The number of the registrant’s common shares outstanding as of February 7, 2007 was 5,005,700.
DOCUMENT INCORPORATED BY REFERENCE
Portions of the registrant’s Proxy Statement to be filed in connection with the solicitation of proxies for the Annual Meeting of Shareholders to be held on May 30, 2007 are incorporated by reference into Part III of this report.
BANCINSURANCE CORPORATION AND SUBSIDIARIES
2006 FORM 10-K
TABLE OF CONTENTS
2
FORWARD-LOOKING INFORMATION
Certain statements made in this Annual Report on Form 10-K are forward-looking and are made pursuant to the safe harbor provisions of the Private Securities Litigation Reform Act of 1995. In addition, we may make other written or oral communications from time to time that contain forward-looking statements. Forward-looking statements convey our current expectations or forecast future events. All statements contained in this Annual Report on Form 10-K, other than statements of historical fact, are forward-looking statements. Forward-looking statements include statements regarding our future financial position, results of operations, business strategy, budgets, projected costs and plans and objectives of management for future operations. The words “may,” “continue,” “estimate,” “intend,” “plan,” “will,” “believe,” “project,” “expect,” “anticipate” and similar expressions generally identify forward-looking statements but the absence of these words does not necessarily mean that a statement is not forward-looking. Forward-looking statements are not guarantees of future performance and involve risks and uncertainties that may cause actual results to differ materially from those statements. Risk factors that might cause actual results to differ from those statements include, without limitation, changes in underwriting results affected by adverse economic conditions, fluctuations in the investment markets, changes in the retail marketplace, changes in the laws or regulations affecting the operations of the Company, changes in the business tactics or strategies of the Company, the financial condition of the Company’s business partners, changes in market forces, litigation, developments in the discontinued bond program and related Highlands arbitration, the ongoing SEC private investigation and the concentrations of ownership of the Company’s common shares by members of the Sokol family, and other risk factors identified in our filings with the SEC, any one of which might materially affect our financial condition and/or results of operations. Any forward-looking statements speak only as of the date made. We undertake no obligation to update any forward-looking statements to reflect events or circumstances arising after the date on which they are made.
PART I
ITEM 1. BUSINESS
GENERAL/OVERVIEW
Bancinsurance Corporation is an Ohio insurance holding company primarily engaged in the underwriting of specialized property/casualty insurance products through our wholly-owned subsidiary, Ohio Indemnity Company (“Ohio Indemnity”), an Ohio corporation. Ohio Indemnity is licensed to transact business in 48 states and the District of Columbia. Until August 31, 2006, the Company also had a municipal code publishing business segment. On August 31, 2006, the Company sold its municipal code publishing segment as more fully described in “General/Overview-Sale of Affiliate” below and in Note 1 to the Consolidated Financial Statements. In addition, our wholly-owned subsidiary, Ultimate Services Agency, LLC (“USA”), an Ohio limited liability company which we formed in July 2002, is a property/casualty insurance agency. Financial information for our business segments for the three years ended December 31, 2006 is included in Note 24 to the Consolidated Financial Statements included in this Annual Report on Form 10-K. Unless the context indicates otherwise, all references herein to “Bancinsurance,” “we,” “Registrant,” “us,” “its,” “our” or the “Company” refer to Bancinsurance Corporation and its consolidated subsidiaries.
General information about Bancinsurance is available on the Company’s website, www.bancins.com. Information on our website is not and should not be considered part of this Annual Report on Form 10-K.
PRODUCTS AND SERVICES
Ohio Indemnity Company
The majority of our net premiums written and premiums earned are derived from three distinct product lines offered by Ohio Indemnity: (1) automobile lender/dealer; (2) unemployment compensation; and (3) waste industry. In 2006, we had net premiums earned of $49,106,653 with 79% attributable to our lender/dealer products, 12% attributable to our unemployment compensation products and 9% attributable to our waste industry products.
Automobile Lender/Dealer Products. Our automobile lender/dealer line offers three types of products. First, ULTIMATE LOSS INSURANCE® (“ULI”), a blanket vendor single interest coverage, is sold to lending institutions, such as banks, savings and loan associations, credit unions, automobile dealers and finance companies. ULI insures against damage to pledged collateral in cases where the collateral is not otherwise insured. Our standard ULI policy covers physical damage to the collateral in an amount not to exceed the lesser of the collateral’s fair market value or the outstanding loan balance. This blanket vendor single interest policy is generally written to cover the lending institution’s complete portfolio of collateralized personal property loans, which generally consists of automobile loans. Certain ULI policies are eligible for experience rated and retrospective rated refunds based on loss experience. We also offer supplemental insurance coverages, at additional premium cost, for losses resulting from unintentional errors in lien filings and conversion, confiscation and skip risks. Conversion risk coverage protects the lender from unauthorized and wrongful taking of the lender’s collateral. Skip risk coverage protects the lender when a delinquent debtor disappears with the loan collateral. During 2006, we provided ULI coverage to approximately 400 lending institutions. The premiums charged for ULI are based on claims experience, loan volumes and general market conditions. ULI products represented 53%, 56% and 69% of our net premiums earned during 2006, 2005 and 2004, respectively.
3
Second, creditor placed insurance (“CPI”) provides an alternative to our traditional blanket vendor single interest product. While both products cover the risk of damage to uninsured collateral in a lender’s automobile loan portfolio, CPI covers an automobile lender’s loan portfolio through tracking individual borrowers’ insurance coverage. The lender purchases physical damage coverage for loan collateral after a borrower’s insurance has lapsed. The lender then charges the premium to the borrower. The National Association of Insurance Commissioners (“NAIC”) developed a “model act” for CPI in 1996 and several states have adopted its provisions. The model act helped to clarify program parameters that are acceptable to regulators. Our CPI product complies with the model act. During 2006, we provided CPI coverage to approximately 35 lending institutions. CPI products represented 3%, 5% and 4% of our net premiums earned during 2006, 2005 and 2004, respectively.
Third, guaranteed auto protection insurance (“GAP”) pays the difference or “gap” between the amount owed by the customer on a lease or loan contract and the amount of primary insurance company coverage in the event a vehicle is damaged beyond repair or stolen and never recovered. The “gap” results from the way loans and leases amortize compared to depreciation patterns of vehicles. Leasing, low or no down payment loans, long-term loans (60-84 months) and low trade-in prices contribute to such “gap” amounts. GAP insurance policies insure lenders, lessors and auto dealers who waive “gap” amounts and elect to purchase GAP insurance to cover the risk assumed by making the waiver. We offer two primary forms of GAP insurance products. First, voluntary GAP insurance policies are sold to lenders, lessors and auto dealers who in turn sell such policies directly to the borrower when a vehicle is purchased or leased. Second, blanket GAP insurance policies are sold to lessors who typically waive “gap” amounts on all of their leases. During 2006, we provided GAP coverage to approximately 800 lenders, lessors and auto dealers. GAP products represented 23%, 19% and 11% of our net premiums earned during 2006, 2005 and 2004, respectively.
Unemployment Compensation Products. Our unemployment compensation (“UC”) products are utilized by qualified entities that elect not to pay the unemployment compensation taxes and instead reimburse state unemployment agencies for benefits paid by the agencies to the entities’ former employees. Through our UCassure® and excess of loss products, we indemnify the qualified entity for liability associated with their reimbursing obligations. In addition, we underwrite surety bonds that certain states require employers to post in order to obtain reimbursing status for their unemployment compensation obligations. Our bonded service program was discontinued at the end of 2003 and replaced by our UCassure® program.
During 2006, we provided UC insurance coverage to approximately 100 customers. UC products represented 12%, 11% and 10% of our net premiums earned during 2006, 2005 and 2004, respectively.
Waste Industry Products. Our waste industry products (“WIP”) consist of certain surety bonds produced and administered by a general insurance agent. Under this program, the Company both assumes and cedes certain waste surety bond business under two quota share reinsurance arrangements. In the second quarter of 2004, the Company entered into a 50% quota share reinsurance arrangement whereby the Company assumed 50% of all waste surety bonds with liability limits up to $4.0 million from two insurance carriers. Effective January 1, 2005, the reinsurance arrangement was amended whereby the Company’s assumed participation was reduced from 50% to 25%. Effective August 1, 2006, the reinsurance arrangement was further amended whereby the Company assumed 50% of all waste surety bonds with liability limits up to $1.2 million. In addition to assuming business, the Company also writes on a direct basis waste surety bonds with liability limits up to our Treasury limit ($3.6 million during 2006). The Company then cedes 50% of that business to an insurance carrier under a reinsurance arrangement. All surety bonds written directly and assumed under this program are produced and administered by a general insurance agent that is affiliated with one of the insurance carriers participating in the program. The majority of the surety bonds under the program satisfy the closure/post-closure financial responsibility obligations imposed on hazardous and solid waste treatment, storage and disposal facilities pursuant to Subtitles C and D of the Federal Resource Conservation and Recovery Act (“RCRA”). Closure/post-closure bonds cover future costs to close and monitor a regulated site such as a landfill. All of the surety bonds are indemnified by the principal and collateral is maintained on the majority of the bonds. The indemnifications and collateralization of this program reduces the risk of loss.
During 2006, we provided WIP coverage to approximately 80 customers. WIP represented 9%, 9% and 4% of our net premiums earned during 2006, 2005 and 2004, respectively.
The Company has certain other specialty products which consist primarily of service contracts and other surety products. Net premiums earned for these products were $251,191, $258,798 and $159,439 during 2006, 2005 and 2004, respectively. In addition, from 2001 until the end of the second quarter of 2004, the Company participated in a bail and immigration bond program. This program was discontinued in the second quarter of 2004. For a more detailed description of this program, see “Management’s Discussion and Analysis of Financial Condition and Results of Operations, Overview-Discontinued Bond Program” below and Note 16 to the Consolidated Financial Statements.
We sell our insurance products through multiple distribution channels, including three managing general agents, approximately thirty-five independent agents and direct sales.
4
American Legal Publishing Corporation
On August 31, 2006, the Company sold its wholly-owned subsidiary, American Legal Publishing Corporation (“ALPC”), which codifies, publishes, supplements and distributes ordinances for municipalities and counties nationwide in addition to state governments. Ordinance codification is the process of collecting, organizing and publishing legislation for state and local governments. ALPC also provides information management services which includes electronic publishing, document imaging and internet hosting services. ALPC represented 4%, 6% and 7% of our total revenues during 2006, 2005 and 2004, respectively. See “General/Overview-Sale of Affiliate” below and Note 1 to the Consolidated Financial Statements for more information concerning this transaction.
Ultimate Services Agency, LLC
In July 2002, we formed Ultimate Services Agency, LLC (“USA”), a wholly-owned subsidiary. We formed USA to act as an agency for placing and servicing property/casualty insurance policies offered and underwritten by Ohio Indemnity and by other property/casualty insurance companies.
SALE OF AFFILIATE
On August 31, 2006, the Company entered into a Stock Purchase Agreement (the “Agreement”) with A.L.P. Acquisition Co., Inc., an Ohio corporation (the “Purchaser”), whereby the Company sold 100% of the issued and outstanding common shares of ALPC to the Purchaser for $4,620,000 subject to customary post-closing adjustments (the “Sale”). The Company received cash of $4,150,000 and a promissory note in the principal amount of $470,000 (the “Promissory Note”) from the Purchaser at the closing in connection with the Sale. On September 1, 2006, the Purchaser made a principal payment to the Company on the Promissory Note in the amount of $345,000, bringing the remaining principal balance of the Promissory Note to $125,000 which is to be repaid in six monthly installments and bears interest at an annual rate of 8.0%. As of December 31, 2006, the principal balance of the promissory note was $62,500.
The Purchaser was organized by Steven G. Wolf, who has served as President of ALPC since 1984 and as a director of ALPC since 2000. Mr. Wolf and certain other employees of ALPC collectively own a significant equity interest in the Purchaser.
In conjunction with the Sale, on August 31, 2006, the Company also made an investment (the “Investment”) in the Purchaser in the amount of $250,000, consisting of (1) a $137,500 cash purchase of equity securities of the Purchaser and (2) a $112,500 loan to the Purchaser in the form of a subordinated convertible promissory note (the “Convertible Note”). The Convertible Note is to be repaid on August 31, 2016 (if not previously converted), bears interest at an annual rate of 8.0% and is convertible at any time at the option of the Company into additional equity securities of the Purchaser.
In connection with the Sale and the Investment, the Company recorded a net realized gain of approximately $2.5 million ($1.7 million after tax) for the period ended December 31, 2006.
COMPETITION
The insurance business is highly competitive with over 3,000 property/casualty insurance companies in the United States. The majority of such property/casualty insurers are not engaged in the specialty lines of property/casualty insurance which we underwrite. Some of our competitors may: (1) offer more diversified insurance coverage; (2) have greater financial resources; (3) offer lower premiums; (4) have more complete and complex product lines; (5) have greater pricing flexibility; (6) have different marketing techniques; (7) have a higher financial rating; and/or (8) provide better agent compensation. Management believes that one of our competitive advantages is specializing in limited insurance lines. This specialization allows us to refine our underwriting and claims techniques, which in turn, provides agents and insureds with superior service.
REINSURANCE
The Company assumes and cedes reinsurance with other insurers and reinsurers. Such arrangements serve to enhance the Company’s capacity to write business, provide greater diversification, align business partners with the Company’s interests, and/or limit the Company’s maximum loss arising from certain risks. Although reinsurance does not discharge the original insurer from its primary liability to its policyholders, it is the practice of insurers for accounting purposes to treat reinsured risks as risks of the reinsurer. The primary insurer would reassume liability in those situations where the reinsurer is unable to meet the obligations it assumed under the reinsurance agreement. The ability to collect reinsurance is subject to the solvency of the reinsurers and/or collateral provided under the contract.
Several of our lender/dealer insurance producers have formed sister reinsurance companies, commonly referred to as a producer-owned reinsurance company (“PORC”). The primary reason for an insurance producer to form a PORC is to realize the underwriting profits and investment income from the insurance premiums generated by that producer. In return for ceding business to the PORC, the Company receives a ceding commission, which is based on a percentage of the premiums ceded. Such arrangements align business partners with the Company’s interests while preserving valued customer relationships. All of the Company’s lender/dealer ceded reinsurance transactions are PORC arrangements.
5
Effective January 1, 2003, the Company entered into a producer-owned reinsurance arrangement with a new lender/dealer producer whereby 100% of that producer’s premiums (along with the associated risk) was ceded to its PORC. This reinsurance arrangement was cancelled effective December 31, 2003. For this reinsurance arrangement, the Company has obtained collateral in the form of a letter of credit from the reinsurer to secure its obligations. Under the provisions of the reinsurance agreement, the collateral must be equal to or greater than 102% of the reinsured reserves and the Company has immediate access to such collateral if necessary. Under this arrangement, the Company ceded premiums earned of $67,969, $115,790 and $4,435,659 for the years ended December 31, 2006, 2005 and 2004, respectively.
Effective October 1, 2003, the Company entered into a producer-owned reinsurance arrangement with an existing lender/dealer customer whereby 100% of that customer’s premiums (along with the associated risk) was ceded to its PORC. For this reinsurance arrangement, the Company has obtained collateral in the form of a trust from the reinsurer to secure its obligations. Under the provisions of the reinsurance agreement, the collateral must be equal to or greater than 102% of the reinsured reserves and the Company has immediate access to such collateral if necessary. Under this arrangement, the Company ceded premiums earned of $2,266,090, $1,727,303 and $894,717 for the years ended December 31, 2006, 2005 and 2004, respectively.
Beginning in the second quarter of 2004, the Company entered into a quota share reinsurance arrangement with certain insurance carriers whereby the Company assumed and ceded 50% of certain waste surety bond business. Effective January 1, 2005, the reinsurance arrangement was amended whereby the Company’s assumed participation was reduced from 50% to 25%. Effective August 1, 2006, the reinsurance arrangement was further amended whereby the Company’s assumed participation was increased from 25% to 50%. Under this program, the Company assumed premiums earned of $3,283,690, $4,302,509 and $1,980,492 during 2006, 2005 and 2004, respectively. Also, the Company ceded premiums earned of $1,235,624, $679,563 and $131,051 for the years ended December 31, 2006, 2005, and 2004, respectively.
Effective January 1, 2005, the Company entered into a producer-owned reinsurance arrangement with a guaranteed auto protection insurance agent whereby 100% of that agent’s premiums (along with the associated risk) were ceded to its PORC. For this reinsurance arrangement, the Company has obtained collateral in the form of a letter of credit to secure its obligations. Under the provisions of the reinsurance agreement, the collateral must be equal to or greater than 102% of the reinsured reserves and the Company has immediate access to such collateral if necessary. Under this arrangement, the Company ceded premiums earned of $1,987,640, $734,435 and $0 for the years ended December 31, 2006, 2005 and 2004, respectively.
In addition to the above, the Company has other reinsurance arrangements including two automobile lender/dealer PORC quota share arrangements, several quota share arrangements for certain contract and escrow surety bond business and a reinsurance arrangement for a vehicle service contract program. Under these arrangements, the Company ceded premiums earned of $708,430, $927,455 and $1,113,639 for the years ended December 31, 2006, 2005 and 2004, respectively. Also, the Company assumed premiums earned of $60,535, $0 and $0 for the years ended December 31, 2006, 2005 and 2004, respectively.
From 2001 until the end of the second quarter of 2004, the Company participated in a bail and immigration bond program. This program was discontinued in the second quarter of 2004. For a more detailed description of this program, see “Management’s Discussion and Analysis of Financial Condition and Results of Operations, Overview-Discontinued Bond Program” below and Note 16 to the Consolidated Financial Statements.
For more information concerning the Company’s reinsurance transactions, see “Management’s Discussion and Analysis of Financial Condition and Results of Operations” and Note 16 to the Consolidated Financial Statements.
REGULATION
Insurance Company Regulation
Ohio Indemnity, as an Ohio property/casualty insurance corporation, is subject to the regulatory supervision of the Ohio Department of Insurance (the “Department”). In addition, Ohio Indemnity is subject to regulation in each jurisdiction in which it is licensed to write insurance.
Such regulation relates to, among other matters: licensing of insurers and their agents, authorized lines of business, capital and surplus requirements, rate and form approvals, claims practices, mandated participation in shared markets, reserve requirements, insurer solvency, investment criteria, underwriting limitations, affiliate transactions, dividend limitations, changes in control and a variety of other financial and non-financial components of our business.
6
All insurance companies must file annual financial statements (statutory basis) in states where they are authorized to do business and are subject to regular and special examinations by the regulatory agencies of those states. In March and April of 2005, the Department conducted a targeted on-site examination of Ohio Indemnity’s discontinued bond program and statutory financial condition at December 31, 2004. On September 12, 2005, the Department issued its targeted on-site examination report and no adjustments to the statutory financial statements were required as a result of the examination. In December 2006, the Department initiated its regular examination of Ohio Indemnity which is currently ongoing.
Numerous states require deposits of assets by insurance companies to protect policyholders. Such deposits must consist of securities which comply with standards established by the particular state’s insurance department. As of December 31, 2006, we have securities with a carrying value of $4,538,220 deposited with eleven state insurance departments. The deposits, typically required by a state’s insurance department on admission to do insurance business in such state, may be increased periodically as mandated by applicable statutory or regulatory requirements.
Ohio Insurance Holding Company System Regulation
We are also subject to the Ohio Insurance Holding Company System Regulatory Act, as amended (the “Ohio Insurance Holding Company Act”), which requires that notice of the proposed payment of any dividend or other distribution by Ohio Indemnity be given to the Ohio Superintendent of Insurance within five business days of its declaration and at least ten days prior to payment. If such dividend or distribution is paid from other than earned surplus or the dividend or distribution, together with any other dividends or distributions made within the preceding 12 months, exceed the greater of: (1) 10% of Ohio Indemnity’s statutory surplus as of the immediately preceding December 31, or (2) the statutory net income of Ohio Indemnity for the immediately preceding calendar year, notice of the proposed dividend or distribution must be given to the Superintendent at least 30 days prior to payment, and the Superintendent may disapprove the dividend or distribution within the 30 day period following receipt of such notice.
Pursuant to the Ohio Insurance Holding Company Act, no person may acquire, directly or indirectly, 10% or more of the outstanding voting securities of Bancinsurance or Ohio Indemnity, unless the Ohio Superintendent of Insurance has approved such acquisition. The determination of whether to approve any such acquisition is based on a variety of factors, including an evaluation of the acquirer’s financial condition, the competence of its management and whether competition in Ohio would be reduced. In addition, under the Ohio Insurance Holding Company Act, certain other material transactions involving Ohio Indemnity and its affiliates must be disclosed to the Ohio Superintendent of Insurance not less than 30 days prior to the effective date of the transaction. The Superintendent may elect not to approve such transaction within such 30-day period if it does not meet the required standards. Transactions requiring approval by the Superintendent include: sales, purchases, or exchanges of assets; loans and extensions of credit; and investments not in compliance with statutory guidelines. Ohio Indemnity is also required under the Ohio Insurance Holding Company Act to file periodic and updated statements reflecting the current status of its holding company system, the existence of any related-party transactions and certain financial information relating to any person who directly or indirectly controls (presumed to exist with 10% voting control) Ohio Indemnity. We believe that we are in compliance with the Ohio Insurance Holding Company Act and the related regulations.
National Association of Insurance Commissioners
All states have adopted the financial reporting form of the National Association of Insurance Commissioners (“NAIC”), which form is typically referred to as the NAIC “annual statement.” In addition, most states, including Ohio, generally defer to NAIC with respect to statutory accounting practices and procedures. In this regard, NAIC has a substantial degree of practical influence and is able to accomplish quasi-legislative initiatives through amendments to the NAIC annual statement and applicable statutory accounting practices and procedures. The Department requires that insurance companies domiciled in the State of Ohio prepare their statutory basis financial statements in accordance with the NAIC Accounting Practices and Procedures Manual.
The NAIC applies a risk-based capital test to property/casualty insurers. Ohio also applies the NAIC risk-based capital test. The risk-based capital test serves as a benchmark of an insurance enterprise’s solvency by establishing statutory surplus targets which will require certain company level or regulatory level actions. Ohio Indemnity’s total adjusted capital was in excess of all required action levels as of December 31, 2006.
Other Regulatory Matters
Broker Contingent Commission. In 2004, the New York attorney general began an investigation into insurance broker activities connected with contingent commission agreements. The investigation led to lawsuits and prompted other attorney generals and state insurance departments to conduct further investigations. We have not received any formal inquiries from any state attorney general and/or insurance department. The NAIC has proposed a model act on these agreements for agents and brokers, and several states have indicated they will adopt the model act or some variation of the proposed act. We continue to closely monitor all proposals.
Federal Insurance Charter. The Commerce Committee of the United States Senate has held hearings on federal involvement in the regulation of the insurance industry. The hearings included a discussion of a proposed federal charter that would allow companies to operate under federal, rather than state, regulation. Any proposed legislation could have a significant impact on the insurance industry, and we continue to monitor all proposals. We anticipate there will be further legislative activity during 2007.
7
EMPLOYEES
As of February 7, 2007, we employed approximately 33 full-time employees and one part-time employee. None of our employees are represented by a collective bargaining agreement, and we are not aware of any efforts to unionize our employees.
SERVICE MARKS
Our service marks “ULTIMATE LOSS INSURANCE,” “UTIMATE GAP” and “UCASSURE,” are registered with the United States Patent and Trademark Office and the State of Ohio. We have also developed common law rights in “BI BANCINSURANCE CORPORATION” (stylized letters) in each state in which Bancinsurance is operating. While these service marks are important to us, we do not believe our business is materially dependent on any one of them.
ITEM 1A. RISK FACTORS
RISK FACTORS THAT MAY AFFECT FUTURE RESULTS
The following cautionary discussion of risks and uncertainties relevant to our business include factors we believe could cause our actual results to differ materially from expected and historical results. Other factors beyond these listed below, including factors unknown to us and factors known to us which we have currently determined not to be material, could adversely affect us.
Economic Factors Impacting our Specialty Insurance Products
The majority of our premium revenues are dependent on the demand for our customers’ automobile financing programs. Increased automobile sales generally cause increased demand for automobile financing and, in turn, our lender/dealer products. Our ULI claims experience is impacted by the rate of loan defaults, bankruptcies and automobile repossessions among our customers. As delinquency dollars rise, our claims experience is expected to increase. In addition, the state of the used car market has a direct impact on our GAP claims. As used car prices decline, there is a larger gap between the balance of the loan/lease and the actual cash value of the automobile, which results in higher severity of our GAP claims. Our UC products are impacted by unemployment levels. As unemployment levels rise, we could experience an increase in the frequency of claims. Such economic factors could have a material adverse effect on our business, financial condition and/or operating results.
Concentration in Specialty Insurance Products
Due to our focus on insuring specialty risks, such as lender collateral protection, unemployment compensation and waste industry bonds, our operations could be more exposed than our more diversified competitors to the effects of changes in economic, competitive or regulatory conditions affecting such specialty markets. These changes may include, but are not limited to, economic downturns, increased competition and the enactment and enforcement of federal and state regulations that may adversely impact these markets. Such factors could have a material adverse effect on our business, financial condition and/or operating results.
Geographic Concentration
We are licensed to operate in 48 states and the District of Columbia. The percentage of our direct premiums written that related to policies issued to customers in Ohio, Rhode Island, Connecticut, Michigan, California, Massachusetts and New York were 28.2%, 11.9%, 9.5%, 7.2%, 6.7%, 6.7% and 5.6%, respectively, for the year ended December 31, 2006. Therefore, a significant percentage of our revenues (75.8%) are concentrated in a small number of states, and our revenues and profitability are subject to prevailing regulatory, legal, economic, demographic, competitive and other conditions in these states. Changes in any of these conditions could make it less profitable for us to do business in Ohio, Rhode Island, Connecticut, Michigan, California, Massachusetts, New York and the other states in which we operate.
Reinsurance Risk
Historically, we have used reinsurance to increase our underwriting capacity and align the interests of our business partners with the Company’s interests. Our reinsurance facilities generally are subject to annual renewal. We are subject to credit risk with respect to our reinsurers, as the ceding of risk to reinsurers does not relieve us of our primary liability to our insureds. Although we place our reinsurance with reinsurers we believe to be financially stable and/or obtain collateral on our reinsurance, a significant reinsurer’s inability or unwillingness to make payment under the terms of a reinsurance treaty could have a material adverse effect on our business, financial condition and/or operating results.
Possible Inadequacy of Loss Reserves
We record reserve liabilities for the estimated future payment of losses and loss adjustment expenses (“LAE”) for both reported and unreported claims. The establishment of appropriate reserves is an inherently uncertain process, involving actuarial and statistical projections of what we expect to be the cost of the ultimate settlement and administration of claims based on historical claims information, estimates of future trends in claims severity and other variable factors such as inflation. Due to the inherent uncertainty in estimating reserves, it has been necessary in the past, and may continue to be necessary in the future, to revise estimated liabilities
8
as reflected in our reserves for claims and related expenses. To the extent our reserves are deficient and are increased, the amount of such increase is treated as a charge to earnings in the period in which the deficiency is recognized.
Ability to Price the Risks We Underwrite Accurately
Our results of operations and financial condition depend on our ability to underwrite and set premium rates accurately for the risks we underwrite. Rate adequacy is necessary to generate sufficient premiums to pay losses, LAE and underwriting expenses and to earn a profit. To set our premium rates accurately, we must collect and properly analyze a substantial amount of data; develop, test and apply appropriate rating formulas; closely monitor and timely recognize changes in trends; and project both severity and frequency of losses with reasonable accuracy. Our ability to undertake these efforts successfully, and as a result set our premium rates accurately, is subject to a number of risks and uncertainties, some of which are outside our control, including but not limited to:
| | • | | the availability of sufficient reliable data and our ability to properly analyze available data; |
| |
| | • | | the uncertainties that inherently characterize estimates and assumptions; |
| |
| | • | | our selection and application of appropriate rating and pricing techniques; and |
| |
| | • | | changes in legal standards and claim settlement practices. |
Consequently, we could under price risks, which would negatively affect our profit margins, or we could overprice risks, which could reduce our sales volume and competitiveness. Such factors could have a material adverse effect on our business, financial condition and/or operating results.
Reliance on General Agents
Approximately $15.2 million (27.4%) of our direct premiums written for 2006 were distributed amongst four general agents as follows: $5.8 million (10.5%), $4.7 million (8.5%), $3.0 million (5.4%) and $1.7 million (3.0%). These general agents are not obligated to promote the Company’s insurance programs and may sell competitors’ insurance programs. As a result, our business depends in part on the marketing efforts of these general agents and on our ability to offer insurance programs and services that meet the requirements of the clients and customers of these agents. In addition, these relationships may be discontinued, or if they do continue, they may not remain profitable for us. A loss of all or substantially all the business produced by one or more of these general agents could have a material adverse effect on our business, financial condition and/or operating results.
General Agents May Exceed Their Authority
One of our general agents underwrites policies on a binding authority basis. This agent produced $3.0 million (5.4%) of our direct premiums written during 2006. Binding authority business poses the risk that policies may be quoted and bound by the general agent prior to our underwriting review. If the general agent exceeds this authority by binding us on a risk that does not comply with our underwriting guidelines, we are at risk for claims that occur under that policy during the period from its issue date until we review the policy and cancel it. Such risks could have a material adverse effect on our business, financial condition and/or operating results.
Risk of Fraud or Negligence with our Insurance Agents
We rely, in part, on insurance agents to sell our insurance products and services. During 2006, our insurance agents produced approximately 44% of our direct premiums written. Because we use independent insurance agents, we are at risk that the agents will engage in negligent or fraudulent acts, including:
| | • | | binding Ohio Indemnity and not reporting the policies and related premium to Ohio Indemnity; |
| |
| | • | | failing to accurately report premiums and/or claims to Ohio Indemnity; |
| |
| | • | | failing to obtain collateral and/or monitor insurance risk; |
| |
| | • | | failing to return commissions to Ohio Indemnity in situations where commissions have been advanced and should be returned to Ohio Indemnity based on the financial performance of the agents’ business; and |
| |
| | • | | financial hardship (i.e. liquidity problems, bankruptcy, liquidation, etc.) of the agent which could lead to lost business and/or increased loss exposure for Ohio Indemnity. |
Any such negligent or fraudulent acts could have a material adverse effect on our business, financial condition and/or operating results.
Importance of Industry Ratings
Ohio Indemnity received an “A-” (Excellent) annual rating in December 2006 from A.M. Best. A.M. Best generally assigns ratings based on an insurance company’s ability to pay policyholder obligations (not based on protection of investors) and focuses on capital adequacy, loss and loss expense reserve adequacy and operating performance. If our performance in these areas decline, A.M. Best could downgrade our rating. A downgrade of our rating could cause our current and future insurance agents and insureds to choose other, more highly rated competitors. In addition, we believe that not having an “A-” rating or better could impact an agents’ or customers’ willingness to place business with Ohio Indemnity.
9
Importance of Treasury Listing
Ohio Indemnity is currently listed on the United States Treasury Department’s listing of approved surety companies (“Treasury Listing”). This listing is required for all surety companies who issue or reinsure surety bonds naming the United States government or any branch or agency of the United States government as the obligee. The Treasury Listing also establishes a company’s maximum underwriting amount on any one surety bond based on its capital and surplus. Many governmental entities, both federal and non-federal, that issue landfill licenses and permits will accept surety bonds only from insurance companies that are on the Treasury Listing. If Ohio Indemnity’s Treasury Listing were revoked, or if its surety bond limit were reduced, it would eliminate or reduce the Company’s ability to write and assume business under the waste surety bond program and certain other surety bond programs. This could have a material adverse effect on our business, financial condition and/or operating results.
Regulation
General. Ohio Indemnity is subject to regulation by governmental agencies in Ohio, its domiciliary state, and the 48 other states and the District of Columbia in which Ohio Indemnity is licensed or admitted to sell insurance. Most insurance regulations are designed to protect the interests of insurance policyholders, as opposed to the interests of shareholders. These regulations generally are administered by a department of insurance in each state and relate to, among other things, licensing of insurers and their agents, authorized lines of business, capital and surplus requirements, rate and form approvals, claims practices, mandated participation in shared markets, reserve requirements, insurer solvency, investment criteria, underwriting limitations, affiliate transactions, dividend limitations, changes in control and a variety of other financial and non-financial matters. Significant changes in these laws and regulations could adversely affect our ability to operate and/or make it more expensive to conduct our business. State insurance departments also conduct periodic examinations of the affairs of insurance companies and require the filing of annual and other reports relating to financial condition, holding company issues and other matters. These regulatory requirements may adversely affect our ability to achieve some or all of our business objectives. We are unable to predict what additional laws and regulations, if any, affecting our business may be promulgated in the future or how they might be interpreted.
Required Licensing. We operate under insurance licenses issued by various state insurance authorities. Regulatory authorities have broad discretion to deny or revoke licenses for various reasons, including the violation of regulations. In some instances, where there is uncertainty as to the application of a regulation, we follow practices based on our interpretations of regulations or practices that we believe generally to be followed by the industry. These practices may turn out to be different from the interpretations of regulatory authorities. If we do not have the requisite licenses and approvals or do not comply with applicable regulatory requirements, insurance regulatory authorities could preclude or temporarily suspend us from carrying on some or all of our activities or otherwise penalize us. This could adversely affect our ability to operate our business. Further, changes in the level of regulation of the insurance industry or changes in laws or regulations themselves or interpretations by regulatory authorities could adversely affect our ability to operate our business.
Premium Rate Filings. Most states have insurance laws requiring that rate schedules and other information be filed with the state’s regulatory authority, either directly or through a rating organization with which the insurer is affiliated. The regulatory authority may disapprove of a premium rate filing if it finds that the rates are inadequate, excessive or unfairly discriminatory. Rates vary by class of business, hazard assumed and size of risk, and are not necessarily uniform for all insurers. Many states have recently adopted laws which limit the ability of insurance companies to increase rates. To date, such limitations have not had a material impact on us, and we have no knowledge of any such limitations that may materially affect our future results of operations. However, there can be no assurance that such limitations will not have a material adverse effect on our business, financial condition and/or operating results in the future.
Risk-Based Capital. The NAIC has adopted a system to test the adequacy of statutory capital, known as “risk-based capital.” This system establishes the minimum amount of risk-based capital necessary for a company to support its overall business operations. It identifies property/casualty insurers that may be inadequately capitalized by looking at certain inherent risks of each insurer’s assets and liabilities and its mix of net written premiums. Failure to meet applicable risk-based capital requirements or minimum statutory capital requirements could subject Ohio Indemnity to further examination or corrective action imposed by state regulators, including limitations on our writing of additional business, state supervision, rehabilitation or even liquidation. Any changes in existing risk-based capital requirements or minimum statutory capital requirements may require us to increase our statutory capital levels, which we may be unable to do, or could cause Ohio Indemnity to lose its regulatory authority to conduct its business.
Transactions Between Our Insurance Subsidiary and Affiliates. We operate as an insurance holding company. Transactions between Ohio Indemnity and other members of our holding company system generally must be disclosed to the state regulators, and prior approval of the applicable regulator generally is required before any material or extraordinary transaction may be consummated. State regulators may refuse to approve or delay approval of such a transaction, which may impact our ability to operate efficiently.
10
Dependence on Our Insurance Subsidiary to Meet Our Obligations
We are a holding company and a legal entity separate and distinct from our insurance subsidiary. As a holding company without significant operations of our own, our principal sources of our funds are dividends and other payments from our subsidiaries which include, among others, Ohio Indemnity. State insurance laws limit the ability of Ohio Indemnity to pay dividends and require Ohio Indemnity to maintain specified minimum levels of statutory capital and surplus. In general, these restrictions limit the aggregate amount of dividends or other distributions that Ohio Indemnity may declare or pay within any twelve-month period without advance regulatory approval. Generally, this limitation is the greater of statutory net income for the preceding calendar year or 10% of the statutory surplus at the end of the preceding calendar year. In addition, insurance regulators have broad powers to prevent reduction of statutory surplus to inadequate levels and could refuse to permit the payment of dividends of the maximum amounts calculated under any applicable formula. As a result, we may not be able to receive dividends from Ohio Indemnity at times and in amounts necessary to meet our debt service obligations or to pay dividends to our shareholders and/or corporate expenses. During 2006, the maximum amount of dividends that may be paid to Bancinsurance by Ohio Indemnity without prior approval is limited to $4,915,331.
Severe Weather Conditions and Other Catastrophes
Our property business is exposed to the risk of severe weather conditions and other catastrophes such as severe winter weather, tornadoes, windstorms, earthquakes, hail and ice storms, thunderstorms and fires, and other events such as explosions, terrorist attacks and riots. The incidence and severity of severe weather conditions and catastrophes are inherently unpredictable. Severe weather conditions and catastrophes can cause losses in all of our property lines and generally result in an increase in the number of claims incurred as well as the amount of reimbursement sought by claimants. During 2006, we were not materially impacted by severe weather. It is possible that a catastrophic event or multiple catastrophic events could have a material adverse effect on our business, financial condition and/or operating results.
Adverse Securities Market Conditions Can Impact Our Investment Portfolio
Our results of operations depend, in part, on the performance of our investments. We own fixed maturity and equity securities that are subject to:
| | • | | credit risk, which is the risk that our investments will decrease in value due to unfavorable changes in the financial prospects and/or a downgrade in the credit rating of an entity in which we have invested; |
| |
| | • | | equity price risk, which is the risk that we will incur economic loss due to a decline in share prices; and |
| |
| | • | | interest rate risk, which is the risk that our investments may decrease in value due to changes in interest rates. |
Fluctuations in interest rates affect our returns on and the fair value of fixed maturity securities. Unrealized gains and losses on fixed maturity securities are recognized in accumulated other comprehensive income, net of taxes, and increase or decrease our shareholders’ equity. An increase in interest rates could reduce the fair value of our investments in fixed maturity securities. In addition, defaults by third parties who fail to pay or perform obligations could reduce our investment income and realized investment gains and could result in investment losses in our portfolio.
Our equity portfolio is subject to economic loss from the decline in preferred and common share prices. As a result, the value of these investments will be determined by the specific financial prospects of these individual companies, as well as the equity markets in general.
Changes in Interest Rates Could Impact our Debt Securities
Our trust preferred debt and revolving line of credit are subject to interest rate risk. The interest rate on the trust preferred debt is determined based upon three month LIBOR and the interest rate on the revolving line of credit is determined based upon the prime rate. Increases in the prevailing interest rates would result in an increase to our interest expense and could have a material adverse effect on our business, financial condition and/or operating results.
Default on Debt Covenants Could Impact our Financial Condition
A default under the terms of our trust preferred debt or revolving line of credit covenants could require us to make immediate payment on our outstanding debt. Such an event could have a material adverse effect on our business, financial condition and/or operating results.
Dependence on Key Executives
Our future success will depend, in large part, upon the efforts of our executive officers and other key personnel. We rely substantially upon our executive officers and other key personnel. Our future success will also depend on our ability to attract and retain additional executives and key personnel as necessary. The loss of any of these officers or other key personnel or our inability to attract and retain qualified personnel could prevent us from implementing our business strategies.
Reliance on Information Technology and Telecommunications Systems
Our business is dependent upon the successful and uninterrupted functioning of our information technology and telecommunications systems. We rely on these systems to process new and renewal business, provide customer service, make claims payments and facilitate
11
collections and cancellations. These systems also enable us to perform actuarial and other modeling functions necessary for underwriting and rate development. The failure of these systems could disrupt our operations and materially impact our ability to write and process new and renewal business, provide customer service or pay claims in a timely manner. These factors could have a material adverse effect on our business, financial condition and/or operating results.
Controlling Interest of the Sokol Family
Si Sokol, John S. Sokol and Saul Sokol, together with their immediate family members and a trust organized for the benefit of and controlled by the Sokol family, beneficially own approximately 61% of our common shares as of December 31, 2006. As a result, the Sokol family is able to control the election of our directors, determine our corporate and management policies and determine, without the consent of our other shareholders, the outcome of many corporate transactions or other matters submitted to our shareholders for approval. The interests of the Sokol family may differ from the interests of our other shareholders in some respects.
Ongoing SEC Investigation
As previously reported, on February 14, 2005, the Company received notification from the U.S. Securities and Exchange Commission (the “SEC”) that it was conducting an informal, non-public inquiry regarding the Company. The inquiry generally concerned the chronology, events and announcements relating to Ernst & Young LLP (“E&Y”), our former independent registered public accounting firm, withdrawing its audit reports for the years 2001 through 2003 for the Company. On March 29, 2005, the Company was notified by the SEC that the informal, non-public inquiry initiated in February 2005 was converted to a formal order of private investigation. The SEC stated in its notification letter that this private investigation should not be construed as an indication by the SEC or its staff that any violation of law has occurred nor should it be considered a reflection upon any person, entity or security. The investigation is ongoing and the Company continues to cooperate fully with the SEC.
The Company cannot predict the outcome of the SEC investigation. There can be no assurance that the scope of the SEC investigation will not expand. The outcome of and costs associated with the SEC investigation could have a material adverse effect on the Company’s business, financial condition and/or operating results, and the investigation could divert the efforts and attention of management from the Company’s ordinary business operations.
Litigation
The Company is involved in various lawsuits and legal proceedings arising in the ordinary course of business, some of which involve claims for substantial amounts. We provide accruals for these items to the extent that we deem the losses probable and reasonably estimable. The outcome of litigation is subject to numerous uncertainties. As a result, the ultimate resolution of these legal proceedings could have a material adverse effect on our business, financial condition and/or operating results and could divert the efforts and attention of management from the Company’s ordinary business operations.
Automobile Service Contract Program
During 2003, the Company began issuing insurance policies which guarantee the performance of two automobile service contract providers (the “Providers”). The Providers are owned and managed by a common group. The Company issues insurance policies for business produced by the Providers in five states. Our insurance policy guarantees the fulfillment of the Providers’ obligation under the service contract. Under the program, the Providers carry the related assets and reserves and are responsible for the premiums and claims administration. The Company is obligated to pay a claim only if a Provider fails to do so. Under a reinsurance arrangement, the Company cedes 100% of this business to another insurance carrier. In addition, the Company obtained collateral in the form of a letter of credit to secure its obligations under the program. In February 2007, the Company was notified that one of the Providers entered into an assignment for the benefit of creditors liquidation and that no new business is being produced by that Provider. The Company, with the assistance of its outside actuary, has estimated its potential exposure under the program to be approximately $3.0 million as of December 31, 2006. Because our estimated potential exposure is fully collateralized by a $4.3 million letter of credit and the loss exposure is 100% reinsured, we do not believe this event will have a material adverse impact to the Company. However, if the Company is required to pay claims under the program and it is unable to draw on the letter of credit and cannot collect on the reinsurance, then this program could have a material adverse effect on our business, financial condition and/or operating results.
ITEM 2. PROPERITES
As of February 7, 2006, we leased 11,868 square feet in Columbus, Ohio for our headquarters pursuant to a lease that commenced on January 1, 2001 and expires on December 31, 2008. The lease provides for monthly rent of $13,230.
ITEM 3. LEGAL PROCEEDINGS
See Note 16 to the Consolidated Financial Statements and “Management’s Discussion and Analysis of Financial Condition and Results of Operations-Overview-Discontinued Bond Program and Overview-Ongoing SEC Investigation” for information concerning the discontinued bond program arbitrations and the SEC private investigation.
12
In October 2006, the Company commenced arbitration against E&Y, the Company’s former independent registered public accounting firm, in accordance with the terms of the engagement letter between the Company and E&Y. In the arbitration, the Company alleges that E&Y improperly withdrew the Company’s audit reports for the 2001 through 2003 fiscal years. The Company is seeking monetary damages in excess of $21 million. E&Y has counterclaimed, seeking to recover in excess of $475,000 from the Company for unpaid invoices and additional costs. No arbitration panel has yet been constituted. The Company does not believe this dispute will have a material adverse effect on our financial condition or liquidity.
In addition, the Company is involved in various other lawsuits and legal proceedings arising in the ordinary course of business, some of which involve claims for substantial amounts. We provide accruals for these items to the extent that we deem the losses probable and reasonably estimable. The outcome of litigation is subject to numerous uncertainties. While the ultimate resolution of these legal proceedings could be material to the Company’s results of operations in a future quarter or annual period, in the opinion of Company’s management, none would likely have a material adverse effect on the Company’s financial condition or liquidity.
ITEM 4. SUBMISSION OF MATTERS TO A VOTE OF SECURITY HOLDERS
No matters were submitted to a vote of security holders during the fourth quarter of the fiscal year ended December 31, 2006.
PART II
ITEM 5. MARKET FOR REGISTRANT’S COMMON SHARES, RELATED SHAREHOLDER MATTERS AND ISSUER PURCHASES OF EQUITY SECURITIES
MARKET INFORMATION
The following table sets forth (a) the high and low closing sale prices for the Company’s common shares on the Nasdaq National Market (“Nasdaq”) for the period from January 1, 2005 until February 22, 2005 and (b) the reported high and low bid quotations for the Company’s common shares in the “pink sheets” for (1) the period from February 22, 2005 until April 1, 2005 and (2) each of the quarterly periods thereafter through the fiscal years ended December 31, 2005 and 2006.
| | | | | | | | | |
| Period | | High Sale | | Low Sale |
| January 1, 2005 until February 22, 2005 | | $ | 7.44 | | | $ | 7.04 | |
| | | | | | | | | |
| Period | | High Bid | | Low Bid |
| February 22, 2005 until April 1, 2005 | | $ | 6.00 | | | $ | 4.50 | |
| Quarterly period ended June 30, 2005 | | | 5.25 | | | | 4.75 | |
| Quarterly period ended September 30, 2005 | | | 4.30 | | | | 4.00 | |
| Quarterly period ended December 31, 2005 | | | 4.50 | | | | 4.25 | |
| | | | | | | | | |
| Period | | High Bid | | Low Bid |
| Quarterly period ended March 31, 2006 | | $ | 6.60 | | | $ | 4.20 | |
| Quarterly period ended June 30, 2006 | | | 6.30 | | | | 6.00 | |
| Quarterly period ended September 30, 2006 | | | 6.14 | | | | 5.56 | |
| Quarterly period ended December 31, 2006 | | | 6.15 | | | | 5.50 | |
As previously reported, the Company’s common shares were delisted from Nasdaq at the opening of business on February 22, 2005 as a result of the Company’s failure to comply with Nasdaq Marketplace Rule 4310(c)(14) which requires Nasdaq issuers to include a properly executed independent auditor opinion in their Annual Reports on Form 10-K. To the Company’s knowledge, there has been no established trading market for the Company’s common shares since February 22, 2005. However, since that time, the Company’s common shares have been quoted in the “pink sheets” under the symbol “BCIS” on an unsolicited basis. On February 7, 2007, the last reported bid quotation for the Company’s common shares in the “pink sheets” was $5.60.
13
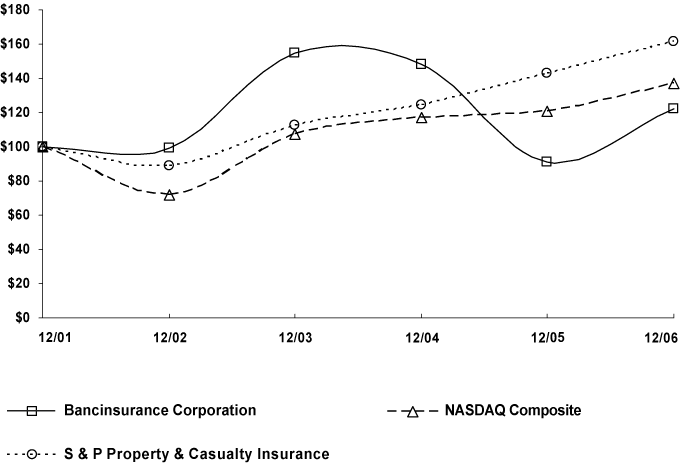
PERFORMANCE GRAPH
The indexed graph and table below sets forth the Company’s total shareholder return for the five-year period ending December 31, 2006 compared to the total return for the NASDAQ Composite Index and the Standard and Poor’s Property & Casualty Insurance Index during the same period, assuming a common starting point of $100 and reinvestment of dividends. Total return indices are weighted using beginning-period market capitalization for each of the reported time periods.
COMPARISON OF 5 YEAR CUMULATIVE TOTAL RETURN
Among Bancinsurance Corporation, The NASDAQ Composite Index
And The S & P Property & Casualty Insurance Index
| | | | | | | | | | | | | | | | | | | | | | | | | |
| | | Fiscal year ending December 31 |
| | | Cumulative Total Return |
| | | 12/01 | | 12/02 | | 12/03 | | 12/04 | | 12/05 | | 12/06 |
| | | |
| Bancinsurance Corporation | | | 100.00 | | | | 98.99 | | | | 154.95 | | | | 147.88 | | | | 90.91 | | | | 122.22 | |
| Nasdaq Composite Index | | | 100.00 | | | | 71.97 | | | | 107.18 | | | | 117.07 | | | | 120.50 | | | | 137.02 | |
| S & P Property & Casualty Insurance Index | | | 100.00 | | | | 88.98 | | | | 112.48 | | | | 124.20 | | | | 142.98 | | | | 161.38 | |
HOLDERS
The number of holders of record of the Company’s common shares as of February 7, 2007 was 634.
DIVIDENDS
The Company did not declare or pay any cash dividends on its outstanding common shares during the fiscal years ended December 31, 2006 and 2005. Any determination to pay dividends in the future will be at the discretion of the Company’s Board of Directors and will be dependent upon the Company’s results of operations and financial condition, legal and regulatory restrictions, and other factors deemed relevant at the time. For a description of the restrictions on payment of dividends to us from Ohio Indemnity, see “Business-Regulation,” “Risk Factors That May Affect Future Results,” “Management’s Discussion and Analysis of Financial Condition and Results of Operations” and Note 12 to the Consolidated Financial Statements.
14
ITEM 6. SELECTED FINANCIAL DATA
The selected consolidated financial data set forth below should be read together with the consolidated financial statements and the related notes to those statements, as well as “Management’s Discussion and Analysis of Financial Condition and Results of Operations,” appearing elsewhere in this Annual Report on Form 10-K. Results for past accounting periods are not necessarily indicative of the results to be expected for any future accounting periods.
| | | | | | | | | | | | | | | | | | | | | |
| | | 2006 | | | 2005 | | | 2004 | | | 2003 | | | 2002 | |
| |
Income Statement Data | | | | | | | | | | | | | | | | | | | | |
| Net premiums earned | | $ | 49,106,653 | | | $ | 51,716,945 | | | $ | 50,064,185 | | | $ | 50,071,966 | | | $ | 42,590,321 | |
| Net investment income | | | 3,845,064 | | | | 3,302,659 | | | | 2,164,115 | | | | 1,599,064 | | | | 1,236,138 | |
| Net realized gains (losses) on investments | | | 55,719 | | | | 1,281,755 | | | | 1,094,174 | | | | 822,161 | | | | (1,220,477 | ) |
| Codification and subscription fees | | | 2,255,558 | | | | 3,474,668 | | | | 4,005,415 | | | | 3,819,221 | | | | 3,324,037 | |
| Management fees | | | 830,329 | | | | 713,697 | | | | 33,710 | | | | 114,094 | | | | 749,442 | |
| Net realized gain on sale of affiliate | | | 2,511,891 | | | | — | | | | — | | | | — | | | | — | |
| Other income | | | 81,428 | | | | 146,786 | | | | 43,123 | | | | 81,653 | | | | 197,278 | |
| Total revenues | | | 58,686,642 | | | | 60,636,510 | | | | 57,404,722 | | | | 56,508,159 | | | | 46,876,739 | |
| Cumulative effect of change in accounting principle | | | — | | | | — | | | | — | | | | — | | | | (1,481,858 | ) |
| Net income (loss) | | | 5,474,901 | | | | 6,294,074 | | | | (8,500,620 | ) | | | 3,909,817 | | | | 889,613 | |
| | | | | | | | | | | | | | | | | | | | | |
Balance Sheet Data at Year End | | | | | | | | | | | | | | | | | | | | |
| Total cash and investments | | $ | 93,580,824 | | | $ | 100,085,781 | | | $ | 86,580,595 | | | $ | 76,929,462 | | | $ | 57,293,361 | |
| Total assets | | | 122,288,506 | | | | 128,335,835 | | | | 117,060,472 | | | | 115,869,736 | | | | 72,703,204 | |
| Notes payable | | | — | | | | 27,119 | | | | 540,198 | | | | 53,276 | | | | 2,166,355 | |
| Trust preferred debt issued to affiliates | | | 15,465,000 | | | | 15,465,000 | | | | 15,465,000 | | | | 15,465,000 | | | | 8,248,000 | |
| Shareholders’ equity | | | 36,365,619 | | | | 30,079,626 | | | | 24,846,288 | | | | 33,365,028 | | | | 28,901,838 | |
| Common shares outstanding | | | 4,980,700 | | | | 4,972,700 | | | | 4,972,700 | | | | 4,920,050 | | | | 5,000,291 | |
| | | | | | | | | | | | | | | | | | | | | |
Per Common Share Data | | | | | | | | | | | | | | | | | | | | |
| Diluted income (loss) before cumulative effect of change in accounting principle | | $ | 1.08 | | | $ | 1.26 | | | $ | (1.72 | ) | | $ | .77 | | | $ | .41 | |
| Diluted net income (loss) | | | 1.08 | | | | 1.26 | | | | (1.72 | ) | | | .77 | | | | .16 | |
| Year-end book value | | | 7.30 | | | | 6.05 | | | | 5.00 | | | | 6.78 | | | | 5.78 | |
| | | | | | | | | | | | | | | | | | | | | |
GAAP Ratios | | | | | | | | | | | | | | | | | | | | |
| Loss ratio | | | 53.2 | % | | | 45.8 | % | | | 95.1 | % | | | 66.1 | % | | | 67.0 | % |
| Expense ratio | | | 44.7 | % | | | 47.8 | % | | | 34.6 | % | | | 26.0 | % | | | 24.4 | % |
| Combined ratio | | | 97.9 | % | | | 93.6 | % | | | 129.7 | % | | | 92.1 | % | | | 91.4 | % |
| | | | | | | | | | | | | | | | | | | | | |
Statutory Ratios | | | | | | | | | | | | | | | | | | | | |
| Loss ratio | | | 53.2 | % | | | 45.8 | % | | | 95.1 | % | | | 66.1 | % | | | 67.0 | % |
| Expense ratio | | | 43.3 | % | | | 50.9 | % | | | 33.3 | % | | | 25.9 | % | | | 25.0 | % |
| Combined ratio | | | 96.5 | % | | | 96.7 | % | | | 128.4 | % | | | 92.0 | % | | | 92.0 | % |
| Net premiums written to statutory surplus | | | 1.2 | x | | | 1.5 | x | | | 1.9 | x | | | 1.6 | x | | | 1.4 | x |
15
ITEM 7. MANAGEMENT’S DISCUSSION AND ANALYSIS OF FINANCIAL CONDITION AND RESULTS OF OPERATIONS
OVERVIEW
Bancinsurance is a specialty property insurance holding company incorporated in the State of Ohio in 1970. The Company has two reportable business segments: (1) property/casualty insurance; and (2) insurance agency. Until August 31, 2006, the Company also had a municipal code publishing business segment. On August 31, 2006, the Company sold its municipal code publishing segment as more fully described in “Overview-Sale of Affiliate” below and in Note 1 to the Consolidated Financial Statements. These segments are described in more detail below.
Products and Services
Property/Casualty Insurance. Our wholly-owned subsidiary, Ohio Indemnity Company (“Ohio Indemnity”), is a specialty property/casualty insurance company. Our principal sources of revenue are premiums for insurance policies and income generated from our investment portfolio. Ohio Indemnity, an Ohio corporation, is licensed in 48 states and the District of Columbia. As such, Ohio Indemnity is subject to the regulations of The Ohio Department of Insurance (the “Department”) and the regulations of each state in which it operates. The majority of Ohio Indemnity’s premiums are derived from three distinct product lines: (1) automobile lender/dealer; (2) unemployment compensation; and (3) waste industry.
Our automobile lender/dealer product line offers three types of products. First, ULTIMATE LOSS INSURANCE® (“ULI”), a blanket vendor single interest coverage, is the primary product we offer to financial institutions nationwide. This product insures banks and financial institutions against damage to pledged collateral in cases where the collateral is not otherwise insured. A ULI policy is generally written to cover a lender’s complete portfolio of collateralized personal property loans, typically automobile loans. Second, creditor placed insurance (“CPI”) is an alternative to our traditional blanket vendor single interest product. While both products cover the risk of damage to uninsured collateral in a lender’s automobile loan portfolio, CPI covers the portfolio through tracking individual borrowers’ insurance coverage. The lender purchases physical damage coverage for loan collateral after a borrower’s insurance has lapsed. Third, our guaranteed auto protection insurance (“GAP”) pays the difference or “gap” between the amount owed by the customer on a loan or lease and the amount of primary insurance company coverage in the event a vehicle is damaged beyond repair or stolen and never recovered. Our GAP product is sold to auto dealers, lenders and lessors and provides coverage on either an individual or portfolio basis.
Our unemployment compensation (“UC”) products are utilized by qualified entities that elect not to pay the unemployment compensation taxes and instead reimburse state unemployment agencies for benefits paid by the agencies to the entities’ former employees. Through our UCassure® and excess of loss products, we indemnify the qualified entity for liability associated with its reimbursing obligations. In addition, we underwrite surety bonds that certain states require employers to post in order to obtain reimbursing status for their unemployment compensation obligations. Our bonded service program was discontinued at the end of 2003 and replaced by our UCassure® program.
Our waste industry products (“WIP”) consist of certain surety bonds produced and administered by a general insurance agent. Under this program, the Company both assumes and cedes certain waste surety bond business under two quota share reinsurance arrangements. In the second quarter of 2004, the Company entered into a 50% quota share reinsurance arrangement whereby the Company assumed 50% of all waste surety bonds with liability limits up to $4.0 million from two insurance carriers. Effective January 1, 2005, the reinsurance arrangement was amended whereby the Company’s assumed participation was reduced from 50% to 25%. Effective August 1, 2006, the reinsurance arrangement was further amended whereby the Company assumed 50% of all waste surety bonds with liability limits up to $1.2 million. In addition to assuming business, the Company also writes on a direct basis waste surety bonds with liability limits up to our Treasury limit ($3.6 million during 2006). The Company then cedes 50% of that business to an insurance carrier under a reinsurance arrangement. All surety bonds written directly and assumed under this program are produced and administered by a general insurance agent that is affiliated with one of the insurance carriers participating in the program. The majority of the surety bonds under the program satisfy the closure/post-closure financial responsibility obligations imposed on hazardous and solid waste treatment, storage and disposal facilities pursuant to Subtitles C and D of the Federal Resource Conservation and Recovery Act (“RCRA”). Closure/post-closure bonds cover future costs to close and monitor a regulated site such as a landfill. All of the surety bonds are indemnified by the principal and collateral is maintained on the majority of the bonds. The indemnifications and collateralization of this program reduces the risk of loss.
The Company has certain other specialty products which consist primarily of service contracts and other surety products. In addition, from 2001 until the end of the second quarter of 2004, the Company participated in a bail and immigration bond program. This program was discontinued in the second quarter of 2004. For a more detailed description of this program, see “Overview-Discontinued Bond Program” below and Note 16 to the Consolidated Financial Statements.
16
The Company sells its insurance products through multiple distribution channels, including three managing general agents, approximately thirty five independent agents and direct sales.
Municipal Code Publishing. On August 31, 2006, the Company sold its wholly-owned subsidiary, American Legal Publishing Corporation (“ALPC”), which codifies, publishes, supplements and distributes ordinances for municipalities and counties nationwide in addition to state governments. Ordinance codification is the process of collecting, organizing and publishing legislation for state and local governments. ALPC also provides information management services which includes electronic publishing, document imaging and internet hosting services. See “Overview-Sale of Affiliate” below and Note 1 to the Consolidated Financial Statements for more information concerning this transaction.
Insurance Agency. In July 2002, we formed Ultimate Services Agency, LLC (“USA”), a wholly-owned subsidiary. We formed USA to act as an agency for placing and servicing property/casualty insurance policies offered and underwritten by Ohio Indemnity and by other property/casualty insurance companies.
Sale of Affiliate
On August 31, 2006, the Company entered into a Stock Purchase Agreement (the “Agreement”) with A.L.P. Acquisition Co., Inc., an Ohio corporation (the “Purchaser”), whereby the Company sold 100% of the issued and outstanding common shares of ALPC to the Purchaser for $4,620,000 subject to customary post-closing adjustments (the “Sale”). The Company received cash of $4,150,000 and a promissory note in the principal amount of $470,000 (the “Promissory Note”) from the Purchaser at the closing in connection with the Sale. On September 1, 2006, the Purchaser made a principal payment to the Company on the Promissory Note in the amount of $345,000, bringing the remaining principal balance of the Promissory Note to $125,000 which is to be repaid in six monthly installments and bears interest at an annual rate of 8.0%. As of December 31, 2006, the principal balance of the promissory note was $62,500.
The Purchaser was organized by Steven G. Wolf, who has served as President of ALPC since 1984 and as a director of ALPC since 2000. Mr. Wolf and certain other employees of ALPC collectively own a significant equity interest in the Purchaser.
In conjunction with the Sale, on August 31, 2006, the Company also made an investment (the “Investment”) in the Purchaser in the amount of $250,000, consisting of (1) a $137,500 cash purchase of equity securities of the Purchaser and (2) a $112,500 loan to the Purchaser in the form of a subordinated convertible promissory note (the “Convertible Note”). The Convertible Note is to be repaid on August 31, 2016 (if not previously converted), bears interest at an annual rate of 8.0% and is convertible at any time at the option of the Company into additional equity securities of the Purchaser.
In connection with the Sale and the Investment, the Company recorded a net realized gain of approximately $2.5 million ($1.7 million after tax) for the period ended December 31, 2006.
Discontinued Bond Program
Beginning in 2001 and continuing into the second quarter of 2004, the Company participated as a reinsurer in a program covering bail and immigration bonds issued by four insurance carriers and produced by a bail bond agency (collectively, the “discontinued bond program” or the “program”). The liability of the insurance carriers was reinsured to a group of reinsurers, including the Company. The Company assumed 15% of the business from 2001 through 2003 and 5% of the business during the first half of 2004. This program was discontinued in the second quarter of 2004.
Based on the design of the program, the bail bond agency was to obtain and maintain collateral and other security and to provide funding for bond losses. The bail bond agency and its principals were responsible for all losses as part of their program administration. The insurance carriers and, in turn, the reinsurers were not required to pay losses unless there was a failure of the bail bond agency. As the bonds were to be 100% collateralized, any losses paid by the reinsurers were to be recoverable through liquidation of the collateral and collections from third party indemnitors.
In the second quarter of 2004, the Company came to believe that the discontinued bond program was not being operated as it had been represented to the Company by agents of the insurance carriers who had solicited the Company’s participation in the program, and the Company began disputing certain issues with respect to the program, including but not limited to: 1) inaccurate/incomplete disclosures relating to the program; 2) improper supervision by the insurance carriers of the bail bond agency in administering the program; 3) improper disclosures by the insurance carriers through the bail bond agency and the reinsurance intermediaries during life of the program; and 4) improper premium and claims administration. Consequently, during the second quarter of 2004, the Company ceased paying claims on the program and retained outside legal counsel to review and defend its rights under the program.
Pending Arbitration. During 2004 and 2005, the Company entered into arbitrations with all four insurance carriers that participated in the
17
discontinued bond program. As discussed below, during 2006, arbitrations with three of the insurance carriers concluded. The following is a description of the last pending arbitration proceeding as of December 31, 2006:
Highlands Arbitration. Highlands Insurance Company (“Highlands”), one of the insurance carriers, was placed in receivership during 2003 (which receivership remains pending). On August 31, 2005, Highlands’ Receiver demanded arbitration against the Company and other reinsurers, including The Philadelphia Contributionship for the Insurance of Houses from Loss by Fire, American Healthcare Insurance Company and various Lloyds Syndicates. In November 2005, the Company responded to this demand by seeking rescission of the reinsurance agreement, monetary damages for claims that were paid by the Company under the agreement and other appropriate relief. Highlands is seeking to recover certain of its losses from the Company under the reinsurance agreement. No arbitration panel has yet been constituted.
Arbitration Developments as of December 31, 2006.
Aegis Arbitration. During 2004, the Company entered into an arbitration proceeding with Aegis Security Insurance Company (“Aegis”), one of the insurance carriers. Through this arbitration, the Company was seeking rescission of the reinsurance agreements, monetary damages for the claims that were paid by the Company under the agreements and other appropriate relief. Aegis was seeking to recover certain of its losses from the Company under the reinsurance agreements. On January 18, 2006, the Company entered into a settlement agreement with Aegis resolving all disputes between the Company and Aegis relating to the discontinued bond program. The settlement also relieved the Company from any potential future liabilities with respect to bonds issued by Aegis. As a result of this settlement agreement, the Company recorded reserve redundancies of approximately $0.2 million during 2006.
Sirius Arbitration.During 2004, the Company entered into an arbitration proceeding with Sirius America Insurance Company (“Sirius”), one of the insurance carriers. Through this arbitration, the Company was seeking rescission of the reinsurance agreement, monetary damages for claims that were paid by the Company under the agreement and other appropriate relief. Sirius was seeking to recover certain of its losses from the Company under the reinsurance agreement. On July 26, 2006, the Company entered into a settlement agreement with Sirius resolving all disputes between the Company and Sirius relating to the discontinued bond program. The settlement also relieved the Company from any potential future liabilities with respect to bonds issued by Sirius. As a result of this settlement agreement, the Company recorded reserve deficiencies of approximately $0.1 million during 2006.
Harco Arbitration.During 2004, the Company entered into an arbitration proceeding with Harco National Insurance Company (“Harco”), one of the insurance carriers. Through this arbitration, the Company was seeking rescission of the reinsurance agreement and other appropriate relief. Harco was seeking to recover certain of its losses from the Company under the reinsurance agreement. The arbitration hearing concluded in July 2006. In August 2006, the arbitration panel issued its Final Decision and Order ordering each of the reinsurers participating in the arbitration, including the Company, to pay its proportionate share of past and future claims paid by Harco, subject to certain adjustments, offsets and credits (the “Final Order”). Based on the Final Order and the most recent loss reports provided by Harco, the Company recorded reserve deficiencies of approximately $2.0 million and return premiums of approximately $0.3 million during 2006.
Highlands Development.During the third quarter of 2006, the Company received information indicating that Highlands and the U.S. Department of Homeland Security (“DHS”) reached a global settlement concerning Highlands’ immigration bond obligations, which settlement is subject to the approval of the court in which the receivership is pending. Based on this information, the Company recorded reserve redundancies of approximately $0.1 million during 2006.
Loss and LAE Reserves. As of December 31, 2006, the Company recorded its loss and LAE reserves for the discontinued bond program based primarily on loss reports received by the Company from Harco and Highlands. The following compares our loss and LAE reserves for the discontinued bond program at December 31, 2006 and December 31, 2005 (dollars in millions):
| | | | | | | | | |
| | | December 31, | | | December 31, | |
| | 2006 | | | 2005 | |
| Bail Bonds: | | | | | | | | |
| Case reserves | | $ | 0.9 | | | $ | 12.1 | |
| Incurred but not reported (“IBNR”) reserves | | | 4.2 | | | | 5.4 | |
| | | | | | | |
| Total bail bond reserves | | | 5.1 | | | | 17.5 | |
| | | | | | | |
| Immigration Bonds: | | | | | | | | |
| Case reserves | | | 0.1 | | | | 0.7 | |
| IBNR reserves | | | 1.2 | | | | 1.4 | |
| | | | | | | |
| Total immigration bond reserves | | | 1.3 | | | | 2.1 | |
| | | | | | | |
| Total loss and LAE reserves | | $ | 6.4 | | | $ | 19.6 | |
| | | | | | | |
18
The decrease in loss and LAE reserves from $19.6 million at December 31, 2005 to $6.4 million at December 31, 2006 was primarily due to loss payments made by the Company during 2006 in connection with the Aegis and Sirius settlements and the Harco Final Order.
Discontinued bond program losses and LAE were $1.8 million, $0.4 and $20.2 million during the years ended December 31, 2006, 2005 and 2004, respectively. The 2006 loss of $1.8 million was primarily attributable to the Harco Final Order combined with our increase in Harco’s reported losses. The $0.4 million loss recorded during 2005 was primarily attributable to an increase in reported losses from Harco which was partially offset by a decrease in losses for Aegis due to a favorable ruling by the Aegis arbitration panel.
We believe there is potential for the Company to mitigate its ultimate liability to Highlands through the arbitration proceeding with Highlands; however, because of the subjective nature inherent in assessing the final outcome of this arbitration, management cannot estimate the probability of an adverse or favorable outcome as of December 31, 2006. In addition, while outside counsel believes we have legal defenses under the reinsurance agreement, they are unable to assess whether an adverse outcome is probable or remote in the arbitration as of December 31, 2006. In accordance with SFAS No. 5 “Accounting for Contingencies,” the Company is reserving to its best estimate of the ultimate liability on the program at December 31, 2006 without any adjustment for positive arbitration outcome or a potential settlement amount with Highlands. If the Company obtains information to determine an estimate of a final arbitration value or estimate a settlement value, the Company will record changes in its reserves, if any, in the period that an estimate is made in accordance with SFAS No. 60. The Company does not intend to pay for any of the Highlands losses unless and until the arbitration is settled on a mutually agreeable basis and/or a final binding judgment is made as to the Company’s ultimate liability.
Given the uncertainties of the outcome of the Highlands arbitration, uncertainties in the future loss information provided by Harco and Highlands, and the inherent volatility in assumed reinsurance, actual losses incurred for the discontinued bond program could be materially different from our estimated reserves. As a result, future loss development on the discontinued bond program could have a material effect on the Company’s results of operations and/or financial condition.
Recently Issued Accounting Standards
In June 2006, the Financial Accounting Standards Board (“FASB”) issued Interpretation No. 48 (“FIN 48”), “Accounting for Uncertainty in Income Taxes,” which prescribes a recognition threshold and measurement attribute for the financial statement recognition and measurement of a tax position taken or expected to be taken in a tax return. In accordance with FIN 48, the Company must adjust its financial statements to reflect only those tax positions that are more-likely-than-not to be sustained as of the adoption date. The effective date of FIN 48 for the Company is January 1, 2007. The adoption of FIN 48 is not expected to have a material impact on the Company’s Consolidated Financial Statements.
In September 2006, the FASB issued Statement of Financial Accounting Standards (“SFAS”) No. 157, “Fair Value Measurements.” This Statement defines fair value, establishes a framework for measuring fair value in accordance with GAAP, and expands disclosures about fair value measurements. The Statement clarifies the rule that fair value be based on the assumptions that market participants would use when pricing an asset or liability, and establishes a fair value hierarchy that prioritizes the framework and information used to develop those assumptions. The Company is required to adopt the provisions of SFAS No. 157 for financial statements issued for fiscal years beginning after November 15, 2007. The adoption of SFAS No. 157 is not expected to have a material impact on the Company’s Consolidated Financial Statements.
Reinsurance Transactions
Effective January 1, 2003, the Company entered into a producer-owned reinsurance arrangement with a new lender/dealer producer whereby 100% of that producer’s premiums (along with the associated risk) was ceded to its PORC. This reinsurance arrangement was cancelled effective December 31, 2003. For this reinsurance arrangement, the Company has obtained collateral in the form of a letter of credit from the reinsurer to secure its obligations. Under the provisions of the reinsurance agreement, the collateral must be equal to or greater than 102% of the reinsured reserves and the Company has immediate access to such collateral if necessary. Under this arrangement, the Company ceded premiums earned of $67,969, $115,790 and $4,435,659 for the years ended December 31, 2006, 2005 and 2004, respectively.
Effective October 1, 2003, the Company entered into a producer-owned reinsurance arrangement with an existing lender/dealer customer whereby 100% of that customer’s premiums (along with the associated risk) was ceded to its PORC. For this reinsurance arrangement, the Company has obtained collateral in the form of a trust from the reinsurer to secure its obligations. Under the provisions of the reinsurance agreement, the collateral must be equal to or greater than 102% of the reinsured reserves and the Company has immediate access to such collateral if necessary. Under this arrangement, the Company ceded premiums earned of $2,266,090, $1,727,303 and $894,717 for the years ended December 31, 2006, 2005 and 2004, respectively.
19
Beginning in the second quarter of 2004, the Company entered into a quota share reinsurance arrangement with certain insurance carriers whereby the Company assumed and ceded 50% of certain waste surety bond business. Effective January 1, 2005, the reinsurance arrangement was amended whereby the Company’s assumed participation was reduced from 50% to 25%. Effective August 1, 2006, the reinsurance arrangement was further amended whereby the Company’s assumed participation was increased from 25% to 50%. Under this program, the Company assumed premiums earned of $3,283,690, $4,302,509 and $1,980,492 during 2006, 2005 and 2004, respectively. Also, the Company ceded premiums earned of $1,235,624, $679,563 and $131,051 for the years ended December 31, 2006, 2005, and 2004, respectively.
Effective January 1, 2005, the Company entered into a producer-owned reinsurance arrangement with a guaranteed auto protection insurance agent whereby 100% of that agent’s premiums (along with the associated risk) were ceded to its PORC. For this reinsurance arrangement, the Company has obtained collateral in the form of a letter of credit to secure its obligations. Under the provisions of the reinsurance agreement, the collateral must be equal to or greater than 102% of the reinsured reserves and the Company has immediate access to such collateral if necessary. Under this arrangement, the Company ceded premiums earned of $1,987,640, $734,435 and $0 for the years ended December 31, 2006, 2005 and 2004, respectively.
In addition to the above, the Company has other reinsurance arrangements including two automobile lender/dealer PORC quota share arrangements, several quota share arrangements for certain contract and escrow surety bond business and a reinsurance arrangement for a vehicle service contract program. Under these arrangements, the Company ceded premiums earned of $708,430, $927,455 and $1,113,639 for the years ended December 31, 2006, 2005 and 2004, respectively. Also, the Company assumed premiums earned of $60,535, $0 and $0 for the years ended December 31, 2006, 2005 and 2004, respectively.
See “Overview-Discontinued Bond Program” above and Note 16 to the Consolidated Financial Statements for a description of the Company’s discontinued bond program.
See Note 16 to the Consolidated Financial Statements for additional information regarding the Company’s reinsurance.
SUMMARY RESULTS
The following table sets forth period-to-period changes in selected financial data:
| | | | | | | | | | | | | | | | | |
| | | Period-to-Period Increase (Decrease) |
| | | Years ended December 31, |
| | | 2005-2006 | | 2004-2005 |
| | | Amount | | % Change | | Amount | % Change |
| Net premiums earned | | $ | (2,610,292 | ) | | | (5.0 | )% | | $ | 1,652,760 | | | | 3.3 | % |
| Net realized gains (losses) on investments | | | (1,226,036 | ) | | | (95.7 | )% | | | 187,581 | | | | 17.1 | % |
| Net realized gain on sale of affiliate | | | 2,511,891 | | | | 100.0 | % | | | — | | | | — | |
| Total revenues | | | (1,949,868 | ) | | | (3.2 | )% | | | 3,231,788 | | | | 5.6 | % |
| Losses and LAE | | | 2,238,623 | | | | 9.6 | % | | | (23,901,695 | ) | | | (50.6 | )% |
| Commissions, other insurance expenses, and general and administrative expenses | | | (2,245,089 | ) | | | (8.9 | )% | | | 6,932,467 | | | | 38.0 | % |
| Income before federal income taxes | | | (1,346,809 | ) | | | (16.5 | )% | | | 21,438,697 | | | | 161.6 | % |
| Net income | | | (819,173 | ) | | | (13.0 | )% | | | 14,794,694 | | | | 174.0 | % |
Net income for 2006 was $5,474,901, or $1.08 per diluted share, compared to $6,294,074, or $1.26 per diluted share, in 2005. The decrease was primarily attributable to an increase in losses and LAE for the discontinued bond program and an increase in losses and LAE due to favorable loss development in 2005. These losses were partially offset by the $2.5 million net realized gain on the sale of ALPC during 2006. See “Overview — Discontinued Bond Program” above and Note 16 to the Consolidated Financial Statements for additional information concerning the discontinued bond program. See “Overview-Sale of Affiliate” above and Note 1 to the Consolidated Financial Statements for additional information concerning the sale of ALPC.
Net income (loss) for 2005 was $6,294,074, or $1.26 per diluted share, compared to $(8,500,620), or $(1.72) per diluted share, in 2004. The most significant factor contributing to the increase in net income was a decrease in losses and LAE of approximately $19.7 million for the discontinued bond program. In addition, the Company benefited from an increase in profitability for its CPI, GAP, UC and WIP product lines and an increase in investment income when compared to 2004. These positive factors were partially offset by an increase in legal, auditing and federal income tax expenses incurred during 2005 when compared to 2004.
The combined ratio, which is the sum of the loss ratio and the expense ratio, is the traditional measure of underwriting experience for property/casualty insurance companies. The Company’s specialty insurance products are underwritten by Ohio Indemnity, whose results represent the Company’s combined ratio. The statutory combined ratio is the sum of the ratio of losses to premiums earned plus the ratio
20
of statutory underwriting expenses less management fees to premiums written after reducing both premium amounts by dividends to policyholders. Statutory accounting principles differ in certain respects from GAAP. Under statutory accounting principles, policy acquisition costs and other underwriting expenses are recognized immediately, not at the same time premiums are earned. To convert underwriting expenses to a GAAP basis, policy acquisition costs are deferred and recognized over the period in which the related premiums are earned. Therefore, the GAAP combined ratio is the sum of the ratio of losses to premiums earned plus the ratio of underwriting expenses less management fees to premiums earned. The following table reflects Ohio Indemnity’s loss, expense and combined ratios on both a statutory and a GAAP basis for the years ended:
| | | | | | | | | | | | | |
| | | 2006 | | 2005 | | 2004 |
| GAAP: | | | | | | | | | | | | |
| Loss ratio | | | 53.2 | % | | | 45.8 | % | | | 95.1 | % |
| Expense ratio | | | 44.7 | % | | | 47.8 | % | | | 34.6 | % |
| | | | | | | | | | | | | |
| Combined ratio | | | 97.9 | % | | | 93.6 | % | | | 129.7 | % |
| | | | | | | | | | | | | |
| Statutory: | | | | | | | | | | | | |
| Loss ratio | | | 53.2 | % | | | 45.8 | % | | | 95.1 | % |
| Expense ratio | | | 43.3 | % | | | 50.9 | % | | | 33.3 | % |
| | | | | | | | | | | | | |
| Combined ratio | | | 96.5 | % | | | 96.7 | % | | | 128.4 | % |
| | | | | | | | | | | | | |
RESULTS OF OPERATIONS
2006 Compared to 2005
Net Premiums Earned. Net premiums earned decreased 5.0%, or $2,610,292, to $49,106,653 in 2006 from $51,716,945 the prior year due to a decline in premiums for ULI, CPI, WIP and the discontinued bond program which were partially offset by growth in our GAP and UC product lines.
ULI net premiums earned decreased 10.5%, or $3,056,573, to $26,017,984 in 2006 from $29,074,557 in 2005. ULI premiums decreased due primarily to a general agent transferring half of its production to other insurance carriers in the second half of 2005 (the “Transferred Business”), combined with lower lending volumes for certain financial institution customers and the cancellation of a ULI customer at the end of second quarter 2006.
Net premiums earned for CPI decreased 29.6%, or $683,650, to $1,623,494 in 2006 from $2,307,144 in 2005 primarily due to a decline in volume for certain financial institution customers.
Net premiums earned for GAP grew 15.3%, or $1,488,113, to $11,240,520 in 2006 from $9,752,407 in 2005. This growth was primarily due to rate and volume increases with existing customers.
Net premiums earned for UC products increased 2.3%, or 128,739, to $5,697,627 in 2006 from $5,568,888 in 2005 primarily due to an increase in volume for our excess of loss product.
Net premiums earned for WIP declined 6.9%, or $333,998, to $4,505,250 in 2006 from $4,839,248 in 2005, due primarily to the general insurance agent changing its distribution of business with the insurance carriers participating in this program.
Discontinued bond program net premiums earned declined $145,317 in 2006 compared to a year ago due to the discontinuation of this program in the second quarter of 2004. See “Overview-Discontinued Bond Program” above and Note 16 to the Consolidated Financial Statements for additional information concerning the discontinued bond program.
Investment Income. We seek to invest in investment-grade obligations of states and political subdivisions because the majority of the interest income from such investments is tax-exempt and such investments have generally resulted in more favorable net yields. Net investment income increased 16.4%, or $542,405, to $3,845,064 in 2006 from $3,302,659 a year ago. This improvement was primarily due to growth in average investments in 2006 compared to 2005 combined with higher yields.
Net realized gains on investments decreased 95.7%, or $1,226,036, to $55,719 in 2006 from $1,281,755 a year ago due to the timing of sales of equity securities. We generally decide whether to sell securities based upon investment opportunities and tax consequences. We regularly evaluate the quality of our investment portfolio. When we believe that a specific security has suffered an other-than-temporary decline in value, the difference between cost and estimated fair value is charged to income as a realized loss on investments. Impairment
21
charges included in net realized gains on investments were $7,310 in 2006 compared to zero a year ago. For more information concerning impairment charges, see “Critical Accounting Policies-Other-Than-Temporary Impairment of Investments” below.
Codification and Subscription Fees. ALPC’s codification and subscription fees decreased 35.1%, or $1,219,110, to $2,255,558 in 2006 from $3,474,668 in 2005. The decrease was primarily due to the sale of ALPC on August 31, 2006 (8 months in 2006 compared to 12 months in 2005). See Overview-Sale of Affiliate” above and Note 1 to the Consolidated Financial Statements for more information concerning this transaction.
Management Fees. Pursuant to the terms of certain surety bonds issued by the Company that guarantee the payment of reimbursable unemployment compensation benefits, certain monies are held by the Company in contract funds on deposit and are used for the payment of benefit charges. The Company has agreements with cost containment service firms designed to control the unemployment compensation costs of the employers enrolled in the program. Any remaining funds after the payment of all benefit charges are shared between the Company and the cost containment firms as management fees. Management fees are recognized when earned based on the development of benefit charges. Our management fees increased 16.3%, or $116,632, to $830,329 in 2006 from $713,697 a year ago as a result of favorable unemployment experience and pricing actions. We expect management fees to vary from period to period depending on unemployment levels and benefit charges.
Net Realized Gain on Sale of Affiliate. In connection with the sale of ALPC, the Company recorded a net realized gain of approximately $2.5 million ($1.7 million after tax or $0.33 per diluted share) during 2006. See “Overview-Sale of Affiliate” above and Note 1 to the Consolidated Financial Statements for more information concerning this transaction.
Losses and Loss Adjustment Expenses. Losses and LAE represent claims associated with insured loss events and expenses associated with adjusting and recording policy claims, respectively. Losses and LAE increased 9.6%, or $2,238,623, to $25,574,243 in 2006 from $23,335,620 a year ago primarily due to an increase in losses and LAE of $1,344,763 for the discontinued bond program. See “Overview-Discontinued Bond Program” above and Note 16 to the Consolidated Financial Statements for additional information concerning the discontinued bond program. Excluding the discontinued bond program, losses and LAE increased 3.9%, or $893,860, to $23,806,747 in 2006 from $22,912,887 a year ago primarily due to an increase in losses and LAE for our ULI and GAP business, which was partially offset by a decrease in losses and LAE for our CPI, UC and WIP business.
ULI losses and LAE increased 7.6%, or $1,189,422, to $16,874,524 in 2006 from $15,685,102 a year ago. The increase was due primarily to favorable loss development during 2005 as a result of fewer loan defaults, bankruptcies and automobile repossessions among our ULI customers.
CPI losses and LAE decreased 32.8%, or $262,098, to $536,367 in 2006 from $798,465 a year ago which is consistent with the decline in business.
GAP losses and LAE increased 5.8%, or $294,848, to $5,383,325 in 2006 from $5,088,477 a year ago principally due to growth in the business.
Losses and LAE for our UC products decreased 35.9%, or $305,110, to $545,295 in 2006 from $850,405 a year ago primarily due to a decrease in losses for the bonded service program which was cancelled at the end of 2003.
WIP losses and LAE decreased 7.0%, or $34,028, to $449,897 in 2006 from $483,925 a year ago. This decrease is consistent with the decrease in net premiums earned as the Company records loss and LAE reserves for WIP using an expected loss ratio reserving method, which is based on a certain percentage of net premiums earned.
For more information concerning losses and LAE, see “Critical Accounting Policies-Loss and Loss Adjustment Expense Reserves” below.
Commissions, Other Insurance Operating Expenses and General and Administrative Expenses. Commission expense decreased 12.4%, or $1,709,942, to $12,041,054 in 2006 from $13,750,996 in 2005 primarily due to the decline in ULI commissions associated with the Transferred Business. Other insurance operating expenses and general and administrative expenses combined decreased 4.7%, or $535,147, to $10,882,039 in 2006 from $11,417,186 a year ago primarily due to a decrease in audit and legal expenses associated with the withdrawal by the Company’s former independent registered public accounting firm in 2005 combined with a decrease in legal expenses associated with the discontinued bond program arbitrations. These decreases were partially offset by an increase in compensation expense and an increase in reserves for contingent liabilities.
Codification and Subscription Expenses. Codification and subscription expenses incurred by ALPC decreased 31.1%, or $873,316, to
22
$1,936,384 in 2006 from $2,809,700 a year ago, as the Company sold APLC on August 31, 2006 (8 months in 2006 compared to 12 months in 2005). See “Overview-Sale of Affiliate” above and Note 1 to the Consolidated Financial statements for more information concerning this transaction.
Interest Expense. Interest expense increased 24.0%, or $276,723, to $1,429,086 in 2006 from $1,152,363 a year ago as a result of rising interest rates. See “Liquidity and Capital Resources” for discussion of the Company’s trust preferred debt issued to affiliates, which makes up the majority of the Company’s interest expense.
Federal Income Taxes. The Company’s effective income tax rate was 19.8% and 23.0% for 2006 and 2005, respectively. This improvement is attributable to the ratio of tax-exempt income when compared to income from operations for each year.
GAAP Combined Ratio. For 2006, the combined ratio increased to 97.9% from 93.6% a year ago. The loss ratio increased to 53.2% in 2006 from 45.8% a year ago partly due to an increase in losses and LAE for the discontinued bond program. Excluding the discontinued bond program, the Company’s loss ratio was 49.6% in 2006 compared to 45.0% a year ago. This increase was primarily attributable to prior year favorable loss development for our ULI product line. The expense ratio improved to 44.7% in 2006 from 47.8% a year ago primarily due to the decrease in ULI commissions associated with the Transferred Business.
2005 Compared to 2004
Net Premiums Earned. Net premiums earned increased 3.3%, or $1,652,760, to $51,716,945 in 2005 from $50,064,185 in 2004. Net premiums earned benefited from growth in our CPI, GAP, UC and WIP product lines, which was partially offset by premium decreases in ULI and the discontinued bond program.
ULI net premiums earned decreased 15.6%, or $5,373,145, to $29,074,557 in 2005 from $34,447,702 in 2004. The decline was due to decreased lending volume for certain of our financial institution customers, a decrease from the Transferred Business and an increase in experience rating adjustments. The experience rating adjustment is primarily influenced by ULI policy experience-to-date and premium growth. A decrease in experience rating adjustments results in a positive impact to net premiums earned whereas an increase in experience rating adjustments results in a decrease to net premiums earned. Experience rating adjustments increased for 2005 when compared to 2004 primarily due to favorable loss experience for the ULI product line. Management anticipates that experience rating adjustments will fluctuate in future periods based upon loss experience and premium growth. These decreases in ULI net premiums earned were partially offset by an increase in lending volume by several of our other financial institution customers.
Net premiums earned for CPI increased 11.8%, or $243,304, to $2,307,144 in 2005 from $2,063,840 in 2004 principally due to new customers added.
Net premiums earned for GAP grew 70.7%, or $4,038,540, to $9,752,407 in 2005 from $5,713,867 in 2004. This growth was due to purchases of GAP coverage by new customers, as well as rate and volume increases with existing customers.
Net premiums earned for UC products increased 11.8%, or 589,895, to $5,568,888 in 2005 from $4,978,993 in 2004 due to growth in the Company’s UCassure® product and rate increases.
Net premiums earned for WIP increased 129.2%, or $2,727,705, to $4,839,248 in 2005 from $2,111,543 in 2004, as we participated in this program for a full year in 2005 compared to a partial year in 2004.
Discontinued bond program net premiums earned declined $672,897 in 2005 compared to 2004 due to the discontinuation of this program in the second quarter of 2004. See “Overview-Discontinued Bond Program” above and Note 16 to the Consolidated Financial Statements for additional information concerning the discontinued bond program.
Investment Income. Net investment income increased 52.6%, or $1,138,544, to $3,302,659 in 2005 from $2,164,115 a year ago. This improvement was due to growth in fixed income investments combined with a higher after-tax yield. Higher yields resulted from the Company’s reallocation of a portion of its portfolio from short-term investments to fixed maturities during 2004, which provided a better matching of the Company’s invested assets to its product liability duration and enhanced the Company’s investment return.
Net realized gains on investments increased 17.1%, or $187,581, to $1,281,755 in 2005 from $1,094,174 a year ago. This increase was a combination of the timing of sales of individual securities and other-than-temporary impairments on investments. There were no impairment charges included in net realized gains on investments in 2005 compared to $535,487 in 2004. Included in impairment charges for 2004 is a write down of $334,136 related to a private equity investment due to its financial uncertainty. For more information
23
concerning impairment charges, see “Critical Accounting Policies-Other-Than-Temporary Impairment of Investments” below.
Codification and Subscription Fees. ALPC’s codification and subscription fees decreased 13.3%, or $530,747, to $3,474,668 in 2005 from $4,005,415 in 2004. In 2004, ALPC engaged in a one-time project which generated additional fees that were not received in 2005.
Management Fees. Our management fees increased to $713,697 in 2005 from $33,710 in 2004 as a result of pricing actions, favorable unemployment experience during 2005 and cancellation of a poor performing account at the end of 2004. We expect management fees to vary from period to period depending on unemployment levels and benefit charges.
Losses and Loss Adjustment Expenses. Losses and LAE decreased 50.6%, or $23,901,695, to $23,335,620 in 2005 from $47,237,315 in 2004. This decline was mostly due to a decrease in losses and LAE of $19,738,370 for the discontinued bond program. See “Overview-Discontinued Bond Program” above and Note 16 to the Consolidated Financial Statements for a discussion of the discontinued bond program. Excluding the discontinued bond program, losses and LAE declined 15.4%, or $4,163,325, to $22,912,887 in 2005 from $27,076,212 in 2004 primarily due to a decrease in ULI losses and LAE which was partially offset by an increase in losses and LAE for our CPI, GAP, UC and WIP business.
ULI losses and LAE decreased 27.3%, or $5,883,795, to $15,685,102 in 2005 from $21,568,897 in 2004. The decrease was due primarily to favorable loss development during 2005 as a result of fewer loan defaults, bankruptcies and automobile repossessions among our ULI customers combined with a decrease in business.
CPI losses and LAE increased 14.0%, or $98,070, to $798,465 in 2005 from $700,395 in 2004 which is consistent with the growth in the business.
GAP losses and LAE increased 22.7%, or $941,850, to $5,088,477 in 2005 from $4,146,627 in 2004 principally due to growth in the business.
Losses and LAE for our UC products increased 98.6%, or $422,214, to $850,405 in 2005 compared to $428,191 in 2004 due to favorable loss development in 2004 on an excess of loss policy that was cancelled at the end of 2003 as well as unfavorable loss development on our bonded service program during 2005.
WIP losses and LAE increased 129.2%, or $272,771, to $483,925 in 2005 from $211,154 in 2004. This increase is consistent with the growth in WIP net premiums earned as the Company records loss and LAE reserves for WIP using an expected loss ratio reserving method, which is based on a certain percentage of net premiums earned.
For more information concerning losses and LAE, see “Critical Accounting Policies-Loss and Loss Adjustment Expense Reserves” below.
Commissions, Other Insurance Operating Expenses and General and Administrative Expenses. Commission expense increased 21.9%, or $2,465,946, to $13,750,996 in 2005 from $11,285,050 in 2004 principally due to the growth in GAP and WIP premiums combined with improved loss performance for one of our ULI general agents, which resulted in an increase to contingent commissions. Other insurance operating expenses and general and administrative expenses combined rose 64.3%, or $4,466,521, to $11,417,186 in 2005 from $6,950,665 in 2004 primarily due to legal fees related to the Audit Committee’s independent investigation of E&Y’s withdrawal of its audit reports, the SEC private investigation and the discontinued bond program arbitrations, as well as an increase in audit fees. We believe a significant portion of this increase represents one-time expenses.
Codification and Subscription Expenses. Codification and subscription expenses incurred by ALPC decreased 20.9%, or $741,844, to $2,809,700 in 2005 from $3,551,544 a year ago. This decrease was consistent with the decline in codification and subscription revenues and was primarily attributable to the completion of a one-time project during 2004 that generated additional expenses for last year as well as an impairment write-down of a database in the second quarter of 2004.
Interest Expense. Interest expense increased 28.8%, or $257,900, to $1,152,363 in 2005 from $894,463 a year ago as a result of rising interest rates. See “Liquidity and Capital Resources” for discussion of the Company’s trust preferred debt issued to affiliates, which makes up the majority of the Company’s interest expense.
Federal Income Taxes. Federal income tax expense was $1,876,571 in 2005 compared to federal income tax (benefit) of $(4,767,432) in 2004. The benefit in 2004 was primarily caused by tax losses arising from the discontinued bond program losses.
GAAP Combined Ratio. For 2005, the combined ratio decreased to 93.6% from 129.7% a year ago. The loss ratio improved to 45.8% in 2005 from 95.1% in 2004 due principally to the decrease in losses and LAE for the discontinued bond program. Excluding the discontinued bond program losses and LAE, the Company’s loss ratio was 45.0% in 2005 compared to 54.8% in 2004. This improvement was attributable to the performance of our ULI, CPI, GAP and WIP product lines. The expense ratio increased to 47.8% in 2005 from 34.6% in 2004 primarily due to an increase in commission expense and other insurance operating expenses as described above.
24
BUSINESS OUTLOOK
Lender/Dealer Products
We believe the national economy remains unstable. National automobile sale volumes were down in 2006 compared to 2005 which resulted in a decline in lending volumes for many our automobile lender/dealer customers. As a result, our premium volume was down in 2006 compared to 2005. If this trend continues, we could experience a premium decline in 2007 as well.
During the third quarter of 2005, one of our managing general agents moved a portion of its ULI and GAP premium in an effort to more evenly distribute its business with existing insurance carriers. As a result, the Company expects a decline in premiums earned of $1.6 million and a decline in losses, commissions and premium taxes incurred of approximately $1.3 million for this managing general agent for fiscal year 2007 when compared to fiscal year 2006. In addition, a ULI financial institution customer cancelled its policy at the end of second quarter 2006. As a result, the Company expects a decline in premiums earned of $1.9 million and a decline in losses, commission and premium taxes incurred of approximately $1.8 million for this customer for fiscal year 2007 when compared to fiscal year 2006.
If the rate of loan defaults, bankruptcies and automobile repossessions increase for our ULI customers, we would anticipate an increase in the frequency of losses for this product line. Incentives being offered on new cars by dealers and manufacturers have depressed the value of the used car market. In addition, the higher level of gas prices could lower the market value of less fuel-efficient vehicles. If used car prices continue to decline, the “gap” between the value of the vehicle and the outstanding loan balance would increase and thus the severity of our GAP losses would increase. The Company has taken pricing actions to help mitigate the effect of these trends.
Effective January 1, 2007, the Company entered into a producer-owned reinsurance arrangement with a new CPI customer whereby 100% of that customer’s premiums (along with the associated risk) were ceded to its PORC. For this program, the CPI coverage is voluntary and is primarily for tractors and residential/commercial mowers as opposed to automobiles. The Company receives a ceding commission based on a percentage of the premiums ceded. For this reinsurance arrangement, the Company obtains collateral in the form of funds held and a letter of credit to secure its obligations. Under the provisions of the reinsurance agreement, the collateral must be equal to or greater than 102% of the reinsured reserves and the Company has immediate access to such collateral if necessary. If the customer’s premium projections for 2007 are accurate, this program should reduce our commission expense by approximately $0.2 million to $0.3 million during 2007.
Unemployment Compensation and Other Specialty Products
The Company believes that there has been a stabilization of benefit charge levels in our UC product customer base; however, if unemployment levels rise, we could experience lower management fees and/or increased losses for our UC products. Furthermore, any developments on the discontinued bond program and related Highlands arbitration could have a material impact on our results of operations and/or financial condition.
Since the Company began participating in the waste surety bond program in 2004 there have not been any claims to date. If the Company were to have claims experience on this program during 2007, such claims experience could have an impact to our financial performance if our reserves prove to be deficient.
As discussed above in “Risk Factors — Automobile Service Contract Program”, this program could have an impact to our 2007 financial performance if the Company is required to pay claims under the program and it is unable to draw on the letter of credit and cannot collect on the reinsurance.
Sale of Affiliate
During 2006, 2005 and 2004, ALPC had pretax income of approximately $0.3 million, $0.7 million and $0.5 million, respectively, which is included in our results of operations. As the Company sold ALPC on August 31, 2006, the operations of ALPC are no longer included in our consolidated financial statements, other than our equity investment in the Purchaser. As a result of this transaction, we do not expect our 2007 operations to include the same level of profit that was contributed by ALPC in previous years.
Expenses and Investments
During 2006, the Company experienced a high level of legal expenses associated with the discontinued bond program arbitrations. The Company anticipates it will continue to incur legal costs during 2007 for the Highlands arbitration; however, the Company believes its total bond program arbitration costs will be significantly reduced in 2007 when compared to 2006.
If interest rates continue to rise during 2007, it would increase the level of interest expense on the Company’s trust preferred debt and any borrowings under its revolving line of credit. See “Liquidity and Capital Resources” below for more information concerning our trust
25
preferred debt and revolving line of credit. In addition, a rise in interest rates could decrease the fair value of the Company’s fixed income investment portfolio.
Based on the above, our outlook for 2007 remains cautious.
LIQUIDITY AND CAPITAL RESOURCES
Liquidity and capital resources demonstrate the Company’s ability to generate sufficient cash flows from its operations and borrow funds at competitive rates to meet operating and growth needs. As of December 31, 2006, the Company’s capital structure consists of trust preferred debt issued to affiliates and shareholders’ equity and is summarized in the following table:
| | | | | | | | | | | | | |
| | | 2006 | | | 2005 | | | 2004 | |
| | | |
| Trust preferred debt issued to BIC Statutory Trust I | | $ | 8,248,000 | | | $ | 8,248,000 | | | $ | 8,248,000 | |
| Trust preferred debt issued to BIC Statutory Trust II | | | 7,217,000 | | | | 7,217,000 | | | | 7,217,000 | |
| Bank note payable | | | — | | | | — | | | | 500,000 | |
| | | | | | | | | | |
| | | | | | | | | | | | | |
| Total debt obligations | | | 15,465,000 | | | | 15,465,000 | | | | 15,965,000 | |
| | | | | | | | | | |
| | | | | | | | | | | | | |
| Total shareholders’ equity | | | 36,365,619 | | | | 30,079,626 | | | | 24,846,288 | |
| | | | | | | | | | |
| Total capitalization | | $ | 51,830,619 | | | $ | 45,544,626 | | | $ | 40,811,288 | |
| | | | | | | | | | |
| Ratio of total debt obligations to total capitalization | | | 29.8 | % | | | 34.0 | % | | | 39.1 | % |
In December 2002, we organized BIC Statutory Trust I (“BIC Trust I”), a Connecticut special purpose business trust, which issued $8,000,000 of floating rate trust preferred capital securities in an exempt private placement transaction. BIC Trust I also issued $248,000 of floating rate common securities to Bancinsurance. In September 2003, we organized BIC Statutory Trust II (“BIC Trust II”), a Delaware special purpose business trust, which issued $7,000,000 of floating rate trust preferred capital securities in an exempt private placement transaction. BIC Trust II also issued $217,000 of floating rate common securities to Bancinsurance. BIC Trust I and BIC Trust II (collectively, the “Trusts”) were formed for the sole purpose of issuing and selling the floating rate trust preferred capital securities and investing the proceeds from such securities in junior subordinated debentures of the Company. In connection with the issuance of the trust preferred capital securities, the Company issued junior subordinated debentures of $8,248,000 and $7,217,000 to BIC Trust I and BIC Trust II, respectively. The floating rate trust preferred capital securities and the junior subordinated debentures have substantially the same terms and conditions. The Company has fully and unconditionally guaranteed the obligations of the Trusts with respect to the floating rate trust preferred capital securities. The Trusts distribute the interest received from the Company on the junior subordinated debentures to the holders of their floating rate trust preferred capital securities to fulfill their dividend obligations with respect to such trust preferred securities. BIC Trust I’s floating rate trust preferred capital securities, and the junior subordinated debentures issued in connection therewith, pay dividends and interest, as applicable, on a quarterly basis at a rate equal to three month LIBOR plus four hundred basis points (9.37% and 8.44% at December 31, 2006 and 2005, respectively), are redeemable at par on or after December 4, 2007 and mature on December 4, 2032. BIC Trust II’s floating rate trust preferred capital securities, and the junior subordinated debentures issued in connection therewith, pay dividends and interest, as applicable, on a quarterly basis at a rate equal to three month LIBOR plus four hundred and five basis points (9.41% and 8.58% at December 31, 2006 and 2005, respectively), are redeemable at par on or after September 30, 2008 and mature on September 30, 2033. The proceeds from the junior subordinated debentures were used for general corporate purposes and provided additional financial flexibility to the Company. The terms of the junior subordinated debentures contain various restrictive covenants. As of December 31, 2006, the Company was in compliance with all such covenants.
We also have a $10,000,000 unsecured revolving line of credit with a maturity date of June 30, 2009 with no outstanding balance at December 31, 2006 and December 31, 2005. The revolving line of credit provides for interest payable quarterly at an annual rate equal to the prime rate less 75 basis points. The Company utilizes the line of credit from time to time based on short-term cash flow needs. The terms of the revolving credit agreement contain various restrictive covenants. As of December 31, 2006, the Company was in compliance with all such covenants.
The short-term cash requirements of our property/casualty business primarily consist of paying losses and LAE, reinsurance premiums and day-to-day operating expenses. Historically, we have met those requirements through short-term investments and cash receipts from operations, which consist primarily of insurance premiums collected, reinsurance recoveries and investment income. Our investment portfolio is a source of additional liquidity through the sale of readily marketable fixed maturities, equity securities and short-term investments. After satisfying our cash requirements, excess cash flows from our underwriting and investment activities are used to build the investment portfolio and thereby increase future investment income.
26
Because of the nature of the risks we insure on a direct basis, losses and LAE emanating from the insurance policies that we issue are generally characterized by relatively short settlement periods and quick development of ultimate losses compared to claims emanating from other types of insurance products. Therefore, we believe we can estimate our cash needs to meet our policy obligations and utilize cash flows from operations and cash and short-term investments to meet these obligations. The Company considers the relationship between the duration of our policy obligations and our expected cash flows from operations in determining our cash and short-term investment position. We maintain a level of cash and liquid short-term investments which we believe will be adequate to meet our anticipated cash needs without being required to liquidate intermediate-term and long-term investments. At December 31, 2006, total cash and short-term investments were approximately $10.1 million and gross loss and LAE reserves, excluding the discontinued bond program, were approximately $7.5 million.
As discussed in “Overview-Discontinued Bond Program” above and in Note 16 to the Consolidated Financial Statements, discontinued bond program loss and LAE reserves were $6.4 million at December 31, 2006. Ultimate payment on the discontinued bond program may result in an increase in cash outflows from operations and may impact our financial condition by reducing our invested assets. We consider the discontinued bond program liabilities and related Highlands arbitration as we manage our assets and liabilities. In selecting the maturity of securities in which we invest, we consider the relationship between the duration of our fixed-income investments with the expected payout of our liabilities for the discontinued bond program. There are no significant variations between the maturity of our investments and the expected payout of our loss and LAE reserves for the discontinued bond program.
We believe that both liquidity and interest rate risk can be minimized by such asset/liability management described above. With this strategy, management believes we can pay our policy liabilities as they become due without being required to use our credit facilities or liquidate intermediate-term and long-term investments; however, in the event that such action is required, it is not anticipated to have a material impact on our results of operations, financial condition and/or future liquidity.
USA derives its funds principally from commissions and fees which are currently sufficient to meet its operating expenses.
Cash flows (used in) provided by operating activities totaled $(11,014,388), $14,813,168 and $8,657,804 for 2006, 2005 and 2004, respectively. The increase in cash used in 2006 (as compared to 2005) was primarily the result of an increase in paid losses for the discontinued bond program, ceded reinsurance payments and management fee payments to our cost containment service firms, which were partially offset by a decrease in commissions paid as well as a decrease in audit and legal expenses related to the withdrawal by the Company’s former independent registered public accounting firm in 2005. The increase in paid losses for the discontinued bond program was primarily due to the Aegis and Sirius settlements and the Harco Final Order (see “Overview-Discontinued Bond Program” and Note 16 to the Consolidated Financial Statements for additional information concerning these arbitrations). The increase in cash provided in 2005 (as compared to 2004) was primarily the result of an increase in investment income collected, an increase in net cash flows from contract funds on deposit and funds held under reinsurance arrangements, a decrease in paid losses and LAE and federal income taxes recovered during 2005 compared to federal income taxes paid during 2004. These increases in cash flows in 2005 were partially offset by an increase in commissions and other expenses paid and a decrease in net premiums collected compared to 2004.
Ohio Indemnity is restricted by the insurance laws of the State of Ohio as to amounts that can be transferred to Bancinsurance in the form of dividends without the approval of the Department. During 2007, the maximum amount of dividends that may be paid to Bancinsurance by Ohio Indemnity without prior approval is limited to $4,915,331.
Ohio Indemnity is subject to a risk based capital test applicable to property/casualty insurers. The risk based capital test serves as a benchmark of an insurance enterprise’s solvency by state insurance regulators by establishing statutory surplus targets which will require certain company level or regulatory level actions. Ohio Indemnity’s total adjusted capital was in excess of all required action levels as of December 31, 2006.
Given the Company’s historic cash flows and current financial condition, management believes that the cash flows from operating and investing activities over the next year will provide sufficient liquidity for the operations of the Company. Our line of credit provides us with additional liquidity that could be used for short-term cash requirements if cash from operations and investments is not sufficient.
CONTRACTUAL OBLIGATIONS
The following table sets forth the Company’s contractual obligations at December 31, 2006:
| | | | | | | | | | | | | | | | | | | | | |
| | | Payments Due By Period | |
| | | | | | | Less than | | | 1-3 | | | 3-5 | | | More than | |
| | | Total | | | 1 year | | | years | | | years | | | 5 years | |
| Contractual Obligations: | | | | | | | | | | | | | | | | | | | | |
Trust preferred debt issued to affiliates(1) | | $ | 15,465,000 | | | $ | — | | | $ | — | | | $ | — | | | $ | 15,465,000 | |
| Operating leases | | | 453,952 | | | | 224,009 | | | | 229,943 | | | | — | | | | — | |
Loss and LAE reserves(2) | | | 13,823,240 | | | | 9,838,781 | | | | 3,984,459 | | | | — | | | | — | |
| | | | | | | | | | | | | | | | |
| | | | | | | | | | | | | | | | | | | | | |
| Total | | $ | 29,742,192 | | | $ | 10,062,790 | | | $ | 4,214,402 | | | $ | — | | | $ | 15,465,000 | |
| | | | | | | | | | | | | | | | |
27
| | |
| (1) | | In accordance with the provisions of the debt agreements, the BIC Trust I and BIC Trust II debt obligations are redeemable at par on December 4, 2007 and September 30, 2008, respectively. The table above assumes payout at maturity date rather than redemption date. |
| |
| (2) | | Our loss and LAE reserves do not have contractual maturity dates; however, based on historical payment patterns, we have included an estimate of when we expect our loss and LAE reserves to be paid in the above table. The exact timing of the payment of claims cannot be predicted with certainty. The actual payment amounts and the related timing of those payments could differ significantly from these estimates. |
INFLATION
We do not consider the impact of inflation to be material in the analysis of our overall operations.
CRITICAL ACCOUNTING ESTIMATES
The preparation of the Consolidated Financial Statements requires us to make estimates, assumptions and judgments that affect the reported amounts of assets, revenues, liabilities and expenses and related disclosures of contingent assets and liabilities. We regularly evaluate these estimates, assumptions and judgments. We base our estimates on historical experience and on various assumptions that we believe to be reasonable under the circumstances. Actual results may differ materially from these estimates, assumptions and judgments under different assumptions or conditions. Set forth below are the critical accounting policies that we believe require significant estimates, assumptions and judgments and are critical to an understanding of our Consolidated Financial Statements .
Other-Than-Temporary Impairment of Investments
We continually monitor the difference between the cost and the estimated fair value of our investments, which involves uncertainty as to whether declines in value are temporary in nature. If we believe a decline in the value of a particular available for sale investment is temporary, we record the decline as an unrealized loss in our shareholders’ equity. If we believe the decline in any investment is “other-than-temporarily impaired,” we write down the carrying value of the investment and record a realized loss. Our assessment of a decline in value includes our current judgment as to the financial position and future prospects of the entity that issued the investment security. If that judgment changes in the future, we may ultimately record a realized loss after having originally concluded that the decline in value was temporary.
The following discussion summarizes our process of reviewing our investments for possible impairment.
Fixed Maturities. On a monthly basis, we review our fixed maturity securities for impairment. We consider the following factors when evaluating potential impairment:
| | • | | the length of time and extent to which the estimated fair value has been less than book value; |
| |
| | • | | the degree to which any appearance of impairment is attributable to an overall change in market conditions (e.g., interest rates); |
| |
| | • | | the degree to which an issuer is current or in arrears in making principal and interest/dividend payments on the securities in question; |
| |
| | • | | the financial condition and future prospects of the issuer, including any specific events that may influence the issuer’s operations and its ability to make future scheduled principal and interest payments on a timely basis; |
| |
| | • | | the independent auditor’s report on the issuer’s most recent financial statements; |
| |
| | • | | buy/hold/sell recommendations of investment advisors and analysts; |
| |
| | • | | relevant rating history, analysis and guidance provided by rating agencies and analysts; and |
| |
| | • | | our ability and intent to hold the security for a period of time sufficient to allow for recovery in the estimated fair value. |
Equity Securities. On a monthly basis, we review our equity securities for impairment. We consider the following factors when evaluating potential impairment:
| | • | | the length of time and extent to which the estimated fair value has been less than book value; |
| |
| | • | | whether the decline appears to be related to general market or industry conditions or is issuer-specific; |
| |
| | • | | the financial condition and future prospects of the issuer, including any specific events that may influence the issuer’s operations; |
| |
| | • | | the recent income or loss of the issuer; |
| |
| | • | | the independent auditor’s report on the issuer’s most recent financial statements; |
| |
| | • | | buy/hold/sell recommendations of investment advisors and analysts; |
| | • | | relevant rating history, analysis and guidance provided by rating agencies and analysts; and |
| |
| | • | | our ability and intent to hold the security for a period of time sufficient to allow for recovery in the estimated fair value. |
28
In addition to the monthly valuation procedures described above, we continually monitor developments affecting our invested assets, paying particular attention to events that might give rise to impairment write-downs. There were $7,310, $0 and $535,487 in impairment charges included in net realized gains on investments for the years ended December 31, 2006, 2005 and 2004, respectively. Included in impairment charges for 2004 is a write down of $334,136 related to a private equity investment due to its financial uncertainty. Impairments within the portfolio during 2007 are possible if current economic and financial conditions worsen. See Note 2 to the Consolidated Financial Statements for additional information with respect to securities in an unrealized loss position at December 31, 2006 and 2005.
Loss and Loss Adjustment Expense Reserves
The Company utilizes its internal staff, reports from ceding insurers under assumed reinsurance and an independent consulting actuary in establishing its loss and LAE reserves. The Company’s independent consulting actuary reviews the Company’s reserve for losses and LAE on a quarterly basis. The Company considers this review in establishing the amount of its reserves for losses and LAE.
Our projection of ultimate loss and LAE reserves are estimates of future events, the outcomes of which are unknown to us at the time the projection is made. Considerable uncertainty and variability are inherent in the estimation of loss and LAE reserves. As a result, it is possible that actual experience may be materially different than the estimates reported. The Company continually refines reserve estimates as experience develops and further claims are reported and resolved. The Company reflects adjustments to reserves in the results of the periods in which such adjustments are made.
Assumed Business. Assumed reinsurance is a line of business with inherent volatility. Since the length of time required for the losses to be reported through the reinsurance process can be quite long, unexpected events are more difficult to predict. Ultimate loss reserve estimates for assumed reinsurance are dependent upon and based primarily on reports received by the Company from the underlying ceding insurers. These reports are the primary basis for the Company’s reserving estimates.
As discussed in “Overview-Discontinued Bond Program” above and in Note 16 to the Consolidated Financial Statements , discontinued bond program loss and LAE reserves were $6.4 million at December 31, 2006. Given the uncertainties of the outcome of the Highlands arbitration, uncertainties in the future loss information provided by Harco and Highlands, and the inherent volatility in assumed reinsurance, actual losses incurred for the discontinued bond program could be materially different from our estimated reserves. As a result, future loss development on the discontinued bond program could have a material effect on the Company’s results of operations and/or financial condition.
For the Company’s assumed WIP program, the Company is recording loss and LAE reserves using a loss ratio reserving methodology. The loss ratio method calculates a reserve based on expected losses in relation to premiums earned. The expected loss ratio for the program was selected using expected loss information provided by the ceding insurer.
Direct Business. For our direct business, estimates of ultimate loss and LAE reserves are based on our historical loss development experience. In using this historical information, we assume that past loss development is predictive of future development. Our assumptions allow for changes in claims and underwriting operations, as now known or anticipated, which may impact the level of required reserves or the emergence of losses. However, we do not anticipate any extraordinary changes in the legal, social or economic environments that could affect the ultimate outcome of claims or the emergence of claims from causes not currently recognized in our historical data. Such extraordinary changes or claims emergence may impact the level of required reserves in ways that are not presently quantifiable. Thus, while we believe our reserve estimates are reasonable given the information currently available, actual emergence of losses could deviate materially from our estimates and from amounts recorded by us.
We conducted a reserve study using historical losses and LAE by product line or coverage within product line. We prepared our estimates of the gross and net loss and LAE reserves using annual accident year loss development triangles for the following products:
| | • | | ULI — limited liability (“ULIL”) |
| |
| | • | | ULI — non-limited liability (“ULIN”) |
| |
| | • | | CPI |
| |
| | • | | GAP |
Historical “age-to-age” loss development factors (“LDF”) were calculated to measure the relative development for each accident year from one maturity point to the next. Based on the historical LDF, we selected age-to-age LDF that we believe are appropriate to estimate the remaining future development for each accident year. These selected factors are used to project the ultimate expected losses for each
29
accident year. The validity of the results from using a loss development approach can be affected by many conditions, such as claim department processing changes, a shift between single and multiple payments per claim, legal changes or variations in our mix of business from year to year. Also, because the percentage of losses paid for immature years is often low, development factors are volatile. A small variation in the number of claims paid can have a leveraging effect that can lead to significant changes in estimated ultimate losses. Therefore, ultimate values for immature accident years may be based on alternative estimation techniques, such as expected loss ratio method, or some combination of acceptable actuarial methods.
For our UC, WIP and other specialty product lines, the Company prepared estimates of loss and LAE reserves based on certain actuarial and other assumptions related to the ultimate cost expected to settle such claims.
We record reserves on an undiscounted basis. Our reserves reflect anticipated salvage and subrogation included as a reduction to loss and LAE reserves. We do not provide coverage that could reasonably be expected to produce asbestos and/or environmental liability claims activity or material levels of exposure to claims-made extended reporting options.
In establishing our reserves, we tested our data for reasonableness, such as ensuring there are no outstanding case reserves on closed claims, and consistency with data used in our previous estimates. We found no material discrepancies or inconsistencies in our data. We did not experience any significant change in the number of claims paid that was inconsistent with our business (other than claims related to the discontinued bond program), average claim paid or average claim reserve that would be inconsistent with the types of risks we insured in the respective years.
Loss and LAE Reserves at Year End. As of December 31, 2006 and 2005, gross loss and LAE reserves by product line were split between incurred but not reported (“IBNR”) and case reserves as follows:
| | | | | | | | | | | | | | | | | |
| | | December 31, 2006 | | | December 31, 2005 | |
| | | IBNR | | | Case | | | IBNR | | | Case | |
| ULI — limited liability (“ULIL”) | | $ | 1,451,145 | | | $ | 77,358 | | | $ | 1,655,241 | | | $ | 245,840 | |
| ULI — non-limited liability (“ULIN”) | | | 267,542 | | | | 558,024 | | | | 206,567 | | | | 1,146,213 | |
| CPI | | | 241,706 | | | | 42,131 | | | | 233,212 | | | | 33,879 | |
| GAP | | | 2,515,611 | | | | 40,000 | | | | 2,110,875 | | | | 184,766 | |
| UC | | | 847,259 | | | | — | | | | 1,057,716 | | | | — | |
| WIP | | | 1,358,717 | | | | — | | | | 778,445 | | | | — | |
| Discontinued bond program | | | 5,483,867 | | | | 882,310 | | | | 6,827,179 | | | | 12,798,950 | |
| Other specialty products | | | 57,570 | | | | — | | | | 21,840 | | | | 3,500 | |
| | | | | | | | | | | | | |
| Total | | $ | 12,223,417 | | | $ | 1,599,823 | | | $ | 12,891,075 | | | $ | 14,413,148 | |
| | | | | | | | | | | | | |
The Company calculates a reserve range for its lender/dealer product lines (ULI, CPI and GAP) and calculates point estimates for UC, WIP and other specialty product lines. As of December 31, 2006, our indicated gross loss and LAE reserve range for lender/dealer products was $3.6 million to $5.8 million and our recorded loss and LAE reserves were $5.2 million.
During 2006, reserves for incurred losses and LAE attributable to insured events of prior years increased by approximately $0.1 million as a result of re-estimation of unpaid losses and LAE principally on the Company’s discontinued bond program. An analysis of this increase is provided below.
For the discontinued bond program, the Company recorded reserve deficiencies of approximately $1.8 million during 2006. The reserve deficiencies were primarily attributable to the Harco Final Order combined with an increase in reported losses from Harco. See “Overview-Discontinued Bond Program” and Note 16 to the Consolidated Financial Statements for additional information concerning the discontinued bond program losses.
The discontinued bond program deficiencies were partially offset by reserve redundancies in our automobile lender/dealer, UC and WIP product lines. Our automobile lender/dealer line experienced the largest redundancy ( $1.1 million) which was primarily attributable to the GAP and ULIN product lines as discussed below.
GAP experienced reserve redundancies of approximately $0.6 million during 2006. The improvement in loss experience primarily related to the 2005 accident year. At December 31, 2006 and 2005, the Company’s ultimate selected loss ratio for the 2005 accident year was 58.2% and 62.3%, respectively. Changes in this key assumption occurred primarily during the first half of 2006 as the majority of our GAP losses are settled within six months from the date of loss. When estimating the ultimate loss ratio at December 31, 2005, the Company selected an ultimate loss ratio for the 2005 accident year that was comparable to previous accident years’ ultimate loss ratios. During the first half of 2006, our 2005 accident year loss experience was more favorable than previously estimated at December 31, 2005.
30
In accordance with SFAS No. 60, the Company recorded this change in reserves as a change in estimate during 2006.
ULIN experienced reserve redundancies of approximately $0.3 million during 2006. The improvement in loss experience primarily related to the 2005 accident year. At December 31, 2006 and 2005, the Company’s ultimate selected loss ratio for the 2005 accident year was 48.2% and 48.5%, respectively. Changes in this key assumption occurred primarily during the first half of 2006 as the majority of our ULIN losses are settled within four months from the date of loss. When estimating the ultimate loss ratio at December 31, 2005, the Company selected an ultimate loss ratio for the 2005 accident year that was comparable to previous accident years’ ultimate loss ratios. During the first half of 2006, our 2005 accident year loss experience was more favorable than previously estimated at December 31, 2005. In accordance with SFAS No. 60, the Company recorded this change in reserves as a change in estimate during 2006.
For our direct business, the majority of our losses are short-tail in nature and adjustments to reserve amounts occur rather quickly. Conditions that affected the above redundancies in reserves may not necessarily occur in the future. Accordingly, it may not be appropriate to extrapolate this redundancy to future periods.
Codification and Subscription Revenue and Expense Recognition
Revenue from municipal code contracts is recognized on the percentage-of-completion method: completion is measured based on the percentage of direct labor costs incurred to date compared to estimated direct labor costs for each contract. While we use available information to estimate total direct labor costs on each contract, actual experience may vary from estimated amounts. Under this method, the costs incurred and the related revenues are included in the income statement as work progresses. Adjustments to contract cost estimates are made in the periods in which the facts which require such revisions become known. If a revised estimate indicates a loss, such loss is provided for in its entirety. The amount by which revenues are earned in advance of contractual collection dates is an unbilled receivable and the amount by which contractual billings exceed earned revenues is deferred revenue which is carried as a liability. As the Company sold ALPC on August 31, 2006, this is a critical accounting policy through that date only. See “Overview-Sale of Affiliate” above and Note 1 to the Consolidated Financial Statements for information concerning this transaction.
Equity-Based Compensation Expense
The fair value of options granted by the Company are estimated on the date of grant using the Black-Scholes option pricing model (“Black-Scholes model”). The Black-Scholes model is utilized by the Company to calculate equity-based compensation expense and it uses various assumptions such as risk-free rate, expected life, expected volatility and dividend yield. The risk-free rate is based on the United States Treasury strip curve at the time of the grant with a term approximating that of the expected option life. The Company analyzes historical data regarding option exercise behaviors, expirations and cancellations to calculate the expected life of the options granted, which represents the length of time in years that the options granted are expected to be outstanding. Expected volatilities are based on historical volatility over a period of time using the expected term of the option grant and using weekly stock prices of the Company; however for options granted after February 4, 2005, the Company excludes the period from February 4, 2005 through January 25, 2006 (the period in which shareholders could not obtain current financial information for the Company and could not rely on the Company’s 2003, 2002 and 2001 financial statements) as the Company believes that its stock price during that period is not relevant in evaluating expected volatility of its common shares in the future. Dividend yield is based on historical dividends. See Note 11 to the Consolidated Financial Statements for information concerning the Company’s equity-based compensation expense.
Legal Matters
The Company is involved in various legal proceedings arising in the ordinary course of business, some of which involve claims for substantial amounts. An estimate is made to accrue for a loss contingency relating to any of these legal proceedings if management believes it is probable that a liability was incurred as of the date of the financial statements and the amount of loss can be reasonably estimated. Because of the subjective nature inherent in assessing the outcome of litigation and because of the potential that an adverse outcome in a legal proceeding could have a material impact on the Company’s financial position and/or results of operations, such estimates are considered to be critical accounting estimates.
OFF-BALANCE SHEET ARRANGEMENTS
We do not have any off-balance sheet arrangements that either have, or are reasonably likely to have, a current or future effect on our financial condition, changes in financial condition, results of operations, liquidity, capital expenditures and/or capital resources that are considered material.
FORWARD-LOOKING INFORMATION
Certain statements made in this Annual Report on Form 10-K are forward-looking and are made pursuant to the safe harbor provisions of the Private Securities Litigation Reform Act of 1995. In addition, we may make other written or oral communications from time to time that contain forward-looking statements. Forward-looking statements convey our current expectations or forecast future events. All statements contained in this Annual Report on Form 10-K, other than statements of historical fact, are forward-looking statements.
31
Forward-looking statements include statements regarding our future financial position, results of operations, business strategy, budgets, projected costs and plans and objectives of management for future operations. The words “may,” “continue,” “estimate,” “intend,” “plan,” “will,” “believe,” “project,” “expect,” “anticipate” and similar expressions generally identify forward-looking statements but the absence of these words does not necessarily mean that a statement is not forward-looking. Forward-looking statements are not guarantees of future performance and involve risks and uncertainties that may cause actual results to differ materially from those statements. Risk factors that might cause actual results to differ from those statements include, without limitation, changes in underwriting results affected by adverse economic conditions, fluctuations in the investment markets, changes in the retail marketplace, changes in the laws or regulations affecting the operations of the Company, changes in the business tactics or strategies of the Company, the financial condition of the Company’s business partners, changes in market forces, litigation, developments in the discontinued bond program and related Highlands arbitration, the ongoing SEC private investigation and the concentrations of ownership of the Company’s common shares by members of the Sokol family, and other risk factors identified in our filings with the SEC, any one of which might materially affect our financial condition and/or results of operations. Any forward-looking statements speak only as of the date made. We undertake no obligation to update any forward-looking statements to reflect events or circumstances arising after the date on which they are made.
ITEM 7A. QUANTITATIVE AND QUALITATIVE DISCLOSURES ABOUT MARKET RISK
Market risk is the risk that we will incur losses due to adverse changes in market rates and prices. The major components of market risk affecting the Company are interest rate risk, credit risk and equity risk. We have no foreign exchange risk or direct commodity risk. Our market risk sensitive instruments are entered into for purposes other than trading. During 2006, there were no material changes in our primary market risk exposures or in how these exposures were managed compared to 2005. The following is a discussion of our primary market risk exposures and how we manage those exposures. The discussion is limited to financial instruments subject to market risks and is not intended to be a complete discussion of all the risks the Company is exposed to in the ordinary course of business. For more information concerning the risks the Company is exposed to in the ordinary course of business, see “Risk Factors That May Affect Future Results” above.
Interest Rate Risk
Interest rate risk is the risk that we will incur losses due to adverse changes in interest rates. Our exposure to interest rate changes primarily results from our holdings of fixed maturity investments and from our debt obligations.
Investments. Interest rate risk is the risk that interest rates will change and cause a decrease in the value of the Company’s investments. We mitigate this risk by attempting to ladder the maturity schedule of our investments. At December 31, 2006, our fixed maturity portfolio had an average duration of 3.96 years (3.57 years at December 31, 2005). At December 31, 2006, we did not own any material non-investment grade securities. We believe that a high quality investment portfolio is more likely to generate stable and predictable investment returns.
The following table summarizes the projected cash flows and estimated fair values of our fixed maturity investments at December 31, 2006, which are sensitive to changes in interest rates. We have excluded short-term investments from the amounts shown below because we have determined the interest rate risk related to those instruments to be immaterial. The table also presents the average interest rate for each period presented.
| | | | | | | | | | | | | | | | | | | | | | | | | | | | | | | | | |
| | | Projected Cash Flows |
| | | | | | | | | | | | | | | | | | | | | | | | | | | | | | | December 31, 2006 |
| | | | | | | | | | | | | | | | | | | | | | | There- | | | | | | Estimated |
| | | 2007 | | 2008 | | 2009 | | 2010 | | 2011 | | after | | Total | | Fair Value |
| | | |
| Assets | | | | | | | | | | | | | | | | | | | | | | | | | | | | | | | | |
| Fixed maturity securities: | | | | | | | | | | | | | | | | | | | | | | | | | | | | | | | | |
| Held to maturity | | $ | 755,000 | | | $ | 1,250,000 | | | $ | — | | | $ | 1,250,000 | | | $ | 775,000 | | | $ | 690,000 | | | $ | 4,720,000 | | | $ | 4,850,986 | |
| Available for sale | | $ | 5,990,000 | | | $ | 6,710,000 | | | $ | 10,530,000 | | | $ | 12,845,000 | | | $ | 5,745,000 | | | $ | 26,620,000 | | | $ | 68,440,000 | | | $ | 68,547,886 | |
| Weighted-average interest rate: | | | | | | | | | | | | | | | | | | | | | | | | | | | | | | | | |
| Fixed maturity securities | | | 4.08% | | | | 4.58% | | | | 4.30% | | | | 4.66% | | | | 4.80% | | | | 4.82% | | | | 4.62% | | | | | |
Debt.The market risk for our outstanding long-term debt is interest rate risk. Because our outstanding long-term debt has a floating interest rate, we are exposed to the effects of changes in prevailing interest rates. At December 31, 2006, we had $15.5 million of debt outstanding under our trust preferred debt issued to affiliates. A 2.0% change in the prevailing interest rate on all of our floating rate debt
32
would result in a corresponding interest expense fluctuation of approximately $300,000 on an annual basis, assuming that all of such debt is outstanding for the entire year.
Credit Risk
Credit risk is the potential loss arising from adverse changes in the financial condition of a specific debt issuer. We address this risk by investing in fixed maturity securities that are investment grade, which are those bonds rated “BBB” or higher by Standard & Poor’s. We also independently and through our outside independent investment manager monitor the financial condition of all of the issuers of fixed maturity securities in our portfolio. In addition, we employ diversification rules that limit our credit exposure to any single issuer.
Equity Risk
Equity risk is the potential loss in market value of our equity investments resulting from an adverse change in price. We manage this risk by focusing on a long-term, value oriented investment philosophy for our equity portfolio. Our strategy remains one of value investing, with security selection taking precedence over market timing. We also mitigate equity risk by diversifying our portfolio across industries and concentrations in any one company are limited by parameters established by senior management, as well as by regulatory requirements. As of December 31, 2006, approximately 10.2% of our investment portfolio was invested in equity securities.
33
ITEM 8. CONSOLIDATED FINANCIAL STATEMENTS AND SUPPLEMENTARY DATA
Report of Independent Registered Public Accounting Firm
To the Board of Directors and Shareholders of
Bancinsurance Corporation
We have audited the accompanying consolidated balance sheets of Bancinsurance Corporation and subsidiaries (the “Company”) as of December 31, 2006 and 2005, and the related consolidated statements of operations, shareholders’ equity and cash flows for the three years then ended. Our audits also included the financial statement schedules listed in the index at Item 15(a). These financial statements are the responsibility of the Company’s management. Our responsibility is to express an opinion on these financial statements based on our audits.
We conducted our audit in accordance with the standards of the Public Company Accounting Oversight Board (United States). Those standards require that we plan and perform the audit to obtain reasonable assurance about whether the financial statements are free of material misstatement. An audit also includes examining, on a test basis, evidence supporting the amounts and disclosures in the financial statements, assessing the accounting principles used and significant estimates made by management, as well as evaluating the overall financial statement presentation. We believe that our audit provides a reasonable basis for our opinion.
In our opinion, the financial statements referred to above present fairly, in all material respects, the consolidated financial position of Bancinsurance Corporation and subsidiaries at December 31, 2006 and 2005 and the results of their operations and their cash flows for the three years then ended in conformity with accounting principles generally accepted in the United States of America. Also, in our opinion, the related financial statement schedules, when considered in relation to the basic consolidated financial statements taken as a whole, present fairly in all material respects the information set forth therein.
/s/Daszkal Bolton LLP
Boca Raton, Florida
February 23, 2007
34
BANCINSURANCE CORPORATION AND SUBSIDIARIES
Consolidated Statements of Operations
| | | | | | | | | | | | | |
| | | Years ended December 31, | |
| | | 2006 | | | 2005 | | | 2004 | |
| |
Revenues: | | | | | | | | | | | | |
| Net premiums earned | | $ | 49,106,653 | | | $ | 51,716,945 | | | $ | 50,064,185 | |
| Net investment income | | | 3,845,064 | | | | 3,302,659 | | | | 2,164,115 | |
| Net realized gains on investments | | | 55,719 | | | | 1,281,755 | | | | 1,094,174 | |
| Codification and subscription fees | | | 2,255,558 | | | | 3,474,668 | | | | 4,005,415 | |
| Management fees | | | 830,329 | | | | 713,697 | | | | 33,710 | |
| Net realized gain on sale of affiliate | | | 2,511,891 | | | | — | | | | — | |
| Other income | | | 81,428 | | | | 146,786 | | | | 43,123 | |
| | | | | | | | | | |
| | | | | | | | | | | | | |
Total revenues | | | 58,686,642 | | | | 60,636,510 | | | | 57,404,722 | |
| | | | | | | | | | |
| | | | | | | | | | | | | |
Expenses: | | | | | | | | | | | | |
| Losses and loss adjustment expenses | | | 23,806,747 | | | | 22,912,887 | | | | 27,076,212 | |
| Discontinued bond program losses and loss adjustment expenses | | | 1,767,496 | | | | 422,733 | | | | 20,161,103 | |
| Commission expense | | | 12,041,054 | | | | 13,750,996 | | | | 11,285,050 | |
| Other insurance operating expenses | | | 9,923,782 | | | | 9,989,798 | | | | 6,030,136 | |
| Codification and subscription expenses | | | 1,936,384 | | | | 2,809,700 | | | | 3,551,544 | |
| General and administrative expenses | | | 958,257 | | | | 1,427,388 | | | | 920,529 | |
| Interest expense | | | 1,429,086 | | | | 1,152,363 | | | | 894,463 | |
| Goodwill impairment | | | — | | | | — | | | | 753,737 | |
| | | | | | | | | | |
| | | | | | | | | | | | | |
Total expenses | | | 51,862,806 | | | | 52,465,865 | | | | 70,672,774 | |
| | | | | | | | | | |
| | | | | | | | | | | | | |
| Income (loss) before federal income taxes | | | 6,823,836 | | | | 8,170,645 | | | | (13,268,052 | ) |
| | | | | | | | | | | | | |
| Federal income tax expense (benefit) | | | 1,348,935 | | | | 1,876,571 | | | | (4,767,432 | ) |
| | | | | | | | | | |
| | | | | | | | | | | | | |
Net income (loss) | | $ | 5,474,901 | | | $ | 6,294,074 | | | $ | (8,500,620 | ) |
| | | | | | | | | | |
| | | | | | | | | | | | | |
| Net income (loss) per share: | | | | | | | | | | | | |
Basic | | $ | 1.10 | | | $ | 1.27 | | | $ | (1.72 | ) |
| | | | | | | | | | |
| | | | | | | | | | | | | |
Diluted | | $ | 1.08 | | | $ | 1.26 | | | $ | (1.72 | ) |
| | | | | | | | | | |
See accompanying notes to consolidated financial statements.
35
BANCINSURANCE CORPORATION AND SUBSIDIARIES
Consolidated Balance Sheets
| | | | | | | | | |
| | | December 31, | |
| | | 2006 | | | 2005 | |
| |
Assets | | | | | | | | |
| Investments: | | | | | | | | |
| Held to maturity: | | | | | | | | |
| Fixed maturities, at amortized cost (fair value $4,850,986 in 2006 and $4,856,624 in 2005) | | $ | 4,793,584 | | | $ | 4,821,629 | |
| | | | | | | | | |
| Available for sale: | | | | | | | | |
| Fixed maturities, at fair value (amortized cost $67,934,779 in 2006 and $72,562,204 in 2005) | | | 68,547,886 | | | | 73,012,240 | |
| | | | | | | | | |
| Equity securities, at fair value (cost $8,277,307 in 2006 and $7,597,066 in 2005) | | | 9,400,247 | | | | 8,043,299 | |
| | | | | | | | | |
| Short-term investments, at cost which approximates fair value | | | 8,263,980 | | | | 8,964,738 | |
| | | | | | | | | |
| Other invested assets | | | 751,936 | | | | 715,000 | |
| | | | | | | |
| | | | | | | | | |
| Total investments | | | 91,757,633 | | | | 95,556,906 | |
| | | | | | | |
| | | | | | | | | |
| Cash | | | 1,823,191 | | | | 4,528,875 | |
| | | | | | | | | |
| Premiums receivable | | | 4,534,856 | | | | 5,403,960 | |
| | | | | | | | | |
| Accounts receivable, net | | | — | | | | 674,357 | |
| | | | | | | | | |
| Reinsurance recoverables | | | 1,420,410 | | | | 1,235,043 | |
| | | | | | | | | |
| Prepaid reinsurance premiums | | | 9,278,559 | | | | 6,011,496 | |
| | | | | | | | | |
| Deferred policy acquisition costs | | | 9,454,410 | | | | 9,678,821 | |
| | | | | | | | | |
| Costs and estimated earnings in excess of billings on uncompleted codification contracts | | | — | | | | 248,035 | |
| | | | | | | | | |
| Loans to affiliates | | | 963,389 | | | | 892,523 | |
| | | | | | | | | |
| Intangible assets, net | | | — | | | | 771,013 | |
| | | | | | | | | |
| Accrued investment income | | | 1,133,757 | | | | 1,128,104 | |
| | | | | | | | | |
| Net deferred tax asset | | | 254,713 | | | | 485,461 | |
| | | | | | | | | |
| Other assets | | | 1,667,588 | | | | 1,721,241 | |
| | | | | | | |
| | | | | | | | | |
Total assets | | $ | 122,288,506 | | | $ | 128,335,835 | |
| | | | | | | |
See accompanying notes to consolidated financial statements.
36
BANCINSURANCE CORPORATION AND SUBSIDIARIES
Consolidated Balance Sheets, Continued
| | | | | | | | | |
| | | December 31, | |
| | | 2006 | | | 2005 | |
Liabilities and Shareholders’ Equity | | | | | | | | |
| Reserve for unpaid losses and loss adjustment expenses | | $ | 7,457,063 | | | $ | 7,678,094 | |
| | | | | | | | | |
| Discontinued bond program reserve for unpaid losses and loss adjustment expenses | | | 6,366,177 | | | | 19,626,129 | |
| | | | | | | | | |
| Unearned premiums | | | 37,248,196 | | | | 35,579,349 | |
| | | | | | | | | |
| Ceded reinsurance premiums payable | | | 1,779,022 | | | | 3,605,394 | |
| | | | | | | | | |
| Experience rating adjustments payable | | | 2,251,171 | | | | 2,302,850 | |
| | | | | | | | | |
| Retrospective premium adjustments payable | | | 3,550,981 | | | | 2,201,706 | |
| | | | | | | | | |
| Funds held under reinsurance treaties | | | 435,558 | | | | 735,341 | |
| | | | | | | | | |
| Contract funds on deposit | | | 3,741,508 | | | | 3,201,124 | |
| | | | | | | | | |
| Taxes, licenses and fees payable | | | 427,928 | | | | 386,936 | |
| | | | | | | | | |
| Current federal income tax payable | | | 266,791 | | | | 570,078 | |
| | | | | | | | | |
| Deferred ceded commissions | | | 1,752,278 | | | | 1,337,098 | |
| | | | | | | | | |
| Commissions payable | | | 2,081,825 | | | | 2,710,582 | |
| | | | | | | | | |
| Billings in excess of estimated earnings on uncompleted codification contracts | | | — | | | | 75,108 | |
| | | | | | | | | |
| Notes payable | | | — | | | | 27,119 | |
| | | | | | | | | |
| Other liabilities | | | 3,099,389 | | | | 2,754,301 | |
| | | | | | | | | |
| Trust preferred debt issued to affiliates | | | 15,465,000 | | | | 15,465,000 | |
| | | | | | | |
| | | | | | | | | |
Total liabilities | | | 85,922,887 | | | | 98,256,209 | |
| | | | | | | |
| | | | | | | | | |
| Commitments and contingencies | | | | | | | | |
| | | | | | | | | |
| Shareholders’ equity: | | | | | | | | |
| Non-voting preferred shares: | | | | | | | | |
| Class A Serial Preference shares without par value; authorized 100,000 shares; no shares issued or outstanding | | | — | | | | — | |
| Class B Serial Preference shares without par value; authorized 98,646 shares; no shares issued or outstanding | | | — | | | | — | |
| | | | | | | | | |
| Common shares without par value; authorized 20,000,000 shares; 6,170,341 shares issued at December 31, 2006 and 2005, 4,980,700 shares outstanding at December 31, 2006 and 4,972,700 shares outstanding at December 31, 2005 | | | 1,794,141 | | | | 1,794,141 | |
| | | | | | | | | |
| Additional paid-in capital | | | 1,554,355 | | | | 1,336,073 | |
| | | | | | | | | |
| Accumulated other comprehensive income | | | 1,142,957 | | | | 588,703 | |
| | | | | | | | | |
| Retained earnings | | | 37,607,687 | | | | 32,132,786 | |
| | | | | | | |
| | | | 42,099,140 | | | | 35,851,703 | |
| Less: Treasury shares, at cost (1,189,641 common shares at December 31, 2006 and 1,197,641 common shares at December 31, 2005) | | | (5,733,521 | ) | | | (5,772,077 | ) |
| | | | | | | |
| | | | | | | | | |
Total shareholders’ equity | | | 36,365,619 | | | | 30,079,626 | |
| | | | | | | |
| | | | | | | | | |
Total liabilities and shareholders’ equity | | $ | 122,288,506 | | | $ | 128,335,835 | |
| | | | | | | |
See accompanying notes to consolidated financial statements.
37
BANCINSURANCE CORPORATION AND SUBSIDIARIES
Consolidated Statements of Shareholders’ Equity
| | | | | | | | | | | | | | | | | | | | | | | | | | | | | | | | | |
| | | | | | | | | | | | | | | | | | | Accumulated | | | | | | | | | | | | |
| | | | | | | | | | | | | | | Additional | | | other | | | | | | | | | | | Total | |
| | | Preferred Shares | | | Common | | | paid-in | | | comprehensive | | | Retained | | | Treasury | | | shareholders’ | |
| | | Class A | | | Class B | | | shares | | | capital | | | income | | | earnings | | | shares | | | equity | |
| |
| |
| Balance at December 31, 2003 | | | — | | | | — | | | $ | 1,794,141 | | | $ | 1,337,138 | | | $ | 1,920,265 | | | $ | 34,339,332 | | | $ | (6,025,848 | ) | | $ | 33,365,028 | |
| | | | | | | | | | | | | | | | | | | | | | | | | |
| Comprehensive loss: | | | | | | | | | | | | | | | | | | | | | | | | | | | | | | | | |
| Net loss | | | — | | | | — | | | | — | | | | — | | | | — | | | | (8,500,620 | ) | | | — | | | | (8,500,620 | ) |
| Unrealized losses, net of tax and reclassification adjustment | | | — | | | | — | | | | — | | | | — | | | | (270,826 | ) | | | — | | | | — | | | | (270,826 | ) |
| | | | | | | | | | | | | | | | | | | | | | | | | | | | | | | | |
| Total comprehensive loss | | | | | | | | | | | | | | | | | | | | | | | | | | | | | | | (8,771,446 | ) |
| | | | | | | | | | | | | | | | | | | | | | | | | | | | | | | | |
| 56,250 shares issued in connection with the exercise of stock options, net of tax benefit | | | — | | | | — | | | | — | | | | (1,065 | ) | | | — | | | | — | | | | 253,771 | | | | 252,706 | |
| | | | | | | | | | | | | | | | | | | | | | | | | |
| Balance at December 31, 2004 | | | — | | | | — | | | | 1,794,141 | | | | 1,336,073 | | | | 1,649,439 | | | | 25,838,712 | | | | (5,772,077 | ) | | | 24,846,288 | |
| | | | | | | | | | | | | | | | | | | | | | | | | |
| Comprehensive income: | | | | | | | | | | | | | | | | | | | | | | | | | | | | | | | | |
| Net income | | | — | | | | — | | | | — | | | | — | | | | — | | | | 6,294,074 | | | | — | | | | 6,294,074 | |
| Unrealized losses, net of tax and reclassification adjustment | | | — | | | | — | | | | — | | | | — | | | | (1,060,736 | ) | | | — | | | | — | | | | (1,060,736 | ) |
| | | | | | | | | | | | | | | | | | | | | | | | | | | | | | | | |
| Total comprehensive income | | | | | | | | | | | | | | | | | | | | | | | | | | | | | | | 5,233,338 | |
| | | | | | | | | | | | | | | | | | | | | | | | | |
| Balance at December 31, 2005 | | | — | | | | — | | | | 1,794,141 | | | | 1,336,073 | | | | 588,703 | | | | 32,132,786 | | | | (5,772,077 | ) | | | 30,079,626 | |
| | | | | | | | | | | | | | | | | | | | | | | | | |
Comprehensive income: | | | | | | | | | | | | | | | | | | | | | | | | | | | | | | | | |
Net income | | | — | | | | — | | | | — | | | | — | | | | — | | | | 5,474,901 | | | | — | | | | 5,474,901 | |
Unrealized gains, net of tax and reclassification adjustment | | | — | | | | — | | | | — | | | | — | | | | 554,254 | | | | — | | | | — | | | | 554,254 | |
| | | | | | | | | | | | | | | | | | | | | | | | | | | | | | | | |
Total comprehensive income | | | | | | | | | | | | | | | | | | | | | | | | | | | | | | | 6,029,155 | |
| | | | | | | | | | | | | | | | | | | | | | | | | | | | | | | | |
Equity-based compensation expense | | | — | | | | — | | | | — | | | | 217,958 | | | | — | | | | — | | | | — | | | | 217,958 | |
8,000 shares issued in connection with the exercise of stock options, net of tax benefit | | | — | | | | — | | | | — | | | | 324 | | | | — | | | | — | | | | 38,556 | | | | 38,880 | |
| | | | | | | | | | | | | | | | | | | | | | | | | |
Balance at December 31, 2006 | | | — | | | | — | | | $ | 1,794,141 | | | $ | 1,554,355 | | | $ | 1,142,957 | | | $ | 37,607,687 | | | $ | (5,733,521 | ) | | $ | 36,365,619 | |
| | | | | | | | | | | | | | | | | | | | | | | | | |
See accompanying notes to consolidated financial statements.
38
BANCINSURANCE CORPORATION AND SUBSIDIARIES
Consolidated Statements of Cash Flows
| | | | | | | | | | | | | |
| | | Years ended December 31, | |
| | | 2006 | | | 2005 | | | 2004 | |
| |
| Cash flows from operating activities: | | | | | | | | | | | | |
| Net income (loss) | | $ | 5,474,901 | | | $ | 6,294,074 | | | $ | (8,500,620 | ) |
| Adjustments to reconcile net income (loss) to net cash provided by (used in) operating activities: | | | | | | | | | | | | |
| Goodwill impairment | | | — | | | | — | | | | 753,737 | |
| Net realized gains on investments | | | (55,719 | ) | | | (1,281,755 | ) | | | (1,094,174 | ) |
| Net realized gain on sale of affiliate | | | (2,511,891 | ) | | | — | | | | — | |
| Net realized (gains) losses on disposal of property and equipment | | | — | | | | 658 | | | | (183 | ) |
| Depreciation and amortization | | | 620,546 | | | | 621,282 | | | | 712,002 | |
| Equity-based compensation expense | | | 217,958 | | | | — | | | | — | |
| Deferred federal income tax (benefit) expense | | | (54,777 | ) | | | 1,697,332 | | | | (2,350,920 | ) |
| Change in assets and liabilities: | | | | | | | | | | | | |
| Premiums receivable | | | 869,104 | | | | 2,507,419 | | | | 2,750,387 | |
| Accounts receivable, net | | | 138,209 | | | | 36,168 | | | | 282,568 | |
| Reinsurance recoverables | | | (185,367 | ) | | | 708,559 | | | | 2,982,844 | |
| Prepaid reinsurance premiums | | | (3,267,063 | ) | | | (3,151,786 | ) | | | 9,384,878 | |
| Deferred policy acquisition costs | | | 224,411 | | | | (2,454,826 | ) | | | (2,261,845 | ) |
| Other assets, net | | | (338,709 | ) | | | 3,304,895 | | | | (3,070,832 | ) |
| Reserve for unpaid losses and loss adjustment expenses | | | (13,480,983 | ) | | | (3,462,244 | ) | | | 16,380,548 | |
| Unearned premiums | | | 1,668,847 | | | | 7,860,201 | | | | 2,595,011 | |
| Ceded reinsurance premiums payable | | | (1,826,372 | ) | | | 3,111,431 | | | | (1,228,000 | ) |
| Experience rating adjustments payable | | | (51,679 | ) | | | 846,447 | | | | (5,541,381 | ) |
| Retrospective premium adjustments payable | | | 1,349,275 | | | | (5,074,519 | ) | | | 1,905,952 | |
| Funds held under reinsurance treaties | | | (299,783 | ) | | | (518,455 | ) | | | (1,392,897 | ) |
| Contract funds on deposit | | | 540,384 | | | | 2,389,766 | | | | (1,096,826 | ) |
| Deferred ceded commissions | | | 415,180 | | | | 302,167 | | | | (190,007 | ) |
| Commissions payable | | | (628,757 | ) | | | (1,312,229 | ) | | | 1,361,832 | |
| Other liabilities, net | | | 167,897 | | | | 2,388,583 | | | | (3,724,270 | ) |
| | | | | | | | | | |
Net cash provided by (used in) operating activities | | | (11,014,388 | ) | | | 14,813,168 | | | | 8,657,804 | |
| | | | | | | | | | |
| | | | | | | | | | | | | |
| Cash flows from investing activities: | | | | | | | | | | | | |
| Proceeds from sale of affiliate, net | | | 4,306,901 | | | | — | | | | — | |
| Proceeds from held to maturity fixed maturities due to redemption or maturity | | | 1,788,000 | | | | 170,000 | | | | 695,000 | |
| Proceeds from available for sale fixed maturities sold, redeemed or matured | | | 26,169,278 | | | | 25,194,401 | | | | 16,143,330 | |
| Proceeds from available for sale equity securities sold | | | 17,434,831 | | | | 22,441,671 | | | | 12,112,580 | |
| Cost of investments purchased: | | | | | | | | | | | | |
| Held to maturity fixed maturities | | | (1,257,369 | ) | | | (98,699 | ) | | | (750,820 | ) |
| Available for sale fixed maturities | | | (22,472,683 | ) | | | (44,709,564 | ) | | | (41,041,113 | ) |
| Available for sale equity securities | | | (18,048,268 | ) | | | (20,211,925 | ) | | | (11,859,943 | ) |
| Net change in short-term investments | | | 700,758 | | | | 3,747,839 | | | | 16,192,103 | |
| Other | | | (351,624 | ) | | | (109,283 | ) | | | (60,006 | ) |
| | | | | | | | | | |
Net cash provided by (used in) investing activities | | | 8,269,824 | | | | (13,575,560 | ) | | | (8,568,869 | ) |
| | | | | | | | | | |
| | | | | | | | | | | | | |
| Cash flows from financing activities: | | | | | | | | | | | | |
| Proceeds from note payable to bank | | | — | | | | — | | | | 3,500,000 | |
| Repayments of note payable to bank | | | — | | | | (500,000 | ) | | | (3,000,000 | ) |
| Proceeds from stock options exercised | | | 38,880 | | | | — | | | | 252,705 | |
| | | | | | | | | | |
Net cash provided by (used in) financing activities | | | 38,880 | | | | (500,000 | ) | | | 752,705 | |
| | | | | | | | | | |
| | | | | | | | | | | | | |
Net increase (decrease) in cash | | | (2,705,684 | ) | | | 737,608 | | | | 841,640 | |
| Cash at beginning of year | | | 4,528,875 | | | | 3,791,267 | | | | 2,949,627 | |
| | | | | | | | | | |
| Cash at end of year | | $ | 1,823,191 | | | $ | 4,528,875 | | | $ | 3,791,267 | |
| | | | | | | | | | |
| | | | | | | | | | | | | |
| Supplemental disclosures of cash flow information: | | | | | | | | | | | | |
| Cash paid (received) during the year for: | | | | | | | | | | | | |
| Interest | | $ | 1,421,673 | | | $ | 1,137,200 | | | $ | 886,115 | |
| | | | | | | | | | |
| Federal income taxes | | $ | 1,707,000 | | | $ | (4,079,067 | ) | | $ | 1,782,807 | |
| | | | | | | | | | |
See accompanying notes to consolidated financial statements.
39
BANCINSURANCE CORPORATION AND SUBSIDIARIES
Notes to Consolidated Financial Statements — December 31, 2006, 2005 and 2004
(1) SUMMARY OF SIGNIFICANT ACCOUNTING POLICIES
| | (a) | | Organization |
| |
| | | | Bancinsurance Corporation (“Bancinsurance”) is a specialty property insurance holding company incorporated in the State of Ohio in 1970. Bancinsurance and its subsidiaries (collectively, the “Company”) have two reportable business segments: (1) property/casualty insurance; and (2) insurance agency. Until August 31, 2006, the Company also had a municipal code publishing business segment. On August 31, 2006, the Company sold its municipal code publishing segment as more fully described in “Sale of Affiliate” below. These segments are described in more detail below. |
| |
| | | | Property/Casualty Insurance. Our wholly-owned subsidiary, Ohio Indemnity Company (“Ohio Indemnity”), is a specialty property/casualty insurance company. Our principal sources of revenue are premiums for insurance policies and income generated from our investment portfolio. Ohio Indemnity, an Ohio corporation, is licensed in 48 states and the District of Columbia. As such, Ohio Indemnity is subject to the regulations of The Ohio Department of Insurance (the “Department”) and the regulations of each state in which it operates. The majority of Ohio Indemnity’s premiums are derived from three distinct product lines: (1) automobile lender/dealer; (2) unemployment compensation; and (3) waste industry. |
| |
| | | | Our automobile lender/dealer product line offers three types of products. First, ULTIMATE LOSS INSURANCE® (“ULI”), a blanket vendor single interest coverage, is the primary product we offer to financial institutions nationwide. This product insures banks and financial institutions against damage to pledged collateral in cases where the collateral is not otherwise insured. A ULI policy is generally written to cover a lender’s complete portfolio of collateralized personal property loans, typically automobile loans. Second, creditor placed insurance (“CPI”) is an alternative to our traditional blanket vendor single interest product. While both products cover the risk of damage to uninsured collateral in a lender’s automobile loan portfolio, CPI covers the portfolio through tracking individual borrowers’ insurance coverage. The lender purchases physical damage coverage for loan collateral after a borrower’s insurance has lapsed. Third, our guaranteed auto protection insurance (“GAP”) pays the difference or “gap” between the amount owed by the customer on a loan or lease and the amount of primary insurance company coverage in the event a vehicle is damaged beyond repair or stolen and never recovered. Our GAP product is sold to auto dealers, lenders and lessors and provides coverage on either an individual or portfolio basis. |
| |
| | | | Our unemployment compensation (“UC”) products are utilized by qualified entities that elect not to pay the unemployment compensation taxes and instead reimburse state unemployment agencies for benefits paid by the agencies to the entities’ former employees. Through our UCassure® and excess of loss products, we indemnify the qualified entity for liability associated with its reimbursing obligations. In addition, we underwrite surety bonds that certain states require employers to post in order to obtain reimbursing status for their unemployment compensation obligations. Our bonded service program was discontinued at the end of 2003 and replaced by our UCassure® program. |
| |
| | | | Our waste industry products (“WIP”) consist of certain surety bonds produced and administered by a general insurance agent. Under this program, the Company both assumes and cedes certain waste surety bond business under two quota share reinsurance arrangements. In the second quarter of 2004, the Company entered into a 50% quota share reinsurance arrangement whereby the Company assumed 50% of all waste surety bonds with liability limits up to $4.0 million from two insurance carriers. Effective January 1, 2005, the reinsurance arrangement was amended whereby the Company’s assumed participation was reduced from 50% to 25%. Effective August 1, 2006, the reinsurance arrangement was further amended whereby the Company assumed 50% of all waste surety bonds with liability limits up to $1.2 million. In addition to assuming business, the Company also writes on a direct basis waste surety bonds with liability limits up to our Treasury limit ($3.6 million during 2006). The Company then cedes 50% of that business to an insurance carrier under a reinsurance arrangement. All surety bonds written directly and assumed under this program are produced and administered by a general insurance agent that is affiliated with one of the insurance carriers participating in the program. The majority of the surety bonds under the program satisfy the closure/post-closure financial responsibility obligations imposed on hazardous and solid waste treatment, storage and disposal facilities pursuant to Subtitles C and D of the Federal Resource Conservation and Recovery Act (“RCRA”). Closure/post-closure bonds cover future costs to close and monitor a regulated site such as a landfill. All of the surety bonds are indemnified by the principal and collateral is maintained on the majority of the bonds. The indemnifications and collateralization of this program reduces the risk of loss. |
| |
| | | | The Company has certain other specialty products which consist primarily of service contracts and other surety products. In addition, from 2001 until the end of the second quarter of 2004, the Company participated in a bail and immigration bond program. This program was discontinued in the second quarter of 2004. For a more detailed description of this program, see Note 16 to the Consolidated Financial Statements. |
| |
| | | | The Company sells its insurance products through multiple distribution channels, including three managing general agents, |
40
| | | | approximately thirty-five independent agents and direct sales. |
| |
| | | | Municipal Code Publishing. On August 31, 2006, the Company sold its wholly-owned subsidiary, American Legal Publishing Corporation (“ALPC”), which codifies, publishes, supplements and distributes ordinances for municipalities and counties nationwide in addition to state governments. Ordinance codification is the process of collecting, organizing and publishing legislation for state and local governments. ALPC also provides information management services which include electronic publishing, document imaging and internet hosting services. See “Sale of Affiliate” below for more information concerning this transaction. |
| |
| | | | Insurance Agency. In July 2002, we formed Ultimate Services Agency, LLC (“USA”), a wholly-owned subsidiary. We formed USA to act as an agency for placing and servicing property/casualty insurance policies offered and underwritten by Ohio Indemnity and by other property/casualty insurance companies. |
| |
| | | | Sale of Affiliate |
| |
| | | | On August 31, 2006, the Company entered into a Stock Purchase Agreement (the “Agreement”) with A.L.P. Acquisition Co., Inc., an Ohio corporation (the “Purchaser”), whereby the Company sold 100% of the issued and outstanding common shares of ALPC to the Purchaser for $4,620,000 subject to customary post-closing adjustments (the “Sale”). The Company received cash of $4,150,000 and a promissory note in the principal amount of $470,000 (the “Promissory Note”) from the Purchaser at the closing in connection with the Sale. On September 1, 2006, the Purchaser made a principal payment to the Company on the Promissory Note in the amount of $345,000, bringing the remaining principal balance of the Promissory Note to $125,000 which is to be repaid in six monthly installments and bears interest at an annual rate of 8.0%. As of December 31, 2006, the principal balance of the promissory note was $62,500. |
| |
| | | | The Purchaser was organized by Steven G. Wolf, who has served as President of ALPC since 1984 and as a director of ALPC since 2000. Mr. Wolf and certain other employees of ALPC collectively own a significant equity interest in the Purchaser. |
| |
| | | | In conjunction with the Sale, on August 31, 2006, the Company also made an investment (the “Investment”) in the Purchaser in the amount of $250,000, consisting of (1) a $137,500 cash purchase of equity securities of the Purchaser and (2) a $112,500 loan to the Purchaser in the form of a subordinated convertible promissory note (the “Convertible Note”). The Convertible Note is to be repaid on August 31, 2016 (if not previously converted), bears interest at an annual rate of 8.0% and is convertible at any time at the option of the Company into additional equity securities of the Purchaser. |
| |
| | | | In connection with the Sale and the Investment, the Company recorded a net realized gain of approximately $2.5 million ($1.7 million after tax) for the year ended December 31, 2006. |
| |
| | (b) | | Basis of Financial Statement Presentation |
| |
| | | | Our accompanying consolidated financial statements have been prepared in accordance with accounting principles generally accepted in the United States of America (“GAAP”) which vary in certain respects from accounting practices prescribed or permitted by the Department. |
| |
| | | | The preparation of financial statements in conformity with GAAP requires management to make estimates and assumptions that affect the reported amounts of assets and liabilities, the disclosure of contingent assets and liabilities at the date of the financial statements and the reported amounts of revenues and expenses during the reporting period. Actual results could differ materially from those estimates. |
| |
| | (c) | | New Accounting Standards |
| |
| | | | In June 2006, the Financial Accounting Standards Board (“FASB”) issued Interpretation No. 48 (“FIN 48”), “Accounting for Uncertainty in Income Taxes,” which prescribes a recognition threshold and measurement attribute for the financial statement recognition and measurement of a tax position taken or expected to be taken in a tax return. In accordance with FIN 48, the Company must adjust its financial statements to reflect only those tax positions that are more-likely-than-not to be sustained as of the adoption date. The effective date of FIN 48 for the Company is January 1, 2007. The adoption of FIN 48 is not expected to have a material impact on the Company’s Consolidated Financial Statements . |
| |
| | | | In September 2006, the FASB issued Statement of Financial Accounting Standards (“SFAS”) No. 157, “Fair Value Measurements.” This Statement defines fair value, establishes a framework for measuring fair value in accordance with GAAP, and expands disclosures about fair value measurements. The Statement clarifies the rule that fair value be based on the assumptions that market participants would use when pricing an asset or liability, and establishes a fair value hierarchy that prioritizes the framework and information used to develop those assumptions. The Company is required to adopt the provisions of SFAS No. 157 for financial statements issued for fiscal years beginning after November 15, 2007. The adoption of SFAS No. 157 is not expected to have a material impact on the Company’s Consolidated Financial Statements . |
| |
| | (d) | | Consolidation Policy |
| |
| | | | The accompanying financial statements include the Company’s accounts and our wholly-owned subsidiaries. All significant intercompany transactions and balances have been eliminated in consolidation. |
41
| |
| | (e) | | Investments |
| |
| | | | Investments in held to maturity fixed maturities where we have the ability and intent to hold to maturity, are carried at amortized cost. Investments in fixed maturities held as available for sale, which include debt securities and redeemable preferred stock, are carried at fair value. The unrealized holding gain or loss, net of applicable deferred taxes and reclassification adjustment, is reflected in other comprehensive income. |
| |
| | | | Available for sale equity securities, which include common stock, non-redeemable preferred stock and mutual funds, are reported at fair value with unrealized gains or losses, net of applicable deferred taxes and reclassification adjustment, reflected in other comprehensive income. Short-term investments are reported at cost which approximates fair value. Other invested assets are reported at cost or using the equity method. |
| |
| | | | Realized gains and losses on disposal of investments are determined by the specific identification method. The carrying value of an investment is revised and the amount of revision is charged to net realized losses on investments when management determines that a decline in the value of an investment is other-than-temporary. |
| |
| | | | For fixed maturity securities purchased at a premium or discount, amortization is calculated using the scientific (constant yield) interest method taking into consideration specified interest and principal provisions over the life of the security. Fixed maturity securities containing call provisions (where the security can be called away from the reporting entity at the issuer’s discretion) are amortized to the call or maturity value/date which produces the lowest asset value (yield to worst). |
| |
| | (f) | | Accounts Receivable |
| |
| | | | Accounts receivable was comprised of ALPC’s municipal code contract billings. We estimated our allowance for doubtful accounts and bad debts based upon our assessment of the collectibility of receivables and prior experience. On August 31, 2006, the Company sold its municipal code publishing segment as more fully described above in “Sale of Affiliate.” |
| |
| | (g) | | Goodwill |
| |
| | | | As part of its annual goodwill impairment testing in the fourth quarter of 2004, the Company concluded that an impairment of goodwill existed at its property/casualty insurance segment. The Company, with the assistance of an independent appraisal firm, determined that the carrying value of the reporting segment exceeded the fair value of the reporting segment, resulting in a non-cash impairment charge. The fair value of the reporting segment was estimated using the expected present value of future cash flows. As a result of this impairment, the Company a recorded non-cash impairment charge in the fourth quarter of 2004 in the aggregate amount of $753,737. |
| |
| | (h) | | Intangible Asset |
| |
| | | | Intangible assets represented databases acquired by ALPC and a non-compete agreement. The databases were comprised of municipal code data and related files, which were amortized on a straight-line basis over the estimated economic useful lives of twenty years. The non-compete agreement was amortized on a straight-line basis over the contractual life of five years, which ended August 31, 2006. On August 31, 2006, the Company sold its municipal code publishing segment as more fully described above in “Sale of Affiliate.” |
| |
| | (i) | | Recognition of Revenue |
| |
| | | | Ohio Indemnity’s insurance premiums and ceded commissions are earned over the terms of the related insurance policies and reinsurance contracts. For our ULI and GAP products, premiums are earned over the contract period in proportion to the amount of insurance protection provided as the amount of insurance protection declines according to a predetermined schedule. For all other products, premiums are earned pro rata over the contract period. The portion of premiums written applicable to the unexpired portion of insurance policies is recorded in the balance sheet as unearned premiums. |
| |
| | | | Revenue from ALPC municipal code contracts was recognized on the percentage-of-completion method. Completion was measured based on the percentage of direct labor costs incurred-to-date compared to estimated direct labor costs for each contract. While we used available information to estimate total direct labor costs on each contract, actual experience may vary from estimated amounts. Revenue from code supplements was recognized on the completed-contract method because the typical supplement is completed in a few months. On August 31, 2006, the Company sold its municipal code publishing segment as more fully described above in “Sale of Affiliate.” |
| |
| | | | Commission and fee revenues for USA are recognized when earned based on contractual rates and services provided. |
| |
| | (j) | | Deferred Policy Acquisition Costs |
| |
| | | | Acquisition expenses, mainly commissions and premium taxes, related to unearned premiums are deferred and amortized over the period the coverage is provided. Anticipated losses and other expenses related to those premiums are considered in determining the recoverability of deferred acquisition costs. |
42
| | (k) | | Reserve for Unpaid Losses and Loss Adjustment Expenses |
| |
| | | | Loss and loss adjustment expense (“LAE”) reserves represent our best estimate of the ultimate net cost of all reported and unreported losses incurred through December 31. We do not discount loss and LAE reserves. The reserves for unpaid losses and LAE are estimated using individual case-basis valuations, statistical analyses and reports received from ceding insurers under assumed reinsurance. Those estimates are subject to the effects of trends in loss severity and frequency. Although considerable variability is inherent in such estimates, we believe the reserves for losses and LAE are adequate. The estimates are regularly reviewed and adjusted as necessary as experience develops or new information becomes known. Such adjustments are included in results of operations in the period such adjustments are made. |
| |
| | (l) | | Reinsurance |
| |
| | | | In the ordinary course of business, we cede and assume reinsurance with other insurers and reinsurers. We report balances pertaining to reinsurance transactions “gross” on the balance sheet, meaning that reinsurance recoverables on unpaid losses and LAE and ceded unearned premiums are not deducted from insurance reserves but are recorded as assets. Ceded reinsurance transactions for the Company include quota share arrangements for certain lender/dealer producers. The Company also participates in a waste surety bond program and certain other surety bond programs under several quota share arrangements in which the Company assumes and cedes business. In addition, the Company cedes certain service contract business under a reinsurance arrangement. Lastly, the Company assumed bail and immigration bond business through the second quarter of 2004 after which the program was discontinued. See Note 16 to the Consolidated Financial Statements for more information concerning the Company’s reinsurance transactions. |
| |
| | (m) | | Experience Rating and Retrospective Premium Adjustments |
| |
| | | | Certain ULI policies are eligible for premium adjustments based on loss experience. For certain policies, return premiums are calculated and settled on an annual basis. These balances are presented in the accompanying balance sheets as retrospective premium adjustments payable. Certain other policies are eligible for an experience rating adjustment that is calculated and adjusted from period to period and settled upon cancellation of the policy. These balances are presented in the accompanying balance sheets as experience rating adjustments payable. These adjustments are included in the calculation of net premiums earned. |
| |
| | (n) | | Contract Funds on Deposit |
| |
| | | | Pursuant to the terms of certain surety bonds issued by the Company that guarantee the payment of reimbursable unemployment compensation benefits, certain monies are held by the Company in contract funds on deposit and are used for the payment of benefit charges. The Company has agreements with cost containment service firms designed to control the unemployment compensation costs of the employers enrolled in the program. Any remaining funds after the payment of all benefit charges are shared between the Company and the cost containment firms as management fees. Management fees are recognized when earned based on the development of benefit charges. Management fees of $830,329, $713,697 and $33,710 were recognized in 2006, 2005 and 2004, respectively, as a result of this arrangement. |
| |
| | (o) | | Depreciation and Amortization |
| |
| | | | Real estate is stated at cost and depreciated using the straight-line method over thirty-nine years. Property, equipment and internally-developed computer software are stated at cost and depreciated using the straight-line method over the estimated useful life, ranging from three to five years. Leasehold improvements are capitalized and amortized over the remaining office lease term. Maintenance and repairs are charged directly to expense as incurred. As of December 31, 2006 and 2005, property, equipment, computer software and leasehold improvements, net of accumulated depreciation, was $636,966 and $484,525, respectively. These balances are presented in the accompanying balance sheets as other assets. |
| |
| | (p) | | Federal Income Taxes |
| |
| | | | We file a consolidated federal income tax return with our subsidiaries. Accordingly, deferred tax liabilities and assets have been recognized for the expected future tax consequences of events that have been included in the financial statements or tax returns. Deferred income taxes are recognized at prevailing income tax rates for temporary differences between financial statement and income tax basis of assets and liabilities for which income tax benefits will be realized in future years. |
| |
| | (q) | | Cash and Cash Equivalents |
| |
| | | | Cash and cash equivalents include all cash balances and highly liquid investments with an initial maturity of three months or less. Cash equivalents are stated at cost, which approximates fair value. The Company places its cash investments with high credit quality financial institutions. |
| |
| | (r) | | Equity-Based Compensation |
| |
| | | | Prior to the first quarter of 2006, the Company accounted for equity-based awards under the intrinsic value method, which followed the recognition and measurement principles of Accounting Principles Board (“APB”) Opinion No. 25, “Accounting for Stock Issued to Employees,” and related interpretations. Therefore, no compensation expense was recognized in net income, as all options granted had an exercise price equal to the fair value of the underlying stock on the date of grant. The following table illustrates the effect on net income and income per share if the Company had adopted the fair value recognition provisions of SFAS No. 123(R), “Share-Based Payment,” for 2005 and 2004: |
43
| | | | | | | | | |
| | | December 31, | | | December 31, | |
| | | 2005 | | | 2004 | |
| Net income (loss), as reported | | $ | 6,294,074 | | | $ | (8,500,620 | ) |
| Deduct: Total equity-based compensation expense determined under “fair value” based method for all awards, net of related tax effects | | | (84,641 | ) | | | (88,662 | ) |
| | | | | | | |
| Pro forma net income (loss) | | $ | 6,209,433 | | | $ | (8,589,282 | ) |
| | | | | | | |
| | | | | | | | | |
| Net income (loss) per common share: | | | | | | | | |
| | | | | | | | | |
| Basic, as reported | | $ | 1.27 | | | $ | (1.72 | ) |
| Basic, pro forma | | $ | 1.25 | | | $ | (1.74 | ) |
| Diluted, as reported | | $ | 1.26 | | | $ | (1.72 | ) |
| Diluted, pro forma | | $ | 1.24 | | | $ | (1.74 | ) |
| | | | See Note 11 to the Consolidated Financial Statements for more information concerning equity-based compensation. |
| | (s) | | Reclassification |
| |
| | | | Certain prior year amounts have been reclassified in order to conform to the 2006 presentation. |
(2) INVESTMENTS
| | | The amortized cost, gross unrealized gains and losses and estimated fair value of investments in held to maturity and available for sale securities were as follows: |
| | | | | | | | | | | | | | | | | |
| | | December 31, 2006 | |
| | | | | | | Gross | | | Gross | | | Estimated | |
| | | Amortized | | | unrealized | | | unrealized | | | fair | |
| | | cost | | | gains | | | losses | | | value | |
| Held to maturity: | | | | | | | | | | | | | | | | |
| Fixed maturities: | | | | | | | | | | | | | | | | |
| US Treasury securities and obligations of US Government corporations and agencies | | $ | 1,356,518 | | | $ | — | | | $ | 1,049 | | | $ | 1,355,469 | |
| Obligations of states and political subdivisions | | | 3,437,066 | | | | 74,614 | | | | 16,163 | | | | 3,495,517 | |
| | | | | | | | | | | | | |
| Total held to maturity | | | 4,793,584 | | | | 74,614 | | | | 17,212 | | | | 4,850,986 | |
| | | | | | | | | | | | | |
| Available for sale: | | | | | | | | | | | | | | | | |
| Fixed maturities: | | | | | | | | | | | | | | | | |
| Obligations of states and political subdivisions | | | 63,871,649 | | | | 825,611 | | | | 70,349 | | | | 64,626,911 | |
| Corporate securities | | | 4,063,130 | | | | 4,981 | | | | 147,136 | | | | 3,920,975 | |
| | | | | | | | | | | | | |
| Total fixed maturities | | | 67,934,779 | | | | 830,592 | | | | 217,485 | | | | 68,547,886 | |
| Equity securities | | | 8,277,307 | | | | 1,244,046 | | | | 121,106 | | | | 9,400,247 | |
| | | | | | | | | | | | | |
| Total available for sale | | | 76,212,086 | | | | 2,074,638 | | | | 338,591 | | | | 77,948,133 | |
| | | | | | | | | | | | | |
| | | | | | | | | | | | | | | | | |
| Total | | $ | 81,005,670 | | | $ | 2,149,252 | | | $ | 355,803 | | | $ | 82,799,119 | |
| | | | | | | | | | | | | |
44
| | | | | | | | | | | | | | | | | |
| | | December 31, 2005 | |
| | | | | | | Gross | | | Gross | | | Estimated | |
| | | Amortized | | | unrealized | | | unrealized | | | fair | |
| | | cost | | | gains | | | losses | | | value | |
| Held to maturity: | | | | | | | | | | | | | | | | |
| Fixed maturities: | | | | | | | | | | | | | | | | |
| US Treasury securities and obligations of US Government corporations and agencies | | $ | 1,149,676 | | | $ | — | | | $ | 16,348 | | | $ | 1,133,328 | |
| Obligations of states and political subdivisions | | | 3,671,953 | | | | 69,590 | | | | 18,247 | | | | 3,723,296 | |
| | | | | | | | | | | | | |
| Total held to maturity | | | 4,821,629 | | | | 69,590 | | | | 34,595 | | | | 4,856,624 | |
| | | | | | | | | | | | | |
| Available for sale: | | | | | | | | | | | | | | | | |
| Fixed maturities: | | | | | | | | | | | | | | | | |
| US Treasury securities and obligations of US Government corporations and agencies | | | 4,126,893 | | | | — | | | | 32,627 | | | | 4,094,266 | |
| Obligations of states and political subdivisions | | | 64,245,160 | | | | 681,930 | | | | 124,876 | | | | 64,802,214 | |
| Corporate securities | | | 4,190,151 | | | | — | | | | 74,391 | | | | 4,115,760 | |
| | | | | | | | | | | | | |
| Total fixed maturities | | | 72,562,204 | | | | 681,930 | | | | 231,894 | | | | 73,012,240 | |
| Equity securities | | | 7,597,066 | | | | 889,141 | | | | 442,908 | | | | 8,043,299 | |
| | | | | | | | | | | | | |
| Total available for sale | | | 80,159,270 | | | | 1,571,071 | | | | 674,802 | | | | 81,055,539 | |
| | | | | | | | | | | | | |
| | | | | | | | | | | | | | | | | |
| Total | | $ | 84,980,899 | | | $ | 1,640,661 | | | $ | 709,397 | | | $ | 85,912,163 | |
| | | | | | | | | | | | | |
The amortized cost and estimated fair value of fixed maturity investments in held to maturity and available for sale securities at December 31, 2006, by contractual maturity, are shown below. Expected maturities will differ from contractual maturities because borrowers may have the right to call or prepay obligations with or without call or prepayment penalties.
| | | | | | | | | | | | | | | | | |
| | | December 31, 2006 | |
| | | Held to Maturity | | | Available for Sale | |
| | | Amortized | | | Estimated | | | Amortized | | | Estimated | |
| | | cost | | | fair value | | | cost | | | fair value | |
| Due in one year or less | | $ | 582,006 | | | $ | 577,386 | | | $ | 879,397 | | | $ | 884,546 | |
| Due after one year but less than five years | | | 2,625,791 | | | | 2,645,385 | | | | 3,154,123 | | | | 3,158,397 | |
| Due after five years but less than ten years | | | 378,798 | | | | 369,701 | | | | 10,491,782 | | | | 10,461,312 | |
| Due after ten years | | | 1,206,989 | | | | 1,258,514 | | | | 53,409,477 | | | | 54,043,631 | |
| | | | | | | | | | | | | |
| Total | | $ | 4,793,584 | | | $ | 4,850,986 | | | $ | 67,934,779 | | | $ | 68,547,886 | |
| | | | | | | | | | | | | |
Net investment income for the year ended December 31 is summarized below:
| | | | | | | | | | | | | |
| | | 2006 | | | 2005 | | | 2004 | |
| Fixed maturities | | $ | 3,251,113 | | | $ | 2,732,635 | | | $ | 1,826,432 | |
| Equity securities | | | 577,851 | | | | 555,414 | | | | 236,528 | |
| Short-term investments | | | 302,620 | | | | 239,643 | | | | 225,190 | |
| Other | | | 42,914 | | | | 34,531 | | | | 25,926 | |
| Expenses | | | (329,434 | ) | | | (259,564 | ) | | | (149,961 | ) |
| | | | | | | | | | |
| Net investment income | | $ | 3,845,064 | | | $ | 3,302,659 | | | $ | 2,164,115 | |
| | | | | | | | | | |
The proceeds from sales of available for sale securities were $43,604,109, $47,636,072 and $28,255,910 for the years ended December 31, 2006, 2005 and 2004, respectively.
45
Pre-tax net realized gains (losses) on investments and changes in unrealized gains (losses) on available for sale investments were as follows for each of the years ended December 31:
| | | | | | | | | | | | | |
| | | 2006 | | | 2005 | | | 2004 | |
| Gross realized gains: | | | | | | | | | | | | |
| Fixed maturities | | $ | 86,955 | | | $ | 157,808 | | | $ | 55,923 | |
| Equity securities | | | 76,801 | | | | 1,388,129 | | | | 1,781,330 | |
| Other | | | — | | | | — | | | | 983 | |
| | | | | | | | | | |
| Total gains | | | 163,756 | | | | 1,545,937 | | | | 1,838,236 | |
| | | | | | | | | | |
| Gross realized losses: | | | | | | | | | | | | |
| Fixed maturities | | | 97,945 | | | | 157,109 | | | | 69,659 | |
| Equity securities | | | 2,687 | | | | 107,073 | | | | 138,916 | |
| Other | | | 95 | | | | — | | | | — | |
| Other-than-temporary impairments | | | 7,310 | | | | — | | | | 535,487 | |
| | | | | | | | | | |
| Total losses | | | 108,037 | | | | 264,182 | | | | 744,062 | |
| | | | | | | | | | |
| | | | | | | | | | | | | |
| Net realized gains | | $ | 55,719 | | | $ | 1,281,755 | | | $ | 1,094,174 | |
| | | | | | | | | | |
| | | | | | | | | | | | | |
| Changes in unrealized gains (losses) on available for sale investments: | | | | | | | | | | | | |
| Fixed maturities | | $ | 163,072 | | | $ | (282,487 | ) | | $ | 437,009 | |
| Equity securities | | | 676,707 | | | | (1,324,689 | ) | | | (847,352 | ) |
| | | | | | | | | | |
| Net change in unrealized gains (losses) | | $ | 839,779 | | | $ | (1,607,176 | ) | | $ | (410,343 | ) |
| | | | | | | | | | |
The following table summarizes the estimated fair value and gross unrealized losses (pre-tax) for all securities in an unrealized loss position at December 31, 2006 and December 31, 2005, distinguishing between those securities which have been continuously in an unrealized loss position for less than twelve months and greater than twelve months.
| | | | | | | | | | | | | | | | | | | | | | | | | |
| | | Less Than 12 Months | | | 12 Months or Greater | | | Total | |
| | | Estimated | | | Gross | | | Estimated | | | Gross | | | Estimated | | | Gross | |
| | | fair | | | unrealized | | | fair | | | unrealized | | | fair | | | unrealized | |
| At December 31, 2006 | | value | | | loss | | | value | | | loss | | | value | | | loss | |
| Fixed maturities: | | | | | | | | | | | | | | | | | | | | | | | | |
| U.S. Treasury securities and obligations of U.S. Government corporations and agencies | | $ | 1,255,719 | | | $ | 975 | | | $ | 99,750 | | | $ | 74 | | | $ | 1,355,469 | | | $ | 1,049 | |
| Obligations of states and political subdivisions | | | 11,102,504 | | | | 52,735 | | | | 4,562,504 | | | | 33,777 | | | | 15,665,008 | | | | 86,512 | |
| Corporate securities | | | 883,640 | | | | 1,360 | | | | 2,017,955 | | | | 145,776 | | | | 2,901,595 | | | | 147,136 | |
| | | | | | | | | | | | | | | | | | | |
| Total fixed maturities | | | 13,241,863 | | | | 55,070 | | | | 6,680,209 | | | | 179,627 | | | | 19,922,072 | | | | 234,697 | |
| Equity securities | | | 1,109,875 | | | | 15,558 | | | | 2,947,643 | | | | 105,548 | | | | 4,057,518 | | | | 121,106 | |
| | | | | | | | | | | | | | | | | | | |
| Total | | $ | 14,351,738 | | | $ | 70,628 | | | $ | 9,627,852 | | | $ | 285,175 | | | $ | 23,979,590 | | | $ | 355,803 | |
| | | | | | | | | | | | | | | | | | | |
| | | | | | | | | | | | | | | | | | | | | | | | | |
| | | Less Than 12 Months | | | 12 Months or Greater | | | Total | |
| | | Estimated | | | Gross | | | Estimated | | | Gross | | | Estimated | | | Gross | |
| | | fair | | | unrealized | | | fair | | | unrealized | | | fair | | | unrealized | |
| At December 31, 2005 | | value | | | loss | | | value | | | loss | | | value | | | loss | |
| Fixed maturities: | | | | | | | | | | | | | | | | | | | | | | | | |
| U.S. Treasury securities and obligations of U.S. Government corporations and agencies | | $ | 4,193,047 | | | $ | 32,627 | | | $ | 1,034,547 | | | $ | 16,348 | | | $ | 5,227,594 | | | $ | 48,975 | |
| Obligations of states and political subdivisions | | | 17,398,953 | | | | 112,464 | | | | 1,709,875 | | | | 30,659 | | | | 19,108,828 | | | | 143,123 | |
| Corporate securities | | | 3,865,760 | | | | 74,391 | | | | — | | | | — | | | | 3,865,760 | | | | 74,391 | |
| | | | | | | | | | | | | | | | | | | |
| Total fixed maturities | | | 25,457,760 | | | | 219,482 | | | | 2,744,422 | | | | 47,007 | | | | 28,202,182 | | | | 266,489 | |
| Equity securities | | | 4,793,807 | | | | 403,593 | | | | 708,780 | | | | 39,315 | | | | 5,502,587 | | | | 442,908 | |
| | | | | | | | | | | | | | | | | | | |
| Total | | $ | 30,251,567 | | | $ | 623,075 | | | $ | 3,453,202 | | | $ | 86,322 | | | $ | 33,704,769 | | | $ | 709,397 | |
| | | | | | | | | | | | | | | | | | | |
The Company continually monitors developments affecting our invested assets, paying particular attention to events that might give rise to impairment write-downs, including but not limited to: (1) the length of time and extent to which the estimated fair value has been less than book value; (2) whether the decline appears to be related to general market or industry conditions or is issuer-specific; and (3) our ability and intent to hold the security for a period of time sufficient to allow for recovery in the estimated fair value. There were $7,310, $0 and $535,487 in impairment charges included in net realized gains on investments for the years ended December 31, 2006, 2005 and 2004, respectively. Included in impairment charges for 2004 is a write down of $334,136 related to a private equity investment due to its financial uncertainty. As part of the Company’s normal assessment of other-than-temporary impairments of investments, the securities listed above were evaluated and no further impairments were deemed necessary as of December 31, 2006.
46
| | | At December 31, 2006, investments having a carrying value of $4,538,220 were on deposit with various state insurance departments to meet their respective regulatory requirements. |
| |
| (3) | | DEFERRED POLICY ACQUISITION COSTS |
| |
| | | Changes in deferred policy acquisition costs for the year ended December 31 are summarized as follows: |
| | | | | | | | | | | | | |
| | | 2006 | | | 2005 | | | 2004 | |
| Deferred, January 1 | | $ | 9,678,821 | | | $ | 7,223,995 | | | $ | 4,962,150 | |
| Additions: | | | | | | | | | | | | |
| Commissions | | | 8,893,883 | | | | 10,215,611 | | | | 7,124,437 | |
| Premium tax | | | 587,637 | | | | 604,559 | | | | 397,168 | |
| | | | | | | | | | |
| Total additions | | | 9,481,520 | | | | 10,820,170 | | | | 7,521,605 | |
| | | | | | | | | | |
| | | | | | | | | | | | | |
| Amortization to expense | | | 9,705,931 | | | | 8,365,344 | | | | 5,259,760 | |
| | | | | | | | | | |
| | | | | | | | | | | | | |
| Deferred, December 31 | | $ | 9,454,410 | | | $ | 9,678,821 | | | $ | 7,223,995 | |
| | | | | | | | | | |
| (4) | | UNCOMPLETED CONTRACTS |
| |
| | | Revenues earned on uncompleted codification contracts by ALPC were $0 and $1,452,739 and billings to date on those contracts were $0 and $1,279,812 at December 31, 2006 and 2005, respectively. The excess of costs and estimated earnings over billings were $0 and $248,035 at December 31, 2006 and 2005, respectively. On August 31, 2006, the Company sold its municipal code publishing segment as more fully described above in Note 1 to the Consolidated Financial Statements. |
| |
| (5) | | GOODWILL AND INTANGIBLE ASSETS |
| |
| | | As part of its annual goodwill impairment testing in the fourth quarter of 2004, the Company concluded that an impairment of goodwill existed at its property/casualty insurance segment. The Company performed impairment testing in accordance with SFAS No. 142, “Goodwill and Other Intangible Assets.” The Company, with the assistance of an independent appraisal firm, determined that the carrying value of the reporting segment exceeded the fair value of the reporting segment, resulting in a non-cash impairment charge. The fair value of the reporting segment was estimated using the expected present value of future cash flows. As a result of this impairment, the Company recorded a non-cash impairment charge in the fourth quarter of 2004 in the aggregate amount of $753,737. |
| |
| | | Intangible assets as of December 31 were as follows: |
| | | | | | | | | | | | | | | | | | | | | | | | | | | | | |
| | | December 31, 2006 | | | December 31, 2005 | |
| | | | | | | Accumulated | | | Sale of | | | | | | | | | | | Accumulated | | | | |
| | | Cost | | | amortization | | | affiliate | | | Net | | | Cost | | | amortization | | | Net | |
| Amortizing intangibles: | | | | | | | | | | | | | | | | | | | | | | | | | | | | |
| Databases | | $ | 1,008,773 | | | $ | (287,505 | ) | | $ | (721,268 | ) | | $ | — | | | $ | 1,008,773 | | | $ | (253,879 | ) | | $ | 754,894 | |
| Noncompete agreement | | | 120,394 | | | | (120,328 | ) | | | (66 | ) | | | — | | | | 120,394 | | | | (104,275 | ) | | | 16,119 | |
| | | | | | | | | | | | | | | | | | | | | | |
| | | | | | | | | | | | | | | | | | | | | | | | | | | | | |
| Total intangible assets | | $ | 1,129,167 | | | $ | (407,833 | ) | | $ | (721,334 | ) | | $ | — | | | $ | 1,129,167 | | | $ | (358,154 | ) | | $ | 771,013 | |
| | | | | | | | | | | | | | | | | | | | | | |
| | | Amortization expense related to amortizable intangible assets was $49,679, $74,518 and $74,517 during 2006, 2005 and 2004, respectively. On August 31, 2006, the Company sold its municipal code publishing segment as more fully described above in Note 1 to the Consolidated Financial Statements. |
| |
| (6) | | NOTES PAYABLE |
| |
| | | We have a $10,000,000 unsecured revolving line of credit with a maturity date of June 30, 2009 with no outstanding balance at December 31, 2006 and December 31, 2005. The revolving line of credit provides for interest payable quarterly at an annual rate equal to the prime rate less 75 basis points. The Company utilizes the line of credit from time to time based on short-term cash flow needs. The terms of the revolving credit agreement contain various restrictive covenants. As of December 31, 2006, the Company was in compliance with all such covenants. The bank that provides the line of credit is also a policyholder of the Company. |
47
| (7) | | LEASE EXPENSES |
| |
| | | We routinely lease premises for use as administrative offices, vehicles and office equipment under operating leases for varying periods. Management expects that in the normal course of business, leases will be renewed or replaced by other leases. Effective January 2001, we entered into a new lease for our Columbus, Ohio office space. Under its provisions, no cash payments were due until April 1, 2002. Rent expense is recognized evenly over the lease term ending December 31, 2008. Rental expenses under operating leases were $251,768, $265,852 and $274,300 for the years ended December 31, 2006, 2005 and 2004, respectively. |
| |
| | | The future minimum lease payments required under operating leases for the next five fiscal years are as follows: |
| | | | | |
| 2007 | | $ | 224,009 | |
| 2008 | | | 229,943 | |
| 2009 | | | — | |
| 2010 | | | — | |
| 2011 | | | — | |
| | | | |
| | | $ | 453,952 | |
| | | | |
| (8) | | TRUST PREFERRED DEBT ISSUED TO AFFILIATES |
| |
| | | In December 2002, we organized BIC Statutory Trust I (“BIC Trust I”), a Connecticut special purpose business trust, which issued $8,000,000 of floating rate trust preferred capital securities in an exempt private placement transaction. BIC Trust I also issued $248,000 of floating rate common securities to Bancinsurance. In September 2003, we organized BIC Statutory Trust II (“BIC Trust II”), a Delaware special purpose business trust, which issued $7,000,000 of floating rate trust preferred capital securities in an exempt private placement transaction. BIC Trust II also issued $217,000 of floating rate common securities to Bancinsurance. BIC Trust I and BIC Trust II were formed for the sole purpose of issuing and selling the floating rate trust preferred capital securities and investing the proceeds from such securities in junior subordinated debentures of the Company. In connection with the issuance of the trust preferred capital securities, the Company issued junior subordinated debentures of $8,248,000 and $7,217,000 to BIC Trust I and BIC Trust II, respectively. The floating rate trust preferred capital securities and the junior subordinated debentures have substantially the same terms and conditions. The Company has fully and unconditionally guaranteed the obligations of BIC Trust I and BIC Trust II with respect to the floating rate trust preferred capital securities. BIC Trust I and BIC Trust II distribute the interest received from the Company on the junior subordinated debentures to the holders of their floating rate trust preferred capital securities to fulfill their dividend obligations with respect to such trust preferred securities. BIC Trust I’s floating rate trust preferred capital securities, and the junior subordinated debentures issued in connection therewith, pay dividends and interest, as applicable, on a quarterly basis at a rate equal to three month LIBOR plus four hundred basis points (9.37% and 8.44% at December 31, 2006 and 2005, respectively), are redeemable at par on or after December 4, 2007 and mature on December 4, 2032. BIC Trust II’s floating rate trust preferred capital securities, and the junior subordinated debentures issued in connection therewith, pay dividends and interest, as applicable, on a quarterly basis at a rate equal to three month LIBOR plus four hundred and five basis points (9.41% and 8.58% at December 31, 2006 and 2005, respectively), are redeemable at par on or after September 30, 2008 and mature on September 30, 2033. Interest on the junior subordinated debentures is charged to income as it accrues. Interest expense related to the junior subordinated debentures for the years ended December 31, 2006, 2005 and 2004 was $1,427,241, $1,148,431and $862,256, respectively. The terms of the junior subordinated debentures contain various restrictive covenants. As of December 31, 2006, the Company was in compliance with all such covenants. |
| |
| | | In January 2003, the FASB issued Interpretation No. 46 (“FIN 46”), “Consolidation of Variable Interest Entities,” which requires the consolidation of certain entities considered to be variable interest entities (“VIEs”). An entity is considered to be a VIE when it has equity investors who lack the characteristics of having a controlling financial interest, or its capital is insufficient to permit it to finance its activities without additional subordinated financial support. Consolidation of a VIE by an investor is required when it is determined that the investor will absorb a majority of the VIE’s expected losses if they occur, receive a majority of the VIE’s expected residual returns if they occur, or both. In accordance with FIN 46, BIC Trust I and BIC Trust II are not included in the Company’s consolidated financial statements. If they were included in the Company’s consolidated financial statements, there would be no change to net income, only changes in the presentation of the financial statements. |
| |
| (9) | | FEDERAL INCOME TAXES |
| |
| | | Deferred income taxes at December 31 reflect the impact of “temporary differences” between amounts of assets and liabilities for financial reporting purposes and such amounts as measured on an income tax basis. Temporary differences which give rise to the net deferred tax asset at December 31 are as follows: |
48
| | | | | | | | | |
| | | 2006 | | | 2005 | |
| Deferred tax assets: | | | | | | | | |
| Unpaid loss and LAE reserves | | $ | 216,931 | | | $ | 417,169 | |
| Unearned premium reserves | | | 1,901,935 | | | | 2,010,614 | |
| Net operating loss carryforward | | | — | | | | 733,158 | |
| Alternative minimum tax | | | 868,235 | | | | 508,562 | |
| Other-than-temporary impairment of investments | | | 5,872 | | | | 3,386 | |
| Deferred ceded commissions | | | 595,774 | | | | 454,613 | |
| Contingent liabilities | | | 437,308 | | | | — | |
| Other | | | 312,494 | | | | 256,579 | |
| | | | | | | |
| Total deferred tax assets | | | 4,338,549 | | | | 4,384,081 | |
| | | | | | | |
| | | | | | | | | |
| Deferred tax liabilities: | | | | | | | | |
| Net unrealized gains on available for sale securities | | | (590,257 | ) | | | (304,732 | ) |
| Deferred policy acquisition costs | | | (3,214,499 | ) | | | (3,290,799 | ) |
| Accrued dividends receivable | | | (27,142 | ) | | | (10,321 | ) |
| Other | | | (251,938 | ) | | | (292,768 | ) |
| | | | | | | |
| Total deferred tax liabilities | | | (4,083,836 | ) | | | (3,898,620 | ) |
| | | | | | | |
| | | | | | | | | |
| Net deferred tax asset | | $ | 254,713 | | | $ | 485,461 | |
| | | | | | | |
| | | Net deferred tax assets and liabilities and federal income tax expense in future years can be materially affected by changes in enacted tax rates or by unexpected adverse events. |
| |
| | | The provision for federal income taxes for the period ended December 31 consists of the following: |
| | | | | | | | | | | | | |
| | | 2006 | | | 2005 | | | 2004 | |
| Current expense (benefit) | | $ | 1,403,712 | | | $ | 179,239 | | | $ | (2,416,512 | ) |
| Deferred expense (benefit) | | | (54,777 | ) | | | 1,697,332 | | | | (2,350,920 | ) |
| | | | | | | | | | |
| Federal income tax expense (benefit) | | $ | 1,348,935 | | | $ | 1,876,571 | | | $ | (4,767,432 | ) |
| | | | | | | | | | |
| | | The difference between income taxes provided at our effective tax rate and the 34% federal statutory rate for the period ended December 31 is as follows: |
| | | | | | | | | | | | | |
| | | 2006 | | | 2005 | | | 2004 | |
| Federal income tax at statutory rate | | $ | 2,320,104 | | | $ | 2,778,019 | | | $ | (4,511,138 | ) |
| Dividends received deduction and tax exempt interest | | | (927,798 | ) | | | (842,952 | ) | | | (566,581 | ) |
| Business meals and entertainment | | | 21,330 | | | | 21,914 | | | | 35,042 | |
| Goodwill impairment | | | — | | | | — | | | | 256,271 | |
| Other | | | (64,701 | ) | | | (80,410 | ) | | | 18,974 | |
| | | | | | | | | | |
| Federal income tax expense (benefit) | | $ | 1,348,935 | | | $ | 1,876,571 | | | $ | (4,767,432 | ) |
| | | | | | | | | | |
| | | As of December 31, 2006, the Company does not have any uncertain tax positions under FIN 48. As a result, there are no unrecognized tax benefits as of December 31, 2006. The Company’s 1999 through 2005 federal tax returns still remain subject to examination by the Internal Revenue Service. |
| |
| (10) | | BENEFIT PLANS |
| |
| | | The Ohio Indemnity Company Employee 401(k) and Profit Sharing Plan (the “401(k) Plan”) is available to full-time employees who meet the 401(k) Plan’s eligibility requirements. Under the 401(k) Plan, we match 100% of the qualified employee’s contribution up to 3% of salary and 50% of the qualified employee’s contribution between 3% and 5% of salary. The total cost of the matching contribution was $130,075, $126,640 and $224,548 for the years ended December 31, 2006, 2005 and 2004, respectively. |
| |
| (11) | | EQUITY-BASED COMPENSATION |
| |
| | | The Company maintains two equity compensation plans (collectively, the “Plans”) for the benefit of certain of its officers, directors, employees, consultants and advisors. During the first quarter of 2006, the Company adopted SFAS No. 123(R), “Share-Based Payment,” applying the modified prospective method. SFAS No. 123(R) requires all equity-based payments to employees and directors, including grants of stock options, to be recognized in net income based on the grant date fair value of the award. Under the modified prospective method, the Company is required to record equity-based compensation expense for all awards granted after the |
49
| | | date of adoption and for the nonvested portion of previously granted awards outstanding as of the date of adoption. The results for prior periods have not been restated. |
| |
| | | The Company has stock options outstanding and exercisable at December 31, 2006 under two equity compensation plans, each of which has been approved by our shareholders. |
| |
| | | The 1994 Stock Option Plan (the “1994 Stock Option Plan”) provided for the grants of options, covering up to an aggregate of 500,000 common shares, with a 100,000 common share maximum for any one participant. Key employees, officers and directors of, and consultants and advisors to, the Company were eligible to participate in the 1994 Stock Option Plan. The 1994 Stock Option Plan is administered by the Company’s Compensation Committee which determined to whom and when options were granted along with the terms and conditions of the options. Under the 1994 Stock Option Plan, options for 266,500 common shares were outstanding at December 31, 2006 and expire at various dates from 2007 to 2013 and range in option price per share from $3.88 to $6.25. Of the options for 266,500 common shares outstanding, 32,000 have been granted to our non-employee directors and 234,500 have been granted to employees. All of the options outstanding were granted to employees and directors for compensatory purposes. No new options can be granted under the 1994 Stock Option Plan and the plan remains in effect only with respect to the outstanding options. |
| |
| | | The 2002 Stock Incentive Plan (the “2002 Plan”) provides for awards, including grants of options, covering up to an aggregate of 600,000 common shares. Key employees, officers and directors of, and consultants and advisors to, the Company are eligible to participate in the 2002 Plan. The 2002 Plan is administered by the Compensation Committee which determines to whom and when awards will be granted as well as the terms and conditions of the awards. Under the 2002 Plan, options for 561,000 common shares were outstanding at December 31, 2006 and expire at various dates from 2012 to 2016 and range in option price per share from $4.50 to $8.00. Of the options for 561,000 common shares outstanding, 12,000 have been granted to our non-employee directors and 549,000 have been granted to employees. All of the options outstanding were granted to employees and directors for compensatory purposes. As of December 31, 2006, there were 35,000 shares available for future grant under the 2002 Plan. |
| |
| | | All stock options (1) are granted with an exercise price equal to the market price of the Company’s common shares on the date of grant; (2) have a 10-year contractual term; (3) with respect to officers and employees, vest and become exercisable at the rate of 20% per year over a five-year period; and (4) with respect to non-employee directors, vest and become exercisable after one full year of continuous service. |
| |
| | | The fair value of options granted by the Company during 2006 was estimated on the date of grant using the Black-Scholes option pricing model (“Black-Scholes model”). The Black-Scholes model incorporates ranges of assumptions such as risk-free rate, expected life, expected volatility and dividend yield. The risk-free rate was based on the United States Treasury strip curve at the time of the grant with a term approximating that of the expected option life. The Company analyzed historical data regarding option exercise behaviors, expirations and cancellations to calculate the expected life of the options granted, which represents the length of time in years that the options granted are expected to be outstanding. Expected volatilities were based on historical volatility over a period of time using the expected term of the option grant (6 years) and using weekly stock prices of the Company; however, the Company excluded from its historical volatility the period from February 4, 2005 through January 25, 2006 (the period in which shareholders could not obtain current financial information for the Company and could not rely on the Company’s 2003, 2002, and 2001 financial statements) as the Company believes that its stock price during that period is not relevant in evaluating the expected volatility of its common shares in the future. A 0% dividend yield was used in the Black-Scholes model based on historical dividends. The following table provides the range of assumptions used for options valued during the years ended December 31: |
| | | | | | | | | | | | | |
| | | 2006 | | 2005(1) | | 2004 |
| Risk-free interest rate | | | 4.94%–5.01 | % | | | — | | | | 3.88%–4.26 | % |
| Expected life | | 6 years | | | | — | | | 6 years | |
| Expected volatility | | | 32.01%–32.10 | % | | | — | | | | 27.10%–27.42 | % |
| Dividend yield | | | 0 | % | | | — | | | | 0 | % |
| | |
| (1) | | There were no options granted during 2005. |
| | | The compensation expense recognized for all equity-based awards is net of forfeitures and is recognized over the awards’ service period. In accordance with Staff Accounting Bulletin (“SAB”) No. 107, the Company recorded equity-based compensation expense for the year ended December 31, 2006 in the amount of $217,958 ($143,852 net of tax), which is classified within other insurance operating expenses to correspond with the same line item as cash compensation paid to employees. During 2006, the Company received cash of $38,880 from the exercise of stock options and realized a tax benefit of $3,101 from such option exercises. |
50
| | | The following table summarizes all stock option activity for the Company under the Plans from January 1, 2006 through December 31, 2006: |
| | | | | | | | | | | | | | | | | |
| | | | | | | Weighted-average | | | | |
| | | | | | | exercise price | | Weighted-average | | Aggregate |
| | | Shares | | per common share | | contractual life (years) | | intrinsic value |
| | | |
| Outstanding at January 1, 2006 | | | 613,500 | | | $ | 5.33 | | | | | | | | | |
| Granted | | | 232,000 | | | | 6.00 | | | | | | | | | |
| Exercised | | | (8,000 | ) | | | 4.86 | | | | | | | | | |
| Expired | | | (2,000 | ) | | | 3.38 | | | | | | | | | |
| Cancelled | | | (8,000 | ) | | | 5.33 | | | | | | | | | |
| | | |
| Outstanding at December 31, 2006 | | | 827,500 | | | $ | 5.52 | | | | 6.25 | | | $ | 438,575 | |
| | | |
| Vested and exercisable at December 31, 2006 | | | 443,100 | | | $ | 5.09 | | | | 4.31 | | | $ | 425,376 | |
| | | |
| | | The aggregate intrinsic value represents the total pretax intrinsic value, based on the Company’s last reported bid quotation for the common shares in the “Pink Sheets” as of December 31, 2006 ($6.05), which would have been received by the option holders had all option holders exercised their options as of that date. |
| |
| | | The weighted-average grant-date fair value of options granted during the years ended December 31, 2006, 2005 and 2004 was $2.48, $0 and $2.50, respectively. The total intrinsic value of options exercised during the years ended December 31, 2006, 2005 and 2004 was $9,120, $0 and $172,857, respectively. |
| |
| | | The following table summarizes nonvested stock option activity for the Company under the Plans from January 1, 2006 through December 31, 2006: |
| | | | | | | | | |
| | | | | | | Weighted-average |
| | | | | | | grant date fair value |
| | | Shares | | per common share |
| | | |
| Nonvested at January 1, 2006 | | | 236,600 | | | $ | 2.05 | |
| Granted | | | 232,000 | | | | 2.48 | |
| Vested | | | (82,200 | ) | | | 1.96 | |
| Expired | | | — | | | | — | |
| Cancelled | | | (2,000 | ) | | | 1.70 | |
| | | |
| Nonvested at December 31, 2006 | | | 384,400 | | | $ | 2.33 | |
| | | |
| | | As of December 31, 2006, the total compensation cost related to nonvested stock options not yet recognized was $771,528. The weighted-average period over which this cost is expected to be recognized is approximately 3.4 years. |
| |
| | | The following table summarizes weighted-average information by range of exercise prices for stock options outstanding and exercisable at December 31, 2006: |
| | | | | | | | | | | | | | | | | | | | | |
| | | Options Outstanding | | | Options Exercisable | |
| | | Number | | | Weighted-average | | | Weighted-average | | | Number | | | Weighted-average | |
| | | outstanding | | | remaining | | | exercise | | | exercisable | | | exercise | |
| Range of Exercise Prices | | at 12/31/06 | | | contractual life (years) | | | price | | | at 12/31/06 | | | price | |
| | | |
| $3.875 | | | 25,000 | | | | 0.00 | | | $ | 3.88 | | | | 25,000 | | | $ | 3.88 | |
| 4.00 - 4.82 | | | 236,000 | | | | 3.72 | | | | 4.57 | | | | 213,400 | | | | 4.58 | |
| 5.00 - 5.375 | | | 193,500 | | | | 5.30 | | | | 5.23 | | | | 141,100 | | | | 5.25 | |
| 6.00 - 6.25 | | | 244,000 | | | | 9.20 | | | | 6.00 | | | | 12,000 | | | | 6.08 | |
| 7.04 - 8.00 | | | 129,000 | | | | 7.93 | | | | 7.11 | | | | 51,600 | | | | 7.11 | |
| | | | | | | | | | | | | | | | |
| Total ($3.875 - $8.00) | | | 827,500 | | | | 6.25 | | | $ | 5.52 | | | | 443,100 | | | $ | 5.09 | |
| | | | | | | | | | | | | | | | |
| (12) | | STATUTORY RESTRICTIONS |
| |
| | | Generally, Ohio Indemnity is restricted by the insurance laws of the State of Ohio as to amounts that can be transferred to its parent in the form of dividends, loans, or advances without the approval of the Department. Under these restrictions, during 2007, dividends, loans or advances in excess of $4,915,331 will require the approval of the Department. |
| |
| | | Ohio Indemnity is subject to a risk-based capital test applicable to property/casualty insurers. The risk-based capital test serves as a benchmark of an insurance enterprise’s solvency by state insurance regulators by establishing statutory surplus targets which will require certain company level or regulatory level actions. Ohio Indemnity’s total adjusted capital was in excess of all required action levels at December 31, 2006. |
51
| (13) | | STATUTORY SURPLUS AND NET INCOME |
| |
| | | Ohio Indemnity is statutorily required to file financial statements with state and other regulatory authorities. The accounting principles used to prepare such statutory financial statements follow prescribed or permitted accounting practices as defined in the National Association of Insurance Commissioners Accounting Practices and Procedures Manual, which principles may differ from GAAP. Permitted statutory accounting practices encompass all accounting practices not so prescribed, but allowed by the Department. Ohio Indemnity has no permitted statutory accounting practices. |
| |
| | | As of and for the period ended December 31, Ohio Indemnity’s statutory surplus and net income determined in accordance with statutory accounting practices differed from shareholder’s equity and net income determined in accordance with GAAP by the following: |
| | | | | | | | | | | | | | | | | | | | | | | | | |
| | | Shareholder’s Equity/Surplus | | | Net Income (Loss) | |
| | | 2006 | | | 2005 | | | 2004 | | | 2006 | | | 2005 | | | 2004 | |
| Statutory | | $ | 40,458,732 | | | $ | 34,782,737 | | | $ | 30,879,673 | | | $ | 4,915,331 | | | $ | 5,780,803 | | | $ | (11,300,632 | ) |
| Reconciling items: | | | | | | | | | | | | | | | | | | | | | | | | |
| Non-admitted assets | | | 103,002 | | | | 744,219 | | | | 586,668 | | | | — | | | | — | | | | — | |
| Deferred policy acquisition costs | | | 9,454,410 | | | | 9,678,821 | | | | 7,223,995 | | | | (224,411 | ) | | | 2,454,826 | | | | 2,261,845 | |
| Deferred ceded commissions | | | (1,579,168 | ) | | | (994,459 | ) | | | (465,457 | ) | | | (584,709 | ) | | | (529,002 | ) | | | (94,134 | ) |
| Deferred taxes | | | (2,886,036 | ) | | | (3,105,697 | ) | | | (2,539,073 | ) | | | (108,099 | ) | | | (1,570,402 | ) | | | 2,004,269 | |
| Unrealized gain on available for sale fixed maturities | | | 613,108 | | | | 450,037 | | | | 709,323 | | | | — | | | | — | | | | — | |
| Provision for reinsurance | | | 3,000 | | | | 10,000 | | | | — | | | | — | | | | — | | | | — | |
| Subsequent capital contribution from parent | | | — | | | | — | | | | (4,200,000 | ) | | | — | | | | — | | | | — | |
| | | | | | | | | | | | | | | | | | | |
| GAAP | | $ | 46,167,048 | | | $ | 41,565,658 | | | $ | 32,195,129 | | | $ | 3,998,112 | | | $ | 6,136,225 | | | $ | (7,128,652 | ) |
| | | | | | | | | | | | | | | | | | | |
| (14) | | OTHER COMPREHENSIVE INCOME (LOSS) |
| |
| | | The components of other comprehensive income (loss) and the related federal income tax effects for the years ended December 31, are as follows: |
| | | | | | | | | | | | | |
| | | Year ended December 31, 2006 | |
| | | Pre-tax | | | Income tax | | | Net-of-tax | |
| | | amount | | | expense (benefit) | | | amount | |
| | | |
| Net unrealized holding gains on securities: | | | | | | | | | | | | |
| Unrealized holding gains arising during 2006 | | $ | 895,498 | | | $ | 304,469 | | | $ | 591,029 | |
| Less: reclassification adjustments for gains realized in net income | | | 55,719 | | | | 18,944 | | | | 36,775 | |
| | | | | | | | | | |
| Net unrealized holding gains | | | 839,779 | | | | 285,525 | | | | 554,254 | |
| | | | | | | | | | |
| Other comprehensive income | | $ | 839,779 | | | $ | 285,525 | | | $ | 554,254 | |
| | | | | | | | | | |
| | | | | | | | | | | | | |
| | | Year ended December 31, 2005 | |
| | | Pre-tax | | | Income tax | | | Net-of-tax | |
| | | amount | | | expense (benefit) | | | amount | |
| | | |
| Net unrealized holding gains (losses) on securities: | | | | | | | | | | | | |
| Unrealized holding losses arising during 2005 | | $ | (325,421 | ) | | $ | (110,643 | ) | | $ | (214,778 | ) |
| Less: reclassification adjustments for gains realized in net income | | | 1,281,755 | | | | 435,797 | | | | 845,958 | |
| | | | | | | | | | |
| Net unrealized holding losses | | | (1,607,176 | ) | | | (546,440 | ) | | | (1,060,736 | ) |
| | | | | | | | | | |
| Other comprehensive loss | | $ | (1,607,176 | ) | | $ | (546,440 | ) | | $ | (1,060,736 | ) |
| | | | | | | | | | |
| | | | | | | | | | | | | |
| | | Year ended December 31, 2004 | |
| | | Pre-tax | | | Income tax | | | Net-of-tax | |
| | | amount | | | expense (benefit) | | | amount | |
| | | |
| Net unrealized holding gains (losses) on securities: | | | | | | | | | | | | |
| Unrealized holding gains arising during 2004 | | $ | 1,017,968 | | | $ | 346,109 | | | $ | 671,859 | |
| Less: reclassification adjustments for gains realized in net income | | | 1,428,311 | | | | 485,626 | | | | 942,685 | |
| | | | | | | | | | |
| Net unrealized holding losses | | | (410,343 | ) | | | (139,517 | ) | | | (270,826 | ) |
| | | | | | | | | | |
| Other comprehensive loss | | $ | (410,343 | ) | | $ | (139,517 | ) | | $ | (270,826 | ) |
| | | | | | | | | | |
52
| (15) | | RESERVE FOR UNPAID LOSSES AND LOSS ADJUSTMENT EXPENSES |
| |
| | | Activity in the reserve for unpaid losses and LAE is summarized as follows (dollars in thousands): |
| | | | | | | | | | | | | |
| | | 2006 | | | 2005 | | | 2004 | |
| | | |
| Balance at January 1 | | $ | 27,304 | | | $ | 30,766 | | | $ | 14,386 | |
| Less reinsurance recoverables | | | 1,235 | | | | 1,944 | | | | 4,926 | |
| | | | | | | | | | |
| Net Balance at January 1 | | | 26,069 | | | | 28,822 | | | | 9,460 | |
| | | | | | | | | | |
| Incurred related to: | | | | | | | | | | | | |
| Current year | | | 25,438 | | | | 27,033 | | | | 52,620 | |
| Prior years | | | 136 | | | | (3,697 | ) | | | (5,383 | ) |
| | | | | | | | | | |
| Total incurred | | | 25,574 | | | | 23,336 | | | | 47,237 | |
| | | | | | | | | | |
| Paid related to: | | | | | | | | | | | | |
| Current year | | | 20,730 | | | | 20,678 | | | | 23,690 | |
| Prior years | | | 18,510 | | | | 5,411 | | | | 4,185 | |
| | | | | | | | | | |
| Total paid | | | 39,240 | | | | 26,089 | | | | 27,875 | |
| | | | | | | | | | |
| Net Balance at December 31 | | | 12,403 | | | | 26,069 | | | | 28,822 | |
| Plus reinsurance recoverables | | | 1,420 | | | | 1,235 | | | | 1,944 | |
| | | | | | | | | | |
| Balance at December 31 | | $ | 13,823 | | | $ | 27,304 | | | $ | 30,766 | |
| | | | | | | | | | |
| | | | | | | | | | | | | |
| Reserve for unpaid losses and LAE | | $ | 7,457 | | | $ | 7,678 | | | $ | 11,563 | |
| Discontinued bond program reserve for unpaid losses and LAE | | | 6,366 | | | | 19,626 | | | | 19,203 | |
| | | | | | | | | | |
| Total reserve for unpaid losses and LAE | | $ | 13,823 | | | $ | 27,304 | | | $ | 30,766 | �� |
| | | | | | | | | | |
| | | As a result of changes in estimates of insured events in prior years, the provision for unpaid loss and LAE increased (decreased) by approximately $136,000, $(3,697,000) and $(5,383,000) for the years ended December 31, 2006, 2005 and 2004, respectively. The increase in 2006 was due to unfavorable loss development for the discontinued bond program which was partially offset by favorable loss development in our automobile lender/dealer and waste industry product lines. The decrease in 2005 and 2004 was attributed primarily to favorable loss development in the Company’s ULI product line. |
| |
| | | For more information concerning loss and LAE reserves for the discontinued bond program, see Note 16 to the Consolidated Financial Statements. |
| |
| (16) | | REINSURANCE |
| |
| | | The Company assumes and cedes reinsurance with other insurers and reinsurers. Such arrangements serve to enhance the Company’s capacity to write business, provide greater diversification, align business partners with the Company’s interests, and/or limit the Company’s maximum loss arising from certain risks. Although reinsurance does not discharge the original insurer from its primary liability to its policyholders, it is the practice of insurers for accounting purposes to treat reinsured risks as risks of the reinsurer. The primary insurer would reassume liability in those situations where the reinsurer is unable to meet the obligations it assumed under the reinsurance agreement. The ability to collect reinsurance is subject to the solvency of the reinsurers and/or collateral provided under the contract. |
| |
| | | Several of our lender/dealer insurance producers have formed sister reinsurance companies, commonly referred to as a producer-owned reinsurance company (“PORC”). The primary reason for an insurance producer to form a PORC is to realize the underwriting profits and investment income from the insurance premiums generated by that producer. In return for ceding business to the PORC, the Company receives a ceding commission, which is based on a percentage of the premiums ceded. Such arrangements align business partners with the Company’s interests while preserving valued customer relationships. All of the Company’s lender/dealer ceded reinsurance transactions are PORC arrangements. |
| |
| | | Effective January 1, 2003, the Company entered into a producer-owned reinsurance arrangement with a new lender/dealer producer whereby 100% of that producer’s premiums (along with the associated risk) was ceded to its PORC. This reinsurance arrangement was cancelled effective December 31, 2003. For this reinsurance arrangement, the Company has obtained collateral in the form of a letter of credit from the reinsurer to secure its obligations. Under the provisions of the reinsurance agreement, the collateral must be equal to or greater than 102% of the reinsured reserves and the Company has immediate access to such collateral if necessary. Under this arrangement, the Company ceded premiums earned of $67,969, $115,790 and $4,435,659 for the years ended December 31, 2006, 2005 and 2004, respectively. |
| |
| | | Effective October 1, 2003, the Company entered into a producer-owned reinsurance arrangement with an existing lender/dealer customer whereby 100% of that customer’s premiums (along with the associated risk) was ceded to its PORC. For this reinsurance arrangement, the Company has obtained collateral in the form of a trust from the reinsurer to secure its obligations. Under the provisions of the reinsurance agreement, the collateral must be equal to or greater than 102% of the reinsured reserves and the Company has immediate access to such collateral if necessary. Under this arrangement, the Company ceded premiums earned of $2,266,090, $1,727,303 and $894,717 for the years ended December 31, 2006, 2005 and 2004, respectively. |
53
| | | Beginning in the second quarter of 2004, the Company entered into a quota share reinsurance arrangement with certain insurance carriers whereby the Company assumed and ceded 50% of certain waste surety bond business. Effective January 1, 2005, the reinsurance arrangement was amended whereby the Company’s assumed participation was reduced from 50% to 25%. Effective August 1, 2006, the reinsurance arrangement was further amended whereby the Company’s assumed participation was increased from 25% to 50%. Under this program, the Company assumed premiums earned of $3,283,690, $4,302,509 and $1,980,492 during 2006, 2005 and 2004, respectively. Also, the Company ceded premiums earned of $1,235,624, $679,563 and $131,051 for the years ended December 31, 2006, 2005 and 2004, respectively. |
| |
| | | Effective January 1, 2005, the Company entered into a producer-owned reinsurance arrangement with a guaranteed auto protection insurance agent whereby 100% of that agent’s premiums (along with the associated risk) were ceded to its PORC. For this reinsurance arrangement, the Company has obtained collateral in the form of a letter of credit to secure its obligations. Under the provisions of the reinsurance agreement, the collateral must be equal to or greater than 102% of the reinsured reserves and the Company has immediate access to such collateral if necessary. Under this arrangement, the Company ceded premiums earned of $1,987,640, $734,435 and $0 for the years ended December 31, 2006, 2005 and 2004, respectively. |
| |
| | | In addition to the above, the Company has other reinsurance arrangements including two automobile lender/dealer PORC quota share arrangements, several quota share arrangements for certain contract and escrow surety bond business and a reinsurance arrangement for a vehicle service contract program. Under these arrangements, the Company ceded premiums earned of $708,430, $927,455 and $1,113,639 for the years ended December 31, 2006, 2005 and 2004, respectively. Also, the Company assumed premiums earned of $60,535, $0 and $0 for the years ended December 31, 2006, 2005 and 2004, respectively. |
| |
| | | From 2001 until the end of the second quarter of 2004, the Company participated in a bail and immigration bond program. This program was discontinued in the second quarter of 2004. For a more detailed description of this program, see “Discontinued Bond Program” below. |
| |
| | | A reconciliation of direct to net premiums, on both a written and earned basis, for the year ended December 31 is as follows: |
| | | | | | | | | | | | | | | | | | | | | | | | | |
| | | 2006 | | | 2005 | | | 2004 | |
| | | Premiums | | | Premiums | | | Premiums | | | Premiums | | | Premiums | | | Premiums | |
| | | written | | | earned | | | written | | | earned | | | written | | | earned | |
| Direct | | $ | 55,542,460 | | | $ | 52,583,987 | | | $ | 56,013,503 | | | $ | 51,743,182 | | | $ | 56,234,221 | | | $ | 54,069,958 | |
| Assumed | | | 3,122,782 | | | | 3,114,813 | | | | 3,580,422 | | | | 4,218,416 | | | | 4,301,004 | | | | 2,569,293 | |
| Ceded | | | (9,859,208 | ) | | | (6,592,147 | ) | | | (7,396,438 | ) | | | (4,244,653 | ) | | | (2,126,555 | ) | | | (6,575,066 | ) |
| | | | | | | | | | | | | | | | | | | |
| | | $ | 48,806,034 | | | $ | 49,106,653 | | | $ | 52,197,487 | | | $ | 51,716,945 | | | $ | 58,408,670 | | | $ | 50,064,185 | |
| | | | | | | | | | | | | | | | | | | |
| | | The amounts of recoveries pertaining to reinsurance that were deducted from losses and LAE incurred for the years ended December 31, 2006, 2005 and 2004 were $3,390,786, $1,789,439 and $2,465,643, respectively. For the years ended December 31, 2006, 2005 and 2004, ceded reinsurance decreased commission expense incurred by $1,494,873, $1,054,259 and $597,927, respectively. |
| |
| | | Discontinued Bond Program |
| |
| | | Beginning in 2001 and continuing into the second quarter of 2004, the Company participated as a reinsurer in a program covering bail and immigration bonds issued by four insurance carriers and produced by a bail bond agency (collectively, the “discontinued bond program” or the “program”). The liability of the insurance carriers was reinsured to a group of reinsurers, including the Company. The Company assumed 15% of the business from 2001 through 2003 and 5% of the business during the first half of 2004. This program was discontinued in the second quarter of 2004. |
| |
| | | Based on the design of the program, the bail bond agency was to obtain and maintain collateral and other security and to provide funding for bond losses. The bail bond agency and its principals were responsible for all losses as part of their program administration. The insurance carriers and, in turn, the reinsurers were not required to pay losses unless there was a failure of the bail bond agency. As the bonds were to be 100% collateralized, any losses paid by the reinsurers were to be recoverable through liquidation of the collateral and collections from third party indemnitors. |
| |
| | | In the second quarter of 2004, the Company came to believe that the discontinued bond program was not being operated as it had been represented to the Company by agents of the insurance carriers who had solicited the Company’s participation in the program, and the Company began disputing certain issues with respect to the program, including but not limited to: 1) inaccurate/incomplete disclosures relating to the program; 2) improper supervision by the insurance carriers of the bail bond agency in administering the program; 3) improper disclosures by the insurance carriers through the bail bond agency and the reinsurance intermediaries during life of the program; and 4) improper premium and claims administration. Consequently, during the second quarter of 2004, the Company ceased paying claims on the program and retained outside legal counsel to review and defend its rights under the program. |
54
| | | Pending Arbitration. During 2004 and 2005, the Company entered into arbitrations with all four insurance carriers that participated in the discontinued bond program. As discussed below, during 2006, arbitrations with three of the insurance carriers concluded. The following is a description of the last pending arbitration proceeding as of December 31, 2006: |
| |
| | | Highlands Arbitration. Highlands Insurance Company (“Highlands”), one of the insurance carriers, was placed in receivership during 2003 (which receivership remains pending). On August 31, 2005, Highlands’ Receiver demanded arbitration against the Company and other reinsurers, including The Philadelphia Contributionship for the Insurance of Houses from Loss by Fire, American Healthcare Insurance Company and various Lloyds Syndicates. In November 2005, the Company responded to this demand by seeking rescission of the reinsurance agreement, monetary damages for claims that were paid by the Company under the agreement and other appropriate relief. Highlands is seeking to recover certain of its losses from the Company under the reinsurance agreement. No arbitration panel has yet been constituted. |
| |
| | | Arbitration Developments as of December 31, 2006. |
| |
| | | Aegis Arbitration.During 2004, the Company entered into an arbitration proceeding with Aegis Security Insurance Company (“Aegis”), one of the insurance carriers. Through this arbitration, the Company was seeking rescission of the reinsurance agreements, monetary damages for the claims that were paid by the Company under the agreements and other appropriate relief. Aegis was seeking to recover certain of its losses from the Company under the reinsurance agreements. On January 18, 2006, the Company entered into a settlement agreement with Aegis resolving all disputes between the Company and Aegis relating to the discontinued bond program. The settlement also relieved the Company from any potential future liabilities with respect to bonds issued by Aegis. As a result of this settlement agreement, the Company recorded reserve redundancies of approximately $0.2 million during 2006. |
| |
| | | Sirius Arbitration.During 2004, the Company entered into an arbitration proceeding with Sirius America Insurance Company (“Sirius”), one of the insurance carriers. Through this arbitration, the Company was seeking rescission of the reinsurance agreement, monetary damages for claims that were paid by the Company under the agreement and other appropriate relief. Sirius was seeking to recover certain of its losses from the Company under the reinsurance agreement. On July 26, 2006, the Company entered into a settlement agreement with Sirius resolving all disputes between the Company and Sirius relating to the discontinued bond program. The settlement also relieved the Company from any potential future liabilities with respect to bonds issued by Sirius. As a result of this settlement agreement, the Company recorded reserve deficiencies of approximately $0.1 million during 2006. |
| |
| | | Harco Arbitration. During 2004, the Company entered into an arbitration proceeding with Harco National Insurance Company (“Harco”), one of the insurance carriers. Through this arbitration, the Company was seeking rescission of the reinsurance agreement and other appropriate relief. Harco was seeking to recover certain of its losses from the Company under the reinsurance agreement. The arbitration hearing concluded in July 2006. In August 2006, the arbitration panel issued its Final Decision and Order ordering each of the reinsurers participating in the arbitration, including the Company, to pay its proportionate share of past and future claims paid by Harco, subject to certain adjustments, offsets and credits (the “Final Order”). Based on the Final Order and the most recent loss reports provided by Harco, the Company recorded reserve deficiencies of approximately $2.0 million and return premiums of approximately $0.3 million during 2006. |
| |
| | | Highlands Development.During the third quarter of 2006, the Company received information indicating that Highlands and the U.S. Department of Homeland Security (“DHS”) reached a global settlement concerning Highlands’ immigration bond obligations, which settlement is subject to the approval of the court in which the receivership is pending. Based on this information, the Company recorded reserve redundancies of approximately $0.1 million during 2006. |
| |
| | | Loss and LAE Reserves. As of December 31, 2006, the Company recorded its loss and LAE reserves for the discontinued bond program based primarily on loss reports received by the Company from Harco and Highlands. The following compares our loss and LAE reserves for the discontinued bond program at December 31, 2006 and December 31, 2005 (dollars in millions): |
| | | | | | | | | |
| | | December 31, | | | December 31, | |
| | | 2006 | | | 2005 | |
| Bail Bonds: | | | | | | | | |
| Case reserves | | $ | 0.9 | | | $ | 12.1 | |
| Incurred but not reported (“IBNR”) reserves | | | 4.2 | | | | 5.4 | |
| | | | | | | |
| Total bail bond reserves | | | 5.1 | | | | 17.5 | |
| | | | | | | |
| Immigration Bonds: | | | | | | | | |
| Case reserves | | | 0.1 | | | | 0.7 | |
| IBNR reserves | | | 1.2 | | | | 1.4 | |
| | | | | | | |
| Total immigration bond reserves | | | 1.3 | | | | 2.1 | |
| | | | | | | |
| | | | | | | | | |
| Total loss and LAE reserves | | $ | 6.4 | | | $ | 19.6 | |
| | | | | | | |
55
| | | The decrease in loss and LAE reserves from $19.6 million at December 31, 2005 to $6.4 million at December 31, 2006 was primarily due to loss payments made by the Company during 2006 in connection with the Aegis and Sirius settlements and the Harco Final Order. |
| |
| | | Discontinued bond program losses and LAE were $1.8 million, $0.4 and $20.2 million during the years ended December 31, 2006, 2005 and 2004, respectively. The 2006 loss of $1.8 million was primarily attributable to the Harco Final Order combined with our increase in Harco’s reported losses. The $0.4 million loss recorded during 2005 was primarily attributable to an increase in reported losses from Harco which was partially offset by a decrease in losses for Aegis due to a favorable ruling by the Aegis arbitration panel. |
| |
| | | We believe there is potential for the Company to mitigate its ultimate liability to Highlands through the arbitration proceeding with Highlands; however, because of the subjective nature inherent in assessing the final outcome of this arbitration, management cannot estimate the probability of an adverse or favorable outcome as of December 31, 2006. In addition, while outside counsel believes we have legal defenses under the reinsurance agreement, they are unable to assess whether an adverse outcome is probable or remote in the arbitration as of December 31, 2006. In accordance with SFAS No. 5 “Accounting for Contingencies,” the Company is reserving to its best estimate of the ultimate liability on the program at December 31, 2006 without any adjustment for positive arbitration outcome or a potential settlement amount with Highlands. If the Company obtains information to determine an estimate of a final arbitration value or estimate a settlement value, the Company will record changes in its reserves, if any, in the period that an estimate is made in accordance with SFAS No. 60. The Company does not intend to pay for any of the Highlands losses unless and until the arbitration is settled on a mutually agreeable basis and/or a final binding judgment is made as to the Company’s ultimate liability. |
| |
| | | Given the uncertainties of the outcome of the Highlands arbitration, uncertainties in the future loss information provided by Harco and Highlands, and the inherent volatility in assumed reinsurance, actual losses incurred for the discontinued bond program could be materially different from our estimated reserves. As a result, future loss development on the discontinued bond program could have a material effect on the Company’s results of operations and/or financial condition. |
| |
| (17) | | RELATED PARTIES |
| |
| | | In 1994, we entered into a Split-Dollar Insurance Agreement with a bank, as trustee, for the benefit of an officer and his spouse. The bank has acquired a second-to-die policy on the lives of the insureds, in the aggregate face amount of $2,700,000. At December 31, 2006 and 2005, we had loaned the trustee $932,653 and $860,934, respectively, under this agreement for payment of insurance premiums, which is included in loans to affiliates in the accompanying balance sheet. Amounts loaned by the Company to the trustee are to be repaid, in full, without interest, from any of the following sources: (1) cash surrender value of the underlying insurance policies; (2) death benefits; and/or (3) the sale of 15,750 common shares of the Company contributed by the officer to the trust. |
| |
| | | In February 2000, we entered into a Split-Dollar Insurance Agreement for the benefit of another officer in the face amount of $1,000,000. All premiums paid by the Company in accordance with this agreement are to be repaid, in full, without interest, upon the death, retirement or termination of the officer. The Company had paid premiums of $30,000 relating to this agreement; however, the Company is no longer paying premiums under the agreement. At December 31, 2006 and 2005, $30,000 was included in loans to affiliates in the accompanying balance sheet for payment of insurance premiums in accordance with this agreement. |
| |
| | | We share Bancinsurance’s executive offices with certain of our consolidated subsidiaries. Certain expenses are allocated among them pursuant to cost sharing agreements. |
| |
| (18) | | CONCENTRATIONS |
| |
| | | The Company has the following concentrations of net premiums earned with one managing general agent within our property/casualty insurance business segment for the years ended December 31: |
| | | | | | | | | | | | | |
| | | 2006 | | 2005 | | 2004 |
| | | |
Product — Customer Type | | | | | | | | | | | | |
| Lender/Dealer-Managing General Agent | | $ | 7,474,823 | | | $ | 10,078,546 | | | $ | 11,081,680 | |
| (19) | | FAIR VALUE OF FINANCIAL INSTRUMENTS |
| |
| | | The following methods and assumptions were used to estimate the fair value of each class of financial instruments for which it is practicable to estimate fair value: |
| |
| | | Cash and short-term investments:The carrying amounts are reasonable estimates of fair value. |
| |
| | | Fixed maturities and equity securities:Fair values are based upon quoted market prices or dealer quotes for comparable securities. |
| |
| | | Trust preferred debt issued to affiliates:Fair value is estimated using discounted cash flow calculations based on interest rates currently being offered for similar obligations with maturities consistent with the obligation being valued. As the interest rate adjusts regularly, the carrying amount is a reasonable estimate of fair value. |
56
| | | The carrying amount and estimated fair value of financial instruments subject to disclosure requirements were as follows at December 31: |
| | | | | | | | | | | | | | | | | |
| | | 2006 | | 2005 |
| | | Carrying | | Estimated | | Carrying | | Estimated |
| | | amount | | fair value | | amount | | fair value |
| | | |
| Assets: | | | | | | | | | | | | | | | | |
| Held to maturity fixed maturities | | $ | 4,793,584 | | | $ | 4,850,986 | | | $ | 4,821,629 | | | $ | 4,856,624 | |
| Available for sale fixed maturities | | | 68,547,886 | | | | 68,547,886 | | | | 73,012,240 | | | | 73,012,240 | |
| Available for sale equity securities | | | 9,400,247 | | | | 9,400,247 | | | | 8,043,299 | | | | 8,043,299 | |
| Short-term investments | | | 8,263,980 | | | | 8,263,980 | | | | 8,964,738 | | | | 8,964,738 | |
| Cash | | | 1,823,191 | | | | 1,823,191 | | | | 4,528,875 | | | | 4,528,875 | |
| Liabilities: | | | | | | | | | | | | | | | | |
| Trust preferred debt issued to affiliates | | | 15,465,000 | | | | 15,465,000 | | | | 15,465,000 | | | | 15,465,000 | |
| (20) | | QUARTERLY RESULTS OF OPERATIONS (UNAUDITED) |
| |
| | | Our results of operations have varied, and in the future may vary, from quarter to quarter, principally because of fluctuations in our underwriting results and/or realized gain (loss) activity. Consequently, quarterly results are not necessarily indicative of full year results, nor are they comparable to the results of other quarters. The following table sets forth certain unaudited quarterly consolidated financial and operating data: |
| | | | | | | | | | | | | | | | | |
| | | 2006 |
| | | First | | Second | | Third | | Fourth |
| | | Quarter | | Quarter | | Quarter | | Quarter |
| | | |
| Total revenues | | $ | 13,088,556 | | | $ | 15,030,251 | | | $ | 16,294,028 | | | $ | 14,273,807 | |
| Income before federal income taxes | | | 2,059,882 | | | | 1,851,635 | | | | 2,832,145 | | | | 80,174 | |
| Net income | | | 1,493,383 | | | | 1,440,606 | | | | 2,104,531 | | | | 436,381 | |
| Net income per common share: | | | | | | | | | | | | | | | | |
| Basic | | | .30 | | | | .29 | | | | .42 | | | | .09 | |
| Diluted | | | .30 | | | | .28 | | | | .42 | | | | .08 | |
| | | | | | | | | | | | | | | | | |
| | | 2005 |
| | | First | | Second | | Third | | Fourth |
| | | Quarter | | Quarter | | Quarter | | Quarter |
| | | |
| Total revenues | | $ | 14,556,205 | | | $ | 15,953,712 | | | $ | 15,719,332 | | | $ | 14,407,261 | |
| Income (loss) before federal income taxes | | | (934,721 | ) | | | 2,966,904 | | | | 1,960,225 | | | | 4,178,237 | |
| Net income (loss) | | | (461,383 | ) | | | 2,140,092 | | | | 1,501,631 | | | | 3,113,734 | |
| Net income (loss) per common share: | | | | | | | | | | | | | | | | |
| Basic | | | (.09 | ) | | | .43 | | | | .30 | | | | .63 | |
| Diluted | | | (.09 | ) | | | .43 | | | | .30 | | | | .62 | |
| (21) | | LITIGATION |
| |
| | | As discussed in Note 16 to the Consolidated Financial Statements, the Company is a party to the Highlands arbitration proceeding arising from claims made under a reinsurance contract relating to the discontinued bond program. In addition, the Aegis, Sirius and Harco arbitrations were resolved during 2006. See Note 16 to the Consolidated Financial Statements for additional information concerning the discontinued bond program arbitrations. |
| |
| | | In October 2006, the Company commenced arbitration against Ernst & Young LLP (“E&Y”), the Company’s former independent registered public accounting firm, in accordance with the terms of the engagement letter between the Company and E&Y. In the arbitration, the Company alleges that E&Y improperly withdrew the Company’s audit reports for the 2001 through 2003 fiscal years. The Company is seeking monetary damages in excess of $21 million. E&Y has counterclaimed, seeking to recover in excess of $475,000 from the Company for unpaid invoices and additional costs. No arbitration panel has yet been constituted. The Company does not believe this dispute will have a material adverse effect on our financial condition or liquidity. |
| |
| | | In addition, the Company is involved in various other lawsuits and legal proceedings arising in the ordinary course of business, some of which involve claims for substantial amounts. We provide accruals for these items to the extent that we deem the losses probable and reasonably estimable. The outcome of litigation is subject to numerous uncertainties. While the ultimate resolution of these legal proceedings could be material to the Company’s results of operations in a future quarter or annual period, in the opinion of Company’s management, none would likely have a material adverse effect on the Company’s financial condition or liquidity. |
57
| (22) | | SUPPLEMENTAL DISCLOSURE FOR EARNINGS PER SHARE |
| | | | | | | | | | | | | |
| | | 2006 | | | 2005 | | | 2004 | |
| | | |
| Net income (loss) | | $ | 5,474,901 | | | $ | 6,294,074 | | | $ | (8,500,620 | ) |
| | | | | | | | | | |
| Income (loss) available to common shareholders, assuming dilution | | $ | 5,474,901 | | | $ | 6,294,074 | | | $ | (8,500,620 | ) |
| | | | | | | | | | |
| | | | | | | | | | | | | |
| Weighted-average common shares outstanding | | | 4,976,010 | | | | 4,972,700 | | | | 4,950,437 | |
| Dilutive effect of outstanding options | | | 87,394 | | | | 34,638 | | | | — | |
| | | | | | | | | | |
| Diluted common shares | | | 5,063,404 | | | | 5,007,338 | | | | 4,950,437 | |
| | | | | | | | | | |
| | | | | | | | | | | | | |
| Basic net income (loss) per common share | | $ | 1.10 | | | $ | 1.27 | | | $ | (1.72 | ) |
| Diluted net income (loss) per common share | | $ | 1.08 | | | $ | 1.26 | | | $ | (1.72 | ) |
| (23) | | SEGMENT INFORMATION |
| |
| | | As described in Note 1 to the Consolidated Financial Statements, the Company has three reportable business segments: (1) property/casualty insurance; (2) municipal code publishing (through August 31, 2006); and (3) insurance agency. There are intersegment management and commission fees. The allocations of certain general expenses within segments are based on a number of assumptions, and the reported operating results would change if different assumptions were applied. Depreciation and capital expenditures are not considered material. Segment results for the years ended December 31, 2006, 2005 and 2004 are as follows: |
| | | | | | | | | | | | | | | | | |
| | | December 31, 2006 |
| | | |
| | | | | | | Municipal | | | | | | Reportable |
| | | Property/Casualty | | Code | | Insurance | | Segment |
| | | Insurance | | Publishing(1) | | Agency | | Total |
| | | |
| Revenues from external customers | | $ | 49,787,642 | | | $ | 2,255,558 | | | $ | — | | | $ | 52,043,200 | |
| Intersegment revenues | | | — | | | | — | | | | 1,349,987 | | | | 1,349,987 | |
| Interest revenue | | | 3,942,687 | | | | — | | | | 2,202 | | | | 3,944,889 | |
| Interest expense | | | 559 | | | | 1,286 | | | | — | | | | 1,845 | |
| Depreciation and amortization | | | 417,254 | | | | 68,130 | | | | — | | | | 485,384 | |
| Segment profit | | | 4,805,033 | | | | 317,366 | | | | 1,344,110 | | | | 6,466,509 | |
| Federal income tax expense | | | 806,676 | | | | 114,251 | | | | 456,998 | | | | 1,377,925 | |
| Segment assets | | | 118,717,764 | | | | — | | | | 254,064 | | | | 118,971,828 | |
(1) As discussed in Note 1 to the Consolidated Financial Statements , the Company sold ALPC, its municipal code publishing segment, on August 31, 2006. The municipal code publishing segment in the above table includes results through August 31, 2006. |
| |
| | | December 31, 2005 |
| | | | | | | Municipal | | | | | | Reportable |
| | | Property/Casualty | | Code | | Insurance | | Segment |
| | | Insurance | | Publishing | | Agency | | Total |
| | | |
| Revenues from external customers | | $ | 53,618,930 | | | $ | 3,474,917 | | | $ | 22,387 | | | $ | 57,116,234 | |
| Intersegment revenues | | | 4,410 | | | | — | | | | 1,188,678 | | | | 1,193,088 | |
| Interest revenue | | | 3,257,818 | | | | — | | | | 3,847 | | | | 3,261,665 | |
| Interest expense | | | 126 | | | | 1,921 | | | | — | | | | 2,047 | |
| Depreciation and amortization | | | 380,403 | | | | 94,602 | | | | — | | | | 475,005 | |
| Segment profit | | | 7,624,590 | | | | 665,794 | | | | 1,203,673 | | | | 9,494,057 | |
| Federal income tax expense | | | 1,488,365 | | | | 248,826 | | | | 408,797 | | | | 2,145,988 | |
| Segment assets | | | 123,381,430 | | | | 2,077,332 | | | | 319,571 | | | | 125,778,333 | |
58
| | | | | | | | | | | | | | | | | |
| | | December 31, 2004 |
| | | | | | | Municipal | | | | | | Reportable |
| | | Property/Casualty | | Code | | Insurance | | Segment |
| | | Insurance | | Publishing | | Agency | | Total |
| | | |
| Revenues from external customers | | $ | 51,126,855 | | | $ | 4,005,415 | | | $ | 68,080 | | | $ | 55,200,350 | |
| Intersegment revenues | | | 5,880 | | | | — | | | | 377,893 | | | | 383,773 | |
| Interest revenue | | | 2,266,867 | | | | — | | | | 349 | | | | 2,267,216 | |
| Interest expense | | | (262 | ) | | | 1,921 | | | | — | | | | 1,659 | |
| Depreciation and amortization | | | 376,016 | | | | 93,410 | | | | — | | | | 469,426 | |
| Segment profit (loss) | | | (11,569,336 | ) | | | 503,702 | | | | 402,592 | | | | (10,663,042 | ) |
| Federal income tax expense (benefit) | | | (4,440,684 | ) | | | 180,608 | | | | 136,212 | | | | (4,123,864 | ) |
| Segment assets | | | 107,524,584 | | | | 2,687,373 | | | | 729,932 | | | | 110,941,889 | |
The following is a reconciliation of the segment results to the consolidated amounts reported in the consolidated financial statements:
| | | | | | | | | | | | | |
| | | 2006 | | | 2005 | | | 2004 | |
| | | |
| Revenues | | | | | | | | | | | | |
| | | | | | | | | | | | | |
| Total revenues for reportable segments | | $ | 57,338,076 | | | $ | 61,570,987 | | | $ | 57,851,339 | |
| Parent company gain (loss) | | | 2,698,553 | | | | 258,611 | | | | (62,844 | ) |
| Elimination of intersegment revenues | | | (1,349,987 | ) | | | (1,193,088 | ) | | | (383,773 | ) |
| | | | | | | | | | |
| Total consolidated revenues | | $ | 58,686,642 | | | $ | 60,636,510 | | | $ | 57,404,722 | |
| | | | | | | | | | |
| | | | | | | | | | | | | |
| Profit | | | | | | | | | | | | |
| | | | | | | | | | | | | |
| Total profit (loss) for reportable segments | | $ | 6,466,509 | | | $ | 9,494,057 | | | $ | (10,663,042 | ) |
| Parent company gain (loss), net of intersegment eliminations | | | 357,327 | | | | (1,323,412 | ) | | | (2,605,010 | ) |
| | | | | | | | | | |
| Total consolidated net income (loss) before income taxes | | $ | 6,823,836 | | | $ | 8,170,645 | | | $ | (13,268,052 | ) |
| | | | | | | | | | |
| | | | | | | | | | | | | |
| Assets | | | | | | | | | | | | |
| | | | | | | | | | | | | |
| Total assets for reportable segments | | $ | 118,971,828 | | | $ | 125,778,333 | | | $ | 110,941,889 | |
| Parent company assets | | | 6,492,158 | | | | 3,771,162 | | | | 11,096,804 | |
| Elimination of intersegment receivables | | | (3,175,480 | ) | | | (1,213,660 | ) | | | (4,978,221 | ) |
| | | | | | | | | | |
| Total consolidated assets | | $ | 122,288,506 | | | $ | 128,335,835 | | | $ | 117,060,472 | |
| | | | | | | | | | |
| (24) | | SUBSEQUENT EVENTS |
| |
| | | During 2003, the Company began issuing insurance policies which guarantee the performance of two automobile service contract providers (the “Providers”). The Providers are owned and managed by a common group. The Company issues insurance policies for business produced by the Providers in five states. Our insurance policy guarantees the fulfillment of the Providers’ obligation under the service contract. Under the program, the Providers carry the related assets and reserves and are responsible for the premiums and claims administration. The Company is obligated to pay a claim only if a Provider fails to do so. Under a reinsurance arrangement, the Company cedes 100% of this business to another insurance carrier. In addition, the Company obtained collateral in the form of a letter of credit to secure its obligations under the program. In February 2007, the Company was notified that one of the Providers entered into an assignment for the benefit of creditors liquidation and that no new business is being produced by that Provider. The Company, with the assistance of its outside actuary, has estimated its potential exposure under the program to be approximately $3.0 million as of December 31, 2006. Because our estimated potential exposure is fully collateralized by a $4.3 million letter of credit and the loss exposure is 100% reinsured, we do not believe this event will have a material adverse impact to the Company. However, if the Company is required to pay claims under the program and it is unable to draw on the letter of credit and cannot collect on the reinsurance, then this program could have a material adverse effect on our business, financial condition and/or operating results. |
| |
| | | Effective January 1, 2007, the Company entered into a producer-owned reinsurance arrangement with a new CPI customer whereby 100% of that customer’s premiums (along with the associated risk) were ceded to its PORC. For this program, the CPI coverage is voluntary and is primarily for tractors and residential/commercial mowers as opposed to automobiles. The Company receives a ceding commission based on a percentage of the premiums ceded. For this reinsurance arrangement, the Company obtains collateral in the form of funds held and a letter of credit to secure its obligations. Under the provisions of the reinsurance agreement, the collateral must be equal to or greater than 102% of the reinsured reserves and the Company has immediate access to such collateral if necessary. |
59
ITEM 9. CHANGES IN AND DISAGREEMENTS WITH ACCOUNTANTS ON ACCOUNTING AND FINANCIAL DISCLOSURE
As previously reported, on July 12, 2005, the Audit Committee dismissed Ernst & Young LLP (“E&Y”) as the Company’s independent registered public accounting firm. Also, on July 12, 2005, the Audit Committee engaged Daszkal Bolton LLP (“Daszkal”) as the Company’s independent registered public accounting firm for the fiscal years ending December 31, 2001, 2002, 2003, 2004 and 2005. Subsequently, the Audit Committee engaged Daszkal as the Company’s independent registered public accounting firm for the fiscal year ended December 31, 2006.
The following is a description of all “disagreements” described in Item 304(a)(1)(iv) of Regulation S-K and “reportable events” described in Item 304(a)(1)(v) of Regulation S-K that occurred with respect to the Company and E&Y during the period between January 1, 2002 and July 12, 2005.
As previously reported, on February 4, 2005, E&Y advised the Company that, because of developments related to the Company’s discontinued bond program (1) E&Y was withdrawing its audit reports for the years 2001 through 2003 for the Company and its wholly-owned subsidiaries, Ohio Indemnity and ALPC, (2) those audit reports and the completed interim reviews of the Company’s 2004 quarterly filings on Form 10-Q should no longer be relied upon, (3) E&Y was unable to complete the audit of the Company’s 2004 financial statements at that time and (4) the Company’s appointed actuary, who was employed by E&Y, was withdrawing his certification of Ohio Indemnity’s statutory reserves for the years 2001 through 2003.
In subsequent correspondence to the Company, E&Y informed the Company of the following:
(1) E&Y believed that the Company had a material weakness in its system of internal controls related to the discontinued bond program claim reserves;
(2) E&Y believed that the Company did not have the internal controls related to the discontinued bond program necessary for the Company to develop reliable financial statements;
(3) E&Y believed that at the time the Company filed its 2003 Form 10-K in March 2004, management was aware that there had been significant adverse claims development in the discontinued bond program. E&Y believed this information was not provided to E&Y on a timely basis in connection with E&Y’s audit of the Company’s 2003 financial statements. As a result, E&Y did not believe it could rely on the representations of management. Furthermore, E&Y believed this adverse claims development information would have a significant material effect on the discontinued bond program reserve levels recognized by the Company in its previously filed financial statements and material adjustments needed to be recorded in such previously filed financial statements; and
(4) E&Y did not believe sufficient information existed to enable management or consulting actuaries to estimate a liability for IBNR claims on the discontinued bond program at December 31, 2004.
As discussed above, at the time of its dismissal, E&Y believed that material adjustments needed to be recorded in the Company’s previously filed financial statements for the discontinued bond program; however, E&Y did not qualitatively or quantitatively disclose to the Company the material adjustments they believed existed for each of the previously filed financial statements prior to its dismissal. As a result, the Company cannot determine how E&Y would have accounted for or disclosed the discontinued bond program differently from how the Company has accounted for and disclosed the discontinued bond program in this Annual Report on Form 10-K.
ITEM 9A. CONTROLS AND PROCEDURES
With the participation of our principal executive officer and principal financial officer, our management has evaluated the effectiveness of our disclosure controls and procedures (as defined in Rules 13a-15 and 15d-15 of the Securities Exchange Act of 1934 (the “Exchange Act”)) as of the end of the period covered by this report. Based upon that evaluation, our principal executive officer and principal financial officer have concluded that such disclosure controls and procedures are effective as of the end of the period covered by this report.
In addition, there were no changes during the quarter ended December 31, 2006 in our internal control over financial reporting (as defined in Rules 13a-15 and 15d-15 of the Exchange Act) that have materially affected, or are reasonably likely to materially affect, our internal control over financial reporting.
ITEM 9B. OTHER INFORMATION
There is no information that was required to be disclosed in a report on Form 8-K during the fourth quarter of 2006 that has not been reported on a Form 8-K.
60
PART III
ITEM 10. DIRECTORS, EXECUTIVE OFFICERS AND CORPORATE GOVERNANCE
The information required by this Item 10 is incorporated herein by reference to our definitive Proxy Statement relating to the 2007 Annual Meeting of Shareholders.
ITEM 11. EXECUTIVE COMPENSATION
The information required by this Item 11 is incorporated herein by reference to our definitive Proxy Statement relating to the 2007 Annual Meeting of Shareholders.
ITEM 12. SECURITY OWNERSHIP OF CERTAIN BENEFICIAL OWNERS AND MANAGEMENT AND RELATED SHAREHOLDER MATTERS
EQUITY COMPENSATION PLAN INFORMATION
The following table sets forth the number of our common shares issuable upon exercise of outstanding options, warrants and rights under our equity compensation plans, the weighted-average exercise price of the outstanding options, warrants and rights under our equity compensation plans and the number of our common shares remaining available for future issuance under our equity compensation plans, each as of December 31, 2006. Each of our equity compensation plans has been approved by our shareholders.
| | | | | | | | | | | | | |
| | | (a) | | | (b) | | | (c) | |
| | | | | | | | | | | Number of securities | |
| | | Number of securities to | | | Weighted-average | | | remaining available for future | |
| | | be issued upon exercise | | | exercise price of | | | issuance under equity | |
| | | of outstanding options, | | | outstanding options, | | | compensation plans (excluding | |
| Plan category | | warrants and rights | | | warrants and rights | | | securities reflected in column (a)) | |
| Equity compensation plans approved by security holders | | | 827,500 | | | $ | 5.52 | | | | 35,000 | |
| |
| Equity compensation plans not approved by security holders | | None | | | None | | | None | |
| | | | | | | | | | |
| |
| Total | | | 827,500 | | | $ | 5.52 | | | | 35,000 | |
| | | | | | | | | | |
Other information required by this Item 12 is incorporated herein by reference to our definitive Proxy Statement relating to the 2007 Annual Meeting of Shareholders.
ITEM 13. CERTAIN RELATIONSHIPS AND RELATED TRANSACTIONS, AND DIRECTOR INDEPENDENCE
The information required by this Item 13 is incorporated herein by reference to our definitive Proxy Statement relating to the 2007 Annual Meeting of Shareholders.
ITEM 14. PRINCIPAL ACCOUNTING FEES AND SERVICES
The information required by this Item 14 is incorporated herein by reference to our definitive Proxy Statement relating to the 2007 Annual Meeting of Shareholders.
61
PART IV
ITEM 15. EXHIBITS, FINANCIAL STATEMENT SCHEDULES
(a) The following documents are filed as a part of this report:
| | | | | |
| | | Page in |
| | | this |
| | | Report |
| (1) Financial Statements | | | | |
| | | | | |
| The following financial statements, which are included in Item 8 of Part II of this report: | | | | |
| | | | | |
| | | 34 | |
| | | | | |
| | | 35 | |
| | | | | |
| | | 36 | |
| | | | | |
| | | 38 | |
| | | | | |
| | | 39 | |
| | | | | |
| | | 40 | |
| | | | | |
| (2) Financial Statement Schedules | | | | |
| | | | | |
| The following financial statement schedules are included in this Item 15 of Part IV of this report: | | | | |
| | | | | |
| | | 65 | |
| | | | | |
| | | 66 | |
| | | All other schedules are omitted because of the absence of conditions under which they are required or the required information is given in the consolidated financial statements or notes thereto. |
| (3) | | Exhibits |
| |
| | | The following exhibits required by Item 601 of Regulation S-K are filed as part of this report. For convenience of reference, the exhibits are listed according to the numbers appearing in the Exhibit Table to Item 601 of Regulation S-K. |
| | | |
| 3(a) | | Amended and Restated Articles of Incorporation of Bancinsurance Corporation (reference is made to Exhibit 3(a) of Form 10-K for the fiscal year ended December 31, 1984 (file number 0-8738), which is incorporated herein by reference). |
| | | |
| 3(b) | | Certificate of Amendment to the Amended and Restated Articles of Incorporation of Bancinsurance Corporation dated March 10, 1993 (reference is made to Exhibit 3(b) of Form 10-K for the fiscal year ended December 31, 2001 (file number 0-8738), which is incorporated herein by reference). |
| | | |
| 3(c) | | Amended and Restated Articles of Incorporation of Bancinsurance Corporation (reflecting amendments through March 10, 1993) (for SEC reporting purposes only) (reference is made to Exhibit 3(c) of Form 10-K for the fiscal year ended December 31, 2001 (file number 0-8738), which is incorporated herein by reference). |
| | | |
| 3(d) | | Amended and Restated Code of Regulations of Bancinsurance Corporation (reference is made to Exhibit 3(b) of Form 10-K for the fiscal year ended December 31, 1984 (file number 0-8738), which is incorporated herein by reference). |
| | | |
| 4(a) | | Credit Agreement dated January 25, 1993 by and between Bancinsurance Corporation and The Fifth Third Bank of Columbus, Ohio (reference is made to Exhibit 4(a) of Form 10-K for the fiscal year ended December 31, 2001 (file number 0-8738), which is incorporated herein by reference). |
| | | |
| 4(b) | | First Amendment to Credit Agreement dated November 5, 1993 by and between Bancinsurance Corporation and The Fifth Third Bank of Columbus, Ohio (reference is made to Exhibit 4(b) of Form 10-K for the fiscal year ended December 31, 2001 (file number 0-8738), which is incorporated herein by reference). |
| | | |
| 4(c) | | Second Amendment to Credit Agreement dated October 19, 1994 by and between Bancinsurance Corporation and The Fifth Third Bank of Columbus, Ohio (reference is made to Exhibit 4(c) of Form 10-K for the fiscal year ended December 31, 2001 (file number 0-8738), which is incorporated herein by reference). |
62
| | | |
| 4(d) | | Third Amendment to Credit Agreement dated November 24, 1999 by and between Bancinsurance Corporation and The Fifth Third Bank of Columbus, Ohio (reference is made to Exhibit 4(d) of Form 10-K for the fiscal year ended December 31, 2001 (file number 0-8738), which is incorporated herein by reference). |
| | | |
| 4(e) | | Fourth Amendment to Credit Agreement dated December 11, 2000 by and between Bancinsurance Corporation and The Fifth Third Bank of Columbus, Ohio (reference is made to Exhibit 4(e) of Form 10-K for the fiscal year ended December 31, 2001 (file number 0-8738), which is incorporated herein by reference). |
| | | |
| 4(f) | | Fifth Amendment to Credit Agreement dated July 1, 2002 by and between Bancinsurance Corporation and The Fifth Third Bank of Columbus, Ohio (reference is made to Exhibit 4(f) of Form 10-Q for the fiscal quarter ended June 30, 2002 (file number 0-8738), which is incorporated herein by reference). |
| | | |
| 4(g) | | Sixth Amendment to Credit Agreement dated October 20, 2003 by and between Bancinsurance Corporation and The Fifth Third Bank of Columbus, Ohio (reference is made to Exhibit 4(a) of Form 10-Q for the fiscal quarter ended September 30, 2003 (file number 0-8738), which is incorporated herein by reference). |
| | | |
| 4(h) | | Indenture dated as of December 4, 2002 by and between Bancinsurance Corporation and State Street Bank and Trust Company of Connecticut, National Association (reference is made to Exhibit 4(g) of Form 10-K for the fiscal year ended December 31, 2002 (file number 0-8738), which is incorporated herein by reference). |
| | | |
| 4(i) | | Amended and Restated Declaration of Trust dated as of December 4, 2002 by and among Bancinsurance Corporation, State Street Bank and Trust Company of Connecticut, National Association, John Sokol, Si Sokol and Sally Cress (reference is made to Exhibit 4(h) of Form 10-K for the fiscal year ended December 31, 2002 (file number 0-8738), which is incorporated herein by reference). |
| | | |
| 4(j) | | Guarantee Agreement dated as of December 4, 2002 by and between Bancinsurance Corporation and State Street Bank and Trust Company of Connecticut, National Association (reference is made to Exhibit 4(i) of Form 10-K for the fiscal year ended December 31, 2002 (file number 0-8738), which is incorporated herein by reference). |
| | | |
| 4(k) | | Indenture dated as of September 30, 2003 by and between Bancinsurance Corporation and JPMorgan Chase Bank (reference is made to Exhibit 4(b) of Form 10-Q for the fiscal quarter ended September 30, 2003 (file number 0-8738), which is incorporated herein by reference). |
| | | |
| 4(l) | | Amended and Restated Declaration of Trust dated as of September 30, 2003 by and among Bancinsurance Corporation, JPMorgan Chase Bank, Chase Manhattan Bank USA, National Association, John Sokol, Si Sokol and Sally Cress (reference is made to Exhibit 4(c) of Form 10-Q for the fiscal quarter ended September 30, 2003 (file number 0-8738), which is incorporated herein by reference). |
| | | |
| 4(m) | | Guarantee Agreement dated as of September 30, 2003 by and between Bancinsurance Corporation and JPMorgan Chase Bank (reference is made to Exhibit 4(d) of Form 10-Q for the fiscal quarter ended September 30, 2003 (file number 0-8738), which is incorporated herein by reference). |
| | | |
| 4(n) | | Amended and Restated Credit Agreement effective as of June 15, 2006 by and between Bancinsurance Corporation and Fifth Third Bank of Columbus, Ohio (reference is made to Exhibit 4.1 of Current Report on Form 8-K filed June 16, 2006 (file number 0-8738), which is incorporated herein by reference). |
| | | |
| 4(o) | | Eleventh Amendment and Restatement of Note effective as of June 15, 2006 by and between Bancinsurance Corporation and Fifth Third Bank of Columbus, Ohio (reference is made to Exhibit 4.2 of Form 8-K filed June 16, 2006 (file number 0-8738), which is incorporated herein by reference). |
| | | |
| 10(a) | | Amended Tax Allocation Agreement by and between Bancinsurance Corporation and Ohio Indemnity Company (reference is made to Exhibit 10(d) of Form 10-K for the fiscal year ended December 31, 1983 (file number 0-8738), which is incorporated herein by reference). |
| | | |
| 10(b)# | | Bancinsurance Corporation 1984 Stock Option Plan (reference is made to Exhibit 10(d) of Form 10-K for the fiscal year ended December 31, 1984 (file number 0-8738), which is incorporated herein by reference). |
| | | |
| 10(c)# | | Bancinsurance Corporation 1994 Stock Option Plan (reference is made to Exhibit 10(f) of Form 10-Q for the fiscal quarter ended June 30, 1994 (file number 0-8738), which is incorporated herein by reference). |
| | | |
| 10(d)# | | Employment Agreement dated May 17, 2000 by and between Ohio Indemnity Company and Daniel J. Stephan (reference is made to Exhibit 10(g) of Form 10-Q for the fiscal quarter ended March 31, 2002 (file number 0-8738), which is incorporated herein by reference). |
| | | |
| 10(e)# | | Bancinsurance Corporation 2002 Stock Incentive Plan (reference is made to Exhibit 10 of Form S-8 dated June 28, 2002 (file number 333-91396), which is incorporated herein by reference). |
| | | |
| 10(f)# | | Undertaking Agreement dated April 14, 2005 between Bancinsurance Corporation and Si Sokol (reference is made to Exhibit 99.1 of Current Report on Form 8-K filed April 15, 2005 (file number 0-8738), which is incorporated herein by reference). |
63
| | | |
| 10(g)# | | Undertaking Agreement dated April 14, 2005 between Bancinsurance Corporation and John S. Sokol (reference is made to Exhibit 99.2 of Current Report on Form 8-K filed April 15, 2005 (file number 0-8738), which is incorporated herein by reference). |
| | | |
| 10(h)# | | Undertaking Agreement dated April 14, 2005 between Bancinsurance Corporation and Sally J. Cress (reference is made to Exhibit 99.3 of Current Report on Form 8-K filed April 15, 2005 (file number 0-8738), which is incorporated herein by reference). |
| | | |
| 10(i)# | | First Amendment to Undertaking Agreement dated October 17, 2005 between Bancinsurance Corporation and Sally J. Cress (reference is made to Exhibit 99.1 of Current Report on Form 8-K filed October 21, 2005 (file number 0-8738), which is incorporated herein by reference). |
| | | |
| 10(j)# | | Bancinsurance Corporation 2002 Stock Incentive Plan Form of Award Agreement (reference is made to Exhibit 10.1 of Current Report on Form 8-K filed June 6, 2006 (file number 0-8738), which is incorporated herein by reference). |
| | | |
| 10(k)# | | Bancinsurance Corporation 2006 Fiscal Year Executive Officer Bonus Plan (reference is made to Exhibit 10.1 of Current Report on Form 8-K filed July 24, 2006 (file number 0-8738), which is incorporated herein by reference). |
| | | |
| 10(l) | | Stock Purchase Agreement between A.L.P. Acquisition Co., Inc. and Bancinsurance Corporation dated August 31, 2006 (reference is made to Exhibit 10.1 of Current Report on Form 8-K filed September 7, 2006 (file number 0-8738), which is incorporated herein by reference). |
| | | |
| 10(m)# | | Bancinsurance Corporation 2007 Fiscal Year Executive Officer Bonus Plan (reference is made to Exhibit 10.1 of Current Report on Form 8-K filed December 21, 2006 (file number 0-8738), which is incorporated herein by reference). |
| | | |
| 21* | | Subsidiaries of the Registrant as of December 31, 2006. |
| | | |
| 23(a)* | | Consent of Daszkal Bolton LLP. |
| | | |
| 31.1* | | Certification of Principal Executive Officer Pursuant to Rule 13a-14 under the Securities Exchange Act of 1934, as Adopted Pursuant to Section 302 of the Sarbanes-Oxley Act of 2002. |
| | | |
| 31.2* | | Certification of Principal Financial Officer Pursuant to Rule 13a-14 under the Securities Exchange Act of 1934, as Adopted Pursuant to Section 302 of the Sarbanes-Oxley Act of 2002. |
| | | |
| 32.1* | | Certification of Principal Executive Officer and Principal Financial Officer Pursuant to 18 U.S.C. Section 1350, as Adopted Pursuant to Section 906 of the Sarbanes-Oxley Act of 2002. |
| | |
| * | | Filed with this Annual Report on Form 10-K. |
| |
| # | | Constitutes a management contract or compensatory plan or arrangement required to be filed as an exhibit to this Annual Report on Form 10-K. |
| (b) | | Exhibits |
| |
| | | See Item 15(a)(3). |
| |
| (c) | | Financial Statement Schedules |
| |
| | | See Item 15(a)(2). |
64
BANCINSURANCE CORPORATION AND SUBSIDIARIES
Schedule I — SUMMARY OF INVESTMENTS — OTHER
THAN INVESTMENT IN RELATED PARTIES
December 31, 2006
| | | | | | | | | | | |
| Column A | | Column B | | Column C | | Column D | |
| Type of Investment | | Cost (1) | | Estimated | | Amount at which | |
| | | | | | fair | | shown in the | |
| | | | | | value | | balance sheet | |
| |
| Held to maturity: | | | | | | | | | | |
| Fixed maturities: | | | | | | | | | | |
| Governments | | $ | 1,356,518 | | $ | 1,355,469 | | $ | 1,356,518 | |
| Political subdivisions | | | 2,030,077 | | | 2,037,707 | | | 2,030,077 | |
| Special revenue and assessments | | | 1,406,989 | | | 1,457,810 | | | 1,406,989 | |
| | | | | | | | |
| Total held to maturity | | | 4,793,584 | | | 4,850,986 | | | 4,793,584 | |
| | | | | | | | |
| | | | | | | | | | | |
| Available for sale: | | | | | | | | | | |
| Fixed maturities: | | | | | | | | | | |
| States, territories and possessions | | | 4,209,642 | | | 4,248,063 | | | 4,248,063 | |
| Political subdivisions | | | 1,496,513 | | | 1,515,050 | | | 1,515,050 | |
| Special revenue and assessments | | | 58,165,494 | | | 58,863,798 | | | 58,863,798 | |
| Industrial and miscellaneous | | | 4,063,130 | | | 3,920,975 | | | 3,920,975 | |
| | | | | | | | |
| Total available for sale fixed maturities | | | 67,934,779 | | | 68,547,886 | | | 68,547,886 | |
| | | | | | | | |
| | | | | | | | | | | |
| Equity securities: | | | | | | | | | | |
| Preferred stock: | | | | | | | | | | |
| Banks, trusts and insurance companies | | | 250,003 | | | 286,298 | | | 286,298 | |
| | | | | | | | | | | |
| Common stock: | | | | | | | | | | |
| Banks, trusts and insurance companies | | | 1,074,623 | | | 1,662,368 | | | 1,662,368 | |
| Industrial and miscellaneous | | | 922,696 | | | 1,412,840 | | | 1,412,840 | |
| Investment in mutual funds | | | 6,029,985 | | | 6,038,741 | | | 6,038,741 | |
| | | | | | | | |
| Total available for sale equity securities | | | 8,277,307 | | | 9,400,247 | | | 9,400,247 | |
| | | | | | | | |
| | | | | | | | | | | |
| Short-term investments | | | 8,263,980 | | | 8,263,980 | | | 8,263,980 | |
| Other invested assets | | | 751,936 | | | 1,021,450 | | | 751,936 | |
| | | | | | | | |
| | | | | | | | | | | |
| Total investments | | $ | 90,021,586 | | $ | 92,084,549 | | $ | 91,757,633 | |
| | | | | | | | |
| | |
| (1) | | Original cost of equity securities, adjusted for any write-downs, and, as to fixed maturities and short-term investments, original cost reduced by repayments, write-downs and adjusted for amortization of premiums or accrual of discounts. |
65
BANCINSURANCE CORPORATION AND SUBSIDIARIES
Schedule II — CONDENSED FINANCIAL INFORMATION OF
BANCINSURANCE CORPORATION (PARENT COMPANY ONLY)
CONDENSED BALANCE SHEETS
| | | | | | | | | |
| | | December 31, | |
| | | 2006 | | | 2005 | |
| Assets | | | | | | | | |
| | | | | | | | | |
| Cash | | $ | 104,407 | | | $ | 172,751 | |
| | | | | | | | | |
| Unaffiliated investments | | | 751,936 | | | | 807,531 | |
| | | | | | | | | |
| Investments in subsidiaries (at equity) | | | 46,237,424 | | | | 43,379,394 | |
| | | | | | | | | |
| Federal income tax recoverable | | | 271,052 | | | | — | |
| | | | | | | | | |
| Receivable from subsidiaries, net | | | 2,672,990 | | | | — | |
| | | | | | | | | |
| Other | | | 2,691,773 | | | | 2,308,401 | |
| | | | | | | |
| | | | | | | | | |
| Total assets | | | 52,729,582 | | | | 46,668,077 | |
| | | | | | | |
| | | | | | | | | |
| Liabilities and Shareholders’ Equity | | | | | | | | |
| | | | | | | | | |
| Trust preferred debt issued to affiliates | | | 15,465,000 | | | | 15,465,000 | |
| | | | | | | | | |
| Federal income tax payable | | | — | | | | 2,060 | |
| | | | | | | | | |
| Payable to subsidiaries, net | | | — | | | | 525,271 | |
| | | | | | | | | |
| Other | | | 898,963 | | | | 596,120 | |
| | | | | | | | | |
| Shareholders’ equity | | | 36,365,619 | | | | 30,079,626 | |
| | | | | | | |
| | | | | | | | | |
| Total liabilities and shareholders’ equity | | $ | 52,729,582 | | | $ | 46,668,077 | |
| | | | | | | |
66
BANCINSURANCE CORPORATION AND SUBSIDIARIES
Schedule II — CONDENSED FINANCIAL INFORMATION OF
BANCINSURANCE CORPORATION (PARENT COMPANY ONLY)
CONDENSED STATEMENTS OF OPERATIONS
| | | | | | | | | | | | | |
| | | Years ended December 31, | |
| | | 2006 | | | 2005 | | | 2004 | |
| Other income | | $ | 187,184 | | | $ | 288,842 | | | $ | 406,318 | |
| Net realized gain on sale of affiliate | | | 2,511,891 | | | | — | | | | — | |
| Interest expense | | | (1,427,241 | ) | | | (1,150,315 | ) | | | (892,804 | ) |
| General and administrative expenses | | | (914,507 | ) | | | (461,938 | ) | | | (1,364,788 | ) |
| | | | | | | | | | |
| |
| Income (loss) before tax benefit and equity in earnings of subsidiaries | | | 357,327 | | | | (1,323,411 | ) | | | (1,851,274 | ) |
| |
| Federal income tax benefit | | | 28,990 | | | | 269,416 | | | | 643,568 | |
| | | | | | | | | | |
| |
| Income (loss) before equity in earnings of subsidiaries | | | 386,317 | | | | (1,053,995 | ) | | | (1,207,706 | ) |
| |
| Equity in distributed and undistributed earnings of subsidiaries | | | 5,088,584 | | | | 7,348,069 | | | | (7,292,914 | ) |
| | | | | | | | | | |
| |
| Net income (loss) | | $ | 5,474,901 | | | $ | 6,294,074 | | | $ | (8,500,620 | ) |
| | | | | | | | | | |
67
BANCINSURANCE CORPORATION AND SUBSIDIARIES
Schedule II — CONDENSED FINANCIAL INFORMATION OF
BANCINSURANCE CORPORATION (PARENT COMPANY ONLY)
CONDENSED STATEMENTS OF CASH FLOWS
| | | | | | | | | | | | | |
| | | Years ended December 31, | |
| | | 2006 | | | 2005 | | | 2004 | |
| Cash flows from operating activities: | | | | | | | | | | | | |
| Net income (loss) | | $ | 5,474,901 | | | $ | 6,294,074 | | | $ | (8,500,620 | ) |
| Adjustments to reconcile net income (loss) to net cash used in operating activities: | | | | | | | | | | | | |
| Equity in distributed and undistributed net earnings of subsidiaries | | | (5,088,584 | ) | | | (7,348,069 | ) | | | 7,292,914 | |
| Net realized gain on sale of affiliate | | | (2,511,891 | ) | | | — | | | | — | |
| Net realized gains on disposal of furniture and equipment | | | — | | | | (658 | ) | | | (183 | ) |
| Net realized (gains) losses on investments | | | (74,801 | ) | | | (139,979 | ) | | | 286,313 | |
| Depreciation and amortization | | | 135,162 | | | | 145,045 | | | | 147,428 | |
| Deferred federal income tax expense (benefit) | | | (230,484 | ) | | | 254,057 | | | | (306,506 | ) |
| Change in operating assets and liabilities: | | | | | | | | | | | | |
| Notes receivable | | | (104,148 | ) | | | 102,718 | | | | 58,664 | |
| Loans to affiliates | | | (71,719 | ) | | | (71,719 | ) | | | (71,719 | ) |
| Accounts receivable/payable from/to subsidiaries | | | (3,198,261 | ) | | | (4,392,848 | ) | | | 5,398,125 | |
| Other assets | | | 18,218 | | | | 4,138,556 | | | | (3,731,229 | ) |
| Other liabilities | | | 207,578 | | | | (32,974 | ) | | | (685,312 | ) |
| | | | | | | | | | |
| Net cash used in operating activities | | | (5,444,029 | ) | | | (1,051,797 | ) | | | (112,125 | ) |
| | | | | | | | | | |
| | | | | | | | | | | | | |
| Cash flows from investing activities: | | | | | | | | | | | | |
| Proceeds from sale of affiliate, net | | | 4,306,901 | | | | — | | | | — | |
| Proceeds from available for sale fixed maturities sold, redeemed or matured | | | — | | | | 1,393,341 | | | | 764,257 | |
| Proceeds from available for sale equity securities sold | | | 93,426 | | | | 2,000,673 | | | | 735,683 | |
| Cost of investments purchased: | | | | | | | | | | | | |
| Available for sale fixed maturities | | | — | | | | — | | | | (964,535 | ) |
| Available for sale equity securities | | | — | | | | (79,051 | ) | | | (859,367 | ) |
| Other | | | (95,265 | ) | | | (49,928 | ) | | | (171,646 | ) |
| | | | | | | | | | |
| Net cash provided by (used in) investing activities | | | 4,305,062 | | | | 3,265,035 | | | | (495,608 | ) |
| | | | | | | | | | |
| | | | | | | | | | | | | |
| Cash flows from financing activities: | | | | | | | | | | | | |
| Proceeds from note payable to bank | | | — | | | | — | | | | 3,500,000 | |
| Repayments of note payable to bank | | | — | | | | (500,000 | ) | | | (3,000,000 | ) |
| Proceeds from stock options exercised | | | 38,880 | | | | — | | | | 252,705 | |
| Dividends from subsidiaries | | | 1,031,743 | | | | 2,462,563 | | | | — | |
| Capital contribution to subsidiary | | | — | | | | (4,200,000 | ) | | | — | |
| | | | | | | | | | |
| Net cash provided by (used in) financing activities | | | 1,070,623 | | | | (2,237,437 | ) | | | 752,705 | |
| | | | | | | | | | |
| | | | | | | | | | | | | |
| Net increase (decrease) in cash | | | (68,344 | ) | | | (24,199 | ) | | | 144,972 | |
| | | | | | | | | | |
| Cash at beginning of year | | | 172,751 | | | | 196,950 | | | | 51,978 | |
| | | | | | | | | | |
| | | | | | | | | | | | | |
| Cash at end of year | | $ | 104,407 | | | $ | 172,751 | | | $ | 196,950 | |
| | | | | | | | | | |
| |
| Supplemental disclosures of cash flow information: | | | | | | | | | | | | |
| | | | | | | | | | | | | |
| Cash paid (received) during the year for: | | | | | | | | | | | | |
| Interest | | $ | 1,421,109 | | | $ | 1,137,074 | | | $ | 884,457 | |
| | | | | | | | | | |
| Federal income taxes | | $ | 283,091 | | | $ | (58,842 | ) | | $ | — | |
| | | | | | | | | | |
68
Signatures
Pursuant to the requirements of Section 13 or 15(d) of the Securities Exchange Act of 1934, the registrant has duly caused this report to be signed on its behalf by the undersigned, thereunto duly authorized.
| | | | | |
| | Bancinsurance Corporation
| |
| Dated: March 7, 2007 | By: | /s/ John S. Sokol | |
| | | John S. Sokol | |
| | | Acting Chief Executive Officer,
President and Director
(Principal Executive Officer) | |
| |
Pursuant to the requirements of the Securities Exchange Act of 1934, this report has been signed below by the following persons on behalf of the registrant and in the capacities and on the dates indicated.
| | | | | | | |
| | | | | Dated: March 7, 2007 | | /s/ John S. Sokol |
| | | | | | | |
| | | | | | | John S. Sokol |
| | | | | | | Acting Chief Executive Officer |
| | | | | | | President and Director |
| | | | | | | (Principal Executive Officer) |
| | | | | | | |
| Dated: March 7, 2007 | | /s/ Douglas G. Borror | | Dated: March 7, 2007 | | /s/ Kenton R. Bowen |
| | | | | | | |
| | | Douglas G. Borror | | | | Kenton R. Bowen |
| | | Director | | | | Director |
| | | | | | | |
| Dated: March 7, 2007 | | /s/ Stephen P. Close | | Dated: March 7, 2007 | | /s/ Daniel D. Harkins |
| | | | | | | |
| | | Stephen P. Close | | | | Daniel D. Harkins |
| | | Director | | | | Director |
| | | | | | | |
| Dated: March 7, 2007 | | /s/ Saul Sokol | | Dated: March 7, 2007 | | /s/ Matthew D. Walter |
| | | | | | | |
| | | Saul Sokol | | | | Matthew D. Walter |
| | | Director | | | | Director |
| | | | | | | |
| Dated: March 7, 2007 | | /s/ Matthew C. Nolan | | | | |
| | | | | | | |
| | | Matthew C. Nolan | | | | |
| | | Vice President, Chief Financial Officer, | | | | |
| | | Treasurer and Secretary | | | | |
| | | (Principal Financial Officer | | | | |
| | | and Principal Accounting Officer) | | | | |
69
INDEX OF EXHIBITS
The following exhibits required by Item 601 of Regulation S-K are filed as part of this report. For convenience of reference, the exhibits are listed according to the numbers appearing in the Exhibit Table to Item 601 of Regulation S-K
| | | |
| Exhibit No. | | Description |
| | | |
| 3(a) | | Amended and Restated Articles of Incorporation of Bancinsurance Corporation (reference is made to Exhibit 3(a) of Form 10-K for the fiscal year ended December 31, 1984 (file number 0-8738), which is incorporated herein by reference). |
| | | |
| 3(b) | | Certificate of Amendment to the Amended and Restated Articles of Incorporation of Bancinsurance Corporation dated March 10, 1993 (reference is made to Exhibit 3(b) of Form 10-K for the fiscal year ended December 31, 2001 (file number 0-8738), which is incorporated herein by reference). |
| | | |
| 3(c) | | Amended and Restated Articles of Incorporation of Bancinsurance Corporation (reflecting amendments through March 10, 1993) (for SEC reporting purposes only) (reference is made to Exhibit 3(c) of Form 10-K for the fiscal year ended December 31, 2001 (file number 0-8738), which is incorporated herein by reference). |
| | | |
| 3(d) | | Amended and Restated Code of Regulations of Bancinsurance Corporation (reference is made to Exhibit 3(b) of Form 10-K for the fiscal year ended December 31, 1984 (file number 0-8738), which is incorporated herein by reference). |
| | | |
| 4(a) | | Credit Agreement dated January 25, 1993 by and between Bancinsurance Corporation and The Fifth Third Bank of Columbus, Ohio (reference is made to Exhibit 4(a) of Form 10-K for the fiscal year ended December 31, 2001 (file number 0-8738), which is incorporated herein by reference). |
| | | |
| 4(b) | | First Amendment to Credit Agreement dated November 5, 1993 by and between Bancinsurance Corporation and The Fifth Third Bank of Columbus, Ohio (reference is made to Exhibit 4(b) of Form 10-K for the fiscal year ended December 31, 2001 (file number 0-8738), which is incorporated herein by reference). |
| | | |
| 4(c) | | Second Amendment to Credit Agreement dated October 19, 1994 by and between Bancinsurance Corporation and The Fifth Third Bank of Columbus, Ohio (reference is made to Exhibit 4(c) of Form 10-K for the fiscal year ended December 31, 2001 (file number 0-8738), which is incorporated herein by reference). |
| | | |
| 4(d) | | Third Amendment to Credit Agreement dated November 24, 1999 by and between Bancinsurance Corporation and The Fifth Third Bank of Columbus, Ohio (reference is made to Exhibit 4(d) of Form 10-K for the fiscal year ended December 31, 2001 (file number 0-8738), which is incorporated herein by reference). |
| | | |
| 4(e) | | Fourth Amendment to Credit Agreement dated December 11, 2000 by and between Bancinsurance Corporation and The Fifth Third Bank of Columbus, Ohio (reference is made to Exhibit 4(e) of Form 10-K for the fiscal year ended December 31, 2001 (file number 0-8738), which is incorporated herein by reference). |
| | | |
| 4(f) | | Fifth Amendment to Credit Agreement dated July 1, 2002 by and between Bancinsurance Corporation and The Fifth Third Bank of Columbus, Ohio (reference is made to Exhibit 4(f) of Form 10-Q for the fiscal quarter ended June 30, 2002 (file number 0-8738), which is incorporated herein by reference). |
| | | |
| 4(g) | | Sixth Amendment to Credit Agreement dated October 20, 2003 by and between Bancinsurance Corporation and The Fifth Third Bank of Columbus, Ohio (reference is made to Exhibit 4(a) of Form 10Q for the fiscal quarter ended September 30, 2003 (file number 0-8738), which is incorporated herein by reference). |
| | | |
| 4(h) | | Indenture dated as of December 4, 2002 by and between Bancinsurance Corporation and State Street Bank and Trust Company of Connecticut, National Association (reference is made to Exhibit 4(g) of Form 10-K for the fiscal year ended December 31, 2002 (file number 0-8738), which is incorporated herein by reference). |
| | | |
| 4(i) | | Amended and Restated Declaration of Trust dated as of December 4, 2002 by and among Bancinsurance Corporation, State Street Bank and Trust Company of Connecticut, National Association, John Sokol, Si Sokol and Sally Cress (reference is made to Exhibit 4(h) of Form 10-K for the fiscal year ended December 31, 2002 (file number 0-8738), which is incorporated herein by reference). |
| | | |
| 4(j) | | Guarantee Agreement dated as of December 4, 2002 by and between Bancinsurance Corporation and State Street Bank and Trust Company of Connecticut, National Association (reference is made to Exhibit 4(i) of Form 10-K for the fiscal year ended December 31, 2002 (file number 0-8738), which is incorporated herein by reference). |
| | | |
| 4(k) | | Indenture dated as of September 30, 2003 by and between Bancinsurance Corporation and JPMorgan Chase Bank (reference is made to Exhibit 4(b) of Form 10-Q for the fiscal quarter ended September 30, 2003 (file number 0-8738), which is incorporated herein by reference). |
| | | |
| 4(l) | | Amended and Restated Declaration of Trust dated as of September 30, 2003 by and among Bancinsurance Corporation, JPMorgan Chase Bank, Chase Manhattan Bank USA, National Association, John Sokol, Si Sokol and Sally Cress (reference is made to Exhibit 4(c) of Form 10-Q for the fiscal quarter ended September 30, 2003 (file number 0-8738), which is incorporated herein by reference). |
70
| | | |
| Exhibit No. | | Description |
| | | |
| 4(m) | | Guarantee Agreement dated as of September 30, 2003 by and between Bancinsurance Corporation and JPMorgan Chase Bank (reference is made to Exhibit 4(d) of Form 10-Q for the fiscal quarter ended September 30, 2003 (file number 0-8738), which is incorporated herein by reference). |
| | | |
| 4(n) | | Amended and Restated Credit Agreement effective as of June 15, 2006 by and between Bancinsurance Corporation and Fifth Third Bank of Columbus, Ohio (reference is made to Exhibit 4.1 of Current Report on Form 8-K filed June 16, 2006 (file number 0-8738), which is incorporated herein by reference). |
| | | |
| 4(o) | | Eleventh Amendment and Restatement of Note effective as of June 15, 2006 by and between Bancinsurance Corporation and Fifth Third Bank of Columbus, Ohio (reference is made to Exhibit 4.2 of Form 8-K filed June 16, 2006 (file number 0-8738), which is incorporated herein by reference). |
| | | |
| 10(a) | | Amended Tax Allocation Agreement by and between Bancinsurance Corporation and Ohio Indemnity Company (reference is made to Exhibit 10(d) of Form 10-K for the fiscal year ended December 31, 1983 (file number 0-8738), which is incorporated herein by reference). |
| | | |
| 10(b)# | | Bancinsurance Corporation 1984 Stock Option Plan (reference is made to Exhibit 10(d) of Form 10-K for the fiscal year ended December 31, 1984 (file number 0-8738), which is incorporated herein by reference). |
| | | �� |
| 10(c)# | | Bancinsurance Corporation 1994 Stock Option Plan (reference is made to Exhibit 10(f) of Form 10-Q for the fiscal quarter ended June 30, 1994 (file number 0-8738), which is incorporated herein by reference). |
| | | |
| 10(d)# | | Employment Agreement dated May 17, 2000 by and between Ohio Indemnity Company and Daniel J. Stephan (reference is made to Exhibit 10(g) of Form 10-Q for the fiscal quarter ended March 31, 2002 (file number 0-8738), which is incorporated herein by reference). |
| | | |
| 10(e)# | | Bancinsurance Corporation 2002 Stock Incentive Plan (reference is made to Exhibit 10 of Form S-8 dated June 28, 2002 (file number 333-91396), which is incorporated herein by reference). |
| | | |
| 10(f)# | | Undertaking Agreement dated April 14, 2005 between Bancinsurance Corporation and Si Sokol (reference is made to Exhibit 99.1 of Current Report on Form 8-K filed April 15, 2005 (file number 0-8738), which is incorporated herein by reference). |
| | | |
| 10(g)# | | Undertaking Agreement dated April 14, 2005 between Bancinsurance Corporation and John S. Sokol (reference is made to Exhibit 99.2 of Current Report on Form 8-K filed April 15, 2005 (file number 0-8738), which is incorporated herein by reference). |
| | | |
| 10(h)# | | Undertaking Agreement dated April 14, 2005 between Bancinsurance Corporation and Sally J. Cress (reference is made to Exhibit 99.3 of Current Report on Form 8-K filed April 15, 2005 (file number 0-8738), which is incorporated herein by reference). |
| | | |
| 10(i)# | | First Amendment to Undertaking Agreement dated October 17, 2005 between Bancinsurance Corporation and Sally J. Cress (reference is made to Exhibit 99.1 of Current Report on Form 8-K filed October 21, 2005 (file number 0-8738), which is incorporated herein by reference). |
| | | |
| 10(j)# | | Bancinsurance Corporation 2002 Stock Incentive Plan Form of Award Agreement (reference is made to Exhibit 10.1 of Current Report on Form 8-K filed June 6, 2006 (file number 0-8738), which is incorporated herein by reference). |
| | | |
| 10(k)# | | Bancinsurance Corporation 2006 Fiscal Year Executive Officer Bonus Plan (reference is made to Exhibit 10.1 of Current Report on Form 8-K filed July 24, 2006 (file number 0-8738), which is incorporated herein by reference). |
| | | |
| 10(l) | | Stock Purchase Agreement between A.L.P. Acquisition Co., Inc. and Bancinsurance Corporation dated August 31, 2006 (reference is made to Exhibit 10.1 of Current Report on Form 8-K filed September 7, 2006 (file number 0-8738), which is incorporated herein by reference). |
| | | |
| 10(m)# | | Bancinsurance Corporation 2007 Fiscal Year Executive Officer Bonus Plan (reference is made to Exhibit 10.1 of Current Report on Form 8-K filed December 21, 2006 (file number 0-8738), which is incorporated herein by reference). |
| | | |
| 21* | | Subsidiaries of the Registrant as of December 31, 2006. |
71
| | | |
| Exhibit No. | | Description |
| | | |
| 23(a)* | | Consent of Daszkal Bolton LLP. |
| | | |
| 31.1* | | Certification of Principal Executive Officer Pursuant to Rule 13a-14 under the Securities Exchange Act of 1934, as Adopted Pursuant to Section 302 of the Sarbanes-Oxley Act of 2002. |
| | | |
| 31.2* | | Certification of Principal Financial Officer Pursuant to Rule 13a-14 under the Securities Exchange Act of 1934, as Adopted Pursuant to Section 302 of the Sarbanes-Oxley Act of 2002. |
| | | |
| 32.1* | | Certification of Principal Executive Officer and Principal Financial Officer Pursuant to 18 U.S.C. Section 1350, as Adopted Pursuant to Section 906 of the Sarbanes-Oxley Act of 2002. |
| | |
| * | | Filed with this Annual Report on Form 10-K. |
| |
| # | | Constitutes a management contract or compensatory plan or arrangement required to be filed as an exhibit to this Annual Report on Form 10-K. |
72