UNITEDSTATES
SECURITIESANDEXCHANGECOMMISSION
Washington,D.C.20549
FORM N-CSR
CERTIFIED SHAREHOLDER REPORT OF REGISTERED MANAGEMENT
INVESTMENT COMPANIES
Investment Company Act file number 811-02857
Name of Fund: BlackRock High Income Fund of BlackRock Bond Fund, Inc.
Fund Address: 100 Bellevue Parkway, Wilmington, DE 19809
Name and address of agent for service: Anne F. Ackerley, Chief Executive Officer, BlackRock High
Income Fund of BlackRock Bond Fund, Inc., 40 East 52nd Street, New York, NY 10022.
Registrant’s telephone number, including area code: (800) 441-7762
Date of fiscal year end: 09/30/2009
Date of reporting period: 09/30/2009
Item 1 – Report to Stockholders
EQUITIES FIXED INCOME REAL ESTATE LIQUIDITY ALTERNATIVES BLACKROCK SOLUTIONS
BlackRock High Income Fund
OF BLACKROCK BOND FUND, INC.
ANNUAL REPORT | SEPTEMBER 30, 2009
NOT FDIC INSURED
MAY LOSE VALUE
NO BANK GUARANTEE
| |
| Table of Contents | |
| | Page |
| Dear Shareholder | 3 |
| Annual Report: | |
| Fund Summary | 4 |
| About Fund Performance | 6 |
| Disclosure of Expenses | 6 |
| Derivative Financial Instruments | 6 |
| Financial Statements: | |
| Schedule of Investments | 7 |
| Statement of Assets and Liabilities | 15 |
| Statement of Operations | 16 |
| Statements of Changes in Net Assets | 17 |
| Financial Highlights | 18 |
| Notes to Financial Statements | 21 |
| Report of Independent Registered Public Accounting Firm | 29 |
| Important Tax Information (Unaudited) | 29 |
| Disclosure of Investment Advisory Agreement and Sub-Advisory Agreement | 30 |
| Officers and Directors | 34 |
| Additional Information | 37 |
| Mutual Fund Family | 39 |
2 BLACKROCK HIGH INCOME FUND SEPTEMBER 30, 2009
Dear Shareholder
The past 12 months saw a seismic shift in market sentiment — from fear and pessimism during the worst economic decline and crisis of confidence in
financial markets since The Great Depression, to exuberance and increasing optimism amid emerging signs of recovery. The period began on the heels
of the infamous collapse of Lehman Brothers, which triggered an intensifying deterioration in global economic activity in the final months of 2008 and
the early months of 2009 and resulted in massive government intervention (on a global scale) in the financial system and the economy. The tide turned
dramatically in March 2009, however, on the back of new US government initiatives, as well as better-than-expected economic data and upside surprises
in corporate earnings.
Not surprisingly, US equities endured extreme volatility in this environment — steep declines and heightened risk aversion in the early part of the report-
ing period gave way to an impressive seven-month rally that began in March. This rally has pushed all major indexes well into positive territory for 2009.
Stocks did experience modest setbacks in June and then again in late September and early October, but the overall trajectory was up. The experience in
international markets was similar to that in the United States. Prominent in the rally have been emerging markets, which were less affected by the global
credit crunch and are experiencing faster economic growth rates when compared to the developed world.
In fixed income markets, the flight-to-safety premium in Treasury securities prevailed during the equity market downturn, but concerns about deficit spend-
ing, debt issuance, inflation and dollar weakness have kept Treasury yields range bound in recent months. At the same time, near-zero interest rates on
risk-free assets, coupled with an improving macro environment, prompted many investors to reallocate money from cash investments into higher-yielding
and riskier non-Treasury assets, bidding those prices higher. The high yield sector was the greatest beneficiary of this move, having decisively outpaced all
other taxable asset classes since the start of 2009. Similarly, the municipal bond market is on pace for its best performance year ever in 2009, following
one of its worst years in 2008. Investor demand remains strong while the Build America Bonds program has alleviated supply pressures, creating a highly
favorable technical backdrop. Municipal bond mutual funds are seeing record inflows, reflecting the renewed investor interest in the asset class.
| | |
| Total Returns as of September 30, 2009 | 6-month | 12-month |
| US equities (S&P 500 Index) | 34.02% | (6.91)% |
| Small cap US equities (Russell 2000 Index) | 43.95 | (9.55) |
| International equities (MSCI Europe, Australasia, Far East Index) | 49.85 | 3.23 |
| US Treasury securities (BofA Merrill Lynch 10-Year US Treasury Index*) | (3.77) | 7.66 |
| Taxable fixed income (Barclays Capital US Aggregate Bond Index) | 5.59 | 10.56 |
| Tax-exempt fixed income (Barclays Capital Municipal Bond Index) | 9.38 | 14.85 |
| High yield bonds (Barclays Capital US Corporate High Yield 2% Issuer Capped Index) | 40.25 | 22.51 |
| * Formerly a Merrill Lynch Index. | | |
| Past performance is no guarantee of future results. Index performance shown for illustrative purposes only. You cannot invest directly in an index. | |
The market environment has visibly improved since the beginning of the year, but a great deal of uncertainty and risk remain. Through periods of
market turbulence, as ever, BlackRock’s full resources are dedicated to the management of our clients’ assets. For additional market perspective and
investment insight, visit the most recent issue of our award-winning Shareholder® magazine at www.blackrock.com/shareholdermagazine. We thank
you for entrusting BlackRock with your investments, and we look forward to continuing to serve you in the months and years ahead.
Announcement to Shareholders
On June 16, 2009, BlackRock, Inc. announced that it received written notice from Barclays PLC (“Barclays”) in which Barclays’ Board of Directors
had accepted BlackRock’s offer to acquire Barclays Global Investors (“BGI”). At a special meeting held on August 6, 2009, BlackRock’s proposed
purchase of BGI was approved by an overwhelming majority of Barclays’ voting shareholders, an important step toward closing the transaction. The
combination of BlackRock and BGI will bring together market leaders in active and index strategies to create the preeminent asset management firm.
The transaction is scheduled to be completed in the fourth quarter of 2009, subject to important fund shareholder and regulatory approvals.
THIS PAGE NOT PART OF YOUR FUND REPORT 3
Fund Summary as of September 30, 2009
Portfolio Management Commentary
How did the Fund perform?
• The Fund underperformed the benchmark Barclays Capital US Corporate
High Yield 2% Issuer Capped Index for the 12-month period.
What factors influenced performance?
• Relative to the Barclays Capital US Corporate High Yield 2% Issuer
Capped Index, the Fund’s underweight exposure to crossover financial
bonds was a large detriment to performance. Industries such as banking
and life insurance were large drivers of the benchmark’s overall return,
and the Fund under-owned issues in these industries. Security selection
within B-rated credits also weighed on returns. Additionally, the port-
folio’s overweight exposure to floating rate loan interests was a negative
factor. While this asset class produced solid returns during the year,
loans were not able to keep pace with traditional non-investment-grade
bonds and, subsequently, lagged.
• On the positive side, security selection among CCC– and CC-rated bonds
aided returns, as did good security selection in the automotive and
media cable industries. The Fund also largely benefited from its alloca-
tion to new bonds that came to market and traded up substantially.
Exposure to investment-grade paper provided a considerable lift to
returns as well.
Describe recent portfolio activity.
• During the period, we participated very heavily in a robust high yield
new-issue calendar. As the high yield market began to considerably
improve after the start of 2009, we purchased many new-issue bonds
coming from more defensive and higher-rated issuers. We also notice-
ably increased the Fund’s exposure to new senior-secured bond deals
coming via the primary market — in which these proceeds were often
used by issuing companies to pay down their concurrent floating rate
loan interests. Earlier in the year, we built a significant weighting within
new investment-grade bonds coming to market. However, many of these
positions have been largely scaled back as these bonds have greatly
appreciated in price and their risk-reward profiles have diminished.
Overall, we remained negative on the US consumer throughout the year,
but maintained a constructive view on the high yield asset class.
Describe Fund positioning at period end.
At period end, the Fund held a large underweight in BB-rated issues,
with a small overweight in B-rated securities and a moderate overweight
in CCC-rated issues. The Fund was overweight in the automotive, wire-
less and metals industries; it was underweight in healthcare, gaming
and retailers. While near-term default risk has certainly moderated, it is
still expected that the defaults will remain above their historical average
for some time. Nevertheless, we contend that this risk is priced into the
high yield market. High yield paper currently provides very attractive
income — helping to protect against downside risk, while simultaneously
offering the potential for strong, “equity-like” returns. Going forward,
corporate earnings uncertainty and high levels of leverage will inspire
a decent degree of volatility; still, we believe that there are quite promis-
ing opportunities and companies with great relative value in the high
yield universe.
The views expressed reflect the opinions of BlackRock as of the date of this report and are subject to change based on changes in market, economic or other conditions.
These views are not intended to be a forecast of future events and are no guarantee of future results.
| | | |
| Fund Profile | | | |
| | Percent of | | |
| | Corporate | | Percent of |
| | Bond | | Long-Term |
| Credit Quality Allocations1 | Investments | Portfolio Composition | Investments |
| BBB/Baa | 4% | Corporate Bonds | 85% |
| BB/Ba | 32 | Floating Rate Loan Interests | 13 |
| B/B | 37 | Common Stocks | 2 |
| CCC/Caa | 18 | | |
| CC/Ca | 3 | | |
| D | 2 | | |
| Not Rated | 4 | | |
| 1 Using the higher of Standard & Poor’s or Moody’s Investors Service ratings. | | |
| 4 | BLACKROCK HIGH INCOME FUND | SEPTEMBER 30, 2009 | |
| | | | | | | | | | | |
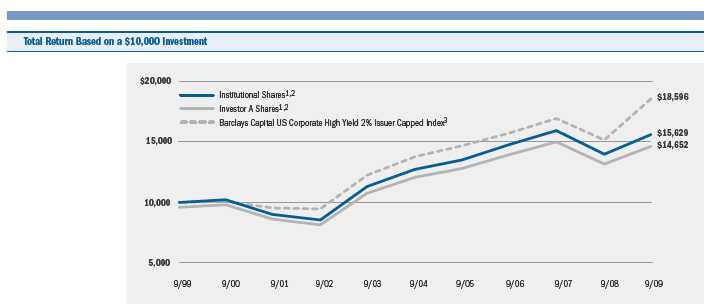
| | 1 Assuming maximum sales charge, if any, transaction costs and other operating expenses, including advisory fees. Institutional Shares do |
| | not have a sales charge. | | | | | | | | | | |
| | 2 The Fund invests principally in fixed income securities which are rated in the lower rating categories of the established rating services, |
| | or in unrated securities of comparable quality. | | | | | | | | | |
| | 3 This unmanaged index is comprised of issues that meet the following criteria: at least $150 million par value outstanding; maximum credit |
| | rating of Ba1; at least one year to maturity; and no issuer represents more than 2% of the index. | | | | |
| Performance Summary for the Period Ended September 30, 2009 | | | | | | | | | |
| | | | | | | | Average Annual Total Returns4 | | | |
| | | | | 1 Year | | 5 Years | | | 10 Years |
| | Standardized | 6-Month | w/o sales | | w/sales | w/o sales | w/sales | w/o sales | w/sales |
| | 30-Day Yields Total Returns | charge | | | charge | charge | charge | charge | | charge |
| Institutional | 8.72% | 40.82% | 11.63% | | N/A | 4.16% | N/A | 4.57% | | N/A |
| Investor A | 8.16 | 40.68 | 11.14 | | | 6.70% | 3.92 | 3.08% | 4.32 | | 3.89% |
| Investor B | 7.99 | 40.25 | 10.42 | | | 6.42 | 3.34 | 3.06 | 3.76 | | 3.76 |
| Investor C | 7.50 | 39.88 | 9.73 | | | 8.73 | 2.85 | 2.85 | 3.39 | | 3.39 |
| Investor C1 | 7.88 | 40.23 | 10.39 | | | 9.39 | 3.28 | 3.28 | 3.69 | | 3.69 |
| Barclays Capital US Corporate High Yield 2% | | | | | | | | | | |
| Issuer Capped Index | — | 40.25 | 22.51 | | | N/A | 6.16 | N/A | 6.40 | | N/A |
| 4 Assuming maximum sales charges, if any. Average annual total returns with and without sales charges reflect reductions for distribution and service fees. See “About Fund |
| Performance” on page 6 for a detailed description of share classes, including any related sales charges and fees. | | | | |
| N/A — Not applicable as share class and index do not have a sales charge. | | | | | | | | | |
| Past performance is not indicative of future results. | | | | | | | | | | |
| Expense Example | | | | | | | | | | | |
| | | Actual | | | | | | Hypothetical6 | | |
| | Beginning | Ending | | Expenses | Beginning | | Ending | | Expenses |
| | Account Value | Account Value | Paid During | Account Value | Account Value | | Paid During |
| | April 1, 2009 | September 30, 2009 | the Period5 | April 1, 2009 | September 30, 2009 | | the Period5 |
| Institutional | $1,000 | $1,408.20 | | $ 4.47 | $1,000 | $1,021.39 | | $ 3.75 |
| Investor A | $1,000 | $1,406.80 | | $ 5.73 | $1,000 | $1,020.34 | | $ 4.81 |
| Investor B | $1,000 | $1,402.50 | | $ 9.52 | $1,000 | $1,017.18 | | $ 7.99 |
| Investor C | $1,000 | $1,398.80 | | $12.69 | $1,000 | $1,014.52 | | $10.66 |
| Investor C1 | $1,000 | $1,402.30 | | $ 9.76 | $1,000 | $1,016.98 | | $ 8.19 |
| 5 For each class of the Fund, expenses are equal to the annualized expense ratio for the class (0.74% for Institutional, 0.95% for Investor A, 1.58% for Investor B, 2.11% for |
| Investor C and 1.62% for Investor C1), multiplied by the average account value over the period, multiplied by 183/365 (to reflect the one-half year period shown). |
| 6 Hypothetical 5% annual return before expenses is calculated by pro-rating the number of days in the most recent fiscal half year divided by 365. | | |
| See “Disclosure of Expenses” on page 6 for further information on how expenses were calculated. | | | | | |
| | BLACKROCK HIGH INCOME FUND | | | | | SEPTEMBER 30, 2009 | | 5 |
About Fund Performance
• Institutional Shares are not subject to any sales charge. Institutional
Shares bear no ongoing distribution or service fees and are available
only to eligible investors.
• Investor A Shares incur a maximum initial sales charge (front-end load)
of 4% and a service fee of 0.25% per year (but no distribution fee).
• Investor B Shares are subject to a maximum contingent deferred sales
charge of 4% declining to 0% after six years. In addition, Investor B
Shares are subject to a distribution fee of 0.50% per year and a service
fee of 0.25% per year. These shares automatically convert to Investor A
Shares after approximately 10 years. (There is no initial sales charge for
automatic share conversions.)
• Investor C Shares are subject to a distribution fee of 0.75% per year
and a service fee of 0.25% per year. In addition, Investor C Shares are
subject to a 1% contingent deferred sales charge if redeemed within
one year of purchase. Prior to October 2, 2006, Investor C Share
performance results are those of Institutional Shares (which have no
distribution or service fees) restated to reflect Investor C Share fees.
• Investor C1 Shares are subject to a distribution fee of 0.55% per year
and a service fee of 0.25% per year. In addition, Investor C1 Shares are
subject to a 1% contingent deferred sales charge if redeemed within
one year of purchase.
Performance information reflects past performance and does not guaran-
tee future results. Current performance may be lower or higher than the
performance data quoted. Refer to www.blackrock.com/funds to obtain
performance data current to the most recent month-end. Performance
results do not reflect the deduction of taxes that a shareholder would pay
on fund distributions or the redemption of fund shares. The Fund may
charge a 2% redemption fee for sales or exchanges of shares within
30 days of purchase or exchange. Performance data does not reflect this
potential fee. Figures shown in the performance tables on the previous
page assume reinvestment of all dividends and capital gain distributions,
if any, at net asset value on the ex-dividend date. Investment return and
principal value of shares will fluctuate so that shares, when redeemed,
may be worth more or less than their original cost. Dividends paid to
each class of shares will vary because of the different levels of service,
distribution and transfer agency fees applicable to each class, which are
deducted from the income available to be paid to shareholders.
Disclosure of Expenses
Shareholders of this Fund may incur the following charges: (a) expenses
related to transactions, including sales charges, redemption fees and
exchange fees; and (b) operating expenses including advisory fees,
distribution fees including 12b-1 fees, and other Fund expenses. The
expense example on the previous page (which is based on a hypotheti-
cal investment of $1,000 invested on April 1, 2009 and held through
September 30, 2009) is intended to assist shareholders both in calcu-
lating expenses based on an investment in the Fund and in comparing
these expenses with similar costs of investing in other mutual funds.
The table provides information about actual account values and actual
expenses. In order to estimate the expenses a shareholder paid during
the period covered by this report, shareholders can divide their account
value by $1,000 and then multiply the result by the number correspon-
ding to their share class under the heading entitled “Expenses Paid During
the Period.”
The table also provides information about hypothetical account values
and hypothetical expenses based on the Fund’s actual expense ratio
and an assumed rate of return of 5% per year before expenses. In
order to assist shareholders in comparing the ongoing expenses of
investing in this Fund and other funds, compare the 5% hypothetical
example with the 5% hypothetical examples that appear in other funds’
shareholder reports.
The expenses shown in the table are intended to highlight shareholders’
ongoing costs only and do not reflect any transactional expenses, such
as sales charges, redemption fees or exchange fees. Therefore, the hypo-
thetical example is useful in comparing ongoing expenses only, and will
not help shareholders determine the relative total expenses of owning
different funds. If these transactional expenses were included, shareholder
expenses would have been higher.
Derivative Financial Instruments
The Fund may invest in various derivative instruments, including swaps,
options and foreign currency exchange contracts as specified in Note 2
of the Notes to Financial Statements, which constitute forms of eco-
nomic leverage. Such instruments are used to obtain exposure to a mar-
ket without owning or taking physical custody of securities or to hedge
market and/or interest rate risks. Such derivative instruments involve
risks, including the imperfect correlation between the value of a deriva-
tive instrument and the underlying asset, possible default of the counter-
party to the transaction and illiquidity of the derivative instrument. The
Fund’s ability to successfully use a derivative instrument depends on the
investment advisor’s ability to accurately predict pertinent market move-
ments, which cannot be assured. The use of derivative instruments may
result in losses greater than if they had not been used, may require the
Fund to sell or purchase portfolio securities at inopportune times or for
distressed values, may limit the amount of appreciation the Fund can
realize on an investment or may cause the Fund to hold a security that
it might otherwise sell. The Fund’s investments in these instruments are
discussed in detail in the Notes to Financial Statements.
6 BLACKROCK HIGH INCOME FUND SEPTEMBER 30, 2009
Schedule of Investments September 30, 2009 (Percentages shown are based on Net Assets)
| | | |
| Common Stocks | | Shares | Value |
| Building Products — 0.6% | | | |
| Masonite Worldwide Holdings (a) | | 164,037 | $ 6,233,406 |
| Communications Equipment — 0.7% | | | |
| Loral Space & Communications Ltd. (a) | | 258,381 | 7,100,310 |
| Diversified Telecommunication Services — 0.0% | | |
| PTV, Inc. (a) | | 2 | 1,000 |
| Electrical Equipment — 0.0% | | | |
| Medis Technologies Ltd. (a) | | 852,625 | 285,629 |
| SunPower Corp. Class B (a) | | 2,142 | 54,043 |
| | | | 339,672 |
| Hotels, Restaurants & Leisure — 0.0% | | | |
| Buffets Restaurants Holdings, Inc. (a) | | 3,546 | 35 |
| Household Durables — 0.0% | | | |
| Ashton Woods Class B Membership Units | | 1 | — |
| Paper & Forest Products — 0.3% | | | |
| Ainsworth Lumber Co. Ltd. (a) | | 615,817 | 1,386,185 |
| Ainsworth Lumber Co. Ltd. (a)(b) | | 691,101 | 1,551,806 |
| Western Forest Products, Inc. (a) | | 1,280,355 | 310,925 |
| Western Forest Products, Inc. (a)(b) | | 330,542 | 80,270 |
| | | | 3,329,186 |
| Total Common Stocks — 1.6% | | | 17,003,609 |
| | | Par | |
| Corporate Bonds | | (000) | |
| Aerospace & Defense — 0.3% | | | |
| L-3 Communications Corp., 5.88%, 1/15/15 | USD | 2,600 | 2,587,000 |
| Airlines — 0.6% | | | |
| Continental Airlines, Inc., Series 2003-RJ, 7.88%, | | |
| 1/02/20 | | 1,650 | 1,254,199 |
| Delta Air Lines, Inc., 9.50%, 9/15/14 (b) | | 950 | 950,000 |
| United Air Lines, Inc., 12.75%, 7/15/12 | | 3,900 | 3,900,000 |
| | | | 6,104,199 |
| Auto Components — 1.5% | | | |
| Allison Transmission, Inc., 11.00%, 11/01/15 (b) | 3,419 | 3,350,620 |
| The Goodyear Tire & Rubber Co.: | | | |
| 7.86%, 8/15/11 | | 3,530 | 3,600,600 |
| 8.63%, 12/01/11 | | 4,482 | 4,627,665 |
| Lear Corp. (a)(c): | | | |
| 8.50%, 12/01/13 | | 2,290 | 1,511,400 |
| 8.75%, 12/01/16 | | 3,805 | 2,511,300 |
| | | | 15,601,585 |
| Biotechnology — 0.2% | | | |
| Gilead Sciences, Inc., 0.63%, 5/01/13 (d) | | 1,365 | 1,783,031 |
| Building Products — 0.2% | | | |
| Ply Gem Industries, Inc., 11.75%, 6/15/13 | | 2,770 | 2,437,600 |
| Capital Markets — 0.2% | | | |
| E*Trade Financial Corp.: | | | |
| 12.50%, 11/30/17 (b)(e) | | 260 | 288,600 |
| 12.50%, 11/30/17 (e) | | 8 | 8,880 |
| 3.63%, 8/31/19 (b)(d)(f) | | 831 | 1,405,429 |
| Series A, 3.96%, 8/31/19 (d)(f) | | 26 | 43,973 |
| | | | 1,746,882 |
| | | |
| | | Par | |
| Corporate Bonds | | (000) | Value |
| Chemicals — 1.5% | | | |
| American Pacific Corp., 9.00%, 2/01/15 | USD | 3,100 | $ 2,813,250 |
| Huntsman International LLC (b): | | | |
| 6.88%, 11/15/13 | EUR | 1,245 | 1,621,473 |
| 5.50%, 6/30/16 | USD | 2,425 | 2,061,250 |
| Innophos, Inc., 8.88%, 8/15/14 | | 2,480 | 2,504,800 |
| MacDermid, Inc., 9.50%, 4/15/17 (b) | | 2,460 | 2,263,200 |
| Nalco Co., 8.25%, 5/15/17 (b) | | 2,350 | 2,467,500 |
| Olin Corp., 8.88%, 8/15/19 | | 1,320 | 1,379,400 |
| Terra Capital, Inc., Series B, 7.00%, 2/01/17 | | 325 | 338,813 |
| | | | 15,449,686 |
| Commercial Banks — 0.1% | | | |
| Glitnir Banki HF (a)(c): | | | |
| 4.15%, 4/20/10 (b) | | 810 | 198,450 |
| 4.97%, 1/18/12 (b) | | 450 | 110,250 |
| 6.38%, 9/25/12 (b) | | 2,270 | 556,150 |
| Series EMTN, 5.07%, 1/27/10 | EUR | 200 | 65,851 |
| Series EMTN, 3.00%, 6/30/10 | | 210 | 69,144 |
| Series GMTN, 4.38%, 2/05/10 | | 220 | 72,436 |
| | | | 1,072,281 |
| Commercial Services & Supplies — 3.2% | | | |
| ARAMARK Corp., 3.98%, 2/01/15 (g) | USD | 2,000 | 1,735,000 |
| Altegrity, Inc., 10.50%, 11/01/15 (b) | | 2,800 | 2,366,000 |
| Corrections Corp. of America, 6.75%, 1/31/14 | | 2,025 | 2,002,219 |
| DI Finance, Series B, 9.50%, 2/15/13 | | 1,835 | 1,871,700 |
| GeoEye, Inc., 9.63%, 10/01/15 (b) | | 1,470 | 1,488,375 |
| ISS Financing, 11.00%, 6/15/14 | EUR | 1,278 | 1,985,504 |
| International Lease Finance Corp.: | | | |
| 5.63%, 9/20/13 | USD | 600 | 457,133 |
| 5.65%, 6/01/14 | | 3,235 | 2,482,966 |
| Iron Mountain, Inc., 8.38%, 8/15/21 | | 3,300 | 3,399,000 |
| Mobile Services Group, Inc., 9.75%, 8/01/14 | | 2,750 | 2,798,125 |
| RSC Equipment Rental, Inc., 10.00%, 7/15/17 (b) | 3,385 | 3,638,875 |
| Scientific Games International, Inc., 9.25%, | | | |
| 6/15/19 (b) | | 2,665 | 2,771,600 |
| West Corp., 11.00%, 10/15/16 | | 6,025 | 5,979,813 |
| | | | 32,976,310 |
| Construction & Engineering — 0.2% | | | |
| Dycom Industries, Inc., 8.13%, 10/15/15 | | 2,175 | 1,979,250 |
| Construction Materials — 0.5% | | | |
| Nortek, Inc., 10.00%, 12/01/13 | | 4,680 | 4,773,600 |
| Texas Industries, Inc., 7.25%, 7/15/13 | | 560 | 537,600 |
| | | | 5,311,200 |
| Consumer Finance — 0.2% | | | |
| Ford Motor Credit Co. LLC, 7.50%, 8/01/12 | | 1,230 | 1,181,005 |
| Inmarsat Finance Plc, 7.63%, 6/30/12 | | 400 | 401,000 |
| | | | 1,582,005 |
| Containers & Packaging — 3.9% | | | |
| Ball Corp.: | | | |
| 7.13%, 9/01/16 | | 1,800 | 1,836,000 |
| 7.38%, 9/01/19 | | 1,800 | 1,827,000 |
| Berry Plastics Corp., 5.26%, 2/15/15 (g) | | 2,140 | 1,968,800 |
| Berry Plastics Holding Corp., 4.17%, | | | |
| 9/15/14 (g) | | 3,150 | 2,425,500 |
| Crown Americas LLC, 7.63%, 5/15/17 (b) | | 3,980 | 4,019,800 |
| Crown European Holdings SA, 6.25%, 9/01/11 | EUR | 356 | 541,793 |
See Notes to Financial Statements.
BLACKROCK HIGH INCOME FUND SEPTEMBER 30, 2009 7
Schedule of Investments (continued) (Percentages shown are based on Net Assets)
| | | |
| | | Par | |
| Corporate Bonds | | (000) | Value |
| Containers & Packaging (concluded) | | | |
| Graphic Packaging International, Inc.: | | | |
| 9.50%, 8/15/13 | USD | 761 | $ 783,830 |
| 9.50%, 6/15/17 (b) | | 5,430 | 5,769,374 |
| Greif, Inc., 7.75%, 8/01/19 (b) | | 1,155 | 1,189,650 |
| Impress Holdings BV, 3.63%, 9/15/13 (b)(g) | | 1,930 | 1,828,675 |
| Owens-Brockway Glass Container, Inc.: | | | |
| 8.25%, 5/15/13 | | 1,020 | 1,042,950 |
| 6.75%, 12/01/14 | EUR | 1,015 | 1,470,455 |
| 7.38%, 5/15/16 | USD | 2,555 | 2,593,325 |
| Packaging Dynamics Finance Corp., 10.00%, | | | |
| 5/01/16 (b) | | 2,550 | 1,153,875 |
| Pregis Corp., 12.38%, 10/15/13 | | 4,485 | 4,238,325 |
| Rock-Tenn Co., 5.63%, 3/15/13 | | 1,910 | 1,852,700 |
| Sealed Air Corp., 7.88%, 6/15/17 (b) | | 3,200 | 3,374,371 |
| Solo Cup Co., 10.50%, 11/01/13 (b) | | 1,790 | 1,897,400 |
| | | | 39,813,823 |
| Distributors — 0.6% | | | |
| American Tire Distributors, Inc., 6.54%, 4/01/12 (g) | 6,835 | 5,673,050 |
| Diversified Financial Services — 7.1% | | | |
| Axcan Intermediate Holdings, Inc., 12.75%, 3/01/16 | 3,230 | 3,488,400 |
| CIT Group, Inc.: | | | |
| 0.42%, 3/12/10 (g) | | 630 | 453,600 |
| 5.20%, 11/03/10 | | 540 | 370,348 |
| 4.75%, 12/15/10 | | 855 | 590,653 |
| 0.78%, 7/28/11 (g) | | 920 | 644,847 |
| 5.00%, 2/01/15 | | 4,770 | 3,054,994 |
| FCE Bank Plc: | | | |
| 7.88%, 2/15/11 | GBP | 2,000 | 3,132,391 |
| 7.13%, 1/16/12 | EUR | 12,950 | 18,002,956 |
| 7.13%, 1/15/13 | | 3,550 | 4,805,300 |
| GMAC LLC (b): | | | |
| 7.25%, 3/02/11 | USD | 3,100 | 2,983,750 |
| 6.88%, 8/28/12 | | 680 | 625,600 |
| 2.56%, 12/01/14 (g) | | 11,601 | 8,990,775 |
| 6.75%, 12/01/14 | | 4,123 | 3,504,550 |
| 8.00%, 11/01/31 | | 7,630 | 6,142,150 |
| General Motors Acceptance Corp. of Canada Ltd., | | | |
| 6.00%, 5/25/10 | CAD | 6,800 | 6,186,149 |
| Leucadia National Corp., 8.13%, 9/15/15 | USD | 6,200 | 6,324,000 |
| Saturns Investments Europe Plc, 6.19%, 6/09/14 | | 1,275 | 892,500 |
| Southern Star Central Corp., 6.75%, 3/01/16 (b) | | 2,090 | 1,995,950 |
| | | | 72,188,913 |
| Diversified Telecommunication Services — 3.9% | | |
| Broadview Networks Holdings, Inc., 11.38%, | | | |
| 9/01/12 | | 5,230 | 4,791,987 |
| Cincinnati Bell, Inc., 7.25%, 7/15/13 | | 6,400 | 6,496,000 |
| Nordic Telephone Co. Holdings ApS, 8.88%, | | | |
| 5/01/16 (b) | | 1,290 | 1,335,150 |
| Qwest Communications International, Inc.: | | | |
| 8.00%, 10/01/15 (b) | | 2,500 | 2,496,875 |
| 3.50%, 11/15/25 (d) | | 5,060 | 5,104,275 |
| Series B, 7.50%, 2/15/14 | | 1,395 | 1,377,562 |
| Qwest Corp.: | | | |
| 7.50%, 10/01/14 | | 7,670 | 7,746,700 |
| 8.38%, 5/01/16 (b) | | 2,840 | 2,939,400 |
| Series WI, 6.50%, 6/01/17 | | 1,680 | 1,579,200 |
| | | |
| | | Par | |
| Corporate Bonds | | (000) | Value |
| Diversified Telecommunication Services (concluded) | | |
| Windstream Corp.: | | | |
| 8.13%, 8/01/13 | USD | 4,605 | $ 4,731,638 |
| 8.63%, 8/01/16 | | 1,145 | 1,170,763 |
| | | | 39,769,550 |
| Electric Utilities — 1.5% | | | |
| Edison Mission Energy, 7.20%, 5/15/19 | | 75 | 60,750 |
| Elwood Energy LLC, 8.16%, 7/05/26 | | 1,343 | 1,182,801 |
| IPALCO Enterprises, Inc.: | | | |
| 8.63%, 11/14/11 (h) | | 1,500 | 1,537,500 |
| 7.25%, 4/01/16 (b) | | 1,670 | 1,674,175 |
| NSG Holdings LLC, 7.75%, 12/15/25 (b) | | 7,725 | 6,913,875 |
| Tenaska Alabama Partners LP, 7.00%, 6/30/21 (b) | 4,054 | 3,680,757 |
| | | | 15,049,858 |
| Energy Equipment & Services — 0.8% | | | |
| Compagnie Generale de Geophysique-Veritas: | | |
| 9.50%, 5/15/16 (b) | | 1,045 | 1,105,087 |
| 7.75%, 5/15/17 | | 3,035 | 3,012,237 |
| North American Energy Alliance LLC, 10.88%, | | | |
| 6/01/16 (b) | | 2,400 | 2,472,000 |
| North American Energy Partners, Inc., 8.75%, | | | |
| 12/01/11 | | 1,665 | 1,631,700 |
| | | | 8,221,024 |
| Food & Staples Retailing — 0.3% | | | |
| AmeriQual Group LLC, 9.50%, 4/01/12 (b) | | 3,200 | 2,560,000 |
| Duane Reade, Inc., 11.75%, 8/01/15 (b) | | 760 | 798,000 |
| | | | 3,358,000 |
| Food Products — 0.4% | | | |
| DGS International Finance Co., 10.00%, | | | |
| 6/01/07 (a)(b)(c) | | 20,000 | 2 |
| Smithfield Foods, Inc., 10.00%, 7/15/14 (b) | | 3,800 | 3,990,000 |
| | | | 3,990,002 |
| Health Care Equipment & Supplies — 1.4% | | | |
| DJO Finance LLC, 10.88%, 11/15/14 | | 3,910 | 3,997,975 |
| Elan Corp. Plc, 8.75%, 10/15/2016 (b) | | 3,255 | 3,214,313 |
| Hologic, Inc., 2.00%, 12/15/37 (d)(h) | | 9,105 | 7,443,338 |
| | | | 14,655,626 |
| Health Care Providers & Services — 1.6% | | | |
| Community Health Systems, Inc., Series WI, | | | |
| 8.88%, 7/15/15 | | 5,479 | 5,615,975 |
| HealthSouth Corp., 10.75%, 6/15/16 | | 990 | 1,074,150 |
| Tenet Healthcare Corp. (b): | | | |
| 9.00%, 5/01/15 | | 6,614 | 6,911,630 |
| 10.00%, 5/01/18 | | 2,284 | 2,518,110 |
| | | | 16,119,865 |
| Hotels, Restaurants & Leisure — 2.4% | | | |
| American Real Estate Partners LP, 7.13%, | | | |
| 2/15/13 (i) | | 10,735 | 10,332,437 |
| Fontainebleau Las Vegas Holdings LLC, 10.25%, | | |
| 6/15/15 (a)(b)(c) | | 225 | 6,187 |
| Gaylord Entertainment Co., 8.00%, 11/15/13 | 1,270 | 1,301,750 |
| Greektown Holdings, LLC, 10.75%, 12/01/13 (a)(b)(c) | 3,200 | 776,000 |
| Harrahs Operating Co., Inc., 10.00%, 12/15/15 (b) | 580 | 481,400 |
| Little Traverse Bay Bands of Odawa Indians, | | | |
| 10.25%, 2/15/14 (a)(b)(c) | | 5,965 | 2,751,356 |
See Notes to Financial Statements.
8 BLACKROCK HIGH INCOME FUND SEPTEMBER 30, 2009
Schedule of Investments (continued) (Percentages shown are based on Net Assets)
| | | |
| | | Par | |
| Corporate Bonds | | (000) | Value |
| Hotels, Restaurants & Leisure (concluded) | | | |
| MGM Mirage, 11.13%, 11/15/17 (b) | USD | 2,150 | $ 2,348,875 |
| Mashantucket Western Pequot Tribe, Series A, | | | |
| 8.50%, 11/15/15 (b) | | 970 | 351,625 |
| Scientific Games Corp., 0.75%, 12/01/24 (d)(h) | 1,450 | 1,421,000 |
| Snoqualmie Entertainment Authority, 4.68%, | | | |
| 2/01/14 (b)(g) | | 1,175 | 575,750 |
| Travelport LLC: | | | |
| 4.99%, 9/01/14 (g) | | 600 | 504,000 |
| 9.88%, 9/01/14 | | 930 | 899,775 |
| 11.88%, 9/01/16 | | 100 | 91,500 |
| Tropicana Entertainment LLC, Series WI, 9.63%, | | |
| 12/15/14 (a)(c) | | 405 | 253 |
| Virgin River Casino Corp., 9.00%, 1/15/12 (a)(c) | 8,165 | 979,800 |
| Waterford Gaming LLC, 8.63%, 9/15/14 (b) | | 2,905 | 1,888,250 |
| | | | 24,709,958 |
| Household Durables — 2.9% | | | |
| Ashton Woods USA LLC, 16.29%, 6/30/15 (b)(j) | 4,220 | 843,960 |
| Beazer Homes USA, Inc.: | | | |
| 8.38%, 4/15/12 | | 4,195 | 3,670,625 |
| 12.00%, 10/15/17 (b) | | 3,000 | 3,150,000 |
| K Hovnanian Enterprises, Inc., 18.00%, 5/01/17 | 2,090 | 1,703,350 |
| KB Home: | | | |
| 6.38%, 8/15/11 | | 152 | 153,520 |
| 9.10%, 9/15/17 | | 1,560 | 1,677,000 |
| Meritage Homes Corp., 6.25%, 3/15/15 | | 1,225 | 1,139,250 |
| Pulte Homes, Inc., 6.38%, 5/15/33 | | 300 | 231,000 |
| Standard Pacific Corp.: | | | |
| 7.75%, 3/15/13 | | 1,500 | 1,410,000 |
| 6.25%, 4/01/14 | | 3,435 | 2,988,450 |
| 7.00%, 8/15/15 | | 6,485 | 5,674,375 |
| Standard Pacific Escrow LLC, 10.75%, 9/15/16 (b) | 1,795 | 1,768,075 |
| Stanley-Martin Communities LLC, 9.75%, | | | |
| 8/15/15 (a)(c) | | 14,000 | 3,465,000 |
| Toll Brothers Finance Corp., 8.91%, 10/15/17 | 1,135 | 1,287,260 |
| | | | 29,161,865 |
| IT Services — 2.0% | | | |
| Alliance Data Systems Corp., 1.75%, 8/01/13 (d) | 6,710 | 6,458,375 |
| First Data Corp.: | | | |
| 9.88%, 9/24/15 | | 1,400 | 1,293,250 |
| 11.25%, 3/31/16 | | 14,235 | 12,242,100 |
| iPayment Investors LP, 12.75%, 7/15/14 (b)(e) | 522 | 208,923 |
| | | | 20,202,648 |
| Independent Power Producers & Energy Traders — 4.0% | |
| The AES Corp., 8.75%, 5/15/13 (b) | | 350 | 356,562 |
| AES Eastern Energy LP, Series 99-B, 9.67%, | | | |
| 1/02/29 | | 2,800 | 2,436,000 |
| Calpine Construction Finance Co. LP, 8.00%, | | | |
| 6/01/16 (b) | | 5,750 | 5,893,750 |
| Dynegy Holdings, Inc., 8.38%, 5/01/16 | | 630 | 589,050 |
| Energy Future Holdings Corp., 11.25%, 11/01/17 (e) | 18,290 | 11,371,787 |
| NRG Energy, Inc.: | | | |
| 7.25%, 2/01/14 | | 2,635 | 2,588,887 |
| 7.38%, 2/01/16 | | 9,895 | 9,573,412 |
| 8.50%, 6/15/19 | | 3,680 | 3,684,600 |
| Texas Competitive Electric Holdings Co. LLC, 10.50%, | | |
| 11/01/16 (e) | | 7,254 | 4,652,544 |
| | | | 41,146,592 |
| | | |
| | | Par | |
| Corporate Bonds | | (000) | Value |
| Industrial Conglomerates — 1.2% | | | |
| Sequa Corp. (b): | | | |
| 11.75%, 12/01/15 | USD | 6,480 | $ 5,119,200 |
| 13.50%, 12/01/15 (e) | | 9,216 | 6,903,875 |
| | | | 12,023,075 |
| Insurance — 0.1% | | | |
| USI Holdings Corp., 4.32%, 11/15/14 (b)(g) | | 1,530 | 1,271,813 |
| Leisure Equipment & Products — 0.7% | | | |
| Brunswick Corp., 11.25%, 11/01/16 (b) | | 5,110 | 5,569,900 |
| Nebraska Book Co., Inc., 10.00%, 12/01/11 (b) | | 2,050 | 2,039,750 |
| | | | 7,609,650 |
| Life Sciences Tools & Services — 0.3% | | | |
| Bio-Rad Laboratories, Inc., 8.00%, 9/15/16 (b) | | 3,190 | 3,309,625 |
| Machinery — 0.8% | | | |
| ESCO Corp. (b): | | | |
| 4.17%, 12/15/13 (g) | | 1,110 | 999,000 |
| 8.63%, 12/15/13 | | 2,810 | 2,753,800 |
| RBS Global, Inc., 8.88%, 9/01/16 | | 1,205 | 979,063 |
| Titan International, Inc., 8.00%, 1/15/12 | | 3,315 | 3,207,263 |
| | | | 7,939,126 |
| Marine — 0.6% | | | |
| Horizon Lines, Inc., 4.25%, 8/15/12 (d) | | 6,300 | 4,969,125 |
| Navios Maritime Holdings, Inc., 9.50%, 12/15/14 | 1,217 | 1,150,065 |
| | | | 6,119,190 |
| Media — 9.0% | | | |
| Affinion Group, Inc., 10.13%, 10/15/13 | | 5,690 | 5,846,475 |
| CCO Holdings LLC, 8.75%, 11/15/13 | | 2,745 | 2,786,175 |
| CSC Holdings, Inc., Series B, 7.63%, 4/01/11 | | 730 | 757,375 |
| Cablevision Systems Corp., Series B, 8.00%, | | | |
| 4/15/12 | | 5,205 | 5,426,212 |
| Catalina Marketing Corp., 10.50%, | | | |
| 10/01/15 (b)(e)(h) | | 5,855 | 5,862,319 |
| Central European Media Enterprises Ltd., | | | |
| 11.63%, 9/15/16 | EUR | 3,300 | 4,961,879 |
| Charter Communications Holdings II, LLC (a)(c): | | | |
| 10.25%, 9/15/10 | USD | 3,395 | 3,819,375 |
| Series B, 10.25%, 9/15/10 | | 770 | 862,400 |
| Charter Communications Operating, LLC (b): | | | |
| 8.41%, 4/30/12 (f) | | 2,550 | 2,594,625 |
| 8.38%, 4/30/14 | | 3,530 | 3,600,600 |
| Charter Communications, Inc., 6.50%, | | | |
| 10/01/27 (a)(c)(d) | | 2,690 | 1,223,950 |
| Clear Channel Communications, Inc.: | | | |
| 5.00%, 3/15/12 | | 1,400 | 827,750 |
| 5.75%, 1/15/13 | | 330 | 171,600 |
| 11.00%, 8/01/16 (e) | | 7,980 | 2,793,000 |
| EchoStar DBS Corp., 7.00%, 10/01/13 | | 6,680 | 6,730,100 |
| Harland Clarke Holdings Corp.: | | | |
| 6.00%, 5/15/15 (g) | | 980 | 737,450 |
| 9.50%, 5/15/15 | | 1,180 | 1,056,100 |
| Intelstat Corp., 9.25%, 6/15/16 | | 4,370 | 4,501,100 |
| Intelsat Subsidiary Holding Co. Ltd.: | | | |
| 8.50%, 1/15/13 | | 1,890 | 1,913,625 |
| 8.88%, 1/15/15 | | 670 | 681,725 |
| 8.88%, 1/15/15 (b) | | 1,350 | 1,366,875 |
| Liberty Media Corp., 3.13%, 3/30/23 (d) | | 2,775 | 2,747,250 |
| Local Insight Regatta Holdings, Inc., 11.00%, | | | |
| 12/01/17 | | 1,393 | 696,500 |
See Notes to Financial Statements.
BLACKROCK HIGH INCOME FUND SEPTEMBER 30, 2009 9
Schedule of Investments (continued) (Percentages shown are based on Net Assets)
| | | |
| | | Par | |
| Corporate Bonds | | (000) | Value |
| Media (concluded) | | | |
| Mediacom Broadband LLC, 8.50%, 10/15/15 | USD | 1,600 | $ 1,616,000 |
| NTL Cable Plc, 8.75%, 4/15/14 | | 195 | 198,900 |
| Network Communications, Inc., 10.75%, | | | |
| 12/01/13 | | 200 | 56,250 |
| Nielsen Finance LLC: | | | |
| 11.63%, 2/01/14 | | 1,930 | 2,036,150 |
| 9.00%, 8/01/14 | EUR | 600 | 818,749 |
| 10.00%, 8/01/14 | USD | 2,980 | 2,994,900 |
| 19.35%, 8/01/16 (j) | | 380 | 299,250 |
| ProtoStar I Ltd., 18.00%, 10/15/12 (a)(b)(c)(d) | | 3,928 | 1,571,238 |
| Rainbow National Services LLC, 10.38%, | | | |
| 9/01/14 (b) | | 3,723 | 3,918,457 |
| TL Acquisitions, Inc., 10.50%, 1/15/15 (b) | | 11,360 | 10,735,200 |
| UPC Holding B.V., 9.88%, 4/15/18 (b) | | 1,000 | 1,050,000 |
| Virgin Media, Inc., 6.50%, 11/15/16 (b)(d) | | 4,630 | 4,849,925 |
| | | | 92,109,479 |
| Metals & Mining — 4.5% | | | |
| Aleris International, Inc. (a)(c): | | | |
| 9.00%, 12/15/14 | | 2,135 | 2,135 |
| 10.00%, 12/15/16 | | 4,700 | 4,700 |
| Anglo American Capital Plc, 9.38%, 4/08/19 (b) | | 1,830 | 2,223,450 |
| Arch Western Finance LLC, 6.75%, 7/01/13 | | 3,665 | 3,605,444 |
| Drummond Co., Inc., 7.38%, 2/15/16 (b) | | 3,510 | 3,088,800 |
| Evraz Group SA (b): | | | |
| 8.88%, 4/24/13 | | 3,170 | 3,027,350 |
| 9.50%, 4/24/18 | | 2,120 | 2,027,250 |
| FMG Finance Property Ltd. (b): | | | |
| 10.00%, 9/01/13 | | 455 | 482,300 |
| 10.63%, 9/01/16 | | 3,225 | 3,571,687 |
| Novelis, Inc.: | | | |
| 7.25%, 2/15/15 | | 7,475 | 6,465,875 |
| 11.50%, 2/15/15 (b) | | 1,950 | 1,969,500 |
| RathGibson, Inc., 11.25%, 2/15/14 (a)(c) | | 6,665 | 2,466,050 |
| Ryerson, Inc.: | | | |
| 7.86%, 11/01/14 (g) | | 1,670 | 1,461,250 |
| 12.00%, 11/01/15 | | 650 | 617,500 |
| Steel Dynamics, Inc.: | | | |
| 7.38%, 11/01/12 | | 3,115 | 3,146,150 |
| 8.25%, 4/15/16 (b) | | 575 | 577,875 |
| Teck Resources Ltd.: | | | |
| 10.25%, 5/15/16 | | 1,460 | 1,649,800 |
| 10.75%, 5/15/19 | | 5,620 | 6,533,250 |
| Vedanta Resources Plc, 9.50%, 7/18/18 (b) | | 2,925 | 2,881,125 |
| | | | 45,801,491 |
| Multi-Utilities — 0.2% | | | |
| CMS Energy Corp., 8.75%, 6/15/19 | | 1,500 | 1,631,686 |
| Multiline Retail — 0.6% | | | |
| Dollar General Corp.: | | | |
| 10.63%, 7/15/15 | | 1,430 | 1,580,150 |
| 11.88%, 7/15/17 (e) | | 970 | 1,062,071 |
| Macy’s Retail Holdings, Inc., 5.88%, 1/15/13 | | 2,560 | 2,485,614 |
| Saks, Inc., 9.88%, 10/01/11 | | 1,350 | 1,350,000 |
| | | | 6,477,835 |
| Oil, Gas & Consumable Fuels — 8.7% | | | |
| Arch Coal, Inc., 8.75%, 8/01/16 (b) | | 2,065 | 2,126,950 |
| Atlas Energy Operating Co. LLC, 12.13%, 8/01/17 | 2,100 | 2,262,750 |
| Atlas Energy Resources LLC, 10.75%, 2/01/18 (b) | 940 | 975,250 |
| Atlas Pipeline Partners LP, 8.75%, 6/15/18 | | 1,755 | 1,404,000 |
| Berry Petroleum Co., 8.25%, 11/01/16 | | 2,625 | 2,520,000 |
| | | |
| | | Par | |
| Corporate Bonds | | (000) | Value |
| Oil, Gas & Consumable Fuels (concluded) | | | |
| Bill Barrett Corp., 9.88%, 7/15/16 | USD | 1,135 | $ 1,194,587 |
| Chesapeake Energy Corp.: | | | |
| 9.50%, 2/15/15 | | 1,570 | 1,652,425 |
| 6.38%, 6/15/15 | | 1,610 | 1,495,287 |
| 2.25%, 12/15/38 (d) | | 3,550 | 2,653,625 |
| Cimarex Energy Co., 7.13%, 5/01/17 | | 2,745 | 2,552,850 |
| Concho Resources, Inc., 8.63%, 10/01/17 | | 1,360 | 1,394,000 |
| Connacher Oil and Gas Ltd. (b): | | | |
| 11.75%, 7/15/14 | | 835 | 889,275 |
| 10.25%, 12/15/15 | | 5,185 | 4,225,775 |
| Corral Finans AB, 2.01%, 4/15/10 (b)(e) | | 1,227 | 939,805 |
| Denbury Resources, Inc.: | | | |
| 7.50%, 12/15/15 | | 1,750 | 1,736,875 |
| 9.75%, 3/01/16 | | 3,350 | 3,559,375 |
| EXCO Resources, Inc., 7.25%, 1/15/11 | | 1,975 | 1,957,719 |
| El Paso Corp.: | | | |
| 8.25%, 2/15/16 | | 2,875 | 2,946,875 |
| 7.00%, 6/15/17 | | 4,000 | 3,920,000 |
| Encore Acquisition Co., 6.00%, 7/15/15 | | 1,955 | 1,769,275 |
| Forest Oil Corp.: | | | |
| 8.50%, 2/15/14 (b) | | 6,840 | 6,891,300 |
| 7.25%, 6/15/19 | | 1,270 | 1,187,450 |
| Kinder Morgan Finance Co. ULC, 5.35%, 1/05/11 | 3,515 | 3,532,575 |
| Massey Energy Co., 3.25%, 8/01/15 (d) | | 6,900 | 5,485,500 |
| Newfield Exploration Co.: | | | |
| 6.63%, 4/15/16 | | 1,185 | 1,161,300 |
| 7.13%, 5/15/18 | | 665 | 663,337 |
| OPTI Canada, Inc.: | | | |
| 7.88%, 12/15/14 | | 3,720 | 2,845,800 |
| 8.25%, 12/15/14 | | 4,270 | 3,309,250 |
| PetroHawk Energy Corp.: | | | |
| 10.50%, 8/01/14 (b) | | 2,910 | 3,128,250 |
| 7.88%, 6/01/15 | | 2,795 | 2,753,075 |
| Range Resources Corp., 6.38%, 3/15/15 | | 1,840 | 1,789,400 |
| Roseton-Danskammer 2001, Series B, 7.67%, | | |
| 11/08/16 | | 4,525 | 4,157,344 |
| Sabine Pass LNG LP, 7.50%, 11/30/16 | | 1,025 | 875,094 |
| SandRidge Energy, Inc.: | | | |
| 3.91%, 4/01/14 (g) | | 2,250 | 2,004,730 |
| 8.63%, 4/01/15 (e) | | 350 | 347,375 |
| 8.00%, 6/01/18 (b) | | 2,200 | 2,117,500 |
| Southwestern Energy Co., 7.50%, 2/01/18 | | 1,115 | 1,126,150 |
| Swift Energy Co., 7.13%, 6/01/17 | | 3,425 | 2,979,750 |
| | | | 88,531,878 |
| Paper & Forest Products — 4.5% | | | |
| APP Finance II Mauritius Ltd., 12% (a)(c)(d)(k) | 21,000 | 105,000 |
| Ainsworth Lumber Co. Ltd., 11.00%, 7/29/15 (b)(e) | 5,313 | 2,773,664 |
| Boise Cascade LLC, 7.13%, 10/15/14 | | 1,985 | 1,578,075 |
| Clearwater Paper Corp., 10.63%, 6/15/16 (b) | 1,865 | 2,016,531 |
| Georgia-Pacific Corp., 8.13%, 5/15/11 | | 170 | 176,375 |
| Georgia-Pacific LLC, 8.25%, 5/01/16 (b) | | 5,335 | 5,535,062 |
| International Paper Co., 9.38%, 5/15/19 | | 2,530 | 2,962,367 |
| NewPage Corp.: | | | |
| 10.00%, 5/01/12 | | 4,195 | 2,768,700 |
| 11.38%, 12/31/14 (b) | | 21,800 | 21,418,500 |
| Verso Paper Holdings LLC: | | | |
| 11.50%, 7/01/14 (b) | | 1,610 | 1,650,250 |
| Series B, 4.23%, 8/01/14 (g) | | 4,635 | 2,873,700 |
| Series B, 9.13%, 8/01/14 | | 1,055 | 780,700 |
| Series B, 11.38%, 8/01/16 | | 2,680 | 1,681,700 |
| | | | 46,320,624 |
See Notes to Financial Statements.
10 BLACKROCK HIGH INCOME FUND SEPTEMBER 30, 2009
Schedule of Investments (continued) (Percentages shown are based on Net Assets)
| | | |
| | | Par | |
| Corporate Bonds | | (000) | Value |
| Pharmaceuticals — 0.5% | | | |
| Angiotech Pharmaceuticals, Inc., 4.11%, | | | |
| 12/01/13 (g) | USD | 5,855 | $ 4,947,475 |
| Elan Finance Plc, 8.88%, 12/01/13 | | 455 | 458,412 |
| | | | 5,405,887 |
| Professional Services — 0.1% | | | |
| FTI Consulting, Inc., 7.75%, 10/01/16 | | 550 | 547,250 |
| Real Estate Investment Trusts (REITs) — 0.2% | | | |
| iStar Financial, Inc., Series B, 5.13%, 4/01/11 | | 1,120 | 761,600 |
| Rouse Co. LP, 5.38%, 11/26/13 (a)(c) | | 980 | 835,450 |
| | | | 1,597,050 |
| Real Estate Management & Development — 0.3% | | |
| Realogy Corp.: | | | |
| 10.50%, 4/15/14 | | 845 | 612,625 |
| 12.38%, 4/15/15 | | 4,055 | 2,240,388 |
| | | | 2,853,013 |
| Road & Rail — 0.5% | | | |
| The Hertz Corp., 7.88%, 1/01/14 | EUR | 3,500 | 4,955,294 |
| Semiconductors & Semiconductor Equipment — 0.5% | | |
| Spansion, Inc. (a)(b)(c): | | | |
| 5.33%, 6/01/13 | USD | 3,425 | 3,467,813 |
| 2.25%, 6/15/16 (d) | | 2,905 | 1,220,100 |
| | | | 4,687,913 |
| Software — 0.0% | | | |
| BMS Holdings, Inc., 8.35%, 2/15/12 (b)(e)(g) | | 2,281 | 20,748 |
| Specialty Retail — 1.6% | | | |
| Asbury Automotive Group, Inc., 8.00%, 3/15/14 | | 5,400 | 5,022,000 |
| General Nutrition Centers, Inc.: | | | |
| 5.18%, 3/15/14 (e)(g) | | 235 | 207,975 |
| 10.75%, 3/15/15 | | 4,095 | 4,110,356 |
| Group 1 Automotive, Inc., 2.25%, 6/15/36 (d)(h) | 2,735 | 1,904,244 |
| Limited Brands, Inc., 8.50%, 6/15/19 (b) | | 470 | 491,682 |
| United Auto Group, Inc., 7.75%, 12/15/16 | | 5,255 | 4,847,738 |
| | | | 16,583,995 |
| Textiles, Apparel & Luxury Goods — 0.6% | | | |
| Levi Strauss & Co., 8.63%, 4/01/13 | EUR | 4,100 | 5,999,766 |
| Thrifts & Mortgage Finance — 0.7% | | | |
| Residential Capital Corp., 8.38%, 6/30/10 | USD | 9,740 | 7,256,300 |
| Tobacco — 0.3% | | | |
| Lorillard Tobacco Co., 8.13%, 6/23/19 | | 1,540 | 1,747,704 |
| Vector Group Ltd., 11.00%, 8/15/15 | | 1,500 | 1,455,000 |
| | | | 3,202,704 |
| Wireless Telecommunication Services — 6.3% | | | |
| American Tower Corp., 7.13%, 10/15/12 | | 375 | 380,625 |
| Cricket Communications, Inc.: | | | |
| 9.38%, 11/01/14 | | 7,375 | 7,485,625 |
| 10.00%, 7/15/15 | | 5,030 | 5,168,325 |
| 7.75%, 5/15/16 (b) | | 1,500 | 1,522,500 |
| Crown Castle International Corp., 9.00%, 1/15/15 | 1,445 | 1,513,637 |
| Digicel Group Ltd. (b): | | | |
| 8.88%, 1/15/15 | | 5,740 | 5,338,200 |
| 9.13%, 1/15/15 (e) | | 5,660 | 5,207,200 |
| FiberTower Corp., 11.00%, 11/15/12 (b)(d) | | 3,281 | 1,997,339 |
| iPCS, Inc., 2.61%, 5/01/13 (g) | | 6,810 | 5,754,450 |
| MetroPCS Wireless, Inc., 9.25%, 11/01/14 | | 9,310 | 9,519,475 |
| | | |
| | | Par | |
| Corporate Bonds | | (000) | Value |
| Wireless Telecommunication Services (concluded) | | |
| NII Holdings, Inc., 2.75%, 8/15/25 (d) | USD | 2,690 $ | 2,639,563 |
| Nextel Communications, Inc.: | | | |
| Series D, 7.38%, 8/01/15 | | 1,400 | 1,256,500 |
| Series E, 6.88%, 10/31/13 | | 11,330 | 10,508,575 |
| Series F, 5.95%, 3/15/14 | | 1,220 | 1,079,700 |
| Orascom Telecom Finance SCA, 7.88%, 2/08/14 (b) | 1,385 | 1,322,675 |
| SBA Telecommunications, Inc., 8.00%, 8/15/16 (b) | 750 | 766,875 |
| Sprint Capital Corp., 6.88%, 11/15/28 | | 2,816 | 2,351,360 |
| | | | 63,812,624 |
| Total Corporate Bonds — 84.3% | | | 858,759,819 |
| Floating Rate Loan Interests | | | |
| Auto Components — 2.5% | | | |
| Allison Transmission, Inc., Term Loan, 3.00%, | | | |
| 8/07/14 | | 3,408 | 2,966,908 |
| Dana Holding Corp., Term Advance, | | | |
| 6.50% – 7.25%, 1/31/15 | | 9,332 | 8,345,922 |
| Delphi Corp. (a)(c): | | | |
| Initial Tranche C Loan, Debtor in Possession, | | | |
| 10.50%, 12/31/09 | | 22,525 | 12,704,171 |
| Subsequent Tranche C Loan, Debtor in Possession, | | |
| 10.50%, 12/31/09 | | 2,282 | 1,287,096 |
| | | | 25,304,097 |
| Capital Markets — 0.1% | | | |
| Marsico Parent Co., LLC, Term Loan, 4.75%, | | | |
| 12/15/14 | | 1,383 | 708,723 |
| Chemicals — 1.1% | | | |
| PQ Corp. (fka Niagara Acquisition, Inc.): | | | |
| Loan (Second Lien), 6.75%, 7/30/15 | | 8,250 | 6,517,500 |
| Original Term Loan (First Lien), 3.50% – 3.75%, | | |
| 7/31/14 | | 2,716 | 2,357,163 |
| Solutia Inc., Loan, 7.25%, 2/28/14 | | 2,119 | 2,134,948 |
| | | | 11,009,611 |
| Diversified Telecommunication Services — 1.5% | | |
| Hawaiian Telcom Communications, Inc., Tranche C | | | |
| Term Loan, 4.75%, 5/30/14 | | 3,193 | 1,963,917 |
| Wind Finance SL SA, Euro Facility (Second Lien): | | | |
| 7.70%, 12/17/14 | EUR | 5,645 | 8,297,411 |
| 7.93%, 3/22/15 | USD | 2,250 | 2,257,736 |
| Wind Telecomunicazioni SpA: | | | |
| B1 Term Loan Facility, 3.68%, 9/22/13 | EUR | 1,000 | 1,393,064 |
| C1 Term Loan Facility, 4.70%, 9/22/14 | | 1,000 | 1,393,064 |
| | | | 15,305,192 |
| Food & Staples Retailing — 0.4% | | | |
| Rite Aid Corp., Tranche 4 Term Loan, 9.50%, | | | |
| 6/04/15 | USD | 4,050 | 4,201,875 |
| Health Care Providers & Services — 0.3% | | | |
| CCS Medical Return of Capital, 7.09%, 9/30/11 | | 775 | 353,400 |
| HCA Inc., Tranche A-1 Term Loan, 1.78%, 11/17/12 | 3,294 | 3,078,879 |
| | | | 3,432,279 |
| Hotels, Restaurants & Leisure — 0.7% | | | |
| Travelport LLC (fka Travelport Inc.), Loan, 7.99%, | | | |
| 3/27/12 | | 9,496 | 6,646,892 |
See Notes to Financial Statements.
BLACKROCK HIGH INCOME FUND SEPTEMBER 30, 2009 11
Schedule of Investments (continued) (Percentages shown are based on Net Assets)
| | | |
| | | Par | |
| Floating Rate Loan Interests | | (000) | Value |
| IT Services — 0.1% | | | |
| First Data Corp., Initial Tranche B-1 Term Loan, | | | |
| 3.00% – 3.04%, 9/24/14 | USD | 796 $ | 685,171 |
| Independent Power Producers & Energy Traders — 1.3% | |
| Dynegy Holdings Inc.: | | | |
| Term Letter of Credit Facility Term Loan, | | | |
| 4.00%, 4/02/13 | | 1,745 | 1,675,957 |
| Tranche B Term Loan, 4.00%, 4/02/13 | | 79 | 75,841 |
| NRG Energy, Inc.: | | | |
| Credit-Linked Deposit, 0.18%, 2/01/13 | | 428 | 405,494 |
| Term Loan, 2.00% – 2.03%, 2/01/13 | | 797 | 754,972 |
| Texas Competitive Electric Holdings Co., LLC (TXU): | | |
| Initial Tranche B-1 Term Loan, 3.75% – 3.78%, | | | |
| 10/10/14 | | 995 | 784,877 |
| Initial Tranche B-2 Term Loan, 3.75% – 3.78%, | | | |
| 10/10/14 | | 1,470 | 1,160,198 |
| Initial Tranche B-3 Term Loan, 3.75% – 3.78%, | | | |
| 10/10/14 | | 11,126 | 8,736,847 |
| | | | 13,594,186 |
| Machinery — 0.7% | | | |
| Navistar International Corp.: | | | |
| Revolving Credit-Linked Deposit, 3.35% – 3.50%, | | |
| 1/19/12 | | 1,987 | 1,917,133 |
| Term Advance, 3.50%, 1/19/12 | | 5,463 | 5,272,117 |
| | | | 7,189,250 |
| Media — 2.8% | | | |
| EB Sports Corp., Loan Assignment, 7.57%, 5/01/12 | 5,306 | 3,395,813 |
| HMH Publishing Co. Ltd.: | | | |
| Mezzanine, 17.50%, 11/14/14 | | 19,099 | 5,029,437 |
| Tranche A Term Loan, 5.25%, 6/12/14 | | 7,280 | 6,055,746 |
| Newsday, LLC, Fixed Rate Term Loan, 9.75%, | | | |
| 8/01/13 | | 5,200 | 5,401,500 |
| Protostar Ltd., Debtor in Possession, Term Loan, | | | |
| 18.00%, 10/15/09 | | 771 | 770,854 |
| Virgin Media Investment Holdings Ltd., C Facility, | | | |
| 3.62%, 7/17/13 | GBP | 4,400 | 6,371,400 |
| World Color Press Inc. and World Color (USA) | | | |
| Corp. (fka Quebecor World Inc.), Advance, | | | |
| 9.00%, 6/30/12 | USD | 1,500 | 1,496,250 |
| | | | 28,521,000 |
| Metals & Mining — 0.4% | | | |
| RathGibson, Inc., Loan, Debtor in Possession, | | | |
| 10.50% – 10.75%, 2/10/10 | | 4,254 | 4,253,501 |
| Multiline Retail — 0.0% | | | |
| The Neiman Marcus Group Inc., Term Loan, | | | |
| 2.25% – 2.32%, 4/06/13 | | 590 | 508,875 |
| Oil, Gas & Consumable Fuels — 0.7% | | | |
| Turbo Beta Limited, Dollar Facility, 14.50%, | | | |
| 3/15/18 | | 9,530 | 6,670,851 |
| Paper & Forest Products — 0.1% | | | |
| Verso Paper Finance Holdings LLC, Loan, | | | |
| 6.73% – 7.48%, 2/01/13 | | 4,527 | 1,279,018 |
| Real Estate Management & Development — 0.6% | | |
| Realogy Corp.: | | | |
| Initial Term B Loan, 3.25%, 10/10/13 | | 1,811 | 1,537,160 |
| Synthetic Letter of Credit, 0.1%, 10/10/13 | | 574 | 487,187 |
| Tranche A Second Lien, 13.50%, 10/15/17 | | 4,250 | 4,414,688 |
| | | | 6,439,035 |
| | | |
| | | Par | |
| Floating Rate Loan Interests | | (000) | Value |
| Semiconductors & Semiconductor Equipment — 0.0% | | |
| Freescale Semiconductor, Inc. Term Loan B, | | | |
| 7.07%, 12/02/13 | USD | 500 | $ 399,688 |
| Specialty Retail — 0.1% | | | |
| Claire’s Stores, Term Loan B, 3.11%, 5/29/14 | 1,290 | 959,438 |
| Total Floating Rate Loan Interests — 13.4% | | | 137,108,682 |
| | Beneficial | |
| | | Interest | |
| Other Interests (l) | | (000) | |
| Hotels, Restaurants & Leisure — 0.0% | | | |
| Buffets, Inc. | | 1,855 | 186 |
| Media — 0.0% | | | |
| Adelphia Escrow | | 25,500 | 2,550 |
| Adelphia Recovery Trust | | 31,980 | 127,922 |
| | | | 130,472 |
| Total Other Interests — 0.0% | | | 130,658 |
| Preferred Securities | | | |
| Preferred Stocks | | Shares | |
| Diversified Telecommunication Services — 0.0% | | |
| PTV, Inc. Series A, 10.00% | | 130 | 10 |
| Total Preferred Securities — 0.0% | | | 10 |
| Warrants (m) | | | |
| Health Care Providers & Services — 0.0% | | | |
| HealthSouth Corp. (expires 1/16/14) | | 201,408 | 2 |
| Hotels, Restaurants & Leisure — 0.0% | | | |
| Buffets Restaurants Holdings, Inc. (expires 4/29/14) | 1,566 | 16 |
| Media — 0.0% | | | |
| Virgin Media, Inc. (expires 1/10/11) | | 117,980 | 6,312 |
| Oil, Gas & Consumable Fuels — 0.0% | | | |
| Turbo Cayman Ltd. (No Expiration) | | 6 | — |
| Total Warrants — 0.0% | | | 6,330 |
| Total Long-Term Investments | | | |
| (Cost — $1,156,847,326) — 99.3% | | | 1,013,009,108 |
| Short-Term Securities | | | |
| BlackRock Liquidity Funds, TempFund, | | | |
| Institutional Class, 0.20% (n)(o) | | 1,301 | 1,301 |
| Total Short-Term Securities | | | |
| (Cost — $1,301) — 0.0% | | | 1,301 |
| Total Investments (Cost — $1,156,848,627*) — 99.3% | | 1,013,010,409 |
| Other Assets Less Liabilities — 0.7% | | | 6,585,076 |
| Net Assets — 100.0% | | | $1,019,595,485 |
See Notes to Financial Statements.
12 BLACKROCK HIGH INCOME FUND SEPTEMBER 30, 2009
| | | | | | | |
| | Schedule of Investments (continued) |
| * The cost and unrealized appreciation (depreciation) of investments as of September 30, |
| | 2009, as computed for federal income tax purposes, were as follows: | |
| | Aggregate cost | | | | $1,161,369,299 |
| | Gross unrealized appreciation | | $ 62,042,023 |
| | Gross unrealized depreciation | | | (210,400,913) |
| | Net unrealized depreciation | | | $ (148,358,890) |
| (a) Non-income producing security. | | | |
| (b) Security exempt from registration under Rule 144A of the Securities Act of 1933. |
| | These securities may be resold in transactions exempt from registration to qualified |
| | institutional investors. | | | | | |
| (c) Issuer filed for bankruptcy and/or is in default of interest payments. | |
| (d) Convertible security. | | | | | |
| (e) Represents a payment-in-kind security which may pay interest/dividends in additional |
| | par/shares. | | | | | �� |
| (f) Represents a zero-coupon bond. Rate shown reflects the current yield as of report date. |
| (g) Variable rate security. Rate shown is as of report date. | | |
| (h) Represents a step-down bond that pays an initial coupon rate for the first period and |
| | then a lower coupon rate for the following periods. Rate shown is as of report date. |
| (i) All or a portion of the security has been pledged as collateral in connection with |
| | open swaps. | | | | | |
| (j) Represents a step-up bond that pays an initial coupon rate for the first period and |
| | then a higher coupon rate for the following periods. Rate shown is as of report date. |
| (k) Security is perpetual in nature and has no stated maturity date. | |
| (l) Other interests represent beneficial interest in liquidation trusts and other reorganiza- |
| | tion entities and are non-income producing. | | |
| (m) Warrants entitle the Fund to purchase a predetermined number of shares of common |
| | stock and are non-income producing. The purchase price and number of shares are |
| | subject to adjustment under certain conditions until the expiration date. |
| (n) Investments in companies considered to be an affiliate of the Fund, for purposes of |
| | Section 2(a)(3) of the Investment Co. Act of 1940, were as follows: | |
| | | | | | | Net | |
| | Affiliate | | | Activity | Income |
| | BlackRock Liquidity Funds, TempFund, | | | |
| | Institutional Class | | | $ 1,301 | $ 13,659 |
| | BlackRock Liquidity Series, LLC | | | |
| | Cash Sweep Series | | | $(29,156,762) | $131,851 |
| (o) Represents the current yield as of report date. | | |
| • | For Fund compliance purposes, the Fund’s industry classifications refer to any one |
| | or more of the industry sub-classifications used by one or more widely recognized |
| | market indexes or ratings group indexes, and/or as defined by Fund management. |
| | This definition may not apply for purposes of this report, which may combine industry |
| | sub-classifications for reporting ease. | | | |
| • | Foreign currency exchange contracts as of September 30, 2009 were as follows: |
| | | | | | | | Unrealized |
| | Currency | | Currency | | Settlement Appreciation |
| | Purchased | | Sold | Counterparty | Date | (Depreciation) |
| | USD | 5,317,856 | CAD | 5,774,500 Barclays London 10/28/09 | $ (75,877) |
| | USD | 1,922,053 | CAD | 2,080,000 | Citibank NA | 10/28/09 | (20,793) |
| | USD | 2,091,565 | EUR | 1,414,000 | Citibank NA | 10/28/09 | 22,408 |
| | USD | 5,993,501 | GBP | 3,689,000 | Citibank NA | 10/28/09 | 98,684 |
| | USD 53,585,449 | EUR | 36,714,000 | Citibank NA | 11/18/09 | (137,980) |
| | USD | 662,417 | EUR | 448,500 Royal Bank of | 11/18/09 | 6,129 |
| | | | | | Scotland AG | | |
| | USD | 4,999,561 | EUR | 3,403,500 | Deutsche | 11/18/09 | 19,235 |
| | | | | | Bank AG | | |
| | Total | | | | | | $ (88,194) |
| | | | | | | | |
| • | Currency Abbreviations: | | | | | |
| | CAD | Canadian Dollar | | | | |
| | EUR | Euro | | | | | | |
| | GBP | British Pound | | | | | |
| | USD | US Dollar | | | | | |
| • | Credit default swaps on single name issues-buy protection outstanding as of |
| | September 30, 2009 were as follows: | | | | |
| | | | Pay | | | Notional | Unrealized |
| | | | Fixed | | | Amount | Appreciation |
| | Issuer | | Rate Counterparty Expiration | (000) | (Depreciation) |
| | Standard Pacific | 5.00% | Goldman Sachs | June | USD | 1,500 | $ (61,494) |
| | Corp. | | | Bank USA | 2013 | | | |
| | Harrahs Operating | 5.00% | JPMorgan | September | USD | 2,000 | (279,663) |
| | Co., Inc. | | | Chase Bank NA | 2013 | | | |
| | First Data Corp. | 5.00% | JPMorgan | December | USD | 1,000 | (114,387) |
| | | | | Chase Bank NA | 2013 | | | |
| | Edison Mission | 7.10% | Credit Suisse | March | USD | 2,000 | 125,672 |
| | Energy | | | International | 2014 | | | |
| | Hertz Global | | 5.00% | Goldman Sachs | March | EUR | 3,500 | (1,333,707) |
| | Holdings, Inc. | | Bank USA | 2014 | | | |
| | JCPenney Co., Inc. | 5.40% | Goldman Sachs | March | USD | 5,000 | (715,806) |
| | | | | Bank USA | 2014 | | | |
| | Louisiana-Pacific | 5.00% | JPMorgan | March | USD | 2,000 | (521,205) |
| | Corp. | | | Chase Bank NA | 2014 | | | |
| | Masco Corp. | | 5.35% | JPMorgan | March | USD | 5,000 | (706,164) |
| | | | | Chase Bank NA | 2014 | | | |
| | Mohawk | | 3.90% | JPMorgan | March | USD | 5,000 | (428,682) |
| | Industries Inc. | | Chase Bank NA | 2014 | | | |
| | Macys Inc. | | 7.90% | Goldman Sachs | March | USD | 5,000 | (994,031) |
| | | | | Bank USA | 2014 | | | |
| | Centex Corp. | | 1.00% | Deutsche | June | USD | 1,225 | (45,240) |
| | | | | Bank AG | 2014 | | | |
| | First Data Corp. | 5.00% | Credit Suisse | June | USD | 1,250 | (154,307) |
| | | | | International | 2014 | | | |
| | Lennar Corp. | | 5.75% | JPMorgan | June | USD | 1,000 | (136,900) |
| | | | | Chase Bank NA | 2014 | | | |
| | Standard Pacific | 5.00% | JPMorgan | June | USD | 2,450 | (158,828) |
| | Corp. | | | Chase Bank NA | 2014 | | | |
| | Brunswick Corp. | 5.00% | Goldman Sachs September | USD | 2,250 | (105,311) |
| | | | | Bank USA | 2014 | | | |
| | Centex Corp. | | 1.00% | Deutsche | September | USD | 825 | (9,641) |
| | | | | Bank AG | 2014 | | | |
| | Ladbrokes Plc | 1.00% | JPMorgan | September | EUR | 3,000 | 42,134 |
| | | | | Chase Bank NA | 2014 | | | |
| | Limited | | 1.00% | JPMorgan | September | USD | 700 | (5,418) |
| | Brands, Inc. | | Chase Bank NA | 2014 | | | |
| | Pulte | | 1.00% | JPMorgan | September | USD | 1,650 | 13,253 |
| | Homes, Inc. | | Chase Bank NA | 2014 | | | |
| | Standard Pacific | 5.00% | Credit Suisse | September | USD | 2,590 | (55,525) |
| | Corp. | | | International | 2014 | | | |
| | Meritage Homes | 5.00% | Credit Suisse | June | USD | 1,225 | (141,452) |
| | Corp. | | | International | 2015 | | | |
| | K Hovnanian | | 5.00% | JPMorgan | June | USD | 3,115 | (88,658) |
| | Enterprises, Inc. | | Chase Bank NA | 2016 | | | |
| | Total | | | | | | | $ (5,875,360) |
See Notes to Financial Statements.
BLACKROCK HIGH INCOME FUND SEPTEMBER 30, 2009 13
| | | | | | | |
| | Schedule of Investments (concluded) |
| • | Credit default swaps on single name issues-sold protection outstanding as of |
| | September 30, 2009 were as follows: | | | |
| | | | Receive | | | Notional | |
| | | | Fixed | Counter- Credit Expiration Amount | Unrealized |
| | Issuer | Rate | party Rating1 Date | (000)2 Appreciation |
| | D.R. Horton, Inc. | 1.00% | JPMorgan BB- September USD 825 | $ 4,895 |
| | | | | Chase | 2014 | | |
| | | | | Bank NA | | | |
| | 1 | Using Standard & Poor’s ratings of the issuer. | | |
| | 2 | The maximum potential amount the Fund may pay should a negative credit event |
| | | take place as defined under the terms of the agreement. See Note 2 of the Notes |
| | | to Financial Statements. | | | |
| • | Credit default swaps on traded indexes — buy protection outstanding as of September |
| | 30, 2009 were as follows: | | | | |
| | | | Pay | | | Notional | |
| | | | Fixed | | Expiration | Amount | Unrealized |
| | Issuer | Rate Counterparty | Date | (000) | Appreciation |
| | Dow Jones CDX | 5.00% | Credit Suisse | December USD 30,000 | $ 356,318 |
| | North America | | International | 2014 | | |
| | High Yield | | | | | |
| • | Fair Value Measurements — Various inputs are used in determining the fair value of |
| | investments, which are as follows: | | | |
| | • | Level 1 — price quotations in active markets/exchanges for identical assets and |
| | | liabilities | | | | | |
| | • | Level 2 — other observable inputs (including, but not limited to: quoted prices for |
| | | similar assets or liabilities in markets that are active, quoted prices for identical or |
| | | similar assets or liabilities in markets that are not active, inputs other than quoted |
| | | prices that are observable for the assets or liabilities (such as interest rates, yield |
| | | curves, volatilities, prepayment speeds, loss severities, credit risks and default |
| | | rates) or other market-corroborated inputs) | | |
| | • | Level 3 — unobservable inputs based on the best information available in the cir- |
| | | cumstances, to the extent observable inputs are not available (including the Fund’s |
| | | own assumptions used in determining the fair value of investments) | |
| | | |
| The inputs or methodology used for valuing securities are not necessarily an indication |
| of the risk associated with investing in those securities. For information about the |
| Fund’s policy regarding valuation of investments and other significant accounting |
| policies, please refer to Note 1 of the Notes to Financial Statements. |
| The following table summarizes the inputs used as of September 30, 2009 in deter- |
| mining the fair valuation of the Fund’s investments: | | |
| | | | Investments in |
| Valuation Inputs | | | Securities |
| Level 1 | | | |
| Long-Term Investments: | | | |
| Common Stocks | | | $ 15,451,768 |
| Warrants | | | 6,312 |
| Short-Term Securities | | | 1,301 |
| Total Level 1 | | | 15,459,381 |
| Level 2 | | | |
| Long-Term Investments: | | | |
| Common Stocks | | | 1,551,806 |
| Corporate Bonds | | | 855,184,465 |
| Floating Rate Loan Interests | | | 70,882,715 |
| Preferred Securities | | | 10 |
| Total Level 2 | | | 927,618,996 |
| Level 3 | | | |
| Long-Term Investments: | | | |
| Common Stocks | | | 35 |
| Corporate Bonds | | | 3,577,089 |
| Floating Rate Loan Interests | | | 66,224,232 |
| Other Interests | | | 130,658 |
| Warrants | | | 18 |
| Total Level 3 | | | 69,932,032 |
| Total | | | $1,013,010,409 |
| | | Other Financial |
| | | Instruments1 |
| | | Assets | Liabilities |
| Level 1 | | — | — |
| Level 2 | $ 688,728 | $ (6,291,069) |
| Level 3 | | — | — |
| Total | $ 688,728 | $ (6,291,069) |
| 1 Other financial instruments are foreign currency exchange contracts and swaps, |
| which are shown at the unrealized appreciation/depreciation on the instrument. |
| | | | | | | | | |
| The following is a reconciliation of investments for unobservable inputs (Level 3) used in determining fair value: | | | | | |
| | | | | | Investments in Securities | | | |
| | | Common | Corporate | Floating Rate | Other | | | |
| | | Stocks | | Bonds | Loan Interests | Interests | | Warrants | Total |
| Balance, as of September 30, 2008 | | — | — | $19,513,664 | $ 130,472 | | — | $19,644,136 |
| Accrued discounts/premiums | | | — | — | — | — | | — | — |
| Realized loss | | | — | — | (4,137,004) | — | | — | (4,137,004) |
| Change in unrealized appreciation (depreciation) | | — | $ (633,747) | 802,948 | — | $ 2 | 169,203 |
| Net sales | | | — | — | (8,057,905) | — | | — | (8,057,905) |
| Net transfers in Level 3 | | $ 35 | 4,210,836 | 58,102,529 | 186 | | 16 | 62,313,602 |
| Balance, as of September 30, 2009 | $ 35 | $ 3,577,089 | $66,224,232 | $ 130,658 | $ 18 | $69,932,032 |
| See Notes to Financial Statements. | | | | | | | | |
| 14 | BLACKROCK HIGH INCOME FUND | | | | SEPTEMBER 30, 2009 | | |
| | |
| Statement of Assets and Liabilities | | |
| September 30, 2009 | | |
| Assets | | |
| Investments at value — unaffiliated (cost — $1,156,847,326) | | $1,013,009,108 |
| Investments at value — affiliated (cost — $1,301) | | 1,301 |
| Unrealized appreciation on swaps | | 542,272 |
| Unrealized appreciation on foreign currency exchange contracts | | 146,456 |
| Foreign currency at value (cost — $6,940,553) | | 6,913,455 |
| Interest receivable | | 20,866,876 |
| Investments sold receivable | | 18,479,072 |
| Swap premiums paid | | 6,369,900 |
| Capital shares sold receivable | | 3,768,970 |
| Swaps receivable | | 1,355,722 |
| Principal paydown receivable | | 47,426 |
| Prepaid expenses | | 39,311 |
| Other assets | | 1,555,019 |
| Total assets | | 1,073,094,888 |
| Liabilities | | |
| Bank overdraft | | 9,274,253 |
| Unrealized depreciation on swaps | | 6,056,419 |
| Unrealized depreciation on foreign currency exchange contracts | | 234,650 |
| Investments purchased payable | | 28,413,518 |
| Income dividends payable | | 4,457,464 |
| Swaps payable | | 2,121,250 |
| Capital shares redeemed payable | | 1,765,484 |
| Investment advisory fees payable | | 338,807 |
| Service and distribution fees payable | | 280,669 |
| Other affiliates payable | | 35,318 |
| Deferred income | | 20,250 |
| Officer’s and Directors’ fees payable | | 1,107 |
| Other accrued expenses payable | | 500,214 |
| Total liabilities | | 53,499,403 |
| Net Assets | | $1,019,595,485 |
| Net Assets Consist of | | |
| Paid-in capital | | $2,850,746,763 |
| Undistributed net investment income | | 19,269,129 |
| Accumulated net realized loss | | (1,701,213,301) |
| Net unrealized appreciation/depreciation | | (149,207,106) |
| Net Assets | | $1,019,595,485 |
| Net Asset Value | | |
| Institutional — Based on net assets of $263,647,550 and 63,728,107 shares outstanding, 500 million shares authorized, $0.10 par value | $ 4.14 |
| Investor A — Based on net assets of $486,449,619 and 117,476,438 shares outstanding, 500 million shares authorized, $0.10 par value | $ 4.14 |
| Investor B — Based on net assets of $51,368,848 and 12,400,609 shares outstanding, 1,500 million shares authorized, $0.10 par value | $ 4.14 |
| Investor C — Based on net assets of $84,176,263 and 20,316,470 shares outstanding, 200 million shares authorized, $0.10 par value | $ 4.14 |
| Investor C1 — Based on net assets of $133,953,205 and 32,339,395 shares outstanding, 200 million shares authorized, $0.10 par value | $ 4.14 |
| See Notes to Financial Statements. | | |
| BLACKROCK HIGH INCOME FUND | SEPTEMBER 30, 2009 | 15 |
| | | |
| Statement of Operations | | |
| Year Ended September 30, 2009 | | |
| Investment Income | | | |
| Interest | | | $ 100,732,615 |
| Facility and other fees | | | 447,217 |
| Income — affiliated | | | 145,737 |
| Total income | | | 101,325,569 |
| Expenses | | | |
| Investment advisory | | | 3,640,034 |
| Service — Investor A | | | 1,026,120 |
| Service and distribution — Investor B | | 371,297 |
| Service and distribution — Investor C | | 681,262 |
| Service and distribution — Investor C1 | | 967,180 |
| Transfer agent — Institutional | | | 566,750 |
| Transfer agent — Investor A | | | 879,258 |
| Transfer agent — Investor B | | | 187,006 |
| Transfer agent — Investor C | | | 500,542 |
| Transfer agent — Investor C1 | | | 427,557 |
| Accounting services | | | 218,334 |
| Printing | | | 130,588 |
| Professional | | | 119,282 |
| Registration | | | 77,623 |
| Custodian | | | 57,224 |
| Officer and Directors | | | 44,053 |
| Miscellaneous | | | 120,981 |
| Total expenses | | | 10,015,091 |
| Less fees waived by advisor | | | (2,587) |
| Less fees paid indirectly | | | (954) |
| Total expenses after fees waived and paid indirectly | | 10,011,550 |
| Net investment income | | | 91,314,019 |
| Realized and Unrealized Gain (Loss) | | |
| Net realized gain (loss) from: | | | |
| Investments | | | (122,855,798) |
| Swaps | | | (20,041,936) |
| Options written | | | 1,500,000 |
| Foreign currency | | | (2,839,866) |
| | | | (144,237,600) |
| Net change in unrealized appreciation/depreciation on: | | |
| Investments | | | 138,081,324 |
| Swaps | | | (998,913) |
| Options written | | | (141,300) |
| Foreign currency | | | (156,045) |
| Unfunded corporate loans | | | 16,960 |
| | | | 136,802,026 |
| Total realized and unrealized loss | | (7,435,574) |
| Net Increase in Net Assets Resulting from Operations | | $ 83,878,445 |
| See Notes to Financial Statements. | | |
| 16 | BLACKROCK HIGH INCOME FUND | SEPTEMBER 30, 2009 | |
| | |
| Statements of Changes in Net Assets | | |
| | Year Ended September 30, |
| Increase (Decrease) in Net Assets: | 2009 | 2008 |
| Operations | | |
| Net investment income | $ 91,314,019 | $ 99,731,623 |
| Net realized loss | (144,237,600) | (68,917,318) |
| Net change in unrealized appreciation/depreciation | 136,802,026 | (193,308,817) |
| Net increase (decrease) in net assets resulting from operations | 83,878,445 | (162,494,512) |
| Dividends to Shareholders From | | |
| Net investment income: | | |
| Institutional | (22,891,440) | (25,556,310) |
| Investor A | (42,922,786) | (47,095,464) |
| Investor B | (4,961,796) | (8,033,651) |
| Investor C | (6,220,177) | (5,765,367) |
| Investor C1 | (11,954,053) | (15,615,122) |
| Decrease in net assets resulting from dividends to shareholders | (88,950,252) | (102,065,914) |
| Capital Share Transactions | | |
| Net decrease in net assets derived from capital share transactions | (56,047,403) | (57,597,678) |
| Redemption Fee | | |
| Redemption fee | 20,264 | 41,463 |
| Net Assets | | |
| Total decrease in net assets | (61,098,946) | (322,116,641) |
| Beginning of year | 1,080,694,431 | 1,402,811,072 |
| End of year | $1,019,595,485 | $1,080,694,431 |
| Undistributed net investment income | $ 19,269,129 | $ 17,525,677 |
| See Notes to Financial Statements. | | |
| BLACKROCK HIGH INCOME FUND | SEPTEMBER 30, 2009 | 17 |
| | | | | | | | | | | | | |
| Financial Highlights | | | | | | | | | | | | |
| | | | Institutional | | | | | | Investor A | |
| | | | Year Ended September 30, | | | Year Ended September 30, | |
| | | 2009 | 2008 | | 2007 | 2006 | 2005 | 2009 | 2008 | | 2007 | 2006 | 2005 |
| Per Share Operating Performance | | | | | | | | | | | | |
| Net asset value, beginning of year | $ 4.13 | $ 5.12 | $ 5.12 | $ 5.04 | $ 5.15 | $ 4.14 | $ 5.12 | $ 5.12 | $ 5.05 | $ 5.15 |
| Net investment income1 | | 0.37 | 0.39 | | 0.39 | 0.38 | 0.40 | 0.37 | 0.38 | | 0.38 | 0.37 | 0.39 |
| Net realized and unrealized gain (loss)2 | (0.00)3 | (0.98) | | (0.01) | 0.08 | (0.09) | (0.01) | (0.97) | | — | 0.06 | (0.09) |
| Net increase (decrease) from investment | | | | | | | | | | | | |
| operations | | 0.37 | (0.59) | | 0.38 | 0.46 | 0.31 | 0.36 | (0.59) | | 0.38 | 0.43 | 0.30 |
| Dividends from net investment income | (0.36) | (0.40) | | (0.38) | (0.38) | (0.42) | (0.36) | (0.39) | | (0.38) | (0.36) | (0.40) |
| Net asset value, end of year | | $ 4.14 | $ 4.13 | $ 5.12 | $ 5.12 | $ 5.04 | $ 4.14 | $ 4.14 | $ 5.12 | $ 5.12 | $ 5.05 |
| Total Investment Return4 | | | | | | | | | | | | | |
| Based on net asset value | | 11.63% | (12.25)% | 7.75% | 9.54% | 6.05% | 11.14% | (12.23)% | 7.51% | 9.06% | 5.99% |
| Ratios to Average Net Assets | | | | | | | | | | | | |
| Total expenses | | 0.77% | 0.72% | | 0.66% | 0.64% | 0.60% | 0.97% | 0.93% | | 0.89% | 0.89% | 0.85% |
| Total expenses after fees waived and | | | | | | | | | | | | |
| paid indirectly | | 0.77% | 0.72% | | 0.66% | 0.64% | 0.60% | 0.97% | 0.93% | | 0.89% | 0.89% | 0.85% |
| Net investment income | | 10.90% | 8.23% | | 7.50% | 7.55% | 7.75% | 10.72% | 7.91% | | 7.27% | 7.29% | 7.58% |
| Supplemental Data | | | | | | | | | | | | | |
| Net assets, end of year (000) | | $263,648 | $261,913 | $331,998 $ 333,995 | $341,122 | $486,450 | $495,943 | $607,913 | $551,649 | $488,006 |
| Portfolio turnover | | 98% | 72% | | 80% | 77% | 67% | 98% | 72% | | 80% | 77% | 67% |
| 1 Based on average shares outstanding. | | | | | | | | | | | | |
| 2 Includes a redemption fee, which is less than $0.01 per share. | | | | | | | | | | |
| 3 Amount is less than $(0.00) per share. | | | | | | | | | | | | |
| 4 Where applicable, total investment returns exclude the effects of any sales charges and include the reinvestment of dividends and distributions. | | |
| See Notes to Financial Statements. | | | | | | | | | | | | |
| 18 | BLACKROCK HIGH INCOME FUND | | | SEPTEMBER 30, 2009 | | |
| | | | | | | | | |
| Financial Highlights (continued) | | | | | | | | |
| | | | | | | | | Investor C | |
| | | | | | | | | | Period |
| | | | | Investor B | | | | | October 2, |
| | | | | | | | Year Ended | 20061 to |
| | | | Year Ended September 30, | | September 30, | September 30, |
| | 2009 | | 2008 | 2007 | 2006 | 2005 | 2009 | 2008 | 2007 |
| Per Share Operating Performance | | | | | | | | | |
| Net asset value, beginning of period | $ 4.14 | $ 5.13 | $ 5.12 | $ 5.05 | $ 5.15 | $ 4.14 | $ 5.13 | $ 5.13 |
| Net investment income2 | 0.35 | | 0.35 | 0.35 | 0.34 | 0.36 | 0.32 | 0.31 | 0.29 |
| Net realized and unrealized gain (loss)3 | (0.02) | | (0.98) | 0.01 | 0.07 | (0.08) | (0.01) | (0.98) | 0.03 |
| Net increase (decrease) from investment operations | 0.33 | | (0.63) | 0.36 | 0.41 | 0.28 | 0.31 | (0.67) | 0.32 |
| Dividends from net investment income | (0.33) | | (0.36) | (0.35) | (0.34) | (0.38) | (0.31) | (0.32) | (0.32) |
| Net asset value, end of period | $ 4.14 | $ 4.14 | $ 5.13 | $ 5.12 | $ 5.05 | $ 4.14 | $ 4.14 | $ 5.13 |
| Total Investment Return4 | | | | | | | | | |
| Based on net asset value | 10.42% | (12.91)% | 7.14% | 8.49% | 5.44% | 9.73% | (13.57)% | 6.30%5 |
| Ratios to Average Net Assets | | | | | | | | | |
| Total expenses | 1.64% | | 1.51% | 1.43% | 1.42% | 1.37% | 2.24% | 2.27% | 2.16%6 |
| Total expenses after fees waived and paid indirectly | 1.64% | | 1.51% | 1.43% | 1.42% | 1.37% | 2.24% | 2.27% | 2.16%6 |
| Net investment income | 10.24% | | 7.34% | 6.72% | 6.78% | 6.99% | 9.41% | 6.57% | 6.05%6 |
| Supplemental Data | | | | | | | | | |
| Net assets, end of period (000) | $ 51,369 | $ 74,449 | $152,559 | $284,787 | $428,812 | $ 84,176 | $ 80,535 | $ 70,070 |
| Portfolio turnover | 98% | | 72% | 80% | 77% | 67% | 98% | 72% | 80% |
| 1 Commencement of operations. | | | | | | | | | |
| 2 Based on average shares outstanding. | | | | | | | | | |
| 3 Includes a redemption fee, which is less than $0.01 per share. | | �� | | | | | | |
| 4 Where applicable, total investment returns exclude the effects of any sales charges and include the reinvestment of dividends and distributions. | | |
| 5 Aggregate total investment return. | | | | | | | | | |
| 6 Annualized. | | | | | | | | | |
| See Notes to Financial Statements. | | | | | | | | | |
| BLACKROCK HIGH INCOME FUND | | | | SEPTEMBER 30, 2009 | 19 |
| | | | | | | |
| Financial Highlights (concluded) | | | | | | |
| | | | | Investor C1 | | | |
| | | | Year Ended September 30, | |
| | | 2009 | 2008 | 2007 | | 2006 | 2005 |
| Per Share Operating Performance | | | | | | |
| Net asset value, beginning of year | $ 4.14 | $ 5.13 | $ 5.12 | $ 5.05 | $ 5.15 |
| Net investment income1 | | 0.34 | 0.35 | 0.35 | | 0.34 | 0.36 |
| Net realized and unrealized gain (loss)2 | (0.01) | (0.98) | 0.01 | | 0.08 | (0.09) |
| Net increase (decrease) from investment operations | 0.33 | (0.63) | 0.36 | | 0.42 | 0.27 |
| Dividends from net investment income | (0.33) | (0.36) | (0.35) | | (0.35) | (0.37) |
| Net asset value, end of year | | $ 4.14 | $ 4.14 | $ 5.13 | $ 5.12 | $ 5.05 |
| Total Investment Return3 | | | | | | | |
| Based on net asset value | | 10.39% | (12.96)% | 7.07% | | 8.42% | 5.38% |
| Ratios to Average Net Assets | | | | | | |
| Total expenses | | 1.67% | 1.57% | 1.50% | | 1.48% | 1.43% |
| Total expenses after fees waived and paid indirectly | 1.66% | 1.57% | 1.50% | | 1.48% | 1.43% |
| Net investment income | | 10.13% | 7.28% | 6.66% | | 6.70% | 7.00% |
| Supplemental Data | | | | | | | |
| Net assets, end of year (000) | | $133,953 | $167,855 | $240,270 | $274,416 | $220,443 |
| Portfolio turnover | | 98% | 72% | 80% | | 77% | 67% |
| 1 Based on average shares outstanding. | | | | | | |
| 2 Includes a redemption fee, which is less than $0.01 per share. | | | | | | |
| 3 Where applicable, total investment returns exclude the effects of any sales charges and include the reinvestment of dividends and distributions. | | |
| See Notes to Financial Statements. | | | | | | |
| 20 | BLACKROCK HIGH INCOME FUND | | SEPTEMBER 30, 2009 | |
Notes to Financial Statements
1. Organization and Significant Accounting Policies:
BlackRock High Income Fund (the “Fund”), a series of BlackRock
Bond Fund, Inc. (the “Bond Fund”), is registered under the Investment
Company Act of 1940, as amended (the “1940 Act”), as a diversified,
open-end management investment company. The Bond Fund is organized
as a Maryland corporation. The Fund’s financial statements are prepared
in conformity with accounting principles generally accepted in the United
States of America, which may require the use of management accruals
and estimates. Actual results may differ from these estimates. The Fund
offers multiple classes of shares. Institutional Shares are sold without
a sales charge and only to certain eligible investors. Investor A Shares
are generally sold with a front-end sales charge. Investor B, Investor C
and Investor C1 Shares may be subject to a contingent deferred sales
charge. All classes of shares have identical voting, dividend, liquidation
and other rights and the same terms and conditions, except that Investor
A, Investor B, Investor C and Investor C1 Shares bear certain expenses
related to the shareholder servicing of such shares, and Investor B,
Investor C and Investor C1 Shares also bear certain expenses related
to the distribution of such shares. Investor B Shares automatically con-
vert to Investor A Shares after approximately 10 years. Each class has
exclusive voting rights with respect to matters relating to its shareholder
servicing and distribution expenditures (except that Investor B sharehold-
ers may vote on material changes to the Investor A distribution plan).
The following is a summary of significant accounting policies followed by
the Fund:
Valuation: The Fund values its bond investments on the basis of last
available bid prices or current market quotations provided by dealers or
pricing services selected under the supervision of the Fund’s Board of
Directors (the “Board”). Floating rate loan interests are valued at the
mean between the last available bid prices from one or more brokers
or dealers as obtained from a pricing service. In determining the value
of a particular investment, pricing services may use certain information
with respect to transactions in such investments, quotations from deal-
ers, pricing matrixes, market transactions in comparable investments,
various relationships observed in the market between investments, and
calculated yield measures based on valuation technology commonly
employed in the market for such investments. Swap agreements are
valued utilizing quotes received daily by the Fund’s pricing service or
through brokers, which are derived using daily swap curves and trades of
underlying securities. Investments in open-end investment companies
are valued at net asset value each business day. Short-term securities
with maturities less than 60 days may be valued at amortized cost,
which approximates fair value. The Fund values its investment in Cash
Sweep Series of BlackRock Liquidity Series, LLC at fair value, which is
ordinarily based upon its prorata ownership in the net assets of the
underlying fund.
Equity investments traded on a recognized securities exchange or the
NASDAQ Global Market System are valued at the last reported sale price
that day or the NASDAQ official closing price, if applicable. For equity
investments traded on more than one exchange, the last reported sale
price on the exchange where the stock is primarily traded is used. Equity
investments traded on a recognized exchange for which there were no
sales on that day are valued at the last available bid price. If no bid
price is available, the prior day’s price will be used, unless it is deter-
mined that such prior day’s price no longer reflects the fair value of
the security.
Exchange-traded options are valued at the mean between the last bid
and ask prices at the close of the options market in which the options
trade. An exchange-traded option for which there is no mean price is
valued at the last bid (long positions) or ask (short positions) price.
If no bid or ask price is available, the prior day’s price will be used,
unless it is determined that the prior day’s price no longer reflects the
fair value of the option. Over-the-counter options and swaptions are
valued by an independent pricing service using a mathematical model
which incorporates a number of market data factors, such as the trades
and prices of the underlying securities.
In the event that application of these methods of valuation results in
a price for an investment which is deemed not to be representative
of the market value of such investment or is not available, the invest-
ment will be valued by a method approved by the Board as reflecting
fair value (“Fair Value Assets”). When determining the price for Fair Value
Assets, the investment advisor and/or sub-advisor seeks to determine
the price that the Fund might reasonably expect to receive from the cur-
rent sale of that asset in an arm’s-length transaction. Fair value determi-
nations shall be based upon all available factors that the investment
advisor and/or sub-advisor deems relevant. The pricing of all Fair Value
Assets is subsequently reported to the Board or a committee thereof.
Generally, trading in foreign securities is substantially completed each
day at various times prior to the close of business on the New York Stock
Exchange (“NYSE”). The values of such securities used in computing the
net assets of the Fund are determined as of such times. Foreign cur-
rency exchange rates will be determined as of the close of business on
the NYSE. Occasionally, events affecting the values of such securities
and such exchange rates may occur between the times at which they are
determined and the close of business on the NYSE that may not be
reflected in the computation of the Fund’s net assets. If events (for
example, a company announcement, market volatility or a natural dis-
aster) occur during such periods that are expected to materially affect
the value of such securities, those securities will be Fair Value Assets
and be valued at their fair value as determined in good faith by the
Board or by the investment advisor using a pricing service and/or proce-
dures approved by the Board. Foreign currency exchange contracts are
valued at the mid between the bid and ask prices. Interpolated values
BLACKROCK HIGH INCOME FUND SEPTEMBER 30, 2009 21
Notes to Financial Statements (continued)
are derived when the settlement date of the contract is an interim date
for which quotations are not available.
Foreign Currency Transactions: Foreign currency amounts are trans-
lated into United States dollars on the following basis: (i) market value
of investment securities, assets and liabilities at the current rate of
exchange; and (ii) purchases and sales of investment securities, income
and expenses at the rates of exchange prevailing on the respective dates
of such transactions.
The Fund reports foreign currency related transactions as components
of realized gains for financial reporting purposes, whereas such compo-
nents are treated as ordinary income for federal income tax purposes.
Floating Rate Loans: The Fund invests in floating rate loans, which are
generally non-investment grade, made by banks, other financial institu-
tions and privately and publicly offered corporations. Floating rate loans
are senior in the debt structure of a corporation. Floating rate loans gen-
erally pay interest at rates that are periodically determined by reference
to a base lending rate plus a premium. The base lending rates are gen-
erally (i) the lending rate offered by one or more European banks, such
as LIBOR (London InterBank Offered Rate), (ii) the prime rate offered by
one or more US banks or (iii) the certificate of deposit rate. The Fund
considers these investments to be investments in debt securities for
purposes of its investment policies.
The Fund earns and/or pays facility and other fees on floating rate
loans. Other fees earned/paid include commitment, amendment, con-
sent, commissions and prepayment penalty fees. Facility, amendment
and consent fees are typically amortized as premium and/or accreted
as discount over the term of the loan. Commitment, commission and
various other fees are recorded as income. Prepayment penalty fees
are recognized on the accrual basis. When the Fund buys a floating rate
loan it may receive a facility fee and when it sells a floating rate loan
it may pay a facility fee. On an ongoing basis, the Fund may receive a
commitment fee based on the undrawn portion of the underlying line of
credit portion of a floating rate loan. In certain circumstances, the Fund
may receive a prepayment penalty fee upon the prepayment of a floating
rate loan by a borrower. Other fees received by the Fund may include
covenant waiver fees and covenant modification fees.
The Fund may invest in multiple series or tranches of a loan. A different
series or tranche may have varying terms and carry different associated
risks.
Floating rate loans are usually freely callable at the issuer’s option. The
Fund may invest in such loans in the form of participations in loans
(“Participations”) and assignments of all or a portion of loans from third
parties. Participations typically will result in the Fund having a contrac-
tual relationship only with the lender, not with the borrower. The Fund will
have the right to receive payments of principal, interest and any fees to
which it is entitled only from the lender selling the Participation and only
upon receipt by the lender of the payments from the borrower.
In connection with purchasing Participations, the Fund generally will
have no right to enforce compliance by the borrower with the terms of
the loan agreement relating to the loans, nor any rights of offset against
the borrower, and the Fund may not benefit directly from any collateral
supporting the loan in which it has purchased the Participation.
As a result, the Fund will assume the credit risk of both the borrower and
the lender that is selling the Participation. The Fund’s investments in loan
participation interests involve the risk of insolvency of the financial inter-
mediaries who are parties to the transactions. In the event of the insol-
vency of the lender selling the Participation, the Fund may be treated as
a general creditor of the lender and may not benefit from any offset
between the lender and the borrower.
Zero-Coupon Bonds: The Fund may invest in zero-coupon bonds, which
are normally issued at a significant discount from face value and do not
provide for periodic interest payments. Zero-coupon bonds may experi-
ence greater volatility in market value than similar maturity debt obliga-
tions which provide for regular investment payments.
Preferred Stock: The Fund may invest in preferred stocks. Preferred stock
has a preference over common stock in liquidation (and generally in
receiving dividends as well) but is subordinated to the liabilities of the
issuer in all respects. As a general rule, the market value of preferred stock
with a fixed dividend rate and no conversion element varies inversely with
interest rates and perceived credit risk, while the market price of convert-
ible preferred stock generally also reflects some element of conversion
value. Because preferred stock is junior to debt securities and other obli-
gations of the issuer, deterioration in the credit quality of the issuer will
cause greater changes in the value of a preferred stock than in a more
senior debt security with similar stated yield characteristics. Unlike interest
payments on debt securities, preferred stock dividends are payable only if
declared by the issuer’s board of directors. Preferred stock also may be
subject to optional or mandatory redemption provisions.
Segregation and Collateralization: In cases in which the 1940 Act and
the interpretive positions of the Securities and Exchange Commission
(“SEC”) require that the Fund either delivers collateral or segregates
assets in connection with certain investments (e.g., swaps, written
options and foreign currency exchange contracts), the Fund will, con-
sistent with SEC rules and/or certain interpretive letters issued by
the SEC, segregate collateral or designate on its books and records
cash or other liquid securities having a market value at least equal
to the amount that would otherwise be required to be physically seg-
regated. Furthermore, based on requirements and agreements with
certain exchanges and third party broker-dealers, each party has
requirements to deliver/deposit securities as collateral for certain
investments.
22 BLACKROCK HIGH INCOME FUND SEPTEMBER 30, 2009
Notes to Financial Statements (continued)
Investment Transactions and Investment Income: For financial reporting
purposes, investment transactions are recorded on the dates the trans-
actions are entered into (the trade dates). Realized gains and losses
on investment transactions are determined on the identified cost basis.
Dividend income is recorded on the ex-dividend dates. Dividends from
foreign securities where the ex-dividend date may have passed are sub-
sequently recorded when the Fund has determined the ex-dividend date.
Interest income is recognized on the accrual basis. The Fund amortizes
all premiums and discounts on debt securities. Income and realized and
unrealized gains and losses are allocated daily to each class based on
its relative net assets.
Dividends and Distributions: Dividends from net investment income
are declared daily and paid monthly. Distributions of capital gains are
recorded on the ex-dividend dates.
Income Taxes: It is the Fund’s policy to comply with the requirements
of the Internal Revenue Code applicable to regulated investment com-
panies and to distribute substantially all of its taxable income to its
shareholders. Therefore, no federal income tax provision is required.
Under the applicable foreign tax laws, a withholding tax may be
imposed on interest, dividends and capital gains at various rates.
The Fund files US federal and various state and local tax returns. No
income tax returns are currently under examination. The statute of limita-
tions on the Fund’s US federal tax returns remains open for each of the
four years ended September 30, 2009. The statutes of limitations on the
Fund’s state and local tax returns may remain open for an additional
year depending upon the jurisdiction.
Recent Accounting Standards: In June 2009, amended guidance was
issued by the Financial Accounting Standards Board for transfers of
financial assets. This guidance is intended to improve the relevance, rep-
resentational faithfulness and comparability of the information that a
reporting entity provides in its financial statements about a transfer of
financial assets; the effects of a transfer on its financial position, finan-
cial performance, and cash flows; and a transferor’s continuing involve-
ment, if any, in transferred financial assets. The amended guidance is
effective for financial statements for fiscal years and interim periods
beginning after November 15, 2009. Earlier application is prohibited.
The recognition and measurement provisions of this guidance must be
applied to transfers occurring on or after the effective date. Additionally,
the enhanced disclosure provisions of the amended guidance should be
applied to transfers that occurred both before and after the effective
date of this guidance. The impact of this guidance on the Fund’s finan-
cial statements and disclosures, if any, is currently being assessed.
Bank Overdraft: The Fund recorded a bank overdraft due to estimates of
available cash.
Other: Expenses directly related to the Fund or its classes are charged
to that Fund or class. Other operating expenses shared by several funds
are prorated among those funds on the basis of relative net assets or
other appropriate methods. Other expenses of the Fund are allocated
daily to each class based on its relative net assets. Custodian fees may
be reduced by amounts calculated on univested cash balances, which
are shown as fees paid indirectly in the Statement of Operations.
2. Derivative Financial Instruments:
The Fund may engage in various portfolio investment strategies both
to increase the returns of the Fund and to economically hedge, or
protect, its exposure to certain risks such as credit risk, and foreign cur-
rency exchange rate risk. Losses may arise if the value of the contract
decreases due to an unfavorable change in the value of the underlying
security, or if the counterparty does not perform under the contract. The
Fund may mitigate counterparty risk through master netting agreements
included within an International Swap and Derivatives Association, Inc.
(“ISDA”) Master Agreement between the Fund and its counterparties. The
ISDA Master Agreement allows the Fund to offset with its counterparty
certain derivative financial instruments’ payables and/or receivables with
collateral held with each counterparty. The amount of collateral moved
to/from applicable counterparties is based upon minimum transfer
amounts of up to $500,000. To the extent amounts due to the Fund
from its counterparties are not fully collateralized contractually or other-
wise, the Fund bears the risk of loss from counterparty non-performance.
See Note 1 “Segregation and Collateralization” for additional information
with respect to collateral practices.
The Fund’s maximum risk of loss from counterparty credit risk on over-
the-counter derivatives is generally the aggregate unrealized gain in
excess of any collateral pledged by the counterparty to the Fund. For
over-the-counter purchased options, the Fund bears the risk of loss in
the amount of the premiums paid and change in market value of the
options should the counterparty not perform under the contracts. Options
written by the Fund do not give rise to counterparty credit risk, as written
options obligate the Fund to perform and not the counterparty. Certain
ISDA Master Agreements allow counterparties to over-the-counter deriva-
tives to terminate derivative contracts prior to maturity in the event the
Fund’s net assets decline by a stated percentage or the Fund fails to
meet the terms of its ISDA Master Agreements, which would cause the
Fund to accelerate payment of any net liability owed to the counterparty.
Counterparty risk related to exchange-traded financial futures contracts
and options is minimal because of the protection against defaults pro-
vided by the exchange on which they trade.
BLACKROCK HIGH INCOME FUND SEPTEMBER 30, 2009 23
Notes to Financial Statements (continued)
Foreign Currency Exchange Contracts: The Fund may enter into foreign
currency exchange contracts as an economic hedge against either spe-
cific transactions or portfolio positions (foreign currency exchange rate
risk). A foreign currency exchange contract is an agreement between two
parties to buy and sell a currency at a set exchange rate on a future
date. Foreign currency exchange contracts, when used by the Fund, help
to manage the overall exposure to the currency backing some of the
investments held by the Fund. The contract is marked-to-market daily
and the change in market value is recorded by the Fund as an unreal-
ized gain or loss. When the contract is closed, the Fund records a real-
ized gain or loss equal to the difference between the value at the time it
was opened and the value at the time it was closed. The use of foreign
currency exchange contracts involves the risk that counterparties may
not meet the terms of the agreement or unfavorable movements in the
value of a currency relative to the US dollar.
Options: The Fund may purchase and write call and put options to
increase or decrease their exposure to underlying instruments (interest
rate risk). A call option gives the purchaser of the option the right (but
not the obligation) to buy, and obligates the seller to sell (when the
option is exercised), the underlying instrument at the exercise price at
any time or at a specified time during the option period. A put option
gives the holder the right to sell and obligates the writer to buy the
underlying instrument at the exercise price at any time or at a specified
time during the option period. When the Fund purchases (writes) an
option, an amount equal to the premium paid (received) by the Fund
is reflected as an asset (liability). The amount of the asset (liability) is
subsequently marked-to-market to reflect the current market value of the
option purchased (written). When an instrument is purchased or sold
through an exercise of an option, the related premium paid (or received)
is added to (or deducted from) the basis of the instrument acquired or
deducted from (or added to) the proceeds of the instrument sold. When
an option expires (or the Fund enters into a closing transaction), the
Fund realizes a gain or loss on the option to the extent of the premiums
received or paid (or gain or loss to the extent the cost of the closing
transaction exceeds the premium received or paid). When the Fund
writes a call option, such option is “covered,” meaning that the Fund
holds the underlying instrument subject to being called by the option
counterparty, or cash in an amount sufficient to cover the obligation.
When the Fund writes a put option, such option is covered by cash in
an amount sufficient to cover the obligation.
Options on swaps (swaptions) are similar to options on securities except
that instead of selling or purchasing the right to buy or sell a security,
the writer or purchaser of the swap option is granting or buying the right
to enter into a previously agreed upon interest rate swap agreement at
any time before the expiration of the option.
In purchasing and writing options, the Fund bears the risk of an unfavor-
able change in the value of the underlying instrument or the risk that the
Fund may not be able to enter into a closing transaction due to an illiq-
uid market. Exercise of a written option could result in a Fund purchas-
ing a security at a price different from the current market value. The Fund
may execute transactions in both listed and over-the-counter options.
Swaps: The Fund may enter into swap agreements, in which the Fund
and a counterparty agree to make periodic net payments on a specified
notional amount. These periodic payments received or made by the
Fund are recorded in the Statement of Operations as realized gains or
losses, respectively. Swaps are marked-to-market daily and changes in
value are recorded as unrealized appreciation (depreciation). When the
swap is terminated, the Fund will record a realized gain or loss equal to
the difference between the proceeds from (or cost of) the closing trans-
action and the Fund’s basis in the contract, if any. Swap transactions
involve, to varying degrees, elements of interest rate, credit and market
risk in excess of the amounts recognized on the Statement of Assets and
Liabilities. Such risks involve the possibility that there will be no liquid
market for these agreements, that the counterparty to the agreements
may default on its obligation to perform or disagree as to the meaning
of the contractual terms in the agreements, and that there may be unfa-
vorable changes in interest rates and/or market values associated with
these transactions.
• Credit default swaps — The Fund may enter into credit default swaps
to manage its exposure to the market or certain sectors of the
market, to reduce its risk exposure to defaults of corporate and/or
sovereign issuers or to create exposure to corporate and/or sovereign
issuers to which it is not otherwise exposed (credit risk). The Fund
enters into credit default agreements to provide a measure of pro-
tection against the default of an issuer (as buyer protection) and/or
gain credit exposure to an issuer to which it is not otherwise exposed
(as seller of protection). The Fund may either buy or sell (write) credit
default swaps on single-name issuers (corporate or sovereign) or
traded indexes. Credit default swaps on single-name issuers are
agreements in which the buyer pays fixed periodic payments to the
seller in consideration for a guarantee from the seller to make a
specific payment should a negative credit event take place (e.g.,
bankruptcy, failure to pay, obligation accelerators, repudiation, mora-
torium or restructuring). Credit default swaps on traded indexes are
agreements in which the buyer pays fixed periodic payments to the
seller in consideration for a guarantee from the seller to make a
specific payment should a write-down, principal or interest shortfall
or default of all or individual underlying securities included in the
index occurs. As a buyer, the Fund will either receive from the seller
an amount equal to the notional amount of the swap and deliver the
referenced security or underlying securities comprising of an index or
receive a net settlement of cash equal to the notional amount of the
swap less the recovery value of the security or underlying securities
comprising of an index. As a seller (writer), the Fund will either pay
the buyer an amount equal to the notional amount of the swap and
take delivery of the referenced security or underlying securities com-
prising of an index or pay a net settlement of cash equal to the
notional amount of the swap less the recovery value of the security
or underlying securities comprising of an index.
24 BLACKROCK HIGH INCOME FUND SEPTEMBER 30, 2009
| | | | | | | |
| Notes to Financial Statements (continued) | | | | | | |
| Derivative Instruments Categorized by Risk Exposure: | | | | | | |
| | Values of Derivative Instruments as of September 30, 2009* | | | |
| | Asset Derivatives | | | | Liability Derivatives | |
| | Statements of Assets and Liabilities | Value | | Statements of Assets and Liabilities | Value |
| | Location | | | | Location | | |
| Foreign currency exchange contracts | Unrealized appreciation on foreign | | | Unrealized depreciation on foreign | |
| | currency exchange contracts | $ 146,456 | | currency exchange contracts | | $ 234,650 |
| Credit contracts | Unrealized appreciation on swaps | $ 542,272 | | Unrealized depreciation on swaps | $6,056,419 |
| Total | | $ 688,728 | | | | | $6,291,069 |
| * For open derivative instruments as of September 30, 2009, see the Schedule of Investments, which is also indicative of activity for the year ended September 30, 2009. |
| | The Effect of Derivative Instruments on the Statement of Operations | | |
| | Year Ended September 30, 2009 | | | | |
| | Net Realized Gain (Loss) From: | | | | |
| | | | | | | Foreign | |
| | | | | | | Currency | |
| | | | | | Written | Exchange | |
| | | | | Swaps | Options | Contracts | Total |
| Foreign currency exchange contracts | | | | — | — | $(2,698,743) | $ (2,698,743) |
| Credit contracts | | | $(20,041,936) | $1,500,000 | — | (18,541,936) |
| Total | | | $(20,041,936) | $1,500,000 | $(2,698,743) | $(21,240,679) |
| | Net Change in Unrealized Appreciation/Depreciation on: | | | |
| | | | | | | Foreign | |
| | | | | | | Currency | |
| | | | | | Written | Exchange | |
| | | | | Swaps | Options | Contracts | Total |
| Foreign currency exchange contracts | | | | — | — | $(1,412,800) | $ (1,412,800) |
| Credit contracts | | | $ (998,913) | $ (141,300) | — | (1,140,213) |
| Total | | | $ (998,913) | $ (141,300) | $(1,412,800) | $ (2,553,013) |
3. Investment Advisory Agreement and Transactions
with Affiliates:
The PNC Financial Services Group, Inc. (“PNC”) and Bank of America
Corporation (“BAC”) are the largest stockholders of BlackRock, Inc.
(“BlackRock”). BAC became a stockholder of BlackRock following its
acquisition of Merrill Lynch & Co., Inc. (“Merrill Lynch”) on January 1,
2009. Prior to that date, both PNC and Merrill Lynch were considered
affiliates of the Fund under the 1940 Act. Subsequent to the acquisition,
PNC remains an affiliate, but due to the restructuring of Merrill Lynch’s
ownership interest of BlackRock, BAC is not deemed to be an affiliate
under the 1940 Act.
The Bond Fund, on behalf of the Fund, entered into an Investment
Advisory Agreement with BlackRock Advisors, LLC (the “Manager”), the
Fund’s investment advisor, an indirect, wholly owned subsidiary of
BlackRock, to provide investment advisory and administration services.
The Manager is responsible for the management of the Fund’s portfolio
and provides the necessary personnel, facilities, equipment and certain
other services necessary to the operations of the Fund. For such serv-
ices, the Fund pays a monthly fee with respect to the Fund based upon
the aggregate average daily value of the net assets of the Fund and the
Master Total Return Portfolio of Master Bond LLC at the following annual
rates: 0.55% of the Bond Fund’s average daily net assets not exceeding
$250 million; 0.50% of average daily net assets in excess of $250
million but not exceeding $500 million; 0.45% of average daily net
assets in excess of $500 million but not exceeding $750 million; and
0.40% of average daily net assets in excess of $750 million. For the
year ended September 30, 2009, the aggregate average daily net
assets of the Fund and the Master Total Return Portfolio was
approximately $3,633,656,000.
The Manager has voluntarily agreed to waive its advisory fees by the
amount of investment advisory fees the Fund pays to the Manager indi-
rectly through its investment in affiliated money market funds. This amount
is shown as fees waived by advisor in the Statement of Operations.
The Manager has entered into a separate sub-advisory agreement
with BlackRock Financial Management, Inc. (“BFM”), an affiliate of the
Manager, under which the Manager pays BFM for services it provides, a
monthly fee that is a percentage of the investment advisory fee paid by
the Fund to the Manager.
For the year ended September 30, 2009, the Fund reimbursed the
Manager $17,609 for certain accounting services, which is included in
accounting services in the Statement of Operations.
BLACKROCK HIGH INCOME FUND SEPTEMBER 30, 2009 25
Notes to Financial Statements (continued)
The Fund has entered into a Distribution Agreement and Distribution
Plans with BlackRock Investments, LLC (“BRIL”), which is an affiliate
of BlackRock.
Pursuant to the Distribution Plans adopted by the Fund in accordance
with Rule 12b-1 under the 1940 Act, the Fund pays BRIL ongoing serv-
ice and distribution fees. The fees are accrued daily and paid monthly
at annual rates based upon the average daily net assets of the shares
as follows:
| | |
| | Service | Distribution |
| | Fee | Fee |
| Investor A | 0.25% | — |
| Investor B | 0.25% | 0.50% |
| Investor C | 0.25% | 0.75% |
| Class C1 | 0.25% | 0.55% |
Pursuant to sub-agreements with BRIL, broker-dealers, including Merrill
Lynch, Pierce, Fenner & Smith Incorporated (“MLPF&S”), a wholly owned
subsidiary of Merrill Lynch, and BRIL provide shareholder servicing and
distribution services to the Fund. The ongoing service and/or distribution
fee compensates BRIL and each broker-dealer for providing shareholder
servicing and/or distribution-related services to Investor A, Investor B,
Investor C and Investor C1 shareholders.
For the year ended September 30, 2009, affiliates, including Merrill
Lynch, from October 1, 2008 to December 31, 2008 (after which time
Merrill Lynch was no longer considered an affiliate) earned underwriting
discounts, direct commissions and dealer concessions on sales of the
Fund’s Investor A shares, which totaled $43,838. Affiliates received con-
tingent deferred sales charges of $38,884, $31,374 and $4,744 relat-
ing to transactions in Investor B, Investor C and Investor C1 Shares,
respectively. Furthermore, affiliates received contingent deferred sales
charges of $1,976 relating to transactions subject to front-end sales
charge waivers on Investor A Shares.
PNC Global Investment Servicing (U.S.) Inc., an indirect, wholly owned
subsidiary of PNC and an affiliate of the Manager, serves as transfer
agent and dividend disbursing agent. Each class of the Fund bears
the costs of transfer agent fees associated with such respective class.
Transfer agency fees borne by each class of the Fund are comprised
of those fees charged for all shareholder communications including
mailing of shareholder reports, dividend and distribution notices, and
proxy materials for shareholder meetings, as well as per account and
per transaction fees related to servicing and maintenance of shareholder
accounts, including the issuing, redeeming and transferring of shares of
each class of the Fund, 12b-1 fee calculation, check writing, anti-money
laundering services, and customer identification services.
The Fund may earn income on positive cash balances in demand deposit
accounts that are maintained by the transfer agent on behalf of the Fund.
For the year ended September 30, 2009, the Fund earned $227, which
is included in income — affiliated in the Statement of Operations.
Pursuant to written agreements, certain affiliates, including Merrill Lynch,
from October 1, 2008 to December 31, 2008 (after which time Merrill
Lynch was no longer considered an affiliate) provide the Fund with sub-
accounting, recordkeeping, sub-transfer agency and other administrative
services with respect to sub-accounts they service. For these services,
these affiliates receive an annual fee per shareholder account which
will vary depending on share class. For the year ended September 30,
2009, the Fund paid $627,571 in return for these services, which is
included in transfer agent in the Statement of Operations.
The Manager maintains a call center, which is responsible for providing
certain shareholder services to the Fund, such as responding to share-
holder inquiries and processing transactions based upon instructions
from shareholders with respect to the subscription and redemption of
Fund shares. For the year ended September 30, 2009, the Fund reim-
bursed the Manager for costs incurred running the call center, which are
included in transfer agent in the Statement of Operations.
| |
| | Call Center |
| | Fees |
| Institutional | $ 7,212 |
| Investor A | $13,405 |
| Investor B | $ 2,024 |
| Investor C | $ 3,514 |
| Class C1 | $ 4,610 |
Certain officers and/or directors of the Fund are officers and/or directors
of BlackRock or its affiliates. The Fund reimburses the Manager for com-
pensation paid to the Fund’s Chief Compliance Officer.
4. Investments
Purchases and sales of investments, including paydowns and excluding
short-term securities for the year ended September 30, 2009 were
$843,567,742 and $890,296,194, respectively.
Transactions in call options written for the year ended September 30,
2009 were as follows:
| | |
| | | Premiums |
| Call Options Written | Contracts | Received |
| Outstanding options written, beginning | | |
| of the year | 30 | $465,000 |
| Options expired | (30) | (465,000) |
| Outstanding options written, end of | | |
| the year | — | — |
| Transactions in put options written for the year ended September 30, |
| 2009 were as follows: | | |
| | | Premiums |
| Put Options Written | Contracts | Received |
| Outstanding options written, beginning | | |
| of the year | 30 | $1,035,000 |
| Options expired | (30) | (1,035,000) |
| Outstanding options written, end of | | |
| the year | — | — |
26 BLACKROCK HIGH INCOME FUND SEPTEMBER 30, 2009
Notes to Financial Statements (continued)
5. Income Tax Information
Reclassifications: Accounting principles generally accepted in the United
States of America require that certain components of net assets be
adjusted to reflect permanent differences between financial and tax
reporting. These reclassifications have no effect on net assets or net
asset values per share. The following permanent differences as of
September 30, 2009 attributable to the accounting for swap agree-
ments, amortization methods on fixed income securities, the classifica-
tion of investments, foreign currency transactions and the expiration of
capital loss carryforwards were reclassified to the following accounts:
| |
| Paid-in capital | $ (387,766,347) |
| Undistributed net investment income | $ (620,315) |
| Accumulated net realized loss | $ 388,386,662 |
| The tax character of distributions paid during the fiscal years ended |
| September 30, 2009 and September 30, 2008 was as follows: |
| Ordinary income | |
| 9/30/2009 | $ 88,950,252 |
| 9/30/2008 | $102,065,914 |
| Total distributions | |
| 9/30/2009 | $ 88,950,252 |
| 9/30/2008 | $102,065,914 |
| As of September 30, 2009, the tax components of accumulated |
| net losses were as follows: | |
| Undistributed ordinary income | $ 25,855,243 |
| Capital loss carryforward | $ (1,573,500,527) |
| Net unrealized losses* | $ (283,505,994) |
| Total | $ (1,831,151,278) |
| * The differences between book-basis and tax-basis net unrealized losses were |
| attributable primarily to the tax deferral of losses on wash sales, amortization |
| methods on fixed income securities, the accrual of income on securities in |
| default, the realization for tax purposes of unrealized gains (losses) on certain |
| foreign currency contracts, the deferral of post-October capital losses for tax |
| purposes, the accounting for swap agreements and other temporary differences. |
| As of September 30, 2009, the Fund had capital loss carryforwards |
| available to offset future realized capital gains through the indicated |
| expiration dates: | |
| 2010 | $ 187,386,138 |
| 2011 | 684,131,730 |
| 2012 | 458,613,508 |
| 2013 | 8,631,903 |
| 2014 | 59,615,799 |
| 2015 | 82,988,587 |
| 2016 | 10,095,668 |
| 2017 | 82,037,194 |
| Total | $ 1,573,500,527 |
6. Market and Credit Risk:
In the normal course of business, the Fund invests in securities and
enters into transactions where risks exist due to fluctuations in the
market (market risk) or failure of the issuer of a security to meet all its
obligations (credit risk). The value of securities held by the Fund may
decline in response to certain events, including those directly involving
the issuers whose securities are owned by the Fund; conditions affecting
the general economy; overall market changes; local, regional or global
political, social or economic instability; and currency and interest rate
and price fluctuations. Similar to credit risk, the Fund may be exposed
to counterparty risk, or the risk that an entity with which the Fund has
unsettled or open transactions may default. Financial assets, which
potentially expose the Fund to credit and counterparty risks, consist
principally of investments and cash due from counterparties. The extent
of the Fund’s exposure to credit and counterparty risks with respect to
these financial assets is approximated by their value recorded in the
Fund’s Statement of Assets and Liabilities.
7. Bridge Debt Commitments:
The Fund may invest in floating rate senior loans. In connection with
these investments, the Fund may, with its Manager, also enter into senior
unsecured bridge financing commitments. Bridge financing commitments
may obligate the Fund to furnish temporary financing to a borrower until
permanent financing can be arranged. At September 30, 2009, the Fund
had outstanding bridge financing commitments of $5.4 million with
Warner Chilcott. In connection with these commitments, the Fund earns
a commitment fee, typically set as a percentage of the commitment
amount. Such fee income, which is classified in the Statement of
Operations as interest income, is recognized ratably over the commit-
ment period. As of September 30, 2009, the unrecognized commitment
fee income is shown as deferred income liability in the Statement of
Assets and Liabilities.
8. Short-Term Borrowings:
The Fund, along with certain other funds managed by the Manager and
its affiliates, is a party to a $500 million credit agreement with a group
of lenders, which expires in November 2009. The Fund may borrow under
the credit agreement to fund shareholder redemptions and for other
lawful purposes other than for leverage. The Fund may borrow up to the
maximum amount allowable under the Fund’s current Prospectus and
Statement of Additional Information, subject to various other legal, reg-
ulatory or contractual limits. The Fund paid its prorata share of a 0.02%
upfront fee on the aggregate commitment amount based on its net
assets as of October 31, 2008. The Fund pays a commitment fee of
0.08% per annum based on the Fund’s prorata share of the unused
portion of the credit agreement, which is included in miscellaneous in the
Statement of Operations. Amounts borrowed under the credit agreement
bear interest at a rate equal to the higher of the (a) federal funds effec-
tive rate and (b) reserve adjusted one month LIBOR, plus, in each case,
the higher of (i) 1.50% and (ii) 50% of the CDX Index (as defined in the
credit agreement). The Fund did not borrow under the credit agreement
during the year ended September 30, 2009.
BLACKROCK HIGH INCOME FUND SEPTEMBER 30, 2009 27
| | | | | | | |
| Notes to Financial Statements (concluded) | | | | | |
| 9. Capital Share Transactions: | | | | | | |
| Transactions in capital shares for each class were as follows: | | | | | | |
| | | Year Ended | | Year Ended | |
| | | September 30, 2009 | September 30, 2008 |
| | | Shares | | Amount | Shares | | Amount |
| Institutional | | | | | | | |
| Shares sold | | 10,248,030 | $ 33,796,456 | 6,329,137 | $ 30,100,025 |
| Shares issued to shareholders in reinvestment of dividends | 5,515,311 | | 18,473,295 | 4,286,210 | | 20,127,963 |
| Total issued | | 15,763,341 | | 52,269,751 | 10,615,347 | | 50,227,988 |
| Shares redeemed | | (15,432,734) | | (51,748,056) | (12,072,116) | | (56,936,668) |
| Net increase (decrease) | | 330,607 | $ 521,695 | (1,456,769) | $ (6,708,680) |
| Investor A | | | | | | | |
| Shares sold and automatic conversion of shares | 23,442,360 | $ 76,468,076 | 23,336,122 | $ 111,917,683 |
| Shares issued to shareholders in reinvestment of dividends | 8,860,880 | | 29,643,518 | 6,614,812 | | 31,081,321 |
| Total issued | | 32,303,240 | | 106,111,594 | 29,950,934 | | 142,999,004 |
| Shares redeemed | | (34,762,793) | | (118,759,581) | (28,660,935) | (135,820,581) |
| Net increase (decrease) | | (2,459,553) | $ (12,647,987) | 1,289,999 | $ 7,178,423 |
| Investor B | | | | | | | |
| Shares sold | | 710,842 | $ 2,352,052 | 684,052 | $ 3,288,803 |
| Shares issued to shareholders in reinvestment of dividends | 844,417 | | 2,804,248 | 931,983 | | 4,407,136 |
| Total issued | | 1,555,259 | | 5,156,300 | 1,616,035 | | 7,695,939 |
| Shares redeemed | | (7,153,740) | | (23,710,078) | (13,383,842) | | (64,387,425) |
| Net decrease | | (5,598,481) | $ (18,553,778) | (11,767,807) | $ (56,691,486) |
| Investor C | | | | | | | |
| Shares sold | | 8,350,652 | $ 27,893,838 | 9,985,623 | $ 47,955,162 |
| Shares issued to shareholders in reinvestment of dividends | 1,610,356 | | 5,387,974 | 1,105,426 | | 5,176,498 |
| Total issued | | 9,961,008 | | 33,281,812 | 11,091,049 | | 53,131,660 |
| Shares redeemed | | (9,110,981) | | (30,863,264) | (5,292,853) | | (24,728,472) |
| Net increase | | 850,027 | $ 2,418,548 | 5,798,196 | $ 28,403,188 |
| Investor C1 | | | | | | | |
| Shares sold | | 77,817 | $ 265,035 | 125,441 | $ 584,611 |
| Shares issued to shareholders in reinvestment of dividends | 2,696,340 | | 8,979,728 | 2,503,496 | | 11,790,255 |
| Total issued | | 2,774,157 | | 9,244,763 | 2,628,937 | | 12,374,866 |
| Shares redeemed | | (11,016,220) | | (37,030,644) | (8,925,021) | | (42,153,989) |
| Net decrease | | (8,242,063) | $ (27,785,881) | (6,296,084) | $ (29,779,123) |
| There is a 2% redemption fee on shares redeemed or exchanged that have been held 30 days or less. The redemption fees are collected and |
| retained by the Fund for the benefit of the remaining shareholders. The redemption fees are recorded as a credit to paid-in capital. | | |
| 10. Subsequent Events: | | | | | | |
| Management has evaluated the impact of all subsequent events on | | | | | |
| the Fund through November 25, 2009, the date the financial statements | | | | | |
| were issued, and has determined that there were no subsequent events | | | | | |
| requiring adjustment or disclosure in the financial statements. | | | | | |
| 28 | BLACKROCK HIGH INCOME FUND | | | SEPTEMBER 30, 2009 | | |
Report of Independent Registered Public Accounting Firm
To the Shareholders and Board of Directors of BlackRock
Bond Fund, Inc.:
We have audited the accompanying statement of assets and liabilities,
including the schedule of investments, of BlackRock High Income Fund,
one of the portfolios constituting BlackRock Bond Fund, Inc. (the “Fund”),
as of September 30, 2009, and the related statement of operations for
the year then ended, the statements of changes in net assets for each of
the two years in the period then ended, and the financial highlights for
each of the five years in the period then ended. These financial state-
ments and financial highlights are the responsibility of the Fund’s man-
agement. Our responsibility is to express an opinion on these financial
statements and financial highlights based on our audits.
We conducted our audits in accordance with the standards of the Public
Company Accounting Oversight Board (United States). Those standards
require that we plan and perform the audit to obtain reasonable assur-
ance about whether the financial statements and financial highlights
are free of material misstatement. The Fund is not required to have, nor
were we engaged to perform, an audit of its internal control over financial
reporting. Our audits included consideration of internal control over
financial reporting as a basis for designing audit procedures that are
appropriate in the circumstances, but not for the purpose of expressing
an opinion on the effectiveness of the Fund’s internal control over finan-
cial reporting. Accordingly, we express no such opinion. An audit also
includes examining, on a test basis, evidence supporting the amounts
and disclosures in the financial statements, assessing the accounting
principles used and significant estimates made by management, as well
as evaluating the overall financial statement presentation. Our procedures
included confirmation of securities owned as of September 30, 2009,
by correspondence with the custodian and financial intermediaries;
where replies were not received from financial intermediaries, we per-
formed other auditing procedures. We believe that our audits provide a
reasonable basis for our opinion.
In our opinion, the financial statements and financial highlights referred
to above present fairly, in all material respects, the financial position
of BlackRock High Income Fund of BlackRock Bond Fund, Inc. as of
September 30, 2009, the results of its operations for the year then
ended, the changes in its net assets for each of the two years in the
period then ended, and the financial highlights for each of the five years
in the period then ended, in conformity with U.S. generally accepted
accounting principles.
Deloitte & Touche LLP
Princeton, New Jersey
November 25, 2009
| | | |
| Important Tax Information (Unaudited) | | |
| The following information is provided with respect to the ordinary income distributions paid by BlackRock High Income Fund of BlackRock Bond Fund, |
| Inc. during the fiscal year ended September 30, 2009: | | |
| Interest-Related Dividends for Non-U.S. Residents* | | |
| Month(s) Paid: | October 2008 | | 90.14% |
| | November 2008 | | 89.20% |
| | December 2008 | | 79.07% |
| | January 2009 – September 2009 | | 84.15% |
| * Represents the portion of the taxable ordinary income dividends eligible for exemption from U.S. withholding tax for nonresident aliens and foreign corporations. | |
| | BLACKROCK HIGH INCOME FUND | SEPTEMBER 30, 2009 | 29 |
Disclosure of Investment Advisory Agreement and Sub-Advisory Agreement
The Board of Directors (the “Board,” and the members of which are
referred to as “Board Members”) of BlackRock High Income Fund (the
“Fund”), a series of BlackRock Bond Fund, Inc. (the “Corporation”) met
on May 5, 2009 and June 4 – 5, 2009 to consider the approval of the
Corporation’s investment advisory agreement (the “Advisory Agreement”),
on behalf of the Fund, with BlackRock Advisors, LLC (the “Manager”), the
Fund’s investment advisor. The Board also considered the approval of
the sub-advisory agreement (the “Sub-Advisory Agreement”) between the
Manager and BlackRock Financial Management, Inc. (the “Sub-Advisor”)
with respect to the Fund. The Manager and the Sub-Advisor are referred
to herein as “BlackRock.” For simplicity, the Fund and the Corporation
are referred to herein as the “Fund.” The Advisory Agreement and the
Sub-Advisory Agreement are referred to herein as the “Agreements.”
Activities and Composition of the Board
The Board of the Fund consisted of fifteen individuals, twelve of whom
were not “interested persons” of the Fund as defined in the Investment
Company Act of 1940, as amended (the “1940 Act”) (the “Independent
Board Members”), at the time of the Board’s approval of the Agreements.
The Board Members are responsible for the oversight of the operations
of the Fund and perform the various duties imposed on the directors of
investment companies by the 1940 Act. The Independent Board Members
have retained independent legal counsel to assist them in connection
with their duties. The Chairman of the Board is an Independent Board
Member. The Board has established five standing committees: an Audit
Committee, a Governance and Nominating Committee, a Compliance
Committee, a Performance Oversight Committee and an Executive
Committee, each of which is composed of Independent Board Members
(except for the Performance Oversight Committee and the Executive
Committee, which each have one interested Board Member) and is
chaired by Independent Board Members.
The Agreements
Pursuant to the 1940 Act, the Board is required to consider the con-
tinuation of the Agreements on an annual basis. In connection with
this process, the Board assessed, among other things, the nature, scope
and quality of the services provided to the Fund by the personnel of
BlackRock and its affiliates, including investment management, adminis-
trative and shareholder services, oversight of fund accounting and cus-
tody, marketing services and assistance in meeting applicable legal and
regulatory requirements.
Throughout the year, the Board, acting directly and through its commit-
tees, considers at each of its meetings factors that are relevant to its
annual consideration of the renewal of the Agreements, including the
services and support provided by BlackRock to the Fund and its share-
holders. Among the matters the Board considered were: (a) investment
performance for one-, three- and five-year periods, as applicable, against
peer funds, and applicable benchmarks, if any, as well as senior manage-
ment and portfolio managers’ analysis of the reasons for any out perfor-
mance or underperformance against its peers; (b) fees, including advisory,
administration, if applicable, and other amounts paid to BlackRock and
its affiliates by the Fund for services, such as transfer agency, marketing
and distribution, call center and fund accounting; (c) Fund operating
expenses; (d) the resources devoted to and compliance reports relating to
the Fund’s investment objective, policies and restrictions, (e) the Fund’s
compliance with its Code of Ethics and compliance policies and proce-
dures; (f) the nature, cost and character of non-investment management
services provided by BlackRock and its affiliates; (g) BlackRock’s and
other service providers’ internal controls; (h) BlackRock’s implementa-
tion of the proxy voting policies approved by the Board; (i) execution
quality of portfolio transactions; (j) BlackRock’s implementation of the
Fund’s valuation and liquidity procedures; and (k) periodic updates on
BlackRock’s business.
Board Considerations in Approving the Agreements
The Approval Process: Prior to the May 5, 2009 meeting, the Board
requested and received materials specifically relating to the Agreements.
The Board is engaged in an ongoing process with BlackRock to continu-
ously review the nature and scope of the information provided to better
assist its deliberations. The materials provided in connection with the
May meeting included (a) information independently compiled and pre-
pared by Lipper, Inc. (“Lipper”) on Fund fees and expenses, and the
investment performance of the Fund as compared with a peer group of
funds as determined by Lipper (collectively, “Peers”); (b) information on
the profitability of the Agreements to BlackRock and a discussion of fall-
out benefits to BlackRock and its affiliates and significant shareholders;
(c) a general analysis provided by BlackRock concerning investment
advisory fees charged to other clients, such as institutional clients and
closed-end funds, under similar investment mandates, as well as the
performance of such other clients; (d) the impact of economies of
scale; (e) a summary of aggregate amounts paid by the Fund to
BlackRock; (f) sales and redemption data regarding the Fund’s shares;
and (g) an internal comparison of management fees classified by Lipper,
if applicable.
At an in-person meeting held on May 5, 2009, the Board reviewed
materials relating to its consideration of the Agreements. As a result of
the discussions that occurred during the May 5, 2009 meeting, the
Board presented BlackRock with questions and requests for additional
information and BlackRock responded to these requests with additional
written information in advance of the June 4 – 5, 2009 Board meeting.
30 BLACKROCK HIGH INCOME FUND SEPTEMBER 30, 2009
Disclosure of Investment Advisory Agreement and Sub-Advisory Agreement (continued)
At an in-person meeting held on June 4 – 5, 2009, the Fund’s Board,
including the Independent Board Members, unanimously approved the
continuation of the Advisory Agreement between the Manager and the
Fund and the Sub-Advisory Agreement between the Manager and the
Sub-Advisor with respect to the Fund, each for a one-year term ending
June 30, 2010. The Board considered all factors it believed relevant
with respect to the Fund, including, among other factors: (a) the nature,
extent and quality of the services provided by BlackRock; (b) the invest-
ment performance of the Fund and BlackRock portfolio management;
(c) the advisory fee and the cost of the services and profits to be real-
ized by BlackRock and certain affiliates from the relationship with the
Fund; (d) economies of scale; and (e) other factors.
The Board also considered other matters it deemed important to the
approval process, such as payments made to BlackRock or its affiliates
relating to the distribution of Fund shares, services related to the valua-
tion and pricing of Fund portfolio holdings, direct and indirect benefits
to BlackRock and its affiliates and significant shareholders from their
relationship with the Fund and advice from independent legal counsel
with respect to the review process and materials submitted for the
Board’s review. The Board noted the willingness of BlackRock personnel
to engage in open, candid discussions with the Board. The Board did not
identify any particular information as controlling, and each Board Member
may have attributed different weights to the various items considered.
A. Nature, Extent and Quality of the Services: The Board, including the
Independent Board Members, reviewed the nature, extent and quality
of services provided by BlackRock, including the investment advisory
services and the resulting performance of the Fund. Throughout the year,
the Board compared Fund performance to the performance of a com-
parable group of mutual funds, and the performance of a relevant
benchmark, if any. The Board met with BlackRock’s senior management
personnel responsible for investment operations, including the senior
investment officers. The Board also reviewed the materials provided by
the Fund’s portfolio management team discussing Fund performance
and the Fund’s investment objective, strategies and outlook.
The Board considered, among other factors, the number, education
and experience of BlackRock’s investment personnel generally and the
Fund’s portfolio management team, investments by portfolio managers
in the funds they manage, BlackRock’s portfolio trading capabilities,
BlackRock’s use of technology, BlackRock’s commitment to compliance
and BlackRock’s approach to training and retaining portfolio managers
and other research, advisory and management personnel. The Board
also reviewed a general description of BlackRock’s compensation struc-
ture with respect to the Fund’s portfolio management team and
BlackRock’s ability to attract and retain high-quality talent.
In addition to advisory services, the Board considered the quality of the
administrative and non-investment advisory services provided to the
Fund. BlackRock and its affiliates and significant shareholders provide
the Fund with certain administrative, transfer agency, shareholder and
other services (in addition to any such services provided to the Fund
by third parties) and officers and other personnel as are necessary for
the operations of the Fund. In addition to investment advisory services,
BlackRock and its affiliates provide the Fund with other services, includ-
ing (i) preparing disclosure documents, such as the prospectus, the
statement of additional information and periodic shareholder reports;
(ii) assisting with daily accounting and pricing; (iii) overseeing and
coordinating the activities of other service providers; (iv) organizing
Board meetings and preparing the materials for such Board meetings;
(v) providing legal and compliance support; and (vi) performing other
administrative functions necessary for the operation of the Fund, such
as tax reporting, fulfilling regulatory filing requirements, and call center
services. The Board reviewed the structure and duties of BlackRock’s
fund administration, accounting, legal and compliance departments
and considered BlackRock’s policies and procedures for assuring c
ompliance with applicable laws and regulations.
B. The Investment Performance of the Fund and BlackRock: The Board,
including the Independent Board Members, also reviewed and consid-
ered the performance history of the Fund. In preparation for the May 5,
2009 meeting, the Board was provided with reports, independently pre-
pared by Lipper, which included a comprehensive analysis of the Fund’s
performance. The Board also reviewed a narrative and statistical analysis
of the Lipper data that was prepared by BlackRock, which analyzed vari-
ous factors that affect Lipper’s rankings. In connection with its review,
the Board received and reviewed information regarding the investment
performance of the Fund as compared to a representative group of simi-
lar funds as determined by Lipper and to all funds in the Fund’s appli-
cable Lipper category. The Board was provided with a description of the
methodology used by Lipper to select peer funds. The Board regularly
reviews the performance of the Fund throughout the year. The Board
attaches more importance to performance over relatively long periods
of time, typically three to five years.
The Board noted that the Fund ranked in the fourth quartile against its
Lipper Performance Universe for each of the one-, three- and five-year
periods reported. The Board and BlackRock reviewed the reasons for the
Fund’s underperformance during these periods compared with its Peers.
The Board was informed that, among other things, exposure to bank
loans detracted from performance as significant underperformance of
bank loans in December caused the bank loan market to underperform
traditional high yield securities for the entire year. With regard to credit
quality, the Fund’s underweight to BB-rated securities also subtracted
BLACKROCK HIGH INCOME FUND SEPTEMBER 30, 2009 31
Disclosure of Investment Advisory Agreement and Sub-Advisory Agreement (continued)
from returns as higher quality non-investment grade securities outper-
formed lower quality securities. From a sector perspective, security
selection to the Paper and Automotive sectors and an underweight to
the Non-Captive Diversified Finance sector subtracted from perform-
ance. The Board also noted the enhancements made to BlackRock’s
Fixed Income Team and process. The Board and BlackRock discussed
BlackRock’s commitment to providing the resources necessary to assist
the portfolio managers and to improve the Fund’s performance.
C. Consideration of the Advisory Fees and the Cost of the Services
and Profits to be Realized by BlackRock and its Affiliates from their
Relationship with the Fund: The Board, including the Independent Board
Members, reviewed the Fund’s contractual advisory fee rates compared
with the other funds in its Lipper category. It also compared the Fund’s
total expenses, as well as actual management fees, to those of other
comparable funds. The Board considered the services provided and the
fees charged by BlackRock to other types of clients with similar invest-
ment mandates, including separately managed institutional accounts.
The Board received and reviewed statements relating to BlackRock’s
financial condition and profitability with respect to the services it
provided the Fund. The Board was also provided with a profitability
analysis that detailed the revenues earned and the expenses incurred
by BlackRock for services provided to the Fund. The Board reviewed
BlackRock’s profitability with respect to the Fund and other funds the
Board currently oversees for the year ended December 31, 2008 com-
pared to available aggregate profitability data provided for the year
ended December 31, 2007. The Board reviewed BlackRock’s profit-
ability with respect to other fund complexes managed by the Manager
and/or its affiliates. The Board reviewed BlackRock’s assumptions and
methodology of allocating expenses in the profitability analysis, noting
the inherent limitations in allocating costs among various advisory prod-
ucts. The Board recognized that profitability may be affected by numer-
ous factors including, among other things, fee waivers and expense
reimbursements by the Manager, the types of funds managed, expense
allocations and business mix, and therefore comparability of profitability
is somewhat limited.
The Board noted that, in general, individual fund or product line prof-
itability of other advisors is not publicly available. Nevertheless, to the
extent such information is available, the Board considered BlackRock’s
operating margin, in general, compared to the operating margin for lead-
ing investment management firms whose operations include advising
open-end funds, among other product types. The comparison indicated
that operating margins for BlackRock with respect to its registered funds
are generally consistent with margins earned by similarly situated pub-
licly traded competitors. In addition, the Board considered, among other
things, certain third party data comparing BlackRock’s operating margin
with that of other publicly-traded asset management firms, which con-
cluded that larger asset bases do not, in themselves, translate to higher
profit margins.
In addition, the Board considered the cost of the services provided to
the Fund by BlackRock, and BlackRock’s and its affiliates’ profits relat-
ing to the management and distribution of the Fund and the other funds
advised by BlackRock and its affiliates. As part of its analysis, the Board
reviewed BlackRock’s methodology in allocating its costs to the manage-
ment of the Fund. The Board also considered whether BlackRock has
the financial resources necessary to attract and retain high quality
investment management personnel to perform its obligations under
the Agreements and to continue to provide the high quality of services
that is expected by the Board.
The Board noted that the Fund’s contractual advisory fees, which do
not take into account any expense reimbursements or fee waivers, were
lower than or equal to the median contractual advisory fees paid by the
Fund’s Peers. The Board also noted that the Fund has an advisory fee
arrangement that includes breakpoints that adjust the fee rate down-
ward as the size of the aggregate assets of the Fund and the BlackRock
Total Return Fund, also a series of the Corporation, increase, thereby
allowing shareholders the potential to participate in economies of scale.
D. Economies of Scale: The Board, including the Independent Board
Members, considered the extent to which economies of scale might be
realized as the assets of the Fund increase and whether there should
be changes in the advisory fee rate or structure in order to enable the
Fund to participate in these economies of scale, for example through
the use of revised breakpoints in the advisory fee based upon the assets
of the Fund and the BlackRock Total Return Fund. The Board considered
that the funds in the BlackRock fund complex share some common
resources and, as a result, an increase in the overall size of the complex
could permit each fund to incur lower expenses than it would otherwise
as a stand-alone entity. The Board also considered BlackRock’s overall
operations and its efforts to expand the scale of, and improve the qual-
ity of, its operations.
E. Other Factors: The Board also took into account other ancillary or
“fall-out” benefits that BlackRock or its affiliates and significant share-
holders may derive from its relationship with the Fund, both tangible
and intangible, such as BlackRock’s ability to leverage its investment
professionals who manage other portfolios, an increase in BlackRock’s
profile in the investment advisory community, and the engagement of
BlackRock’s affiliates and significant shareholders as service providers
to the Fund, including for administrative, transfer agency and distribution
32 BLACKROCK HIGH INCOME FUND SEPTEMBER 30, 2009
Disclosure of Investment Advisory Agreement and Sub-Advisory Agreement (concluded)
services. The Board also noted that BlackRock may use third party
research obtained by soft dollars generated by certain mutual fund
transactions to assist itself in managing all or a number of its other
client accounts.
In connection with its consideration of the Agreements, the Board also
received information regarding BlackRock’s brokerage and soft dollar
practices. The Board received reports from BlackRock which included
information on brokerage commissions and trade execution practices
throughout the year.
Conclusion
The Board, including the Independent Board Members, unanimously
approved the continuation of the Advisory Agreement between the
Manager and the Fund for a one-year term ending June 30, 2010 and
the Sub-Advisory Agreement between the Manager and Sub-Advisor
with respect to the Fund for a one-year term ending June 30, 2010.
Based upon its evaluation of all these factors in their totality, the Board,
including the Independent Board Members, was satisfied that the terms
of the Agreements were fair and reasonable and in the best interest of
the Fund and its shareholders. In arriving at a decision to approve the
Agreements, the Board did not identify any single factor or group of fac-
tors as all-important or controlling, but considered all factors together,
and different Board Members may have attributed different weights to
the various factors considered. The Independent Board Members were
also assisted by the advice of independent legal counsel in making this
determination. The contractual fee arrangements for the Fund reflect the
results of several years of review by the Board Members and predeces-
sor Board Members, and discussions between such Board Members
(and predecessor Board Members) and BlackRock. Certain aspects of
the arrangements may be the subject of more attention in some years
than in others, and the Board Members’ conclusions may be based in
part on their consideration of these arrangements in prior years.
BLACKROCK HIGH INCOME FUND SEPTEMBER 30, 2009 33
| | | | | | |
| Officers and Directors | | | | | |
| | | | | | Number of BlackRock- | |
| | | | | | Advised Registered | |
| | | Length | | | Investment Companies | |
| | Position(s) | of Time | | | (“RICs”) Consisting of | |
| Name, Address | Held with | Served as | | | Investment Portfolios | Public |
| and Year of Birth | Fund | a Director2 | Principal Occupation(s) During Past 5 Years | | (“Portfolios”) Overseen | Directorships |
| Non-Interested Directors1 | | | | | |
| Robert M. Hernandez | Chairman of the | Since | Director, Vice Chairman and Chief Financial Officer of USX | 35 RICs consisting of | ACE Limited |
| 40 East 52nd Street | Board, Director | 2007 | Corporation (energy and steel business) from 1991 to 2001. | 101 Portfolios | (insurance company); |
| New York, NY 10022 | and Member of | | | | | Eastman Chemical |
| 1944 | the Audit | | | | | Company (chemical); |
| | Committee | | | | | RTI International |
| | | | | | | Metals, Inc. (metals); |
| | | | | | | TYCO Electronics |
| | | | | | | (electronics) |
| Fred G. Weiss | Vice Chairman | Since | Managing Director, FGW Associates (consulting and investment | 35 RICs consisting of | Watson |
| 40 East 52nd Street | of the Board, | 2007 | company) since 1997; Director, Michael J. Fox Foundation for | 101 Portfolios | Pharmaceutical Inc. |
| New York, NY 10022 | Director and | | Parkinson’s Research since 2000; Director, BTG International | | |
| 1941 | Member of the | | Plc (a global technology commercialization company) from | | |
| | Audit Committee | | 2001 to 2007. | | | |
| James H. Bodurtha | Director | Since | Director, The China Business Group, Inc. (consulting firm) since | 35 RICs consisting of | None |
| 40 East 52nd Street | | 2007 | 1996 and Executive Vice President thereof from 1996 to 2003; | 101 Portfolios | |
| New York, NY 10022 | | | Chairman of the Board, Berkshire Holding Corporation since 1980. | | |
| 1944 | | | | | | |
| Bruce R. Bond | Director | Since | Trustee and Member of the Governance Committee, State Street | 35 RICs consisting of | None |
| 40 East 52nd Street | | 2007 | Research Mutual Funds from 1997 to 2005; Board Member of | 101 Portfolios | |
| New York, NY 10022 | | | of Governance, Audit and Finance Committee, Avaya Inc. | | | |
| 1946 | | | (computer equipment) from 2003 to 2007. | | | |
| Donald W. Burton | Director | Since | Managing General Partner, The Burton Partnership, LP (an | | 35 RICs consisting of | Knology, Inc. (tele- |
| 40 East 52nd Street | | 2007 | investment partnership) since 1979; Managing General Partner, | 101 Portfolios | communications); |
| New York, NY 10022 | | | The South Atlantic Venture Funds since 1983; Member of the | | Capital Southwest |
| 1944 | | | Investment Advisory Council of the Florida State Board of | | | (financial) |
| | | | Administration from 2001 to 2007. | | | |
| Honorable | Director | Since | Partner and Head of International Practice, Covington and | 35 RICs consisting of | Alcatel-Lucent (tele- |
| Stuart E. Eizenstat | | 2007 | Burling (law firm) since 2001; International Advisory Board | 101 Portfolios | communications); |
| 40 East 52nd Street | | | Member, The Coca Cola Company since 2002; Advisory Board | | Global Specialty |
| New York, NY 10022 | | | Member, BT Americas (telecommunications) since 2004; | | | Metallurgical (metal- |
| 1943 | | | Member of the Board of Directors, Chicago Climate Exchange | | lurgical industry); |
| | | | (environmental) since 2006; Member of the International | | | UPS Corporation |
| | | | Advisory Board GML (energy) since 2003. | | | (delivery service) |
| Kenneth A. Froot | Director | Since | Professor, Harvard University since 1992. | | 35 RICs consisting of | None |
| 40 East 52nd Street | | 2007 | | | 101 Portfolios | |
| New York, NY 10022 | | | | | | |
| 1957 | | | | | | |
| John F. O’Brien | Director | Since | Trustee, Woods Hole Oceanographic Institute since 2003; | | 35 RICs consisting of | Cabot Corporation |
| 40 East 52nd Street | | 2007 | Director, Allmerica Financial Corporation from 1995 to 2003; | 101 Portfolios | (chemicals); LKQ |
| New York, NY 10022 | | | Director, ABIOMED from 1989 to 2006; Director, Ameresco, Inc. | | Corporation (auto |
| 1943 | | | (energy solutions company) from 2006 to 2007. | | | parts manufacturing); |
| | | | | | | TJX Companies, Inc. |
| | | | | | | (retailer) |
| Roberta Cooper Ramo | Director | Since | Shareholder, Modrall, Sperling, Roehl, Harris & Sisk, P.A. (law | 35 RICs consisting of | None |
| 40 East 52nd Street | | 2007 | firm) since 1993; Chairman of the Board, Cooper’s Inc., (retail) | 101 Portfolios | |
| New York, NY 10022 | | | since 2000; Director of ECMC Group (service provider to | | | |
| 1942 | | | students, schools and lenders) since 2001; President, The | | |
| American Law Institute, (non-profit) since 2008; President, |
| | | | American Bar Association from 1995 to 1996. | | | |
| 34 | BLACKROCK HIGH INCOME FUND | SEPTEMBER 30, 2009 | |
| | | | | |
| Officers and Directors (continued) | | |
| | | | | Number of BlackRock- | |
| | | | | Advised Registered | |
| | | Length | | Investment Companies | |
| | Position(s) | of Time | | (“RICs”) Consisting of | |
| Name, Address | Held with | Served as | | Investment Portfolios | Public |
| and Year of Birth | Fund | a Director2 | Principal Occupation(s) During Past 5 Years | (“Portfolios”) Overseen | Directorships |
| Non-Interested Directors1 (concluded) | | | | |
| David H. Walsh | Director | Since | Director, National Museum of Wildlife Art since 2007; Director, | 35 RICs consisting of | None |
| 40 East 52nd Street | | 2007 | Ruckleshaus Institute and Haub School of Natural Resources | 101 Portfolios | |
| New York, NY 10022 | | | at the University of Wyoming from 2006 to 2008; Trustee, | | |
| 1941 | | | University of Wyoming Foundation since 2008; Director, The | | |
| American Museum of Fly Fishing since 1997; Director, The |
| | | | National Audubon Society from 1998 to 2005. | | |
| Richard R. West | Director | Since | Dean Emeritus, New York University’s Leonard N. Stern School | 35 RICs consisting of | Bowne & Co., Inc. |
| 40 East 52nd Street | and Member | 1980 | of Business Administration since 1995. | 101 Portfolios | (financial printers); |
| New York, NY 10022 | of the Audit | | | | Vornado Realty Trust |
| 1938 | Committee | | | | (real estate |
| | | | | | company); |
| | | | | | Alexander’s Inc. |
| | | | | | (real estate |
| | | | | | company) |
| | 1 Directors serve until their resignation, removal or death, or until December 31 of the year in which they turn 72. | |
| | 2 Date shown is the earliest date a person has served as a director for the Fund covered by this annual report. Following the combination of Merrill |
| | Lynch Investment Managers, L.P. (“MLIM”) and BlackRock, Inc. (“BlackRock”) in September 2006, the various legacy MLIM and legacy BlackRock |
| | Fund boards were realigned and consolidated into three new Fund boards in 2007. As a result, although the chart shows certain directors as joining |
| | the Fund’s board in 2007, each director first became a member of the board of other legacy MLIM or legacy BlackRock Funds as follows: James H. |
| | Bodurtha, 1995; Bruce R. Bond, 2005; Donald W. Burton, 2002; Stuart E. Eizenstat, 2001; Kenneth A. Froot, 2005; Robert M. Hernandez, 1996; |
| | John F. O’Brien, 2004; Roberta Cooper Ramo, 2000; David H. Walsh, 2003; Fred G. Weiss, 1998; and Richard R. West, 1978. | |
| Interested Directors3 | | | | | |
| Richard S. Davis | Director | Since | Managing Director, BlackRock, Inc. since 2005; Chief Executive | 172 RICs consisting of | None |
| 40 East 52nd Street | | 2007 | Officer, State Street Research & Management Company from | 283 Portfolios | |
| New York, NY 10022 | | | 2000 to 2005; Chairman of the Board of Trustees, State Street | | |
| 1945 | | | Research Mutual Funds from 2000 to 2005; Chairman, SSR | | |
| | | | Realty from 2000 to 2004. | | |
| Laurence D. Fink | Director | Since | Chairman and Chief Executive Officer of BlackRock, Inc. since its | 35 RICs consisting of | None |
| 40 East 52nd Street | | 2007 | formation in 1998 and of BlackRock, Inc.’s predecessor entities | 101 Portfolios | |
| New York, NY 10022 | | | since 1988 and Chairman of the Executive and Management | | |
| 1952 | | | Committees; Formerly Managing Director, The First Boston Corp- | | |
| oration, Member of its Management Committee, Co-head of its |
| | | | Taxable Fixed Income Division and Head of its Mortgage and Real | | |
| Estate Products Group; Chairman of the Board of several of |
| | | | BlackRock’s alternative investment vehicles; Director of several of | | |
| | | | BlackRock’s offshore funds; Member of the Board of Trustees of | | |
| | | | New York University, Chair of the Financial Affairs Committee and | | |
| | | | a member of the Executive Committee, the Ad Hoc Committee on | | |
| | | | Board Governance, and the Committee on Trustees; Co-Chairman | | |
| of the NYU Hospitals Center Board of Trustees, Chairman of the |
| Development/Trustee Stewardship Committee and Chairman of |
| the Finance Committee; Trustee, The Boys’ Club of New York. |
|
| Henry Gabbay | Director | Since | Consultant, BlackRock, Inc. from 2007 to 2008; Managing | 172 RICs consisting of | None |
| 40 East 52nd Street | | 2007 | Director, BlackRock, Inc. from 1989 to 2007; Chief | 283 Portfolios | |
| New York, NY 10022 | | | Administrative Officer, BlackRock Advisors, LLC from 1998 to | | |
| 1947 | | | 2007; President of BlackRock Funds and BlackRock Bond | | |
| Allocation Target Shares from 2005 to 2007 and Treasurer of |
| certain closed-end funds in the BlackRock fund complex from |
| | | | 1989 to 2006. | | |
| | 3 Messrs. Davis and Fink are both “interested persons,” as defined in the Investment Company Act of 1940, of the Fund based on their positions with |
| | BlackRock, Inc. and its affiliates. Mr. Gabbay is an “interested person” of the Fund based on his former positions with BlackRock, Inc. and its affiliates |
| | as well as his ownership of BlackRock, Inc. and PNC securities. Directors serve until their resignation, removal or death, or until December 31 of the |
| | year in which they turn 72. | | | |
| | BLACKROCK HIGH INCOME FUND | SEPTEMBER 30, 2009 | 35 |
| | | | | | | |
| Officers and Directors (concluded) | | | |
| | Position(s) | | | | | |
| Name, Address | Held with | Length of | | | | |
| and Year of Birth | Fund | Time Served Principal Occupation(s) During Past 5 Years | | |
| Fund Officers1 | | | | | | | |
| Anne F. Ackerley | President | Since | Managing Director of BlackRock, Inc. since 2000; Vice President of the BlackRock-advised funds from 2007 to |
| 40 East 52nd Street | and Chief | 2009 | 2009; Chief Operating Officer of BlackRock’s Global Client Group (GCG) since 2009; Chief Operating Officer |
| New York, NY 10022 | Executive | | of BlackRock’s U.S. Retail Group from 2006 to 2009; Head of BlackRock’s Mutual Fund Group from 2000 |
| 1962 | Officer | | to 2006. | | | |
| Jeffrey Holland, CFA | Vice | Since | Director of BlackRock, Inc. since 2006; Chief Operating Officer of BlackRock’s U.S. Retail Group since 2009; |
| 40 East 52nd Street | President | 2009 | Co-head of Product Development and Management for BlackRock’s U.S. Retail Group from 2007 to 2009; |
| New York, NY 10022 | | | | Product Manager of Raymond James & Associates from 2003 to 2006. | |
| 1971 | | | | | | | |
| Brendan Kyne | Vice | Since | Director of BlackRock, Inc. since 2008; Head of Product Development and Management for BlackRock’s U.S. |
| 40 East 52nd Street | President | 2009 | Retail Group since 2009, co-head thereof from 2007 to 2009; Vice President of BlackRock, Inc. from 2005 to |
| New York, NY 10022 | | | | 2008; Associate of BlackRock, Inc. from 2002 to 2004. | |
| 1977 | | | | | | | |
| Brian Schmidt | Vice | Since | Managing Director of BlackRock, Inc. since 2004; Various positions with U.S. Trust Company from 1991 to 2003 |
| 40 East 52nd Street | President | 2009 | including Director from 2001 to 2003 and Senior Vice President from 1998 to 2003; Vice President, Chief Financial |
| New York, NY 10022 | | | | Officer and Treasurer of Excelsior Funds, Inc., Excelsior Tax-Exempt Funds, Inc. and Excelsior Funds Trust from 2001 |
| 1958 | | | | to 2003. | | | |
| Neal J. Andrews | Chief | Since | Managing Director of BlackRock, Inc. since 2006; Senior Vice President and Line of Business Head of Fund |
| 40 East 52nd Street | Financial | 2007 | Accounting and Administration at PNC Global Investment Servicing (U.S.) Inc. from 1992 to 2006. |
| New York, NY 10022 | Officer | | | | | |
| 1966 | | | | | | | |
| Jay M. Fife | Treasurer | Since | Managing Director of BlackRock, Inc. since 2007 and Director in 2006; Assistant Treasurer of the Merrill Lynch |
| 40 East 52nd Street | | | 2007 | Investment Managers, L.P. (“MLIM”) and Fund Asset Management, L.P. advised funds from 2005 to 2006; Director |
| New York, NY 10022 | | | | of MLIM Fund Services Group from 2001 to 2006. | | |
| 1970 | | | | | | | |
| Brian P. Kindelan | Chief | Since | Chief Compliance Officer of the BlackRock-advised funds since 2007; Managing Director and Senior Counsel of |
| 40 East 52nd Street | Compliance | 2007 | BlackRock, Inc. since 2005; Director and Senior Counsel of BlackRock Advisors, Inc. from 2001 to 2004. |
| New York, NY 10022 | Officer | | | | | |
| 1959 | | | | | | | |
| Howard B. Surloff | Secretary | Since | Managing Director of BlackRock, Inc. and General Counsel of U.S. Funds at BlackRock, Inc. since 2006; General |
| 40 East 52nd Street | | | 2007 | Counsel (U.S.) of Goldman Sachs Asset Management, L.P. from 1993 to 2006. | |
| New York, NY 10022 | | | | | | | |
| 1965 | | | | | | | |
| | 1 Officers of the Fund serve at the pleasure of the Board. | | | |
| | Further information about the Fund’s Officers and Directors is available in the Fund’s Statement of Additional Information, which can be obtained |
| | without charge by calling (800) 441-7762. | | | |
| Investment Advisor | | Custodian | | Transfer Agent | Accounting Agent | Independent Registered | Legal Counsel |
| BlackRock Advisors, LLC | State Street Bank | PNC Global Investment | State Street Bank | Public Accounting Firm | Willkie Farr & Gallagher LLP |
| Wilmington, DE 19809 | and Trust Company | Servicing (U.S.) Inc. | and Trust Company | Deloitte & Touche LLP | New York, NY 10019 |
| Sub-Advisor | | Boston, MA 02101 | Wilmington, DE 19809 | Princeton, NJ 08540 | Princeton, NJ 08540 | Address of the Fund |
| BlackRock Financial | | | | | Distributor | | 100 Bellevue Parkway |
| Management, Inc. | | | | | BlackRock Investments, LLC | Wilmington, DE 19809 |
| New York, NY 10022 | | | | | New York, NY 10022 | | |
Effective July 31, 2009, Donald C. Burke, President and Chief Executive Officer of the Fund, retired. The Fund’s Board wishes
Mr. Burke well in his retirement.
Effective August 1, 2009, Anne F. Ackerley became President and Chief Executive Officer of the Fund, and Jeffrey Holland and Brian
Schmidt became Vice Presidents of the Fund.
Effective August 1, 2009, Jean Margo Reid resigned as a Director of the Fund. The Board wishes Ms. Reid well in her future endeavors.
Effective September 9, 2009, Brendan Kyne became a Vice President of the Fund.
36 BLACKROCK HIGH INCOME FUND SEPTEMBER 30, 2009
Additional Information
General Information
Electronic Delivery
Electronic copies of most financial reports and prospectuses are available
on the Fund’s website or shareholders can sign up for e-mail notifications
of quarterly statements, annual and semi-annual reports and prospec-
tuses by enrolling in the Fund’s electronic delivery program.
To enroll:
Shareholders Who Hold Accounts with Investment Advisors, Banks or
Brokerages:
Please contact your financial advisor. Please note that not all investment
advisors, banks or brokerages may offer this service.
Shareholders Who Hold Accounts Directly with BlackRock:
1) Access the BlackRock website at
http://www.blackrock.com/edelivery
2) Click on the applicable link and follow the steps to sign up
3) Log into your account
Availability of Proxy Voting Policies and Procedures
A description of the policies and procedures that the Fund uses to
determine how to vote proxies relating to portfolio securities is available
(1) without charge, upon request, by calling toll-free (800) 441-7762;
(2) at www.blackrock.com; and (3) on the Securities and Exchange
Commission’s (the “SEC”) website at http://www.sec.gov.
Householding
The Fund will mail only one copy of shareholder documents, including
prospectuses, annual and semi-annual reports and proxy statements, to
shareholders with multiple accounts at the same address. This practice is
commonly called “householding” and it is intended to reduce expenses
and eliminate duplicate mailings of shareholder documents. Mailings of
your shareholder documents may be householded indefinitely unless you
instruct us otherwise. If you do not want the mailing of these documents
to be combined with those for other members of your household, please
contact the Fund at (800) 441-7762.
Availability of Proxy Voting Record
Information about how the Fund votes proxies relating to securities
held in the Fund’s portfolio during the most recent 12-month period
ended June 30 is available upon request and without charge (1) at
www.blackrock.com or by calling (800) 441-7762 and (2) on the
SEC’s website at http://www.sec.gov.
Availability of Quarterly Portfolio Schedule
The Fund files its complete schedule of portfolio holdings with the SEC
for the first and third quarters of each fiscal year on Form N-Q. The Fund’s
Forms N-Q are available on the SEC’s website at http://www.sec.gov
and may also be reviewed and copied at the SEC’s Public Reference
Room in Washington, D.C. Information on the operation of the Public
Reference Room may be obtained by calling (202) 551-8090. The
Fund’s Forms N-Q may also be obtained upon request and without
charge by calling (800) 441-7762.
BLACKROCK HIGH INCOME FUND SEPTEMBER 30, 2009 37
Additional Information (concluded)
Shareholder Privileges
Account Information
Call us at (800) 441-7762 8:00 AM to 6:00 PM EST on any business day to
get information about your account balances, recent transactions and share
prices. You can also reach us on the Web at www.blackrock.com/funds.
Automatic Investment Plans
Investor Class shareholders who want to invest regularly can arrange to
have $50 or more automatically deducted from their checking or savings
account and invested in any of the BlackRock funds.
Systematic Withdrawal Plans
Investor Class shareholders can establish a systematic withdrawal plan
and receive periodic payments of $50 or more from their BlackRock
funds, as long as their account is at least $10,000.
Retirement Plans
Shareholders may make investments in conjunction with Traditional,
Rollover, Roth, Coverdell, Simple IRAs, SEP IRAs and 403(b) Plans.
BlackRock Privacy Principles
BlackRock is committed to maintaining the privacy of its current and
former fund investors and individual clients (collectively, “Clients”) and
to safeguarding their non-public personal information. The following
information is provided to help you understand what personal informa-
tion BlackRock collects, how we protect that information and why in cer-
tain cases we share such information with select parties.
If you are located in a jurisdiction where specific laws, rules or regula-
tions require BlackRock to provide you with additional or different
privacy-related rights beyond what is set forth below, then BlackRock
will comply with those specific laws, rules or regulations.
BlackRock obtains or verifies personal non-public information from and
about you from different sources, including the following: (i) information
we receive from you or, if applicable, your financial intermediary, on
applications, forms or other documents; (ii) information about your
transactions with us, our affiliates, or others; (iii) information we receive
from a consumer reporting agency; and (iv) from visits to our websites.
BlackRock does not sell or disclose to non-affiliated third parties any
non-public personal information about its Clients, except as permitted
by law or as is necessary to respond to regulatory requests or to service
Client accounts. These non-affiliated third parties are required to protect
the confidentiality and security of this information and to use it only for
its intended purpose.
We may share information with our affiliates to service your account or
to provide you with information about other BlackRock products or serv-
ices that may be of interest to you. In addition, BlackRock restricts
access to non-public personal information about its Clients to those
BlackRock employees with a legitimate business need for the informa-
tion. BlackRock maintains physical, electronic and procedural safeguards
that are designed to protect the non-public personal information of its
Clients, including procedures relating to the proper storage and disposal
of such information.
38 BLACKROCK HIGH INCOME FUND SEPTEMBER 30, 2009
| | | |
| A World-Class Mutual Fund Family | | |
| BlackRock offers a diverse lineup of open-end mutual funds crossing all investment styles and managed by experts in equity, fixed income and | |
| tax-exempt investing. | | | |
| Equity Funds | | | |
| BlackRock All-Cap Energy & Resources Portfolio | BlackRock Global Opportunities Portfolio | BlackRock Mid-Cap Value Equity Portfolio | |
| BlackRock Asset Allocation Portfolio† | BlackRock Global SmallCap Fund | BlackRock Mid Cap Value Opportunities Fund |
| BlackRock Aurora Portfolio | BlackRock Health Sciences Opportunities Portfolio | BlackRock Natural Resources Trust | |
| BlackRock Balanced Capital Fund† | BlackRock Healthcare Fund | BlackRock Pacific Fund | |
| BlackRock Basic Value Fund | BlackRock Index Equity Portfolio* | BlackRock Science & Technology | |
| BlackRock Capital Appreciation Portfolio | BlackRock International Fund | Opportunities Portfolio | |
| BlackRock Energy & Resources Portfolio | BlackRock International Diversification Fund | BlackRock Small Cap Core Equity Portfolio | |
| BlackRock Equity Dividend Fund | BlackRock International Index Fund | BlackRock Small Cap Growth Equity Portfolio |
| BlackRock EuroFund | BlackRock International Opportunities Portfolio | BlackRock Small Cap Growth Fund II | |
| BlackRock Focus Growth Fund | BlackRock International Value Fund | BlackRock Small Cap Index Fund | |
| BlackRock Focus Value Fund | BlackRock Large Cap Core Fund | BlackRock Small Cap Value Equity Portfolio | |
| BlackRock Fundamental Growth Fund | BlackRock Large Cap Core Plus Fund | BlackRock Small/Mid-Cap Growth Portfolio | |
| BlackRock Global Allocation Fund† | BlackRock Large Cap Growth Fund | BlackRock S&P 500 Index Fund | |
| BlackRock Global Dynamic Equity Fund | BlackRock Large Cap Value Fund | BlackRock U.S. Opportunities Portfolio | |
| BlackRock Global Emerging Markets Fund | BlackRock Latin America Fund | BlackRock Utilities and Telecommunications Fund |
| BlackRock Global Financial Services Fund | BlackRock Mid-Cap Growth Equity Portfolio | BlackRock Value Opportunities Fund | |
| BlackRock Global Growth Fund | | | |
| Fixed Income Funds | | | |
| BlackRock Bond Portfolio | BlackRock Income Builder Portfolio† | BlackRock Managed Income Portfolio | |
| BlackRock Emerging Market Debt Portfolio | BlackRock Inflation Protected Bond Portfolio | BlackRock Short-Term Bond Fund | |
| BlackRock GNMA Portfolio | BlackRock Intermediate Government | BlackRock Strategic Income Portfolio | |
| BlackRock Government Income Portfolio | Bond Portfolio | BlackRock Total Return Fund | |
| BlackRock High Income Fund | BlackRock International Bond Portfolio | BlackRock Total Return Portfolio II | |
| BlackRock High Yield Bond Portfolio | BlackRock Long Duration Bond Portfolio | BlackRock World Income Fund | |
| BlackRock Income Portfolio† | BlackRock Low Duration Bond Portfolio | | |
| Municipal Bond Funds | | | |
| BlackRock AMT-Free Municipal Bond Portfolio | BlackRock Kentucky Municipal Bond Portfolio | BlackRock New York Municipal Bond Fund | |
| BlackRock California Municipal Bond Fund | BlackRock Municipal Insured Fund | BlackRock Ohio Municipal Bond Portfolio | |
| BlackRock Delaware Municipal Bond Portfolio | BlackRock National Municipal Fund | BlackRock Pennsylvania Municipal Bond Fund |
| BlackRock High Yield Municipal Fund | BlackRock New Jersey Municipal Bond Fund | BlackRock Short-Term Municipal Fund | |
| BlackRock Intermediate Municipal Fund | | | |
| Target Risk & Target Date Funds | | | |
| BlackRock Prepared Portfolios | BlackRock Lifecycle Prepared Portfolios | | |
| Conservative Prepared Portfolio | Prepared Portfolio 2010 | Prepared Portfolio 2030 | |
| Moderate Prepared Portfolio | Prepared Portfolio 2015 | Prepared Portfolio 2035 | |
| Growth Prepared Portfolio | Prepared Portfolio 2020 | Prepared Portfolio 2040 | |
| Aggressive Growth Prepared Portfolio | Prepared Portfolio 2025 | Prepared Portfolio 2045 | |
| | | Prepared Portfolio 2050 | |
| * See the prospectus for information on specific limitations on investments in the fund. | | |
| † Mixed asset fund. | | | |
| BlackRock mutual funds are currently distributed by BlackRock Investments, LLC. You should consider the investment objectives, risks, charges and |
| expenses of the funds under consideration carefully before investing. Each fund’s prospectus contains this and other information and is available at |
| www.blackrock.com or by calling (800) 441-7762 or from your financial advisor. The prospectus should be read carefully before investing. | |
| BLACKROCK HIGH INCOME FUND | SEPTEMBER 30, 2009 | 39 |
This report is not authorized for use as an offer to buy shares of
the Fund unless accompanied or preceded by the Fund’s current
prospectus. Past performance results shown in this report should
not be considered a representation of future performance.
Investment returns and principal value of shares will fluctuate
so that shares, when redeemed, may be worth more or less than
their original cost. Statements and other information herein are
as dated and are subject to change.
#10251-2-9/09

Item 2 – Code of Ethics – The registrant (or the “Fund”) has adopted a code of ethics, as of the end of the
period covered by this report, applicable to the registrant’s principal executive officer, principal
financial officer and principal accounting officer, or persons performing similar functions. During
the period covered by this report, there have been no amendments to or waivers granted under the
code of ethics. A copy of the code of ethics is available without charge at www.blackrock.com.
Item 3 – Audit Committee Financial Expert – The registrant’s board of directors or trustees, as applicable
(the “board of directors”) has determined that (i) the registrant has the following audit committee
financial experts serving on its audit committee and (ii) each audit committee financial expert is
independent:
Robert M. Hernandez
Fred G. Weiss
Richard R. West
Under applicable securities laws, a person determined to be an audit committee financial expert will
not be deemed an “expert” for any purpose, including without limitation for the purposes of Section
11 of the Securities Act of 1933, as a result of being designated or identified as an audit committee
financial expert. The designation or identification as an audit committee financial expert does not
impose on such person any duties, obligations, or liabilities greater than the duties, obligations, and
liabilities imposed on such person as a member of the audit committee and board of directors in the
absence of such designation or identification.
Item 4 – Principal Accountant Fees and Services
| | | | | | | | |
| | (a) Audit Fees | (b) Audit-Related Fees1 | (c) Tax Fees2 | (d) All Other Fees3 |
| | Current | Previous | Current | Previous | Current | Previous | Current | Previous |
| | Fiscal Year | Fiscal Year | Fiscal Year | Fiscal Year | Fiscal Year | Fiscal Year | Fiscal Year | Fiscal Year |
| Entity Name | End | End | End | End | End | End | End | End |
| BlackRock High | | | | | | | | |
| Income Fund of | | | | | | | | |
| BlackRock Bond | $39,300 | $36,300 | $0 | $0 | $6,100 | $6,100 | $1,028 | $1,049 |
| Fund, Inc. | | | | | | | | |
| 1 The nature of the services include assurance and related services reasonably related to the performance of the audit of financial |
| statements not included in Audit Fees. | | | | | | |
| 2 The nature of the services include tax compliance, tax advice and tax planning. | | | |
| 3 The nature of the services include a review of compliance procedures and attestation thereto. | | |
(e)(1) Audit Committee Pre-Approval Policies and Procedures:
The registrant’s audit committee (the “Committee”) has adopted policies and procedures with
regard to the pre-approval of services. Audit, audit-related and tax compliance services provided to
the registrant on an annual basis require specific pre-approval by the Committee. The Committee
also must approve other non-audit services provided to the registrant and those non-audit services
provided to the registrant’s affiliated service providers that relate directly to the operations and the
financial reporting of the registrant. Certain of these non-audit services that the Committee believes
are a) consistent with the SEC’s auditor independence rules and b) routine and recurring services
that will not impair the independence of the independent accountants may be approved by the
Committee without consideration on a specific case-by-case basis (“general pre-approval”). The
term of any general pre-approval is 12 months from the date of the pre-approval, unless the
Committee provides for a different period. Tax or other non-audit services provided to the registrant
which have a direct impact on the operation or financial reporting of the registrant will only be
deemed pre-approved provided that any individual project does not exceed $10,000 attributable to
the registrant or $50,000 for all of the registrants the Committee oversees. For this purpose,
multiple projects will be aggregated to determine if they exceed the previously mentioned cost
levels.
Any proposed services exceeding the pre-approved cost levels will require specific pre-
approval by the Committee, as will any other services not subject to general pre-approval (e.g.,
unanticipated but permissible services). The Committee is informed of each service approved
subject to general pre-approval at the next regularly scheduled in-person board meeting. At this
meeting, an analysis of such services is presented to the Committee for ratification. The Committee
may delegate to one or more of its members the authority to approve the provision of and fees for
any specific engagement of permitted non-audit services, including services exceeding pre-approved
cost levels.
(e)(2) None of the services described in each of Items 4(b) through (d) were approved by the audit
committee pursuant to paragraph (c)(7)(i)(C) of Rule 2-01 of Regulation S-X.
(f) Not Applicable
(g) Affiliates’ Aggregate Non-Audit Fees:
| | |
| | Current Fiscal Year | Previous Fiscal Year |
| Entity Name | End | End |
| BlackRock High Income Fund | | |
| of BlackRock Bond Fund, Inc. | $414,628 | $412,149 |
(h) The registrant’s audit committee has considered and determined that the provision of non-audit
services that were rendered to the registrant’s investment adviser (not including any non-affiliated
sub-adviser whose role is primarily portfolio management and is subcontracted with or overseen by
the registrant’s investment adviser), and any entity controlling, controlled by, or under common
control with the investment adviser that provides ongoing services to the registrant that were not
pre-approved pursuant to paragraph (c)(7)(ii) of Rule 2-01 of Regulation S-X is compatible with
maintaining the principal accountant’s independence.
Regulation S-X Rule 2-01(c)(7)(ii) – $407,500, 0%
Item 5 – Audit Committee of Listed Registrants – Not Applicable
Item 6 – Investments
(a) The registrant’s Schedule of Investments is included as part of the Report to Stockholders filed
under Item 1 of this form.
(b) Not Applicable due to no such divestments during the semi-annual period covered since the
previous Form N-CSR filing.
Item 7 – Disclosure of Proxy Voting Policies and Procedures for Closed-End Management Investment
Companies – Not Applicable
Item 8 – Portfolio Managers of Closed-End Management Investment Companies – Not Applicable
Item 9 – Purchases of Equity Securities by Closed-End Management Investment Company and Affiliated
Purchasers – Not Applicable
Item 10 – Submission of Matters to a Vote of Security Holders – The registrant’s Nominating and
Governance Committee will consider nominees to the board of directors recommended by
shareholders when a vacancy becomes available. Shareholders who wish to recommend a nominee
should send nominations that include biographical information and set forth the qualifications of the
proposed nominee to the registrant’s Secretary. There have been no material changes to these
procedures.
Item 11 – Controls and Procedures
11(a) – The registrant’s principal executive and principal financial officers or persons performing similar
functions have concluded that the registrant’s disclosure controls and procedures (as defined in Rule
30a-3(c) under the Investment Company Act of 1940, as amended (the “1940 Act”)) are effective as
of a date within 90 days of the filing of this report based on the evaluation of these controls and
procedures required by Rule 30a-3(b) under the 1940 Act and Rule 15(d)-15(b) under the Securities
Exchange Act of 1934, as amended.
11(b) – There were no changes in the registrant’s internal control over financial reporting (as defined in
Rule 30a-3(d) under the 1940 Act) that occurred during the second fiscal quarter of the period
covered by this report that have materially affected, or are reasonably likely to materially affect, the
registrant’s internal control over financial reporting.
Item 12 – Exhibits attached hereto
12(a)(1) – Code of Ethics – See Item 2
12(a)(2) – Certifications – Attached hereto
12(a)(3) – Not Applicable
12(b) – Certifications – Attached hereto
Pursuant to the requirements of the Securities Exchange Act of 1934 and the Investment Company
Act of 1940, the registrant has duly caused this report to be signed on its behalf by the undersigned,
thereunto duly authorized.
BlackRock High Income Fund of BlackRock Bond Fund, Inc.
By: /s/ Anne F. Ackerley
Anne F. Ackerley
Chief Executive Officer of
BlackRock High Income Fund of BlackRock Bond Fund, Inc.
Date: November 20, 2009
Pursuant to the requirements of the Securities Exchange Act of 1934 and the Investment Company
Act of 1940, this report has been signed below by the following persons on behalf of the registrant
and in the capacities and on the dates indicated.
By: /s/ Anne F. Ackerley
Anne F. Ackerley
Chief Executive Officer (principal executive officer) of
BlackRock High Income Fund of BlackRock Bond Fund, Inc.
Date: November 20, 2009
By: /s/ Neal J. Andrews
Neal J. Andrews
Chief Financial Officer (principal financial officer) of
BlackRock High Income Fund of BlackRock Bond Fund, Inc.
Date: November 20, 2009