UNITED STATES
SECURITIES AND EXCHANGE COMMISSION
Washington, D.C. 20549
FORM N-CSR
CERTIFIED SHAREHOLDER REPORT OF REGISTERED
MANAGEMENT INVESTMENT COMPANIES
Investment Company Act file number 811-2861
Fidelity Money Market Trust
(Exact name of registrant as specified in charter)
82 Devonshire St., Boston, Massachusetts 02109
(Address of principal executive offices) (Zip code)
Scott C. Goebel, Secretary
82 Devonshire St.
Boston, Massachusetts 02109
(Name and address of agent for service)
Registrant's telephone number, including area code: 617-563-7000
Date of fiscal year end: | August 31 |
| |
Date of reporting period: | February 28, 2010 |
Item 1. Reports to Stockholders
Fidelity
Money Market Trust
Retirement Government
Money Market Portfolio
Semiannual Report
February 28, 2010
(2_fidelity_logos) (Registered_Trademark)
Contents
Shareholder Expense Example | <Click Here> | An example of shareholder expenses. |
Investment Changes | <Click Here> | A summary of major shifts in the fund's investments over the past six months. |
Investments | <Click Here> | A complete list of the fund's investments. |
Financial Statements | <Click Here> | Statements of assets and liabilities, operations, and changes in net assets, as well as financial highlights. |
Notes | <Click Here> | Notes to the financial statements. |
Board Approval of Investment Advisory Contracts and Management Fees | <Click Here> | |
To view a fund's proxy voting guidelines and proxy voting record for the 12-month period ended June 30, visit http://www.fidelity.com/proxyvotingresults or visit the Securities and Exchange Commission's (SEC) web site at http://www.sec.gov. You may also call 1-800-544-8544 to request a free copy of the proxy voting guidelines.
Standard & Poor's, S&P and S&P 500 are registered service marks of The McGraw-Hill Companies, Inc. and have been licensed for use by Fidelity Distributors Corporation.
Other third party marks appearing herein are the property of their respective owners.
All other marks appearing herein are registered or unregistered trademarks or service marks of FMR LLC or an affiliated company.
The fund seeks to obtain as high a level of current income as is consistent with the preservation of capital and liquidity by investing in high-quality, short-term money market securities issued or guaranteed as to principal and interest by the U.S. Government, or by any of its agencies or instrumentalities.
Investments in the fund are neither insured nor guaranteed by the U.S. Government, and there can be no assurance that the fund will maintain a stable $1.00 share price.
This report and the financial statements contained herein are submitted for the general information of the shareholders of the fund. This report is not authorized for distribution to prospective investors in the fund unless preceded or accompanied by an effective prospectus.
A fund files its complete schedule of portfolio holdings with the SEC for the first and third quarters of each fiscal year on Form N-Q. Forms N-Q are available on the SEC's web site at http://www.sec.gov. A fund's Forms N-Q may be reviewed and copied at the SEC's Public Reference Room in Washington, DC. Information regarding the operation of the SEC's Public Reference Room may be obtained by calling 1-800-SEC-0330. For a complete list of a fund's portfolio holdings, view the most recent holdings listing, semiannual report, or annual report on Fidelity's web site at http://www.fidelity.com or http://www.advisor.fidelity.com, as applicable.
NOT FDIC INSURED · MAY LOSE VALUE · NO BANK GUARANTEE
Neither the fund nor Fidelity Distributors Corporation is a bank.
Semiannual Report
Shareholder Expense Example
As a shareholder of the Fund, you incur two types of costs: (1) transaction costs, and (2) ongoing costs, including management fees and other Fund expenses. This Example is intended to help you understand your ongoing costs (in dollars) of investing in the Fund and to compare these costs with the ongoing costs of investing in other mutual funds.
The Example is based on an investment of $1,000 invested at the beginning of the period and held for the entire period (September 1, 2009 to February 28, 2010).
Actual Expenses
The first line of the accompanying table provides information about actual account values and actual expenses. You may use the information in this line, together with the amount you invested, to estimate the expenses that you paid over the period. Simply divide your account value by $1,000.00 (for example, an $8,600 account value divided by $1,000.00 = 8.6), then multiply the result by the number in the first line under the heading entitled "Expenses Paid During Period" to estimate the expenses you paid on your account during this period.
Hypothetical Example for Comparison Purposes
The second line of the accompanying table provides information about hypothetical account values and hypothetical expenses based on the Fund's actual expense ratio and an assumed rate of return of 5% per year before expenses, which is not the Fund's actual return. The hypothetical account values and expenses may not be used to estimate the actual ending account balance or expenses you paid for the period. You may use this information to compare the ongoing costs of investing in the Fund and other funds. To do so, compare this 5% hypothetical example with the 5% hypothetical examples that appear in the shareholder reports of the other funds.
Please note that the expenses shown in the table are meant to highlight your ongoing costs only and do not reflect any transaction costs. Therefore, the second line of the table is useful in comparing ongoing costs only, and will not help you determine the relative total costs of owning different funds.
| Annualized
Expense Ratio | Beginning
Account Value
September 1, 2009 | Ending
Account Value
February 28, 2010 | Expenses Paid
During Period*
September 1, 2009
to February 28, 2010 |
Actual | .30% | $ 1,000.00 | $ 1,000.20 | $ 1.49** |
Hypothetical
(5% return per year before expenses) | | $ 1,000.00 | $ 1,023.31 | $ 1.51** |
* Expenses are equal to the Fund's annualized expense ratio, multiplied by the average account value over the period, multiplied by 181/365 (to reflect the one-half year period).
** If certain fees were not voluntarily waived by FMR or its affiliates during the period, the annualized expense ratio for the Retirement Government Money Market Portfolio would have been .42% and the expenses paid in the actual and hypothetical examples above would have been $2.08 and $2.11, respectively.
Semiannual Report
Investment Changes (Unaudited)
Maturity Diversification |
Days | % of fund's investments 2/28/10 | % of fund's investments 8/31/09 | % of fund's investments 2/28/09 |
0 - 30 | 65.0 | 59.0 | 44.4 |
31 - 90 | 19.1 | 17.7 | 33.0 |
91 - 180 | 11.2 | 7.8 | 11.9 |
181 - 397 | 4.7 | 15.5 | 10.7 |
Weighted Average Maturity |
| 2/28/10 | 8/31/09 | 2/28/09 |
Retirement Government Money Market
Portfolio | 42 Days | 69 Days | 68 Days |
All Taxable Money Market Funds Average * | 48 Days | 52 Days | 49 Days |
Asset Allocation (% of fund's net assets) |
As of February 28, 2010 | As of August 31, 2009 |
 | Federal Agency
Issues 29.9% | | | Federal Agency
Issues 48.5% | |
 | U.S. Treasury
Obligations 15.8% | | | U.S. Treasury
Obligations 13.7% | |
 | Other Government Related 0.0% | | | Other Government Related† 2.8% | |
 | Repurchase
Agreements 54.2% | �� | | Repurchase
Agreements 34.9% | |
 | Net Other Assets** 0.1% | | | Net Other Assets** 0.1% | |

** Net Other Assets are not included in the pie chart.
† Includes Federal Financing Bank Supported Student Loan Short-Term Notes.
* Source: iMoneyNet, Inc.
Semiannual Report
Investments February 28, 2010 (Unaudited)
Showing Percentage of Net Assets
Federal Agencies - 29.9% |
| Due Date | Yield (a) | Principal Amount (000s) | Value (000s) |
Federal Home Loan Bank - 29.6% |
| 3/1/10 to 11/12/10 | 0.12 to 1.00% (b) | $ 1,471,900 | $ 1,471,561 |
Freddie Mac - 0.3% |
| 5/5/10 | 0.63 (b) | 18,000 | 17,980 |
TOTAL FEDERAL AGENCIES | 1,489,541 |
U.S. Treasury Obligations - 15.8% |
|
U.S. Treasury Bills - 13.5% |
| 3/11/10 to 12/16/10 | 0.19 to 0.73 | 671,682 | 670,639 |
U.S. Treasury Notes - 2.3% |
| 5/31/10 to 6/30/10 | 0.48 to 0.60 | 112,000 | 112,606 |
TOTAL U.S. TREASURY OBLIGATIONS | 783,245 |
Repurchase Agreements - 54.2% |
| Maturity Amount (000s) | | |
In a joint trading account at 0.12% dated 2/26/10 due 3/1/10 (Collateralized by U.S. Government Obligations) # | $ 2,301,808 | | 2,301,785 |
With: | | | |
ING Financial Markets LLC at: | | | |
0.14%, dated 1/14/10 due 3/31/10 (Collateralized by U.S. Government Obligations valued at $73,452,877, 0% - 5.67%, 7/1/35 - 9/1/37) | 72,021 | | 72,000 |
0.17%, dated: | | | |
1/22/10 due 4/30/10 (Collateralized by U.S. Government Obligations valued at $111,199,019, 0% - 9.85%, 4/1/18 - 1/1/38) | 109,050 | | 109,000 |
2/2/10 due 5/3/10 (Collateralized by U.S. Government Obligations valued at $108,132,624, 0% - 5.87%, 12/1/29 - 5/1/38) | 106,045 | | 106,000 |
0.2%, dated 2/25/10 due 6/30/10 (Collateralized by U.S. Government Obligations valued at $18,361,769, 0% - 5.67%, 11/1/35 - 3/1/38) | 18,013 | | 18,000 |
Morgan Stanley & Co., Inc. at: | | | |
0.18%, dated 2/3/10 due 5/4/10 (Collateralized by U.S. Government Obligations valued at $73,715,629, 3.38% - 9%, 4/1/17 - 2/1/40) | 72,032 | | 72,000 |
Repurchase Agreements - continued |
| Maturity Amount (000s) | | Value (000s) |
With: - continued | | | |
Morgan Stanley & Co., Inc. at: - continued | | | |
0.2%, dated 2/26/10 due 6/30/10 (Collateralized by U.S. Government Obligations valued at $18,416,728, 4.5%, 1/1/40) | $ 18,012 | | $ 18,000 |
TOTAL REPURCHASE AGREEMENTS | 2,696,785 |
TOTAL INVESTMENT PORTFOLIO - 99.9% (Cost $4,969,571) | | 4,969,571 |
NET OTHER ASSETS - 0.1% | | 5,099 |
NET ASSETS - 100% | $ 4,974,670 |
Legend |
(a) Yield represents either the annualized yield at the date of purchase, or the stated coupon rate, or, for floating rate securities, the rate at period end. |
(b) Coupon rates for floating and adjustable rate securities reflect the rates in effect at period end. Due dates for these security types are the next interest rate reset date or, when applicable, the final maturity date. |
# Additional information on each counterparty to the repurchase agreement is as follows: |
Repurchase Agreement / Counterparty | Value
(Amounts in thousands) |
$2,301,785,000 due 3/01/10 at 0.12% |
BNP Paribas Securities Corp. | $ 174,009 |
Banc of America Securities LLC | 107,082 |
Bank of America, NA | 245,160 |
Barclays Capital, Inc. | 113,775 |
Citigroup Global Markets, Inc. | 107,082 |
Credit Suisse Securities (USA) LLC | 107,082 |
Deutsche Bank Securities, Inc. | 481,874 |
RBS Securities, Inc. | 107,082 |
ING Financial Markets LLC | 182,040 |
J.P. Morgan Securities, Inc. | 59,538 |
Merrill Lynch Government Securities, Inc. | 53,541 |
Morgan Stanley & Co., Inc. | 144,561 |
RBC Capital Markets Corp. | 14,724 |
Societe Generale, New York Branch | 107,082 |
UBS Securities LLC | 149,915 |
Wachovia Bank NA | 147,238 |
| $ 2,301,785 |
Other Information |
All investments are categorized as Level 2 under the Fair Value Hierarchy. The inputs or methodology used for valuing securities may not be an indication of the risk associated with investing in those securities. For more information on valuation inputs, please refer to the Security Valuation section in the accompanying Notes to Financial Statements. |
See accompanying notes which are an integral part of the financial statements.
Semiannual Report
Statement of Assets and Liabilities
Amounts in thousands (except per-share amount) | February 28, 2010 (Unaudited) |
| | |
Assets | | |
Investment in securities, at value (including repurchase agreements of $2,696,785) - See accompanying schedule: Unaffiliated issuers (cost $4,969,571) | | $ 4,969,571 |
Receivable for fund shares sold | | 13,189 |
Interest receivable | | 2,203 |
Total assets | | 4,984,963 |
| | |
Liabilities | | |
Payable for fund shares redeemed | $ 9,310 | |
Accrued management fee | 978 | |
Other affiliated payables | 1 | |
Other payables and accrued expenses | 4 | |
Total liabilities | | 10,293 |
| | |
Net Assets | | $ 4,974,670 |
Net Assets consist of: | | |
Paid in capital | | $ 4,974,599 |
Accumulated undistributed net realized gain (loss) on investments | | 71 |
Net Assets, for 4,974,216 shares outstanding | | $ 4,974,670 |
Net Asset Value, offering price and redemption price per share ($4,974,670 ÷ 4,974,216 shares) | | $ 1.00 |
See accompanying notes which are an integral part of the financial statements.
Semiannual Report
Statement of Operations
Amounts in thousands | Six months ended February 28, 2010 (Unaudited) |
| | |
Investment Income | | |
Interest | | $ 7,891 |
| | |
Expenses | | |
Management fee | $ 10,637 | |
Independent Trustees' compensation | 10 | |
Total expenses before reductions | 10,647 | |
Expense reductions | (3,010) | 7,637 |
Net investment income | | 254 |
Realized and Unrealized Gain (Loss) Net realized gain (loss) on: | | |
Investment securities: | | |
Unaffiliated issuers | | 59 |
Net increase in net assets resulting from operations | | $ 313 |
See accompanying notes which are an integral part of the financial statements.
Semiannual Report
Financial Statements - continued
Statement of Changes in Net Assets
Amounts in thousands | Six months ended February 28, 2010 (Unaudited) | Year ended
August 31,
2009 |
Increase (Decrease) in Net Assets | | |
Operations | | |
Net investment income | $ 254 | $ 46,004 |
Net realized gain (loss) | 59 | 720 |
Net increase in net assets resulting
from operations | 313 | 46,724 |
Distributions to shareholders from net investment income | (254) | (46,000) |
Distributions to shareholders from net realized gain | (704) | - |
Total distributions | (958) | (46,000) |
Share transactions at net asset value of $1.00 per share
Proceeds from sales of shares | 1,076,078 | 3,124,889 |
Reinvestment of distributions | 958 | 45,988 |
Cost of shares redeemed | (1,371,959) | (2,917,192) |
Net increase (decrease) in net assets and shares resulting from share transactions | (294,923) | 253,685 |
Total increase (decrease) in net assets | (295,568) | 254,409 |
| | |
Net Assets | | |
Beginning of period | 5,270,238 | 5,015,829 |
End of period | $ 4,974,670 | $ 5,270,238 |
See accompanying notes which are an integral part of the financial statements.
Semiannual Report
Financial Highlights
| Six months ended February 28, 2010 | Years ended August 31, |
| (Unaudited) | 2009 | 2008 | 2007 | 2006 | 2005 |
Selected Per-Share Data | | | | | |
Net asset value, beginning of period | $ 1.00 | $ 1.00 | $ 1.00 | $ 1.00 | $ 1.00 | $ 1.00 |
Income from Investment Operations | | | | | | |
Net investment
income | - E | .009 | .033 | .049 | .042 | .021 |
Distributions from net investment income | - E | (.009) | (.033) | (.049) | (.042) | (.021) |
Net asset value,
end of period | $ 1.00 | $ 1.00 | $ 1.00 | $ 1.00 | $ 1.00 | $ 1.00 |
Total Return B,C | .02% | .86% | 3.35% | 5.06% | 4.25% | 2.17% |
Ratios to Average Net Assets D | | | | | |
Expenses before
reductions | .42% A | .44% | .42% | .42% | .42% | .42% |
Expenses net of fee waivers, if any | .30% A | .44% | .42% | .42% | .42% | .42% |
Expenses net of all reductions | .30% A | .44% | .41% | .39% | .40% | .41% |
Net investment
income | .01% A | .84% | 3.28% | 4.95% | 4.18% | 2.13% |
Supplemental Data | | | | | | |
Net assets, end of period (in millions) | $ 4,975 | $ 5,270 | $ 5,016 | $ 4,733 | $ 4,826 | $ 4,740 |
A Annualized
B Total returns for periods of less than one year are not annualized.
C Total returns would have been lower had certain expenses not been reduced during the periods shown.
D Expense ratios reflect operating expenses of the Fund. Expenses before reductions do not reflect amounts reimbursed or waived or reductions from expense offset arrangements and do not represent the amount paid by the Fund during periods when reimbursements, waivers or reductions occur. Expenses net of fee waivers reflect expenses after reimbursement and waivers but prior to reductions from expense offset arrangements. Expenses net of all reductions represent the net expenses paid by the Fund.
E Amount represents less than $.001 per share.
See accompanying notes which are an integral part of the financial statements.
Semiannual Report
Notes to Financial Statements
For the period ended February 28, 2010 (Unaudited)
(Amounts in thousands except ratios)
1. Organization.
Retirement Government Money Market Portfolio (the Fund) is a fund of Fidelity Money Market Trust (the trust) and is authorized to issue an unlimited number of shares. The trust is registered under the Investment Company Act of 1940, as amended (the 1940 Act), as an open-end management investment company organized as a Delaware statutory trust.
2. Significant Accounting Policies.
The financial statements have been prepared in conformity with accounting principles generally accepted in the United States of America, which require management to make certain estimates and assumptions at the date of the financial statements. Actual results could differ from those estimates. The following summarizes the significant accounting policies of the Fund:
Security Valuation. The Fund categorizes the inputs to valuation techniques used to value its investments into a disclosure hierarchy consisting of three levels as shown below.
Level 1 - quoted prices in active markets for identical investments
Level 2 - other significant observable inputs (including quoted prices for similar investments, interest rates, prepayment speeds, etc.)
Level 3 - unobservable inputs (including the fund's own assumptions based on the best information available)
As permitted by compliance with certain conditions under Rule 2a-7 of the 1940 Act, securities are valued at amortized cost, which approximates value and are categorized as Level 2 in the hierarchy.
Investment Transactions and Income. The net asset value per share for processing shareholder transactions is calculated as of the close of business of the New York Stock Exchange (NYSE), normally 4:00 p.m. Eastern time. Security transactions are accounted for as of trade date. Gains and losses on securities sold are determined on the basis of identified cost. Interest income is accrued as earned. Interest income includes coupon interest and amortization of premium and accretion of discount on debt securities.
Expenses. Most expenses of the trust can be directly attributed to a fund. Expenses which cannot be directly attributed are apportioned among each Fund in the trust. Expense estimates are accrued in the period to which they relate and adjustments are made when actual amounts are known.
Semiannual Report
Notes to Financial Statements (Unaudited) - continued
(Amounts in thousands except ratios)
2. Significant Accounting Policies - continued
Income Tax Information and Distributions to Shareholders. Each year, the Fund intends to qualify as a regulated investment company by distributing substantially all of its taxable income and realized gains under Subchapter M of the Internal Revenue Code and filing its U.S. federal tax return. As a result, no provision for income taxes is required. A Fund's federal tax return is subject to examination by the Internal Revenue Service (IRS) for a period of three years.
Dividends are declared daily and paid monthly from net investment income. Distributions from realized gains, if any, are recorded on the ex-dividend date. Income and capital gain distributions are determined in accordance with income tax regulations, which may differ from generally accepted accounting principles.
Book-tax differences are primarily due to deferred trustees compensation, capital loss carryforwards and losses deferred due to wash sales.
The federal tax cost of investment securities and unrealized appreciation (depreciation) as of period end were as follows:
Gross unrealized appreciation | $ - |
Gross unrealized depreciation | - |
Net unrealized appreciation (depreciation) | $ - |
Tax cost | $ 4,969,571 |
3. Operating Policies.
Repurchase Agreements. Fidelity Management & Research Company (FMR) has received an Exemptive Order from the Securities and Exchange Commission (the SEC) which permits the Fund and other affiliated entities of FMR to transfer uninvested cash balances into joint trading accounts which are then invested in repurchase agreements. The Fund may also invest directly with institutions in repurchase agreements. Repurchase agreements are collateralized by government or non-government securities. Upon settlement date, collateral is held in segregated accounts with custodian banks and may be obtained in the event of a default of the counterparty. The Fund monitors, on a daily basis, the value of the collateral to ensure it is at least equal to the principal amount of the repurchase agreement (including accrued interest). In the event of a default by the counterparty, realization of the collateral proceeds could be delayed, during which time the value of the collateral may decline.
Reverse Repurchase Agreements. To enhance its yield, the Fund may enter into reverse repurchase agreements whereby the Fund transfers securities to a counterparty who then agrees to transfer them back to the Fund at a future date and agreed upon price, reflecting a rate of interest below market rate. Securities sold under a reverse
Semiannual Report
3. Operating Policies - continued
Reverse Repurchase Agreements - continued
repurchase agreement are recorded as a liability in the accompanying Statement of Assets and Liabilities. The Fund receives cash proceeds, which are invested in other securities, and agrees to repay the proceeds plus any accrued interest in return for the same securities transferred. The Fund continues to receive interest payments on the transferred securities during the term of the reverse repurchase agreement. During the period that a reverse repurchase agreement is outstanding, the Fund identifies cash and liquid securities as segregated in its custodian records with a value at least equal to its obligation under the agreement. If the counterparty defaults on its obligation, because of insolvency or other reasons, the Fund could experience delays and costs in recovering the security or in gaining access to the collateral. At period end, there were no reverse repurchase agreements outstanding.
4. Fees and Other Transactions with Affiliates.
Management Fee. FMR and its affiliates provide the Fund with investment management related services for which the Fund pays a monthly management fee that is based on an annual rate of .42% of the Fund's average net assets. FMR pays all other expenses, except the compensation of the independent Trustees and certain exceptions such as interest expense. The management fee paid to FMR by the Fund is reduced by an amount equal to the fees and expenses paid by the Fund to the independent Trustees.
5. Expense Reductions.
FMR or its affiliates voluntarily agreed to waive certain fees during the period. The amount of the waiver is $3,010.
6. Other.
The Fund's organizational documents provide former and current trustees and officers with a limited indemnification against liabilities arising in connection with the performance of their duties to the Fund. In the normal course of business, the Fund may also enter into contracts that provide general indemnifications. The Fund's maximum exposure under these arrangements is unknown as this would be dependent on future claims that may be made against the Fund. The risk of material loss from such claims is considered remote.
Semiannual Report
Board Approval of Investment Advisory Contracts and Management Fees
Fidelity Retirement Government Money Market Portfolio
Each year, the Board of Trustees, including the Independent Trustees (together, the Board), votes on the renewal of the management contract and sub-advisory agreements (together, the Advisory Contracts) for the fund. The Board, assisted by the advice of fund counsel and Independent Trustees' counsel, requests and considers a broad range of information throughout the year.
The Board meets regularly and considers at each of its meetings factors that are relevant to its annual consideration of the renewal of the fund's Advisory Contracts, including the services and support provided to the fund and its shareholders. The Board has established three standing committees, each composed of Independent Trustees with varying backgrounds, to which the Board has assigned specific subject matter responsibilities in order to enhance effective decision-making by the Board. The Operations Committee meets regularly throughout the year and, among other matters, considers matters specifically related to the annual consideration of the renewal of the fund's Advisory Contracts. The Board, acting directly and through its Committees, requests and receives information concerning the annual consideration of the renewal of the fund's Advisory Contracts. The Board also meets as needed to consider matters specifically related to the Board's annual consideration of the renewal of Advisory Contracts.
At its September 2009 meeting, the Board of Trustees, including the Independent Trustees, unanimously determined to renew the fund's Advisory Contracts. In reaching its determination, the Board considered all factors it believed relevant, including (i) the nature, extent, and quality of the services to be provided to the fund and its shareholders (including the investment performance of the fund); (ii) the competitiveness of the fund's management fee and total expenses; (iii) the total costs of the services to be provided by and the profits to be realized by Fidelity from its relationship with the fund; (iv) the extent to which economies of scale would be realized as the fund grows; and (v) whether fee levels reflect these economies of scale, if any, for the benefit of fund shareholders.
In considering whether to renew the Advisory Contracts for the fund, the Board ultimately reached a determination, with the assistance of fund counsel and Independent Trustees' counsel and through the exercise of its business judgment, that the renewal of the Advisory Contracts and the compensation to be received by Fidelity under the management contract is consistent with Fidelity's fiduciary duty under applicable law. The Board's decision to renew the Advisory Contracts was not based on any single factor noted above, but rather was based on a comprehensive consideration of all the information provided to the Board at its meetings throughout the year. The Board, in reaching its determination to renew the Advisory Contracts, is aware that shareholders in the fund have a broad range of investment choices available to them, including a wide choice among mutual funds offered by competitors to Fidelity, and that the fund's shareholders, with the opportunity to review and weigh the disclosure provided by the fund in its prospectus and other public disclosures, have chosen to invest in this fund, managed by Fidelity.
Semiannual Report
Board Approval of Investment Advisory Contracts and
Management Fees - continued
Nature, Extent, and Quality of Services Provided. The Board considered staffing within the investment adviser, FMR, and the sub-advisers (together, the Investment Advisers), including the backgrounds of the fund's investment personnel and the fund's investment objective and discipline. The Independent Trustees also had discussions with senior management of Fidelity's investment operations and investment groups. The Board considered the structure of the portfolio manager compensation program and whether this structure provides appropriate incentives.
Resources Dedicated to Investment Management and Support Services. The Board reviewed the size, education, and experience of the Investment Advisers' investment staff, their use of technology, and the Investment Advisers' approach to recruiting, training, and retaining portfolio managers and other research, advisory, and management personnel. In response to the recent financial crisis, Fidelity took a number of actions intended to cut costs and improve efficiency without weakening the investment teams or resources. The Board specifically noted Fidelity's response to the 2008 credit market crisis. The Board noted that Fidelity's analysts have access to a variety of technological tools and market and securities data that enable them to perform both fundamental and quantitative analysis and to specialize in various disciplines. The Board considered Fidelity's extensive global research capabilities that enable the Investment Advisers to aggregate data from various sources in an effort to produce positive investment results. The Board also considered that Fidelity's portfolio managers and analysts have access to daily portfolio attribution that allows for monitoring of a fund's portfolio, as well as an electronic communication system that provides immediate real-time access to research concerning issuers and credit enhancers. In addition, the Board considered the trading resources that are an integral part of the fixed-income portfolio management investment process.
Shareholder and Administrative Services. The Board considered (i) the nature, extent, quality, and cost of advisory, administrative, distribution, and shareholder services performed by the Investment Advisers and their affiliates under the Advisory Contracts and under separate agreements covering transfer agency and pricing and bookkeeping services for the fund; (ii) the nature and extent of the Investment Advisers' supervision of third party service providers, principally custodians and subcustodians; and (iii) the resources devoted to, and the record of compliance with, the fund's compliance policies and procedures.
The Board noted that the growth of fund assets over time across the complex allows Fidelity to reinvest in the development of services designed to enhance the value or convenience of the Fidelity funds as investment vehicles. These services include 24-hour access to account information and market information through phone representatives and over the Internet, and investor education materials and asset allocation tools.
Semiannual Report
Investment in a Large Fund Family. The Board considered the benefits to shareholders of investing in a Fidelity fund, including the benefits of investing in a fund that is part of a large family of funds offering a variety of investment disciplines and providing a large variety of mutual fund investor services. The Board noted that Fidelity had taken a number of actions over the previous year that benefited particular funds, including (i) dedicating additional resources to investment research and to restructure and broaden the focus of the investment research teams; (ii) bolstering the senior management team that oversees asset management; (iii) contractually agreeing to reduce the management fee on Fidelity U.S. Bond Index Fund; and (iv) expanding Class A and Class T load waiver categories to increase rollover retention opportunities and create consistent policies across the classes.
Investment Performance. The Board considered whether the fund has operated in accordance with its investment objective, as well as its record of compliance with its investment restrictions. It also reviewed the fund's absolute investment performance, as well as the fund's relative investment performance measured against a peer group of mutual funds deemed appropriate by the Board over multiple periods. The following charts considered by the Board show, over the one-, three-, and five-year periods ended December 31, 2008, the fund's cumulative total returns and a range of cumulative total returns of a peer group of mutual funds identified by Lipper Inc. as having an investment objective similar to that of the fund. The box within each chart shows the 25th percentile return (bottom of box) and the 75th percentile return (top of box) of the peer group. Returns shown above the box are in the first quartile and returns shown below the box are in the fourth quartile. The percentage beaten number noted below each chart corresponds to the percentile box and represents the percentage of funds in the peer group whose performance was equal to or lower than that of the fund.
Semiannual Report
Board Approval of Investment Advisory Contracts and
Management Fees - continued
Fidelity Retirement Government Money Market Portfolio
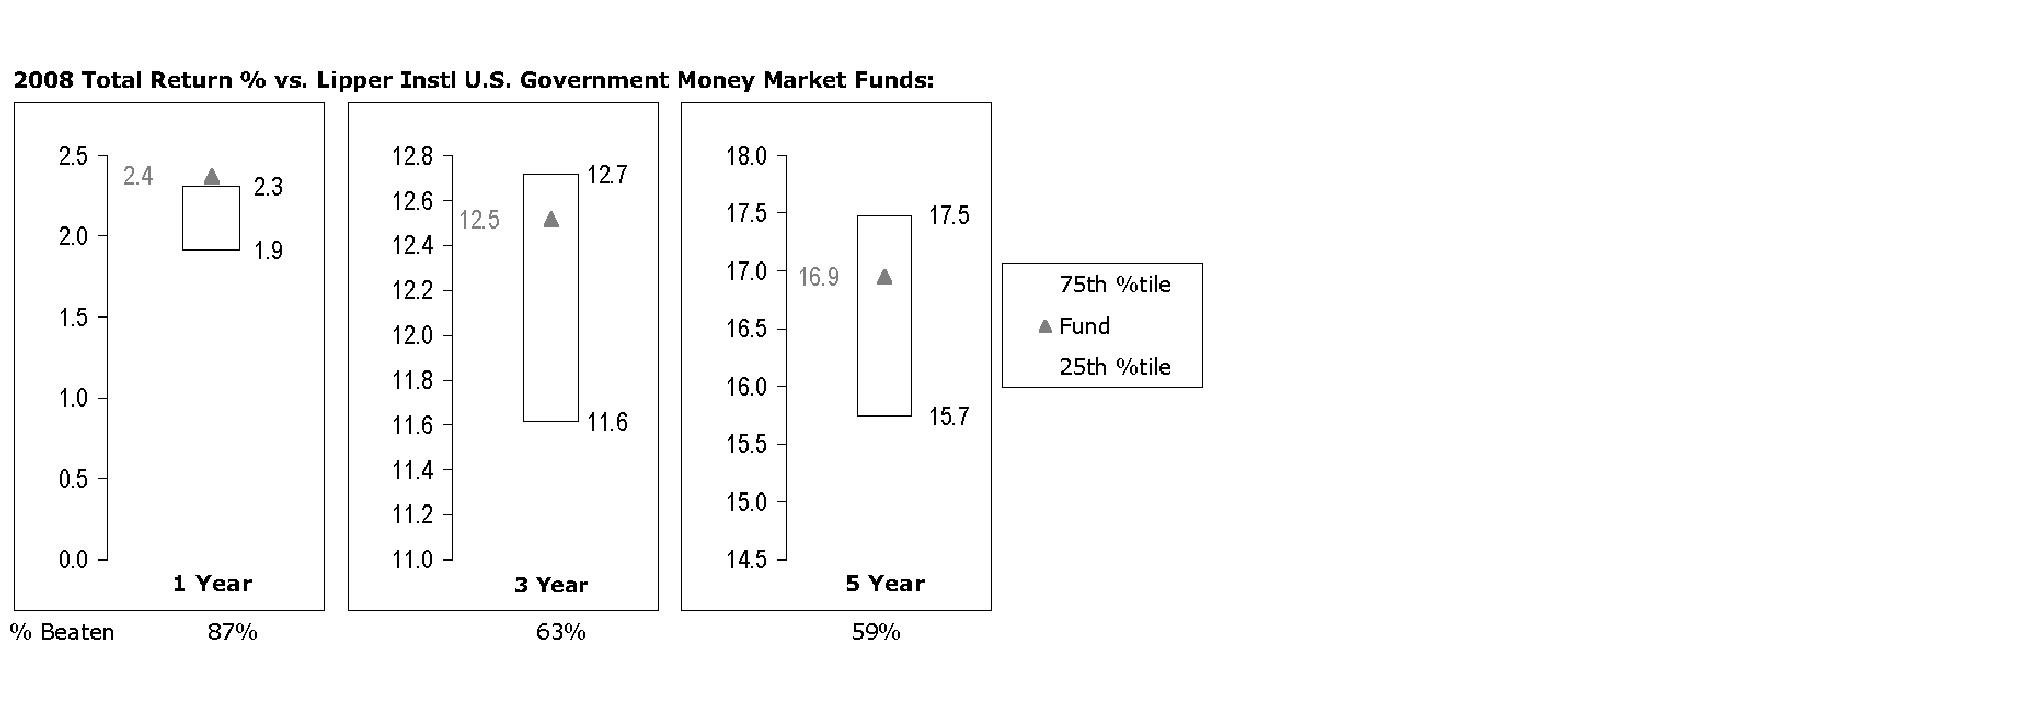
The Board reviewed the fund's relative investment performance against its peer group and stated that the performance of the fund was in the first quartile for the one-year period and the second quartile for the three- and five-year periods. The Board also reviewed the fund's performance during 2009.
Based on its review, and giving particular weight to the nature and quality of the resources dedicated by the Investment Advisers to maintain and improve relative performance and factoring in the unprecedented recent market events, the Board concluded that the nature, extent, and quality of the services provided to the fund will benefit the fund's shareholders, particularly in light of the Board's view that the fund's shareholders benefit from investing in a fund that is part of a large family of funds offering a variety of investment disciplines and services.
Competitiveness of Management Fee and Total Fund Expenses. The Board considered the fund's management fee and total expenses compared to "mapped groups" of competitive funds and classes. Fidelity creates "mapped groups" by combining similar Lipper investment objective categories that have comparable management fee characteristics. Combining Lipper investment objective categories aids the Board's management fee and total expense comparisons by broadening the competitive group used for comparison and by reducing the number of universes to which various Fidelity funds are compared.
The Board considered two proprietary management fee comparisons for the 12-month periods shown in the chart below. The group of Lipper funds used by the Board for management fee comparisons is referred to below as the "Total Mapped Group" and, for the reasons explained above, is broader than the Lipper peer group used by the Board for performance comparisons. The Total Mapped Group comparison focuses on a fund's standing relative to the total universe of comparable funds available to investors, in terms of gross management fees before expense reimbursements or caps. "TMG %" represents the percentage of funds in the Total Mapped Group that had management fees that were lower than the fund's. For example, a TMG % of 23% means that 77% of the funds in the Total Mapped Group had higher management fees than the fund. The "Asset-Size Peer Group" (ASPG) comparison focuses on a fund's standing relative to non-Fidelity funds similar in size to the fund within the Total Mapped Group. The ASPG represents at least 15% of the funds in the Total Mapped Group with comparable asset size and management fee characteristics, subject to a minimum of 50 funds (or all funds in the Total Mapped Group if fewer than 50). Additional information, such as the ASPG quartile in which the fund's management fee ranked, is also included in the chart and considered by the Board. For a more meaningful comparison of management fees, the fund is compared on the basis of a hypothetical "net management fee," which is derived by subtracting payments made by FMR for non-management expenses (including transfer agent fees, pricing and bookkeeping fees, and custody fees) from the fund's all-inclusive fee. In this regard, the Board realizes that net management fees can vary from year to year because of differences in non-management expenses.
Semiannual Report
Fidelity Retirement Government Money Market Portfolio
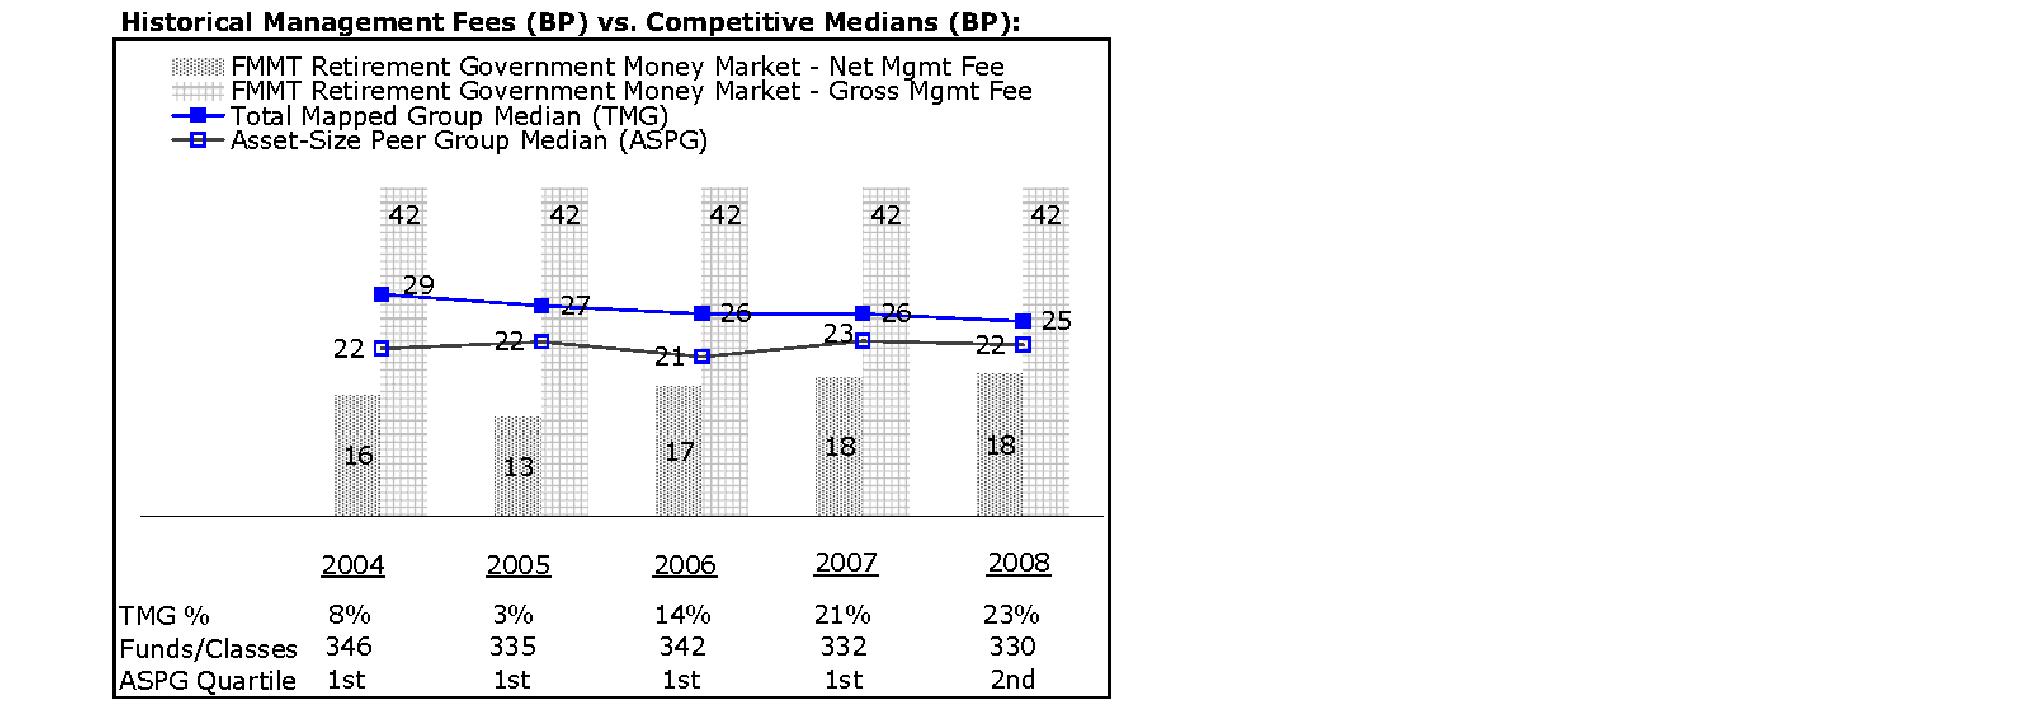
The Board noted that the fund's hypothetical net management fee ranked below the median of its Total Mapped Group and below the median of its ASPG for 2008.
Semiannual Report
Board Approval of Investment Advisory Contracts and
Management Fees - continued
Based on its review, the Board concluded that the fund's management fee was fair and reasonable in light of the services that the fund receives and the other factors considered.
In its review of the fund's total expenses, the Board considered the fund's hypothetical net management fee as well as the fund's all-inclusive fee. The Board also considered other expenses, such as transfer agent fees, pricing and bookkeeping fees, and custodial, legal, and audit fees, paid by FMR under the all-inclusive arrangement. The Board also noted the effects of any waivers and reimbursements on fees and expenses. As part of its review, the Board also considered current and historical total expenses of the fund compared to competitive fund median expenses. The fund is compared to those funds and classes in the Total Mapped Group (used by the Board for management fee comparisons) that have a similar sales load structure.
The Board noted that the fund's total expenses ranked above its competitive median for 2008. The Board considered that although the fund has no minimum initial investment and provides a range of services similar to retail funds, Lipper categorizes it as institutional. When compared to retail no-load funds, the fund's total expenses rank below the median for 2008.
In its review, the Board also considered Fidelity fee structures and other information on clients that FMR and its affiliates service in other competitive markets, such as other mutual funds advised or subadvised by FMR or its affiliates, pension plan clients, and other institutional clients.
Based on its review, the Board concluded that the fund's total expenses were reasonable, although above the median of the universe presented for comparison, in light of the services that the fund and its shareholders receive and the other factors considered.
Costs of the Services and Profitability. The Board considered the revenues earned and the expenses incurred by Fidelity in conducting the business of developing, marketing, distributing, managing, administering and servicing the fund and its shareholders. The Board also considered the level of Fidelity's profits in respect of all the Fidelity funds.
On an annual basis, FMR presents to the Board Fidelity's profitability for the fund. Fidelity calculates the profitability for each fund, as well as aggregate profitability for groups of Fidelity funds and all Fidelity funds, using a series of detailed revenue and cost allocation methodologies which originate with the audited books and records of Fidelity. The Audit Committee of the Board reviews any significant changes from the prior year's methodologies.
PricewaterhouseCoopers LLP (PwC), independent registered public accounting firm and auditor to Fidelity and certain Fidelity funds, has been engaged annually by the
Semiannual Report
Board as part of the Board's assessment of Fidelity's profitability analysis. PwC's engagement includes the review and assessment of Fidelity's methodologies used in determining the revenues and expenses attributable to Fidelity's mutual fund business, and completion of agreed-upon procedures surrounding the mathematical accuracy of fund profitability and its conformity to allocation methodologies. After considering PwC's reports issued under the engagement and information provided by Fidelity, the Board believes that while other allocation methods may also be reasonable, Fidelity's profitability methodologies are reasonable in all material respects.
The Board has also reviewed Fidelity's non-fund businesses and any fall-out benefits related to the mutual fund business as well as cases where Fidelity's affiliates may benefit from or be related to the fund's business.
The Board considered the costs of the services provided by and the profits realized by Fidelity in connection with the operation of the fund and determined that the amount of profit is a fair entrepreneurial profit for the management of the fund.
Economies of Scale. The Board considered whether there have been economies of scale in respect of the management of the Fidelity funds, whether the Fidelity funds (including the fund) have appropriately benefited from any such economies of scale, and whether there is potential for realization of any further economies of scale. The Board considered the extent to which the fund will benefit from economies of scale through increased services to the fund, through waivers or reimbursements, or through fee or expense reductions.
In February 2009, the Board created an Ad Hoc Committee (the "Committee") to analyze economies of scale. The Committee was formed to consider whether FMR attains economies of scale in respect of the management and servicing of the Fidelity funds, whether the Fidelity funds have appropriately benefited from such economies of scale, and whether there is potential for realization of any further economies of scale.
The Board concluded, considering the findings of the Committee, that any potential economies of scale are being shared between fund shareholders and Fidelity in an appropriate manner.
Additional Information Requested by the Board. In order to develop fully the factual basis for consideration of the Fidelity funds' Advisory Contracts, the Board requested and received additional information on certain topics, including (i) fund performance trends, actions to be taken by FMR to improve certain funds' overall performance and Fidelity's long-term strategies for certain funds; (ii) portfolio manager changes that have occurred during the past year; (iii) Fidelity's fund profitability methodology, the profitability of certain fund service providers, and profitability trends for certain funds; (iv) Fidelity's compensation structure for portfolio managers and key personnel, including its effects on fund profitability, and the extent to which current market conditions have affected retention and recruitment; (v) the selection of and compensation paid by FMR to fund sub-advisers; (vi) Fidelity's fee structures and rationale for recommending different fees among categories of funds; (vii) the rationale for any differences between fund fee structures and fee structures in place for other Fidelity clients; and (viii) explanations for the relative total expenses borne by certain funds and classes, total expense competitive trends, and actions that might be taken by FMR to reduce total expenses for certain funds and classes.
Semiannual Report
Board Approval of Investment Advisory Contracts and
Management Fees - continued
Based on its evaluation of all of the conclusions noted above, and after considering all material factors, the Board ultimately concluded that the advisory fee structures are fair and reasonable, and that the fund's Advisory Contracts should be renewed.
Semiannual Report
Investment Adviser
Fidelity Management &
Research Company
Boston, MA
Investment Sub-Advisers
Fidelity Investments Money
Management, Inc.
FIL Investment Advisors
FIL Investment Advisors
(U.K.) Ltd.
Fidelity Research & Analysis Company
Fidelity Management & Research
(U.K.) Inc.
Fidelity Management & Research
(Hong Kong) Limited
Fidelity Management & Research
(Japan) Inc.
General Distributor
Fidelity Distributors Corporation
Boston, MA
Transfer and Service Agents
Fidelity Investments Institutional
Operations Company, Inc.
Boston, MA
Fidelity Service Company, Inc.
Boston, MA
Custodian
JPMorgan Chase Bank
New York, NY
RGM-SANN-0410
1.700932.112

Fidelity
Money Market Trust
Retirement Money Market
Portfolio
Semiannual Report
February 28, 2010
(2_fidelity_logos) (Registered_Trademark)
Contents
Shareholder Expense Example | <Click Here> | An example of shareholder expenses. |
Investment Changes | <Click Here> | A summary of major shifts in the fund's investments over the past six months. |
Investments | <Click Here> | A complete list of the fund's investments. |
Financial Statements | <Click Here> | Statements of assets and liabilities, operations, and changes in net assets, as well as financial highlights. |
Notes | <Click Here> | Notes to the financial statements. |
Board Approval of Investment Advisory Contracts and Management Fees | <Click Here> | |
To view a fund's proxy voting guidelines and proxy voting record for the 12-month period ended June 30, visit http://www.fidelity.com/proxyvotingresults or visit the Securities and Exchange Commission's (SEC) web site at http://www.sec.gov. You may also call 1-800-544-8544 to request a free copy of the proxy voting guidelines.
Standard & Poor's, S&P and S&P 500 are registered service marks of The McGraw-Hill Companies, Inc. and have been licensed for use by Fidelity Distributors Corporation.
Other third party marks appearing herein are the property of their respective owners.
All other marks appearing herein are registered or unregistered trademarks or service marks of FMR LLC or an affiliated company.
The fund seeks to obtain as high a level of current income as is consistent with the preservation of capital and liquidity by investing in high-quality, short-term money market securities.
Investments in the fund are neither insured nor guaranteed by the U.S. Government, and there can be no assurance that the fund will maintain a stable $1.00 share price.
This report and the financial statements contained herein are submitted for the general information of the shareholders of the fund. This report is not authorized for distribution to prospective investors in the fund unless preceded or accompanied by an effective prospectus.
A fund files its complete schedule of portfolio holdings with the SEC for the first and third quarters of each fiscal year on Form N-Q. Forms N-Q are available on the SEC's web site at http://www.sec.gov. A fund's Forms N-Q may be reviewed and copied at the SEC's Public Reference Room in Washington, DC. Information regarding the operation of the SEC's Public Reference Room may be obtained by calling 1-800-SEC-0330. For a complete list of a fund's portfolio holdings, view the most recent holdings listing, semiannual report, or annual report on Fidelity's web site at http://www.fidelity.com or http://www.advisor.fidelity.com, as applicable.
NOT FDIC INSURED · MAY LOSE VALUE · NO BANK GUARANTEE
Neither the fund nor Fidelity Distributors Corporation is a bank.
Semiannual Report
Shareholder Expense Example
As a shareholder of the Fund, you incur two types of costs: (1) transaction costs, and (2) ongoing costs, including management fees and other Fund expenses. This Example is intended to help you understand your ongoing costs (in dollars) of investing in the Fund and to compare these costs with the ongoing costs of investing in other mutual funds.
The Example is based on an investment of $1,000 invested at the beginning of the period and held for the entire period (September 1, 2009 to February 28, 2010).
Actual Expenses
The first line of the accompanying table provides information about actual account values and actual expenses. You may use the information in this line, together with the amount you invested, to estimate the expenses that you paid over the period. Simply divide your account value by $1,000.00 (for example, an $8,600 account value divided by $1,000.00 = 8.6), then multiply the result by the number in the first line under the heading entitled "Expenses Paid During Period" to estimate the expenses you paid on your account during this period.
Hypothetical Example for Comparison Purposes
The second line of the accompanying table provides information about hypothetical account values and hypothetical expenses based on the Fund's actual expense ratio and an assumed rate of return of 5% per year before expenses, which is not the Fund's actual return. The hypothetical account values and expenses may not be used to estimate the actual ending account balance or expenses you paid for the period. You may use this information to compare the ongoing costs of investing in the Fund and other funds. To do so, compare this 5% hypothetical example with the 5% hypothetical examples that appear in the shareholder reports of the other funds.
Please note that the expenses shown in the table are meant to highlight your ongoing costs only and do not reflect any transaction costs. Therefore, the second line of the table is useful in comparing ongoing costs only, and will not help you determine the relative total costs of owning different funds.
| Annualized Expense Ratio | Beginning
Account Value
September 1, 2009 | Ending
Account Value
February 28, 2010 | Expenses Paid
During Period*
September 1, 2009
to February 28, 2010 |
Actual | .42% | $ 1,000.00 | $ 1,000.60 | $ 2.08 |
Hypothetical (5% return per year before expenses) | | $ 1,000.00 | $ 1,022.71 | $ 2.11 |
* Expenses are equal to the Fund's annualized expense ratio, multiplied by the average account value over the period, multiplied by 181/365 (to reflect the one-half year period).
Semiannual Report
Investment Changes (Unaudited)
Maturity Diversification |
Days | % of fund's investments 2/28/10 | % of fund's investments 8/31/09 | % of fund's
investments
2/28/09 |
0 - 30 | 50.1 | 30.8 | 31.6 |
31 - 90 | 28.7 | 46.7 | 48.2 |
91 - 180 | 13.7 | 14.0 | 11.8 |
181 - 397 | 7.5 | 8.5 | 8.4 |
Weighted Average Maturity |
| 2/28/10 | 8/31/09 | 2/28/09 |
Retirement Money Market Portfolio | 63 Days | 69 Days | 68 Days |
All Taxable Money Market Funds Average* | 48 Days | 52 Days | 49 Days |
Asset Allocation (% of fund's net assets) |
As of February 28, 2010 | As of August 31, 2009 |
| Corporate Bonds 0.3% | | | Corporate Bonds 1.2% | |
 | Commercial Paper 13.6% | | | Commercial Paper 15.0% | |
| Bank CDs, BAs,
TDs, and Notes 56.4% | | | Bank CDs, BAs,
TDs, and Notes 60.1% | |
 | Government
Securities† 16.6% | | | Government
Securities† 20.9% | |
 | Repurchase
Agreements 13.9% | | | Repurchase
Agreements 3.4% | |
 | Other Investments 0.0% | | | Other Investments 0.2% | |
 | Net Other Assets** (0.8)% | | | Net Other Assets** (0.8)% | |

**Net Other Assets are not included in the pie chart.
† Includes FDIC Guaranteed Corporate Securities
*Source: iMoneyNet, Inc.
Semiannual Report
Investments February 28, 2010 (Unaudited)
Showing Percentage of Net Assets
Corporate Bonds - 0.3% |
| Due Date | Yield (a) | Principal Amount (000s) | Value (000s) |
General Electric Capital Corp. |
| 3/11/11 | 0.46% | $ 23,500 | $ 23,821 |
LP Pinewood SPV LLC |
| 3/5/10 | 0.23 (d) | 25,000 | 25,000 |
TOTAL CORPORATE BONDS | 48,821 |
Certificates of Deposit - 46.2% |
|
London Branch, Eurodollar, Foreign Banks - 13.7% |
Banco Bilbao Vizcaya Argentaria SA |
| 5/28/10 | 0.25 | 103,000 | 103,001 |
Commonwealth Bank of Australia |
| 8/23/10 to 9/24/10 | 0.33 to 0.50 | 106,000 | 106,000 |
Credit Agricole SA |
| 3/1/10 to 6/1/10 | 0.25 to 0.67 (d) | 546,000 | 546,000 |
Credit Industriel et Commercial |
| 3/3/10 to 6/1/10 | 0.34 to 0.41 | 340,000 | 340,000 |
Danske Bank AS |
| 4/19/10 to 4/22/10 | 0.21 | 104,000 | 104,000 |
DZ BANK AG Deutsche Zentral-Genossenschaftsbank |
| 3/24/10 | 0.21 | 27,000 | 27,000 |
HSBC Bank PLC |
| 11/22/10 to 12/21/10 | 0.58 to 0.60 | 83,000 | 83,000 |
ING Bank NV |
| 3/8/10 to 5/25/10 | 0.22 to 0.26 | 352,000 | 352,000 |
Landesbank Hessen-Thuringen |
| 3/15/10 to 8/3/10 | 0.41 to 0.63 | 271,000 | 271,000 |
National Australia Bank Ltd. |
| 3/10/10 to 4/1/10 | 0.35 to 0.40 | 300,000 | 300,000 |
UniCredit SpA |
| 3/3/10 to 3/12/10 | 0.24 | 121,000 | 121,000 |
| | 2,353,001 |
New York Branch, Yankee Dollar, Foreign Banks - 32.5% |
ABN-AMRO Bank NV |
| 4/6/10 | 0.27 | 104,000 | 104,000 |
Certificates of Deposit - continued |
| Due Date | Yield (a) | Principal Amount (000s) | Value (000s) |
New York Branch, Yankee Dollar, Foreign Banks - continued |
Banco Bilbao Vizcaya Argentaria SA New York Branch |
| 5/24/10 | 0.25% | $ 104,000 | $ 104,001 |
Bank of Montreal |
| 3/22/10 | 0.24 (d) | 27,000 | 27,000 |
Bank of Nova Scotia |
| 3/8/10 to 5/25/10 | 0.25 to 0.45 (d) | 242,000 | 242,000 |
Bank of Nova Scotia Institutional |
| 3/8/10 | 0.24 (d) | 108,000 | 108,000 |
Bank of Tokyo-Mitsubishi |
| 4/6/10 to 5/4/10 | 0.21 | 263,000 | 263,000 |
Bank Tokyo-Mitsubishi UFJ Ltd. |
| 3/26/10 to 4/30/10 | 0.21 | 91,000 | 91,000 |
Barclays Bank PLC |
| 3/16/10 | 0.34 (d) | 217,000 | 217,000 |
Barclays Bank PLC New York Branch |
| 3/31/10 | 0.20 | 58,000 | 58,000 |
BNP Paribas New York Branch |
| 8/3/10 to 9/20/10 | 0.33 to 0.45 | 553,000 | 553,000 |
BNP Paribas SA |
| 4/20/10 to 8/12/10 | 0.40 to 0.60 | 254,000 | 254,000 |
Calyon New York Branch |
| 3/8/10 to 7/6/10 | 0.40 to 0.41 (d) | 180,000 | 180,000 |
Calyon SA |
| 6/11/10 | 0.60 | 136,000 | 136,000 |
Canadian Imperial Bank of Commerce, New York |
| 3/9/10 to 3/22/10 | 0.23 to 0.28 (d) | 263,000 | 263,000 |
Commerzbank AG |
| 3/1/10 to 3/2/10 | 0.35 | 133,000 | 133,000 |
Commerzbank AG New York Branch |
| 3/10/10 to 8/10/10 | 0.23 to 0.45 | 232,000 | 232,000 |
Fortis Bank New York Branch |
| 3/24/10 | 0.20 | 39,000 | 39,000 |
Lloyds TSB Bank PLC New York Branch |
| 3/22/10 | 0.21 | 130,000 | 130,000 |
Natexis Banques Populaires NY |
Certificates of Deposit - continued |
| Due Date | Yield (a) | Principal Amount (000s) | Value (000s) |
New York Branch, Yankee Dollar, Foreign Banks - continued |
Natexis Banques Populaires NY - continued |
| 3/1/10 to 5/19/10 | 0.30 to 1.05% (d) | $ 354,000 | $ 354,000 |
Natixis New York Branch |
| 3/12/10 to 3/22/10 | 0.30 to 1.05 (d) | 205,000 | 205,000 |
Rabobank Nederland |
| 3/5/10 to 5/18/10 | 0.23 to 0.60 (d) | 435,000 | 435,013 |
Rabobank Nederland New York Branch |
| 3/8/10 to 9/7/10 | 0.23 to 0.30 (d) | 358,000 | 358,003 |
Royal Bank of Canada |
| 4/1/10 | 0.57 (d) | 118,000 | 118,000 |
Royal Bank of Canada New York Branch |
| 3/22/10 to 3/29/10 | 0.23 (d) | 24,000 | 24,000 |
Royal Bank of Scotland PLC |
| 3/16/10 to 4/1/10 | 0.73 to 0.80 | 165,000 | 165,000 |
Royal Bank of Scotland PLC Connecticut Branch |
| 3/22/10 to 5/21/10 | 0.51 to 0.54 (d) | 174,000 | 174,000 |
Royal Bank Scotland NV Chicago |
| 5/24/10 | 0.30 | 57,000 | 57,000 |
Skandinaviska Enskilda Banken New York Branch |
| 5/4/10 | 0.30 | 69,000 | 69,000 |
Societe Generale |
| 5/5/10 | 0.55 (d) | 30,000 | 30,000 |
Societe Generale Institutional CD Program |
| 3/2/10 to 3/8/10 | 0.26 to 0.27 (d) | 245,000 | 245,000 |
Sumitomo Mitsui Banking Corp. New York Branch |
| 4/28/10 | 0.21 | 21,000 | 21,000 |
Toronto-Dominion Bank |
| 3/29/10 to 4/16/10 | 0.23 to 0.65 (d) | 101,000 | 101,000 |
Toronto-Dominion Bank New York Branch |
| 3/4/10 | 0.23 (d) | 26,000 | 26,000 |
UniCredito Italiano SpA, New York |
| 4/27/10 | 0.30 | 87,000 | 87,000 |
| | 5,603,017 |
TOTAL CERTIFICATES OF DEPOSIT | 7,956,018 |
Commercial Paper - 13.6% |
| Due Date | Yield (a) | Principal Amount (000s) | Value (000s) |
Abbott Laboratories |
| 4/26/10 | 0.32% (d) | $ 80,000 | $ 80,000 |
American Honda Finance Corp. |
| 8/10/10 | 0.35 | 20,000 | 19,969 |
Autobahn Funding |
| 3/1/10 to 3/8/10 | 0.20 to 0.24 | 31,000 | 31,000 |
Banco Bilbao Vizcaya Argentaria SA (London Branch) |
| 3/18/10 | 0.30 | 56,000 | 55,992 |
Bayerische Landesbank |
| 3/11/10 | 0.40 | 149,000 | 148,983 |
Commerzbank U.S. Finance, Inc. |
| 3/10/10 to 8/10/10 | 0.20 to 0.45 | 202,000 | 201,782 |
CVS Caremark Corp. |
| 3/1/10 | 0.20 | 7,000 | 7,000 |
Dakota Notes (Citibank Credit Card Issuance Trust) |
| 3/5/10 to 4/7/10 | 0.20 to 0.21 | 105,000 | 104,994 |
Devon Energy Corp. |
| 3/11/10 | 0.24 | 25,000 | 24,998 |
DnB NOR Bank ASA |
| 3/19/10 to 4/1/10 | 0.22 (d) | 147,000 | 147,000 |
Gotham Funding Corp. |
| 4/9/10 | 0.20 | 9,000 | 8,998 |
Groupe BPCE |
| 4/6/10 | 0.30 | 86,000 | 85,974 |
Irish Republic |
| 3/2/10 to 5/21/10 | 0.32 to 0.40 | 118,000 | 117,908 |
Landesbank Hessen-Thuringen |
| 7/6/10 to 8/9/10 | 0.63 | 67,000 | 66,836 |
Natexis Banques Populaires U.S. Finance Co. LLC |
| 5/18/10 | 0.30 | 115,000 | 114,925 |
Nationwide Building Society |
| 3/1/10 to 6/1/10 | 0.25 to 0.37 | 68,000 | 67,983 |
Norddeutsche Landesbank (New York Branch) |
| 3/15/10 to 5/11/10 | 0.33 to 0.40 | 108,000 | 107,947 |
Pfizer, Inc. |
| 4/20/10 to 4/30/10 | 0.60 to 0.65 | 72,000 | 71,930 |
Commercial Paper - continued |
| Due Date | Yield (a) | Principal Amount (000s) | Value (000s) |
Sumitomo Trust & Banking Co. Ltd. New York Branch Program |
| 3/9/10 | 0.20% | $ 19,000 | $ 18,999 |
Toronto Dominion Holdings (USA) |
| 3/8/10 | 0.55 | 11,000 | 10,999 |
Toyota Motor Credit Corp. |
| 4/1/10 to 5/17/10 | 0.25 to 0.27 | 114,000 | 113,948 |
Transocean Ltd. |
| 3/8/10 | 0.25 | 11,000 | 10,999 |
UniCredito Italiano Bank (Ireland) PLC |
| 4/22/10 to 5/28/10 | 0.30 to 0.36 | 262,000 | 261,824 |
Vodafone Group PLC |
| 3/1/10 | 0.20 | 9,000 | 9,000 |
Westpac Banking Corp. |
| 3/11/10 to 5/11/10 | 0.26 to 0.70 (d) | 412,000 | 411,924 |
XTO Energy, Inc. |
| 3/12/10 to 3/26/10 | 0.23 to 0.24 | 34,500 | 34,496 |
TOTAL COMMERCIAL PAPER | 2,336,408 |
U.S. Government and Government Agency Obligations - 2.7% |
|
Other Government Related - 2.7% |
Bank of America NA (FDIC Guaranteed) |
| 3/15/10 to 4/29/10 | 0.28 to 0.30 (c)(d) | 269,414 | 269,414 |
Citibank NA (FDIC Guaranteed) |
| 3/30/10 | 0.30 (c)(d) | 44,000 | 44,000 |
General Electric Capital Corp. (FDIC Guaranteed) |
| 4/8/10 | 0.30 (c)(d) | 158,035 | 158,035 |
TOTAL U.S. GOVERNMENT AND GOVERNMENT AGENCY OBLIGATIONS | 471,449 |
Federal Agencies - 7.0% |
|
Federal Home Loan Bank - 7.0% |
| 3/2/10 to 3/14/11 | 0.14 to 1.01 (d) | 1,199,900 | 1,199,568 |
U.S. Treasury Obligations - 6.9% |
| Due Date | Yield (a) | Principal Amount (000s) | Value (000s) |
|
U.S. Treasury Bills - 6.1% |
| 3/11/10 to 10/21/10 | 0.20 to 0.73% | $ 1,055,773 | $ 1,054,143 |
U.S. Treasury Notes - 0.8% |
| 1/31/11 | 0.47 to 0.48 | 135,000 | 135,485 |
TOTAL U.S. TREASURY OBLIGATIONS | 1,189,628 |
Bank Notes - 0.6% |
|
Bank of America NA |
| 3/4/10 to 3/15/10 | 0.28 to 0.30 (d) | 112,000 | 112,000 |
Medium-Term Notes - 8.0% |
|
AT&T, Inc. |
| 4/2/10 | 0.70 (b)(d) | 152,000 | 152,000 |
Banque Federative du Credit Mutuel |
| 2/28/10 | 0.65 (b)(d) | 96,000 | 96,000 |
Berkshire Hathaway, Inc. |
| 5/10/10 | 0.23 (d) | 41,500 | 41,500 |
BP Capital Markets PLC |
| 3/11/10 | 0.39 (d) | 65,000 | 65,000 |
Cellco Partnership |
| 3/29/10 | 0.80 (b)(d) | 74,000 | 74,000 |
Commonwealth Bank of Australia |
| 3/4/10 to 3/15/10 | 0.28 (b)(d) | 214,000 | 214,000 |
Metropolitan Life Global Funding I |
| 6/3/10 | 0.95 (b)(d) | 29,000 | 29,000 |
New York Life Insurance Co. |
| 3/31/10 to 5/14/10 | 1.30 to 1.40 (d)(g) | 109,000 | 109,000 |
Procter & Gamble International Funding SCA |
| 5/7/10 | 0.26 (d) | 34,000 | 34,000 |
Royal Bank of Canada |
| 3/15/10 to 5/17/10 | 0.57 to 0.67 (b)(d) | 170,000 | 170,000 |
Verizon Communications, Inc. |
| 3/15/10 | 0.65 (d) | 105,000 | 105,000 |
Medium-Term Notes - continued |
| Due Date | Yield (a) | Principal Amount (000s) | Value (000s) |
Westpac Banking Corp. |
| 3/23/10 to 5/11/10 | 0.26 to 0.29% (b)(d) | $ 296,000 | $ 296,000 |
TOTAL MEDIUM-TERM NOTES | 1,385,500 |
Short-Term Notes - 0.3% |
|
Metropolitan Life Insurance Co. |
| 4/1/10 | 1.00 (d)(g) | 45,000 | 45,000 |
Time Deposits - 0.5% |
|
Banco Santander SA |
| 3/31/10 to 4/16/10 | 0.25 | 89,000 | 89,000 |
Asset-Backed Securities - 0.0% |
|
Bank of America Auto Trust |
| 9/15/10 | 0.39 (b) | 4,262 | 4,262 |
Harley-Davidson Motorcycle Trust |
| 7/15/10 | 0.71 | 606 | 606 |
TOTAL ASSET-BACKED SECURITIES | 4,868 |
Municipal Securities - 0.8% |
|
ABAG Fin. Auth. for Nonprofit Corps. Multi-family Hsg. Rev. Series 2000 A, VRDN |
| 3/5/10 | 0.17 (d)(e) | 15,000 | 15,000 |
Butler County Health Facilities Rev. Series 2002, VRDN |
| 3/5/10 | 0.18 (d) | 15,000 | 15,000 |
California Dept. of Wtr. Resources Pwr. Supply Rev. Series 2008 J2, VRDN |
| 3/5/10 | 0.17 (d) | 7,000 | 7,000 |
California Hsg. Fin. Agcy. Rev. Series 2003 F, VRDN |
| 3/5/10 | 0.17 (d)(e) | 21,620 | 21,620 |
Maryland Health & Higher Edl. Facilities Auth. Rev. Series 2008 B, VRDN |
| 3/5/10 | 0.18 (d) | 20,250 | 20,250 |
Massachusetts Bay Trans. Auth. Sales Tax Rev. Series 2008 A2, VRDN |
| 3/5/10 | 0.20 (d) | 26,870 | 26,870 |
Middletown Hosp. Facilities Rev. Series 2008 B, VRDN |
| 3/5/10 | 0.17 (d) | 19,430 | 19,430 |
Municipal Securities - continued |
| Due Date | Yield (a) | Principal Amount (000s) | Value (000s) |
New York Hsg. Fin. Agcy. Rev. Series 2005 A, VRDN |
| 3/5/10 | 0.15% (d)(e) | $ 12,500 | $ 12,500 |
TOTAL MUNICIPAL SECURITIES | 137,670 |
Repurchase Agreements - 13.9% |
| Maturity Amount (000s) | | |
In a joint trading account at 0.12% dated 2/26/10 due 3/1/10 (Collateralized by U.S. Government Obligations) # | $ 161,088 | | 161,086 |
With: | | | |
Banc of America Securities LLC at: | | | |
0.32%, dated 2/26/10 due 3/1/10 (Collateralized by Corporate Obligations valued at $49,351,317, 6.05% - 7.5%, 8/15/12 - 2/15/19) | 47,001 | | 47,000 |
0.64%, dated 2/26/10 due 3/1/10 (Collateralized by Corporate Obligations valued at $218,171,636, 0% - 10%, 6/15/19 - 3/4/53) | 202,011 | | 202,000 |
Barclays Capital, Inc. at: | | | |
0.32%, dated 2/17/10 due 5/18/10 (Collateralized by Corporate Obligations valued at $5,250,561, 6.5%, 1/18/11) | 5,004 | | 5,000 |
0.39%, dated 2/26/10 due 3/1/10 (Collateralized by Equity Securities valued at $5,400,207) | 5,000 | | 5,000 |
0.4%, dated: | | | |
1/25/10 due 4/19/10 (Collateralized by Mortgage Loan Obligations valued at $16,806,533, 5.29% - 5.7%, 6/25/45 - 7/10/46) | 16,015 | | 16,000 |
2/16/10 due 3/18/10 (Collateralized by Equity Securities valued at $42,126,091) | 39,013 | | 39,000 |
0.45%, dated: | | | |
2/4/10 due 3/5/10 (Collateralized by Corporate Obligations valued at $14,044,388, 0.37%, 7/25/13) | 13,005 | | 13,000 |
2/10/10 due 4/9/10 (Collateralized by Corporate Obligations valued at $10,802,565, 0.29% - 0.36%, 4/25/37 - 6/25/37) | 10,007 | | 10,000 |
2/19/10 due 3/19/10 (Collateralized by Corporate Obligations valued at $22,682,835, 0.6% - 6.9%, 4/10/28 - 4/25/36) | 21,007 | | 21,000 |
0.5%, dated 1/25/10 due: | | | |
4/9/10 (Collateralized by Corporate Obligations valued at $14,046,826, 0.37% - 0.78%, 6/17/13 - 7/25/13) | 13,013 | | 13,000 |
Repurchase Agreements - continued |
| Maturity Amount (000s) | | Value (000s) |
With: - continued | | | |
Barclays Capital, Inc. at: | | | |
0.5%, dated 1/25/10 due: | | | |
4/26/10 (Collateralized by Corporate Obligations valued at $14,046,826, 0.37% - 0.43%, 7/25/13 - 10/25/35) | $ 13,016 | | $ 13,000 |
0.55%, dated: | | | |
12/22/09 due 3/22/10 (Collateralized by Corporate Obligations valued at $29,190,740, 0.61% - 7.24%, 8/7/37 - 9/25/37) | 27,037 | | 27,000 |
12/28/09 due 3/26/10 (Collateralized by Corporate Obligations valued at $29,188,067, 0.61% - 7.24%, 2/20/14 - 9/25/37) | 27,036 | | 27,000 |
1/4/10 due 4/1/10 (Collateralized by Corporate Obligations valued at $17,294,784, 0.29% - 6.9%, 4/10/28 - 12/25/32) | 16,021 | | 16,000 |
0.59%, dated 2/26/10 due 3/1/10 (Collateralized by Corporate Obligations valued at $291,614,419, 2.5% - 4.25%, 3/29/13 - 3/15/47) | 270,013 | | 270,000 |
Citigroup Global Markets, Inc. at: | | | |
0.49%, dated 2/23/10 due 3/2/10 (Collateralized by Equity Securities valued at $14,043,533) | 13,001 | | 13,000 |
0.54%, dated 2/26/10 due 3/1/10 (Collateralized by Mortgage Loan Obligations valued at $250,339,792, 0.38% - 11.75%, 9/29/14 - 11/20/57) | 232,010 | | 232,000 |
Credit Suisse Securities (USA) LLC at 0.29%, dated 2/26/10 due 3/1/10 (Collateralized by Equity Securities valued at $678,709,644) | 617,015 | | 617,000 |
Deutsche Bank Securities, Inc. at: | | | |
0.27%, dated: | | | |
1/5/10 due 3/5/10 (Collateralized by Commercial Paper Obligations valued at $9,274,232, 3/16/10) | 9,004 | | 9,000 |
1/15/10 due 3/30/10 (Collateralized by Commercial Paper Obligations valued at $8,243,159, 3/10/10 - 4/14/10) | 8,004 | | 8,000 |
1/20/10 due 3/30/10 (Collateralized by Commercial Paper Obligations valued at $11,335,325, 3/29/10 - 4/20/10) | 11,006 | | 11,000 |
0.35%, dated: | | | |
1/14/10 due 4/16/10 (Collateralized by Corporate Obligations valued at $57,060,223, 4.88% - - 11.25%, 5/10/10 - 5/15/31) | 53,047 | | 53,000 |
1/22/10 due: | | | |
4/28/10 (Collateralized by Corporate Obligations valued at $27,917,131, 4.9% - 10.55%, 2/15/14 - 8/15/31) | 26,024 | | 26,000 |
Repurchase Agreements - continued |
| Maturity Amount (000s) | | Value (000s) |
With: - continued | | | |
Deutsche Bank Securities, Inc. at: | | | |
0.35%, dated: | | | |
1/22/10 due: | | | |
4/30/10 (Collateralized by Corporate Obligations valued at $27,772,426, 2.75% - 10.38%, 2/1/11 - 2/26/37) | $ 26,025 | | $ 26,000 |
0.4%, dated: | | | |
1/8/10 due 4/8/10 (Collateralized by Corporate Obligations valued at $29,164,021, 0.3% - 11.5%, 2/4/17 - 7/19/46) | 27,027 | | 27,000 |
1/11/10 due 4/13/10 (Collateralized by Corporate Obligations valued at $28,898,601, 0.52% - - 8.14%, 1/2/23 - 7/1/43) | 27,028 | | 27,000 |
1/20/10 due 4/20/10 (Collateralized by Mortgage Loan Obligations valued at $14,046,240, 0% - 11.5%, 2/4/17 - 11/20/48) | 13,013 | | 13,000 |
2/2/10 due: | | | |
5/4/10 (Collateralized by Corporate Obligations valued at $27,823,561, 4.88% - 11.25%, 11/8/10 - 8/15/31) | 26,026 | | 26,000 |
5/7/10 (Collateralized by Corporate Obligations valued at $13,726,135, 5.25% - 12.38%, 4/15/15 - 9/15/33) | 13,014 | | 13,000 |
5/10/10 (Collateralized by Corporate Obligations valued at $14,042,382, 1.05% - 10.55%, 2/1/11 - 6/1/56) | 13,014 | | 13,000 |
0.6%, dated 1/15/10 due 3/16/10 (Collateralized by Corporate Obligations valued at $13,660,760, 5.5%, 4/15/29) | 13,013 | | 13,000 |
Goldman Sachs & Co. at 0.24%, dated 2/26/10 due 3/5/10 (Collateralized by Commercial Paper Obligations valued at $21,630,433, 3/1/10) (d)(f) | 21,001 | | 21,000 |
ING Financial Markets LLC at: | | | |
0.3%, dated 2/22/10 due 5/24/10 (Collateralized by Corporate Obligations valued at $26,255,507, 1.32% - 8.88%, 7/26/10 - 11/15/38) | 25,019 | | 25,000 |
0.33%, dated 1/7/10 due 4/9/10 (Collateralized by Corporate Obligations valued at $7,354,707, 3.88% - 4.88%, 3/15/14 - 9/16/15) | 7,006 | | 7,000 |
J.P. Morgan Securities, Inc. at 0.19%, dated 2/26/10 due 3/1/10 (Collateralized by U.S. Government Obligations valued at $79,312,578, 6.15%, 9/1/39) | 77,001 | | 77,000 |
Merrill Lynch, Pierce, Fenner & Smith at 0.44%, dated 2/22/10 due 5/21/10 (Collateralized by Equity Securities valued at $56,223,117) (d)(f) | 52,057 | | 52,000 |
Repurchase Agreements - continued |
| Maturity Amount (000s) | | Value (000s) |
With: - continued | | | |
Morgan Stanley & Co. at: | | | |
0.5%, dated 2/5/10 due 3/5/10 (Collateralized by Corporate Obligations valued at $42,211,634, 3.47% - 12.5%, 6/29/10 - 3/31/56) | $ 39,015 | | $ 39,000 |
0.75%, dated 1/14/10 due 4/14/10 (Collateralized by Corporate Obligations valued at $113,961,568, 0.37% - 5.28%, 7/25/13 - 1/6/48) | 106,199 | | 106,000 |
UBS Securities LLC at 0.3%, dated: | | | |
2/9/10 due 5/10/10 (Collateralized by Corporate Obligations valued at $27,305,264, 0.12% - 0.54%, 4/15/22 - 11/14/22) | 26,020 | | 26,000 |
2/17/10 due 5/17/10 (Collateralized by Corporate Obligations valued at $19,953,663, 0.12% - 0.54%, 4/15/22 - 11/14/22) | 19,014 | | 19,000 |
Wells Fargo Securities, LLC at 0.32%, dated 1/27/10 due 4/27/10 (Collateralized by Commercial Paper Obligations valued at $8,242,418, 4/21/10) | 8,006 | | 8,000 |
TOTAL REPURCHASE AGREEMENTS | 2,392,086 |
TOTAL INVESTMENT PORTFOLIO - 100.8% (Cost $17,368,016) | | 17,368,016 |
NET OTHER ASSETS - (0.8)% | | (130,491) |
NET ASSETS - 100% | $ 17,237,525 |
Security Type Abbreviations |
VRDN - VARIABLE RATE DEMAND NOTE |
Legend |
(a) Yield represents either the annualized yield at the date of purchase, or the stated coupon rate, or, for floating rate securities, the rate at period end. |
(b) Security exempt from registration under Rule 144A of the Securities Act of 1933. These securities may be resold in transactions exempt from registration, normally to qualified institutional buyers. At the end of the period, the value of these securities amounted to $1,035,262,000 or 6.0% of net assets. |
(c) Under the Temporary Liquidity Guarantee Program, the Federal Deposit Insurance Corporation guarantees principal and interest in the event of payment default or bankruptcy until the earlier of maturity date of the debt or until June 30, 2012. At the end of the period these securities amounted to $471,449,000 or 2.7% of net assets. |
(d) Coupon rates for floating and adjustable rate securities reflect the rates in effect at period end. Due dates for these security types are the next interest rate reset date or, when applicable, the final maturity date. |
(e) Private activity obligations whose interest is subject to the federal alternative minimum tax for individuals. |
(f) The maturity amount is based on the rate at period end. |
(g) Restricted securities - Investment in securities not registered under the Securities Act of 1933 (excluding 144A issues). At the end of the period, the value of restricted securities (excluding 144A issues) amounted to $154,000,000 or 0.9% of net assets. |
Additional information on each holding is as follows: |
Security | Acquisition Date | Cost
(000s) |
Metropolitan Life Insurance Co. 1%, 4/1/10 | 3/26/02 | $ 45,000 |
New York Life Insurance Co.: 1.3%, 5/14/10 | 5/8/09 | $ 42,000 |
1.4%, 3/31/10 | 3/23/09 | $ 67,000 |
# Additional information on each counterparty to the repurchase agreement is as follows: |
Repurchase Agreement / Counterparty | Value
(Amounts in thousands) |
$161,086,000 due 3/01/10 at 0.12% |
BNP Paribas Securities Corp. | $ 12,178 |
Banc of America Securities LLC | 7,494 |
Bank of America, NA | 17,157 |
Barclays Capital, Inc. | 7,962 |
Citigroup Global Markets, Inc. | 7,494 |
Credit Suisse Securities (USA) LLC | 7,494 |
Deutsche Bank Securities, Inc. | 33,722 |
RBS Securities, Inc. | 7,494 |
ING Financial Markets LLC | 12,740 |
J.P. Morgan Securities, Inc. | 4,167 |
Merrill Lynch Government Securities, Inc. | 3,747 |
Morgan Stanley & Co., Inc. | 10,117 |
RBC Capital Markets Corp. | 1,030 |
Societe Generale, New York Branch | 7,494 |
UBS Securities LLC | 10,492 |
Wachovia Bank NA | 10,304 |
| $ 161,086 |
Other Information |
All investments are categorized as Level 2 under the Fair Value Hierarchy. The inputs or methodology used for valuing securities may not be an indication of the risk associated with investing in those securities. For more information on valuation inputs, please refer to the Security Valuation section in the accompanying Notes to Financial Statements. |
See accompanying notes which are an integral part of the financial statements.
Semiannual Report
Statement of Assets and Liabilities
Amounts in thousands (except per-share amount) | February 28, 2010 (Unaudited) |
| | |
Assets | | |
Investment in securities, at value (including repurchase agreements of $2,392,086) - See accompanying schedule: Unaffiliated issuers (cost $17,368,016) | | $ 17,368,016 |
Cash | | 134 |
Receivable for fund shares sold | | 44,190 |
Interest receivable | | 11,349 |
Other receivables | | 253 |
Total assets | | 17,423,942 |
| | |
Liabilities | | |
Payable for investments purchased | $ 135,992 | |
Payable for fund shares redeemed | 44,671 | |
Accrued management fee | 5,500 | |
Other affiliated payables | 2 | |
Other payables and accrued expenses | 252 | |
Total liabilities | | 186,417 |
| | |
Net Assets | | $ 17,237,525 |
Net Assets consist of: | | |
Paid in capital | | $ 17,237,400 |
Undistributed net investment income | | 6 |
Accumulated undistributed net realized gain (loss) on investments | | 119 |
Net Assets, for 17,235,983 shares outstanding | | $ 17,237,525 |
Net Asset Value, offering price and redemption price per share ($17,237,525 ÷ 17,235,983 shares) | | $ 1.00 |
See accompanying notes which are an integral part of the financial statements.
Semiannual Report
Statement of Operations
Amounts in thousands | Six months ended February 28, 2010 (Unaudited) |
| | |
Investment Income | | |
Interest | | $ 45,123 |
| | |
Expenses | | |
Management fee | $ 36,887 | |
Independent trustees' compensation | 33 | |
Miscellaneous | 317 | |
Total expenses before reductions | 37,237 | |
Expense reductions | (534) | 36,703 |
Net investment income | | 8,420 |
Realized and Unrealized Gain (Loss) Net realized gain (loss) on: | | |
Investment securities: | | |
Unaffiliated issuers | | 236 |
Net increase in net assets resulting from operations | | $ 8,656 |
See accompanying notes which are an integral part of the financial statements.
Semiannual Report
Financial Statements - continued
Statement of Changes in Net Assets
Amounts in thousands | Six months ended February 28, 2010 (Unaudited) | Year ended
August 31,
2009 |
Increase (Decrease) in Net Assets | | |
Operations | | |
Net investment income | $ 8,420 | $ 261,362 |
Net realized gain (loss) | 236 | 3,741 |
Net increase in net assets resulting
from operations | 8,656 | 265,103 |
Distributions to shareholders from net investment income | (8,414) | (261,370) |
Distributions to shareholders from net realized gain | (2,284) | - |
Total distributions | (10,698) | (261,370) |
Share transactions at net asset value of $1.00 per share
Proceeds from sales of shares | 4,367,568 | 13,450,269 |
Reinvestment of distributions | 10,690 | 261,277 |
Cost of shares redeemed | (5,185,866) | (11,958,023) |
Net increase (decrease) in net assets and shares resulting from share transactions | (807,608) | 1,753,523 |
Total increase (decrease) in net assets | (809,650) | 1,757,256 |
| | |
Net Assets | | |
Beginning of period | 18,047,175 | 16,289,919 |
End of period (including undistributed net investment income of $6 and $0, respectively) | $ 17,237,525 | $ 18,047,175 |
See accompanying notes which are an integral part of the financial statements.
Semiannual Report
Financial Highlights
| Six months ended
February 28, 2010 | Years ended August 31, |
| (Unaudited) | 2009 | 2008 | 2007 | 2006 | 2005 |
Selected Per-Share Data | | | | | |
Net asset value, beginning of period | $ 1.00 | $ 1.00 | $ 1.00 | $ 1.00 | $ 1.00 | $ 1.00 |
Income from Investment Operations | | | | | | |
Net investment income | - E | .015 | .037 | .050 | .042 | .022 |
Distributions from net investment income | -E | (.015) | (.037) | (.050) | (.042) | (.022) |
Net asset value, end of period | $ 1.00 | $ 1.00 | $ 1.00 | $ 1.00 | $ 1.00 | $ 1.00 |
Total Return B, C | .06% | 1.46% | 3.72% | 5.15% | 4.32% | 2.23% |
Ratios to Average Net Assets D | | | | | |
Expenses before reductions | .43%A | .45% | .42% | .42% | .42% | .42% |
Expenses net of fee waivers, if any | .42%A | .45% | .42% | .42% | .42% | .42% |
Expenses net of all reductions | .42%A | .45% | .40% | .39% | .40% | .41% |
Net investment income | .10%A | 1.43% | 3.66% | 5.03% | 4.24% | 2.21% |
Supplemental Data | | | | | | |
Net assets, end of period (in millions) | $ 17,238 | $ 18,047 | $ 16,290 | $ 16,057 | $ 16,609 | $ 16,164 |
A Annualized
B Total returns for periods of less than one year are not annualized.
C Total returns would have been lower had certain expenses not been reduced during the periods shown.
D Expense ratios reflect operating expenses of the Fund. Expenses before reductions do not reflect amounts reimbursed or waived or reductions from expense offset arrangements and do not represent the amount paid by the Fund during periods when reimbursements, waivers or reductions occur. Expenses net of fee waivers reflect expenses after reimbursement and waivers but prior to reductions from expense offset arrangements. Expenses net of all reductions represent the net expenses paid by the Fund.
E Amount represents less than $.001 per share.
See accompanying notes which are an integral part of the financial statements.
Semiannual Report
Notes to Financial Statements
For the period ended February 28, 2010 (Unaudited)
(Amounts in thousands except ratios)
1. Organization.
Retirement Money Market Portfolio (the Fund) is a fund of Fidelity Money Market Trust (the trust) and is authorized to issue an unlimited number of shares. The trust is registered under the Investment Company Act of 1940, as amended (the 1940 Act), as an open-end management investment company organized as a Delaware statutory trust.
2. Significant Accounting Policies.
The financial statements have been prepared in conformity with accounting principles generally accepted in the United States of America, which require management to make certain estimates and assumptions at the date of the financial statements. Actual results could differ from those estimates. The following summarizes the significant accounting policies of the Fund:
Security Valuation. The Fund categorizes the inputs to valuation techniques used to value its investments into a disclosure hierarchy consisting of three levels as shown below.
Level 1 - quoted prices in active markets for identical investments
Level 2 - other significant observable inputs (including quoted prices for similar investments, interest rates, prepayment speeds, etc.)
Level 3 - unobservable inputs (including the fund's own assumptions based on the best information available)
As permitted by compliance with certain conditions under Rule 2a-7 of the 1940 Act, securities are valued at amortized cost, which approximates value and are categorized as Level 2 in the hierarchy.
Investment Transactions and Income. The net asset value per share for processing shareholder transactions is calculated as of the close of business of the New York Stock Exchange (NYSE), normally 4:00 p.m. Eastern time. Security transactions are accounted for as of trade date. Gains and losses on securities sold are determined on the basis of identified cost. Interest income is accrued as earned. Interest income includes coupon interest and amortization of premium and accretion of discount on debt securities.
Expenses. Most expenses of the trust can be directly attributed to a fund. Expenses which cannot be directly attributed are apportioned among each Fund in the trust. Expense estimates are accrued in the period to which they relate and adjustments are made when actual amounts are known.
Semiannual Report
2. Significant Accounting Policies - continued
Expenses - continued
The Fund participated in the U.S. Treasury Department's Temporary Guarantee Program for Money Market Funds (the "Program") through September 18, 2009. The Fund paid the U.S. Treasury Department fees equal to 0.04% based on the number of shares outstanding as of September 19, 2008 to participate in the Program through September 18, 2009. The expense was borne by the Fund without regard to any expense limitation in effect for the Fund.
Deferred Trustee Compensation. Under a Deferred Compensation Plan (the Plan), independent Trustees may elect to defer receipt of a portion of their annual compensation. Deferred amounts are invested in a cross-section of Fidelity funds, are marked-to-market and remain in the Fund until distributed in accordance with the Plan. The investment of deferred amounts and the offsetting payable to the Trustees are included in the accompanying Statement of Assets and Liabilities.
Income Tax Information and Distributions to Shareholders. Each year, the Fund intends to qualify as a regulated investment company by distributing substantially all of its taxable income and realized gains under Subchapter M of the Internal Revenue Code and filing its U.S. federal tax return. As a result, no provision for income taxes is required. A Fund's federal tax return is subject to examination by the Internal Revenue Service (IRS) for a period of three years.
Dividends are declared daily and paid monthly from net investment income. Distributions from realized gains, if any, are recorded on the ex-dividend date. Income and capital gain distributions are determined in accordance with income tax regulations, which may differ from generally accepted accounting principles.
Book-tax differences are primarily due to deferred trustees compensation and excise tax regulations.
The federal tax cost of investment securities and unrealized appreciation (depreciation) as of period end were as follows:
Gross unrealized appreciation | $ - |
Gross unrealized depreciation | - |
Net unrealized appreciation (depreciation) | $ - |
| |
Tax cost | $ 17,368,016 |
Semiannual Report
Notes to Financial Statements (Unaudited) - continued
(Amounts in thousands except ratios)
3. Operating Policies.
Repurchase Agreements. Fidelity Management & Research Company (FMR) has received an Exemptive Order from the Securities and Exchange Commission (the SEC) which permits the Fund and other affiliated entities of FMR to transfer uninvested cash balances into joint trading accounts which are then invested in repurchase agreements. The Fund may also invest directly with institutions in repurchase agreements. Repurchase agreements are collateralized by government or non-government securities. Upon settlement date, collateral is held in segregated accounts with custodian banks and may be obtained in the event of a default of the counterparty. The Fund monitors, on a daily basis, the value of the collateral to ensure it is at least equal to the principal amount of the repurchase agreement (including accrued interest). In the event of a default by the counterparty, realization of the collateral proceeds could be delayed, during which time the value of the collateral may decline.
Reverse Repurchase Agreements. To enhance its yield, the Fund may enter into reverse repurchase agreements whereby the Fund transfers securities to a counterparty who then agrees to transfer them back to the Fund at a future date and agreed upon price, reflecting a rate of interest below market rate. Securities sold under a reverse repurchase agreement are recorded as a liability in the accompanying Statement of Assets and Liabilities. The Fund receives cash proceeds, which are invested in other securities, and agrees to repay the proceeds plus any accrued interest in return for the same securities transferred. The Fund continues to receive interest payments on the transferred securities during the term of the reverse repurchase agreement. During the period that a reverse repurchase agreement is outstanding, the Fund identifies cash and liquid securities as segregated in its custodian records with a value at least equal to its obligation under the agreement. If the counterparty defaults on its obligation, because of insolvency or other reasons, the Fund could experience delays and costs in recovering the security or in gaining access to the collateral. At period end, there were no reverse repurchase agreements outstanding.
Restricted Securities. The Fund may invest in securities that are subject to legal or contractual restrictions on resale. These securities generally may be resold in transactions exempt from registration or to the public if the securities are registered. Disposal of these securities may involve time-consuming negotiations and expense, and prompt sale at an acceptable price may be difficult. Information regarding restricted securities is included at the end of the Fund's Schedule of Investments.
Semiannual Report
4. Fees and Other Transactions with Affiliates.
Management Fee. FMR and its affiliates provide the Fund with investment management related services for which the Fund pays a monthly management fee that is based on an annual rate of .42% of the Fund's average net assets. FMR pays all other expenses, except the compensation of the independent Trustees and certain exceptions such as interest expense. The management fee paid to FMR by the Fund is reduced by an amount equal to the fees and expenses paid by the Fund to the independent Trustees.
5. Expense Reductions.
FMR or its affiliates voluntarily agreed to waive certain fees during the period. The amount of the waiver is $534.
6. Other.
The Fund's organizational documents provide former and current trustees and officers with a limited indemnification against liabilities arising in connection with the performance of their duties to the Fund. In the normal course of business, the Fund may also enter into contracts that provide general indemnifications. The Fund's maximum exposure under these arrangements is unknown as this would be dependent on future claims that may be made against the Fund. The risk of material loss from such claims is considered remote.
Semiannual Report
Board Approval of Investment Advisory Contracts and Management Fees
Fidelity Retirement Money Market Portfolio
Each year, the Board of Trustees, including the Independent Trustees (together, the Board), votes on the renewal of the management contract and sub-advisory agreements (together, the Advisory Contracts) for the fund. The Board, assisted by the advice of fund counsel and Independent Trustees' counsel, requests and considers a broad range of information throughout the year.
The Board meets regularly and considers at each of its meetings factors that are relevant to its annual consideration of the renewal of the fund's Advisory Contracts, including the services and support provided to the fund and its shareholders. The Board has established three standing committees, each composed of Independent Trustees with varying backgrounds, to which the Board has assigned specific subject matter responsibilities in order to enhance effective decision-making by the Board. The Operations Committee meets regularly throughout the year and, among other matters, considers matters specifically related to the annual consideration of the renewal of the fund's Advisory Contracts. The Board, acting directly and through its Committees, requests and receives information concerning the annual consideration of the renewal of the fund's Advisory Contracts. The Board also meets as needed to consider matters specifically related to the Board's annual consideration of the renewal of Advisory Contracts.
At its September 2009 meeting, the Board of Trustees, including the Independent Trustees, unanimously determined to renew the fund's Advisory Contracts. In reaching its determination, the Board considered all factors it believed relevant, including (i) the nature, extent, and quality of the services to be provided to the fund and its shareholders (including the investment performance of the fund); (ii) the competitiveness of the fund's management fee and total expenses; (iii) the total costs of the services to be provided by and the profits to be realized by Fidelity from its relationship with the fund; (iv) the extent to which economies of scale would be realized as the fund grows; and (v) whether fee levels reflect these economies of scale, if any, for the benefit of fund shareholders.
In considering whether to renew the Advisory Contracts for the fund, the Board ultimately reached a determination, with the assistance of fund counsel and Independent Trustees' counsel and through the exercise of its business judgment, that the renewal of the Advisory Contracts and the compensation to be received by Fidelity under the management contract is consistent with Fidelity's fiduciary duty under applicable law. The Board's decision to renew the Advisory Contracts was not based on any single factor noted above, but rather was based on a comprehensive consideration of all the information provided to the Board at its meetings throughout the year. The Board, in reaching its determination to renew the Advisory Contracts, is aware that shareholders in the fund have a broad range of investment choices available to them, including a wide choice among mutual funds offered by competitors to Fidelity, and that the fund's shareholders, with the opportunity to review and weigh the disclosure provided by the fund in its prospectus and other public disclosures, have chosen to invest in this fund, managed by Fidelity.
Semiannual Report
Board Approval of Investment Advisory Contracts and
Management Fees - continued
Nature, Extent, and Quality of Services Provided. The Board considered staffing within the investment adviser, FMR, and the sub-advisers (together, the Investment Advisers), including the backgrounds of the fund's investment personnel and the fund's investment objective and discipline. The Independent Trustees also had discussions with senior management of Fidelity's investment operations and investment groups. The Board considered the structure of the portfolio manager compensation program and whether this structure provides appropriate incentives.
Resources Dedicated to Investment Management and Support Services. The Board reviewed the size, education, and experience of the Investment Advisers' investment staff, their use of technology, and the Investment Advisers' approach to recruiting, training, and retaining portfolio managers and other research, advisory, and management personnel. In response to the recent financial crisis, Fidelity took a number of actions intended to cut costs and improve efficiency without weakening the investment teams or resources. The Board specifically noted Fidelity's response to the 2008 credit market crisis. The Board noted that Fidelity's analysts have access to a variety of technological tools and market and securities data that enable them to perform both fundamental and quantitative analysis and to specialize in various disciplines. The Board considered Fidelity's extensive global research capabilities that enable the Investment Advisers to aggregate data from various sources in an effort to produce positive investment results. The Board also considered that Fidelity's portfolio managers and analysts have access to daily portfolio attribution that allows for monitoring of a fund's portfolio, as well as an electronic communication system that provides immediate real-time access to research concerning issuers and credit enhancers. In addition, the Board considered the trading resources that are an integral part of the fixed-income portfolio management investment process.
Shareholder and Administrative Services. The Board considered (i) the nature, extent, quality, and cost of advisory, administrative, distribution, and shareholder services performed by the Investment Advisers and their affiliates under the Advisory Contracts and under separate agreements covering transfer agency and pricing and bookkeeping services for the fund; (ii) the nature and extent of the Investment Advisers' supervision of third party service providers, principally custodians and subcustodians; and (iii) the resources devoted to, and the record of compliance with, the fund's compliance policies and procedures.
The Board noted that the growth of fund assets over time across the complex allows Fidelity to reinvest in the development of services designed to enhance the value or convenience of the Fidelity funds as investment vehicles. These services include 24-hour access to account information and market information through phone representatives and over the Internet, and investor education materials and asset allocation tools.
Semiannual Report
Investment in a Large Fund Family. The Board considered the benefits to shareholders of investing in a Fidelity fund, including the benefits of investing in a fund that is part of a large family of funds offering a variety of investment disciplines and providing a large variety of mutual fund investor services. The Board noted that Fidelity had taken a number of actions over the previous year that benefited particular funds, including (i) dedicating additional resources to investment research and to restructure and broaden the focus of the investment research teams; (ii) bolstering the senior management team that oversees asset management; (iii) contractually agreeing to reduce the management fee on Fidelity U.S. Bond Index Fund; and (iv) expanding Class A and Class T load waiver categories to increase rollover retention opportunities and create consistent policies across the classes.
Investment Performance. The Board considered whether the fund has operated in accordance with its investment objective, as well as its record of compliance with its investment restrictions. It also reviewed the fund's absolute investment performance, as well as the fund's relative investment performance measured against a peer group of mutual funds deemed appropriate by the Board over multiple periods. The following charts considered by the Board show, over the one-, three-, and five-year periods ended December 31, 2008, the fund's cumulative total returns and a range of cumulative total returns of a peer group of mutual funds identified by Lipper Inc. as having an investment objective similar to that of the fund. The box within each chart shows the 25th percentile return (bottom of box) and the 75th percentile return (top of box) of the peer group. Returns shown above the box are in the first quartile and returns shown below the box are in the fourth quartile. The percentage beaten number noted below each chart corresponds to the percentile box and represents the percentage of funds in the peer group whose performance was equal to or lower than that of the fund.
Semiannual Report
Board Approval of Investment Advisory Contracts and
Management Fees - continued
Fidelity Retirement Money Market Portfolio
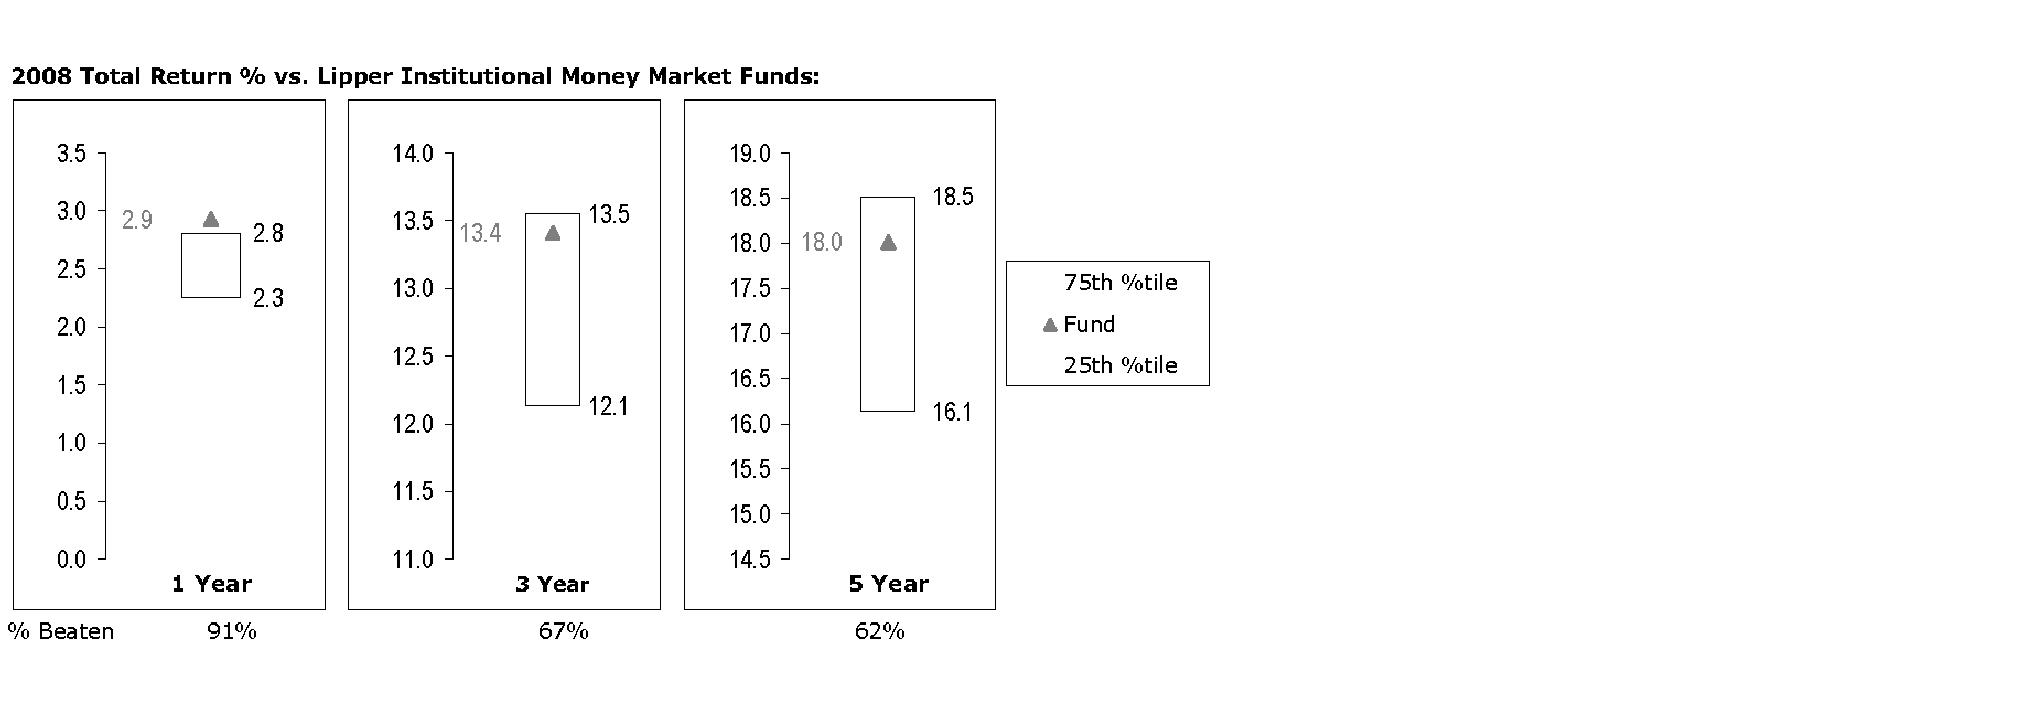
The Board reviewed the fund's relative investment performance against its peer group and stated that the performance of the fund was in the first quartile for the one-year period and the second quartile for the three- and five-year periods. The Board also reviewed the fund's performance during 2009.
Based on its review, and giving particular weight to the nature and quality of the resources dedicated by the Investment Advisers to maintain and improve relative performance and factoring in the unprecedented recent market events, the Board concluded that the nature, extent, and quality of the services provided to the fund will benefit the fund's shareholders, particularly in light of the Board's view that the fund's shareholders benefit from investing in a fund that is part of a large family of funds offering a variety of investment disciplines and services.
Competitiveness of Management Fee and Total Fund Expenses. The Board considered the fund's management fee and total expenses compared to "mapped groups" of competitive funds and classes. Fidelity creates "mapped groups" by combining similar Lipper investment objective categories that have comparable management fee characteristics. Combining Lipper investment objective categories aids the Board's management fee and total expense comparisons by broadening the competitive group used for comparison and by reducing the number of universes to which various Fidelity funds are compared.
The Board considered two proprietary management fee comparisons for the 12-month periods shown in the chart below. The group of Lipper funds used by the Board for management fee comparisons is referred to below as the "Total Mapped Group" and, for the reasons explained above, is broader than the Lipper peer group used by the Board for performance comparisons. The Total Mapped Group comparison focuses on a fund's standing relative to the total universe of comparable funds available to investors, in terms of gross management fees before expense reimbursements or caps. "TMG %" represents the percentage of funds in the Total Mapped Group that had management fees that were lower than the fund's. For example, a TMG % of 26% means that 74% of the funds in the Total Mapped Group had higher management fees than the fund. The "Asset-Size Peer Group" (ASPG) comparison focuses on a fund's standing relative to non-Fidelity funds similar in size to the fund within the Total Mapped Group. The ASPG represents at least 15% of the funds in the Total Mapped Group with comparable asset size and management fee characteristics, subject to a minimum of 50 funds (or all funds in the Total Mapped Group if fewer than 50). Additional information, such as the ASPG quartile in which the fund's management fee ranked, is also included in the chart and considered by the Board. For a more meaningful comparison of management fees, the fund is compared on the basis of a hypothetical "net management fee," which is derived by subtracting payments made by FMR for non-management expenses (including transfer agent fees, pricing and bookkeeping fees, and custody fees) from the fund's all-inclusive fee. In this regard, the Board realizes that net management fees can vary from year to year because of differences in non-management expenses.
Semiannual Report
Fidelity Retirement Money Market Portfolio
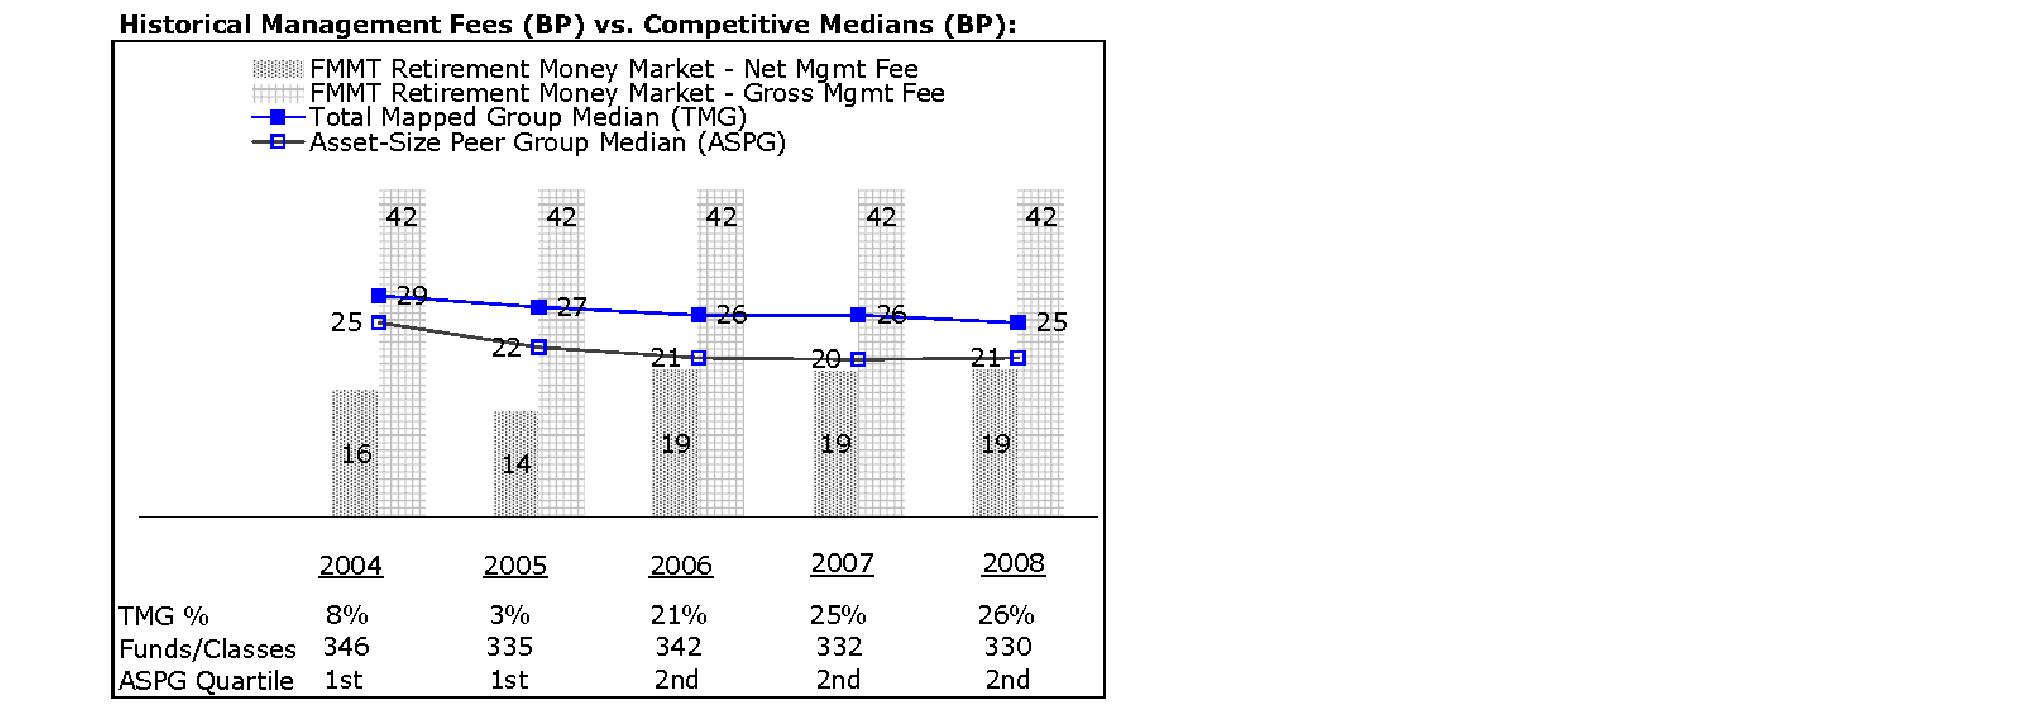
The Board noted that the fund's hypothetical net management fee ranked below the median of its Total Mapped Group and below the median of its ASPG for 2008.
Semiannual Report
Board Approval of Investment Advisory Contracts and
Management Fees - continued
Based on its review, the Board concluded that the fund's management fee was fair and reasonable in light of the services that the fund receives and the other factors considered.
In its review of the fund's total expenses, the Board considered the fund's hypothetical net management fee as well as the fund's all-inclusive fee. The Board also considered other expenses, such as transfer agent fees, pricing and bookkeeping fees, and custodial, legal, and audit fees, paid by FMR under the all-inclusive arrangement. The Board also noted the effects of any waivers and reimbursements on fees and expenses. As part of its review, the Board also considered current and historical total expenses of the fund compared to competitive fund median expenses. The fund is compared to those funds and classes in the Total Mapped Group (used by the Board for management fee comparisons) that have a similar sales load structure.
The Board noted that the fund's total expenses ranked above its competitive median for 2008. The Board considered that although the fund has no minimum initial investment and provides a range of services similar to retail funds, Lipper categorizes it as institutional. When compared to retail no-load funds, the fund's total expenses rank below the median for 2008.
In its review, the Board also considered Fidelity fee structures and other information on clients that FMR and its affiliates service in other competitive markets, such as other mutual funds advised or subadvised by FMR or its affiliates, pension plan clients, and other institutional clients.
Based on its review, the Board concluded that the fund's total expenses were reasonable, although above the median of the universe presented for comparison, in light of the services that the fund and its shareholders receive and the other factors considered.
Costs of the Services and Profitability. The Board considered the revenues earned and the expenses incurred by Fidelity in conducting the business of developing, marketing, distributing, managing, administering and servicing the fund and its shareholders. The Board also considered the level of Fidelity's profits in respect of all the Fidelity funds.
On an annual basis, FMR presents to the Board Fidelity's profitability for the fund. Fidelity calculates the profitability for each fund, as well as aggregate profitability for groups of Fidelity funds and all Fidelity funds, using a series of detailed revenue and cost allocation methodologies which originate with the audited books and records of Fidelity. The Audit Committee of the Board reviews any significant changes from the prior year's methodologies.
PricewaterhouseCoopers LLP (PwC), independent registered public accounting firm and auditor to Fidelity and certain Fidelity funds, has been engaged annually by the Board as part of the Board's assessment of Fidelity's profitability analysis. PwC's engagement includes the review and assessment of Fidelity's methodologies used in determining the revenues and expenses attributable to Fidelity's mutual fund business, and completion of agreed-upon procedures surrounding the mathematical accuracy of fund profitability and its conformity to allocation methodologies. After considering PwC's reports issued under the engagement and information provided by Fidelity, the Board believes that while other allocation methods may also be reasonable, Fidelity's profitability methodologies are reasonable in all material respects.
Semiannual Report
The Board has also reviewed Fidelity's non-fund businesses and any fall-out benefits related to the mutual fund business as well as cases where Fidelity's affiliates may benefit from or be related to the fund's business.
The Board considered the costs of the services provided by and the profits realized by Fidelity in connection with the operation of the fund and determined that the amount of profit is a fair entrepreneurial profit for the management of the fund.
Economies of Scale. The Board considered whether there have been economies of scale in respect of the management of the Fidelity funds, whether the Fidelity funds (including the fund) have appropriately benefited from any such economies of scale, and whether there is potential for realization of any further economies of scale. The Board considered the extent to which the fund will benefit from economies of scale through increased services to the fund, through waivers or reimbursements, or through fee or expense reductions.
In February 2009, the Board created an Ad Hoc Committee (the "Committee") to analyze economies of scale. The Committee was formed to consider whether FMR attains economies of scale in respect of the management and servicing of the Fidelity funds, whether the Fidelity funds have appropriately benefited from such economies of scale, and whether there is potential for realization of any further economies of scale.
The Board concluded, considering the findings of the Committee, that any potential economies of scale are being shared between fund shareholders and Fidelity in an appropriate manner.
Additional Information Requested by the Board. In order to develop fully the factual basis for consideration of the Fidelity funds' Advisory Contracts, the Board requested and received additional information on certain topics, including (i) fund performance trends, actions to be taken by FMR to improve certain funds' overall performance and Fidelity's long-term strategies for certain funds; (ii) portfolio manager changes that have occurred during the past year; (iii) Fidelity's fund profitability methodology, the profitability of certain fund service providers, and profitability trends for certain funds; (iv) Fidelity's compensation structure for portfolio managers and key personnel, including its effects on fund profitability, and the extent to which current market conditions have affected retention and recruitment; (v) the selection of and compensation paid by FMR to fund sub-advisers; (vi) Fidelity's fee structures and rationale for recommending different fees among categories of funds; (vii) the rationale for any differences between fund fee structures and fee structures in place for other Fidelity clients; and (viii) explanations for the relative total expenses borne by certain funds and classes, total expense competitive trends, and actions that might be taken by FMR to reduce total expenses for certain funds and classes.
Semiannual Report
Board Approval of Investment Advisory Contracts and
Management Fees - continued
Based on its evaluation of all of the conclusions noted above, and after considering all material factors, the Board ultimately concluded that the advisory fee structures are fair and reasonable, and that the fund's Advisory Contracts should be renewed.
Semiannual Report
Investment Adviser
Fidelity Management &
Research Company
Boston, MA
Investment Sub-Advisers
Fidelity Investments Money
Management, Inc.
Fidelity Management & Research
(U.K.) Inc.
Fidelity Management & Research
(Hong Kong) Limited
Fidelity Management & Research
(Japan) Inc.
FIL Investment Advisors
FIL Investment Advisors
(U.K.) Ltd.
Fidelity Research & Analysis Company
General Distributor
Fidelity Distributors Corporation
Boston, MA
Transfer and Service Agents
Fidelity Investments Institutional
Operations Company, Inc.
Boston, MA
Fidelity Service Company, Inc.
Boston, MA
Custodian
JPMorgan Chase Bank
New York, NY
RMM-SANN-0410
1.700934.112
Item 2. Code of Ethics
Not applicable.
Item 3. Audit Committee Financial Expert
Not applicable.
Item 4. Principal Accountant Fees and Services
Not applicable.
Item 5. Audit Committee of Listed Registrants
Not applicable.
Item 6. Investments
(a) Not applicable.
(b) Not applicable
Item 7. Disclosure of Proxy Voting Policies and Procedures for Closed-End Management Investment Companies
Not applicable.
Item 8. Portfolio Managers of Closed-End Management Investment Companies
Not applicable.
Item 9. Purchase of Equity Securities by Closed-End Management Investment Company and Affiliated Purchasers
Not applicable.
Item 10. Submission of Matters to a Vote of Security Holders
There were no material changes to the procedures by which shareholders may recommend nominees to the Fidelity Money Market Trust's Board of Trustees.
Item 11. Controls and Procedures
(a)(i) The President and Treasurer and the Chief Financial Officer have concluded that the Fidelity Money Market Trust's (the "Trust") disclosure controls and procedures (as defined in Rule 30a-3(c) under the Investment Company Act) provide reasonable assurances that material information relating to the Trust is made known to them by the appropriate persons, based on their evaluation of these controls and procedures as of a date within 90 days of the filing date of this report.
(a)(ii) There was no change in the Trust's internal control over financial reporting (as defined in Rule 30a-3(d) under the Investment Company Act) that occurred during the second fiscal quarter of the period covered by this report that has materially affected, or is reasonably likely to materially affect, the Trust's internal control over financial reporting.
Item 12. Exhibits
(a) | (1) | Not applicable. |
(a) | (2) | Certification pursuant to Rule 30a-2(a) under the Investment Company Act of 1940 (17 CFR 270.30a-2(a)) is filed and attached hereto as Exhibit 99.CERT. |
(a) | (3) | Not applicable. |
(b) | | Certification pursuant to Rule 30a-2(b) under the Investment Company Act of 1940 (17 CFR 270.30a-2(b)) is furnished and attached hereto as Exhibit 99.906CERT. |
SIGNATURES
Pursuant to the requirements of the Securities Exchange Act of 1934 and the Investment Company Act of 1940, the registrant has duly caused this report to be signed on its behalf by the undersigned, thereunto duly authorized.
Fidelity Money Market Trust
By: | /s/John R. Hebble |
| John R. Hebble |
| President and Treasurer |
| |
Date: | April 29, 2010 |
Pursuant to the requirements of the Securities Exchange Act of 1934 and the Investment Company Act of 1940, this report has been signed below by the following persons on behalf of the registrant and in the capacities and on the dates indicated.
By: | /s/John R. Hebble |
| John R. Hebble |
| President and Treasurer |
| |
Date: | April 29, 2010 |
By: | /s/Christine Reynolds |
| Christine Reynolds |
| Chief Financial Officer |
| |
Date: | April 29, 2010 |