UNITED STATES
SECURITIES AND EXCHANGE COMMISSION
Washington, D.C. 20549
FORM N-CSR
CERTIFIED SHAREHOLDER REPORT OF REGISTERED
MANAGEMENT INVESTMENT COMPANIES
Investment Company Act file number 811-2861
Fidelity Money Market Trust
(Exact name of registrant as specified in charter)
245 Summer St., Boston, MA 02210
(Address of principal executive offices) (Zip code)
Marc Bryant, Secretary
245 Summer St.
Boston, Massachusetts 02210
(Name and address of agent for service)
Registrant's telephone number, including area code:
617-563-7000
| |
Date of fiscal year end: | August 31 |
|
|
Date of reporting period: | February 28, 2017 |
Item 1.
Reports to Stockholders
Fidelity Money Market Trust Retirement Government Money Market Portfolio
Semi-Annual Report February 28, 2017 |
 |
Contents
To view a fund's proxy voting guidelines and proxy voting record for the 12-month period ended June 30, visit http://www.fidelity.com/proxyvotingresults or visit the Securities and Exchange Commission's (SEC) web site at http://www.sec.gov.
You may also call 1-800-544-8544 to request a free copy of the proxy voting guidelines.
Standard & Poor's, S&P and S&P 500 are registered service marks of The McGraw-Hill Companies, Inc. and have been licensed for use by Fidelity Distributors Corporation.
Other third-party marks appearing herein are the property of their respective owners.
All other marks appearing herein are registered or unregistered trademarks or service marks of FMR LLC or an affiliated company. © 2017 FMR LLC. All rights reserved.
The fund seeks to obtain as high a level of current income as is consistent with the preservation of capital and liquidity by investing in high-quality, short-term money market securities issued or guaranteed as to principal and interest by the U.S. Government, or by any of its agencies or instrumentalities.
An investment in a money market fund is not insured or guaranteed by the Federal Deposit Insurance Corporation or any other government agency. Although the fund seeks to preserve the value of your investment at $1.00 per share, it is possible to lose money by investing in the fund.
This report and the financial statements contained herein are submitted for the general information of the shareholders of the Fund. This report is not authorized for distribution to prospective investors in the Fund unless preceded or accompanied by an effective prospectus.
A fund files its complete schedule of portfolio holdings with the SEC for the first and third quarters of each fiscal year on Form N-Q. Forms N-Q are available on the SEC’s web site at http://www.sec.gov. A fund's Forms N-Q may be reviewed and copied at the SEC’s Public Reference Room in Washington, DC. Information regarding the operation of the SEC's Public Reference Room may be obtained by calling 1-800-SEC-0330.
For a complete list of a fund's portfolio holdings, view the most recent holdings listing, semiannual report, or annual report on Fidelity's web site at http://www.fidelity.com, http://www.institutional.fidelity.com, or http://www.401k.com, as applicable.
NOT FDIC INSURED •MAY LOSE VALUE •NO BANK GUARANTEE
Neither the Fund nor Fidelity Distributors Corporation is a bank.
Investment Summary/Performance (Unaudited)
Effective Maturity Diversification
| Days | % of fund's investments 2/28/17 | % of fund's investments 8/31/16 | % of fund's investments 2/29/16 |
| 1 - 7 | 33.5 | 29.5 | 26.1 |
| 8 - 30 | 27.1 | 18.7 | 27.1 |
| 31 - 60 | 14.4 | 16.7 | 22.3 |
| 61 - 90 | 13.9 | 24.4 | 17.0 |
| 91 - 180 | 10.6 | 10.1 | 6.5 |
| > 180 | 0.5 | 0.6 | 1.0 |
Effective maturity is determined in accordance with the requirements of Rule 2a-7 under the Investment Company Act of 1940.
Asset Allocation (% of fund's net assets)
| As of February 28, 2017 |
| | Variable Rate Demand Notes (VRDNs) | 1.7% |
| | U.S. Treasury Debt | 15.9% |
| | U.S. Government Agency Debt | 56.4% |
| | Repurchase Agreements | 27.0% |
| | Net Other Assets (Liabilities)* | (1.0)% |

* Net Other Assets (Liabilities) are not included in the pie chart
| As of August 31, 2016 |
| | U.S. Treasury Debt | 9.0% |
| | U.S. Government Agency Debt | 69.5% |
| | Repurchase Agreements | 22.5% |
| | Net Other Assets (Liabilities)* | (1.0)% |

* Net Other Assets (Liabilities) are not included in the pie chart
Current And Historical 7-Day Yields
| | 2/28/17 | 11/30/16 | 8/31/16 | 5/31/16 | 2/29/16 |
| Retirement Government Money Market Portfolio | 0.20% | 0.10% | 0.07% | 0.03% | 0.01% |
Yield refers to the income paid by the Fund over a given period. Yields for money market funds are usually for seven-day periods, as they are here, though they are expressed as annual percentage rates. Past performance is no guarantee of future results. Yield will vary and it's possible to lose money investing in the Fund.
Investments February 28, 2017 (Unaudited)
Showing Percentage of Net Assets
| U.S. Treasury Debt - 15.9% | | | | |
| | | Yield(a) | Principal Amount (000s) | Value (000s) |
| U.S. Treasury Obligations - 15.9% | | | | |
| U.S. Treasury Bills | | | | |
| 3/15/17 to 8/17/17(b) | | 0.50 to 0.67% | $368,000 | $367,381 |
| U.S. Treasury Notes | | | | |
| 3/15/17 to 9/30/17 | | 0.54 to 0.70 | 74,000 | 74,056 |
| TOTAL U.S. TREASURY DEBT | | | | |
| (Cost $441,437) | | | | 441,437 |
|
| Variable Rate Demand Note - 1.7% | | | | |
| California - 0.1% | | | | |
| Anaheim Hsg. Auth. Multi-family Hsg. Rev. (Park Vista Apt. Proj.) Series 2000 D, 0.6% 3/7/17, LOC Freddie Mac, VRDN | | | | |
| 3/7/17 | | 0.60 (c)(d) | 3,600 | 3,600 |
| Florida - 0.1% | | | | |
| Florida Hsg. Fin. Corp. Multi-family Mtg. Rev. (Mariner's Cay Apts. Proj.) Series 2008 M, 0.64% 3/7/17, LOC Fannie Mae, VRDN | | | | |
| 3/7/17 | | 0.64 (c) | 1,245 | 1,245 |
| New York - 1.5% | | | | |
| FNMA New York Hsg. Fin. Agcy. Rev. (55 West 25th Street Hsg. Proj.) Series 2005 A, 0.57% 3/7/17, LOC Fannie Mae, VRDN | | | | |
| 3/7/17 | | 0.57 (c)(d) | 35,400 | 35,400 |
| New York City Hsg. Dev. Corp. Multi-family Mtg. Rev. (Bruckner by the Bridge Proj.) Series 2008 A, 0.65% 3/7/17, LOC Freddie Mac, VRDN | | | | |
| 3/7/17 | | 0.65 (c) | 2,000 | 2,000 |
| New York City Hsg. Dev. Corp. Multi-family Mtg. Rev. Series 2011 B, 0.64% 3/7/17, LOC Freddie Mac, VRDN | | | | |
| 3/7/17 | | 0.64 (c) | 3,050 | 3,050 |
| New York City Hsg. Dev. Corp. Multi-family Rental Hsg. Rev. (Two Gold Street Proj.) Series 2006 A, 0.64% 3/7/17, LOC Fannie Mae, VRDN | | | | |
| 3/7/17 | | 0.64 (c) | 1,700 | 1,700 |
| | | | | 42,150 |
| Pennsylvania - 0.0% | | | | |
| Montgomery County Redev. Auth. Multi-family Hsg. Rev. (Kingswood Apts. Proj.) Series 2001 A, 0.64% 3/7/17, LOC Fannie Mae, VRDN | | | | |
| 3/7/17 | | 0.64 (c) | 1,000 | 1,000 |
| TOTAL VARIABLE RATE DEMAND NOTE | | | | |
| (Cost $47,995) | | | | 47,995 |
|
| U.S. Government Agency Debt - 56.4% | | | | |
| Federal Agencies - 56.4% | | | | |
| Fannie Mae | | | | |
| 5/11/17 to 1/11/18 | | 0.62 to 0.98 (c) | 48,500 | 48,638 |
| Federal Farm Credit Bank | | | | |
| 5/8/17 to 1/26/18 | | 0.81 to 1.00 (c) | 38,000 | 38,057 |
| Federal Home Loan Bank | | | | |
| 12/1/17 | | 0.66(c) | 4,000 | 4,000 |
| 12/1/17 | | 0.66(c) | 4,000 | 4,000 |
| 12/1/17 | | 0.66(c) | 4,000 | 4,000 |
| 3/1/17 to 2/26/18 | | 0.53 to 0.97 (c) | 1,288,808 | 1,288,552 |
| 9/6/17 | | 0.61 (c) | 4,000 | 4,000 |
| Freddie Mac | | | | |
| 3/8/17 to 1/12/18 | | 0.52 to 0.99 (c) | 168,837 | 168,880 |
| TOTAL U.S. GOVERNMENT AGENCY DEBT | | | | |
| (Cost $1,560,127) | | | | 1,560,127 |
| U.S. Government Agency Repurchase Agreement - 9.3% | | | |
| | | Maturity Amount (000s) | Value (000s) |
| In a joint trading account at 0.53% dated 2/28/17 due 3/1/17 (Collateralized by U.S. Government Obligations) # | | $71,112 | $71,111 |
| With: | | | |
| BNP Paribas, S.A. at: | | | |
| 0.56%, dated 2/2/17 due 3/7/17 (Collateralized by U.S. Treasury Obligations valued at $2,060,709, 0.00% - 9.13%, 3/02/2017 - 1/01/2044) | | 2,002 | 2,000 |
| 0.59%, dated 2/8/17 due 3/7/17 (Collateralized by U.S. Treasury Obligations valued at $4,082,204, 0.00% - 7.13%, 9/14/2017 - 11/15/2045) | | 4,006 | 4,000 |
| 0.6%, dated 2/17/17 due 3/7/17 (Collateralized by U.S. Treasury Obligations valued at $8,237,565, 0.00% - 8.75%, 7/31/2018 - 11/15/2030) | | 8,012 | 8,000 |
| 0.62%, dated 1/9/17 due 3/7/17 (Collateralized by U.S. Treasury Obligations valued at $2,061,621, 0.00% - 7.13%, 11/15/2018 - 10/25/2040) | | 2,002 | 2,000 |
| 0.66%, dated 2/27/17 due 5/26/17 (Collateralized by U.S. Government Obligations valued at $8,160,299, 2.38% - 7.13%, 1/13/2022 - 2/01/2047) | | 8,013 | 8,000 |
| Citibank NA at: | | | |
| 0.54%, dated 2/28/17 due 3/7/17 (Collateralized by U.S. Treasury Obligations valued at $2,059,672, 0.38% - 6.50%, 7/31/2018 - 10/20/2045) | | 2,000 | 2,000 |
| 0.55%, dated 2/28/17 due 3/7/17 (Collateralized by U.S. Treasury Obligations valued at $12,253,398, 0.13% - 3.63%, 7/31/2018 - 2/15/2045) | | 12,001 | 12,000 |
| Deutsche Bank Securities, Inc. at 0.55%, dated: | | | |
| 2/22/17 due 3/1/17 (Collateralized by U.S. Treasury Obligations valued at $6,180,665, 0.63%, 1/15/2026) | | 6,001 | 6,000 |
| 2/24/17 due 3/3/17 (Collateralized by U.S. Treasury Obligations valued at $6,180,560, 0.63%, 1/15/2026) | | 6,001 | 6,000 |
| 2/28/17 due 3/1/17 (Collateralized by U.S. Treasury Obligations valued at $8,240,226, 0.63%, 1/15/2026) | | 8,000 | 8,000 |
| ING Financial Markets LLC at: | | | |
| 0.61%, dated 12/9/16 due 3/9/17 (Collateralized by U.S. Government Obligations valued at $1,022,244, 1.13%, 7/20/2018) | | 1,002 | 1,000 |
| 0.63%, dated: | | | |
| 2/8/17 due 4/4/17 (Collateralized by U.S. Government Obligations valued at $3,061,721, 1.13%, 7/20/2018) | | 3,005 | 3,000 |
| 2/9/17 due 4/4/17 (Collateralized by U.S. Government Obligations valued at $4,083,965, 1.13%, 7/20/2018) | | 4,006 | 4,000 |
| 2/10/17 due 4/4/17 (Collateralized by U.S. Government Obligations valued at $5,106,209, 1.13%, 7/20/2018) | | 5,008 | 5,000 |
| 2/14/17 due 4/4/17 (Collateralized by U.S. Government Obligations valued at $4,083,965, 1.13%, 7/20/2018) | | 4,006 | 4,000 |
| 2/15/17 due 4/4/17 (Collateralized by U.S. Government Obligations valued at $2,044,488, 1.13%, 7/20/2018) | | 2,003 | 2,000 |
| 2/16/17 due 4/4/17 (Collateralized by U.S. Government Obligations valued at $5,101,198, 1.13%, 7/20/2018) | | 5,008 | 5,000 |
| 2/17/17 due 4/4/17 (Collateralized by U.S. Government Obligations valued at $2,044,488, 1.13%, 7/20/2018) | | 2,003 | 2,000 |
| 2/21/17 due 4/4/17 (Collateralized by U.S. Government Obligations valued at $4,083,965, 1.13%, 7/20/2018) | | 4,006 | 4,000 |
| Merrill Lynch, Pierce, Fenner & Smith at 0.59%, dated 2/13/17 due 3/7/17 (Collateralized by U.S. Government Obligations valued at $12,244,186, 0.00%, 8/25/2017) | | 12,012 | 12,000 |
| Mitsubishi UFJ Securities (U.S.A.), Inc. at: | | | |
| 0.61%, dated: | | | |
| 2/7/17 due 4/7/17 (Collateralized by U.S. Government Obligations valued at $5,101,901, 2.31% - 3.50%, 4/20/2027 - 3/01/2047) | | 5,005 | 5,000 |
| 2/8/17 due 4/10/17 (Collateralized by U.S. Government Obligations valued at $5,101,815, 2.05% - 4.00%, 8/01/2025 - 3/01/2047) | | 5,005 | 5,000 |
| 2/22/17 due 4/24/17 (Collateralized by U.S. Government Obligations valued at $6,120,727, 2.24% - 4.00%, 10/01/2035 - 3/01/2047) | | 6,006 | 6,000 |
| 2/28/17 due 5/1/17 (Collateralized by U.S. Government Obligations valued at $7,140,121, 2.56% - 3.43%, 3/01/2037 - 3/01/2047) | | 7,007 | 7,000 |
| 0.64%, dated 1/11/17 due 4/11/17 (Collateralized by U.S. Government Obligations valued at $6,125,331, 2.32% - 4.00%, 11/01/2023 - 3/01/2047) | | 6,010 | 6,000 |
| Mizuho Securities U.S.A., Inc. at 0.56%, dated 2/6/17 due 3/7/17 (Collateralized by U.S. Government Obligations valued at $4,081,460, 3.00%, 2/01/2032) | | 4,002 | 4,000 |
| RBC Capital Markets Corp. at: | | | |
| 0.55%, dated 1/20/17 due 3/7/17 (Collateralized by U.S. Government Obligations valued at $2,058,794, 0.97% - 4.50%, 10/01/2027 - 3/01/2047) | | 2,002 | 2,000 |
| 0.56%, dated: | | | |
| 1/9/17 due 3/7/17 (Collateralized by U.S. Government Obligations valued at $6,135,867, 1.50% - 4.87%, 1/01/2027 - 3/01/2047) | | 6,006 | 6,000 |
| 1/13/17 due 3/7/17 (Collateralized by U.S. Government Obligations valued at $6,138,788, 0.97% - 5.50%, 6/01/2028 - 3/01/2047) | | 6,006 | 6,000 |
| 1/17/17 due 3/7/17 (Collateralized by U.S. Government Obligations valued at $2,054,885, 0.97% - 6.00%, 10/01/2027 - 3/01/2047) | | 2,002 | 2,000 |
| 2/6/17 due 3/7/17 (Collateralized by U.S. Government Obligations valued at $4,082,138, 2.18% - 5.00%, 1/01/2027 - 2/01/2047) | | 4,004 | 4,000 |
| 0.58%, dated 2/14/17 due 3/7/17 (Collateralized by U.S. Government Obligations valued at $4,081,168, 2.18% - 4.50%, 1/01/2027 - 12/01/2046) | | 4,005 | 4,000 |
| RBC Dominion Securities at: | | | |
| 0.54%, dated 2/17/17 due 3/7/17 (Collateralized by U.S. Government Obligations valued at $6,121,102, 2.25% - 4.50%, 3/31/2021 - 1/20/2047) | | 6,003 | 6,000 |
| 0.56%, dated: | | | |
| 1/17/17 due 3/7/17 (Collateralized by U.S. Government Obligations valued at $4,082,730, 2.25% - 6.00%, 3/31/2021 - 1/20/2047) | | 4,004 | 4,000 |
| 1/18/17 due 3/3/17 (Collateralized by U.S. Government Obligations valued at $1,020,667, 2.13% - 4.50%, 6/30/2022 - 1/20/2047) | | 1,001 | 1,000 |
| 0.58%, dated 2/28/17 due 3/7/17: | | | |
| (Collateralized by U.S. Treasury Obligations valued at $4,080,128, 2.00% - 4.38%, 8/31/2021 - 5/15/2041) | | 4,004 | 4,000 |
| (Collateralized by U.S. Treasury Obligations valued at $4,080,128, 2.00% - 4.38%, 8/31/2021 - 5/15/2041) | | 4,004 | 4,000 |
| Wells Fargo Securities, LLC at 0.61%, dated 12/6/16 due 3/6/17 (Collateralized by U.S. Government Obligations valued at $9,193,223, 3.50% - 4.50%, 7/15/2046 - 2/15/2047) | | 9,014 | 9,000 |
| TOTAL U.S. GOVERNMENT AGENCY REPURCHASE AGREEMENT | | | |
| (Cost $256,111) | | | 256,111 |
|
| U.S. Treasury Repurchase Agreement - 17.7% | | | |
| With: | | | |
| Barclays Capital, Inc. at: | | | |
| 0.5%, dated 2/28/17 due 3/1/17 (Collateralized by U.S. Treasury Obligations valued at $2,052,799, 1.63%, 3/31/2019) | | 2,000 | 2,000 |
| 0.54%, dated 2/28/17 due 3/1/17 (Collateralized by U.S. Treasury Obligations valued at $3,060,073, 0.00%, 4/27/2017) | | 3,000 | 3,000 |
| BMO Harris Bank NA at: | | | |
| 0.53%, dated: | | | |
| 1/11/17 due 3/7/17 (Collateralized by U.S. Treasury Obligations valued at $2,053,297, 2.63%, 8/15/2020) | | 2,002 | 2,000 |
| 1/13/17 due 3/7/17 (Collateralized by U.S. Treasury Obligations valued at $8,208,001, 1.63%, 11/30/2020) | | 8,007 | 8,000 |
| 1/20/17 due 3/7/17 (Collateralized by U.S. Treasury Obligations valued at $4,099,224, 2.50%, 6/30/2017) | | 4,003 | 4,000 |
| 2/10/17 due 3/7/17 (Collateralized by U.S. Treasury Obligations valued at $4,097,083, 3.25%, 3/31/2017) | | 4,002 | 4,000 |
| 0.54%, dated 2/9/17 due 3/7/17: | | | |
| (Collateralized by U.S. Treasury Obligations valued at $4,131,442, 3.75%, 11/15/2043) | | 4,004 | 4,000 |
| (Collateralized by U.S. Treasury Obligations valued at $8,189,649, 0.88%, 6/15/2017) | | 8,007 | 8,000 |
| 0.55%, dated: | | | |
| 2/1/17 due 3/7/17 (Collateralized by U.S. Treasury Obligations valued at $6,208,759, 3.75%, 11/15/2043) | | 6,006 | 6,000 |
| 2/3/17 due 3/7/17: | | | |
| (Collateralized by U.S. Treasury Obligations valued at $3,066,309, 1.75%, 5/15/2023) | | 3,004 | 3,000 |
| (Collateralized by U.S. Treasury Obligations valued at $3,074,514, 1.50%, 8/15/2026) | | 3,004 | 3,000 |
| 0.56%, dated 1/31/17 due 3/7/17 (Collateralized by U.S. Treasury Obligations valued at $4,098,382, 0.88%, 6/15/2017) | | 4,005 | 4,000 |
| 0.57%, dated 2/28/17 due 3/7/17 (Collateralized by U.S. Treasury Obligations valued at $4,122,806, 1.50%, 8/15/2026) | | 4,004 | 4,000 |
| BNP Paribas, S.A. at: | | | |
| 0.55%, dated 2/2/17 due 3/7/17 (Collateralized by U.S. Treasury Obligations valued at $6,180,116, 1.63% - 6.88%, 11/30/2020 - 5/15/2045) | | 6,006 | 6,000 |
| 0.56%, dated 1/31/17 due 3/7/17 (Collateralized by U.S. Treasury Obligations valued at $7,176,636, 1.50% - 6.88%, 11/15/2020 - 11/15/2042) | | 7,007 | 7,000 |
| 0.57%, dated: | | | |
| 1/5/17 due 3/3/17 (Collateralized by U.S. Treasury Obligations valued at $7,146,219, 0.00% - 8.00%, 4/13/2017 - 5/15/2023) | | 7,006 | 7,000 |
| 1/9/17 due 3/7/17 (Collateralized by U.S. Treasury Obligations valued at $5,154,109, 2.13% - 2.75%, 9/30/2021 - 11/15/2042) | | 5,005 | 5,000 |
| 1/12/17 due 3/7/17 (Collateralized by U.S. Treasury Obligations valued at $4,109,728, 0.62% - 3.00%, 7/31/2017 - 5/15/2046) | | 4,005 | 4,000 |
| 1/17/17 due 3/7/17 (Collateralized by U.S. Treasury Obligations valued at $8,165,659, 1.50% - 6.88%, 11/30/2020 - 2/15/2041) | | 8,009 | 8,000 |
| 1/20/17 due 3/7/17 (Collateralized by U.S. Treasury Obligations valued at $12,356,573, 0.00% - 3.00%, 3/02/2017 - 5/15/2046) | | 12,017 | 12,000 |
| 1/30/17 due 3/7/17 (Collateralized by U.S. Treasury Obligations valued at $23,697,084, 1.38% - 3.13%, 9/30/2020 - 11/15/2044) | | 23,021 | 23,000 |
| 2/8/17 due 3/7/17 (Collateralized by U.S. Treasury Obligations valued at $11,304,273, 0.00% - 8.13%, 7/31/2017 - 11/15/2044) | | 11,016 | 11,000 |
| 0.58%, dated 1/9/17 due 3/10/17 (Collateralized by U.S. Treasury Obligations valued at $3,062,583, 0.00% - 6.88%, 7/31/2017 - 2/15/2037) | | 3,003 | 3,000 |
| 0.6%, dated: | | | |
| 1/5/17 due 3/3/17 (Collateralized by U.S. Treasury Obligations valued at $7,146,706, 0.00% - 8.13%, 7/31/2017 - 2/15/2047) | | 7,007 | 7,000 |
| 1/9/17 due 3/7/17 (Collateralized by U.S. Treasury Obligations valued at $3,068,591, 0.62% - 6.88%, 7/31/2017 - 2/15/2040) | | 3,003 | 3,000 |
| 1/20/17 due 4/20/17 (Collateralized by U.S. Treasury Obligations valued at $16,330,928, 0.00% - 6.88%, 3/30/2017 - 11/15/2044) | | 16,024 | 16,000 |
| 0.63%, dated: | | | |
| 2/24/17 due 3/7/17 (Collateralized by U.S. Treasury Obligations valued at $15,301,383, 0.62% - 2.63%, 7/31/2017 - 11/30/2022) | | 15,028 | 15,000 |
| 2/27/17 due 3/7/17 (Collateralized by U.S. Treasury Obligations valued at $22,656,705, 2.63% - 7.63%, 11/15/2020 - 11/15/2044) | | 22,040 | 22,000 |
| Commerz Markets LLC at 0.55%, dated 2/28/17 due 3/1/17 (Collateralized by U.S. Treasury Obligations valued at $55,082,329, 3.75%, 11/15/2018) | | 54,001 | 54,000 |
| Deutsche Bank Securities, Inc. at 0.54%, dated: | | | |
| 2/22/17 due 3/1/17 (Collateralized by U.S. Treasury Obligations valued at $11,221,225, 1.00%, 12/15/2017) | | 11,001 | 11,000 |
| 2/24/17 due 3/3/17 (Collateralized by U.S. Treasury Obligations valued at $5,100,429, 1.00%, 12/15/2017) | | 5,001 | 5,000 |
| 2/28/17 due 3/1/17 (Collateralized by U.S. Treasury Obligations valued at $6,120,093, 1.00%, 12/15/2017) | | 6,000 | 6,000 |
| Mitsubishi UFJ Securities (U.S.A.), Inc. at 0.56%, dated 1/18/17 due 3/7/17 (Collateralized by U.S. Treasury Obligations valued at $2,061,408, 3.00%, 11/15/2045) | | 2,002 | 2,000 |
| Mizuho Securities U.S.A., Inc. at 0.54%, dated 2/28/17 due 3/1/17 (Collateralized by U.S. Treasury Obligations valued at $7,188,331, 2.25%, 11/15/2025) | | 7,000 | 7,000 |
| MUFG Securities EMEA PLC at: | | | |
| 0.53%, dated 2/28/17 due 3/1/17 (Collateralized by U.S. Treasury Obligations valued at $1,236,794, 2.00%, 11/15/2026) | | 1,198 | 1,198 |
| 0.58%, dated 2/6/17 due 3/7/17 (Collateralized by U.S. Treasury Obligations valued at $1,027,293, 1.63%, 5/15/2026) | | 1,001 | 1,000 |
| 0.59%, dated: | | | |
| 2/21/17 due 3/1/17: | | | |
| (Collateralized by U.S. Treasury Obligations valued at $4,105,006, 2.25%, 11/15/2025) | | 4,001 | 4,000 |
| (Collateralized by U.S. Treasury Obligations valued at $4,089,531, 1.50%, 8/15/2026) | | 4,001 | 4,000 |
| 2/23/17 due 3/3/17 (Collateralized by U.S. Treasury Obligations valued at $4,101,091, 1.50%, 5/31/2019) | | 4,001 | 4,000 |
| 3/1/17 due 3/10/17(e) | | 4,001 | 4,000 |
| 3/3/17 due: | | | |
| 3/10/17(e) | | 1,000 | 1,000 |
| 3/17/17(e) | | 2,000 | 2,000 |
| 0.6%, dated: | | | |
| 2/13/17 due 3/7/17 (Collateralized by U.S. Treasury Obligations valued at $1,028,475, 1.50%, 5/31/2019) | | 1,002 | 1,000 |
| 2/14/17 due 3/9/17 (Collateralized by U.S. Treasury Obligations valued at $19,619,472, 2.63%, 8/15/2020) | | 19,007 | 19,000 |
| 2/23/17 due 3/8/17 (Collateralized by U.S. Treasury Obligations valued at $2,046,076, 1.50%, 8/15/2026) | | 2,000 | 2,000 |
| 0.63%, dated 3/1/17 due 5/1/17(e) | | 2,002 | 2,000 |
| Nomura Securities International, Inc. at 0.53%, dated: | | | |
| 2/23/17 due 3/2/17 (Collateralized by U.S. Treasury Obligations valued at $53,026,654, 2.25%, 11/15/2024) | | 52,005 | 52,000 |
| 2/28/17 due 3/1/17 (Collateralized by U.S. Treasury Obligations valued at $26,655,311, 1.38%, 4/30/2021) | | 26,000 | 26,000 |
| RBC Capital Markets Corp. at 0.54%, dated: | | | |
| 1/19/17 due 3/7/17 (Collateralized by U.S. Treasury Obligations valued at $3,091,958, 2.50% - 5.25%, 11/15/2028 - 5/15/2046) | | 3,003 | 3,000 |
| 2/3/17 due 3/7/17 (Collateralized by U.S. Treasury Obligations valued at $4,095,339, 2.00% - 6.25%, 7/31/2020 - 2/15/2046) | | 4,004 | 4,000 |
| RBC Dominion Securities at: | | | |
| 0.53%, dated 1/11/17 due 3/7/17 (Collateralized by U.S. Treasury Obligations valued at $16,334,765, 0.00% - 4.38%, 3/16/2017 - 5/15/2041) | | 16,014 | 16,000 |
| 0.56%, dated 12/22/16 due 3/7/17 (Collateralized by U.S. Treasury Obligations valued at $6,148,392, 1.13% - 4.38%, 9/30/2018 - 2/15/2047) | | 6,008 | 6,000 |
| 0.57%, dated 2/28/17 due 3/7/17 (Collateralized by U.S. Treasury Obligations valued at $4,080,128, 2.00% - 4.38%, 8/31/2021 - 5/15/2041) | | 4,004 | 4,000 |
| RBS Securities, Inc. at: | | | |
| 0.53%, dated 2/28/17 due 3/1/17 (Collateralized by U.S. Treasury Obligations valued at $1,020,182, 0.88%, 4/15/2019) | | 1,000 | 1,000 |
| 0.55%, dated 2/15/17 due 3/1/17 (Collateralized by U.S. Treasury Obligations valued at $6,132,447, 1.25% - 5.00%, 1/31/2020 - 5/15/2037) | | 6,001 | 6,000 |
| Societe Generale at: | | | |
| 0.53%, dated: | | | |
| 1/30/17 due 3/2/17 (Collateralized by U.S. Treasury Obligations valued at $3,061,393, 0.00% - 9.00%, 4/27/2017 - 11/15/2044) | | 3,001 | 3,000 |
| 2/10/17 due 3/7/17 (Collateralized by U.S. Treasury Obligations valued at $6,121,771, 0.75% - 2.00%, 7/15/2019 - 11/15/2026) | | 6,003 | 6,000 |
| 0.54%, dated 2/17/17 due 3/7/17 (Collateralized by U.S. Treasury Obligations valued at $13,278,863, 0.00% - 4.50%, 4/27/2017 - 8/15/2039) | | 13,007 | 13,000 |
| 0.55%, dated: | | | |
| 1/19/17 due 3/7/17 (Collateralized by U.S. Treasury Obligations valued at $4,082,585, 0.00% - 1.00%, 4/27/2017 - 10/15/2018) | | 4,003 | 4,000 |
| 2/2/17 due 3/7/17 (Collateralized by U.S. Treasury Obligations valued at $2,040,881, 0.00% - 2.13%, 4/27/2017 - 8/31/2020) | | 2,002 | 2,000 |
| 0.6%, dated 2/9/17 due 3/7/17 (Collateralized by U.S. Treasury Obligations valued at $4,081,582, 0.00% - 4.50%, 4/27/2017 - 8/15/2039) | | 4,006 | 4,000 |
| Wells Fargo Securities, LLC at: | | | |
| 0.57%, dated 12/1/16 due 3/1/17 (Collateralized by U.S. Treasury Obligations valued at $3,064,391, 1.75%, 10/31/2020) | | 3,004 | 3,000 |
| 0.59%, dated 12/6/16 due 3/6/17 (Collateralized by U.S. Treasury Obligations valued at $3,064,314, 1.88%, 2/28/2022) | | 3,004 | 3,000 |
| TOTAL U.S. TREASURY REPURCHASE AGREEMENT | | | |
| (Cost $490,198) | | | 490,198 |
| TOTAL INVESTMENT PORTFOLIO - 101.0% | | | |
| (Cost $2,795,868) | | | 2,795,868 |
| NET OTHER ASSETS (LIABILITIES) - (1.0)% | | | (28,997) |
| NET ASSETS - 100% | | | $2,766,871 |
Security Type Abbreviations
VRDN – VARIABLE RATE DEMAND NOTE (A debt instrument that is payable upon demand, either daily, weekly or monthly)
The date shown for securities represents the date when principal payments must be paid, taking into account any call options exercised by the issuer and any permissible maturity shortening features other than interest rate resets.
Legend
(a) Yield represents either the annualized yield at the date of purchase, or the stated coupon rate, or, for floating and adjustable rate securities, the rate at period end.
(b) Security or a portion of the security was sold in a reverse repurchase transaction and pledged for the benefit of a counterparty as collateral to secure the future obligations of the Fund to repurchase the securities at an agreed-upon date and price within 7 days of period end. At period end, the value of securities pledged by the Fund for reverse repurchase transactions was $2,000,000 and the principal amount of obligations of the Fund with respect to reverse repurchase transactions was $2,000,000.
(c) Coupon rates for floating and adjustable rate securities reflect the rates in effect at period end.
(d) Private activity obligations whose interest is subject to the federal alternative minimum tax for individuals.
(e) Represents a forward settling transaction and therefore no collateral securities had been allocated as of period end. The agreement contemplated the delivery of U.S. Treasury Obligations as collateral on settlement date.
Investment Valuation
All investments are categorized as Level 2 under the Fair Value Hierarchy. The inputs or methodology used for valuing securities may not be an indication of the risk associated with investing in those securities. For more information on valuation inputs please refer to the Investment Valuation section in the accompanying Notes to Financial Statements.
Other Information
# Additional information on each counterparty to the repurchase agreement is as follows:
| Repurchase Agreement / Counterparty | Value (Amounts in thousands) |
| $71,111,000 due 3/01/17 at 0.53% | |
| BNP Paribas, S.A. | $3,216 |
| BNY Mellon Capital Markets LLC | 191 |
| Bank of America NA | 15,696 |
| Citibank NA | 3,828 |
| Credit Agricole CIB New York Branch | 10,528 |
| Credit Suisse Securities (USA) LLC | 665 |
| HSBC Securities (USA), Inc. | 3,250 |
| ING Financial Markets LLC | 383 |
| J.P. Morgan Securities, Inc. | 11,868 |
| Merrill Lynch, Pierce, Fenner & Smith, Inc. | 1,371 |
| Mizuho Securities USA, Inc. | 4,706 |
| Morgan Stanley & Co., Inc. | 9,571 |
| Societe Generale | 1,914 |
| Wells Fargo Securities LLC | 3,924 |
| | $71,111 |
See accompanying notes which are an integral part of the financial statements.
Financial Statements
Statement of Assets and Liabilities
| Amounts in thousands (except per-share amount) | | February 28, 2017 (Unaudited) |
| Assets | | |
Investment in securities, at value (including repurchase agreements of $746,309) — See accompanying schedule:
Unaffiliated issuers (cost $2,795,868) | | $2,795,868 |
| Cash | | 7 |
| Receivable for investments sold | | 2,997 |
| Receivable for fund shares sold | | 6,526 |
| Interest receivable | | 2,062 |
| Total assets | | 2,807,460 |
| Liabilities | | |
| Payable for investments purchased | $29,000 | |
| Payable for fund shares redeemed | 8,605 | |
| Accrued management fee | 984 | |
| Payable for reverse repurchase agreement | 2,000 | |
| Total liabilities | | 40,589 |
| Net Assets | | $2,766,871 |
| Net Assets consist of: | | |
| Paid in capital | | $2,766,834 |
| Accumulated undistributed net realized gain (loss) on investments | | 37 |
| Net Assets, for 2,766,318 shares outstanding | | $2,766,871 |
| Net Asset Value, offering price and redemption price per share ($2,766,871 ÷ 2,766,318 shares) | | $1.00 |
See accompanying notes which are an integral part of the financial statements.
Statement of Operations
| Amounts in thousands | | Six months ended February 28, 2017 (Unaudited) |
| Investment Income | | |
| Interest | | $8,303 |
| Expenses | | |
| Management fee | $6,197 | |
| Independent trustees' fees and expenses | 9 | |
| Interest | 1 | |
| Total expenses before reductions | 6,207 | |
| Expense reductions | – | 6,207 |
| Net investment income (loss) | | 2,096 |
| Realized and Unrealized Gain (Loss) | | |
| Net realized gain (loss) on: | | |
| Investment securities: | | |
| Unaffiliated issuers | | 3 |
| Total net realized gain (loss) | | 3 |
| Net increase in net assets resulting from operations | | $2,099 |
See accompanying notes which are an integral part of the financial statements.
Statement of Changes in Net Assets
| Amounts in thousands | Six months ended February 28, 2017 (Unaudited) | Year ended August 31, 2016 |
| Increase (Decrease) in Net Assets | | |
| Operations | | |
| Net investment income (loss) | $2,096 | $696 |
| Net realized gain (loss) | 3 | 52 |
| Net increase in net assets resulting from operations | 2,099 | 748 |
| Distributions to shareholders from net investment income | (2,096) | (696) |
| Share transactions at net asset value of $1.00 per share | | |
| Proceeds from sales of shares | 1,838,266 | 3,487,252 |
| Reinvestment of distributions | 2,095 | 696 |
| Cost of shares redeemed | (2,134,287) | (3,637,008) |
| Net increase (decrease) in net assets and shares resulting from share transactions | (293,926) | (149,060) |
| Total increase (decrease) in net assets | (293,923) | (149,008) |
| Net Assets | | |
| Beginning of period | 3,060,794 | 3,209,802 |
| End of period | $2,766,871 | $3,060,794 |
See accompanying notes which are an integral part of the financial statements.
Financial Highlights — Retirement Government Money Market Portfolio
| | Six months ended (Unaudited) February 28, | Years ended August 31, | | | | |
| | 2017 | 2016 | 2015 | 2014 | 2013 | 2012 |
| Selected Per–Share Data | | | | | | |
| Net asset value, beginning of period | $1.00 | $1.00 | $1.00 | $1.00 | $1.00 | $1.00 |
| Income from Investment Operations | | | | | | |
| Net investment income (loss) | .001 | –A | –A | –A | –A | –A |
| Net realized and unrealized gain (loss)A | – | – | – | – | – | – |
| Total from investment operations | .001 | –A | –A | –A | –A | –A |
| Distributions from net investment income | (.001) | –A | –A | –A | –A | –A |
| Total distributions | (.001) | –A | –A | –A | –A | –A |
| Net asset value, end of period | $1.00 | $1.00 | $1.00 | $1.00 | $1.00 | $1.00 |
| Total ReturnB,C | .07% | .02% | .01% | .01% | .01% | .01% |
| Ratios to Average Net AssetsD | | | | | | |
| Expenses before reductions | .42%E | .42% | .42% | .42% | .42% | .42% |
| Expenses net of fee waivers, if any | .42%E | .32% | .13% | .11% | .17% | .17% |
| Expenses net of all reductions | .42%E | .32% | .13% | .11% | .17% | .17% |
| Net investment income (loss) | .14%E | .02% | .01% | .01% | .01% | .01% |
| Supplemental Data | | | | | | |
| Net assets, end of period (in millions) | $2,767 | $3,061 | $3,210 | $3,345 | $3,988 | $4,000 |
A Amount represents less than $.0005 per share.
B Total returns for periods of less than one year are not annualized.
C Total returns would have been lower if certain expenses had not been reduced during the applicable periods shown.
D Expense ratios reflect operating expenses of the Fund. Expenses before reductions do not reflect amounts reimbursed or waived or reductions from expense offset arrangements and do not represent the amount paid by the Fund during periods when reimbursements, waivers or reductions occur. Expenses net of fee waivers reflect expenses after reimbursement and waivers but prior to reductions from expense offset arrangements. Expenses net of all reductions represent the net expenses paid by the Fund.
E Annualized
See accompanying notes which are an integral part of the financial statements.
Notes to Financial Statements (Unaudited)
For the period ended February 28, 2017
(Amounts in thousands except percentages)
1. Organization.
Retirement Government Money Market Portfolio (the Fund) is a fund of Fidelity Money Market Trust (the Trust) and is authorized to issue an unlimited number of shares. Share transactions on the Statement of Changes in Net Assets may contain exchanges between affiliated funds. The Trust is registered under the Investment Company Act of 1940, as amended (the 1940 Act), as an open-end management investment company organized as a Delaware statutory trust.
2. Significant Accounting Policies.
The financial statements have been prepared in conformity with accounting principles generally accepted in the United States of America (GAAP), which require management to make certain estimates and assumptions at the date of the financial statements. Actual results could differ from those estimates. Subsequent events, if any, through the date that the financial statements were issued have been evaluated in the preparation of the financial statements. The following summarizes the significant accounting policies of the Fund:
Investment Valuation. The Fund categorizes the inputs to valuation techniques used to value its investments into a disclosure hierarchy consisting of three levels as shown below:
- Level 1 – quoted prices in active markets for identical investments
- Level 2 – other significant observable inputs (including quoted prices for similar investments, interest rates, prepayment speeds, etc.)
- Level 3 – unobservable inputs (including the Fund's own assumptions based on the best information available)
As permitted by compliance with certain conditions under Rule 2a-7 of the 1940 Act, securities are valued at amortized cost, which approximates fair value. The amortized cost of an instrument is determined by valuing it at its original cost and thereafter amortizing any discount or premium from its face value at a constant rate until maturity. Securities held by a money market fund are generally high quality and liquid; however, they are reflected as Level 2 because the inputs used to determine fair value are not quoted prices in an active market.
Investment Transactions and Income. The net asset value per share for processing shareholder transactions is calculated as of the close of business of the New York Stock Exchange (NYSE), normally 4:00 p.m. Eastern time. Security transactions are accounted for as of trade date. Gains and losses on securities sold are determined on the basis of identified cost. Interest income is accrued as earned and includes coupon interest and amortization of premium and accretion of discount on debt securities as applicable.
Expenses. Expenses directly attributable to a fund are charged to that fund. Expenses attributable to more than one fund are allocated among the respective funds on the basis of relative net assets or other appropriate methods. Expense estimates are accrued in the period to which they relate and adjustments are made when actual amounts are known.
Income Tax Information and Distributions to Shareholders. Each year, the Fund intends to qualify as a regulated investment company under Subchapter M of the Internal Revenue Code, including distributing substantially all of its taxable income and realized gains. As a result, no provision for U.S. Federal income taxes is required. The Fund files a U.S. federal tax return, in addition to state and local tax returns as required. The Fund's federal income tax returns are subject to examination by the Internal Revenue Service (IRS) for a period of three fiscal years after they are filed. State and local tax returns may be subject to examination for an additional fiscal year depending on the jurisdiction.
Dividends are declared and recorded daily and paid monthly from net investment income. Distributions from realized gains, if any, are declared and recorded on the ex-dividend date. Income and capital gain distributions are determined in accordance with income tax regulations, which may differ from GAAP.
Capital accounts within the financial statements are adjusted for permanent book-tax differences. These adjustments have no impact on net assets or the results of operations. Capital accounts are not adjusted for temporary book-tax differences which will reverse in a subsequent period.
Book-tax differences are primarily due to deferred trustees compensation.
The federal tax cost of investment securities and unrealized appreciation (depreciation) as of period end were as follows:
| Gross unrealized appreciation | $– |
| Gross unrealized depreciation | – |
| Net unrealized appreciation (depreciation) on securities | $– |
| Tax cost | $2,795,868 |
Repurchase Agreements. Pursuant to an Exemptive Order issued by the Securities and Exchange Commission (the SEC), the Fund along with other registered investment companies having management contracts with Fidelity Management & Research Company (FMR), or other affiliated entities of FMR, are permitted to transfer uninvested cash balances into joint trading accounts which are then invested in repurchase agreements. The Fund may also invest directly with institutions in repurchase agreements. Repurchase agreements may be collateralized by government or non-government securities. Upon settlement date, collateral is held in segregated accounts with custodian banks and may be obtained in the event of a default of the counterparty. The Fund monitors, on a daily basis, the value of the collateral to ensure it is at least equal to the principal amount of the repurchase agreement (including accrued interest). In the event of a default by the counterparty, realization of the collateral proceeds could be delayed, during which time the value of the collateral may decline.
Reverse Repurchase Agreements. To enhance its yield, the Fund may enter into reverse repurchase transactions under master repurchase agreements whereby the Fund sells securities to a counterparty in return for cash and agrees to repurchase those securities at a future date and agreed upon price. During the period that reverse repurchase transactions are outstanding, the Fund identifies the securities as pledged in its records with an initial value at least equal to its principal obligation under the agreement. The cash proceeds received by the Fund may be invested in other securities. To the extent cash proceeds received from the counterparty exceed the value of the securities sold, the counterparty may request additional collateral from the Fund. If the counterparty defaults on its obligation, because of insolvency or other reasons, the Fund could experience delays and costs in recovering the securities sold. Information regarding securities sold under a reverse repurchase agreement is included at the end of the Fund's Schedule of Investments and the cash proceeds are recorded as a liability in the accompanying Statement of Assets and Liabilities. The Fund continues to receive interest and dividend payments on the securities sold during the term of the reverse repurchase agreement. During the period, the average principal balance of reverse repurchase transactions was $4,943 and the weighted average interest rate was .15% with payments included in the Statement of Operations as a component of interest expense.
3. Fees and Other Transactions with Affiliates.
Management Fee. Fidelity Management & Research Company (the investment adviser) and its affiliates provide the Fund with investment management related services for which the Fund pays a monthly management fee that is based on an annual rate of .42% of the Fund's average net assets. Under the management contract, the investment adviser pays all other expenses, except the compensation of the independent Trustees and certain other expenses such as interest expense. The management fee is reduced by an amount equal to the fees and expenses paid by the Fund to the independent Trustees.
Interfund Trades. The Fund may purchase from or sell securities to other Fidelity Funds under procedures adopted by the Board. The procedures have been designed to ensure these interfund trades are executed in accordance with Rule 17a-7 of the 1940 Act.
4. Expense Reductions.
Through arrangements with the Fund's custodian, credits realized as a result of certain uninvested cash balances were used to reduce the Fund's management fee. During the period, these credits reduced the Fund's management fee by an amount of less than five hundred dollars.
5. Other.
The Fund's organizational documents provide former and current trustees and officers with a limited indemnification against liabilities arising in connection with the performance of their duties to the Fund. In the normal course of business, the Fund may also enter into contracts that provide general indemnifications. The Fund's maximum exposure under these arrangements is unknown as this would be dependent on future claims that may be made against the Fund. The risk of material loss from such claims is considered remote.
Shareholder Expense Example
As a shareholder of the Fund, you incur two types of costs: (1) transaction costs and (2) ongoing costs, including management fees and other Fund expenses. This Example is intended to help you understand your ongoing costs (in dollars) of investing in the Fund and to compare these costs with the ongoing costs of investing in other mutual funds.
The Example is based on an investment of $1,000 invested at the beginning of the period and held for the entire period (September 1, 2016 to February 28, 2017).
Actual Expenses
The first line of the accompanying table provides information about actual account values and actual expenses. You may use the information in this line, together with the amount you invested, to estimate the expenses that you paid over the period. Simply divide your account value by $1,000.00 (for example, an $8,600 account value divided by $1,000.00 = 8.6), then multiply the result by the number in the first line under the heading entitled "Expenses Paid During Period" to estimate the expenses you paid on your account during this period.
Hypothetical Example for Comparison Purposes
The second line of the accompanying table provides information about hypothetical account values and hypothetical expenses based on the Fund's actual expense ratio and an assumed rate of return of 5% per year before expenses, which is not the Fund's actual return. The hypothetical account values and expenses may not be used to estimate the actual ending account balance or expenses you paid for the period. You may use this information to compare the ongoing costs of investing in the Fund and other funds. To do so, compare this 5% hypothetical example with the 5% hypothetical examples that appear in the shareholder reports of the other funds.
Please note that the expenses shown in the table are meant to highlight your ongoing costs only and do not reflect any transaction costs. Therefore, the second line of the table is useful in comparing ongoing costs only, and will not help you determine the relative total costs of owning different funds.
| | Annualized Expense Ratio-A | Beginning
Account Value
September 1, 2016 | Ending
Account Value
February 28, 2017 | Expenses Paid
During Period-B
September 1, 2016
to February 28, 2017 |
| Actual | .42% | $1,000.00 | $1,000.70 | $2.08 |
| Hypothetical-C | | $1,000.00 | $1,022.71 | $2.11 |
A Annualized expense ratio reflects expenses net of applicable fee waivers.
B Expenses are equal to the Fund's annualized expense ratio, multiplied by the average account value over the period, multiplied by 181/365 (to reflect the one-half year period).
C 5% return per year before expenses
Board Approval of Investment Advisory Contracts and Management Fees
Fidelity Retirement Government Money Market Portfolio
Each year, the Board of Trustees, including the Independent Trustees (together, the Board), votes on the renewal of the management contract with Fidelity Management & Research Company (FMR) and the sub-advisory agreements (together, the Advisory Contracts) for the fund. The Board, assisted by the advice of fund counsel and Independent Trustees' counsel, requests and considers a broad range of information relevant to the renewal of the Advisory Contracts throughout the year.
The Board meets regularly and, at each of its meetings, covers an extensive agenda of topics and materials and considers factors that are relevant to its annual consideration of the renewal of the fund's Advisory Contracts, including the services and support provided to the fund and its shareholders. The Board has established four standing committees (Committees) — Operations, Audit, Fair Valuation, and Governance and Nominating — each composed of and chaired by Independent Trustees with varying backgrounds, to which the Board has assigned specific subject matter responsibilities in order to enhance effective decision-making by the Board. The Operations Committee, of which all of the Independent Trustees are members, meets regularly throughout the year and considers, among other matters, information specifically related to the annual consideration of the renewal of the fund's Advisory Contracts. The Board, acting directly and through its Committees, requests and receives information concerning the annual consideration of the renewal of the fund's Advisory Contracts. The Board also meets as needed to consider matters specifically related to the Board's annual consideration of the renewal of the Advisory Contracts. Members of the Board may also meet with trustees of other Fidelity funds through ad hoc joint committees to discuss certain matters relevant to all of the Fidelity funds.
At its September 2016 meeting, the Board unanimously determined to renew the fund's Advisory Contracts. In reaching its determination, the Board considered all factors it believed relevant, including (i) the nature, extent, and quality of the services to be provided to the fund and its shareholders (including the investment performance of the fund); (ii) the competitiveness of the fund's management fee and total expense ratio relative to peer funds; (iii) the total costs of the services to be provided by and the profits to be realized by Fidelity from its relationships with the fund; and (iv) the extent to which, if any, economies of scale exist and would be realized as the fund grows, and whether any economies of scale are appropriately shared with fund shareholders.
In considering whether to renew the Advisory Contracts for the fund, the Board reached a determination, with the assistance of fund counsel and Independent Trustees' counsel and through the exercise of its business judgment, that the renewal of the Advisory Contracts was in the best interests of the fund and its shareholders and that the compensation payable under the Advisory Contracts was fair and reasonable. The Board's decision to renew the Advisory Contracts was not based on any single factor, but rather was based on a comprehensive consideration of all the information provided to the Board at its meetings throughout the year. The Board, in reaching its determination to renew the Advisory Contracts, was aware that shareholders of the fund have a broad range of investment choices available to them, including a wide choice among funds offered by Fidelity's competitors, and that the fund's shareholders, who have the opportunity to review and weigh the disclosure provided by the fund in its prospectus and other public disclosures, have chosen to invest in this fund, which is part of the Fidelity family of funds.
Nature, Extent, and Quality of Services Provided. The Board considered Fidelity's staffing as it relates to the fund, including the backgrounds of investment personnel of Fidelity, and also considered the fund's investment objective, strategies, and related investment philosophy. The Independent Trustees also had discussions with senior management of Fidelity's investment operations and investment groups. The Board considered the structure of the investment personnel compensation program and whether this structure provides appropriate incentives to act in the best interests of the fund. Additionally, the Board considered the portfolio managers' investments, if any, in the funds that they manage.
Resources Dedicated to Investment Management and Support Services. The Board reviewed the general qualifications and capabilities of Fidelity's investment staff, including its size, education, experience, and resources, as well as Fidelity's approach to recruiting, managing, and compensating investment personnel. The Board noted that Fidelity has continued to increase the resources devoted to non-U.S. offices, including expansion of Fidelity's global investment organization. The Board also noted that Fidelity's analysts have extensive resources, tools and capabilities that allow them to conduct sophisticated quantitative and fundamental analysis, as well as credit analysis of issuers, counterparties and guarantors. Further, the Board considered that Fidelity's investment professionals have sufficient access to global information and data so as to provide competitive investment results over time, and that those professionals also have access to sophisticated tools that permit them to assess portfolio construction and risk and performance attribution characteristics continuously, as well as to transmit new information and research conclusions rapidly around the world. Additionally, in its deliberations, the Board considered Fidelity's trading, risk management, compliance, and technology and operations capabilities and resources, which are integral parts of the investment management process.
Shareholder and Administrative Services. The Board considered (i) the nature, extent, quality, and cost of advisory, administrative, and shareholder services performed by FMR, the sub-advisers (together with FMR, the Investment Advisers), and their affiliates under the Advisory Contracts and under separate agreements covering transfer agency and pricing and bookkeeping services for the fund; (ii) the nature and extent of the supervision of third party service providers, principally custodians, subcustodians, and pricing vendors; and (iii) the resources devoted to, and the record of compliance with, the fund's compliance policies and procedures.
The Board noted that the growth of fund assets over time across the complex allows Fidelity to reinvest in the development of services designed to enhance the value or convenience of the Fidelity funds as investment vehicles. These services include 24-hour access to account information and market information through telephone representatives and over the Internet, investor education materials and asset allocation tools, and the expanded availability of Fidelity Investor Centers.
Investment in a Large Fund Family. The Board considered the benefits to shareholders of investing in a Fidelity fund, including the benefits of investing in a fund that is part of a large family of funds offering a variety of investment disciplines and providing a large variety of mutual fund investor services. The Board noted that Fidelity had taken, or had made recommendations that resulted in the Fidelity funds taking, a number of actions over the previous year that benefited particular funds, including: (i) continuing to dedicate additional resources to investment research and to the support of the senior management team that oversees asset management; (ii) continuing efforts to enhance Fidelity's global research capabilities; (iii) launching new funds and making other enhancements to meet client needs; (iv) broadening eligibility requirements for certain lower-priced share classes of, and streamlining the fee structure for, certain existing equity index funds; (v) lowering expense caps for certain existing funds and classes to reduce expenses paid by shareholders; (vi) eliminating redemption fees for certain variable insurance product funds and classes; (vii) continuing to launch dedicated lower cost underlying funds to meet portfolio construction needs related to expanding underlying fund options for Fidelity funds of funds, specifically for the Freedom Fund product lines; (viii) launching a lower cost share class for use by the Freedom Index Fund product line; (ix) rationalizing product lines and gaining increased efficiencies through fund mergers and share class consolidations; (x) continuing to develop, acquire and implement systems and technology to improve services to the funds and shareholders, strengthen information security, and increase efficiency; (xi) implementing investment enhancements to further strengthen Fidelity's target date product line to increase investors' probability of success in achieving their goals; (xii) accelerating the conversion of all remaining Class B shares to Class A shares, which have a lower expense structure; and (xiii) implementing changes to Fidelity's money market fund product line in response to recent regulatory reforms.
Investment Performance. The Board considered whether the fund has operated in accordance with its investment objective, as well as its record of compliance with its investment restrictions and its performance history.
The Board took into account discussions with representatives of the Investment Advisers about fund investment performance that occur at Board meetings throughout the year. In this regard the Board noted that as part of regularly scheduled fund reviews and other reports to the Board on fund performance, the Board considers annualized return information for the fund for different time periods, measured against a peer group of funds with similar objectives ("peer group").
In addition to reviewing absolute and relative fund performance, the Independent Trustees periodically consider the appropriateness of fund performance metrics in evaluating the results achieved. In general, the Independent Trustees believe that fund performance should be evaluated based on gross performance (before fees and expenses but after transaction costs) compared to the gross performance of appropriate peer groups, over appropriate time periods that may include full market cycles, taking into account relevant factors including the following: general market conditions; expectations for interest rate levels and credit conditions; issuer-specific information including credit quality; the fund's market value NAV over time and its resilience under various stressed conditions; and fund cash flows and other factors.
The Board recognizes that in interest rate environments where many competitors waive fees to maintain a minimum yield, relative money market fund performance on a net basis (after fees and expenses) may not be particularly meaningful due to miniscule performance differences among competitor funds. Depending on the circumstances, the Independent Trustees may be satisfied with a fund's performance notwithstanding that it lags its peer group for certain periods.
The Independent Trustees recognize that shareholders evaluate performance on a net basis over their own holding periods, for which one-, three-, and five-year periods are often used as a proxy. For this reason, the performance information reviewed by the Board also included net cumulative calendar year total return information for the fund and an appropriate peer group for the most recent one-, three-, and five-year periods.
Based on its review, the Board concluded that the nature, extent, and quality of services provided to the fund under the Advisory Contracts should continue to benefit the shareholders of the fund.
Competitiveness of Management Fee and Total Expense Ratio. The Board considered the fund's management fee and total expense ratio compared to "mapped groups" of competitive funds and classes created for the purpose of facilitating the Trustees' competitive analysis of management fees and total expenses. Fidelity creates "mapped groups" by combining similar Lipper investment objective categories that have comparable investment mandates. Combining Lipper investment objective categories aids the Board's management fee and total expense ratio comparisons by broadening the competitive group used for comparison.
Management Fee. The Board considered two proprietary management fee comparisons for the 12-month periods shown in basis points (BP) in the chart below. The group of Lipper funds used by the Board for management fee comparisons is referred to below as the "Total Mapped Group" and, for the reasons explained above, is broader than the Lipper peer group used by the Board for performance comparisons. The Total Mapped Group comparison focuses on a fund's standing in terms of gross management fees before expense reimbursements or caps relative to the total universe of funds with comparable investment mandates, regardless of whether their management fee structures also are comparable. Funds with comparable investment mandates offer exposure to similar types of securities. Funds with comparable management fee structures have similar management fee contractual arrangements (
e.g., flat rate charged for advisory services, all-inclusive fee rate,
etc.). "TMG %" represents the percentage of funds in the Total Mapped Group that had management fees that were lower than the fund's. For example, a hypothetical TMG % of 20% would mean that 80% of the funds in the Total Mapped Group had higher, and 20% had lower, management fees than the fund. The fund's actual TMG %s and the number of funds in the Total Mapped Group are in the chart below. The "Asset-Size Peer Group" (ASPG) comparison focuses on a fund's standing relative to a subset of non-Fidelity funds within the Total Mapped Group that are similar in size and management fee structure. For example, if a fund is in the first quartile of the ASPG, the fund's management fee ranks in the least expensive or lowest 25% of funds in the ASPG. The ASPG represents at least 15% of the funds in the Total Mapped Group with comparable asset size and management fee structures, subject to a minimum of 50 funds (or all funds in the Total Mapped Group if fewer than 50). Additional information, such as the ASPG quartile in which the fund's management fee rate ranked, is also included in the chart and considered by the Board. Because the vast majority of competitor funds' management fees do not cover non-management expenses, for a more meaningful comparison of management fees, the fund is compared on the basis of a hypothetical "net management fee," which is derived by subtracting payments made by FMR for non-management expenses (including transfer agent fees, pricing and bookkeeping fees, and fees paid to non-affiliated custodians) from the fund's all-inclusive fee. In this regard, the Board considered that net management fees can vary from year to year because of differences in non-management expenses.
Fidelity Retirement Government Money Market Portfolio
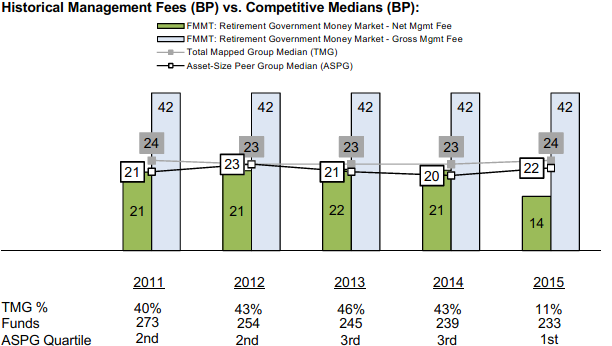
The Board noted that the fund's hypothetical net management fee rate ranked below the median of its Total Mapped Group and below the median of its ASPG for 2015.
The Board noted that, in 2014, the ad hoc Committee on Group Fee was formed by it and the boards of other Fidelity funds to conduct an in-depth review of the "group fee" component of the management fee of funds with such management fee structures. The Committee's focus included the mechanics of the group fee, the competitive landscape of group fee structures, Fidelity funds with no group fee component (such as the fund) and investment products not included in group fee assets. The Board also considered that, for funds subject to the group fee, FMR agreed to voluntarily waive fees over a specified period of time in amounts designed to account for assets converted from certain funds to certain collective investment trusts.
Based on its review, the Board concluded that the fund's management fee is fair and reasonable in light of the services that the fund receives and the other factors considered.
Total Expense Ratio. In its review of the fund's total expense ratio, the Board considered the fund's hypothetical net management fee rate as well as the fund's all-inclusive fee rate. The Board also considered other expenses, such as transfer agent fees, pricing and bookkeeping fees, and custodial, legal, and audit fees, paid by FMR under the all-inclusive arrangement. The Board also noted that Fidelity may agree to waive fees and expenses from time to time, and the extent to which, if any, it has done so for the fund. As part of its review, the Board also considered the current and historical total expense ratios of the fund compared to competitive fund median expenses. The fund is compared to those funds and classes in the Total Mapped Group (used by the Board for management fee comparisons) that have a similar sales load structure.
The Board noted that the fund's total expense ratio ranked above the competitive median for 2015. The Board considered that, in general, various factors can affect total expense ratios. The Board considered that Fidelity has been voluntarily waiving part or all of the management fees to maintain a minimum yield. The fund's total expense ratio ranked above the median for 2015 because the advisers of many competitor funds waived fees or reimbursed expenses to a greater extent than Fidelity in order to maintain a minimum yield, which caused the expense medians of such competitor funds to be lower than they would otherwise be. Excluding fee waivers, the total expense ratio of the fund ranked above the median when compared to the institutional money market fund universe; however, the Board also considered that the fund is sold to plan participants, has no investment minimum, and provides services similar to retail funds, and that FMR believes the fund is more comparable to a fund in the retail money market fund universe. When compared to the retail money market fund universe, the fund ranks below the median.
Fees Charged to Other Fidelity Clients. The Board also considered Fidelity fee structures and other information with respect to clients of Fidelity, such as other funds advised or subadvised by Fidelity, pension plan clients, and other institutional clients with similar mandates. The Board noted that an ad hoc joint committee created by it and the boards of other Fidelity funds periodically (most recently in 2013) reviews and compares Fidelity's institutional investment advisory business with its business of providing services to the Fidelity funds, including the differences in services provided, fees charged, and costs incurred, as well as competition in their respective marketplaces.
Based on its review of total expense ratios and fees charged to other Fidelity clients, the Board concluded that, although above the median of the universe presented for comparison, the fund's total expense ratio was reasonable in light of the services that the fund and its shareholders receive and the other factors considered.
Costs of the Services and Profitability. The Board considered the revenues earned and the expenses incurred by Fidelity in conducting the business of developing, marketing, distributing, managing, administering and servicing the fund and servicing the fund's shareholders. The Board also considered the level of Fidelity's profits in respect of all the Fidelity funds.
On an annual basis, Fidelity presents to the Board information about the profitability of its relationships with the fund. Fidelity calculates profitability information for each fund, as well as aggregate profitability information for groups of Fidelity funds and all Fidelity funds, using a series of detailed revenue and cost allocation methodologies which originate with the books and records of Fidelity on which Fidelity's audited financial statements are based. The Audit Committee of the Board reviews any significant changes from the prior year's methodologies.
PricewaterhouseCoopers LLP (PwC), independent registered public accounting firm and auditor to Fidelity and certain Fidelity funds, has been engaged annually by the Board as part of the Board's assessment of Fidelity's profitability analysis. PwC's engagement includes the review and assessment of the methodologies used by Fidelity in determining the revenues and expenses attributable to Fidelity's mutual fund business, and completion of agreed-upon procedures in respect of the mathematical accuracy of the fund profitability information and its conformity to established allocation methodologies. After considering PwC's reports issued under the engagement and information provided by Fidelity, the Board concluded that while other allocation methods may also be reasonable, Fidelity's profitability methodologies are reasonable in all material respects.
The Board also reviewed Fidelity's non-fund businesses and fall-out benefits related to the mutual fund business as well as cases where Fidelity's affiliates may benefit from or be related to the fund's business.
The Board considered the costs of the services provided by and the profits realized by Fidelity in connection with the operation of the fund and was satisfied that the profitability was not excessive.
Economies of Scale. The Board considered whether there have been economies of scale in respect of the management of the Fidelity funds, whether the Fidelity funds (including the fund) have appropriately benefited from any such economies of scale, and whether there is potential for realization of any further economies of scale. The Board considered the extent to which the fund will benefit from economies of scale as assets grow through increased services to the fund, through waivers or reimbursements, or through fee or expense ratio reductions. The Board recognized that due to the fund's current contractual arrangements its expense ratio will not decline if the fund's operating costs decrease as assets grow, or rise as assets decrease. The Board also noted that a committee (the Economies of Scale Committee) created by it and the boards of other Fidelity funds periodically (most recently in 2013) analyzes whether Fidelity attains economies of scale in respect of the management and servicing of the Fidelity funds, whether the Fidelity funds have appropriately benefited from such economies of scale, and whether there is potential for realization of any further economies of scale.
The Board concluded, taking into account the analysis of the Economies of Scale Committee, that economies of scale, if any, are being appropriately shared between fund shareholders and Fidelity.
Additional Information Requested by the Board. In order to develop fully the factual basis for consideration of the Fidelity funds' advisory contracts, the Board requested and received additional information on certain topics, including: (i) Fidelity's fund profitability methodology, profitability trends for certain funds, and the impact of certain factors on fund profitability results; (ii) portfolio manager changes that have occurred during the past year and the amount of the investment that each portfolio manager has made in the Fidelity fund(s) that he or she manages; (iii) Fidelity's compensation structure for portfolio managers, research analysts, and other key personnel, including its effects on fund profitability, the rationale for the compensation structure, and the extent to which current market conditions have affected retention and recruitment; (iv) the arrangements with and compensation paid to certain fund sub-advisers on behalf of the Fidelity funds; (v) Fidelity's voluntary waiver of its fees to maintain minimum yields for certain money market funds and classes as well as contractual waivers in place for certain funds; (vi) the methodology with respect to competitive fund data and peer group classifications; (vii) Fidelity's transfer agent fee, expense, and service structures for different funds and classes relative to competitive trends, and the impact of the increased use of omnibus accounts; (viii) Fidelity's long-term expectations for its offerings in the workplace investing channel; (ix) new developments in the retail and institutional marketplaces; (x) the approach to considering "fall-out" benefits; and (xi) the impact of money market reform on Fidelity's money market funds, including with respect to costs and profitability. In addition, the Board considered its discussions with Fidelity throughout the year regarding enhanced information security initiatives and the funds' fair valuation policies.
Based on its evaluation of all of the conclusions noted above, and after considering all factors it believed relevant, the Board concluded that the advisory fee structures are fair and reasonable, and that the fund's Advisory Contracts should be renewed.

Corporate Headquarters
245 Summer St.
Boston, MA 02210
www.fidelity.com
RGM-SANN-0417
1.700932.119
Fidelity Money Market Trust Retirement Government Money Market II Portfolio
Semi-Annual Report February 28, 2017 |
|
Contents
To view a fund's proxy voting guidelines and proxy voting record for the 12-month period ended June 30, visit http://www.fidelity.com/proxyvotingresults or visit the Securities and Exchange Commission's (SEC) web site at http://www.sec.gov.
You may also call 1-800-544-8544 to request a free copy of the proxy voting guidelines.
Standard & Poor's, S&P and S&P 500 are registered service marks of The McGraw-Hill Companies, Inc. and have been licensed for use by Fidelity Distributors Corporation.
Other third-party marks appearing herein are the property of their respective owners.
All other marks appearing herein are registered or unregistered trademarks or service marks of FMR LLC or an affiliated company. © 2017 FMR LLC. All rights reserved.
The fund seeks to obtain as high a level of current income as is consistent with the preservation of capital and liquidity by investing in high-quality, short-term money market securities issued or guaranteed as to principal and interest by the U.S. Government, or by any of its agencies or instrumentalities.
An investment in a money market fund is not insured or guaranteed by the Federal Deposit Insurance Corporation or any other government agency. Although the fund seeks to preserve the value of your investment at $1.00 per share, it is possible to lose money by investing in the fund.
This report and the financial statements contained herein are submitted for the general information of the shareholders of the Fund. This report is not authorized for distribution to prospective investors in the Fund unless preceded or accompanied by an effective prospectus.
A fund files its complete schedule of portfolio holdings with the SEC for the first and third quarters of each fiscal year on Form N-Q. Forms N-Q are available on the SEC’s web site at http://www.sec.gov. A fund's Forms N-Q may be reviewed and copied at the SEC’s Public Reference Room in Washington, DC. Information regarding the operation of the SEC's Public Reference Room may be obtained by calling 1-800-SEC-0330.
For a complete list of a fund's portfolio holdings, view the most recent holdings listing, semiannual report, or annual report on Fidelity's web site at http://www.fidelity.com, http://www.institutional.fidelity.com, or http://www.401k.com, as applicable.
NOT FDIC INSURED •MAY LOSE VALUE •NO BANK GUARANTEE
Neither the Fund nor Fidelity Distributors Corporation is a bank.
Investment Summary/Performance (Unaudited)
Effective Maturity Diversification
| Days | % of fund's investments 2/28/17 | % of fund's investments 8/31/16 | % of fund's investments 2/29/16 |
| 1 - 7 | 32.3 | 22.5 | 21.4 |
| 8 - 30 | 25.6 | 16.0 | 29.9 |
| 31 - 60 | 19.9 | 26.7 | 22.6 |
| 61 - 90 | 13.1 | 26.4 | 13.6 |
| 91 - 180 | 6.1 | 7.3 | 11.0 |
| > 180 | 3.0 | 1.1 | 1.5 |
Effective maturity is determined in accordance with the requirements of Rule 2a-7 under the Investment Company Act of 1940.
Asset Allocation (% of fund's net assets)
| As of February 28, 2017 |
| | Variable Rate Demand Notes (VRDNs) | 0.8% |
| | U.S. Treasury Debt | 16.6% |
| | U.S. Government Agency Debt | 57.6% |
| | Repurchase Agreements | 26.0% |
| | Net Other Assets (Liabilities)* | (1.0)% |

* Net Other Assets (Liabilities) are not included in the pie chart
| As of August 31, 2016 |
| | U.S. Treasury Debt | 15.4% |
| | U.S. Government Agency Debt | 68.0% |
| | Repurchase Agreements | 17.0% |
| | Net Other Assets (Liabilities)* | (0.4)% |

* Net Other Assets (Liabilities) are not included in the pie chart
Current And Historical 7-Day Yields
| | 2/28/17 | 11/30/16 | 8/31/16 | 5/31/16 | 2/29/16 |
| Retirement Government Money Market II Portfolio | 0.20% | 0.09% | 0.05% | 0.03% | 0.01% |
Yield refers to the income paid by the Fund over a given period. Yields for money market funds are usually for seven-day periods, as they are here, though they are expressed as annual percentage rates. Past performance is no guarantee of future results. Yield will vary and it's possible to lose money investing in the Fund.
Investments February 28, 2017 (Unaudited)
Showing Percentage of Net Assets
| U.S. Treasury Debt - 16.6% | | | | |
| | | Yield(a) | Principal Amount (000s) | Value (000s) |
| U.S. Treasury Obligations - 16.6% | | | | |
| U.S. Treasury Bills | | | | |
| 4/20/17 to 8/17/17 | | 0.48 to 0.65% | $813,976 | $812,591 |
| U.S. Treasury Notes | | | | |
| 3/31/17 to 10/31/18 | | 0.50 to 0.90 (b) | 805,000 | 805,846 |
| TOTAL U.S. TREASURY DEBT | | | | |
| (Cost $1,618,437) | | | | 1,618,437 |
|
| Variable Rate Demand Note - 0.8% | | | | |
| Arizona - 0.1% | | | | |
| FNMA Arizona Hsg. Fin. Auth. Multi-family Hsg. Rev. (Santa Carolina Apts. Proj.) Series 2005, 0.58% 3/7/17, LOC Fannie Mae, VRDN | | | | |
| 3/7/17 | | 0.58 (b)(c) | 3,645 | 3,645 |
| Maricopa County Indl. Dev. Auth. Multi-family Hsg. Rev. (San Remo Apts. Proj.) Series 2002, 0.58% 3/7/17, LOC Fannie Mae, VRDN | | | | |
| 3/7/17 | | 0.58 (b)(c) | 4,000 | 4,000 |
| | | | | 7,645 |
| California - 0.1% | | | | |
| California Statewide Cmntys. Dev. Auth. Multi-family Hsg. Rev. (Bristol Apts. Proj.) Series Z, 0.62% 3/7/17, LOC Freddie Mac, VRDN | | | | |
| 3/7/17 | | 0.62 (b)(c) | 9,500 | 9,500 |
| California Statewide Cmntys. Dev. Auth. Multi-family Hsg. Rev. (Northwood Apts. Proj.) Series N, 0.63% 3/7/17, LOC Freddie Mac, VRDN | | | | |
| 3/7/17 | | 0.63 (b)(c) | 4,600 | 4,600 |
| | | | | 14,100 |
| District Of Columbia - 0.1% | | | | |
| District of Columbia Hsg. Fin. Agcy. Multi-family Hsg. Rev. (Park 7 at Minnesota Benning Proj.) Series 2012, 0.65% 3/7/17, LOC Freddie Mac, VRDN | | | | |
| 3/7/17 | | 0.65 (b) | 5,900 | 5,900 |
| New Jersey - 0.1% | | | | |
| Bergen County Impt. Auth. Multi-family Hsg. Rev. (Kentshire Apts. Proj.) Series 2001, 0.61% 3/7/17, LOC Fannie Mae, VRDN | | | | |
| 3/7/17 | | 0.61 (b)(c) | 10,100 | 10,100 |
| New York - 0.1% | | | | |
| New York City Hsg. Dev. Corp. Multi-family Rental Hsg. Rev. (Two Gold Street Proj.) Series 2006 A, 0.64% 3/7/17, LOC Fannie Mae, VRDN | | | | |
| 3/7/17 | | 0.64 (b) | 1,600 | 1,600 |
| New York Hsg. Fin. Agcy. Rev. (South Cove Plaza Proj.) Series A, 0.57% 3/7/17, LOC Freddie Mac, VRDN | | | | |
| 3/7/17 | | 0.57 (b)(c) | 4,000 | 4,000 |
| New York Hsg. Fin. Agcy. Rev. (Theatre Row Tower Hsg. Proj.) Series 2000 A, 0.66% 3/7/17, LOC Freddie Mac, VRDN | | | | |
| 3/7/17 | | 0.66 (b)(c) | 3,600 | 3,600 |
| | | | | 9,200 |
| Texas - 0.1% | | | | |
| FNMA Texas Dept. of Hsg. & Cmnty. Affairs Multi-family Hsg. Rev. (Chisholm Trail Proj.) Series 2004, 0.58% 3/7/17, LOC Fannie Mae, VRDN | | | | |
| 3/7/17 | | 0.58 (b)(c) | 4,900 | 4,900 |
| FNMA Texas Dept. of Hsg. & Cmnty. Affairs Multi-family Hsg. Rev. (St. Augustine Estate Proj.) Series 2005, 0.58% 3/7/17, LOC Fannie Mae, VRDN | | | | |
| 3/7/17 | | 0.58 (b)(c) | 5,780 | 5,780 |
| | | | | 10,680 |
| Washington - 0.2% | | | | |
| FNMA Washington Hsg. Fin. Commission Multi-family Hsg. Rev. (The Vintage at Everett Sr. Living Proj.) Series 2004 A, 0.58% 3/7/17, LOC Fannie Mae, VRDN | | | | |
| 3/7/17 | | 0.58 (b)(c) | 15,750 | 15,750 |
| TOTAL VARIABLE RATE DEMAND NOTE | | | | |
| (Cost $73,375) | | | | 73,375 |
|
| U.S. Government Agency Debt - 57.6% | | | | |
| Federal Agencies - 57.6% | | | | |
| Fannie Mae | | | | |
| 10/26/17 to 1/11/18 | | 0.78 to 0.98 (b) | 129,000 | 129,009 |
| Federal Home Loan Bank | | | | |
| 12/1/17 | | 0.66 (b) | 14,000 | 14,000 |
| 12/1/17 | | 0.66 (b) | 14,000 | 14,000 |
| 12/1/17 | | 0.66 (b) | 14,000 | 14,000 |
| 3/1/17 to 9/26/18 | | 0.51 to 0.97 (b) | 4,977,900 | 4,976,713 |
| 9/6/17 | | 0.61 (b) | 14,000 | 14,000 |
| Freddie Mac | | | | |
| 3/9/17 to 1/12/18 | | 0.50 to 0.99 (b) | 470,000 | 470,081 |
| TOTAL U.S. GOVERNMENT AGENCY DEBT | | | | |
| (Cost $5,631,803) | | | | 5,631,803 |
| U.S. Government Agency Repurchase Agreement - 8.9% | | | |
| | | Maturity Amount (000s) | Value (000s) |
| In a joint trading account at 0.53% dated 2/28/17 due 3/1/17 (Collateralized by U.S. Government Obligations) # | | $209,413 | $209,410 |
| With: | | | |
| BNP Paribas, S.A. at: | | | |
| 0.56%, dated 2/2/17 due 3/7/17 (Collateralized by U.S. Government Obligations valued at $7,151,793, 0.00% - 8.00%, 7/28/17 - 1/01/44) | | 7,007 | 7,000 |
| 0.59%, dated 2/8/17 due 3/7/17 (Collateralized by U.S. Treasury Obligations valued at $15,305,608, 0.00% - 8.13%, 9/14/17 - 2/01/32) | | 15,022 | 15,000 |
| 0.6%, dated 2/17/17 due 3/7/17 (Collateralized by U.S. Treasury Obligations valued at $29,875,390, 0.00% - 7.13%, 11/15/18 - 12/25/42) | | 29,042 | 29,000 |
| 0.62%, dated 1/9/17 due 3/7/17 (Collateralized by U.S. Treasury Obligations valued at $8,209,399, 0.00% - 7.13%, 11/15/18 - 11/01/46) | | 8,008 | 8,000 |
| 0.66%, dated 2/27/17 due 5/26/17 (Collateralized by U.S. Government Obligations valued at $29,581,085, 2.38% - 7.13%, 1/13/22 - 2/01/47) | | 29,047 | 29,000 |
| Citibank NA at: | | | |
| 0.54%, dated 2/28/17 due 3/7/17 (Collateralized by U.S. Treasury Obligations valued at $7,140,152, 0.00% - 3.63%, 8/03/17 - 9/30/20) | | 7,001 | 7,000 |
| 0.55%, dated 2/28/17 due 3/7/17 (Collateralized by U.S. Treasury Obligations valued at $43,861,013, 0.75% - 2.50%, 7/31/18 - 1/15/29) | | 43,005 | 43,000 |
| Deutsche Bank Securities, Inc. at 0.55%, dated: | | | |
| 2/22/17 due 3/1/17 (Collateralized by U.S. Treasury Obligations valued at $20,402,184, 2.75%, 11/15/23) | | 20,002 | 20,000 |
| 2/24/17 due 3/3/17 (Collateralized by U.S. Treasury Obligations valued at $20,408,417, 1.75% - 2.63%, 11/15/20 - 11/15/24) | | 20,002 | 20,000 |
| 2/28/17 due 3/1/17 (Collateralized by U.S. Treasury Obligations valued at $29,870,512, 2.75%, 8/15/42) | | 29,000 | 29,000 |
| ING Financial Markets LLC at: | | | |
| 0.61%, dated 12/9/16 due 3/9/17 (Collateralized by U.S. Government Obligations valued at $5,111,220, 1.13%, 7/20/18) | | 5,008 | 5,000 |
| 0.63%, dated: | | | |
| 2/8/17 due 4/4/17 (Collateralized by U.S. Government Obligations valued at $12,244,463, 1.75% - 2.38%, 9/12/19 - 1/13/22) | | 12,019 | 12,000 |
| 2/9/17 due 4/4/17 (Collateralized by U.S. Government Obligations valued at $15,307,488, 2.38%, 1/13/22) | | 15,024 | 15,000 |
| 2/10/17 due 4/4/17 (Collateralized by U.S. Government Obligations valued at $18,366,943, 2.38%, 1/13/22) | | 18,028 | 18,000 |
| 2/14/17 due 4/4/17 (Collateralized by U.S. Government Obligations valued at $15,307,488, 2.38%, 1/13/22) | | 15,024 | 15,000 |
| 2/15/17 due 4/4/17 (Collateralized by U.S. Government Obligations valued at $9,186,237, 1.75%, 9/12/19) | | 9,014 | 9,000 |
| 2/16/17 due 4/4/17 (Collateralized by U.S. Government Obligations valued at $16,323,901, 2.38%, 1/13/22) | | 16,025 | 16,000 |
| 2/17/17 due 4/4/17 (Collateralized by U.S. Government Obligations valued at $9,186,237, 1.75%, 9/12/19) | | 9,014 | 9,000 |
| 2/21/17 due 4/4/17 (Collateralized by U.S. Government Obligations valued at $15,302,381, 2.38%, 1/13/22) | | 15,024 | 15,000 |
| Merrill Lynch, Pierce, Fenner & Smith at 0.59%, dated 2/13/17 due 3/7/17 (Collateralized by U.S. Government Obligations valued at $44,892,251, 0.00%, 5/15/30 - 5/04/37) | | 44,043 | 44,000 |
| Mitsubishi UFJ Securities (U.S.A.), Inc. at: | | | |
| 0.61%, dated: | | | |
| 2/7/17 due 4/7/17 (Collateralized by U.S. Government Obligations valued at $19,387,225, 2.42% - 4.50%, 7/01/24 - 12/01/46) | | 19,019 | 19,000 |
| 2/8/17 due 4/10/17 (Collateralized by U.S. Government Obligations valued at $16,325,807, 2.50% - 4.00%, 1/01/30 - 3/01/47) | | 16,017 | 16,000 |
| 2/22/17 due 4/24/17 (Collateralized by U.S. Government Obligations valued at $20,402,420, 2.42% - 5.34%, 1/01/19 - 3/01/47) | | 20,021 | 20,000 |
| 2/28/17 due 5/1/17 (Collateralized by U.S. Government Obligations valued at $24,480,415, 2.35% - 4.98%, 11/01/23 - 3/01/47) | | 24,025 | 24,000 |
| 0.64%, dated 1/11/17 due 4/11/17 (Collateralized by U.S. Government Obligations valued at $20,417,771, 1.80% - 6.06%, 11/01/23 - 3/01/47) | | 20,032 | 20,000 |
| Mizuho Securities U.S.A., Inc. at 0.56%, dated 2/6/17 due 3/7/17 (Collateralized by U.S. Government Obligations valued at $15,310,024, 2.36% - 4.50%, 1/01/27 - 2/01/47) | | 15,007 | 15,000 |
| RBC Capital Markets Corp. at: | | | |
| 0.55%, dated 1/20/17 due 3/7/17 (Collateralized by U.S. Government Obligations valued at $8,165,526, 2.39% - 6.00%, 6/01/28 - 3/01/47) | | 8,007 | 8,000 |
| 0.56%, dated: | | | |
| 1/9/17 due 3/7/17 (Collateralized by U.S. Government Obligations valued at $21,440,427, 2.13% - 5.50%, 1/01/27 - 2/01/47) | | 21,020 | 21,000 |
| 1/13/17 due 3/7/17 (Collateralized by U.S. Government Obligations valued at $20,426,762, 2.52% - 5.00%, 1/01/27 - 2/01/47) | | 20,018 | 20,000 |
| 1/17/17 due 3/7/17 (Collateralized by U.S. Government Obligations valued at $8,165,648, 2.50% - 5.50%, 1/01/27 - 12/01/46) | | 8,007 | 8,000 |
| 2/6/17 due 3/7/17 (Collateralized by U.S. Government Obligations valued at $15,305,475, 3.00% - 3.50%, 2/01/32 - 2/01/47) | | 15,015 | 15,000 |
| 0.58%, dated 2/14/17 due 3/7/17 (Collateralized by U.S. Government Obligations valued at $15,303,937, 2.47% - 4.50%, 1/01/27 - 1/01/47) | | 15,019 | 15,000 |
| RBC Dominion Securities at: | | | |
| 0.54%, dated 2/17/17 due 3/7/17 (Collateralized by U.S. Government Obligations valued at $21,423,856, 3.00% - 4.50%, 10/20/43 - 1/20/47) | | 21,010 | 21,000 |
| 0.56%, dated: | | | |
| 1/17/17 due 3/7/17 (Collateralized by U.S. Government Obligations valued at $14,289,552, 3.00% - 4.00%, 4/20/46 - 1/20/47) | | 14,013 | 14,000 |
| 1/18/17 due 3/3/17 (Collateralized by U.S. Government Obligations valued at $3,062,000, 3.00% - 4.50%, 3/20/41 - 1/20/47) | | 3,002 | 3,000 |
| 0.58%, dated 2/28/17 due 3/7/17: | | | |
| (Collateralized by U.S. Treasury Obligations valued at $14,280,252, 1.38% - 2.00%, 8/31/21 - 8/31/23) | | 14,014 | 14,000 |
| (Collateralized by U.S. Government Obligations valued at $14,280,231, 4.00%, 1/20/47) | | 14,014 | 14,000 |
| Wells Fargo Securities, LLC at 0.61%, dated 12/6/16 due 3/6/17 (Collateralized by U.S. Government Obligations valued at $31,665,542, 3.50% - 9.00%, 8/15/17 - 2/15/47) | | 31,047 | 31,000 |
| TOTAL U.S. GOVERNMENT AGENCY REPURCHASE AGREEMENT | | | |
| (Cost $872,410) | | | 872,410 |
|
| U.S. Treasury Repurchase Agreement - 17.1% | | | |
| With: | | | |
| Barclays Capital, Inc. at 0.54%, dated 2/28/17 due 3/1/17 (Collateralized by U.S. Treasury Obligations valued at $12,240,212, 0.00% - 8.00%, 5/11/17 - 8/15/23) | | 12,000 | 12,000 |
| BMO Harris Bank NA at: | | | |
| 0.53%, dated: | | | |
| 1/11/17 due 3/7/17 (Collateralized by U.S. Treasury Obligations valued at $7,178,703, 2.63%, 8/15/20) | | 7,006 | 7,000 |
| 1/13/17 due 3/7/17 (Collateralized by U.S. Treasury Obligations valued at $28,715,514, 1.63%, 11/30/20) | | 28,025 | 28,000 |
| 2/10/17 due 3/7/17 (Collateralized by U.S. Treasury Obligations valued at $13,316,787, 3.25%, 3/31/17) | | 13,007 | 13,000 |
| 0.54%, dated 2/9/17 due 3/7/17: | | | |
| (Collateralized by U.S. Treasury Obligations valued at $13,302,347, 1.38%, 4/30/20) | | 13,012 | 13,000 |
| (Collateralized by U.S. Treasury Obligations valued at $15,356,845, 0.88%, 6/15/17) | | 15,014 | 15,000 |
| 0.55%, dated: | | | |
| 2/1/17 due 3/7/17 (Collateralized by U.S. Treasury Obligations valued at $21,695,414, 3.63%, 8/15/43) | | 21,022 | 21,000 |
| 2/3/17 due 3/7/17: | | | |
| (Collateralized by U.S. Treasury Obligations valued at $9,198,927, 1.75%, 5/15/23) | | 9,012 | 9,000 |
| (Collateralized by U.S. Treasury Obligations valued at $9,214,297, 1.50%, 8/15/26) | | 9,011 | 9,000 |
| 0.56%, dated 1/31/17 due 3/7/17 (Collateralized by U.S. Treasury Obligations valued at $13,430,883, 0.75%, 8/31/18) | | 13,016 | 13,000 |
| 0.57%, dated 2/28/17 due 3/7/17 (Collateralized by U.S. Treasury Obligations valued at $13,364,138, 1.75%, 11/30/21) | | 13,012 | 13,000 |
| BNP Paribas, S.A. at: | | | |
| 0.55%, dated 2/2/17 due 3/7/17 (Collateralized by U.S. Treasury Obligations valued at $20,408,417, 1.75% - 2.63%, 11/15/20 - 11/15/24) | | 20,018 | 20,000 |
| 0.56%, dated 1/31/17 due 3/7/17 (Collateralized by U.S. Treasury Obligations valued at $27,819,177, 0.62% - 5.50%, 7/31/17 - 5/15/45) | | 27,027 | 27,000 |
| 0.57%, dated: | | | |
| 1/5/17 due 3/3/17 (Collateralized by U.S. Treasury Obligations valued at $27,563,986, 0.00% - 9.13%, 4/13/17 - 11/15/43) | | 27,024 | 27,000 |
| 1/9/17 due 3/7/17 (Collateralized by U.S. Treasury Obligations valued at $17,354,072, 0.62% - 6.88%, 7/31/17 - 11/15/42) | | 17,015 | 17,000 |
| 1/12/17 due 3/7/17 (Collateralized by U.S. Treasury Obligations valued at $14,290,886, 1.75% - 7.50%, 11/15/20 - 11/15/24) | | 14,017 | 14,000 |
| 1/17/17 due 3/7/17 (Collateralized by U.S. Treasury Obligations valued at $28,859,267, 2.63% - 4.25%, 11/15/20 - 11/15/40) | | 28,031 | 28,000 |
| 1/20/17 due 3/7/17 (Collateralized by U.S. Treasury Obligations valued at $42,867,171, 1.00% - 6.88%, 3/15/19 - 2/15/26) | | 42,060 | 42,000 |
| 1/30/17 due 3/7/17 (Collateralized by U.S. Treasury Obligations valued at $84,726,409, 0.88% - 6.88%, 10/15/17 - 2/15/47) | | 83,078 | 83,000 |
| 2/8/17 due 3/7/17 (Collateralized by U.S. Treasury Obligations valued at $41,078,695, 1.00% - 8.13%, 9/30/19 - 11/15/45) | | 40,057 | 40,000 |
| 0.58%, dated 1/9/17 due 3/10/17 (Collateralized by U.S. Treasury Obligations valued at $11,229,279, 0.00% - 6.88%, 4/13/17 - 8/15/25) | | 11,011 | 11,000 |
| 0.6%, dated: | | | |
| 1/5/17 due 3/3/17 (Collateralized by U.S. Treasury Obligations valued at $27,568,842, 1.50% - 7.50%, 9/30/21 - 2/15/47) | | 27,026 | 27,000 |
| 1/9/17 due 3/7/17 (Collateralized by U.S. Treasury Obligations valued at $10,306,410, 2.13% - 2.50%, 9/30/21 - 5/15/46) | | 10,010 | 10,000 |
| 1/20/17 due 4/20/17 (Collateralized by U.S. Treasury Obligations valued at $57,354,878, 0.62% - 9.13%, 7/15/17 - 11/15/44) | | 56,084 | 56,000 |
| 0.63%, dated: | | | |
| 2/24/17 due 3/7/17 (Collateralized by U.S. Treasury Obligations valued at $53,430,681, 1.75% - 3.00%, 11/15/20 - 5/15/45) | | 52,096 | 52,000 |
| 2/27/17 due 3/7/17 (Collateralized by U.S. Treasury Obligations valued at $80,826,145, 2.63% - 7.50%, 5/15/20 - 5/15/45) | | 79,145 | 79,000 |
| Commerz Markets LLC at 0.55%, dated 2/28/17 due 3/1/17 (Collateralized by U.S. Treasury Obligations valued at $193,804,324, 1.50% - 2.00%, 3/31/23 - 2/15/25) | | 190,003 | 190,000 |
| Deutsche Bank Securities, Inc. at 0.54%, dated: | | | |
| 2/22/17 due 3/1/17 (Collateralized by U.S. Treasury Obligations valued at $38,764,159, 1.63%, 6/30/20) | | 38,004 | 38,000 |
| 2/24/17 due 3/3/17 (Collateralized by U.S. Treasury Obligations valued at $19,381,494, 2.75%, 11/15/23) | | 19,002 | 19,000 |
| 2/28/17 due 3/1/17 (Collateralized by U.S. Treasury Obligations valued at $20,400,406, 2.75%, 11/15/23) | | 20,000 | 20,000 |
| Mitsubishi UFJ Securities (U.S.A.), Inc. at 0.56%, dated 1/18/17 due 3/7/17 (Collateralized by U.S. Treasury Obligations valued at $7,164,158, 1.00% - 5.25%, 5/15/18 - 11/15/45) | | 7,007 | 7,000 |
| Mizuho Securities U.S.A., Inc. at 0.54%, dated 2/28/17 due 3/1/17 (Collateralized by U.S. Treasury Obligations valued at $26,697,361, 2.25%, 11/15/25) | | 26,000 | 26,000 |
| MUFG Securities EMEA PLC at: | | | |
| 0.53%, dated 2/28/17 due 3/1/17 (Collateralized by U.S. Treasury Obligations valued at $4,347,369, 2.00%, 11/15/26) | | 4,213 | 4,213 |
| 0.58%, dated 2/6/17 due 3/7/17 (Collateralized by U.S. Treasury Obligations valued at $3,088,384, 1.50%, 8/15/26) | | 3,003 | 3,000 |
| 0.59%, dated: | | | |
| 2/21/17 due 3/1/17: | | | |
| (Collateralized by U.S. Treasury Obligations valued at $14,364,742, 2.13%, 5/15/25) | | 14,002 | 14,000 |
| (Collateralized by U.S. Treasury Obligations valued at $13,348,877, 2.25%, 11/15/25) | | 13,002 | 13,000 |
| 2/23/17 due 3/3/17 (Collateralized by U.S. Treasury Obligations valued at $14,329,698, 1.38%, 5/31/21) | | 14,002 | 14,000 |
| 3/1/17 due 3/10/17(d) | | 13,002 | 13,000 |
| 3/3/17 due: | | | |
| 3/10/17(d) | | 5,001 | 5,000 |
| 3/17/17(d) | | 8,002 | 8,000 |
| 0.6%, dated: | | | |
| 2/13/17 due 3/7/17 (Collateralized by U.S. Treasury Obligations valued at $3,092,567, 1.63%, 2/15/26) | | 3,005 | 3,000 |
| 2/14/17 due 3/9/17 (Collateralized by U.S. Treasury Obligations valued at $69,718,142, 2.13%, 5/15/25) | | 68,026 | 68,000 |
| 2/23/17 due 3/8/17 (Collateralized by U.S. Treasury Obligations valued at $3,069,114, 1.50%, 8/15/26) | | 3,001 | 3,000 |
| 0.63%, dated 3/1/17 due 5/1/17(d) | | 8,009 | 8,000 |
| Nomura Securities International, Inc. at 0.53%, dated: | | | |
| 2/23/17 due 3/2/17 (Collateralized by U.S. Treasury Obligations valued at $188,848,588, 2.13%, 9/30/21) | | 185,019 | 185,000 |
| 2/28/17 due 3/1/17 (Collateralized by U.S. Treasury Obligations valued at $91,941,973, 1.13%, 7/31/21) | | 90,001 | 90,000 |
| RBC Capital Markets Corp. at 0.54%, dated 1/19/17 due 3/7/17 (Collateralized by U.S. Treasury Obligations valued at $11,227,071, 1.13% - 6.25%, 11/30/18 - 8/15/46) | | 11,009 | 11,000 |
| RBC Dominion Securities at: | | | |
| 0.53%, dated 1/11/17 due 3/7/17 (Collateralized by U.S. Treasury Obligations valued at $56,277,770, 1.13% - 4.38%, 9/30/18 - 2/15/47) | | 55,049 | 55,000 |
| 0.56%, dated 12/22/16 due 3/7/17 (Collateralized by U.S. Treasury Obligations valued at $23,485,202, 1.13% - 1.75%, 2/28/19 - 3/31/23) | | 23,032 | 23,000 |
| 0.57%, dated 2/28/17 due 3/7/17 (Collateralized by U.S. Treasury Obligations valued at $13,260,341, 2.00% - 4.38%, 8/31/21 - 5/15/41) | | 13,012 | 13,000 |
| RBS Securities, Inc. at: | | | |
| 0.53%, dated 2/28/17 due 3/1/17 (Collateralized by U.S. Treasury Obligations valued at $3,090,398, 5.00%, 5/15/37) | | 3,000 | 3,000 |
| 0.55%, dated 2/15/17 due 3/1/17 (Collateralized by U.S. Treasury Obligations valued at $19,386,745, 1.00%, 5/15/18 - 11/30/18) | | 19,004 | 19,000 |
| Societe Generale at: | | | |
| 0.53%, dated: | | | |
| 1/30/17 due 3/2/17 (Collateralized by U.S. Treasury Obligations valued at $11,225,277, 0.00% - 4.50%, 5/18/17 - 8/15/39) | | 11,005 | 11,000 |
| 2/10/17 due 3/7/17 (Collateralized by U.S. Treasury Obligations valued at $20,406,350, 0.00% - 4.75%, 5/18/17 - 11/15/44) | | 20,009 | 20,000 |
| 0.54%, dated 2/17/17 due 3/7/17 (Collateralized by U.S. Treasury Obligations valued at $47,236,684, 0.00% - 4.50%, 4/27/17 - 8/15/42) | | 46,024 | 46,000 |
| 0.55%, dated: | | | |
| 1/19/17 due 3/7/17 (Collateralized by U.S. Treasury Obligations valued at $14,288,988, 0.00% - 1.25%, 4/27/17 - 9/30/21) | | 14,012 | 14,000 |
| 2/2/17 due 3/7/17 (Collateralized by U.S. Treasury Obligations valued at $8,163,406, 0.00% - 8.88%, 4/27/17 - 2/15/39) | | 8,007 | 8,000 |
| 0.6%, dated 2/9/17 due 3/7/17 (Collateralized by U.S. Treasury Obligations valued at $13,357,862, 0.00% - 3.75%, 5/18/17 - 11/15/43) | | 13,021 | 13,000 |
| Wells Fargo Securities, LLC at: | | | |
| 0.57%, dated 12/1/16 due 3/1/17 (Collateralized by U.S. Treasury Obligations valued at $9,193,174, 1.75%, 10/31/20) | | 9,013 | 9,000 |
| 0.59%, dated 12/6/16 due 3/6/17 (Collateralized by U.S. Treasury Obligations valued at $13,282,401, 1.88% - 2.88%, 2/28/22 - 8/15/45) | | 13,019 | 13,000 |
| TOTAL U.S. TREASURY REPURCHASE AGREEMENT | | | |
| (Cost $1,675,213) | | | 1,675,213 |
| TOTAL INVESTMENT PORTFOLIO - 101.0% | | | |
| (Cost $9,871,238) | | | 9,871,238 |
| NET OTHER ASSETS (LIABILITIES) - (1.0)% | | | (98,532) |
| NET ASSETS - 100% | | | $9,772,706 |
Security Type Abbreviations
VRDN – VARIABLE RATE DEMAND NOTE (A debt instrument that is payable upon demand, either daily, weekly or monthly)
The date shown for securities represents the date when principal payments must be paid, taking into account any call options exercised by the issuer and any permissible maturity shortening features other than interest rate resets.
Legend
(a) Yield represents either the annualized yield at the date of purchase, or the stated coupon rate, or, for floating and adjustable rate securities, the rate at period end.
(b) Coupon rates for floating and adjustable rate securities reflect the rates in effect at period end.
(c) Private activity obligations whose interest is subject to the federal alternative minimum tax for individuals.
(d) Represents a forward settling transaction and therefore no collateral securities had been allocated as of period end. The agreement contemplated the delivery of U.S. Treasury Obligations as collateral on settlement date.
Investment Valuation
All investments are categorized as Level 2 under the Fair Value Hierarchy. The inputs or methodology used for valuing securities may not be an indication of the risk associated with investing in those securities. For more information on valuation inputs please refer to the Investment Valuation section in the accompanying Notes to Financial Statements.
Other Information
# Additional information on each counterparty to the repurchase agreement is as follows:
| Repurchase Agreement / Counterparty | Value (000s) |
| $209,410,000 due 3/01/17 at 0.53% | |
| BNP Paribas, S.A. | $9,470 |
| BNY Mellon Capital Markets LLC | 564 |
| Bank of America NA | 46,221 |
| Citibank NA | 11,274 |
| Credit Agricole CIB New York Branch | 31,003 |
| Credit Suisse Securities (USA) LLC | 1,959 |
| HSBC Securities (USA), Inc. | 9,571 |
| ING Financial Markets LLC | 1,127 |
| J.P. Morgan Securities, Inc. | 34,950 |
| Merrill Lynch, Pierce, Fenner & Smith, Inc. | 4,036 |
| Mizuho Securities USA, Inc. | 13,858 |
| Morgan Stanley & Co., Inc. | 28,184 |
| Societe Generale | 5,637 |
| Wells Fargo Securities LLC | 11,556 |
| | $209,410 |
See accompanying notes which are an integral part of the financial statements.
Financial Statements
Statement of Assets and Liabilities
| Amounts in thousands (except per-share amount) | | February 28, 2017 (Unaudited) |
| Assets | | |
Investment in securities, at value (including repurchase agreements of $2,547,623) — See accompanying schedule:
Unaffiliated issuers (cost $9,871,238) | | $9,871,238 |
| Cash | | 14 |
| Receivable for investments sold | | 999 |
| Receivable for fund shares sold | | 48,334 |
| Interest receivable | | 6,980 |
| Other receivables | | 337 |
| Total assets | | 9,927,902 |
| Liabilities | | |
| Payable for investments purchased | $104,000 | |
| Payable for fund shares redeemed | 47,383 | |
| Accrued management fee | 3,474 | |
| Other affiliated payables | 2 | |
| Other payables and accrued expenses | 337 | |
| Total liabilities | | 155,196 |
| Net Assets | | $9,772,706 |
| Net Assets consist of: | | |
| Paid in capital | | $9,772,938 |
| Distributions in excess of net investment income | | (295) |
| Accumulated undistributed net realized gain (loss) on investments | | 63 |
| Net Assets, for 9,771,175 shares outstanding | | $9,772,706 |
| Net Asset Value, offering price and redemption price per share ($9,772,706 ÷ 9,771,175 shares) | | $1.00 |
See accompanying notes which are an integral part of the financial statements.
Statement of Operations
| Amounts in thousands | | Six months ended February 28, 2017 (Unaudited) |
| Investment Income | | |
| Interest | | $28,938 |
| Expenses | | |
| Management fee | $22,108 | |
| Independent trustees' fees and expenses | 27 | |
| Interest | 4 | |
| Total expenses before reductions | 22,139 | |
| Expense reductions | – | 22,139 |
| Net investment income (loss) | | 6,799 |
| Realized and Unrealized Gain (Loss) | | |
| Net realized gain (loss) on: | | |
| Investment securities: | | |
| Unaffiliated issuers | | 63 |
| Total net realized gain (loss) | | 63 |
| Net increase in net assets resulting from operations | | $6,862 |
See accompanying notes which are an integral part of the financial statements.
Statement of Changes in Net Assets
| Amounts in thousands | Six months ended February 28, 2017 (Unaudited) | Year ended August 31, 2016 |
| Increase (Decrease) in Net Assets | | |
| Operations | | |
| Net investment income (loss) | $6,799 | $2,221 |
| Net realized gain (loss) | 63 | 108 |
| Net increase in net assets resulting from operations | 6,862 | 2,329 |
| Distributions to shareholders from net investment income | (6,800) | (2,221) |
| Distributions to shareholders from net realized gain | – | (580) |
| Total distributions | (6,800) | (2,801) |
| Share transactions at net asset value of $1.00 per share | | |
| Proceeds from sales of shares | 6,123,297 | 10,968,452 |
| Reinvestment of distributions | 6,797 | 2,799 |
| Cost of shares redeemed | (7,208,770) | (12,054,496) |
| Net increase (decrease) in net assets and shares resulting from share transactions | (1,078,676) | (1,083,245) |
| Total increase (decrease) in net assets | (1,078,614) | (1,083,717) |
| Net Assets | | |
| Beginning of period | 10,851,320 | 11,935,037 |
| End of period | $9,772,706 | $10,851,320 |
| Other Information | | |
| Distributions in excess of net investment income end of period | $(295) | $(294) |
See accompanying notes which are an integral part of the financial statements.
Financial Highlights — Retirement Government Money Market II Portfolio
| | Six months ended (Unaudited) February 28, | Years ended August 31, | | | | |
| | 2017 | 2016 | 2015 | 2014 | 2013 | 2012 |
| Selected Per–Share Data | | | | | | |
| Net asset value, beginning of period | $1.00 | $1.00 | $1.00 | $1.00 | $1.00 | $1.00 |
| Income from Investment Operations | | | | | | |
| Net investment income (loss) | .001 | –A | –A | –A | –A | –A |
| Net realized and unrealized gain (loss)A | – | – | – | – | – | – |
| Total from investment operations | .001 | –A | –A | –A | –A | –A |
| Distributions from net investment income | (.001) | –A | –A | –A | –A | –A |
| Distributions from net realized gain | – | –A | – | – | – | – |
| Total distributions | (.001) | –A | –A | –A | –A | –A |
| Net asset value, end of period | $1.00 | $1.00 | $1.00 | $1.00 | $1.00 | $1.00 |
| Total ReturnB,C | .07% | .02% | .01% | .01% | .01% | .01% |
| Ratios to Average Net AssetsD | | | | | | |
| Expenses before reductions | .42%E | .42% | .42% | .42% | .42% | .42% |
| Expenses net of fee waivers, if any | .42%E | .35% | .27% | .24% | .31% | .38% |
| Expenses net of all reductions | .42%E | .35% | .27% | .24% | .31% | .38% |
| Net investment income (loss) | .13%E | .02% | .01% | .01% | .01% | .01% |
| Supplemental Data | | | | | | |
| Net assets, end of period (in millions) | $9,773 | $10,851 | $11,935 | $12,712 | $14,006 | $14,660 |
A Amount represents less than $.0005 per share.
B Total returns for periods of less than one year are not annualized.
C Total returns would have been lower if certain expenses had not been reduced during the applicable periods shown.
D Expense ratios reflect operating expenses of the Fund. Expenses before reductions do not reflect amounts reimbursed or waived or reductions from expense offset arrangements and do not represent the amount paid by the Fund during periods when reimbursements, waivers or reductions occur. Expenses net of fee waivers reflect expenses after reimbursement and waivers but prior to reductions from expense offset arrangements. Expenses net of all reductions represent the net expenses paid by the Fund.
E Annualized
See accompanying notes which are an integral part of the financial statements.
Notes to Financial Statements (Unaudited)
For the period ended February 28, 2017
(Amounts in thousands except percentages)
1. Organization.
Retirement Government Money Market II Portfolio (the Fund) is a fund of Fidelity Money Market Trust (the Trust) and is authorized to issue an unlimited number of shares. Share transactions on the Statement of Changes in Net Assets may contain exchanges between affiliated funds. The Trust is registered under the Investment Company Act of 1940, as amended (the 1940 Act), as an open-end management investment company organized as a Delaware statutory trust.
2. Significant Accounting Policies.
The financial statements have been prepared in conformity with accounting principles generally accepted in the United States of America (GAAP), which require management to make certain estimates and assumptions at the date of the financial statements. Actual results could differ from those estimates. Subsequent events, if any, through the date that the financial statements were issued have been evaluated in the preparation of the financial statements. The following summarizes the significant accounting policies of the Fund:
Investment Valuation. The Fund categorizes the inputs to valuation techniques used to value its investments into a disclosure hierarchy consisting of three levels as shown below:
- Level 1 – quoted prices in active markets for identical investments
- Level 2 – other significant observable inputs (including quoted prices for similar investments, interest rates, prepayment speeds, etc.)
- Level 3 – unobservable inputs (including the Fund's own assumptions based on the best information available)
As permitted by compliance with certain conditions under Rule 2a-7 of the 1940 Act, securities are valued at amortized cost, which approximates fair value. The amortized cost of an instrument is determined by valuing it at its original cost and thereafter amortizing any discount or premium from its face value at a constant rate until maturity. Securities held by a money market fund are generally high quality and liquid; however, they are reflected as Level 2 because the inputs used to determine fair value are not quoted prices in an active market.
Investment Transactions and Income. The net asset value per share for processing shareholder transactions is calculated as of the close of business of the New York Stock Exchange (NYSE), normally 4:00 p.m. Eastern time. Security transactions are accounted for as of trade date. Gains and losses on securities sold are determined on the basis of identified cost. Interest income is accrued as earned and includes coupon interest and amortization of premium and accretion of discount on debt securities as applicable.
Expenses. Expenses directly attributable to a fund are charged to that fund. Expenses attributable to more than one fund are allocated among the respective funds on the basis of relative net assets or other appropriate methods. Expense estimates are accrued in the period to which they relate and adjustments are made when actual amounts are known.
Deferred Trustee Compensation. Under a Deferred Compensation Plan (the Plan), independent Trustees may elect to defer receipt of a portion of their annual compensation. Deferred amounts are invested in a cross-section of Fidelity funds, are marked-to-market and remain in the Fund until distributed in accordance with the Plan. The investment of deferred amounts and the offsetting payable to the Trustees are included in the accompanying Statement of Assets and Liabilities.
Income Tax Information and Distributions to Shareholders. Each year, the Fund intends to qualify as a regulated investment company under Subchapter M of the Internal Revenue Code, including distributing substantially all of its taxable income and realized gains. As a result, no provision for U.S. Federal income taxes is required. The Fund files a U.S. federal tax return, in addition to state and local tax returns as required. The Fund's federal income tax returns are subject to examination by the Internal Revenue Service (IRS) for a period of three fiscal years after they are filed. State and local tax returns may be subject to examination for an additional fiscal year depending on the jurisdiction.
Dividends are declared and recorded daily and paid monthly from net investment income. Distributions from realized gains, if any, are declared and recorded on the ex-dividend date. Income and capital gain distributions are determined in accordance with income tax regulations, which may differ from GAAP.
Capital accounts within the financial statements are adjusted for permanent book-tax differences. These adjustments have no impact on net assets or the results of operations. Capital accounts are not adjusted for temporary book-tax differences which will reverse in a subsequent period.
Book-tax differences are primarily due to deferred trustees compensation.
The federal tax cost of investment securities and unrealized appreciation (depreciation) as of period end were as follows:
| Gross unrealized appreciation | $– |
| Gross unrealized depreciation | – |
| Net unrealized appreciation (depreciation) on securities | $– |
| Tax cost | $9,871,238 |
Repurchase Agreements. Pursuant to an Exemptive Order issued by the Securities and Exchange Commission (the SEC), the Fund along with other registered investment companies having management contracts with Fidelity Management & Research Company (FMR), or other affiliated entities of FMR, are permitted to transfer uninvested cash balances into joint trading accounts which are then invested in repurchase agreements. The Fund may also invest directly with institutions in repurchase agreements. Repurchase agreements may be collateralized by government or non-government securities. Upon settlement date, collateral is held in segregated accounts with custodian banks and may be obtained in the event of a default of the counterparty. The Fund monitors, on a daily basis, the value of the collateral to ensure it is at least equal to the principal amount of the repurchase agreement (including accrued interest). In the event of a default by the counterparty, realization of the collateral proceeds could be delayed, during which time the value of the collateral may decline.
Reverse Repurchase Agreements. To enhance its yield, the Fund may enter into reverse repurchase transactions under master repurchase agreements whereby the Fund sells securities to a counterparty in return for cash and agrees to repurchase those securities at a future date and agreed upon price. During the period that reverse repurchase transactions are outstanding, the Fund identifies the securities as pledged in its records with an initial value at least equal to its principal obligation under the agreement. The cash proceeds received by the Fund may be invested in other securities. To the extent cash proceeds received from the counterparty exceed the value of the securities sold, the counterparty may request additional collateral from the Fund. If the counterparty defaults on its obligation, because of insolvency or other reasons, the Fund could experience delays and costs in recovering the securities sold. Information regarding securities sold under a reverse repurchase agreement, if any, is included at the end of the Fund's Schedule of Investments and the cash proceeds are recorded as a liability in the accompanying Statement of Assets and Liabilities. The Fund continues to receive interest and dividend payments on the securities sold during the term of the reverse repurchase agreement. During the period, the average principal balance of reverse repurchase transactions was $43,505 and the weighted average interest rate was .08% with payments included in the Statement of Operations as a component of interest expense. At period end, there were no reverse repurchase agreements outstanding.
3. Fees and Other Transactions with Affiliates.
Management Fee. Fidelity Management & Research Company (the investment adviser) and its affiliates provide the Fund with investment management related services for which the Fund pays a monthly management fee that is based on an annual rate of .42% of the Fund's average net assets. Under the management contract, the investment adviser pays all other expenses, except the compensation of the independent Trustees and certain other expenses such as interest expense. The management fee is reduced by an amount equal to the fees and expenses paid by the Fund to the independent Trustees.
Interfund Trades. The Fund may purchase from or sell securities to other Fidelity Funds under procedures adopted by the Board. The procedures have been designed to ensure these interfund trades are executed in accordance with Rule 17a-7 of the 1940 Act.
4. Expense Reductions.
Through arrangements with the Fund's custodian, credits realized as a result of certain uninvested cash balances were used to reduce the Fund's management fee. During the period, these credits reduced the Fund's management fee by an amount of less than five hundred dollars.
5. Other.
The Fund's organizational documents provide former and current trustees and officers with a limited indemnification against liabilities arising in connection with the performance of their duties to the Fund. In the normal course of business, the Fund may also enter into contracts that provide general indemnifications. The Fund's maximum exposure under these arrangements is unknown as this would be dependent on future claims that may be made against the Fund. The risk of material loss from such claims is considered remote.
Shareholder Expense Example
As a shareholder of the Fund, you incur two types of costs: (1) transaction costs and (2) ongoing costs, including management fees and other Fund expenses. This Example is intended to help you understand your ongoing costs (in dollars) of investing in the Fund and to compare these costs with the ongoing costs of investing in other mutual funds.
The Example is based on an investment of $1,000 invested at the beginning of the period and held for the entire period (September 1, 2016 to February 28, 2017).
Actual Expenses
The first line of the accompanying table provides information about actual account values and actual expenses. You may use the information in this line, together with the amount you invested, to estimate the expenses that you paid over the period. Simply divide your account value by $1,000.00 (for example, an $8,600 account value divided by $1,000.00 = 8.6), then multiply the result by the number in the first line under the heading entitled "Expenses Paid During Period" to estimate the expenses you paid on your account during this period.
Hypothetical Example for Comparison Purposes
The second line of the accompanying table provides information about hypothetical account values and hypothetical expenses based on the Fund's actual expense ratio and an assumed rate of return of 5% per year before expenses, which is not the Fund's actual return. The hypothetical account values and expenses may not be used to estimate the actual ending account balance or expenses you paid for the period. You may use this information to compare the ongoing costs of investing in the Fund and other funds. To do so, compare this 5% hypothetical example with the 5% hypothetical examples that appear in the shareholder reports of the other funds.
Please note that the expenses shown in the table are meant to highlight your ongoing costs only and do not reflect any transaction costs. Therefore, the second line of the table is useful in comparing ongoing costs only, and will not help you determine the relative total costs of owning different funds.
| | Annualized Expense Ratio-A | Beginning
Account Value
September 1, 2016 | Ending
Account Value
February 28, 2017 | Expenses Paid
During Period-B
September 1, 2016
to February 28, 2017 |
| Actual | .42% | $1,000.00 | $1,000.70 | $2.08 |
| Hypothetical-C | | $1,000.00 | $1,022.71 | $2.11 |
A Annualized expense ratio reflects expenses net of applicable fee waivers.
B Expenses are equal to the Fund's annualized expense ratio, multiplied by the average account value over the period, multiplied by 181/365 (to reflect the one-half year period).
C 5% return per year before expenses
Board Approval of Investment Advisory Contracts and Management Fees
Fidelity Retirement Government Money Market II Portfolio (formerly Fidelity Retirement Money Market Portfolio)
Each year, the Board of Trustees, including the Independent Trustees (together, the Board), votes on the renewal of the management contract with Fidelity Management & Research Company (FMR) and the sub-advisory agreements (together, the Advisory Contracts) for the fund. The Board, assisted by the advice of fund counsel and Independent Trustees' counsel, requests and considers a broad range of information relevant to the renewal of the Advisory Contracts throughout the year.
The Board meets regularly and, at each of its meetings, covers an extensive agenda of topics and materials and considers factors that are relevant to its annual consideration of the renewal of the fund's Advisory Contracts, including the services and support provided to the fund and its shareholders. The Board has established four standing committees (Committees) — Operations, Audit, Fair Valuation, and Governance and Nominating — each composed of and chaired by Independent Trustees with varying backgrounds, to which the Board has assigned specific subject matter responsibilities in order to enhance effective decision-making by the Board. The Operations Committee, of which all of the Independent Trustees are members, meets regularly throughout the year and considers, among other matters, information specifically related to the annual consideration of the renewal of the fund's Advisory Contracts. The Board, acting directly and through its Committees, requests and receives information concerning the annual consideration of the renewal of the fund's Advisory Contracts. The Board also meets as needed to consider matters specifically related to the Board's annual consideration of the renewal of the Advisory Contracts. Members of the Board may also meet with trustees of other Fidelity funds through ad hoc joint committees to discuss certain matters relevant to all of the Fidelity funds.
At its September 2016 meeting, the Board unanimously determined to renew the fund's Advisory Contracts. In reaching its determination, the Board considered all factors it believed relevant, including (i) the nature, extent, and quality of the services to be provided to the fund and its shareholders (including the investment performance of the fund); (ii) the competitiveness of the fund's management fee and total expense ratio relative to peer funds; (iii) the total costs of the services to be provided by and the profits to be realized by Fidelity from its relationships with the fund; and (iv) the extent to which, if any, economies of scale exist and would be realized as the fund grows, and whether any economies of scale are appropriately shared with fund shareholders. The Board noted that, effective December 1, 2015, the fund implemented certain changes necessary to operate as a government money market fund, including: (i) adopting a principal investment strategy to normally invest at least 99.5% of its total assets in cash, government securities, and/or repurchase agreements that are collateralized fully; (ii) changing its name to "Fidelity Retirement Government Money Market II Portfolio"; and (iii) modifying its fundamental concentration policy so that the fund would be prohibited from investing more than 25% of its total assets in the financial services industry.
In considering whether to renew the Advisory Contracts for the fund, the Board reached a determination, with the assistance of fund counsel and Independent Trustees' counsel and through the exercise of its business judgment, that the renewal of the Advisory Contracts was in the best interests of the fund and its shareholders and that the compensation payable under the Advisory Contracts was fair and reasonable. The Board's decision to renew the Advisory Contracts was not based on any single factor, but rather was based on a comprehensive consideration of all the information provided to the Board at its meetings throughout the year. The Board, in reaching its determination to renew the Advisory Contracts, was aware that shareholders of the fund have a broad range of investment choices available to them, including a wide choice among funds offered by Fidelity's competitors, and that the fund's shareholders, who have the opportunity to review and weigh the disclosure provided by the fund in its prospectus and other public disclosures, have chosen to invest in this fund, which is part of the Fidelity family of funds.
Nature, Extent, and Quality of Services Provided. The Board considered Fidelity's staffing as it relates to the fund, including the backgrounds of investment personnel of Fidelity, and also considered the fund's investment objective, strategies, and related investment philosophy. The Independent Trustees also had discussions with senior management of Fidelity's investment operations and investment groups. The Board considered the structure of the investment personnel compensation program and whether this structure provides appropriate incentives to act in the best interests of the fund. Additionally, the Board considered the portfolio managers' investments, if any, in the funds that they manage.
Resources Dedicated to Investment Management and Support Services. The Board reviewed the general qualifications and capabilities of Fidelity's investment staff, including its size, education, experience, and resources, as well as Fidelity's approach to recruiting, managing, and compensating investment personnel. The Board noted that Fidelity has continued to increase the resources devoted to non-U.S. offices, including expansion of Fidelity's global investment organization. The Board also noted that Fidelity's analysts have extensive resources, tools and capabilities that allow them to conduct sophisticated quantitative and fundamental analysis, as well as credit analysis of issuers, counterparties and guarantors. Further, the Board considered that Fidelity's investment professionals have sufficient access to global information and data so as to provide competitive investment results over time, and that those professionals also have access to sophisticated tools that permit them to assess portfolio construction and risk and performance attribution characteristics continuously, as well as to transmit new information and research conclusions rapidly around the world. Additionally, in its deliberations, the Board considered Fidelity's trading, risk management, compliance, and technology and operations capabilities and resources, which are integral parts of the investment management process.
Shareholder and Administrative Services. The Board considered (i) the nature, extent, quality, and cost of advisory, administrative, and shareholder services performed by FMR, the sub-advisers (together with FMR, the Investment Advisers), and their affiliates under the Advisory Contracts and under separate agreements covering transfer agency and pricing and bookkeeping services for the fund; (ii) the nature and extent of the supervision of third party service providers, principally custodians, subcustodians, and pricing vendors; and (iii) the resources devoted to, and the record of compliance with, the fund's compliance policies and procedures.
The Board noted that the growth of fund assets over time across the complex allows Fidelity to reinvest in the development of services designed to enhance the value or convenience of the Fidelity funds as investment vehicles. These services include 24-hour access to account information and market information through telephone representatives and over the Internet, investor education materials and asset allocation tools, and the expanded availability of Fidelity Investor Centers.
Investment in a Large Fund Family. The Board considered the benefits to shareholders of investing in a Fidelity fund, including the benefits of investing in a fund that is part of a large family of funds offering a variety of investment disciplines and providing a large variety of mutual fund investor services. The Board noted that Fidelity had taken, or had made recommendations that resulted in the Fidelity funds taking, a number of actions over the previous year that benefited particular funds, including: (i) continuing to dedicate additional resources to investment research and to the support of the senior management team that oversees asset management; (ii) continuing efforts to enhance Fidelity's global research capabilities; (iii) launching new funds and making other enhancements to meet client needs; (iv) broadening eligibility requirements for certain lower-priced share classes of, and streamlining the fee structure for, certain existing equity index funds; (v) lowering expense caps for certain existing funds and classes to reduce expenses paid by shareholders; (vi) eliminating redemption fees for certain variable insurance product funds and classes; (vii) continuing to launch dedicated lower cost underlying funds to meet portfolio construction needs related to expanding underlying fund options for Fidelity funds of funds, specifically for the Freedom Fund product lines; (viii) launching a lower cost share class for use by the Freedom Index Fund product line; (ix) rationalizing product lines and gaining increased efficiencies through fund mergers and share class consolidations; (x) continuing to develop, acquire and implement systems and technology to improve services to the funds and shareholders, strengthen information security, and increase efficiency; (xi) implementing investment enhancements to further strengthen Fidelity's target date product line to increase investors' probability of success in achieving their goals; (xii) accelerating the conversion of all remaining Class B shares to Class A shares, which have a lower expense structure; and (xiii) implementing changes to Fidelity's money market fund product line in response to recent regulatory reforms.
Investment Performance. The Board considered whether the fund has operated in accordance with its investment objective, as well as its record of compliance with its investment restrictions and its performance history.
The Board took into account discussions with representatives of the Investment Advisers about fund investment performance that occur at Board meetings throughout the year. In this regard the Board noted that as part of regularly scheduled fund reviews and other reports to the Board on fund performance, the Board considers annualized return information for the fund for different time periods, measured against a peer group of funds with similar objectives ("peer group").
In addition to reviewing absolute and relative fund performance, the Independent Trustees periodically consider the appropriateness of fund performance metrics in evaluating the results achieved. In general, the Independent Trustees believe that fund performance should be evaluated based on gross performance (before fees and expenses but after transaction costs) compared to the gross performance of appropriate peer groups, over appropriate time periods that may include full market cycles, taking into account relevant factors including the following: general market conditions; expectations for interest rate levels and credit conditions; issuer-specific information including credit quality; the fund's market value NAV over time and its resilience under various stressed conditions; and fund cash flows and other factors.
The Board recognizes that in interest rate environments where many competitors waive fees to maintain a minimum yield, relative money market fund performance on a net basis (after fees and expenses) may not be particularly meaningful due to miniscule performance differences among competitor funds. Depending on the circumstances, the Independent Trustees may be satisfied with a fund's performance notwithstanding that it lags its peer group for certain periods.
The Independent Trustees recognize that shareholders evaluate performance on a net basis over their own holding periods, for which one-, three-, and five-year periods are often used as a proxy. For this reason, the performance information reviewed by the Board also included net cumulative calendar year total return information for the fund and an appropriate peer group for the most recent one-, three-, and five-year periods.
Based on its review, the Board concluded that the nature, extent, and quality of services provided to the fund under the Advisory Contracts should continue to benefit the shareholders of the fund.
Competitiveness of Management Fee and Total Expense Ratio. The Board considered the fund's management fee and total expense ratio compared to "mapped groups" of competitive funds and classes created for the purpose of facilitating the Trustees' competitive analysis of management fees and total expenses. Fidelity creates "mapped groups" by combining similar Lipper investment objective categories that have comparable investment mandates. Combining Lipper investment objective categories aids the Board's management fee and total expense ratio comparisons by broadening the competitive group used for comparison.
Management Fee. The Board considered two proprietary management fee comparisons for the 12-month periods shown in basis points (BP) in the chart below. The group of Lipper funds used by the Board for management fee comparisons is referred to below as the "Total Mapped Group" and, for the reasons explained above, is broader than the Lipper peer group used by the Board for performance comparisons. The Total Mapped Group comparison focuses on a fund's standing in terms of gross management fees before expense reimbursements or caps relative to the total universe of funds with comparable investment mandates, regardless of whether their management fee structures also are comparable. Funds with comparable investment mandates offer exposure to similar types of securities. Funds with comparable management fee structures have similar management fee contractual arrangements (
e.g., flat rate charged for advisory services, all-inclusive fee rate,
etc.). "TMG %" represents the percentage of funds in the Total Mapped Group that had management fees that were lower than the fund's. For example, a hypothetical TMG % of 20% would mean that 80% of the funds in the Total Mapped Group had higher, and 20% had lower, management fees than the fund. The fund's actual TMG %s and the number of funds in the Total Mapped Group are in the chart below. The "Asset-Size Peer Group" (ASPG) comparison focuses on a fund's standing relative to a subset of non-Fidelity funds within the Total Mapped Group that are similar in size and management fee structure. For example, if a fund is in the first quartile of the ASPG, the fund's management fee ranks in the least expensive or lowest 25% of funds in the ASPG. The ASPG represents at least 15% of the funds in the Total Mapped Group with comparable asset size and management fee structures, subject to a minimum of 50 funds (or all funds in the Total Mapped Group if fewer than 50). Additional information, such as the ASPG quartile in which the fund's management fee rate ranked, is also included in the chart and considered by the Board. Because the vast majority of competitor funds' management fees do not cover non-management expenses, for a more meaningful comparison of management fees, the fund is compared on the basis of a hypothetical "net management fee," which is derived by subtracting payments made by FMR for non-management expenses (including transfer agent fees, pricing and bookkeeping fees, and fees paid to non-affiliated custodians) from the fund's all-inclusive fee. In this regard, the Board considered that net management fees can vary from year to year because of differences in non-management expenses.
Fidelity Retirement Government Money Market II Portfolio
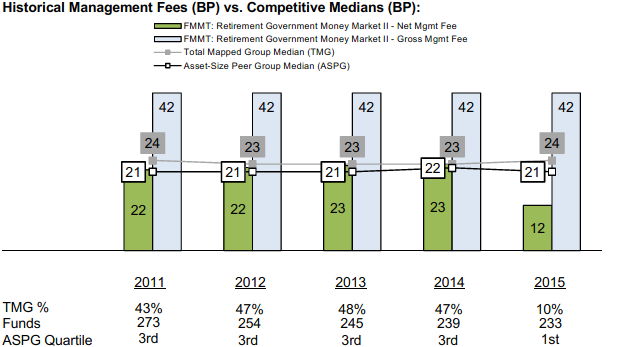
The Board noted that the fund's hypothetical net management fee rate ranked below the median of its Total Mapped Group and below the median of its ASPG for 2015.
The Board noted that, in 2014, the ad hoc Committee on Group Fee was formed by it and the boards of other Fidelity funds to conduct an in-depth review of the "group fee" component of the management fee of funds with such management fee structures. The Committee's focus included the mechanics of the group fee, the competitive landscape of group fee structures, Fidelity funds with no group fee component (such as the fund) and investment products not included in group fee assets. The Board also considered that, for funds subject to the group fee, FMR agreed to voluntarily waive fees over a specified period of time in amounts designed to account for assets converted from certain funds to certain collective investment trusts.
Based on its review, the Board concluded that the fund's management fee is fair and reasonable in light of the services that the fund receives and the other factors considered.
Total Expense Ratio. In its review of the fund's total expense ratio, the Board considered the fund's hypothetical net management fee rate as well as the fund's all-inclusive fee rate. The Board also considered other expenses, such as transfer agent fees, pricing and bookkeeping fees, and custodial, legal, and audit fees, paid by FMR under the all-inclusive arrangement. The Board also noted that Fidelity may agree to waive fees and expenses from time to time, and the extent to which, if any, it has done so for the fund. As part of its review, the Board also considered the current and historical total expense ratios of the fund compared to competitive fund median expenses. The fund is compared to those funds and classes in the Total Mapped Group (used by the Board for management fee comparisons) that have a similar sales load structure.
The Board noted that the fund's total expense ratio ranked above the competitive median for 2015. The Board considered that, in general, various factors can affect total expense ratios. The Board considered that Fidelity has been voluntarily waiving part or all of the management fees to maintain a minimum yield. The fund's total expense ratio ranked above the median for 2015 because the advisers of many competitor funds waived fees or reimbursed expenses to a greater extent than Fidelity in order to maintain a minimum yield, which caused the expense medians of such competitor funds to be lower than they would otherwise be. Excluding fee waivers, the total expense ratio of the fund ranked above the median when compared to the institutional money market fund universe; however, the Board also considered that the fund is sold to plan participants, has no investment minimum, and provides services similar to retail funds, and that FMR believes the fund is more comparable to a fund in the retail money market fund universe. When compared to the retail money market fund universe, the fund ranks below the median.
Fees Charged to Other Fidelity Clients. The Board also considered Fidelity fee structures and other information with respect to clients of Fidelity, such as other funds advised or subadvised by Fidelity, pension plan clients, and other institutional clients with similar mandates. The Board noted that an ad hoc joint committee created by it and the boards of other Fidelity funds periodically (most recently in 2013) reviews and compares Fidelity's institutional investment advisory business with its business of providing services to the Fidelity funds, including the differences in services provided, fees charged, and costs incurred, as well as competition in their respective marketplaces.
Based on its review of total expense ratios and fees charged to other Fidelity clients, the Board concluded that, although above the median of the universe presented for comparison, the fund's total expense ratio was reasonable in light of the services that the fund and its shareholders receive and the other factors considered.
Costs of the Services and Profitability. The Board considered the revenues earned and the expenses incurred by Fidelity in conducting the business of developing, marketing, distributing, managing, administering and servicing the fund and servicing the fund's shareholders. The Board also considered the level of Fidelity's profits in respect of all the Fidelity funds.
On an annual basis, Fidelity presents to the Board information about the profitability of its relationships with the fund. Fidelity calculates profitability information for each fund, as well as aggregate profitability information for groups of Fidelity funds and all Fidelity funds, using a series of detailed revenue and cost allocation methodologies which originate with the books and records of Fidelity on which Fidelity's audited financial statements are based. The Audit Committee of the Board reviews any significant changes from the prior year's methodologies.
PricewaterhouseCoopers LLP (PwC), independent registered public accounting firm and auditor to Fidelity and certain Fidelity funds, has been engaged annually by the Board as part of the Board's assessment of Fidelity's profitability analysis. PwC's engagement includes the review and assessment of the methodologies used by Fidelity in determining the revenues and expenses attributable to Fidelity's mutual fund business, and completion of agreed-upon procedures in respect of the mathematical accuracy of the fund profitability information and its conformity to established allocation methodologies. After considering PwC's reports issued under the engagement and information provided by Fidelity, the Board concluded that while other allocation methods may also be reasonable, Fidelity's profitability methodologies are reasonable in all material respects.
The Board also reviewed Fidelity's non-fund businesses and fall-out benefits related to the mutual fund business as well as cases where Fidelity's affiliates may benefit from or be related to the fund's business.
The Board considered the costs of the services provided by and the profits realized by Fidelity in connection with the operation of the fund and was satisfied that the profitability was not excessive.
Economies of Scale. The Board considered whether there have been economies of scale in respect of the management of the Fidelity funds, whether the Fidelity funds (including the fund) have appropriately benefited from any such economies of scale, and whether there is potential for realization of any further economies of scale. The Board considered the extent to which the fund will benefit from economies of scale as assets grow through increased services to the fund, through waivers or reimbursements, or through fee or expense ratio reductions. The Board recognized that due to the fund's current contractual arrangements its expense ratio will not decline if the fund's operating costs decrease as assets grow, or rise as assets decrease. The Board also noted that a committee (the Economies of Scale Committee) created by it and the boards of other Fidelity funds periodically (most recently in 2013) analyzes whether Fidelity attains economies of scale in respect of the management and servicing of the Fidelity funds, whether the Fidelity funds have appropriately benefited from such economies of scale, and whether there is potential for realization of any further economies of scale.
The Board concluded, taking into account the analysis of the Economies of Scale Committee, that economies of scale, if any, are being appropriately shared between fund shareholders and Fidelity.
Additional Information Requested by the Board. In order to develop fully the factual basis for consideration of the Fidelity funds' advisory contracts, the Board requested and received additional information on certain topics, including: (i) Fidelity's fund profitability methodology, profitability trends for certain funds, and the impact of certain factors on fund profitability results; (ii) portfolio manager changes that have occurred during the past year and the amount of the investment that each portfolio manager has made in the Fidelity fund(s) that he or she manages; (iii) Fidelity's compensation structure for portfolio managers, research analysts, and other key personnel, including its effects on fund profitability, the rationale for the compensation structure, and the extent to which current market conditions have affected retention and recruitment; (iv) the arrangements with and compensation paid to certain fund sub-advisers on behalf of the Fidelity funds; (v) Fidelity's voluntary waiver of its fees to maintain minimum yields for certain money market funds and classes as well as contractual waivers in place for certain funds; (vi) the methodology with respect to competitive fund data and peer group classifications; (vii) Fidelity's transfer agent fee, expense, and service structures for different funds and classes relative to competitive trends, and the impact of the increased use of omnibus accounts; (viii) Fidelity's long-term expectations for its offerings in the workplace investing channel; (ix) new developments in the retail and institutional marketplaces; (x) the approach to considering "fall-out" benefits; and (xi) the impact of money market reform on Fidelity's money market funds, including with respect to costs and profitability. In addition, the Board considered its discussions with Fidelity throughout the year regarding enhanced information security initiatives and the funds' fair valuation policies.
Based on its evaluation of all of the conclusions noted above, and after considering all factors it believed relevant, the Board concluded that the advisory fee structures are fair and reasonable, and that the fund's Advisory Contracts should be renewed.
Corporate Headquarters
245 Summer St.
Boston, MA 02210
www.fidelity.com
RMM-SANN-0417
1.700934.119
Item 2.
Code of Ethics
Not applicable.
Item 3.
Audit Committee Financial Expert
Not applicable.
Item 4.
Principal Accountant Fees and Services
Not applicable.
Item 5.
Audit Committee of Listed Registrants
Not applicable.
Item 6.
Investments
(a)
Not applicable.
(b)
Not applicable
Item 7.
Disclosure of Proxy Voting Policies and Procedures for Closed-End Management Investment Companies
Not applicable.
Item 8.
Portfolio Managers of Closed-End Management Investment Companies
Not applicable.
Item 9.
Purchase of Equity Securities by Closed-End Management Investment Company and Affiliated Purchasers
Not applicable.
Item 10.
Submission of Matters to a Vote of Security Holders
There were no material changes to the procedures by which shareholders may recommend nominees to the Fidelity Money Market Trust’s Board of Trustees.
Item 11.
Controls and Procedures
(a)(i) The President and Treasurer and the Chief Financial Officer have concluded that the Fidelity Money Market Trust’s (the “Trust”) disclosure controls and procedures (as defined in Rule 30a-3(c) under the Investment Company Act) provide reasonable
assurances that material information relating to the Trust is made known to them by the appropriate persons, based on their evaluation of these controls and procedures as of a date within 90 days of the filing date of this report.
(a)(ii) There was no change in the Trust’s internal control over financial reporting (as defined in Rule 30a-3(d) under the Investment Company Act) that occurred during the second fiscal quarter of the period covered by this report that has materially affected, or is reasonably likely to materially affect, the Trust’s internal control over financial reporting.
Item 12.
Exhibits
| | |
(a) | (1) | Not applicable. |
(a) | (2) | Certification pursuant to Rule 30a-2(a) under the Investment Company Act of 1940 (17 CFR 270.30a-2(a)) is filed and attached hereto as Exhibit 99.CERT. |
(a) | (3) | Not applicable. |
(b) |
| Certification pursuant to Rule 30a-2(b) under the Investment Company Act of 1940 (17 CFR 270.30a-2(b)) is furnished and attached hereto as Exhibit 99.906CERT. |
SIGNATURES
Pursuant to the requirements of the Securities Exchange Act of 1934 and the Investment Company Act of 1940, the registrant has duly caused this report to be signed on its behalf by the undersigned, thereunto duly authorized.
Fidelity Money Market Trust
| |
By: | /s/Stephanie J. Dorsey |
| Stephanie J. Dorsey |
| President and Treasurer |
|
|
Date: | May 1, 2017 |
Pursuant to the requirements of the Securities Exchange Act of 1934 and the Investment Company Act of 1940, this report has been signed below by the following persons on behalf of the registrant and in the capacities and on the dates indicated.
| |
By: | /s/Stephanie J. Dorsey |
| Stephanie J. Dorsey |
| President and Treasurer |
|
|
Date: | May 1, 2017 |
| |
By: | /s/Howard J. Galligan III |
| Howard J. Galligan III |
| Chief Financial Officer |
|
|
Date: | May 1, 2017 |