UNITED STATES
SECURITIES AND EXCHANGE COMMISSION
Washington, D.C. 20549
Form 10-K
x ANNUAL REPORT PURSUANT TO SECTION 13 OR 15(d) OF THE SECURITIES EXCHANGE ACT OF 1934
For the fiscal year ended August 31, 2013
o TRANSITION REPORT PURSUANT TO SECTION 13 OR 15(d) OF THE SECURITIES EXCHANGE ACT OF 1934
Commission File Number 0-8814
| PURE CYCLE CORPORATION |
| (Exact name of registrant as specified in its charter) |
| | |
| Colorado | 84-0705083 |
(State or other jurisdiction of incorporation or organization) | (I.R.S. Employer Identification No.) |
| | |
| 1490 Lafayette St, Suite 203, Denver, CO 80218 | (303) 292-3456 |
| (Address of principal executive offices) (Zip Code) | |
| |
| Securities registered pursuant to Section 12(b) of the Act: |
| |
| Common Stock 1/3 of $.01 par value | The NASDAQ Stock Market, LLC |
| (Title of each class) | (Name of each exchange on which registered) |
| | |
Securities registered pursuant to Section 12(g) of the Act: NONE |
Indicate by check mark if the registrant is a well-known seasoned issuer, as defined in Rule 405 of the Securities Act. Yes o No x |
| |
Indicate by check mark if the registrant is not required to file reports pursuant to Section 13 or Section 15(d) of the Act. Yes o No x |
| |
Indicate by check mark whether the registrant (1) has filed all reports required to be filed by Section 13 or 15(d) of the Securities Exchange Act of 1934 during the preceding 12 months (or for such shorter period that the registrant was required to file such reports), and (2) has been subject to such filing requirements for the past 90 days. Yes x No o |
| |
Indicate by check mark whether the registrant has submitted electronically and posted on its corporate website, if any, every Interactive Data File required to be submitted and posted pursuant to Rule 405 of Regulation S-T (Section 232.405 of this chapter) during the preceding 12 months (or for such shorter period that the registrant was required to submit and post such files). Yes x No o |
Indicate by check mark if disclosure of delinquent filers pursuant to Item 405 of Regulation S-K (Section 229.405 of this chapter) is not contained herein, and will not be contained, to the best of registrant’s knowledge, in definitive proxy or information statements incorporated by reference in Part III of this Form 10-K or any amendment to this Form 10-K x |
| Indicate by check mark whether the registrant is a large accelerated filer, an accelerated filer, a non-accelerated filer, or a smaller reporting company. See the definitions of “large accelerated filer,” “accelerated filer,” and “smaller reporting company” in Rule 12b-2 of the Exchange Act: |
| Large accelerated filer | o | | Accelerated filer | o |
| Non-accelerated filer | o | (Do not check if a smaller reporting company) | Smaller reporting company | x |
Indicate by check mark whether the registrant is a shell company (as defined in Rule 12b-2 of the Act). Yes o No x
State the aggregate market value of the voting and non-voting common equity held by non-affiliates computed by reference to the price at which the common equity was last sold, or the average bid and asked price of such common equity, as of the last business day of the registrant’s most recently completed second fiscal quarter: $69,447,594
Indicate the number of shares outstanding of each of the registrant’s classes of common stock, as of the latest practicable date: November 20, 2013: 24,037,598
DOCUMENTS INCORPORATED BY REFERENCE
The information required by Part III is incorporated by reference from the registrant’s definitive proxy statement for the 2014 Annual Meeting of Shareholders, which will be filed with the SEC within 120 days of the close of the fiscal year ended August 31, 2013.
Table of Contents
“SAFE HARBOR” STATEMENT UNDER THE UNITED STATES PRIVATE
SECURITIES LITIGATION REFORM ACT OF 1995
Statements that are not historical facts contained in this Annual Report on Form 10-K, or incorporated by reference into this Form 10-K, are forward-looking statements that involve risk and uncertainties that could cause actual results to differ materially from projected results. The words “anticipate,” “believe,” “estimate,” “expect,” “plan,” “intend” and similar expressions, as they relate to us, are intended to identify forward-looking statements. Such statements reflect our current views with respect to future events and are subject to certain risks, uncertainties and assumptions. We cannot assure you that any of our expectations will be realized. Our actual results could differ materially from those discussed in or implied by these forward-looking statements. Forward-looking statements include statements relating to, among other things:
| | ● | factors that may impact labor and material costs; |
| | ● | loss of key employees and hiring additional personnel for our operations; |
| | ● | our competitive advantage; |
| | ● | negotiation of payment terms for fees; |
| | ● | the sufficiency of our working capital and financing sources to fund our operations; |
| | ● | intent not to hold marketable securities until maturity; |
| | ● | our ability to comply with permit requirements and environmental regulations and the cost of such compliance; |
| | ● | the adequacy of the provisions in the “Lease” for the Lowry Range to cover present and future circumstances; |
| | ● | estimated population increases in the Denver metropolitan area and the South Platte River basin; |
| | ● | plans for the use and development of our water assets; |
| | ● | anticipated timing and amount of, and sources of funding for (i) capital expenditures to construct infrastructure and increase production capacities, (ii) compliance with water, environmental and other regulations, and (iii) operations including delivery and treatment of water and wastewater; |
| | ● | the ability of our deep water well enhancement tool and process to increase efficiency of wells and our plans to market that product to area water providers; |
| | ● | our ability to assist Colorado “Front Range” water providers in meeting current and future water needs; |
| | ● | our ability to reduce the amount of up-front construction costs; |
| | ● | participation in regional water projects, including “WISE”; |
| | ● | timing of satisfaction of conditions to change Land Board royalties; |
| | ● | regional cooperation among area water providers in the development of new water supplies and water storage, transmission and distribution systems as the most cost-effective way to expand and enhance service capacities; |
| | ● | future water supply needs in Colorado; |
| | ● | anticipated increases in residential and commercial demand for water services and competition for these services; |
| | ● | use of raw and reclaimed water for outdoor irrigation; |
| | ● | costs to treat contaminated water; |
| | ● | the decreases of individual housing and economic cycles on the number of connections we can serve with our water; |
| | ● | the number of new water connections needed to recover the costs of our Rangeview Water Supply and Arkansas River water assets; |
| | ● | increases in future water tap fees; |
| | ● | the impact of water quality, solid waste disposal and environmental regulations on our financial condition and results of operations; |
| | ● | the impact of the downturn in the homebuilding and credit markets on our business and financial condition; |
| | ● | environmental clean-up at the Lowry Range by the U.S. Army Corps of Engineers; |
| | ● | our plans to provide water for drilling and hydraulic fracturing of oil and gas wells; |
| | ● | increases in oil and gas drilling activity on our property and on the Lowry Range; |
| | ● | the recoverability of construction and acquisition costs from rates; |
| | ● | our belief that we are not a public utility under Colorado law; |
| | ● | plans for development of our Sky Ranch property; |
| | ● | anticipated revenues from full development of our Sky Ranch property; |
| | | management of farms and the generation of revenues from such management including plans to increase crop yields; |
| | | our ability to meet customer demands in a sustainable and environmentally friendly way; |
| | | potential opposition to, and anticipated requirements of, the water court in connection with a change of use application for our Arkansas River water; |
| | | our ability to mitigate adverse impacts to local communities from our change of use process; |
| | | claims of “HP A&M” against the Company; |
| | | the amount of the “Tap Participation Fee” liability; |
| | | our ability to reduce the Tap Participation Fee and recover damages from HP A&M; |
| | | changes in unrecognized tax positions; |
| | | forfeitures of option grants and vesting of non-vested options; |
| | | the impact of new accounting pronouncements; |
| | | impairments in carrying amounts of long-lived assets; |
| | | the effectiveness of our disclosure controls and procedures and our internal controls over financial reporting; |
| | | loss of properties and water rights due to the failure to cure defaults by HP A&M; |
| | | litigation and arbitration with the Land Board; |
| | | litigation with HP A&M; and |
| | | future fluctuations in the price and trading volume of our common stock. |
Factors that may cause actual results to differ materially from those contemplated by such forward-looking statements include, without limitation:
| | | the timing of new home construction and other development in the areas where we may sell our water, which in turn may be impacted by credit availability; |
| | | general economic conditions; |
| | | the market price of water; |
| | | changes in customer consumption patterns; |
| | | changes in applicable statutory and regulatory requirements; |
| | | changes in governmental policies and procedures; |
| | | uncertainties in the estimation of water available under decrees; |
| | | uncertainties in the estimation of costs of delivery of water and treatment of wastewater; |
| | | uncertainties in the estimation of the service life of our systems; |
| | | uncertainties in the estimation of costs of construction projects; |
| | | the strength and financial resources of our competitors; |
| | | our ability to find and retain skilled personnel; |
| | | climatic and weather conditions, including floods, droughts and freezing conditions; |
| | | turnover of elected and appointed officials and delays caused by political concerns and government procedures; |
| | | availability and cost of labor, material and equipment; |
| | | delays in anticipated permit and construction dates; |
| | | engineering and geological problems; |
| | | environmental risks and regulations; |
| | | our ability to raise capital; |
| | | our ability to negotiate contracts with new customers; |
| | | outcome of litigation and arbitration proceedings; and |
| | | uncertainties in water court rulings. |
These forward-looking statements are subject to numerous risks, uncertainties and assumptions about us, including the factors described under “Risk Factors” in this Annual Report on Form 10-K. “Risk Factors” contains additional information concerning factors that could cause actual results to differ materially from those in the forward-looking statements. Except for our ongoing obligation to disclose certain information under the federal securities laws, we undertake no obligation, and disclaim any obligation, to publicly update or revise any forward-looking statements, whether as a result of new information, future events or otherwise. All forward-looking statements are expressly qualified by this cautionary statement.
Pure Cycle Corporation (“Pure Cycle”) is an investor-owned Colorado corporation that provides wholesale water and wastewater services and leases farm land. The wholesale water and wastewater services include water production, storage, treatment, bulk transmission to retail distribution systems, wastewater collection and treatment, irrigation water treatment and transmission, construction management, billing and collection and emergency response. We provide these services to our wholesale customers, which are typically local governmental entities that provide water and wastewater services to their end-use customers located in the greater Denver, Colorado metropolitan area.
We are vertically integrated, which means we own all assets necessary to provide wholesale water and wastewater services to our customers. This includes owning (i) water rights which we use to provide domestic and irrigation water to our wholesale customers (we own surface water, groundwater, reclaimed water rights and storage rights), (ii) infrastructure (such as wells, diversion structures, pipelines, reservoirs and treatment facilities) required to withdraw, treat, store and deliver water, (iii) infrastructure required to collect, treat, store and reuse wastewater, and (iv) infrastructure required to treat and deliver reclaimed water for irrigation use.
We currently provide wholesale water service predominately to two local governmental entity customers. Our largest customer is the Rangeview Metropolitan District (the “District”), a quasi-municipal political subdivision of the State of Colorado which is described further below. We provide service to the District and its end-use customers pursuant to “The Rangeview Water Agreements” (defined below) between us and the District for the provision of wholesale water service to the District for use in the District’s service area. Through the District, we provide wholesale service to 258 Single Family Equivalent (“SFE”) (as defined below) water connections and 157 SFE wastewater connections located in southeastern metropolitan Denver. We also provide water to the oil and gas industry for the purpose of hydraulic fracturing.
We plan to utilize our significant water assets along with our adjudicated reservoir sites, which are described in the Our Water Assets section below, to provide wholesale water and wastewater services to local governmental entities. These local governmental entities will in turn provide residential and commercial water and wastewater services to communities along the eastern slope of Colorado in the area extending essentially from Fort Collins on the north to Colorado Springs on the south which is generally referred to as the “Front Range.” Principally we are targeting the “I-70 corridor” which is located east of downtown Denver and south of the Denver International Airport. This area is predominately undeveloped and is expected to experience substantial growth over the next 30 years.
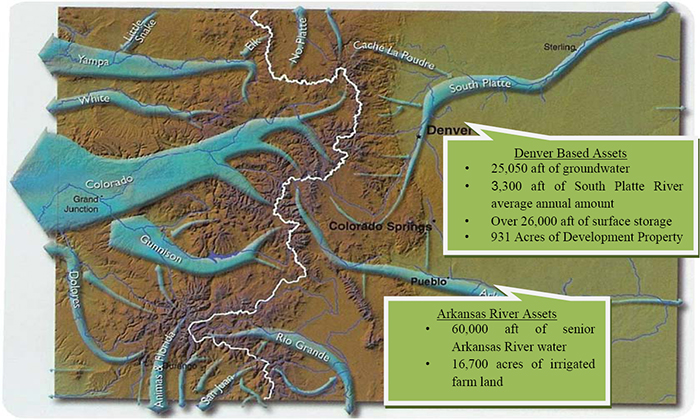
Our farm land consists of approximately 16,700 acres of irrigated land currently being leased to local farmers in southeastern Colorado and we own 931 acres of land in the I-70 corridor east of Denver, Colorado that is being held for development. These land interests are described in the Our Water and Land Assets section below.
Pure Cycle Corporation was incorporated in Delaware in 1976 and reincorporated in Colorado in 2008.
Glossary of terms
The following terms are commonly used in the water industry and are used throughout our annual report:
| | ● | Acre Foot (“aft”) – approximately 326,000 gallons of water, or enough water to cover an acre of ground with one foot of water. For some instances herein, as context dictates, the term acre feet is used to designate an annual decreed amount of water available during a typical year. |
| | | Consumptive Use – the amount of water that is evaporated, transpired, incorporated into products or crops, consumed by humans or livestock, or otherwise removed from the immediate water environment. |
| | | Customer Facilities – facilities that carry potable water and reclaimed water to customers from the retail water distribution system (see “Retail Facilities” below) and collect wastewater from customers and transfer it to the retail wastewater collection system. Water and wastewater service lines, interior plumbing, meters and other components are typical examples of Customer Facilities. In many cases, portions of the Customer Facilities are constructed by the developer, but they are owned and maintained by the customer. |
| | | Non-Tributary Groundwater – underground water in an aquifer which is situated so it neither draws from nor contributes to a natural surface stream in any measurable degree. |
| | | Not Non-Tributary Groundwater – statutorily defined as a groundwater located within those portions of the Dawson, Denver, Arapahoe, and Laramie-Fox hills aquifers that are outside of any designated groundwater basin in existence on January 1, 1985. |
| | | Retail Facilities – facilities that distribute water to and collect wastewater from an individual subdivision or community. Developers are typically responsible for the funding and construction of Retail Facilities. Once we certify that the Retail Facilities have been constructed in accordance with our design criteria, the developer dedicates the Retail Facilities to us or to a quasi-municipal political subdivision of the state and we operate and maintain the facilities. |
| | | Section – a parcel of land equal to one square mile and containing 640 acres. |
| | | Single Family Equivalent unit (“SFE”) – One SFE is a customer – whether residential, commercial or industrial – that imparts a demand on our water or wastewater systems similar to the demand of a family of four persons living in a single family house on a standard sized lot. One SFE is assumed to have a water demand of approximately 0.4 acre feet per year and to contribute wastewater flows of approximately 300 gallons per day. |
| | | Special Facilities – facilities that are required to extend services to an individual development and are not otherwise classified as a typical “Wholesale Facility” or “Retail Facility.” Temporary infrastructure required prior to construction of permanent water and wastewater systems or transmission pipelines to transfer water from one location to another are examples of Special Facilities. We typically design and construct the Special Facilities using funds provided by the developer in addition to the normal rates, fees and charges that we collect from our customers. We are typically responsible for the operation and maintenance of the Special Facilities upon completion. |
| | | Tributary Groundwater – all water located in an aquifer that is hydrologically connected to a natural stream and is not considered non-tributary or not non-tributary. |
| | | Tributary Surface Water – water on the surface of the ground flowing in a stream or river system. |
| | | Wholesale Facilities – facilities that serve an entire service area or major regions or portions thereof. Wells, treatment plants, pump stations, tanks, reservoirs, transmission pipelines, and major sewage lift stations are typical examples of Wholesale Facilities. We own, design, construct, operate, maintain and repair Wholesale Facilities which are typically funded using rates, fees and charges that we collect from our customers. |
Our Water and Land Assets
This section should be read in conjunction with Item 1A – Risk Factors, Item 7 – Management’s Discussion and Analysis of Financial Condition and Results of Operations – Critical Accounting Policies and Use of Estimates, and Note 4 – Water Assets to the accompanying financial statements.
The $88.5 million of capitalized water costs on our balance sheet represents the costs of the water rights we own and the related infrastructure developed to provide wholesale water and wastewater services. Each of these assets is explained in detail below.
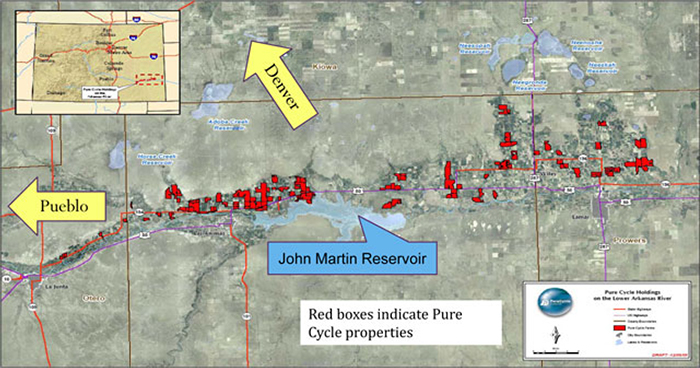
The illustration below indicates the approximate location of each of our assets.
The map below indicates the location of our Denver area assets.
Rangeview Water Supply and the Lowry Range
Our Rangeview Water – We own or control a total of approximately 3,300 acre feet of tributary surface water, 25,050 acre feet of non-tributary and not non-tributary groundwater rights, and approximately 26,000 acre feet of adjudicated reservoir sites that we refer to as our “Rangeview Water Supply.” This water is located at the “Lowry Range,” which is owned by the State Board of Land Commissioners (the “Land Board”) and is described below.
Of the 25,050 acre feet of Lowry Range groundwater, we own approximately 11,650 acre feet of non-tributary and not non-tributary groundwater which we can “export” from the Lowry Range to supply water to nearby communities (this portion of the Rangeview Water Supply is referred to as our “Export Water”). We also have the right to convert up to 1,650 acre feet of the Export groundwater to a similar amount of surface water for use off the Lowry Range. We hold the exclusive right to develop and deliver through the year 2081 the remaining 13,400 acre feet of groundwater, along with the balance of the surface water, for use on the Lowry Range.
We acquired our Rangeview Water Supply in April 1996 pursuant to the following agreements:
(i) The 1996 Amended and Restated Lease Agreement (the “Lease”) between the Land Board and the District;
(ii) The Agreement for Sale of Export Water between us and the District; and
(iii) The Service Agreement between us and the District for the provision of water service to the District’s customers.
Additionally, in 1997 we entered into a Wastewater Service Agreement (the “Wastewater Agreement”) with the District to provide wastewater service to the District’s customers. All of the foregoing agreements are collectively referred to as the “Rangeview Water Agreements.”
Pursuant to the Rangeview Water Agreements, we design, construct, operate and maintain the District’s water and wastewater systems to allow the District to provide water and wastewater service to its customers located within the District’s 24,000 acre service area at the Lowry Range. On the Lowry Range, we operate both the water and the wastewater systems during our contract period on behalf of the District, who owns the facilities for both systems. At the expiration of our contract term in 2081, ownership of the water system facilities servicing customers on the Lowry Range will revert to the Land Board, with the District retaining ownership of the wastewater facilities. Through facilities we own, we use our Export Water, and we intend to use other supplies owned by us, to provide wholesale water service and wastewater service to customers located outside of the Lowry Range, including customers of the District and other governmental entities and industrial and commercial customers.
Based on independent engineering estimates, the water designated for use on the Lowry Range is capable of providing water service to 46,500 SFE units, and the Export Water owned by the Company can serve 33,600 SFE units throughout the Denver metropolitan region.
The Lowry Range Property – The Lowry Range is located in unincorporated Arapahoe County (the “County”), about 20 miles southeast of downtown Denver. The Lowry Range is one of the largest contiguous parcels under single ownership next to a major metropolitan area in the United States. The Lowry Range is approximately 27,000 acres in size or about 40 square miles of land. Of the 27,000 acres, pursuant to our agreements with the District, we have the exclusive rights to provide water and wastewater services to approximately 24,000 acres of the Lowry Range. However, as more fully described in Item 3 – Legal Proceedings, we filed a lawsuit against the Land Board for failing to protect our exclusive rights under the Lease in December 2011.
Rangeview Metropolitan District – The District is a quasi-municipal corporation and political subdivision of Colorado formed in 1986 for the purpose of providing water and wastewater service to the Lowry Range. The District is required to utilize the 13,400 acre feet of water leased to it by the Land Board to serve customers on the Lowry Range. The District is governed by an elected board of directors. Eligible voters and persons eligible to serve as directors of the District must own an interest in property within the boundaries of the District. We own certain rights and real property interests which encompass the current boundaries of the District. The current directors of the District are Mark W. Harding and Scott E. Lehman (both employees of Pure Cycle), and an independent board member. Pursuant to Colorado law, directors may receive $100 for each board meeting they attend, up to a maximum of $1,600 per year. Mr. Harding and Mr. Lehman have both elected to forego these payments.
South Metropolitan Water Supply Authority – The South Metropolitan Water Supply Authority (“SMWSA”) is a municipal water authority in the State of Colorado organized to pursue the acquisition and development of new water supplies on behalf of its members. SMWSA members include 14 Denver area water providers in Arapahoe and Douglas Counties. The District became a member of SMWSA in 2009 in an effort to participate with other area water providers in developing regional water supplies along the Front Range. For over 2 years, the SMWSA members have been working with Denver Water and Aurora Water on a cooperative water project known as the Water Infrastructure Supply Efficiency partnership (“WISE”), which seeks to develop regional infrastructure which would interconnect member’s water transmission systems to be able to develop additional water supplies from the South Platte River in conjunction with Denver Water and Aurora Water. In July of 2013, the District together with 9 other SMWSA members formed the South Metropolitan Wise Authority (“SMWA”) to continue to develop the WISE project. Through an agreement with the District, we support SMWA and its joint water development efforts and may seek to participate in one or more regional water projects if such projects are in our best interest. Preliminary estimates for the District’s capital expenditure related to the WISE project are approximately $6.7 million, which will be completed over a 7 year period.
East Cherry Creek Valley System – Pursuant to a 1982 contractual right, the District may purchase water produced from East Cherry Creek Valley Water and Sanitation District’s (“ECCV”) Land Board system. ECCV’s Land Board system is comprised of eight wells and over ten miles of buried water pipeline located on the Lowry Range. In order to increase the delivery capacity and reliability of these wells, in May 2012, in our capacity as Rangeview’s service provider and the Export Water Contractor (as defined in the Lease), we entered into an agreement to operate and maintain the ECCV facilities and we can utilize the system to provide water to commercial and industrial customers, including customers providing water for drilling and hydraulic fracturing of oil and gas wells.
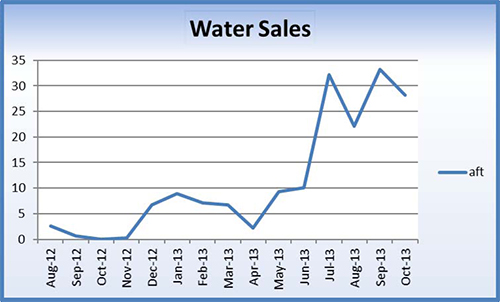
Hydraulic fracturing – We generated revenues of $325,700 during our fiscal year ended August 31, 2013 from sales of drilling and frack water to third party service providers who were providing water for wells drilled into the Niobrara Formation. With a large percentage of the acreage surrounding the Lowry Range in Arapahoe, Adams, Elbert, and portions of Douglas Counties already leased by major oil companies, we anticipate providing additional water for drilling oil and gas wells in the coming fiscal year. Through Select Energy Services, LLC (“Select”), we are currently selling frack water to ConocoPhillips, the largest oil and gas lease holder operating in the area. In order to service this new demand, we have rehabilitated or are in the process of rehabilitating five of our ECCV wells to service the industry and we have added approximately 2,500 ft of 8” buried line so that we can deliver water directly to the industry both on and off of the Lowry Range. We have increased our capacity to approximately 500,000 gallons per day to meet this demand and anticipate during fiscal 2014 that we will increase our delivery capacity to 1 million gallons per day. At present ConocoPhillips has one rig working the area and is fracking 1 well approximately every 3 weeks. Each frack uses approximately 7 million gallons. We anticipate another rig will be added in early calendar 2014. During fiscal 2013 we sold approximately 106.5 aft to the industry. During September and October 2013 we sold an additional approximately 61.3 aft to the industry. Sales of water to the industry by aft are detailed in the following chart.
Land Board Royalties – Pursuant to the Rangeview Water Agreements, the Land Board is entitled to royalty payments based on a percentage of revenues earned from water sales that utilize water from the Rangeview Water Supply. The calculation of royalties depends on the water source, whether the customer is located on the Lowry Range or elsewhere, and whether the customer is a public or private entity. The Land Board does not receive a royalty from wastewater services.
Lowry Range Customers – Water service related payments from customers located on the Lowry Range generate royalties to the Land Board at a rate of 12% of gross revenues. When either (i) metered production of water used on the Lowry Range in any calendar year exceeds 13,000 acre feet or (ii) 10,000 surface acres on the Lowry Range have been rezoned to non-agricultural use, finally platted and water tap agreements have been entered into with respect to all improvements to be constructed on such acreage, the Land Board may elect, at its option, to receive, in lieu of its royalty of 12% of gross revenues, 50% of the collective net profits (ours and the District’s) derived from the sale or other disposition of water on the Lowry Range. To date neither of these conditions has been met and such conditions are not likely to be met any time soon.
Export Water Customers – Export Water royalties are owed to the Land Board when our Rangeview Water Supply is sold or disposed of to customers located off the Lowry Range. If we incur costs to withdraw, treat and deliver water to such customers, royalties to the Land Board are based on our “Net Revenues.” Net Revenues are defined as gross revenues less costs incurred as a direct and indirect result of incremental activity associated with the withdrawal, treatment and delivery of the water (costs include reasonable overhead allocations). Royalties payable to the Land Board for Export Water sales escalate based on the amount of Net Revenue we receive and are lower for sales to a water district or similar municipal or public entity than for sales to a private entity as noted in Table A.
| | | | | | | | | | |
| Table A - Royalties for Export Water Sales | |
| | | Royalty Rate | |
| | | Private | | Public | |
| Net Revenues | | Entity Buyer | | Entity Buyer | |
| $0 - $45,000,000 | | | 12 | % | | | 10 | % | |
| $45,000,001 - $60,000,000 | | | 24 | % | | | 20 | % | |
| $60,000,001 – $75,000,000 | | | 36 | % | | | 30 | % | |
| $75,000,001 - $90,000,000 | | | 48 | % | | | 40 | % | |
| Over $90,000,000 | | | 50 | % | | | 50 | % | |
Arkansas River Water and Land
We own approximately 60,000 acre feet of surface water rights in the Arkansas River together with approximately 16,700 acres of irrigated farm land in southeastern Colorado. We acquired our Arkansas River water and land from High Plains A&M, LLC (“HP A&M”) pursuant to an asset purchase agreement dated May 10, 2006 (the “Arkansas River Agreement”). The water rights we own are represented by 21,782 shares of the Fort Lyon Canal Company (the “FLCC”), which is a non-profit mutual ditch company established in the late 1800’s to operate and maintain the 110-mile long Fort Lyon Canal between La Junta and Lamar, Colorado. We have agreements to sell approximately 1,600 acres of farmland and 3,400 FLCC shares for approximately $5.7 million, which are expected to close during fiscal year 2014.
In order to preserve our Arkansas River water rights until we are ready to seek a change of use, we currently lease our land and water to area farmers who continue to irrigate the land for agricultural purposes. In conjunction with the Arkansas River Agreement we entered into a property management agreement pursuant to which HP A&M agreed to manage our farm properties and take care of our obligations under the farm leases, including property taxes in exchange for the rental income from the Leases (the “Property Management Agreement”). In August 2012, we terminated the Property Management Agreement due to certain defaults by HP A&M under the terms of the Arkansas River Agreement and related agreements. As a result of the termination, we now control all leasing activities and are entitled to all future income from such leasing activities. We are also responsible for property taxes and other expenses associate with the properties. We intend to continue managing our farms together with our tenant farmers. For additional information concerning our rights and obligations under the Arkansas River Agreement and a discussion of the effect of the defaults by HP A&M, see Item 7 – Management’s Discussion and Analysis of Financial Condition and Results of Operations – Critical Accounting Policies and Use of Estimates – Fair Value Estimates – Obligations Payable by HP A&M, Now in Default and – Farm Accounts Receivable and Future Farm Income.

Agricultural Operations and Leasing – Beginning on August 3, 2012, we assumed management of our farm operations and all associated income and expenses. Beginning September 1, 2012, we began tracking and reporting our farm operations as a separate business segment to reflect management’s analysis, investment decision, and operating performance for this business segment. Currently, approximately 90% of our farm operations are managed through cash lease arrangements with local area farmers whereby we charge a fixed fee, billed semi-annually in March and November, to lease our land and the water for agricultural purposes to tenant farmers. We have a small number of crop share leases, pursuant to which we and the tenant farmer jointly share in the gross revenues generated from the crops grown under a 75% farmer, 25% landlord participation. The table to the right details a sampling of the crops grown on our farms. We will continue to review and evaluate ways to enhance the performance of our approximately16,700 acres of farm land through relationships with area farmers. The following is a map of our farming properties.
Tap Participation Fee – As further described in Item 7 – Management’s Discussion and Analysis of Financial Condition and Results of Operations – Critical Accounting Policies and Use of Estimates below and Note 7 – Long-Term Debt and Operating Lease and Note 15 – Subsequent Events to the accompanying financial statements, we agreed to pay HP A&M 10% of the tap fees we receive from the next 40,000 water taps we sell from and after the original date of the Arkansas River Agreement. This is referred to as the “Tap Participation Fee”, or “TPF.” The TPF is payable when we sell water taps and receive funds from such water tap sales or other dispositions of property purchased in the HP A&M acquisition.
Effective as of September 1, 2011, (i) HP A&M elected to increase the TPF percentage from 10% to 20% and take a corresponding 50% reduction in the number of taps subject to the TPF and (ii) pursuant to the Property Management Agreement, we began allocating 26.9% of the Net Revenues (defined as all lease and related income received from the farms less employee expenses, direct expenses for managing the leases and a reasonable overhead allocation) paid to HP A&M against the TPF. Beginning in June of 2012, HP A&M began defaulting on certain promissory notes owed to third parties resulting in a default under the Arkansas River Agreements. As a result of HP A&M’s default, on August 3, 2012, we terminated the Property Management Agreement and stopped allocating 26.9% of the Net Revenues to the TPF. We began implementing our remedies under the Arkansas River Agreements, including commencing foreclosure procedures on certain farms and FLCC shares, and as of August 31, 2013, there remained 17,194 water taps subject to the Tap Participation Fee. Subsequent to fiscal year end, additional farms and corresponding FLCC shares have been foreclosed upon reducing the remaining water taps subject to the Tap Participation Fee to 13,830.
Additional information on the elections made by HP A&M, the terms of the Arkansas River Agreement, the estimation of the fair value of the Tap Participation Fee liability, the calculation of the percentage of Net Revenues and the reduction of water taps subject to the Tap Participation Fee is included in Item 7 – Management’s Discussion and Analysis of Financial Condition and Results of Operations – Critical Accounting Policies and Estimates below and in Note 7 – Long-term Debt and Operating Lease and Note 14 – Related Party Transactions to the accompanying financial statements.
Approximately 60 of the 80 farms acquired from HP A&M were subject to deeds of trust to secure payment of promissory notes owed by HP A&M to third parties. As of the date of this filing, HP A&M has defaulted on all of these promissory notes and deeds of trust. The farms subject to the deeds of trust consist of approximately 14,000 acres of farm land and 16,882 FLCC shares of water rights. Mineral rights on these farms, if any, are owned approximately 75% by HP A&M and 25% by us. As of September 1, 2012 HP A&M owed approximately $9.6 million of principal and accrued interest on the defaulted notes. We have commenced exercising our remedies under the Arkansas River Agreement and related agreements, which remedies include, but are not limited to, the right to (i) foreclose on 1,500,000 shares of Pure Cycle common stock issued to HP A&M and the proceeds therefrom (the “Pledged Shares”) which were pledged by HP A&M pursuant to a pledge agreement (the “Seller Pledge Agreement”) to secure the payment and performance by HP A&M of the promissory notes described above (these shares were sold in a foreclosure sale in September 2012); (ii) reduce the Tap Participation Fee; (iii) terminate the Property Management Agreement; and (iv) recover damages caused by the defaults, including certain costs and attorney’s fees. See Item 7 – Management’s Discussion and Analysis of Financial Condition and Results of Operation – Critical Accounting Policies and Use of Estimates - Fair Value Estimates – Obligations Payable by HP A&M, Now in Default below for further discussion of the defaults by HP A&M and the remedies under the Arkansas River Agreement, as well as Note 7 – Long-Term Debt and Operating Lease and Note 15 – Subsequent Events to the accompanying financial statements.
During fiscal year 2013 four of our farms and one FLLC certificate representing water rights only went through foreclosure proceedings due to the defaults by HP A&M. Our agreement with HP A&M provides for a reduction of the number of water taps subject to the TPF payable to HP A&M in the event of the farms or water rights are sold in a foreclosure sale. We reduced the number of taps by 2,233 taps and the discounted present value of the TPF payable by a total of approximately $11.7 million as a result of the foreclosures. As of August 31, 2013 there were 17,194 taps subject to the Tap Participation Fee. Subsequent to our fiscal year end, an additional three farms and one FLCC certificate representing water rights only, collectively including 1,832 FLCC shares, were foreclosed resulting in a reduction of the number of taps subject to the TPF by an additional 3,364 taps (approximately $11.9 million of the TPF), leaving 13,830 taps subject to the Tap Participation Fee as of November 27, 2013.
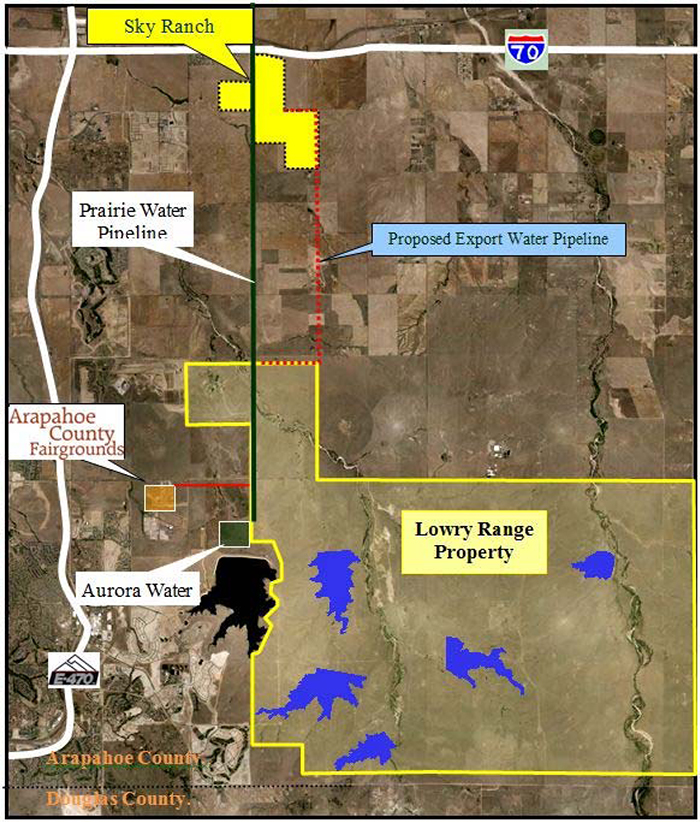
Sky Ranch
In 2010 we purchased 931 acres of undeveloped land located in unincorporated Arapahoe County known as Sky Ranch. Sky Ranch is located directly adjacent to I-70, 16 miles east of downtown Denver, 4 miles north of the Lowry Range, and 4 miles south of Denver International Airport. The financing of the Sky Ranch acquisition is described in greater detail in Note 4 – Water Assets to the accompanying financial statements.
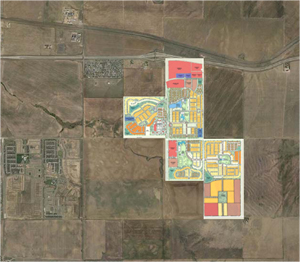
The property includes rights to 820 acre feet of water, has been zoned for residential, commercial and retail uses and may include up to 4,850 SFE’s. There is currently no development at Sky Ranch. We currently lease the land to an area farmer. We envision that when development at Sky Ranch begins, the development will be in the form of entry level housing (houses costing less than $300,000). We plan to partner with national home builders/developers to develop the Sky Ranch property. We are anticipating that the home builder/developer will construct infrastructure such as roads, curbs and gutters, and we will construct the necessary water and wastewater systems. Our plan is to provide the market with competitively priced lots that are ready for development together with affordable, sustainable, environmentally sound water and wastewater services. We anticipate working with the builders/developers to bring a product to the Denver market that is both affordable and desirable. Although timing for development of this property is unknown, some land development experts believe the entry level housing market is among the most active housing products in the Denver metropolitan area. At full development, the water and wastewater utilities at Sky Ranch are anticipated to generate in excess of $132 million in tap fee revenue and approximately $7 million annually in wholesale service fee revenue (based on current fees and charges).
Oil and Gas Lease – On March 10, 2011, we entered into a Paid-Up Oil and Gas Lease (the “O&G Lease”) and Surface Use and Damage Agreement (the “Surface Use Agreement”) with Anadarko E&P Company, L.P. (“Anadarko”), a wholly owned subsidiary of Anadarko Petroleum Company. The O&G Lease seeks to capitalize on the growing interest in the region’s Niobrara Oil Formation. Pursuant to the O&G Lease, we received an up-front payment of $1,900 per net mineral leased acre, or $1,243,400, and 20% of gross proceeds royalty (less certain taxes) from the sale of any oil and gas produced from our property. In December of 2012 the O&G Lease was purchased by a wholly owned subsidiary of ConocoPhillips Company (“ConocoPhillips”). The O&G Lease has a term of three (3) years commencing on March 10, 2011. If ConocoPhillips commences drilling and has a producing well on Sky Ranch or lands pooled or unitized with Sky Ranch, the O&G Lease will continue in effect for as long as oil or gas is being produced. If there is no production by the end of the initial term, ConocoPhillips may extend the O&G Lease for an additional two (2) years by paying us an up-front payment equal to the initial up-front payment noted above. Pursuant to the Surface Use Agreement, ConocoPhillips may drill on up to three well pad sites on the Sky Ranch property covered under the O&G Lease. Additionally, we will receive $3,000 per acre for land that is permanently disturbed for use in the oil and gas exploration and production. During October 2013 three well permit applications were filed. One permit is for a well to be drilled on the Sky Ranch property. The remaining two permits are for wells to be drilled off of Sky Ranch, but will be drilled into the formation under the Sky Ranch property.
We have experienced increased water demands for hydraulic fracturing of oil and gas wells being developed in the Niobrara Formation around our Sky Ranch property and the Land Board’s Lowry Range property. Based on similar horizontal wells developed in the Niobrara Formation each horizontal well will require between 3 million and 7 million gallons of water to drill and “frack”, which equates to selling water to between approximately 23 and 54 SFE’s.
Arapahoe County Fairgrounds Agreement for Water Service
In 2005, we entered into an Agreement for Water Service (the “County Agreement”) with the County to design, construct, operate and maintain a water system for, and provide water services to, the County for use at the County’s fairgrounds (the “Fairgrounds”), which are located west of the Lowry Range. Pursuant to the County Agreement we purchased 321 acre feet of water in 2008. Further details of the funding arrangements with the County are described in Note 4 – Water Assets to the accompanying financial statements.
Pursuant to the County Agreement we constructed and own a deep water well, a 500,000 gallon water tank and pipelines to transport water to the Fairgrounds. The construction of these items was completed in our fiscal 2006, and we began providing water service to the County in 2006.
Well Enhancement and Recovery Systems
In January 2007, we, along with two other parties, formed Well Enhancement and Recovery Systems, LLC (“Well Enhancement LLC”), to develop a new deep water well enhancement tool and process which we believe will increase the efficiency of wells into the Denver Basin groundwater formation. In fiscal 2008, the well enhancement tool and process was completed and tested on two deep water wells developed by an area water provider with favorable results. According to results from studies performed by an independent hydro-geologist, the well enhancement tool effectively increased the production of the two test wells by 80% and 83% when compared to that of nearby wells developed in similar formations at similar depths. Based on the positive results of the test wells, we continue to refine the process of enhancing deep water wells and are marketing the tool to area water providers. On April 27, 2010, we and the other remaining owner of Well Enhancement LLC acquired the third partner’s 1/3rd interest in Well Enhancement LLC. Following the acquisition, the remaining partners each hold a 50% interest in Well Enhancement LLC. During fiscal 2013 our tool was used in 3 wells.
Paradise Water Supply
In 1987 we acquired the conditional rights to build a 70,000 acre foot reservoir to store Colorado River tributary water and a right-of-way permit from the U.S. Bureau of Land Management for property at the dam and reservoir site (collectively known as our “Paradise Water Supply”). Due to the significant development costs of water assets along the western slope and agreements with other western slope water interests, the use of our Paradise Water Supply is limited to opportunities along the western slope. The conditional water rights diligence application was completed in October 2008 and we were able to negotiate a finding of diligence and continuation of the conditional water rights through October 2014. In order to obtain a finding of reasonable diligence at the next diligence proceeding for the Paradise conditional water rights in October 2014, we are required to (i) select an alternate reservoir site; (ii) file an application with the Water Court for Water Division 5 to change the place of storage; (iii) identify specific end users and places of use for the Paradise conditional water rights within the Colorado River basin in Colorado, excluding the Gunnison River basin; and (iv) identify specific source(s) of the water rights for use. We do not intend to spend the resources needed to find an alternative reservoir site without a specific use for the water. We have been unable to find potential customers for this water and cannot be certain that any customer will commit to use the water within the next year. Since we do not have a customer that will commit to use the water and will not commit the resources necessary to move the reservoir site without a customer, we are expecting to lose the conditional water rights. Accordingly, we deemed the Paradise Water Supply to be fully impaired and an impairment of $5.5 million was recorded in the fiscal 2012 financial statements. We are currently working on options to dispose of our Paradise Water Supply asset.
Revenues
We generate revenues through two separate lines of businesses including our Wholesale Water and Wastewater business and our Farming Operations, which are described below.
Wholesale Water and Wastewater business – We generate revenues through our wholesale water and wastewater segment predominately from three sources: (i) monthly service and contract delivery fees, (ii) one time water and wastewater tap fees and construction fees, and (iii) consulting fees. Our revenue sources and how we account for them are described in greater detail below. We typically negotiate the payment terms for tap fees, construction fees, and other water and wastewater service fees with our wholesale customers as a component of our service agreements prior to construction of the project.
| | i) | Monthly Service Fees – Monthly wholesale water usage fees are assessed to our customers based on actual metered deliveries to their end-use customers each month. Water usage fees are based on a tiered pricing structure that provides for higher prices as customers use greater amounts of water. Water usage pricing is capped at the average of the prices charged by the same three surrounding water providers used as the basis for water tap fees. The District has not changed its water usage fees since July 1, 2010. The water usage fees are noted below in table B: |
| | | | | | | | | | |
| Table B - Tiered Water Usage Pricing Structure | |
| | | Price ($ per thousand gallons) | |
| Amount of consumption | | 2013 | | | 2012 | | | 2011 | |
| Base charge per SFE | | $ | 27.62 | | | $ | 27.62 | | | $ | 27.62 | |
| 0 gallons to 10,000 gallons | | $ | 2.81 | | | $ | 2.81 | | | $ | 2.81 | |
| 10,001 gallons to 20,000 gallons | | $ | 3.69 | | | $ | 3.69 | | | $ | 3.69 | |
| 20,001 gallons to 40,000 gallons | | $ | 6.56 | | | $ | 6.56 | | | $ | 6.56 | |
| 40,001 gallons and above | | $ | 8.93 | | | $ | 8.93 | | | $ | 8.93 | |
The figures in Table B reflect the amounts charged to the District’s end-use customers. In exchange for providing water service to the District’s Lowry Range customers, we receive 95% of the usage charges received by the District relating to water services after deducting the required royalty to the Land Board (described above at Rangeview Water Supply and Lowry Range – Land Board Royalties). In exchange for providing wastewater services, we receive 90% of the District’s monthly wastewater service fees, as well as the right to use or sell the reclaimed water.
Currently the District charges its wastewater customers based on a monthly fee of $7.83 per SFE plus a $6.68 per thousand gallons treated usage fee. There have not been any changes to the pricing structure since July 1, 2011.
In addition to the tiered water usage pricing structure we currently charge a hydrant rate of $9 per thousand gallons. During fiscal 2013 our sales to the fracking industry were charged at the hydrant rate. Beginning October 2013 we began charging a water rate to the fracking industry of $10.50 per thousand gallons for export water sales. We also collect other immaterial fees and charges from customers and other users to cover miscellaneous administrative and service expenses, such as application fees, review fees and permit fees.
| | ii) | Water and Wastewater Tap Fees and Construction Fees – Tap fees are paid by developers in advance of construction activities and are non-refundable. Tap fees are typically used to fund construction of the Wholesale Facilities and defray the acquisition costs of obtaining water rights. |
Pursuant to the Rangeview Water Agreements the District’s rates and charges to end use customers may not exceed the average of similar rates and charges of three nearby water providers. Despite modest increases in the water tap fees at these three nearby water providers, the District’s water tap fees and wastewater tap fees have remained unchanged at $22,500 per SFE and $4,883 per SFE, respectively, since 2009. The District last increased water tap fees on July 1, 2009, by $1,000 to $22,500 per SFE, which was a 4.7% increase over the 2008 water tap fee.
In exchange for providing water service to the District’s customers (customers on the Lowry Range), we receive 95% of the District’s tap fees after deducting the required royalty to the Land Board described above. In exchange for providing wastewater services, we receive 100% of the District’s wastewater tap fees.
Construction fees are fees we receive, typically in advance, from developers for us to build certain infrastructure such as Special Facilities which are normally the responsibility of the developer.
| | iii) | Consulting Fees – Consulting fees are fees we receive, typically on a monthly basis, from municipalities and area water providers along the I-70 corridor, for system management and maintenance. |
Farming Operations – We lease our farms to local area farmers on both cash and crop share lease basis. Our cash lease farmers are charged a fixed fee, billed semi-annually in March and November. During the November billing cycle our cash lease billings include either a discount or a premium adjustment based on actual water deliveries by the FLCC. Our crop share lease fees are based on actual crop yields and are received upon the sale of the crops. All fees are estimated and recognized ratably on a monthly basis.
Significant Customers
Our wholesale water and wastewater sales to the District pursuant to the Rangeview Water Agreements accounted for 34%, 86%, and 91% of our total water revenues for the years ended August 31, 2013, 2012 and 2011, respectively. The District has one significant customer, the Ridgeview Youth Services Center (“Ridgeview”). Pursuant to our Rangeview Water Agreements with the District, we are providing water to Ridgeview on behalf of the District. Ridgeview accounted for 28%, 53% and 60% of our total water revenues for the years ended August 31, 2013, 2012 and 2011, respectively.
Our wholesale water sales indirectly to ConocoPhillips accounted for 59% of our total water revenues for the fiscal year ended August 31, 2013.
Our Projected Operations
This section should be read in conjunction with Item 1A – Risk Factors.
Along the Colorado Front Range, there are over 70 water providers with varying needs for replacement and new water supplies. We believe we are well positioned to assist certain of these providers in meeting their current and future water needs.
We design, construct and operate our existing and future water and wastewater facilities using advanced water purification and wastewater treatment technologies which allow us to use our water supplies in an efficient and environmentally sustainable manner. We plan to develop our water and wastewater systems in stages to efficiently meet demands in our service areas, thereby reducing the amount of up-front capital costs required for construction of facilities. We use third party contractors to construct our facilities as needed. We employ licensed water and wastewater operators to operate our water and wastewater systems. As our systems expand, we expect to hire additional personnel to operate our systems, which include water production, treatment, testing, storage, distribution, metering, billing, and operations management.
Our water and wastewater systems conjunctively use surface and groundwater supplies and storage of raw water and highly treated effluent supplies to provide a balanced sustainable water supply for our wholesale customers and their end-use customers. Integrating conservation practices and incentives together with effective water reuse demonstrates our commitment to providing environmentally responsible, sustainable water and wastewater services. Water supplies and water storage reservoirs are competitively sought throughout the west and along the Front Range of Colorado. We believe regional cooperation among area water providers in developing new water supplies, water storage, and transmission and distribution systems, provides the most cost effective way of expanding and enhancing service capacities for area water providers. We continue to discuss developing water supplies and water storage opportunities with area water providers.
We expect the development of our Rangeview Water Supply to require a significant number of high capacity deep water wells. We anticipate drilling separate wells into each of the three principal aquifers located beneath the Lowry Range. Each well is intended to deliver water to central water treatment facilities for treatment prior to delivery to customers. Development of our Lowry Range surface water supplies will require facilities to divert surface water to storage reservoirs to be located on the Lowry Range and treatment facilities to treat the water prior to introduction into our distribution systems. Surface water diversion facilities will be designed with capacities to divert the surface water when available (particularly during seasonal events such as spring run-off and summer storms) for storage in reservoirs to be constructed on the Lowry Range. Based on preliminary engineering estimates, the full build-out of water facilities (including diversion structures, transmission pipelines, reservoirs, and water treatment facilities) on the Lowry Range will cost in excess of $340 million, based on current costs, and will accommodate water service to customers located on and outside the Lowry Range. We expect this build out to occur over an extended period of time, and we expect that tap fees will be sufficient to fund the infrastructure costs.
Our Denver based supplies are a valuable, locally available resource located near the point of use. This enables us to incrementally develop infrastructure to produce, treat and deliver water to customers based on their growing demands. Adding our locally available supplies to our intermediate and longer term supplies from the Arkansas River balances both current and ongoing supplies to meet the growing water demands in the Front Range market.
In order to use our Arkansas River water for municipal purposes, we must file a change of use application with the Colorado water court. This will likely be a lengthy process and require a substantial amount of capital for legal and engineering services. If we successfully change the use of our water rights to include municipal uses, we would then need to construct a 130-mile pipeline, and water treatment and pumping facilities, from southeastern Colorado to the Denver metropolitan area at an estimated cost of over $500 million, based on current costs. Since acquiring the Arkansas River supply, we have investigated various pipeline alignments and potential partnerships for construction of these facilities. We do not plan on starting this process in the near term and anticipate that the tap fees and usage fees we generate from taps sold utilizing our water rights located along the Front Range, along with funding from other pipeline partners, will be sufficient to fund the water delivery facilities when the water is needed along the Front Range. Although we have not yet filed a change of use application, we are working with the FLCC and other interested parties in the Arkansas River Valley to mitigate any adverse impacts to the local communities and to make investments and decisions on farming operations which benefit continued agricultural operations as well as providing new municipal water supplies for the Front Range. We are conducting a rotational crop study program and participating in discussions with area interests including the Lower Arkansas Valley Super Ditch (“Super Ditch”), which is a group of Arkansas Valley irrigators who have assembled to study alternatives to traditional “buy and dry” agricultural-to-municipal water transfers.
During fiscal 2013 we, along with the District, began developing and integrating the ECCV system of wells through the rehabilitation of a number of existing wells and the addition of piping to service fracking operations both on and off of the Lowry Range. In order to fully meet the anticipated demand by these operations during fiscal 2014 we may continue to invest in this system to maximize our production and to divert our water to the locations we need to reach. We anticipate expanding capacity in our system from approximately 500,000 gallons per day to approximately 1 million gallons per day during fiscal 2014.
The District is currently in the process of negotiating terms for the development of the WISE project. This project is being established for the purpose of extending renewable water sources held by the Denver and Aurora water districts to the South Metro water providers, including the District. This system will add an additional vital source of water to our system, which in the long-term will be an essential component of the District’s system and will enable us to continue to meet the demands or our customers on a sustainable and environmentally friendly manner. Through our funding agreement with the District we may participate in this project during fiscal 2014.
We are exploring development of our Sky Ranch property including evaluating possible joint venture opportunities whereby we will contribute the property, a portion of the development funds, and build the water and wastewater infrastructure for housing and commercial development of the property. The timing for us to begin developing the property is largely dependent on the Denver real estate market and interest we receive from home builders and developers. While the Denver area’s housing market has strengthened in recent years we are not able to determine when we expect to begin development of the property.
We continue to develop our farming operations seeking to increase crop yields and to balance our cash and crop share leases in order to maximize profits while leveraging our risks. We plan on adding sprinkler irrigation to a few of our farms during fiscal 2014 in order to better utilize our water supplies and increase crop yields. We are also negotiating with area farmers to optimize our lease structure.
Water and Growth in Colorado
After experiencing a weak economy through 2012, much like that of the U.S. as a whole, Colorado began recovering during 2013. The key drivers in our business model are:
| | ● | Housing Starts – From September 2011 to September 2012 the annual housing starts increased by 41%. From September 2012 to September 2013 the annual housing starts increased by 34%. |
| | | Unemployment – The unemployment rate in Colorado was 7% at August 31, 2013 compared to a national unemployment rate of 7.3%. Colorado added an estimated 56,800 jobs from August 2012 to August 2013. |
| | | Population – The Denver Regional Council of Governments (“DRCOG”), a voluntary association of over 50 county and municipal governments in the Denver metropolitan area, continues to estimate that the Denver metropolitan area population will increase by about 44% from today’s 2.7 million people to 3.9 million people by the year 2030. A Statewide Water Supply Initiative report by the Colorado Water Conservation Board estimates that the South Platte River basin, which includes the Denver metropolitan region, will grow from a current population of 3.2 million to 4.9 million by the year 2030; while the State’s population will increase from 4.7 million to 7.2 million. |
| | | Demand – Approximately 70% of the State’s projected population increase is anticipated to occur within the South Platte River basin. Significant increases in Colorado’s population, particularly in the Denver metro region and other areas in the water short South Platte River basin, together with increasing agricultural, recreational, and environmental water demands will intensify competition for water supplies. The estimated population increases are expected to result in demands for water services in excess of the current capabilities of municipal service providers, especially during drought conditions. |
| | | Supply – The Statewide Water Supply Initiative estimates that population growth in the Denver region and the South Platte River basin will result in additional water supply demands of over 400,000 acre feet by the year 2030, which must be met with new water sources. |
| | | Development – Colorado law requires property developers to demonstrate they have sufficient water supplies for their proposed projects before rezoning or annexation applications will be considered. These factors indicate that water and availability of water will continue to be critical to growth prospects for the region and the state, and that competition for available sources of water will continue to intensify. We focus the marketing of our water supplies and services to developers and homebuilders that are active along the Colorado Front Range as well as other area water providers in need of additional supplies. |
Colorado’s future water supply needs will be met through conservation, reuse and the development of new supplies. The District’s rules and regulations for water and wastewater service call for adherence to strict conservation measures, including low flow water fixtures, high efficiency appliances, and advanced irrigation control devices. Additionally, our systems are designed and constructed using a dual-pipe water distribution system to segregate the delivery of high quality potable drinking water to our local governmental entities and their end-use customers through one system and a second system to supply raw or reclaimed water for irrigation demands. About one-half of the water used by a typical Denver-area residential water customer is used for outdoor landscape and lawn irrigation. We believe that raw or reclaimed water supplies provide the lowest cost, most environmentally sustainable water for outdoor irrigation. We expect our systems to include an extensive water reclamation system, in which essentially all effluent water from wastewater treatment plants will be reused to meet non-potable water demands. Our dual-distribution systems demonstrate our commitment to environmentally responsible water management policies in our water short region.
Competition
We negotiate individual service agreements with our governmental customers and with their developers and/or homebuilders, to design, construct and operate water and wastewater systems and to provide services to end-use customers of governmental entities and to commercial and industrial customers. These service agreements address all aspects of the development of the water and wastewater systems including:
(i) the purchase of water and wastewater taps in exchange for our obligation to construct certain Wholesale Facilities,
(ii) the establishment of payment terms, timing, capacity and location of Special Facilities (if any); and
(iii) specific terms related to our provision of ongoing water and wastewater services to our local governmental customers as well as the governmental entity’s end-use customers.
Although we have exclusive long-term water and wastewater service contracts for 24,000 acres of the 27,000-acre Lowry Range pursuant to our service agreement with the District, providing water and wastewater services to areas other than Sky Ranch and the majority of the Lowry Range, is subject to competition. Moreover, others, including the Land Board, have attempted to challenge, thus far without success, our exclusive rights to service the Lowry Range. See Item 1A – Risk Factors and Item 3 – Legal Proceedings below. Alternate sources of water are available, principally from other private parties, such as farmers or others owning water rights that have historically been used for agriculture, and from municipalities seeking to annex new development areas in order to increase their tax base. Our principal competition in areas close to the Lowry Range is the City of Aurora. Principal factors affecting competition for potential purchasers of our Arkansas River water and Export Water include the availability of water for the particular purpose, the cost of delivering the water to the desired location including the cost of required taps, and the reliability of the water supply during drought periods. The water assets we own and have the exclusive right to use have a supply capacity of 180,000 SFE units, and we believe they provide us with a significant competitive advantage along the Front Range. Our legal rights to the Rangeview Water Supply have been confirmed for municipal use and a significant portion of our water supply is close to Denver area water users. Our pricing structure is competitive and our water portfolio is well balanced with senior surface water rights, groundwater rights, storage capacity and reclaimed water supplies.
Environmental, Health and Safety Regulation
Provision of water and wastewater services is subject to regulation under the federal Safe Drinking Water Act, the Clean Water Act, related state laws, and federal and state regulations issued under these laws. These laws and regulations establish criteria and standards for drinking water and for wastewater discharges. In addition, we are subject to federal and state laws and other regulations relating to solid waste disposal and certain other aspects of our operations.
Environmental compliance issues may arise in the normal course of operations or as a result of regulatory changes. We attempt to align capital budgeting and expenditures to address these issues in a timely manner.
Safe Drinking Water Act – The Safe Drinking Water Act establishes criteria and procedures for the U.S. Environmental Protection Agency (the “EPA”) to develop national quality standards for drinking water. Regulations issued pursuant to the Safe Drinking Water Act and its amendments set standards on the amount of certain microbial and chemical contaminants and radionuclides allowable in drinking water. The State of Colorado has assumed primary responsibility for enforcing the standards established by the Safe Drinking Water Act and has adopted the Colorado Primary Drinking Water Standards (5 CCR 1003-1). Current requirements for drinking water are not expected to have a material impact on our financial condition or results of operations as we have made and are making investments to meet existing water quality standards. In the future, we might be required to change our method of treating drinking water and make additional capital investments if additional regulations become effective.
The federal Groundwater Rule became effective December 1, 2009. This rule requires additional testing of water from well sources and under certain circumstances requires demonstration and maintenance of effective disinfection. In 2009, Colorado adopted Article 13 to the Colorado Primary Drinking Water Standards to establish monitoring and compliance criteria for the Groundwater Rule. We have implemented measures to comply with the Groundwater Rule.
Clean Water Act – The Clean Water Act regulates wastewater discharges from drinking water and wastewater treatment facilities and storm water discharges into lakes, rivers, streams, and groundwater. The State of Colorado has assumed primary responsibility for enforcing the standards established by the federal Clean Water Act for wastewater discharges from domestic water and wastewater treatment facilities and has adopted the Colorado Water Quality Control Act and related regulations. It is our policy to obtain and maintain all required permits and approvals for discharges from our water and wastewater facilities and to comply with all conditions of those permits and other regulatory requirements. A program is in place to monitor facilities for compliance with permitting, monitoring and reporting for wastewater discharges. From time to time, discharge violations might occur which might result in fines and penalties; but we have no reason to believe that any such fines or penalties are pending or will be assessed.
In the future, we anticipate changing our method of treating wastewater, which will require future additional capital investments, as additional regulations become effective. We anticipate spending between $400,000 and $500,000 during calendar year 2014 for improvements at our wastewater treatment facilities necessary to maintain compliant operations in light of more stringent discharge criteria for ammonia-nitrogen and chlorine residual.
Solid Waste Disposal – The handling and disposal of residuals and solid waste generated from water and wastewater treatment facilities is governed by federal and state laws and regulations. We have a program in place to monitor our facilities for compliance with regulatory requirements, and we do not anticipate that costs associated with our handling and disposal of waste material from our water and wastewater operations will have a material impact on our business or financial condition.
Employees
We currently have five full-time employees.
Available Information and Website Address
Our website address is www.purecyclewater.com. We make available free of charge through our website our annual reports on Form 10-K, quarterly reports on Form 10-Q, current reports on Form 8-K, and all amendments to these reports as soon as reasonably practicable after filing with the Securities and Exchange Commission (“SEC”).
These reports and all other material we file with the SEC may be obtained directly from the SEC’s website, www.sec.gov/edgar/searchedgar/companysearch.html, under CIK code 276720. The contents of our website are not incorporated by reference into this report. You may also read and copy any materials we file with the SEC at the SEC’s Public Reference Room at 100 F Street, NE, Washington, DC 20549. Operating information for the Public Reference Room is available by calling the SEC at 1-800-SEC-0330.
Our business, operations, and financial condition are subject to significant risks. These risks include those listed below and may include additional risks of which we are not currently aware or which we currently do not believe are material. If any of the events or circumstances described in the following risk factors actually occurs, our business could be materially adversely affected. These risks should be read in conjunction with the other information set forth in this report, including the accompanying financial statements and notes thereto.
We are dependent on the housing market and development in our targeted service areas for future revenues. Providing wholesale water service using our Colorado Front Range water supplies is our principal source of future revenue. The timing and amount of these revenues will depend significantly on housing developments being built near our water assets. The development of these areas is not within our control, and there can be no assurance that development will occur or that water sales will occur on acceptable terms or in the amounts or time required for us to support our costs of operation. In the event wholesale water sales are not forthcoming or development on the Lowry Range, Sky Ranch or other developments in our targeted service area is delayed indefinitely, we would need to incur additional short or long-term debt obligations or seek to sell additional equity to generate operating capital, and there are no assurances that we would be successful in obtaining additional operating capital. After several years of significant declines in new home construction, there have been positive market gains in the Colorado housing market in 2013. However, if the downturn in the homebuilding and credit markets return or if the national economy weakens and economic concerns intensify, it could have a significant negative impact on our business and financial condition.
Development on the Lowry Range is not within our control and is subject to obstacles. Development on the Lowry Range is controlled by the Land Board, which consists of a five person citizen group representing education, agriculture, local government and natural resources, plus one at-large commissioner, each appointed for a four-year term by the Colorado governor and approved by the Colorado Senate. The Land Board’s focus with respect to issues such as development and conservation on the Lowry Range tends to change as membership on the Land Board changes. In addition, there are often significant delays on the adoption and implementation of plans with respect to property administered by the Land Board because the process involves many constituencies with diverse interests. In the event water sales are not forthcoming or development of the Lowry Range is delayed, we may incur additional short or long-term debt obligations or seek to sell additional equity to generate operating capital. Further, the Land Board may not develop large portions of the Lowry Range which would significantly limit our ability to utilize the non-Export Water specifically reserved for use on the Lowry Range.
Because of the prior use of the Lowry Range as a military facility, environmental clean-up may be required prior to development, including the removal of unexploded ordnance. The U.S. Army Corps of Engineers have been conducting unexploded ordnance removal activities at the Lowry Range for the past 20 years. Continued activities are dependent on federal appropriations, and the Army Corps of Engineers has no assurance from year to year of such appropriations for its activities at the Lowry Range.
We and the District have been involved in ongoing disputes with the Land Board regarding our rights and obligations with respect to our Rangeview Water Supply, and such disputes may continue to arise and may not be resolved in our favor. Our Rangeview Water Supply rights are subject to terms of the Lease between the Land Board and the District. The Lease was entered into in 1996 prior to any development of the Lowry Range or of areas outside the Lowry Range that utilize our Export Water. The terms of the Lease did not fully anticipate the specific circumstances of development that have arisen and may not clearly delineate rights and responsibilities for the forms of transactions that may arise in the future. We are currently involved in both an arbitration proceeding and a lawsuit with the Land Board to resolve disputes under the Lease. See the next two risk factors. Moreover, since the Lease extends until 2081, additional disputes may arise. An unfavorable resolution of these disputes could have a material adverse effect on our business, operating results and financial condition.
We filed a lawsuit against the Land Board claiming the Land Board breached and will breach agreements entered into by the Land Board and us in connection with a 1996 settlement, and we may not be successful. On December 19, 2011, we and the District filed a lawsuit against the Land Board, claiming that the Land Board breached, and will breach, agreements entered into by the Land Board with us and the District in connection with a 1996 settlement agreement with respect to our Rangeview Water Supply. Those agreements include the Lease between the Land Board and the District and the Service Agreement between us and the District. The Land Board issued a Request for Proposal that included a draft lease agreement related to oil and gas rights at the Land Board’s Lowry Range and subsequently entered into an oil and gas lease which we believe does not adequately address or protect the District’s exclusive right to provide water service to the Lowry Range or our rights as the District’s exclusive Service Provider. There can be no assurance that we will be successful in the lawsuit or that disputes under the Lease will not reoccur. An unfavorable decision in this lawsuit could have a material adverse effect on the value of our Rangeview Water Supply, our business, operating results and financial condition.
We, The District and the Land Board entered into an Arbitration Agreement pursuant to which the parties have agreed to submit certain counterclaims under the Lease to binding arbitration. In connection with the lawsuit we and the District filed against the Land Board, as described above, the Land Board raised certain counterclaims related to operational disputes under the Lease, which the parties have agreed to submit to binding arbitration. An unfavorable outcome in the arbitration could increase our costs of operations and have a material adverse effect on our business, operating results, and financial condition.
HP A&M filed a law suit against us alleging breaches of representations made in connection with the Arkansas River Agreement. HP A&M initiated a lawsuit against us in District Court, City and County of Denver, State of Colorado on February 27, 2012 alleging breaches of representations made in connection with the Arkansas River Agreement. HP A&M’s claims relate to the issues currently being litigated between us and the Land Board regarding our exclusive right to provide water service to the Land Board’s Lowry Range property. An unfavorable decision in our lawsuit against the Land Board discussed above could adversely affect the decision in this lawsuit. An adverse decision in the HP A&M lawsuit could have a material adverse effect on our business, operating, results and financial condition.
The District’s rights under the Lease have been challenged by third parties. The District’s rights under the Lease have been challenged by third parties in the past, most recently in 2008 when the City of Aurora (the “City”) applied for the right to store water in certain reservoir sites on the Lowry Range that had already been adjudicated by the District and the Land Board, which adjudications allow us to use the reservoir sites for our Rangeview Water Supply. In that proceeding, a developer sought to support the City by filing an amicus brief in which the developer asserted, contrary to the terms of the Lease, that the developer might not be required to obtain water and wastewater service exclusively from the District for planned development on the Lowry Range. The City’s application was denied. However, there can be no assurance that the District’s rights under the Lease will not be challenged again, which could require us to commence potentially expensive litigation to enforce our rights as the District’s service provider to the adjudicated reservoir sites and to provide wholesale water and wastewater service to the Lowry Range. See also risk factor: “We filed a lawsuit against the Land Board claiming the Land Board breached and will breach agreements entered into by the Land Board and us in connection with a 1996 settlement, and we may not be successful.”
Our operations are affected by local politics and governmental procedures which are beyond our control. We operate in a highly political environment. We market our water rights to municipalities and other governmental entities run by elected or politically appointed officials. Our principal competitors are municipalities seeking to expand their sales tax base and other water districts. Various constituencies, including our competitors, developers, environmental groups, conservation groups, and agricultural interests, have competing agendas with respect to the development of water rights in Colorado, which means that decisions affecting our business are based on many factors other than economic and business considerations. Additional risks associated with dealing with governmental entities include turnover of elected and appointed officials, changes in policies from election to election, and a lack of institutional history in these entities concerning their prior courses of dealing with the Company. We spend significant time and resources educating elected officials, local authorities and others regarding our water rights and the benefits of contracting with us. Political concerns and governmental procedures and policies may hinder or delay our ability to enter into service agreements or develop our water rights. While we have worked to reduce the political risks in our business through our participation as the service provider for the District in regional cooperative resource programs, such as the SMWA and its WISE partnership with Denver Water and Aurora Water, as well as education and communication efforts and community involvement, there can be no assurance that our efforts will be successful.
Our Lowry Range Surface water rights are “conditional decrees” and require findings of reasonable diligence. Our surface water interests and reservoir sites at the Lowry Range are conditionally decreed and are subject to a finding of reasonable diligence from the Colorado water court every six years. To arrive at a finding of reasonable diligence, the water court must determine that we continue to diligently pursue the development of said water rights. If the water court is unable to make such a finding, we could lose the water right under review. During fiscal 2012, the Lowry Range conditional decrees were granted their first review by the water court which determined that we and the District met the diligence criteria. The water court entered a finding of reasonable diligence on the Lowry Range surface water decrees on February 11, 2012. Our next diligence period will be in February 2018. If the water court does not make a determination of reasonable diligence in 2018, it would materially adversely impact the value of our interests in the Rangeview Surface Water Supply.
In order to utilize our Arkansas River water, we must apply for a change of use with the water court and this may take several years to complete. The change of use of our Arkansas River water requires a favorable ruling by the water court, which could take several years and be a costly and contentious effort since it is anticipated that many parties will oppose the change of use and the transfer of the water. There are several conditions which must be satisfied prior to our receiving a change of use decree for transfer of our Arkansas River water. One condition that we must satisfy is a showing of anti-speculation in which we, as the applicant, must demonstrate that we have contractual obligations to provide water service to customers prior to the water court ruling on the transfer of a water right. The water court is also expected to limit the transfer to the “consumptive use” portion of the water right and to address changing the historic use of the water from agricultural uses to other uses such as municipal and industrial use. We expect to face opposition to any consumptive use calculations of the historic agricultural uses of this water. The water court may impose conditions on our transfer of the water rights such as requiring us to mitigate the loss of the farming tax base, imposing re-vegetation requirements to convert soils from irrigated to non-irrigated, and imposing water quality measures. Any such conditions will likely increase the cost of transferring the water rights.
We may not be able to obtain sufficient capital to develop our water rights, in particular the Arkansas River water. Development of water rights requires a substantial capital investment. We anticipate financing water and wastewater systems primarily through the sale of water taps and water delivery charges to our customers. However, we cannot assure you that these sources of cash will be sufficient to cover our capital costs. Moreover, the development of the Arkansas River water will require a pipeline or other infrastructure to deliver the water to the Front Range, which is anticipated to cost over $500 million, based on current costs. We likely would be required to partner with others to finance a project of this magnitude, and there is no assurance we would be able to obtain the financing necessary to develop our Arkansas River water.
HP A&M has defaulted on promissory notes secured by deeds of trust on our Arkansas River properties and water rights and if we are unsuccessful in curing the defaults, we will lose some of our properties and the water rights associated with such properties. Approximately 60 of the 80 properties we acquired from HP A&M are subject to promissory notes owed by HP A&M to third parties with principal and accrued interest totaling $9.6 million at August 31, 2012. These promissory notes are secured by deeds of trust on our Arkansas River properties and water rights. HP A&M has defaulted on all of the notes. Although we are not legally responsible for paying these notes, if we do not cure the defaults, we would lose 75% of the Arkansas River properties and a comparable percentage of the water rights. We foreclosed on the Pledged Shares, consisting of 1.5 million shares of our common stock owned by HP A&M which were pledged to us to secure the promissory notes. The foreclosure sale yielded $3.5 million which is not enough to cure all of the promissory notes. We have been acquiring the promissory notes to protect our Arkansas River properties. As of the filing date, we have successfully acquired approximately $7 million of the notes payable by HP A&M in exchange for a combination of cash and secured notes. The notes we have issued are secured by the same Arkansas River properties and water rights and generally have a five-year term, bear interest at an annual rate of 5% and require semi-annual payments with a straight line amortization schedule. We may not be successful in negotiating acquisitions of all of the notes. If we are unable to acquire all of the notes or to pay our notes as they become due, we could lose the property and water rights securing the unacquired HP A&M notes and securing our notes in foreclosure proceedings. The loss of the Arkansas River properties and water rights could have a material adverse effect on our business, operating results and financial condition.
HP A&M attempted to acquire four of the Arkansas River properties, which were subject to promissory notes and deeds of trust defaulted on by HP A&M, without paying us for the properties. We have purchased most of the HP A&M notes and deeds of trust defaulted on by HP A&M and started foreclosure proceedings to clear title to the properties and obtain title to any mineral rights owned by HP A&M as additional collateral to recover the amounts we have had to pay to cure HP A&M’s defaults. HP A&M attempted to redeem four of the properties after the foreclosure sales were completed and sought a court order preventing the Public Trustee from issuing us the deeds to the properties as the successful bidder in the foreclosure sales. The court ruled against HP A&M on November 20, 2013. However, HP A&M has 49 days to appeal the judgment. See “Item 3 – Legal Proceedings” for details regarding this lawsuit. If HP A&M appeals the judgment and is successful, we could lose these four properties, which have a market value of approximately $3,060,000. HP A&M would be liable to us for this loss pursuant to the terms of the Arkansas River Agreement, but there can be no assurance that we would recover such damages.
Our net losses may continue and we may not have sufficient liquidity to pursue our business objectives. We have experienced significant net losses, our cash flows from operations have not been sufficient to fund our operations in the past and we have been required to raise debt and equity capital to remain in operation. Since 2004, we have raised $30.4 million to support our operations through (i) the issuance of $25.2 million of common stock (includes the issuance of stock pursuant to the exercise of options, net of expenses) and (ii) the issuance of $5.2 million of Convertible Debt, which was converted to common stock on January 11, 2011. Our ability to fund our operational needs and meet our business objectives will depend on our ability to generate cash from future operations. We currently have a limited number of customers. If our future cash flows from operations and other capital resources are not sufficient to fund our operations and the significant capital expenditure requirements to build our water delivery systems, we may be forced to reduce or delay our business activities, or seek to obtain additional debt or equity capital. Recent economic conditions and disruptions have caused substantial volatility in capital markets, including credit markets and the banking industry, and have increased the cost and significantly reduced the availability of financing, which may continue or worsen in the future. There can be no assurance that financing will be available on acceptable terms or at all.
The rates the District is allowed to charge customers on the Lowry Range are limited by the Lease with the Land Board and our contract with the District and may not be sufficient to cover our costs of construction and operation. The prices charged by the District for water service on the Lowry Range are subject to pricing regulations set forth in the Lease with the Land Board. Both the tap fees and usage rates and charges are capped at the average of the rates of three nearby water providers. Annually the District surveys the tap fees and rates of the three nearby providers and the District may adjust tap fees and rates and charges based on the average of those charged by this group, and we receive 95% of whatever the District charges its customers. Our costs associated with the construction of water delivery systems and the production, treatment and delivery of water are subject to market conditions and other factors, which may increase at a significantly greater rate than the fees we receive from the District. Factors beyond our control and which cannot be predicted, such as government regulations, insurance and labor markets, drought, water contamination and severe weather conditions, like tornadoes and floods, may result in additional labor and material costs that may not be recoverable under the current rate structure. Either increased customer demand or increased water conservation may also impact the overall cost of our operations. If the costs for construction and operation of our wholesale water services, including the cost of extracting our groundwater, exceed our revenues, we would be providing service to the District for use at the Lowry Range at a loss. The District may petition the Land Board for rate increases; however, there can be no assurance that the Land Board would approve a rate increase request. Further, even if a rate increase were approved, it might not be granted in a timely manner or in an amount sufficient to cover the expenses for which the rate increase was sought.
Our construction of water and wastewater projects may expose us to certain completion, performance and financial risks. We intend to rely on independent contractors to construct our water and wastewater facilities. These construction activities may involve risks, including shortages of materials and labor, work stoppages, labor relations disputes, weather interference, engineering, environmental, permitting or geological problems and unanticipated cost increases. These issues could give rise to delays, cost overruns or performance deficiencies, or otherwise adversely affect the construction or operation of our water and wastewater delivery systems. In addition, we may experience quality problems in the construction of our systems and facilities, including equipment failures. We cannot assure you that we will not face claims from customers or others regarding product quality and installation of equipment placed in service by contractors.
Certain of our contracts may be fixed-price contracts, in which we may bear all or a significant portion of the risk for cost overruns. Under these fixed-price contracts, contract prices are established in part based on fixed, firm subcontractor quotes on contracts and on cost and scheduling estimates. These estimates may be based on a number of assumptions, including assumptions about prices and availability of labor, equipment and materials, and other issues. If these subcontractor quotations or cost estimates prove inaccurate, or if circumstances change, cost overruns may occur, and our financial results would be negatively impacted. In many cases, the incurrence of these additional costs would not be within our control.
We may have contracts in which we guarantee project completion by a scheduled date. At times, we may guarantee that the project, when completed, will achieve certain performance standards. If we fail to complete the project as scheduled, or if we fail to meet guaranteed performance standards, we may be held responsible for cost impacts and/or penalties to the customer resulting from any delay or for the costs to alter the project to achieve the performance standards. To the extent that these events occur and are not due to circumstances for which the customer accepts responsibility or cannot be mitigated by performance bonds or the provisions of our agreements with contractors, the total costs of the project would exceed our original estimates and our financial results would be negatively impacted.
Our customers may require us to secure performance and completion bonds for certain contracts and projects. The market environment for surety companies has become more risk averse. We secure performance and completion bonds for our contracts from these surety companies. To the extent we are unable to obtain bonds, we may not be awarded new contracts. We cannot assure you that we can secure performance and completion bonds when required.
Design, construction or system failures could result in injury to third parties or damage to property. Any losses that exceed claims against our contractors, the performance bonds and our insurance limits at such facilities could result in claims against us. In addition, if there is a customer dispute regarding performance of our services, the customer may decide to delay or withhold payment to us.
We have a limited number of employees and may not be able to manage the increasing demands of our expanding operations. We have a limited number of employees to administer our existing assets, interface with applicable governmental bodies, market our services and plan for the construction and development of our future assets. We may not be able to maximize the value of our water assets because of our limited manpower. We depend significantly on the services of Mark W. Harding, our President and Chief Financial Officer. The loss of Mr. Harding would cause a significant interruption of our operations. The success of our future business development and ability to capitalize on growth opportunities depends on our ability to attract and retain additional experienced and qualified persons to operate and manage our business. State regulations set the training, experience and qualification standards required for our employees to operate specific water and wastewater facilities. Failure to find state-certified and qualified employees to support the operation of our facilities could put us at risk for, among other things, regulatory penalties (including fines and suspension of operations), operational errors at the facilities, improper billing and collection processes, and loss of contracts and revenues. We cannot assure you that we can successfully manage our assets and our growth.
We may be adversely affected by any future decision by the Colorado Public Utilities Commission to regulate us as a public utility. The Colorado Public Utilities Commission (“CPUC”) regulates investor-owned water companies operating for the purpose of supplying water to the public. The CPUC regulates many aspects of public utilities’ operations, including establishing water rates and fees, initiating inspections, enforcement and compliance activities and assisting consumers with complaints. We do not believe we are a public utility under Colorado law. We currently provide services by contract mainly to the District, which supplies the public. Quasi-municipal metropolitan districts, such as the District, are exempt by statute from regulation by the CPUC. However, the CPUC could attempt to regulate us as a public utility. If this were to occur, we might incur significant expense challenging the CPUC’s assertion of jurisdiction, and we may be unsuccessful. In the future, existing regulations may be revised or reinterpreted, and new laws and regulations may be adopted or become applicable to us or our facilities. If we become regulated as a public utility, our ability to generate profits could be limited and we might incur significant costs associated with regulatory compliance.
Conflicts of interest may arise relating to the operation of the District. Our officers and employees constitute a majority of the directors of the District. Pure Cycle, along with our officers and employees and one unrelated individual, own the 40 acres that constitute the District. We have made loans to the District to fund its operations. At August 31, 2013, total principal and interest owed to us by the District was $556,000. Pursuant to our Service Agreement with the District for the provision of water services, the District retains 5% of the revenues from the sale of water to its end-use customers on the Lowry Range. Proceeds from the fee collections will initially be used to repay the District’s obligations to us, but after these loans are repaid, the District is not required to use the funds to benefit Pure Cycle. We have received benefits from our activities undertaken in conjunction with the District, but conflicts may arise between our interests and those of the District, and with our officers who are acting in dual capacities in negotiating contracts to which both we and the District are parties. We expect that the District will expand when more properties are developed and become part of the District, and our officers acting as directors of the District will have fiduciary obligations to those other constituents. There can be no assurance that all conflicts will be resolved in the best interests of Pure Cycle and its shareholders. In addition, other landowners coming into the District will be eligible to vote and to serve as directors of the District. There can be no assurances that our officers and employees will remain as directors of the District or that the actions of a subsequently elected board would not have an adverse impact on our operations.
Water quality standards are subject to regulatory change. We must provide water that meets all federal and state regulatory water quality standards and operate our water and wastewater facilities in accordance with these standards. Future changes in regulations governing the supply of drinking water and treatment of wastewater may have a material adverse impact on our financial results. With respect to service of customers on the Lowry Range, the District’s rates might not be sufficient to cover the cost of compliance with additional or more stringent requirements. If the cost of compliance were to increase, we anticipate that the rates of the nearby water providers that the District uses to establish its rates and charges would increase to reflect these cost increases, thereby allowing the District to increase its rates and charges. However, there can be no assurance that these water providers would raise their rates in an amount that would be sufficient to enable the District (and us) to cover any increased compliance costs.
In October 2009, the Water Quality Control Division of the Colorado Department of Public Health and Environment advised us of proposed changes to the discharge permit for the District’s Coal Creek wastewater reclamation facility. The revised permit requires compliance with effluent ammonia limitations, use of E. coli rather than fecal coliform as an indicator of effluent disinfection efficacy, and a more stringent (lower) effluent chlorine residual limitation. The revised permit requires us to comply with the new criteria by October 2015. Although we anticipate being able to comply with the revised permit, there can be no assurances that we will be able to comply with future requirements or that the cost of such compliance will be covered by the rate structure required by the Rangeview Water Agreements.
Contamination to our water supply may result in disruption in our services and litigation, which could adversely affect our business, operating results and financial condition. Our water supplies are subject to contamination, including contamination from naturally occurring compounds, pollution from man-made sources and intentional sabotage. Our land at Sky Ranch and a portion of the Lowry Range have been leased for oil and gas exploration and development. Such exploration and development could expose us to additional contamination risks. In addition, we handle certain hazardous materials at our water treatment facilities, primarily sodium hypochlorite. Any failure of our operation of the facilities or any contamination of our supplies, including sewage spills, noncompliance with water quality standards, hazardous materials leaks and spills, and similar events could expose us to environmental liabilities, claims and litigation costs. If any of these events occur, we may have to interrupt the use of that water supply until we are able to substitute the supply from another source or treat the contaminated supply. We cannot assure you that we will successfully manage these issues, and failure to do so could have a material adverse effect on our future results of operations.
We may incur significant costs in order to treat the contaminated source through expansion of our current treatment facilities or development of new treatment methods. If we are unable to substitute water supply from an uncontaminated water source, or to adequately treat the contaminated water source in a cost-effective manner, there may be an adverse effect on our revenues, operating results and financial condition. The costs we incur to decontaminate a water source or an underground water system could be significant and could adversely affect our business, operating results and financial condition and may not be recoverable in rates.
We could also be held liable for consequences arising out of human exposure to hazardous substances in our water supplies or other environmental damage. For example, private plaintiffs could assert personal injury or other toxic tort claims arising from the presence of hazardous substances in our drinking water supplies. Although we have not been a party to any environmental or pollution-related lawsuits, such lawsuits have increased in frequency in recent years. If we are subject to an environmental or pollution-related lawsuit, we might incur significant legal costs, and it is uncertain whether we would be able to recover the legal costs from ratepayers or other third parties. Our insurance policies may not cover or provide sufficient coverage for the costs of these claims.
Our business is subject to seasonal fluctuations and weather conditions which could affect demand for our water service and our revenues. We depend on an adequate water supply to meet the present and future demands of our local governmental customers and their end-use customers and to continue our expansion efforts. Conditions beyond our control may interfere with our water supply sources. Drought and overuse may limit the availability of water. These factors might adversely affect our ability to supply water in sufficient quantities to our customers and our revenues and earnings may be adversely affected. Additionally, cool and wet weather, as well as drought restrictions and our customers’ conservation efforts, may reduce consumption demands, also adversely affecting our revenue and earnings. Furthermore, freezing weather may contribute to water transmission interruptions caused by pipe and main breakage. If we experience an interruption in our water supply, it could have a material adverse effect on our financial condition and results of operations. Demand for our water during the warmer months is generally greater than during cooler months due primarily to additional requirements for water in connection with cooling systems, irrigation systems and other outside water use. Throughout the year, and particularly during typically warmer months, demand will vary with temperature and rainfall levels. If temperatures during the typically warmer months are cooler than expected or there is more rainfall than expected, the demand for our water may decrease and adversely affect our revenues.
Sales to the fracking industry could be curtailed or eliminated in the future. Our water sales are highly concentrated with one company providing frack services to the oil and gas industry on and around the Lowry range and our Sky Ranch property. Regulations, fracking technologies, and the success of the wells are conditions that could limit or eliminate our sales to this customer base as well as renewals of our oil and gas leases, if any, in the future. We have no contractual commitment that will ensure these sales will continue in the future.
A failure of the water wells or distribution networks that we own or control could result in losses and damages that may affect our financial condition and reputation. We distribute water through a network of pipelines and store water in storage tanks. A failure of these pipelines or tanks could result in injuries and damage to property for which we may be responsible, in whole or in part. The failure of these pipelines or tanks may also result in the need to shut down some facilities or parts of our water distribution network in order to conduct repairs. Such failures and shutdowns may limit our ability to supply water in sufficient quantities to our customers and to meet the water delivery requirements prescribed by our contracts, which could adversely affect our financial condition, results of operations, cash flow, liquidity and reputation. Any business interruption or other losses might not be covered by insurance policies or be recoverable in rates, and such losses may make it difficult for us to secure insurance in the future at acceptable rates.
Our stock price has been volatile in the past and may decline in the future. Our common stock has experienced significant price and volume fluctuations in the past and may experience significant fluctuations in the future depending upon a number of factors, some of which are beyond our control. Factors that could affect our stock price and trading volume include, among others, the perceived prospects of our business; differences between anticipated and actual operating results; changes in analysts’ recommendations or projections; the commencement and/or results of litigation and other legal proceedings; and future sales of our common stock by significant shareholders, officers and directors. In addition, stock markets in general have experienced extreme price and volume volatility from time to time, which may adversely affect the market price of our common stock for reasons unrelated to our performance.
None.
Corporate Office – We occupy 1,200 square feet at a cost of $1,530, per month, at the address shown on the cover of this Form 10-K. We lease these premises pursuant to a two year operating lease agreement with a third party.
Water Related Assets – In addition to the water rights and adjudicated reservoir sites which are described in Item 1 – Our Water Assets, we also own a 500,000 gallon water tank, a deep water well and pump station, and four miles of water pipeline in Arapahoe County Colorado. Additionally, although owned by the District, we operate and maintain another 500,000 gallon water tank, a deep water well, and pump station, two alluvial wells, the District’s wastewater treatment plant, and water distribution and wastewater collection pipelines that serve customers located at the Lowry Range. These assets are used to provide service to our existing customers.
Land – We own 931 acres of land known as Sky Ranch which is described further in Item 1 – Our Water Assets – Sky Ranch. In addition, we own approximately 16,700 acres of irrigated farm land in the Arkansas River Valley as described in Item 1 – Our Water Assets – Arkansas River Water. A portion of our farm land totaling 1,603 acres of land is currently held for sale.
Other Equipment – We also own various water delivery fixtures located on our farm properties. These items consist mainly of irrigation pumps, irrigation ditches, and irrigation pipelines.
As discussed in a Form 8-K filed on December 19, 2011, on that date we and the District filed a lawsuit against the State of Colorado by and through the Land Board. The complaint was filed with the District Court, City and County of Denver, State of Colorado. We and the District are claiming that the Land Board breached, and will breach, agreements entered into by the Land Board with us and the District in connection with a 1996 settlement agreement. Those agreements include (i) the Amended and Restated Water Lease, dated as of April 4, 1996, between the Land Board and the District (the “Lease”) and (ii) the Service Agreement of the same date between us and the District. The Land Board asserted certain counterclaims in the lawsuit that relate to operational disputes under the Lease. On June 14, 2013, we, the District and the Land Board entered into an Arbitration Agreement pursuant to which the parties have agreed to submit three counterclaims under the Lease to binding arbitration: (i) whether revenues from wastewater services are subject to royalties under the Lease and the appropriate payment for a right-of-way for a wastewater reclamation facility, (ii) whether Export Water royalties are owed on a net or gross proceeds basis, and (iii) if, and/or how water from the four aquifers under the Lowry Range should be blended for sale, as well as any related claims of us and the District for offset, credit or overpayment of previous royalties paid and defenses to the three claims. The counterclaims have been dismissed from the lawsuit without prejudice. An arbitrator has not yet been selected, so the timing of resolution of these claims is unknown. We and the District believe that we have been conducting our operations in accordance with the Lease and are prepared to defend our decisions in the arbitration.
As disclosed in two Form 8-K’s, one filed on February 16, 2012 and one filed on February 29, 2012, HP A&M initiated a lawsuit against us in District Court, City and County of Denver, State of Colorado on February 27, 2012 alleging breaches of representations made in connection with the Arkansas River Agreement. HP A&M claims relate to the issues currently being litigated between us and the Land Board regarding our exclusive right to provide water service to the Land Board’s Lowry Range property. Because the claims alleged by HP A&M relate to the issues being litigated in our lawsuit against the Land Board, the HP A&M suit has been stayed pending resolution of the Land Board suit. We believe the allegations are without merit and intend to defend the lawsuit vigorously.
During the fiscal year ended August 31, 2013, foreclosure proceedings were commenced against 38 of the properties we acquired from HP A&M which are subject to promissory notes defaulted upon by HP A&M and secured by deeds of trust on our land and water rights. As of August 31, 2013, 34 of our properties acquired from HP A&M remain subject to foreclosure proceedings. These properties represent over 40% of our FLCC shares and over 45% of our farm land. The proceedings were filed on various dates from January 9, 2013 through July 3, 2013, with the Public Trustees of Bent, Otero and Prowers Counties in Colorado and involve claims against HP A&M for its failure to pay the notes. Foreclosure proceedings in Colorado take at least nine months to conclude. Foreclosure sales were conducted on three of our properties on August 28, 2013, and on a fourth property on September 4, 2013. PCY Holdings, LLC (“PCY Holdings”), our wholly owned subsidiary, was the successful bidder in the foreclosure sales. Due to statutory protections afforded us as the owner of the properties and our liquidity, we had anticipated concluding these foreclosure proceedings on terms which would not have a material adverse effect on our financial position, results of operations or cash flows. However, on September 16, 2013, HP A&M filed a complaint against PCY Holdings and the Public Trustee for the County of Bent, Colorado. The lawsuit was filed in the District Court, County of Bent, Colorado. HP A&M is seeking (i) a declaratory judgment that it is entitled to redeem the four properties from the foreclosure sales by paying the amount of the outstanding debt, plus fees, which is the amount we bid in the sales, and (ii) preliminary and permanent injunctions against the Public Trustee preventing the Public Trustee from issuing confirmation deeds for the foreclosure sales to PCY Holdings or anyone other than HP A&M. On November 20, 2013, the complaint was dismissed with prejudice, and judgment was entered in favor of the Public Trustee and PCY Holdings. The District Court ruled that “High Plains’ Complaint and Motion are baseless, without statutory authority, and are an attempt to obstruct the proper function of the office of the Public Trustee of Bent County, and PCY Holdings relative to the foreclosures of the four Subject Farms”. Further the District Court ruled “that High Plains’ Motion and its claims in its Verified Complaint are frivolous and groundless, and awards the Public Trustee of Bent County and PCY Holdings their attorneys’ fees and costs incurred in connection with this matter.”
HP A&M has 49 days from the date of the judgment in which to file an appeal. If HP A&M appeals this judgment and wins on appeal, we could lose these four properties, subject to our remedies under the Arkansas River Agreement. We intend to vigorously defend any appeal of this ruling. The Arkansas River agreement requires HP A&M to acquire any properties subject to foreclosure on our behalf. Therefore, our remedies against HP A&M for the note defaults include the right to damages for any loss of these four properties.
None.
(a) Market Information
Our common stock is traded on the NASDAQ Capital Market under the symbol “PCYO”. The high and low sales prices of our common stock, by quarter, for the fiscal years ended August 31, 2013 and 2012 are presented below:
| | | | | | | | | | | | | | | | | |
| Fiscal 2013 quarters ended: | | August 31 | | | May 31 | | February 28 | | November 30 | |
| Market price of common stock | | | | | | | | | | | | |
| High | | $ | 6.72 | | | $ | 7.32 | | | $ | 4.10 | | | $ | 2.78 | |
| Low | | $ | 5.00 | | | $ | 3.87 | | | $ | 2.31 | | | $ | 1.87 | |
| | | | | | | | | | | | | | | | | |
| Fiscal 2012 quarters ended: | | August 31 | | | May 31 | | | February 28 | | November 30 | |
| Market price of common stock | | | | | | | | | | | | | | | | |
| High | | $ | 2.51 | | | $ | 2.90 | | | $ | 3.25 | | | $ | 3.00 | |
| Low | | $ | 1.90 | | | $ | 2.03 | | | $ | 1.65 | | | $ | 1.70 | |
(b) Holders
On November 20, 2013, there were 1,097 holders of record of our common stock.
(c) Dividends
We have never paid any dividends on our common stock and expect for the foreseeable future to retain all of our earnings from operations, if any, for use in expanding and developing our business. Any future decision as to the payment of dividends will be at the discretion of our board of directors and will depend upon our earnings, financial position, capital requirements, plans for expansion and such other factors as our board of directors deems relevant. The terms of our Series B Preferred Stock prohibit payment of dividends on common stock unless all dividends accrued on the Series B Preferred Stock have been paid and require dividends to be paid on the Series B Preferred Stock if proceeds from the sale of Export Water Rights exceed $36,026,232. For further discussion see Note 8 – Shareholder’s Equity to the accompanying financial statements.
(d) Securities Authorized For Issuance Under Equity Compensation Plans
| | | | | | | | | | | | | |
| Table D - Securities Authorized for Issuance Under Equity Compensation Plans | |
| | | | | | | | | Number of securities | |
| | | | | | | | | remaining available for future | |
| | | Number of securities to | | | Weighted-average exercise | | | issuance under equity | |
| | | be issued upon exercise of | | | price of outstanding | | | compensation plans | |
| | | outstanding options, | | | options, warrants and | | | (excluding securities reflected | |
| Plan category | | warrants and rights | | | rights | | | in column (a)) | |
| | | (a) | | | (b) | | | (c) | |
| Equity compensation plans: | | | | | | | | | |
| Approved by security holders | | | 347,500 | | | $ | 5.63 | | | | 1,218,311 | |
Not approved by security holders | | | — | | | | — | | | | — | |
| Total | | | 347,500 | | | $ | 5.63 | | | | 1,218,311 | |
(e) Performance Graph 1
This graph compares the cumulative total return of our common stock for the last five fiscal years with the cumulative total return for the same period of the S&P 500 Index and a peer group index2. The graph assumes the investment of $100 in common stock in each of the indices as of the market close on August 31 and reinvestment of all dividends.
| | | | | | | | | | | | | | | | |
| Cumulative Returns For the fiscal years ended August 31, | |
| | | 2013 | | | 2012 | | | 2011 | | | 2010 | | | 2009 | |
| Pure Cycle Corporation | | $ | 86.09 | | | $ | 33.11 | | | $ | 49.01 | | | $ | 49.83 | | | $ | 53.81 | |
| S&P 500 | | $ | 142.35 | | | $ | 119.92 | | | $ | 101.63 | | | $ | 85.76 | | | $ | 81.75 | |
| Peer Group | | $ | 160.97 | | | $ | 134.27 | | | $ | 117.94 | | | $ | 104.42 | | | $ | 93.18 | |
COMPARISON OF 5 YEAR CUMULATIVE TOTAL RETURN*Among Pure Cycle Corporation, the S&P 500 Index, and a Peer Group
*$100 invested on 8/31/08 in stock or index, including reinvestment of dividends.
Fiscal year ending August 31.
Copyright© 2013 S&P, a division of The McGraw-Hill Companies Inc. All rights reserved.
| | |
| | |
| 1. | This performance graph is not “soliciting material,” is not deemed “filed” with the Commission and is not to be incorporated by reference in any of our filings under the Securities Act of 1933, as amended, or the Securities Exchange Act of 1934, as amended, whether made before or after the date hereof and irrespective of any general incorporation language in any such filing. |
| | |
| 2. | The Peer Group consists of the following companies that have been selected on the basis of industry focus or industry leadership: American States Water Company, Aqua America, Inc., Artesian Resources Corp., California Water Service Group, Connecticut Water Service, Inc., Middlesex Water Company, Pennichuck Corp., SJW Corp., and The York Water Company. |
| (f) | Recent Sales of Unregistered Securities; Use of Proceeds From Registered Securities |
None.
| (g) | Purchase of Equity Securities By the Issuer and Affiliated Purchasers |
None.
| | | | | | | | | | | | | | | | |
| Table E - Selected Financial Data | |
| In thousands (except per share data) | | For the Fiscal Years Ended August 31, | |
| | | 2013 | | | 2012 | | | 2011 | | | 2010 | | | 2009 | |
| Summary Statement of Operations items: | | | | | | | | | | | | | | | |
| Total revenues | | $ | 1,857.5 | | | $ | 284.4 | | | $ | 282.1 | | | $ | 264.1 | | | $ | 260.2 | |
| Net loss | | $ | (4,150.4 | ) | | $ | (17,418.7 | ) | | $ | (6,016.2 | ) | | $ | (5,391.3 | ) | | $ | (5,728.1 | ) |
| Basic and diluted loss per share | | $ | (0.17 | ) | | $ | (0.72 | ) | | $ | (0.26 | ) | | $ | (0.27 | ) | | $ | (0.28 | ) |
| Weighted average shares outstanding | | | 24,038 | | | | 24,038 | | | | 23,169 | | | | 20,207 | | | | 20,207 | |
| | | | | | | | | | | | | | | | | | | | | |
| | | As of August 31, | |
| Summary Balance Sheet Information: | | | 2013 | | | | 2012 | | | | 2011 | | | | 2010 | | | | 2009 | |
| Current assets | | $ | 9,900.0 | | | $ | 7,661.8 | | | $ | 5,065.6 | | | $ | 1,819.6 | | | $ | 3,990.4 | |
| Total assets | | $ | 108,618.3 | | | $ | 111,582.0 | | | $ | 116,122.7 | | | $ | 106,377.8 | | | $ | 108,091.1 | |
| Current liabilities | | $ | 5,402.3 | | | $ | 6,254.8 | | | $ | 658.3 | | | $ | 171.3 | | | $ | 138.1 | |
| Long term liabilities | | $ | 65,443.5 | | | $ | 75,209.5 | | | $ | 68,174.0 | | | $ | 63,746.5 | | | $ | 60,183.8 | |
| Total liabilities | | $ | 70,845.8 | | | $ | 81,464.3 | | | $ | 68,832.3 | | | $ | 63,917.8 | | | $ | 60,321.9 | |
| Equity | | $ | 37,772.5 | | | $ | 30,117.8 | | | $ | 47,290.3 | | | $ | 42,460.0 | | | $ | 47,769.2 | |
The following items had a significant impact on our operations:
| | ● | In fiscal 2013 in order to protect our farm assets we acquired approximately $7 million of the $9.6 million in HP A&M notes. |
| | | In fiscal 2013 we sold 1,500,000 unregistered shares of Pure Cycle common stock owned by HP A&M for $2.35 per share, yielding approximately $3.5 million. |
| | | In fiscal 2012 the Paradise Water Supply asset was deemed fully impaired and the entire asset value of $5.5 million was written off and recorded in the accompanying financial statements. Additionally, we recorded an impairment of $6.5 million on land and water rights held for sale. See further discussion in Note 4 – Water Assets in the accompanying financial statements. |
| | | In fiscal 2013, 2012, 2011, 2010 and 2009, respectively, we imputed $3.3 million, $3.5 million, $3.8 million, $3.6 million and $3.7 million of interest related to the Tap Participation Fee payable to HP A&M. As described below, this represents the difference between the net present value and the estimated realizable value of the Tap Participation Fee, which is being charged to expense using the effective interest method over the estimated development period utilized in the valuation of the Tap Participation Fee. The Tap Participation Fee is payable when we sell water taps and receive funds from such water tap sales or other dispositions of property purchased from HP A&M. |
| | | In fiscal 2011, we acquired 931 acres of land known as Sky Ranch for $7.0 million. |
| | | In fiscal 2010, we sold a total of 3.8 million shares of common stock for a total of $10.7 million, which was used to acquire the Sky Ranch property and is being used for working capital. |
| | | In fiscal 2009, we recognized gains on the sale of non-irrigated land totaling $59,700. |
Overview
The discussion and analysis below includes certain forward-looking statements that are subject to risks, uncertainties and other factors, as described in “Risk Factors” and elsewhere in this Annual Report on Form 10-K, that could cause our actual growth, results of operations, performance, financial position and business prospects and opportunities for this fiscal year and the periods that follow to differ materially from those expressed in, or implied by, those forward-looking statements. Readers are cautioned that forward-looking statements contained in this Form 10-K should be read in conjunction with our disclosure under the heading: “SAFE HARBOR STATEMENT UNDER THE UNITED STATES PRIVATE SECURITIES LITIGATION REFORM ACT OF 1995” on page 4.
The following Management’s Discussion and Analysis (“MD&A”) is intended to help the reader understand the results of operations and our financial condition and should be read in conjunction with the accompanying financial statements and the notes thereto included in Part II, Item 8 of this Annual Report on Form 10-K. The following sections focus on the key indicators reviewed by management in evaluating our financial condition and operating performance, including the following:
| | | Revenue generated from providing water and wastewater services and our farming operations; |
| | | Expenses associated with developing our water and land assets; and |
| | | Cash available to continue development of our water rights and service agreements. |
Our MD&A section includes the following items:
Our Business – a general description of our business, our services and our business strategy.
Critical Accounting Policies and Estimates – a discussion of our critical accounting policies that require critical judgments, assumptions and estimates.
Results of Operations – an analysis of our results of operations for the three fiscal years presented in our financial statements. We present our discussion in the MD&A in conjunction with the accompanying Financial Statements.
Liquidity, Capital Resources and Financial Position – an analysis of our cash position and cash flows, as well as a discussion of our financing arrangements.
Our Business
Pure Cycle Corporation (“we”, “us” or “our”) is an investor-owned Colorado corporation that (i) provides wholesale water and wastewater services to end-use customers of governmental entities and to commercial and industrial customers and (ii) manages land and water assets for farming.
Wholesale Water and Wastewater - These services include water production, storage, treatment, bulk transmission to retail distribution systems, wastewater collection and treatment, irrigation water treatment and transmission, construction management, billing and collection and emergency response.
We are a vertically integrated wholesale water and wastewater provider, which means we own or control substantially all assets necessary to provide wholesale water and wastewater services to our customers. This includes owning (i) water rights which we use to provide domestic, irrigation, and industrial water to our wholesale customers (we own surface water, groundwater, reclaimed water rights and storage rights), (ii) infrastructure (such as wells, diversion structures, pipelines, reservoirs and treatment facilities) required to withdraw, treat, store and deliver water, (iii) infrastructure required to collect, treat, store and reuse wastewater, and (iv) infrastructure required to treat and deliver reclaimed water for irrigation use.
We currently provide wholesale water service predominately to two local governmental entity customers. Our largest customer is the Rangeview Metropolitan District (the “District”), a quasi-municipal political subdivision of the State of Colorado, which is described further below. We provide service to the District and its end-use customers pursuant to “The Rangeview Water Agreements” (defined below) between us and the District for the provision of wholesale water service to the District for use in the District’s service area. Through our governmental entity wholesale customers, we serve 258 Single Family Equivalent (“SFE”) (as defined below) water connections and 157 SFE wastewater connections located in southeastern metropolitan Denver.
We plan to utilize our significant water assets along with our adjudicated reservoir sites to provide wholesale water and wastewater services to local governmental entities which in turn will provide residential/commercial water and wastewater services to communities along the eastern slope of Colorado in the area extending essentially from Fort Collins on the north to Colorado Springs on the south, which is generally referred to as the “Front Range.” Principally we target the “I-70 corridor,” which is located east of downtown Denver and south of the Denver International Airport. This area is predominately undeveloped and is expected to experience substantial growth over the next 30 years.
Agricultural Operations and Leasing- Beginning August 3, 2012, we assumed management of our farm operations and all associated income and expenses. Beginning September 1, 2012, we began tracking and reporting our farm operations as a separate business segment to reflect management’s analysis, investment decision, and operating performance for this business segment. Currently, approximately 90% of our farm operations are managed through cash lease arrangements with local area farmers whereby we charge a fixed fee, billed semi-annually in March and November, to lease our land and the water for agricultural purposes to tenant farmers. We have a small number of crop share leases, pursuant to which we and the tenant farmer jointly share in the gross revenues generated from the crops grown under a 75% farmer, 25% landlord participation. The majority of crops grown on our farms are alfalfa, with a number of acres also planted in corn, sorghum, and wheat. We will continue to review and evaluate ways to enhance the performance of our approximately 16,700 acres of farm land through relationships with area farmers.
We also own 931 acres of land along the I-70 corridor east of Denver, Colorado. We are currently leasing this land to an area farmer until such time as the property can be developed.
These land interests are described in the Arkansas River Water and Land and Sky Ranch sections of Note 4 - Water Assets to the 2013 Annual Report.
Critical Accounting Policies and Use of Estimates
The preparation of financial statements in conformity with accounting principles generally accepted in the United States of America (“GAAP”) requires management to make estimates and assumptions about future events that affect the amounts reported in the financial statements and accompanying notes. Future events and their effects cannot be determined with absolute certainty. Therefore, the determination of estimates requires the exercise of judgment. Actual results inevitably will differ from those estimates, and such differences may be material to the financial statements.
The most significant accounting estimates inherent in the preparation of our financial statements include estimates associated with the timing of revenue recognition, the impairment of water assets and other long-lived assets, valuation of the Tap Participation Fee, fair value estimates and share-based compensation. Below is a summary of these critical accounting policies.
Revenue Recognition
Our revenues consist mainly of tap fees, construction fees, monthly service fees, and beginning in fiscal 2013, farm operations. As further described in Note 2 – Summary of Significant Accounting Policies to the accompanying financial statements, proceeds from tap sales and construction fees are deferred upon receipt and recognized in income based on whether we own or do not own the facilities constructed with the proceeds. We recognize tap fees derived from agreements for which we construct infrastructure owned by others as revenue, along with the associated costs of construction, pursuant to the percentage-of-completion method. The percentage-of-completion method requires management to estimate the percent of work that is completed on a particular project, which could change materially throughout the duration of the construction period and result in significant fluctuations in revenue recognized during the reporting periods throughout the construction process. We did not recognize any revenues pursuant to the percentage-of-completion method during the fiscal years ended August 31, 2013, 2012 or 2011.
Tap and construction fees derived from agreements for which we own the infrastructure are recognized as revenue ratably over the estimated service life of the assets constructed with said fees. Although the cash will be received up-front and most construction will be completed within one year of receipt of the proceeds, revenue recognition may occur over 30 years or more. Management is required to estimate the service life, and currently the service life is based on the estimated useful accounting life of the assets constructed with the tap fees. The useful accounting life of the asset is based on management’s estimation of an accounting based useful life and may not have any correlation to the actual life of the asset or the actual service life of the tap. This is deemed a reasonable recognition life of the revenues because the depreciation of the assets constructed generating those revenues will therefore be matched with the revenues.
Monthly water usage fees and monthly wastewater service fees are recognized in income each month as earned.
Pursuant to the O&G Lease, we received up-front payments which are recognized as other income on a straight-line basis over three years (the initial term of the O&G Lease).
Historically, we have leased our Arkansas River land and water to tenant farmers under a cash lease model. Pursuant to the Property Management Agreement, HP A&M was to receive the income from the farm leases until 2014. As a result of HP A&M’s default of certain obligations, we terminated the Property Management Agreement. Effective as of August 3, 2012 we are managing the farm operations and we are entitled to receive all income from such operations. Currently we lease our farms to local area farmers on both cash and crop share lease basis. Our cash lease farmers are charged a fixed fee, billed semi-annually in March and November. During the November billing cycle our cash lease billings include either a discount or a premium adjustment based on actual water deliveries by the FLCC. Our crop share lease fees are based on actual crop yields and are received upon the sale of the crops. All fees are estimated and recognized ratably on a monthly basis.
Impairment of Water Assets and Other Long-Lived Assets
We review our long-lived assets for impairment whenever management believes events or changes in circumstances indicate that the carrying amount of an asset may not be recoverable. We measure recoverability of assets to be held and used by a comparison of the carrying amount of an asset to estimated future undiscounted net cash flows we expect to be generated by the eventual use of the asset. If such assets are considered to be impaired and therefore the costs of the assets deemed to be unrecoverable, the impairment to be recognized would be the amount by which the carrying amount of the assets exceeds the estimated fair value of the assets.
Our water assets will be utilized in the provision of water services which inevitably will encompass many housing and economic cycles. Our service capacities are quantitatively estimated based on an average single family home utilizing .4 acre feet of water per year. Our water supplies are legally decreed to us through the water court. The water court decree allocates a specific amount of water (subject to continued beneficial use) which historically has not changed. Thus, individual housing and economic cycles typically do not have an impact on the number of connections we can serve with our supplies or the amount of water legally decreed to us relating to these supplies.
We report assets to be disposed of at the lower of the carrying amount or fair value less costs to sell.
Our Front Range and Arkansas River Water Rights – We determine the undiscounted cash flows for our Denver based assets and the Arkansas River assets by estimating tap sales to potential new developments in our service area and along the Front Range, using estimated future tap fees less estimated costs to provide water services, over an estimated development period. Actual new home development in our service area and the Front Range, actual future tap fees, and actual future operating costs, inevitably will vary significantly from our estimates, which could have a material impact on our financial statements as well as our results of operations. We performed an impairment analysis as of August 31, 2011, which we reviewed as of August 31, 2013, and determined there were no material changes and that our Denver based assets and our Arkansas River assets are not impaired and their costs are deemed recoverable. Our impairment analysis is based on development occurring within areas in which we have service agreements (e.g. Sky Ranch and the Lowry Range) as well as in surrounding areas, including the Front Range and the I-70 corridor. We estimate that we have the ability to provide water service to 180,000 SFE’s using our combined Rangeview Water Supply, Sky Ranch water and Arkansas River water assets which have a carrying value of $88.5 million as of August 31, 2013. Based on the carrying value of our water rights, the long term and uncertain nature of any development plans, current tap fees of $22,500 and estimated gross margins, we estimate that we would need to add 8,300 new water connections (requiring 5.7% of our portfolio) to generate net revenues sufficient to recover the costs of our Rangeview Water Supply and Arkansas River water assets. If tap fees increase 5%, we would need to add 7,900 new water taps (requiring 5.4% of our portfolio) to recover the costs of our Rangeview Water Supply and Arkansas River water assets. If tap fees decrease 5%, we would need to add 8,700 new water taps (requiring 5.9% of our portfolio) to recover the costs of our Rangeview Water Supply and Arkansas River water assets.
Although changes in the housing market throughout the Front Range have delayed our estimated tap sale projections, these changes do not alter our water ownership, nor our service obligations to existing properties or the number of SFE’s we can service.
We have contracts to sell farms totaling 1,603 acres along with 3,397 FLCC shares associated with the land.
Our Paradise Water Supply – Every six years the Paradise Water Supply is subject to a finding of reasonable diligence review by the water court and the State Engineer. For a favorable finding we must demonstrate that we are diligently pursuing the development of the water rights. If we do not receive a favorable finding of reasonable diligence, our right to the Paradise Water Supply would be lost and we would be required to impair the Paradise Water Supply asset. The most recent diligence review was started in our fiscal 2005 and was completed in 2008, but not without objectors and not without us having to agree to certain stipulations to remove the objections. In order to continue to maintain the Paradise water right, by 2014 we must (i) select an alternative reservoir site; (ii) file an application in water court to change the place of storage; (iii) identify specific end users and place(s) of use of the water; and (iv) identify specific source(s) of the water rights for use. We do not intend to spend the resources needed to find an alternative reservoir site without a specific use for the water. We have been unable to find potential customers for this water and cannot be certain a customer will commit to use the water within the next two years. Since we do not have a customer that will commit to use the water and we will not commit the resources necessary to move the reservoir site without a customer, we expect to lose the conditional water rights. Accordingly, we have deemed the Paradise Water Supply to be fully impaired and an impairment of $5.5 million was recorded in the accompanying fiscal 2012 financial statements. We are currently working on options to dispose of our Paradise Water Supply asset.
Tap Participation Fee
The $59.8 million Tap Participation Fee liability at August 31, 2013, represents the estimated discounted fair value of the Company’s obligation to pay HP A&M 20% of the Company’s gross proceeds, or the equivalent thereof, from the future sale of 17,194 water taps by the Company.
As partial consideration for the purchase of our farms and related water, we agreed to pay HP A&M 10% of the tap fees we receive from the next 40,000 water taps we sell from and after the date of the Arkansas River Agreement. The TPF is payable only when we sell water taps and receive funds from such water tap sales from any of our properties as well as any sale of water rights we had purchased from HP A&M. Payment of the TPF may be accelerated in the event of a merger, reorganization, sale of substantially all assets, or similar transactions and in the event of bankruptcy and insolvency events. The TPF liability is valued by estimating new home development in our service area over an estimated development period. This was done by utilizing third party historical and projected housing and population growth data for the Denver metropolitan area applied to an estimated development pattern supported by historical development patterns of certain master planned communities in the Denver metropolitan area. This development pattern was then applied to projected future water tap fees determined by using historical water tap fee trends. Actual new home development in our service area and actual future tap fees inevitably will vary significantly from our estimates, which could have a material impact on our financial statements as well as our results of operations. The difference between the net present value and the estimated realizable value will be imputed as interest expense using the effective interest method over the estimated development period utilized in the valuation of the TPF. See further discussion in the “Obligations Payable by HP A&M, Now in Default” section below.
An important component in our estimate of the value of the TPF is that water tap fees will continue to increase in the coming years. Tap fees are market based and increases in tap fees reflect, among other things, the increasing costs to acquire and develop new water supplies. Tap fees thus are partially indicative of the increasing value of our water assets. We continue to assess the value of the TPF liability and update our valuation analysis whenever events or circumstances indicate the assumptions used to estimate the value of the liability have changed materially. We updated the estimated discounted cash flow analysis as of August 31, 2013, as described in more detail below.
Pursuant to the Arkansas River Agreement, effective as of September 1, 2011, HP A&M elected to increase the TPF percentage from 10% to 20% and take a corresponding 50% reduction in the number of taps subject to the TPF. In addition, the initial term of the Property Management Agreement with HP A&M expired on August 31, 2011. During the extended term of the Property Management Agreement, we were permitted to allocate 26.9% of the Net Revenues (defined as all lease and related income received from the farms less employee expenses, direct expenses for managing the leases and a reasonable overhead allocation) paid to HP A&M against the TPF. As a result of HP A&M’s default, on August 3, 2012 we terminated the Property Management Agreement and stopped allocating 26.9% of the Net Revenues to the TPF.
During the 2012 fiscal year, we allocated $189,700 to the TPF liability and to additional paid in capital (due to HP A&M being deemed a related party as of fiscal 2012 year-end). This is the equivalent of 41 water taps.
During the 2013 fiscal year we foreclosed on three farms and one FLCC certificate representing water rights only. Additionally we cured one farm in foreclosure. As a result of these foreclosures, in accordance with our remedies pursuant to our agreement with HP A&M, we exercised our right to reduce the TPF. We reduced the number of taps subject to the TPF by 2,233 taps, and the discounted present value of the TPF by a total of approximately $11.7 million.
As a result of the events described above, we revalued the TPF liability as of August 31, 2013. The updated valuation and the events described above resulted in the following:
| | | Our obligation to pay HP A&M 20% of the gross proceeds, or the equivalent thereof, from the sale of the next 19,468 water taps as of September 1, 2011, became an obligation to pay 20% of the gross proceeds, or the equivalent thereof, from the sale of the next 17,194 water taps. |
| | | The total undiscounted estimated payments to HP A&M for the TPF decreased $17.9 million from the previous valuation completed in fiscal 2012. The total estimated payments were then discounted to the current valuation date and the difference between the amount reflected on the Company’s balance sheet and the total estimated payments is imputed as interest expense over the estimated development life using the effective interest method. The imputed effective interest rate remained 5.3% and the amount of interest imputed was $3.3 million for fiscal 2013. |
As of August 31, 2013 there were 17,194 taps subject to the TPF and we revalued the TPF liability resulting in a remaining discounted present value liability of $59.8 million. $26.1 million of interest has been imputed since the acquisition date recorded using the effective interest method. Subsequent to our fiscal year end an additional three farms and 1,832 FLCC shares have been obtained through the foreclosure proceedings resulting in a further reduction of the number of taps subject to the TPF by 3,364 taps and a corresponding reduction to the TPF payable of $11.9 million, leaving 13,830 taps subject to the TPF.
Fair Value Estimates
Fair value is defined as the price that would be received to sell an asset or paid to transfer a liability in an orderly transaction between market participants at the measurement date in the principal or most advantageous market. We generally use a fair value hierarchy that has three levels of inputs, both observable and unobservable, with use of the lowest possible level of input to determine fair value. See Note 3 – Fair Value Measurements to the accompanying financial statements. As discussed below, we used other methodologies to determine the fair value of the related party receivable from HP A&M, certain notes payable issued by us in exchange for HP A&M notes, and the receivable for unpaid balances owed to HP A&M for farm lease payments that are now payable to us.
Obligations Payable by HP A&M, Now in Default – Approximately 60 of the 80 properties we acquired from HP A&M were subject to outstanding promissory notes payable to third parties. These promissory notes are secured by deeds of trust on our properties and water rights, as well as mineral interests, up to 25% of which are owned by us and up to 75% of which are currently owned by HP A&M. As of fiscal year end 2012 and since that date, HP A&M has defaulted on all of the notes. At the time of default, HP A&M owed approximately $9.6 million of principal and accrued interest secured by approximately 14,000 acres of farm land and 16,882 FLCC shares representing water rights owned by us.
On July 2, 2012, we formally notified HP A&M that its failure to pay the promissory notes constituted an Event of Default under the Seller Pledge Agreement and a default of a material covenant under the Arkansas River Agreement and that unless such defaults were cured within thirty (30) days, the Property Management Agreement would be terminated and we would proceed to exercise certain rights and remedies under the Arkansas River Agreement, the Seller Pledge Agreement, and the Property Management Agreement to protect our assets. Our remedies at law and under the Arkansas River Agreement and related agreements include, but are not limited to, the right to (i) terminate the Property Management Agreement; (ii) foreclose on the Pledged Shares; (iii) reduce the Tap Participation Fee; and (iv) recover damages caused by the defaults, including certain costs and attorneys’ fees. Pursuant to these remedies we have taken the following actions:
(i) On August 3, 2012, we formally terminated the Property Management Agreement. See further discussion in Farm Accounts Receivable and Future Farm Income below.
(ii) During September 2012 we sold the Pledged Shares in accordance with the Seller Pledge Agreement yielding approximately $3.4 million to us.
(iii) As described in Note 7 – Long Term Debt and Operating Lease, to the accompanying consolidated financial statements, to protect our land and water interests, upon a default by HP A&M, at our sole discretion, we may take any measure we deem appropriate to remedy all of the defaults. If we do not protect our interest relating to the defaults, we may lose the properties and water rights securing the defaulted notes. As of August 31, 2013, we have acquired approximately $7 million of the $9.6 million of promissory notes that are payable by HP A&M to third parties. These promissory notes were acquired with cash payments of approximately $1.5 million and the issuance of notes by us. The majority of the notes we issued have a five-year term, bear interest at an annual rate of 5% and require semi-annual payments with a straight-line amortization schedule. The carrying value of the notes payable approximate the fair value as the rates are comparable to market rates. We did not assume any of these promissory notes and are not legally responsible for making any of the required payments under these notes. This responsibility remains solely with HP A&M.
During the 2013 fiscal year four farms and one FLCC certificate representing water only went through foreclosure proceedings. In accordance with our remedies pursuant to our agreement with HP A&M, we exercised our right to reduce the TPF as a result of these foreclosures. We reduced the number of taps by 2,233 or a total of approximately $10.3 million. Subsequent to our fiscal year end an additional three farms and 1,832 FLCC shares have been through the foreclosure proceedings resulting in a further reduction of 3,364 taps.
(iv) We have the right to collect from HP A&M any amounts we spend to protect our interest against the defaulted notes, including the new notes we issue to the holders in exchange for the HP A&M notes. Among other remedies we have the right to collect from HP A&M all costs and expenses, including reasonable attorneys’ fees, we incur to protect our interest against the defaults and in protecting our rights and title to the farm property and water rights securing the notes. The following table details the balance in HP default receivable as of August 31, 2013 and August 31, 2012.
| | | | | | | | | |
| | | August 31, 2013 | | | August 31, 2012 | |
| HP A&M receivable | | | | | | |
| Mortgage default (1) | | $ | 9,643,550 | | | $ | 9,550,222 | |
Attorneys’ fees, filing fees, & other costs (2) | | | 426,606 | | | | | |
| | | | 10,070,156 | | | | 9,550,222 | |
| Pledged share sale | | | (3,415,000 | ) | | | | |
| HP A&M receivable | | $ | 6,655,156 | | | $ | 9,550,222 | |
| 1) | Includes default interest paid at the time we acquired the notes. In addition to the interest included above interest continues to accrue at a default interest rate of 10% per annum. As of August 31, 2013 the balance of default interest not accrued above was approximately $751,300. Payment of the default interest remains the sole responsibility of HP A&M. |
| 2) | In addition to the above we have expensed $72,557 in attorney’s fees related to the defaults during 2012 that have not been accrued. |
Farm Accounts Receivable and Farm Operations– The Property Management Agreement was terminated prior to the end of fiscal 2012 and all future farm income will be paid directly to us instead of HP A&M. Most of the farm leases are “cash only” leases and a few are “crop share” leases. A “crop share” lease entitles us to a share of the sales from the crop sales of the farmer. Most of the farm leases expire on December 31, 2014, while the remaining leases have a variety of expiration dates. The farm “cash only” lease payments are generally billed twice a year in March and November. The unpaid balances from the March billing (performed by HP A&M) were recorded on our books as accounts receivable (less an allowance for uncollectible accounts) of $56,500. We may terminate the leases by written notice on or before July 15th of the year prior to the termination. As of July 15, 2013, none of the leases were terminated. Under the “cash only” lease agreements, the annual lease payment can be reduced if the number of annual runs of irrigation water delivered to the farm as reported by the Fort Lyon Canal Company fall below 20 runs. If the annual runs of irrigation are less than 20, the annual lease rate will be reduced by $2 per acre per run less than the 20 runs with a maximum annual discount of $10 per acre. During calendar year 2013, the lessee farmers only received 11 runs. Accordingly, the maximum discount of $10 per acre will be applied to the second billing in November 2013. This discount which will be deducted with the November 2013 billing is reflected in the schedule below. All future expected cash billings are reflected at their full value. The “crop share” agreements are generally 1 year agreements and the payment cannot be calculated until after the farmers sell their crops. Accordingly any future payments from “crop share” leases are not included in the future farm lease billings schedule below.
The future scheduled billing for the farm income is presented in Table F below:
| | | | | | | | | | | | | |
| Table F - Contractual Farm lease income receivable | |
| | | | | | Payments due to Pure Cycle by period | |
| | | | | | | | | | |
| | | Total | | | Less than 1 year | | | 1-3 years | |
| Contractual lease income receivable | | | | | | | | | |
| Farm leases receivable | | $ | 1,350,400 | | | $ | 895,800 | | | $ | 454,600 | |
| Total | | $ | 1,350,400 | | | $ | 895,800 | | | $ | 454,600 | |
Expenses associated with the farm operations are expected to include management salaries, maintenance, property taxes and FLCC assessments.
Share-based compensation
We estimate the fair value of share-based payment awards made to key employees and directors on the date of grant using the Black-Scholes option-pricing model. We then expense the fair value over the vesting period of the grant using a straight-line expense model. The fair value of share-based payments requires management to estimate/calculate various inputs such as the volatility of the underlying stock, the expected dividend rate, the estimated forfeiture rate and an estimated life of each option. We do not expect any forfeiture of option grants; therefore the compensation expense has not been reduced for estimated forfeitures. These assumptions are based on historical trends and estimated future actions of option holders and may not be indicative of actual events which may have a material impact on our financial statements. For further details on share based compensation expense, see Note 8 – Shareholders’ Equity to the accompanying financial statements.
Results of operations
Executive Summary
The results of our operations for the fiscal years ended August 31, 2013, 2012 and 2011 were as follows:
| | | | | | | | | | | | | | | | | | | | | | | | | | | |
| Table G - Summary Results of Operations | |
| | | | | | | | | | | | Change | |
| | | Fiscal Years Ended August 31, | | | 2013-2012 | | | 2012-2011 | |
| | | 2013 | | | 2012 | | | 2011 | | | $ | | | % | | $ | | | % |
| Millions of gallons of water delivered | | | 69.2 | | | | 34.2 | | | | 34.5 | | | | 35.0 | | | 102 | % | | | (0.3 | ) | | -1 | % |
| Water revenues generated | | $ | 502,700 | | | $ | 182,800 | | | $ | 157,500 | | | $ | 319,900 | | | 175 | % | | $ | 25,300 | | | 16 | % |
| Water delivery operating costs incurred | | | | | | | | | | | | | | | | | | | | | | | | | | |
| (excluding depreciation and depletion) | | $ | 188,300 | | | $ | 78,100 | | | $ | 51,900 | | | $ | 110,200 | | | 141 | % | | $ | 26,200 | | | 50 | % |
| Water delivery gross margin % | | | 63 | % | | | 57 | % | | | 67 | % | | | | | | | | | | | | | | |
| | | | | | | | | | | | | | | | | | | | | | | | | | | |
| Wastewater treatment revenues | | $ | 41,700 | | | $ | 45,800 | | | $ | 68,800 | | | $ | (4,100 | ) | | -9 | % | | $ | (23,000 | ) | | -33 | % |
| Wastewater treatment operating costs incurred | | $ | 17,000 | | | $ | 19,300 | | | $ | 19,200 | | | $ | (2,300 | ) | | -12 | % | | $ | 100 | | | 1 | % |
| Wastewater treatment gross margin % | | | 59 | % | | | 58 | % | | | 72 | % | | | | | | | | | | | | | | |
| | | | | | | | | | | | | | | | | | | | | | | | | | | |
| Farm operations | | $ | 1,241,900 | | | $ | — | | | $ | — | | | $ | 1,241,900 | | | 100 | % | | $ | — | | | 0 | % |
| Farm operations operating costs incurred | | $ | 96,300 | | | $ | — | | | $ | — | | | $ | 96,300 | | | 100 | % | | $ | — | | | 0 | % |
| Farm operations gross margin % | | | 92 | % | | | | | | | | | | | | | | | | | | | | | | |
| | | | | | | | | | | | | | | | | | | | | | | | | | | |
| General and administrative expenses | | $ | 2,333,100 | | | $ | 2,374,100 | | | $ | 2,212,000 | | | $ | (41,000 | ) | | -2 | % | | $ | 162,100 | | | 7 | % |
| | | | | | | | | | | | | | | | | | | | | | | | | | | |
| Net losses | | $ | 4,150,400 | | | $ | 17,418,700 | | | $ | 6,016,200 | | | $ | (13,268,300 | ) | | -76 | % | | $ | 11,402,500 | | | 190 | % |
Changes in Revenues
We generate water revenues from (i) one time water and wastewater tap fees, (ii) construction fees, (iii) monthly wholesale water usage fees and wastewater service fees and (iv) farm operations.
Fiscal 2013 compared to Fiscal 2012 – Our water deliveries increased 102% in fiscal 2013 compared to fiscal 2012. Revenues increased 175% in fiscal 2013 compared to fiscal 2012. Both deliveries and sales increased primarily as a result of the addition of water sales used for oil and gas activities, which was used to frack wells drilled into the Niabrara formation. Our revenue increased by a greater margin then our deliveries due to our ability to charge a higher meter rate on fracking water then we typically receive from customers that have acquired taps. The following table details the sources of our sales, the number of kgal (1,000 gallons) sold, and the average price per kgal for fiscal 2013 and fiscal 2012.
| | | | | | | | | | | | | | | | | | | | | | | | | |
| Water Revenue Summary | |
| | | 2013 | | | 2012 | |
| Customer Type | | Sales | | | kgal | | | | | | Sales | | | kgal | | | | |
| On Site | | $ | 138,300 | | | | 33,831.2 | | | $ | 4.09 | | | $ | 142,300 | | | | 30,759.9 | | | $ | 4.63 | |
| Export-Commercial | | | 42,000 | | | | 4,156.8 | | | | 10.10 | | | | 23,700 | | | | 2,587.6 | | | | 9.16 | |
| Fracking | | | 322,400 | | | | 34,025.1 | | | | 9.48 | | | | 10,200 | | | | 852.8 | | | | 11.96 | |
| Consulting | | | | | | | | | | | | | | | 6,600 | | | | | | | | | |
| | | $ | 502,700 | | | | 72,013.1 | | | $ | 6.98 | | | $ | 182,800 | | | | 34,200.3 | | | $ | 5.34 | |
Our gross margin on delivering water (not including depletion charges) increased from 57% in fiscal 2012 to 67% in fiscal 2013 due to increased sales and our ability to offset the ECCV system costs with increased water deliveries.
Our wastewater fees decreased 9% in fiscal 2013 compared to fiscal 2012 due to decreased demand from our only customer.
We began our farm operations during fiscal 2013. Prior to fiscal 2012 we did not generate any revenues from our farming operations. The following chart details our farm revenue by lease type, acres, and the average revenue per acre for fiscal 2013.
| | | | | | | | | | | | | |
| Farm Summary | |
| | | 2013 | |
| Lease Type | | Sales | | | Acres | | | | |
| Arkansas Cash | | $ | 1,062,120 | | | | 10,732 | | | $ | 98.97 | |
| Arkansas Pasture | | | 5,500 | | | | 1,084 | | | | 5.07 | |
| Arkansas Watershares | | | 56,000 | | | | — | | | | N/A | |
| Arkansas Crop Share | | | 102,400 | | | | 1,202 | | | | 85.19 | |
| Arkansas Held for Sale | | | — | | | | 1,331 | | | | — | |
| Arkansas Not Farmed | | | — | | | | 2,361 | | | | — | |
| Sky Ranch | | | 15,880 | | | | 931 | | | | 17.06 | |
| | | $ | 1,241,900 | | | | 17,641 | | | $ | 70.40 | |
Fiscal 2012 compared to Fiscal 2011 – Our water deliveries decreased 1% in fiscal 2012 compared to fiscal 2011 due mainly to slightly more precipitation during the irrigation season resulting in less usage for outdoor irrigation. Our gross margin on delivering water (not including depletion charges) decreased from 67% in fiscal 2011 to 57% in fiscal 2012, mainly as a result of the ECCV lease expense of $23,300 in fiscal 2012 and $0 in fiscal 2011, See further discussion below in “ECCV Capacity Operating System” section below.
Our wastewater fees decreased 33% in fiscal 2012 compared to fiscal 2011, because we changed how our customer is charged. Our only wastewater customer was previously charged a flat monthly fee based on the number of tap connections; however, beginning July 1, 2011, we began to charge our wastewater customer based on the amount of wastewater treated due to a reduction in their wastewater flows..
General and Administrative Expenses
Table H details significant items, and changes, included in our General and Administrative Expenses (“G&A Expenses”) as well as the impact that share-based compensation has on our G&A Expenses for the fiscal years ended August 31, 2013, 2012 and 2011, respectively.
| | | | | | | | | | | | | | | | | | | | | | | | | | | | | |
| Table H- G&A Expenses | |
| | | | | | | | | | | | Change | |
| | | Fiscal Years Ended August 31, | | | | 2013-2012 | | 2012-2011 |
| | | 2013 | | | 2012 | | | 2011 | | | | $ | | | | % | | $ | | | | % |
| Significant G&A Expense items: | | | | | | | | | | | | | | | | | | | | | | | | |
| Salary and salary related expenses | | $ | 723,500 | | | $ | 693,500 | | | $ | 807,400 | | | $ | 30,000 | | | | 4 | % | | $ | (113,900 | ) | | | -14 | % |
| FLCC water assessment fees | | | 321,200 | | | | 361,600 | | | | 472,400 | | | | (40,400 | ) | | | -11 | % | | | (110,800 | ) | | | -23 | % |
| Professional fees | | | 370,600 | | | | 655,800 | | | | 330,400 | | | | (285,200 | ) | | | -43 | % | | | 325,400 | | | | 98 | % |
| Fees paid to directors including insurance | | | 120,600 | | | | 124,700 | | | | 144,100 | | | | (4,100 | ) | | | -3 | % | | | (19,400 | ) | | | -13 | % |
| Costs associated with Sky Ranch | | | 83,600 | | | | 133,800 | | | | 136,500 | | | | (50,200 | ) | | | -38 | % | | | (2,700 | ) | | | -2 | % |
| Public entity related expenses | | | 90,500 | | | | 98,100 | | | | 92,500 | | | | (7,600 | ) | | | -8 | % | | | 5,600 | | | | 6 | % |
| Consulting fees | | | 47,400 | | | | 2,600 | | | | 11,600 | | | | 44,800 | | | | 1723 | % | | | (9,000 | ) | | | -78 | % |
| Farm property taxes | | | 237,400 | | | | | | | | — | | | | | | | | | | | | | | | | | |
| All other compenents of G&A combined | | | 338,300 | | | | 304,000 | | | | 217,100 | | | | 34,300 | | | | 11 | % | | | 86,900 | | | | 40 | % |
| G&A Expenses as reported | | $ | 2,333,100 | | | $ | 2,374,100 | | | $ | 2,212,000 | | | $ | (41,000 | ) | | | -2 | % | | $ | 162,100 | | | | 7 | % |
| Share-based compensation | | | (66,800 | ) | | | (54,600 | ) | | | (94,500 | ) | | | (12,200 | ) | | | 22 | % | | | 39,900 | | | | -42 | % |
| G&A Expenses less share-based compensation | | $ | 2,266,300 | | | $ | 2,319,500 | | | $ | 2,117,500 | | | $ | (53,200 | ) | | | -2 | % | | $ | 202,000 | | | | 10 | % |
| | | | | | | | | | | | | | | | | | | | | | | | | | | | | |
| Note - salary and salary related expenses excluding share-based compensation: | | | | | | | | | | | | | | | | | | | | | |
| Salary and salary related expenses | | $ | 656,700 | | | $ | 638,900 | | | $ | 712,800 | | | $ | 17,800 | | | | 3 | % | | $ | (73,900 | ) | | | -10 | % |
Fiscal 2013 compared to Fiscal 2012 – Salary and related expenses increased by 4% during fiscal 2013 as compared to fiscal 2012 mainly as a result of bonuses paid to management in fiscal 2013 following the successful conversion of our farming operations to our control as well as the addition of capacity to our system. As noted on the bottom line of Table H, salary and related expenses excluding share-based compensation expenses increased 3% during fiscal 2013 compared to fiscal 2012, mainly as a result of the employee bonuses noted above. Share-based compensation expenses increased 22% during fiscal 2013 compared to fiscal 2012 due to the issuance of additional options to our independent directors and to our management.
FLCC water assessment fees are the fees we pay for our share of the maintenance of the Fort Lyon Canal in Southeast Colorado. The fees are approved by the shareholders of the FLCC. The FLCC fees decreased 11% during fiscal 2013 compared to fiscal 2012 as a result of the assessment fees being decreased from $17.00 per share for calendar year 2012 to $15.00 per share for calendar year 2013. As of August 31, 2013, we hold approximately 23% of the voting shares of the FLCC.
Professional fees (mainly legal and accounting fees) decreased 43% during fiscal 2013 compared to fiscal 2012. The decrease was due to a reduction in state litigation legal fees of approximately $188,900, a reduction of legal fees associated with the HP default of $73,600, and a reduction of general legal fees of $27,700. The decrease was partially offset by an increase in accounting fees of $4,900.
Fees paid to our board of directors in fiscal 2013 include $45,800 for premiums related to our directors and officers insurance policy (this amount increased by $800 from fiscal 2012). The remaining fees of $74,800 represent amounts paid to our board members for annual and meeting attendance fees and travel expenses which decreased $4,900 from fiscal 2012, primarily as a result of a reduction in the number of committee meetings.
Costs associated with Sky Ranch decreased 38% during fiscal 2013 as compared to fiscal 2012 due to a decrease in consulting fees associated with the establishment of water districts that occurred in fiscal 2012. The consulting fees were decreased in fiscal 2013 by $23,700. Our property taxes also decreased by $26,500.
Costs associated with being a corporation and costs associated with being a publicly traded entity decreased 8% during fiscal 2013 compared to fiscal 2012 primarily due to a change in our Edgar and XBRL processing providers.
Consulting fees for fiscal 2013 consisted of $27,500 to recruit new staff members, $2,700 for fees associated with the disposal of our Paradise asset, $2,000 related to our involvement in WISE, and $15,200 related to the development of the Sky Ranch water districts. All of these fees are non-recurring.
We incurred $237,400 in property taxes during fiscal 2013 as a result of taking over the management of our farms in August 2012. This obligation was previously the responsibility of HP A&M and as such we did not have this expense in previous years.
All other G&A Expenses are comprised of typical operating expenses and increased 11% during fiscal 2013 compared to fiscal 2012 as a result of additional funding to Rangeview Metropolitan District as well as an increase in our bad debt allowance.
Fiscal 2012 compared to Fiscal 2011 – Salary and related expenses decreased by 14% during fiscal 2012 as compared to fiscal 2011 mainly as a result of bonuses paid to management in fiscal 2011 following the successful completion of the financing and acquisition of the Sky Ranch property which were not paid in 2012. As noted on the bottom line of Table H, salary and related expenses excluding share-based compensation expenses decreased 10% during fiscal 2012 compared to fiscal 2011, mainly as a result of the employee bonuses noted above. Share-based compensation expenses decreased 42% during fiscal 2012 compared to fiscal 2011 due to the forfeiture of 29,500 stock options by two former board members and one former employee.
FLCC water assessment fees are the fees we pay for our share of the maintenance of the Fort Lyon Canal in the Arkansas River Valley. The fees are approved by the shareholders of the FLCC. The FLCC fees decreased 23% during fiscal 2012 compared to fiscal 2011 as a result of the purchase of project water by the FLCC during our fiscal 2011, which did not recur in 2012. As of August 31, 2012, we hold approximately 23% of the voting shares of the FLCC.
Professional fees (mainly legal and accounting fees) increased 98% during fiscal 2012 compared to fiscal 2011 mainly as a result of additional legal fees related to the lawsuit we filed against the State of Colorado by and through the Land Board in December 2011 and the lawsuit filed against us by HP A&M, as well as legal fees associated with the HP A&M default on the promissory notes secured by deeds of trust on our Arkansas River assets.
Fees paid to our board of directors in fiscal 2012 include $45,000 for premiums related to our directors and officers insurance policy (this amount is unchanged from fiscal 2011). The remaining fees of $79,700 represent amounts paid to our board members for annual and meeting attendance fees and travel expenses which decreased 13% from fiscal 2011, mainly as a result of an additional board member in fiscal 2011 as well as additional meetings held to discuss the financing and acquisition of Sky Ranch in fiscal 2011.
Costs associated with Sky Ranch decreased 2% during fiscal 2012 as compared to fiscal 2011 due to a decrease in consulting fees associated with the beginning phases of marketing the property to home builders/developers that occurred in 2011. The consulting fees were decreased in 2012 by $30,000, but were offset by an increase in property taxes of $27,000.
Costs associated with being a corporation and costs associated with being a publicly traded entity increased 6% during fiscal 2012 compared to fiscal 2011 primarily due to increased fees charged by NASDAQ and our transfer agent.
Overall consulting fees decreased due to a decrease in the use of consultants as a result of management’s continued effort to reduce costs.
All other G&A Expenses are comprised of typical operating expenses and increased 40% during fiscal 2012 compared to fiscal 2011 as a result of additional funding to Rangeview Metropolitan District as well as bad debt expense for the newly acquired farm lease receivables.
Other Income and Expense Items
| | | | | | | | | | | | | | | | | | | | | | | | | | | | | |
| | | | | | | | | | | | Change | |
| | | For the Fiscal Years Ended August 31, | | | 2013-2012 | | | 2012-2011 | |
| | | 2013 | | | 2012 | | | 2011 | | | | $ | | | | % | | | | $ | | | | % | |
| Other expense items: | | | | | | | | | | | | | | | | | | | | | | | | | |
| Depreciation and depletion expense | | $ | 311,200 | | | $ | 309,200 | | | $ | 300,800 | | | $ | 2,000 | | | | 1 | % | | $ | 8,400 | | | | 3 | % |
| Imputed interest expense | | $ | 3,275,400 | | | $ | 3,470,500 | | | $ | 3,847,000 | | | $ | (195,100 | ) | | | -6 | % | | $ | (376,500 | ) | | | -10 | % |
| | | | | | | | | | | | | | | | | | | | | | | | | | | | | |
| Other income items: | | | | | | | | | | | | | | | | | | | | | | | | | | | | |
| Oil and gas payments recognized | | $ | 416,000 | | | $ | 423,000 | | | $ | 199,300 | | | $ | (8,500 | ) | | | -2 | % | | $ | 223,700 | | | | 100 | % |
| Interest income | | $ | 34,600 | | | $ | 53,400 | | | $ | 53,100 | | | $ | (18,800 | ) | | | -35 | % | | $ | 300 | | | | 1 | % |
Depreciation and depletion increased 1% during fiscal 2013 compared to fiscal 2012 due to the addition of equipment beginning to depreciate in fiscal 2013. Depreciation and depletion increased 3% during fiscal 2012 compared to fiscal 2011 due mainly to Sky Ranch improvements beginning to depreciate in fiscal 2012.
Imputed interest expense represents the expensed portion of the difference between the relative fair value of the Tap Participation Fee liability payable to HP A&M and the net present value of the liability recognized under the effective interest method. The changes in the imputed interest expense in each of the years presented are a result of the updated valuations performed in first quarter of fiscal 2012, which are explained in greater detail in Note 7- Long-Term Debt and Operating Lease to the accompanying financial statements. These imputed interest charges account for 79%, 20% and 64% of our total reported net losses for the fiscal years ended August 31, 2013, 2012 and 2011, respectively.
The $416,000, $423,000, and $199,300 of oil and gas lease payments recognized in fiscal 2013, fiscal 2012, and fiscal 2011 respectively, represent a portion of the up-front payment received on March 10, 2011, upon the signing of the O&G Lease and the Surface Use Agreement with Anadarko. On March 10, 2011 we received an up-front payment of $1,243,400 from Anadarko for the purpose of exploring for, developing, producing and marketing oil and gas on 634 acres of mineral estate we own at our Sky Ranch property. The oil and gas rights under the remaining 304 acres at Sky Ranch were already owned by Anadarko. We deferred immediate recognition of the up-front payment, but began recognizing the up-front payment in income over the initial three year term of the O&G Lease beginning March 10, 2011. We also received $9,300 from Anadarko pursuant to the Surface Use Agreement. As of August 31, 2013, we have deferred recognition of $235,500 of income related to the O&G Lease.
Interest income represents interest earned on the temporary investment of capital in cash equivalents or available-for-sale securities, interest accrued on the note payable by the District and interest accrued on the Special Facilities construction proceeds receivable from the County. The decrease from fiscal 2012 to fiscal 2013 is due to reduced investments partially offset by increased farm late fees. The increase from fiscal 2011 to fiscal 2012 is due to a slight recovery of the investment market interest rates.
Liquidity, capital resources and financial position
At August 31, 2013, our working capital, defined as current assets less current liabilities, was $4.5 million, which included $2.45 million in cash, cash equivalents and marketable securities. As of the date of the filing of this annual report on Form 10-K, we have an effective shelf registration statement pursuant to which we may elect to sell up to another $15 million of stock at any time and from time to time. During 2012 we sold the 1.5 million Pledged Shares for $3.5 million or $2.35 per share. We believe that as of the date of the filing of this annual report on Form 10-K and as of August 31, 2013, we have sufficient working capital to fund our operations for the next fiscal year.
Arkansas River Valley Water Assets – The FLCC water assessments are the charges assessed to the FLCC shareholders for the upkeep and maintenance of the Fort Lyon Canal. The water assessment payments are payable to the FLCC each calendar year. Our calendar year assessments for 2013 will be approximately $290,000 and are being expensed ratably during the year. Our calendar year 2012 property taxes (paid in April 2013) were approximately $142,000. We anticipate the property taxes for calendar year 2013 to be similar, so we accrue monthly property taxes of approximately $11,800.
Sky Ranch Property – Our calendar year 2012 Sky Ranch property taxes (paid in April 2013) were approximately $90,600. We anticipate the property taxes for calendar year 2013 to be similar, so we accrue monthly property taxes of approximately $7,600.
ECCV Capacity Operating System – Pursuant to a 1982 contractual right, the District may purchase water produced from East Cherry Creek Valley Water and Sanitation District’s (“ECCV”) Land Board system. ECCV’s Land Board system is comprised of eight wells and more than ten miles of buried water pipeline located on the “Lowry Range” as described in Note 4 – Water Assets to the 2012 Annual Report. In May 2012, in order to increase the delivery capacity and reliability of these wells, in our capacity as the District’s service provider and the Export Water Contractor (as defined in the Amended and Restated Water Lease between the District and the Colorado State Board of Land Commissioners), we entered into an agreement to operate and maintain the ECCV facilities allowing us to utilize the system to provide water to commercial and industrial customers, including customers providing water for drilling and hydraulic fracturing of oil and gas wells. Our costs associated with the use of the ECCV system were a flat monthly fee of $4,667 per month from May 1, 2012 through December 31, 2012, which increased to $8,000 per month from January 1, 2013 through December 31, 2020, and will decrease to $3,000 per month from January 1, 2020 through April 2032. Additionally, we pay a fee per 1,000 gallons of water produced from ECCV’s system, which is included in the water usage fees charged to customers.
The Tap Participation Fee - The $59.8 million Tap Participation Fee liability at August 31, 2013, represents the estimated fair value of our obligation to pay HP A&M 20% of our gross proceeds, or the equivalent thereof, from the sale of the next 17,194 water taps we sell and includes $26.1 million of interest, which has been imputed since we acquired our farm assets, recorded using the effective interest method. During the extended term of the Property Management Agreement, we were permitted to allocate 26.9% of the Net Revenues (defined as all lease and related income received from the farms less employee expenses, direct expenses for managing the leases and a reasonable overhead allocation) paid to HP A&M against the Tap Participation Fee. During the fiscal year ended August 31, 2012, we allocated $189,700 to the Tap Participation Fee liability, which was the equivalent of 41 taps. As a result of HP A&M’s default, on August 3, 2012 we terminated the Property Management Agreement and stopped allocating 26.9% of the Net Revenues to the TPF. Therefore, no Net Revenue was allocated against the TPF liability during the fiscal year ended August 31, 2013, and no Net Revenue will be allocated to the liability in any future period. We did not sell any taps during the fiscal years ended August 31, 2013 or 2012.
Payment of the TPF may be accelerated in the event of a merger, reorganization, sale of substantially all assets, or similar transactions and in the event of bankruptcy and insolvency events. During the 2013 fiscal year we foreclosed on three of our farms and one FLCC certificate representing water rights only, and cured one farm in foreclosure. Our agreement with HP A&M allows us to reduce the TPF in the event any of our farms or water rights are foreclosed upon. As of August 31, 2013, there were 17,194 (a reduction of 2,233 compared to 2012) taps subject to the Tap Participation Fee. As a result of the foreclosures and the reduction in taps remaining subject to the TPF, the Tap Participation Fee was revalued as of August 31, 2013.
South Metropolitan Water Supply Authority – The South Metropolitan Water Supply Authority (“SMWSA”) is a municipal water authority in the State of Colorado organized to pursue the acquisition and development of new water supplies on behalf of its members. SMWSA members include 14 Denver area water providers in Arapahoe and Douglas Counties. The District became a member of SMWSA in 2009 in an effort to participate with other area water providers in developing regional water supplies along the Front Range. For over 2 years, the SMWSA members have been working with Denver Water and Aurora Water on a cooperative water project known as the Water Infrastructure Supply Efficiency partnership (“WISE”), which seeks to develop regional infrastructure which would interconnect member’s water transmission systems to be able to develop additional water supplies from the South Platte River in conjunction with Denver Water and Aurora Water. In July of 2013, the District together with 9 other SMWSA members formed the South Metropolitan Wise Authority (SWMA) to continue to develop the WISE project. Through an agreement with the District, we continue to support SMWA and its joint water development efforts and may seek to participate in one or more regional water projects if such projects are in our best interest.
Summary Cash Flows Table
| | | | | | | | | | | | | | | | | | | | | | | | | | | | | |
| | | | | | | | | | | | Change | |
| | | For the Fiscal Years Ended August 31, | | | 2013-2012 | | | 2012-2011 | |
| | | 2013 | | | 2012 | | | 2011 | | | $ | | | % | | $ | | | % |
| Cash (used) provided by: | | | | | | | | | | | | | | | | | | | | | | | | | |
| Operating acitivites | | $ | (1,756,700 | ) | | $ | (1,887,100 | ) | | $ | (623,200 | ) | | $ | 130,400 | | | | -7 | % | | $ | (1,263,900 | ) | | | 203 | % |
| Investing activities | | $ | 4,098,100 | | | $ | 3,354,000 | | | $ | (9,996,100 | ) | | $ | 744,100 | | | | 22 | % | | $ | 13,350,100 | | | | -134 | % |
| Financing activities | | $ | (1,516,500 | ) | | $ | 85,000 | | | $ | 10,679,100 | | | $ | (1,601,500 | ) | | | -1884 | % | | $ | (10,594,100 | ) | | | -99 | % |
Changes in Operating Activities – Operating activities include revenues we receive from the sale of wholesale water and wastewater services, costs incurred in the delivery of those services, G&A expenses, and depletion/depreciation expenses.
Cash used by operations in fiscal 2013 decreased by $130,000 compared to fiscal 2012, which was due mainly to increased revenues and reduced legal fees related to the Land Board. These were partially offset by an increase in accounts receivable and HP default receivable. Cash used by operations in fiscal 2012 increased by $1.3 million compared to fiscal 2011, which was due mainly to increased legal fees related to the Land Board and HP A&M law suits and the HP A&M default on the farm notes and deeds of trust. These were offset by an increase in accounts payable and accrued expenses and a decrease in deferred income from the Anadarko lease.
We will continue to provide wholesale domestic water and wastewater services to customers in our service area and we will continue to operate and maintain our water and wastewater systems with our own employees.
Changes in Investing Activities – Investing activities in fiscal 2013 consisted of the investment in our water system and purchase of assets of $418,000, the sale of marketable securities of $1.1 million, the sale of collateral stock of $3.4 million. Investing activities in fiscal 2012 consisted of the purchase of marketable securities of $1.2 million and the sale of marketable securities of $4.7 million. Investing activities in fiscal 2011 consisted of our acquisition of Sky Ranch, which required $6.8 million during the year ended August 31, 2011, and the purchase of $6.4 million of marketable securities, which was offset by the sale/maturity of $3.2 million of marketable securities..
Changes in Financing Activities – Financing activities in fiscal 2013 consisted primarily of payments on the promissory notes of $1.8 million and the receipt of $292,00 from the County pursuant to the County Agreement and the early payoff of the debt. Financing activities in fiscal 2012 consisted of the receipt of $85,000 from the County pursuant to the County Agreement. Financing activities in fiscal 2011 consisted mainly of the sale of $5.4 million of common stock pursuant to our effective shelf registration and the issuance of the $5.2 million Convertible Note – Related Party. See Note 4 – Water Assets to the accompanying financial statements. Proceeds from both financings were used to finance the acquisition of Sky Ranch and provide additional working capital. The Convertible Note – Related Party was converted into common stock in January 2011. Additionally, we received $82,200 from the County pursuant to the County Agreement. See Note 4 – Water Assets to the accompanying financial statements.
Off-Balance Sheet Arrangements
Our off-balance sheet arrangements consist entirely of the contingent portion of the CAA which is $2.2 million, as described in Note 5 – Participating Interest in Export Water to the accompanying financial statements. The contingent liability is not reflected on our balance sheet because the obligation to pay the CAA is contingent on sales of Export Water, the amounts and timing of which are not reasonably determinable.
Recently Adopted and Issued Accounting Pronouncements
See Note 2 – Summary of Significant Accounting Policies to the accompanying financial statements for recently adopted and issued accounting pronouncements.
Total Contractual Cash Obligations
| | | | | | | | | | | | | | | |
| Table K - Contractual Cash Obligations | |
| | | | Payments due by period | |
| | | | Less than 1 | | | | | | | | More than | |
| | Total | | year | | 1-3 years | | | 3-5 years | | | 5 years | |
| Contractual obligations | | $ | 7,758,000 | | | $ | 4,546,900 | | | $ | 2,664,000 | | | $ | 547,100 | | | | (a | ) |
| Operating lease obligations | | | 24,480 | | | | 18,360 | | | | 6,120 | | | (b) | | | (b | ) |
| Participating Interests in Export Water | | | 1,192,900 | | (c) | | (c) | | | (c) | | | (c | ) |
| Tap Participation Fee payable to HP A&M | | | 105,065,800 | | (d) | | (d) | | | (d) | | | (d | ) |
| Total | | $ | 114,041,180 | | | $ | 4,565,260 | | | $ | 2,670,120 | | | $ | 547,100 | | | $ | — | |
| | (a) | Our contractual obligations are related to our Arkansas Valley farms. We have refinanced most farms on 5 year terms at a rate of 5% payable 2 times per year. The remaining farms are in various stages of negotiation, but due to their default status by HP A&M they are reflected as a current liability maturing in less than 1 year. |
| | (b) | Our only operating lease is related to our office space. We occupy 1,200 square feet at a cost of $1,530, per month, at the address shown on the cover of this Form 10-K. We lease these premises pursuant to a two year operating lease agreement with a third party. |
| | (c) | The participating interests liability is payable to the CAA holders upon the sale of Export Water, and therefore, the timing of the payments is uncertain and not reflected in the above table by period. |
| | (d) | The Tap Participation Fee payable to HP A&M is payable upon the sale of water taps. Because the timing of these water tap sales is not fixed and determinable, the estimated payments are not reflected in the above table by period. The amount listed above includes an unamortized discount of $41.4 million. The Tap Participation Fee is described in greater detail in Note 7 – Long-Term Debt and Operating Lease to the accompanying financial statements. |
General
We have limited exposure to market risks from instruments that may impact our balance sheets, statements of operations, and statements of cash flows. Such exposure is due primarily to changing interest rates.
Interest Rates
The primary objective for our investment activities is to preserve principal while maximizing yields without significantly increasing risk. This is accomplished by investing in diversified short-term interest bearing investments. As of August 31, 2013, the Company is not holding any marketable securities in an effort to create liquidity while the Company is in the process of curing the defaults by High Plains A&M, LLC (“HP A&M”). We have no investments denominated in foreign country currencies, and therefore our investments are not subject to foreign currency exchange risk.
Index to Consolidated Financial Statements and Supplementary Data
Board of Directors and Shareholders
Pure Cycle Corporation
We have audited the accompanying consolidated balance sheets of Pure Cycle Corporation as of August 31, 2013 and 2012, and the related consolidated statements of operations, shareholders’ equity and comprehensive income (loss) and cash flows for each of the three years in the period ended August 31, 2013. These financial statements are the responsibility of the Company’s management. Our responsibility is to express an opinion on these financial statements.
We conducted our audits in accordance with the standards of the Public Company Accounting Oversight Board (United States). Those standards require that we plan and perform the audits to obtain reasonable assurance about whether the financial statements are free of material misstatement. An audit includes examining, on a test basis, evidence supporting the amounts and disclosures in the financial statements. An audit also includes assessing the accounting principles used and significant estimates made by management, as well as evaluating the overall financial statement presentation. We believe that our audits provide a reasonable basis for our opinion.
In our opinion, the consolidated financial statements referred to above present fairly, in all material respects, the financial position of Pure Cycle Corporation as of August 31, 2013 and 2012, and the results of their operations and their cash flows for each of the three years in the period ended August 31, 2013, in conformity with accounting principles generally accepted in the United States of America.
/s/ GHP HORWATH, P.C
Denver, Colorado
November __, 2013
| | | | | | | |
| | | August 31, 2013 | | | August 31, 2012 | |
| ASSETS: | | | | | | |
| Current assets: | | | | | | |
| Cash and cash equilvalents | | $ | 2,448,363 | | | $ | 1,623,517 | |
| Marketable securities | | | — | | | | 1,101,367 | |
| Trade accounts receivable | | | 584,802 | | | | 135,458 | |
| Sky Ranch receivable | | | 57,303 | | | | — | |
| Current portion of HP A&M receivable | | | 6,655,156 | | | | 4,456,857 | |
| Prepaid expenses | | | 154,345 | | | | 279,782 | |
| Current portion of construction proceeds receivable | | | — | | | | 64,783 | |
| Total current assets | | | 9,899,969 | | | | 7,661,764 | |
| | | | | | | | | |
| Investments in water and water systems, net | | | 88,512,249 | | | | 88,510,359 | |
| Land - Sky Ranch | | | 3,768,029 | | | | 3,778,464 | |
| Land and water held for sale | | | 5,748,630 | | | | 5,748,630 | |
| Construction proceeds receivable, less current portion | | | — | | | | 226,879 | |
| Note receivable - related party: | | | | | | | | |
| Rangeview Metropolitan District, including accrued interest | | | 555,983 | | | | 543,945 | |
| HP A&M receivable, less current portion | | | — | | | | 5,093,365 | |
| Other assets | | | 133,471 | | | | 18,671 | |
| Total assets | | $ | 108,618,331 | | | $ | 111,582,077 | |
| | | | | | | | | |
| LIABILITIES: | | | | | | | | |
| Current liabilities: | | | | | | | | |
| Accounts payable | | | 167,775 | | | | 261,383 | |
| Current portion mortgages payable, including interest payable of $122,028 | | | 4,668,943 | | | | 5,340,890 | |
| Accrued liabilities | | | 264,740 | | | | 172,630 | |
| Deferred revenues | | | 65,384 | | | | 65,384 | |
| Deferred oil and gas lease payment | | | 235,483 | | | | 414,480 | |
| Total current liabilities | | | 5,402,325 | | | | 6,254,767 | |
| | | | | | | | | |
| Deferred revenues, less current portion | | | 1,232,220 | | | | 1,297,605 | |
| Deferred oil and gas lease payment, less current portion | | | — | | | | 224,510 | |
Mortgages payable, less current portion | | | 3,211,112 | | | | 4,209,329 | |
| Participating interests in Export Water Supply | | | 1,192,910 | | | | 1,208,928 | |
| Tap Participation Fee payable to HP A&M net of $42.9 million and $44.8 million discount respectively | | | 59,807,289 | | | | 68,269,176 | |
| Total liabilities | | | 70,845,856 | | | | 81,464,315 | |
| | | | | | | | | |
| Commitments and Contingencies | | | | | | | | |
| | | | | | | | | |
| SHAREHOLDERS’ EQUITY: | | | | | | | | |
| Preferred stock: | | | | | | | | |
Series B - par value $.001 per share, 25 milllion shares authorized 432,513 shares issued and outstanding (liquidation perference of $432,513) | | | 433 | | | | 433 | |
| Common stock: | | | | | | | | |
| Par value 1/3 of $.01 per share, 40 million shares authorized; 24,037,598 shares issued and outstanding | | | 80,130 | | | | 80,130 | |
| Additional paid in capital | | | 115,224,946 | | | | 103,420,869 | |
| Accumulated comprehensive loss | | | — | | | | (1,081 | ) |
| Accumulated deficit | | | (77,533,034 | ) | | | (73,382,589 | ) |
| Total shareholders’ equity | | | 37,772,475 | | | | 30,117,762 | |
| Total liabilities and shareholders’ equity | | $ | 108,618,331 | | | $ | 111,582,077 | |
| | | For the Fiscal Years Ended August 31, | |
| | | 2013 | | | 2012 | | | 2011 | |
| Revenues: | | | | | | | | | |
| Metered water usage | | $ | 502,668 | | | $ | 182,802 | | | $ | 157,497 | |
| Wastewater treatment fees | | | 41,697 | | | | 45,778 | | | | 68,833 | |
| Special facility funding recognized | | | 41,508 | | | | 41,508 | | | | 41,508 | |
| Water tap fees recognized | | | 14,294 | | | | 14,296 | | | | 14,296 | |
| Farm operations | | | 1,241,882 | | | | | | | | | |
| Other income | | | 15,413 | | | | | | | | | |
| Total revenues | | | 1,857,462 | | | | 284,384 | | | | 282,134 | |
| | | | | | | | | | | | | |
| Expenses: | | | | | | | | | | | | |
| Water service operations | | | (188,309 | ) | | | (78,144 | ) | | | (51,882 | ) |
| Wastewater service operations | | | (16,958 | ) | | | (19,269 | ) | | | (19,224 | ) |
| Farm operations | | | (96,337 | ) | | | — | | | | — | |
| Other | | | (1,199 | ) | | | (1,995 | ) | | | | |
| Depletion and depreciation | | | (90,468 | ) | | | (88,576 | ) | | | (88,587 | ) |
| Total cost of revenues | | | (393,271 | ) | | | (187,984 | ) | | | (159,693 | ) |
| Gross margin | | | 1,464,191 | | | | 96,400 | | | | 122,441 | |
| | | | | | | | | | | | | |
| General and administrative expenses | | | (2,333,126 | ) | | | (2,374,106 | ) | | | (2,212,026 | ) |
| Impairment of land and water rights held for sale | | | — | | | | (6,457,760 | ) | | | — | |
| Impairment of water assets | | | — | | | | (5,544,022 | ) | | | — | |
| Depreciation | | | (220,834 | ) | | | (220,657 | ) | | | (212,184 | ) |
| Operating loss | | | (1,089,769 | ) | | | (14,500,145 | ) | | | (2,301,769 | ) |
| | | | | | | | | | | | | |
| Other income (expense): | | | | | | | | | | | | |
| Oil and gas lease income, net | | | 416,048 | | | | 422,999 | | | | 199,257 | |
| Farm income, net | | | — | | | | 71,101 | | | | — | |
| Interest income | | | 34,583 | | | | 53,339 | | | | 53,133 | |
| Interest expense | | | (245,503 | ) | | | | | | | | |
| Other | | | 9,574 | | | | 3,552 | | | | 31,887 | |
| Gain on sale of assets | | | — | | | | 1,016 | | | | — | |
| Interest expensed on Convertible Note - Related Party | | | — | | | | — | | | | (151,667 | ) |
Interest imputed on the Tap Participation Fees payable to HP A&M | | | (3,275,378 | ) | | | (3,470,523 | ) | | | (3,847,000 | ) |
| Net loss | | $ | (4,150,445 | ) | | $ | (17,418,661 | ) | | $ | (6,016,159 | ) |
| Net loss per common share – basic and diluted | | $ | (0.17 | ) | | $ | (0.72 | ) | | $ | (0.26 | ) |
| | | | | | | | | | | | | |
| Weighted average common shares outstanding – basic and diluted | | | 24,037,596 | | | | 24,037,596 | | | | 23,168,450 | |
See accompanying Notes to Financial Statements
| | | | | | | | | Additional | | | Accumulated | | | | | | | |
| | | Preferred Stock | | | Common Stock | | | Paid-in | | | Comprehensive | | | Accumulated | | | | |
| | | Shares | | | Amount | | | Shares | | | Amount | | | Capital | | | Income (loss) | | | Deficit | | | Total | |
| August 31, 2010 balance: | | | 432,513 | | | $ | 433 | | | | 20,206,566 | | | $ | 67,360 | | | $ | 92,341,555 | | | $ | (1,580 | ) | | $ | (49,947,769.0 | ) | | $ | 42,459,999 | |
Sale of common stock, less fees and expenses of approximately $145,200 | | | — | | | | — | | | | 1,848,931 | | | | 6,163 | | | | 5,395,442 | | | | — | | | | — | | | | 5,401,605 | |
| Issuance of restricted common stock upon conversion of Convertible Debt | | | — | | | | — | | | | 1,982,099 | | | | 6,607 | | | | 5,345,060 | | | | — | | | | — | | | | 5,351,667 | |
| Share-based compensation | | | — | | | | — | | | | — | | | | — | | | | 94,550 | | | | — | | | | — | | | | 94,550 | |
| Unrealized loss on investments | | | — | | | | — | | | | — | | | | — | | | | — | | | | (1,323 | ) | | | — | | | | (1,323 | ) |
| Net loss | | | — | | | | — | | | | — | | | | — | | | | — | | | | — | | | | (6,016,159 | ) | | | (6,016,159 | ) |
| Comprehensive loss | | | | | | | | | | | | | | | | | | | | | | | | | | | | | | | (6,017,482 | ) |
| August 31, 2011 balance: | | | 432,513 | | | | 433 | | | | 24,037,596 | | | | 80,130 | | | | 103,176,607 | | | | (2,903 | ) | | | (55,963,928 | ) | | | 47,290,339 | |
| Share-based compensation | | | — | | | | — | | | | | | | | | | | | 54,588 | | | | | | | | | | | | 54,588 | |
| Allocation of net revenues to TPF | | | | | | | | | | | | | | | | | | | 189,674 | | | | | | | | | | | | 189,674 | |
| Unrealized loss on investments | | | — | | | | — | | | | | | | | | | | | | | | | 1,822 | | | | | | | | 1,822 | |
| Net loss | | | — | | | | — | | | | | | | | | | | | | | | | | | | | (17,418,661 | ) | | | (17,418,661 | ) |
| Comprehensive loss | | | | | | | | | | | | | | | | | | | | | | | | | | | | | | | (17,416,839 | ) |
| August 31, 2012 balance: | | | 432,513 | | | | 433 | | | | 24,037,596 | | | | 80,130 | | | | 103,420,869 | | | | (1,081 | ) | | | (73,382,589 | ) | | | 30,117,762 | |
| Share-based compensation | | | — | | | | — | | | | — | | | | — | | | | 66,812 | | | | — | | | | — | | | | 66,812 | |
| Reduction in TPF due to remedies under the Arkansas River Agreement | | | — | | | | — | | | | — | | | | — | | | | 11,737,265 | | | | — | | | | — | | | | 11,737,265 | |
| Realized gain on investments | | | — | | | | — | | | | — | | | | — | | | | — | | | | 1,081 | | | | — | | | | 1,081 | |
| Net loss | | | — | | | | — | | | | — | | | | — | | | | — | | | | — | | | | (4,150,445 | ) | | | (4,150,445 | ) |
| Comprehensive loss | | | | | | | | | | | | | | | | | | | | | | | | | | | | | | | (4,149,364 | ) |
| August 31, 2013 balance: | | | 432,513 | | | $ | 433 | | | | 24,037,596 | | | $ | 80,130 | | | $ | 115,224,946 | | | $ | — | | | $ | (77,533,034 | ) | | $ | 37,772,475 | |
See accompanying Notes to Financial Statements
PURE CYCLE CORPORATION
| | | For the fiscal Years Ended August 31, | |
| | | 2013 | | | 2012 | | | 2011 | |
| Cash flows from operating activities | | | | | | | | | |
| Net loss | | $ | (4,150,445 | ) | | $ | (17,418,661 | ) | | $ | (6,016,159 | ) |
| Adjustments to reconcile net loss to net cash used for operating activities: | | | | | | | | | | | | |
| Share-based compensation expense | | | 66,812 | | | | 54,588 | | | | 94,550 | |
| Depreciation, depletion and other non-cash items | | | 313,137 | | | | 307,507 | | | | 297,212 | |
| Imputed interest on Tap Participation Fees payable to HP A&M | | | 3,275,378 | | | | 3,470,523 | | | | 3,847,000 | |
| Impairment of water assets | | | — | | | | 5,544,022 | | | | — | |
| Impairment of land and water rights held for sale | | | — | | | | 6,457,760 | | | | — | |
| Interest expensed on Convertible Note-Related Party | | | — | | | | — | | | | 151,667 | |
| Interest added to note receivable - related party | | | | | | | | | | | | |
| Rangeview Metropolitan District | | | (12,038 | ) | | | (12,072 | ) | | | (12,039 | ) |
| Interest added to construction proceeds receivable | | | — | | | | (19,241 | ) | | | (22,899 | ) |
| Gain on sale of fixed assets | | | — | | | | (1,016 | ) | | | — | |
| Changes in operating assets and liabilities: | | | | | | | | | | | | |
| Trade accounts receivable | | | (449,344 | ) | | | (36,974 | ) | | | (27,329 | ) |
| Prepaid expenses | | | 125,437 | | | | (37,782 | ) | | | (5,373 | ) |
| HP A&M Receivable | | | (519,934 | ) | | | — | | | | — | |
| Sky Ranch Receivable | | | (57,303 | ) | | | — | | | | — | |
| Accounts payable and accrued liabilities | | | 120,527 | | | | 246,034 | | | | 72,457 | |
| Deferred revenue | | | (65,385 | ) | | | (27,314 | ) | | | (55,802 | ) |
| Deferred income - oil and gas lease | | | (403,507 | ) | | | (414,480 | ) | | | 1,053,470 | |
| Net cash used for operating activities | | | (1,756,665 | ) | | | (1,887,106 | ) | | | (623,245 | ) |
| | | | | | | | | | | | | |
| Cash flows from investing activities: | | | | | | | | | | | | |
| Investments in water, water systems and land | | | (378,008 | ) | | | (132,221 | ) | | | (6,841,255 | ) |
| Purchases of marketable securities | | | — | | | | (1,235,857 | ) | | | (6,357,177 | ) |
| Sales and maturities of marketable securities | | | 1,101,367 | | | | 4,724,847 | | | | 3,202,373 | |
| Proceeds from sale of land | | | — | | | | 1,099 | | | | — | |
| Proceeds from sale of collateral stock | | | 3,415,000 | | | | — | | | | — | |
| Purchase of property and equipment | | | (40,300 | ) | | | (3,894 | ) | | | — | |
| Net cash provided by (used for) investing activities | | | 4,098,059 | | | | 3,353,974 | | | | (9,996,059 | ) |
| | | | | | | | | | | | | |
| Cash flows from financing activities | | | | | | | | | | | | |
| Net proceeds from equity offering | | | — | | | | — | | | | 5,401,606 | |
| Issuance of Convertible Note - Related Party | | | — | | | | — | | | | 5,200,000 | |
| Arapahoe County construction proceeds | | | 291,662 | | | | 84,854 | | | | 82,196 | |
| Payment to contingent liability holders | | | (16,018 | ) | | | — | | | | (4,720 | ) |
| Payments made on promissory notes payable | | | (1,792,192 | ) | | | | | | | | |
| Net cash (used for) provided by financing activities | | | (1,516,548 | ) | | | 84,854 | | | | 10,679,082 | |
| | | | | | | | | | | | | |
| Net change in cash and cash equivalents | | | 824,846 | | | | 1,551,722 | | | | 59,778 | |
| Cash and cash equivalents - beginning of year | | | 1,623,517 | | | | 71,795 | | | | 12,017 | |
| Cash and cash equivalents - end of year | | $ | 2,448,363 | | | $ | 1,623,517 | | | $ | 71,795 | |
See accompanying Notes to Financial Statements
PURE CYCLE CORPORATION
August 31, 2013, 2012 and 2011
NOTE 1 – ORGANIZATION
Pure Cycle Corporation (the “Company”) was incorporated in Delaware in 1976 and reincorporated in Colorado in 2008. The Company owns assets in the Denver, Colorado metropolitan area and in Southeast Colorado. The Company is currently using its water assets located in the Denver metropolitan area to provide wholesale water and wastewater services to customers located in the Denver metropolitan area. The Company is leasing its farm land in the Arkansas River Valley to area farmers.
The Company provides a full line of water and wastewater services which includes designing and constructing water and wastewater systems as well as operating and maintaining such systems. The Company’s business focus is to provide wholesale water and wastewater services, predominately to local governmental entities, which provide services to their end-use customers throughout the Denver metropolitan area as well as along the Colorado Front Range.
The Company believes it has sufficient working capital and financing sources to fund its operations for at least the next fiscal year. As of August 31, 2013, the Company had $2.4 million of cash and cash equivalents, and $4.5 million of working capital. During fiscal year end 2013, the Company sold the 1.5 million shares of Pure Cycle common stock issued to High Plains A&M, LLC (“HP A&M”), which were pledged as security for certain debt obligations, in a foreclosure sale for $3.5 million or $2.35 per share.
The Company’s ability to generate working capital from its water and wastewater projects is dependent on its ability to successfully market its water, or in the event it is unsuccessful, to sell the underlying water assets. In the event increased sales are not achieved or the Company is unable to sell its water assets at a sufficient level, the Company may have to issue additional short or long-term debt or seek to sell additional shares of the Company’s common or preferred stock to generate sufficient working capital. There can be no assurance that the Company will be successful in marketing its water on terms that are acceptable to the Company.
NOTE 2 – SUMMARY OF SIGNIFICANT ACCOUNTING POLICIES
Principles of Consolidation
The consolidated financial statements of the Company include the accounts of Pure Cycle Corporation and its majority-owned and controlled subsidiaries. Intercompany accounts and transactions have been eliminated in consolidation.
Use of Estimates
The preparation of financial statements in conformity with accounting principles generally accepted in the United States of America (“GAAP”) requires management to make estimates and assumptions that affect the reported amounts of assets and liabilities and disclosure of contingent assets and liabilities at the date of the financial statements and the reported amounts of revenues and expenses during the reporting period. Actual results could differ from those estimates.
Cash and Cash Equivalents
Cash and cash equivalents include all highly liquid debt instruments with original maturities of three months or less. The Company’s cash equivalents are comprised entirely of money market funds maintained at a high quality financial institution in an account which as of August 31, 2013 exceed federally insured limits. At various times during the year ended August 31, 2013, the Company’s main operating account exceeded federally insured limits.
Marketable Securities
At August 31, 2012, the Company’s marketable securities are comprised entirely of certificates of deposits maintained at various financial institutions, each of which have invested below federally insured limits and pay interest at stated rates through maturity. The certificates matured at various dates through May 2013.
The amounts reported on the balance sheets for marketable securities as of August 31, 2012 represent the fair values of the underlying instruments as reported by the financial institutions where the funds are held. As of August 31, 2013, the Company is not holding any marketable securities in an effort to create liquidity while the Company is in the process of resolving the defaults by HP A&M.
PURE CYCLE CORPORATION
NOTES TO CONSOLIDATED FINANCIAL STATEMENTS
August 31, 2013, 2012 and 2011
Financial Instruments – Concentration of Credit Risk and Fair Value
Financial instruments that potentially subject the Company to concentrations of credit risk consist primarily of cash equivalents and marketable securities. The Company places its cash equivalents and investments with high quality financial institutions. At various times throughout the year ended August 31, 2013, cash deposits have exceeded federally insured limits. The Company invests its idle cash primarily in certificates of deposit, money market instruments, commercial paper obligations, corporate bonds and US government treasury obligations. To date, the Company has not experienced significant losses on any of these investments.
Mortgages Payable and HP A&M Receivable
In conjunction with HP A&M defaulting on certain promissory notes in fiscal year 2012, the Company has the right to collect from HP A&M any amounts the Company spends to protect its interest from the defaulted notes. Accordingly the Company has recorded the entire amount of the HP A&M notes at default as well as expenses incurred to cure the defaults as a receivable from HP A&M less proceeds received from the sale of shares held in escrow pursuant to the asset purchase agreement (“The Arkansas River Agreement”). The receivable represents the amount of the defaulted promissory notes payable by HP A&M which were purchased by the Company and with respect to which the Company will pursue remedies under the Arkansas River agreement (as described in more detail in Note 4) over the next 12 months, plus expenses as noted above.
In the fiscal year 2013 the Company began acquiring the defaulted promissory notes that are payable by HP A&M. The majority of the notes issued by the Company have a five-year term, bear interest at an annual rate of five percent (5%) and require semi-annual payments with a straight-line amortization schedule, (see Note 7 – Long term debt and operating lease).
Cash Flows
The Company paid $123,500 in interest during the fiscal year ended August 31, 2013. The Company did not pay any interest during the fiscal years ended August 31, 2012 and 2011, respectively.
The Company did not pay any income taxes during the fiscal years ended August 31, 2013, 2012 and 2011, respectively.
Trade Accounts Receivable
The Company records accounts receivable net of allowances for uncollectible accounts. Included in trade accounts receivable are balances due from farm operations. The Company recorded an allowance for uncollectible accounts in the amounts of $41,100 and $20,400 as of August 31, 2013 and 2012, respectively. The allowance for uncollectible accounts was determined based on specific review of all past due accounts.
Long-Lived Assets
The Company reviews its long-lived assets for impairment whenever events or changes in circumstances indicate that the carrying amount of an asset may not be recoverable. Recoverability of assets to be held and used is measured by a comparison of the carrying amount of an asset to future undiscounted net cash flows expected to be generated by the eventual use of the asset. If such assets are considered to be impaired, the impairment to be recognized is measured by the amount by which the carrying amount of the assets exceeds the fair value of the assets. Assets to be disposed of are reported at the lower of the carrying amount or fair value less costs to sell. Based on the Company’s procedures, the Company determined that its “Paradise Water Supply” asset (defined in Note 4 below) and land and water rights held for sale related to the Arkansas River Assets were impaired as of August 31, 2012. The Company determined that no impairment of such assets existed at August 31, 2013. There was no impairment in the carrying amounts of the remaining long-lived assets at August 31, 2013 and 2012. See further discussion in Note 4 below under sections “Paradise Water Supply” and “Arkansas River Assets”.
PURE CYCLE CORPORATION
NOTES TO CONSOLIDATED FINANCIAL STATEMENTS
August 31, 2013, 2012 and 2011
Capitalized Costs of Water and Wastewater Systems and Depreciation and Depletion Charges
Costs to construct water and wastewater systems that meet the Company’s capitalization criteria are capitalized as incurred, including interest, and depreciated on a straight-line basis over their estimated useful lives of up to thirty years. The Company capitalizes design and construction costs related to construction activities and it capitalizes certain legal, engineering and permitting costs relating to the adjudication and improvement of its water assets.
The Company depletes its water assets that are being utilized on the basis of units produced (i.e. thousands of gallons sold) divided by the total volume of water adjudicated in the water decrees.
Tap Participation Fee Liability and Imputed Interest Expense
The Tap Participation Fee liability (“TPF”), as described in Note 7 – Long Term Debt and Operating Lease, represents the discounted fair value of the amounts the Company estimates it will pay HP A&M pursuant to the Arkansas River Agreement. The Company imputes interest expense on the unpaid TPF using the effective interest imputed over the estimated development period. The company imputed interest of $3.3 million, $3.5 million and $3.8 million during the years ended August 31, 2013, 2012 and 2011, respectively.
The TPF is due and payable once the Company has sold a water tap and received the consideration due for such water tap. The Company did not sell any water taps during the years ended August 31, 2013, 2012 or 2011. As of August 31, 2013, 17,194 water taps remain subject to the TPF.
Revenue Recognition
The Company generates revenues through two separate lines of businesses. Its revenues are derived through its Wholesale Water and Wastewater business and its Agricultural Farming Operations, which are described below.
Wholesale Water and Wastewater business – The Company generates revenues through its wholesale water and wastewater segment predominately from three sources: (i) monthly wholesale water usage fees and wastewater service fees, (ii) one time water and wastewater tap fees, and construction fees, and (iii) consulting fees. Because these items are separately delivered, the Company accounts for each of the items separately, as described below.
| | i) | Monthly wholesale water and wastewater service fees – Monthly wholesale water usage charges are assessed to the Company’s customers based on actual metered usage each month plus a base monthly service fee assessed per single family equivalent (“SFE”) unit served. One SFE is a customer, whether residential, commercial or industrial, that imparts a demand on the Company’s water or wastewater systems similar to the demand of a family of four persons living in a single family house on a standard sized lot. One SFE is assumed to have a water demand of approximately 0.4 acre feet per year and to contribute wastewater flows of approximately 300 gallons per day. Water usage pricing uses a tiered pricing structure. The Company recognizes wholesale water usage revenues upon delivering water to its customers or its governmental customers’ end-use customers, as applicable. The water revenues recognized by the Company are shown net of royalties to the Land Board and, when applicable, amounts retained by the Rangeview Metropolitan District (the “District”). |
The Company recognizes wastewater processing revenues monthly based on usage. The monthly wastewater service fees are shown net of amounts retained by the District. Amounts recognized for water and wastewater services during the fiscal years ended August 31, 2013, 2012 and 2011, are presented in the statements of operations. Costs of delivering water and providing wastewater service to customers are recognized as incurred.
PURE CYCLE CORPORATION
NOTES TO CONSOLIDATED FINANCIAL STATEMENTS
August 31, 2013, 2012 and 2011
The Company delivered 69.2 million, 34.2 million and 34.5 million gallons of water to customers during the fiscal years ended August 31, 2013, 2012 and 2011, respectively.
| | ii) | Water and wastewater tap fees and construction fees – Tap fees, also called system development fees, are received in advance, are non-refundable and are typically used to fund construction of certain facilities and defray the acquisition costs of obtaining water rights. Construction fees are fees used by the Company to construct assets that are typically required to be constructed by developers or home builders. |
Proceeds from tap fees and construction fees are deferred upon receipt and recognized in income either upon completion of construction of infrastructure or ratably over time, depending on whether the Company owns the infrastructure constructed with the proceeds or a customer owns the infrastructure constructed with the proceeds.
Tap and construction fees derived from agreements in which the Company will not own the assets constructed with the fees are recognized as revenue using the percentage-of-completion method. Costs of construction of the assets when the Company will not own the assets are recorded as construction costs.
Tap and construction fees derived from agreements for which the Company will own the infrastructure are recognized as revenues ratably over the estimated accounting service life of the facilities constructed, starting at completion of construction, which could be in excess of thirty years. Costs of construction of the assets when the Company will own the assets are capitalized and depreciated over their estimated economic lives.
In August 2005, the Company entered into the Water Service Agreement (the “County Agreement”) with Arapahoe County (the “County”) to provide water service to the County’s fairgrounds (the “Fairgrounds”). Pursuant to the County Agreement, the Company owns the facilities which store, treat, and deliver the water and amortizes the cost of these facilities over their useful lives. In each of the three fiscal years ended August 31, 2013, 2012 and 2011, the Company recognized $14,300 of tap fee revenue. At August 31, 2013, $327,600 of these tap fees are still deferred. The Company recognized $41,500 of “Special Facilities” funding as revenue in each of the three fiscal years ended August 31, 2013, 2012, and 2011 respectively. These construction revenues also relate to the County Agreement entered into in August 2005. As of August 31, 2013, the Company has deferred recognition of $1.3 million of tap and construction fee revenue from the County, which will be recognized as revenue ratably through 2036.
In addition to the tap fee revenues and the construction revenues, the Company also records interest income from the County using the effective interest method. Pursuant to the County Agreement, the County is making payments to the Company totaling $82,200 per year for the construction of the Special Facilities at the Fairgrounds. These payments include interest at 6% per annum. In April 2013 the County paid the balance on the note. The Company recognized $5,500, $19,200 and $22,900 of interest income from the County during the fiscal years ended August 31, 2013, 2012 and 2011, respectively.
In August 2012, the Company entered into an agreement with Front Range Pipeline which grants Front Range Pipeline easement rights for a period of three years to construct a pipeline for total consideration of $28,700. As of August 31, 2013, the Company had $18,900 in deferred revenue from Front Range Pipeline.
| | iii) | Consulting Fees – Consulting fees are fees we receive, typically on a monthly basis, from municipalities and area water providers along the I-70 corridor, for system management and maintenance |
Agricultural Farming Operations –The Company leases its Arkansas River water and land to area farmers who actively farm the properties. Prior to August 3, 2012, pursuant to a property management agreement between HP A&M and the Company (the “Property Management Agreement”), HP A&M received a management fee equal to 100% of the income from the land and water leases. As a result, the Company presented its land and water lease income net of the management fees paid to HP A&M. Effective August 3, 2012, the Company terminated the Property Management Agreement due to a default by HP A&M on certain promissory notes secured by deeds of trust on the land and water purchased by the Company from HP A&M in 2006. Effective August 3, 2012, the Company manages the land and water leases and the income from the land and water leases became payable to the Company. Pursuant to the farm lease agreements, the Company bills the lessees semi-annually in March and November. Thelease billings include minimum billings and adjustments based on actual water deliveries by the Fort Lyon Canal Company (“FLCC”) or are based on crop yields. Subsequent to August 3, 2012, the Company records farm lease income ratably each month based on estimated annual lease income the Company anticipates collecting from its land and water leases.TheCompany recorded these amounts as receivables, less an estimated allowance for uncollectible accounts. The allowance as of August 31, 2013, was determined by the Company’s specific review of all past due accounts. The Company has recorded allowances for doubtful accounts totaling $41,100 and $20,400 as of August 31, 2013 and 2012, respectively. As of August 31, 2013 the company has accrued $397,300 of farm income related to billings for future periods. The Company manages the farm lease business as a separate line of business from the wholesale water and wastewater business.
PURE CYCLE CORPORATION
NOTES TO CONSOLIDATED FINANCIAL STATEMENTS
August 31, 2013, 2012 and 2011
Royalty and other obligations
Revenues from the sale of Export Water are shown net of royalties payable to the Land Board. Revenues from the sale of water on the “Lowry Range” are shown net of the royalties to the Land Board and the amounts retained by the District. See further description of the “Lowry Range” in Note 4 – Water Assets under section “Rangeview Water Supply and Water System”.
Oil and Gas Lease Payments
As further described in Note 4 below, on March 10, 2011, the Company entered into a Paid-Up Oil and Gas Lease (the “O&G Lease”) and a Surface Use and Damage Agreement (the “Surface Use Agreement”) with Anadarko E&P Company, L.P. (“Anadarko”) a wholly owned subsidiary of Anadarko Petroleum Company. Pursuant to the O&G Lease on March 10, 2011, the Company received an up-front payment of $1,243,400 from Anadarko for the purpose of exploring for, developing, producing and marketing oil and gas on approximately 634 acres of mineral estate owned by the Company at its Sky Ranch property. In December 2012 the O&G Lease was purchased by a wholly owned subsidiary of ConocoPhillips Company. The Company began recognizing the up-front payment from Anadarko as income on a straight-line basis over three years (the initial term of the O&G Lease) on March 10, 2011. During the years ended August 31, 2013, 2012 and 2011, the Company recognized $416,000, $423,000 and $199,000 respectively, of income related to the up-front payments received pursuant to the O&G Lease.
As of August 31, 2013, the Company has deferred recognition of $235,500 of income related to the O&G Lease, which will be recognized into income ratably through February 2014.
Share-based Compensation
The Company maintains a stock option plan for the benefit of its employees and directors. The Company records share-based compensation costs which are measured at the grant date based on the fair value of the award and are recognized as expense over the applicable vesting period of the stock award using the straight-line method. The Company has adopted the alternative transition method for calculating the tax effects of share-based compensation which allows for a simplified method of calculating the tax effects of employee share-based compensation. Because the Company has a full valuation allowance on its deferred tax assets, the granting and exercise of stock options during the fiscal years ended August 31, 2013 and 2012 had no impact on the income tax provisions.
The Company recognized $66,800, $54,600 and $94,600 of share-based compensation expenses during the fiscal years ended August 31, 2013, 2012 and 2011, respectively.
Income Taxes
The Company uses a “more-likely-than-not” threshold for the recognition and de-recognition of tax positions, including any potential interest and penalties relating to tax positions taken by the Company. The Company does not have any significant unrecognized tax benefits as of August 31, 2013.
The Company files income tax returns with the Internal Revenue Service and the State of Colorado. The tax years that remain subject to examination are fiscal 2009 through fiscal 2012. The Company does not believe there will be any material changes in its unrecognized tax positions over the next twelve months.
The Company’s policy is to recognize interest and penalties accrued on any unrecognized tax benefits as a component of income tax expense. At August 31, 2013, the Company did not have any accrued interest or penalties associated with any unrecognized tax benefits, nor was any interest expense recognized during the fiscal years ended August 31, 2013, 2012 or 2011.
PURE CYCLE CORPORATION
NOTES TO CONSOLIDATED FINANCIAL STATEMENTS
August 31, 2013, 2012 and 2011
Loss per Common Share
Loss per common share is computed by dividing net loss by the weighted average number of shares outstanding during each period. Common stock options and warrants aggregating 347,600, 215,100 and 280,100 common share equivalents as of August 31, 2013, 2012 and 2011, respectively, have been excluded from the calculation of loss per common share as their effect is anti-dilutive.
Recently Issued Accounting Pronouncements
The Company continually assesses any new accounting pronouncements to determine their applicability. Where it is determined that a new accounting pronouncement affects the Company’s financial reporting, the Company undertakes a study to determine the consequence of the change to its financial statements and assures that there are proper controls in place to ascertain that the Company’s financials properly reflect the change. A variety of proposed or otherwise potential accounting standards are currently under study by standard-setting organizations and various regulatory agencies. Because of the tentative and preliminary nature of these proposed standards, the Company has not determined whether implementation of such proposed standards would be material to the Company’s financial statements. New pronouncements assessed by the Company recently are discussed below:
In February 2013, the FASB issued ASU No. 2013-02, Comprehensive Income (Topic 220) - Reporting of Amounts Reclassified Out of Accumulated Other Comprehensive Income (“ASU 2013-02). ASU 2013-02 finalizes Proposed ASU No. 2012-240, and seeks to improve the transparency of reporting reclassifications out of accumulated other comprehensive income. ASU 2013-02 is effective prospectively for reporting periods beginning after December 15, 2012 (September 1, 2013 for the Company). The adoption of ASU 2013-02 will not have a material impact on its results of operations, financial condition or cash flows.
In 2013, the FASB issued ASU No. 2013-11, Presentation of an Unrecognized Tax Benefit When a Net Operating Loss Carryforward, a Similar Tax Loss, or a Tax Credit Carryforward Exists (“ASU 2013-11). ASU 2013-02 provides that an unrecognized tax benefit, or a portion, should be presented in the financial statements as a reduction to a deferred tax asset for a net operating loss carryforward, a similar tax loss, or a tax credit carryforward for reporting fiscal years beginning after December 15, 2013 (September 1, 2014 for the Company). The adoption of ASUJ 2013-11 will not have a material impact on its results of operations, financial condition or cash flows.
NOTE 3 – FAIR VALUE MEASUREMENTS
Fair value is defined as the price that would be received to sell an asset or paid to transfer a liability in an orderly transaction between market participants at the measurement date in the principal or most advantageous market. The Company uses a fair value hierarchy that has three levels of inputs, both observable and unobservable, with use of the lowest possible level of input to determine fair value.
Level 1 — Valuations for assets and liabilities traded in active exchange markets, such as the New York Stock Exchange. The Company had none of these instruments at August 31, 2013 or 2012.
Level 2 — Valuations for assets and liabilities obtained from readily available pricing sources via independent providers for market transactions involving similar assets or liabilities. The Company had no Level 2 assets at August 31, 2013 and one Level 2 asset at August 31, 2012, its marketable securities. The Company’s principal markets for these securities are the secondary institutional markets and valuations are based on observable market data in those markets.
PURE CYCLE CORPORATION
NOTES TO CONSOLIDATED FINANCIAL STATEMENTS
August 31, 2013, 2012 and 2011
Level 3 — Valuations for assets and liabilities that are derived from other valuation methodologies, including discounted cash flow models and similar techniques, and not based on market exchange, dealer, or broker traded transactions. Level 3 valuations incorporate certain assumptions and projections in determining the fair value assigned to such assets or liabilities. The Company had one Level 3 liability at August 31, 2013 and 2012, the Tap Participation Fee liability, which is described in greater detail in Note 2 – Summary of Significant Accounting Policies and Note 7 – Long-Term Debt And Operating Lease.
The Company maintains policies and procedures to value instruments using the best and most relevant data available.
The Company’s non-financial assets measured at fair value on a non-recurring basis consist entirely of its investments in water and water systems and other long-lived assets. See Note 4 for impairment of water rights and land with the associated water rights held for sale.
Level 2 Asset – Marketable Securities Measured on a Recurring Basis. The Company’s marketable securities were the Company’s only financial assets measured on a recurring basis. The fair values of the marketable securities are based on the values reported by the financial institutions where the funds are held. These securities included only federally insured certificates of deposit.
Level 3 Liability – Tap Participation Fee. The Company’s Tap Participation Fee liability is the Company’s only financial liability measured on a non-recurring basis. The Tap Participation Fee liability is valued by projecting new home development in the Company’s targeted service area over an estimated development period. Due to the long-term nature of the Tap Participation Fee, the valuation of the Tap Participation Fee is not sensitive to minor changes. See further description of the Tap Participation Fee in Note 7 – Long-Term Debt and Operating Lease.
The following table provides information on the assets and liabilities measured at fair value as of August 31, 2013:
| | | | | | | | | Fair Value Measurement Using: | | | | |
| | | | | | | | | Quoted Prices in | | | | | | Significant | | | Total | |
| | | | | | | | | Active Markets for | | | Significant Other | | | Unobservable | | | Unrealized | |
| | | | | | | | | Identical Assets | | | Observable Inputs | | | Inputs | | | Gains and | |
| | | Fair Value | | Cost / Other Value | | | (Level 1) | | | (Level 2) | | | (Level 3) | | | (Losses) | |
| Tap Participation Fee | | $ | 59,807,289 | | | $ | 59,807,289 | | | $ | — | | | $ | — | | | $ | 59,807,289 | | | $ | — | |
Although not required, the Company deems the following table, which presents the changes in the Tap Participation Fee for the year ended August 31, 2013, to be helpful to the users of its financial statements:
| | | Fair Value Measurement using Significant Unobservable
Inputs (Level 3) | |
| | | | | | | | | Discount - to | |
| | | | | | Tap | | | be imputed as | |
| | | Gross Estimated | | | Participation | | | interest | |
| | | Tap Participation | | | Fee Reported | | | expense in | |
| | | Fee Liability | | | Liability | | | future periods | |
| Balance at August 31, 2012 | | $ | 112,958,000 | | | $ | 68,269,100 | | | $ | 44,688,900 | |
| Total gains and losses (realized and unrealized): | | | | | | | | | | | | |
Imputed interest recorded as “Other Expense” | | | — | | | | 3,275,400 | | | | (3,275,400 | ) |
| Purchases, sales, issuances, payments, and settlements | | | (10,276,100 | ) | | | (11,737,200 | ) | | | 1,461,100 | |
| Transfers in and/or out of Level 3 | | | — | | | | — | | | | — | |
| Balance at August 31, 2013 | | $ | 102,681,900 | | | $ | 59,807,300 | | | $ | 42,874,600 | |
The methodologies for estimating the fair value of financial assets and liabilities that are measured at fair value are discussed above. The methodologies for other financial assets and liabilities are discussed below.
PURE CYCLE CORPORATION
NOTES TO CONSOLIDATED FINANCIAL STATEMENTS
August 31, 2013, 2012 and 2011
Cash and Cash Equivalents: The Company’s cash and cash equivalents are reported using the values as reported by the financial institution where the funds are held. These securities primarily include balances in the Company’s operating and savings accounts. The carrying amount of cash and cash equivalents approximate fair value.
Accounts Receivable and Accounts Payable: The carrying amounts of accounts receivable and accounts payable approximate fair value due to the relatively short period to maturity for these instruments.
Long-term Financial Liabilities: The Comprehensive Amendment Agreement No. 1 the “CAA” is comprised of a recorded balance and an off-balance sheet or “contingent” obligation associated with the Company’s acquisition of its “Rangeview Water Supply” (defined in Note 4 below). The amount payable is a fixed amount but is repayable only upon the sale of “Export Water” (defined in Note 4 below). Because of the uncertainty of the sale of Export Water, the Company has determined that the contingent portion of the CAA does not have a determinable fair value. The CAA is described further in Note 5 – Participating Interests in Export Water.
The recorded balance of the “Tap Participation Fee” liability (as described below) is its estimated fair value determined by projecting new home development in the Company’s targeted service area over an estimated development period.
Notes Receivable and Construction Proceeds Receivable: The carrying amounts of the Company’s notes receivable and construction proceeds receivable approximate fair value as they bear interest at rates which are comparable to current market rates.
HP A&M Receivable: In conjunction with HP A&M defaulting on certain promissory notes, the Company has the right to collect from HP A&M any amounts the Company spends to cure the defaulted notes. Accordingly the Company has recorded the entire amount of the HP A&M notes as a receivable from HP A&M. Due to the fact that HP A&M is a related party the fair value of the accounts receivable is not practical to determine.
Mortgages Payable: During fiscal 2013, the Company began acquiring the defaulted and non-defaulted promissory notes that are payable by HP A&M. The majority of the notes issued by the Company have a five-year term, bear interest at an annual rate of five percent (5%) and require semi-annual payments with a straight-line amortization schedule. The carrying value of the notes payable approximate the fair value as the rates are comparable to market rates.
Off-Balance Sheet Instruments: The Company’s off-balance sheet instruments consist entirely of the contingent portion of the CAA. Because repayment of this portion of the CAA is contingent on the sale of Export Water, which is not reasonably estimable, the Company has determined that the contingent portion of the CAA does not have a determinable fair value. See further discussion in Note 5 – Participating Interests In Export Water.
PURE CYCLE CORPORATION
NOTES TO CONSOLIDATED FINANCIAL STATEMENTS
August 31, 2013, 2012 and 2011
NOTE 4 – WATER ASSETS
The Company’s water and water systems consist of the following approximate costs and accumulated depreciation and depletion as of August 31:
| | | August 31, 2013 | | | August 31, 2012 | |
| | | | | | Accumulated | | | | | | Accumulated | |
| | | | | | Depreciation | | | | | | Depreciation | |
| | | Costs | | | and Depletion | | | Costs | | | and Depletion | |
| Arkansas River assets | | $ | 69,112,300 | | | $ | (1,487,700 | ) | | $ | 69,112,300 | | | $ | (1,315,900 | ) |
| Rangeview water supply | | | 14,667,000 | | | | (7,700 | ) | | | 14,376,100 | | | | (7,100 | ) |
| Sky Ranch water rights and other costs | | | 3,915,100 | | | | (79,800 | ) | | | 3,924,100 | | | | (50,800 | ) |
| Fairgrounds water and water system | | | 2,899,900 | | | | (622,600 | ) | | | 2,899,900 | | | | (534,500 | ) |
| Rangeview water system | | | 167,700 | | | | (72,800 | ) | | | 167,700 | | | | (67,600 | ) |
| Water supply – other | | | 43,200 | | | | (22,400 | ) | | | 25,600 | | | | (19,400 | ) |
| Totals | | | 90,805,200 | | | | (2,293,000 | ) | | | 90,505,700 | | | | (1,995,300 | ) |
| Net investments in water and water systems | | $ | 88,512,200 | | | | | | | $ | 88,510,400 | | | | | |
Depletion and Depreciation
The Company recorded $500 of depletion charges during each of the three fiscal years ended August 31, 2013, 2012 and 2011, respectively. This related entirely to the Rangeview Water Supply (defined below). No depletion is taken against the Arkansas River water or Sky Ranch Water Supply (all are defined below) because the water located at these locations is not yet being utilized for their intended purpose as of August 31, 2013.
The Company recorded $311,300, $309,200 and $300,800 of depreciation expense in each of the fiscal years ended August 31, 2013, 2012 and 2011, respectively. These figures include depreciation for other equipment not included in the table above.
Arkansas River Assets
Arkansas River Water – The Company owns 60,000 acre feet of senior water rights in the Arkansas River and its tributaries in Southeastern Colorado. The Company anticipates that of this, 40,000 acre feet may be available for non-agricultural uses along the front range of Colorado sometime in the future. The Company acquired its Arkansas River assets from HP A&M pursuant to the Arkansas River Agreement entered into on May 10, 2006.
In order to utilize the Arkansas River water in the Company’s service areas, the Company will be required to convert this water to municipal and industrial uses. Change of water use must be done through the Colorado water court and several conditions must be present prior to the water court granting an application for transfer of a water right. A transfer case would be expected to include the following provisions:
| (i) | a provision of anti-speculation in which the applicant must have contractual obligations to provide water service to customers prior to the water court ruling on the transfer of a water right, |
| | |
| (ii) | the applicant can only transfer the “consumptive use” portion of its water rights (the Company expects to face opposition to any consumptive use calculation of the historic agricultural uses of its water), |
| | |
| (iii) | applicants likely would be required to mitigate the loss of tax base in the basin of origin, |
| | |
| (iv) | applicants would likely have re-vegetation requirements to restore irrigated soils to non-irrigated, and |
| | |
| (v) | applicants would be required to meet water quality measures which would be included in the cost of transferring the water rights. |
The value of the assets was recorded based on the determined fair value of the consideration paid at the acquisition date, because the value of the consideration was deemed a more reliable criterion of value than the value of the acquired assets. The consideration paid was comprised of equity (3.0 million shares of the Company’s common stock) and the Tap Participation Fee. Because the estimated value of the consideration paid was less than the total estimated fair value of the assets acquired by the Company, the relative values assigned to the assets were ratably reduced. For a discussion of promissory notes owed by HP A&M to third parties which are secured by the Company’s Arkansas River water rights, see “Arkansas River Land” section below, Note 7 – Long Term Debt and Operating Lease, and Note 15 – Subsequent Events.
PURE CYCLE CORPORATION
NOTES TO CONSOLIDATED FINANCIAL STATEMENTS
August 31, 2013, 2012 and 2011
Fort Lyon Canal Company (“FLCC”) Shares – The Arkansas River water rights are represented by 21,782 shares of the FLCC, which is a non-profit mutual ditch company established in the late 1800’s that operates and maintains the 110 mile Fort Lyon Canal between La Junta, Colorado and Lamar, Colorado. The shares in the FLCC represent the amount of water the Company owns in the Fort Lyon Canal.
Pursuant to the Arkansas River Agreement, the Company pledged to HP A&M: (i) one-half of the FLCC shares purchased by the Company, (ii) all shares of FLCC hereafter issued to the Company by means of any dividend or distribution in respect of the shares pledged hereunder (together with the shares identified in (i), the “Company’s Pledged Shares”), (iii) the certificates representing the Company’s Pledged Shares, (iv) the land associated with the water represented by the Company’s Pledged Shares, and (v) all rights to money or property which the Company now has or hereafter acquires in respect of the Company’s Pledged Shares. This pledge agreement will terminate upon payment of the Tap Participation Fee.
Arkansas River Land – The Company owns approximately 16,700 acres of real property which is being used for agricultural purposes and was acquired from HP A&M in 2006 in connection with the water acquisition described above. The land is located in the counties of Bent, Otero and Prowers in southern Colorado. The Company also owns certain contract rights, tangible personal property, mineral rights, and other water interests related to the Arkansas River water and land.
The land owned by the Company is divided into 80 separate properties, each of which is being leased to area farmers. Most of the operating leases expire on December 31, 2014, while the remaining leases have a variety of expiration dates. Pursuant to a property management agreement between HP A&M and the Company (the “Property Management Agreement”), HP A&M had the right to pursue leasing of the land and Arkansas River water to interested parties with all lease income associated with leasing the land and Arkansas River water, together with all costs associated with these activities, being the sole opportunity and obligation of HP A&M. The Property Management Agreement’s initial term expired on August 31, 2011 and beginning September 1, 2011, the Property Management Agreement entered into the “Extended Term” which could extend the Property Management Agreement until September 2014 at the latest. During the Extended Term, HP A&M was to continue to manage the leases and receive all lease payments from the lessees as a management fee. Beginning September 1, 2011, until the Property Management Agreement was terminated the Company allocated 26.9% (calculated pursuant to the Property Management Agreement based on consideration paid to HP A&M since the signing of the Arkansas River Agreement) of the net revenues paid to HP A&M (which is the lease payments HP A&M retains less expenses for employees, reasonable overhead and actual expenses paid to manage the farm leases) against the Tap Participation Fee liability. Because the Company did not have the risk of loss associated with the leases (HP A&M’s management fee was equal to all lease income and contractually HP A&M had the risk of loss on the leases), the lease income and management fees are reflected on a net basis throughout the initial and Extended Terms of the Property Management Agreement until termination on August 3, 2012.
The Property Management Agreement was terminated on August 3, 2012 due to defaults by HP A&M on certain promissory notes secured by deeds of trust on the Company’s land and water. On July 23, 2012, the Company notified all the farm lessees that HP A&M had notified the Company that HP A&M intended to default on its obligations under the promissory notes issued by HP A&M to purchase farms and water rights in the Fort Lyon Canal system. The lessees were informed that all lease payments would be billed directly by and paid directly to the Company from the date of the notice forward. All other terms of the leases remained unchanged. Under the farm lease agreements, the farmers are billed twice a year in November and March. The Company received lease income from farm leases of approximately $1,241,900 and $71,100 (recorded as revenue for fiscal 2013 and other income for fiscal 2012) for the fiscal years ended August 31, 2013 and 2012, respectively. The allocation of 26.9% of the net revenues against the Tap Participation Fee, the termination of the Property Management and the defaults by HP A&M are described in greater detail in Note 7 – Long-Term Debt and Operating Lease.
PURE CYCLE CORPORATION
NOTES TO CONSOLIDATED FINANCIAL STATEMENTS
August 31, 2013, 2012 and 2011
Land and Water Shares Held for Sale
During fiscal year end 2012, management decided to sell certain farms in order to have the cash flow sufficient to acquire the notes defaulted upon by HP A&M and to meet the future obligations on the promissory notes the Company intends to issue as consideration to purchase the notes owed by HP A&M. Management is anticipating selling approximately 1,603 acres of land along with 3,397 FLCC shares associated with this land. The net book value of the assets held for sale prior to being impaired at August 31, 2012 was $12.2 million. The negotiated sale price for these assets is $5.7 million which resulted in a loss of $6.5 million, which was expensed in fiscal 2012.
Rangeview Water Supply and Water System
The “Rangeview Water Supply” consists of 25,050 acre feet and is a combination of tributary surface water and groundwater rights along with certain storage rights associated with the Lowry Range, a 27,000-acre property owned by the Land Board located 16 miles southeast of Denver, Colorado. The $14.7 million on the Company’s balance sheet as of August 31, 2013, represents the costs of assets acquired or facilities constructed to extend water service to customers located on and off the Lowry Range. The recorded costs of the Rangeview Water Supply include payments to the sellers of the Rangeview Water Supply, design and construction costs and certain direct costs related to improvements to the asset including legal and engineering fees.
The Company acquired the Rangeview Water Supply beginning in 1996 when:
| (i) | The District entered into the Amended and Restated Lease Agreement with the Land Board, which owns the Lowry Range; |
| (ii) | The Company entered into the Agreement for Sale of Export Water with the District, a quasi-municipal political subdivision of the State of Colorado; |
| (iii) | The Company entered into the Service Agreement with the District for the provision of water service to the Lowry Range; and |
| (iv) | In 1997, the Company entered into the Wastewater Service Agreement with the District for the provision of wastewater service to the District’s service area (collectively these agreements are referred to as the “Rangeview Water Agreements”). |
Pursuant to the Rangeview Water Agreements, the Company has the exclusive right, through 2081, to use 13,400 acre feet of the Rangeview Water Supply specifically on the Lowry Range. The Rangeview Water Agreements also provide for the Company to use surface reservoir storage capacity in providing water service to customers both on and off the Lowry Range. The Company owns the rights to use the remaining 11,650 acre feet groundwater, which can be exported off the Lowry Range to serve area users (referred to as “Export Water”). The Company also has the option with the Land Board to exchange an aggregate gross volume of 165,000 acre feet of groundwater for 1,650 acre feet per year of adjudicated surface water and to use this surface water as Export Water.
Services on the Lowry Range – Pursuant to the Rangeview Water Agreements, the Company designs, finances, constructs, operates and maintains the District’s water and wastewater systems to provide service to the District’s customers on the Lowry Range. The Company will operate both the water and the wastewater systems during the contract period and the District owns both systems. After 2081, ownership of the water system will revert to the Land Board, with the District retaining ownership of the wastewater system.
Rates and charges for all water and wastewater services on the Lowry Range, including tap fees and usage or monthly fees, are governed by the terms of the Rangeview Water Agreements. Rates and charges are required to be less than the average of similar rates and charges of three surrounding municipal water and wastewater service providers, which are reassessed annually. Pursuant to the Rangeview Water Agreements the Land Board receives a 12% royalty on all gross revenues received from water sales to customers on the Lowry Range. The District retains 5% of the remaining gross revenues and the Company receives 95% of the remaining gross revenues after the Land Board Royalty. The Land Board does not receive a royalty on wastewater fees. The Company receives 100% of the District’s wastewater tap fees and 90% of the District’s wastewater usage fees (the District retains the other 10%).
PURE CYCLE CORPORATION
NOTES TO CONSOLIDATED FINANCIAL STATEMENTS
August 31, 2013, 2012 and 2011
Export Water – The Company owns the Export Water and uses and intends to use it to provide water and wastewater services to customers off the Lowry Range. The Company will own all facilities required to extend water and wastewater services using its Export Water. The Company anticipates contracting with third parties for the construction of these facilities. If the Company sells Export Water, the Company is required to pay royalties to the Land Board ranging from 10% of gross revenues to 50% of net revenue after deducting certain costs.
The County Fairgrounds Water and Water System
The Company owns 321 acre feet of groundwater purchased pursuant to the County Agreement. The Company plans to use this water in conjunction with its Rangeview Water Rights in providing water to areas outside the Lowry Range. The $2.9 million of capitalized costs includes the costs to construct various Wholesale and Special Facilities, including a new deep water well, a 500,000 gallon water tank and pipelines to transport water to the Fairgrounds.
Sky Ranch
In 2010 the Company purchased approximately 931 acres of undeveloped land known as Sky Ranch. The property includes the rights to 820 acre feet of water.
Total consideration for the land and water included the $7.0 million purchase price, plus direct costs and fees of $554,100. The Company allocated the total acquisition cost to the land and water rights based on estimates of each asset’s respective fair value.
At August 31, 2013 Sky Ranch Metropolitan District #5 owed The Company approximately $57,300 for various costs associated with establishing and operating the district. The Company anticipates these costs will be recovered through property tax assessments.
O&G Lease – On March 10, 2011, the Company entered into the O&G Lease and the Surface Use Agreement with Anadarko. Pursuant to the O&G Lease, the Company received an up-front payment of $1,243,400 from Anadarko for the purpose of exploring for, developing, producing and marketing oil and gas on 634 acres of mineral estate owned by the Company at its Sky Ranch property. The Company also received $9,000 in surface use and damage payments.
Paradise Water Supply
In 1987, the Company acquired water, water wells, and related assets from Paradise Oil, Water and Land Development, Inc., which constitute the “Paradise Water Supply.” Every six years the Paradise Water Supply is subject to a finding of reasonable diligence review by the water court and the State Engineer. For a favorable finding, the Company must demonstrate that it is diligently pursuing the development of the water rights. If the Company does not receive a favorable finding of reasonable diligence, it will lose its right to the Paradise Water Supply. The most recent diligence review was started in our fiscal 2005 and was completed in 2008, but not without objectors and not without the Company having to agree to certain stipulations to remove the objections. In order to continue to maintain the Paradise water right, by 2014 the Company must (i) select an alternative reservoir site; (ii) file an application in water court to change the place of storage; (iii) identify specific end users and places of use for the water; and (iv) identify specific source(s) of the water rights for use. Management does not intend to spend the resources needed to find an alternative reservoir site without a specific use for the water. The Company has been unable to find potential customers for this water and cannot be certain that a customer will commit to use the water within the next two years. Since the Company does not have a customer that will commit to use the water and the Company will not commit the resources necessary to move the reservoir site in the absence of a customer, the Company expects to lose these conditional water rights. Accordingly during the fourth quarter of fiscal 2012, the Company determined the Paradise Water Supply was fully impaired and an impairment charge of $5.5 million was recorded. The Company is currently in the process of disposing of the Paradise Water Supply.
PURE CYCLE CORPORATION
NOTES TO CONSOLIDATED FINANCIAL STATEMENTS
August 31, 2013, 2012 and 2011
NOTE 5 – PARTICIPATING INTERESTS IN EXPORT WATER
The Company acquired its Rangeview Water Supply through various amended agreements entered into in the early 1990’s. The acquisition was consummated with the signing of the CAA in 1996. Upon entering into the CAA, the Company recorded an initial liability of $11.1 million, which represented the cash the Company received from the participating interest holders that was used to purchase the Company’s Export Water (described in greater detail in Note 4 – Water Assets to the 2013 Annual Report). The Company agreed to remit a total of $31.8 million of proceeds received from the sale of Export Water to the participating interest holders in return for their initial $11.1 million investments. The obligation for the $11.1 million was recorded as debt, and the remaining $20.7 million contingent liability was not reflected on the Company’s balance sheet because the obligation to pay this is contingent on the sale of Export Water, the amounts and timing of which are not reasonably determinable.
The CAA obligation is non-interest bearing, and if the Export Water is not sold, the parties to the CAA have no recourse against the Company. If the Company does not sell the Export Water, the holders of the Series B Preferred Stock are also not entitled to payment of any dividend and have no contractual recourse against the Company.
As the proceeds from the sale of Export Water are received and the amounts are remitted to the external CAA holders, the Company allocates a ratable percentage of this payment to the principal portion (the Participating Interests in Export Water Supply liability account) with the balance of the payment being charged to the contingent obligation portion. Because the original recorded liability, which was $11.1 million, was 35% of the original total liability of $31.8 million, 35% of each payment remitted to the CAA holders is allocated to the recorded liability account. The remaining portion of each payment, or 65%, is allocated to the contingent obligation, which is recorded on a net revenue basis.
From time to time the Company repurchased various portions of the CAA obligations in priority. The Company did not make any CAA acquisitions during the fiscal years ended August 31, 2013 and 2012. As a result of the acquisitions, and due to the sale of Export Water, as detailed in the table below, the remaining potential third party obligation at August 31, 2013, is $3.4 million:
| | | Export Water | | | Initial Export | | | Total Potential | | | Paticipating | | | | |
| | | Proceeds | | | Water Proceeds | | | Third party | | | Interests | | | | |
| | | Received | | | to Pure Cycle | | | Obligation | | | Liability | | | Contingency | |
| Original balances | | $ | — | | | $ | 218,500 | | | $ | 31,807,700 | | | $ | 11,090,600 | | | $ | 20,717,100 | |
| Activity from inception until August 31, 2012: | | | | | | | | | | | | | | | | | |
| Acquisitions | | | — | | | | 28,077,500 | | | | (28,077,500 | ) | | | (9,790,000 | ) | | | (18,287,500 | ) |
Option payments - Sky Ranch and The Hills at Sky Ranch | | | 110,400 | | | | (42,300 | ) | | | (68,100 | ) | | | (23,800 | ) | | | (44,300 | ) |
| Arapahoe County tap fees * | | | 533,000 | | | | (373,100 | ) | | | (159,900 | ) | | | (55,800 | ) | | | (104,100 | ) |
| Export Water sale payments | | | 111,300 | | | | (77,900 | ) | | | (33,400 | ) | | | (12,100 | ) | | | (21,300 | ) |
| Balance at August 31, 2012 | | | 754,700 | | | | 27,802,700 | | | | 3,468,800 | | | | 1,208,900 | | | | 2,259,900 | |
| Fiscal 2013 activity: | | | | | | | | | | | | | | | | | | | | |
| Export Water sale payments | | | 158,000 | | | | (110,600 | ) | | | (47,400 | ) | | | (16,000 | ) | | | (31,400 | ) |
| Balance at August 31, 2013 | | $ | 912,700 | | | $ | 27,692,100 | | | $ | 3,421,400 | | | $ | 1,192,900 | | | $ | 2,228,500 | |
* The Arapahoe County tap fees are less $34,522 in royalties paid to the Land Board.
The CAA includes contractually established priorities which call for payments to CAA holders in order of their priority. This means the first three payees receive their full payment before the next priority level receives any payment and so on until full repayment. The Company will receive $5.1 million of the first priority payout (the remaining entire first priority payout totals $7.3 million as of August 31, 2013).
NOTE 6 – ACCRUED LIABILITIES
At August 31, 2013, the Company had accrued liabilities of $264,700, of which $156,200 was for estimated property taxes on the Sky Ranch property, $56,700 was for professional fees, $30,300 for prepaid farm lease payments and the remaining $21,500 was related to operating payables.
PURE CYCLE CORPORATION
NOTES TO CONSOLIDATED FINANCIAL STATEMENTS
August 31, 2013, 2012 and 2011
At August 31, 2012, the Company had accrued liabilities of $172,600, of which $60,500 was for estimated property taxes on the Sky Ranch property, $56,800 was for professional fees, $33,500 for prepaid farm lease payments and the remaining $21,800 was related to operating payables.
NOTE 7 – LONG-TERM DEBT AND OPERATING LEASE
As of August 31, 2013, the Company is subject to mortgages with contractual maturity dates as described below.
The Participating Interest in Export Water supply and the Tap Participation Fee payable to HP A&M are obligations of the Company that have no scheduled maturity dates. Therefore, these liabilities are not disclosed in tabular format. However, the Participating Interest in Export Water supply is described in Note 5 – Participating Interest in Export Water and the Tap Participation Fee is described below in section “Tap Participation Fee Payable to HP A&M”.
Tap Participation Fee Payable to HP A&M
The $59.8 million Tap Participation Fee liability at August 31, 2013, represents the estimated discounted fair value of the Company’s obligation to pay HP A&M 20% of the Company’s gross proceeds, or the equivalent thereof, from the sale of the next 17,194 water taps sold by the Company.
Initially the obligation was to pay 10% of the Company’s gross proceeds, or the equivalent thereof, from the sale of 40,000 water taps sold after the date of the Arkansas River Agreement. The 40,000 water taps were reduced to 17,194 water taps as a result of (i) sales of Arkansas River Valley land in 2006 and 2009, (ii) the sale of unutilized water rights owned by the Company in the Arkansas River Valley in 2007, (iii) the election made by HP A&M, effective September 1, 2011, pursuant to the Arkansas River Agreement, to increase the Tap Participation Fee percentage from 10% to 20%, and to take a corresponding 50% reduction in the number of taps subject to the Tap Participation Fee, (iv) the allocation of 26.9% of the Net Revenues (defined as all lease and related income received from the farms less employee expenses, direct expenses for managing the leases and a reasonable overhead allocation) received by HP A&M from management of the farm leasing operations from September 1, 2011 to August 3, 3012 prior to termination of the Property Management Agreement, and (v) the reduction of 2,233 taps as the result of foreclosures on certain farms pursuant to the remedies outlined in the Arkansas River Agreement.
The fair value of the TPF liability is an estimate prepared by management of the Company. The fair value of the liability is based on discounted estimated cash flows subject to the TPF calculated by projecting future annual water tap sales for the number of taps subject to the TPF at the date of valuation. Future cash flows from water tap sales are estimated by utilizing the following historical information, where available:
| | ● | New homes constructed in the area known as the 11-county “Front Range” of Colorado from the 1980’s through the valuation date. The Company utilized data for this length of time to provide development information over many economic cycles because the Company anticipates development in its targeted service area to encompass many economic cycles over the development period. |
| | ● | New home construction patterns for large master planned housing developments along the Front Range. The Company utilized this information because these developments are deemed comparable to projects anticipated to be constructed in the Company’s targeted service area (i.e. these master planned communities were located in predominately undeveloped areas on the outskirts of the Front Range). |
| | ● | Population growth rates for Colorado and the Front Range. Population growth rates were utilized to predict anticipated growth along the Front Range, which was used to predict an estimated number of new homes necessary to house the increased population. |
| | ● | The Consumer Price Index since the 1980’s, which was utilized to project estimated future water tap fees. |
PURE CYCLE CORPORATION
NOTES TO CONSOLIDATED FINANCIAL STATEMENTS
August 31, 2013, 2012 and 2011
Utilizing this historical information, the Company projected an estimated new home development pattern in its targeted service area sufficient to cover the sale of the water taps subject to the Tap Participation Fee at the date of the revaluation, August 31, 2013. The Company revaluated the TPF payable as of August 31, 2013 due to the reduction of taps subject to the TPF related to remedies under the Arkansas River Agreement. The estimated proceeds generated from the sale of those water taps resulted in estimated payments to HP A&M over the life of the projected development period of $102.7 million, which is a decrease of $17.9 million from the previous valuation completed in fiscal 2012 ($120.6 million). The estimated payments to HP A&M are then discounted to the current valuation date and the difference between the amount reflected on the Company’s balance sheet at the valuation date and the total estimated payments is imputed as interest expense over the estimated development time using the effective interest method. The implied interest rate for the most recent valuation was 5.0%.
Actual new home development in the Company’s service area and actual future tap fees inevitably will vary significantly from the Company’s estimates, which could have a material impact on the Company’s consolidated financial statements. An important component in the Company’s estimate of the value of the TPF, which is based on historical trends, is that the Company reasonably expects water tap fees to continue to increase in the coming years. Tap fees are market based and the continued increase in tap fees reflects, among other things, the increasing costs to acquire and develop new water supplies. Tap fees thus are partially indicative of the increasing value of the Company’s water assets. The Company continues to assess the value of the TPF liability and updates its valuation analysis whenever events or circumstances indicate the assumptions used to estimate the value of the liability have changed materially. The difference between the net present value and the estimated realizable value will be imputed as interest expense using the effective interest method over the estimated development period utilized in the valuation of the TPF.
Payment of the TPF may be accelerated in the event of a merger, reorganization, sale of substantially all assets, or similar transactions and in the event of bankruptcy and insolvency events. Pursuant to the default provisions of the Company’s agreement with HP A&M. The Company reduced the discounted present value of the TPF by $11.7 million during the fiscal year-end August 31, 2013. The Company recorded the decrease in the TPF payable as an equity transaction due to the related party nature of the original transaction. Through August 31, 2013 $26.1 million of interest has been imputed since the acquisition date, recorded using the effective interest method.
Promissory Notes Payable by HP A&M in default
Approximately 60 of the 80 properties the Company originally acquired from HP A&M are subject to outstanding promissory notes payable to third parties that are secured by deeds of trust on the Company’s properties and water rights, as well as mineral interests. HP A&M has now defaulted on all of the promissory notes and informed the Company that it does not intend to pay any of the amounts owed. HP A&M owed approximately $9.6 million of principal and accrued interest as of September 1, 2012. These promissory notes are secured by approximately 14,000 acres of land and 16,882 FLCC shares representing water rights owned by the Company.
On July 2, 2012, the Company formally notified HP A&M that its failure to pay the promissory notes constituted an Event of Default under the Seller Pledge Agreement (as defined below) and a default of a material covenant under the Arkansas River Agreement. The Company informed HP A&M that unless such defaults were cured within thirty days, the Property Management Agreement would be terminated and the Company would proceed to exercise certain rights and remedies under the Arkansas River Agreement, the Seller Pledge Agreement, and the Property Management Agreement to protect its assets. The Company’s remedies at law and under the Arkansas River Agreement and related agreements include, but are not limited to, the right to (i) foreclose on 1,500,000 shares of Pure Cycle common stock issued to HP A&M and the proceeds therefrom (the “Pledged Shares”) which were pledged by HP A&M pursuant to a pledge agreement (the “Seller Pledge Agreement”) to secure the payment and performance by HP A&M of the promissory notes described above; (ii) reduce the Tap Participation Fee; (iii) terminate the Property Management Agreement; and (iv) recover damages caused by the defaults, including certain costs and expenses, including attorneys’ fees.
On August 3, 2012, the Company formally terminated the Property Management Agreement. On September 27, 2012, the Pledged Shares were sold at auction in a foreclosure sale for $2.35 per share, yielding approximately $3.42 million of proceeds to the Company (net of fees of $110,000). Pursuant to the Arkansas River Agreement, the Company is reducing the Tap Participation Fee and is entitled to recover damages caused by the defaults, including certain costs and expenses, including attorney fees. The Company is currently pursuing its remedies and will continue to pursue such remedies over the next 12 months.
PURE CYCLE CORPORATION
NOTES TO CONSOLIDATED FINANCIAL STATEMENTS
August 31, 2013, 2012 and 2011
To protect its land and water interests, during the fiscal ended August 31, 2013, the Company purchased approximately $7.0 million of the $9.6 million notes payable by HP A&M and is negotiating the purchase of the remaining $2.6 million with the holders. HP A&M continues to be liable for making the required payments on the notes, and the Company is pursuing remedies to recover the costs and expenses, including attorneys’ fees, incurred by the Company in protecting the rights and title to the land and water rights securing the notes payable by HP A&M, including the costs incurred in purchasing the notes defaulted on by HP A&M. The amount owed on the outstanding notes was approximately $7.9 million, including accrued interest of $122,000, and $9.6 million at August 31, 2013 and August 31, 2012, respectively.
During fiscal year 2013 four of the farms and one FLLC certificate representing water rights only went through foreclosure proceedings due to the defaults by HP A&M. The Company’s agreement with HP A&M provides for a reduction of the number of water taps subject to the TPF payable to HP A&M. The Company reduced the number of taps by 2,233 taps and the discounted present value of the Tap Participation Fee by a total of approximately $11.7 million as a result of the foreclosures. As of August 31, 2013 there were 17,194 taps subject to the Tap Participation Fee. Subsequent to the Company’s fiscal year end, an additional three farms and one FLCC certificate representing water rights only, collectively including 1,832 FLCC shares, were foreclosed resulting in a reduction of the number of taps subject to the TPF by an additional 3,364 taps (approximately $11.9 million of the TPF), leaving 13,830 taps subject to the Tap Participation Fee.
Future Maturities
| Mortgage notes held and defaulted on by HP A&M | | $ | 2,526,900 | |
| | | | | |
| Mortgage notes, interest at 5%, due various dates in 2017 | | | 5,231,100 | |
| Total | | | 7,758,000 | |
| Less: current portion | | | (4,546,900 | ) |
| Total long-term mortgage payable | | $ | 3,211,100 | |
| | | | | |
| Future Maturities | | | | |
| 2014 | | $ | 4,546,900 | |
| (including $2,526,900 of HP A&M defaulted notes to third parties) | | | | |
| 2015 | | | 844,500 | |
| 2016 | | | 887,300 | |
| 2017 | | | 932,200 | |
| 2018 | | | 534,500 | |
| 2019 | | | 12,600 | |
| Total | | $ | 7,758,000 | |
Operating Lease
Effective January 2013, the Company entered into an operating lease for 1,200 square feet of office space. The lease has a two year term with payments of approximately $1,530 per month.
NOTE 8 – SHAREHOLDERS’ EQUITY
Sale of common stock and a common stock upon conversion of Convertible Note – Related Party
The Company issued a $5.2 million convertible note on September 28, 2010. The Company’s shareholders authorized conversion of the convertible note at the January 11, 2011 annual shareholders’ meeting. Following the meeting, the note was converted into 1,982,099 unregistered shares of its common stock. From issuance until conversion, the convertible note accrued interest at rate of 10% per annum. During the fiscal year ended August 31, 2011, the Company accrued $151,700 of interest on the Convertible Note – Related Party.
PURE CYCLE CORPORATION
NOTES TO CONSOLIDATED FINANCIAL STATEMENTS
August 31, 2013, 2012 and 2011
Preferred Stock
The Company’s non-voting Series B Preferred Stock has a preference in liquidation of $1.00 per share less any dividends previously paid. Additionally, the Series B Preferred Stock is redeemable at the discretion of the Company for $1.00 per share less any dividends previously paid. In the event that the Company’s proceeds from sale or disposition of Export Water rights exceed $36,026,232, the Series B Preferred Stock holders will receive the next $432,513 of proceeds in the form of a dividend.
Equity Compensation Plan
The Company maintains the 2004 Incentive Plan (the “Equity Plan”), which was approved by shareholders in April 2004. Executives, eligible employees and non-employee directors are eligible to receive options and restricted stock grants pursuant to the Equity Plan. Under the Equity Plan, options to purchase shares of stock and restricted stock awards can be granted with exercise prices and vesting periods determined by the Compensation Committee of the Board. The Company initially reserved 1.6 million shares of common stock for issuance under the Equity Plan. At August 31, 2013, the Company had 1,218,311 shares that can be granted to eligible participants pursuant to the Equity Plan.
The Company estimates the fair value of share-based payment awards on the date of grant using the Black-Scholes option-pricing model (“Black-Scholes model”). Using the Black-Scholes model, the value of the portion of the award that is ultimately expected to vest is recognized as a period expense over the requisite service period in the statement of operations. Option forfeitures are to be estimated at the time of grant and revised if necessary, in subsequent periods if actual forfeitures differ from those estimates. The Company does not expect any forfeiture of its option grants and therefore the compensation expense has not been reduced for estimated forfeitures. During fiscal year 2012, 29,500 options were forfeited by option holders and an additional 48,000 options expired. No options were forfeited during the fiscal years ended August 31, 2013 and 2011. The Company attributes the value of share-based compensation to expense using the straight-line single option method for all options granted.
The Company’s determination of the estimated fair value of share-based payment awards on the date of grant is affected by the following variables and assumptions:
| | ● | The grant date exercise price – is the closing market price of the Company’s common stock on the date of grant; |
| | ● | Estimated option lives – based on historical experience with existing option holders; |
| | ● | Estimated dividend rates – based on historical and anticipated dividends over the life of the option; |
| | ● | Life of the option –based on historical experience option grants have lives between 8 and 10 years; |
| | ● | Risk-free interest rates – with maturities that approximate the expected life of the options granted; |
| | ● | Calculated stock price volatility – calculated over the expected life of the options granted, which is calculated based on the weekly closing price of the Company’s common stock over a period equal to the expected life of the option; and |
| | ● | Option exercise behaviors – based on actual and projected employee stock option exercises and forfeitures. |
In August 2013, the Company granted management options to purchase 100,000 shares of the Company’s common stock pursuant to the Equity Plan. The options vest one-third one year from the date of grant, one-third two years from the date of grant, and one-third three years from date of grant. The options expire ten years from the date of grant. The Company calculated the fair value of these options at $427,100 using the Black-Scholes model with the following variables: weighted average exercise price of $5.88 (which was the closing sales price of the Company’s common stock on the date of the grant); estimated option lives of ten years; estimated dividend rate of 0%; weighted average risk-free interest rate of 2.71%; weighted average stock price volatility 63.6%; and an estimated forfeiture rate of 0%. The $427,100 of stock-based compensation is being expensed monthly over the vesting periods.
PURE CYCLE CORPORATION
NOTES TO CONSOLIDATED FINANCIAL STATEMENTS
August 31, 2013, 2012 and 2011
In January 2013, the Company granted its non-employee directors options to purchase a combined 32,500 shares of the Company’s common stock pursuant to the Equity Plan. The options vest one year from the date of grant and expire ten years from the date of grant. The Company calculated the fair value of these options at $76,800 using the Black-Scholes model with the following variables: weighted average exercise price of $3.15 (which was the closing sales price of the Company’s common stock on the date of the grant); estimated option lives of ten years; estimated dividend rate of 0%; weighted average risk-free interest rate of 1.84%; weighted average stock price volatility 69.2%; and an estimated forfeiture rate of 0%. The $76,800 of stock-based compensation is being expensed monthly over the vesting periods.
In January 2012, the Company granted its non-employee directors options to purchase a combined 12,500 shares of the Company’s common stock pursuant to the Equity Plan. The options vest one year from the date of grant and expire ten years from the date of grant. The Company calculated the fair value of these options at $15,400 using the Black-Scholes model with the following variables: weighted average exercise price of $1.85 (which was the closing sales price of the Company’s common stock on the date of the grant); estimated option lives of ten years; estimated dividend rate of 0%; weighted average risk-free interest rate of 1.87%; weighted average stock price volatility 73.29%; and an estimated forfeiture rate of 0%. The $15,400 of stock-based compensation is being expensed monthly over the vesting periods.
In January 2011, the Company granted its non-employee directors options to purchase a combined 17,500 shares of the Company’s common stock pursuant to the Equity Plan. 12,500 of the options vest one year from the date of grant and expire ten years from the date of grant. 5,000 of the options vest one-half at the first anniversary of the grant date and one-half at the second anniversary of the grant date. The Company calculated the fair value of these options at $54,500 using the Black-Scholes model with the following variables: weighted average exercise price of $3.67 (which was the closing sales price of the Company’s common stock on the date of the grant); estimated option lives of ten years; estimated dividend rate of 0%; weighted average risk-free interest rate of 3.37%; weighted average stock price volatility of 84.7%; and an estimated forfeiture rate of 0%. The $54,500 of stock-based compensation is being expensed monthly over the vesting periods.
No options were exercised during the fiscal years ended August 31, 2013, 2012, or 2011.
The following table summarizes the stock option activity for the Equity Plan for the fiscal year ended August 31, 2013:
| | | Number of Options | | | Weighted-Average Exercise Price | | | Weighted-Average Remaining Contractual Term | | | Approximate Aggregate Instrinsic Value | |
| Oustanding at beginning of period | | | 215,000 | | | $ | 5.88 | | | | | | | |
| Granted | | | 132,500 | | | $ | 5.21 | | | | | | | |
| Exercised | | | — | | | $ | — | | | | | | | |
| Forfeited or expired | | | — | | | $ | — | | | | | | | |
| Outstanding at August 31, 2013 | | | 347,500 | | | $ | 5.62 | | | $ | 6.98 | | | $ | 145,559 | |
| | | | | | | | | | | | | | | | | |
| Options exercisable at August 31, 2013 | | | 215,000 | | | $ | 5.90 | | | $ | 4.89 | | | $ | 121,265 | |
PURE CYCLE CORPORATION
NOTES TO CONSOLIDATED FINANCIAL STATEMENTS
August 31, 2013, 2012 and 2011
The following table summarizes the activity and value of non-vested options as of and for the fiscal year ended August 31, 2013:
| | | Number of Options | | | Weighted-
Average Grant
Date Fair
Value | |
| Non-vested options oustanding at beginning of period | | | 22,500 | | | $ | 1.72 | |
| Granted | | | 132,500 | | | | 3.80 | |
| Vested | | | (22,500 | ) | | | 1.72 | |
| Forfeited | | | — | | | | — | |
| Non-vested options outstanding at August 31, 2013 | | | 132,500 | | | $ | 3.80 | |
All non-vested options are expected to vest. The total fair value of options vested during the fiscal years ended August 31, 2013, 2012 and 2011 was $48,700, $66,000 and $74,700, respectively. The weighted average grant date fair value of options granted during the fiscal years ended August 31, 2013, 2012 and 2011 was $3.80, $1.23 and $3.11, respectively.
Share-based compensation expense for the fiscal years ended August 31, 2013, 2012 and 2011, was $66,800, $54,600 and $94,600, respectively.
At August 31, 2013, the Company had unrecognized expenses relating to non-vested options that are expected to vest totaling $453,700. The weighted-average period over which these options are expected to vest is less than three years. The Company has not recorded any excess tax benefits to additional paid in capital.
Warrants
As of August 31, 2013, the Company had outstanding warrants to purchase 92 shares of common stock at an exercise price of $1.80 per share. These warrants expire six months from the earlier of:
| (i) | The date all of the Export Water is sold or otherwise disposed of, |
| (ii) | The date the CAA is terminated with respect to the original holder of the warrant, or |
| (iii) | The date on which the Company makes the final payment pursuant to Section 2.1(r) of the CAA. |
No warrants were exercised during fiscal 2013, 2012 or 2011.
Pledged Common Stock Owned by HP A&M
Pursuant to the Arkansas River Agreement, HP A&M pledged, transferred, assigned and granted to the Company a security interest in and to the Pledged Shares, consisting of 1,500,000 shares of Pure Cycle common stock and the proceeds there from. Due to the HP A&M default the Pledged Shares were sold pursuant to a foreclosure sale for $3.5 million or $2.35 per share.
NOTE 9 – SIGNIFICANT CUSTOMER
The Company sells wholesale water and wastewater services to the District pursuant to the Rangeview Water Agreements. Sales to the District accounted for 34%, 86%, and 91% of the Company’s total revenues for the years ended August 31, 2013, 2012 and 2011, respectively. The District had one significant customer, the Ridgeview Youth Services Center. Pursuant to the Rangeview Water Agreements the Company is providing water and wastewater services to this customer on behalf of the District. The District’s significant customer accounted for 28%, 53% and 60% of the Company’s total revenues for the years ended August 31, 2013, 2012 and 2011, respectively.
Revenues from another customer represented approximately 59% of the Company’s water and wastewater revenues for the fiscal year ended August 31, 2013. The Company had no revenues from the other customer for the fiscal years ended August 31, 2012 or 2011.
PURE CYCLE CORPORATION
NOTES TO CONSOLIDATED FINANCIAL STATEMENTS
August 31, 2013, 2012 and 2011
The Company had accounts receivable from the District which accounted for 20% and 16% of the Company’s trade receivables balances at August 31, 2013 and 2012, respectively. Accounts receivable from the District’s largest customer accounted for 17% and 13% of the Company’s trade receivables as of August 31, 2013, and 2012, respectively.
NOTE 10 – INCOME TAXES
There is no provision for income taxes, because the Company has incurred operating losses. Deferred income taxes reflect the tax effects of net operating loss carryforwards and temporary differences between the carrying amounts of assets and liabilities for financial reporting purposes and the amounts used for income tax purposes. Significant components of the Company’s deferred tax assets as of August 31 are as follows:
| | | For the Fiscal Years Ended August 31, | |
| | | 2013 | | | 2012 | |
| Deferred tax assets: | | | | | | |
| Net operating loss carryforwards | | $ | 6,080,000 | | | $ | 5,948,300 | |
| Imputed interest on Tap Participation Fee | | | 10,074,200 | | | | 8,852,500 | |
| Deferred revenue | | | 494,600 | | | | 560,700 | |
| Impairment charges | | | — | | | | 2,408,800 | |
| Depreciation and depletion | | | 4,899,800 | | | | 2,425,700 | |
| Other | | | 43,600 | | | | 45,000 | |
| Valuation allowance | | | (21,592,200 | ) | | | (20,241,000 | ) |
| Net deferred tax asset | | $ | — | | | $ | — | |
The Company has recorded a valuation allowance against the deferred tax assets as the Company is unable to reasonably determine if it is more likely than not that deferred tax assets will ultimately be realized.
Income taxes computed using the federal statutory income tax rate differs from our effective tax rate primarily due to the following for the fiscal years ended August 31:
| | | For the Fiscal Years Ended August 31, | |
| | | 2013 | | | 2012 | | | 2011 | |
| Expected benefit from federal taxes at statutory rate of 34% | | $ | (1,411,200 | ) | | $ | (5,922,300 | ) | | $ | (2,045,500 | ) |
| State taxes, net of federal benefit | | | (137,000 | ) | | | (574,800 | ) | | | (198,500 | ) |
| Expiration of net operating losses | | | 147,400 | | | | 90,000 | | | | 121,000 | |
| Permanent and other differences | | | 27,400 | | | | 25,800 | | | | 37,800 | |
| Change in valuation allowance | | | 1,373,400 | | | | 6,381,300 | | | | 2,085,200 | |
| Total income tax expense / benefit | | $ | — | | | $ | — | | | $ | — | |
At August 31, 2013, the Company has $16.3 million of net operating loss carryforwards available for income tax purposes, which expire between fiscal 2014 and 2028. Utilization of these net operating loss carryforwards may be subject to substantial annual ownership change limitations provided by the Internal Revenue Code. Such an annual limitation could result in the expiration of the net operating loss carryforwards before utilization.
Net operating loss carryforwards of $395,200, $241,200 and $324,500 expired during the fiscal years ended August 31, 2013, 2012 and 2011, respectively.
NOTE 11 – 401(k) PLAN
Effective July 25, 2006, the Company adopted the Pure Cycle Corporation 401(k) Profit Sharing Plan (the “Plan”), a defined contribution retirement plan for the benefit of its employees. The Plan is currently a salary deferral only plan, and at this time the Company does not match employee contributions. The Company pays the annual administrative fees of the Plan, and the Plan participants pay the investment fees. The Plan is open to all employees, age 21 or older, who have been employees of the Company for at least six months. During the fiscal years ended August 31, 2013, 2012 and 2011, the Company paid fees of $3,300, $3,400 and $2,600, respectively, for the administration of the Plan.
PURE CYCLE CORPORATION
NOTES TO CONSOLIDATED FINANCIAL STATEMENTS
August 31, 2013, 2012 and 2011
NOTE 12 – LITIGATION LOSS CONTINGENCIES
The Company is involved in various claims, litigation and other legal proceedings that arise in the ordinary course of its business. The Company records an accrual for a loss contingency when its occurrence is probable and damages can be reasonably estimated based on the anticipated most likely outcome or the minimum amount within a range of possible outcomes. The Company makes such estimates based on information known about the claims and experience in contesting, litigating and settling similar claims. Disclosures are also provided for reasonably possible losses that could have a material effect on the Company’s financial position, results of operations or cash flows.
Because each of the lawsuits below involves complex legal issues and uncertainties and are in the early stages of litigation, the Company has determined that no accruals for losses related to the lawsuits are reasonably estimable or deemed reasonably likely at this time.
On December 19, 2011, the Company and the District filed a lawsuit against the State of Colorado by and through the Land Board. The complaint was filed with the District Court, City and County of Denver, State of Colorado. The Company and the District are claiming that the Land Board breached, and will breach, agreements entered into by the Land Board with the Company and the District in connection with a 1996 settlement agreement. Those agreements include (i) the Amended and Restated Water Lease, dated as of April 4, 1996, between the Land Board and the District (the “Lease”) and (ii) the Service Agreement of the same date between the Company and the District. As initially reported in a Current Report on Form 8-K filed on November 29, 2011, the Land Board issued a Request for Proposal that included a draft lease agreement related to oil and gas rights at the Land Board’s Lowry Range. The Company believes the draft lease agreement did not adequately address or protect the Company’s exclusive right to provide water to the Lowry Range. The Land Board subsequently entered into an oil and gas lease for the Lowry Range, which, like the draft lease, does not protect the Company’s exclusive rights. As a result of this breach, the Company and the District are claiming damages to be proven at trial.
HP A&M initiated a lawsuit against the Company in District Court, City and County of Denver, State of Colorado on February 27, 2012, alleging breaches of representations made in connection with the Arkansas River Agreement. The HP A&M claims relate to the issues currently being litigated between the Company and the Land Board regarding the Company’s exclusive right to provide water service to the Land Board’s Lowry Range property. The Company believes the allegations are without merit and intends to vigorously defend against them.
The Land Board asserted certain counterclaims in the lawsuit described above that relate to operational disputes under the Lease. On June 14, 2013, the Company, the District and the Land Board entered into an Arbitration Agreement pursuant to which the parties have agreed to submit three counterclaims under the Lease to binding arbitration: (i) whether revenue from wastewater services are subject to royalties under the Lease and the appropriate payment for a right-of-way for a wastewater reclamation facility, (ii) whether Export Water royalties are owed on a net or gross proceeds basis, and (iii) if, and/or how water from the four aquifers under the Lowry Range should be blended for sale, as well as any related claims of the Company and the District for offset, credit or overpayment of previous royalties paid and defenses to the three claims. The counterclaims have been dismissed from the lawsuit without prejudice. An arbitrator has not yet been selected, so the timing of resolution of these claims is unknown. Because the arbitration has not proceeded past the agreement stage and the outcome is uncertain, the Company has determined that accruals for losses related to the arbitration are not reasonably estimable or deemed reasonably likely at this time. The Company and the District believe that they have been conducting their operations in accordance with the Lease and are prepared to defend their decisions in the arbitration.
PURE CYCLE CORPORATION
NOTES TO CONSOLIDATED FINANCIAL STATEMENTS
August 31, 2013, 2012 and 2011
During the fiscal year ended August 31, 2013, foreclosure proceedings were commenced against 38 of the properties acquired by the Company from HP A&M which are subject to promissory notes defaulted upon by HP A&M and secured by deeds of trust on the Company’s land and water rights. These properties represent approximately 40% of the Company’s FLLC shares and over 45% of the Company’s Arkansas River land. The proceedings were filed on various dates from January 9, 2013 through July 3, 2013, with the Public Trustees of Bent, Otero and Prowers Counties in Colorado and involve claims against HP A&M for its failure to pay the notes. Foreclosure proceedings in Colorado take at least nine months to conclude. Foreclosure sales were conducted on three of the Company’s farm properties on August 28, 2013, and on a fourth property on September 4, 2013, subsequent to fiscal year end. The Company’s wholly owned subsidiary, PCY Holding, LLC (“PCY Holdings”), was the successful bidder in the foreclosure sales. Due to statutory protections afforded to the Company as the owner of the properties and the Company’s liquidity, the Company had anticipated concluding these foreclosure proceedings on terms which would not have a material adverse effect on its financial position, results of operations or cash flows. On September 16, 2013, HP A&M filed a complaint against PCY Holdings and the Public Trustee for the County of Bent, Colorado. The lawsuit was filed in the District Court, County of Bent, Colorado. HP A&M was seeking (i) a declaratory judgment that it is entitled to redeem the four properties from the foreclosure sales by paying the amount of the outstanding debt, plus fees, which is the amount PCY Holdings bid in the sales, and (ii) preliminary and permanent injunctions against the Public Trustee preventing the Public Trustee from issuing confirmation deeds for the foreclosure sales to PCY Holdings or anyone other than HP A&M. On November 20, 2013 the Complaint was dismissed with prejudice, and judgment was entered in favor of the Public Trustee and PCY Holdings. The District Court ruled that “High Plains’ Complaint and Motion are baseless, without statutory authority, and are an attempt to obstruct the proper function of the office of the Public Trustee of Bent County, and PCY Holdings relative to the foreclosures of the four Subject Farms”. Further the District Court ruled “that High Plains’ Motion and its claims in its Verified Complaint are frivolous and groundless, and awards the Public Trustee of Bent County and PCY Holdings their attorneys’ fees and costs incurred in connection with this matter.”
HP A&M has 49 days from the date of the judgment in which to file an appeal. If HP A&M appeals this judgment and wins on appeal, the Company could lose these properties, subject to its remedies under the Arkansas River Agreement. The Company intends to vigorously defend any appeal of this ruling.
NOTE 13 – SEGMENT REPORTING
The Company operates primarily in two lines of business: (i) the wholesale water and wastewater business; and (ii) the agricultural farming business. The Company provides wholesale water and wastewater services to customers using water rights owned by the Company and develops infrastructure to divert, treat and distribute that water and collect, treat and reuse wastewater. The Company’s agricultural business consists of the Company leasing its Arkansas River Valley land and water to area farmers under cash leases or in certain cases crop share leases. The following tables show information by operating segment for the fiscal year ended August 31, 2013:
| Fiscal Year Ended August 31, 2013 | |
| | | | | | | | | | | | | |
| | | Business segments | | | | | | | |
| | | Wholesale | | | | | | | | | | |
| | | water and | | | | | | | | | | |
| | | wastewater | | | Agricultural | | | All Other | | | Total | |
| | | | | | | | | | | | | |
| Revenues | | $ | 544,400 | | | $ | 1,241,900 | | | $ | 71,200 | | | $ | 1,857,500 | |
| Gross profit | | | 248,600 | | | | 1,145,600 | | | | 70,000 | | | | 1,464,200 | |
| Depletion and depreciation | | | 311,300 | | | | — | | | | — | | | | 311,300 | |
| Other significant noncash items: | | | | | | | | | | | | | | | | |
| Stock-based compensation | | | — | | | | — | | | | 66,800 | | | | 66,800 | |
| TPF interest expense | | | 3,275,400 | | | | — | | | | — | | | | 3,275,400 | |
| Segment assets | | | 93,522,800 | | | | 6,697,500 | | | | 8,398,000 | | | | 108,618,300 | |
| Expenditures for segment assets | | | — | | | | — | | | | — | | | | — | |
As of August 31, 2012, the Company had only one operating segment.
PURE CYCLE CORPORATION
NOTES TO CONSOLIDATED FINANCIAL STATEMENTS
August 31, 2013, 2012 and 2011
NOTE 14 – SUPPLEMENTAL DISCLOSURE OF NON-CASH ACTIVITIES
| | | | | | | | | | |
| | | For the Fiscal Years Ended August 31, | |
| | | 2013 | | | 2012 | | | 2011 | |
| Reduction in Tap Participation Fee Liability resulting from remedies under the Arkansas River Agrement | | $ | 11,737,300 | | | | | | $ | — | | | $ | — | |
| Mortgage payable and related party receivable recorded upon HP A&M default | | | — | | | | 9,550,200 | | | | — | |
| Farm revenue allocated against the Tap Participation Fee liability and additional paid in capital thru August 3, 2012 | | | — | | | | 189,700 | | | | — | |
| Issuance of shares of restricted common stock upon conversion of the Convertible Note - Related Party | | | — | | | | — | | | | 5,351,700 | |
| | | $ | 11,737,300 | | | $ | 9,739,900 | | | $ | 5,351,700 | |
NOTE 15 – RELATED PARTY TRANSACTIONS
On December 16, 2009, the Company entered into a Participation Agreement with the District, whereby the Company agreed to provide funding to the District in connection with the District joining the South Metro Water Supply Authority (“SMWSA”). The Company provided funding of $139,500, $115,500, and $25,000 for the fiscal years ended August 31, 2013, 2012, and 2011, respectively. The funding was expensed in the general and administrative expenses line in the accompanying statements of operations for the years ended August 31, 2013, 2012, and 2011, respectively.
In 1995, the Company extended a loan to the District, a related party. The loan provided for borrowings of up to $250,000, is unsecured, bears interest based on the prevailing prime rate plus 2% (5.25% at August 31, 2013) and matures on December 31, 2013. The $556,000 balance of the note receivable at August 31, 2013 includes borrowings of $229,300 and accrued interest of $326,700. The $543,900 balance of the note receivable at August 31, 2012 includes borrowings of $229,300 and accrued interest of $314,600. The Company extended the due date to December 31, 2014, and accordingly the note has been classified as non-current.
NOTE 16 – SUBSEQUENT EVENTS
Subsequent to our fiscal year end an additional three farms and 1,832 FLCC shares have been obtained through the foreclosure proceedings resulting in a reduction of the number of taps subject to the TPF by 3,364 taps and a corresponding reduction to the TPF payable of $11.9 million.
There were no changes in or disagreement with accountants on accounting and financial disclosures.
(a) Evaluation of Disclosure Controls and Procedures
We maintain disclosure controls and procedures (as such term is defined in Rule 13a-15(e) of the Securities Exchange Act of 1934, as amended (the “Exchange Act”)) that are designed to ensure that information required to be disclosed in our reports filed or submitted to the SEC under the Exchange Act is recorded, processed, summarized and reported within the time periods specified by the Commission’s rules and forms, and that information is accumulated and communicated to management, including the principal executive and financial officer as appropriate, to allow timely decisions regarding required disclosures. The President and Chief Financial Officer evaluated the effectiveness of disclosure controls and procedures as of August 31, 2013, pursuant to Rule 13a-15(b) under the Exchange Act. Based on that evaluation, the President and Chief Financial Officer concluded that, as of the end of the period covered by this report, the Company’s disclosure controls and procedures were effective. A system of controls, no matter how well designed and operated, cannot provide absolute assurance that the objectives of the system of controls are met, and no evaluation of controls can provide absolute assurance that all control issues and instances of fraud, if any, within a company have been detected.
(b) Management’s Report on Internal Control Over Financial Reporting
Management is responsible for establishing and maintaining adequate internal control over financial reporting as defined in Rules 13a-15(f) under the Exchange Act. The Exchange Act defines internal control over financial reporting as a process designed by, or under the supervision of, our executive and principal financial officers and effected by our board of directors, management and other personnel, to provide reasonable assurance regarding the reliability of financial reporting and the preparation of financial statements for external purposes in accordance with GAAP and includes those policies and procedures that:
| | ● | Pertain to the maintenance of records that in reasonable detail accurately and fairly reflect the transactions and dispositions of our assets; |
| | ● | Provide reasonable assurance that transactions are recorded as necessary to permit preparation of financial statements in accordance with GAAP, and that our receipts and expenditures are being made only in accordance with authorizations of our management and our directors; and |
| | ● | Provide reasonable assurance regarding prevention or timely detection of unauthorized acquisition, use or disposition of our assets that could have a material effect on the financial statements. |
All internal control systems, no matter how well designed, have inherent limitations. Therefore, even those systems determined to be effective can provide only reasonable assurance with respect to financial statement preparation and presentation. Also, projections of any evaluation of effectiveness to future periods are subject to the risk that controls may become inadequate because of changes in conditions or that the degree of compliance with the policies or procedures may deteriorate.
Management assessed the effectiveness of our internal control over financial reporting as of August 31, 2013. In making this assessment, we used the criteria set forth by the Committee of Sponsoring Organizations of the Treadway Commission (COSO) in Internal Control – Integrated Framework. Based on our assessment, we determined that, as of August 31, 2013, our internal control over financial reporting was effective based on those criteria.
(c) Changes in Internal Controls
No changes were made to our internal control over financial reporting during our most recently completed fiscal quarter that have materially affected, or are reasonably likely to materially affect, our internal control over financial reporting.
None
Information concerning Items 10 through Items 14 will be contained in, and is incorporated herein by reference to, our definitive Proxy Statement pursuant to Regulation 14A promulgated under the Exchange Act for the 2013 Annual Meeting of Shareholders, which is expected to be filed on or about December 6, 2013.
| (a) | | Financial Statements |
| 1. | | See “Index to Financial Statements and Supplementary Data” in Part II, Item 8 of this Form 10-K. |
| 2. | | Financial Statement Schedules: None |
| 3. | | Exhibits: The exhibits listed in the accompanying “Index to Exhibits” are filed or incorporated by reference as part of this Form 10-K |
Index to Exhibits |
Exhibit
No. | | Description |
3.1 | | Articles of Incorporation of Pure Cycle Corporation. Incorporated by reference to Appendix B to the Proxy Statement on Schedule 14A filed December 14, 2007. |
| 3.2 | | Bylaws of Pure Cycle Corporation. Incorporated by reference to Appendix C to the Proxy Statement on Schedule 14A filed December 14, 2007. |
4.1 | | Specimen Stock Certificate. Incorporated by reference to Exhibit 4.1 to Quarterly Report on Form 10-Q for the fiscal quarter ended May 31, 2010. |
10.1 | | 2004 Equity Incentive Plan, Incorporated by reference to Exhibit F to the Proxy Statement for the Annual Meeting held April 12, 2004. ** |
| 10.2 | | Service Agreement, dated April 11, 1996, by and between Pure Cycle Corporation and the Rangeview Metropolitan District. Incorporated by reference to Exhibit 10.2 to the Quarterly Report on Form 10-QSB for the period ended May 31, 1996. |
10.3 | | Wastewater Service Agreement, dated January 22, 1997, by and between Pure Cycle Corporation and the Rangeview Metropolitan District. Incorporated by reference to Exhibit 10.3 to the Annual Report on Form 10-KSB for the fiscal year ended August 31, 1998. |
| 10.4 | | Comprehensive Amendment Agreement No. 1, dated April 11, 1996, by and among ISC, the Company, the Bondholders, Gregory M. Morey, Newell Augur, Jr., Bill Peterson, Stuart Sundlun, Alan C. Stormo, Beverlee A. Beardslee, Bradley Kent Beardslee, Robert Douglas Beardslee, Asra Corporation, International Properties, Inc., and the Land Board. Incorporated by reference to Exhibit 10.7 to the Quarterly Report on Form 10-QSB for the period ended May 31, 1996. |
| 10.5 | | Agreement for Sale of Export Water dated April 11, 1996 by and among the Company and the District. Incorporated by reference to Exhibit 10.3 to the Quarterly Report on Form 10-QSB for the fiscal quarter ended May 31, 1996. |
| 10.6 | | Water Service Agreement for the Sky Ranch PUD dated October 31, 2003 by and between Airpark Metropolitan District, Icon Investors I, LLC, the Company and the District. Incorporated by reference to Exhibit 10.9 to the Registration Statement on Form SB-2, filed April 19, 2004, Registration No. 333-114568. |
| 10.7 | | Amendment to Water Service Agreement for the Sky Ranch PUD dated January 6, 2004. Incorporated by reference to Exhibit 10.13 to Amendment No. 1 to Registration Statement on Form SB-2, filed June 7, 2004, Registration No. 333-114568. |
| 10.8 | | Agreement to Amend Water Service Agreement for the Sky Ranch PUD dated January 30, 2004. Incorporated by reference to Exhibit 10.14 to Amendment No. 1 to Registration Statement on Form SB-2, filed June 7, 2004, Registration No. 333-114568. |
| 10.9 | | Second Amendment to Water Service Agreement for the Sky Ranch PUD dated March 5, 2004. Incorporated by reference to Exhibit 10.15 to the original Annual Report on Form 10-K for the fiscal year ended August 31, 2007. |
| 10.10 | | Amended and Restated Lease Agreement between the Land Board and the District dated April 4, 1996. Incorporated by reference to Exhibit 10.17 to Amendment No. 1 to Registration Statement on Form SB-2, filed June 7, 2004, Registration No. 333-114568. |
| 10.11 | | Bargain and Sale Deed among the Land Board, the District and the Company dated April 11, 1996. Incorporated by reference to Exhibit 10.18 to Amendment No. 1 to Registration Statement on Form SB-2, filed June 7, 2004, Registration No. 333-114568. |
| 10.12 | | Mortgage Deed, Security Agreement, and Financing Statement between the Land Board and the Company dated April 11, 1996. Incorporated by reference to Exhibit 10.19 to Amendment No. 1 to Registration Statement on Form SB-2, filed June 7, 2004, Registration No. 333-114568. |
| 10.13 | | Water Service Agreement for the Hills at Sky Ranch Water dated May 14, 2004 among Icon Land II, LLC, a Colorado limited liability company, the Company, and the District. Incorporated by reference to Exhibit 10.1 to the Current Report on Form 8-K filed on May 21, 2004. |
| 10.14 | | Agreement for Water Service dated August 3, 2005 among Pure Cycle Corporation, Rangeview Metropolitan District and Arapahoe County incorporated by reference to Exhibit 10.24 to the Current Report on Form 8-K filed on August 4, 2005. |
| 10.15 | | Arkansas River Agreement dated May 10, 2006, between Pure Cycle Corporation and High Plains A&M, LLC, and the Seller Pledge Agreement, Pure Cycle Corporation Pledge Agreement and Property Management Agreement, attached as exhibits thereto, entered into between Pure Cycle Corporation and High Plains A&M, LLC dated August 31, 2010. Incorporated by reference to Exhibit 10.25 to the Current Report on Form 8-K filed on May 16, 2006. |
| 10.16 | | Amendment No. 1 to Agreement for Water Service dated August 25, 2008, between Pure Cycle Corporation and Arapahoe County. Incorporated by reference to Exhibit 10.36 to the Annual Report on Form 10-K for the fiscal year ended August 31, 2009. |
| 10.17 | | Registration Rights Agreement dated September 28, 2010, between Pure Cycle Corporation and PAR Investment Partners, L.P. Incorporated by reference to Exhibit 10.2 to the Current Report on Form 8-K filed on September 29, 2010. |
| 10.18 | | Paid-Up Oil and Gas Lease dated March 14, 2011, between Pure Cycle Corporation and Anadarko E&P Company, L.P. Incorporated by reference to Exhibit 10.1 to the Current Report on Form 8-K filed on March 15, 2011. |
Pursuant to the requirements of Section 13 or 15(d) of the Securities Exchange Act of 1934, the registrant has duly caused this report to be signed on its behalf by the undersigned, thereunto duly authorized.
| PURE CYCLE CORPORATION | |
| | | |
| By: | /s/ Mark W. Harding | |
| Mark W. Harding, President and Chief Financial Officer | |
| November 27, 2013 | |
Pursuant to the requirements of the Securities Exchange Act of 1934, this report has been signed below by the following persons on behalf of the registrant and in the capacities and on the dates indicated.
| Signature | | Title | | Date |
/s/ Mark W. Harding | | President, Chief Financial Officer and Director | | November 27, 2013 |
| Mark W. Harding | | (Principal Executive Officer, Principal Financial and Accounting Officer) | | |
/s/ Harrison H. Augur | | | | |
| Harrison H. Augur | | Chairman, Director | | November 27, 2013 |
| | | | | |
| /s/ Arthur G. Epker III | | | | |
| Arthur G. Epker III | | Director | | November 27, 2013 |
| | | | | |
| /s/ Richard L. Guido | | | | |
| Richard L. Guido | | Director | | November 27, 2013 |
| | | | | |
| /s/ Peter C. Howell | | | | |
| Peter C. Howell | | Director | | November 27, 2013 |
| | | | | |
| /s/ George M. Middlemas | | | | |
| George M. Middlemas | | Director | | November 27, 2013 |