TABLEOF CONTENTS
An investor should consider each Fund’s investment objectives, risks, and charges and expenses carefully before investing or sending money. This and other important information about each Fund can be found in the Funds’ prospectus. To obtain a prospectus, call toll-free 877-757-7424. Please read the prospectus carefully before investing.
| | | | |
| NOT FDIC INSURED | | MAY LOSE VALUE | | NO BANK GUARANTEE |
i
LETTER TO SHAREHOLDERS
Dear Fellow Shareholders,
We are pleased to present the enclosed annual report for Regions Morgan Keegan Select Mid Cap Growth Fund, Regions Morgan Keegan Select Growth Fund, Regions Morgan Keegan Select Core Equity Fund, Regions Morgan Keegan Select Mid Cap Value Fund, Regions Morgan Keegan Select Value Fund, Regions Morgan Keegan Select Balanced Fund, Regions Morgan Keegan Select Fixed Income Fund, Regions Morgan Keegan Select Limited Maturity Fixed Income Fund, Regions Morgan Keegan Select Intermediate Tax Exempt Bond Fund, Regions Morgan Keegan Select Treasury Money Market Fund and Regions Morgan Keegan Select Money Market Fund (each a “Fund” and, collectively, the “Funds”). In this report, you will find information on each Fund’s investment objective and strategy and learn how your investment performed during the fiscal year ended November 30, 2008. The portfolio managers will also provide an overview of the market conditions and discuss some of the factors that affected investment performance during the reporting period. In addition, this report includes each Fund’s audited financial statements and portfolio of investments as of November 30, 2008.
As I write, the markets continue to operate under substantial stresses. Although, the worst appears to have passed, the current situation is far from normal. World economic worries compound our own domestic economic issues. Market places for stocks, bonds and other financial instruments continue to operate, but only marginally. Investors and lenders continue to be skeptical and unwilling to venture far from “home”. World governments are loosening credit and supporting institutions in an effort to avoid further declines. As managers of your Funds, our duty is to appraise the economic and market environment and do our best to select prudent and valuable investments. We continue in the belief that capitalism is still an outstanding economic system; that economic downturns are followed by recoveries; and that severely shaken financial markets will once again find their footings and operate normally. With these thoughts, we strive to provide you with worthwhile results.
As always, we appreciate your continued support of the Regions Morgan Keegan Select family of funds. It is important to stay focused on your long-term investment strategy. Your financial adviser can help you evaluate your portfolio’s performance to ensure that your diversified mix of investments is designed to help generate the long-term performance your goals demand. We remain committed to helping you pursue your financial goals through investments in our fund family. You have our commitment to bring you the highest level of disciplined decision-making and personal service to meet your financial needs. If you have any questions about the Funds, please call us toll-free at 877-757-7424.
Sincerely,

Brian B. Sullivan, CFA
President
Regions Morgan Keegan Select Funds
January 26, 2009
1
ABOUT SHAREHOLDERAND FUND EXPENSES (UNAUDITED)
All mutual funds have operating expenses and it is important for our shareholders to understand the impact of expenses on their investments. As a shareholder of a Fund, you may incur two types of costs: (1) transaction costs, including sales charges (loads) on purchases and on redemptions; and (2) operating costs, including management fees; to the extent applicable, distribution (12b-1) fees and/or shareholder services fees; and other Fund expenses. Operating costs, which are deducted from a Fund’s gross income, reduce the investment return of the Fund.
A Fund’s operating expenses are expressed as a percentage of its average net assets, which is known as the expense ratio. The following example is intended to help you to understand your ongoing costs (in dollars) of investing in the Funds and to compare these costs with the ongoing costs of investing in other mutual funds. The examples are based on an investment of $1,000 made at the beginning of the period and held for the entire six-month period beginning June 1, 2008 and ending November 30, 2008.
The following table illustrates your Fund’s costs in two ways:
Based on actual fund return. This section helps you estimate the actual expenses that you paid over the period. The “Ending Account Value” shown is derived from the Fund’s actual return, and the fourth column shows the dollar amount that would have been paid by an investor who started with $1,000 in the Fund. You may use the information here, together with the amount you invested, to estimate the expenses that you incurred over the period. Simply divide your account value by $1,000 (for example, an $8,600 account value divided by $1,000 = 8.6), then multiply the result by the number given for your Fund under the heading entitled “Expenses Paid During Period.”
Based on hypothetical 5% return. This section is intended to help you compare your Fund’s cost with those of other mutual funds. The table provides information about hypothetical account values and hypothetical expenses based on the Fund’s actual expense ratio and an assumed rate of return of 5% per year before expenses, which is not the Fund’s actual return. The hypothetical account values and expenses may not be used to estimate the actual ending account balance or expenses you paid during the period. The example is useful in making comparisons because the Securities and Exchange Commission requires all mutual funds to calculate expenses based on the 5% return. You can assess your Fund’s costs by comparing this hypothetical example with the hypothetical examples that appear in shareholder reports of other funds.
Please note that the expenses shown in the table are meant to highlight and help you compare your ongoing costs only and do not reflect any sales charges (loads) on purchases or on redemptions which may be incurred by some of the Fund’s share classes. Therefore, the hypothetical account values and expenses in the table are useful in comparing ongoing costs only and will not help you determine the relative total costs of owning different Funds. In addition, if these sales charges (loads) were included, your overall costs would have been higher.
You can find more information about a Fund’s expenses, including annual expense ratios for the past five years, in the Financial Highlights section of this report. For additional information on operating expenses and other shareholder costs, please refer to the Funds’ prospectus.
2
ABOUT SHAREHOLDERAND FUND EXPENSES (UNAUDITED)
| | | | | | | | | | | | |
| | | Annualized
Expense
Ratio | | | Beginning
Account Value
June 1, 2008 | | Ending
Account Value
November 30,
2008 | | Expenses
Paid During
Period(1) |
| | | | | |
| MID CAP GROWTH FUND | | | | | | | | | | | | |
| Actual | | | | | | | | | | | | |
Class A Shares | | 1.29 | % | | $ | 1,000 | | $ | 557.20 | | $ | 5.02 |
Class C Shares | | 2.04 | % | | | 1,000 | | | 554.90 | | | 7.93 |
Class I Shares | | 1.04 | % | | | 1,000 | | | 557.80 | | | 4.05 |
Hypothetical (assuming a 5% return before expenses) | | | | | | | | | | | | |
Class A Shares | | 1.29 | % | | $ | 1,000 | | $ | 1,018.55 | | $ | 6.51 |
Class C Shares | | 2.04 | % | | | 1,000 | | | 1,014.80 | | | 10.28 |
Class I Shares | | 1.04 | % | | | 1,000 | | | 1,019.80 | | | 5.25 |
| | | | | |
| GROWTH FUND | | | | | | | | | | | | |
| Actual | | | | | | | | | | | | |
Class A Shares | | 1.30 | % | | $ | 1,000 | | $ | 648.30 | | $ | 5.36 |
Class C Shares | | 2.05 | % | | | 1,000 | | | 645.70 | | | 8.43 |
Class I Shares | | 1.05 | % | | | 1,000 | | | 648.90 | | | 4.33 |
Hypothetical (assuming a 5% return before expenses) | | | | | | | | | | | | |
Class A Shares | | 1.30 | % | | $ | 1,000 | | $ | 1,018.50 | | $ | 6.56 |
Class C Shares | | 2.05 | % | | | 1,000 | | | 1,014.75 | | | 10.33 |
Class I Shares | | 1.05 | % | | | 1,000 | | | 1,019.75 | | | 5.30 |
| | | | | |
| CORE EQUITY FUND | | | | | | | | | | | | |
| Actual | | | | | | | | | | | | |
Class A Shares | | 1.86 | % | | $ | 1,000 | | $ | 611.40 | | $ | 7.49 |
Class C Shares | | 2.61 | % | | | 1,000 | | | 611.20 | | | 10.51 |
Class I Shares | | 1.61 | % | | | 1,000 | | | 612.10 | | | 6.49 |
Hypothetical (assuming a 5% return before expenses) | | | | | | | | | | | | |
Class A Shares | | 1.86 | % | | $ | 1,000 | | $ | 1,015.70 | | $ | 9.37 |
Class C Shares | | 2.61 | % | | | 1,000 | | | 1,011.95 | | | 13.13 |
Class I Shares | | 1.61 | % | | | 1,000 | | | 1,016.95 | | | 8.12 |
| | | | | |
| MID CAP VALUE FUND | | | | | | | | | | | | |
| Actual | | | | | | | | | | | | |
Class A Shares | | 1.53 | % | | $ | 1,000 | | $ | 643.10 | | $ | 6.28 |
Class C Shares | | 2.28 | % | | | 1,000 | | | 640.80 | | | 9.35 |
Class I Shares | | 1.28 | % | | | 1,000 | | | 643.80 | | | 5.26 |
Hypothetical (assuming a 5% return before expenses) | | | | | | | | | | | | |
Class A Shares | | 1.53 | % | | $ | 1,000 | | $ | 1,017.35 | | $ | 7.72 |
Class C Shares | | 2.28 | % | | | 1,000 | | | 1,013.60 | | | 11.48 |
Class I Shares | | 1.28 | % | | | 1,000 | | | 1,018.60 | | | 6.46 |
(1) | | Expenses are equal to each Fund’s annualized expense ratio, multiplied by the average account value over the period, multiplied by 183/366 (to reflect the one-half year period). |
3
ABOUT SHAREHOLDERAND FUND EXPENSES (UNAUDITED)
| | | | | | | | | | | | |
| | | Annualized
Expense
Ratio | | | Beginning
Account Value
June 1, 2008 | | Ending
Account Value
November 30,
2008 | | Expenses
Paid During
Period(1) |
| | | | | |
| VALUE FUND | | | | | | | | | | | | |
| Actual | | | | | | | | | | | | |
Class A Shares | | 1.31 | % | | $ | 1,000 | | $ | 636.50 | | $ | 5.36 |
Class C Shares | | 2.06 | % | | | 1,000 | | | 634.10 | | | 8.42 |
Class I Shares | | 1.06 | % | | | 1,000 | | | 637.30 | | | 4.34 |
Hypothetical (assuming a 5% return before expenses) | | | | | | | | | | | | |
Class A Shares | | 1.31 | % | | $ | 1,000 | | $ | 1,018.45 | | $ | 6.61 |
Class C Shares | | 2.06 | % | | | 1,000 | | | 1,014.70 | | | 10.38 |
Class I Shares | | 1.06 | % | | | 1,000 | | | 1,019.70 | | | 5.35 |
| | | | | |
| BALANCED FUND | | | | | | | | | | | | |
| Actual | | | | | | | | | | | | |
Class A Shares | | 1.41 | % | | $ | 1,000 | | $ | 780.80 | | $ | 6.28 |
Class C Shares | | 2.16 | % | | | 1,000 | | | 778.30 | | | 9.60 |
Class I Shares | | 1.16 | % | | | 1,000 | | | 781.80 | | | 5.17 |
Hypothetical (assuming a 5% return before expenses) | | | | | | | | | | | | |
Class A Shares | | 1.41 | % | | $ | 1,000 | | $ | 1,017.95 | | $ | 7.11 |
Class C Shares | | 2.16 | % | | | 1,000 | | | 1,014.20 | | | 10.88 |
Class I Shares | | 1.16 | % | | | 1,000 | | | 1,019.20 | | | 5.86 |
| | | | | |
| FIXED INCOME FUND | | | | | | | | | | | | |
| Actual | | | | | | | | | | | | |
Class A Shares | | 1.03 | % | | $ | 1,000 | | $ | 943.40 | | $ | 5.00 |
Class C Shares | | 1.78 | % | | | 1,000 | | | 939.90 | | | 8.63 |
Class I Shares | | 0.78 | % | | | 1,000 | | | 944.60 | | | 3.79 |
Hypothetical (assuming a 5% return before expenses) | | | | | | | | | | | | |
Class A Shares | | 1.03 | % | | $ | 1,000 | | $ | 1,019.85 | | $ | 5.20 |
Class C Shares | | 1.78 | % | | | 1,000 | | | 1,016.10 | | | 8.97 |
Class I Shares | | 0.78 | % | | | 1,000 | | | 1,021.10 | | | 3.94 |
| | | | |
| LIMITED MATURITY FIXED INCOME FUND | | | | | | | | | | |
| Actual | | | | | | | | | | | | |
Class A Shares | | 1.00 | % | | $ | 1,000 | | $ | 968.50 | | $ | 4.92 |
Class C Shares | | 1.75 | % | | | 1,000 | | | 964.90 | | | 8.60 |
Class I Shares | | 0.75 | % | | | 1,000 | | | 969.10 | | | 3.69 |
Hypothetical (assuming a 5% return before expenses) | | | | | | | | | | | | |
Class A Shares | | 1.00 | % | | $ | 1,000 | | $ | 1,020.00 | | $ | 5.05 |
Class C Shares | | 1.75 | % | | | 1,000 | | | 1,016.25 | | | 8.82 |
Class I Shares | | 0.75 | % | | | 1,000 | | | 1,021.25 | | | 3.79 |
(1) | | Expenses are equal to each Fund’s annualized expense ratio, multiplied by the average account value over the period, multiplied by 183/366 (to reflect the one-half year period). |
4
ABOUT SHAREHOLDERAND FUND EXPENSES (UNAUDITED)
| | | | | | | | | | | | |
| | | Annualized
Expense
Ratio | | | Beginning
Account Value
June 1, 2008 | | Ending
Account Value
November 30,
2008 | | Expenses
Paid During
Period(1) |
| | | | |
| INTERMEDIATE TAX EXEMPT BOND FUND | | | | | | | | | | |
| Actual | | | | | | | | | | | | |
Class A Shares | | 1.00 | % | | $ | 1,000 | | $ | 1,005.90 | | $ | 5.01 |
Class C Shares | | 1.75 | % | | | 1,000 | | | 1,002.20 | | | 8.76 |
Class I Shares | | 0.75 | % | | | 1,000 | | | 1,008.20 | | | 3.77 |
Hypothetical (assuming a 5% return before expenses) | | | | | | | | | | | | |
Class A Shares | | 1.00 | % | | $ | 1,000 | | $ | 1,020.00 | | $ | 5.05 |
Class C Shares | | 1.75 | % | | | 1,000 | | | 1,016.25 | | | 8.82 |
Class I Shares | | 0.75 | % | | | 1,000 | | | 1,021.25 | | | 3.79 |
| | | | | |
| TREASURY MONEY MARKET FUND | | | | | | | | | | | | |
| Actual | | | | | | | | | | | | |
Class A Shares | | 0.65 | % | | $ | 1,000 | | $ | 1,004.00 | | $ | 3.26 |
Class I Shares | | 0.40 | % | | | 1,000 | | | 1,005.30 | | | 2.01 |
Hypothetical (assuming a 5% return before expenses) | | | | | | | | | | | | |
Class A Shares | | 0.65 | % | | $ | 1,000 | | $ | 1,021.75 | | $ | 3.29 |
Class I Shares | | 0.40 | % | | | 1,000 | | | 1,023.00 | | | 2.02 |
| | | | | |
| MONEY MARKET FUND | | | | | | | | | | | | |
| Actual | | | | | | | | | | | | |
Class A Shares | | 0.72 | % | | $ | 1,000 | | $ | 1,008.10 | | $ | 3.61 |
Class I Shares | | 0.47 | % | | | 1,000 | | | 1,009.40 | | | 2.36 |
Hypothetical (assuming a 5% return before expenses) | | | | | | | | | | | | |
Class A Shares | | 0.72 | % | | $ | 1,000 | | $ | 1,021.40 | | $ | 3.64 |
Class I Shares | | 0.47 | % | | | 1,000 | | | 1,022.65 | | | 2.38 |
(1) | | Expenses are equal to each Fund’s annualized expense ratio, multiplied by the average account value over the period, multiplied by 183/366 (to reflect the one-half year period). |
5
REGIONS MORGAN KEEGAN SELECT MID CAP GROWTH FUND
OBJECTIVE & STRATEGY
Regions Morgan Keegan Select Mid Cap Growth Fund seeks long-term capital appreciation. The Fund invests primarily in equity securities of mid-capitalization companies (i.e., companies whose market capitalization falls within the range tracked by the Russell Mid Cap Growth Index at the time of purchase).
INVESTMENT RISKS: Equity securities (stocks) can be more volatile and carry more risk than other forms of investments, including investments in high-grade fixed income securities. Mid-capitalization and growth stocks typically carry additional risk, since smaller companies generally have higher risk of failure and growth stocks generally have been more susceptible to market, economic and individual company developments and, in each case historically, these stocks have experienced a greater degree of volatility. The net asset value per share of the Fund will fluctuate as the value of the securities in the portfolio changes.
MANAGEMENT DISCUSSIONOF FUND PERFORMANCE
What started out as a modest gain during the first half of the Fund’s fiscal year turned into an absolute rout in the second half of the fiscal year ended November 30, 2008. In our years of investment management experience, we have never seen stocks cascade down in price as they have over the last few months. The last few months will certainly be remembered well into the future.
For the fiscal year ended November 30, 2008, Regions Morgan Keegan Select Mid Cap Growth Fund’s Class A Shares had a total return of –41.79%, based on net asset value. The Russell Mid Cap Growth Index(1), the Fund’s benchmark, had a total return of –46.15% and the Lipper Mid Cap Growth Index(2) showed an average return of –45.29% during the same period. While the numbers were certainly not what we had envisioned at the beginning of the year, the Fund was able to outperform its index and peer group.
In what started as a long row of dominos falling over, the year began with poor performance from high-yield/structured debt funds, then on to bank stocks collapsing, a frozen financial system, and now potential major industrial problems (e.g., GM, Ford and Chrysler). We all are looking for what’s next, but perhaps all the dominos (or enough of them) have fallen over. The stock market has certainly declined enough to discount any (or most) unforeseen events.
While there were no sectors that provided positive returns, the Energy, Industrial and Consumer Discretionary sectors declined less than the market. Information Technology, Materials, and Financials were the weaker performing sectors. Individual stocks that added to performance were: Dollar Tree Stores, +47%; Southwestern Energy, +38%; Church & Dwight, +6%; and Ross Stores, +1%. While we try to avoid large price declines in stocks we hold, it was almost impossible to avoid large percentage losses in the Fund due to the overall decline of the market. The weaker performing holdings in the Fund were: Sirius XM Radio, –95%; Boyd Gaming, –88%; Health Net, –81%; CB Richard Ellis –81%; and Coventry Health, –78%.
There are any number of variables that could happen to the economy, but positive actions by the Federal Reserve and Treasury Department should lessen the economic pain and lead to eventual recovery of the economy. Unfortunately, there are no guarantees as it’s been over seventy years since the economy has suffered such financial shocks as we have over the last year.
| | |
 | |  |
Charles A. Murray, CFA Senior Portfolio Manager Morgan Asset Management, Inc. | | David P. McGrath, CFA Senior Portfolio Manager Morgan Asset Management, Inc. |
(Unaudited)
6
REGIONS MORGAN KEEGAN SELECT MID CAP GROWTH FUND
Market forecasts provided in this report may not necessarily come to pass. There is no assurance that the Fund will achieve its investment objectives. These views are subject to change at any time based upon market or other conditions, and Morgan Asset Management, Inc. disclaims any responsibility to update such views. The Fund is subject to market risk, which is the possibility that the market values of securities owned by the Fund will decline and, therefore, the value of the Fund’s shares may be less than what you paid for them. Accordingly, you can lose money investing in the Fund.
TOP TEN EQUITY HOLDINGS†
AS OF NOVEMBER 30, 2008
| | | | | | | | | | | | | | |
| TICKER | | DESCRIPTION | | % OF TOTAL NET ASSETS | | TICKER | | DESCRIPTION | | % OF TOTAL NET ASSETS |
SWN | | Southwestern Energy Company | | 5.4% | | DNB | | The Dun & Bradstreet Corporation | | 2.2% |
MDY | | Midcap Standard & Poors Trust Series 1 | | 4.3% | | NEM | | Newmont Mining Corporation | | 2.2% |
NBL | | Noble Energy, Inc. | | 3.6% | | HRS | | Harris Corporation | | 1.9% |
ABX | | Barrick Gold Corporation | | 3.3% | | SUN | | Sunoco, Inc. | | 1.8% |
JEC | | Jacobs Engineering Group Inc. | | 2.5% | | NRG | | NRG Energy, Inc. | | 1.7% |
| † | | The Fund’s composition is subject to change. |
EQUITY SECTOR DIVERSIFICATION†
AS OF NOVEMBER 30, 2008
| | | | | | |
% OF TOTAL INVESTMENTS
EXCLUDINGCOLLATERALFORSECURITIESLENDING | | % OF TOTAL INVESTMENTS
EXCLUDINGCOLLATERALFORSECURITIESLENDING |
Consumer Products | | 28.6% | | Technology | | 7.0% |
Energy | | 25.8% | | Financials | | 4.8% |
Industrials | | 8.8% | | Communications | | 4.7% |
Exchange Traded Funds | | 8.0% | | Utilities | | 2.3% |
Basic Materials | | 8.2% | | Short Term Investments | | 1.8% |
| | | | | | |
|
| | | | | Total | | 100.0% |
| † | | The Fund’s composition is subject to change. |
INDEX DESCRIPTIONS
(1) | | The Russell Mid Cap Growth Index tracks equity securities of medium-sized companies whose market capitalization falls within the $17 million to $15.4 billion range. The index is unmanaged and, unlike the Fund, is not affected by cash flows or trading and other expenses. It is not possible to invest directly in an index. |
(2) | | The Lipper Mid Cap Growth Index is the average return of the 30 largest mid-cap growth funds. Funds in the index are rebalanced quarterly. It is not possible to invest directly in an index. |
(Unaudited)
7
REGIONS MORGAN KEEGAN SELECT MID CAP GROWTH FUND
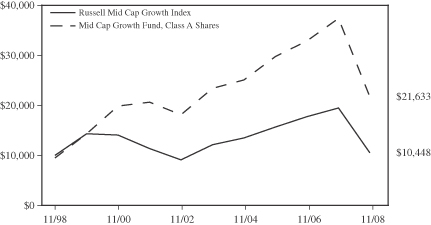
GROWTHOFA $10,000 INVESTMENT
CLASS A SHARES
The graph below illustrates a hypothetical investment of $10,000 in Regions Morgan Keegan Select Mid Cap Growth Fund—Class A Shares(1) from Novemeber 30, 1998 to November 30, 2008 compared to the Russell Mid Cap Growth Index(2).
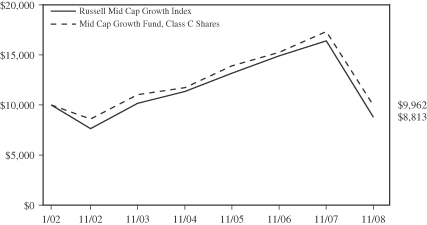
GROWTHOFA $10,000 INVESTMENT
CLASS C SHARES
The graph below illustrates a hypothetical investment of $10,000 in Regions Morgan Keegan Select Mid Cap Growth Fund—Class C Shares from the commencement of investment operations on January 7, 2002 to November 30, 2008 compared to the Russell Mid Cap Growth Index (2).
(Unaudited)
8
REGIONS MORGAN KEEGAN SELECT MID CAP GROWTH FUND
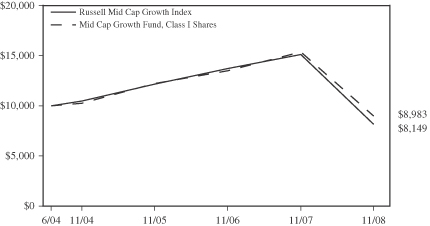
GROWTHOFA $10,000 INVESTMENT
CLASS I SHARES
The graph below illustrates a hypothetical investment of $10,000 in Regions Morgan Keegan Select Mid Cap Growth Fund—Class I Shares from the commencement of investment operations on June 23, 2004 to November 30, 2008 compared to the Russell Mid Cap Growth Index (2).
PERFORMANCE INFORMATION
| | | | | | | | | | | | | | | |
| | | AVERAGE ANNUAL TOTAL RETURNS | |
| AS OF NOVEMBER 30, 2008 | | SIX
MONTHS* | | | 1 YEAR | | | 5 YEAR | | | 10 YEAR | | | COMMENCEMENT
OF INVESTMENT
OPERATIONS(3) | |
| CLASS A SHARES**(1) | | -47.34 | % | | -44.99 | % | | -2.58 | % | | 8.02 | % | | 9.61 | % |
(EXCLUDINGSALESLOAD)(1) | | -44.28 | % | | -41.79 | % | | -1.47 | % | | 8.63 | % | | 10.01 | % |
| CLASS C SHARES*** | | -45.06 | % | | -42.95 | % | | -2.01 | % | | N/A | | | -0.06 | % |
(EXCLUDINGCDSC) | | -44.51 | % | | -42.37 | % | | -2.01 | % | | N/A | | | -0.06 | % |
| CLASS I SHARES | | -44.22 | % | | -41.62 | % | | N/A | | | N/A | | | -2.39 | % |
| RUSSELL MID CAP GROWTH INDEX(2) | | -46.59 | % | | -46.15 | % | | -2.83 | % | | 0.44 | % | | — | |
| * | | Not annualized for periods less than one year. |
| ** | | Reflects the maximum sales load of 5.50%. |
| *** | | Reflects the maximum contingent deferred sales charge (CDSC) of 1.00% for shares redeemed within one year of purchase. |
(1) | | Effective June 4, 2004, all Class B Shares of the Fund converted to Class A Shares. Historical total return information for any period or portion thereof prior to the commencement of investment operations of Class A Shares on May 20, 1998 is that of Class B Shares and reflects all charges, expenses and fees incurred by Class B Shares, which were generally higher than the expenses of Class A Shares, during such periods. |
(2) | | The Russell Mid Cap Growth Index tracks equity securities of medium-sized companies whose market capitalization falls within the $17 million to $15.4 billion range. Total returns for the index shown are not adjusted to reflect sales charges, expenses or other fees that the Securities and Exchange Commission requires to be reflected in the Fund’s performance. The index is unmanaged and, unlike the Fund, is not affected by cash flows or trading and other expenses. It is not possible to invest directly in an index. |
(3) | | The Fund’s Class A Shares (including predecessor Class B Shares), Class C Shares and Class I Shares commenced investment operations on June 30, 1993, January 7, 2002 and June 23, 2004, respectively. |
Performance data quoted represents past performance, which is no guarantee of future results. Investment return and principal value will fluctuate so that an investor’s shares, when redeemed, may be worth more or less than their original cost. Fund performance changes over time and current performance may be lower or higher than what is stated. For the most recent performance, call toll-free 877-757-7424. The Fund’s performance results are shown on a total return basis and include the reinvestment of all dividends and capital gain distributions in the Fund. Returns shown in the chart and table above do not reflect the deduction of taxes that a shareholder would pay on Fund distributions or the redemption of Fund shares. Mutual funds are not bank deposits or obligations, are not guaranteed by any bank and are not insured or guaranteed by the U.S. government, the Federal Deposit Insurance Corporation, the Federal Reserve Board or any other government agency. Investment in mutual funds involves investment risk, including possible loss of principal.
(Unaudited)
9
REGIONS MORGAN KEEGAN SELECT MID CAP GROWTH FUND
PORTFOLIOOF INVESTMENTS
NOVEMBER 30, 2008
| | | | | | | |
| Shares | | | | | | Value |
| Common Stocks–89.9% | | | |
| | | |
| | | | | Basic Materials–8.2% | | | |
| | | | | Iron/ Steel–2.5% | | | |
| 140,000 | | | | Carpenter Technology Corporation | | $ | 2,332,400 |
| 160,000 | | | | Steel Dynamics, Inc. | | | 1,321,600 |
| 60,000 | | | | United States Steel Corporation | | | 1,824,000 |
| | | | | | |
|
|
| | | | | Total | | | 5,478,000 |
| | | | | | |
|
|
| | | | | Mining–5.7% | | | |
| 15,000 | | (2) | | Agnico-Eagle Mines Limited | | | 564,900 |
| 240,000 | | | | Barrick Gold Corporation | | | 7,070,400 |
| 140,000 | | | | Newmont Mining Corporation | | | 4,711,000 |
| | | | | | |
|
|
| | | | | Total | | | 12,346,300 |
| | | | | | |
|
|
| | | | | Total Basic Materials | | | 17,824,300 |
| | | | | | |
|
|
| | | |
| | | | | Communications–4.7% | | | |
| | | | | Media–1.9% | | | |
| 120,000 | | (1) | | DISH Network Corporation | | | 1,329,600 |
| 80,000 | | | | John Wiley & Sons, Inc. | | | 2,876,800 |
| | | | | | |
|
|
| | | | | Total | | | 4,206,400 |
| | | | | | |
|
|
| | | | | Radio–0.1% | | | |
| 700,000 | | (1)(2) | | SIRIUS XM Radio Inc. | | | 142,100 |
| | | | | Telecommunications–2.7% | | | |
| 140,000 | | (1)(2) | | Ciena Corporation | | | 1,036,000 |
| 50,000 | | (1) | | CommScope, Inc. | | | 564,500 |
| 120,000 | | | | Harris Corporation | | | 4,185,600 |
| | | | | | |
|
|
| | | | | Total | | | 5,786,100 |
| | | | | | |
|
|
| | | | | Total Communications | | | 10,134,600 |
| | | | | | |
|
|
| | | |
| | | | | Consumer Products–28.5% | | | |
| | | | | Agriculture–1.6% | | | |
| 80,000 | | (2) | | Bunge Limited | | | 3,396,800 |
| | | | | Airlines–1.1% | | | |
| 200,000 | | (1)(2) | | AirTran Holdings, Inc. | | | 682,000 |
| 200,000 | | (1)(2) | | AMR Corporation | | | 1,756,000 |
| | | | | | |
|
|
| | | | | Total | | | 2,438,000 |
| | | | | | |
|
|
| | | | | Apparel–1.3% | | | |
| 120,000 | | (1) | | Coach, Inc. | | | 2,148,000 |
| 70,000 | | (1)(2) | | The Timberland Company | | | 710,500 |
| | | | | | |
|
|
| | | | | Total | | | 2,858,500 |
| | | | | | |
|
|
| | | | | Beverages–1.0% | | | |
| 120,000 | | | | The Pepsi Bottling Group, Inc. | | | 2,170,800 |
| | | | | Biotechnology–2.7% | | | |
| 40,000 | | (1) | | Celgene Corporation | | | 2,084,000 |
| 150,000 | | (1)(2) | | Vertex Pharmaceuticals Incorporated | | | 3,688,500 |
| | | | | | |
|
|
| | | | | Total | | | 5,772,500 |
| | | | | | |
|
|
| | | | | Commercial Services–1.0% | | | |
| 50,000 | | | | Lender Processing Services, Inc. | | | 1,103,000 |
| 90,000 | | (1)(2) | | Monster Worldwide, Inc. | | | 1,032,300 |
| | | | | | |
|
|
| | | | | Total | | | 2,135,300 |
| | | | | | |
|
|
| | | | | Cosmetics/Personal Care–0.7% | | | |
| 70,000 | | | | Avon Products, Inc. | | | 1,477,000 |
| | | | | Distribution/Wholesale–1.4% | | | |
| 80,000 | | (2) | | Fastenal Company | | | 3,080,800 |
| | | | | | | |
| Shares | | | | | | Value |
| Common Stocks (continued) | | | |
| | | | | Healthcare Products–3.2% | | | |
| 60,000 | | (2) | | DENTSPLY International, Inc. | | $ | 1,564,800 |
| 50,000 | | (1) | | Henry Schein, Inc. | | | 1,786,500 |
| 140,000 | | (1)(2) | | Hologic, Inc. | | | 1,968,400 |
| 60,000 | | (1) | | St. Jude Medical, Inc. | | | 1,681,800 |
| | | | | | |
|
|
| | | | | Total | | | 7,001,500 |
| | | | | | |
|
|
| | | | | Healthcare Services–1.1% | | | |
| 50,000 | | (1) | | Coventry Health Care, Inc. | | | 623,500 |
| 60,000 | | (1) | | Pediatrix Medical Group, Inc. | | | 1,867,200 |
| | | | | | |
|
|
| | | | | Total | | | 2,490,700 |
| | | | | | |
|
|
| | | | | Home Furnishings–0.4% | | | |
| 50,000 | | | | Harman International Industries, Incorporated | | | 752,500 |
| | | | | Household Products–2.2% | | | |
| 40,000 | | | | Church & Dwight Co., Inc. | | | 2,377,600 |
| 200,000 | | (1)(2) | | Jarden Corporation | | | 2,496,000 |
| | | | | | |
|
|
| | | | | Total | | | 4,873,600 |
| | | | | | |
|
|
| | | | | Lodging–0.2% | | | |
| 100,000 | | (2) | | Boyd Gaming Corporation | | | 440,000 |
| | | | | Pharmaceuticals–2.4% | | | |
| 50,000 | | | | Allergan, Inc. | | | 1,884,000 |
| 40,000 | | (1) | | Express Scripts, Inc. | | | 2,300,400 |
| 50,000 | | (1)(2) | | VCA Anatech, Inc. | | | 952,500 |
| | | | | | |
|
|
| | | | | Total | | | 5,136,900 |
| | | | | | |
|
|
| | | | | Retail–8.2% | | | |
| 70,000 | | | | Advance Auto Parts, Inc. | | | 2,125,200 |
| 130,000 | | (2) | | American Eagle Outfitters, Inc. | | | 1,248,000 |
| 100,000 | | | | Brinker International, Inc. | | | 664,000 |
| 180,000 | | (2) | | CBRL Group, Inc. | | | 3,479,400 |
| 300,000 | | (1)(2) | | Chico’s FAS, Inc. | | | 765,000 |
| 56,000 | | (1) | | Dollar Tree Stores, Inc. | | | 2,368,240 |
| 140,000 | | | | Guess?, Inc. | | | 1,852,200 |
| 120,000 | | | | Ross Stores, Inc. | | | 3,180,000 |
| 80,000 | | (1)(2) | | Urban Outfitters, Inc. | | | 1,453,600 |
| 100,000 | | (2) | | Williams-Sonoma, Inc. | | | 701,000 |
| | | | | | |
|
|
| | | | | Total | | | 17,836,640 |
| | | | | | |
|
|
| | | | | Total Consumer Products | | | 61,861,540 |
| | | | | | |
|
|
| | | |
| | | | | Energy–25.7% | | | |
| | | | | Coal–3.2% | | | |
| 230,000 | | | | Arch Coal, Inc. | | | 3,537,400 |
| 150,000 | | (2) | | Peabody Energy Corporation | | | 3,514,500 |
| | | | | | |
|
|
| | | | | Total | | | 7,051,900 |
| | | | | | |
|
|
| | | | | Energy Alternate Sources–0.1% | | | |
| 1,000 | | (1) | | First Solar, Inc. | | | 124,840 |
| | | | | Oil & Gas–13.9% | | | |
| 80,000 | | (1) | | Cameron International Corporation | | | 1,688,000 |
| 60,000 | | | | ENSCO International Incorporated | | | 1,944,600 |
| 80,000 | | (1) | | Newfield Exploration Company | | | 1,806,400 |
| 150,000 | | | | Noble Energy, Inc. | | | 7,842,000 |
| 30,000 | | | | Range Resources Corporation | | | 1,244,100 |
| 340,000 | | (1) | | Southwestern Energy Company | | | 11,685,800 |
| 100,000 | | (2) | | Sunoco, Inc. | | | 3,974,000 |
| | | | | | |
|
|
| | | | | Total | | | 30,184,900 |
| | | | | | |
|
|
The Notes to the Financial Statements are an integral part of, and should be read in conjunction with, the Financial Statements.
10
REGIONS MORGAN KEEGAN SELECT MID CAP GROWTH FUND
PORTFOLIOOF INVESTMENTS
NOVEMBER 30, 2008
| | | | | | | |
| Shares | | | | | | Value |
| Common Stocks (continued) | | | |
| | | | | Oil & Gas Services–5.9% | | | |
| 80,000 | | (2) | | Cimarex Energy Co. | | $ | 2,269,600 |
| 100,000 | | (1) | | Denbury Resources Inc. | | | 953,000 |
| 80,000 | | (1) | | FMC Technologies, Inc. | | | 2,197,600 |
| 80,000 | | | | Frontier Oil Corporation | | | 955,200 |
| 70,000 | | (1) | | National Oilwell Varco, Inc. | | | 1,980,300 |
| 50,000 | | (1) | | Oceaneering International, Inc. | | | 1,291,000 |
| 70,000 | | | | Smith International, Inc. | | | 2,046,800 |
| 100,000 | | (1) | | Weatherford International Ltd. | | | 1,277,000 |
| | | | | | |
|
|
| | | | | Total | | | 12,970,500 |
| | | | | | |
|
|
| | | | | Pipelines–2.6% | | | |
| 56,000 | | | | Equitable Resources, Inc. | | | 1,868,720 |
| 80,000 | | | | Questar Corporation | | | 2,575,200 |
| 70,000 | | | | The Williams Companies, Inc. | | | 1,135,400 |
| | | | | | |
|
|
| | | | | Total | | | 5,579,320 |
| | | | | | |
|
|
| | | | | Total Energy | | | 55,911,460 |
| | | | | | |
|
|
| | | |
| | | | | Financials–4.8% | | | |
| | | | | Diversified Financial Services–4.6% | | | |
| 80,000 | | | | Ameriprise Financial, Inc. | | | 1,476,800 |
| 24,000 | | (1)(2) | | IntercontinentalExchange, Inc. | | | 1,766,400 |
| 220,000 | | (2) | | Janus Capital Group, Inc. | | | 1,793,000 |
| 60,000 | | | | NYSE Euronext, Inc. | | | 1,428,600 |
| 160,000 | | (1)(2) | | The Nasdaq Stock Market, Inc. | | | 3,440,000 |
| | | | | | |
|
|
| | | | | Total | | | 9,904,800 |
| | | | | | |
|
|
| | | | | Real Estate Investment Trusts–0.2% | | | |
| 100,000 | | (1) | | CB Richard Ellis Group, Inc. | | | 456,000 |
| | | | | | |
|
|
| | | | | Total Financials | | | 10,360,800 |
| | | | | | |
|
|
| | | |
| | | | | Industrials–8.8% | | | |
| | | | | Diversified Machinery–1.2% | | | |
| 50,000 | | | | Flowserve Corporation | | | 2,516,500 |
| | | | | Electrical Components & Equipment–1.8% | | | |
| 80,000 | | (1)(2) | | Energizer Holdings, Inc. | | | 3,473,600 |
| 13,386 | | (1) | | SunPower Corporation | | | 348,304 |
| | | | | | |
|
|
| | | | | Total | | | 3,821,904 |
| | | | | | |
|
|
| | | | | Electronics–0.4% | | | |
| 40,000 | | | | Amphenol Corporation | | | 928,800 |
| | | | | Engineering & Construction–3.4% | | | |
| 44,000 | | | | Fluor Corporation | | | 2,003,760 |
| 120,000 | | (1) | | Jacobs Engineering Group Inc. | | | 5,372,400 |
| | | | | | |
|
|
| | | | | Total | | | 7,376,160 |
| | | | | | |
|
|
| | | | | Manufacturing–0.6% | | | |
| 17,280 | | | | John Bean Technologies Corporation | | | 150,855 |
| 80,000 | | | | Textron Inc. | | | 1,218,400 |
| | | | | | |
|
|
| | | | | Total | | | 1,369,255 |
| | | | | | |
|
|
| | | | | Metal Fabricate/Hardware–1.4% | | | |
| 50,000 | | | | Precision Castparts Corp. | | | 3,135,000 |
| | | | | | |
|
|
| | | | | Total Industrials | | | 19,147,619 |
| | | | | | |
|
|
| | | |
| | | | | Technology–7.0% | | | |
| | | | | Computers–2.7% | | | |
| 40,000 | | (1) | | Cognizant Technology Solutions Corporation | | | 768,000 |
| | | | | | | | |
| Shares | | | | | | Value |
| | Common Stocks (continued) | | | |
| | 70,000 | | (1)(2) | | DST Systems, Inc. | | $ | 2,646,700 |
| | 40,000 | | (1) | | Synopsys, Inc. | | | 641,200 |
| | 140,000 | | (1) | | Western Digital Corporation | | | 1,708,000 |
| | | | | | | |
|
|
| | | | | | Total | | | 5,763,900 |
| | | | | | | |
|
|
| | | | | | Semiconductors–1.3% | | | |
| | 100,000 | | | | Applied Materials, Inc. | | | 958,000 |
| | 100,000 | | (1)(2) | | Cypress Semiconductor Corporation | | | 373,000 |
| | 200,000 | | (1)(2) | | NVIDIA Corporation | | | 1,494,000 |
| | | | | | | |
|
|
| | | | | | Total | | | 2,825,000 |
| | | | | | | |
|
|
| | | | | | Software–3.0% | | | |
| | 100,000 | | | | Fidelity National Information Services, Inc. | | | 1,718,000 |
| | 60,000 | | | | The Dun & Bradstreet Corporation | | | 4,800,000 |
| | | | | | | |
|
|
| | | | | | Total | | | 6,518,000 |
| | | | | | | |
|
|
| | | | | | Total Technology | | | 15,106,900 |
| | | | | | | |
|
|
| | | |
| | | | | | Utilities–2.2% | | | |
| | | | | | Electric–2.2% | | | |
| | 160,000 | | (1)(2) | | NRG Energy, Inc. | | | 3,790,400 |
| | 140,000 | | (1) | | The AES Corporation | | | 1,076,600 |
| | | | | | | |
|
|
| | | | | | Total Utilities | | | 4,867,000 |
| | | | | | | |
|
|
| | | | | | Total Common Stocks
(identified cost $277,834,590) | | | 195,214,219 |
| | | | | | | |
|
|
| | Exchange Traded Funds–8.0% | | | |
| | 200,000 | | (2) | | Financial Select Sector SPDR | | | 2,522,000 |
| | 140,000 | | (2) | | Market Vectors Gold Miners | | | 3,729,600 |
| | 100,000 | | (2) | | Midcap Standard & Poors Trust Series 1 | | | 9,359,000 |
| | 100,000 | | (2) | | Semiconductor HOLDRs | | | 1,664,000 |
| | | | | | | |
|
|
| | | | | | Total | | | 17,274,600 |
| | | | | | | |
|
|
| | | | | | Total Exchange Traded Funds
(identified cost $24,641,737) | | | 17,274,600 |
| | | | | | | |
|
|
| | Short-Term Investments–17.7% | | | |
| | 34,703,387 | | | | Bank of New York Institutional Cash Reserves Fund (held as collateral for securities lending) | | | 34,546,558 |
| | 1,986,818 | | | | Fidelity Institutional Money Market Fund | | | 1,986,818 |
| | 1,986,818 | | | | Lehman Brothers Institutional Prime Money Market Fund | | | 1,986,818 |
| | | | | | | |
|
|
| | | | | | Total Short-Term Investments (identified cost $38,677,023) | | | 38,520,194 |
| | | | | | | |
|
|
Principal
Amount | | | | | | Value |
| | Certificates of Deposit–6.4% | | | |
| $ | 1,993,653 | | | | Bank of Ireland, 1.539%, 2/12/2009 (held as collateral for securities lending) | | | 1,993,653 |
The Notes to the Financial Statements are an integral part of, and should be read in conjunction with, the Financial Statements.
11
REGIONS MORGAN KEEGAN SELECT MID CAP GROWTH FUND
PORTFOLIOOF INVESTMENTS
NOVEMBER 30, 2008
| | | | | | | | | |
Principal
Amount | | | | | | Value | |
| | Certificates of Deposit (continued) | | | | |
| $ | 2,962,950 | | | | Calyon New York, 1.463%, 2/13/2009 (held as collateral for securities lending) | | $ | 2,962,950 | |
| | 2,958,596 | | | | Deutsche Bank AG Yankee, 4.035%, 1/25/2010 (held as collateral for securities lending) | | | 2,958,596 | |
| | 2,992,174 | | | | Nordea Bank Finland New York, 2.178%, 2/6/2009 (held as collateral securities lending) | | | 2,992,174 | |
| | 1,956,114 | | | | Suntrust Bank, 1.415%, 6/25/2009 (held as collateral for securities lending) | | | 1,956,114 | |
| | 957,426 | | | | Suntrust Bank, 1.471%, 1/29/2010 (held as collateral for securities lending) | | | 957,426 | |
| | | | | | | |
|
|
|
| | | | | | Total Certificates of Deposit (identified cost $13,820,913) | | | 13,820,913 | |
| | | | | | | |
|
|
|
| | | | | | Total Investments–122.0% (identified cost $354,974,263) | | | 264,829,926 | |
| | | | | | | |
|
|
|
| | | | | | Other Assets and Liabilities–net–(22.0)% | | | (47,685,651 | ) |
| | | | | | | |
|
|
|
| | | | | | Total Net Assets–100.0% | | $ | 217,144,275 | |
| | | | | | | |
|
|
|
|
| Call Options Written November 30, 2008 |
| | | | |
| | |
Number of
Contracts
| | Common Stocks/Expiration
Date/Exercise Price
| | |
| 200 | | Church & Dwight Co., Inc. /
January 2009 / 65.000 | | (14,000) |
| 1,000 | | Southwestern Energy Company /
January 2009 / 47.500 | | (105,000) |
| | | |
|
| 1,200 | | Total Call Options Written
(Premiums Received $250,025) | | (119,000) |
| | | |
|
| (1) | | Non-income producing security. |
| (2) | | Certain shares are temporarily on loan to unaffiliated broker-dealers. See Notes 2 and 5 of the Financial Statements for additional information about securities lending. |
Note: The categories of investments are shown as a percentage of total net assets at November 30, 2008.
The Notes to the Financial Statements are an integral part of, and should be read in conjunction with, the Financial Statements.
12
[THIS PAGE INTENTIONALLY LEFT BLANK]
13
REGIONS MORGAN KEEGAN SELECT GROWTH FUND
OBJECTIVE & STRATEGY
Regions Morgan Keegan Select Growth Fund seeks growth of capital and income. The Fund invests in common stocks of companies that are expected to achieve above-average growth in earnings.
INVESTMENT RISKS: Equity securities (stocks) can be more volatile and carry more risk than other forms of investments, including investments in high-grade fixed income securities. Growth style stocks are considered to be more susceptible to developments affecting the market/economy and the individual company than common stocks in general. The net asset value per share of the Fund will fluctuate as the value of the securities in the portfolio changes.
MANAGEMENT DISCUSSIONOF FUND PERFORMANCE
For the fiscal year ended November 30, 2008, Regions Morgan Keegan Select Growth Fund’s Class A Shares had a total return of –35.65%, based on net asset value. During the same period, the Standard & Poor’s 500 Index(1), the Fund’s benchmark, had a total return of –38.09% and the Lipper Large Cap Growth Index(2) had a total return of –42.88%. The miserable performance of the equity markets reflected a convergence of declining housing prices, an institutional credit crisis, skyrocketing unemployment, plunging consumer confidence (and spending), and massive government intervention. While we are not pleased with the Fund’s performance, we did avoid many major disasters in the financial sector. Also, we were underweighted in the “high expectations” stocks with high valuations that performed poorly during the year.
Only three stocks held in the Fund showed a positive return. They were Southwest Energy (+38%), Wal-Mart (+19%) and Genentech (+0.4%). The list of stocks that showed poor performance for the year is extensive, but some of the worst include Coventry Health (–78%), NYSE Euronext (–72%) and Research in Motion (–63%).
The last few months left no place for investors to hide. Only three economic sectors in the Standard & Poor’s 500 Index showed a better performance than –38% for the twelve months ended November 30, 2008. They were Consumer Staples (–13%), Energy (–26%) and Health Care (–27%). We continue to hold a slight overweight in the Energy and Material sectors as compared to the Fund’s benchmark index.
| | |
| | |
Charles A. Murray, CFA Senior Portfolio Manager Morgan Asset Management, Inc. | | David P. McGrath, CFA Senior Portfolio Manager Morgan Asset Management, Inc. |
Market forecasts provided in this report may not necessarily come to pass. There is no assurance that the Fund will achieve its investment objectives. These views are subject to change at any time based upon market or other conditions, and Morgan Asset Management, Inc. disclaims any responsibility to update such views. The Fund is subject to market risk, which is the possibility that the market values of securities owned by the Fund will decline and, therefore, the value of the Fund’s shares may be less than what you paid for them. Accordingly, you can lose money investing in the Fund.
(Unaudited)
14
REGIONS MORGAN KEEGAN SELECT GROWTH FUND
TOP TEN EQUITY HOLDINGS†
AS OF NOVEMBER 30, 2008
| | | | | | | | | | | | | | |
| TICKER | | DESCRIPTION | | % OF TOTAL NET ASSETS | | TICKER | | DESCRIPTION | | % OF TOTAL NET ASSETS |
XOM | | Exxon Mobil Corp. | | 6.4% | | MSFT | | Microsoft Corp. | | 3.4% |
CSCO | | Cisco Systems, Inc. | | 4.0% | | PG | | The Procter & Gamble Co. | | 3.4% |
ORCL | | Oracle Corp. | | 3.9% | | IBM | | International Business Machines Corp. | | 3.3% |
JNJ | | Johnson & Johnson | | 3.8% | | CVX | | Chevron Corp. | | 3.2% |
OIH | | Oil Services HOLDRs | | 3.5% | | ABX | | Barrick Gold Corp. | | 3.1% |
| † | | The Fund’s composition is subject to change. |
EQUITY SECTOR DIVERSIFICATION†
AS OF NOVEMBER 30, 2008
| | | | | | | | |
%OFTOTALINVESTMENTS EXCLUDINGCOLLATERALFORSECURITIESLENDING | | %OFTOTALINVESTMENTS EXCLUDINGCOLLATERALFORSECURITIESLENDING |
Consumer Products | | 33.1% | | Industrials | | 5.9% |
Energy | | 21.3% | | Exchange Traded Fund | | 5.4% |
Technology | | 15.8% | | Financials | | 0.8% |
Communications | | 6.4% | | Short Term Investments | | 5.3% |
| | | | | | |
|
Basic Materials | | 6.0% | | Total | | 100.0% |
| † | | The Fund’s composition is subject to change. |
INDEX DESCRIPTIONS
(1) | | The Standard & Poor’s 500 Index is an unmanaged capitalization-weighted index of 500 stocks designed to measure performance of the broad domestic economy through changes in the aggregated market value of 500 stocks representing all major industries. The index is unmanaged and, unlike the Fund, is not affected by cash flows or trading and other expenses. It is not possible to invest directly in an index. |
(2) | | The Lipper Large Cap Growth Index is the average return of the 30 largest large-cap growth funds. Funds in the index are rebalanced quarterly. It is not possible to invest directly in an index. |
(Unaudited)
15
REGIONS MORGAN KEEGAN SELECT GROWTH FUND
GROWTHOFA $10,000 INVESTMENT
CLASS A SHARES
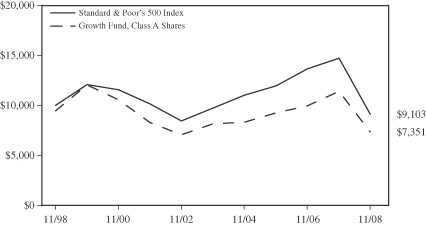
The graph below illustrates a hypothetical investment of $10,000 in Regions Morgan Keegan Select Growth Fund—Class A Shares(1) from November 30, 1998 to November 30, 2008 compared to the Standard & Poor’s 500 Index(2), a broad-based market index.
GROWTHOFA $10,000 INVESTMENT
CLASS C SHARES
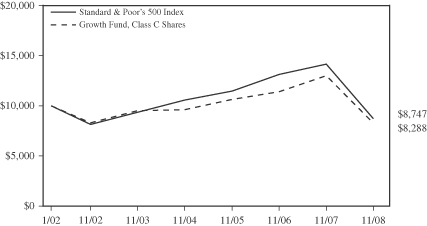
The graph below illustrates a hypothetical investment of $10,000 in Regions Morgan Keegan Select Growth Fund—Class C Shares from the commencement of investment operations on January 7, 2002 to November 30, 2008 compared to the Standard & Poor’s 500 Index(2), a broad-based market index.
(Unaudited)
16
REGIONS MORGAN KEEGAN SELECT GROWTH FUND
GROWTHOFA $10,000 INVESTMENT
CLASS I SHARES
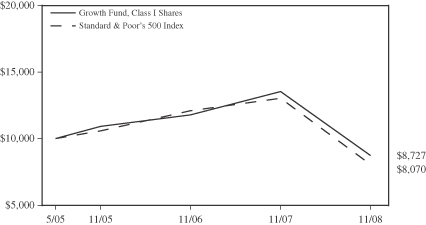
The graph below illustrates a hypothetical investment of $10,000 in Regions Morgan Keegan Select Growth Fund—Class I Shares from the commencement of investment operations on May 19, 2005 to November 30, 2008 compared to the Standard & Poor’s 500 Index(2), a broad-based market index.
PERFORMANCE INFORMATION
| | | | | | | | | | | | | | | |
| | | AVERAGE ANNUAL TOTAL RETURNS | |
| AS OF NOVEMBER 30, 2008 | | SIX
MONTHS* | | | 1 YEAR | | | 5 YEAR | | | 10 YEAR | | | COMMENCEMENT
OF INVESTMENT
OPERATIONS(3) | |
| CLASS A SHARES**(1) | | -38.73 | % | | -39.19 | % | | -3.24 | % | | -3.03 | % | | 4.62 | % |
(EXCLUDINGSALESLOAD)(1) | | -35.17 | % | | -35.65 | % | | -2.13 | % | | -2.48 | % | | 4.98 | % |
| CLASS C SHARES*** | | -36.07 | % | | -36.93 | % | | -2.74 | % | | N/A | | | -2.68 | % |
(EXCLUDINGCDSC) | | -35.43 | % | | -36.30 | % | | -2.74 | % | | N/A | | | -2.68 | % |
| CLASS I SHARES | | -35.11 | % | | -35.53 | % | | N/A | | | N/A | | | -3.77 | % |
| STANDARD & POOR’S 500 INDEX(2) | | -35.20 | % | | -38.09 | % | | -1.39 | % | | -0.93 | % | | — | |
| * | | Not annualized for periods less than one year. |
| ** | | Reflects the maximum sales load of 5.50%. |
| *** | | Reflects the maximum contingent deferred sales charge (CDSC) of 1.00% for shares redeemed within one year of purchase. |
(1) | | Effective June 4, 2004, all Class B Shares of the Fund converted to Class A Shares. Historical total return information for any period or portion thereof prior to the commencement of investment operations of Class A Shares on May 20, 1998 is that of Class B Shares and reflects all charges, expenses and fees incurred by Class B Shares, which were generally higher than the expenses of Class A Shares, during such periods. |
(2) | | The Standard & Poor’s 500 Index is an unmanaged capitalization-weighted index of 500 stocks designed to measure performance of the broad domestic economy through changes in the aggregated market value of 500 stocks representing all major industries. Total returns for the index shown are not adjusted to reflect sales charges, expenses or other fees that the Securities and Exchange Commission requires to be reflected in the Fund’s performance. The index is unmanaged and, unlike the Fund, is not affected by cash flows or trading and other expenses. It is not possible to invest directly in an index. |
(3) | | The Fund’s Class A Shares (including predecessor Class B Shares), Class C Shares and Class I Shares commenced investment operations on April 20, 1992, January 7, 2002 and May 19, 2005, respectively. |
Performance data quoted represents past performance, which is no guarantee of future results. Investment return and principal value will fluctuate so that an investor’s shares, when redeemed, may be worth more or less than their original cost. Fund performance changes over time and current performance may be lower or higher than what is stated. For the most recent performance, call toll-free 877-757-7424. The Fund’s performance results are shown on a total return basis and include the reinvestment of all dividends and capital gain distributions in the Fund. Returns shown in the chart and table above do not reflect the deduction of taxes that a shareholder would pay on Fund distributions or the redemption of Fund shares. Mutual funds are not bank deposits or obligations, are not guaranteed by any bank and are not insured or guaranteed by the U.S. government, the Federal Deposit Insurance Corporation, the Federal Reserve Board or any other government agency. Investment in mutual funds involves investment risk, including possible loss of principal.
(Unaudited)
17
REGIONS MORGAN KEEGAN SELECT GROWTH FUND
PORTFOLIOOF INVESTMENTS
NOVEMBER 30, 2008
| | | | | | | |
| Shares | | | | | | Value |
| Common Stocks–89.5% | | | |
| | | |
| | | | | Basic Materials–6.0% | | | |
| | | | | Iron/Steel–1.3% | | | |
| 70,000 | | | | Nucor Corporation | | $ | 2,497,600 |
| 24,000 | | | | United States Steel Corporation | | | 729,600 |
| | | | | | |
|
|
| | | | | Total | | | 3,227,200 |
| | | | | | |
|
|
| | | | | Mining–4.7% | | | |
| 260,000 | | | | Barrick Gold Corporation | | | 7,659,600 |
| 120,000 | | | | Newmont Mining Corporation | | | 4,038,000 |
| | | | | | |
|
|
| | | | | Total | | | 11,697,600 |
| | | | | | |
|
|
| | | | | Total Basic Materials | | | 14,924,800 |
| | | | | | |
|
|
| | | |
| | | | | Communications–6.4% | | | |
| | | | | Internet–0.9% | | | |
| 8,000 | | (1) | | Google Inc. | | | 2,343,680 |
| | | | | Telecommunications–5.5% | | | |
| 600,000 | | (1) | | Cisco Systems, Inc. | | | 9,924,000 |
| 110,000 | | | | QUALCOMM Incorporated | | | 3,692,700 |
| | | | | | |
|
|
| | | | | Total | | | 13,616,700 |
| | | | | | |
|
|
| | | | | Total Communications | | | 15,960,380 |
| | | | | | |
|
|
| | | |
| | | | | Consumer Products–33.2% | | | |
| | | | | Agriculture–0.8% | | | |
| 50,000 | | (2) | | Bunge Limited | | | 2,123,000 |
| | | | | Apparel–1.1% | | | |
| 60,000 | | (1) | | Coach, Inc. | | | 1,074,000 |
| 30,000 | | | | NIKE, Inc. | | | 1,597,500 |
| | | | | | |
|
|
| | | | | Total | | | 2,671,500 |
| | | | | | |
|
|
| | | | | Beverages–4.2% | | | |
| 120,000 | | | | PepsiCo, Inc. | | | 6,804,000 |
| 70,000 | | | | The Coca-Cola Company | | | 3,280,900 |
| 20,000 | | | | The Pepsi Bottling Group, Inc. | | | 361,800 |
| | | | | | |
|
|
| | | | | Total | | | 10,446,700 |
| | | | | | |
|
|
| | | | | Biotechnology–6.6% | | | |
| 80,000 | | (1) | | Celgene Corporation | | | 4,168,000 |
| 40,000 | | (1) | | Genentech, Inc. | | | 3,064,000 |
| 90,000 | | (1) | | Genzyme Corporation | | | 5,761,800 |
| 80,000 | | (1) | | Gilead Sciences, Inc. | | | 3,583,200 |
| | | | | | |
|
|
| | | | | Total | | | 16,577,000 |
| | | | | | |
|
|
| | | | | Commercial Services–1.2% | | | |
| 20,000 | | (2) | | MasterCard Incorporated | | | 2,906,000 |
| | | | | Cosmetics/Personal Care–3.3% | | | |
| 130,000 | | | | The Procter & Gamble Company | | | 8,365,500 |
| | | | | Healthcare Products–4.5% | | | |
| 160,000 | | | | Johnson & Johnson | | | 9,372,800 |
| 60,000 | | | | Medtronic, Inc. | | | 1,831,200 |
| | | | | | |
|
|
| | | | | Total | | | 11,204,000 |
| | | | | | |
|
|
| | | | | Healthcare Services–2.4% | | | |
| 160,000 | | | | UnitedHealth Group Incorporated | | | 3,361,600 |
| 70,000 | | (1) | | WellPoint, Inc. | | | 2,492,000 |
| | | | | | |
|
|
| | | | | Total | | | 5,853,600 |
| | | | | | |
|
|
| | | | | | | |
| Shares | | | | | | Value |
| Common Stocks (continued) | | | |
| | | | | Pharmaceuticals–3.8% | | | |
| 140,000 | | | | Abbott Laboratories | | $ | 7,334,600 |
| 60,000 | | | | Wyeth | | | 2,160,600 |
| | | | | | |
|
|
| | | | | Total | | | 9,495,200 |
| | | | | | |
|
|
| | | | | Retail–5.3% | | | |
| 40,000 | | (2) | | CVS Corporation | | | 1,157,200 |
| 30,000 | | (1) | | Kohl’s Corporation | | | 979,800 |
| 80,000 | | | | Lowe’s Companies, Inc. | | | 1,652,800 |
| 120,000 | | (1)(2) | | Starbucks Corporation | | | 1,071,600 |
| 40,000 | | | | Target Corporation | | | 1,350,400 |
| 100,000 | | | | Walgreen Co. | | | 2,474,000 |
| 80,000 | | | | Wal-Mart Stores, Inc. | | | 4,470,400 |
| | | | | | |
|
|
| | | | | Total | | | 13,156,200 |
| | | | | | |
|
|
| | | | | Total Consumer Products | | | 82,798,700 |
| | | | | | |
|
|
| | | |
| | | | | Energy–21.4% | | | |
| | | | | Coal–0.8% | | | |
| 80,000 | | (2) | | Peabody Energy Corporation | | | 1,874,400 |
| | | | | Oil & Gas–18.8% | | | |
| 18,000 | | | | Apache Corporation | | | 1,391,400 |
| 100,000 | | | | Chevron Corporation | | | 7,901,000 |
| 10,000 | | | | Devon Energy Corporation | | | 723,400 |
| 200,000 | | | | Exxon Mobil Corporation | | | 16,030,000 |
| 10,000 | | | | Murphy Oil Corporation | | | 440,500 |
| 90,000 | | (2) | | Noble Corporation | | | 2,411,100 |
| 100,000 | | | | Noble Energy, Inc. | | | 5,228,000 |
| 80,000 | | (1) | | Southwestern Energy Company | | | 2,749,600 |
| 60,000 | | (2) | | Sunoco, Inc. | | | 2,384,400 |
| 200,000 | | | | XTO Energy Inc. | | | 7,648,000 |
| | | | | | |
|
|
| | | | | Total | | | 46,907,400 |
| | | | | | |
|
|
| | | | | Oil & Gas Services–1.8% | | | |
| 40,000 | | | | Schlumberger Limited | | | 2,029,600 |
| 80,000 | | | | Smith International, Inc. | | | 2,339,200 |
| 20,000 | | (1) | | Weatherford International Ltd. | | | 255,400 |
| | | | | | |
|
|
| | | | | Total | | | 4,624,200 |
| | | | | | |
|
|
| | | | | Total Energy | | | 53,406,000 |
| | | | | | |
|
|
| | | |
| | | | | Financials–0.8% | | | |
| | | | | Diversified Financial Services–0.8% | | | |
| 60,000 | | (2) | | American Express Company | | | 1,398,600 |
| 30,000 | | | | NYSE Euronext, Inc. | | | 714,300 |
| | | | | | |
|
|
| | | | | Total | | | 2,112,900 |
| | | | | | |
|
|
| | | | | Total Financials | | | 2,112,900 |
| | | | | | |
|
|
| | | |
| | | | | Industrials–5.9% | | | |
| | | | | Aerospace/Defense–1.2% | | | |
| 60,000 | | | | United Technologies Corporation | | | 2,911,800 |
| | | | | Electrical Components & Equipment–0.7% |
| 50,000 | | | | Emerson Electric Co. | | | 1,794,500 |
| | | | | Machinery–2.3% | | | |
| 100,000 | | | | Caterpillar Inc. | | | 4,099,000 |
| 50,000 | | | | Deere & Company | | | 1,740,500 |
| | | | | | |
|
|
| | | | | Total | | | 5,839,500 |
| | | | | | |
|
|
The Notes to the Financial Statements are an integral part of, and should be read in conjunction with, the Financial Statements.
18
REGIONS MORGAN KEEGAN SELECT GROWTH FUND
PORTFOLIOOF INVESTMENTS
NOVEMBER 30, 2008
| | | | | | | |
Shares | | | | | | Value |
| Common Stocks (continued) | | | |
| | | | | Transportation–1.7% | | | |
| 40,000 | | | | Burlington Northern Santa Fe Corporation | | $ | 3,064,400 |
| 20,000 | | (2) | | United Parcel Service, Inc. | | | 1,152,000 |
| | | | | | |
|
|
| | | | | Total | | | 4,216,400 |
| | | | | | |
|
|
| | | | | Total Industrials | | | 14,762,200 |
| | | | | | |
|
|
| | | |
| | | | | Technology–15.8% | | | |
| | | | | Computers–5.3% | | | |
| 10,000 | | (1) | | Apple Computer, Inc. | | | 926,700 |
| 100,000 | | (1) | | Dell Inc. | | | 1,117,000 |
| 180,000 | | (1) | | EMC Corporation | | | 1,902,600 |
| 100,000 | | | | International Business Machines Corporation | | | 8,160,000 |
| 80,000 | | (1)(2) | | NetApp, Inc. | | | 1,080,000 |
| | | | | | |
|
|
| | | | | Total | | | 13,186,300 |
| | | | | | |
|
|
| | | | | Semiconductors–2.3% | | | |
| 200,000 | | (2) | | Applied Materials, Inc. | | | 1,916,000 |
| 140,000 | | | | Intel Corporation | | | 1,932,000 |
| 120,000 | | | | Texas Instruments Incorporated | | | 1,868,400 |
| | | | | | |
|
|
| | | | | Total | | | 5,716,400 |
| | | | | | |
|
|
| | | | | Software–8.2% | | | |
| 90,000 | | (1)(2) | | Citrix Systems, Inc. | | | 2,399,400 |
| 420,000 | | | | Microsoft Corporation | | | 8,492,400 |
| 600,000 | | (1) | | Oracle Corporation | | | 9,654,000 |
| | | | | | |
|
|
| | | | | Total | | | 20,545,800 |
| | | | | | |
|
|
| | | | | Total Technology | | | 39,448,500 |
| | | | | | |
|
|
| | | | | Total Common Stocks
(identified cost $240,352,772) | | | 223,413,480 |
| | | | | | |
|
|
| Exchange Traded Funds–5.4% | | | |
| 180,000 | | (2) | | Market Vectors Gold Miners ETF | | | 4,795,200 |
| 100,000 | | | | Oil Services HOLDRs | | | 8,666,000 |
| | | | | | |
|
|
| | | | | Total Exchange Traded Funds
(identified cost $14,039,999) | | | 13,461,200 |
| | | | | | |
|
|
| Short-Term Investments–11.2% | | | |
| 14,923,696 | | | | Bank of New York Institutional Cash Reserves Fund (held as collateral for securities lending) | | | 14,879,068 |
| 6,586,042 | | | | Fidelity Institutional Money Market Fund | | | 6,586,042 |
| 6,586,043 | | | | Lehman Brothers Prime Money Market Fund | | | 6,586,043 |
| | | | | | |
|
|
| | | | | Total Short-Term Investments (identified cost $28,095,781) | | | 28,051,153 |
| | | | | | |
|
|
| | | | | | | | | |
Principal
Amount | | | | Value | |
| | Certificates of Deposit–2.6% | | | | |
| $ | 1,993,653 | | | | Bank of Ireland, 1.539%, 2/12/2009 (held as collateral for securities lending) | | $ | 1,993,653 | |
| | 1,975,300 | | | | Calyon New York, 1.463%, 2/13/2009 (held as collateral for securities lending) | | | 1,975,300 | |
| | 2,493,478 | | | | Nordea Bank Finland New York, 2.178%, 2/6/2009 (held as collateral for securities lending) | | | 2,493,478 | |
| | | | | | | |
|
|
|
| | | | | | Total Certificates of Deposit (identified cost $6,462,431) | | | 6,462,431 | |
| | | | | | | |
|
|
|
| | | | | | Total Investments–108.7%
(identified cost $288,950,983) | | | 271,388,264 | |
| | | | | | | |
|
|
|
| | | | | | Other Assets and Liabilities–
net–(8.7)% | | | (21,772,926 | ) |
| | | | | | | |
|
|
|
| | | | | | Total Net Assets–100.0% | | $ | 249,615,338 | |
| | | | | | | |
|
|
|
| | Call Options Written November 30, 2008 | | | | |
| | | | |
| | |
Number of
Contracts
| | Common Stocks/Expiration
Date/Exercise Price
| | |
| 1,000 | | Exxon Mobil Corporation / December 2008 / 85.00 | | (160,000) |
| 1,000 | | Exxon Mobil Corporation / January 2009 / 80.00 | | (593,000) |
| | | |
|
| 2,000 | | Total Call Options Written
(Premiums Received $542,727) | | (753,000) |
| | | |
|
| (1) | | Non-income producing security. |
| (2) | | Certain shares are temporarily on loan to unaffiliated broker- dealers. See Notes 2 and 5 of the financial statements for additional information about securities lending. |
Note: The categories of investments are shown as a percentage of total net assets at November 30, 2008.
The Notes to the Financial Statements are an integral part of, and should be read in conjunction with, the Financial Statements.
19
REGIONS MORGAN KEEGAN SELECT CORE EQUITY FUND
OBJECTIVE & STRATEGY
Regions Morgan Keegan Select Core Equity Fund seeks long-term growth of capital, current income and growth of income. The Fund typically invests in a combination of growth stocks and value stocks. By investing in a blend of stocks that demonstrate strong long-term earnings potential and undervalued stocks, the Fund seeks to achieve strong returns with less volatility.
INVESTMENT RISKS: Equity securities (stocks) can be more volatile and carry more risk than other forms of investments, including investments in high-grade fixed income securities. Growth style stocks are considered to be more susceptible to developments affecting the market/economy and the individual company than common stocks in general. Value-based investments are subject to the risk that the broad market may not recognize their intrinsic value. The net asset value per share of the Fund will fluctuate as the value of the securities in the portfolio changes.
MANAGEMENT DISCUSSIONOF FUND PERFORMANCE
In the past year, we have witnessed events not seen since and reminiscent of the 1930s: the dramatic slowing economic growth; the freeze-up of the financial system; and the decline in the stock market. However, unlike the 1930s, the significant fiscal and monetary responses, although slow in coming, are unprecedented.
The stresses in the financial markets and the economy are evidenced in the negative reaction of stocks such as the decline seen in the Fund’s benchmark, the Standard & Poor’s 500 Index(1), which fell 38.09 percent for the twelve months ended November 30, 2008. Regions Morgan Keegan Select Core Equity Fund’s Class A Shares performed in line with the Fund’s benchmark with a decline of 39.36 percent, based on net asset value (1.26 percent underperformance). The Lipper Large-Cap Core Funds Index(2) fell 38.52 percent during the same period.
All sectors in the benchmark index produced negative returns. For the Fund, the best performing sector was the Financial sector because of selection. Energy was the poorest performing sector for the Fund because of underweight and selection. Much of the outperformance resulted from not owning such stocks as Lehman Brothers, Merrill Lynch, Fannie Mae, Freddie Mac and Washington Mutual. In the Energy sector, holdings of Smith International, National Oilwell Varco and Bank of America negatively affected performance. In the Healthcare sector, holdings of Gilead Sciences, Express Scripts, and Medco Health were additive to performance.
It is with trepidation that we look to 2009. Uncertainty exists concerning the recovery of the domestic economy, and fears abound that the global economy will continue to slow. Increased unemployment and a cautious consumer are strong headwinds for any improvement in economic growth here in the U.S.; and, as the U.S. slows, so does the rest of the world.
As things now stand, serious damage has been done to home prices, bond prices, and stock prices. Cash and U.S. Treasury securities seem to be the safe havens of choice. As of this writing, 90-day Treasury bills yield zero percent. The ten-year Treasury yields slightly more than two percent.
As a result of the dismal outlook and price depreciation, attractive valuations unseen for over fifty years have appeared in the stock market. For example, the dividend yield on the Standard & Poor’s 500 Index is now 3.30 percent. Compared to the Treasury yields cited previously, the yield is quite attractive and we have not seen such a spread since the 1950s.
Although the outlook for earnings is dismal, even at reduced levels, the earnings yield on stocks is significantly higher than aforementioned Treasury yields. Thus, at some point normal relative valuations could return. Money would move out of the safety of Treasury securities, and into other bonds and stocks. Cash on the sidelines has grown significantly. When money comes out of Treasury bills and cash, stocks have the potential to dramatically outperform other asset classes.
(Unaudited)
20
REGIONS MORGAN KEEGAN SELECT CORE EQUITY FUND
In the meantime, building or adding to a portfolio of quality stocks presents an attractive, forward-looking strategy. The Fund provides a portfolio of domestic stocks that should participate in the ultimate stock market recovery.
| | |
 | |  |
Walter A. Hellwig Senior Portfolio Manager Morgan Asset Management, Inc. | | John B. Russell, CFA Assistant Portfolio Manager Morgan Asset Management, Inc. |
Market forecasts provided in this report may not necessarily come to pass. There is no assurance that the Fund will achieve its investment objectives. These views are subject to change at any time based upon market or other conditions, and Morgan Asset Management, Inc. disclaims any responsibility to update such views. The Fund is subject to market risk, which is the possibility that the market values of securities owned by the Fund will decline and, therefore, the value of the Fund’s shares may be less than what you paid for them. Accordingly, you can lose money investing in the Fund.
TOP TEN EQUITY HOLDINGS†
AS OF NOVEMBER 30, 2008
| | | | | | | | | | | | | | |
| TICKER | | DESCRIPTION | | % OF TOTAL NET ASSETS | | TICKER | | DESCRIPTION | | % OF TOTAL NET ASSETS |
GILD | | Gilead Sciences, Inc. | | 4.1% | | PG | | The Procter & Gamble Company | | 2.9% |
XOM | | Exxon Mobil Corp. | | 3.7% | | MON | | Monsanto Company | | 2.7% |
T | | AT&T, Inc. | | 3.3% | | WFC | | Wells Fargo & Company | | 2.6% |
MCD | | McDonald’s Corporation | | 3.0% | | ESRX | | Express Scripts, Inc. | | 2.6% |
JNJ | | Johnson & Johnson | | 3.0% | | MO | | Altria Group, Inc. | | 2.6% |
| † | | The Fund’s composition is subject to change. |
EQUITY SECTOR DIVERSIFICATION†
AS OF NOVEMBER 30, 2008
| | | | | | | | |
%OFTOTALINVESTMENTS | | | | %OFTOTALINVESTMENTS |
Consumer Products | | 23.5% | | | | Energy | | 7.9% |
Healthcare | | 18.4% | | | | Communications | | 5.8% |
Financials | | 13.0% | | | | Basic Materials | | 2.7% |
Technology | | 10.3% | | | | Utilities | | 1.0% |
Industrials | | 8.8% | | | | Short Term Investments | | 8.6% |
| | | | | | | | |
|
| | | | | | | Total | | 100.0% |
| † | | The Fund’s composition is subject to change. |
INDEX DESCRIPTIONS
(1) | | The Standard & Poor’s 500 Index is an unmanaged capitalization-weighted index of 500 stocks designed to measure performance of the broad domestic economy through changes in the aggregated market value of 500 stocks representing all major industries. The index is unmanaged and, unlike the Fund, is not affected by cash flows or trading and other expenses. It is not possible to invest directly in an index. |
(2) | | The Lipper Large-Cap Core Funds Index consists of managed mutual funds that, by portfolio practice, invest at least 75% of their equity assets in companies with market capitalizations (on a three-year weighted basis) greater than 300% of the dollar-weighted median market capitalization of the middle 1,000 securities of the Standard & Poor’s SuperComposite 1500 Index. Large-cap core funds have more latitude in the companies in which they invest. These funds typically have an average price-to-earnings ratio, price-to-book ratio and three-year sales-per-share growth value compared to the Standard & Poor’s 500 Index. The index is unmanaged and, unlike the Fund, is not affected by cash flows or trading and other expenses. It is not possible to invest directly in an index. |
(Unaudited)
21
REGIONS MORGAN KEEGAN SELECT CORE EQUITY FUND
GROWTHOFA $10,000 INVESTMENT
CLASS A SHARES
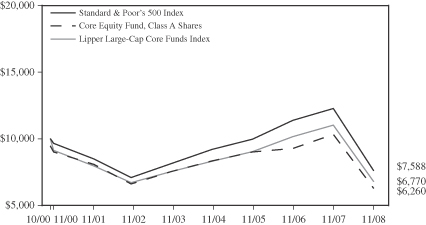
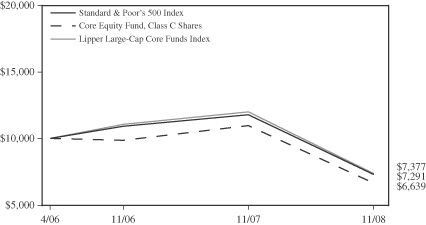
The graph below illustrates a hypothetical investment of $10,000 in Regions Morgan Keegan Select Core Equity Fund—Class A Shares from the commencement of investment operations on October 26, 2000 to November 30, 2008 compared to the Standard & Poor’s 500 Index(1), a broad-based market index, and the Lipper Large-Cap Core Funds Index(2).
GROWTHOFA $10,000 INVESTMENT
CLASS C SHARES
The graph below illustrates a hypothetical investment of $10,000 in Regions Morgan Keegan Select Core Equity Fund—Class C Shares from the commencement of investment operations on April 3, 2006 to November 30, 2008 compared to the Standard & Poor’s 500 Index(1), a broad-based market index, and the Lipper Large-Cap Core Funds Index(2).
(Unaudited)
22
REGIONS MORGAN KEEGAN SELECT CORE EQUITY FUND
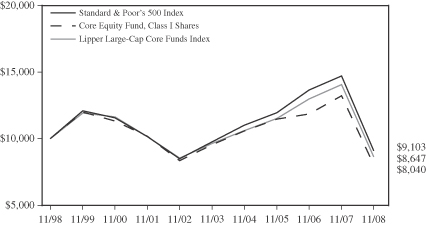
GROWTHOFA $10,000 INVESTMENT
CLASS I SHARES
The graph below illustrates a hypothetical investment of $10,000 in Regions Morgan Keegan Select Core Equity Fund—Class I Shares from November 30, 1998 to November 30, 2008 compared to the Standard & Poor’s 500 Index(1), a broad-based market index, and the Lipper Large-Cap Core Funds Index(2).
PERFORMANCE INFORMATION
| | | | | | | | | | | | | | | |
| | | AVERAGE ANNUAL TOTAL RETURNS | |
| AS OF NOVEMBER 30, 2008 | | SIX
MONTHS* | | | 1 YEAR | | | 5 YEAR | | | 10
YEAR | | | COMMENCEMENT
OF INVESTMENT
OPERATIONS(3) | |
| CLASS A SHARES**(3) | | -42.23 | % | | -42.69 | % | | -4.73 | % | | N/A | | | -5.62 | % |
(EXCLUDINGSALESLOAD) | | -38.86 | % | | -39.36 | % | | -3.64 | % | | N/A | | | -4.96 | % |
| CLASS C SHARES*** | | -39.49 | % | | -40.06 | % | | N/A | | | N/A | | | -14.24 | % |
(EXCLUDINGSALESLOAD) | | -38.88 | % | | -39.46 | % | | N/A | | | N/A | | | -14.24 | % |
| CLASS I SHARES(3) | | -38.79 | % | | -39.22 | % | | -3.39 | % | | -2.16 | % | | 4.86 | % |
| STANDARD & POOR’S 500 INDEX(1) | | -35.20 | % | | -38.09 | % | | -1.39 | % | | -0.93 | % | | — | |
| LIPPER LARGE-CAP CORE FUNDS INDEX(2) | | -36.05 | % | | -38.52 | % | | -2.15 | % | | -1.45 | % | | — | |
| * | | Not annualized for periods less than one year. |
| ** | | Reflects the maximum sales load of 5.50%. |
| *** | | Reflects the maximum contingent deferred sales charge (CDSC) of 1.00% for shares redeemed within one year of purchase. |
(1) | | The Standard & Poor’s 500 Index is an unmanaged capitalization-weighted index of 500 stocks designed to measure performance of the broad domestic economy through changes in the aggregated market value of 500 stocks representing all major industries. Total returns for the index shown are not adjusted to reflect sales charges, expenses or other fees that the Securities and Exchange Commission requires to be reflected in the Fund’s performance. The index is unmanaged and, unlike the Fund, is not affected by cash flows or trading and other expenses. It is not possible to invest directly in an index. |
(2) | | The Lipper Large-Cap Core Funds Index consists of managed mutual funds that, by portfolio practice, invest at least 75% of their equity assets in companies with market capitalizations (on a three-year weighted basis) greater than 300% of the dollar-weighted median market capitalization of the middle 1,000 securities of the Standard & Poor’s SuperComposite 1500 Index. Large-cap core funds have more latitude in the companies in which they invest. These funds typically have an average price-to-earnings ratio, price-to-book ratio and three-year sales-per-share growth value compared to the Standard & Poor’s 500 Index. It is not possible to invest directly in an index. |
(3) | | The Fund began operations on February 18, 2005 as the successor to a substantially similar fund. On that date, the Fund merged with LEADER Growth & Income Fund, a series of LEADER Mutual Funds, and assumed that portfolio’s operating history and performance record. The Fund’s performance prior to February 18, 2005 is that of the Fund’s predecessor, the inception date of which was October 26, 2000 (Class A Shares) and September 1, 1994 (Class I Shares) and reflects fees and expenses paid by the predecessor fund’s Class A Shares and Class I Shares. Effective April 1, 2006, Regions Morgan Keegan Select LEADER Growth & Income Fund changed its name to Regions Morgan Keegan Select Core Equity Fund. The Fund’s Class C Shares commenced investment operations on April 3, 2006. |
Performance data quoted represents past performance, which is no guarantee of future results. Investment return and principal value will fluctuate so that an investor’s shares, when redeemed, may be worth more or less than their original cost. Fund performance changes over time and current performance may be lower or higher than what is stated. For the most recent performance, call toll-free 877-757-7424. The Fund’s performance results are shown on a total return basis and include the reinvestment of all dividends and capital gain distributions in the Fund. Returns shown in the chart and table above do not reflect the deduction of taxes that a shareholder would pay on Fund distributions or the redemption of Fund shares. Mutual funds are not bank deposits or obligations, are not guaranteed by any bank and are not insured or guaranteed by the U.S. government, the Federal Deposit Insurance Corporation, the Federal Reserve Board or any other government agency. Investment in mutual funds involves investment risk, including possible loss of principal.
(Unaudited)
23
REGIONS MORGAN KEEGAN SELECT CORE EQUITY FUND
PORTFOLIOOF INVESTMENTS
NOVEMBER 30, 2008
| | | | | | | |
| Shares | | | | | | Value |
| Common Stocks–92.0% | | | |
| | | |
| | | | | Basic Materials–2.7% | | | |
| | | | | Chemicals–2.7% | | | |
| 3,000 | | | | Monsanto Company | | $ | 237,600 |
| | | | | | |
|
|
| | | | | Total Basic Materials | | | 237,600 |
| | | | | | |
|
|
| | | |
| | | | | Communications–5.9% | | | |
| | | | | Internet–0.7% | | | |
| 200 | | (1) | | Google Inc. | | | 58,592 |
| | | | | | |
|
|
| | | | | Telecommunications–5.2% | | | |
| 10,000 | | | | AT&T Inc. | | | 285,600 |
| 5,000 | | | | QUALCOMM Inc. | | | 167,850 |
| | | | | | |
|
|
| | | | | Total | | | 453,450 |
| | | | | | |
|
|
| | | | | Total Communications | | | 512,042 |
| | | | | | |
|
|
| | | |
| | | | | Consumer Products–23.7% | | | |
| | | | | Agriculture–5.0% | | | |
| 14,000 | | | | Altria Group, Inc. | | | 225,120 |
| 5,000 | | | | Philip Morris International Inc. | | | 210,800 |
| | | | | | |
|
|
| | | | | Total | | | 435,920 |
| | | | | | |
|
|
| | | | | Apparel–0.8% | | | |
| 1,250 | | | | Nike Inc. | | | 66,563 |
| | | | | Cosmetics/Personal Care–5.2% | | | |
| 3,000 | | | | Colgate-Palmolive Company | | | 195,210 |
| 4,000 | | | | The Procter & Gamble Company | | | 257,400 |
| | | | | | |
|
|
| | | | | Total | | | 452,610 |
| | | | | | |
|
|
| | | | | Food–4.6% | | | |
| 2,000 | | | | General Mills, Inc. | | | 126,340 |
| 5,000 | | | | HJ Heinz Company | | | 194,200 |
| 2,000 | | | | Kellogg Company | | | 86,860 |
| | | | | | |
|
|
| | | | | Total | | | 407,400 |
| | | | | | |
|
|
| | | | | Retail–7.2% | | | |
| 1,000 | | | | Costco Wholesale Corporation | | | 51,470 |
| 5,000 | | | | CVS Caremark Corporation | | | 144,650 |
| 4,500 | | | | McDonald’s Corporation | | | 264,375 |
| 3,000 | | | | Wal-Mart Stores, Inc. | | | 167,640 |
| | | | | | |
|
|
| | | | | Total | | | 628,135 |
| | | | | | |
|
|
| | | | | Toys and Games–0.9% | | | |
| 3,000 | | | | Hasbro Inc. | | | 80,400 |
| | | | | | |
|
|
| | | | | Total Consumer Products | | | 2,071,028 |
| | | | | | |
|
|
| | | |
| | | | | Energy–7.9% | | | |
| | | | | Oil & Gas–6.7% | | | |
| 2,000 | | | | Chevron Corporation | | | 158,020 |
| 4,000 | | | | Exxon Mobil Corporation | | | 320,600 |
| 500 | | (1) | | Transocean, Inc. | | | 33,440 |
| 1,250 | | (1) | | Southwestern Energy Company | | | 42,962 |
| 1,000 | | | | XTO Energy, Inc. | | | 38,240 |
| | | | | | |
|
|
| | | | | Total | | | 593,262 |
| | | | | | |
|
|
| | | | | | | |
| Shares | | | | | | Value |
| Common Stocks (continued) | | | |
| | | | | Oil & Gas Services–1.2% | | | |
| 1,500 | | (1) | | National Oilwell Varco, Inc. | | $ | 42,435 |
| 2,000 | | | | Smith International Inc. | | | 58,480 |
| | | | | | |
|
|
| | | | | Total | | | 100,915 |
| | | | | | |
|
|
| | | | | Total Energy | | | 694,177 |
| | | | | | |
|
|
| | | |
| | | | | Financials–13.0% | | | |
| | | | | Banks–10.5% | | | |
| 6,000 | | | | Bank of America Corporation | | | 97,500 |
| 5,000 | | | | BB&T Corporation | | | 149,850 |
| 6,000 | | | | JPMorgan Chase & Co. | | | 189,960 |
| 3,000 | | | | The PNC Financial Services Group, Inc. | | | 158,310 |
| 3,500 | | | | U.S. Bancorp | | | 94,430 |
| 8,000 | | | | Wells Fargo & Company | | | 231,120 |
| | | | | | |
|
|
| | | | | Total | | | 921,170 |
| | | | | | |
|
|
| | | | | Diversified Financial Services–0.4% | | | |
| 500 | | (1) | | IntercontinentalExchange, Inc. | | | 36,800 |
| | | | | Insurance–0.8% | | | |
| 1,500 | | | | The Travelers Companies, Inc. | | | 65,475 |
| | | | | Savings & Loan–1.3% | | | |
| 7,000 | | | | Hudson City Bancorp, Inc. | | | 116,900 |
| | | | | | |
|
|
| | | | | Total Financials | | | 1,140,345 |
| | | | | | |
|
|
| | | |
| | | | | Healthcare–18.5% | | | |
| | | | | Biotechnology–5.3% | | | |
| 2,000 | | (1) | | Celgene Corporation | | | 104,200 |
| 8,000 | | (1) | | Gilead Sciences, Inc. | | | 358,320 |
| | | | | | |
|
|
| | | | | Total | | | 462,520 |
| | | | | | |
|
|
| | | | | Healthcare Products–6.0% | | | |
| 2,000 | | | | Baxter International Inc. | | | 105,800 |
| 4,500 | | | | Johnson & Johnson | | | 263,610 |
| 700 | | (1) | | Intuitive Surgical, Inc. | | | 92,771 |
| 1,500 | | (1) | | Varian Medical Systems, Inc. | | | 60,540 |
| | | | | | |
|
|
| | | | | Total | | | 522,721 |
| | | | | | |
|
|
| | | | | Pharmaceuticals–7.2% | | | |
| 3,750 | | | | Abbott Laboratories | | | 196,463 |
| 4,000 | | (1) | | Express Scripts, Inc. | | | 230,040 |
| 5,000 | | (1) | | Medco Health Solutions, Inc. | | | 210,000 |
| | | | | | |
|
|
| | | | | Total | | | 636,503 |
| | | | | | |
|
|
| | | | | Total Healthcare | | | 1,621,744 |
| | | | | | |
|
|
| | | |
| | | | | Industrials–8.9% | | | |
| | | | | Aerospace/Defense–5.7% | | | |
| 3,000 | | | | General Dynamics Corporation | | | 155,010 |
| 4,000 | | | | Raytheon Company | | | 195,200 |
| 3,000 | | | | United Technologies Corporation | | | 145,590 |
| | | | | | |
|
|
| | | | | Total | | | 495,800 |
| | | | | | |
|
|
| | | | | Electronics–0.4% | | | |
| 1,000 | | (1) | | Thermo Fisher Scientific, Inc. | | | 35,680 |
| | | | | | |
|
|
The Notes to the Financial Statements are an integral part of, and should be read in conjunction with, the Financial Statements.
24
REGIONS MORGAN KEEGAN SELECT CORE EQUITY FUND
PORTFOLIOOF INVESTMENTS
NOVEMBER 30, 2008
| | | | | | | | |
| Shares | | | | | | Value | |
| Common Stocks (continued) | | | | |
| | | | | Hand/Machine Tools–1.0% | | | | |
| 2,500 | | | | Snap-on Incorporated | | $ | 90,125 | |
| | | | | Transportation–1.8% | | | | |
| 2,000 | | | | Burlington Northern Santa Fe Corporation | | | 153,220 | |
| | | | | | |
|
|
|
| | | | | Total Industrials | | | 774,825 | |
| | | | | | |
|
|
|
| | | |
| | | | | Technology–10.4% | | | | |
| | | | | Computers–5.5% | | | | |
| 1,500 | | (1) | | Apple, Inc. | | | 139,005 | |
| 5,000 | | | | Hewlett-Packard Company | | | 176,400 | |
| 2,000 | | | | International Business Machines Corporation | | | 163,200 | |
| | | | | | |
|
|
|
| | | | | Total | | | 478,605 | |
| | | | | | |
|
|
|
| | | | | Semiconductors–1.3% | | | | |
| 8,000 | | | | Altera Corp. | | | 117,680 | |
| | | | | Software–3.6% | | | | |
| 7,500 | | | | Microsoft Corporation | | | 151,650 | |
| 10,000 | | (1) | | Oracle Corporation | | | 160,900 | |
| | | | | | |
|
|
|
| | | | | Total | | | 312,550 | |
| | | | | | |
|
|
|
| | | | | Total Technology | | | 908,835 | |
| | | | | | |
|
|
|
| | | |
| | | | | Utilities–1.0% | | | | |
| | | | | Electric–1.0% | | | | |
| 1,500 | | | | Firstenergy Corp. | | | 87,870 | |
| | | | | | |
|
|
|
| | | | | Total Utilities | | | 87,870 | |
| | | | | | |
|
|
|
| | | | | Total Common Stocks
(identified cost $9,307,412) | | | 8,048,466 | |
| | | | | | |
|
|
|
| Short-Term Investments–8.6% | | | | |
| 376,748 | | | | Fidelity Institutional Money Market Fund | | | 376,748 | |
| 376,748 | | | | Lehman Brothers Prime Money Market Fund | | | 376,748 | |
| | | | | | |
|
|
|
| | | | | Total Mutual Funds
(identified cost $753,496) | | | 753,496 | |
| | | | | | |
|
|
|
| | | | | Total Investments–100.6%
(identified cost $10,060,908) | | | 8,801,962 | |
| | | | | | |
|
|
|
| | | | | Other Assets and Liabilities–
net–(0.6)% | | | (50,945 | ) |
| | | | | | |
|
|
|
| | | | | Total Net Assets–100.0% | | $ | 8,751,017 | |
| | | | | | |
|
|
|
| (1) | | Non-income producing security. |
Note: The categories of investments are shown as a percentage of total net assets at November 30, 2008.
The Notes to the Financial Statements are an integral part of, and should be read in conjunction with, the Financial Statements.
25
REGIONS MORGAN KEEGAN SELECT MID CAP VALUE FUND
OBJECTIVE & STRATEGY
Regions Morgan Keegan Select Mid Cap Value Fund seeks long-term capital appreciation. The Fund invests its assets primarily in equity securities of companies with mid-capitalizations (i.e., companies whose market capitalization falls within the range tracked by the Russell Mid Cap Value Index at the time of purchase) that are judged by the Fund’s adviser to be undervalued.
INVESTMENT RISKS: Equity securities (stocks) can be more volatile and carry more risk than other forms of investments, including investments in high-grade fixed income securities. Mid-capitalization stocks typically carry additional risk, since smaller companies generally have higher risk of failure and, historically, their stocks have experienced a greater degree of volatility. Value-based investments are subject to the risk that the broad market may not recognize their intrinsic value. The net asset value per share of the Fund will fluctuate as the value of the securities in the portfolio changes.
MANAGEMENT DISCUSSIONOF FUND PERFORMANCE
For the fiscal year ended November 30, 2008, Regions Morgan Keegan Select Mid Cap Value Fund’s Class A Shares had a total return of –37.35%, based on net asset value. This compares to the Russell Midcap Value Index(1) total return of –41.95% during the same period. Fund performance was impacted by underperforming stocks within the Energy, Consumer Discretionary, and Healthcare sectors, as well as high volatility and severely negative returns across the board in the U.S. and global stock markets. The financial meltdown which intensified in the second half of 2008 has created unprecedented failures and mergers of major U.S. financial institutions and a level of U.S. government, regulatory, and Federal Reserve involvement not seen since the 1930’s. A protracted recovery and continued market volatility are more likely than not for the foreseeable future as the world economy recalibrates to slower consumer and industrial activity, changes in credit availability, and the ongoing U.S. housing malaise.
From a sector perspective, the Fund’s holdings in the Materials, Industrials, and Information Technology sectors were some of the key positive contributors to overall performance relative to the benchmark. With respect to specific stocks, the Fund benefited from strong contributions by Compass Minerals International, Inc., Flowserve Corp., Peoples United Financial, and Pactiv Corporation. Fund holdings that most adversely impacted performance were found primarily in the Energy and Consumer Discretionary sectors. With respect to specific stocks, Fund performance was adversely impacted by Affiliated Managers Group, Exterran Holdings Inc., Hanesbrands Inc., and Corinthian Colleges, Inc.
With respect to the outlook for 2009, we believe that the challenges of the ongoing global financial crisis will likely impact the markets for some time. On a positive note, stock market valuations have generally become much more attractive than they have been for a long time. However, the restoration of integrity and confidence in the capital markets is an essential ingredient for improved market returns. The massive and unprecedented coordinated activities of Federal Reserve and the U.S. Treasury in October and November of 2008 appear to be having some positive impact on credit markets; however, credit spreads remained wide and unstable at year end 2008. On one hand, the credit market for residential mortgages has shown some signs of stabilizing, but many investors have shifted their focus to the consumer credit and commercial mortgage sectors of the market. The recession started in December 2007, and is expected to continue well into 2009. As a result, we feel that it may take an extended period of time, likely measured in months or quarters, before full confidence and strong economic growth reappear. There will likely continue to be market volatility as many investors continue to reassess the credit crisis and the depressed economy.
Nevertheless, we concur with Warren Buffett’s widely publicized quote from October 2008—“if you wait for the robins, the spring will be over.” In our view, U.S. stocks, including mid-cap stocks, are generally trading at attractive levels for long-term investment, though the timing of the recovery is unpredictable. Based on a traditional rule of thumb, market–recovery medicine (in the form of interest rate cuts and fiscal stimulus) takes 9-12 months to begin to take hold with the stock market serving as a leading indicator of the recovery. This suggests an economic recovery by late 2009 and a stock market recovery in advance of that. Perhaps the timetable for a classic recovery may be challenged by the severity and nature of market concerns, but we believe that this historical perspective will ultimately serve investors well.
(Unaudited)
26
REGIONS MORGAN KEEGAN SELECT MID CAP VALUE FUND
Despite the painful losses that so many investors have experienced this year, we believe that a focus on high quality business franchises and valuations will provide attractive opportunities amongst the rubble for long-term investors. In general, the Fund’s portfolio companies possess strong business and attractive cash flow characteristics, and in our opinion, are likely to weather the impact of a recessionary economy and volatile markets well. Also, we are looking at more potential new investment opportunities with similar characteristics being presented these days than in many years. As such, we are cautiously optimistic about the potential for better markets and returns in 2009 and beyond.
|
 |
Eric T. McKissack, CFA Chief Investment Officer Channing Capital Management, LLC |
Market forecasts provided in this report may not necessarily come to pass. There is no assurance that the Fund will achieve its investment objectives. These views are subject to change at any time based upon market or other conditions, and Channing Capital Management, LLC. disclaims any responsibility to update such views. The Fund is subject to market risk, which is the possibility that the market values of securities owned by the Fund will decline and, therefore, the value of the Fund’s shares may be less than what you paid for them. Accordingly, you can lose money investing in the Fund.
TOP TEN EQUITY HOLDINGS†
AS OF NOVEMBER 30, 2008
| | | | | | | | | | | | | | |
| TICKER | | DESCRIPTION | | % OF TOTAL NET ASSETS | | TICKER | | DESCRIPTION | | % OF TOTAL NET ASSETS |
PBCT | | People’s United Financial, Inc. | | 4.4% | | MKL | | Markel Corp | | 3.7% |
WEC | | Wisconsin Energy Corp. | | 4.1% | | HNZ | | H. J. Heinz Co. | | 3.6% |
RSG | | Republic Services, Inc. | | 4.1% | | PTV | | Pactiv Corp. | | 3.5% |
AOC | | Aon Corp. | | 3.8% | | LAZ | | Lazard Ltd. | | 3.5% |
ACN | | Accenture Ltd. | | 3.7% | | FISV | | Fiserv, Inc. | | 3.5% |
| † | | The Fund’s composition is subject to change. |
EQUITY SECTOR DIVERSIFICATION†
AS OF NOVEMBER 30, 2008
| | | | | | |
%OFTOTALINVESTMENTS
EXCLUDING COLLATERAL FOR SECURITIES LENDING | | %OFTOTALINVESTMENTS
EXCLUDINGCOLLATERALFORSECURITIESLENDING |
Consumer Products | | 30.9% | | Basic Materials | | 5.7% |
Financials | | 20.7% | | Communications | | 5.2% |
Industrials | | 15.2% | | Energy | | 2.3% |
Technology | | 9.4% | | Short Term Investments | | 2.2% |
| | | | | | |
|
Utilities | | 8.4% | | Total | | 100.0% |
| † | | The Fund’s composition is subject to change. |
INDEX DESCRIPTION
(1) | | The Russell Midcap Value Index tracks equity securities of medium-sized companies whose market capitalization falls within the $17 million to $13.6 billion range. The index is unmanaged and, unlike the Fund, is not affected by cash flows or trading and other expenses. It is not possible to invest directly in an index. |
(Unaudited)
27
REGIONS MORGAN KEEGAN SELECT MID CAP VALUE FUND
GROWTHOFA $10,000 INVESTMENT
CLASS A SHARES
The graph below illustrates a hypothetical investment of $10,000 in Regions Morgan Keegan Select Mid Cap Value Fund—Class A Shares(1) from the commencement of investment operations on December 9, 2002 to November 30, 2008 compared to the Russell Midcap Value Index(2).
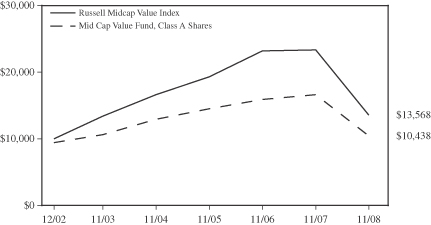
GROWTHOFA $10,000 INVESTMENT
CLASS C SHARES
The graph below illustrates a hypothetical investment of $10,000 in Regions Morgan Keegan Select Mid Cap Value Fund—Class C Shares from the commencement of investment operations on December 9, 2002 to November 30, 2008 compared to the Russell Midcap Value Index (2).

(Unaudited)
28
REGIONS MORGAN KEEGAN SELECT MID CAP VALUE FUND
GROWTHOFA $10,000 INVESTMENT
CLASS I SHARES
The graph below illustrates a hypothetical investment of $10,000 in Regions Morgan Keegan Select Mid Cap Value Fund—Class I Shares from the commencement of investment operations on May 10, 2005 to November 30, 2008 compared to the Russell Midcap Value Index(2).
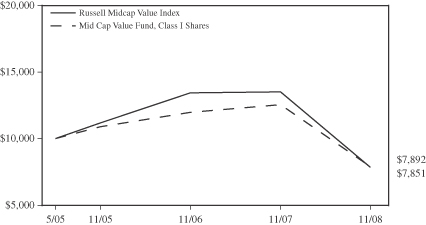
PERFORMANCE INFORMATION
| | | | | | | | | | | | |
| | | AVERAGE ANNUAL TOTAL RETURNS | |
| AS OF NOVEMBER 30, 2008 | | SIX
MONTHS* | | | 1 YEAR | | | 5
YEAR | | | COMMENCEMENT
OF INVESTMENT
OPERATIONS(3) | |
| CLASS A SHARES**(1) | | -39.22 | % | | -40.80 | % | | -1.52 | % | | 0.72 | % |
(EXCLUDINGSALESLOAD)(1) | | -35.69 | % | | -37.35 | % | | -0.40 | % | | 1.68 | % |
| CLASS C SHARES*** | | -36.56 | % | | -38.63 | % | | -1.09 | % | | 1.06 | % |
(EXCLUDINGCDSC) | | -35.92 | % | | -38.01 | % | | -1.09 | % | | 1.06 | % |
| CLASS I SHARES | | -35.62 | % | | -37.15 | % | | N/A | | | -6.42 | % |
| RUSSELL MID CAP VALUE INDEX(2) | | -41.52 | % | | -41.95 | % | | 0.22 | % | | — | |
| * | | Not annualized for periods less than one year. |
| ** | | Reflects the maximum sales load of 5.50%. |
| *** | | Reflects the maximum contingent deferred sales charge (CDSC) of 1.00% for shares redeemed within one year of purchase. |
(1) | | Effective June 4, 2004, all Class B Shares of the Fund converted to Class A Shares. |
(2) | | The Russell Midcap Value Index tracks equity securities of medium-sized companies whose market capitalization falls within the $17 million to $13.6 billion range. Total returns for the index shown are not adjusted to reflect sales charges, expenses or other fees that the Securities and Exchange Commission requires to be reflected in the Fund’s performance. The index is unmanaged and, unlike the Fund, is not affected by cash flows or trading and other expenses. It is not possible to invest directly in an index. |
(3) | | The Fund’s Class A Shares and Class C Shares commenced investment operations on December 9, 2002 and the Fund’s Class I Shares commenced investment operations on May 10, 2005. |
Performance data quoted represents past performance, which is no guarantee of future results. Investment return and principal value will fluctuate so that an investor’s shares, when redeemed, may be worth more or less than their original cost. Fund performance changes over time and current performance may be lower or higher than what is stated. For the most recent performance, call toll-free 877-757-7424. The Fund’s performance results are shown on a total return basis and include the reinvestment of all dividends and capital gain distributions in the Fund. Returns shown in the chart and table above do not reflect the deduction of taxes that a shareholder would pay on Fund distributions or the redemption of Fund shares. Mutual funds are not bank deposits or obligations, are not guaranteed by any bank and are not insured or guaranteed by the U.S. government, the Federal Deposit Insurance Corporation, the Federal Reserve Board or any other government agency. Investment in mutual funds involves investment risk, including possible loss of principal.
(Unaudited)
29
REGIONS MORGAN KEEGAN SELECT MID CAP VALUE FUND
PORTFOLIOOF INVESTMENTS
NOVEMBER 30, 2008
| | | | | | | |
| Shares | | | | | | Value |
| Common Stocks–97.8% | | | |
| | | |
| | | | | Basic Materials–5.7% | | | |
| | | | | Chemicals–3.1% | | | |
| 29,057 | | | | Airgas, Inc. | | $ | 1,038,788 |
| | | | | Mining–2.6% | | | |
| 15,986 | | | | Compass Minerals International, Inc. | | | 895,056 |
| | | | | | |
|
|
| | | | | Total Basic Materials | | | 1,933,844 |
| | | | | | |
|
|
| | | |
| | | | | Communications–5.2% | | | |
| | | | | Advertising–1.8% | | | |
| 20,761 | | | | Omnicom Group Inc. | | | 587,329 |
| | | | | Telecommunications–3.4% | | | |
| 21,518 | | (1)(2) | | Anixter International Inc. | | | 589,593 |
| 64,974 | | | | Frontier Communications Corporation | | | 566,573 |
| | | | | | |
|
|
| | | | | Total | | | 1,156,166 |
| | | | | | |
|
|
| | | | | Total Communications | | | 1,743,495 |
| | | | | | |
|
|
| | | |
| | | | | Consumer Products–30.9% | | | |
| | | | | Apparel–3.0% | | | |
| 79,167 | | (1) | | Hanesbrands Inc. | | | 1,022,838 |
| | | | | Beverages–2.2% | | | |
| 59,391 | | (1) | | Constellation Brands, Inc. | | | 757,829 |
| | | | | Commercial Services–9.6% | | | |
| 28,046 | | (1) | | Brink’s Home Security Inc. | | | 560,920 |
| 33,151 | | | | Equifax Inc. | | | 843,693 |
| 39,674 | | (1) | | Hewitt Associates, Inc. | | | 1,133,883 |
| 21,692 | | | | Manpower Inc. | | | 682,864 |
| | | | | | |
|
|
| | | | | Total | | | 3,221,360 |
| | | | | | |
|
|
| | | | | Distribution/Wholesale–3.2% | | | |
| 15,403 | | | | W.W. Grainger, Inc. | | | 1,086,990 |
| | | | | Food–3.6% | | | |
| 31,074 | | | | H. J. Heinz Company | | | 1,206,914 |
| | | | | Health Care Products–1.7% | | | |
| 22,379 | | | | DENTSPLY International Inc. | | | 583,644 |
| | | | | Health Care Services–2.7% | | | |
| 14,471 | | (1) | | Laboratory Corporation of America Holdings | | | 916,883 |
| | | | | Housewares–1.0% | | | |
| 23,929 | | | | Newell Rubbermaid Inc. | | | 319,691 |
| | | | | Pharmaceuticals–3.0% | | | |
| 32,273 | | | | AmerisourceBergen Corporation | | | 1,011,758 |
| | | | | Retail–0.9% | | | |
| 25,127 | | | | Nordstrom, Inc. | | | 285,694 |
| | | | | | |
|
|
| | | | | Total Consumer Products | | | 10,413,601 |
| | | | | | |
|
|
| | | |
| | | | | Energy–2.3% | | | |
| | | | | Oil & Gas Services–2.3% | | | |
| 44,984 | | (1) | | Superior Energy Services, Inc. | | | 757,980 |
| | | | | | |
|
|
| | | | | Total Energy | | | 757,980 |
| | | | | | |
|
|
| | | | | | | |
| Shares | | | | | | Value |
| Common Stocks (continued) | | | |
| | | |
| | | | | Financials–20.7% | | | |
| | | | | Banks–2.1% | | | |
| 11,056 | | | | M&T Bank Corporation | | $ | 710,348 |
| | | | | Diversified Financial Services–6.7% | | | |
| 13,128 | | (1)(2) | | Affiliated Managers Group, Inc. | | | 367,584 |
| 37,907 | | | | Lazard Ltd | | | 1,184,973 |
| 20,408 | | | | T. Rowe Price Group, Inc. | | | 698,158 |
| | | | | | |
|
|
| | | | | Total | | | 2,250,715 |
| | | | | | |
|
|
| | | | | Insurance–7.5% | | | |
| 28,533 | | | | Aon Corporation | | | 1,292,545 |
| 4,001 | | (1) | | Markel Corporation | | | 1,232,308 |
| | | | | | |
|
|
| | | | | Total | | | 2,524,853 |
| | | | | | |
|
|
| | | | | Savings & Loans–4.4% | | | |
| 77,711 | | | | People’s United Financial, Inc. | | | 1,481,949 |
| | | | | | |
|
|
| | | | | Total Financials | | | 6,967,865 |
| | | | | | |
|
|
| | | |
| | | | | Industrials–15.2% | | | |
| | | | | Diversified Machinery–2.2% | | | |
| 31,695 | | | | IDEX Corporation | | | 728,985 |
| | | | | Electronics–1.0% | | | |
| 9,885 | | (1) | | Thermo Fisher Scientific Inc. | | | 352,697 |
| | | | | Environmental Control–4.1% | | | |
| 57,127 | | | | Republic Services, Inc. | | | 1,371,048 |
| | | | | Hand/Machine Tools–2.1% | | | |
| 19,773 | | | | Snap-on Incorporated | | | 712,817 |
| | | | | Miscellaneous Manufacturing–2.3% | | | |
| 35,801 | | | | The Brink’s Company | | | 779,388 |
| | | | | Packaging & Containers–3.5% | | | |
| 47,561 | | (1) | | Pactiv Corporation | | | 1,188,549 |
| | | | | | |
|
|
| | | | | Total Industrials | | | 5,133,484 |
| | | | | | |
|
|
| | | |
| | | | | Technology–9.4% | | | |
| | | | | Computers–3.7% | | | |
| 40,203 | | (2) | | Accenture Ltd. | | | 1,245,489 |
| | | | | Software–5.7% | | | |
| 34,406 | | (1) | | Fiserv, Inc. | | | 1,174,621 |
| 9,422 | | | | The Dun & Bradstreet Corporation | | | 753,760 |
| | | | | | |
|
|
| | | | | Total | | | 1,928,381 |
| | | | | | |
|
|
| | | | | Total Technology | | | 3,173,870 |
| | | | | | |
|
|
| | | |
| | | | | Utilities–8.4% | | | |
| | | | | Electric–8.4% | | | |
| 40,606 | | | | DPL Inc. | | | 845,417 |
| 13,408 | | | | Integrys Energy Group, Inc. | | | 592,365 |
| 32,013 | | | | Wisconsin Energy Corporation | | | 1,391,285 |
| | | | | | |
|
|
| | | | | Total Utilities | | | 2,829,067 |
| | | | | | |
|
|
| | | | | Total Common Stocks
(identified cost $37,314,673) | | $ | 32,953,206 |
| | | | | | |
|
|
The Notes to the Financial Statements are an integral part of, and should be read in conjunction with, the Financial Statements.
30
REGIONS MORGAN KEEGAN SELECT MID CAP VALUE FUND
PORTFOLIOOF INVESTMENTS
NOVEMBER 30, 2008
| | | | | | | | |
| Shares | | | | | | Value | |
| Short-Term Investments–4.2% | | | | |
| 684,701 | | | | Bank of New York Institutional Cash Reserves Fund (held as collateral for securities lending) | | $ | 655,647 | |
| 377,733 | | | | Fidelity Institutional Money Market Fund | | | 377,733 | |
| 377,734 | | | | Lehman Brothers Prime Money Market Fund | | | 377,734 | |
| | | | | | |
|
|
|
| | | | | Total Short-Term Investments (identified cost $1,440,168) | | | 1,411,114 | |
| | | | | | |
|
|
|
| | | | | Total Investments–102.0%
(identified cost $38,754,841) | | | 34,364,320 | |
| | | | | | |
|
|
|
| | | | | Other Assets and Liabilities–
net–(2.0)% | | | (667,153 | ) |
| | | | | | |
|
|
|
| | | | | Total Net Assets–100.0% | | $ | 33,697,167 | |
| | | | | | |
|
|
|
| (1) | | Non-income producing security. |
| (2) | | Certain shares are temporarily on loan to unaffiliated broker- dealers. See Notes 2 and 5 of the Financial Statements for additional information about securities lending. |
Note: The categories of investments are shown as a percentage of total net assets at November 30, 2008.
The Notes to the Financial Statements are an integral part of, and should be read in conjunction with, the Financial Statements.
31
REGIONS MORGAN KEEGAN SELECT VALUE FUND
OBJECTIVE & STRATEGY
Regions Morgan Keegan Select Value Fund seeks income and growth of capital. The Fund invests in common and preferred stocks according to a sector-weighting strategy in which attractive market valuation levels are assigned priority over prospects for future earnings growth.
INVESTMENT RISKS: Equity securities (stocks) can be more volatile and carry more risk than other forms of investments, including investments in high-grade fixed income securities. Value-based investments are subject to the risk that the broad market may not recognize their intrinsic value. The net asset value per share of the Fund will fluctuate as the value of the securities in the portfolio changes.
MANAGEMENT DISCUSSIONOF FUND PERFORMANCE
In the past year, we have witnessed events not seen since and reminiscent of the 1930s: the dramatic slowing economic growth; the freeze-up of the financial system; and the decline in the stock market. However, unlike the 1930s, the significant fiscal and monetary responses, although slow in coming, are unprecedented.
The stresses in the financial markets and the economy are evidenced in the negative reaction of stocks such as the decline seen in the Fund’s benchmark, the Standard & Poor’s 500 Citigroup Value Index(1), which fell 40.75 percent for the twelve months ended November 30, 2008. Regions Morgan Keegan Select Value Fund’s Class A Shares performed in line with the Fund’s benchmark with a decline of 39.17 percent, based on net asset value (1.58 percent outperformance).
All sectors in the benchmark index produced negative returns. For the Fund, the best performing sector was the Financial sector because of an underweight, particularly early in the year. The Utility sector was the poorest performing sector for the Fund because of an underweight position.
Much of the outperformance resulted from not owning such stocks as Lehman Brothers, Merrill Lynch, Fannie Mae, Freddie Mac and Washington Mutual. The holdings of McDonalds, General Mills, and Monsanto were additive to performance. In the Utility sector, holdings of Entergy, Exelon, and First Energy negatively affected performance.
It is with trepidation that we look to 2009. Uncertainty exists concerning the recovery of the domestic economy, and fears abound that the global economy will continue to slow. Increased unemployment and a cautious consumer are strong headwinds for any improvement in economic growth here in the U.S.; and, as the U.S. slows, so does the rest of the world.
As things now stand, serious damage has been done to home prices, bond prices, and stock prices. Cash and U.S. Treasury securities seem to be the safe havens of choice. As of this writing, 90-day Treasury bills yield zero percent. The ten-year Treasury yields slightly more than two percent.
As a result of the dismal outlook and price depreciation, attractive valuations unseen for over fifty years have appeared in the stock market. For example, the dividend yield on the Standard & Poor’s 500 Index is now 3.30 percent. Compared to the Treasury yields cited previously, the yield is quite attractive and we have not seen such a spread since the 1950s.
Although the outlook for earnings is dismal, even at reduced levels, the earnings yield on stocks is significantly higher than aforementioned Treasury yields. Thus, at some point normal relative valuations could return. Money would move out of the safety of Treasury securities, and into other bonds and stocks. Cash on the sidelines has grown significantly. When money comes out of Treasury bills and cash, stocks have the potential to dramatically outperform other asset classes.
(Unaudited)
32
REGIONS MORGAN KEEGAN SELECT VALUE FUND
In the meantime, building or adding to a portfolio of quality stocks presents an attractive, forward-looking strategy. The Fund provides a portfolio of domestic stocks that should participate in the ultimate stock market recovery.
Walter A. Hellwig
Senior Portfolio Manager
Morgan Asset Management, Inc.
Market forecasts provided in this report may not necessarily come to pass. There is no assurance that the Fund will achieve its investment objectives. These views are subject to change at any time based upon market or other conditions, and Morgan Asset Management, Inc. disclaims any responsibility to update such views. The Fund is subject to market risk, which is the possibility that the market values of securities owned by the Fund will decline and, therefore, the value of the Fund’s shares may be less than what you paid for them. Accordingly, you can lose money investing in the Fund.
TOP TEN EQUITY HOLDINGS†
AS OF NOVEMBER 30, 2008
| | | | | | | | | | | | | | |
| TICKER | | DESCRIPTION | | % OF TOTAL NET ASSETS | | TICKER | | DESCRIPTION | | % OF TOTAL NET ASSETS |
T | | AT&T Inc. | | 4.1% | | MCD | | McDonald’s Corporation | | 3.0% |
GIS | | General Mills, Inc. | | 3.7% | | WFC | | Wells Fargo & Company | | 3.0% |
BMY | | Bristol-Myers Squibb Company | | 3.3% | | BNI | | Burlington Northern Santa Fe Corp. | | 3.0% |
USB | | U.S. Bancorp | | 3.2% | | MO | | Altria Group, Inc. | | 2.8% |
JPM | | JPMorgan Chase & Co. | | 3.0% | | PM | | Philip Morris International Inc. | | 2.7% |
| † | | The Fund’s composition is subject to change. |
EQUITY SECTOR DIVERSIFICATION†
AS OF NOVEMBER 30, 2008
| | | | | | |
| % OF TOTAL INVESTMENTS | | % OF TOTAL INVESTMENTS |
Consumer Products | | 35.3% | | Basic Materials | | 3.5% |
Financials | | 17.7% | | Technology | | 3.4% |
Industrials | | 13.0% | | Utilities | | 3.1% |
Communications | | 8.3% | | Short Term Investments | | 9.6% |
| | | | |
|
Energy | | 6.1% | | Total | | 100.0% |
| † | | The Fund’s composition is subject to change. |
INDEX DESCRIPTION
(1) | | The Standard & Poor’s 500 Citigroup Value Index is a sub-index of the Standard & Poor’s 500 Index representing 50% of the Standard & Poor’s 500 market capitalization and is comprised of those companies with value characteristics based on a series of ratios. (The Standard & Poor’s 500 Barra Value Index, which the Fund has used in the past as its benchmark, ceased to exist on June 30, 2006. The Standard & Poor’s 500 Barra Value Index was also a sub-index of the Standard & Poor’s 500 Index representing 50% of the Standard & Poor’s 500 Index market capitalization and was comprised of those companies with lower price-to-book ratios.) The index is unmanaged and, unlike the Fund, is not affected by cash flows or trading and other expenses. It is not possible to invest directly in an index. |
(Unaudited)
33
REGIONS MORGAN KEEGAN SELECT VALUE FUND
GROWTHOFA $10,000 INVESTMENT
CLASS A SHARES
The graph below illustrates a hypothetical investment of $10,000 in Regions Morgan Keegan Select Value Fund—Class A Shares(1) from November 30, 1998 to November 30, 2008 compared to the Standard & Poor’s 500 Citigroup Value Index(2), a broad-based market index.
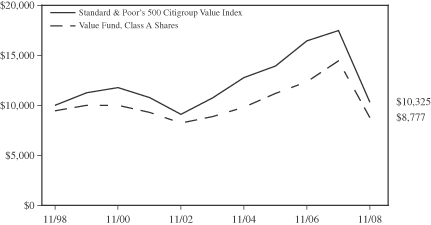
GROWTHOFA $10,000 INVESTMENT
CLASS C SHARES
The graph below illustrates a hypothetical investment of $10,000 in Regions Morgan Keegan Select Value Fund—Class C Shares from the commencement of investment operations on February 21, 2002 to November 30, 2008 compared to the Standard & Poor’s 500 Citigroup Value Index(2), a broad-based market index.
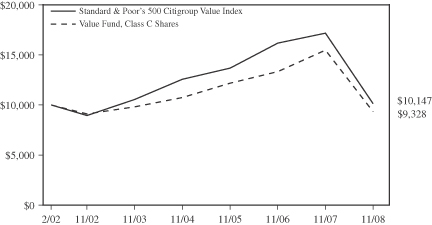
(Unaudited)
34
REGIONS MORGAN KEEGAN SELECT VALUE FUND
GROWTHOFA $10,000 INVESTMENT
CLASS I SHARES
The graph below illustrates a hypothetical investment of $10,000 in Regions Morgan Keegan Select Value Fund—Class I Shares from the commencement of investment operations on June 16, 2004 to November 30, 2008 compared to the Standard & Poor’s 500 Citigroup Value Index(2), a broad-based market index.
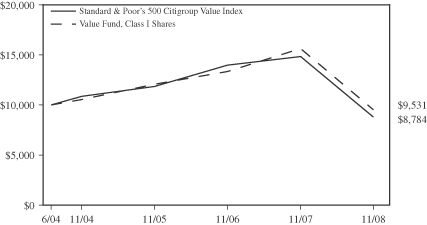
PERFORMANCE INFORMATION
| | | | | | | | | | | | | | | |
| | | AVERAGE ANNUAL TOTAL RETURNS | |
| AS OF NOVEMBER 30, 2008 | | SIX
MONTHS* | | | 1 YEAR | | | 5 YEAR | | | 10
YEAR | | | COMMENCEMENT
OF INVESTMENT
OPERATIONS(3) | |
| CLASS A SHARES**(1) | | -39.85 | % | | -42.52 | % | | -1.41 | % | | -1.30 | % | | 4.42 | % |
(EXCLUDINGSALESLOAD)(1) | | -36.35 | % | | -39.17 | % | | -0.28 | % | | -0.74 | % | | 4.84 | % |
| CLASS C SHARES*** | | -37.22 | % | | -40.25 | % | | -1.00 | % | | N/A | | | -1.02 | % |
(EXCLUDINGCDSC) | | -36.59 | % | | -39.64 | % | | -1.00 | % | | N/A | | | -1.02 | % |
| CLASS I SHARES | | -36.27 | % | | -39.04 | % | | N/A | | | N/A | | | -1.07 | % |
| STANDARD & POOR’S 500 CITIGROUP VALUE INDEX(2) | | -36.34 | % | | -40.75 | % | | -0.21 | % | | 0.01 | % | | — | |
| * | | Not annualized for periods less than one year. |
| ** | | Reflects the maximum sales load of 5.50%. |
| *** | | Reflects the maximum contingent deferred sales charge (CDSC) of 1.00% for shares redeemed within one year of purchase. |
(1) | | Effective June 4, 2004, all Class B Shares of the Fund converted to Class A Shares. Historical total return information for any period or portion thereof prior to the commencement of investment operations of Class A Shares on May 20, 1998 is that of Class B Shares and reflects all charges, expenses and fees incurred by Class B Shares, which were generally higher than the expenses of Class A Shares, during such periods. |
(2) | | The Standard & Poor’s 500 Citigroup Value Index is a sub-index of the Standard & Poor’s 500 Index representing 50% of the Standard & Poor’s 500 market capitalization and is comprised of those companies with value characteristics based on a series of ratios. (The Standard & Poor’s 500 Barra Value Index, which the Fund has used in the past as its benchmark, ceased to exist on June 30, 2006. The Standard & Poor’s 500 Barra Value Index was also a sub-index of the Standard & Poor’s 500 Index representing 50% of the Standard & Poor’s 500 Index market capitalization and was comprised of those companies with lower price-to-book ratios and had the same returns for the periods shown as the Standard & Poor’s 500 Citigroup Value Index.) Total returns for the index shown are not adjusted to reflect sales charges, expenses or other fees that the Securities and Exchange Commission requires to be reflected in the Fund’s performance. The index is unmanaged and, unlike the Fund, is not affected by cash flows or trading and other expenses. It is not possible to invest directly in an index. |
(3) | | The Fund’s Class A Shares (including predecessor Class B Shares), Class C Shares and Class I Shares commenced investment operations on December 19, 1994, February 21, 2002 and June 16, 2004, respectively. |
Performance data quoted represents past performance, which is no guarantee of future results. Investment return and principal value will fluctuate so that an investor’s shares, when redeemed, may be worth more or less than their original cost. Fund performance changes over time and current performance may be lower or higher than what is stated. For the most recent performance, call toll-free 877-757-7424. The Fund’s performance results are shown on a total return basis and include the reinvestment of all dividends and capital gain distributions in the Fund. Returns shown in the chart and table above do not reflect the deduction of taxes that a shareholder would pay on Fund distributions or the redemption of Fund shares. Mutual funds are not bank deposits or obligations, are not guaranteed by any bank and are not insured or guaranteed by the U.S. government, the Federal Deposit Insurance Corporation, the Federal Reserve Board or any other government agency. Investment in mutual funds involves investment risk, including possible loss of principal.
(Unaudited)
35
REGIONS MORGAN KEEGAN SELECT VALUE FUND
PORTFOLIOOF INVESTMENTS
NOVEMBER 30, 2008
| | | | | | | |
| Shares | | | | | | Value |
| Common Stocks–94.8% | | | |
| | | |
| | | | | Basic Materials–3.7% | | | |
| | | | | Chemicals–2.9% | | | |
| 45,000 | | | | Monsanto Company | | $ | 3,564,000 |
| 12,000 | | | | Potash Corporation of Saskatchewan, Inc. | | | 739,680 |
| 10,000 | | | | Terra Industries Inc. | | | 147,100 |
| | | | | | |
|
|
| | | | | Total | | | 4,450,780 |
| | | | | | |
|
|
| | | | | Iron/Steel–0.2% | | | |
| 10,000 | | | | Nucor Corporation | | | 356,800 |
| | | | | Mining–0.6% | | | |
| 20,000 | | | | Freeport-McMoRan Copper & Gold Inc. | | | 479,800 |
| 15,000 | | | | Newmont Mining Corporation | | | 504,750 |
| | | | | | |
|
|
| | | | | Total | | | 984,550 |
| | | | | | |
|
|
| | | | | Total Basic Materials | | | 5,792,130 |
| | | | | | |
|
|
| | | |
| | | | | Communications–8.7% | | | |
| | | | | Media–1.2% | | | |
| 50,000 | | | | Comcast Corporation | | | 867,000 |
| 15,000 | | (1) | | The DIRECTV Group, Inc. | | | 330,150 |
| 75,000 | | | | Time Warner Inc. | | | 678,750 |
| | | | | | |
|
|
| | | | | Total | | | 1,875,900 |
| | | | | | |
|
|
| | | | | Telecommunications–7.5% | | | |
| 225,000 | | | | AT&T Inc. | | | 6,426,000 |
| 20,000 | | | | QUALCOMM Incorporated | | | 671,400 |
| 25,000 | | (1) | | Juniper Networks, Inc. | | | 434,500 |
| 125,000 | | | | Verizon Communications, Inc. | | | 4,081,250 |
| | | | | | |
|
|
| | | | | Total | | | 11,613,150 |
| | | | | | |
|
|
| | | | | Total Communications | | | 13,489,050 |
| | | | | | |
|
|
| | | |
| | | | | Consumer Products–37.0% | | | |
| | | | | Agriculture–7.5% | | | |
| 275,000 | | | | Altria Group, Inc. | | | 4,422,000 |
| 50,000 | | | | Lorillard, Inc. | | | 3,021,500 |
| 100,000 | | | | Philip Morris International Inc. | | | 4,216,000 |
| | | | | | |
|
|
| | | | | Total | | | 11,659,500 |
| | | | | | |
|
|
| | | | | Airlines–0.2% | | | |
| 30,000 | | | | Southwest Airlines Co. | | | 259,500 |
| | | | | Apparel–0.8% | | | |
| 25,000 | | | | V.F. Corporation | | | 1,307,250 |
| | | | | Biotechnology–0.3% | | | |
| 10,000 | | (1) | | Celgene Corporation | | | 521,000 |
| | | | | Cosmetics–1.8% | | | |
| 45,000 | | | | The Procter & Gamble Company | | | 2,895,750 |
| | | | | Food–5.3% | | | |
| 35,000 | | | | ConAgra Foods, Inc. | | | 516,250 |
| 90,000 | | | | General Mills, Inc. | | | 5,685,300 |
| 25,000 | | | | H. J. Heinz Company | | | 971,000 |
| 40,000 | | | | Kraft Foods, Inc. | | | 1,088,400 |
| | | | | | |
|
|
| | | | | Total | | | 8,260,950 |
| | | | | | |
|
|
| | | | | | | |
| Shares | | | | | | Value |
| Common Stocks (continued) | | | |
| | | | | Healthcare Products–2.8% | | | |
| 35,000 | | | | Baxter International Inc. | | $ | 1,851,500 |
| 45,000 | | | | Covidien Ltd. | | | 1,658,250 |
| 10,000 | | | | C. R. Bard, Inc. | | | 820,300 |
| | | | | | |
|
|
| | | | | Total | | | 4,330,050 |
| | | | | | |
|
|
| | | | | Pharmaceuticals–8.9% | | | |
| 55,000 | | | | Abbott Laboratories | | | 2,881,450 |
| 15,000 | | | | Allergan, Inc. | | | 565,200 |
| 250,000 | | | | Bristol–Myers Squibb Company | | | 5,175,000 |
| 25,000 | | (1) | | Medco Health Solutions | | | 1,050,000 |
| 30,000 | | | | Merck & Co., Inc. | | | 801,600 |
| 50,000 | | (1) | | Mylan Inc. | | | 470,500 |
| 180,000 | | | | Pfizer Inc. | | | 2,957,400 |
| | | | | | |
|
|
| | | | | Total | | | 13,901,150 |
| | | | | | |
|
|
| | | | | Retail–9.1% | | | |
| 15,000 | | (1) | | Big Lots, Inc. | | | 262,800 |
| 35,000 | | | | Costco Wholesale Corporation | | | 1,801,450 |
| 25,000 | | | | CVS Caremark Corporation | | | 723,250 |
| 40,000 | | | | Family Dollar Stores, Inc. | | | 1,111,200 |
| 20,000 | | | | Macy's, Inc. | | | 148,400 |
| 80,000 | | | | McDonald's Corporation | | | 4,700,000 |
| 30,000 | | | | Target Corporation | | | 1,012,800 |
| 10,000 | | | | Tiffany & Co. | | | 197,900 |
| 75,000 | | | | Wal–Mart Stores, Inc. | | | 4,191,000 |
| | | | | | |
|
|
| | | | | Total | | | 14,148,800 |
| | | | | | |
|
|
| | | | | Toys–0.3% | | | |
| 15,000 | | | | Hasbro, Inc. | | | 402,000 |
| | | | | | |
|
|
| | | | | Total Consumer Products | | | 57,685,950 |
| | | | | | |
|
|
| | | |
| | | | | Energy–6.3% | | | |
| | | | | Coal–0.7% | | | |
| 45,000 | | | | Peabody Energy Corporation | | | 1,054,350 |
| | | | | Oil & Gas–3.9% | | | |
| 20,000 | | | | Anadarko Petroleum Corporation | | | 821,000 |
| 40,000 | | | | Chevron Corporation | | | 3,160,400 |
| 25,000 | | | | Hess Corporation | | | 1,351,000 |
| 15,000 | | | | Occidental Petroleum Corporation | | | 812,100 |
| | | | | | |
|
|
| | | | | Total | | | 6,144,500 |
| | | | | | |
|
|
| | | | | Oil & Gas Services–1.0% | | | |
| 10,000 | | (1) | | National Oilwell Varco, Inc. | | | 282,900 |
| 100,000 | | (1) | | Weatherford International Ltd. | | | 1,277,000 |
| | | | | | |
|
|
| | | | | Total | | | 1,559,900 |
| | | | | | |
|
|
| | | | | Pipelines–0.7% | | | |
| 150,000 | | | | El Paso Corporation | | | 1,108,500 |
| | | | | | |
|
|
| | | | | Total Energy | | | 9,867,250 |
| | | | | | |
|
|
The Notes to the Financial Statements are an integral part of, and should be read in conjunction with, the Financial Statements.
36
REGIONS MORGAN KEEGAN SELECT VALUE FUND
PORTFOLIOOF INVESTMENTS
NOVEMBER 30, 2008
| | | | | | | |
| Shares | | | | | | Value |
| Common Stocks (continued) | | | |
| | | |
| | | | | Financials–18.5% | | | |
| | | | | Banks–9.4% | | | |
| 150,000 | | | | Bank Of America Corporation | | $ | 2,437,500 |
| 20,000 | | | | The Bank of New York Mellon Corporation | | | 604,200 |
| 20,000 | | | | BB&T Corporation | | | 599,400 |
| 15,000 | | | | Morgan Stanley | | | 221,250 |
| 15,000 | | | | Northern Trust Corporation | | | 688,350 |
| 10,000 | | | | The PNC Financial Services Group, Inc. | | | 527,700 |
| 185,000 | | | | U.S. Bancorp | | | 4,991,300 |
| 160,000 | | | | Wells Fargo & Company | | | 4,622,400 |
| | | | | | |
|
|
| | | | | Total | | | 14,692,100 |
| | | | | | |
|
|
| | | | | Diversified Financial Services–5.5% |
| 25,000 | | | | Citigroup Inc. | | | 207,250 |
| 150,000 | | | | JPMorgan Chase & Co. | | | 4,749,000 |
| 85,000 | | | | T. Rowe Price Group, Inc. | | | 2,907,850 |
| 10,000 | | | | The Goldman Sachs Group, Inc. | | | 789,900 |
| | | | | | |
|
|
| | | | | Total | | | 8,654,000 |
| | | | | | |
|
|
| | | | | Insurance–3.6% | | | |
| 20,000 | | | | Aflac Incorporated | | | 926,000 |
| 68,817 | | | | Loews Corporation | | | 1,884,897 |
| 15,000 | | | | Prudential Financial, Inc. | | | 325,500 |
| 55,000 | | | | The Travelers Companies, Inc. | | | 2,400,750 |
| | | | | | |
|
|
| | | | | Total | | | 5,537,147 |
| | | | | | |
|
|
| | | | | Total Financials | | | 28,883,247 |
| | | | | | |
|
|
| | | |
| | | | | Industrials–13.7% | | | |
| | | | | Aerospace/ Defense–1.7% | | | |
| 55,000 | | | | Raytheon Company | | | 2,684,000 |
| | | | | Electronics–1.4% | | | |
| 60,000 | | (1) | | Thermo Fisher Scientific, Inc. | | | 2,140,800 |
| | | | | Engineering & Construction–0.4% | | | |
| 12,000 | | | | Chicago Bridge & Iron Company N.V. | | | 631,560 |
| | | | | Hand Tools–0.4% | | | |
| 15,000 | | | | Snap–on Incorporated | | | 540,750 |
| | | | | Machinery–0.6% | | | |
| 25,000 | | | | Deere & Company | | | 870,250 |
| | | | | Manufacturing–2.5% | | | |
| 20,000 | | | | Cooper Industries, Ltd. | | | 482,800 |
| 200,000 | | | | General Electric Company | | | 3,434,000 |
| | | | | | |
|
|
| | | | | Total | | | 3,916,800 |
| | | | | | |
|
|
| | | | | Transportation–6.7% | | | |
| 60,000 | | | | Burlington Northern Santa Fe Corporation | | | 4,596,600 |
| 25,000 | | | | CSX Corporation | | | 931,000 |
| 50,000 | | | | Norfolk Southern Corporation | | | 2,473,500 |
| 50,000 | | | | Union Pacific Corporation | | | 2,502,000 |
| | | | | | |
|
|
| | | | | Total | | | 10,503,100 |
| | | | | | |
|
|
| | | | | Total Industrials | | | 21,287,260 |
| | | | | | |
|
|
| | | | | | | | |
| Shares | | | | | | Value | |
| Common Stocks (continued) | | | | |
| | | |
| | | | | Technology–3.6% | | | | |
| | | | | Computers–1.7% | | | | |
| 5,000 | | (1) | | Apple, Inc. | | $ | 463,350 | |
| 25,000 | | | | Hewlett–Packard Company | | | 882,000 | |
| 15,000 | | | | International Business Machines Corporation | | | 1,224,000 | |
| | | | | | |
|
|
|
| | | | | Total | | | 2,569,350 | |
| | | | | | |
|
|
|
| | | | | Semiconductors–1.9% | | | | |
| 50,000 | | | | Applied Materials, Inc. | | | 479,000 | |
| 150,000 | | | | Intel Corporation | | | 2,070,000 | |
| 25,000 | | | | Xilinx, Inc. | | | 409,000 | |
| | | | | | |
|
|
|
| | | | | Total | | | 2,958,000 | |
| | | | | | |
|
|
|
| | | | | Total Technology | | | 5,527,350 | |
| | | | | | |
|
|
|
| | | |
| | | | | Utilities–3.3% | | | | |
| | | | | Electric–3.3% | | | | |
| 15,000 | | | | Dominion Resources, Inc. | | | 552,300 | |
| 30,000 | | | | Entergy Corporation | | | 2,553,000 | |
| 20,000 | | | | Exelon Corporation | | | 1,124,200 | |
| 15,000 | | | | FirstEnergy Corp. | | | 878,700 | |
| | | | | | |
|
|
|
| | | | | Total Utilities | | | 5,108,200 | |
| | | | | | |
|
|
|
| | | | | Total Common Stocks (identified cost $171,905,446) | | | 147,640,437 | |
| | | | | | |
|
|
|
| Short-Term Investments–10.0% | | | | |
| 7,792,902 | | | | Fidelity Institutional Money Market Fund | | | 7,792,902 | |
| 7,792,902 | | | | Lehman Brothers Prime Money Market Fund | | | 7,792,902 | |
| | | | | | |
|
|
|
| | | | | Total Short-Term Investments (identified cost $15,585,804) | | | 15,585,804 | |
| | | | | | |
|
|
|
| | | | | Total Investments–104.8% (identified cost $187,491,250) | | | 163,226,241 | |
| | | | | | |
|
|
|
| | | | | Other Assets and Liabilities–
net–(4.8)% | | | (7,472,626 | ) |
| | | | | | |
|
|
|
| | | | | Total Net Assets–100.0% | | $ | 155,753,615 | |
| | | | | | |
|
|
|
| (1) | | Non-income producing security. |
Note: The categories of investments are shown as a percentage of total net assets at November 30, 2008.
The Notes to the Financial Statements are an integral part of, and should be read in conjunction with, the Financial Statements.
37
REGIONS MORGAN KEEGAN SELECT BALANCED FUND
OBJECTIVE & STRATEGY
Regions Morgan Keegan Select Balanced Fund seeks total return through capital appreciation, dividends and interest. The Fund invests primarily in common and preferred stocks, convertible securities, and fixed-income securities.
INVESTMENT RISKS: Stocks can be more volatile and carry more risk and return potential than other forms of investments. Bonds offer a relatively stable level of income, although bond prices will fluctuate, providing the potential for principal gain or loss. Cash equivalents offer low risk and low return potential. The net asset value per share of the Fund will fluctuate as the value of the securities in the portfolio changes.
MANAGEMENT DISCUSSIONOF FUND PERFORMANCE
For the fiscal year ended November 30, 2008, Regions Morgan Keegan Select Balanced Fund’s Class A Shares had a total return of –20.78%, based on net asset value. The Standard & Poor’s 500 Index(1) and the Barclays Capital (formerly, Lehman Brothers) Government/Credit Total Index(2) had total returns of –38.09% and 1.32%, respectively, during the same period. A market-index return comprised of 60% Standard & Poor’s 500 Index and 40% Merrill Lynch 1-10 Year Government/Corporate A Rated and Above Index(3) was –22.32%. The peer group, as represented by the Lipper Balanced Index( 4), showed a return of –28.91%. While we were not pleased with the absolute return of the Fund, the relative outperformance as compared to the blended index (141 basis points) and the peer group (813 basis points) helps ease some of the pain.
What began as a modest return at midyear turned into a financial horror movie by year-end. Concerns of bank failures, a frozen credit market, weak consumer spending and plunging consumer confidence led to a market decline for the ages, or the worst stock market return since 1931. What strikes this 35-year investment veteran is how many financial and economic comparisons to the 1930’s were made over the last few months.
The Fund performed well relative to the indices and our peer group probably due to two reasons: the Fund had no major exposure to any poorly performing assets, and we did not rebalance the Fund from bonds to stocks as the market declined. The Fund was underweighted in Financials during the year, and the bond portion of the Fund held no bonds of the bankrupt financial institutions. An over-weighted position in U.S. Treasury securities helped as the rush to quality assets pushed their prices higher offsetting some of the stock declines.
As mentioned above, we did not rebalance the Fund during the second half of the year. Rebalancing is the process of selling the outperforming asset class and reinvesting in the underperforming asset class. This kept the Fund from always buying into stocks as they were steadily declining.
|
|
| Charles A. Murray, CFA |
| Senior Portfolio Manager |
| Morgan Asset Management, Inc. |
Market forecasts provided in this report may not necessarily come to pass. There is no assurance that the Fund will achieve its investment objectives. These views are subject to change at any time based upon market or other conditions, and Morgan Asset Management, Inc. disclaims any responsibility to update such views. The Fund is subject to market risk, which is the possibility that the market values of securities owned by the Fund will decline and, therefore, the value of the Fund’s shares may be less than what you paid for them. Accordingly, you can lose money investing in the Fund.
(Unaudited)
38
REGIONS MORGAN KEEGAN SELECT BALANCED FUND
TOP TEN EQUITY HOLDINGS†
AS OF NOVEMBER 30, 2008
| | | | | | | | | | | | | | |
| TICKER | | DESCRIPTION | | % OF TOTAL NET ASSETS | | TICKER | | DESCRIPTION | | % OF TOTAL NET ASSETS |
XOM | | Exxon Mobil Corp. | | 4.5% | | ABT | | Abbott Laboratories | | 3.0% |
DVN | | Devon Energy Corp. | | 4.3% | | PG | | The Proctor & Gamble Co. | | 2.5% |
ABX | | Barrick Gold Corp. | | 4.2% | | NEM | | Newmont Mining Corp. | | 2.4% |
XLF | | Financial Select Sector SPDR | | 3.7% | | PM | | Philip Morris International, Inc. | | 2.4% |
WMT | | Wal-Mart Stores, Inc. | | 3.2% | | SLV | | iShares Silver Trust | | 2.3% |
| † | | The Fund’s composition is subject to change. |
EQUITY SECTOR DIVERSIFICATION†
AS OF NOVEMBER 30, 2008
| | |
%OFTOTALINVESTMENTS
EXCLUDINGCOLLATERALFORSECURITIESLENDING |
Consumer Products | | 15.1% |
Energy | | 11.1% |
Industrials | | 7.0% |
Technology | | 5.9% |
Basic Materials | | 5.5% |
Financials | | 4.0% |
Exchange Traded Funds | | 3.7% |
Communications | | 3.4% |
| | |
|
Total | | 55.7% |
| † | | The Fund’s composition is subject to change. |
FIXED INCOME DIVERSIFICATION†
AS OF NOVEMBER 30, 2008
| | |
%OFTOTALINVESTMENTS
EXCLUDINGCOLLATERALFORSECURITIESLENDING |
Corporate Bonds | | 23.7% |
U.S. Treasury Obligations | | 8.0% |
Government & Agency Securities | | 5.8% |
Mortgage-Backed Securities | | 3.6% |
Short Term Investments | | 3.2% |
| | |
|
Total | | 44.3% |
INDEX DESCRIPTIONS
(1) | | The Standard & Poor’s 500 Index is an unmanaged capitalization-weighted index of 500 stocks designed to measure performance of the broad domestic economy through changes in the aggregated market value of 500 stocks representing all major industries. The index is unmanaged and, unlike the Fund, is not affected by cash flows or trading and other expenses. It is not possible to invest directly in an index. |
(2) | | The Barclays Capital (formerly Lehman Brothers) Government/Credit Total Index is comprised of approximately 5,000 issues which include: non-convertible bonds publicly issued by the U.S. government or its agencies; corporate bonds guaranteed by the U.S. government and quasi-federal corporations; and publicly issued, fixed rate, non-convertible domestic bonds of companies in industry, public utilities and finance. The index is unmanaged and, unlike the Fund, is not affected by cash flows or trading and other expenses. It is not possible to invest directly in an index. |
(3) | | The Standard & Poor’s 500 Index/Merrill Lynch 1-10 Year Government/Corporate A Rated and Above Index is a 60%/40% weight between the two indexes. It is sometimes used as a standard market mix to measure a balanced fund’s performance against market indexes. The Fund’s asset allocation allowed by the prospectus is between 75% equity securities and 25% fixed income securities to 25% equity securities and 75% fixed income securities. The Merrill Lynch 1-10 Year Government/Corporate A Rated and Above Index is comprised of publicly placed, non-convertible, coupon-bearing domestic debt with maturities between 1 and 9.99 years, rated “A” or better. The index is unmanaged and, unlike the Fund, is not affected by cash flows or trading and other expenses. It is not possible to invest directly in an index. |
(4) | | The Lipper Balanced Index is the average return of the 30 largest balanced mutual funds. Funds in the index are rebalanced quarterly. It is not possible to invest directly in an index. |
39
(Unaudited)
REGIONS MORGAN KEEGAN SELECT BALANCED FUND
GROWTHOFA $10,000 INVESTMENT
CLASS A SHARES
The graph below illustrates a hypothetical investment of $10,000 in Regions Morgan Keegan Select Balanced Fund—Class A Shares(1) from November 30, 1998 to November 30, 2008 compared to the Standard & Poor’s 500 Index(2) and the Barclays Capital (formerly, Lehman Brothers) Government/Credit Total Index(2), two separate broad-based market indexes, and to the Standard & Poor’s 500 Index/Merrill Lynch 1-10 Year Government/Corporate A Rated and Above Index(2).
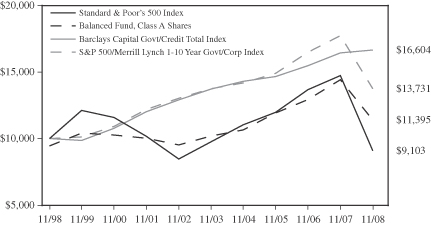
GROWTHOFA $10,000 INVESTMENT
CLASS C SHARES
The graph below illustrates a hypothetical investment of $10,000 in Regions Morgan Keegan Select Balanced Fund—Class C Shares from the commencement of investment operations on January 14, 2002 to November 30, 2008 compared to the Standard & Poor’s 500 Index(2) and the Barclays Capital (formerly, Lehman Brothers) Government/Credit Total Index(2), two separate broad-based market indexes, and to the Standard & Poor’s 500 Index/Merrill Lynch 1-10 Year Government/Corporate A Rated and Above Index(2).
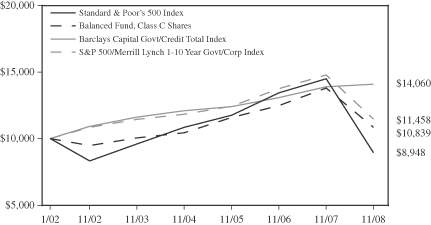
(Unaudited)
40
REGIONS MORGAN KEEGAN SELECT BALANCED FUND
GROWTHOFA $10,000 INVESTMENT
CLASS I SHARES
The graph below illustrates a hypothetical investment of $10,000 in Regions Morgan Keegan Select Balanced Fund—Class I Shares from the commencement of investment operations on September 1, 2005 to November 30, 2008 compared to the Standard & Poor’s 500 Index(2) and the Barclays Capital (formerly, Lehman Brothers) Government/Credit Total Index(2), two separate broad-based market indexes, and to the Standard & Poor’s 500 Index/Merrill Lynch 1-10 Year Government/Corporate A Rated and Above Index(2).
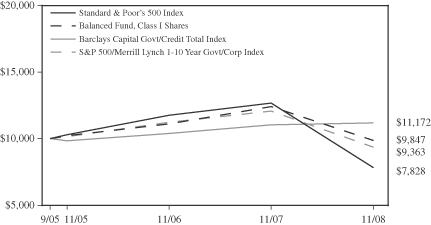
PERFORMANCE INFORMATION
| | | | | | | | | | | | | | | |
| | | AVERAGE ANNUAL TOTAL RETURNS | |
| AS OF NOVEMBER 30, 2008 | | SIX
MONTHS* | | | 1 YEAR | | | 5 YEAR | | | 10 YEAR | | | COMMENCEMENT
OF INVESTMENT
OPERATIONS(3) | |
| CLASS A SHARES**(1) | | -26.21 | % | | -25.13 | % | | 1.12 | % | | 1.31 | % | | 5.57 | % |
(EXCLUDINGSALESLOAD)(1) | | -21.92 | % | | -20.78 | % | | 2.27 | % | | 1.89 | % | | 6.00 | % |
| CLASS C SHARES*** | | -22.95 | % | | -22.13 | % | | 1.54 | % | | N/A | | | 1.18 | % |
(EXCLUDINGCDSC) | | -22.17 | % | | -21.34 | % | | 1.54 | % | | N/A | | | 1.18 | % |
| CLASS I SHARES | | -21.82 | % | | -20.58 | % | | N/A | | | N/A | | | -0.47 | % |
| STANDARD & POOR’S 500 INDEX(2) | | -35.20 | % | | -38.09 | % | | -1.39 | % | | -0.93 | % | | — | |
BARCLAYS CAPITAL GOVERNMENT/CREDIT TOTAL INDEX(2) | | 0.25 | % | | 1.32 | % | | 3.92 | % | | 5.20 | % | | — | |
| STANDARD & POOR’S 500 INDEX/MERRILL LYNCH 1-10 YEAR GOVERNMENT/CORPORATE A RATEDAND ABOVE INDEX(2) | | -21.82 | % | | -22.32 | % | | 0.98 | % | | 1.81 | % | | — | |
| * | | Not annualized for periods less than one year. |
| ** | | Reflects the maximum sales load of 5.50%. |
| *** | | Reflects the maximum contingent deferred sales charge (CDSC) of 1.00% for shares redeemed within one year of purchase. |
(1) | | Effective June 4, 2004, all Class B Shares of the Fund converted to Class A Shares. Historical total return information for any period or portion thereof prior to the commencement of investment operations of Class A Shares on May 20, 1998 is that of Class B Shares and reflects all charges, expenses and fees incurred by Class B Shares, which were generally higher than the expenses of Class A Shares, during such periods. |
(2) | | The Standard & Poor’s 500 Index is a capitalization-weighted index of 500 stocks representing all major industries. The Barclays Capital (formerly Lehman Brothers) Government/Credit Total Index is comprised of approximately 5,000 issues which include: non-convertible bonds publicly issued by the U.S. government or its agencies; corporate bonds guaranteed by the U.S. government and quasi-federal corporations; and publicly issued, fixed rate, non-convertible domestic bonds of companies in industry, public utilities, and finance. The Standard & Poor’s 500 Index/Merrill Lynch 1-10 Year Government/Corporate A Rated and Above Index is a 60%/40% weight between the two indexes. (Returns greater than one year assume rebalancing at the end of each fiscal year.) The Merrill Lynch 1-10 Year Government/Corporate A Rated and Above Index is comprised of publicly placed, non-convertible, coupon-bearing domestic debt with maturities between 1 and 9.99 years, rated “A” or better. Total returns for the indexes shown are not adjusted to reflect sales charges, expenses or other fees that the Securities and Exchange Commission requires to be reflected in the Fund’s performance. The indexes are unmanaged and, unlike the Fund, are not affected by cash flows or trading and other expenses. It is not possible to invest directly in an index. |
(3) | | The Fund’s Class A Shares (including predecessor Class B Shares), Class C Shares and Class I Shares commenced investment operations on December 18, 1994, January 14, 2002 and September 1, 2005, respectively. |
Performance data quoted represents past performance, which is no guarantee of future results. Investment return and principal value will fluctuate so that an investor’s shares, when redeemed, may be worth more or less than their original cost. Fund performance changes over time and current performance may be lower or higher than what is stated. For the most recent performance, call toll-free 877-757-7424. The Fund’s performance results are shown on a total return basis and include the reinvestment of all dividends and capital gain distributions in the Fund. Returns shown in the chart and table above do not reflect the deduction of taxes that a shareholder would pay on Fund distributions or the redemption of Fund shares. Mutual funds are not bank deposits or obligations, are not guaranteed by any bank and are not insured or guaranteed by the U.S. government, the Federal Deposit Insurance Corporation, the Federal Reserve Board or any other government agency. Investment in mutual funds involves investment risk, including possible loss of principal.
(Unaudited)
41
REGIONS MORGAN KEEGAN SELECT BALANCED FUND
PORTFOLIOOF INVESTMENTS
NOVEMBER 30, 2008
| | | | | | | |
| Shares | | | | | | Value |
| Common Stocks–51.7% | | | |
| | | |
| | | | | Basic Materials–5.4% | | | |
| | | | | Iron/Steel–0.8% | | | |
| 20,000 | | | | Nucor Corporation | | $ | 713,600 |
| 10,000 | | | | United States Steel Corporation | | | 304,000 |
| | | | | | |
|
|
| | | | | | | | 1,017,600 |
| | | | | | |
|
|
| | | | | Mining–4.6% | | | |
| 36,000 | | (2) | | Agnico-Eagle Mines Limited | | | 1,355,760 |
| 100,000 | | | | Barrick Gold Corporation | | | 2,946,000 |
| 50,000 | | | | Newmont Mining Corporation | | | 1,682,500 |
| | | | | | |
|
|
| | | | | Total | | | 5,984,260 |
| | | | | | |
|
|
| | | | | Total Basic Materials | | | 7,001,860 |
| | | | | | |
|
|
| | | |
| | | | | Communications–3.4% | | | |
| | | | | Internet–0.9% | | | |
| 4,000 | | (1) | | Google, Inc. | | | 1,171,840 |
| | | | | Telecommunications–2.5% | | | |
| 90,000 | | (1) | | Cisco Systems, Inc. | | | 1,488,600 |
| 5,000 | | | | Nokia Corporation | | | 70,850 |
| 30,000 | | | | QUALCOMM Inc. | | | 1,007,100 |
| 20,000 | | | | Verizon Communications Inc. | | | 653,000 |
| | | | | | |
|
|
| | | | | Total | | | 3,219,550 |
| | | | | | |
|
|
| | | | | Total Communications | | | 4,391,390 |
| | | | | | |
|
|
| | | |
| | | | | Consumer Products–15.0% | | | |
| | | | | Agriculture–2.6% | | | |
| 40,000 | | | | Altria Group, Inc. | | | 643,200 |
| 24,000 | | (2) | | Bunge Limited | | | 1,019,040 |
| 40,000 | | | | Philip Morris International Inc. | | | 1,686,400 |
| | | | | | |
|
|
| | | | | Total | | | 3,348,640 |
| | | | | | |
|
|
| | | | | Airlines–0.3% | | | |
| 50,000 | | (1) | | AMR Corporation | | | 439,000 |
| | | | | Apparel–0.2% | | | |
| 5,000 | | | | NIKE, Inc. | | | 266,250 |
| | | | | Beverages–0.9% | | | |
| 20,000 | | | | PepsiCo, Inc. | | | 1,134,000 |
| | | | | Biotechnology–1.9% | | | |
| 16,000 | | (1) | | Celgene Corporation | | | 833,600 |
| 12,000 | | (1) | | Genentech, Inc. | | | 919,200 |
| 10,000 | | (1) | | Genzyme Corporation | | | 640,200 |
| | | | | | |
|
|
| | | | | Total | | | 2,393,000 |
| | | | | | |
|
|
| | | | | Commercial Services–0.5% | | | |
| 4,000 | | | | MasterCard Inc. | | | 581,200 |
| | | | | Cosmetics/ Personal Care–1.4% | | | |
| 28,000 | | | | The Procter & Gamble Company | | | 1,801,800 |
| | | | | Healthcare Products–1.8% | | | |
| 24,000 | | | | Johnson & Johnson | | | 1,405,920 |
| 28,000 | | | | Medtronic, Inc. | | | 854,560 |
| | | | | | |
|
|
| | | | | Total | | | 2,260,480 |
| | | | | | |
|
|
| | | | | Healthcare Services–0.3% | | | |
| 10,000 | | | | UnitedHealth Group Inc. | | | 210,100 |
| 6,000 | | (1) | | WellPoint, Inc. | | | 213,600 |
| | | | | | |
|
|
| | | | | Total | | | 423,700 |
| | | | | | |
|
|
| | | | | | | |
| Shares | | | | | | Value |
| Common Stocks (continued) | | | |
| | | | | Pharmaceuticals–2.6% | | | |
| 40,000 | | | | Abbott Laboratories | | $ | 2,095,600 |
| 10,000 | | | | Eli Lilly and Company | | | 341,500 |
| 20,000 | | (1) | | Gilead Sciences, Inc. | | | 895,800 |
| | | | | | |
|
|
| | | | | Total | | | 3,332,900 |
| | | | | | |
|
|
| | | | | Retail–2.5% | | | |
| 20,000 | | | | Lowe's Companies, Inc. | | | 413,200 |
| 20,000 | | (1) | | Starbucks Corporation | | | 178,600 |
| 15,000 | | | | The Home Depot, Inc. | | | 346,650 |
| 40,000 | | | | Wal-Mart Stores, Inc. | | | 2,235,200 |
| | | | | | |
|
|
| | | | | Total | | | 3,173,650 |
| | | | | | |
|
|
| | | | | Total Consumer Products | | | 19,154,620 |
| | | | | | |
|
|
| | | |
| | | | | Energy–11.0% | | | |
| | | | | Coal–0.8% | | | |
| 40,000 | | | | Arch Coal, Inc. | | | 615,200 |
| 20,000 | | | | Peabody Energy Corporation | | | 468,600 |
| | | | | | |
|
|
| | | | | Total | | | 1,083,800 |
| | | | | | |
|
|
| | | | | Oil & Gas–9.1% | | | |
| 42,000 | | | | Devon Energy Corporation | | | 3,038,280 |
| 40,000 | | | | Exxon Mobil Corporation | | | 3,206,000 |
| 30,000 | | | | Occidental Petroleum Corporation | | | 1,624,200 |
| 30,000 | | (1) | | Southwestern Energy Company | | | 1,031,100 |
| 40,000 | | | | Sunoco, Inc. | | | 1,589,600 |
| 30,000 | | | | XTO Energy Inc. | | | 1,147,200 |
| | | | | | |
|
|
| | | | | Total | | | 11,636,380 |
| | | | | | |
|
|
| | | | | Oil and Gas Services–0.8% | | | |
| 20,000 | | | | Halliburton Company | | | 352,000 |
| 1,000 | | | | Schlumberger Limited | | | 50,740 |
| 10,000 | | | | Smith International, Inc. | | | 292,400 |
| 20,000 | | (1) | | Weatherford International Limited | | | 255,400 |
| | | | | | |
|
|
| | | | | Total | | | 950,540 |
| | | | | | |
|
|
| | | | | Pipelines–0.3% | | | |
| 50,000 | | | | El Paso Corporation | | | 369,500 |
| | | | | | |
|
|
| | | | | Total Energy | | | 14,040,220 |
| | | | | | |
|
|
| | | |
| | | | | Financials–4.0% | | | |
| | | | | Diversified Financial Services–3.8% | | | |
| 20,000 | | | | American Express Company | | | 466,200 |
| 16,000 | | | | Bank of New York Mellon Corporation | | | 483,360 |
| 32,000 | | | | Citigroup Inc. | | | 265,280 |
| 1,600 | | | | CME Group Inc. | | | 339,120 |
| 20,000 | | | | Franklin Resources Inc. | | | 1,215,000 |
| 20,000 | | | | The Goldman Sachs Group Inc. | | | 1,579,800 |
| 20,000 | | | | US Bancorp | | | 539,600 |
| | | | | | |
|
|
| | | | | Total | | | 4,888,360 |
| | | | | | |
|
|
| | | | | Insurance–0.2% | | | |
| 5,000 | | | | Aflac Inc. | | | 231,500 |
| | | | | | |
|
|
| | | | | Total Financials | | | 5,119,860 |
| | | | | | |
|
|
The Notes to the Financial Statements are an integral part of, and should be read in conjunction with, the Financial Statements.
42
REGIONS MORGAN KEEGAN SELECT BALANCED FUND
PORTFOLIOOF INVESTMENTS
NOVEMBER 30, 2008
| | | | | | | |
| Shares | | | | | | Value |
| Common Stocks (continued) | | | |
| | | |
| | | | | Industrials–7.0% | | | |
| | | | | Aerospace/Defense–0.9% | | | |
| 24,000 | | | | United Technologies Corporation | | $ | 1,164,720 |
| | | | | Engineering and Construction–1.1% | | | |
| 4,000 | | | | Fluor Corporation | | | 182,160 |
| 28,000 | | (1) | | Jacobs Engineering Group Inc. | | | 1,253,560 |
| | | | | | |
|
|
| | | | | Total | | | 1,435,720 |
| | | | | | |
|
|
| | | | | Machinery–1.8% | | | |
| 30,000 | | | | Caterpillar, Inc. | | | 1,229,700 |
| 30,000 | | | | Deere & Company | | | 1,044,300 |
| | | | | | |
|
|
| | | | | Total | | | 2,274,000 |
| | | | | | |
|
|
| | | | | Manufacturing–0.6% | | | |
| 30,000 | | | | General Electric Company | | | 515,100 |
| 12,000 | | | | Textron Inc. | | | 182,760 |
| | | | | | |
|
|
| | | | | Total | | | 697,860 |
| | | | | | |
|
|
| | | | | Metal Fabrication–0.3% | | | |
| 6,000 | | | | Precision Castparts Corp. | | | 376,200 |
| | | | | Transportation–2.3% | | | |
| 18,000 | | | | Burlington Northern Santa Fe Corporation | | | 1,378,980 |
| 32,000 | | | | Union Pacific Corporation | | | 1,601,280 |
| | | | | | |
|
|
| | | | | Total | | | 2,980,260 |
| | | | | | |
|
|
| | | | | Total Industrials | | | 8,928,760 |
| | | | | | |
|
|
| | | |
| | | | | Technology–5.9% | | | |
| | | | | Computers–2.6% | | | |
| 40,000 | | (1) | | Dell Inc. | | | 446,800 |
| 34,000 | | | | Hewlett-Packard Company | | | 1,199,520 |
| 20,000 | | | | International Business Machines Corporation | | | 1,632,000 |
| | | | | | |
|
|
| | | | | Total | | | 3,278,320 |
| | | | | | |
|
|
| | | | | Semiconductors–1.0% | | | |
| 50,000 | | | | Applied Materials, Inc. | | | 479,000 |
| 40,000 | | | | Intel Corporation | | | 552,000 |
| 20,000 | | | | Texas Instruments Inc. | | | 311,400 |
| | | | | | |
|
|
| | | | | Total | | | 1,342,400 |
| | | | | | |
|
|
| | | | | Software–2.3% | | | |
| 80,000 | | (1) | | Oracle Corporation | | | 1,287,200 |
| 80,000 | | | | Microsoft Corporation | | | 1,617,600 |
| | | | | | |
|
|
| | | | | Total | | | 2,904,800 |
| | | | | | |
|
|
| | | | | Total Technology | | | 7,525,520 |
| | | | | | |
|
|
| | | | | Total Common Stocks
(identified cost $67,437,560) | | $ | 66,162,230 |
| | | | | | |
|
|
| | | | | | | | |
Principal
Amount | | | | | | Value |
| | Corporate Bonds–23.5% | | | |
| | | |
| | | | | | Consumer Staples–1.6% | | | |
| | | | | | Food–0.8% | | | |
| $ | 1,000,000 | | | | Kraft Foods, Inc., 4.125%, 11/12/2009 | | $ | 988,831 |
| | | | | | Personal Products–0.8% | | | |
| | 1,000,000 | | | | The Procter & Gamble Company, 6.875% 9/15/2009 | | | 1,037,233 |
| | | | | | | |
|
|
| | | | | | Total Consumer Staples | | | 2,026,064 |
| | | | | | | |
|
|
| | | |
| | | | | | Energy–0.4% | | | |
| | | | | | Oil & Gas–0.4% | | | |
| | 500,000 | | | | ConocoPhillips, 4.750%, 10/15/2012 | | | 492,170 |
| | | | | | | |
|
|
| | | | | | Total Energy | | | 492,170 |
| | | | | | | |
|
|
| | | |
| | | | | | Financials–10.9% | | | |
| | | | | | Banks–2.3% | | | |
| | 500,000 | | | | Bank of America Corporation, 6.250%, 4/15/2012 | | | 503,331 |
| | 500,000 | | | | Bank of America Corporation, 4.750%, 8/15/2013 | | | 469,717 |
| | 500,000 | | | | Bank of New York Mellon, 5.125%, 8/27/2013 | | | 496,088 |
| | 500,000 | | | | Goldman Sachs Group Inc., 5.450%, 11/1/2012 | | | 446,007 |
| | 1,000,000 | | | | Wells Fargo & Company, 5.125%, 9/1/2012 | | | 991,859 |
| | | | | | | |
|
|
| | | | | | Total | | | 2,907,002 |
| | | | | | | |
|
|
| | | | | | Diversified Financial Services–6.6% | | | |
| | 1,000,000 | | | | Boeing Capital Corporation, 7.375%, 9/27/2010 | | | 1,041,700 |
| | 1,000,000 | | | | Caterpillar Financial Services, 4.500% 6/15/2009 | | | 994,402 |
| | 500,000 | | | | Caterpillar Financial Services, 5.050% 12/1/2010 | | | 492,480 |
| | 1,000,000 | | | | Citigroup Inc, 4.625%, 8/3/2010 | | | 953,550 |
| | 500,000 | | | | General Electric Company, 4.250%, 9/13/2010 | | | 493,240 |
| | 1,000,000 | | | | General Electric Company, 4.875%, 10/21/2010 | | | 994,540 |
| | 1,000,000 | | | | General Electric Company, 5.500%, 11/15/2011 | | | 981,865 |
| | 500,000 | | | | IBM Intl Group, 5.050%, 10/22/2012 | | | 497,634 |
| | 1,000,000 | | | | John Deere Capital Corporation, 4.875%, 3/16/2009 | | | 1,001,651 |
| | 1,000,000 | | | | National Rural Utilities, 7.250%, 3/1/2012 | | | 985,667 |
| | | | | | | |
|
|
| | | | | | Total | | | 8,436,729 |
| | | | | | | |
|
|
| | | | | | Insurance–0.4% | | | |
| | 500,000 | | | | MetLife Inc, 5.375% 12/15/2012 | | | 462,438 |
| | | | | | Investment Services–1.1% | | | |
| | 500,000 | | | | Goldman Sachs Group, Inc., 4.500%, 6/15/2010 | | | 472,061 |
| | 1,000,000 | | | | Morgan Stanley, 5.050% 1/21/2011 | | | 944,609 |
| | | | | | | |
|
|
| | | | | | Total | | | 1,416,670 |
| | | | | | | |
|
|
The Notes to the Financial Statements are an integral part of, and should be read in conjunction with, the Financial Statements.
43
REGIONS MORGAN KEEGAN SELECT BALANCED FUND
PORTFOLIOOF INVESTMENTS
NOVEMBER 30, 2008
| | | | | | | | |
Principal
Amount | | | | | | Value |
| | Corporate Bonds (continued) | | | |
| | | | | | Leasing Companies–0.5% | | | |
| $ | 1,000,000 | | | | International Lease Finance, 5.450%, 3/24/2011 | | $ | 707,431 |
| | | | | | | |
|
|
| | | | | | Total Financials | | | 13,930,270 |
| | | | | | | |
|
|
| | | |
| | | | | | Healthcare–2.0% | | | |
| | | | | | Healthcare Products–0.8% | | | |
| | 1,000,000 | | | | Johnson & Johnson, 5.150% 8/15/2012 | | | 1,069,522 |
| | | | | | Pharmaceuticals–1.2% | | | |
| | 1,000,000 | | | | Abbott Laboratories, Note, 3.500%, 2/17/2009 | | | 1,000,533 |
| | 500,000 | | | | Abbott Laboratories, 5.600% 5/15/2011 | | | 516,997 |
| | | | | | | |
|
|
| | | | | | | | | 1,517,530 |
| | | | | | | |
|
|
| | | | | | Total Healthcare | | | 2,587,052 |
| | | | | | | |
|
|
| | | |
| | | | | | Industrials–1.5% | | | |
| | | | | | Brewery–0.7% | | | |
| | 1,000,000 | | | | Anheuser-Bush Inc., 4.700%, 4/15/2012 | | | 924,231 |
| | | | | | Industrial Conglomerates–0.8% | | | |
| | 1,000,000 | | | | United Technologies Corporation, 4.375%, 5/1/2010 | | | 1,004,938 |
| | | | | | | |
|
|
| | | | | | Total Industrials | | | 1,929,169 |
| | | | | | | |
|
|
| | | |
| | | | | | Services–0.7% | | | |
| | | | | | Retail–0.7% | | | |
| | 1,000,000 | | | | The Home Depot, Inc., 5.200%, 3/1/2011 | | | 929,576 |
| | | | | | | |
|
|
| | | | | | Total Services | | | 929,576 |
| | | | | | | |
|
|
| | | |
| | | | | | Technology–0.4% | | | |
| | | | | | Software–0.4% | | | |
| | 500,000 | | | | Oracle Corporation, 5.000% 1/15/2011 | | | 498,950 |
| | | | | | | |
|
|
| | | | | | Total Technology | | | 498,950 |
| | | | | | | |
|
|
| | |
| | | | | | Telecommunication Services–4.9% |
| | | | | | Diversified Telecommunication Services–4.9% |
| | 1,500,000 | | | | AT&T Inc, 5.300% 11/15/2010 | | | 1,488,670 |
| | 500,000 | | | | AT&T Inc, 5.875% 2/1/2012 | | | 492,515 |
| | 1,000,000 | | | | AT&T Inc, 5.875%, 8/15/2012 | | | 982,769 |
| | 1,000,000 | | | | AT&T Inc, 4.950% 01/15/2013 | | | 942,930 |
| | 500,000 | | | | AT&T Inc, 5.100% 9/15/2014 | | | 448,491 |
| | 1,000,000 | | | | New York Telephone Corporation, 6.125% 1/15/2010 | | | 985,814 |
| | 1,000,000 | | | | Verizion Pennsylvania, 5.650% 11/15/2011 | | | 961,915 |
| | | | | | | |
|
|
| | | | | | Total Telecommunication Services | | | 6,303,104 |
| | | | | | | |
|
|
| | | |
| | | | | | Utilities–1.1% | | | |
| | | | | | Electric Utilities–1.1% | | | |
| | 1,000,000 | | | | Cons Edison NY, 3.850%, 6/15/2013 | | | 915,666 |
| | 500,000 | | | | Detroit Edison Company, 6.125%, 10/1/2010 | | | 497,923 |
| | | | | | | |
|
|
| | | | | | Total Utilities | | | 1,413,589 |
| | | | | | | |
|
|
| | | | | | Total Corporate Bonds
(identified cost $30,970,202) | | $ | 30,109,944 |
| | | | | | | |
|
|
| | | | | | | | |
Principal
Amount | | | | | | Value |
| | Government & Agency Securities–5.7% | | | |
| | | | | | Federal Home Loan Bank–2.8% | | | |
| $ | 1,000,000 | | | | 6.210%, 6/2/2009 | | $ | 1,025,010 |
| | 1,000,000 | | | | 4.375%, 10/22/2010 | | | 1,034,239 |
| | 500,000 | | | | 3.625%, 5/29/2013 | | | 509,350 |
| | 1,000,000 | | | | 4.750%, 1/19/2016 | | | 1,056,584 |
| | | | | | | |
|
|
| | | | | | Total Federal Home Loan Bank | | | 3,625,183 |
| | | | | | | |
|
|
| | | | | | Federal National Mortgage Association–2.9% |
| | 1,500,000 | | (2) | | 4.250%, 8/15/2010 | | | 1,551,678 |
| | 1,000,000 | | (2) | | 5.000%, 10/15/2011 | | | 1,057,898 |
| | 1,000,000 | | | | 4.625%, 10/15/2013 | | | 1,070,790 |
| | | | | | | |
|
|
| | | | | | Total Federal National Mortgage Association | | | 3,680,366 |
| | | | | | | |
|
|
| | | | | | Total Government and Agency Securities
(identified cost $6,987,159) | | | 7,305,549 |
| | | | | | | |
|
|
| | Mortgage-Backed Securities–3.6% | | | |
| | | | | | Government National Mortgage Association–3.6% | | | |
| | 550,107 | | | | 5.000%, 2/15/2018 | | | 568,206 |
| | 620,816 | | | | 5.000%, 2/15/2018 | | | 641,240 |
| | 622,315 | | | | 5.000%, 3/15/2018 | | | 642,789 |
| | 641,155 | | | | 5.000%, 5/15/2018 | | | 662,249 |
| | 944,287 | | | | 5.000%, 6/15/2019 | | | 973,881 |
| | 1,014,793 | | | | 5.000%, 8/15/2019 | | | 1,046,597 |
| | | | | | | |
|
|
| | | | | | Total Mortgage-Backed Securities (identified cost $4,496,295) | | | 4,534,962 |
| | | | | | | |
|
|
| | U.S. Treasury Obligations–7.9% | | | |
| | | | | | U.S. Treasury Notes–7.9% | | | |
| | 1,000,000 | | (2) | | 3.500%, 12/15/2009 | | | 1,028,438 |
| | 1,000,000 | | (2) | | 4.500%, 11/30/2011 | | | 1,093,594 |
| | 1,000,000 | | (2) | | 4.375%, 8/15/2012 | | | 1,119,141 |
| | 4,000,000 | | (2) | | 4.875%, 8/15/2016 | | | 4,599,064 |
| | 2,000,000 | | (2) | | 4.625%, 2/15/2017 | | | 2,261,406 |
| | | | | | | |
|
|
| | | | | | Total U.S. Treasury Obligations (identified cost $9,051,988) | | | 10,101,643 |
| | | | | | | |
|
|
| | | |
| Shares | | | | | | |
| | Exchange Traded Funds–3.7% | | | |
| | 200,000 | | | | Financial Select Sector SPDR | | | 2,522,000 |
| | 12,000 | | (2) | | iShares MSCI EAFE Index | | | 500,040 |
| | 160,000 | | (1) | | iShares Silver Trust | | | 1,636,800 |
| | | | | | | |
|
|
| | | | | | Total Exchange Traded Funds (identified cost $4,855,589) | | | 4,658,840 |
| | | | | | | |
|
|
| | Short-Term Investments–12.5% | | | |
| | 11,996,133 | | | | Bank of New York Institutional Cash Reserves Fund (held as collateral for securities lending) | | | 11,930,049 |
| | 2,002,310 | | | | Fidelity Institutional Money Market Fund | | | 2,002,310 |
The Notes to the Financial Statements are an integral part of, and should be read in conjunction with, the Financial Statements.
44
REGIONS MORGAN KEEGAN SELECT BALANCED FUND
PORTFOLIOOF INVESTMENTS
NOVEMBER 30, 2008
| | | | | | | | | |
| | | |
| Shares | | | | | | Value | |
| | Short-Term Investments (continued) | | | | |
| | 2,002,310 | | | | Lehman Brothers Prime Money Market Fund | | $ | 2,002,310 | |
| | | | | | | |
|
|
|
| | | | | | Total Short-Term Investments (identified cost $16,000,753) | | | 15,934,669 | |
| | | | | | | |
|
|
|
| | | |
Principal Amount | | | | | | Value | |
| | Certificates of Deposit–0.8% | | | | |
| $ | 996,827 | | | | Bank of Ireland, 1.539%, 2/12/2009 (held as collateral for securities lending) | | | 996,827 | |
| | | | | | | |
|
|
|
| | | | | | Total Certificates of Deposit (identified cost $996,827) | | | 996,827 | |
| | | | | | | |
|
|
|
| | | | | | Total Investments–109.4% (identified cost $140,796,374) | | | 139,804,664 | |
| | | | | | | |
|
|
|
| | | | | | Other Assets and Liabilities–net–(9.4%) | | | (12,054,071 | ) |
| | | | | | | |
|
|
|
| | | | | | Total Net Assets–100.0% | | $ | 127,750,593 | |
| | | | | | | |
|
|
|
| | Call Options Written November 30, 2008 | | | | |
| | | |
Number of
Contracts
| | | | Common Stocks/Expiration
Date/Exercise Price
| | | |
| | 200 | | | | Exxon Mobil Corp. / January / 90 | | | (34,000 | ) |
| | 50 | | | | Genzyme Corp. / January / 90 | | | (1,250 | ) |
|
| | | | | |
|
|
|
| | 250 | | | | Total Call Options Written
(Premiums Received $48,470) | | | (35,250 | ) |
|
| | | | | |
|
|
|
| (1) | | Non-income producing security. |
| (2) | | Certain shares are temporarily on loan to unaffiliated broker-dealers. See Notes 2 and 5 of the Financial Statements for additional information about securities lending. |
Note: The categories of investments are shown as a percentage of total net assets at November 30, 2008.
The Notes to the Financial Statements are an integral part of, and should be read in conjunction with, the Financial Statements.
45
REGIONS MORGAN KEEGAN SELECT FIXED INCOME FUND
OBJECTIVE & STRATEGY
Regions Morgan Keegan Select Fixed Income Fund seeks current income with capital appreciation as a secondary objective. The Fund invests a majority of its total assets in investment-grade debt securities, including debt securities of the U.S. Treasury and government agencies, mortgage-backed and asset-backed securities, and corporate bonds. The Fund may invest up to 10% of its total assets in below investment grade debt securities. The debt securities purchased by the Fund will be rated, at the time of investment, at least CCC (or a comparable rating) by at least one nationally recognized statistical rating organization or, if unrated, determined by the Fund’s adviser to be of comparable quality.
INVESTMENT RISKS: Investors in any bond fund should anticipate fluctuations in price. Bond prices and the value of bond funds decline as interest rates rise. Bonds with longer-term maturities generally are more vulnerable to interest rate risk than bonds with shorter-term maturities. Below investment grade debt securities are considered speculative with respect to an issuer’s capacity to pay interest and repay principal and are susceptible to default or decline in market value due to adverse economic and business developments. An economic downturn or period of rising interest rates could adversely affect the ability of issuers, especially issuers of below investment grade debt, to service primary obligations and an unanticipated default could cause the Fund to experience a reduction in value of its shares. The net asset value per share of the Fund will fluctuate as the value of the securities in the portfolio changes.
MANAGEMENT DISCUSSIONOF FUND PERFORMANCE
The sluggish economic growth that characterized the first half of the Fund’s fiscal year gave way to a full blown recession as 2008 drew to a close. Declining home prices, delinquencies and foreclosures forced banks to tighten credit standards and slow lending. Faced with declining home prices, falling equity prices, rising unemployment and slowing global growth, consumer confidence dropped sharply. The result has been a decline in consumer spending that has spread to businesses as they cut jobs and reduce capital spending plans. On almost all fronts, incoming data suggest the recession will be deeper and longer than many thought a few months ago. After growing over 3.0% during the first half of the year, GDP declined 0.5% in the third quarter with a sharper decline expected in the last quarter.
After a modest total return of 0.25% during the first half of the year, the Regions Morgan Keegan Select Fixed Income Fund’s Class A Shares total return was –5.66% for the six months ended November 30, 2008. The result was a total return for the year of –5.42%. This compares with the Fund’s benchmark return of 3.04% for the Merrill Lynch U.S. Corporate/Government/Mortgage Index(1). The underperformance of the Fund relative to the index was the result two factors. First, investor flight to quality has favored U.S. Treasury securities, a sector which we have underweighted. Second, the Fund retains a small position in non-agency mortgage securities. Despite the still solid credit characteristics of these mortgage bonds, most are rated AAA, prices have been adversely affected by a decline in mortgage market fundamentals and insufficient market liquidity.
Looking into the coming year, we expect the economic environment to remain challenging as the housing market seeks to stabilize and rising unemployment further dampens consumer demand. While this recession looks to be deeper and perhaps longer than other post-war downturns, we feel the economy will rebound in the second half of 2009. The Administration, Congress, and the Federal Reserve have been very aggressive with a combination of monetary and fiscal policy stimulus. While some of this stimulus has already been felt, much has yet to work its way through the economy. Additional policy actions by the Federal Reserve and the Obama Administration to stoke the economic engine are expected over the next several months. We believe the Fund is currently positioned to benefit in the coming year. The Fund remains underweight in the Treasury sector. The Fund is overweight high quality corporate and U.S. agency mortgages, the areas we expect to lead performance in 2009.
| | |
 | |  |
Scott M. Flurry, CFA Senior Portfolio Manager Morgan Asset Management, Inc. | | William C. Rice, CFA Senior Portfolio Manager Morgan Asset Management, Inc. |
(Unaudited)
46
REGIONS MORGAN KEEGAN SELECT FIXED INCOME FUND
Market forecasts provided in this report may not necessarily come to pass. There is no assurance that the Fund will achieve its investment objectives. These views are subject to change at any time based upon market or other conditions, and Morgan Asset Management, Inc. disclaims any responsibility to update such views. The Fund is subject to market risk, which is the possibility that the market values of securities owned by the Fund will decline and, therefore, the value of the Fund’s shares may be less than what you paid for them. Accordingly, you can lose money investing in the Fund.
PORTFOLIO STATISTICS†
AS OF NOVEMBER 30, 2008
| | |
| | | |
Average Credit Quality | | AA+ |
Current Yield | | 5.93% |
Yield to Maturity | | 7.93% |
Duration | | 4.8 Years |
Average Effective Maturity | | 5.5 Years |
Total Number of Holdings | | 51 |
| | | |
| † | | The Fund’s composition is subject to change. |
ASSET ALLOCATION†
AS OF NOVEMBER 30, 2008
| | |
%OFTOTALINVESTMENTS EXCLUDINGCOLLATERALFORSECURITIESLENDING |
Government & Agency Securities | | 42.3% |
Corporate Bonds | | 28.2% |
Mortgage-Backed Securities | | 18.5% |
U. S. Treasury Obligations | | 9.0% |
Short-Term Investments | | 2.0% |
| | |
|
Total | | 100.0% |
CREDIT QUALITY†
AS OF NOVEMBER 30, 2008
| | | | | | |
| %OFTOTALINVESTMENTS | | %OFTOTALINVESTMENTS |
AAA | | 12.0% | | BB | | 0.1% |
AA | | 12.8% | | Agency | | 46.9% |
A | | 14.5% | | Treasury | | 8.9% |
BBB | | 3.0% | | Cash | | 1.8% |
| | | | | | |
|
| | | | | Total | | 100.0% |
| † | | The Fund’s composition is subject to change. |
INDEX DESCRIPTION
(1) | | The Merrill Lynch U.S. Corporate/Government/Mortgage Index is composed of U.S. dollar denominated SEC-registered investment grade public corporate and government debt. Treasuries, mortgage-backed securities, global bonds (debt issued simultaneously in the Eurobond and U.S. domestic bond markets) and some Yankee Bonds (debt of foreign issuers issued in the U.S. domestic market) are included in the Merrill Lynch U.S. Corporate/Government/Mortgage Index. The index is unmanaged, and unlike the Fund, is not affected by cash flows or trading and other expenses. It is not possible to invest directly in an index. |
(Unaudited)
47
REGIONS MORGAN KEEGAN SELECT FIXED INCOME FUND
GROWTHOFA $10,000 INVESTMENT
CLASS A SHARES
The graph below illustrates a hypothetical investment of $10,000 in Regions Morgan Keegan Select Fixed Income Fund—Class A Shares(1) from November 30, 1998 to November 30, 2008 compared to the Merrill Lynch U.S. Corporate/Government/Mortgage Index(2) a broad-based market index.
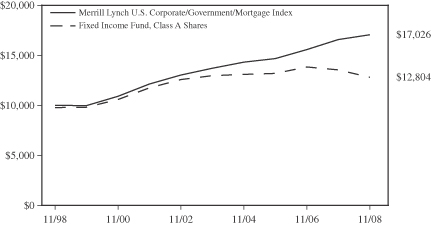
GROWTHOFA $10,000 INVESTMENT
CLASS C SHARES
The graph below illustrates a hypothetical investment of $10,000 in Regions Morgan Keegan Select Fixed Income Fund—Class C Shares from the commencement of investment operations on December 3, 2001 to November 30, 2008 compared to the Merrill Lynch U.S. Corporate/Government/Mortgage Index(2) a broad-based market index.
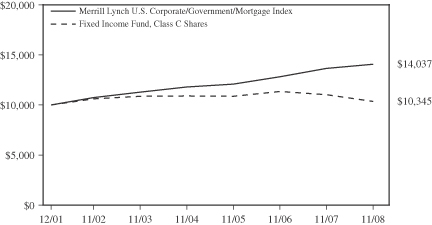
(Unaudited)
48
REGIONS MORGAN KEEGAN SELECT FIXED INCOME FUND
GROWTHOFA $10,000 INVESTMENT
CLASS I SHARES
The graph below illustrates a hypothetical investment of $10,000 in Regions Morgan Keegan Select Fixed Income Fund—Class I Shares from the commencement of investment operations on August 14, 2005 to November 30, 2008 compared to the Merrill Lynch U.S. Corporate/Government/Mortgage Index(2) a broad-based market index.
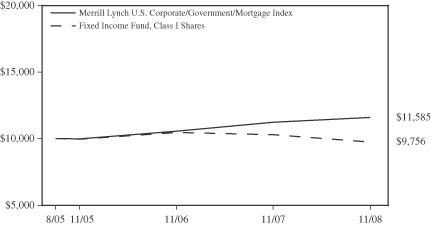
PERFORMANCE INFORMATION
| | | | | | | | | | | | | | | |
| | | AVERAGE ANNUAL TOTAL RETURNS | |
| AS OF NOVEMBER 30, 2008 | | SIX
MONTHS* | | | 1 YEAR | | | 5 YEAR | | | 10 YEAR | | | COMMENCEMENT
OF INVESTMENT
OPERATIONS(3) | |
| CLASS A SHARES**(1) | | -7.55 | % | | -7.31 | % | | -0.64 | % | | 2.50 | % | | 4.25 | % |
(EXCLUDINGSALESLOAD)(1) | | -5.66 | % | | -5.42 | % | | -0.24 | % | | 2.71 | % | | 4.37 | % |
| CLASS C SHARES*** | | -6.95 | % | | -7.16 | % | | -0.98 | % | | N/A | | | 0.49 | % |
(EXCLUDINGCDSC) | | -6.01 | % | | -6.22 | % | | -0.98 | % | | N/A | | | 0.49 | % |
| CLASS I SHARES | | -5.54 | % | | -5.18 | % | | N/A | | | N/A | | | -0.74 | % |
| MERRILL LYNCH U.S. CORPORATE/GOVERNMENT/MORTGAGE INDEX(2) | | 1.67 | % | | 3.04 | % | | 4.45 | % | | 5.46 | % | | — | |
| * | | Not annualized for periods less than one year. |
| ** | | Reflects the maximum sales load of 2.00%. |
| *** | | Reflects the maximum contingent deferred sales charge (CDSC) of 1.00% for shares redeemed within one year of purchase. |
(1) | | Effective June 4, 2004, all Class B Shares of the Fund converted to Class A Shares. Historical total return information for any period or portion thereof prior to the commencement of investment operations of Class A Shares on May 20, 1998 is that of Class B Shares and reflects all charges, expenses and fees incurred by Class B Shares, which were generally higher than the expenses of Class A Shares, during such periods. |
(2) | | The Merrill Lynch U.S. Corporate/Government/Mortgage Index is composed of U.S. dollar denominated SEC-registered investment grade public corporate and government debt. Treasuries, mortgage-backed securities, global bonds (debt issued simultaneously in the Eurobond and U.S. domestic bond markets) and some Yankee Bonds (debt of foreign issuers issued in the U.S. domestic market) are included in the Merrill Lynch U.S. Corporate/Government/Mortgage Index. Total returns for the index shown are not adjusted to reflect taxes, sales charges, expenses or other fees that the Securities and Exchange Commission requires to be reflected in the Fund’s performance. The index is unmanaged, and unlike the Fund, is not affected by cash flows or trading and other expenses. It is not possible to invest directly in an index. |
(3) | | The Fund’s Class A Shares (including predecessor Class B Shares), Class C Shares and Class I Shares commenced investment operations on April 20, 1992, December 3, 2001 and August 14, 2005, respectively. |
Performance data quoted represents past performance, which is no guarantee of future results. Investment return and principal value will fluctuate so that an investor’s shares, when redeemed, may be worth more or less than their original cost. Fund performance changes over time and current performance may be lower or higher than what is stated. For the most recent performance, call toll-free 877-757-7424. The Fund’s performance results are shown on a total return basis and include the reinvestment of all dividends and capital gain distributions in the Fund. Returns shown in the chart and table above do not reflect the deduction of taxes that a shareholder would pay on Fund distributions or the redemption of Fund shares. Mutual funds are not bank deposits or obligations, are not guaranteed by any bank and are not insured or guaranteed by the U.S. government, the Federal Deposit Insurance Corporation, the Federal Reserve Board or any other government agency. Investment in mutual funds involves investment risk, including possible loss of principal.
(Unaudited)
49
REGIONS MORGAN KEEGAN SELECT FIXED INCOME FUND
PORTFOLIOOF INVESTMENTS
NOVEMBER 30, 2008
| | | | | | | | |
Principal Amount | | | | | | Value |
| | Corporate Bonds–28.1% |
| | | |
| | | | | | Energy–1.6% | | | |
| | | | | | Oil & Gas–1.6% | | | |
| $ | 2,000,000 | | | | Atlantic Richfield Co, 5.900% 4/15/2009 | | $ | 2,017,074 |
| | | | | | | |
|
|
| | | | | | Total Energy | | | 2,017,074 |
| | | | | | | |
|
|
| | | |
| | | | | | Financials–15.5% | | | |
| | | | | | Commercial Banks–6.6% | | | |
| | 3,000,000 | | | | Bank of America Corp, 7.800% 2/15/2010 | | | 3,040,659 |
| | 2,000,000 | | | | JPMorgan Chase & Co, 7.000% 11/15/2009 | | | 2,000,672 |
| | 1,500,000 | | | | Northern Trust Co/The, 7.100% 8/1/2009 | | | 1,514,101 |
| | 2,000,000 | | | | Wachovia Corp, 5.750% 6/15/17 | | | 1,806,772 |
| | | | | | | |
|
|
| | | | | | Total | | | 8,362,204 |
| | | | | | | |
|
|
| | | | | | Consumer Finance–3.5% | | | |
| | 4,750,000 | | | | American General Finance Corp, 4.625% 9/1/2010 | | | 2,407,215 |
| | 2,000,000 | | | | BP Capital Markets PLC, 5.250% 11/7/2013 | | | 2,006,280 |
| | | | | | | |
|
|
| | | | | | | | | 4,413,495 |
| | | | | | | |
|
|
| | | | | | Diversified Telecommunication Services–1.6% |
| | 1,200,000 | | | | AT&T Inc, 5.600% 5/15/2018 | | | 1,039,183 |
| | 1,000,000 | | | | Bellsouth Capital Funding Corp, 7.750% 2/15/2010 | | | 1,017,370 |
| | | | | | | |
|
|
| | | | | | Total | | | 2,056,553 |
| | | | | | | |
|
|
| | | | | | Investment Services–2.5% | | | |
| | 2,000,000 | | | | Goldman Sachs Group Inc/The, 5.500% 11/15/2014 | | | 1,650,378 |
| | 2,000,000 | | | | Merrill Lynch & Co Inc, 6.110% 1/29/2037 | | | 1,449,878 |
| | | | | | | |
|
|
| | | | | | Total | | | 3,100,256 |
| | | | | | | |
|
|
| | | | | | Property/Casualty Insurance–1.3% | | | |
| | 2,000,000 | | | | Travelers Cos Inc/The, 6.250% 6/15/2037 | | | 1,586,862 |
| | | | | | | |
|
|
| | | | | | Total Financials | | | 19,519,370 |
| | | | | | | |
|
|
| | | |
| | | | | | Industrials–7.6% | | | |
| | | | | | Beverages–0.9% | | | |
| | 1,000,000 | | | | PepsiCo Inc/NC, 7.900% 11/1/2018 | | | 1,115,839 |
| | | | | | Diversified Machinery–1.0% | | | |
| | 1,400,000 | | | | Ingersoll-Rand Global Holding Co Ltd, 6.875% 8/15/2018 | | | 1,280,791 |
| | | | | | Food–2.0% | | | |
| | 2,500,000 | | | | Kellogg Co, 5.125% 12/3/2012 | | | 2,458,843 |
| | | | | | Retail–3.7% | | | |
| | 1,200,000 | | | | McDonald's Corp, 5.350% 3/1/2018 | | | 1,173,396 |
| | 2,000,000 | | | | Target Corp, 5.375% 5/1/2017 | | | 1,645,204 |
| | 2,000,000 | | | | Wal-Mart Stores Inc, 5.875% 4/5/2027 | | | 1,870,340 |
| | | | | | | |
|
|
| | | | | | Total | | | 4,688,940 |
| | | | | | | |
|
|
| | | | | | Total Industrials | | | 9,544,413 |
| | | | | | | |
|
|
| | | | | | | | |
Principal Amount | | | | | | Value |
| | Corporate Bonds (continued) |
| | | |
| | | | | | Technology–2.6% | | | |
| | | | | | Computers–1.3% | | | |
| $ | 1,700,000 | | | | Hewlett-Packard Co, 4.500% 3/1/2013 | | $ | 1,645,649 |
| | | | | | Software–1.3% | | | |
| | 1,800,000 | | | | Oracle Corp, 5.750% 4/15/2018 | | | 1,687,036 |
| | | | | | | |
|
|
| | | | | | Total Technology | | | 3,332,685 |
| | | | | | | |
|
|
| | | |
| | | | | | Utility–0.8% | | | |
| | | | | | Electric–0.8% | | | |
| | 1,000,000 | | | | Alabama Power Co, 4.850% 12/15/2012 | | | 980,212 |
| | | | | | | |
|
|
| | | | | | Total Utility | | | 980,212 |
| | | | | | | |
|
|
| | | | | | Total Corporate Bonds
(identified cost $40,169,599) | | | 35,393,754 |
| | | | | | | |
|
|
| | Government & Agency Securities–42.1% | | | |
| | | | | | Federal Home Loan Bank–1.5% | | | |
| | 1,000,000 | | | | 7.375% 2/12/2010 | | | 1,062,698 |
| | 800,000 | | | | 4.000% 3/30/2012 | | | 825,993 |
| | | | | | | |
|
|
| | | | | | Total | | | 1,888,691 |
| | | | | | | |
|
|
| | | | | | Federal Home Loan Mortgage Corporation–17.0% (2) | | | |
| | 3,000,000 | | | | 5.750% 1/15/2012 | | | 3,233,226 |
| | 3,000,000 | | | | 5.000% 4/15/2025 | | | 3,010,566 |
| | 7,000,000 | | | | 5.000% 6/15/2033 | | | 6,874,007 |
| | 8,118,408 | | | | 6.000% 7/1/2037 | | | 8,298,474 |
| | | | | | | |
|
|
| | | | | | Total | | | 21,416,273 |
| | | | | | | |
|
|
| | | | | | Federal National Mortgage Association–23.6% (2) | | | |
| | 2,338,112 | | | | 5.000% 1/1/2020 | | | 2,376,317 |
| | 2,700,000 | | | | 5.000% 3/25/2024 | | | 2,646,672 |
| | 7,000,000 | | | | 5.000% 7/25/2033 | | | 6,885,144 |
| | 12,481,060 | | | | 5.500% 7/1/2034 | | | 12,707,092 |
| | 5,024,094 | | | | 6.000% 4/1/2036 | | | 5,135,529 |
| | | | | | | |
|
|
| | | | | | Total | | | 29,750,754 |
| | | | | | | |
|
|
| | | | | | Total Government & Agency Securities
(identified cost $52,474,956) | | | 53,055,718 |
| | | | | | | |
|
|
| | Mortgage-Backed Securities–18.4% | | | |
| | | | | | Government National Mortgage Association–4.7% |
| | 1,217,629 | | | | 5.500% 10/15/2017 | | | 1,262,852 |
| | 888,603 | | | | 5.500% 2/15/2018 | | | 920,913 |
| | 995,862 | | | | 5.500% 2/15/2018 | | | 1,032,072 |
| | 1,241,062 | | | | 5.500% 9/15/2019 | | | 1,285,219 |
| | 1,422,782 | | | | 5.500% 11/15/2019 | | | 1,473,405 |
| | | | | | | |
|
|
| | | | | | Total | | | 5,974,461 |
| | | | | | | |
|
|
| | | | | | Collateralized Mortgage Obligations–13.7% |
| | 7,000,000 | | | | Countrywide Alternative Loan Trust 2005-6CB, 5.500% 4/25/2035 | | | 5,378,786 |
| | 813,255 | | | | Downey Savings & Loan 2004-AR3 2A 2A, 1.844% 7/19/2044 | | | 515,916 |
| | 2,239,775 | | | | GSR Mortgage Loan Trust 2004-7 2A1, 4.144% 6/25/2034 | | | 2,131,479 |
The Notes to the Financial Statements are an integral part of, and should be read in conjunction with, the Financial Statements.
50
REGIONS MORGAN KEEGAN SELECT FIXED INCOME FUND
PORTFOLIOOF INVESTMENTS
NOVEMBER 30, 2008
| | | | | | | | |
Principal Amount | | | | | | Value |
| | Mortgage-Backed Securities (continued) | | | |
| $ | 4,980,758 | | | | JP Morgan Mortgage Trust 2005-A1 3A3, 4.900% 2/25/2035 | | $ | 3,767,590 |
| | 3,499,178 | | | | Master Mortgage 2005-1 9A1, 5.194% 1/25/2035 | | | 2,310,619 |
| | 1,859,919 | | | | Merrill Lynch 2005-A1 2A1, 4.538% 12/25/2034 | | | 1,090,050 |
| | 500,000 | | | | Residential Funding Mortgage 2004-S9, 5.500% 12/25/2034 | | | 454,695 |
| | 4,217,340 | | | | Structured Mortgage 2005-1 5A2, 5.164% 2/25/2035 | | | 1,420,889 |
| | 1,000,000 | | | | Structured Adjustable Rate Mortgage 2006-3 3A2, 5.750% 4/25/2036 | | | 154,894 |
| | | | | | | |
|
|
| | | | | | Total | | | 17,224,918 |
| | | | | | | |
|
|
| | | | | | Total Mortgage-Backed Securities (identified cost $32,165,038) | | | 23,199,379 |
| | | | | | | |
|
|
| | U.S. Treasury Obligations–8.9% | | | |
| | | | | | U.S. Treasury Notes–8.9% | | | |
| | 2,000,000 | | | | 4.500% 3/31/2012 | | | 2,210,624 |
| | 3,000,000 | | (1) | | 4.750% 5/15/2014 | | | 3,438,516 |
| | 1,500,000 | | (1) | | 4.125% 5/15/2015 | | | 1,665,936 |
| | 2,500,000 | | (1) | | 4.250% 8/15/2015 | | | 2,804,297 |
| | 1,000,000 | | (1) | | 4.500% 2/15/2016 | | | 1,138,750 |
| | | | | | | |
|
|
| | | | | | Total U.S. Treasury Notes
(identified cost $10,116,494) | | $ | 11,258,123 |
| | | | | | | |
|
|
| | | | | | | | |
| | | |
| Shares | | | | | | Value | |
| Short–Term Investments–8.8% | | | | |
| 8,564,259 | | | | Bank of New York Institutional Cash Reserves Fund (held as collateral for securities lending) | | $ | 8,523,048 | |
| 1,248,416 | | | | Federated U.S. Treasury Cash Reserve Fund | | | 1,248,416 | |
| 1,248,415 | | | | Fidelity Institutional Money Market Fund | | | 1,248,415 | |
| | | | | | |
|
|
|
| | | | | Total Short-Term Investments (identified cost $11,061,090) | | | 11,019,879 | |
| | | | | | |
|
|
|
| | | | | Total Investments–106.3%
(identified cost $145,987,177) | | | 133,926,853 | |
| | | | | | |
|
|
|
| | | | | Other Assets and Liabilities–
net–(6.3)% | | | (7,922,243 | ) |
| | | | | | |
|
|
|
| | | | | Total Net Assets–100.0% | | $ | 126,004,610 | |
| | | | | | |
|
|
|
| (1) | | Certain principal amounts are temporarily on loan to unaffiliated broker-dealers. See Notes 2 and 5 of the Financial Statements for additional information about securities lending. |
| (2) | | The issuer is a publicly-traded company that operates under a congressional charter. |
Note: The categories of investments are shown as a percentage of total net assets at November 30, 2008.
The Notes to the Financial Statements are an integral part of, and should be read in conjunction with, the Financial Statements.
51
REGIONS MORGAN KEEGAN SELECT
LIMITED MATURITY FIXED INCOME FUND
OBJECTIVE & STRATEGY
Regions Morgan Keegan Select Limited Maturity Fixed Income Fund seeks current income. The Fund invests a majority of its total assets in investment-grade debt securities, including debt securities of the U.S. Treasury and government agencies, mortgage-backed and asset-backed securities, and corporate bonds. The Fund may invest up to 10% of its total assets in below investment grade debt securities. The debt securities purchased by the Fund will be rated, at the time of investment, at least CCC (or a comparable rating) by at least one nationally recognized statistical rating organization or, if unrated, determined by the Fund’s adviser to be of comparable quality.
INVESTMENT RISKS: Investors in any bond fund should anticipate fluctuations in price. Bond prices and the value of bond funds decline as interest rates rise. Bonds with longer-term maturities generally are more vulnerable to interest rate risk than bonds with shorter-term maturities. Below investment grade debt securities are considered speculative with respect to an issuer’s capacity to pay interest and repay principal and are susceptible to default or decline in market value due to adverse economic and business developments. An economic downturn or period of rising interest rates could adversely affect the ability of issuers, especially issuers of below investment grade debt, to service primary obligations and an unanticipated default could cause the Fund to experience a reduction in value of its shares. The net asset value per share of the Fund will fluctuate as the value of the securities in the portfolio changes.
MANAGEMENT DISCUSSIONOF FUND PERFORMANCE
For the fiscal year ended November 30, 2008, Regions Morgan Keegan Select Limited Maturity Fixed Income Fund’s Class A Shares had a total return of –7.01%, based on net asset value. During the same period, the Merrill Lynch 1-3 Year Government/Corporate A Rated and Above Index(1) had a total return of 4.30%.
The market events and the deteriorating economic data throughout 2008 created turmoil in the financial markets. As a result, investor confidence fell to extremely low levels. Investors continued to choose U.S. Treasury securities over other sectors in the fixed income market. Thus, U.S. Treasuries outperformed other sectors, such as non-agency mortgages and corporate bonds. Credit characteristics of many investment grade securities became secondary, as prices suffered from a decline in overall market fundamentals and little market liquidity.
We expect that economic conditions will struggle to improve over the next year, as the credit markets seek liquidity and rising unemployment weakens consumer demand. The fiscal and monetary policies that have been passed should serve as a stimulus to the economy as these policies are implemented. Going forward, we believe the Fund is properly structured heading into the coming year, as it is underweight the Treasury sector and has a duration short to that of its benchmark. Furthermore, the Fund is overweight the Corporate sector and has a AAA average quality rating.
| | |
| |  |
Scott M. Flurry, CFA Senior Portfolio Manager Morgan Asset Management, Inc. | | George R. McCurdy IV, CFA Portfolio Manager Morgan Asset Management, Inc. |
Market forecasts provided in this report may not necessarily come to pass. There is no assurance that the Fund will achieve its investment objectives. These views are subject to change at any time based upon market or other conditions, and Morgan Asset Management, Inc. disclaims any responsibility to update such views. The Fund is subject to market risk, which is the possibility that the market values of securities owned by the Fund will decline and, therefore, the value of the Fund’s shares may be less than what you paid for them. Accordingly, you can lose money investing in the Fund.
(Unaudited)
52
REGIONS MORGAN KEEGAN SELECT
LIMITED MATURITY FIXED INCOME FUND
PORTFOLIO STATISTICS†
AS OF NOVEMBER 30, 2008
| | |
| | | |
Average Credit Quality | | AAA |
Current Yield | | 4.03% |
Yield to Maturity | | 3.06% |
Duration | | 0.82 Years |
Average Effective Maturity | | 1.47 Years |
Total Number of Holdings | | 15 |
| † | | The Fund’s composition is subject to change. |
ASSET ALLOCATION†
AS OF NOVEMBER 30, 2008
| | |
%OFTOTALINVESTMENTS EXCLUDINGCOLLATERALFORSECURITIESLENDING |
U. S. Treasury Obligations | | 47.1% |
Mortgage-Backed Securities | | 18.4% |
Government & Agency Securities | | 13.9% |
Corporate Bonds | | 13.6% |
Short-Term Investments | | 7.0% |
| | |
|
Total | | 100.0% |
CREDIT QUALITY†
AS OF NOVEMBER 30, 2008
| | | | | | |
| %OFTOTALINVESTMENTS | | %OFTOTALINVESTMENTS |
AAA | | 18.3% | | Agency . | | 13.9% |
A | | 11.4% | | Treasury | | 47.3% |
BBB | | 2.2% | | Cash | | 6.9% |
| | | | | | |
|
| | | | | Total | | 100.0% |
| † | | The Fund’s composition is subject to change. |
INDEX DESCRIPTIONS
(1) | | The Merrill Lynch 1-3 Year Government/Corporate A Rated and Above Index is an unmanaged index composed of U.S. government and U.S. dollar denominated SEC registered corporate bonds with an investment grade rating of “A” or higher. Issuers have a maturity of between 1 and 3 years. The index is unmanaged, and unlike the Fund, is not affected by cash flows or trading and other expenses. It is not possible to invest directly in an index. |
(Unaudited)
53
REGIONS MORGAN KEEGAN SELECT
LIMITED MATURITY FIXED INCOME FUND
GROWTHOFA $10,000 INVESTMENT
CLASS A SHARES
The graph below illustrates a hypothetical investment of $10,000 in Regions Morgan Keegan Select Limited Maturity Fixed Income Fund—Class A Shares(2) from November 30, 1998 to November 30, 2008(1) compared to the Merrill Lynch 1-3 Year Government/Corporate A Rated and Above Index(3), a broad-based market index.
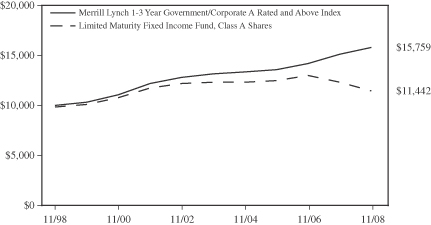
GROWTHOFA $10,000 INVESTMENT
CLASS C SHARES
The graph below illustrates a hypothetical investment of $10,000 in Regions Morgan Keegan Select Limited Maturity Fixed Income Fund—Class C Shares from the commencement of investment operations on December 14, 2001 to November 30, 2008(1) compared to the Merrill Lynch 1-3 Year Government/Corporate A Rated and Above Index(3), a broad-based market index.
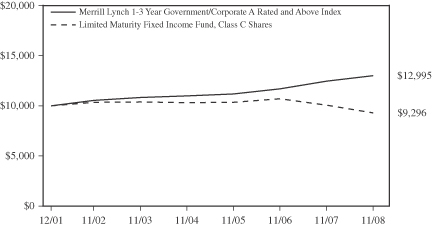
(Unaudited)
54
REGIONS MORGAN KEEGAN SELECT
LIMITED MATURITY FIXED INCOME FUND
GROWTHOFA $10,000 INVESTMENT
CLASS I SHARES
The graph below illustrates a hypothetical investment of $10,000 in Regions Morgan Keegan Select Limited Maturity Fixed Income Fund—Class I Shares from the commencement of investment operations on September 1, 2005 to November 30, 2008(1) compared to the Merrill Lynch 1-3 Year Government/Corporate A Rated and Above Index(3), a broad-based market index.
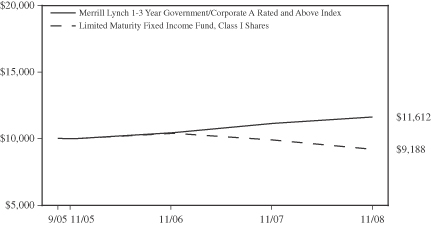
PERFORMANCE INFORMATION
| | | | | | | | | | | | | | | |
| | | AVERAGE ANNUAL TOTAL RETURNS | |
| AS OF NOVEMBER 30, 2008(1) | | SIX
MONTHS* | | | 1 YEAR | | | 5 YEAR | | | 10 YEAR | | | COMMENCEMENT
OF INVESTMENT
OPERATIONS(4) | |
| CLASS A SHARES**(2) | | -4.60 | % | | -8.41 | % | | -1.77 | % | | 1.36 | % | | 2.57 | % |
(EXCLUDINGSALESLOAD)(2) | | -3.15 | % | | -7.01 | % | | -1.47 | % | | 1.51 | % | | 2.68 | % |
| CLASS C SHARES*** | | -4.48 | % | | -8.63 | % | | -2.21 | % | | N/A | | | -1.04 | % |
(EXCLUDINGCDSC) | | -3.51 | % | | -7.71 | % | | -2.21 | % | | N/A | | | -1.04 | % |
| CLASS I SHARES | | -3.09 | % | | -7.08 | % | | N/A | | | N/A | | | -2.57 | % |
| MERRILL LYNCH 1-3 YEAR GOVERNMENT/CORPORATE A RATEDAND ABOVE INDEX(3) | | 2.15 | % | | 4.30 | % | | 3.72 | % | | 4.66 | % | | — | |
| * | | Not annualized for periods less than one year. |
| ** | | Reflects the maximum sales load of 1.50%. |
| *** | | Reflects the maximum contingent deferred sales charge (CDSC) of 1.00% for shares redeemed within one year of purchase. |
(1) | | Effective April 1, 2008, the Fund’s adviser voluntarily agreed to waive fees and reimburse expenses to the extent that the Fund’s total annual operating expenses (excluding brokerage, interest, taxes, and extraordinary expenses) exceed 1.00%, 1.75% and 0.75% of net assets of Class A Shares, Class C Shares and Class I Shares, respectively, on an annualized basis for the period that the voluntary waiver is in effect. The Fund’s adviser will evaluate the continuance of this voluntary waiver at each month-end and it can terminate this voluntary waiver at any time. If not for this waiver, performance would have been lower. |
(2) | | Effective June 4, 2004, all Class B Shares of the Fund converted to Class A Shares. Historical total return information for any period or portion thereof prior to the commencement of investment operations of Class A Shares on May 20, 1998 is that of Class B Shares and reflects all charges, expenses and fees incurred by Class B Shares, which were generally higher than the expenses of Class A Shares, during such periods. |
(3) | | The Merrill Lynch 1-3 Year Government/Corporate A Rated and Above Index is an unmanaged index composed of U.S. government and U.S. dollar denominated SEC registered corporate bonds with an investment grade rating of “A” or higher. Issuers have a maturity of between 1 and 3 years. Total returns for the index shown are not adjusted to reflect taxes, sales charges, expenses or other fees that the SEC requires to be reflected in the Fund’s performance. The index is unmanaged, and unlike the Fund, is not affected by cash flows or trading and other expenses. It is not possible to invest directly in an index. |
(4) | | The Fund’s Class A Shares (including predecessor Class B Shares), Class C Shares and Class I Shares commenced investment operations on December 12, 1993, December 14, 2001 and September 1, 2005, respectively. |
Performance data quoted represents past performance, which is no guarantee of future results. Investment return and principal value will fluctuate so that an investor’s shares, when redeemed, may be worth more or less than their original cost. Fund performance changes over time and current performance may be lower or higher than what is stated. For the most recent performance, call toll-free 877-757-7424. The Fund’s performance results are shown on a total return basis and include the reinvestment of all dividends and capital gain distributions in the Fund. Returns shown in the chart and table above do not reflect the deduction of taxes that a shareholder would pay on Fund distributions or the redemption of Fund shares. Mutual funds are not bank deposits or obligations, are not guaranteed by any bank and are not insured or guaranteed by the U.S. government, the Federal Deposit Insurance Corporation, the Federal Reserve Board or any other government agency. Investment in mutual funds involves investment risk, including possible loss of principal.
(Unaudited)
55
REGIONS MORGAN KEEGAN SELECT
LIMITED MATURITY FIXED INCOME FUND
PORTFOLIOOF INVESTMENTS
NOVEMBER 30, 2008
| | | | | | | | |
Principal Amount | | | | | | Value |
| | Corporate Bonds–13.9% | | | |
| | | | | | Chemicals–2.4% | | | |
| $ | 100,000 | | | | E.I. Du Pont de Nemours & Co., 6.875% 10/15/2009 | | $ | 102,655 |
| | | | | | Finance–4.6% | | | |
| | 100,000 | | | | Caterpillar Financial Services Corporation, 4.500% 6/15/2009 | | | 99,440 |
| | 100,000 | | | | Marshall & Ilsley Corporation, 4.375% 8/1/2009 | | | 92,616 |
| | | | | | | |
|
|
| | | | | | Total | | | 192,056 |
| | | | | | | |
|
|
| | | | | | Food & Beverage–2.3% | | | |
| | 100,000 | | | | Diageo Capital PLC, 4.375% 5/3/2010 | | | 98,816 |
| | | | | | Retail–2.3% | | | |
| | 100,000 | | | | Home Depot Inc., 3.750% 9/15/09 | | | 97,470 |
| | | | | | Telecommunications–2.3% | | | |
| | 100,000 | | (1) | | AT&T Inc., 4.125% 9/15/2009 | | | 99,169 |
| | | | | | | |
|
|
| | | | | | Total Corporate Bonds
(identified cost $601,391) | | | 590,166 |
| | | | | | | |
|
|
| | Government & Agency Securities–14.3% | | | |
| | | | | | Federal Home Loan Mortgage Corporation–1.2% (2) | | | |
| | 51,701 | | | | 5.000%, 1/15/2016 | | | 51,737 |
| | | | | | Federal National Mortgage Association–13.1% (2) | | | |
| | 550,000 | | | | 2.500%, 4/9/2010 | | | 553,926 |
| | | | | | | |
|
|
| | | | | | Total Government & Agency Securities
(identified cost $599,664) | | | 605,663 |
| | | | | | | |
|
|
| | Mortgage-Backed Securities–19.0% | | | |
| | | | | | Collateralized Mortgage Obligations–19.0% |
| | 256,817 | | | | Downey Savings & Loan 2004-AR3 2A2A, 1.844% 7/19/44 | | | 162,921 |
| | 671,932 | | | | GSR Mortgage Loan Trust 2004-7 2A1, 4.144% 6/25/34 | | | 639,444 |
| | | | | | | |
|
|
| | | | | | Total Mortgage-Backed Securities (identified cost $924,744) | | | 802,365 |
| | | | | | | |
|
|
| | U.S. Treasury Obligations–48.4% | | | |
| | | | | | U.S. Treasury Notes–48.4% | | | |
| | 500,000 | | (1) | | 4.750%, 2/28/2009 | | | 505,507 |
| | 1,500,000 | | (1) | | 4.875%, 8/15/2009 | | | 1,542,305 |
| | | | | | | |
|
|
| | | | | | Total U. S. Treasury Obligations (identified cost $2,001,029) | | $ | 2,047,812 |
| | | | | | | |
|
|
| | | | | | | | | |
Principal Amount | | | | | | Value | |
| | Short-Term Investments–28.8% | | | | |
| $ | 917,275 | | | | Bank of New York Institutional Cash Reserves Fund (held as collateral for securities lending) | | $ | 914,966 | |
| | 151,821 | | | | Fidelity Institutional Money Market Fund | | | 151,821 | |
| | 151,822 | | | | Lehman Brothers Prime Money Market Fund | | | 151,822 | |
| | | | | | | |
|
|
|
| | | | | | Total Short-Term Investments
(identified cost $1,220,918) | | | 1,218,609 | |
| | | | | | | |
|
|
|
| | | | | | Total Investments–124.4%
(identified cost $5,347,746) | | | 5,264,615 | |
| | | | | | | |
|
|
|
| | | | | | Other Assets and Liabilities–
net–(24.4)% | | | (1,032,087 | ) |
| | | | | | | |
|
|
|
| | | | | | Total Net Assets–100% | | $ | 4,232,528 | |
| | | | | | | |
|
|
|
| (1) | | Certain principal amounts are temporarily on loan to unaffiliated broker-dealers. See Notes 2 and 5 of the Financial Statements for additional information about securities lending. |
| (2) | | The issuer is a publicly-traded company that operates under a congressional charter. |
Note: The categories of investments are shown as a percentage of total net assets at November 30, 2008.
The Notes to the Financial Statements are an integral part of, and should be read in conjunction with, the Financial Statements.
56
[THIS PAGE INTENTIONALLY LEFT BLANK]
57
REGIONS MORGAN KEEGAN SELECT
INTERMEDIATE TAX EXEMPT BOND FUND
OBJECTIVE & STRATEGY
Regions Morgan Keegan Select Intermediate Tax Exempt Bond Fund seeks current income that is exempt from federal income tax. The Fund invests its assets primarily in a highly diversified portfolio of tax-exempt bonds.
INVESTMENT RISKS: Investors in any bond fund should anticipate fluctuations in price. Bond prices and the value of bond funds decline as interest rates rise. Bonds with longer-term maturities generally are more vulnerable to interest rate risk than bonds with shorter-term maturities. A portion of the Fund’s income may be subject to the federal alternative minimum tax and/or certain state and local taxes. The net asset value per share of the Fund will fluctuate as the value of the securities in the portfolio changes.
MANAGEMENT DISCUSSIONOF FUND PERFORMANCE
For the fiscal year ended November 30, 2008, Regions Morgan Keegan Select Intermediate Tax Exempt Bond Fund’s Class A Shares had a total return of 2.40%, based on net asset value. The Merrill Lynch 3-7 Year Municipal Index, the Fund’s benchmark, had a total return of 4.51% during the same period.
At the beginning of the fiscal year, yields on investment grade tax-exempt bonds were at multi-year lows, and the Fund was positioned defensively with a relatively short maturity structure and relatively high credit quality profile.
Soon after the start of 2008 severe disruptions began to occur in the municipal market, mainly as a result of the fallout from mortgage market problems. Bond insurers were downgraded by the credit rating agencies because of the insurers’ exposure to subprime mortgage-backed securities. The municipal market had long relied on AAA-rated insurance to facilitate valuation of diverse credits. The very functioning of short-term tax-exempt credit markets depended on having AAA-rated insurance available. While the Fund did not hold any securities whose underlying credit quality was in question, the market dysfunction affected security valuation and trading across most market sectors. As the yield curve steepened in the first half of the fiscal year, with shorter term securities increasing in value and longer term ones declining, the Fund benefited from holding shorter bonds.
In the second half of the fiscal year the volatility of tax-exempt yields increased as economic and financial market problems increased. Liquidity in the tax-exempt market was very poor during this period. Despite the volatility the net change in municipal yields was a small increase from about 7 years to 30 years and little change in the shorter maturities. The Fund had a small positive return for the period as interest earned exceeded the slight decline in market value.
The Fund is once again defensively positioned for a difficult market. Both maturity structure and duration are shorter than those of the benchmark.
| | |
 | | |
Dorothy E. Thomas, CFA Senior Portfolio Manager Morgan Asset Management, Inc. | | |
Market forecasts provided in this report may not necessarily come to pass. There is no assurance that the Fund will achieve its investment objectives. These views are subject to change at any time based upon market or other conditions, and Morgan Asset Management, Inc. disclaims any responsibility to update such views. The Fund is subject to market risk, which is the possibility that the market values of securities owned by the Fund will decline and, therefore, the value of the Fund’s shares may be less than what you paid for them. Accordingly, you can lose money investing in the Fund.
(Unaudited)
58
REGIONS MORGAN KEEGAN SELECT
INTERMEDIATE TAX EXEMPT BOND FUND
PORTFOLIO STATISTICS†
AS OF NOVEMBER 30, 2008
| | |
| | | |
Average Credit Quality | | AA |
Current Yield | | 4.65% |
Yield to Maturity | | 3.00% |
Duration | | 3.6 Years |
Average Effective Maturity | | 4.3 Years |
Total Number of Holdings | | 51 |
| † | | The Fund’s composition is subject to change. |
CREDIT QUALITY†
AS OF NOVEMBER 30, 2008
| | |
%OFTOTALINVESTMENTS |
AAA | | 17.3% |
AA | | 57.5% |
A | | 25.2% |
| | |
|
Total | | 100.0% |
STATE DIVERSIFICATION†
AS OF NOVEMBER 30, 2008
| | | | | | |
| %OFTOTALINVESTMENTS | | %OFTOTALINVESTMENTS |
Alabama . . . . . . . . . . . . . . . . . . . . . . . . | | 19.4% | | Colorado | | 3.9% |
Texas . . . . . . . . . . . . . . . . . . . . . . . . . . . | | 12.5% | | Arkansas | | 3.0% |
North Carolina. . . . . . . . . . . . . . . . . . . . | | 10.0% | | California | | 2.1% |
South Carolina . . . . . . . . . . . . . . . . . . . | | 8.8% | | Illinois | | 2.1% |
Missouri . . . . . . . . . . . . . . . . . . . . . . . . | | 7.1% | | Maryland | | 2.1% |
Virginia . . . . . . . . . . . . . . . . . . . . . . . . . | | 6.0% | | Kentucky | | 2.0% |
Florida . . . . . . . . . . . . . . . . . . . . . . . . . | | 5.9% | | Washington | | 1.9% |
Georgia . . . . . . . . . . . . . . . . . . . . . . . . . | | 4.9% | | Kansas | | 1.2% |
Indiana . . . . . . . . . . . . . . . . . . . . . . . . . . | | 4.2% | | Short-Term Investments | | 2.9% |
| | | | | | |
|
| | | | | Total | | 100.0% |
| † | | The Fund’s composition is subject to change. |
INDEX DESCRIPTION
(1) | | The Merrill Lynch 3-7 Year Municipal Index is a total performance benchmark for the intermediate-term municipal bond market. The index is unmanaged and, unlike the Fund, is not affected by cash flows or trading and other expenses. It is not possible to invest directly in an index. |
(Unaudited)
59
REGIONS MORGAN KEEGAN SELECT
INTERMEDIATE TAX EXEMPT BOND FUND
GROWTHOFA $10,000 INVESTMENT
CLASS A SHARES
The graph below illustrates a hypothetical investment of $10,000 in Regions Morgan Keegan Select Intermediate Tax Exempt Bond Fund—Class A Shares from the commencement of investment operations on February 9, 2004 to November 30, 2008 compared to the Merrill Lynch 3-7 Year Municipal Index(1), a broad-based market index.
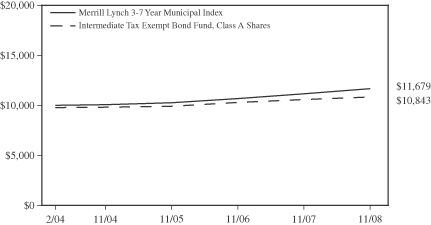
GROWTHOFA $10,000 INVESTMENT
CLASS C SHARES
The graph below illustrates a hypothetical investment of $10,000 in Regions Morgan Keegan Select Intermediate Tax Exempt Bond Fund—Class C Shares from the commencement of investment operations on February 9, 2004 to November 30, 2008 compared to the Merrill Lynch 3-7 Year Municipal Index(1), a broad-based market index.

(Unaudited)
60
REGIONS MORGAN KEEGAN SELECT
INTERMEDIATE TAX EXEMPT BOND FUND
GROWTHOFA $10,000 INVESTMENT
CLASS I SHARES
The graph below illustrates a hypothetical investment of $10,000 in Regions Morgan Keegan Select Intermediate Tax Exempt Bond Fund—Class I Shares from the commencement of investment operations on February 9, 2004 to November 30, 2008 compared to the Merrill Lynch 3-7 Year Municipal Index(1), a broad-based market index.
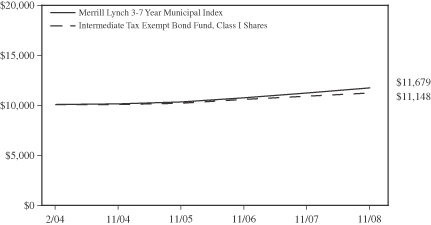
PERFORMANCE INFORMATION
| | | | | | | | | |
| | | AVERAGE ANNUAL TOTAL RETURNS | |
| AS OF NOVEMBER 30, 2008 | | SIX
MONTHS* | | | 1 YEAR | | | COMMENCEMENT
OF INVESTMENT
OPERATIONS(2) | |
| CLASS A SHARES** | | -1.42 | % | | 0.35 | % | | 1.69 | % |
(EXCLUDINGSALESLOAD) | | 0.59 | % | | 2.40 | % | | 2.12 | % |
| CLASS C SHARES*** | | -0.79 | % | | 0.51 | % | | 1.72 | % |
(EXCLUDINGCDSC) | | 0.22 | % | | 1.53 | % | | 1.72 | % |
| CLASS I SHARES | | 0.82 | % | | 2.76 | % | | 2.28 | % |
| MERRILL LYNCH 3-7 YEAR MUNICIPAL INDEX (1) | | 1.78 | % | | 4.51 | % | | — | |
| * | | Not annualized for periods less than one year. |
| ** | | Reflects the maximum sales load of 2.00%. |
| *** | | Reflects the maximum contingent deferred sales charge (CDSC) of 1.00% for shares redeemed within one year of purchase. |
(1) | | The Merrill Lynch 3-7 Year Municipal Index is a total performance benchmark for the intermediate-term municipal bond market. Total returns for the index shown are not adjusted to reflect sales charges, expenses or other fees that the Securities and Exchange Commission requires to be reflected in the Fund’s performance. The index is unmanaged and, unlike the Fund, is not affected by cash flows or trading and other expenses. It is not possible to invest directly in an index. |
(2) | | The Fund commenced investment operations on February 9, 2004. |
Performance data quoted represents past performance, which is no guarantee of future results. Investment return and principal value will fluctuate so that an investor’s shares, when redeemed, may be worth more or less than their original cost. Fund performance changes over time and current performance may be lower or higher than what is stated. For the most recent performance, call toll-free 877-757-7424. The Fund’s performance results are shown on a total return basis and include the reinvestment of all dividends and capital gain distributions in the Fund. Returns shown in the chart and table above do not reflect the deduction of taxes that a shareholder would pay on Fund distributions or the redemption of Fund shares. Mutual funds are not bank deposits or obligations, are not guaranteed by any bank and are not insured or guaranteed by the U.S. government, the Federal Deposit Insurance Corporation, the Federal Reserve Board or any other government agency. Investment in mutual funds involves investment risk, including possible loss of principal.
(Unaudited)
61
REGIONS MORGAN KEEGAN SELECT
INTERMEDIATE TAX EXEMPT BOND FUND
PORTFOLIOOF INVESTMENTS
NOVEMBER 30, 2008
| | | | | | | | |
Principal
Amount | | | | | | Value |
| | Municipal Bonds–96.1% |
| | | | | | Alabama–19.2% | | | |
| $ | 1,000,000 | | | | Alabama State Public School & College Authority Capital Improvement, Revenue Bonds, 5.000%, 12/1/2018 | | $ | 1,054,050 |
| | 500,000 | | | | Alabama Water Pollution Control Authority, Revenue Bonds, 4.750% (AMBAC INS), 8/15/2014 | | | 500,295 |
| | 430,000 | | | | Athens, Alabama , GO UT Warrants, 4.650% (AMBAC INS), 8/1/2011 | | | 433,457 |
| | 500,000 | | | | Huntsville, Alabama Health Care Authority, Revenue Bond, 4.700% (MBIA INS), 6/1/2012 | | | 524,610 |
| | 500,000 | | | | Limestone County Alabama Water Authority, 4.700% (AMBAC INS), 12/1/2009 | | | 505,480 |
| | 250,000 | | | | Mobile, Alabama, GO UT Warrants, 5.200% (AMBAC INS), 2/15/2010 | | | 260,710 |
| | 500,000 | | | | Scottsboro, Alabama Waterworks Sewer & Gas Board, Revenue Bonds, 4.400% (MBIA INS), 8/1/2012 | | | 504,365 |
| | 500,000 | | | | Shelby County Alabama Board of Education, GO LTD,
4.750%, 2/1/2013 | | | 507,145 |
| | 250,000 | | | | Southeast Alabama Gas District, Revenue Bonds (Series A), 5.250% (AMBAC INS), 6/1/2011 | | | 268,382 |
| | 500,000 | | | | Tuscaloosa, Alabama, GO UT Warrants, 4.500%, 2/15/2013 | | | 520,840 |
| | | | | | | |
|
|
| | | | | | Total | | | 5,079,334 |
| | | | | | | |
|
|
| | | | | | Arkansas–2.9% | | | |
| | 250,000 | | | | Arkansas State Development Finance Authority, Revenue Bonds, 4.000% (AMBAC INS), 12/1/2011 | | | 258,340 |
| | 500,000 | | | | Little Rock, Arkansas, GO LTD, 4.000% (FSA LOC), 4/1/2014 | | | 518,440 |
| | | | | | | |
|
|
| | | | | | Total | | | 776,780 |
| | | | | | | |
|
|
| | | | | | California–2.1% | | | |
| | 500,000 | | | | California State, GO UT,
6.000%, 2/1/2016 | | | 555,460 |
| | | | | | Colorado–3.9% | | | |
| | 85,000 | | | | Lower Colorado River Authority, Prerefunded, Revenue Bonds,
5.250%, 5/15/2021 | | | 94,293 |
| | 915,000 | | | | Lower Colorado River Authority, Unrefunded, Revenue Bonds,
5.250%, 5/15/2021 | | | 918,212 |
| | | | | | | |
|
|
| | | | | | Total | | | 1,012,505 |
| | | | | | | |
|
|
| | | | | | | | |
Principal
Amount | | | | | | Value |
| | Municipal Bonds (continued) |
| | | | | | Florida–5.8% | | | |
| $ | 750,000 | | | | Broward County Florida, GO UT (Series B), 5.000%, 1/1/2012 | | $ | 794,678 |
| | 250,000 | | | | Florida State Department of Transportation, GO UT (Series A), 5.000%, 7/1/2016 | | | 264,270 |
| | 500,000 | | | | JEA Florida Electric Systems, Revenue Bonds (Series D), 4.400%, 10/1/2018 | | | 484,445 |
| | | | | | | |
|
|
| | | | | | Total | | | 1,543,393 |
| | | | | | | |
|
|
| | | | | | Georgia–4.9% | | | |
| | 500,000 | | | | Augusta, Georgia Water & Sewer Authority, Revenue Bonds, 4.000% (FSA LOC), 10/1/2012 | | | 516,110 |
| | 250,000 | | | | Fayette County Georgia School District,
GO UT, 4.625%, 3/1/2010 | | | 256,487 |
| | 500,000 | | | | Gwinnett County Georgia Water & Sewer Authority, Revenue Bonds,
4.000%, 8/1/2015 | | | 518,940 |
| | | | | | | |
|
|
| | | | | | Total | | | 1,291,537 |
| | | | | | | |
|
|
| | | | | | Illinois–2.0% | | | |
| | 500,000 | | | | Illinois Health Facilities Authority, Revenue Bonds, 6.125%, 11/15/2022 | | | 538,945 |
| | | | | | Indiana–4.1% | | | |
| | 500,000 | | | | Indiana State Office Building & Facility, Revenue Bonds, 5.250% (FGIC INS), 7/1/2015 | | | 535,520 |
| | 500,000 | | | | Indianapolis, Indiana Public Improvement Board, Revenue Bonds,
6.000%, 1/10/2020 | | | 554,795 |
| | | | | | | |
|
|
| | | | | | Total | | | 1,090,315 |
| | | | | | | |
|
|
| | | | | | Kansas–1.2% | | | |
| | 300,000 | | | | Kansas State Development Finance Authority, Revenue Bonds, 5.000% (MBIA INS), 6/1/2011 | | | 316,461 |
| | | | | | Kentucky–2.0% | | | |
| | 500,000 | | | | Kentucky State Property & Building Commission, Revenue Bonds,
5.750%, 10/1/2012 | | | 534,590 |
| | | | | | Maryland–2.1% | | | |
| | 500,000 | | | | Maryland State & Local Facilities, GO UT (Series II), 5.500%, 7/15/2013 | | | 556,465 |
| | | | | | Missouri–7.1% | | | |
| | 500,000 | | | | Missouri State Environmental Energy Authority, Revenue Bonds (Series B), 5.125%, 1/1/2020 | | | 511,320 |
| | 750,000 | | | | Missouri State Highway & Transportation, Revenue Bonds (Series A),
5.625%, 2/1/2018 | | | 808,523 |
| | 500,000 | | | | Missouri State Highway & Transportation, Revenue Bonds (Series A),
5.250%, 2/1/2020 | | | 545,345 |
| | | | | | | |
|
|
| | | | | | Total | | | 1,865,188 |
| | | | | | | |
|
|
The Notes to the Financial Statements are an integral part of, and should be read in conjunction with, the Financial Statements.
62
REGIONS MORGAN KEEGAN SELECT
INTERMEDIATE TAX EXEMPT BOND FUND
PORTFOLIOOF INVESTMENTS
NOVEMBER 30, 2008
| | | | | | | | |
Principal
Amount | | | | | | Value |
| | | | | | Municipal Bonds (continued) | | | |
| | | | | | North Carolina–9.9% | | | |
| $ | 500,000 | | | | Greensboro, North Carolina, GO UT
(Series A), 4.000%, 2/1/2013 | | $ | 522,795 |
| | 500,000 | | | | Mecklenburg County North Carolina,
GO UT (Series A), 4.000%, 2/1/2015 | | | 514,790 |
| | 250,000 | | | | North Carolina Infrastructure Financial Corp., Revenue Bonds,
5.000%, 10/1/2011 | | | 266,107 |
| | 500,000 | | | | Wake County North Carolina, GO UT Refunding Bonds, 4.000%, 3/1/2015 | | | 520,730 |
| | 750,000 | | | | Wake County North Carolina, GO UT
(Series A), 4.000%, 4/1/2013 | | | 785,175 |
| | | | | | | |
|
|
| | | | | | Total | | | 2,609,597 |
| | | | | | | |
|
|
| | | | | | South Carolina–8.7% | | | |
| | 500,000 | | | | South Carolina State, GO UT,
4.000%, 1/1/2014 | | | 514,205 |
| | 500,000 | | | | South Carolina State, GO UT (Series A), 4.600%, 5/1/2012 | | | 513,540 |
| | 500,000 | | | | South Carolina State Public Service Authority, Revenue Bonds (Series A), 5.000% (AMBAC), 1/1/2018 | | | 517,640 |
| | 750,000 | | | | South Carolina State Public Service Authority, Revenue Bonds (Series A), 5.000% (AMBAC), 1/1/2022 | | | 754,538 |
| | | | | | | |
|
|
| | | | | | Total | | | 2,299,923 |
| | | | | | | |
|
|
| | | | | | Texas–12.4% | | | |
| | 500,000 | | | | Dallas, Texas Waterworks & Sewer System, Revenue Bonds, 4.125% (FSA LOC), 4/1/2013 | | | 521,620 |
| | 500,000 | | | | Denton, Texas Utility, Prerefunded, Revenue Bonds, 5.125% (AMBAC INS), 12/1/2018 | | | 538,215 |
| | 500,000 | | | | Fort Worth, Texas, GO LTD,
4.000%, 3/1/2013 | | | 518,760 |
| | 500,000 | | | | San Antonio, Texas, GO LTD (Series A), 5.250%, 2/1/2010 | | | 520,015 |
| | 275,000 | | | | Texas State Public Finance Authority, GO UT, 5.000%, 10/1/2017 | | | 284,754 |
| | 500,000 | | | | Tomball, Texas, GO UT, 4.500% (MBIA INS), 2/15/2011 | | | 521,260 |
| | 350,000 | | | | University of Texas, Revenue Bonds
(Series B), 5.250%, 8/15/2013 | | | 384,104 |
| | | | | | | |
|
|
| | | | | | Total | | | 3,288,728 |
| | | | | | | |
|
|
| | | | | | Virginia–5.9% | | | |
| | 500,000 | | | | Virginia Commonwealth Transportation Board Revenue, 5.000%, 5/15/2012 | | | 536,780 |
| | 500,000 | | | | Virginia State Public Building Authority, Revenue Refunding Bonds (Series A), 5.000%, 8/1/2015 | | | 524,345 |
| | 500,000 | | | | Virginia State Resource Authority Infrastructure, Revenue Pooled Loan Bond (Series D), 5.000%, 5/1/2020 | | | 504,155 |
| | | | | | | |
|
|
| | | | | | Total | | | 1,565,280 |
| | | | | | | |
|
|
| | | | | | | | |
Principal
Amount | | | | | | Value |
| | | | | | Municipal Bonds (continued) | | | |
| | | | | | Washington–1.9% | | | |
| $ | 500,000 | | | | Washington State, GO UT (Series B), 5.500%, 5/1/2009 | | $ | 508,825 |
| | | | | | | |
|
|
| | | | | | Total Municipal Bonds
(identified cost $25,210,390) | | | 25,433,326 |
| | | | | | | |
|
|
| Short-Term Investments–2.9%
|
| | 770,745 | | | | Federated Tax-Free Obligations Money Market Fund | | | 770,745 |
| | | | | | | |
|
|
| | | | | | Total Short-Term Investments
(identified cost $770,745) | | | 770,745 |
| | | | | | | |
|
|
| | | | | | Total Investments–99.0%
(identified cost $25,981,134) | | | 26,204,071 |
| | | | | | | |
|
|
| | | | | | Other Assets and Liabilities–
net–1.0% | | | 265,058 |
| | | | | | | |
|
|
| | | | | | Total Net Assets–100.0% | | $ | 26,469,129 |
| | | | | | | |
|
|
At November 30,2008, the Fund held no securities that are subject to federal alternative minimum tax (AMT).
Note: The categories of investments are shown as a percentage of total net assets at November 30, 2008.
The following acronyms are used throughout this portfolio:
AMBAC—American Municipal Bond Assurance Corporation
FGIC—Financial Guaranty Insurance Company
FSA—Financial Security Assurance
GO—General Obligation
INS—Insured
LOC—Letter of Credit
LTD—Limited Tax
MBIA—Municipal Bond Investors Assurance Corporation
UT—Unlimited Tax
The Notes to the Financial Statements are an integral part of, and should be read in conjunction with, the Financial Statements.
63
REGIONS MORGAN KEEGAN SELECT
TREASURY MONEY MARKET FUND
OBJECTIVE & STRATEGY
Regions Morgan Keegan Select Treasury Money Market Fund seeks current income consistent with stability of principal and liquidity. The Fund invests primarily in U.S. Treasury obligations maturing in 397 days or less and in repurchase agreements collateralized by U.S. Treasury obligations.
INVESTMENT RISKS: An investment in the Fund is neither guaranteed nor insured by the Federal Deposit Insurance Corporation or any other government agency. Although the Fund seeks to preserve the value of your investment at $1.00 per share, it is possible to lose money by investing in the Fund.
MANAGEMENT DISCUSSIONOF FUND PERFORMANCE
For the fiscal year ended November 30, 2008, Regions Morgan Keegan Select Treasury Money Market Fund’s Class A Shares had a total return 1.35%, based on net asset value. During this time period, the Federal Reserve Board cut the Federal Funds Rate from 4.50% to 1.00%, as economic growth concerns overshadowed inflationary risks.
The market events this year have been nothing short of astonishing, and as a result, investor confidence remains extremely low. Demand for liquid, government guaranteed securities has driven U.S. Treasury yields to historically low levels. The three-month U.S. Treasury bill began the fiscal year at 3.14%, yet ended at 0.04%, which is a decline of 310 basis points, or 3.10%.
The Fund maintains a 60-day or less weighted average life in order to qualify for its AAA rating from Standard & Poor’s. A positively sloped yield curve and a decline in interest rates mean longer dated securities have yielded a higher return than shorter-dated securities. Therefore, the Fund purchased longer-dated U.S. Treasury securities when possible.
Our current strategy is to take advantage of any short-term fluctuations in interest rates, as well as exploiting any yield disparities between U.S. Treasury Bills and money market eligible U.S. Treasury Notes. Due to the slightly positive slope of the yield curve, the low interest rate environment, and the Federal Reserve Board’s monetary outlook, we will maintain a weighted average life of the Fund near 50 days as liquidity considerations and trading conditions permit.
|
|
George R. McCurdy IV, CFA Portfolio Manager Morgan Asset Management, Inc. |
Market forecasts provided in this report may not necessarily come to pass. There is no assurance that the Fund will achieve its investment objectives. These views are subject to change at any time based upon market or other conditions, and Morgan Asset Management, Inc. disclaims any responsibility to update such views. The Fund is subject to market risk, which is the possibility that the market values of securities owned by the Fund will decline and, therefore, the value of the Fund’s shares may be less than what you paid for them. Accordingly, you can lose money investing in the Fund.
(Unaudited)
64
REGIONS MORGAN KEEGAN SELECT
TREASURY MONEY MARKET FUND
MATURITY BREAKDOWN†
AS OF NOVEMBER 30, 2008
| | |
| % OF TOTAL INVESTMENTS |
1-14 Days | | 21.6% |
15-29 Days | | 17.4% |
30-59 Days | | 23.5% |
60-179 Days | | 37.5% |
| | |
|
Total | | 100.0% |
| † | | The Fund’s composition is subject to change. |
PERFORMANCE INFORMATION
| | | | | | | | | | | | | | | | | | |
| | | | | | AVERAGE ANNUAL TOTAL RETURNS | |
| AS OF NOVEMBER 30, 2008(1) | | SEVEN-DAY
YIELD*(2) | | | SIX
MONTHS* | | | 1 YEAR | | | 5 YEAR | | | 10 YEAR | | | COMMENCEMENT
OF INVESTMENT
OPERATIONS(4) | |
| CLASS A SHARES**(3) | | 0.06 | % | | 0.40 | % | | 1.35 | % | | 2.48 | % | | 2.76 | % | | 3.35 | % |
| CLASS I SHARES** | | 0.31 | % | | 0.53 | % | | 1.61 | % | | N/A | | | N/A | | | 3.20 | % |
| * | | Not annualized for periods less than one year. |
| ** | | The Fund’s shares are not sold subject to a sales (load) charge; therefore, the total returns displayed above are based upon net asset value. |
(1) | | In light of recent extraordinary market events, effective November 20, 2008, the Fund’s adviser has voluntarily agreed to waive fees and reimburse expenses to the extent necessary to prevent a negative yield for each class of shares of the Fund. This undertaking is voluntary and may be modified or discontinued by the Fund’s adviser at any time. |
(2) | | The Seven-Day Yield more closely reflects the current earnings of the Fund than does the total return quotation. Investors may call the Fund toll-free at 877-757-7424 to acquire the current Seven-Day Yield. |
(3) | | Effective June 4, 2004, all Class B Shares of the Fund converted to Class A Shares. Historical total return information for any period or portion thereof prior to the commencement of investment operations of Class A Shares on May 20, 1998 is that of Class B Shares and reflects all charges, expenses and fees incurred by Class B Shares, which were generally higher than the expenses of Class A Shares, during such periods. |
(4) | | The Fund’s Class A Shares and Class I Shares commenced investment operations on April 14, 1992 and April 3, 2006, respectively. |
Performance data quoted represents past performance, which is no guarantee of future results. Investment return and principal value will fluctuate so that an investor’s shares, when redeemed, may be worth more or less than their original cost. Fund performance changes over time and current performance may be lower or higher than what is stated. For the most recent performance, call toll-free 877-757-7424. The Fund’s performance results are shown on a total return basis and include the reinvestment of all dividends and capital gain distributions in the Fund. Returns shown in the chart and table above do not reflect the deduction of taxes that a shareholder would pay on Fund distributions or the redemption of Fund shares. Although the money market funds seek to preserve the value of your investment at $1.00 per share, it is possible to lose money by investing in these funds. Mutual funds are not bank deposits or obligations, are not guaranteed by any bank and are not insured or guaranteed by the U.S. government, the Federal Deposit Insurance Corporation, the Federal Reserve Board or any other government agency. Investment in mutual funds involves investment risk, including possible loss of principal.
(Unaudited)
65
REGIONS MORGAN KEEGAN SELECT
TREASURY MONEY MARKET FUND
PORTFOLIOOF INVESTMENTS
NOVEMBER 30, 2008
| | | | | | | | |
Principal
Amount | | | | | | Value |
| | U.S. Treasury Obligations–90.5% | | | |
| | | | | | U.S. Treasury Bills–67.3% | | | |
| $ | 60,000,000 | | (1) | | 0.38% - 1.75%, 12/4/2008 | | $ | 59,997,024 |
| | 60,000,000 | | (1) | | 0.06% - 0.70%, 12/11/2008 | | | 59,991,397 |
| | 40,000,000 | | (1) | | 0.10% - 0.61%, 12/18/2008 | | | 39,991,028 |
| | 80,000,000 | | (1) | | 0.10% - 0.72%, 12/26/2008 | | | 79,977,499 |
| | 130,000,000 | | (1) | | 0.02% - 0.99%, 1/2/2009 | | | 129,919,422 |
| | 50,000,000 | | (1) | | 1.79%, 1/15/2009 | | | 49,890,237 |
| | 50,000,000 | | (1) | | 0.49% - 1.01%, 1/22/2009 | | | 49,942,915 |
| | 35,000,000 | | (1) | | 1.16%, 1/29/2009 | | | 34,934,465 |
| | 50,000,000 | | (1) | | 0.36% - 0.42%, 2/5/2009 | | | 49,965,717 |
| | 35,000,000 | | (1) | | 0.26%, 2/19/2009 | | | 34,979,778 |
| | 40,000,000 | | (1) | | 0.52%, 3/5/2009 | | | 39,946,211 |
| | 20,000,000 | | (1) | | 0.63%, 3/19/2009 | | | 19,963,100 |
| | 10,000,000 | | (1) | | 0.76%, 4/29/2009 | | | 9,968,958 |
| | | | | | | |
|
|
| | | | | | | | | 659,467,751 |
| | | | | | | |
|
|
| | | | | | U.S. Treasury Notes–23.2% | | | |
| | 30,000,000 | | (1) | | 0.84%, 5/15/2009 | | | 30,634,699 |
| | 50,000,000 | | (1) | | 0.96%, 12/15/2008 | | | 50,045,943 |
| | 20,000,000 | | (1) | | 0.49%, 4/15/2009 | | | 20,194,888 |
| | 30,000,000 | | (1) | | 0.09%, 2/15/2009 | | | 30,272,824 |
| | 95,000,000 | | (1) | | 0.44% - 0.62%, 4/30/2009 | | | 96,550,510 |
| | | | | | | |
|
|
| | | | | | | | | 227,698,864 |
| | | | | | | |
|
|
| | | | | | Total U.S. Treasury Obligations (amortized cost $887,166,615) | | $ | 887,166,615 |
| | | | | | | |
|
|
| | | | | | | |
| | | |
| Shares | | | | | | Value |
| Short-Term Investments–9.4% | | | |
| 41,053,546 | | | | BlackRock Liquidity Funds Treasury Trust Fund Portfolio | | $ | 41,053,546 |
| 41,968,401 | | | | Federated U.S. Treasury Cash Reserve Fund | | | 41,968,401 |
| 9,085,933 | | | | Goldman Sachs Financial Square Trust | | | 9,085,933 |
| | | | | | |
|
|
| | | | | Total Short-Term Investments (amortized cost $92,107,880) | | | 92,107,880 |
| | | | | | |
|
|
| | | | | Total Investments–99.9% (amortized cost $979,274,495) (2) | | | 979,274,495 |
| | | | | | |
|
|
| | | | | Other Assets and Liabilities–
net–0.1% | | | 1,024,288 |
| | | | | | |
|
|
| | | | | Total Net Assets–100.0% | | $ | 980,298,783 |
| | | | | | |
|
|
| (1) | | Yield at date of purchase. |
| (2) | | Also represents cost for federal income tax purposes. |
Note: The categories of investments are shown as a percentage of total net assets at November 30, 2008.
The Notes to the Financial Statements are an integral part of, and should be read in conjunction with, the Financial Statements.
66
[THIS PAGE INTENTIONALLY LEFT BLANK]
67
REGIONS MORGAN KEEGAN SELECT MONEY MARKET FUND
OBJECTIVE & STRATEGY
Regions Morgan Keegan Select Money Market Fund seeks maximum current income consistent with preservation of capital and liquidity. The Fund invests in high quality, short-term money market instruments with remaining maturities of 397 days or less.
INVESTMENT RISKS: An investment in the Fund is neither guaranteed nor insured by the Federal Deposit Insurance Corporation or any other government agency. Although the Fund seeks to preserve the value of your investment at $1.00 per share, it is possible to lose money by investing in the Fund.
MANAGEMENT DISCUSSIONOF FUND PERFORMANCE
For the fiscal year ended November 30, 2008, Regions Morgan Keegan Select Money Market Fund’s Class A Shares had a total return of 2.26%, based on net asset value. During this time period, the Federal Reserve Board cut the Federal Funds Rate from 4.50% to 1.00%, as economic growth concerns overshadowed inflationary risks.
Unprecedented market events, such as the failure of some major financial institutions and U.S. government intervention, along with deteriorating economic conditions have caused investors to seek principal preservation over investment returns. This flight to quality has driven U.S. Treasury yields to historically low levels. The three-month U.S. Treasury bill began the fiscal year at 3.14%, yet ended at 0.04%, which is a decline of 310 basis points, or 3.10%.
Investor preference to government guaranteed securities shifted funds from corporations, which limited their ability to raise capital at reasonable rates. This disruption in the credit markets resulted in a decline in outstanding commercial paper. Our focus on quality and a shrinking commercial paper market caused the Fund’s sector allocation to shift heavily to money market eligible U.S. government securities. We will continue managing the Fund to take advantage of any short-term market fluctuations without exposing it to any unnecessary risks.
George R. McCurdy IV, CFA
Portfolio Manager
Morgan Asset Management, Inc.
Market forecasts provided in this report may not necessarily come to pass. There is no assurance that the Fund will achieve its investment objectives. These views are subject to change at any time based upon market or other conditions, and Morgan Asset Management, Inc. disclaims any responsibility to update such views. The Fund is subject to market risk, which is the possibility that the market values of securities owned by the Fund will decline and, therefore, the value of the Fund’s shares may be less than what you paid for them. Accordingly, you can lose money investing in the Fund.
(Unaudited)
68
REGIONS MORGAN KEEGAN SELECT MONEY MARKET FUND
MATURITY BREAKDOWN†
AS OF NOVEMBER 30, 2008
| | |
| %OFTOTALINVESTMENTS |
1-14 Days | | 19.0% |
15-29 Days | | 17.2% |
30-59 Days | | 32.8% |
60-179 Days | | 24.2% |
180-397 Days | | 6.8% |
| | |
|
Total | | 100.0% |
| † | | The Fund’s composition is subject to change. |
PERFORMANCE INFORMATION
| | | | | | | | | | | | | | | |
| | | AVERAGE ANNUAL TOTAL RETURNS | |
| AS OF NOVEMBER 30, 2008 | | SEVEN-DAY
YIELD*(1) | | | SIX
MONTHS* | | | 1 YEAR | | | 5 YEAR | | | COMMENCEMENT
OF INVESTMENT
OPERATIONS(2) | |
| CLASS A SHARES** | | 0.91 | % | | 0.81 | % | | 2.26 | % | | 2.65 | % | | 2.33 | % |
| CLASS I SHARES** | | 1.16 | % | | 0.94 | % | | 2.52 | % | | 3.00 | % | | 3.10 | % |
| * | | Not annualized for periods less than one year. |
| ** | | The Fund’s shares are not sold subject to a sales (load) charge; therefore, the total returns displayed above are based upon net asset value. |
(1) | | The Seven-Day Yield more closely reflects the current earnings of the Fund than does the total return quotation. Investors may call the Fund toll-free at 877-757-7424 to acquire the current Seven-Day Yield. |
(2) | | The Fund began operations on February 18, 2005 as the successor to a substantially similar investment company. On that date, the Fund merged with LEADER Money Market Fund, a series of LEADER Mutual Funds, and assumed that portfolio’s operating history and performance record. The Fund’s performance prior to February 18, 2005 is that of the Fund’s predecessor, the inception date of which was October 4, 2000 (Class A Shares) and July 7, 1999 (Class I Shares). The performance information assumes reinvestment of dividends and other distributions and, for the periods prior to February 18, 2005, reflects fees and expenses paid by the predecessor fund’s Class A Shares and Class I Shares. |
Performance data quoted represents past performance, which is no guarantee of future results. Investment return and principal value will fluctuate so that an investor’s shares, when redeemed, may be worth more or less than their original cost. Fund performance changes over time and current performance may be lower or higher than what is stated. For the most recent performance, call toll-free 877-757-7424. The Fund’s performance results are shown on a total return basis and include the reinvestment of all dividends and capital gain distributions in the Fund. Returns shown in the chart and table above do not reflect the deduction of taxes that a shareholder would pay on Fund distributions or the redemption of Fund shares. Although the money market funds seek to preserve the value of your investment at $1.00 per share, it is possible to lose money by investing in these funds. Mutual funds are not bank deposits or obligations, are not guaranteed by any bank and are not insured or guaranteed by the U.S. government, the Federal Deposit Insurance Corporation, the Federal Reserve Board or any other government agency. Investment in mutual funds involves investment risk, including possible loss of principal.
(Unaudited)
69
REGIONS MORGAN KEEGAN SELECT MONEY MARKET FUND
PORTFOLIOOF INVESTMENTS
NOVEMBER 30, 2008
| | | | | | | | |
Principal
Amount | | | | | | Value |
| | Commercial Paper–13.1% | | | |
| | | | | | Auto Manufacturers–2.9% | | | |
| $ | 1,000,000 | | (1) | | Toyota Motor Corporation,
0.700%, 12/3/2008 | | $ | 999,961 |
| | 2,000,000 | | (1) | | Toyota Motor Corporation,
3.265%, 12/8/2008 | | | 1,998,736 |
| | | | | | | |
|
|
| | | | | | Total Auto Manufacturers | | | 2,998,697 |
| | | | | | | |
|
|
| | | | | | Beverages–2.0% |
| | 2,000,000 | | (1) | | Coca-Cola Company,
1.703%, 12/2/2008 | | | 1,999,906 |
| | | | | | Computers–1.5% |
| | 1,500,000 | | (1) | | Hewlett-Packard Corp.,
0.850%, 12/2/2008 | | | 1,499,965 |
| | | | | | Electric–1.9% |
| | 2,000,000 | | (1) | | Southern Company,
1.251%, 12/4/2008 | | | 1,999,792 |
| | | | | | Media–1.9% | | | |
| | 2,000,000 | | (1) | | Walt Disney, 1.755%, 12/11/2008 | | | 1,999,028 |
| | | | | | Oil & Gas–2.9% |
| | 3,000,000 | | (1) | | Chevron Corp., 1.002%, 1/20/2009 | | | 2,995,833 |
| | | | | | | |
|
|
| | | | | | Total Commercial Paper | | | |
| | | | | | (amortized cost $13,493,221) | | | 13,493,221 |
| | | | | | | |
|
|
| | U.S. Government Agencies–80.9% | | | |
| | | | | | Federal National Mortgage Association–25.1% (2) | | | |
| | 2,000,000 | | (1) | | 1.089%, 12/1/2008 | | | 2,000,000 |
| | 1,303,000 | | (1) | | 0.200% - 0.254%, 12/11/2008 | | | 1,302,924 |
| | 2,000,000 | | (1) | | 0.203%, 12/15/2008 | | | 1,999,844 |
| | 4,289,000 | | (1) | | 0.601% - 0.701%,1/27/2009 | | | 4,284,292 |
| | 2,000,000 | | (1) | | 1.002%, 1/28/2009 | | | 1,996,778 |
| | 100,000 | | (1) | | 0.919%, 2/3/2009 | | | 99,837 |
| | 2,000,000 | | (1) | | 1.096%, 2/18/2009 | | | 1,995,282 |
| | 6,105,000 | | (1) | | 0.816% - 2.625%, 1/15/2009 | | | 6,127,877 |
| | 1,025,000 | | (1) | | 2.526%, 4/15/2009 | | | 1,033,816 |
| | 4,000,000 | | (1) | | 2.587%, 12/15/2008 | | | 4,001,184 |
| | 1,070,000 | | (1) | | 2.524%, 4/20/2009 | | | 1,080,056 |
| | | | | | | |
|
|
| | | | | | | | | 25,921,890 |
| | | | | | | |
|
|
| | | | | | Federal Home Loan Bank–27.9% | | | |
| | 200,000 | | (1) | | 0.651%, 1/7/2009 | | | 199,866 |
| | 2,000,000 | | (1) | | 0.601%, 1/12/2009 | | | 1,998,600 |
| | 480,000 | | (1) | | 0.250%,1/14/2009 | | | 479,853 |
| | 200,000 | | (1) | | 0.662%, 1/20/2009 | | | 199,819 |
| | 3,000,000 | | (1) | | 0.551%, 1/22/2009 | | | 2,997,617 |
| | 4,400,000 | | (1) | | 0.647% - 2.364, 1/26/2009 | | | 4,384,982 |
| | 1,500,000 | | (1) | | 0.500%, 12/29/2008 | | | 1,505,381 |
| | 4,000,000 | | (1) | | 2.733%, 1/14/2009 | | | 4,011,857 |
| | 1,000,000 | | (1) | | 2.646%, 1/22/2009 | | | 1,000,667 |
| | 4,000,000 | | (1) | | 2.250%, 3/3/2009 | | | 4,005,778 |
| | 5,000,000 | | (1) | | 2.635%, 3/5/2009 | | | 5,001,023 |
| | 3,000,000 | | (1) | | 2.529%, 4/14/2009 | | | 2,995,869 |
| | | | | | | |
|
|
| | | | | | | | | 28,781,312 |
| | | | | | | |
|
|
| | | | | | | | |
Principal
Amount | | | | | | Value |
| | | | | | Federal Home Loan Mortgage Corporation–27.9% (2) | | | |
| $ | 3,000,000 | | (1) | | (1.901)%, 12/26/2008 | | $ | 3,003,745 |
| | 4,000,000 | | (1) | | 3.080%, 6/12/2009 | | | 3,996,171 |
| | 3,000,000 | | (1) | | 1.393%, 6/5/2009 | | | 3,002,147 |
| | 628,000 | | (1) | | 0.254%, 12/16/2008 | | | 627,935 |
| | 3,000,000 | | (1) | | 1.303%, 12/17/2008 | | | 2,998,267 |
| | 2,000,000 | | (1) | | 1.002%, 12/22/2008 | | | 1,998,834 |
| | 3,500,000 | | (1) | | 1.708%, 2/11/2009 | | | 3,488,100 |
| | 1,580,000 | | (1) | | 1.470%, 12/19/2008 | | | 1,582,434 |
| | 5,000,000 | | (1) | | 2.308% - 2.468%, 5/21/2009 | | | 5,065,995 |
| | 3,000,000 | | (1) | | 2.658%, 1/16/2009 | | | 3,008,668 |
| | | | | | | |
|
|
| | | | | | | | | 28,772,296 |
| | | | | | | |
|
|
| | | | | | Total U.S. Government Agencies | | | |
| | | | | | (amortized cost $83,475,498) | | | 83,475,498 |
| | | | | | | |
|
|
| | | |
| Shares | | | | | | Value |
| | Short-Term Investments–5.6% | | | |
| | 2,906,847 | | | | Fidelity Institutional Money Market Fund | | | 2,906,847 |
| | 2,906,847 | | | | Lehman Brothers Prime Money Market Fund | | | 2,906,847 |
| | | | | | | |
|
|
| | | | | | Total Short-Term Investments (amortized cost $5,813,694) | | | 5,813,694 |
| | | | | | | |
|
|
| | | | | | Total Investments–99.6%
(amortized cost $102,782,413) (3) | | | 102,782,413 |
| | | | | | | |
|
|
| | | | | | Other Assets and Liabilities–
net–0.4% | | | 449,643 |
| | | | | | | |
|
|
| | | | | | Total Net Assets–100.0% | | $ | 103,232,056 |
| | | | | | | |
|
|
| (1) | | Yield at date of purchase. |
| (2) | | The issuer is a publicly traded company that operates under a congressional charter. |
| (3) | | Also represents cost for federal income tax purposes. |
Note: The categories of investments are shown as a percentage of total net assets at November 30, 2008.
The Notes to the Financial Statements are an integral part of, and should be read in conjunction with, the Financial Statements.
70
REGIONS MORGAN KEEGAN SELECT FUNDS
STATEMENTSOF ASSETSAND LIABILITIES
NOVEMBER 30, 2008
| | | | | | | | | | | | | | | | | | | | | | | | |
| | | Mid Cap Growth Fund | | | Growth Fund | | | Core Equity Fund | | | Mid Cap Value Fund | | | Value Fund | | | Balanced Fund | |
Assets: | | | | | | | | | | | | | | | | | | | | | | | | |
Investments in securities, at value | | $ | 264,829,926 | (1) | | $ | 271,388,264 | (1) | | $ | 8,801,962 | | | $ | 34,364,320 | (1) | | $ | 163,226,241 | | | $ | 139,804,664 | (1) |
Cash | | | 251,962 | | | | — | | | | — | | | | — | | | | — | | | | — | |
Interest and dividends receivable | | | 283,978 | | | | 574,612 | | | | 16,654 | | | | 75,646 | | | | 377,058 | | | | 761,256 | |
Receivable for fund shares sold | | | 100,936 | | | | 171,206 | | | | — | | | | 10,223 | | | | 150,386 | | | | 389,811 | |
Receivable for investments sold | | | 664,420 | | | | — | | | | — | | | | — | | | | — | | | | — | |
Other assets | | | 17,682 | | | | — | | | | — | | | | — | | | | 429 | | | | — | |
| | |
|
|
| |
|
|
| |
|
|
| |
|
|
| |
|
|
| |
|
|
|
Total assets | | | 266,148,904 | | | | 272,134,082 | | | | 8,818,616 | | | | 34,450,189 | | | | 163,754,114 | | | | 140,955,731 | |
| | |
|
|
| |
|
|
| |
|
|
| |
|
|
| |
|
|
| |
|
|
|
Liabilities: | | | | | | | | | | | | | | | | | | | | | | | | |
Payable for fund shares redeemed | | | 122,188 | | | | 73,150 | | | | 31,558 | | | | 11,292 | | | | 31,649 | | | | 23,777 | |
Dividends payable | | | — | | | | 37,835 | | | | 12,913 | | | | 8,333 | | | | 5,559 | | | | — | |
Payable for investments purchased | | | — | | | | — | | | | — | | | | — | | | | 7,791,163 | | | | — | |
Call options written, at value (premiums received $250,025, $542,727, and $48,470) (Note 6) | | | 119,000 | | | | 753,000 | | | | — | | | | — | | | | — | | | | 35,250 | |
Payable upon return of securities on loan | | | 48,524,300 | | | | 21,386,127 | | | | — | | | | 684,701 | | | | — | | | | 12,992,960 | |
Accrued expenses: | | | | | | | | | | | | | | | | | | | | | | | | |
Advisory fees (Note 3) | | | 129,410 | | | | 151,868 | | | | 5,536 | | | | 20,233 | | | | 97,252 | | | | 76,880 | |
Administration fees (Note 3) | | | 15,529 | | | | 18,224 | | | | 664 | | | | 2,428 | | | | 11,670 | | | | 9,226 | |
Custodian fees (Note 3) | | | 3,595 | | | | 4,062 | | | | 185 | | | | 675 | | | | 2,798 | | | | 2,255 | |
Accounting fees (Note 3) | | | 5,177 | | | | 6,075 | | | | 222 | | | | 809 | | | | 3,890 | | | | 3,075 | |
Shareholder services fees (Note 3) | | | 20,438 | | | | 20,392 | | | | 383 | | | | 2,143 | | | | 9,332 | | | | 5,645 | |
Distribution services fees (Note 3) | | | 2,677 | | | | 1,358 | | | | — | | | | 187 | | | | 712 | | | | 1,475 | |
Transfer agent fees (Note 3) | | | 10,431 | | | | 9,429 | | | | 3,555 | | | | 4,935 | | | | 5,876 | | | | 5,766 | |
Other | | | 51,884 | | | | 57,224 | | | | 12,583 | | | | 17,286 | | | | 40,598 | | | | 48,829 | |
| | |
|
|
| |
|
|
| |
|
|
| |
|
|
| |
|
|
| |
|
|
|
Total liabilities | | | 49,004,629 | | | | 22,518,744 | | | | 67,599 | | | | 753,022 | | | | 8,000,499 | | | | 13,205,138 | |
| | |
|
|
| |
|
|
| |
|
|
| |
|
|
| |
|
|
| |
|
|
|
Net Assets: | | | 217,144,275 | | | | 249,615,338 | | | | 8,751,017 | | | | 33,697,167 | | | | 155,753,615 | | | | 127,750,593 | |
| | |
|
|
| |
|
|
| |
|
|
| |
|
|
| |
|
|
| |
|
|
|
Composition of Net Assets: | | | | | | | | | | | | | | | | | | | | | | | | |
Paid-in capital | | $ | 305,855,163 | | | $ | 271,019,284 | | | $ | 4,907,609 | | | $ | 41,363,344 | | | $ | 188,677,994 | | | $ | 129,191,783 | |
Undistributed net investment income/(loss) | | | — | | | | 402,777 | | | | (1,848 | ) | | | 36,619 | | | | 673,502 | | | | 571,603 | |
Accumulated net realized gains/(losses) on investments | | | 1,302,424 | | | | (4,033,731 | ) | | | 5,104,202 | | | | (3,312,275 | ) | | | (9,332,872 | ) | | | (1,034,303 | ) |
Net unrealized appreciation/(depreciation) on investments | | | (90,013,312 | ) | | | (17,772,992 | ) | | | (1,258,946 | ) | | | (4,390,521 | ) | | | (24,265,009 | ) | | | (978,490 | ) |
| | |
|
|
| |
|
|
| |
|
|
| |
|
|
| |
|
|
| |
|
|
|
Net Assets | | $ | 217,144,275 | | | $ | 249,615,338 | | | $ | 8,751,017 | | | $ | 33,697,167 | | | $ | 155,753,615 | | | $ | 127,750,593 | |
| | |
|
|
| |
|
|
| |
|
|
| |
|
|
| |
|
|
| |
|
|
|
Investments, at identified cost | | $ | 354,974,263 | | | $ | 288,950,983 | | | $ | 10,060,908 | | | $ | 38,754,841 | | | $ | 187,491,250 | | | $ | 140,796,374 | |
| | |
|
|
| |
|
|
| |
|
|
| |
|
|
| |
|
|
| |
|
|
|
Shares Outstanding† and Net Asset Value Per Share: | | | | | | | | | | | | | | | | | | | | | | | | |
Class A Shares: | | | | | | | | | | | | | | | | | | | | | | | | |
Net assets | | $ | 97,154,490 | | | $ | 97,374,201 | | | $ | 1,841,498 | | | $ | 10,256,772 | | | $ | 43,545,982 | | | $ | 25,532,269 | |
Shares outstanding | | | 10,134,966 | | | | 7,501,643 | | | | 143,789 | | | | 1,561,106 | | | | 3,561,374 | | | | 2,034,037 | |
Net asset value and redemption price per share | | $ | 9.59 | | | $ | 12.98 | | | $ | 12.81 | | | $ | 6.57 | | | $ | 12.23 | | | $ | 12.55 | |
Offering price per share | | $ | 10.15 | (2) | | $ | 13.74 | (2) | | $ | 13.56 | (2) | | $ | 6.95 | (2) | | $ | 12.94 | (2) | | $ | 13.28 | (2) |
| | |
|
|
| |
|
|
| |
|
|
| |
|
|
| |
|
|
| |
|
|
|
Class C Shares: | | | | | | | | | | | | | | | | | | | | | | | | |
Net assets | | $ | 4,457,209 | | | $ | 2,234,146 | | | $ | 66 | | | $ | 311,803 | | | $ | 1,128,649 | | | $ | 2,394,524 | |
Shares outstanding | | | 490,292 | | | | 179,385 | | | | 5 | | | | 49,581 | | | | 92,304 | | | | 190,602 | |
Net asset value, offering and redemption price* per share | | $ | 9.09 | | | $ | 12.45 | | | $ | 12.80 | | | $ | 6.29 | | | $ | 12.23 | | | $ | 12.56 | |
| | |
|
|
| |
|
|
| |
|
|
| |
|
|
| |
|
|
| |
|
|
|
Class I Shares: | | | | | | | | | | | | | | | | | | | | | | | | |
Net assets | | $ | 115,532,576 | | | $ | 150,006,991 | | | $ | 6,909,453 | | | $ | 23,128,592 | | | $ | 111,078,984 | | | $ | 99,823,800 | |
Shares outstanding | | | 11,912,171 | | | | 11,561,761 | | | | 537,639 | | | | 3,510,398 | | | | 9,090,874 | | | | 7,940,343 | |
Net asset value, offering and redemption price per share | | $ | 9.70 | | | $ | 12.97 | | | $ | 12.85 | | | $ | 6.59 | | | $ | 12.22 | | | $ | 12.57 | |
| † | | The Declaration of Trust permits the Board of Trustees to issue an unlimited number of full and fractional shares of beneficial interest (without par value) for each class of shares. |
| * | | Redemption price per share varies by length of time shares are held. |
| (1) | | Including $47,597,457, $21,077,540, $664,872, and $12,848,547 of securities loaned, respectively. |
| (2) | | Computation of offering price per share: 100/94.5% of net asset value. |
The Notes to the Financial Statements are an integral part of, and should be read in conjunction with, the Financial Statements.
71
REGIONS MORGAN KEEGAN SELECT FUNDS
STATEMENTSOF ASSETSAND LIABILITIES
NOVEMBER 30, 2008
| | | | | | | | | | | | | | | | | | | |
| | | Fixed Income Fund | | | Limited Maturity Fixed Income Fund | | | Intermediate Tax Exempt Bond Fund | | | Treasury Money Market Fund | | Money Market Fund | |
Assets: | | | | | | | | | | | | | | | | | | | |
Investments in securities, at value | | $ | 133,926,853 | (1) | | $ | 5,264,615 | (1) | | $ | 26,204,071 | | | $ | 979,274,495 | | $ | 102,782,413 | |
Interest and dividends receivable | | | 1,083,837 | | | | 39,182 | | | | 352,661 | | | | 1,740,660 | | | 612,121 | |
Receivable for fund shares sold | | | 58,542 | | | | — | | | | — | | | | — | | | — | |
Due from affiliates | | | — | | | | 22,959 | | | | — | | | | — | | | — | |
| | |
|
|
| |
|
|
| |
|
|
| |
|
| |
|
|
|
Total assets | | | 135,069,232 | | | | 5,326,756 | | | | 26,556,732 | | | | 981,015,155 | | | 103,394,534 | |
| | |
|
|
| |
|
|
| |
|
|
| |
|
| |
|
|
|
Liabilities: | | | | | | | | | | | | | | | | | | | |
Payable for fund shares redeemed | | | 5,581 | | | | 140,370 | | | | — | | | | — | | | — | |
Dividends payable | | | 381,751 | | | | 9,307 | | | | 64,043 | | | | 127,183 | | | 95,716 | |
Payable upon return of securities on loan | | | 8,564,259 | | | | 917,275 | | | | — | | | | — | | | — | |
Accrued expenses: | | | | | | | | | | | | | | | | | | | |
Advisory fees (Note 3) | | | 52,188 | | | | 1,451 | | | | 5,588 | | | | 162,961 | | | 20,893 | |
Administration fees (Note 3) | | | 9,394 | | | | 327 | | | | 2,012 | | | | 73,332 | | | 7,522 | |
Custodian fees (Note 3) | | | 2,292 | | | | 91 | | | | 559 | | | | 7,967 | | | 1,876 | |
Accounting fees (Note 3) | | | 3,131 | | | | 109 | | | | 670 | | | | 24,444 | | | 2,507 | |
Shareholder services fees (Note 3) | | | 12,613 | | | | 892 | | | | 4,504 | | | | 201,781 | | | 18,824 | |
Distribution services fees (Note 3) | | | 875 | | | | 175 | | | | 203 | | | | — | | | — | |
Transfer agent fees (Note 3) | | | 5,182 | | | | 3,242 | | | | 4,686 | | | | 3,825 | | | 3,196 | |
Other | | | 27,356 | | | | 20,989 | | | | 5,338 | | | | 114,879 | | | 11,944 | |
| | |
|
|
| |
|
|
| |
|
|
| |
|
| |
|
|
|
Total liabilities | | | 9,064,622 | | | | 1,094,228 | | | | 87,603 | | | | 716,372 | | | 162,478 | |
| | |
|
|
| |
|
|
| |
|
|
| |
|
| |
|
|
|
Net Assets: | | | 126,004,610 | | | | 4,232,528 | | | | 26,469,129 | | | | 980,298,783 | | | 103,232,056 | |
| | |
|
|
| |
|
|
| |
|
|
| |
|
| |
|
|
|
Composition of Net Assets: | | | | | | | | | | | | | | | | | | | |
Paid-in capital | | $ | 161,001,345 | | | $ | 14,388,336 | | | $ | 26,163,576 | | | $ | 978,855,078 | | $ | 103,441,657 | |
Undistributed net investment income/(loss) | | | — | | | | 21,043 | | | | (9,141 | ) | | | — | | | (8,840 | ) |
Accumulated net realized gains/(losses) on investments | | | (22,936,411 | ) | | | (10,093,720 | ) | | | 91,757 | | | | 1,443,705 | | | (200,761 | ) |
Net unrealized appreciation/(depreciation) of investments | | | (12,060,324 | ) | | | (83,131 | ) | | | 222,937 | | | | — | | | — | |
| | |
|
|
| |
|
|
| |
|
|
| |
|
| |
|
|
|
Net Assets | | $ | 126,004,610 | | | $ | 4,232,528 | | | $ | 26,469,129 | | | $ | 980,298,783 | | $ | 103,232,056 | |
| | |
|
|
| |
|
|
| |
|
|
| |
|
| |
|
|
|
Investments, at identified cost | | $ | 145,987,177 | | | $ | 5,347,746 | | | $ | 25,981,134 | | | $ | 979,274,495 | | $ | 102,782,413 | |
| | |
|
|
| |
|
|
| |
|
|
| |
|
| |
|
|
|
Shares Outstanding† and Net Asset Value Per Share: | | | | | | | | | | | | | | | | | | | |
Class A Shares: | | | | | | | | | | | | | | | | | | | |
Net assets | | $ | 59,138,996 | | | $ | 3,880,058 | | | $ | 21,119,194 | | | $ | 973,252,205 | | $ | 91,465,850 | |
Shares outstanding | | | 6,834,834 | | | | 496,310 | | | | 2,238,876 | | | | 971,825,777 | | | 91,515,410 | |
Net asset value and redemption price per share | | $ | 8.65 | | | $ | 7.82 | | | $ | 9.43 | | | $ | 1.00 | | $ | 1.00 | |
Offering price per share | | $ | 8.83 | (2) | | $ | 7.94 | (3) | | $ | 9.62 | (2) | | $ | 1.00 | | $ | 1.00 | |
| | |
|
|
| |
|
|
| |
|
|
| |
|
| |
|
|
|
Class C Shares: | | | | | | | | | | | | | | | | | | | |
Net assets | | $ | 1,427,268 | | | $ | 283,696 | | | $ | 315,497 | | | | — | | | — | |
Shares outstanding | | | 164,959 | | | | 36,290 | | | | 33,442 | | | | — | | | — | |
Net asset value, offering and redemption price* per share | | $ | 8.65 | | | $ | 7.82 | | | $ | 9.43 | | | | — | | | — | |
| | |
|
|
| |
|
|
| |
|
|
| |
|
| |
|
|
|
Class I Shares: | | | | | | | | | | | | | | | | | | | |
Net assets | | $ | 65,438,346 | | | $ | 68,774 | | | $ | 5,034,438 | | | $ | 7,046,578 | | $ | 11,766,206 | |
Shares outstanding | | | 7,565,335 | | | | 8,792 | | | | 533,935 | | | | 7,036,397 | | | 11,755,844 | |
Net asset value, offering and redemption price per share | | $ | 8.65 | | | $ | 7.82 | | | $ | 9.43 | | | $ | 1.00 | | $ | 1.00 | |
| † | | The Declaration of Trust permits the Board of Trustees to issue an unlimited number of full and fractional shares of beneficial interest (without par value) for each class of shares. |
| * | | Redemption price per share varies by length of time shares are held. |
| (1) | | Including $8,433,857 and $900,408 of securities loaned, respectively. |
| (2) | | Computation of Offering Price Per Share: 100/98% of net asset value. |
| (3) | | Computation of Offering Price Per Share: 100/98.5% of net asset value. |
The Notes to the Financial Statements are an integral part of, and should be read in conjunction with, the Financial Statements.
72
REGIONS MORGAN KEEGAN SELECT FUNDS
STATEMENTSOF OPERATIONS
FOR THE YEAR ENDED NOVEMBER 30, 2008
| | | | | | | | | | | | |
| | | Mid Cap
Growth Fund | | | Growth Fund | | | Core Equity Fund | |
Investment Income: | | | | | | | | | | | | |
Dividend income | | $ | 3,205,840 | (1) | | $ | 4,993,802 | (2) | | $ | 402,798 | (3) |
Proceeds from securities lending | | | 267,971 | | | | 148,123 | | | | — | |
| | |
|
|
| |
|
|
| |
|
|
|
Total investment income | | | 3,473,811 | | | | 5,141,925 | | | | 402,798 | |
| | |
|
|
| |
|
|
| |
|
|
|
Expenses: | | | | | | | | | | | | |
Advisory fees | | | 2,608,242 | | | | 2,950,781 | | | | 225,134 | |
Administration fees | | | 312,989 | | | | 354,094 | | | | 27,016 | |
Custodian fees | | | 61,613 | | | | 65,181 | | | | 7,364 | |
Accounting fees | | | 104,329 | | | | 118,031 | | | | 9,005 | |
Shareholder service fees—Class A Shares | | | 484,474 | | | | 470,494 | | | | 8,390 | |
Shareholder service fees—Class C Shares | | | 20,467 | | | | 9,610 | | | | — | |
Distribution service fees—Class C Shares | | | 61,400 | | | | 28,830 | | | | — | |
Transfer agent fees | | | 202,530 | | | | 201,490 | | | | 43,346 | |
Legal fees | | | 64,454 | | | | 72,893 | | | | 5,406 | |
Audit fees | | | 24,611 | | | | 25,636 | | | | 10,244 | |
Registration fees | | | 42,910 | | | | 44,007 | | | | 17,687 | |
Trustees’ fees | | | 7,089 | | | | 7,089 | | | | 7,088 | |
Insurance premiums | | | 2,808 | | | | 3,319 | | | | 857 | |
Printing and postage fees | | | 37,214 | | | | 43,066 | | | | 4,074 | |
Other | | | 21,460 | | | | 24,516 | | | | 7,750 | |
| | |
|
|
| |
|
|
| |
|
|
|
Total expenses | | | 4,056,590 | | | | 4,419,037 | | | | 373,361 | |
| | |
|
|
| |
|
|
| |
|
|
|
Net investment income/(loss) | | | (582,779 | ) | | | 722,888 | | | | 29,437 | |
| | |
|
|
| |
|
|
| |
|
|
|
Realized and Unrealized Gains/(Losses) on Investments: | | | | | | | | | | | | |
Net realized gains/(losses) on investments | | | 503,989 | | | | (4,458,968 | ) | | | 7,997,951 | |
Net realized gains on expired or closed options | | | 707,255 | | | | 469,232 | | | | 106,950 | |
Change in unrealized depreciation on investments | | | (162,838,720 | ) | | | (143,617,926 | ) | | | (18,519,317 | ) |
| | |
|
|
| |
|
|
| |
|
|
|
Net realized and unrealized losses on investments | | | (161,627,476 | ) | | | (147,607,662 | ) | | | (10,414,416 | ) |
| | |
|
|
| |
|
|
| |
|
|
|
Change in net assets resulting from operations | | $ | (162,210,255 | ) | | $ | (146,884,774 | ) | | $ | (10,384,979 | ) |
| | |
|
|
| |
|
|
| |
|
|
|
| | | | | | | | | | | | | |
| (1) | | Net of foreign taxes withheld of $14,220. |
| (2) | | Net of foreign taxes withheld of $16,141. |
| (3) | | Net of foreign taxes withheld of $414. |
The Notes to the Financial Statements are an integral part of, and should be read in conjunction with, the Financial Statements.
73
REGIONS MORGAN KEEGAN SELECT FUNDS
STATEMENTSOF OPERATIONS
FOR THE YEAR ENDED NOVEMBER 30, 2008
| | | | | | | | | | | | |
| | | Mid Cap Value Fund | | | Value Fund | | | Balanced Fund | |
Investment Income: | | | | | | | | | | | | |
Dividend income | | $ | 709,036 | (1) | | $ | 5,018,153 | (2) | | $ | 1,840,770 | (3) |
Interest income | | | — | | | | — | | | | 2,472,820 | |
Proceeds from securities lending | | | 37,027 | | | | — | | | | 155,219 | |
| | |
|
|
| |
|
|
| |
|
|
|
Total investment income | | | 746,063 | | | | 5,018,153 | | | | 4,468,809 | |
| | |
|
|
| |
|
|
| |
|
|
|
Expenses: | | | | | | | | | | | | |
Advisory fees | | | 392,465 | | | | 1,722,614 | | | | 1,245,402 | |
Administration fees | | | 47,096 | | | | 206,714 | | | | 149,449 | |
Custodian fees | | | 12,816 | | | | 46,675 | | | | 35,710 | |
Accounting fees | | | 15,698 | | | | 68,904 | | | | 49,816 | |
Shareholder service fees—Class A Shares | | | 58,038 | | | | 223,198 | | | | 191,130 | |
Shareholder service fees—Class C Shares | | | 1,572 | | | | 5,076 | | | | 11,247 | |
Distribution service fees—Class C Shares | | | 4,715 | | | | 15,228 | | | | 33,740 | |
Transfer agent fees | | | 64,177 | | | | 128,736 | | | | 166,984 | |
Legal fees | | | 9,751 | | | | 42,185 | | | | 30,249 | |
Audit fees | | | 12,063 | | | | 19,691 | | | | 27,169 | |
Registration fees | | | 39,521 | | | | 42,481 | | | | 41,811 | |
Trustees’ fees | | | 7,088 | | | | 7,088 | | | | 7,089 | |
Insurance premiums | | | 753 | | | | 1,921 | | | | 1,591 | |
Printing and postage fees | | | 5,233 | | | | 22,732 | | | | 15,990 | |
Other | | | 7,887 | | | | 15,849 | | | | 12,499 | |
| | |
|
|
| |
|
|
| |
|
|
|
Total expenses | | | 678,873 | | | | 2,569,092 | | | | 2,019,876 | |
| | |
|
|
| |
|
|
| |
|
|
|
Net investment income/(loss) | | | 67,190 | | | | 2,449,061 | | | | 2,448,933 | |
| | |
|
|
| |
|
|
| |
|
|
|
Realized and Unrealized Gains/(Losses) on Investments: | | | | | | | | | | | | |
Net realized losses on investments | | | (3,257,945 | ) | | | (9,508,189 | ) | | | (2,168,490 | ) |
Net realized gains on expired or closed options | | | — | | | | 178,270 | | | | 1,240,272 | |
Change in unrealized depreciation on investments | | | (19,185,849 | ) | | | (94,399,395 | ) | | | (36,673,347 | ) |
| | |
|
|
| |
|
|
| |
|
|
|
Net realized and unrealized losses on investments | | | (22,443,794 | ) | | | (103,729,314 | ) | | | (37,601,565 | ) |
| | |
|
|
| |
|
|
| |
|
|
|
Change in net assets resulting from operations | | $ | (22,376,604 | ) | | $ | (101,280,253 | ) | | $ | (35,152,632 | ) |
| | |
|
|
| |
|
|
| |
|
|
|
| | | | | | | | | | | | | |
| (1) | | Net of foreign taxes withheld of $395. |
| (2) | | Net of foreign taxes withheld of $3,691. |
| (3) | | Net of foreign taxes withheld of $6,845. |
The Notes to the Financial Statements are an integral part of, and should be read in conjunction with, the Financial Statements.
74
REGIONS MORGAN KEEGAN SELECT FUNDS
STATEMENTSOF OPERATIONS
FOR THE YEAR ENDED NOVEMBER 30, 2008
| | | | | | | | | | | | |
| | | Fixed Income Fund | | | Limited
Maturity
Fixed Income
Fund | | | Intermediate
Tax Exempt
Bond Fund | |
Investment Income: | | | | | | | | | | | | |
Interest income | | $ | 8,036,105 | | | $ | 458,452 | | | $ | 1,501,145 | |
Dividend income | | | 74,835 | | | | 9,975 | | | | 20,225 | |
Proceeds from securities lending | | | 123,156 | | | | 13,429 | | | | — | |
| | |
|
|
| |
|
|
| |
|
|
|
Total investment income | | | 8,234,096 | | | | 481,856 | | | | 1,521,370 | |
| | |
|
|
| |
|
|
| |
|
|
|
Expenses: | | | | | | | | | | | | |
Advisory fees | | | 780,971 | | | | 42,021 | | | | 93,948 | |
Administration fees | | | 140,575 | | | | 9,455 | | | | 33,821 | |
Custodian fees | | | 33,738 | | | | 2,626 | | | | 9,387 | |
Accounting fees | | | 46,858 | | | | 3,152 | | | | 11,274 | |
Shareholder service fees—Class A Shares | | | 229,254 | | | | 24,425 | | | | 78,007 | |
Shareholder service fees—Class C Shares | | | 5,559 | | | | 1,645 | | | | 2,713 | |
Distribution service fees—Class C Shares | | | 16,676 | | | | 4,936 | | | | 8,138 | |
Transfer agent fees | | | 81,420 | | | | 38,403 | | | | 54,634 | |
Legal fees | | | 20,006 | | | | 1,845 | | | | 3,416 | |
Audit fees | | | 9,918 | | | | 13,994 | | | | 7,277 | |
Registration fees | | | 34,007 | | | | 42,897 | | | | 24,632 | |
Trustees’ fees | | | 7,088 | | | | 7,088 | | | | 7,088 | |
Insurance premiums | | | 1,702 | | | | 346 | | | | 696 | |
Printing and postage fees | | | 12,252 | | | | 1,240 | | | | 2,228 | |
Other | | | 12,597 | | | | 7,284 | | | | 5,547 | |
| | |
|
|
| |
|
|
| |
|
|
|
Total expenses | | | 1,432,621 | | | | 201,357 | | | | 342,806 | |
Expenses voluntarily waived by the Fund’s adviser (Note 3) | | | — | | | | (87,859 | ) | | | — | |
| | |
|
|
| |
|
|
| |
|
|
|
Net Expenses | | | 1,432,621 | | | | 113,498 | | | | 342,806 | |
| | |
|
|
| |
|
|
| |
|
|
|
Net investment income | | | 6,801,475 | | | | 368,358 | | | | 1,178,564 | |
| | |
|
|
| |
|
|
| |
|
|
|
Realized and Unrealized Gains/(Losses) on Investments: | | | | | | | | | | | | |
Net realized gains/(losses) on investments | | | (7,276,721 | ) | | | (1,889,634 | ) | | | 70,237 | |
Change in unrealized appreciation/(depreciation) on investments | | | (7,330,125 | ) | | | 745,049 | | | | (240,961 | ) |
| | |
|
|
| |
|
|
| |
|
|
|
Net realized and unrealized losses on investments | | | (14,606,846 | ) | | | (1,144,585 | ) | | | (170,724 | ) |
| | |
|
|
| |
|
|
| |
|
|
|
Change in net assets resulting from operations | | $ | (7,805,371 | ) | | $ | (776,227 | ) | | $ | 1,007,840 | |
| | |
|
|
| |
|
|
| |
|
|
|
| | | | | | | | | | | | | |
The Notes to the Financial Statements are an integral part of, and should be read in conjunction with, the Financial Statements.
75
REGIONS MORGAN KEEGAN SELECT FUNDS
STATEMENTSOF OPERATIONS
FOR THE YEAR ENDED NOVEMBER 30, 2008
| | | | | | | |
| | | Treasury
Money
Market
Fund | | Money
Market
Fund | |
Investment Income: | | | | | | | |
Interest income | | $ | 21,291,420 | | $ | 3,862,760 | |
Dividend income | | | 1,004,184 | | | 251,160 | |
Proceeds from securities lending | | | 194,208 | | | — | |
| | |
|
| |
|
|
|
Total investment income | | | 22,489,812 | | | 4,113,920 | |
| | |
|
| |
|
|
|
Expenses: | | | | | | | |
Advisory fees | | | 2,202,499 | | | 337,464 | |
Administration fees | | | 991,126 | | | 121,487 | |
Custodian fees | | | 102,561 | | | 29,497 | |
Accounting fees | | | 330,374 | | | 40,496 | |
Shareholder service fees—Class A Shares | | | 2,742,283 | | | 311,319 | |
Transfer agent fees | | | 234,924 | | | 25,660 | |
Legal fees | | | 208,855 | | | 17,531 | |
Audit fees | | | 117,116 | | | 5,991 | |
Registration fees | | | 30,699 | | | 11,045 | |
Trustees’ fees | | | 7,089 | | | 7,088 | |
Insurance premiums | | | 48,181 | | | 469 | |
Printing and postage fees | | | 102,014 | | | 3,038 | |
Other | | | 70,573 | | | 1,244 | |
| | |
|
| |
|
|
|
Total expenses | | | 7,188,294 | | | 912,329 | |
| | |
|
| |
|
|
|
Net investment income | | | 15,301,518 | | | 3,201,591 | |
| | |
|
| |
|
|
|
Realized and Unrealized Gains/(Losses) on Investments: | | | | | | | |
Net realized gains/(losses) on investments | | | 1,443,705 | | | (2,687 | ) |
Change in unrealized appreciation/(depreciation) on investments | | | — | | | — | |
| | |
|
| |
|
|
|
Net realized and unrealized gains/(losses) on investments | | | 1,443,705 | | | (2,687 | ) |
| | |
|
| |
|
|
|
Change in net assets resulting from operations | | $ | 16,745,223 | | $ | 3,198,904 | |
| | |
|
| |
|
|
|
| | | | | | | | |
The Notes to the Financial Statements are an integral part of, and should be read in conjunction with, the Financial Statements.
76
REGIONS MORGAN KEEGAN SELECT FUNDS
STATEMENTSOF CHANGESIN NET ASSETS
| | | | | | | | | | | | | | | | |
| | | Mid Cap Growth Fund
| | | Growth Fund
| |
| | | Year Ended
November 30, 2008 | | | Year Ended
November 30, 2007 | | | Year Ended
November 30, 2008 | | | Year Ended
November 30, 2007 | |
Change in Net Assets: | | | | | | | | | | | | | | | | |
Operations: | | | | | | | | | | | | | | | | |
Net investment income/(loss) | | $ | (582,779 | ) | | $ | (1,225,033 | ) | | $ | 722,888 | | | $ | 593,805 | |
Net realized gains/(losses) on investments | | | 1,211,244 | | | | 45,784,252 | | | | (3,989,736 | ) | | | 45,263,010 | |
Net change in unrealized appreciation/(depreciation) on investments | | | (162,838,720 | ) | | | 2,298,192 | | | | (143,617,926 | ) | | | 20,226,334 | |
| | |
|
|
| |
|
|
| |
|
|
| |
|
|
|
Change in net assets resulting from operations | | | (162,210,255 | ) | | | 46,857,411 | | | | (146,884,774 | ) | | | 66,083,149 | |
| | |
|
|
| |
|
|
| |
|
|
| |
|
|
|
Distributions to Shareholders: | | | | | | | | | | | | | | | | |
Distributions from net investment income: | | | | | | | | | | | | | | | | |
Class A Shares | | | — | | | | — | | | | (63,501 | ) | | | (426,641 | ) |
Class C Shares | | | — | | | | — | | | | — | | | | — | |
Class I Shares | | | — | | | | — | | | | (287,602 | ) | | | (248,364 | ) |
Distributions from net realized gain on investments: | | | | | | | | | | | | | | | | |
Class A Shares | | | (35,505,979 | ) | | | (44,384,965 | ) | | | (11,292,017 | ) | | | — | |
Class C Shares | | | (1,235,800 | ) | | | (1,195,467 | ) | | | (171,931 | ) | | | — | |
Class I Shares | | | (7,889,191 | ) | | | (518,880 | ) | | | (3,701,691 | ) | | | — | |
| | |
|
|
| |
|
|
| |
|
|
| |
|
|
|
Change in net assets resulting from distributions to shareholders | | | (44,630,970 | ) | | | (46,099,312 | ) | | | (15,516,742 | ) | | | (675,005 | ) |
| | |
|
|
| |
|
|
| |
|
|
| |
|
|
|
Capital Transactions: | | | | | | | | | | | | | | | | |
Change in net assets resulting from capital transactions (Note 7) | | | 38,209,098 | | | | 19,474,335 | | | | (94,212,917 | ) | | | 22,657,020 | |
| | |
|
|
| |
|
|
| |
|
|
| |
|
|
|
Change in net assets | | | (168,632,127 | ) | | | 20,232,434 | | | | (256,614,433 | ) | | | 88,065,164 | |
Net Assets: | | | | | | | | | | | | | | | | |
Beginning of period | | | 385,776,402 | | | | 365,543,968 | | | | 506,229,771 | | | | 418,164,607 | |
| | |
|
|
| |
|
|
| |
|
|
| |
|
|
|
End of period | | $ | 217,144,275 | | | $ | 385,776,402 | | | $ | 249,615,338 | | | $ | 506,229,771 | |
| | |
|
|
| |
|
|
| |
|
|
| |
|
|
|
Undistributed net investment income/(loss) | | $ | — | | | $ | (1,223,840 | ) | | $ | 402,777 | | | $ | 31,991 | |
| | |
|
|
| |
|
|
| |
|
|
| |
|
|
|
| | | | | | | | | | | | | | | | | |
The Notes to the Financial Statements are an integral part of, and should be read in conjunction with, the Financial Statements.
77
REGIONS MORGAN KEEGAN SELECT FUNDS
STATEMENTSOF CHANGESIN NET ASSETS
| | | | | | | | | | | | | | | | |
| | | Core Equity Fund
| | | Mid Cap Value Fund
| |
| | | Year Ended November 30, 2008 | | | Year Ended November 30, 2007 | | | Year Ended November 30, 2008 | | | Year Ended November 30, 2007 | |
Change in Net Assets: | | | | | | | | | | | | | | | | |
Operations: | | | | | | | | | | | | | | | | |
Net investment income/(loss) | | $ | 29,437 | | | $ | 601,811 | | | $ | 67,190 | | | $ | 70,380 | |
Net realized gains/(losses) on investments | | | 8,104,901 | | | | 9,806,579 | | | | (3,257,945 | ) | | | 5,608,095 | |
Net change in unrealized appreciation/(depreciation) on investments | | | (18,519,317 | ) | | | (2,573,834 | ) | | | (19,185,849 | ) | | | (2,492,622 | ) |
| | |
|
|
| |
|
|
| |
|
|
| |
|
|
|
Change in net assets resulting from operations | | | (10,384,979 | ) | | | 7,834,556 | | | | (22,376,604 | ) | | | 3,185,853 | |
| | |
|
|
| |
|
|
| |
|
|
| |
|
|
|
Distributions to Shareholders: | | | | | | | | | | | | | | | | |
Distributions from net investment income: | | | | | | | | | | | | | | | | |
Class A Shares | | | (5,603 | ) | | | (36,740 | ) | | | — | | | | — | |
Class C Shares | | | — | | | | — | | | | — | | | | — | |
Class I Shares | | | (99,876 | ) | | | (677,088 | ) | | | (100,052 | ) | | | — | |
Distributions from net realized gain on investments: | | | | | | | | | | | | | | | | |
Class A Shares | | | (714,711 | ) | | | (1,237,931 | ) | | | (3,253,965 | ) | | | (2,964,671 | ) |
Class C Shares | | | (16 | ) | | | (21 | ) | | | (55,170 | ) | | | (51,238 | ) |
Class I Shares | | | (9,092,455 | ) | | | (19,477,443 | ) | | | (1,094,247 | ) | | | (5,233 | ) |
| | |
|
|
| |
|
|
| |
|
|
| |
|
|
|
Change in net assets resulting from distributions to shareholders | | | (9,912,661 | ) | | | (21,429,223 | ) | | | (4,503,434 | ) | | | (3,021,142 | ) |
| | |
|
|
| |
|
|
| |
|
|
| |
|
|
|
Capital Transactions: | | | | | | | | | | | | | | | | |
Change in net assets resulting from capital transactions (Note 7) | | | (37,572,930 | ) | | | (19,873,318 | ) | | | (13,612,466 | ) | | | (3,168,597 | ) |
| | |
|
|
| |
|
|
| |
|
|
| |
|
|
|
Change in net assets | | | (57,870,570 | ) | | | (33,467,985 | ) | | | (40,492,504 | ) | | | (3,003,886 | ) |
Net Assets: | | | | | | | | | | | | | | | | |
Beginning of period | | | 66,621,587 | | | | 100,089,572 | | | | 74,189,671 | | | | 77,193,557 | |
| | |
|
|
| |
|
|
| |
|
|
| |
|
|
|
End of period | | $ | 8,751,017 | | | $ | 66,621,587 | | | $ | 33,697,167 | | | $ | 74,189,671 | |
| | |
|
|
| |
|
|
| |
|
|
| |
|
|
|
Undistributed net investment income/(loss) | | $ | (1,848 | ) | | $ | 74,194 | | | $ | 36,619 | | | $ | 70,380 | |
| | |
|
|
| |
|
|
| |
|
|
| |
|
|
|
| | | | | | | | | | | | | | | | | |
The Notes to the Financial Statements are an integral part of, and should be read in conjunction with, the Financial Statements.
78
REGIONS MORGAN KEEGAN SELECT FUNDS
STATEMENTSOF CHANGESIN NET ASSETS
| | | | | | | | | | | | | | | | |
| | | Value Fund
| | | Balanced Fund
| |
| | | Year Ended November 30, 2008 | | | Year Ended November 30, 2007 | | | Year Ended November 30, 2008 | | | Year Ended November 30, 2007 | |
Change in Net Assets: | | | | | | | | | | | | | | | | |
Operations: | | | | | | | | | | | | | | | | |
Net investment income/(loss) | | $ | 2,449,061 | | | $ | 2,518,750 | | | $ | 2,448,933 | | | $ | 2,029,034 | |
Net realized gains/(losses) on investments | | | (9,329,919 | ) | | | 20,098,966 | | | | (928,218 | ) | | | 14,821,402 | |
Net change in unrealized appreciation/(depreciation) on investments | | | (94,399,395 | ) | | | 17,163,968 | | | | (36,673,347 | ) | | | 1,339,593 | |
| | |
|
|
| |
|
|
| |
|
|
| |
|
|
|
Change in net assets resulting from operations | | | (101,280,253 | ) | | | 39,781,684 | | | | (35,152,632 | ) | | | 18,190,029 | |
| | |
|
|
| |
|
|
| |
|
|
| |
|
|
|
Distributions to Shareholders: | | | | | | | | | | | | | | | | |
Distributions from net investment income: | | | | | | | | | | | | | | | | |
Class A Shares | | | (1,111,385 | ) | | | (2,331,976 | ) | | | (1,186,798 | ) | | | (2,047,156 | ) |
Class C Shares | | | — | | | | — | | | | (22,451 | ) | | | (5,878 | ) |
Class I Shares | | | (1,352,991 | ) | | | (132,289 | ) | | | (1,100,504 | ) | | | (6,629 | ) |
Distributions from net realized gain on investments: | | | | | | | | | | | | | | | | |
Class A Shares | | | (2,924,393 | ) | | | — | | | | (14,126,867 | ) | | | (5,291,763 | ) |
Class C Shares | | | (35,164 | ) | | | — | | | | (603,750 | ) | | | (28,204 | ) |
Class I Shares | | | (426,905 | ) | | | — | | | | (19,152 | ) | | | (16,916 | ) |
| | |
|
|
| |
|
|
| |
|
|
| |
|
|
|
Change in net assets resulting from distributions to shareholders | | | (5,850,838 | ) | | | (2,464,265 | ) | | | (17,059,522 | ) | | | (7,396,546 | ) |
| | |
|
|
| |
|
|
| |
|
|
| |
|
|
|
Capital Transactions: | | | | | | | | | | | | | | | | |
Change in net assets resulting from capital transactions (Note 7) | | | (2,215,941 | ) | | | (26,564,813 | ) | | | 6,194,931 | | | | (14,799,267 | ) |
| | |
|
|
| |
|
|
| |
|
|
| |
|
|
|
Change in net assets | | | (109,347,032 | ) | | | 10,752,606 | | | | (46,017,223 | ) | | | (4,005,784 | ) |
Net Assets: | | | | | | | | | | | | | | | | |
Beginning of period | | | 265,100,647 | | | | 254,348,041 | | | | 173,767,816 | | | | 177,773,600 | |
| | |
|
|
| |
|
|
| |
|
|
| |
|
|
|
End of period | | $ | 155,753,615 | | | $ | 265,100,647 | | | $ | 127,750,593 | | | $ | 173,767,816 | |
| | |
|
|
| |
|
|
| |
|
|
| |
|
|
|
Undistributed net investment income/(loss) | | $ | 673,502 | | | $ | 689,354 | | | $ | 571,603 | | | $ | 381,965 | |
| | |
|
|
| |
|
|
| |
|
|
| |
|
|
|
| | | | | | | | | | | | | | | | | |
The Notes to the Financial Statements are an integral part of, and should be read in conjunction with, the Financial Statements.
79
REGIONS MORGAN KEEGAN SELECT FUNDS
STATEMENTSOF CHANGESIN NET ASSETS
| | | | | | | | | | | | | | | | |
| | | Fixed Income Fund
| | | Limited Maturity Fixed Income Fund
| |
| | | Year Ended November 30, 2008 | | | Year Ended November 30, 2007 | | | Year Ended November 30, 2008 | | | Year Ended November 30, 2007 | |
Change in Net Assets: | | | | | | | | | | | | | | | | |
Operations: | | | | | | | | | | | | | | | | |
Net investment income/(loss) | | $ | 6,801,475 | | | $ | 11,009,240 | | | $ | 368,358 | | | $ | 1,519,520 | |
Net realized gains/(losses) on investments | | | (7,276,721 | ) | | | (10,796,662 | ) | | | (1,889,634 | ) | | | (1,939,293 | ) |
Net change in unrealized appreciation/(depreciation) on investments | | | (7,330,125 | ) | | | (4,536,576 | ) | | | 745,049 | | | | (1,232,991 | ) |
| | |
|
|
| |
|
|
| |
|
|
| |
|
|
|
Change in net assets resulting from operations | | | (7,805,371 | ) | | | (4,323,998 | ) | | | (776,227 | ) | | | (1,652,764 | ) |
| | |
|
|
| |
|
|
| |
|
|
| |
|
|
|
Distributions to Shareholders: | | | | | | | | | | | | | | | | |
Distributions from net investment income: | | | | | | | | | | | | | | | | |
Class A Shares | | | (3,967,115 | ) | | | (8,196,929 | ) | | | (381,780 | ) | | | (1,703,665 | ) |
Class C Shares | | | (79,288 | ) | | | (111,583 | ) | | | (20,916 | ) | | | (31,593 | ) |
Class I Shares | | | (2,816,760 | ) | | | (2,803,171 | ) | | | (653 | ) | | | (5 | ) |
| | |
|
|
| |
|
|
| |
|
|
| |
|
|
|
Change in net assets resulting from distributions to shareholders | | | (6,863,163 | ) | | | (11,111,683 | ) | | | (403,349 | ) | | | (1,735,263 | ) |
| | |
|
|
| |
|
|
| |
|
|
| |
|
|
|
Capital Transactions: | | | | | | | | | | | | | | | | |
Change in net assets resulting from capital transactions (Note 7) | | | (41,684,606 | ) | | | (73,909,580 | ) | | | (16,801,059 | ) | | | (26,828,049 | ) |
| | |
|
|
| |
|
|
| |
|
|
| |
|
|
|
Change in net assets | | | (56,353,140 | ) | | | (89,345,261 | ) | | | (17,980,635 | ) | | | (30,216,076 | ) |
Net Assets: | | | | | | | | | | | | | | | | |
Beginning of period | | | 182,357,750 | | | | 271,703,011 | | | | 22,213,163 | | | | 52,429,239 | |
| | |
|
|
| |
|
|
| |
|
|
| |
|
|
|
End of period | | $ | 126,004,610 | | | $ | 182,357,750 | | | $ | 4,232,528 | | | $ | 22,213,163 | |
| | |
|
|
| |
|
|
| |
|
|
| |
|
|
|
Undistributed net investment income/(loss) | | $ | — | | | $ | (102,443 | ) | | $ | 21,043 | | | $ | (1,623 | ) |
| | |
|
|
| |
|
|
| |
|
|
| |
|
|
|
| | | | | | | | | | | | | | | | | |
The Notes to the Financial Statements are an integral part of, and should be read in conjunction with, the Financial Statements.
80
REGIONS MORGAN KEEGAN SELECT FUNDS
STATEMENTSOF CHANGESIN NET ASSETS
| | | | | | | | |
| | | Intermediate Tax Exempt Bond Fund
| |
| | | Year Ended November 30, 2008 | | | Year Ended November 30, 2007 | |
Change in Net Assets: | | | | | | | | |
Operations: | | | | | | | | |
Net investment income/(loss) | | $ | 1,178,564 | | | $ | 1,656,605 | |
Net realized gains/(losses) on investments | | | 70,237 | | | | 28,911 | |
Net change in unrealized appreciation/(depreciation) on investments | | | (240,961 | ) | | | (145,091 | ) |
| | |
|
|
| |
|
|
|
Change in net assets resulting from operations | | | 1,007,840 | | | | 1,540,425 | |
| | |
|
|
| |
|
|
|
Distributions to Shareholders: | | | | | | | | |
Distributions from net investment income: | | | | | | | | |
Class A Shares | | | (974,209 | ) | | | (1,426,501 | ) |
Class C Shares | | | (26,034 | ) | | | (22,448 | ) |
Class I Shares | | | (173,603 | ) | | | (181,127 | ) |
Distributions from net realized gain on investments: | | | | | | | | |
Class A Shares | | | (38,898 | ) | | | — | |
Class C Shares | | | (2,663 | ) | | | — | |
Class I Shares | | | (5,313 | ) | | | — | |
| | |
|
|
| |
|
|
|
Change in net assets resulting from distributions to shareholders | | | (1,220,720 | ) | | | (1,630,076 | ) |
| | |
|
|
| |
|
|
|
Capital Transactions: | | | | | | | | |
Change in net assets resulting from capital transactions (Note 7) | | | (28,020,451 | ) | | | 2,087,718 | |
| | |
|
|
| |
|
|
|
Change in net assets | | | (28,233,331 | ) | | | 1,998,067 | |
Net Assets: | | | | | | | | |
Beginning of period | | | 54,702,460 | | | | 52,704,393 | |
| | |
|
|
| |
|
|
|
End of period | | $ | 26,469,129 | | | $ | 54,702,460 | |
| | |
|
|
| |
|
|
|
Undistributed net investment income/(loss) | | $ | (9,141 | ) | | $ | — | |
| | |
|
|
| |
|
|
|
| | | | | | | | | |
The Notes to the Financial Statements are an integral part of, and should be read in conjunction with, the Financial Statements.
81
REGIONS MORGAN KEEGAN SELECT FUNDS
STATEMENTSOF CHANGESIN NET ASSETS
| | | | | | | | | | | | | | | | |
| | | Treasury Money Market Fund
| | | Money Market Fund
| |
| | | Year Ended November 30, 2008 | | | Year Ended November 30, 2007 | | | Year Ended November 30, 2008 | | | Year Ended November 30, 2007 | |
Change in Net Assets: | | | | | | | | | | | | | | | | |
Operations: | | | | | | | | | | | | | | | | |
Net investment income | | $ | 15,301,518 | | | $ | 49,263,771 | | | $ | 3,201,591 | | | $ | 5,100,767 | |
Net realized gains/(losses) on investments | | | 1,443,705 | | | | 707,214 | | | | (2,687 | ) | | | (2,890 | ) |
| | |
|
|
| |
|
|
| |
|
|
| |
|
|
|
Change in net assets resulting from operations | | | 16,745,223 | | | | 49,970,985 | | | | 3,198,904 | | | | 5,097,877 | |
| | |
|
|
| |
|
|
| |
|
|
| |
|
|
|
Distributions to Shareholders: | | | | | | | | | | | | | | | | |
Distributions from net investment income: | | | | | | | | | | | | | | | | |
Class A Shares | | | (15,261,633 | ) | | | (49,245,664 | ) | | | (2,918,130 | ) | | | (4,678,888 | ) |
Class I Shares | | | (39,880 | ) | | | (18,112 | ) | | | (248,102 | ) | | | (466,078 | ) |
Distributions from net realized gain on investments: | | | | | | | | | | | | | | | | |
Class A Shares | | | (706,476 | ) | | | — | | | | — | | | | — | |
Class I Shares | | | (614 | ) | | | — | | | | — | | | | — | |
| | |
|
|
| |
|
|
| |
|
|
| |
|
|
|
Change in net assets resulting from distributions to shareholders | | | (16,008,603 | ) | | | (49,263,776 | ) | | | (3,166,232 | ) | | | (5,144,966 | ) |
| | |
|
|
| |
|
|
| |
|
|
| |
|
|
|
Capital Transactions: | | | | | | | | | | | | | | | | |
Change in net assets resulting from capital transactions (Note 7) | | | (278,708,781 | ) | | | 171,011,389 | | | | (44,799,831 | ) | | | 58,916,144 | |
| | |
|
|
| |
|
|
| |
|
|
| |
|
|
|
Change in net assets | | | (277,972,161 | ) | | | 171,718,598 | | | | (44,767,159 | ) | | | 58,869,055 | |
Net Assets: | | | | | | | | | | | | | | | | |
Beginning of period | | | 1,258,270,944 | | | | 1,086,552,346 | | | | 147,999,215 | | | | 89,130,160 | |
| | |
|
|
| |
|
|
| |
|
|
| |
|
|
|
End of period | | $ | 980,298,783 | | | $ | 1,258,270,944 | | | $ | 103,232,056 | | | $ | 147,999,215 | |
| | |
|
|
| |
|
|
| |
|
|
| |
|
|
|
Undistributed net investment income/(loss) | | $ | — | | | $ | (5 | ) | | $ | (8,840 | ) | | $ | 1,206 | |
| | |
|
|
| |
|
|
| |
|
|
| |
|
|
|
| | | | | | | | | | | | | | | | | |
The Notes to the Financial Statements are an integral part of, and should be read in conjunction with, the Financial Statements.
82
[THIS PAGE INTENTIONALLY LEFT BLANK]
83
REGIONS MORGAN KEEGAN SELECT FUNDS
FINANCIAL HIGHLIGHTS
SELECTED DATA FORA SHARE OUTSTANDING THROUGHOUTTHE PERIOD INDICATED:
| | | | | | | | | | | | | | | | | | |
| | | Net Asset
Value,
Beginning
of Period | | Net
Investment
Income/(Loss) | | | Net Realized
and Unrealized
Gains/(Losses)
on Investments | | | Total
From
Investment
Operations | | | Dividends
from Net
Investment
Income | | | Distributions
from Capital
Gains | |
Mid Cap Growth Fund | | | | | | | | | | | | | | | | | | |
Class A Shares | | | | | | | | | | | | | | | | | | |
Year Ended November 30, 2008 | | $ | 18.63 | | (0.05 | ) | | (6.84 | ) | | (6.89 | ) | | — | | | (2.15 | ) |
Year Ended November 30, 2007 | | $ | 18.82 | | (0.06 | ) | | 2.27 | | | 2.21 | | | — | | | (2.40 | ) |
Year Ended November 30, 2006 | | $ | 18.06 | | (0.06 | ) | | 1.82 | | | 1.76 | | | — | | | (1.00 | ) |
Year Ended November 30, 2005 | | $ | 16.57 | | (0.07 | ) | | 2.93 | | | 2.86 | | | — | | | (1.37 | ) |
Year Ended November 30, 2004 | | $ | 15.49 | | (0.11 | ) | | 1.19 | | | 1.08 | | | — | | | — | |
| | | | | | |
Mid Cap Growth Fund | | | | | | | | | | | | | | | | | | |
Class C Shares | | | | | | | | | | | | | | | | | | |
Year Ended November 30, 2008 | | $ | 17.93 | | (0.17 | ) | | (6.52 | ) | | (6.69 | ) | | — | | | (2.15 | ) |
Year Ended November 30, 2007 | | $ | 18.24 | | (0.18 | ) | | 2.27 | | | 2.09 | | | — | | | (2.40 | ) |
Year Ended November 30, 2006 | | $ | 17.61 | | (0.06 | ) | | 1.69 | | | 1.63 | | | — | | | (1.00 | ) |
Year Ended November 30, 2005 | | $ | 16.24 | | (0.07 | ) | | 2.81 | | | 2.74 | | | — | | | (1.37 | ) |
Year Ended November 30, 2004 | | $ | 15.29 | | (0.11 | ) | | 1.06 | | | 0.95 | | | — | | | — | |
| | | | | | |
Mid Cap Growth Fund | | | | | | | | | | | | | | | | | | |
Class I Shares | | | | | | | | | | | | | | | | | | |
Year Ended November 30, 2008 | | $ | 18.77 | | — | | | (6.92 | ) | | (6.92 | ) | | — | | | (2.15 | ) |
Year Ended November 30, 2007 | | $ | 18.92 | | (0.02 | ) | | 2.27 | | | 2.25 | | | — | | | (2.40 | ) |
Year Ended November 30, 2006 | | $ | 18.11 | | (0.06 | ) | | 1.87 | | | 1.81 | | | — | | | (1.00 | ) |
Year Ended November 30, 2005 | | $ | 16.59 | | (0.07 | ) | | 2.96 | | | 2.89 | | | — | | | (1.37 | ) |
Period Ended November 30, 2004 (7) | | $ | 16.16 | | (0.11 | ) | | 0.54 | | | 0.43 | | | — | | | — | |
| | | | | | |
Growth Fund | | | | | | | | | | | | | | | | | | |
Class A Shares | | | | | | | | | | | | | | | | | | |
Year Ended November 30, 2008 | | $ | 20.82 | | (0.01 | ) | | (7.20 | ) | | (7.21 | ) | | — | (6) | | (0.63 | ) |
Year Ended November 30, 2007 | | $ | 18.21 | | 0.02 | | | 2.61 | | | 2.63 | | | (0.02 | ) | | — | |
Year Ended November 30, 2006 | | $ | 16.93 | | 0.02 | | | 1.28 | | | 1.30 | | | (0.02 | ) | | — | |
Year Ended November 30, 2005 | | $ | 15.33 | | 0.04 | | | 1.65 | | | 1.69 | | | (0.09 | ) | | — | |
Year Ended November 30, 2004 | | $ | 15.04 | | 0.06 | | | 0.23 | | | 0.29 | | | — | | | — | |
| | | | | | |
Growth Fund | | | | | | | | | | | | | | | | | | |
Class C Shares | | | | | | | | | | | | | | | | | | |
Year Ended November 30, 2008 | | $ | 20.19 | | (0.17 | ) | | (6.94 | ) | | (7.11 | ) | | — | | | (0.63 | ) |
Year Ended November 30, 2007 | | $ | 17.69 | | — | | | 2.50 | | | 2.50 | | | — | | | — | |
Year Ended November 30, 2006 | | $ | 16.52 | | — | | | 1.17 | | | 1.17 | | | — | | | — | |
Year Ended November 30, 2005 | | $ | 15.02 | | 0.01 | | | 1.55 | | | 1.56 | | | (0.06 | ) | | — | |
Year Ended November 30, 2004 | | $ | 14.84 | | 0.06 | | | 0.12 | | | 0.18 | | | — | | | — | |
| | | | | | |
Growth Fund | | | | | | | | | | | | | | | | | | |
Class I Shares | | | | | | | | | | | | | | | | | | |
Year Ended November 30, 2008 | | $ | 20.80 | | 0.08 | | | (7.25 | ) | | (7.17 | ) | | (0.03 | ) | | (0.63 | ) |
Year Ended November 30, 2007 | | $ | 18.19 | | 0.07 | | | 2.61 | | | 2.68 | | | (0.07 | ) | | — | |
Year Ended November 30, 2006 | | $ | 16.94 | | 0.10 | | | 1.25 | | | 1.35 | | | (0.10 | ) | | — | |
Period Ended November 30, 2005 (8) | | $ | 15.52 | | (0.04 | ) | | 1.47 | | | 1.43 | | | (0.01 | ) | | — | |
| (1) | | Total return is based on net asset value, which excludes the sales charge or contingent deferred sales charge, if applicable. |
| (2) | | Not annualized for periods less than one year. |
| (3) | | Ratio annualized for periods less than one year. |
| (4) | | Portfolio turnover rate is calculated on the basis of the Fund as a whole without distinguishing between classes of shares issued. |
| (5) | | This voluntary expense decrease is reflected in both the net expense and net investment income/(loss) ratios shown. |
The Notes to the Financial Statements are an integral part of, and should be read in conjunction with, the Financial Statements.
84
REGIONS MORGAN KEEGAN SELECT FUNDS
| | | | | | | | | | | | | | | | | | | | | | |
| | | | | | | | | Ratios to Average Net Assets
| | | Supplemental Data
| |
Total
Distributions | | | Net Asset
Value, End of
Period | | Total
Return (1, 2) | | | Net
Investment
Income (3) | | | Net
Expenses (3) | | | Expenses Waiver/
Reimbursement (3, 5) | | | Net Assets,
End of Period
(000's) | | Portfolio
Turnover
Rate (4) | |
| | | | | | | | | | | | | | | | | | | | | | | |
| | | | | | | | | | | | | | | | | | | | | | | |
| (2.15 | ) | | $ | 9.59 | | (41.79 | )% | | (0.25 | )% | | 1.25 | % | | — | | | $ | 97,154 | | 38 | % |
| (2.40 | ) | | $ | 18.63 | | 13.72 | % | | (0.34 | )% | | 1.23 | % | | — | | | $ | 308,921 | | 52 | % |
| (1.00 | ) | | $ | 18.82 | | 10.27 | % | | (0.32 | )% | | 1.25 | % | | — | | | $ | 352,742 | | 67 | % |
| (1.37 | ) | | $ | 18.06 | | 18.91 | % | | (0.40 | )% | | 1.26 | % | | — | | | $ | 318,644 | | 73 | % |
| — | | | $ | 16.57 | | 6.97 | % | | (0.69 | )% | | 1.29 | % | | — | | | $ | 294,325 | | 56 | % |
| | | | | | | |
| | | | | | | | | | | | | | | | | | | | | | | |
| | | | | | | | | | | | | | | | | | | | | | | |
| (2.15 | ) | | $ | 9.09 | | (42.37 | )% | | (1.00 | )% | | 2.00 | % | | — | | | $ | 4,457 | | 38 | % |
| (2.40 | ) | | $ | 17.93 | | 13.48 | % | | (1.09 | )% | | 1.98 | % | | — | | | $ | 10,345 | | 52 | % |
| (1.00 | ) | | $ | 18.24 | | 9.76 | % | | (1.07 | )% | | 2.00 | % | | — | | | $ | 9,168 | | 67 | % |
| (1.37 | ) | | $ | 17.61 | | 18.54 | % | | (1.15 | )% | | 2.01 | % | | — | | | $ | 5,984 | | 73 | % |
| — | | | $ | 16.24 | | 6.21 | % | | (1.39 | )% | | 1.99 | % | | — | | | $ | 5,353 | | 56 | % |
| | | | | | | |
| | | | | | | | | | | | | | | | | | | | | | | |
| | | | | | | | | | | | | | | | | | | | | | | |
| (2.15 | ) | | $ | 9.70 | | (41.62 | )% | | — | | | 1.00 | % | | — | | | $ | 115,533 | | 38 | % |
| (2.40 | ) | | $ | 18.77 | | 13.87 | % | | (0.09 | )% | | 0.98 | % | | — | | | $ | 66,510 | | 52 | % |
| (1.00 | ) | | $ | 18.92 | | 10.52 | % | | (0.07 | )% | | 1.00 | % | | — | | | $ | 3,634 | | 67 | % |
| (1.37 | ) | | $ | 18.11 | | 19.09 | % | | (0.15 | )% | | 1.01 | % | | — | | | $ | 1,315 | | 73 | % |
| — | | | $ | 16.59 | | 2.66 | % | | (0.40 | )% | | 1.00 | % | | — | | | $ | 1,032 | | 56 | % |
| | | | | | | |
| | | | | | | | | | | | | | | | | | | | | | | |
| | | | | | | | | | | | | | | | | | | | | | | |
| (0.63 | ) | | $ | 12.98 | | (35.65 | )% | | 0.06 | % | | 1.25 | % | | — | | | $ | 97,374 | | 26 | % |
| (0.02 | ) | | $ | 20.82 | | 14.46 | % | | 0.10 | % | | 1.21 | % | | — | | | $ | 379,550 | | 41 | % |
| (0.02 | ) | | $ | 18.21 | | 7.67 | % | | 0.12 | % | | 1.25 | % | | — | | | $ | 387,871 | | 27 | % |
| (0.09 | ) | | $ | 16.93 | | 11.06 | % | | 0.22 | % | | 1.23 | % | | 0.05 | % | | $ | 385,900 | | 53 | % |
| — | | | $ | 15.33 | | 1.93 | % | | 0.37 | % | | 1.27 | % | | 0.05 | % | | $ | 411,785 | | 33 | % |
| | | | | | | |
| | | | | | | | | | | | | | | | | | | | | | | |
| | | | | | | | | | | | | | | | | | | | | | | |
| (0.63 | ) | | $ | 12.45 | | (36.30 | )% | | (0.69 | )% | | 2.00 | % | | — | | | $ | 2,234 | | 26 | % |
| — | | | $ | 20.19 | | 14.13 | % | | (0.65 | )% | | 1.96 | % | | — | | | $ | 5,562 | | 41 | % |
| — | | | $ | 17.69 | | 7.08 | % | | (0.63 | )% | | 2.00 | % | | — | | | $ | 3,609 | | 27 | % |
| (0.06 | ) | | $ | 16.52 | | 10.43 | % | | (0.53 | )% | | 1.98 | % | | 0.05 | % | | $ | 3,082 | | 53 | % |
| — | | | $ | 15.02 | | 1.21 | % | | (0.32 | )% | | 1.96 | % | | 0.05 | % | | $ | 2,955 | | 33 | % |
| | | | | | | |
| | | | | | | | | | | | | | | | | | | | | | | |
| | | | | | | | | | | | | | | | | | | | | | | |
| (0.66 | ) | | $ | 12.97 | | (35.53 | )% | | 0.31 | % | | 1.00 | % | | — | | | $ | 150,007 | | 26 | % |
| (0.07 | ) | | $ | 20.80 | | 14.75 | % | | 0.35 | % | | 0.96 | % | | — | | | $ | 121,118 | | 41 | % |
| (0.10 | ) | | $ | 18.19 | | 7.98 | % | | 0.37 | % | | 1.00 | % | | — | | | $ | 26,685 | | 27 | % |
| (0.01 | ) | | $ | 16.94 | | 9.24 | % | | 0.47 | % | | 0.98 | % | | 0.05 | % | | $ | 33,118 | | 53 | % |
| (6) | | Represents less than $0.005. |
| (7) | | From the commencement of investment operations on June 23, 2004. |
| (8) | | From the commencement of investment operations on May 19, 2005. |
The Notes to the Financial Statements are an integral part of, and should be read in conjunction with, the Financial Statements.
85
REGIONS MORGAN KEEGAN SELECT FUNDS
FINANCIAL HIGHLIGHTS
SELECTED DATA FORA SHARE OUTSTANDING THROUGHOUTTHE PERIOD INDICATED:
| | | | | | | | | | | | | | | | | | |
| | | Net Asset
Value,
Beginning
of Period | | Net
Investment
Income | | | Net Realized
and Unrealized
Gains/(Losses)
on Investments | | | Total
From
Investment
Operations | | | Dividends
from Net
Investment
Income | | | Distributions
from Capital
Gains | |
Core Equity Fund | | | | | | | | | | | | | | | | | | |
Class A Shares | | | | | | | | | | | | | | | | | | |
Year Ended November 30, 2008 | | $ | 24.92 | | (0.02 | ) | | (8.33 | ) | | (8.35 | ) | | (0.03 | ) | | (3.73 | ) |
Year Ended November 30, 2007 | | $ | 28.53 | | 0.15 | | | 2.41 | | | 2.56 | | | (0.18 | ) | | (5.99 | ) |
Year Ended November 30, 2006 | | $ | 27.94 | | 0.26 | | | 0.59 | | | 0.85 | | | (0.26 | ) | | — | |
Period Ended November 30, 2005 (9) | | $ | 27.56 | | 0.05 | | | 0.39 | | | 0.44 | | | (0.06 | ) | | — | |
Year Ended August 31, 2005 | | $ | 24.38 | | 0.27 | (6) | | 3.15 | (6) | | 3.42 | | | (0.24 | ) | | — | |
Year Ended August 31, 2004 | | $ | 22.68 | | 0.12 | (6) | | 1.73 | (6) | | 1.85 | | | (0.15 | ) | | — | |
| | | | | | |
Core Equity Fund | | | | | | | | | | | | | | | | | | |
Class C Shares | | | | | | | | | | | | | | | | | | |
Year Ended November 30, 2008 | | $ | 24.93 | | (0.05 | ) | | (8.33 | ) | | (8.38 | ) | | (0.02 | ) | | (3.73 | ) |
Year Ended November 30, 2007 | | $ | 28.53 | | 0.10 | | | 2.42 | | | 2.52 | | | (0.13 | ) | | (5.99 | ) |
Period Ended November 30, 2006 (10) | | $ | 29.07 | | 0.14 | | | (0.54 | ) | | (0.40 | ) | | (0.14 | ) | | — | |
| | | | | | |
Core Equity Fund | | | | | | | | | | | | | | | | | | |
Class I Shares | | | | | | | | | | | | | | | | | | |
Year Ended November 30, 2008 | | $ | 24.95 | | 0.05 | | | (8.38 | ) | | (8.33 | ) | | (0.04 | ) | | (3.73 | ) |
Year Ended November 30, 2007 | | $ | 28.56 | | 0.22 | | | 2.41 | | | 2.63 | | | (0.25 | ) | | (5.99 | ) |
Year Ended November 30, 2006 | | $ | 27.97 | | 0.33 | | | 0.59 | | | 0.92 | | | (0.33 | ) | | — | |
Period Ended November 30, 2005 (9) | | $ | 27.59 | | 0.07 | | | 0.39 | | | 0.46 | | | (0.08 | ) | | — | |
Year Ended August 31, 2005 | | $ | 24.42 | | 0.34 | (6) | | 3.16 | (6) | | 3.50 | | | (0.33 | ) | | — | |
Year Ended August 31, 2004 | | $ | 22.71 | | 0.19 | (6) | | 1.73 | (6) | | 1.92 | | | (0.21 | ) | | — | |
| | | | | | |
Mid Cap Value Fund | | | | | | | | | | | | | | | | | | |
Class A Shares | | | | | | | | | | | | | | | | | | |
Year Ended November 30, 2008 | | $ | 11.16 | | (0.02 | ) | | (3.92 | ) | | (3.94 | ) | | — | | | (0.65 | ) |
Year Ended November 30, 2007 | | $ | 11.10 | | — | | | 0.50 | | | 0.50 | | | — | | | (0.44 | ) |
Year Ended November 30, 2006 | | $ | 11.43 | | — | | | 0.97 | | | 0.97 | | | — | | | (1.30 | ) |
Year Ended November 30, 2005 | | $ | 12.73 | | (0.06 | ) | | 1.34 | | | 1.28 | | | — | | | (2.58 | ) |
Year Ended November 30, 2004 | | $ | 11.27 | | (0.06 | ) | | 2.35 | | | 2.29 | | | (0.00 | )(7) | | (0.83 | ) |
| | | | | | |
Mid Cap Value Fund | | | | | | | | | | | | | | | | | | |
Class C Shares | | | | | | | | | | | | | | | | | | |
Year Ended November 30, 2008 | | $ | 10.82 | | (0.11 | ) | | (3.77 | ) | | (3.88 | ) | | — | | | (0.65 | ) |
Year Ended November 30, 2007 | | $ | 10.85 | | (0.14 | ) | | 0.55 | | | 0.41 | | | — | | | (0.44 | ) |
Year Ended November 30, 2006 | | $ | 11.26 | | — | | | 0.89 | | | 0.89 | | | — | | | (1.30 | ) |
Year Ended November 30, 2005 | | $ | 12.63 | | (0.06 | ) | | 1.27 | | | 1.21 | | | — | | | (2.58 | ) |
Year Ended November 30, 2004 | | $ | 11.25 | | (0.06 | ) | | 2.27 | | | 2.21 | | | — | | | (0.83 | ) |
| | | | | | |
Mid Cap Value Fund | | | | | | | | | | | | | | | | | | |
Class I Shares | | | | | | | | | | | | | | | | | | |
Year Ended November 30, 2008 | | $ | 11.22 | | 0.08 | | | (4.00 | ) | | (3.92 | ) | | (0.06 | ) | | (0.65 | ) |
Year Ended November 30, 2007 | | $ | 11.14 | | 0.04 | | | 0.48 | | | 0.52 | | | — | | | (0.44 | ) |
Year Ended November 30, 2006 | | $ | 11.44 | | — | | | 1.00 | | | 1.00 | | | — | | | (1.30 | ) |
Period Ended November 30, 2005 (11) | | $ | 10.50 | | (0.06 | ) | | 1.00 | | | 0.94 | | | — | | | — | |
| (1) | | Total return is based on net asset value, which excludes the sales charge or contingent deferred sales charge, if applicable. |
| (2) | | Not annualized for periods less than one year. |
| (3) | | Ratio annualized for periods less than one year. |
| (4) | | Portfolio turnover rate is calculated on the basis of the Fund as a whole without distinguishing between classes of shares issued. |
| (5) | | This voluntary expense decrease is reflected in both the net expense and net investment income/(loss) ratios shown. |
| (6) | | Per share data calculated using average shares for the period. |
| (7) | | Represents less than $0.005. |
The Notes to the Financial Statements are an integral part of, and should be read in conjunction with, the Financial Statements.
86
REGIONS MORGAN KEEGAN SELECT FUNDS
| | | | | | | | | | | | | | | | | | | | | | | |
| | | | | | | | | Ratios to Average Net Assets
| | | Supplemental Data
| |
Total
Distributions | | | Net Asset
Value,
End of
Period | | Total
Return (1, 2) | | | Net
Investment
Income (3) | | | Net
Expenses (3) | | | Expenses Waiver/
Reimbursement (3, 5) | | | Net Assets,
End of Period
(000's) | | | Portfolio
Turnover
Rate (4) | |
| | | | | | | | | | | | | | | | | | | | | | | | |
| | | | | | | | | | | | | | | | | | | | | | | | |
| (3.76 | ) | | $ | 12.81 | | (39.36 | )% | | (0.12 | )% | | 1.47 | % | | — | | | $ | 1,841 | | | 143 | % |
| (6.17 | ) | | $ | 24.92 | | 11.35 | % | | 0.59 | %(12) | | 1.28 | % | | — | | | $ | 4,764 | | | 113 | % |
| (0.26 | ) | | $ | 28.53 | | 3.06 | % | | 0.87 | % | | 1.27 | % | | — | | | $ | 5,990 | | | 120 | % |
| (0.06 | ) | | $ | 27.94 | | 1.59 | % | | 0.75 | % | | 1.43 | % | | — | | | $ | 5,346 | | | 6 | % |
| (0.24 | ) | | $ | 27.56 | | 14.08 | % | | 0.95 | % | | 1.42 | % | | 0.02 | % | | $ | 5,941 | | | 31 | % |
| (0.15 | ) | | $ | 24.38 | | 8.16 | % | | 0.48 | % | | 1.43 | % | | 0.05 | % | | $ | 12,445 | | | 10 | % |
| | | | | | | |
| | | | | | | | | | | | | | | | | | | | | | | | |
| | | | | | | | | | | | | | | | | | | | | | | | |
| (3.75 | ) | | $ | 12.80 | | (39.46 | )% | | (0.87 | )% | | 2.22 | % | | — | | | $ | — | (8) | | 143 | % |
| (6.12 | ) | | $ | 24.93 | | 11.16 | % | | (0.16 | )%(12) | | 2.03 | % | | — | | | $ | — | (8) | | 113 | % |
| (0.14 | ) | | $ | 28.53 | | (1.35 | )% | | 0.12 | % | | 2.02 | % | | — | | | $ | — | (8) | | 120 | % |
| | | | | | | |
| | | | | | | | | | | | | | | | | | | | | | | | |
| | | | | | | | | | | | | | | | | | | | | | | | |
| (3.77 | ) | | $ | 12.85 | | (39.22 | )% | | 0.13 | % | | 1.22 | % | | — | | | $ | 6,909 | | | 143 | % |
| (6.24 | ) | | $ | 24.95 | | 11.63 | % | | 0.84 | %(12) | | 1.03 | % | | — | | | $ | 61,858 | | | 113 | % |
| (0.33 | ) | | $ | 28.56 | | 3.34 | % | | 1.12 | % | | 1.02 | % | | — | | | $ | 94,099 | | | 120 | % |
| (0.08 | ) | | $ | 27.97 | | 1.65 | % | | 1.01 | % | | 1.18 | % | | — | | | $ | 112,720 | | | 6 | % |
| (0.33 | ) | | $ | 27.59 | | 14.39 | % | | 1.27 | % | | 1.15 | % | | 0.16 | % | | $ | 119,450 | | | 31 | % |
| (0.21 | ) | | $ | 24.42 | | 8.48 | % | | 0.77 | % | | 1.13 | % | | 0.35 | % | | $ | 136,532 | | | 10 | % |
| | | | | | | |
| | | | | | | | | | | | | | | | | | | | | | | | |
| | | | | | | | | | | | | | | | | | | | | | | | |
| (0.65 | ) | | $ | 6.57 | | (37.35 | )% | | — | | | 1.43 | % | | — | | | $ | 10,257 | | | 63 | % |
| (0.44 | ) | | $ | 11.16 | | 4.58 | % | | 0.08 | % | | 1.31 | % | | — | | | $ | 56,249 | | | 66 | % |
| (1.30 | ) | | $ | 11.10 | | 9.75 | % | | — | | | 1.30 | % | | — | | | $ | 75,786 | | | 33 | % |
| (2.58 | ) | | $ | 11.43 | | 11.93 | % | | (0.44 | )% | | 1.25 | % | | 0.05 | % | | $ | 89,810 | | | 68 | % |
| (0.83 | ) | | $ | 12.73 | | 21.76 | % | | (0.70 | )% | | 1.38 | % | | 0.05 | % | | $ | 106,222 | | | 23 | % |
| | | | | | | |
| | | | | | | | | | | | | | | | | | | | | | | | |
| | | | | | | | | | | | | | | | | | | | | | | | |
| (0.65 | ) | | $ | 6.29 | | (38.01 | )% | | (0.75 | )% | | 2.18 | % | | — | | | $ | 312 | | | 63 | % |
| (0.44 | ) | | $ | 10.82 | | 3.83 | % | | (0.67 | )% | | 2.06 | % | | — | | | $ | 930 | | | 66 | % |
| (1.30 | ) | | $ | 10.85 | | 9.13 | % | | (0.75 | )% | | 2.05 | % | | — | | | $ | 1,274 | | | 33 | % |
| (2.58 | ) | | $ | 11.26 | | 11.38 | % | | (1.19 | )% | | 2.00 | % | | 0.05 | % | | $ | 848 | | | 68 | % |
| (0.83 | ) | | $ | 12.63 | | 21.00 | % | | (1.13 | )% | | 1.81 | % | | 0.05 | % | | $ | 384 | | | 23 | % |
| | | | | | | |
| | | | | | | | | | | | | | | | | | | | | | | | |
| | | | | | | | | | | | | | | | | | | | | | | | |
| (0.71 | ) | | $ | 6.59 | | (37.15 | )% | | 0.25 | % | | 1.18 | % | | — | | | $ | 23,129 | | | 63 | % |
| (0.44 | ) | | $ | 11.22 | | 4.75 | % | | 0.33 | % | | 1.06 | % | | — | | | $ | 17,011 | | | 66 | % |
| (1.30 | ) | | $ | 11.14 | | 10.03 | % | | 0.25 | % | | 1.05 | % | | — | | | $ | 134 | | | 33 | % |
| — | | | $ | 11.44 | | 8.95 | % | | (0.19 | )% | | 1.00 | % | | 0.05 | % | | $ | 140 | | | 68 | % |
| (8) | | Represents less than $1,000. |
| (9) | | For the period September 1, 2005 to November 30, 2005. |
| (10) | | From the commencement of investment operations on April 3, 2006. |
| (11) | | From the commencement of investment operations on May 10, 2005. |
| (12) | | Net investment income includes a one-time special cash dividend of $21.50 per share of Florida East Coast Industries, Inc. Excluding this dividend, the net investment income ratio to average net assets would have been 0.15%, (0.60)% and 0.40% for Class A Shares, Class C Shares and Class I Shares, respectively. |
The Notes to the Financial Statements are an integral part of, and should be read in conjunction with, the Financial Statements.
87
REGIONS MORGAN KEEGAN SELECT FUNDS
FINANCIAL HIGHLIGHTS
SELECTED DATA FORA SHARE OUTSTANDING THROUGHOUTTHE PERIOD INDICATED:
| | | | | | | | | | | | | | | | | | |
| | | Net Asset
Value,
Beginning
of Period | | Net
Investment
Income/(Loss) | | | Net Realized
and Unrealized
Gains/(Losses)
on Investments | | | Total
From
Investment
Operations | | | Dividends
from Net
Investment
Income | | | Distributions
from Capital
Gains | |
Value Fund | | | | | | | | | | | | | | | | | | |
Class A Shares | | | | | | | | | | | | | | | | | | |
Year Ended November 30, 2008 | | $ | 20.56 | | 0.17 | | | (8.06 | ) | | (7.89 | ) | | (0.17 | ) | | (0.27 | ) |
Year Ended November 30, 2007 | | $ | 17.76 | | 0.20 | | | 2.79 | | | 2.99 | | | (0.19 | ) | | — | |
Year Ended November 30, 2006 | | $ | 16.23 | | 0.13 | | | 1.52 | | | 1.65 | | | (0.12 | ) | | — | |
Year Ended November 30, 2005 | | $ | 14.40 | | 0.15 | | | 1.86 | | | 2.01 | | | (0.18 | ) | | — | |
Year Ended November 30, 2004 | | $ | 13.13 | | 0.12 | | | 1.23 | | | 1.35 | | | (0.08 | ) | | — | |
| | | | | | |
Value Fund | | | | | | | | | | | | | | | | | | |
Class C Shares | | | | | | | | | | | | | | | | | | |
Year Ended November 30, 2008 | | $ | 20.53 | | — | | | (8.03 | ) | | (8.03 | ) | | — | | | (0.27 | ) |
Year Ended November 30, 2007 | | $ | 17.68 | | 0.01 | | | 2.84 | | | 2.85 | | | — | | | — | |
Year Ended November 30, 2006 | | $ | 16.16 | | 0.01 | | | 1.51 | | | 1.52 | | | — | | | — | |
Year Ended November 30, 2005 | | $ | 14.33 | | 0.04 | | | 1.86 | | | 1.90 | | | (0.07 | ) | | — | |
Year Ended November 30, 2004 | | $ | 13.13 | | 0.08 | | | 1.16 | | | 1.24 | | | (0.04 | ) | | — | |
| | | | | | |
Value Fund | | | | | | | | | | | | | | | | | | |
Class I Shares | | | | | | | | | | | | | | | | | | |
Year Ended November 30, 2008 | | $ | 20.56 | | 0.22 | | | (8.07 | ) | | (7.85 | ) | | (0.22 | ) | | (0.27 | ) |
Year Ended November 30, 2007 | | $ | 17.76 | | 0.25 | | | 2.79 | | | 3.04 | | | (0.24 | ) | | — | |
Year Ended November 30, 2006 | | $ | 16.26 | | 0.20 | | | 1.49 | | | 1.69 | | | (0.19 | ) | | — | |
Year Ended November 30, 2005 | | $ | 14.42 | | 0.18 | | | 1.87 | | | 2.05 | | | (0.21 | ) | | — | |
Period Ended November 30, 2004 (7) | | $ | 13.69 | | 0.07 | | | 0.70 | | | 0.77 | | | (0.04 | ) | | — | |
| | | | | | |
Balanced Fund | | | | | | | | | | | | | | | | | | |
Class A Shares | | | | | | | | | | | | | | | | | | |
Year Ended November 30, 2008 | | $ | 17.57 | | 0.22 | | | (3.54 | ) | | (3.32 | ) | | (0.20 | ) | | (1.50 | ) |
Year Ended November 30, 2007 | | $ | 16.47 | | 0.20 | | | 1.60 | | | 1.80 | | | (0.20 | ) | | (0.50 | ) |
Year Ended November 30, 2006 | | $ | 15.40 | | 0.19 | | | 1.10 | | | 1.29 | | | (0.19 | ) | | (0.03 | ) |
Year Ended November 30, 2005 | | $ | 13.97 | | 0.16 | | | 1.46 | | | 1.62 | | | (0.19 | ) | | — | |
Year Ended November 30, 2004 | | $ | 13.54 | | 0.22 | (6) | | 0.40 | | | 0.62 | | | (0.19 | ) | | — | |
| | | | | | |
Balanced Fund | | | | | | | | | | | | | | | | | | |
Class C Shares | | | | | | | | | | | | | | | | | | |
Year Ended November 30, 2008 | | $ | 17.56 | | 0.09 | | | (3.52 | ) | | (3.43 | ) | | (0.07 | ) | | (1.50 | ) |
Year Ended November 30, 2007 | | $ | 16.46 | | 0.08 | | | 1.60 | | | 1.68 | | | (0.08 | ) | | (0.50 | ) |
Year Ended November 30, 2006 | | $ | 15.38 | | 0.06 | | | 1.11 | | | 1.17 | | | (0.06 | ) | | (0.03 | ) |
Year Ended November 30, 2005 | | $ | 13.95 | | 0.06 | | | 1.46 | | | 1.52 | | | (0.09 | ) | | — | |
Year Ended November 30, 2004 | | $ | 13.54 | | 0.13 | (6) | | 0.39 | | | 0.52 | | | (0.11 | ) | | — | |
| | | | | | |
Balanced Fund | | | | | | | | | | | | | | | | | | |
Class I Shares | | | | | | | | | | | | | | | | | | |
Year Ended November 30, 2008 | | $ | 17.60 | | 0.26 | | | (3.54 | ) | | (3.28 | ) | | (0.25 | ) | | (1.50 | ) |
Year Ended November 30, 2007 | | $ | 16.49 | | 0.24 | | | 1.61 | | | 1.85 | | | (0.24 | ) | | (0.50 | ) |
Year Ended November 30, 2006 | | $ | 15.42 | | 0.23 | | | 1.10 | | | 1.33 | | | (0.23 | ) | | (0.03 | ) |
Period Ended November 30, 2005 (8) | | $ | 15.15 | | 0.01 | | | 0.30 | | | 0.31 | | | (0.04 | ) | | — | |
| (1) | | Total return is based on net asset value, which excludes the sales charge or contingent deferred sales charge, if applicable. |
| (2) | | Not annualized for periods less than one year. |
| (3) | | Ratio annualized for periods less than one year. |
| (4) | | Portfolio turnover rate is calculated on the basis of the Fund as a whole without distinguishing between classes of shares issued. |
| (5) | | This voluntary expense decrease is reflected in both the net expense and net investment income/(loss) ratios shown. |
| (6) | | Per share data calculated using average shares for the period. |
The Notes to the Financial Statements are an integral part of, and should be read in conjunction with, the Financial Statements.
88
REGIONS MORGAN KEEGAN SELECT FUNDS
| | | | | | | | | | | | | | | | | | | | | | |
| | | | | | | | | Ratios to Average Net Assets
| | | Supplemental Data
| |
Total
Distributions | | | Net Asset
Value,
End of
Period | | Total
Return (1, 2) | | | Net
Investment
Income (3) | | | Net
Expenses (3) | | | Expenses Waiver/
Reimbursement (3, 5) | | | Net Assets,
End of Period
(000's) | | Portfolio
Turnover
Rate (4) | |
| | | | | | | | | | | | | | | | | | | | | | | |
| | | | | | | | | | | | | | | | | | | | | | | |
| (0.44 | ) | | $ | 12.23 | | (39.17 | )% | | 0.92 | % | | 1.26 | % | | — | | | $ | 43,546 | | 182 | % |
| (0.19 | ) | | $ | 20.56 | | 16.93 | % | | 1.03 | %(9) | | 1.22 | % | | — | | | $ | 230,288 | | 89 | % |
| (0.12 | ) | | $ | 17.76 | | 10.19 | % | | 0.73 | % | | 1.23 | % | | — | | | $ | 250,627 | | 72 | % |
| (0.18 | ) | | $ | 16.23 | | 14.05 | % | | 0.97 | % | | 1.25 | % | | 0.05 | % | | $ | 224,301 | | 58 | % |
| (0.08 | ) | | $ | 14.40 | | 10.29 | % | | 0.92 | % | | 1.29 | % | | 0.05 | % | | $ | 169,772 | | 59 | % |
| | | | | | | |
| | | | | | | | | | | | | | | | | | | | | | | |
| | | | | | | | | | | | | | | | | | | | | | | |
| (0.27 | ) | | $ | 12.23 | | (39.64 | )% | | 0.17 | % | | 2.01 | % | | — | | | $ | 1,129 | | 182 | % |
| — | | | $ | 20.53 | | 16.12 | % | | 0.28 | %(9) | | 1.97 | % | | — | | | $ | 2,734 | | 89 | % |
| — | | | $ | 17.68 | | 9.41 | % | | (0.02 | )% | | 1.98 | % | | — | | | $ | 2,633 | | 72 | % |
| (0.07 | ) | | $ | 16.16 | | 13.31 | % | | 0.22 | % | | 2.00 | % | | 0.05 | % | | $ | 2,255 | | 58 | % |
| (0.04 | ) | | $ | 14.33 | | 9.45 | % | | 0.18 | % | | 2.00 | % | | 0.05 | % | | $ | 2,056 | | 59 | % |
| | | | | | | |
| | | | | | | | | | | | | | | | | | | | | | | |
| | | | | | | | | | | | | | | | | | | | | | | |
| (0.49 | ) | | $ | 12.22 | | (39.04 | )% | | 1.17 | % | | 1.01 | % | | — | | | $ | 111,079 | | 182 | % |
| (0.24 | ) | | $ | 20.56 | | 17.23 | % | | 1.28 | %(9) | | 0.97 | % | | — | | | $ | 32,079 | | 89 | % |
| (0.19 | ) | | $ | 17.76 | | 10.46 | % | | 0.98 | % | | 0.98 | % | | — | | | $ | 1,088 | | 72 | % |
| (0.21 | ) | | $ | 16.26 | | 14.31 | % | | 1.22 | % | | 1.00 | % | | 0.05 | % | | $ | 806 | | 58 | % |
| 0.04 | | | $ | 14.42 | | 5.63 | % | | 1.16 | % | | 1.02 | % | | 0.05 | % | | $ | 531 | | 59 | % |
| | | | | | | |
| | | | | | | | | | | | | | | | | | | | | | | |
| | | | | | | | | | | | | | | | | | | | | | | |
| (1.70 | ) | | $ | 12.55 | | (20.78 | )% | | 1.37 | % | | 1.33 | % | | — | | | $ | 25,532 | | 40 | % |
| (0.70 | ) | | $ | 17.57 | | 11.36 | % | | 1.19 | % | | 1.25 | % | | — | | | $ | 166,421 | | 34 | % |
| (0.22 | ) | | $ | 16.47 | | 8.51 | % | | 1.23 | % | | 1.28 | % | | — | | | $ | 176,281 | | 29 | % |
| (0.19 | ) | | $ | 15.40 | | 11.72 | % | | 1.16 | % | | 1.28 | % | | 0.05 | % | | $ | 127,954 | | 22 | % |
| (0.19 | ) | | $ | 13.97 | | 4.63 | % | | 1.62 | % | | 1.33 | % | | 0.05 | % | | $ | 117,968 | | 79 | % |
| | | | | | | |
| | | | | | | | | | | | | | | | | | | | | | | |
| | | | | | | | | | | | | | | | | | | | | | | |
| (1.57 | ) | | $ | 12.56 | | (21.34 | )% | | 0.62 | % | | 2.08 | % | | — | | | $ | 2,395 | | 40 | % |
| (0.58 | ) | | $ | 17.56 | | 10.54 | % | | 0.44 | % | | 2.00 | % | | — | | | $ | 7,097 | | 34 | % |
| (0.09 | ) | | $ | 16.46 | | 7.69 | % | | 0.48 | % | | 2.03 | % | | — | | | $ | 932 | | 29 | % |
| (0.09 | ) | | $ | 15.38 | | 10.96 | % | | 0.41 | % | | 2.03 | % | | 0.05 | % | | $ | 1,382 | | 22 | % |
| (0.11 | ) | | $ | 13.95 | | 3.86 | % | | 0.92 | % | | 2.08 | % | | 0.05 | % | | $ | 2,084 | | 79 | % |
| | | | | | | |
| | | | | | | | | | | | | | | | | | | | | | | |
| | | | | | | | | | | | | | | | | | | | | | | |
| (1.75 | ) | | $ | 12.57 | | (20.58 | )% | | 1.62 | % | | 1.08 | % | | — | | | $ | 99,824 | | 40 | % |
| (0.74 | ) | | $ | 17.60 | | 11.69 | % | | 1.44 | % | | 1.00 | % | | — | | | $ | 250 | | 34 | % |
| (0.26 | ) | | $ | 16.49 | | 8.76 | % | | 1.48 | % | | 1.03 | % | | — | | | $ | 561 | | 29 | % |
| (0.04 | ) | | $ | 15.42 | | 2.06 | % | | 1.41 | % | | 1.03 | % | | 0.05 | % | | $ | 47,565 | | 22 | % |
| (7) | | From the commencement of investment operations on June 16, 2004. |
| (8) | | From the commencement of investment operations on September 1, 2005. |
| (9) | | Net investment income includes a one-time special cash dividend of $21.50 per share of Florida East Coast Industries, Inc. Excluding this dividend, the net investment income ratio to average net assets would have been 0.90%, 0.15% and 1.15% for Class A Shares, Class C Shares and Class I Shares, respectively. |
The Notes to the Financial Statements are an integral part of, and should be read in conjunction with, the Financial Statements.
89
REGIONS MORGAN KEEGAN SELECT FUNDS
FINANCIAL HIGHLIGHTS
SELECTED DATA FORA SHARE OUTSTANDING THROUGHOUTTHE PERIOD INDICATED:
| | | | | | | | | | | | | | | | | |
| | | Net Asset
Value,
Beginning
of Period | | Net
Investment
Income | | Net Realized
and Unrealized
Gains/(Losses)
on Investments | | | Total
From
Investment
Operations | | | Dividends
from Net
Investment
Income | | | Distributions
from Capital
Gains | |
Fixed Income Fund | | | | | | | | | | | | | | | | | |
Class A Shares | | | | | | | | | | | | | | | | | |
Year Ended November 30, 2008 | | $ | 9.55 | | 0.40 | | (0.90 | ) | | (0.50 | ) | | (0.40 | ) | | — | |
Year Ended November 30, 2007 | | $ | 10.24 | | 0.48 | | (0.68 | ) | | (0.20 | ) | | (0.49 | ) | | — | |
Year Ended November 30, 2006 | | $ | 10.23 | | 0.47 | | 0.02 | | | 0.49 | | | (0.48 | ) | | — | |
Year Ended November 30, 2005 | | $ | 10.54 | | 0.39 | | (0.31 | ) | | 0.08 | | | (0.39 | ) | | — | |
Year Ended November 30, 2004 | | $ | 11.02 | | 0.37 | | (0.27 | ) | | 0.10 | | | (0.37 | ) | | (0.21 | ) |
| | | | | | |
Fixed Income Fund | | | | | | | | | | | | | | | | | |
Class C Shares | | | | | | | | | | | | | | | | | |
Year Ended November 30, 2008 | | $ | 9.56 | | 0.33 | | (0.91 | ) | | (0.58 | ) | | (0.33 | ) | | — | |
Year Ended November 30, 2007 | | $ | 10.24 | | 0.41 | | (0.67 | ) | | (0.26 | ) | | (0.42 | ) | | — | |
Year Ended November 30, 2006 | | $ | 10.23 | | 0.39 | | 0.02 | | | 0.41 | | | (0.40 | ) | | — | |
Year Ended November 30, 2005 | | $ | 10.55 | | 0.31 | | (0.32 | ) | | (0.01 | ) | | (0.31 | ) | | — | |
Year Ended November 30, 2004 | | $ | 11.02 | | 0.28 | | (0.25 | ) | | 0.03 | | | (0.29 | ) | | (0.21 | ) |
| | | | | | |
Fixed Income Fund | | | | | | | | | | | | | | | | | |
Class I Shares | | | | | | | | | | | | | | | | | |
Year Ended November 30, 2008 | | $ | 9.55 | | 0.42 | | (0.90 | ) | | (0.48 | ) | | (0.42 | ) | | — | |
Year Ended November 30, 2007 | | $ | 10.24 | | 0.50 | | (0.68 | ) | | (0.18 | ) | | (0.51 | ) | | — | |
Year Ended November 30, 2006 | | $ | 10.23 | | 0.49 | | 0.02 | | | 0.51 | | | (0.50 | ) | | — | |
Period Ended November 30, 2005 (8) | | $ | 10.40 | | 0.13 | | (0.17 | ) | | (0.04 | ) | | (0.13 | ) | | — | |
| | | | | | |
Limited Maturity Fixed Income Fund | | | | | | | | | | | | | | | | | |
Class A Shares | | | | | | | | | | | | | | | | | |
Year Ended November 30, 2008 | | $ | 8.75 | | 0.32 | | (0.92 | ) | | (0.60 | ) | | (0.33 | ) | | — | |
Year Ended November 30, 2007 | | $ | 9.69 | | 0.41 | | (0.90 | ) | | (0.49 | ) | | (0.45 | ) | | — | |
Year Ended November 30, 2006 | | $ | 9.65 | | 0.35 | | 0.04 | | | 0.39 | | | (0.35 | ) | | — | |
Year Ended November 30, 2005 | | $ | 9.84 | | 0.29 | | (0.18 | ) | | 0.11 | | | (0.30 | ) | | — | |
Year Ended November 30, 2004 | | $ | 10.11 | | 0.27 | | (0.27 | ) | | — | (6) | | (0.27 | ) | | — | |
| | | | | | |
Limited Maturity Fixed Income Fund | | | | | | | | | | | | | | | | | |
Class C Shares | | | | | | | | | | | | | | | | | |
Year Ended November 30, 2008 | | $ | 8.75 | | 0.26 | | (0.92 | ) | | (0.66 | ) | | (0.27 | ) | | — | |
Year Ended November 30, 2007 | | $ | 9.69 | | 0.34 | | (0.90 | ) | | (0.56 | ) | | (0.38 | ) | | — | |
Year Ended November 30, 2006 | | $ | 9.65 | | 0.28 | | 0.04 | | | 0.32 | | | (0.28 | ) | | — | |
Year Ended November 30, 2005 | | $ | 9.84 | | 0.22 | | (0.18 | ) | | 0.04 | | | (0.23 | ) | | — | |
Year Ended November 30, 2004 | | $ | 10.11 | | 0.20 | | (0.28 | ) | | (0.08 | ) | | (0.19 | ) | | — | |
| | | | | | |
Limited Maturity Fixed Income Fund | | | | | | | | | | | | | | | | | |
Class I Shares | | | | | | | | | | | | | | | | | |
Year Ended November 30, 2008 | | $ | 8.75 | | 0.31 | | (0.92 | ) | | (0.61 | ) | | (0.32 | ) | | — | |
Year Ended November 30, 2007 | | $ | 9.69 | | 0.44 | | (0.90 | ) | | (0.46 | ) | | (0.48 | ) | | — | |
Year Ended November 30, 2006 | | $ | 9.64 | | 0.34 | | 0.05 | | | 0.39 | | | (0.34 | ) | | — | |
Period Ended November 30, 2005 (9) | | $ | 9.74 | | 0.07 | | (0.08 | ) | | (0.01 | ) | | (0.08 | ) | | — | |
| (1) | | Total return is based on net asset value, which excludes the sales charge or contingent deferred sales charge, if applicable. |
| (2) | | Not annualized for periods less than one year. |
| (3) | | Ratio annualized for periods less than one year. |
| (4) | | Portfolio turnover rate is calculated on the basis of the Fund as a whole without distinguishing between classes of shares issued. |
| (5) | | This voluntary expense decrease is reflected in both the net expense and net investment income/(loss) ratios shown. |
The Notes to the Financial Statements are an integral part of, and should be read in conjunction with, the Financial Statements.
90
REGIONS MORGAN KEEGAN SELECT FUNDS
| | | | | | | | | | | | | | | | | | | | | | | |
| | | | | | | | | Ratios to Average Net Assets
| | | Supplemental Data
| |
Total
Distributions | | | Net Asset
Value,
End of
Period | | Total
Return (1, 2) | | | Net
Investment
Income (3) | | | Net
Expenses (3) | | | Expenses Waiver/
Reimbursement (3, 5) | | | Net Assets,
End of Period
(000's) | | | Portfolio
Turnover
Rate (4) | |
| | | | | | | | | | | | | | | | | | | | | | | | |
| | | | | | | | | | | | | | | | | | | | | | | | |
| (0.40 | ) | | | $8.65 | | (5.42 | )% | | 4.27 | % | | 1.01 | % | | — | | | $ | 59,139 | | | 13 | % |
| (0.49 | ) | | $ | 9.55 | | (2.01 | )% | | 4.92 | % | | 1.00 | % | | — | | | $ | 133,830 | | | 58 | % |
| (0.48 | ) | | $ | 10.24 | | 4.91 | % | | 4.56 | % | | 1.00 | % | | — | | | $ | 214,897 | | | 44 | % |
| (0.39 | ) | | $ | 10.23 | | 0.75 | % | | 3.67 | % | | 0.97 | % | | 0.25 | % | | $ | 231,426 | | | 39 | % |
| (0.58 | ) | | $ | 10.54 | | 0.87 | % | | 3.44 | % | | 0.97 | % | | 0.25 | % | | $ | 265,532 | | | 116 | % |
| | | | | | | |
| | | | | | | | | | | | | | | | | | | | | | | | |
| | | | | | | | | | | | | | | | | | | | | | | | |
| (0.33 | ) | | $ | 8.65 | | (6.22 | )% | | 3.52 | % | | 1.76 | % | | — | | | $ | 1,427 | | | 13 | % |
| (0.42 | ) | | $ | 9.56 | | (2.64 | )% | | 4.17 | % | | 1.75 | % | | — | | | $ | 3,096 | | | 58 | % |
| (0.40 | ) | | $ | 10.24 | | 4.13 | % | | 3.81 | % | | 1.75 | % | | — | | | $ | 2,750 | | | 44 | % |
| (0.31 | ) | | $ | 10.23 | | (0.10 | )% | | 2.92 | % | | 1.72 | % | | 0.25 | % | | $ | 2,469 | | | 39 | % |
| (0.50 | ) | | $ | 10.55 | | 0.12 | % | | 2.63 | % | | 1.72 | % | | 0.25 | % | | $ | 2,531 | | | 116 | % |
| | | | | | | |
| | | | | | | | | | | | | | | | | | | | | | | | |
| | | | | | | | | | | | | | | | | | | | | | | | |
| (0.42 | ) | | $ | 8.65 | | (5.18 | )% | | 4.52 | % | | 0.76 | % | | — | | | $ | 65,438 | | | 13 | % |
| (0.51 | ) | | $ | 9.55 | | (1.76 | )% | | 5.17 | % | | 0.75 | % | | — | | | $ | 45,432 | | | 58 | % |
| (0.50 | ) | | $ | 10.24 | | 5.17 | % | | 4.81 | % | | 0.75 | % | | — | | | $ | 54,057 | | | 44 | % |
| (0.13 | ) | | $ | 10.23 | | (0.41 | )% | | 3.92 | % | | 0.72 | % | | 0.25 | % | | $ | 77,969 | | | 39 | % |
| | | | | | | |
| | | | | | | | | | | | | | | | | | | | | | | | |
| | | | | | | | | | | | | | | | | | | | | | | | |
| (0.33 | ) | | $ | 7.82 | | (7.01 | )% | | 3.57 | % | | 1.04 | % | | 0.84 | % | | $ | 3,880 | | | 32 | % |
| (0.45 | ) | | $ | 8.75 | | (5.24 | )% | | 4.23 | % | | 0.96 | % | | 0.15 | % | | $ | 20,747 | | | 19 | % |
| (0.35 | ) | | $ | 9.69 | | 4.15 | % | | 3.59 | % | | 1.00 | % | | 0.06 | % | | $ | 52,023 | | | 83 | % |
| (0.30 | ) | | $ | 9.65 | | 1.19 | % | | 3.01 | % | | 0.96 | % | | 0.30 | % | | $ | 67,475 | | | 42 | % |
| (0.27 | ) | | $ | 9.84 | | (0.02 | )% | | 2.23 | % | | 0.97 | % | | 0.23 | % | | $ | 110,249 | | | 144 | % |
| | | | | | | |
| | | | | | | | | | | | | | | | | | | | | | | | |
| | | | | | | | | | | | | | | | | | | | | | | | |
| (0.27 | ) | | $ | 7.82 | | (7.71 | )% | | 2.82 | % | | 1.79 | % | | 0.84 | % | | $ | 284 | | | 32 | % |
| (0.38 | ) | | $ | 8.75 | | (5.95 | )% | | 3.48 | % | | 1.71 | % | | 0.15 | % | | $ | 1,466 | | | 19 | % |
| (0.28 | ) | | $ | 9.69 | | 3.37 | % | | 2.84 | % | | 1.75 | % | | 0.06 | % | | $ | 406 | | | 83 | % |
| (0.23 | ) | | $ | 9.65 | | 0.43 | % | | 2.26 | % | | 1.71 | % | | 0.30 | % | | $ | 502 | | | 42 | % |
| (0.19 | ) | | $ | 9.84 | | (0.77 | )% | | 1.41 | % | | 1.72 | % | | 0.23 | % | | $ | 843 | | | 144 | % |
| | | | | | | |
| | | | | | | | | | | | | | | | | | | | | | | | |
| | | | | | | | | | | | | | | | | | | | | | | | |
| (0.32 | ) | | $ | 7.82 | | (7.08 | )% | | 3.82 | % | | 0.79 | % | | 0.84 | % | | $ | 69 | | | 32 | % |
| (0.48 | ) | | $ | 8.75 | | (4.91 | )% | | 4.48 | % | | 0.71 | % | | 0.15 | % | | $ | — | (7) | | 19 | % |
| (0.34 | ) | | $ | 9.69 | | 4.18 | % | | 3.84 | % | | 0.75 | % | | 0.06 | % | | $ | — | (7) | | 83 | % |
| (0.08 | ) | | $ | 9.64 | | (0.19 | )% | | 3.26 | % | | 0.71 | % | | 0.30 | % | | $ | — | (7) | | 42 | % |
| (6) | | Represents less than $0.005. |
| (7) | | Represents less than $1,000. |
| (8) | | From the commencement of investment operations on August 14, 2005. |
| (9) | | From the commencement of investment operations on September 1, 2005. |
The Notes to the Financial Statements are an integral part of, and should be read in conjunction with, the Financial Statements.
91
REGIONS MORGAN KEEGAN SELECT FUNDS
FINANCIAL HIGHLIGHTS
SELECTED DATA FORA SHARE OUTSTANDING THROUGHOUTTHE PERIOD INDICATED:
| | | | | | | | | | | | | | | | | |
| | | Net Asset
Value,
Beginning
of Period | | Net
Investment
Income | | Net Realized
and Unrealized
Gains/(Losses)
on Investments | | | Total
From
Investment
Operations | | | Dividends
from Net
Investment
Income | | | Distributions
from Capital
Gains | |
Intermediate Tax Exempt Bond Fund | | | | | | | | | | | | | | | | | |
Class A Shares | | | | | | | | | | | | | | | | | |
Year Ended November 30, 2008 | | $ | 9.51 | | 0.29 | | (0.07 | ) | | 0.22 | | | (0.29 | ) | | (0.01 | ) |
Year Ended November 30, 2007 | | $ | 9.54 | | 0.31 | | (0.04 | ) | | 0.27 | | | (0.30 | ) | | — | |
Year Ended November 30, 2006 | | $ | 9.52 | | 0.31 | | 0.03 | | | 0.34 | | | (0.31 | ) | | (0.01 | ) |
Year Ended November 30, 2005 | | $ | 9.77 | | 0.30 | | (0.19 | ) | | 0.11 | | | (0.30 | ) | | (0.06 | ) |
Period Ended November 30, 2004 (7) | | $ | 10.00 | | 0.25 | | (0.23 | ) | | 0.02 | | | (0.25 | ) | | — | |
| | | | | | |
Intermediate Tax Exempt Bond Fund | | | | | | | | | | | | | | | | | |
Class C Shares | | | | | | | | | | | | | | | | | |
Year Ended November 30, 2008 | | $ | 9.52 | | 0.22 | | (0.08 | ) | | 0.14 | | | (0.22 | ) | | (0.01 | ) |
Year Ended November 30, 2007 | | $ | 9.55 | | 0.26 | | (0.04 | ) | | 0.22 | | | (0.25 | ) | | — | |
Year Ended November 30, 2006 | | $ | 9.54 | | 0.34 | | 0.02 | | | 0.36 | | | (0.34 | ) | | (0.01 | ) |
Year Ended November 30, 2005 | | $ | 9.77 | | 0.26 | | (0.17 | ) | | 0.09 | | | (0.26 | ) | | (0.06 | ) |
Period Ended November 30, 2004 (7) | | $ | 10.00 | | 0.20 | | (0.23 | ) | | (0.03 | ) | | (0.20 | ) | | — | |
| | | | | | |
Intermediate Tax Exempt Bond Fund | | | | | | | | | | | | | | | | | |
Class I Shares | | | | | | | | | | | | | | | | | |
Year Ended November 30, 2008 | | $ | 9.50 | | 0.32 | | (0.06 | ) | | 0.26 | | | (0.32 | ) | | (0.01 | ) |
Year Ended November 30, 2007 | | $ | 9.54 | | 0.33 | | (0.05 | ) | | 0.28 | | | (0.32 | ) | | — | |
Year Ended November 30, 2006 | | $ | 9.52 | | 0.34 | | 0.03 | | | 0.37 | | | (0.34 | ) | | (0.01 | ) |
Year Ended November 30, 2005 | | $ | 9.77 | | 0.32 | | (0.19 | ) | | 0.13 | | | (0.32 | ) | | (0.06 | ) |
Period Ended November 30, 2004 (7) | | $ | 10.00 | | 0.22 | | (0.23 | ) | | (0.01 | ) | | (0.22 | ) | | — | |
| (1) | | Total return is based on net asset value, which excludes the sales charge or contingent deferred sales charge, if applicable. |
| (2) | | Not annualized for periods less than one year. |
| (3) | | Ratio annualized for periods less than one year. |
| (4) | | Portfolio turnover rate is calculated on the basis of the Fund as a whole without distinguishing between classes of shares issued. |
| (5) | | This voluntary expense decrease is reflected in both the net expense and net investment income/(loss) ratios shown. |
| (6) | | Represents less than $1,000. |
| (7) | | From the commencement of investment operations on February 9, 2004. |
The Notes to the Financial Statements are an integral part of, and should be read in conjunction with, the Financial Statements.
92
REGIONS MORGAN KEEGAN SELECT FUNDS
| | | | | | | | | | | | | | | | | | | | | | | |
| | | | | | | | | Ratios to Average Net Assets
| | | Supplemental Data
| |
Total
Distributions | | | Net Asset
Value,
End of
Period | | Total
Return (1, 2) | | | Net
Investment
Income (3) | | | Net
Expenses (3) | | | Expenses Waiver/
Reimbursement (3, 5) | | | Net Assets,
End of Period
(000's) | | | Portfolio
Turnover
Rate (4) | |
| | | | | | | | | | | | | | | | | | | | | | | | |
| | | | | | | | | | | | | | | | | | | | | | | | |
| (0.30 | ) | | $ | 9.43 | | 2.40 | % | | 3.13 | % | | 0.93 | % | | — | | | $ | 21,119 | | | 6 | % |
| (0.30 | ) | | $ | 9.51 | | 2.90 | % | | 3.22 | % | | 0.86 | % | | — | | | $ | 46,586 | | | 15 | % |
| (0.32 | ) | | $ | 9.54 | | 3.66 | % | | 3.30 | % | | 0.80 | % | | — | | | $ | 45,782 | | | 11 | % |
| (0.36 | ) | | $ | 9.52 | | 1.07 | % | | 3.03 | % | | 0.77 | % | | 0.30 | % | | $ | 52,670 | | | 16 | % |
| (0.25 | ) | | $ | 9.77 | | 0.22 | % | | 3.18 | % | | 0.63 | % | | 0.50 | % | | $ | 68,531 | | | 19 | % |
| | | | | | | |
| | | | | | | | | | | | | | | | | | | | | | | | |
| | | | | | | | | | | | | | | | | | | | | | | | |
| (0.23 | ) | | $ | 9.43 | | 1.53 | % | | 2.38 | % | | 1.68 | % | | — | | | $ | 315 | | | 6 | % |
| (0.25 | ) | | $ | 9.52 | | 2.30 | % | | 2.47 | % | | 1.61 | % | | — | | | $ | 3,196 | | | 15 | % |
| (0.35 | ) | | $ | 9.55 | | 3.84 | % | | 2.55 | % | | 1.55 | % | | — | | | $ | — | (6) | | 11 | % |
| (0.32 | ) | | $ | 9.54 | | 0.95 | % | | 2.43 | % | | 1.37 | % | | 0.45 | % | | $ | — | (6) | | 16 | % |
| (0.20 | ) | | $ | 9.77 | | (0.27 | )% | | 2.58 | % | | 1.23 | % | | 0.50 | % | | $ | — | (6) | | 19 | % |
| | | | | | | |
| | | | | | | | | | | | | | | | | | | | | | | | |
| | | | | | | | | | | | | | | | | | | | | | | | |
| (0.33 | ) | | $ | 9.43 | | 2.76 | % | | 3.38 | % | | 0.68 | % | | — | | | $ | 5,034 | | | 6 | % |
| (0.32 | ) | | $ | 9.50 | | 3.05 | % | | 3.47 | % | | 0.61 | % | | — | | | $ | 4,920 | | | 15 | % |
| (0.35 | ) | | $ | 9.54 | | 3.94 | % | | 3.55 | % | | 0.55 | % | | — | | | $ | 6,922 | | | 11 | % |
| (0.38 | ) | | $ | 9.52 | | 1.33 | % | | 3.28 | % | | 0.52 | % | | 0.30 | % | | $ | 8,769 | | | 16 | % |
| (0.22 | ) | | $ | 9.77 | | (0.04 | )% | | 3.43 | % | | 0.38 | % | | 0.50 | % | | $ | 326 | | | 19 | % |
The Notes to the Financial Statements are an integral part of, and should be read in conjunction with, the Financial Statements.
93
REGIONS MORGAN KEEGAN SELECT FUNDS
FINANCIAL HIGHLIGHTS
SELECTED DATA FORA SHARE OUTSTANDING THROUGHOUTTHE PERIOD INDICATED:
| | | | | | | | | | | | | | | | | | |
| | | Net Asset
Value,
Beginning
of Period | | Net
Investment
Income | | | Net Realized
and Unrealized
Gains/(Losses)
on Investments | | | Total
From
Investment
Operations | | | Dividends
from Net
Investment
Income | | | Net Realized
and Unrealized
Gains/(Losses)
on Investments | |
Treasury Money Market Fund | | | | | | | | | | | | | | | | | | |
Class A Shares | | | | | | | | | | | | | | | | | | |
Year Ended November 30, 2008 | | $ | 1.00 | | 0.01 | | | — | | | 0.01 | | | (0.01 | ) | | — | (5) |
Year Ended November 30, 2007 | | $ | 1.00 | | 0.04 | | | — | | | 0.04 | | | (0.04 | ) | | — | |
Year Ended November 30, 2006 | | $ | 1.00 | | 0.04 | | | — | | | 0.04 | | | (0.04 | ) | | — | |
Year Ended November 30, 2005 | | $ | 1.00 | | 0.02 | | | — | | | 0.02 | | | (0.02 | ) | | — | |
Year Ended November 30, 2004 | | $ | 1.00 | | 0.01 | | | — | | | 0.01 | | | (0.01 | ) | | — | |
| | | | | | |
Treasury Money Market Fund | | | | | | | | | | | | | | | | | | |
Class I Shares | | | | | | | | | | | | | | | | | | |
Year Ended November 30, 2008 | | $ | 1.00 | | 0.02 | | | — | | | 0.02 | | | (0.02 | ) | | — | (5) |
Year Ended November 30, 2007 | | $ | 1.00 | | 0.04 | | | — | | | 0.04 | | | (0.04 | ) | | — | |
Period Ended November 30, 2006 (7) | | $ | 1.00 | | 0.03 | | | — | | | 0.03 | | | (0.03 | ) | | — | |
| | | | | | |
Money Market Fund | | | | | | | | | | | | | | | | | | |
Class A Shares | | | | | | | | | | | | | | | | | | |
Year Ended November 30, 2008 | | $ | 1.00 | | 0.02 | | | — | | | 0.02 | | | (0.02 | ) | | — | |
Year Ended November 30, 2007 | | $ | 1.00 | | 0.04 | | | — | | | 0.04 | | | (0.04 | ) | | — | |
Year Ended November 30, 2006 | | $ | 1.00 | | 0.04 | | | — | (5) | | 0.04 | | | (0.04 | ) | | — | |
Period Ended November 30, 2005 (8) | | $ | 1.00 | | 0.01 | | | — | (5) | | 0.01 | | | (0.01 | ) | | — | |
Year Ended August 31, 2005 | | $ | 1.00 | | 0.02 | | | — | (5) | | 0.02 | | | (0.02 | ) | | — | |
Year Ended August 31, 2004 | | $ | 1.00 | | — | (5) | | — | (5) | | — | (5) | | — | (5) | | — | |
| | | | | | |
Money Market Fund | | | | | | | | | | | | | | | | | | |
Class I Shares | | | | | | | | | | | | | | | | | | |
Year Ended November 30, 2008 | | $ | 1.00 | | 0.02 | | | — | | | 0.02 | | | (0.02 | ) | | — | |
Year Ended November 30, 2007 | | $ | 1.00 | | 0.05 | | | — | | | 0.05 | | | (0.05 | ) | | — | |
Year Ended November 30, 2006 | | $ | 1.00 | | 0.04 | | | — | (5) | | 0.04 | | | (0.04 | ) | | — | |
Period Ended November 30, 2005 (8) | | $ | 1.00 | | 0.01 | | | — | (5) | | 0.01 | | | (0.01 | ) | | — | |
Year Ended August 31, 2005 | | $ | 1.00 | | 0.02 | | | — | (5) | | 0.02 | | | (0.02 | ) | | — | |
Year Ended August 31, 2004 | | $ | 1.00 | | 0.01 | | | — | (5) | | 0.01 | | | (0.01 | ) | | — | |
| (1) | | Total return is based on net asset value, which excludes the sales charge or contingent deferred sales charge, if applicable. |
| (2) | | Not annualized for periods less than one year. |
| (3) | | Ratio annualized for periods less than one year. |
| (4) | | This voluntary expense decrease is reflected in both the net expense and net investment income/(loss) ratios shown. |
| (5) | | Represents less than $0.005. |
| (6) | | Represents less than $1,000. |
| (7) | | From the commencement of investment operations on April 3, 2006. |
| (8) | | For the period September 1, 2005 to November 30, 2005. |
The Notes to the Financial Statements are an integral part of, and should be read in conjunction with, the Financial Statements.
94
REGIONS MORGAN KEEGAN SELECT FUNDS
| | | | | | | | | | | | | | | | | | | | |
| | | | | | | | | Ratios to Average Net Assets
| | | Supplemental Data
| |
Total
Distributions | | | Net Asset
Value,
End of
Period | | Total
Return (1, 2) | | | Net
Investment
Income (3) | | | Net
Expenses (3) | | | Expenses Waiver/
Reimbursement (3, 4) | | | Net Assets,
End of Period
(000's) | |
| | | | | | | | | | | | | | | | | | | | | |
| | | | | | | | | | | | | | | | | | | | | |
| (0.01 | ) | | $ | 1.00 | | 1.35 | % | | 1.39 | % | | 0.65 | % | | — | | | $ | 973,252 | |
| (0.04 | ) | | $ | 1.00 | | 4.21 | % | | 4.11 | % | | 0.64 | % | | — | | | $ | 1,256,827 | |
| (0.04 | ) | | $ | 1.00 | | 4.10 | % | | 4.03 | % | | 0.60 | % | | 0.04 | % | | $ | 1,086,552 | |
| (0.02 | ) | | $ | 1.00 | | 2.25 | % | | 2.19 | % | | 0.62 | % | | 0.30 | % | | $ | 827,861 | |
| (0.01 | ) | | $ | 1.00 | | 0.54 | % | | 0.55 | % | | 0.64 | % | | 0.29 | % | | $ | 861,369 | |
| | | | | | |
| | | | | | | | | | | | | | | | | | | | | |
| | | | | | | | | | | | | | | | | | | | | |
| (0.02 | ) | | $ | 1.00 | | 1.61 | % | | 1.64 | % | | 0.40 | % | | — | | | $ | 7,047 | |
| (0.04 | ) | | $ | 1.00 | | 4.24 | % | | 4.36 | % | | 0.39 | % | | — | | | $ | 1,444 | |
| (0.03 | ) | | $ | 1.00 | | 2.67 | % | | 4.03 | % | | 0.35 | % | | 0.04 | % | | $ | — | (6) |
| | | | | | |
| | | | | | | | | | | | | | | | | | | | | |
| | | | | | | | | | | | | | | | | | | | | |
| (0.02 | ) | | $ | 1.00 | | 2.26 | % | | 2.36 | % | | 0.70 | % | | — | | | $ | 91,466 | |
| (0.04 | ) | | $ | 1.00 | | 4.56 | % | | 4.41 | % | | 0.74 | % | | — | | | $ | 136,165 | |
| (0.04 | ) | | $ | 1.00 | | 4.03 | % | | 3.97 | % | | 0.82 | % | | — | | | $ | 76,215 | |
| (0.01 | ) | | $ | 1.00 | | 0.80 | % | | 2.94 | % | | 0.85 | % | | 0.15 | % | | $ | 78,491 | |
| (0.02 | ) | | $ | 1.00 | | 1.55 | % | | 1.45 | % | | 1.06 | % | | 0.17 | % | | $ | 42,404 | |
| — | (5) | | $ | 1.00 | | 0.20 | % | | 0.19 | % | | 1.12 | % | | 0.19 | % | | $ | 68,301 | |
| | | | | | |
| | | | | | | | | | | | | | | | | | | | | |
| | | | | | | | | | | | | | | | | | | | | |
| (0.02 | ) | | $ | 1.00 | | 2.52 | % | | 2.61 | % | | 0.45 | % | | — | | | $ | 11,766 | |
| (0.05 | ) | | $ | 1.00 | | 4.82 | % | | 4.66 | % | | 0.49 | % | | — | | | $ | 11,834 | |
| (0.04 | ) | | $ | 1.00 | | 4.29 | % | | 4.22 | % | | 0.57 | % | | — | | | $ | 12,915 | |
| (0.01 | ) | | $ | 1.00 | | 0.74 | % | | 3.21 | % | | 0.60 | % | | 0.15 | % | | $ | 39,382 | |
| (0.02 | ) | | $ | 1.00 | | 2.06 | % | | 1.92 | % | | 0.55 | % | | 0.31 | % | | $ | 37,575 | |
| (0.01 | ) | | $ | 1.00 | | 0.70 | % | | 0.70 | % | | 0.62 | % | | 0.44 | % | | $ | 120,022 | |
The Notes to the Financial Statements are an integral part of, and should be read in conjunction with, the Financial Statements.
95
REGIONS MORGAN KEEGAN SELECT FUNDS
NOTESTOTHE FINANCIAL STATEMENTS
Regions Morgan Keegan Select Funds (the “Trust”) was organized as a Massachusetts business trust under a Declaration of Trust dated October 15, 1991. The Trust is an open-end, management investment company registered under the Investment Company Act of 1940, as amended (the “1940 Act”). The Trust consists of eleven portfolios, each with its own investment objective. The accompanying financial statements are for Regions Morgan Keegan Select Mid Cap Growth Fund, Regions Morgan Keegan Select Growth Fund, Regions Morgan Keegan Select Core Equity Fund, Regions Morgan Keegan Select Mid Cap Value Fund, Regions Morgan Keegan Select Value Fund, Regions Morgan Keegan Select Balanced Fund, Regions Morgan Keegan Select Fixed Income Fund, Regions Morgan Keegan Select Limited Maturity Fixed Income Fund, Regions Morgan Keegan Select Intermediate Tax Exempt Bond Fund, Regions Morgan Keegan Select Treasury Money Market Fund and Regions Morgan Keegan Select Money Market Fund (each a “Fund” and, collectively, the “Funds”). All Funds, excluding Regions Morgan Keegan Select Treasury Money Market Fund and Regions Morgan Keegan Select Money Market Fund, are referred to as the “Variable Funds”. Regions Morgan Keegan Select Treasury Money Market Fund and Regions Morgan Keegan Select Money Market Fund are referred to as the “Money Market Funds”.
The Declaration of Trust permits the Board of Trustees to issue an unlimited number of full and fractional shares of beneficial interest (without par value) for each class of shares. The Variable Funds offer Class A Shares, Class C Shares and Class I Shares, while the Money Market Funds offer Class A Shares and Class I Shares.
Each class of shares in each Fund has identical rights and privileges except with respect to fees paid under the Fund’s distribution plan, shareholder services plan and voting rights on matters affecting a single class of shares. Class A Shares of the Variable Funds are sold at net asset value (“NAV”) plus the applicable front-end sales charge. The sales charge varies depending on the amount purchased. Purchases of Class A Shares of the Variable Funds of $1 million or more are sold at NAV and have a 1% contingent deferred sales charge (“CDSC”) if the shares are redeemed within one year of purchase. Class A Shares of the Money Market Funds are sold at NAV and are not subject to a CDSC. Class C Shares and Class I Shares of the Funds are sold without a sales charge at NAV per share. Class C Shares of the Variable Funds have a 1% CDSC if shares are redeemed within one year of purchase. Class I Shares are available only to a limited group of investors at the discretion of the Funds through special programs like employer-sponsored retirement plans, advisory accounts of the investment adviser and certain programs available through brokers, like wrap accounts. These programs usually involve special conditions and separate fees. The assets of each Fund of the Trust are segregated and a shareholder’s interest is limited to the Fund in which shares are held.
Under the Trust’s organizational documents, its officers and trustees are indemnified against certain liabilities arising out of the performance of their duties to the Funds. In addition, in the normal course of business, the Trust on behalf of the Funds enters into contracts with vendors and others that provide for general indemnifications. The Funds’ maximum exposure under these arrangements is unknown, as this would involve future claims that may be made against the Funds. Thus, an estimate of the financial impact, if any, of these arrangements cannot be made at this time.
| 2 | Significant Accounting Policies |
The following is a summary of significant accounting policies followed by the Funds in the preparation of their financial statements. These policies are in conformity with accounting principles generally accepted in the United States (“GAAP”).
Investment Valuations—Investments in securities listed or traded on a securities exchange are valued at the last quoted sale price on the exchange where the security is primarily traded as of the close of business on the New York Stock Exchange, usually 4:00 p.m. Eastern Time, on the valuation date. Equity securities traded on the Nasdaq Stock Market are valued at the Nasdaq Official Closing Price (“NOCP”) provided by Nasdaq each business day. The NOCP is the most recently reported price as of 4:00:02 p.m. Eastern Time, unless that price is outside the range of the “inside” bid and asked price (i.e., the bid and asked prices that dealers quote to each other when trading for their own accounts); in that case, Nasdaq will adjust the price to equal the inside bid or asked price, whichever is closer. Because of delays in
96
REGIONS MORGAN KEEGAN SELECT FUNDS
reporting trades, the NOCP may not be the last trade to occur before the market closes. Securities traded in the over-the-counter market and listed securities for which no sales were reported for that date are valued at the last quoted bid price.
Equity and debt securities issued in private placements are valued on the bid side by a primary market dealer. Long-term debt securities (including U.S. government securities, listed corporate bonds, other debt and asset-backed securities, and unlisted securities and private placement securities) are generally valued at the latest price furnished by an independent pricing service or primary market dealer. Short-term debt securities with remaining maturities of more than 60 days for which market quotations are readily available are valued by an independent pricing service or primary market dealer. Short-term debt securities with remaining maturities of 60 days or less are valued at cost with interest accrued or discount accreted to the date of maturity, unless such valuation, in the judgment of Morgan Asset Management, Inc. (the “Adviser”)’s Valuation Committee, does not represent fair value.
Investments in open-end registered investment companies, if any, are valued at NAV as reported by those investment companies. Foreign securities denominated in foreign currencies, if any, are translated from the local currency into U.S. dollars using current exchange rates.
In accordance with Rule 2a-7 under the 1940 Act, investments of the Money Market Funds are valued at amortized cost, which approximates market value. Under the amortized cost method, discount or premium is amortized on a constant basis to the maturity of the security.
Investments for which market quotations are not readily available, or if available quotations are not believed to be reflective of fair value, are valued at fair value as determined by the Adviser’s Valuation Committee using procedures established by and under the supervision of the Trust’s Board of Trustees. The values assigned to fair valued investments are based on available information and do not necessarily represent amounts that might ultimately be realized, since such amounts depend on future developments inherent in long-term investments. Further, because of the inherent uncertainty of valuation, those estimated values may differ significantly from the values that would have been used had a ready market for the investments existed, and the differences could be material.
A Fund may use the fair value of a security to calculate its NAV when, for example, (1) a portfolio security is not traded in a public market or the principal market in which the security trades is closed, (2) trading in a portfolio security is suspended and not resumed prior to the normal market close, (3) a portfolio security is not traded in significant volume for a substantial period, or (4) the Adviser determines that the quotation or price for a portfolio security provided by a dealer or independent pricing services is inaccurate.
Among the more specific factors that are considered by the Valuation Committee in determining the fair value of a security are: (1) type of security; (2) financial statements of the issuer; (3) cost at date of purchase (generally used for initial valuation); (4) size of the Fund’s holding; (5) for restricted securities, the discount from market value of unrestricted securities of the same class at the time of purchase; (6) the existence of a shelf registration for restricted securities; (7) information as to any transactions or offers with respect to the security; (8) special reports prepared by analysts; (9) the existence of merger proposals, tender offers or similar events affecting the security; (10) the price and extent of public trading in similar securities of the issuer or comparable companies; (11) the fundamental analytical data relating to the investment; (12) the nature and duration of restrictions on disposition of the securities; and (13) evaluation of the forces which influence the market in which these securities are purchased and sold.
There can be no assurance that a Fund could purchase or sell a portfolio security at the price used to calculate the Fund’s NAV. Changes in the fair valuation of portfolio securities may be less frequent and of greater magnitude than changes in the price of portfolio securities valued at their last sale price, by an independent pricing service, or based on market quotations.
The Funds have adopted Financial Accounting Standards Board Statement of Financial Accounting Standards No. 157, Fair Value Measurements (“FAS 157"). In accordance with FAS 157, “fair value” is defined as the price that a Fund would receive upon selling an investment in an orderly transaction to an independent buyer in the principal or most
97
REGIONS MORGAN KEEGAN SELECT FUNDS
advantageous market for the investment. Various inputs are used in determining the value of a Fund’s investments. FAS 157 establishes a three-tier hierarchy of inputs to establish a classification of fair value measurements for disclosure purposes. The three-tier hierarchy of inputs is summarized in the three broad Levels listed below.
| n | | Level 1—quoted prices in active markets for identical investments; |
| n | | Level 2—inputs other than quoted prices that are observable for the asset or liability either directly or indirectly, including inputs in markets that are not considered to be active; |
| n | | Level 3—significant unobservable inputs (including the Fund’s own assumptions in determining the fair value of investments). |
Inputs are used in applying the various valuation techniques and broadly refer to the assumptions that market participants use to make valuation decisions, including assumptions about risk. Inputs may include price information, volatility statistics, specific and broad credit data, liquidity statistics, and other factors. A financial instrument’s level within the fair value hierarchy is based on the lowest level of any input that is significant to the fair value measurement. However, the determination of what constitutes “observable” requires significant judgment by the Funds. The Funds consider observable data to be that market data which is readily available, regularly distributed or updated, reliable and verifiable, not proprietary, and provided by independent sources that are actively involved in the relevant market. The categorization of a financial instrument within the hierarchy is based upon the pricing transparency of the instrument and does not necessarily correspond to the Funds’ perceived risk of that instrument.
Investments whose values are based on quoted market prices in active markets, and are therefore classified within Level 1, include active listed equities, certain U.S. government obligations, and certain money market securities. Investments that trade in markets that are not considered to be active, but are valued based on quoted market prices, dealer quotations or alternative pricing sources supported by observable inputs are classified within Level 2. These include certain U.S. government and sovereign obligations, most government agency securities, investment-grade corporate bonds, certain mortgage products, state, municipal and provincial obligations. Investments classified within Level 3 have significant unobservable inputs, as they trade infrequently or not at all.
The following is a summary of the inputs used to value the Fund’s investments as of November 30, 2008:
| | | | | | | | | | | | | | |
| | | Investments in Securities
|
| Valuation Inputs | | Mid Cap
Growth Fund | | | Growth
Fund | | | Core Equity
Fund | | Mid Cap
Value Fund |
Level 1—Quoted Prices | | $ | 230,164,368 | (1) | | $ | 255,756,196 | (2) | | $ | 8,801,962 | | $ | 33,708,673 |
Level 2—Other Significant Observable Inputs | | | 34,546,558 | | | | 14,879,068 | | | | — | | | 655,647 |
Level 3—Significant Unobservable Inputs | | | — | | | | — | | | | — | | | — |
| | |
|
|
| |
|
|
| |
|
| |
|
|
Total | | $ | 264,710,926 | | | $ | 270,635,264 | | | $ | 8,801,962 | | $ | 34,364,320 |
| | |
|
|
| |
|
|
| |
|
| |
|
|
| |
| | | Investments in Securities
|
| Valuation Inputs | | Value
Fund | | | Balanced
Fund | | | Fixed
Income Fund | | Limited
Maturity Fixed
Income Fund |
Level 1—Quoted Prices | | $ | 163,226,241 | | | $ | 85,888,910 | (3) | | $ | 13,754,954 | | $ | 2,351,455 |
Level 2—Other Significant Observable Inputs | | | — | | | | 53,880,504 | | | | 120,171,899 | | | 2,913,160 |
Level 3—Significant Unobservable Inputs | | | — | | | | — | | | | — | | | — |
| | |
|
|
| |
|
|
| |
|
| |
|
|
Total | | $ | 163,226,241 | | | $ | 139,769,414 | | | $ | 133,926,853 | | $ | 5,264,615 |
| | |
|
|
| |
|
|
| |
|
| |
|
|
98
REGIONS MORGAN KEEGAN SELECT FUNDS
| | | | | | | | | |
| | | Investments in Securities
|
| Valuation Inputs | | Intermediate
Tax Exempt
Bond Fund | | Treasury
Money
Market Fund | | Money
Market Fund |
Level 1—Quoted Prices | | $ | 770,745 | | $ | 92,107,880 | | $ | 5,813,694 |
Level 2—Other Significant Observable Inputs | | | 25,433,326 | | | 887,166,615 | | | 96,968,719 |
Level 3—Significant Unobservable Inputs | | | — | | | — | | | — |
| | |
|
| |
|
| |
|
|
Total | | $ | 26,204,071 | | $ | 979,274,495 | | $ | 102,782,413 |
| | |
|
| |
|
| |
|
|
(1) | | Includes written options valued at $(119,000). |
(2) | | Includes written options valued at $(753,000). |
(3) | | Includes written options valued at $(35,250). |
The following is a reconciliation between the beginning and ending balances of investments in which significant unobservable inputs (Level 3) were used in determining value:
| | | | | | | | |
| | | Investments in Securities
| |
| | | Fixed
Income Fund
| | | Limited
Maturity Fixed
Income Fund
| |
Balance as of November 30, 2007 | | $ | 1,851,290 | | | $ | 476,388 | |
Net sales at cost | | | (950,000 | ) | | | (331,055 | ) |
Realized losses | | | (1,050,000 | ) | | | (178,451 | ) |
Change in unrealized appreciation | | | 148,710 | | | | 33,118 | |
Accretion/(amortization) | | | — | | | | — | |
| | |
|
|
| |
|
|
|
Balance as of November 30, 2008 | | $ | — | | | $ | — | |
| | |
|
|
| |
|
|
|
Investment Transactions and Investment Income—Securities transactions are recorded on the trade date for financial reporting purposes. Realized gains and losses from securities transactions are recorded using the identified cost basis. Dividend income is recorded on the ex-dividend date. Interest income, including amortization of premiums and accretion of discounts, is accrued on a daily basis.
Federal Income Taxes—Each Fund of the Trust is treated as a separate corporation for federal tax purposes. No provision for federal income or excise taxes is required because each Fund intends to continue to qualify each year as a regulated investment company under Subchapter M of Chapter 1 of the Internal Revenue Code of 1986, as amended (the “Code”), and to distribute substantially all its net investment income and net realized capital gains to its shareholders.
In July 2006, FASB released FASB Interpretation No. 48 “Accounting for Uncertainty in Income Taxes” (“FIN 48”), an interpretation of FASB Statement No. 109. FIN 48 provides guidance for how uncertain tax positions should be recognized, measured, presented and disclosed in the financial statements. FIN 48 requires the accounting and disclosure of tax positions taken or expected to be taken in the course of preparing the Fund’s tax returns to determine whether the tax positions are more likely than not to be sustained by the applicable tax authority. Tax positions not deemed to meet the more likely than not threshold would be recorded as a tax benefit or expense in the current year.
The Funds have reviewed all taxable years that are open for examination (i.e., not barred by the applicable statute of limitations) by taxing authorities of all major taxing jurisdictions, including the Internal Revenue Service. As of November 30, 2008, open taxable years consisted of the taxable years ended November 30, 2005 through November 30, 2008. No examination of any Fund is currently in progress.
Each Fund has reviewed all its open taxable years for all major taxing jurisdictions and concluded that application of FIN 48 resulted in no effect to the Fund’s financial position or results of operations. There is no tax liability resulting
99
REGIONS MORGAN KEEGAN SELECT FUNDS
from unrecognized tax benefits relating to uncertain income tax positions taken or expected to be taken on any Fund’s tax return for the taxable year ended November 30, 2008. The Funds also are not aware of any tax positions for which it is reasonably possible that the total amounts of unrecognized tax benefits will significantly change in the next twelve months.
Expenses—Expenses directly attributable to a Fund are charged directly to that Fund, while expenses which are attributable to more than one Fund of the Trust are allocated among the respective Funds based upon relative net assets. Expenses directly attributable to a class of shares are charged directly to that class.
Class Allocations—The investment income, fees and expenses (other than class specific fees and expenses) and realized and unrealized gains and losses of a Fund are allocated to each class of shares based upon their relative net assets or another appropriate basis on the date the income is earned or the expenses and realized and unrealized gains and losses are incurred.
Dividends and Other Distributions to Shareholders—Each Fund pays dividends to its shareholders from its net investment income. Dividends for Regions Morgan Keegan Select Mid Cap Growth Fund, Regions Morgan Keegan Select Growth Fund, Regions Morgan Keegan Select Core Equity Fund, Regions Morgan Keegan Select Mid Cap Value Fund, Regions Morgan Keegan Select Value Fund and Regions Morgan Keegan Select Balanced Fund, if any, are declared and paid quarterly, while dividends for all other Funds are declared daily and paid monthly. Each Fund also pays distributions at least annually from its net realized capital gains, if any. Dividends are declared separately for each share class. No share class has preferential dividend rights; differences in per share dividend rates are generally due to differences in class-specific fees and expenses. Dividends and other distributions to shareholders are recorded on the ex-distribution date. The tax composition of each Fund’s distributions for each calendar year is reported on IRS Form 1099-DIV.
The amounts of dividends from net investment income and distributions from net realized capital gains are determined in accordance with federal income tax regulations, which may differ from GAAP. These “book/tax” differences are either considered temporary or permanent in nature. To the extent these differences are permanent in nature (e.g., reclassification of market discounts, net operating losses, paydowns and distributions), they are reclassified within the composition of net assets based on their federal tax treatment; temporary differences do not require reclassification. To the extent distributions from net investment income and net realized capital gains exceed such income and capital gains for tax purposes, they are reported as return of capital.
Restricted Securities—The Variable Funds may purchase investment securities which are unregistered and thus restricted as to resale. These securities, if any, are valued by the Variable Funds after giving due consideration to pertinent factors including recent private sales, market conditions and the issuer’s financial performance. Where future disposition of these securities requires registration under the Securities Act of 1933, the Variable Funds have the right to include these securities in such registration, generally without cost to the Funds. The Variable Funds have no right to require registration of unregistered securities. At November 30, 2008, the Variable Funds did not own any restricted securities.
Repurchase Agreements—The Funds may purchase instruments from financial institutions, such as banks and broker-dealers, subject to the seller’s agreement to repurchase them at an agreed-upon time and price (“repurchase agreement”). The Funds may invest in repurchase agreements with institutions that are deemed by the Adviser to be of good standing and creditworthy. A third party custodian bank takes possession of the underlying securities (“collateral”) of a repurchase agreement, the value of which is required at all times to at least equal the principal amount of the repurchase transaction and accrued interest. In the event of counterparty default on the obligation to repurchase, each Fund has the right to liquidate the collateral and apply the proceeds in satisfaction of the obligation. However, there could be potential losses to the Funds in the event of default or bankruptcy by the counterparty to the agreement if the Funds are delayed or prevented from exercising their rights to dispose of the collateral, including the risk of possible decline in the value of the collateral during the period while the Funds seek to assert their rights.
100
REGIONS MORGAN KEEGAN SELECT FUNDS
Securities Lending—The Funds have established a securities lending agreement with The Bank of New York Mellon as securities lending agent in which a Fund may lend its portfolio securities to qualified borrowers in exchange for collateral consisting of either cash or U.S. government securities in an amount at least equal to the market value of the securities on loan. Cash collateral is invested in approved investments defined in the securities lending agreement. Earnings on collateral are allocated between the securities lending agent, as a fee for its services under the program, and the Funds, according to agreed-upon rates. In the event of counterparty default, a Fund may be subject to potential loss if it is delayed or prevented from exercising its right to dispose of the collateral. The Funds bear risk in the event that invested collateral is not sufficient to meet obligations due on loans. The Trust and Bank of New York Mellon have entered into a credit support agreement related to two securities owned by the Bank of New York Institutional Cash Reserves Fund which are currently in default. The Bank of New York Mellon has agreed to support one defaulted security up to 100% of its value and a second defaulted security up to 80% of its value. The approved investments for the cash collateral are valued at amortized cost or at par (which approximates fair value) with the exception of the two securities owned by the Bank of New York Institutional Cash Reserves Fund which are currently in default and are being valued at the amounts supported by the aforementioned credit support agreement.
Options Writing—When a Fund writes an option, an amount equal to the premium received by the Fund is included in the Statement of Assets and Liabilities as a liability. The amount of the liability is subsequently marked to market to reflect the current value of the option written in accordance with the Fund's policies on investment valuations discussed above. Premiums received from writing options which expire are treated as realized gains. Premiums received from writing options which are exercised or are closed are added to or offset against the proceeds or amount paid on the transaction to determine the realized gain or loss. If a put option is exercised, the premium reduces the cost basis of the securities purchased by the Fund. The Fund, as writer of an option, may have no control over whether the underlying securities may be sold (call) or purchased (put) and, as a result, bears the market risk of an unfavorable change in the price of the securities underlying the written option. Risk of loss is in excess of amounts recorded on the balance sheet.
When-Issued and Delayed Delivery Transactions—The Funds may engage in when-issued or delayed delivery transactions. The Funds record when-issued securities on the trade date and maintain security positions such that sufficient liquid assets will be available to make payment for the securities purchased. Securities purchased on a when-issued or delayed delivery basis are marked to market daily and begin earning interest on the settlement date. Losses may occur on these transactions due to changes in market conditions or the failure of counterparties to perform under the contract.
Use of Estimates—The preparation of financial statements in conformity with GAAP requires management to make estimates and assumptions that affect the reported amount of assets and liabilities and disclosure of contingent assets and liabilities as of the date of the financial statements and the reported amounts of revenues and expenses during the reporting period. Actual results could differ from these estimates.
| 3 | Agreements and Other Transactions with Affiliates |
Investment Adviser—The Trust, on behalf of the Funds, has entered into Investment Advisory Agreements with the Adviser, a wholly owned subsidiary of MK Holding, Inc., which is a wholly owned subsidiary of Regions Financial Corporation (“Regions”). Under the terms of the agreements, the Funds are charged the following annual management fees which are calculated daily and paid monthly based on the average daily net assets of the Funds. The Adviser may voluntarily choose to waive any portion of its fee.
| | | |
| Fund | | Annual Fee | |
Mid Cap Growth Fund | | 0.75 | % |
Growth Fund | | 0.75 | % |
Core Equity Fund | | 0.75 | % |
Mid Cap Value Fund | | 0.75 | % |
Value Fund | | 0.75 | % |
Balanced Fund | | 0.75 | % |
Fixed Income Fund | | 0.50 | % |
Limited Maturity Fixed Income Fund | | 0.40 | %(1) |
Intermediate Tax Exempt Bond Fund | | 0.25 | % |
Treasury Money Market Fund | | 0.20 | %(2) |
Money Market Fund | | 0.25 | % |
(1) | | Effective April 1, 2008, the Adviser voluntarily agreed to waive fees and reimburse expenses to the extent that the Fund’s total annual operating expenses (excluding brokerage, interest, taxes, and extraordinary expenses) exceed 1.00%, 1.75% and 0.75% of |
101
REGIONS MORGAN KEEGAN SELECT FUNDS
| | net assets of Class A Shares, Class C Shares and Class I Shares, respectively, on an annualized basis for the period that the voluntary waiver is in effect. The Adviser will evaluate the continuance of this voluntary waiver at each month-end and it can terminate this voluntary waiver at any time. |
(2) | | In light of recent extraordinary market events, effective November 20, 2008, the Adviser has voluntarily agreed to waive fees and reimburse expenses to the extent necessary to prevent a negative yield for each class of shares of the Fund. This undertaking is voluntary and may be modified or discontinued by the Adviser at any time. |
Investment Sub-Adviser to Regions Morgan Keegan Select Mid Cap Value Fund—Channing Capital Management, LLC (“CCM”) serves as the sub-adviser to Regions Morgan Keegan Select Mid Cap Value Fund pursuant to an Investment Sub-advisory Agreement with the Adviser and the Trust on behalf of Regions Morgan Keegan Select Mid Cap Value Fund. For the services provided and the expenses assumed by CCM pursuant to the Sub-advisory Agreement, the Adviser, not the Fund, pays CCM an annual sub-advisory fee of 0.325% based on the average daily net assets of Regions Morgan Keegan Select Mid Cap Value Fund.
Administrator and Sub-Administrators—The Trust and Morgan Keegan & Company, Inc. (“Morgan Keegan”), a wholly owned subsidiary of Regions and an affiliate of the Adviser, have entered into an Administration Agreement, under which Morgan Keegan provides certain administrative personnel and services for an annual fee of 0.065% based on the average daily net assets of the Funds. Morgan Keegan also provides an employee to serve as the Funds’ Chief Compliance Officer for which Morgan Keegan receives no additional compensation from the Funds.
The Trust and Regions Bank, N.A. (“Regions Bank”) have entered into a Sub-Administrative Services Agreement under which Regions Bank provides certain administrative services for an annual fee of 0.025% of the average daily net assets of the Funds.
Fund Accountant—The Trust and Morgan Keegan have entered into a Fund Accounting Service Agreement, under which Morgan Keegan provides portfolio accounting services to the Funds for an annual fee of 0.03% based on the average daily net assets of the Funds.
Distributor—The Trust has adopted a Distribution Plan pursuant to Rule 12b-1 under the 1940 Act (“12b-1 Plan”) with respect to Class C Shares of the Variable Funds. The 12b-1 Plan compensates Morgan Keegan, the Funds’ primary Distributor, and other dealers and investment representatives for services and expenses relating to the sale and distribution of the Variable Funds’ shares. Under the Class C Shares’ 12b-1 Plan, the Trust will pay a fee at an annual rate of up to 0.75% of the average daily net assets with respect to Class C Shares of the Variable Funds.
Shareholder Services Agent—The Trust on behalf of the Funds and Morgan Keegan have entered into a Shareholder Services Agreement, under which Morgan Keegan provides certain services for shareholders and maintains shareholder accounts for an annual fee of 0.25% of the average daily net assets of the Funds’ Class A Shares and Class C Shares.
Sales Charges—Morgan Keegan received commissions on the sale of shares of the Variable Funds. During the fiscal year ended November 30, 2008, Morgan Keegan received front-end sales charges related to Class A Shares and CDSCs related to Class A Shares and Class C Shares as follows:
| | | | | | | | | |
| | | Front End
Sales Charges
| | Contingent Deferred
Sales Charges
|
| | | Class A Shares
| | Class A Shares
| | Class C Shares
|
Mid Cap Growth Fund | | $ | 12,284 | | $ | — | | $ | 1,841 |
Growth Fund | | | 1,851 | | | — | | | 683 |
Core Equity Fund | | | 550 | | | 302 | | | — |
Mid Cap Value Fund | | | 222 | | | 102 | | | 653 |
Value Fund | | | — | | | — | | | — |
Balanced Fund | | | 483 | | | 436 | | | 2,406 |
Fixed Income Fund | | | 2 | | | — | | | 2,010 |
Limited Maturity Fixed Income Fund | | | 656 | | | — | | | 1,761 |
Intermediate Tax Exempt Bond Fund | | | 10 | | | 9,235 | | | 990 |
102
REGIONS MORGAN KEEGAN SELECT FUNDS
Transfer Agent and Dividend Disbursing Agent—Morgan Keegan serves as the Transfer and Dividend Disbursing Agent for the Funds. Pursuant to the Transfer Agency and Service Agreement, each Fund pays Morgan Keegan an annual base fee per share class plus a variable fee based on the number of shareholder accounts.
Custodian—Regions Bank acts as Custodian for all of the Funds. The fee is based on the level of each Fund’s average daily net assets for the period, plus out-of-pocket expenses.
Trustees and Officers—Certain of the officers and trustees of the Trust are also officers or directors of the Adviser, Morgan Keegan or Regions. Such officers and trustees of the Trust who are “interested persons” as defined in the 1940 Act receive no salary or fees from the Funds.
Prior to September 30, 2008, each trustee who is not an interested person as described above (an “Independent Trustee”) received from the Trust an annual retainer of $4,000 and a fee of $1,000 per quarterly meeting with reimbursement for related expenses for each meeting of the Board attended. Effective October 1, 2008, each Independent Trustee receives from the Trust an annual retainer of $16,000 and a fee of $3,000 per quarterly meeting with reimbursement for related expenses for each meeting of the Board attended. Each chairperson of the Independent Trustees Committee and Audit Committee receives from the Trust annual compensation of $500. An additional $1,500 is paid to the Independent Trustees for attending special Board meetings in person, and an additional $500 is paid for attending special Board meetings by telephone. For committee meetings that are not held in conjunction with a full Board meeting, an additional $1,000 is paid to the Independent Trustees for attending in-person committee meetings, and $500 is paid for attending telephonic committee meetings. No officer or trustee is entitled to receive pension or retirement benefits from the Trust.
During the fiscal year ended November 30, 2008, cost of purchases and proceeds from sales of investment securities (excluding short-term securities and U.S. government obligations) for each Fund were as follows:
Investment Transactions:
| | | | | | | | | | | | |
| | | Long-Term
Government Securities
| | All Other
|
| Fund | | Purchases | | Sales | | Purchases | | Sales |
Mid Cap Growth Fund | | $ | — | | $ | — | | $ | 151,571,636 | | $ | 118,730,171 |
Growth Fund | | | — | | | — | | | 99,780,561 | | | 215,718,047 |
Core Equity Fund | | | — | | | — | | | 40,941,702 | | | 88,506,305 |
Mid Cap Value Fund | | | — | | | — | | | 32,355,056 | | | 50,168,981 |
Value Fund | | | — | | | — | | | 386,778,250 | | | 387,736,332 |
Balanced Fund | | | — | | | 8,593,176 | | | 60,503,291 | | | 52,758,697 |
Fixed Income Fund | | | 6,919,477 | | | 23,509,480 | | | 12,661,040 | | | 30,087,674 |
Limited Maturity Fixed Income Fund | | | — | | | 5,168,168 | | | 3,072,783 | | | 13,970,022 |
Intermediate Tax Exempt Bond Fund | | | — | | | — | | | 2,146,746 | | | 30,044,832 |
As of November 30, 2008, the Funds had securities on loan as follows:
| | | | | | |
| Fund | | Cash Received
as Collateral | | Value of
Securities Loaned |
Mid Cap Growth Fund | | $ | 48,524,300 | | $ | 47,597,457 |
Growth Fund | | | 21,386,127 | | | 21,077,540 |
Mid Cap Value Fund | | | 684,701 | | | 664,872 |
Balanced Fund | | | 12,992,960 | | | 12,848,547 |
Fixed Income Fund | | | 8,564,259 | | | 8,433,857 |
Limited Maturity Fixed Income Fund | | | 917,275 | | | 900,408 |
103
REGIONS MORGAN KEEGAN SELECT FUNDS
Transactions in options written during the fiscal year ended November 30, 2008 were as follows:
Options Transactions:
| | | | | | | | | | | | | | |
| | | Mid Cap Growth Fund
| | | Growth Fund
| |
| | | Number of
Contracts
| | | Premiums
Received
| | | Number of
Contracts
| | | Premiums
Received
| |
Options outstanding at November 30, 2007 | | — | | | $ | — | | | — | | | $ | — | |
Options written | | 5,066 | | | | 1,210,633 | | | 2,400 | | | | 1,120,759 | |
Options terminated in closing purchase transactions | | (2,866 | ) | | | (826,109 | ) | | (400 | ) | | | (578,032 | ) |
Options expired | | (1,000 | ) | | | (134,499 | ) | | — | | | | — | |
Options exercised | | — | | | | — | | | — | | | | — | |
| | |
|
| |
|
|
| |
|
| |
|
|
|
Options outstanding at November 30, 2008 | | 1,200 | | | $ | 250,025 | | | 2,000 | | | $ | 542,727 | |
| | |
|
| |
|
|
| |
|
| |
|
|
|
| | |
| | | Core Equity
| | | Value Fund
| |
| | | Number of
Contracts
| | | Premiums
Received
| | | Number of
Contracts
| | | Premiums
Received
| |
Options outstanding at November 30, 2007 | | — | | | $ | — | | | — | | | $ | — | |
Options written | | 480 | | | | 125,149 | | | 1,900 | | | | 206,467 | |
Options terminated in closing purchase transactions | | (480 | ) | | | (125,149 | ) | | (1,900 | ) | | | (206,467 | ) |
Options expired | | — | | | | — | | | — | | | | — | |
Options exercised | | — | | | | — | | | — | | | | — | |
| | |
|
| |
|
|
| |
|
| |
|
|
|
Options outstanding at November 30, 2008 | | — | | | $ | — | | | — | | | $ | — | |
| | |
|
| |
|
|
| |
|
| |
|
|
|
| | |
| | | Balanced Fund
| | | | |
| | | Number of
Contracts
| | | Premiums
Received
| | | | | | | |
Options outstanding at November 30, 2007 | | — | | | $ | — | | | | | | | | |
Options written | | 7,110 | | | | 2,318,448 | | | | | | | | |
Options terminated in closing purchase transactions | | (6,860 | ) | | | (2,269,978 | ) | | | | | | | |
Options expired | | — | | | | — | | | | | | | | |
Options exercised | | — | | | | — | | | | | | | | |
| | |
|
| |
|
|
| | | | | | | |
Options outstanding at November 30, 2008 | | 250 | | | $ | 48,470 | | | | | | | | |
| | |
|
| |
|
|
| | | | | | | |
104
REGIONS MORGAN KEEGAN SELECT FUNDS
| 7 | Capital Share Transactions |
Capital share transactions for the Funds were as follows:
| | | | | | | | | | | | | | |
| | | Mid Cap Growth Fund | |
| | | Year Ended
November 30, 2008
| | | Year Ended
November 30, 2007
| |
| Class A Shares | | Shares | | | Dollars | | | Shares | | | Dollars | |
Shares sold | | 1,768,216 | | | $ | 27,436,057 | | | 1,751,324 | | | $ | 30,274,539 | |
Shares issued to shareholders in payment of distributions declared | | 1,660,480 | | | | 27,298,294 | | | 2,049,165 | | | | 33,012,051 | |
Shares redeemed | | (9,879,284 | ) | | | (151,508,605 | ) | | (5,956,872 | ) | | | (102,124,018 | ) |
| | |
|
| |
|
|
| |
|
| |
|
|
|
Net change resulting from Class A Share transactions | | (6,450,588 | ) | | $ | (96,774,254 | ) | | (2,156,383 | ) | | $ | (38,837,428 | ) |
| | |
|
| |
|
|
| |
|
| |
|
|
|
| | |
| | | Year Ended
November 30, 2008
| | | Year Ended
November 30, 2007
| |
| Class C Shares | | Shares | | | Dollars | | | Shares | | | Dollars | |
Shares sold | | 87,612 | | | $ | 1,274,474 | | | 257,765 | | | $ | 4,364,168 | |
Shares issued to shareholders in payment of distributions declared | | 73,083 | | | | 1,149,595 | | | 71,683 | | | | 1,113,240 | |
Shares redeemed | | (247,510 | ) | | | (3,480,115 | ) | | (254,865 | ) | | | (4,227,362 | ) |
| | |
|
| |
|
|
| |
|
| |
|
|
|
Net change resulting from Class C Share transactions | | (86,815 | ) | | $ | (1,056,046 | ) | | 74,583 | | | $ | 1,250,046 | |
| | |
|
| |
|
|
| |
|
| |
|
|
|
| | |
| | | Year Ended
November 30, 2008
| | | Year Ended
November 30, 2007
| |
| Class I Shares | | Shares | | | Dollars | | | Shares | | | Dollars | |
Shares sold | | 10,916,039 | | | $ | 173,674,082 | | | 3,744,398 | | | $ | 64,210,251 | |
Shares issued to shareholders in payment of distributions declared | | 141,718 | | | | 2,351,102 | | | 18,212 | | | | 295,395 | |
Shares redeemed | | (2,689,450 | ) | | | (39,985,786 | ) | | (410,789 | ) | | | (7,443,929 | ) |
| | |
|
| |
|
|
| |
|
| |
|
|
|
Net change resulting from Class I Share transactions | | 8,368,307 | | | $ | 136,039,398 | | | 3,351,821 | | | $ | 57,061,717 | |
| | |
|
| |
|
|
| |
|
| |
|
|
|
Net change resulting from Fund Share transactions | | 1,830,904 | | | $ | 38,209,098 | | | 1,270,021 | | | $ | 19,474,335 | |
| | |
|
| |
|
|
| |
|
| |
|
|
|
| |
| | | Growth Fund | |
| | | Year Ended
November 30, 2008
| | | Year Ended
November 30, 2007
| |
| Class A Shares | | Shares | | | Dollars | | | Shares | | | Dollars | |
Shares sold | | 984,892 | | | $ | 18,444,042 | | | 1,651,657 | | | $ | 30,908,767 | |
Shares issued to shareholders in payment of distributions declared | | 405,618 | | | | 8,065,482 | | | 13,824 | | | | 274,626 | |
Shares redeemed | | (12,116,853 | ) | | | (233,794,296 | ) | | (4,739,930 | ) | | | (91,478,959 | ) |
| | |
|
| |
|
|
| |
|
| |
|
|
|
Net change resulting from Class A Share transactions | | (10,726,343 | ) | | $ | (207,284,772 | ) | | (3,074,449 | ) | | $ | (60,295,566 | ) |
| | |
|
| |
|
|
| |
|
| |
|
|
|
| | |
| | | Year Ended
November 30, 2008
| | | Year Ended
November 30, 2007
| |
| Class C Shares | | Shares | | | Dollars | | | Shares | | | Dollars | |
Shares sold | | 37,805 | | | $ | 673,516 | | | 192,416 | | | $ | 3,609,917 | |
Shares issued to shareholders in payment of distributions declared | | 5,483 | | | | 105,378 | | | — | | | | — | |
Shares redeemed | | (139,339 | ) | | | (2,548,060 | ) | | (120,949 | ) | | | (2,253,341 | ) |
| | |
|
| |
|
|
| |
|
| |
|
|
|
Net change resulting from Class C Share transactions | | (96,051 | ) | | $ | (1,769,166 | ) | | 71,467 | | | $ | 1,356,576 | |
| | |
|
| |
|
|
| |
|
| |
|
|
|
105
REGIONS MORGAN KEEGAN SELECT FUNDS
| | | | | | | | | | | | | | |
| | | Growth Fund, continued | |
| | | Year Ended
November 30, 2008
| | | Year Ended
November 30, 2007
| |
| Class I Shares | | Shares | | | Dollars | | | Shares | | | Dollars | |
Shares sold | | 10,400,699 | | | $ | 202,097,827 | | | 5,495,469 | | | $ | 104,046,050 | |
Shares issued to shareholders in payment of distributions declared | | 72,503 | | | | 1,373,374 | | | 1,304 | | | | 26,318 | |
Shares redeemed | | (4,734,166 | ) | | | (88,630,180 | ) | | (1,141,356 | ) | | | (22,476,358 | ) |
| | |
|
| |
|
|
| |
|
| |
|
|
|
Net change resulting from Class I Share transactions | | 5,739,036 | | | $ | 114,841,021 | | | 4,355,417 | | | $ | 81,596,010 | |
| | |
|
| |
|
|
| |
|
| |
|
|
|
Net change resulting from Fund Share transactions | | (5,083,358 | ) | | $ | (94,212,917 | ) | | 1,352,435 | | | $ | 22,657,020 | |
| | |
|
| |
|
|
| |
|
| |
|
|
|
| | | Core Equity Fund | |
| | | Year Ended
November 30, 2008
| | | Year Ended
November 30, 2007
| |
| Class A Shares | | Shares | | | Dollars | | | Shares | | | Dollars | |
Shares sold | | 31,796 | | | $ | 643,016 | | | 37,870 | | | $ | 928,561 | |
Shares issued to shareholders in payment of distributions declared | | 28,132 | | | | 591,558 | | | 46,976 | | | | 1,059,997 | |
Shares redeemed | | (107,248 | ) | | | (2,052,442 | ) | | (103,666 | ) | | | (2,458,347 | ) |
| | |
|
| |
|
|
| |
|
| |
|
|
|
Net change resulting from Class A Share transactions | | (47,320 | ) | | $ | (817,868 | ) | | (18,820 | ) | | $ | (469,789 | ) |
| | |
|
| |
|
|
| |
|
| |
|
|
|
| | |
| | | Year Ended
November 30, 2008
| | | Year Ended
November 30, 2007
| |
| Class C Shares | | Shares | | | Dollars | | | Shares | | | Dollars | |
Shares sold | | — | | | $ | — | | | — | | | $ | — | |
Shares issued to shareholders in payment of distributions declared | | 1 | | | | 16 | | | 1 | | | | 21 | |
Shares redeemed | | — | | | | — | | | — | | | | — | |
| | |
|
| |
|
|
| |
|
| |
|
|
|
Net change resulting from Class C Share transactions | | 1 | | | $ | 16 | | | 1 | | | $ | 21 | |
| | |
|
| |
|
|
| |
|
| |
|
|
|
| | |
| | | Year Ended
November 30, 2008
| | | Year Ended
November 30, 2007
| |
| Class I Shares | | Shares | | | Dollars | | | Shares | | | Dollars | |
Shares sold | | 121,880 | | | $ | 2,461,648 | | | 166,812 | | | $ | 3,991,787 | |
Shares issued to shareholders in payment of distributions declared | | 339,029 | | | | 7,164,405 | | | 522,173 | | | | 11,792,542 | |
Shares redeemed | | (2,402,621 | ) | | | (46,381,131 | ) | | (1,504,132 | ) | | | (35,187,879 | ) |
| | |
|
| |
|
|
| |
|
| |
|
|
|
Net change resulting from Class I Share transactions | | (1,941,712 | ) | | $ | (36,755,078 | ) | | (815,147 | ) | | $ | (19,403,550 | ) |
| | |
|
| |
|
|
| |
|
| |
|
|
|
Net change resulting from Fund Share transactions | | (1,989,031 | ) | | $ | (37,572,930 | ) | | (833,966 | ) | | $ | (19,873,318 | ) |
| | |
|
| |
|
|
| |
|
| |
|
|
|
106
REGIONS MORGAN KEEGAN SELECT FUNDS
| | | | | | | | | | | | | | |
| | | Mid Cap Value Fund | |
| | | Year Ended
November 30, 2008
| | | Year Ended
November 30, 2007
| |
| Class A Shares | | Shares | | | Dollars | | | Shares | | | Dollars | |
Shares sold | | 732,935 | | | $ | 7,038,561 | | | 1,411,662 | | | $ | 15,936,671 | |
Shares issued to shareholders in payment of distributions declared | | 199,719 | | | | 2,042,308 | | | 117,701 | | | | 1,273,524 | |
Shares redeemed | | (4,413,669 | ) | | | (42,409,189 | ) | | (3,312,708 | ) | | | (36,768,194 | ) |
| | |
|
| |
|
|
| |
|
| |
|
|
|
Net change resulting from Class A Share transactions | | (3,481,015 | ) | | $ | (33,328,320 | ) | | (1,783,345 | ) | | $ | (19,557,999 | ) |
| | |
|
| |
|
|
| |
|
| |
|
|
|
| | |
| | | Year Ended
November 30, 2008
| | | Year Ended
November 30, 2007
| |
| Class C Shares | | Shares | | | Dollars | | | Shares | | | Dollars | |
Shares sold | | 36,872 | | | $ | 347,797 | | | 100,200 | | | $ | 1,098,548 | |
Shares issued to shareholders in payment of distributions declared | | 1,449 | | | | 14,329 | | | 1,868 | | | | 19,743 | |
Shares redeemed | | (74,663 | ) | | | (677,797 | ) | | (133,609 | ) | | | (1,466,356 | ) |
| | |
|
| |
|
|
| |
|
| |
|
|
|
Net change resulting from Class C Share transactions | | (36,342 | ) | | $ | (315,671 | ) | | (31,541 | ) | | $ | (348,065 | ) |
| | |
|
| |
|
|
| |
|
| |
|
|
|
| | |
| | | Year Ended
November 30, 2008
| | | Year Ended
November 30, 2007
| |
| Class I Shares | | Shares | | | Dollars | | | Shares | | | Dollars | |
Shares sold | | 3,068,006 | | | $ | 30,137,950 | | | 1,610,996 | | | $ | 17,958,704 | |
Shares issued to shareholders in payment of distributions declared | | 35,025 | | | | 355,538 | | | 17 | | | | 186 | |
Shares redeemed | | (1,108,529 | ) | | | (10,461,963 | ) | | (107,139 | ) | | | (1,221,423 | ) |
| | |
|
| |
|
|
| |
|
| |
|
|
|
Net change resulting from Class I Share transactions | | 1,994,502 | | | $ | 20,031,525 | | | 1,503,874 | | | $ | 16,737,467 | |
| | |
|
| |
|
|
| |
|
| |
|
|
|
Net change resulting from Fund Share transactions | | (1,522,855 | ) | | $ | (13,612,466 | ) | | (311,012 | ) | | $ | (3,168,597 | ) |
| | |
|
| |
|
|
| |
|
| |
|
|
|
| | | Value Fund | |
| | | Year Ended
November 30, 2008
| | | Year Ended
November 30, 2007
| |
| Class A Shares | | Shares | | | Dollars | | | Shares | | | Dollars | |
Shares sold | | 801,720 | | | $ | 14,834,820 | | | 646,271 | | | $ | 12,172,657 | |
Shares issued to shareholders in payment of distributions declared | | 136,724 | | | | 2,729,019 | | | 82,085 | | | | 1,540,871 | |
Shares redeemed | | (8,577,541 | ) | | | (169,021,086 | ) | | (3,641,802 | ) | | | (67,356,298 | ) |
| | |
|
| |
|
|
| |
|
| |
|
|
|
Net change resulting from Class A Share transactions | | (7,639,097 | ) | | $ | (151,457,247 | ) | | (2,913,446 | ) | | $ | (53,642,770 | ) |
| | |
|
| |
|
|
| |
|
| |
|
|
|
| | |
| | | Year Ended
November 30, 2008
| | | Year Ended
November 30, 2007
| |
| Class C Shares | | Shares | | | Dollars | | | Shares | | | Dollars | |
Shares sold | | 22,106 | | | $ | 413,241 | | | 81,218 | | | $ | 1,507,291 | |
Shares issued to shareholders in payment of distributions declared | | 1,169 | | | | 23,586 | | | — | | | | — | |
Shares redeemed | | (64,148 | ) | | | (1,181,605 | ) | | (96,991 | ) | | | (1,786,632 | ) |
| | |
|
| |
|
|
| |
|
| |
|
|
|
Net change resulting from Class C Share transactions | | (40,873 | ) | | $ | (744,778 | ) | | (15,773 | ) | | $ | (279,341 | ) |
| | |
|
| |
|
|
| |
|
| |
|
|
|
107
REGIONS MORGAN KEEGAN SELECT FUNDS
| | | | | | | | | | | | | | |
| | | Value Fund, continued | |
| | | Year Ended
November 30, 2008
| | | Year Ended
November 30, 2007
| |
| Class I Shares | | Shares | | | Dollars | | | Shares | | | Dollars | |
Shares sold | | 9,662,597 | | | $ | 188,227,158 | | | 1,721,958 | | | $ | 31,741,194 | |
Shares issued to shareholders in payment of distributions declared | | 71,008 | | | | 1,216,581 | | | 1,226 | | | | 24,139 | |
Shares redeemed | | (2,202,809 | ) | | | (39,457,655 | ) | | (224,344 | ) | | | (4,408,035 | ) |
| | |
|
| |
|
|
| |
|
| |
|
|
|
Net change resulting from Class I Share transactions | | 7,530,796 | | | $ | 149,986,084 | | | 1,498,840 | | | $ | 27,357,298 | |
| | |
|
| |
|
|
| |
|
| |
|
|
|
Net change resulting from Fund Share transactions | | (149,174 | ) | | $ | (2,215,941 | ) | | (1,430,379 | ) | | $ | (26,564,813 | ) |
| | |
|
| |
|
|
| |
|
| |
|
|
|
| | | Balanced Fund | |
| | | Year Ended
November 30, 2008
| | | Year Ended
November 30, 2007
| |
| Class A Shares | | Shares | | | Dollars | | | Shares | | | Dollars | |
Shares sold | | 636,108 | | | $ | 10,092,803 | | | 1,167,965 | | | $ | 19,345,807 | |
Shares issued to shareholders in payment of distributions declared | | 929,802 | | | | 14,726,915 | | | 438,799 | | | | 7,024,579 | |
Shares redeemed | | (9,001,778 | ) | | | (141,094,991 | ) | | (2,841,848 | ) | | | (46,980,396 | ) |
| | |
|
| |
|
|
| |
|
| |
|
|
|
Net change resulting from Class A Share transactions | | (7,435,868 | ) | | $ | (116,275,273 | ) | | (1,235,084 | ) | | $ | (20,610,010 | ) |
| | |
|
| |
|
|
| |
|
| |
|
|
|
| | |
| | | Year Ended
November 30, 2008
| | | Year Ended
November 30, 2007
| |
| Class C Shares | | Shares | | | Dollars | | | Shares | | | Dollars | |
Shares sold | | 16,135 | | | $ | 259,534 | | | 386,005 | | | $ | 6,773,110 | |
Shares issued to shareholders in payment of distributions declared | | 37,883 | | | | 599,941 | | | 2,112 | | | | 33,878 | |
Shares redeemed | | (267,510 | ) | | | (4,140,410 | ) | | (40,652 | ) | | | (680,555 | ) |
| | |
|
| |
|
|
| |
|
| |
|
|
|
Net change resulting from Class C Share transactions | | (213,492 | ) | | $ | (3,280,935 | ) | | 347,465 | | | $ | 6,126,433 | |
| | |
|
| |
|
|
| |
|
| |
|
|
|
| | |
| | | Year Ended
November 30, 2008
| | | Year Ended
November 30, 2007
| |
| Class I Shares | | Shares | | | Dollars | | | Shares | | | Dollars | |
Shares sold | | 10,000,472 | | | $ | 156,743,350 | | | 37,600 | | | $ | 612,788 | |
Shares issued to shareholders in payment of distributions declared | | 74,672 | | | | 1,106,306 | | | 59 | | | | 936 | |
Shares redeemed | | (2,149,010 | ) | | | (32,098,517 | ) | | (57,475 | ) | | | (929,414 | ) |
| | |
|
| |
|
|
| |
|
| |
|
|
|
Net change resulting from Class I Share transactions | | 7,926,134 | | | $ | 125,751,139 | | | (19,816 | ) | | $ | (315,690 | ) |
| | |
|
| |
|
|
| |
|
| |
|
|
|
Net change resulting from Fund Share transactions | | 276,774 | | | $ | 6,194,931 | | | (907,435 | ) | | $ | (14,799,267 | ) |
| | |
|
| |
|
|
| |
|
| |
|
|
|
108
REGIONS MORGAN KEEGAN SELECT FUNDS
| | | | | | | | | | | | | | |
| | | Fixed Income Fund | |
| | | Year Ended
November 30, 2008
| | | Year Ended
November 30, 2007
| |
| Class A Shares | | Shares | | | Dollars | | | Shares | | | Dollars | |
Shares sold | | 1,407,211 | | | $ | 13,302,723 | | | 1,708,474 | | | $ | 16,966,124 | |
Shares issued to shareholders in payment of distributions declared | | 100,180 | | | | 938,352 | | | 236,019 | | | | 2,333,475 | |
Shares redeemed | | (8,679,018 | ) | | | (81,519,365 | ) | | (8,926,582 | ) | | | (88,880,708 | ) |
| | |
|
| |
|
|
| |
|
| |
|
|
|
Net change resulting from Class A Share transactions | | (7,171,627 | ) | | $ | (67,278,290 | ) | | (6,982,089 | ) | | $ | (69,581,109 | ) |
| | |
|
| |
|
|
| |
|
| |
|
|
|
| | |
| | | Year Ended
November 30, 2008
| | | Year Ended
November 30, 2007
| |
| Class C Shares | | Shares | | | Dollars | | | Shares | | | Dollars | |
Shares sold | | 82,542 | | | $ | 782,533 | | | 327,617 | | | $ | 3,212,641 | |
Shares issued to shareholders in payment of distributions declared | | 3,910 | | | | 36,614 | | | 5,022 | | | | 49,287 | |
Shares redeemed | | (245,451 | ) | | | (2,310,141 | ) | | (277,237 | ) | | | (2,722,588 | ) |
| | |
|
| |
|
|
| |
|
| |
|
|
|
Net change resulting from Class C Share transactions | | (158,999 | ) | | $ | (1,490,994 | ) | | 55,402 | | | $ | 539,340 | |
| | |
|
| |
|
|
| |
|
| |
|
|
|
| | |
| | | Year Ended
November 30, 2008
| | | Year Ended
November 30, 2007
| |
| Class I Shares | | Shares | | | Dollars | | | Shares | | | Dollars | |
Shares sold | | 6,637,475 | | | $ | 62,753,499 | | | 1,973,424 | | | $ | 19,580,874 | |
Shares issued to shareholders in payment of distributions declared | | 56,233 | | | | 511,630 | | | 8,794 | | | | 86,616 | |
Shares redeemed | | (3,883,472 | ) | | | (36,180,451 | ) | | (2,507,207 | ) | | | (24,535,301 | ) |
| | |
|
| |
|
|
| |
|
| |
|
|
|
Net change resulting from Class I Share transactions | | 2,810,236 | | | $ | 27,084,678 | | | (524,989 | ) | | $ | (4,867,811 | ) |
| | |
|
| |
|
|
| |
|
| |
|
|
|
Net change resulting from Fund Share transactions | | (4,520,390 | ) | | $ | (41,684,606 | ) | | (7,451,676 | ) | | $ | (73,909,580 | ) |
| | |
|
| |
|
|
| |
|
| |
|
|
|
| | | Limited Maturity Fixed Income Fund | |
| | | Year Ended
November 30, 2008
| | | Year Ended
November 30, 2007
| |
| Class A Shares | | Shares | | | Dollars | | | Shares | | | Dollars | |
Shares sold | | 75,646 | | | $ | 652,690 | | | 210,859 | | | $ | 1,946,383 | |
Shares issued to shareholders in payment of distributions declared | | 25,391 | | | | 217,264 | | | 108,099 | | | | 1,001,212 | |
Shares redeemed | | (1,975,460 | ) | | | (16,622,979 | ) | | (3,318,054 | ) | | | (30,912,222 | ) |
| | |
|
| |
|
|
| |
|
| |
|
|
|
Net change resulting from Class A Share transactions | | (1,874,423 | ) | | $ | (15,753,025 | ) | | (2,999,096 | ) | | $ | (27,964,627 | ) |
| | |
|
| |
|
|
| |
|
| |
|
|
|
| | |
| | | Year Ended
November 30, 2008
| | | Year Ended
November 30, 2007
| |
| Class C Shares | | Shares | | | Dollars | | | Shares | | | Dollars | |
Shares sold | | 1,807 | | | $ | 15,424 | | | 229,597 | | | $ | 2,070,024 | |
Shares issued to shareholders in payment of distributions declared | | 1,966 | | | | 16,627 | | | 2,806 | | | | 25,391 | |
Shares redeemed | | (135,041 | ) | | | (1,150,241 | ) | | (106,798 | ) | | | (958,842 | ) |
| | |
|
| |
|
|
| |
|
| |
|
|
|
Net change resulting from Class C Share transactions | | (131,268 | ) | | $ | (1,118,190 | ) | | 125,605 | | | $ | 1,136,573 | |
| | |
|
| |
|
|
| |
|
| |
|
|
|
109
REGIONS MORGAN KEEGAN SELECT FUNDS
| | | | | | | | | | | | | | |
| | | Limited Maturity Fixed Income Fund, continued | |
| | | Year Ended
November 30, 2008
| | | Year Ended
November 30, 2007
| |
| Class I Shares | | Shares | | | Dollars | | | Shares | | | Dollars | |
Shares sold | | 8,780 | | | $ | 70,152 | | | — | | | $ | — | |
Shares issued to shareholders in payment of distributions declared | | 1 | | | | 4 | | | — | | | | 5 | |
Shares redeemed | | — | | | | — | | | — | | | | — | |
| | |
|
| |
|
|
| |
|
| |
|
|
|
Net change resulting from Class I Share transactions | | 8,781 | | | $ | 70,156 | | | 0 | | | $ | 5 | |
| | |
|
| |
|
|
| |
|
| |
|
|
|
Net change resulting from Fund Share transactions | | (1,996,910 | ) | | $ | (16,801,059 | ) | | (2,873,491 | ) | | $ | (26,828,049 | ) |
| | |
|
| |
|
|
| |
|
| |
|
|
|
| | | Intermediate Tax Exempt Bond Fund | |
| | | Year Ended
November 30, 2008
| | | Year Ended
November 30, 2007
| |
| Class A Shares | | Shares | | | Dollars | | | Shares | | | Dollars | |
Shares sold | | 197,743 | | | $ | 1,881,857 | | | 1,171,999 | | | $ | 11,016,342 | |
Shares issued to shareholders in payment of distributions declared | | 10,013 | | | | 95,164 | | | 18,439 | | | | 174,302 | |
Shares redeemed | | (2,869,957 | ) | | | (27,262,411 | ) | | (1,087,556 | ) | | | (10,283,788 | ) |
| | |
|
| |
|
|
| |
|
| |
|
|
|
Net change resulting from Class A Share transactions | | (2,662,201 | ) | | $ | (25,285,390 | ) | | 102,882 | | | $ | 906,856 | |
| | |
|
| |
|
|
| |
|
| |
|
|
|
| | |
| | | Year Ended
November 30, 2008
| | | Year Ended
November 30, 2007
| |
| Class C Shares | | Shares | | | Dollars | | | Shares | | | Dollars | |
Shares sold | | 14,001 | | | $ | 133,553 | | | 409,583 | | | $ | 3,856,629 | |
Shares issued to shareholders in payment of distributions declared | | 1,404 | | | | 13,360 | | | 1,168 | | | | 11,067 | |
Shares redeemed | | (317,522 | ) | | | (3,040,726 | ) | | (75,203 | ) | | | (710,266 | ) |
| | |
|
| |
|
|
| |
|
| |
|
|
|
Net change resulting from Class C Share transactions | | (302,117 | ) | | $ | (2,893,813 | ) | | 335,548 | | | $ | 3,157,430 | |
| | |
|
| |
|
|
| |
|
| |
|
|
|
| | |
| | | Year Ended
November 30, 2008
| | | Year Ended
November 30, 2007
| |
| Class I Shares | | Shares | | | Dollars | | | Shares | | | Dollars | |
Shares sold | | 310,514 | | | $ | 2,957,665 | | | 61,957 | | | $ | 581,306 | |
Shares issued to shareholders in payment of distributions declared | | 989 | | | | 9,369 | | | 936 | | | | 8,842 | |
Shares redeemed | | (295,356 | ) | | | (2,808,282 | ) | | (270,902 | ) | | | (2,566,716 | ) |
| | |
|
| |
|
|
| |
|
| |
|
|
|
Net change resulting from Class I Share transactions | | 16,147 | | | $ | 158,752 | | | (208,009 | ) | | $ | (1,976,568 | ) |
| | |
|
| |
|
|
| |
|
| |
|
|
|
Net change resulting from Fund Share transactions | | (2,948,171 | ) | | $ | (28,020,451 | ) | | 230,421 | | | $ | 2,087,718 | |
| | |
|
| |
|
|
| |
|
| |
|
|
|
110
REGIONS MORGAN KEEGAN SELECT FUNDS
| | | | | | | | | | | | | | |
| | | Treasury Money Market Fund | |
| | | Year Ended
November 30, 2008
| | | Year Ended
November 30, 2007
| |
| Class A Shares | | Shares | | | Dollars | | | Shares | | | Dollars | |
Shares sold | | 1,814,032,807 | | | $ | 1,814,032,807 | | | 2,506,725,015 | | | $ | 2,506,725,015 | |
Shares issued to shareholders in payment of distributions declared | | 4,528,286 | | | | 4,528,286 | | | 9,298,041 | | | | 9,298,041 | |
Shares redeemed | | (2,102,862,512 | ) | | | (2,102,862,512 | ) | | (2,346,455,324 | ) | | | (2,346,455,324 | ) |
| | |
|
| |
|
|
| |
|
| |
|
|
|
Net change resulting from Class A Share transactions | | (284,301,419 | ) | | $ | (284,301,419 | ) | | 169,567,732 | | | $ | 169,567,732 | |
| | |
|
| |
|
|
| |
|
| |
|
|
|
| | |
| | | Year Ended
November 30, 2008
| | | Year Ended
November 30, 2007
| |
| Class I Shares | | Shares | | | Dollars | | | Shares | | | Dollars | |
Shares sold | | 17,116,780 | | | $ | 17,116,780 | | | 1,789,258 | | | $ | 1,789,258 | |
Shares issued to shareholders in payment of distributions declared | | 29,722 | | | | 29,722 | | | 11,976 | | | | 11,976 | |
Shares redeemed | | (11,553,864 | ) | | | (11,553,864 | ) | | (357,577 | ) | | | (357,577 | ) |
| | |
|
| |
|
|
| |
|
| |
|
|
|
Net change resulting from Class I Share transactions | | 5,592,638 | | | $ | 5,592,638 | | | 1,443,657 | | | $ | 1,443,657 | |
| | |
|
| |
|
|
| |
|
| |
|
|
|
Net change resulting from Fund Share transactions | | (278,708,781 | ) | | $ | (278,708,781 | ) | | 171,011,389 | | | $ | 171,011,389 | |
| | |
|
| |
|
|
| |
|
| |
|
|
|
| |
| | | Money Market Fund | |
| | Year Ended
November 30, 2008
| | | Year Ended
November 30, 2007
| |
| Class A Shares | | Shares | | | Dollars | | | Shares | | | Dollars | |
Shares sold | | 155,878,581 | | | $ | 155,878,581 | | | 173,656,658 | | | $ | 173,656,658 | |
Shares issued to shareholders in payment of distributions declared | | 2,115,989 | | | | 2,115,989 | | | 2,215,459 | | | | 2,215,459 | |
Shares redeemed | | (202,730,716 | ) | | | (202,730,716 | ) | | (115,882,062 | ) | | | (115,882,062 | ) |
| | |
|
| |
|
|
| |
|
| |
|
|
|
Net change resulting from Class A Share transactions | | (44,736,146 | ) | | $ | (44,736,146 | ) | | 59,990,055 | | | $ | 59,990,055 | |
| | |
|
| |
|
|
| |
|
| |
|
|
|
| | |
| | | Year Ended
November 30, 2008
| | | Year Ended
November 30, 2007
| |
| Class I Shares | | Shares | | | Dollars | | | Shares | | | Dollars | |
Shares sold | | 45,036,835 | | | $ | 45,036,835 | | | 136,082,658 | | | $ | 136,082,658 | |
Shares issued to shareholders in payment of distributions declared | | 4,912 | | | | 4,912 | | | 8,922 | | | | 8,922 | |
Shares redeemed | | (45,105,432 | ) | | | (45,105,432 | ) | | (137,165,491 | ) | | | (137,165,491 | ) |
| | |
|
| |
|
|
| |
|
| |
|
|
|
Net change resulting from Class I Share transactions | | (63,685 | ) | | $ | (63,685 | ) | | (1,073,911 | ) | | $ | (1,073,911 | ) |
| | |
|
| |
|
|
| |
|
| |
|
|
|
Net change resulting from Fund Share transactions | | (44,799,831 | ) | | $ | (44,799,831 | ) | | 58,916,144 | | | $ | 58,916,144 | |
| | |
|
| |
|
|
| |
|
| |
|
|
|
111
REGIONS MORGAN KEEGAN SELECT FUNDS
Because federal income tax regulations differ in certain respects from GAAP, income and capital gain distributions determined in accordance with tax regulations may differ from net investment income and realized gains recognized for financial reporting purposes. These differences are primarily due to differing treatments for net operating losses, discount accretion/premium amortization on debt securities, real estate investment trust adjustments, paydown gains and losses, distribution reclassifications and the utilization of earnings and profits distributed to the shareholders on redemption of shares as part of the dividends paid deduction for income tax purposes.
Permanent book and tax differences, if any, relating to shareholder distributions will result in reclassifications to paid-in capital or to undistributed capital gains. These reclassifications have no effect on net assets or NAVs per share. Any undistributed net income and realized gain remaining at fiscal year-end is distributed in the following year.
For the fiscal year ended November 30, 2008, permanent differences identified and reclassified among the components of net assets were as follows:
| | | | | | | | | | | | |
| Fund | | Paid-In
Capital | | | Undistributed Net
Investment Income | | | Accumulated Net
Realized Gain/(Loss) | |
Mid Cap Growth Fund | | $ | (661,482 | ) | | $ | 561,918 | | | $ | 99,564 | |
Growth Fund | | | — | | | | (999 | ) | | | 999 | |
Core Equity Fund | | | 3,000,000 | | | | — | | | | (3,000,000 | ) |
Mid Cap Value Fund | | | — | | | | (899 | ) | | | 899 | |
Value Fund | | | — | | | | (537 | ) | | | 537 | |
Balanced Fund | | | — | | | | 22,664 | | | | (22,664 | ) |
Fixed Income Fund | | | — | | | | 61,688 | | | | (61,688 | ) |
Limited Maturity Fixed Income Fund | | | — | | | | 21,806 | | | | (21,806 | ) |
Intermediate Tax Exempt Bond Fund | | | (202 | ) | | | (9,141 | ) | | | 9,343 | |
Net investment income, net realized gains/(losses) and net assets were not affected by these reclassifications.
The tax character of distributions as reported on the Statements of Changes in Net Assets for the years ended November 30, 2008 and 2007 were as follows:
| | | | | | | | | | | | |
| | | 2008
| | 2007
|
| Fund | | Ordinary
Income(1) | | Long-Term
Capital
Gains | | Ordinary
Income(1) | | Long-Term
Capital
Gains |
Mid Cap Growth Fund | | $ | — | | $ | 44,630,970 | | $ | 946,737 | | $ | 45,152,575 |
Growth Fund | | | 352,102 | | | 15,164,640 | | | 675,005 | | | — |
Core Equity Fund | | | 2,121,657 | | | 7,791,004 | | | 713,828 | | | 20,715,395 |
Mid Cap Value Fund | | | 100,951 | | | 4,402,483 | | | — | | | 3,021,142 |
Value Fund | | | 2,464,913 | | | 3,385,925 | | | 2,464,265 | | | — |
Balanced Fund | | | 2,309,759 | | | 14,749,763 | | | 2,059,663 | | | 5,336,883 |
Fixed Income Fund | | | 6,863,163 | | | — | | | 11,111,683 | | | — |
Limited Maturity Fixed Income Fund | | | 403,349 | | | — | | | 1,735,263 | | | — |
Intermediate Tax Exempt Bond Fund(2) | | | 1,173,846 | | | 46,874 | | | 1,630,076 | | | — |
Treasury Money Market Fund | | | 16,008,603 | | | — | | | 49,263,776 | | | — |
Money Market Fund | | | 3,166,232 | | | — | | | 5,144,966 | | | — |
(1) | | For tax purposes, short-term capital gain distributions are considered ordinary income distributions. |
(2) | | $1,220,720 and $1,630,076 of the amounts included as ordinary income in 2008 and 2007, respectively, are tax exempt. |
112
REGIONS MORGAN KEEGAN SELECT FUNDS
As of November 30, 2008, the components of distributable earnings on a tax basis were as follows:
| | | | | | | | | | | | | | | | | | |
| Fund | | Undistributed
Ordinary
Income | | Undistributed
Long-Term
Capital Gains | | Net Unrealized
Appreciation/
(Depreciation) | | | Capital Loss Carryforward | | | Other Temporary Adjustments | |
Mid Cap Growth Fund | | $ | — | | $ | 1,302,425 | | $ | (90,013,312 | ) | | $ | — | | | $ | — | |
Growth Fund | | | 440,612 | | | — | | | (17,772,992 | ) | | | (4,033,731 | ) | | | (37,835 | ) |
Core Equity Fund | | | 11,066 | | | 5,165,217 | | | (1,319,961 | ) | | | — | | | | (12,913 | ) |
Mid Cap Value Fund | | | 44,952 | | | — | | | (4,678,229 | ) | | | (3,024,567 | ) | | | (8,333 | ) |
Value Fund | | | 679,061 | | | — | | | (26,340,658 | ) | | | (7,257,224 | ) | | | (5,559 | ) |
Balanced Fund | | | 571,602 | | | — | | | (1,194,374 | ) | | | (818,419 | ) | | | — | |
Fixed Income Fund | | | 381,751 | | | — | | | (12,060,324 | ) | | | (22,936,412 | ) | | | (381,751 | ) |
Limited Maturity Fixed Income Fund | | | 30,350 | | | — | | | (93,937 | ) | | | (10,082,916 | ) | | | (9,307 | ) |
Intermediate Tax Exempt Bond Fund(1) | | | 54,902 | | | 78,017 | | | 236,677 | | | | — | | | | (64,043 | ) |
Treasury Money Market Fund | | | 1,570,888 | | | — | | | — | | | | — | | | | (127,183 | ) |
Money Market Fund | | | 86,876 | | | — | | | — | | | | (200,761 | ) | | | (95,716 | ) |
(1) | | Amounts included as undistributed ordinary income are tax exempt. |
The difference between book-basis and tax-basis net unrealized appreciation/(depreciation) is attributable in part to the tax deferral of losses on wash sales and differing treatments for discount accretion/premium amortization on debt securities.
Withholding taxes on foreign interest and dividends have been provided for in accordance with the applicable country’s tax rules and rates.
Tax Basis Unrealized Appreciation/(Depreciation) on Investments and Distributions—As of November 30, 2008, the Funds’ cost of investments for federal income tax purposes, the aggregate gross unrealized appreciation for all investments for which there was an excess of value over tax cost and the aggregate gross unrealized depreciation for all securities for which there was an excess of tax cost over the value were as follows:
| | | | | | | | | | | | | | |
| Fund | | Cost of
Investments | | Gross
Unrealized
Appreciation | | Gross
Unrealized
(Depreciation) | | | Net Unrealized
Appreciation/
(Depreciation) | |
Mid Cap Growth Fund | | $ | 354,974,263 | | $ | 18,623,718 | | $ | (108,637,030 | ) | | $ | (90,013,312 | ) |
Growth Fund | | | 288,950,983 | | | 34,010,424 | | | (51,783,416 | ) | | | (17,772,992 | ) |
Core Equity Fund | | | 10,121,923 | | | 627,385 | | | (1,947,346 | ) | | | (1,319,961 | ) |
Mid Cap Value Fund | | | 39,042,549 | | | 3,449,340 | | | (8,127,569 | ) | | | (4,678,229 | ) |
Value Fund | | | 189,566,899 | | | 9,598,476 | | | (35,939,134 | ) | | | (26,340,658 | ) |
Balanced Fund | | | 141,012,258 | | | 14,637,072 | | | (15,831,446 | ) | | | (1,194,374 | ) |
Fixed Income Fund | | | 145,987,177 | | | 2,055,442 | | | (14,115,766 | ) | | | (12,060,324 | ) |
Limited Maturity Fixed Income Fund | | | 5,358,552 | | | 53,643 | | | (147,580 | ) | | | (93,937 | ) |
Intermediate Tax Exempt Bond Fund | | | 25,967,394 | | | 441,296 | | | (204,619 | ) | | | 236,677 | |
Treasury Money Market Fund | | | 979,274,495 | | | — | | | — | | | | — | |
Money Market Fund | | | 102,782,413 | | | — | | | — | | | | — | |
113
REGIONS MORGAN KEEGAN SELECT FUNDS
Capital Loss Carryforwards—As of November 30, 2008, the following Funds had capital loss carryforwards, which will reduce the Funds’ taxable income arising from future net realized gains on investments, if any, to the extent permitted by the Code, and thus will reduce the amount of the distributions to shareholders which would otherwise be necessary to relieve the Funds of any liability for federal tax. Pursuant to the Code, such capital loss carryforwards will expire as follows:
| | | | | | | | | | | | | | | | | | | | | | | | | | | |
| Fund | | Expiring in
2009 | | Expiring in
2010 | | Expiring in
2011 | | Expiring in
2012 | | Expiring in
2013 | | Expiring in
2014 | | Expiring in
2015 | | Expiring in
2016 | | Total |
Growth Fund | | $ | — | | $ | — | | $ | — | | $ | — | | $ | — | | $ | — | | $ | — | | $ | 4,033,731 | | $ | 4,033,731 |
Mid Cap Value Fund | | | — | | | — | | | — | | | — | | | — | | | — | | | — | | | 3,024,567 | | | 3,024,567 |
Value Fund | | | — | | | — | | | — | | | — | | | — | | | — | | | — | | | 7,257,224 | | | 7,257,224 |
Balanced Fund | | | — | | | — | | | — | | | — | | | — | | | — | | | — | | | 818,419 | | | 818,419 |
Fixed Income Fund | | | — | | | — | | | — | | | 1,419,944 | | | 209,164 | | | 3,069,321 | | | 10,886,297 | | | 7,351,686 | | | 22,936,412 |
Limited Maturity Fixed Income Fund | | | — | | | — | | | 433,974 | | | 2,704,075 | | | 1,268,755 | | | 1,335,125 | | | 2,440,082 | | | 1,900,905 | | | 10,082,916 |
Money Market Fund | | | 2,572 | | | 54 | | | 18,234 | | | 24,650 | | | 149,661 | | | 13 | | | 2,890 | | | 2,687 | | | 200,761 |
As of November 30, 2008, Fixed Income Fund and Money Market Fund had capital loss carryforwards of $214,873 and $31, respectively, subject to any applicable limitations on availability to offset future capital gains, if any, as the successor of a merger.
Regions Morgan Keegan Select Intermediate Tax Exempt Bond Fund invests primarily in municipal debt securities. The ability of the issuers of the securities held by the Fund to meet their obligations might be affected by economic developments in a specific state or region.
Regions Morgan Keegan Select Fixed Income Fund and Regions Morgan Keegan Select Limited Maturity Fixed Income Fund may invest in investment grade and below investment grade debt securities, including mortgage-backed and asset-backed securities. Below investment grade debt securities, commonly known as “junk bonds,” involve a higher degree of credit risk than investment grade debt securities. In the event of an unanticipated default, a Fund would experience a reduction in its income, a decline in the market value of the securities so affected and a decline in the NAV of its shares. During an economic downturn or period of rising interest rates, highly leveraged and other below investment grade issuers may experience financial stress that could adversely affect their ability to service principal and interest payment obligations, to meet projected business goals and to obtain additional financing. The market prices of below investment grade debt securities are generally less sensitive to interest rate changes than higher-rated investments but are more sensitive to adverse economic or political changes or individual developments specific to the issuer than higher-rated investments. Periods of economic or political uncertainty and change can be expected to result in significant volatility of prices for these securities. Rating services consider these securities to be speculative in nature.
| 10 | U.S. Treasury Temporary Guarantee Program for Money Market Funds |
In October 2008, the Board of Trustees approved Money Market Fund’s participation in the Temporary Guarantee Program for Money Market Funds (the “Program”) offered by the United States Department of the Treasury (the “Treasury”). To participate, the Adviser paid a fee of 0.01% of Money Market Fund’s net assets as of September 19, 2008.
Under the Program, the Treasury guarantees the value of shares of a participating money market fund outstanding as of September 19, 2008 at $1.00 per share if the fund’s net asset value falls below $0.995 and the fund’s board decides to liquidate the fund. The Program covers the lesser of a shareholder’s account value on September 19, 2008, or on the date of liquidation.
The initial term of the Program expired on December 18, 2008. The Treasury has announced that the Program will be extended for a second term, which expires on April 30, 2009. Continued participation in each extension of the Program
114
REGIONS MORGAN KEEGAN SELECT FUNDS
will require payment of an additional fee. The Board of Trustees has determined that continued participation in the Program is in the best interest of Money Market Fund and its shareholders. The Adviser has paid the Treasury an amount equal to 0.015% of Money Market Fund’s net assets as of September 19, 2008 for Money Market Fund’s continued participation in the Program.
If the Program is extended beyond April 30, 2009, the Board of Trustees will consider whether to continue to participate. There is no assurance that Money Market Fund will continue to participate in the Program.
As of the time of this report, assets available to the Program to support all participating money market funds are limited to $50 billion and payments under the Program are dependent on the availability of assets in the Program at the time a request for payment is made. Payments will be made on a first-come-first-served basis.
On January 21, 2009, Regions Financial Corporation announced that Pioneer Investment Management, Inc. (“Pioneer”) has signed a definitive agreement to acquire the Funds, subject to shareholder approval. If the necessary approvals are obtained, the Funds will be reorganized into new or existing Pioneer Funds with generally similar investment objectives, strategies and risks. Shareholders of the Funds will receive a proxy statement/prospectus in advance of the shareholder meetings at which shareholders will vote on the proposed fund reorganizations. The proxy statement/prospectus will contain additional information about the reorganizations. The transaction is subject to customary closing conditions and is expected to be completed in the second quarter of 2009.
A condition of the Pioneer agreement to acquire the Funds is to cease all securities lending activities which, in turn, would trigger an “in-kind” transfer of the participating Funds’ ownership interest of the investments of the Bank of New York Institutional Cash Reserves Fund that the participating Funds invest their cash collateral as described in note 2, “Securities Lending”, and for which the values of certain investments are supported by a credit support agreement issued by the Bank of New York Mellon. Regions Bank has agreed to purchase these investments at a value equal to the credit support agreement provided by Bank of New York Mellon or to otherwise make the participating Funds whole upon this event.
115
REPORT OF INDEPENDENT REGISTERED
PUBLIC ACCOUNTING FIRM
To the Board of Trustees and Shareholders of The Regions Morgan Keegan Select Funds:
In our opinion, the accompanying statements of assets and liabilities, including the portfolios of investments, and the related statements of operations and of changes in net assets and the financial highlights present fairly, in all material respects, the financial position of Regions Morgan Keegan Select Mid Cap Growth Fund, Regions Morgan Keegan Select Growth Fund, Regions Morgan Keegan Select Core Equity Fund, Regions Morgan Keegan Select Mid Cap Value Fund, Regions Morgan Keegan Value Fund, Regions Morgan Keegan Select Balanced Fund, Regions Morgan Keegan Select Fixed Income Fund, Regions Morgan Keegan Select Limited Maturity Fixed Income Fund, Regions Morgan Keegan Select Intermediate Tax Exempt Bond Fund, Regions Morgan Keegan Select Treasury Money Market Fund and Regions Morgan Keegan Select Money Market Fund (hereafter referred to as the “Funds”) at November 30, 2008, the results of each of their operations for the year then ended, the changes in each of their net assets for each of the two years in the periods then ended, and the financial highlights for the years or periods presented, in conformity with accounting principles generally accepted in the United States of America. These financial statements and financial highlights (hereafter referred to as “financial statements”) are the responsibility of the Funds’ management; our responsibility is to express an opinion on these financial statements based on our audits. We conducted our audits of these financial statements in accordance with the standards of the Public Company Accounting Oversight Board (United States). Those standards require that we plan and perform the audit to obtain reasonable assurance about whether the financial statements are free of material misstatement. An audit includes examining, on a test basis, evidence supporting the amounts and disclosures in the financial statements, assessing the accounting principles used and significant estimates made by management, and evaluating the overall financial statement presentation. We believe that our audits, which included confirmation of securities at November 30, 2008 by correspondence with the custodian and brokers, provide a reasonable basis for our opinion.
Chicago, IL
January 28, 2009
116
BOARDOF TRUSTEESAND TRUST OFFICERS
The following tables set forth information concerning the trustees and officers of the Funds. An asterisk (*) indicates the trustees who are “interested persons” of the Funds as defined by the 1940 Act by virtue of their positions with the Adviser, Morgan Keegan and/or Regions, the publicly held parent of the Adviser, or its other subsidiaries. The Statement of Additional Information for the Funds includes additional information about the Funds’ trustees and is available upon request, without charge, by calling the Funds toll-free at 877-757-7424.
TRUSTEES
| | |
Name, Address(1), Age,
Position(s) held with Funds,
Term of Office(2),
Length of Service | | Principal Occupation(s) During Past Five Years and Other Directorships
held by Trustee |
| |
J. Kenneth Alderman* DOB 7/10/1952, Trustee, Since 2003 Chairman, Since 2008 | | Mr. Alderman has been President of Regions Morgan Keegan Trust and Vice-Chairman and Chief Executive Officer of Morgan Asset Management, Inc. since 2002. He has been Executive Vice President of Regions Financial Corporation since 2000. He is a Certified Public Accountant and he holds the Chartered Financial Analyst designation. |
| |
Albert C. Johnson DOB 10/24/1944, Trustee, Since 2005 | | Mr. Johnson has been an independent financial consultant since 1998. He also has served as a Director of Hibbett Sports, Inc. since 2008 and Books-A-Million, Inc. since 2005. He was Senior Vice President and Chief Financial Officer of Dunn Investment Company (construction) from 1994 to 1998. He also was with Arthur Andersen LLP from 1965 to 1994, retiring as the Managing Partner of the firm’s Birmingham Office. |
| |
James Stillman R. McFadden DOB 9/26/1957, Trustee, Since 2003 | | Mr. McFadden has been Chief Manager of McFadden Communications, LLC (commercial printing) since 2002. He also has served as a director for several private companies since 1997. |
| |
W. Randall Pittman DOB 11/11/1953, Trustee, Since 2003 | | Mr. Pittman has been Vice President of Samford University since 2008. From 2002 to 2008, he was Chief Financial Officer of Emageon Inc. (healthcare information systems). From 1999 to 2002, he was Chief Financial Officer of BioCryst Pharmaceuticals, Inc. (biotechnology). From 1998 to 1999, he was Chief Financial Officer of ScandiPharm, Inc. (pharmaceuticals). From 1995 to 1998, he served as Senior Vice President – Finance of CaremarkRx (pharmacy benefit management). From 1983 to 1995, he held various positions with AmSouth Bancorporation (bank holding company), including Executive Vice President and Controller. |
| |
Mary S. Stone DOB 8/19/1950, Trustee, Since 2003 | | Ms. Stone has been a professor at the University of Alabama Culverhouse School of Accountancy since 1981 and held the Hugh Culverhouse Endowed Chair of Accountancy since 2002. She has served as Director of the Culverhouse School of Accountancy since 2004. She is also a former member of Financial Accounting Standards Advisory Council, AICPA, Accounting Standards Executive Committee and AACSB International Accounting Accreditation Committee. She is a Certified Public Accountant. |
117
BOARDOF TRUSTEESAND TRUST OFFICERS
| | |
Name, Address(1), Age,
Position(s) held with Funds,
Term of Office(2),
Length of Service | | Principal Occupation(s) During Past Five Years and Other Directorships
held by Trustee |
| |
Archie W. Willis, III DOB 11/13/1957, Trustee, Since 2003 | | Mr. Willis has been President of Community Capital (financial advisory and real estate development) since 1999 and Vice President of Community Realty Company (real estate brokerage) since 1999. He was a First Vice President of Morgan Keegan & Company, Inc. from 1991 to 1999. He also has served as a Director of Memphis Telecom, LLC since 2001 and a Member of the Advisory Board of Tri-State Bank of Memphis since 2006. |
(1) | | The address of each trustee is c/o the Trust, 50 North Front Street, 21st Floor, Memphis, Tennessee 38103. |
(2) | | Each trustee serves until his or her resignation or retirement. |
OFFICERS
| | |
Name, Address(1), Age,
Position(s) held with Funds,
Term of Office(2),
Length of Service | | Principal Occupation(s) During Past Five Years |
| |
Brian B. Sullivan DOB 1/4/1955, President, Since 2006 | | Mr. Sullivan has served as President and Chief Investment Officer of Morgan Asset Management, Inc. since 2006. From 1999 to 2002 and from 2005 to 2007, Mr. Sullivan has served as President of AmSouth Asset Management, Inc., which merged into Morgan Asset Management, Inc. in late 2007. From 1996 to 1999 and from 2002 to 2005, Mr. Sullivan served as Vice President of AmSouth Asset Management, Inc. Since joining AmSouth Bank in 1982 through 1996, Mr. Sullivan served in various capacities including Equity Research Analyst and Chief Fixed Income Officer and was responsible for Employee Benefits Portfolio Management and Regional Trust Investments. He holds the Chartered Financial Analyst designation. |
| |
J. Thompson Weller DOB 4/2/1965, Treasurer, Since 2006 and Assistant Secretary, Since 2003 | | Mr. Weller has been a Managing Director and Controller of Morgan Keegan & Company, Inc. since 2001. He was Senior Vice President and Controller of Morgan Keegan & Company, Inc. from 1998 to 2001, Controller and First Vice President from 1997 to 1998, Controller and Vice President from 1995 to 1997 and Assistant Controller from 1992 to 1995. Mr. Weller also served as a Business Systems Analyst in the Investment Information Division of Metropolitan Life Insurance Co. from 1991 to 1992. Mr. Weller was also with Arthur Andersen & Co. in 1988 and Andersen Consulting from 1989 to 1991. |
| |
Charles D. Maxwell DOB 5/14/1954, Secretary and Assistant Treasurer, Since 2003 | | Mr. Maxwell has been Executive Managing Director, Chief Financial Officer, Treasurer and Secretary of Morgan Keegan & Company, Inc. since 2006. Mr. Maxwell previously served as Managing Director of Morgan Keegan & Company, Inc. from 1998 to 2006 and Assistant Treasurer and Assistant Secretary of Morgan Keegan & Company, Inc. from 1994 to 2006. Mr. Maxwell has been Secretary and Treasurer of Morgan Asset Management, Inc. since 1993. He was Senior Vice President of Morgan Keegan & Company, Inc. from 1995 to 1997. Mr. Maxwell also was with the accounting firm of Ernst & Young LLP from 1976 to 1986 and served as a Senior Manager from 1984 to 1986. |
118
BOARDOF TRUSTEESAND TRUST OFFICERS
| | |
Name, Address(1), Age,
Position(s) held with Funds,
Term of Office(2),
Length of Service | | Principal Occupation(s) During Past Five Years |
| |
Michele F. Wood DOB 4/29/1969, Chief Compliance Officer, Since 2006 | | Ms. Wood has been the Chief Compliance Officer of Morgan Asset Management, Inc. since 2006 and is also a Senior Vice President of Morgan Keegan & Company, Inc. She was a Senior Attorney and First Vice President of Morgan Keegan & Company, Inc. from 2002 to 2006. She was a Staff Attorney with FedEx Corporation from 2001 to 2002 specializing in employment litigation. She was an Associate with Ford & Harrison LLP from 1997 to 2001. |
(1) | | The address of Messrs. Sullivan, Weller and Maxwell and Ms. Wood is 50 North Front Street, Memphis, Tennessee 38103. |
(2) | | Officers of the Funds are elected and appointed by the Board of Trustees and hold office until they resign, are removed or are otherwise disqualified to serve. |
119
SUPPLEMENTAL INFORMATION
BOARD APPROVAL OFTHE INVESTMENTADVISORY AGREEMENT (UNAUDITED)
On November 20, 2008, the continuance of the investment advisory agreements between Morgan Asset Management, Inc. (“Adviser”) and Regions Morgan Keegan Select Funds (the “Trust”), with respect to Regions Morgan Keegan Select Mid Cap Growth Fund (“Mid Cap Growth Fund”), Regions Morgan Keegan Select Growth Fund (“Growth Fund”), Regions Morgan Keegan Select Core Equity Fund (“Core Equity Fund”), Regions Morgan Keegan Select Mid Cap Value Fund (“Mid Cap Value Fund”), Regions Morgan Keegan Select Value Fund (“Value Fund”), Regions Morgan Keegan Select Balanced Fund (“Balanced Fund”), Regions Morgan Keegan Select Fixed Income Fund (“Fixed Income Fund”), Regions Morgan Keegan Select Limited Maturity Fixed Income Fund (“Limited Maturity Fixed Income Fund”), Regions Morgan Keegan Select Intermediate Tax Exempt Bond Fund (“Intermediate Tax Exempt Bond Fund”), Regions Morgan Keegan Select Treasury Money Market Fund (“Treasury Money Market Fund”) and Regions Morgan Keegan Select Money Market Fund (“Money Market Fund”), each a series of the Trust (each a “Fund” and collectively, the “Funds”), were considered and unanimously approved by the Trust’s Board of Trustees and separately by the Trustees who are not “interested persons” of the Funds within the meaning of Section 2(a)(19) of the Investment Company Act of 1940, as amended (the “Independent Trustees”). In addition, the continuance of the investment sub-advisory agreement between Adviser and Channing Capital Management, LLC (“CCM”), with respect to Mid Cap Value Fund, was considered and unanimously approved by the Trust’s Board of Trustees and separately by the Independent Trustees. The Board previously met in person on August 25, 2008 and continued the investment advisory agreements and the sub-advisory agreement (collectively, the “Agreements”) through December 31, 2008.
In evaluating the Agreements, the Board reviewed information furnished by Adviser and CCM in response to questions submitted by independent counsel to the Independent Trustees. The Independent Trustees were assisted by independent legal counsel during their deliberations and met separately from representatives of Adviser to discuss the contract review.
In approving the continuance of each Agreement, the Board determined that the terms of the Agreement are fair and reasonable and that approval of the Agreement on behalf of the applicable Fund is in the best interests of that Fund. The Board specifically considered the following, among other things, as relevant to its deliberations: (1) the nature, extent, and quality of the services provided by Adviser and CCM under the Agreements; (2) the performance of each Fund compared to its benchmark index and a peer group of investment companies; (3) the costs of the services provided and profits realized by Adviser and CCM from their relationships with the Funds; (4) the extent to which economies of scale might be realized as a Fund grows; and (5) whether fee levels reflect any such potential economies of scale for the benefit of investors in a Fund. The Board also evaluated the terms of the Agreements, the overall fairness of the Agreements to each Fund and whether the Agreements were in the best interests of the Funds. In their deliberations, the Board did not identify any single factor or information as all-important or controlling, and each Trustee may have attributed different importance to the various factors.
With respect to the nature, extent, and quality of the services provided by Adviser and CCM, the Board considered Adviser’s and CCM’s investment processes, the qualifications and experience of the portfolio managers, and the experience and staffing of Adviser’s and CCM’s investment research personnel who perform services for the Funds. The Board also noted the extensive responsibilities that Adviser has as investment adviser to the Funds, and that CCM has as sub-adviser to Mid-Cap Value Fund. In particular, the Board considered the responsibility for making investment decisions on behalf of the Funds and placing all orders for the purchase and sale of investments for the Funds. The Board further considered Adviser’s and CCM’s policies and procedures for the selection of brokers and dealers and for obtaining research from those brokers and dealers and reviewed the products Adviser receives in connection with soft dollars generated by Fund brokerage. In considering the financial condition of Adviser and CCM, the Board reviewed financial information regarding each company and its affiliates (as applicable).
With respect to performance of the Funds, the Board considered the performance of each Fund relative to its benchmark index and a peer group of investment companies pursuing broadly similar strategies. The Board also considered performance in relation to the degree of risk undertaken by the portfolio manager. The Board noted that
120
SUPPLEMENTAL INFORMATION
during the past year, the performance of the Value Fund exceeded its benchmark and the performance of the Balanced Fund exceeded its blended index. The Board also noted that during the past year Mid Cap Growth Fund and Growth Fund each were in line with their respective benchmarks, while the performance of Money Market Fund and Treasury Money Market Fund remained satisfactory. Further, the Board observed that Core Equity Fund, Mid Cap Value Fund, Limited Maturity Fixed Income Fund, Fixed Income Fund and Tax-Exempt Bond Fund each underperformed their respective benchmarks. In considering the performance of each Fund, the Board noted the extraordinary market developments in 2008. Additionally, the Board considered that Core Equity Fund and Limited Maturity Fixed Income Fund had experienced significant net redemptions in 2008. The Board discussed each Fund’s performance with Adviser or CCM and the steps that Adviser or CCM had taken, or intended to take, to improve performance.
The Board also examined the fees payable under the Agreements and the total expense ratio of each Fund in light of the fees and total expense ratios for its peer group. The Board noted that the advisory fee for each of Limited Maturity Fixed Income Fund and Tax-Exempt Bond Fund was below the average for its peer group, while the total expense ratio for each of these Funds was slightly above the peer group average. For Mid Cap Growth Fund, the Board noted that the advisory fee was above average for its peer group, while the total expense ratio for the Fund was below the average for its peer group. The Board noted that the advisory fees for all other Funds were slightly above average for the applicable peer group, while the total expense ratios were near the median for the peer group. In this connection, the Board evaluated Adviser’s and CCM’s costs and profitability in providing services to the Funds, including the costs associated with personnel, systems, infrastructure, and certain other expenses necessary to perform their functions. The Board determined that CCM’s profitability with respect to Mid Cap Value Fund and Adviser’s profitability on a fund-by-fund and complex-wide basis were not excessive. The Board also determined that, other than the service fees for other services provided to the Funds by affiliates of Adviser and certain soft-dollar research services Adviser obtains, Adviser and its affiliates do not receive any material ancillary benefits as a result of Adviser’s relationship with the Funds. In addition, the Board noted that for Limited Maturity Fixed Income Fund, Adviser has voluntarily waived a portion of its fees since April 1, 2008. Further, the Board noted that, effective November 20, 2008, Adviser has voluntarily agreed to waive fees and reimburse expenses to the extent necessary to prevent a negative yield for each class of shares of Treasury Money Market Fund.
The Board discussed other factors, including economies of scale as Fund asset levels increased, the level of fees Adviser and CCM charge to other accounts for the same or similar services, Adviser’s and CCM’s compliance systems, and the Funds’ compliance issues during the past year.
Based on its review of the Agreements, the Board was satisfied that: (1) the Funds were likely to benefit from the nature, quality, and extent of Adviser’s and CCM’s services; and (2) Adviser and CCM have the resources to provide the services and to carry out their responsibilities under the Agreements. The Board also concluded that Adviser’s and CCM’s compensation, including ancillary benefits, is fair and reasonable.
Based on the foregoing, the Board, and the Independent Trustees voting separately, approved continuation of the Agreements as in the best interest of the respective Funds.
121
SUPPLEMENTAL INFORMATION
PRIVACY POLICY NOTICE
Regions Morgan Keegan Select Funds, their distributor (Morgan Keegan & Company, Inc.) and their agents (referred to as the “Funds,” “we” or “us”) recognize that consumers (referred to as “you” or “your”) expect us to protect both your assets and financial information. We respect your right to privacy and your expectation that all personal information about you or your account will be maintained in a secure manner. We are committed to maintaining the confidentiality, security and integrity of client and shareholder information. We want you to understand the Funds’ policy that governs the handling of your information, how the Funds gather information, how that information is used and how it is kept secure.
Information the Funds Collect
The Funds collect nonpublic personal information about you from the following sources:
| n | | We may receive information from you, or from your financial representative, on account applications, other forms or electronically (such as through the Funds’ website or other electronic trading mechanisms). Examples of this information include your name, address, social security number, assets and income. |
| n | | We may receive information from you, or from your financial representative, through transactions with us or others, correspondence and other communications. Examples of this information include specific investments and your account balances. |
| n | | We may obtain other personal information from you in connection with providing you a financial product or service. Examples of this information include depository, debit or credit account numbers. |
Information Sharing Policy
The Funds may share the nonpublic personal information about you, as described above, with financial or non-financial companies or other entities, including companies that may be affiliated with the Funds and other nonaffiliated third parties, for the following purposes:
| n | | We may share information when it is necessary and required to process a transaction or to service a customer relationship. For example, information may be shared with a company that provides account record keeping services or a company that provides proxy services to shareholders. |
| n | | We may share information when it is required or permitted by law. For example, information may be shared in response to a subpoena or to protect you against fraud or with someone who has established a legal beneficial interest, such as a power of attorney. |
| n | | We may disclose all of the information we collect, as described above, to companies that perform marketing or other services on our behalf or to other financial institutions with whom we have agreements, for the limited purpose of jointly offering, endorsing or sponsoring a financial product or service. For example, we may share information about you for these limited purposes with the bank, broker-dealer or other financial intermediary through whom you purchased the Funds’ products or services, or with providers of marketing, legal, accounting or other professional services. The Funds will not, however, disclose a consumer’s account number or similar form of access number or access code for credit card, deposit or transaction accounts to any non-affiliated third party for use in telemarketing, direct mail or other marketing purposes. |
Except as described above, the Funds do not share customer information. We will not rent, sell, trade or otherwise release or disclose any personal information about you. Any information you provide to us is for the Funds’ use only. If you decide to close your account(s) or become an inactive customer, we will adhere to the privacy policies and practices as described in this notice.
Information Security
When the Funds share nonpublic customer information with third parties hired to facilitate the delivery of certain products or services to our customers, such information is made available for limited purposes and under controlled
122
SUPPLEMENTAL INFORMATION
circumstances designed to protect our customers’ privacy. We require third parties to comply with our standards regarding security and confidentiality of such information. We do not permit them to use that information for their own or any other purposes, or rent, sell, trade or otherwise release or disclose the information to any other party. These requirements are reflected in written agreements between the Funds and the third party service providers.
The Funds protect your personal information in several ways. We maintain physical, electronic and procedural safeguards to guard your nonpublic personal information. Each of the following sections explains an aspect of the Funds’ commitment to protecting your personal information and respecting your privacy.
Employee Access to Information
All of the Funds’ employees and agents must adhere to the Funds’ policy on confidentiality. Access to customer information is authorized for business purposes only, and the degree of access is based on the sensitivity of the information and on an employee’s or agent’s need to know the information in order to service a customer’s account or comply with legal requirements.
Visiting the Funds’ Website
| n | | The Funds’ website (www.rmkfunds.com) gathers and maintains statistics about the number of visitors as well as what information is viewed most frequently. This information is used to improve the content and level of service we provide to our clients and shareholders. |
| n | | Information or data entered into a website will be retained. |
| n | | Where registration to a website or re-entering personal information on a website is required, “cookies” are used to improve your online experience. A cookie is a way for websites to recognize whether or not you have visited the site before. It is a small file that is stored on your computer that identifies you each time you re-visit our site so you don’t have to resubmit personal information. Cookies provide faster access into the website. |
| n | | We may also collect non-personally identifiable Internet Protocol (“IP”) addresses for all other visitors to monitor the number of visitors to the site. These non-personally identifiable IP addresses are never shared with any third party. |
E-mail
If you have opted to receive marketing information from the Funds by e-mail, it is our policy to include instructions in all marketing messages on how to unsubscribe from subsequent e-mail programs. Some products or services from the Funds are intended to be delivered and serviced electronically. E-mail communication may be utilized in such cases. If you participate in an employer-sponsored retirement plan, we may, at your employer’s request, send you e-mail on matters pertaining to the retirement plan.
Please do not provide any account or personal information such as social security numbers, account numbers or account balances within your e-mail correspondence to us. We cannot use e-mail to execute transaction instructions, provide personal account information or change account registration. We can, however, use e-mail to provide you with the necessary forms. You can also use customer service to do so. Call us toll-free at 877-757-7424.
Surveys/Aggregate Data
Periodically, the Funds may conduct surveys about financial products and services or review elements of customer information in an effort to forecast future business needs. The Funds then generate reports that include aggregate data regarding its customers. Aggregate data classifies customer information in various ways but that does not identify individual customers. These reports may also include information on website traffic patterns and related information. These reports are used for the Funds’ planning, statistical and other corporate purposes. Aggregate data may also be shared with external parties, such as marketing organizations. However, no information is shared by which any individual customer could be identified.
123
SUPPLEMENTAL INFORMATION
Changes to Our Privacy Statement
The Funds reserve the right to modify or remove parts of this privacy statement at any time. Notice will be provided to you in advance of any changes that would affect your rights under this policy statement.
PROXY VOTING POLICIES & RECORD OF VOTING ACTIVITY
The Funds vote proxies related to their portfolio securities according to a set of policies and procedures approved by the Funds’ Board of Trustees. You may view the proxy voting activity for each Fund during the most recent twelve month period ended June 30 as well as a description of the policies and procedures, without charge, by calling 877-757-7424, by visiting the Fund’s website at www.rmkfunds.com or by visiting the SEC’s website at www.sec.gov.
QUARTERLY REPORTS ON PORTFOLIO HOLDINGS
The Funds file their complete schedules of portfolio holdings as of the first and third quarters of their fiscal years on Form N-Q with the SEC no more than sixty days after the close of those quarters. You may obtain the Funds’ Form N-Q filings, without charge, by calling 877-757-7424 or you may view these filings by visiting the SEC’s website at www.sec.gov. The Funds’ last Form N-Q filing is available on the Funds’ website at www.rmkfunds.com. The Funds’ Form N-Q filings may also be reviewed and copied at the SEC’s Public Reference Room in Washington, D.C. Call 800-SEC-0330 for information on the operation of the Public Reference Room. A description of the Funds’ policies and procedures with respect to disclosure of its portfolio securities is available in the Funds’ Statement of Additional Information.
FEDERAL TAX INFORMATION (UNAUDITED)
For the fiscal year ended November 30, 2008, the amount of capital gain dividends designated by Mid Cap Growth Fund, Growth Fund, Core Equity Fund, Mid Cap Value Fund, Value Fund, Balanced Fund, and Intermediate Tax Exempt Bond Fund were $44,630,970, $15,164,640, $10,791,004, $4,402,483, $3,385,925, $14,749,763 and $46,874, respectively. These amounts may include earnings and profits distributed to shareholders on the redemption of shares as part of the dividend paid deduction.
For the fiscal year ended November 30, 2008, 89.8%, 72.0% and 61.3% of the income dividends paid by Growth Fund, Value Fund and Balanced Fund, respectively, (1) qualified as “qualified dividend income,” which generally is subject to a maximum tax rate of 15%, for individual stockholders (complete information is reported on Form 1099-DIV) and (2) qualified for the dividends-received deduction available to corporate stockholders.
124
SUPPLEMENTAL INFORMATION
SERVICE PROVIDERS
| | |
INVESTMENT ADVISER Morgan Asset Management, Inc. 1901 6th Avenue North, 4th Floor Birmingham, Alabama 35203 | | SUB-ADVISER TO REGIONS MORGAN KEEGAN SELECT MID CAP VALUE FUND Channing Capital Management, LLC 10 South LaSalle Street, Suite 2650 Chicago, Illinois 60603 |
| |
CUSTODIAN Regions Bank 1901 6th Avenue North, 4th Floor Birmingham, Alabama 35203 | | LEGAL COUNSEL K&L Gates LLP 1601 K Street, N.W. Washington, DC 20006 |
| |
ADMINISTRATOR, DISTRIBUTOR &
TRANSFER AGENT Morgan Keegan & Company, Inc. Morgan Keegan Tower 50 North Front Street Memphis, Tennessee 38103 | | INDEPENDENT REGISTERED PUBLIC ACCOUNTING FIRM PricewaterhouseCoopers LLP One North Wacker Chicago, Illinois 60606 |
125
Shares of Regions Morgan Keegan Select Funds, like shares of all mutual funds, are not bank deposits or obligations, are not guaranteed by any bank and are not insured or guaranteed by the U.S. government, the Federal Deposit Insurance Corporation, the Federal Reserve Board or any other government agency. Investment in mutual funds involves investment risk, including possible loss of principal.
This report is authorized for distribution to prospective investors only when preceded or accompanied by the Funds’ prospectus. An investor should consider each Fund’s investment objectives, risks and charges and expenses carefully before investing or sending money. This and other important information about the investment company can be found in the Funds’ prospectus. To obtain a prospectus, call toll-free 877-757-7424. Please read the prospectus carefully before investing.
REGIONS MORGAN KEEGAN FUND COMPLEX
The Regions Morgan Keegan fund complex offers mutual funds with a broad variety of investment objectives to meet the financial needs of all types of investors. With approximately $2 billion in assets, the fund complex includes five equity funds, one balanced fund, two bond funds, one tax-exempt bond fund and two money market funds. You may see an overview of each Fund by visiting the Funds’ website at www.rmkfunds.com. You may also download each Fund's most recent marketing flyer, prospectus, and annual and semi-annual reports to shareholders.
REGIONS MORGAN KEEGAN SELECT FAMILYOF FUNDS
Regions Morgan Keegan Select Mid Cap Growth Fund
Regions Morgan Keegan Select Growth Fund
Regions Morgan Keegan Select Core Equity Fund
Regions Morgan Keegan Select Mid Cap Value Fund
Regions Morgan Keegan Select Value Fund
Regions Morgan Keegan Select Balanced Fund
Regions Morgan Keegan Select Fixed Income Fund
Regions Morgan Keegan Select Limited Maturity Fixed Income Fund
Regions Morgan Keegan Select Intermediate Tax Exempt Bond Fund
Regions Morgan Keegan Select Treasury Money Market Fund
Regions Morgan Keegan Select Money Market Fund
126