UNITED STATES
SECURITIES AND EXCHANGE COMMISSION
Washington, DC 20549
FORM N-CSR
CERTIFIED SHAREHOLDER REPORT OF REGISTERED
MANAGEMENT INVESTMENT COMPANIES
Investment Company Act file number 811-01608
Franklin High Income Trust
(Exact name of registrant as specified in charter)
One Franklin Parkway, San Mateo, CA 94403-1906
(Address of principal executive offices)(Zip code)
Alison Baur, One Franklin Parkway, San Mateo, CA 94403-1906
(Name and address of agent for service)
Registrant’s telephone number, including area code: 650 312-2000
Date of fiscal year end: 9/30
Date of reporting period: 9/30/24
Item 1. Reports to Stockholders.
| a.) | The following is a copy of the report transmitted to shareholders pursuant to Rule 30e-1 under the Investment Company Act of 1940, as amended (the “1940 Act”) (17 CFR 270.30e-1).
|
| b.) | Include a copy of each notice transmitted to stockholders in reliance on Rule 30e-3 under the Act (17 CFR 270.30e-3) that contains disclosures specified by paragraph (c)(3) of that rule. |
Not Applicable.
| | |
Franklin High Income Fund | |
| Class A [FHQRX] |
| Annual Shareholder Report | September 30, 2024 |
|
This annual shareholder report contains important information about Franklin High Income Fund for the period October 1, 2023, to September 30, 2024.
You can find additional information about the Fund at https://www.franklintempleton.com/regulatory-fund-documents. You can also request this information by contacting us at (800) DIAL BEN/342-5236.
WHAT WERE THE FUND COSTS FOR THE LAST YEAR? (based on a hypothetical $10,000 investment)
| | |
Class Name | Costs of a $10,000 investment | Costs paid as a percentage of a $10,000 investment* |
| Class A | $89 | 0.83% |
| * | Reflects fee waivers and/or expense reimbursements, without which expenses would have been higher. |
HOW DID THE FUND PERFORM LAST YEAR AND WHAT AFFECTED ITS PERFORMANCE?
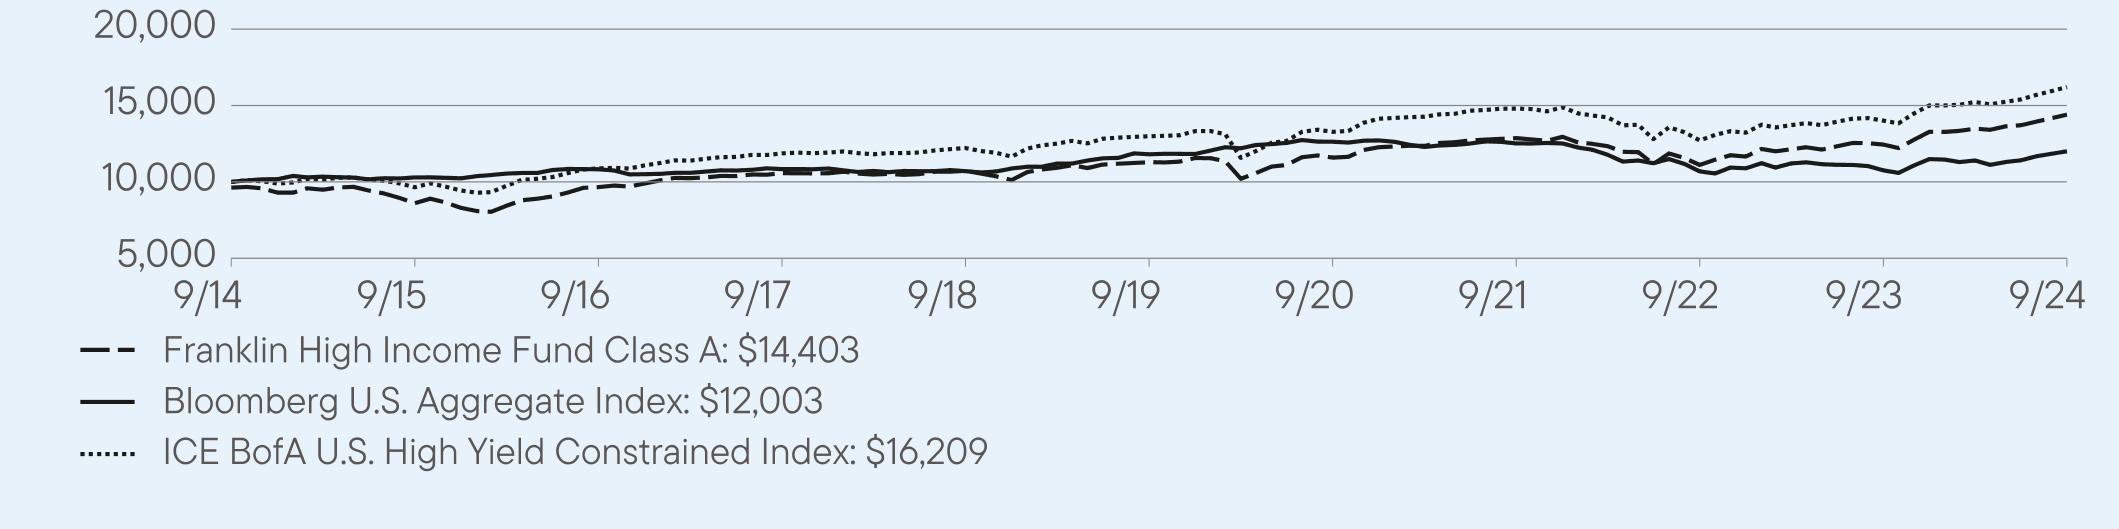
For the twelve months ended September 30, 2024, Class A shares of Franklin High Income Fund returned 15.13%. The Fund compares its performance to the ICE BofA U.S. High Yield Constrained Index, which returned 15.67% for the same period.
| |
Top contributors to performance: |
| ↑ | Holding of a restructured equity security contributed to relative outperformance. The position appreciated sharply in the first half of 2024 (no longer held as of period-end). |
| ↑ | Security selection in the energy, finance and packaging industries. |
| ↑ | Underweight in the wireless industry and overweight in the health care and finance segments. |
| |
Top detractors from performance: |
| ↓ | Yield curve positioning detracted, attributable to an underweight to the short end of the curve as the yield curve steepened. |
| ↓ | Security selection in the health care, entertainment and technology industries. |
| ↓ | Underweight in wired and retail segments and overweight in the energy industry. |
| Franklin High Income Fund | PAGE 1 | 1105-ATSR-1124 |
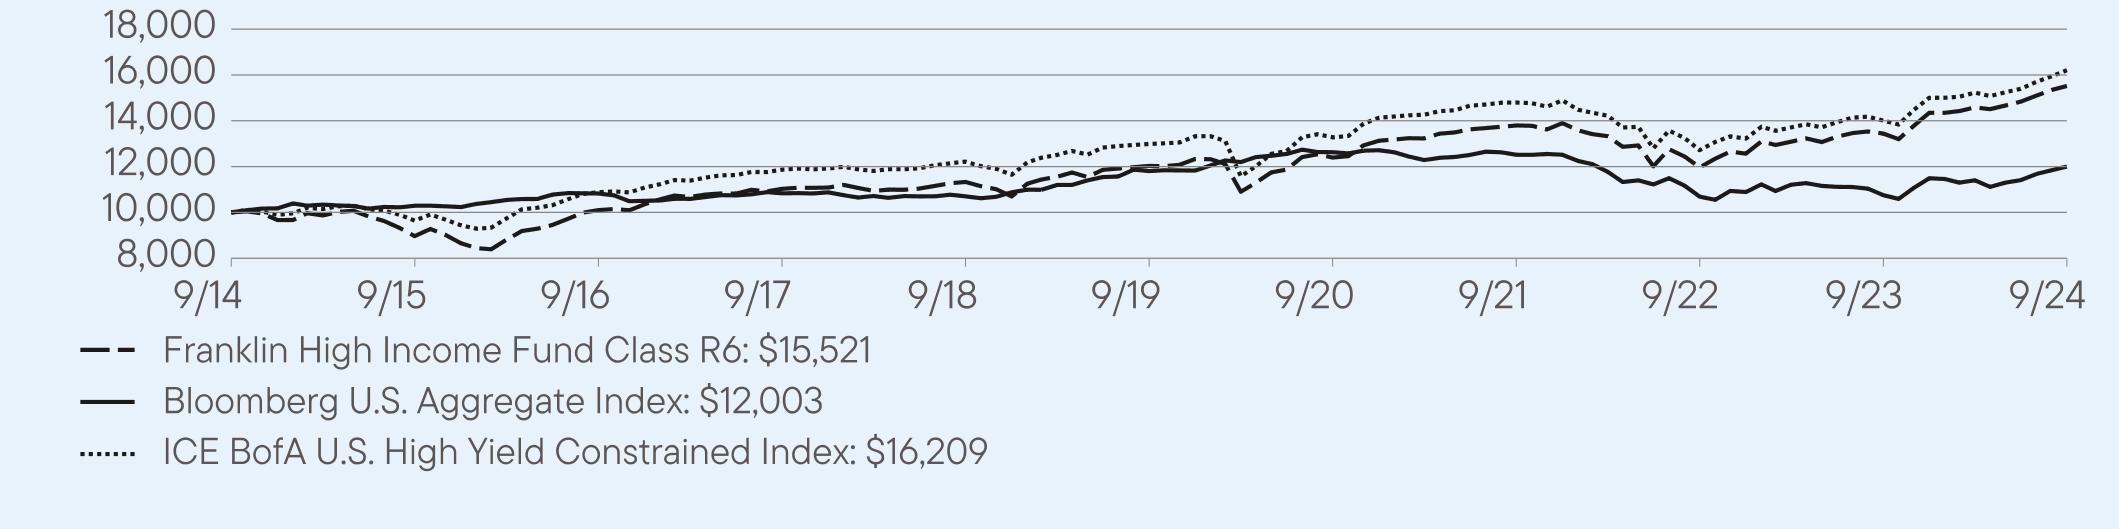
HOW DID THE FUND PERFORM OVER THE LAST 10 YEARS?
The Fund’s past performance is not necessarily an indication of how the Fund will perform in the future. The graph and table do not reflect the deduction of taxes that a shareholder would pay on Fund distributions or redemption of Fund shares.
VALUE OF A $10,000 INVESTMENT ($9,625 AFTER MAXIMUM APPLICABLE SALES CHARGE) –
Class A 9/30/2014 — 9/30/2024
AVERAGE ANNUAL TOTAL RETURNS (%) Period Ended September 30, 2024
| | | |
| | 1 Year | 5 Year | 10 Year |
Class A | 15.13 | 4.89 | 4.11 |
Class A (with sales charge) | 10.81 | 4.09 | 3.72 |
Bloomberg U.S. Aggregate Index | 11.57 | 0.33 | 1.84 |
ICE BofA U.S. High Yield Constrained Index | 15.67 | 4.53 | 4.95 |
Fund performance figures may reflect fee waivers and/or expense reimbursements, without which the performance would have been lower.
The Fund began offering Class A shares on 9/10/2018. Returns for periods before 9/10/2018, are based on the Fund’s Class A1 performance, which has been adjusted to take into account differences in class-specific operating expenses and maximum sales charges. For periods after the share class offering, performance for the specific share class is used, reflecting the applicable expenses and maximum sales charges.
Performance for periods prior to March 1, 2019, has been restated to reflect the current maximum sales charge, which is lower than the maximum sales charge prior to that date.
For current month-end performance, please call Franklin Templeton at (800) DIAL BEN/342-5236 or visit https://www.franklintempleton.com/investments/options/mutual-funds.
Important data provider notices and terms available at www.franklintempletondatasources.com.
KEY FUND STATISTICS (as of September 30, 2024)
| |
Total Net Assets | $2,813,899,954 |
Total Number of Portfolio Holdings* | 328 |
Total Management Fee Paid | $11,993,720 |
Portfolio Turnover Rate | 36.83% |
| * | Does not include derivatives, except purchased options, if any. |
| Franklin High Income Fund | PAGE 2 | 1105-ATSR-1124 |
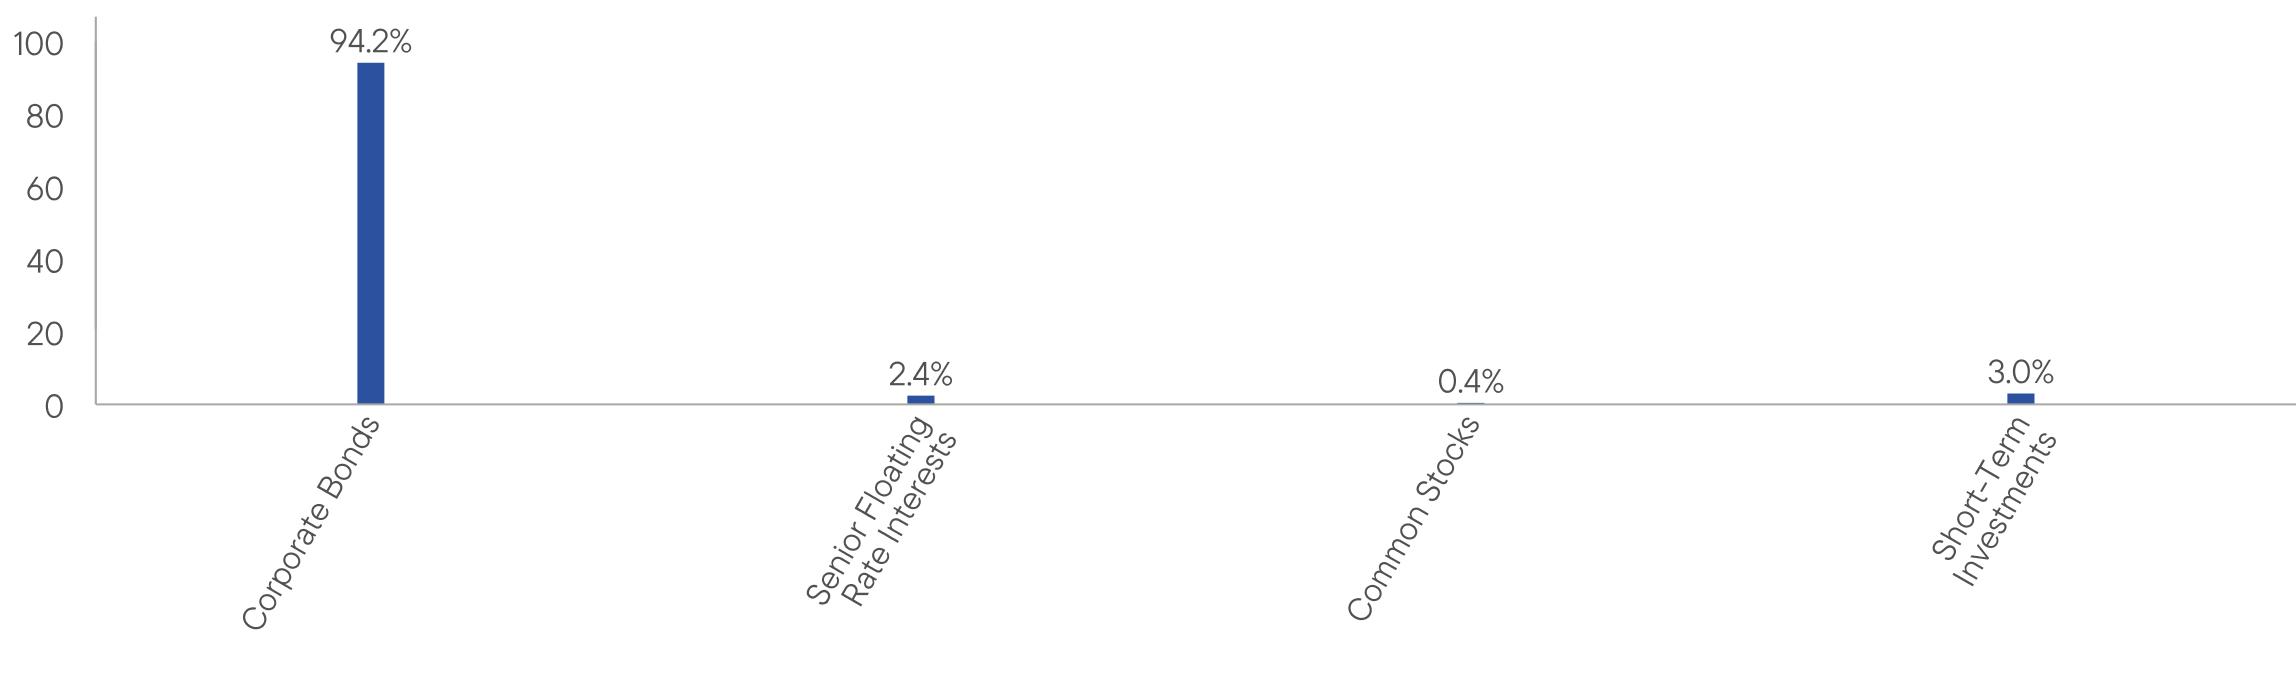
WHAT DID THE FUND INVEST IN? (as of September 30, 2024)
Portfolio Composition* (% of Total Investments)
| * | Does not include derivatives, except purchased options, if any. |
| |
| WHERE CAN I FIND ADDITIONAL INFORMATION ABOUT THE FUND? |
Additional information is available on https://www.franklintempleton.com/regulatory-fund-documents, including its: |
| • prospectus • proxy voting information • financial information • holdings • tax information |
HOUSEHOLDING
You will receive the Fund’s shareholder reports every six months. In addition, you will receive an annual updated summary prospectus (detail prospectus available upon request). To reduce Fund expenses, we try to identify related shareholders in a household and send only one copy of the shareholder reports and summary prospectus. This process, called “householding,” will continue indefinitely unless you instruct us otherwise. If you prefer not to have these documents householded, please call us at (800) DIAL BEN/342-5236. At any time, you may view current prospectuses/summary prospectuses and shareholder reports on our website. If you choose, you may receive these documents through electronic delivery.
| Franklin High Income Fund | PAGE 3 | 1105-ATSR-1124 |
9625860496621057410724112891158912866111091244814403100001029310827108351070411806126301251710690107591200310000964610884118691221812988132761479812717140131620994.22.40.43.0
| | |
Franklin High Income Fund | |
| Class A1 [FHAIX] |
| Annual Shareholder Report | September 30, 2024 |
|
This annual shareholder report contains important information about Franklin High Income Fund for the period October 1, 2023, to September 30, 2024.
You can find additional information about the Fund at https://www.franklintempleton.com/regulatory-fund-documents. You can also request this information by contacting us at (800) DIAL BEN/342-5236.
WHAT WERE THE FUND COSTS FOR THE LAST YEAR? (based on a hypothetical $10,000 investment)
| | |
Class Name | Costs of a $10,000 investment | Costs paid as a percentage of a $10,000 investment* |
| Class A1 | $78 | 0.73% |
| * | Reflects fee waivers and/or expense reimbursements, without which expenses would have been higher. |
HOW DID THE FUND PERFORM LAST YEAR AND WHAT AFFECTED ITS PERFORMANCE?
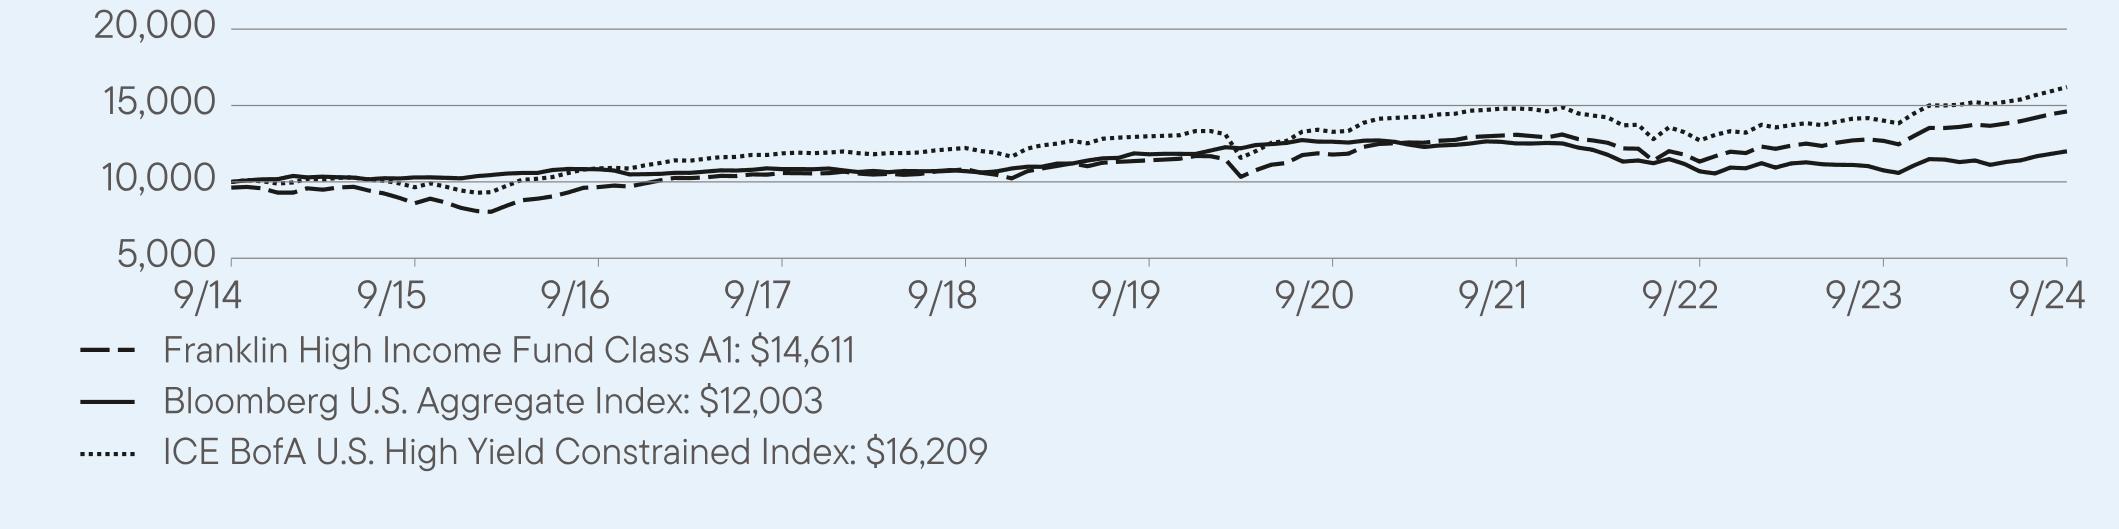
For the twelve months ended September 30, 2024, Class A1 shares of Franklin High Income Fund returned 15.06%. The Fund compares its performance to the ICE BofA U.S. High Yield Constrained Index, which returned 15.67% for the same period.
| |
Top contributors to performance: |
| ↑ | Holding of a restructured equity security contributed to relative outperformance. The position appreciated sharply in the first half of 2024 (no longer held as of period-end). |
| ↑ | Security selection in the energy, finance and packaging industries. |
| ↑ | Underweight in the wireless industry and overweight in the health care and finance segments. |
| |
Top detractors from performance: |
| ↓ | Yield curve positioning detracted, attributable to an underweight to the short end of the curve as the yield curve steepened. |
| ↓ | Security selection in the health care, entertainment and technology industries. |
| ↓ | Underweight in wired and retail segments and overweight in the energy industry. |
| Franklin High Income Fund | PAGE 1 | 105-ATSR-1124 |
HOW DID THE FUND PERFORM OVER THE LAST 10 YEARS?
The Fund’s past performance is not necessarily an indication of how the Fund will perform in the future. The graph and table do not reflect the deduction of taxes that a shareholder would pay on Fund distributions or redemption of Fund shares.
VALUE OF A $10,000 INVESTMENT ($9,625 AFTER MAXIMUM APPLICABLE SALES CHARGE) –
Class A1 9/30/2014 — 9/30/2024
AVERAGE ANNUAL TOTAL RETURNS (%) Period Ended September 30, 2024
| | | |
| | 1 Year | 5 Year | 10 Year |
Class A1 | 15.06 | 5.05 | 4.26 |
Class A1 (with sales charge) | 11.00 | 4.27 | 3.86 |
Bloomberg U.S. Aggregate Index | 11.57 | 0.33 | 1.84 |
ICE BofA U.S. High Yield Constrained Index | 15.67 | 4.53 | 4.95 |
Fund performance figures may reflect fee waivers and/or expense reimbursements, without which the performance would have been lower.
Effective 9/10/18, Class A shares closed to new investors, were renamed Class A1 shares, and a new Class A share with a different expense structure became available.
Performance for periods prior to March 1, 2019, has been restated to reflect the current maximum sales charge, which is lower than the maximum sales charge prior to that date.
For current month-end performance, please call Franklin Templeton at (800) DIAL BEN/342-5236 or visit https://www.franklintempleton.com/investments/options/mutual-funds.
Important data provider notices and terms available at www.franklintempletondatasources.com.
KEY FUND STATISTICS (as of September 30, 2024)
| |
Total Net Assets | $2,813,899,954 |
Total Number of Portfolio Holdings* | 328 |
Total Management Fee Paid | $11,993,720 |
Portfolio Turnover Rate | 36.83% |
| * | Does not include derivatives, except purchased options, if any. |
| Franklin High Income Fund | PAGE 2 | 105-ATSR-1124 |
WHAT DID THE FUND INVEST IN? (as of September 30, 2024)
Portfolio Composition* (% of Total Investments)
| * | Does not include derivatives, except purchased options, if any. |
| |
| WHERE CAN I FIND ADDITIONAL INFORMATION ABOUT THE FUND? |
Additional information is available on https://www.franklintempleton.com/regulatory-fund-documents, including its: |
| • prospectus • proxy voting information • financial information • holdings • tax information |
HOUSEHOLDING
You will receive the Fund’s shareholder reports every six months. In addition, you will receive an annual updated summary prospectus (detail prospectus available upon request). To reduce Fund expenses, we try to identify related shareholders in a household and send only one copy of the shareholder reports and summary prospectus. This process, called “householding,” will continue indefinitely unless you instruct us otherwise. If you prefer not to have these documents householded, please call us at (800) DIAL BEN/342-5236. At any time, you may view current prospectuses/summary prospectuses and shareholder reports on our website. If you choose, you may receive these documents through electronic delivery.
| Franklin High Income Fund | PAGE 3 | 105-ATSR-1124 |
9625860496631057710839114141179113087113301269214611100001029310827108351070411806126301251710690107591200310000964610884118691221812988132761479812717140131620994.22.40.43.0
| | |
Franklin High Income Fund | |
| Class C [FCHIX] |
| Annual Shareholder Report | September 30, 2024 |
|
This annual shareholder report contains important information about Franklin High Income Fund for the period October 1, 2023, to September 30, 2024.
You can find additional information about the Fund at https://www.franklintempleton.com/regulatory-fund-documents. You can also request this information by contacting us at (800) DIAL BEN/342-5236.
WHAT WERE THE FUND COSTS FOR THE LAST YEAR? (based on a hypothetical $10,000 investment)
| | |
Class Name | Costs of a $10,000 investment | Costs paid as a percentage of a $10,000 investment* |
| Class C | $132 | 1.23% |
| * | Reflects fee waivers and/or expense reimbursements, without which expenses would have been higher. |
HOW DID THE FUND PERFORM LAST YEAR AND WHAT AFFECTED ITS PERFORMANCE?
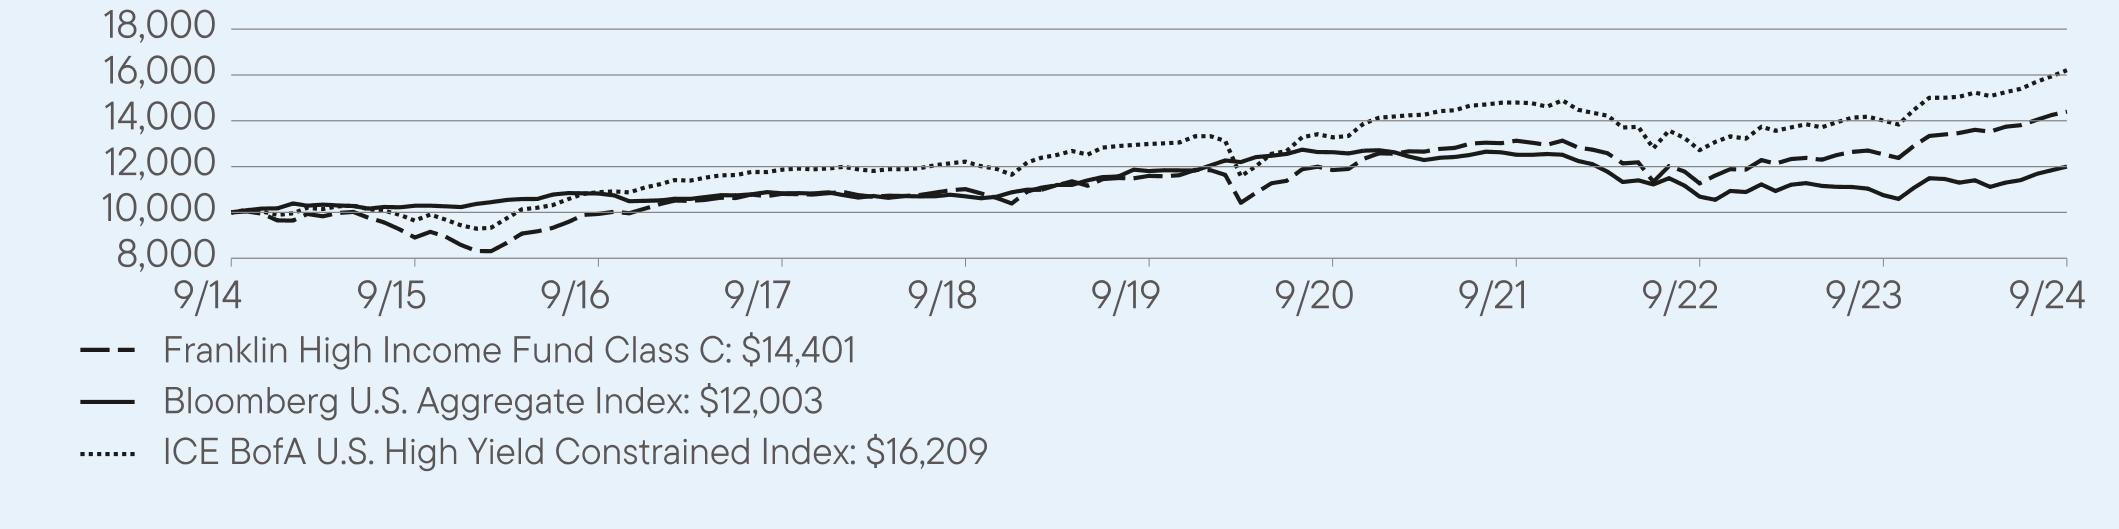
For the twelve months ended September 30, 2024, Class C shares of Franklin High Income Fund returned 14.87%. The Fund compares its performance to the ICE BofA U.S. High Yield Constrained Index, which returned 15.67% for the same period.
| |
Top contributors to performance: |
| ↑ | Holding of a restructured equity security contributed to relative outperformance. The position appreciated sharply in the first half of 2024 (no longer held as of period-end). |
| ↑ | Security selection in the energy, finance and packaging industries. |
| ↑ | Underweight in the wireless industry and overweight in the health care and finance segments. |
| |
Top detractors from performance: |
| ↓ | Yield curve positioning detracted, attributable to an underweight to the short end of the curve as the yield curve steepened. |
| ↓ | Security selection in the health care, entertainment and technology industries. |
| ↓ | Underweight in wired and retail segments and overweight in the energy industry. |
| Franklin High Income Fund | PAGE 1 | 205-ATSR-1124 |
HOW DID THE FUND PERFORM OVER THE LAST 10 YEARS?
The Fund’s past performance is not necessarily an indication of how the Fund will perform in the future. The graph and table do not reflect the deduction of taxes that a shareholder would pay on Fund distributions or redemption of Fund shares.
VALUE OF A $10,000 INVESTMENT – Class C 9/30/2014 — 9/30/2024
AVERAGE ANNUAL TOTAL RETURNS (%) Period Ended September 30, 2024
| | | |
| | 1 Year | 5 Year | 10 Year |
Class C | 14.87 | 4.43 | 3.71 |
Class C (with sales charge) | 13.87 | 4.43 | 3.71 |
Bloomberg U.S. Aggregate Index | 11.57 | 0.33 | 1.84 |
ICE BofA U.S. High Yield Constrained Index | 15.67 | 4.53 | 4.95 |
Fund performance figures may reflect fee waivers and/or expense reimbursements, without which the performance would have been lower.
For current month-end performance, please call Franklin Templeton at (800) DIAL BEN/342-5236 or visit https://www.franklintempleton.com/investments/options/mutual-funds.
Important data provider notices and terms available at www.franklintempletondatasources.com.
KEY FUND STATISTICS (as of September 30, 2024)
| |
Total Net Assets | $2,813,899,954 |
Total Number of Portfolio Holdings* | 328 |
Total Management Fee Paid | $11,993,720 |
Portfolio Turnover Rate | 36.83% |
| * | Does not include derivatives, except purchased options, if any. |
| Franklin High Income Fund | PAGE 2 | 205-ATSR-1124 |
WHAT DID THE FUND INVEST IN? (as of September 30, 2024)
Portfolio Composition* (% of Total Investments)
| * | Does not include derivatives, except purchased options, if any. |
| |
| WHERE CAN I FIND ADDITIONAL INFORMATION ABOUT THE FUND? |
Additional information is available on https://www.franklintempleton.com/regulatory-fund-documents, including its: |
| • prospectus • proxy voting information • financial information • holdings • tax information |
HOUSEHOLDING
You will receive the Fund’s shareholder reports every six months. In addition, you will receive an annual updated summary prospectus (detail prospectus available upon request). To reduce Fund expenses, we try to identify related shareholders in a household and send only one copy of the shareholder reports and summary prospectus. This process, called “householding,” will continue indefinitely unless you instruct us otherwise. If you prefer not to have these documents householded, please call us at (800) DIAL BEN/342-5236. At any time, you may view current prospectuses/summary prospectuses and shareholder reports on our website. If you choose, you may receive these documents through electronic delivery.
| Franklin High Income Fund | PAGE 3 | 205-ATSR-1124 |
10000890599371081011017115961184813133112691253714401100001029310827108351070411806126301251710690107591200310000964610884118691221812988132761479812717140131620994.22.40.43.0
| | |
Franklin High Income Fund | |
| Class R [FHIRX] |
| Annual Shareholder Report | September 30, 2024 |
|
This annual shareholder report contains important information about Franklin High Income Fund for the period October 1, 2023, to September 30, 2024.
You can find additional information about the Fund at https://www.franklintempleton.com/regulatory-fund-documents. You can also request this information by contacting us at (800) DIAL BEN/342-5236.
WHAT WERE THE FUND COSTS FOR THE LAST YEAR? (based on a hypothetical $10,000 investment)
| | |
Class Name | Costs of a $10,000 investment | Costs paid as a percentage of a $10,000 investment* |
| Class R | $116 | 1.08% |
| * | Reflects fee waivers and/or expense reimbursements, without which expenses would have been higher. |
HOW DID THE FUND PERFORM LAST YEAR AND WHAT AFFECTED ITS PERFORMANCE?
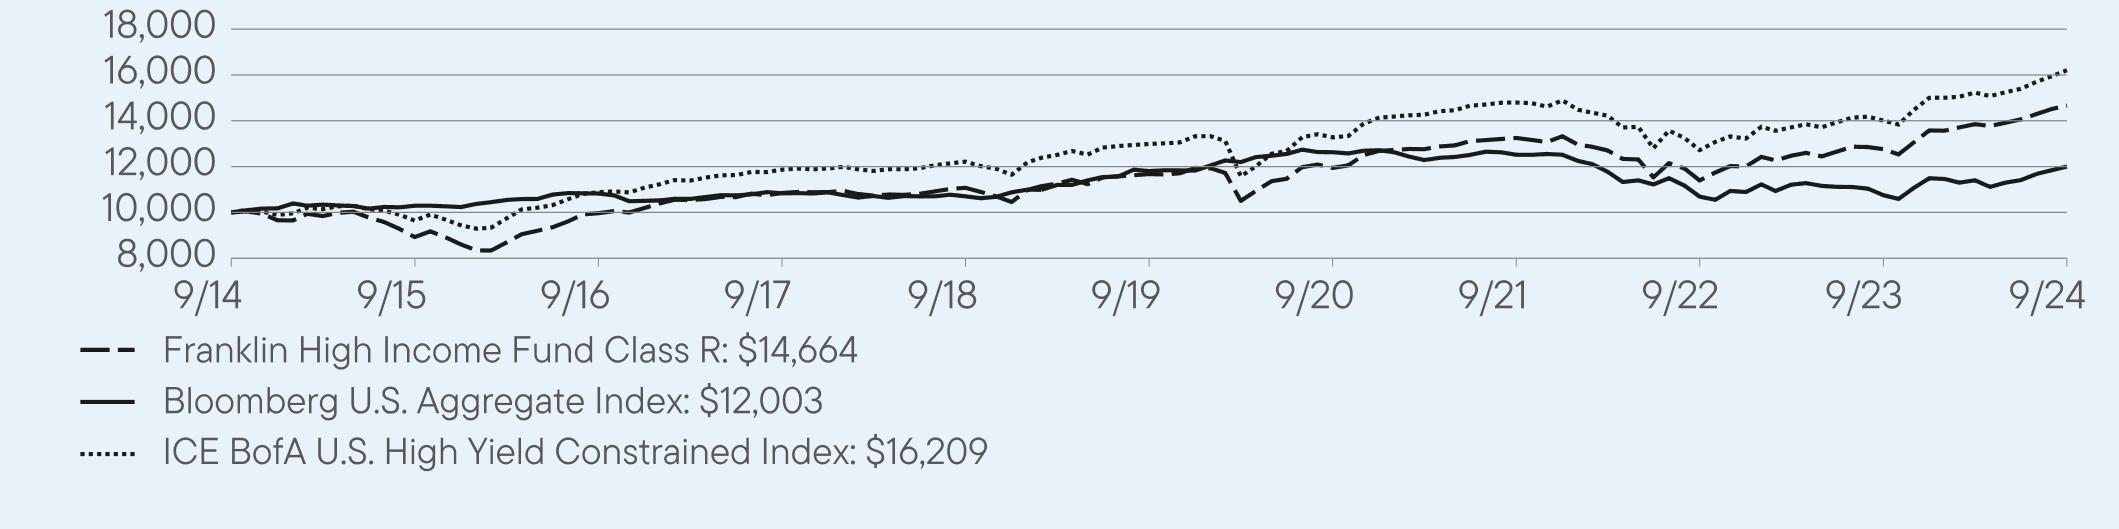
For the twelve months ended September 30, 2024, Class R shares of Franklin High Income Fund returned 14.88%. The Fund compares its performance to the ICE BofA U.S. High Yield Constrained Index, which returned 15.67% for the same period.
| |
Top contributors to performance: |
| ↑ | Holding of a restructured equity security contributed to relative outperformance. The position appreciated sharply in the first half of 2024 (no longer held as of period-end). |
| ↑ | Security selection in the energy, finance and packaging industries. |
| ↑ | Underweight in the wireless industry and overweight in the health care and finance segments. |
| |
Top detractors from performance: |
| ↓ | Yield curve positioning detracted, attributable to an underweight to the short end of the curve as the yield curve steepened. |
| ↓ | Security selection in the health care, entertainment and technology industries. |
| ↓ | Underweight in wired and retail segments and overweight in the energy industry. |
| Franklin High Income Fund | PAGE 1 | 805-ATSR-1124 |
HOW DID THE FUND PERFORM OVER THE LAST 10 YEARS?
The Fund’s past performance is not necessarily an indication of how the Fund will perform in the future. The graph and table do not reflect the deduction of taxes that a shareholder would pay on Fund distributions or redemption of Fund shares.
VALUE OF A $10,000 INVESTMENT – Class R 9/30/2014 — 9/30/2024
AVERAGE ANNUAL TOTAL RETURNS (%) Period Ended September 30, 2024
| | | |
| | 1 Year | 5 Year | 10 Year |
Class R | 14.88 | 4.67 | 3.90 |
Bloomberg U.S. Aggregate Index | 11.57 | 0.33 | 1.84 |
ICE BofA U.S. High Yield Constrained Index | 15.67 | 4.53 | 4.95 |
Fund performance figures may reflect fee waivers and/or expense reimbursements, without which the performance would have been lower.
For current month-end performance, please call Franklin Templeton at (800) DIAL BEN/342-5236 or visit https://www.franklintempleton.com/investments/options/mutual-funds.
Important data provider notices and terms available at www.franklintempletondatasources.com.
KEY FUND STATISTICS (as of September 30, 2024)
| |
Total Net Assets | $2,813,899,954 |
Total Number of Portfolio Holdings* | 328 |
Total Management Fee Paid | $11,993,720 |
Portfolio Turnover Rate | 36.83% |
| * | Does not include derivatives, except purchased options, if any. |
WHAT DID THE FUND INVEST IN? (as of September 30, 2024)
Portfolio Composition* (% of Total Investments)
| * | Does not include derivatives, except purchased options, if any. |
| Franklin High Income Fund | PAGE 2 | 805-ATSR-1124 |
| |
| WHERE CAN I FIND ADDITIONAL INFORMATION ABOUT THE FUND? |
Additional information is available on https://www.franklintempleton.com/regulatory-fund-documents, including its: |
| • prospectus • proxy voting information • financial information • holdings • tax information |
HOUSEHOLDING
You will receive the Fund’s shareholder reports every six months. In addition, you will receive an annual updated summary prospectus (detail prospectus available upon request). To reduce Fund expenses, we try to identify related shareholders in a household and send only one copy of the shareholder reports and summary prospectus. This process, called “householding,” will continue indefinitely unless you instruct us otherwise. If you prefer not to have these documents householded, please call us at (800) DIAL BEN/342-5236. At any time, you may view current prospectuses/summary prospectuses and shareholder reports on our website. If you choose, you may receive these documents through electronic delivery.
| Franklin High Income Fund | PAGE 3 | 805-ATSR-1124 |
10000892599671085211075116731194213251113961276514664100001029310827108351070411806126301251710690107591200310000964610884118691221812988132761479812717140131620994.22.40.43.0
| | |
Franklin High Income Fund | |
| Class R6 [FHRRX] |
| Annual Shareholder Report | September 30, 2024 |
|
This annual shareholder report contains important information about Franklin High Income Fund for the period October 1, 2023, to September 30, 2024.
You can find additional information about the Fund at https://www.franklintempleton.com/regulatory-fund-documents. You can also request this information by contacting us at (800) DIAL BEN/342-5236.
WHAT WERE THE FUND COSTS FOR THE LAST YEAR? (based on a hypothetical $10,000 investment)
| | |
Class Name | Costs of a $10,000 investment | Costs paid as a percentage of a $10,000 investment* |
| Class R6 | $53 | 0.49% |
| * | Reflects fee waivers and/or expense reimbursements, without which expenses would have been higher. |
HOW DID THE FUND PERFORM LAST YEAR AND WHAT AFFECTED ITS PERFORMANCE?
For the twelve months ended September 30, 2024, Class R6 shares of Franklin High Income Fund returned 15.44%. The Fund compares its performance to the ICE BofA U.S. High Yield Constrained Index, which returned 15.67% for the same period.
| |
Top contributors to performance: |
| ↑ | Holding of a restructured equity security contributed to relative outperformance. The position appreciated sharply in the first half of 2024 (no longer held as of period-end). |
| ↑ | Security selection in the energy, finance and packaging industries. |
| ↑ | Underweight in the wireless industry and overweight in the health care and finance segments. |
| |
Top detractors from performance: |
| ↓ | Yield curve positioning detracted, attributable to an underweight to the short end of the curve as the yield curve steepened. |
| ↓ | Security selection in the health care, entertainment and technology industries. |
| ↓ | Underweight in wired and retail segments and overweight in the energy industry. |
| Franklin High Income Fund | PAGE 1 | 355-ATSR-1124 |
HOW DID THE FUND PERFORM OVER THE LAST 10 YEARS?
The Fund’s past performance is not necessarily an indication of how the Fund will perform in the future. The graph and table do not reflect the deduction of taxes that a shareholder would pay on Fund distributions or redemption of Fund shares.
VALUE OF A $10,000 INVESTMENT – Class R6 9/30/2014 — 9/30/2024
AVERAGE ANNUAL TOTAL RETURNS (%) Period Ended September 30, 2024
| | | |
| | 1 Year | 5 Year | 10 Year |
Class R6 | 15.44 | 5.22 | 4.49 |
Bloomberg U.S. Aggregate Index | 11.57 | 0.33 | 1.84 |
ICE BofA U.S. High Yield Constrained Index | 15.67 | 4.53 | 4.95 |
Fund performance figures may reflect fee waivers and/or expense reimbursements, without which the performance would have been lower.
For current month-end performance, please call Franklin Templeton at (800) DIAL BEN/342-5236 or visit https://www.franklintempleton.com/investments/options/mutual-funds.
Important data provider notices and terms available at www.franklintempletondatasources.com.
KEY FUND STATISTICS (as of September 30, 2024)
| |
Total Net Assets | $2,813,899,954 |
Total Number of Portfolio Holdings* | 328 |
Total Management Fee Paid | $11,993,720 |
Portfolio Turnover Rate | 36.83% |
| * | Does not include derivatives, except purchased options, if any. |
WHAT DID THE FUND INVEST IN? (as of September 30, 2024)
Portfolio Composition* (% of Total Investments)
| * | Does not include derivatives, except purchased options, if any. |
| Franklin High Income Fund | PAGE 2 | 355-ATSR-1124 |
| |
| WHERE CAN I FIND ADDITIONAL INFORMATION ABOUT THE FUND? |
Additional information is available on https://www.franklintempleton.com/regulatory-fund-documents, including its: |
| • prospectus • proxy voting information • financial information • holdings • tax information |
HOUSEHOLDING
You will receive the Fund’s shareholder reports every six months. In addition, you will receive an annual updated summary prospectus (detail prospectus available upon request). To reduce Fund expenses, we try to identify related shareholders in a household and send only one copy of the shareholder reports and summary prospectus. This process, called “householding,” will continue indefinitely unless you instruct us otherwise. If you prefer not to have these documents householded, please call us at (800) DIAL BEN/342-5236. At any time, you may view current prospectuses/summary prospectuses and shareholder reports on our website. If you choose, you may receive these documents through electronic delivery.
| Franklin High Income Fund | PAGE 3 | 355-ATSR-1124 |
100008966101041103011331120311239313796119651344515521100001029310827108351070411806126301251710690107591200310000964610884118691221812988132761479812717140131620994.22.40.43.0
| | |
Franklin High Income Fund | |
| Advisor Class [FVHIX] |
| Annual Shareholder Report | September 30, 2024 |
|
This annual shareholder report contains important information about Franklin High Income Fund for the period October 1, 2023, to September 30, 2024.
You can find additional information about the Fund at https://www.franklintempleton.com/regulatory-fund-documents. You can also request this information by contacting us at (800) DIAL BEN/342-5236.
WHAT WERE THE FUND COSTS FOR THE LAST YEAR? (based on a hypothetical $10,000 investment)
| | |
Class Name | Costs of a $10,000 investment | Costs paid as a percentage of a $10,000 investment* |
| Advisor Class | $63 | 0.58% |
| * | Reflects fee waivers and/or expense reimbursements, without which expenses would have been higher. |
HOW DID THE FUND PERFORM LAST YEAR AND WHAT AFFECTED ITS PERFORMANCE?
For the twelve months ended September 30, 2024, Advisor Class shares of Franklin High Income Fund returned 15.94%. The Fund compares its performance to the ICE BofA U.S. High Yield Constrained Index, which returned 15.67% for the same period.
| |
Top contributors to performance: |
| ↑ | Holding of a restructured equity security contributed to relative outperformance. The position appreciated sharply in the first half of 2024 (no longer held as of period-end). |
| ↑ | Security selection in the energy, finance and packaging industries. |
| ↑ | Underweight in the wireless industry and overweight in the health care and finance segments. |
| |
Top detractors from performance: |
| ↓ | Yield curve positioning detracted, attributable to an underweight to the short end of the curve as the yield curve steepened. |
| ↓ | Security selection in the health care, entertainment and technology industries. |
| ↓ | Underweight in wired and retail segments and overweight in the energy industry. |
| Franklin High Income Fund | PAGE 1 | 605-ATSR-1124 |
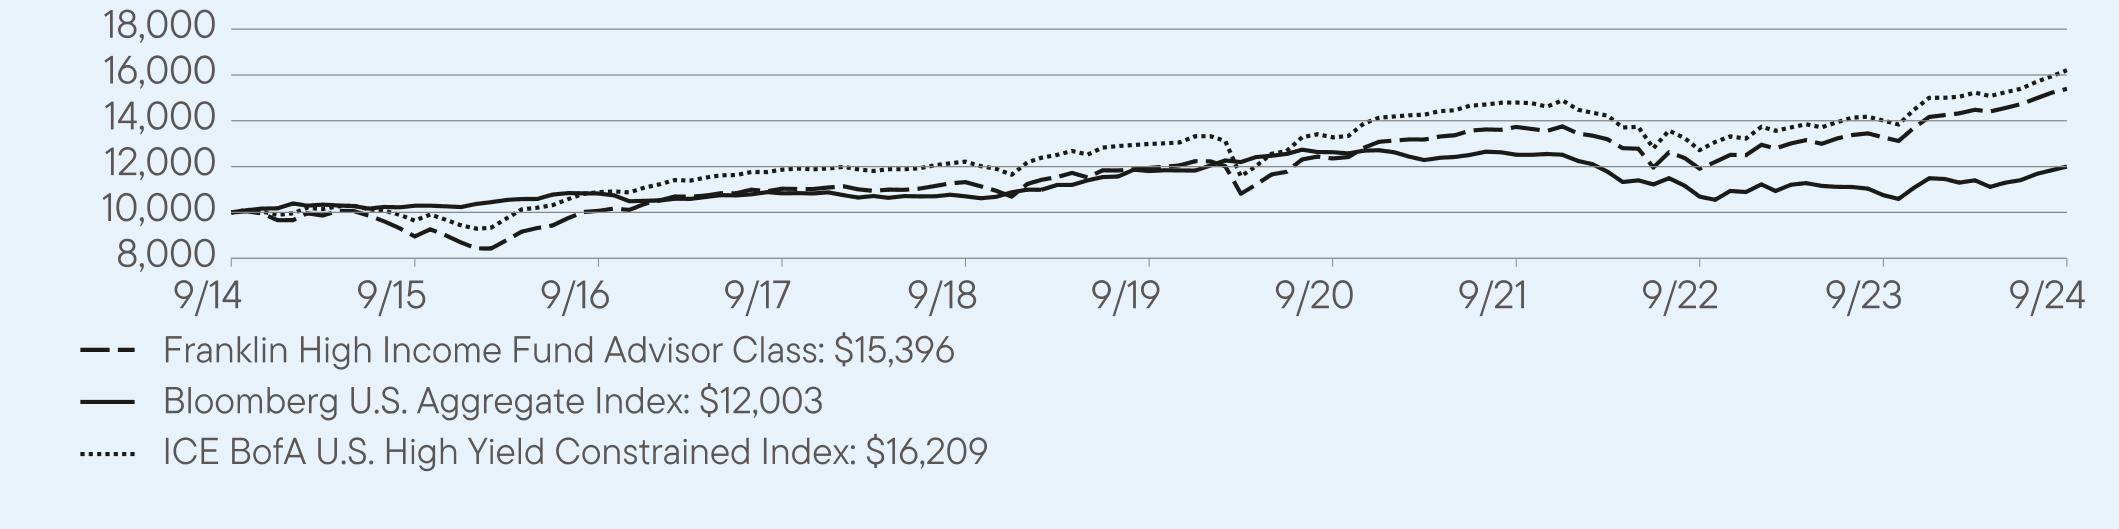
HOW DID THE FUND PERFORM OVER THE LAST 10 YEARS?
The Fund’s past performance is not necessarily an indication of how the Fund will perform in the future. The graph and table do not reflect the deduction of taxes that a shareholder would pay on Fund distributions or redemption of Fund shares.
VALUE OF A $10,000 INVESTMENT – Advisor Class 9/30/2014 — 9/30/2024
AVERAGE ANNUAL TOTAL RETURNS (%) Period Ended September 30, 2024
| | | |
| | 1 Year | 5 Year | 10 Year |
Advisor Class | 15.94 | 5.21 | 4.41 |
Bloomberg U.S. Aggregate Index | 11.57 | 0.33 | 1.84 |
ICE BofA U.S. High Yield Constrained Index | 15.67 | 4.53 | 4.95 |
Fund performance figures may reflect fee waivers and/or expense reimbursements, without which the performance would have been lower.
For current month-end performance, please call Franklin Templeton at (800) DIAL BEN/342-5236 or visit https://www.franklintempleton.com/investments/options/mutual-funds.
Important data provider notices and terms available at www.franklintempletondatasources.com.
KEY FUND STATISTICS (as of September 30, 2024)
| |
Total Net Assets | $2,813,899,954 |
Total Number of Portfolio Holdings* | 328 |
Total Management Fee Paid | $11,993,720 |
Portfolio Turnover Rate | 36.83% |
| * | Does not include derivatives, except purchased options, if any. |
WHAT DID THE FUND INVEST IN? (as of September 30, 2024)
Portfolio Composition* (% of Total Investments)
| * | Does not include derivatives, except purchased options, if any. |
| Franklin High Income Fund | PAGE 2 | 605-ATSR-1124 |
| |
| WHERE CAN I FIND ADDITIONAL INFORMATION ABOUT THE FUND? |
Additional information is available on https://www.franklintempleton.com/regulatory-fund-documents, including its: |
| • prospectus • proxy voting information • financial information • holdings • tax information |
HOUSEHOLDING
You will receive the Fund’s shareholder reports every six months. In addition, you will receive an annual updated summary prospectus (detail prospectus available upon request). To reduce Fund expenses, we try to identify related shareholders in a household and send only one copy of the shareholder reports and summary prospectus. This process, called “householding,” will continue indefinitely unless you instruct us otherwise. If you prefer not to have these documents householded, please call us at (800) DIAL BEN/342-5236. At any time, you may view current prospectuses/summary prospectuses and shareholder reports on our website. If you choose, you may receive these documents through electronic delivery.
| Franklin High Income Fund | PAGE 3 | 605-ATSR-1124 |
100008953100701103511324119421235613734119081327915396100001029310827108351070411806126301251710690107591200310000964610884118691221812988132761479812717140131620994.22.40.43.0
Item 2. Code of Ethics.
(a) The Registrant has adopted a code of ethics that applies to its principal executive officers and principal financial and accounting officer.
(c) N/A
(d) N/A
(f) Pursuant to Item 19(a)(1), the Registrant is attaching as an exhibit a copy of its code of ethics that applies to its principal executive officers and principal financial and accounting officer.
Item 3. Audit Committee Financial Expert.
(a) (1) The Registrant has an audit committee financial expert serving on its audit committee.
(2) The audit committee financial expert is Mary C. Choksi and she is "independent" as defined under the relevant Securities and Exchange Commission Rules and Releases.
Item 4. Principal Accountant Fees and Services.
(a) Audit Fees
The aggregate fees paid to the principal accountant for professional services rendered by the principal accountant for the audit of the registrant’s annual financial statements or for services that are normally provided by the principal accountant in connection with statutory and regulatory filings or engagements were $55,305 for the fiscal year ended September 30, 2024 and $51,771 for the fiscal year ended September 30, 2023.
(b) Audit-Related Fees
There were no fees paid to the principal accountant for assurance and related services rendered by the principal accountant to the registrant that are reasonably related to the performance of the audit of the registrant’s financial statements and are not reported under paragraph (a) of Item 4.
There were no fees paid to the principal accountant for assurance and related services rendered by the principal accountant to the registrant’s investment adviser and any entity controlling, controlled by or under common control with the investment adviser that provides ongoing services to the registrant that are reasonably related to the performance of the audit of their financial statements.
(c) Tax Fees
The aggregate fees paid to the principal accountant for professional services rendered by the principal accountant to the registrant for tax compliance, tax advice and tax planning were $0 for the fiscal year ended September 30, 2024 and $5,000 for the fiscal year ended September 30, 2023. The services for which these fees were paid included fees for tax compliance matters.
The aggregate fees paid to the principal accountant for professional services rendered by the principal accountant to the registrant’s investment adviser and any entity controlling, controlled by or under common control with the investment adviser that provides ongoing services to the registrant for tax compliance, tax advice and tax planning were $70,000 for the fiscal year ended September 30, 2024 and $140,000 for the fiscal year ended September 30, 2023. The services for which these fees were paid included global access to tax platform International Tax View.
(d) All Other Fees
The aggregate fees paid to the principal accountant for products and services rendered by the principal accountant to the registrant not reported in paragraphs (a)-(c) of Item 4 were $0 for the fiscal year ended September 30, 2024 and $ 1,258 for the fiscal year ended September 30, 2023. The services for which these fees were paid included review of materials provided to the fund Board in connection with the investment management contract renewal process.
The aggregate fees paid to the principal accountant for products and services rendered by the principal accountant to the registrant’s investment adviser and any entity controlling, controlled by or under common control with the investment adviser that provides ongoing services to the registrant not reported in paragraphs (a)-(c) of Item 4
were $163,638 for the fiscal year ended September 30, 2024 and $75,699 for the fiscal year ended September 30, 2023. The services for which these fees were paid included professional services relating to the readiness assessment over Greenhouse Gas Emissions and Energy, fees in connection with a license for accounting and business knowledge platform Viewpoint, and professional fees relating to security counts and professional fees in connection with Soc 1 Reports.
(e) (1) The registrant’s audit committee is directly responsible for approving the services to be provided by the auditors, including:
(i) pre-approval of all audit and audit related services;
(ii) pre-approval of all non-audit related services to be provided to the Fund by the auditors;
(iii) pre-approval of all non-audit related services to be provided to the registrant by the auditors to the registrant’s investment adviser or to any entity that controls, is controlled by or is under common control with the registrant’s investment adviser and that provides ongoing services to the registrant where the non-audit services relate directly to the operations or financial reporting of the registrant; and
(iv) establishment by the audit committee, if deemed necessary or appropriate, as an alternative to committee pre-approval of services to be provided by the auditors, as required by paragraphs (ii) and (iii) above, of policies and procedures to permit such services to be pre-approved by other means, such as through establishment of guidelines or by action of a designated member or members of the committee; provided the policies and procedures are detailed as to the particular service and the committee is informed of each service and such policies and procedures do not include delegation of audit committee responsibilities, as contemplated under the Securities Exchange Act of 1934, to management; subject, in the case of (ii) through (iv), to any waivers, exceptions or exemptions that may be available under applicable law or rules.
(e) (2) None of the services provided to the registrant described in paragraphs (b)-(d) of Item 4 were approved by the audit committee pursuant to paragraph (c)(7)(i)(C) of Rule 2-01 of regulation S-X.
(f) No disclosures are required by this Item 4(f).
(g) The aggregate non-audit fees paid to the principal accountant for services rendered by the principal accountant to the registrant and the registrant’s investment adviser and any entity controlling, controlled by or under common control with the investment adviser that provides ongoing services to the registrant were $233,638 for the fiscal year ended September 30, 2024 and $221,957 for the fiscal year ended September 30, 2023.
(h) The registrant’s audit committee of the board has considered whether the provision of non-audit services that were rendered to the registrant’s investment adviser (not including any sub-adviser whose role is primarily portfolio management and is subcontracted with or overseen by another investment adviser), and any entity controlling, controlled by, or under common control with the investment adviser that provides ongoing services to the registrant that were not pre-approved pursuant to paragraph (c)(7)(ii) of Rule 2-01 of Regulation S-X is compatible with maintaining the principal accountant’s independence.
(i) N/A
(j) N/A
Item 5. Audit Committee of Listed Registrants. N/A
Item 6. Schedule of Investments.
(a) Please see schedule of investments contained in the Financial Statements and Financial Highlights included under Item 7 of this Form N-CSR.
(b) N/A
Item 7. Financial Statements and Financial Highlights for Open-End Management Investment Companies.
Franklin
High
Income
Fund
Financial
Statements
and
Other
Important
Information
Annual
|
September
30,
2024
Financial
Statements
and
Other
Important
Information—Annual
Financial
Highlights
and
Schedule
of
Investments
2
Financial
Statements
21
Notes
to
Financial
Statements
25
Report
of
Independent
Registered
Public
Accounting
Firm
36
Tax
Information
37
Changes
In
and
Disagreements
with
Accountants
38
Results
of
Meeting(s)
of
Shareholders
38
Remuneration
Paid
to
Directors,
Officers
and
Others
38
Board
Approval
of
Management
and
Subadvisory
Agreements
38
Financial
Highlights
Franklin
High
Income
Fund
Annual
Report
The
accompanying
notes
are
an
integral
part
of
these
financial
statements.
a
Year
Ended
September
30,
Year
Ended
September
30,
2022
a
Year
Ended
May
31,
2024
2023
2022
2021
2020
Class
A
Per
share
operating
performance
(for
a
share
outstanding
throughout
the
year)
Net
asset
value,
beginning
of
year
.......
$1.62
$1.54
$1.69
$1.87
$1.72
$1.80
Income
from
investment
operations
b
:
Net
investment
income
c
.............
0.11
0.10
0.03
0.08
0.09
0.09
Net
realized
and
unrealized
gains
(losses)
0.13
0.08
(0.15)
(0.17)
0.16
(0.07)
Total
from
investment
operations
........
0.24
0.18
(0.12)
(0.09)
0.25
0.02
Less
distributions
from:
Net
investment
income
..............
(0.11)
(0.10)
(0.03)
(0.09)
(0.10)
(0.10)
Net
asset
value,
end
of
year
...........
$1.75
$1.62
$1.54
$1.69
$1.87
$1.72
Total
return
d
.......................
15.13%
12.06%
(7.03)%
(5.15)%
14.52%
0.88%
Ratios
to
average
net
assets
e
Expenses
before
waiver
and
payments
by
affiliates
..........................
0.84%
0.86%
0.88%
0.87%
0.86%
0.86%
Expenses
net
of
waiver
and
payments
by
affiliates
..........................
0.83%
0.85%
f
0.87%
f
0.87%
f,g
0.85%
f
0.86%
f,g
Net
investment
income
...............
6.26%
6.05%
6.02%
4.66%
5.10%
5.19%
Supplemental
data
Net
assets,
end
of
year
(000’s)
.........
$886,357
$713,381
$642,620
$689,210
$553,316
$309,844
Portfolio
turnover
rate
................
36.83%
34.60%
4.96%
31.57%
55.37%
38.87%
a
For
the
period
June
1,
2022
to
September
30,
2022.
b
The
amount
shown
for
a
share
outstanding
throughout
the
period
may
not
correlate
with
the
Statement
of
Operations
for
the
period
due
to
the
timing
of
sales
and
repurchases
of
the
Fund’s
shares
in
relation
to
income
earned
and/or
fluctuating
fair
value
of
the
investments
of
the
Fund.
c
Based
on
average
daily
shares
outstanding.
d
Total
return
does
not
reflect
sales
commissions
or
contingent
deferred
sales
charges,
if
applicable,
and
is
not
annualized
for
periods
less
than
one
year.
e
Ratios
are
annualized
for
periods
less
than
one
year.
f
Benefit
of
expense
reduction
rounds
to
less
than
0.01%.
g
Benefit
of
waiver
and
payments
by
affiliates
rounds
to
less
than
0.01%.
Franklin
High
Income
Trust
Financial
Highlights
Franklin
High
Income
Fund
(continued)
The
accompanying
notes
are
an
integral
part
of
these
financial
statements.
Annual
Report
a
Year
Ended
September
30,
Year
Ended
September
30,
2022
a
Year
Ended
May
31,
2024
2023
2022
2021
2020
Class
A1
Per
share
operating
performance
(for
a
share
outstanding
throughout
the
year)
Net
asset
value,
beginning
of
year
.......
$1.64
$1.56
$1.71
$1.88
$1.73
$1.81
Income
from
investment
operations
b
:
Net
investment
income
c
.............
0.11
0.10
0.03
0.09
0.10
0.10
Net
realized
and
unrealized
gains
(losses)
0.13
0.08
(0.15)
(0.17)
0.15
(0.08)
Total
from
investment
operations
........
0.24
0.18
(0.12)
(0.08)
0.25
0.02
Less
distributions
from:
Net
investment
income
..............
(0.11)
(0.10)
(0.03)
(0.09)
(0.10)
(0.10)
Net
asset
value,
end
of
year
...........
$1.77
$1.64
$1.56
$1.71
$1.88
$1.73
Total
return
d
.......................
15.06%
12.02%
(6.90)%
(4.51)%
14.52%
0.95%
Ratios
to
average
net
assets
e
Expenses
before
waiver
and
payments
by
affiliates
..........................
0.74%
0.76%
0.78%
0.77%
0.76%
0.76%
Expenses
net
of
waiver
and
payments
by
affiliates
..........................
0.73%
0.75%
f
0.77%
f
0.76%
f
0.76%
f,g
0.76%
f,g
Net
investment
income
...............
6.35%
6.15%
6.12%
4.74%
5.18%
5.29%
Supplemental
data
Net
assets,
end
of
year
(000’s)
.........
$1,288,613
$1,276,764
$1,311,893
$1,483,888
$1,758,443
$1,759,206
Portfolio
turnover
rate
................
36.83%
34.60%
4.96%
31.57%
55.37%
38.87%
a
For
the
period
June
1,
2022
to
September
30,
2022.
b
The
amount
shown
for
a
share
outstanding
throughout
the
period
may
not
correlate
with
the
Statement
of
Operations
for
the
period
due
to
the
timing
of
sales
and
repurchases
of
the
Fund’s
shares
in
relation
to
income
earned
and/or
fluctuating
fair
value
of
the
investments
of
the
Fund.
c
Based
on
average
daily
shares
outstanding.
d
Total
return
does
not
reflect
sales
commissions
or
contingent
deferred
sales
charges,
if
applicable,
and
is
not
annualized
for
periods
less
than
one
year.
e
Ratios
are
annualized
for
periods
less
than
one
year.
f
Benefit
of
expense
reduction
rounds
to
less
than
0.01%.
g
Benefit
of
waiver
and
payments
by
affiliates
rounds
to
less
than
0.01%.
Franklin
High
Income
Trust
Financial
Highlights
Franklin
High
Income
Fund
(continued)
Annual
Report
The
accompanying
notes
are
an
integral
part
of
these
financial
statements.
a
Year
Ended
September
30,
Year
Ended
September
30,
2022
a
Year
Ended
May
31,
2024
2023
2022
2021
2020
Class
C
Per
share
operating
performance
(for
a
share
outstanding
throughout
the
year)
Net
asset
value,
beginning
of
year
.......
$1.66
$1.58
$1.74
$1.91
$1.76
$1.83
Income
from
investment
operations
b
:
Net
investment
income
c
.............
0.10
0.09
0.03
0.08
0.09
0.09
Net
realized
and
unrealized
gains
(losses)
0.14
0.09
(0.16)
(0.17)
0.15
(0.07)
Total
from
investment
operations
........
0.24
0.18
(0.13)
(0.09)
0.24
0.02
Less
distributions
from:
Net
investment
income
..............
(0.10)
(0.10)
(0.03)
(0.08)
(0.09)
(0.09)
Net
asset
value,
end
of
year
...........
$1.80
$1.66
$1.58
$1.74
$1.91
$1.76
Total
return
d
.......................
14.87%
11.25%
(7.53)%
(4.93)%
13.69%
0.99%
Ratios
to
average
net
assets
e
Expenses
before
waiver
and
payments
by
affiliates
..........................
1.24%
1.26%
1.28%
1.26%
1.26%
1.26%
Expenses
net
of
waiver
and
payments
by
affiliates
..........................
1.23%
1.25%
f
1.27%
f
1.26%
f,g
1.26%
f,g
1.26%
f,g
Net
investment
income
...............
5.85%
5.64%
5.63%
4.22%
4.68%
4.79%
Supplemental
data
Net
assets,
end
of
year
(000’s)
.........
$77,858
$77,923
$98,923
$119,630
$220,646
$251,930
Portfolio
turnover
rate
................
36.83%
34.60%
4.96%
31.57%
55.37%
38.87%
a
For
the
period
June
1,
2022
to
September
30,
2022.
b
The
amount
shown
for
a
share
outstanding
throughout
the
period
may
not
correlate
with
the
Statement
of
Operations
for
the
period
due
to
the
timing
of
sales
and
repurchases
of
the
Fund’s
shares
in
relation
to
income
earned
and/or
fluctuating
fair
value
of
the
investments
of
the
Fund.
c
Based
on
average
daily
shares
outstanding.
d
Total
return
does
not
reflect
sales
commissions
or
contingent
deferred
sales
charges,
if
applicable,
and
is
not
annualized
for
periods
less
than
one
year.
e
Ratios
are
annualized
for
periods
less
than
one
year.
f
Benefit
of
expense
reduction
rounds
to
less
than
0.01%.
g
Benefit
of
waiver
and
payments
by
affiliates
rounds
to
less
than
0.01%.
Franklin
High
Income
Trust
Financial
Highlights
Franklin
High
Income
Fund
(continued)
The
accompanying
notes
are
an
integral
part
of
these
financial
statements.
Annual
Report
a
Year
Ended
September
30,
Year
Ended
September
30,
2022
a
Year
Ended
May
31,
2024
2023
2022
2021
2020
Class
R
Per
share
operating
performance
(for
a
share
outstanding
throughout
the
year)
Net
asset
value,
beginning
of
year
.......
$1.68
$1.59
$1.75
$1.92
$1.77
$1.84
Income
from
investment
operations
b
:
Net
investment
income
c
.............
0.11
0.10
0.03
0.08
0.09
0.09
Net
realized
and
unrealized
gains
(losses)
0.13
0.09
(0.16)
(0.17)
0.15
(0.07)
Total
from
investment
operations
........
0.24
0.19
(0.13)
(0.09)
0.24
0.02
Less
distributions
from:
Net
investment
income
..............
(0.10)
(0.10)
(0.03)
(0.08)
(0.09)
(0.09)
Net
asset
value,
end
of
year
...........
$1.82
$1.68
$1.59
$1.75
$1.92
$1.77
Total
return
d
.......................
14.88%
12.01%
(7.44)%
(4.75)%
13.78%
1.14%
Ratios
to
average
net
assets
e
Expenses
before
waiver
and
payments
by
affiliates
..........................
1.09%
1.11%
1.13%
1.12%
1.11%
1.11%
Expenses
net
of
waiver
and
payments
by
affiliates
..........................
1.08%
1.10%
f
1.12%
f
1.11%
f
1.11%
f,g
1.11%
f,g
Net
investment
income
...............
6.00%
5.80%
5.77%
4.39%
4.83%
4.94%
Supplemental
data
Net
assets,
end
of
year
(000’s)
.........
$59,229
$57,051
$57,909
$64,250
$74,532
$77,148
Portfolio
turnover
rate
................
36.83%
34.60%
4.96%
31.57%
55.37%
38.87%
a
For
the
period
June
1,
2022
to
September
30,
2022.
b
The
amount
shown
for
a
share
outstanding
throughout
the
period
may
not
correlate
with
the
Statement
of
Operations
for
the
period
due
to
the
timing
of
sales
and
repurchases
of
the
Fund’s
shares
in
relation
to
income
earned
and/or
fluctuating
fair
value
of
the
investments
of
the
Fund.
c
Based
on
average
daily
shares
outstanding.
d
Total
return
is
not
annualized
for
periods
less
than
one
year.
e
Ratios
are
annualized
for
periods
less
than
one
year.
f
Benefit
of
expense
reduction
rounds
to
less
than
0.01%.
g
Benefit
of
waiver
and
payments
by
affiliates
rounds
to
less
than
0.01%.
Franklin
High
Income
Trust
Financial
Highlights
Franklin
High
Income
Fund
(continued)
Annual
Report
The
accompanying
notes
are
an
integral
part
of
these
financial
statements.
a
Year
Ended
September
30,
Year
Ended
September
30,
2022
a
Year
Ended
May
31,
2024
2023
2022
2021
2020
Class
R6
Per
share
operating
performance
(for
a
share
outstanding
throughout
the
year)
Net
asset
value,
beginning
of
year
.......
$1.63
$1.55
$1.71
$1.88
$1.73
$1.80
Income
from
investment
operations
b
:
Net
investment
income
c
.............
0.11
0.10
0.03
0.09
0.10
0.10
Net
realized
and
unrealized
gains
(losses)
0.13
0.09
(0.16)
(0.17)
0.15
(0.07)
Total
from
investment
operations
........
0.24
0.19
(0.13)
(0.08)
0.25
0.03
Less
distributions
from:
Net
investment
income
..............
(0.11)
(0.11)
(0.03)
(0.09)
(0.10)
(0.10)
Net
asset
value,
end
of
year
...........
$1.76
$1.63
$1.55
$1.71
$1.88
$1.73
Total
return
d
.......................
15.44%
12.37%
(7.42)%
(4.24)%
14.82%
1.80%
Ratios
to
average
net
assets
e
Expenses
before
waiver
and
payments
by
affiliates
..........................
0.51%
0.53%
0.55%
0.55%
0.54%
0.55%
Expenses
net
of
waiver
and
payments
by
affiliates
..........................
0.49%
0.49%
f
0.50%
f
0.51%
f
0.51%
f
0.50%
f
Net
investment
income
...............
6.59%
6.42%
6.39%
5.01%
5.39%
5.55%
Supplemental
data
Net
assets,
end
of
year
(000’s)
.........
$203,691
$115,142
$90,344
$98,282
$88,257
$66,681
Portfolio
turnover
rate
................
36.83%
34.60%
4.96%
31.57%
55.37%
38.87%
a
For
the
period
June
1,
2022
to
September
30,
2022.
b
The
amount
shown
for
a
share
outstanding
throughout
the
period
may
not
correlate
with
the
Statement
of
Operations
for
the
period
due
to
the
timing
of
sales
and
repurchases
of
the
Fund’s
shares
in
relation
to
income
earned
and/or
fluctuating
fair
value
of
the
investments
of
the
Fund.
c
Based
on
average
daily
shares
outstanding.
d
Total
return
is
not
annualized
for
periods
less
than
one
year.
e
Ratios
are
annualized
for
periods
less
than
one
year.
f
Benefit
of
expense
reduction
rounds
to
less
than
0.01%.
Franklin
High
Income
Trust
Financial
Highlights
Franklin
High
Income
Fund
(continued)
The
accompanying
notes
are
an
integral
part
of
these
financial
statements.
Annual
Report
a
Year
Ended
September
30,
Year
Ended
September
30,
2022
a
Year
Ended
May
31,
2024
2023
2022
2021
2020
Advisor
Class
Per
share
operating
performance
(for
a
share
outstanding
throughout
the
year)
Net
asset
value,
beginning
of
year
.......
$1.63
$1.56
$1.71
$1.88
$1.73
$1.81
Income
from
investment
operations
b
:
Net
investment
income
c
.............
0.11
0.10
0.03
0.09
0.10
0.10
Net
realized
and
unrealized
gains
(losses)
0.14
0.08
(0.15)
(0.17)
0.15
(0.08)
Total
from
investment
operations
........
0.25
0.18
(0.12)
(0.08)
0.25
0.02
Less
distributions
from:
Net
investment
income
..............
(0.11)
(0.11)
(0.03)
(0.09)
(0.10)
(0.10)
Net
asset
value,
end
of
year
...........
$1.77
$1.63
$1.56
$1.71
$1.88
$1.73
Total
return
d
.......................
15.94%
11.52%
(6.86)%
(4.37)%
14.68%
1.12%
Ratios
to
average
net
assets
e
Expenses
before
waiver
and
payments
by
affiliates
..........................
0.59%
0.61%
0.63%
0.62%
0.61%
0.61%
Expenses
net
of
waiver
and
payments
by
affiliates
..........................
0.58%
0.60%
f
0.62%
f
0.61%
f
0.61%
f,g
0.61%
f,g
Net
investment
income
...............
6.51%
6.31%
6.32%
4.89%
5.34%
5.44%
Supplemental
data
Net
assets,
end
of
year
(000’s)
.........
$298,151
$295,183
$257,358
$353,786
$341,889
$299,110
Portfolio
turnover
rate
................
36.83%
34.60%
4.96%
31.57%
55.37%
38.87%
a
For
the
period
June
1,
2022
to
September
30,
2022.
b
The
amount
shown
for
a
share
outstanding
throughout
the
period
may
not
correlate
with
the
Statement
of
Operations
for
the
period
due
to
the
timing
of
sales
and
repurchases
of
the
Fund’s
shares
in
relation
to
income
earned
and/or
fluctuating
fair
value
of
the
investments
of
the
Fund.
c
Based
on
average
daily
shares
outstanding.
d
Total
return
is
not
annualized
for
periods
less
than
one
year.
e
Ratios
are
annualized
for
periods
less
than
one
year.
f
Benefit
of
expense
reduction
rounds
to
less
than
0.01%.
g
Benefit
of
waiver
and
payments
by
affiliates
rounds
to
less
than
0.01%.
Schedule
of
Investments,
September
30,
2024
Franklin
High
Income
Fund
Annual
Report
The
accompanying
notes
are
an
integral
part
of
these
financial
statements.
a
a
Country
Shares
a
Value
a
a
a
a
a
a
Common
Stocks
0.4%
Metals
&
Mining
0.1%
Alpha
Metallurgical
Resources,
Inc.
......................
United
States
4,346
$
1,026,438
Oil,
Gas
&
Consumable
Fuels
0.2%
a
Amplify
Energy
Corp.
................................
United
States
8,816
57,568
Birch
Permian
Holdings,
Inc.
...........................
United
States
690,410
4,983,725
California
Resources
Corp.
............................
United
States
1,425
74,770
5,116,063
Pharmaceuticals
0.1%
a
Endo,
Inc.
.........................................
United
States
144,894
3,691,899
Specialty
Retail
0.0%
a,b
Party
City
Holdco,
Inc.
................................
United
States
75
—
Total
Common
Stocks
(Cost
$
28,672,386
)
....................................
9,834,400
Warrants
Warrants
0.0%
†
Oil,
Gas
&
Consumable
Fuels
0.0%
†
a
California
Resources
Corp.
,
10/27/24
....................
United
States
3,278
54,972
a,b
Canvas
Energy,
Inc.
,
10/01/24
..........................
United
States
13
—
a,b
Canvas
Energy,
Inc.
,
10/01/25
..........................
United
States
13
—
54,972
Total
Warrants
(Cost
$
–
)
....................................................
54,972
Principal
Amount
*
Corporate
Bonds
93.7%
Aerospace
&
Defense
1.7%
c
Boeing
Co.
(The)
,
Senior
Bond
,
144A,
6.528
%
,
5/01/34
.......
United
States
3,200,000
3,435,655
c
Bombardier,
Inc.
,
Senior
Note
,
144A,
7
%
,
6/01/32
...........
Canada
17,000,000
17,802,162
c
TransDigm,
Inc.
,
Senior
Secured
Note
,
144A,
6.625
%
,
3/01/32
............
United
States
7,500,000
7,819,440
Senior
Secured
Note
,
144A,
6
%
,
1/15/33
................
United
States
19,600,000
19,892,331
48,949,588
Automobile
Components
2.5%
c
Adient
Global
Holdings
Ltd.
,
Senior
Note
,
144A,
8.25
%
,
4/15/31
....................
United
States
13,100,000
13,913,840
Senior
Secured
Note
,
144A,
7
%
,
4/15/28
................
United
States
7,900,000
8,143,968
c
Allison
Transmission,
Inc.
,
Senior
Bond
,
144A,
3.75
%
,
1/30/31
.
United
States
5,400,000
4,913,673
c
Dornoch
Debt
Merger
Sub,
Inc.
,
Senior
Note
,
144A,
6.625
%
,
10/15/29
........................................
United
States
19,500,000
17,184,108
c
Garrett
Motion
Holdings,
Inc.
/
Garrett
LX
I
SARL
,
Senior
Note
,
144A,
7.75
%
,
5/31/32
...............................
United
States
12,000,000
12,289,872
Goodyear
Tire
&
Rubber
Co.
(The)
,
Senior
Note
,
5
%
,
7/15/29
..
United
States
1,300,000
1,196,693
c
ZF
North
America
Capital,
Inc.
,
Senior
Note
,
144A,
6.75
%
,
4/23/30
....................
Germany
3,900,000
3,935,818
Senior
Note
,
144A,
6.875
%
,
4/23/32
...................
Germany
8,400,000
8,434,885
70,012,857
Automobiles
0.6%
c
Jaguar
Land
Rover
Automotive
plc
,
Senior
Note
,
144A,
5.5
%
,
7/15/29
.........................................
United
Kingdom
18,400,000
18,196,181
Franklin
High
Income
Trust
Schedule
of
Investments
Franklin
High
Income
Fund
(continued)
The
accompanying
notes
are
an
integral
part
of
these
financial
statements.
Annual
Report
a
a
Country
Principal
Amount
*
a
Value
a
a
a
a
a
Corporate
Bonds
(continued)
Beverages
0.4%
c
Primo
Water
Holdings,
Inc.
,
Senior
Note
,
144A,
4.375
%
,
4/30/29
Canada
11,500,000
$
11,037,896
Biotechnology
0.3%
c
Grifols
SA
,
Senior
Note
,
144A,
4.75
%
,
10/15/28
............
Spain
10,000,000
9,375,595
Broadline
Retail
0.1%
c
,d
Wayfair
LLC
,
Senior
Secured
Note
,
144A,
7.25
%
,
10/31/29
....
United
States
3,800,000
3,902,449
Building
Products
2.5%
c
Advanced
Drainage
Systems,
Inc.
,
Senior
Note
,
144A,
6.375
%
,
6/15/30
.........................................
United
States
2,900,000
2,965,073
c
Cornerstone
Building
Brands,
Inc.
,
Senior
Note
,
144A,
6.125
%
,
1/15/29
.........................................
United
States
2,000,000
1,771,594
c
EMRLD
Borrower
LP
/
Emerald
Co-Issuer,
Inc.
,
Senior
Secured
Note
,
144A,
6.625
%
,
12/15/30
........................
United
States
25,400,000
26,221,563
c
Miter
Brands
Acquisition
Holdco,
Inc.
/
MIWD
Borrower
LLC
,
Senior
Secured
Note
,
144A,
6.75
%
,
4/01/32
..............
United
States
9,300,000
9,646,434
c
Smyrna
Ready
Mix
Concrete
LLC
,
Senior
Secured
Note
,
144A,
8.875
%
,
11/15/31
..................................
United
States
20,900,000
22,565,282
c
Standard
Building
Solutions,
Inc.
,
Senior
Note
,
144A,
6.5
%
,
8/15/32
.........................................
United
States
6,500,000
6,735,943
69,905,889
Capital
Markets
0.5%
c
Jane
Street
Group
/
JSG
Finance,
Inc.
,
Senior
Secured
Note
,
144A,
4.5
%
,
11/15/29
...............................
United
States
6,100,000
5,876,462
c
StoneX
Group,
Inc.
,
Senior
Secured
Note
,
144A,
7.875
%
,
3/01/31
United
States
8,600,000
9,164,598
15,041,060
Chemicals
3.3%
b
,c
,e
,f
Anagram
Holdings
LLC
/
Anagram
International,
Inc.
,
Secured
Note
,
144A,
PIK,
10
%
,
8/15/26
........................
United
States
1,891,272
—
c
Avient
Corp.
,
Senior
Note
,
144A,
6.25
%
,
11/01/31
...........
United
States
5,200,000
5,334,826
c
Braskem
Idesa
SAPI
,
Senior
Secured
Bond
,
144A,
6.99
%
,
2/20/32
.........................................
Mexico
4,100,000
3,234,407
c
,d
Cerdia
Finanz
GmbH
,
Senior
Secured
Note
,
144A,
9.375
%
,
10/03/31
........................................
Germany
8,700,000
8,895,750
c
Consolidated
Energy
Finance
SA
,
Senior
Note
,
144A,
5.625
%
,
10/15/28
........................................
Switzerland
12,700,000
10,748,780
c
Element
Solutions,
Inc.
,
Senior
Note
,
144A,
3.875
%
,
9/01/28
...
United
States
4,200,000
4,007,586
c
GPD
Cos.,
Inc.
,
Senior
Secured
Note
,
144A,
10.125
%
,
4/01/26
.
United
States
19,500,000
18,055,163
c
,e
Kobe
US
Midco
2,
Inc.
,
Senior
Note
,
144A,
PIK,
9.25
%
,
11/01/26
United
States
5,292,000
4,432,050
c
Rain
Carbon,
Inc.
,
Senior
Secured
Note
,
144A,
12.25
%
,
9/01/29
United
States
24,000,000
25,952,328
c
Rain
CII
Carbon
LLC
/
CII
Carbon
Corp.
,
Secured
Note
,
144A,
7.25
%
,
4/01/25
...................................
United
States
313,000
309,950
c
Vibrantz
Technologies,
Inc.
,
Senior
Note
,
144A,
9
%
,
2/15/30
...
United
States
11,800,000
11,036,239
92,007,079
Commercial
Services
&
Supplies
2.7%
c
Allied
Universal
Holdco
LLC
,
Senior
Secured
Note
,
144A,
7.875
%
,
2/15/31
...................................
United
States
12,000,000
12,268,164
c
APX
Group,
Inc.
,
Senior
Note
,
144A,
5.75
%
,
7/15/29
.........
United
States
15,300,000
15,163,574
c
Prime
Security
Services
Borrower
LLC
/
Prime
Finance,
Inc.
,
Senior
Secured
Note
,
144A,
3.375
%
,
8/31/27
.............
United
States
16,100,000
15,312,579
c
RR
Donnelley
&
Sons
Co.
,
Senior
Secured
Note
,
144A,
9.5
%
,
8/01/29
.........................................
United
States
10,700,000
10,802,132
c
VM
Consolidated,
Inc.
,
Senior
Note
,
144A,
5.5
%
,
4/15/29
.....
United
States
8,800,000
8,729,856
Franklin
High
Income
Trust
Schedule
of
Investments
Franklin
High
Income
Fund
(continued)
Annual
Report
The
accompanying
notes
are
an
integral
part
of
these
financial
statements.
a
a
Country
Principal
Amount
*
a
Value
a
a
a
a
a
Corporate
Bonds
(continued)
Commercial
Services
&
Supplies
(continued)
c
Wrangler
Holdco
Corp.
,
Senior
Note
,
144A,
6.625
%
,
4/01/32
...
Canada
12,100,000
$
12,587,569
74,863,874
Communications
Equipment
0.5%
c
CommScope
LLC
,
Senior
Note
,
144A,
7.125
%
,
7/01/28
...................
United
States
11,700,000
9,713,532
Senior
Secured
Note
,
144A,
6
%
,
3/01/26
................
United
States
2,500,000
2,434,375
c
CommScope
Technologies
LLC
,
Senior
Bond
,
144A,
6
%
,
6/15/25
United
States
1,635,000
1,583,906
13,731,813
Construction
&
Engineering
0.3%
c
Arcosa,
Inc.
,
Senior
Note
,
144A,
4.375
%
,
4/15/29
...................
United
States
5,400,000
5,195,332
Senior
Note
,
144A,
6.875
%
,
8/15/32
...................
United
States
3,300,000
3,456,433
8,651,765
Consumer
Finance
2.8%
c
Encore
Capital
Group,
Inc.
,
Senior
Secured
Note
,
144A,
9.25
%
,
4/01/29
.............
United
States
3,400,000
3,662,482
Senior
Secured
Note
,
144A,
8.5
%
,
5/15/30
..............
United
States
9,200,000
9,704,684
c
FirstCash,
Inc.
,
Senior
Note
,
144A,
6.875
%
,
3/01/32
.........
United
States
19,300,000
19,886,160
c
Macquarie
Airfinance
Holdings
Ltd.
,
Senior
Note
,
144A,
6.4
%
,
3/26/29
.....................
United
Kingdom
2,150,000
2,239,275
Senior
Note
,
144A,
6.5
%
,
3/26/31
.....................
United
Kingdom
2,900,000
3,063,032
OneMain
Finance
Corp.
,
Senior
Bond
,
5.375
%
,
11/15/29
.......................
United
States
7,600,000
7,309,772
Senior
Note
,
6.625
%
,
1/15/28
........................
United
States
4,400,000
4,483,380
Senior
Note
,
9
%
,
1/15/29
...........................
United
States
7,300,000
7,741,774
Senior
Note
,
7.125
%
,
11/15/31
.......................
United
States
6,400,000
6,481,658
c
PROG
Holdings,
Inc.
,
Senior
Note
,
144A,
6
%
,
11/15/29
.......
United
States
15,000,000
14,810,605
79,382,822
Consumer
Staples
Distribution
&
Retail
0.4%
c
US
Foods,
Inc.
,
Senior
Note
,
144A,
7.25
%
,
1/15/32
....................
United
States
7,200,000
7,629,084
d
Senior
Note
,
144A,
5.75
%
,
4/15/33
....................
United
States
3,300,000
3,311,792
10,940,876
Containers
&
Packaging
3.3%
c
Ardagh
Packaging
Finance
plc
/
Ardagh
Holdings
USA,
Inc.
,
Senior
Note
,
144A,
5.25
%
,
8/15/27
.....................
United
States
8,100,000
6,045,559
c
Mauser
Packaging
Solutions
Holding
Co.
,
Secured
Note
,
144A,
9.25
%
,
4/15/27
...................
United
States
30,000,000
30,789,270
Senior
Secured
Note
,
144A,
7.875
%
,
4/15/27
............
United
States
10,500,000
10,861,489
c
OI
European
Group
BV
,
Senior
Note
,
144A,
4.75
%
,
2/15/30
....
United
States
9,800,000
9,276,055
c
Owens-Brockway
Glass
Container,
Inc.
,
Senior
Note
,
144A,
6.625
%
,
5/13/27
...................
United
States
3,961,000
3,983,332
Senior
Note
,
144A,
7.25
%
,
5/15/31
....................
United
States
3,500,000
3,600,037
c
Pactiv
Evergreen
Group
Issuer
LLC
/
Pactiv
Evergreen
Group
Issuer,
Inc.
,
Senior
Secured
Note
,
144A,
4.375
%
,
10/15/28
...
United
States
2,800,000
2,684,596
c
Pactiv
Evergreen
Group
Issuer,
Inc.
/
Pactiv
Evergreen
Group
Issuer
LLC
,
Senior
Secured
Note
,
144A,
4
%
,
10/15/27
......
United
States
20,800,000
20,019,432
c
Trivium
Packaging
Finance
BV
,
Senior
Note
,
144A,
8.5
%
,
8/15/27
.....................
Netherlands
2,100,000
2,107,113
Franklin
High
Income
Trust
Schedule
of
Investments
Franklin
High
Income
Fund
(continued)
The
accompanying
notes
are
an
integral
part
of
these
financial
statements.
Annual
Report
a
a
Country
Principal
Amount
*
a
Value
a
a
a
a
a
Corporate
Bonds
(continued)
Containers
&
Packaging
(continued)
c
Trivium
Packaging
Finance
BV,
(continued)
Senior
Secured
Note
,
144A,
5.5
%
,
8/15/26
..............
Netherlands
3,600,000
$
3,589,143
92,956,026
Distributors
0.7%
c
Gates
Corp.
,
Senior
Note
,
144A,
6.875
%
,
7/01/29
...........
United
States
4,800,000
4,978,099
c
Ritchie
Bros
Holdings,
Inc.
,
Senior
Note
,
144A,
7.75
%
,
3/15/31
....................
Canada
6,500,000
6,930,690
Senior
Secured
Note
,
144A,
6.75
%
,
3/15/28
.............
Canada
6,300,000
6,521,048
18,429,837
Diversified
Consumer
Services
0.5%
Grand
Canyon
University
,
Secured
Note
,
5.125
%
,
10/01/28
....
United
States
14,300,000
13,436,852
Diversified
REITs
1.5%
c
Global
Net
Lease,
Inc.
/
Global
Net
Lease
Operating
Partnership
LP
,
Senior
Note
,
144A,
3.75
%
,
12/15/27
.................
United
States
15,900,000
14,835,896
c
Necessity
Retail
REIT,
Inc.
(The)
/
American
Finance
Operating
Partner
LP
,
Senior
Note
,
144A,
4.5
%
,
9/30/28
.............
United
States
14,500,000
13,620,275
c
VICI
Properties
LP
/
VICI
Note
Co.,
Inc.
,
Senior
Note
,
144A,
3.75
%
,
2/15/27
....................
United
States
8,000,000
7,809,106
Senior
Note
,
144A,
3.875
%
,
2/15/29
...................
United
States
7,000,000
6,710,061
42,975,338
Diversified
Telecommunication
Services
2.1%
c
Altice
France
SA
,
Senior
Secured
Note
,
144A,
5.5
%
,
1/15/28
..
France
7,500,000
5,460,273
c
CCO
Holdings
LLC
/
CCO
Holdings
Capital
Corp.
,
Senior
Bond
,
144A,
5
%
,
2/01/28
......................
United
States
3,000,000
2,920,507
Senior
Bond
,
144A,
5.375
%
,
6/01/29
...................
United
States
10,900,000
10,512,865
Senior
Bond
,
144A,
4.5
%
,
8/15/30
.....................
United
States
10,500,000
9,525,679
Senior
Bond
,
144A,
4.25
%
,
2/01/31
....................
United
States
3,400,000
3,000,090
Senior
Note
,
144A,
6.375
%
,
9/01/29
...................
United
States
8,000,000
8,015,080
c
Iliad
Holding
SASU
,
Senior
Secured
Note
,
144A,
6.5
%
,
10/15/26
.............
France
2,000,000
2,023,342
Senior
Secured
Note
,
144A,
7
%
,
10/15/28
...............
France
10,400,000
10,588,885
c
Virgin
Media
Secured
Finance
plc
,
Senior
Secured
Bond
,
144A,
4.5
%
,
8/15/30
....................................
United
Kingdom
6,900,000
6,143,420
58,190,141
Electric
Utilities
1.0%
c
Vistra
Operations
Co.
LLC
,
Senior
Note
,
144A,
5.625
%
,
2/15/27
...................
United
States
9,300,000
9,292,620
Senior
Note
,
144A,
7.75
%
,
10/15/31
...................
United
States
8,700,000
9,373,102
Senior
Note
,
144A,
6.875
%
,
4/15/32
...................
United
States
8,700,000
9,158,908
27,824,630
Electrical
Equipment
1.2%
Regal
Rexnord
Corp.
,
Senior
Note
,
6.3
%
,
2/15/30
..........................
United
States
9,700,000
10,322,610
Senior
Note
,
6.4
%
,
4/15/33
..........................
United
States
7,900,000
8,454,693
c
Vertiv
Group
Corp.
,
Senior
Secured
Note
,
144A,
4.125
%
,
11/15/28
........................................
United
States
16,400,000
15,865,158
34,642,461
Electronic
Equipment,
Instruments
&
Components
0.5%
c
TTM
Technologies,
Inc.
,
Senior
Note
,
144A,
4
%
,
3/01/29
......
United
States
9,300,000
8,820,546
Franklin
High
Income
Trust
Schedule
of
Investments
Franklin
High
Income
Fund
(continued)
Annual
Report
The
accompanying
notes
are
an
integral
part
of
these
financial
statements.
a
a
Country
Principal
Amount
*
a
Value
a
a
a
a
a
Corporate
Bonds
(continued)
Electronic
Equipment,
Instruments
&
Components
(continued)
c
Zebra
Technologies
Corp.
,
Senior
Note
,
144A,
6.5
%
,
6/01/32
..
United
States
4,800,000
$
5,015,366
13,835,912
Energy
Equipment
&
Services
2.6%
c
Enerflex
Ltd.
,
Senior
Secured
Note
,
144A,
9
%
,
10/15/27
......
Canada
7,100,000
7,349,256
c
Kodiak
Gas
Services
LLC
,
Senior
Note
,
144A,
7.25
%
,
2/15/29
..
United
States
12,300,000
12,738,901
c
Nabors
Industries,
Inc.
,
Senior
Note
,
144A,
7.375
%
,
5/15/27
...................
United
States
6,200,000
6,218,773
Senior
Note
,
144A,
9.125
%
,
1/31/30
...................
United
States
4,600,000
4,748,042
Senior
Note
,
144A,
8.875
%
,
8/15/31
...................
United
States
9,900,000
9,426,434
Oceaneering
International,
Inc.
,
Senior
Note
,
6
%
,
2/01/28
.....
United
States
6,000,000
6,016,296
c
Transocean
Titan
Financing
Ltd.
,
Senior
Secured
Note
,
144A,
8.375
%
,
2/01/28
...................................
United
States
1,800,000
1,855,613
c
Transocean,
Inc.
,
Senior
Secured
Note
,
144A,
8.75
%
,
2/15/30
..
United
States
13,430,000
14,013,359
c
Weatherford
International
Ltd.
,
Senior
Note
,
144A,
8.625
%
,
4/30/30
.........................................
United
States
11,000,000
11,470,212
73,836,886
Entertainment
0.6%
c
Banijay
Entertainment
SAS
,
Senior
Secured
Note
,
144A,
8.125
%
,
5/01/29
.........................................
France
15,300,000
15,915,106
Financial
Services
3.7%
c
Freedom
Mortgage
Holdings
LLC
,
Senior
Note
,
144A,
9.25
%
,
2/01/29
.........................................
United
States
4,400,000
4,577,215
c
GGAM
Finance
Ltd.
,
Senior
Note
,
144A,
8
%
,
2/15/27
......................
Ireland
8,200,000
8,574,223
Senior
Note
,
144A,
8
%
,
6/15/28
......................
Ireland
15,400,000
16,516,223
c
Jefferson
Capital
Holdings
LLC
,
Senior
Note
,
144A,
6
%
,
8/15/26
......................
United
States
14,500,000
14,513,984
Senior
Note
,
144A,
9.5
%
,
2/15/29
.....................
United
States
8,700,000
9,296,785
c
Nationstar
Mortgage
Holdings,
Inc.
,
Senior
Bond
,
144A,
5.75
%
,
11/15/31
........................................
United
States
19,600,000
19,221,440
c
PRA
Group,
Inc.
,
Senior
Note
,
144A,
8.375
%
,
2/01/28
...................
United
States
9,300,000
9,634,205
Senior
Note
,
144A,
5
%
,
10/01/29
.....................
United
States
5,000,000
4,604,168
Senior
Note
,
144A,
8.875
%
,
1/31/30
...................
United
States
9,600,000
10,011,024
c
United
Wholesale
Mortgage
LLC
,
Senior
Note
,
144A,
5.5
%
,
11/15/25
........................................
United
States
7,100,000
7,092,617
104,041,884
Food
Products
1.1%
B&G
Foods,
Inc.
,
Senior
Note
,
5.25
%
,
4/01/25
.............
United
States
3,190,000
3,186,984
c
Chobani
LLC
/
Chobani
Finance
Corp.,
Inc.
,
Senior
Note
,
144A,
7.625
%
,
7/01/29
...................................
United
States
3,300,000
3,469,524
Pilgrim's
Pride
Corp.
,
Senior
Bond
,
6.875
%
,
5/15/34
.........
United
States
17,900,000
19,887,813
c
Post
Holdings,
Inc.
,
Senior
Secured
Note
,
144A,
6.25
%
,
2/15/32
United
States
5,500,000
5,670,269
32,214,590
Ground
Transportation
2.2%
c
Ashtead
Capital,
Inc.
,
Senior
Bond
,
144A,
5.8
%
,
4/15/34
......
United
Kingdom
4,100,000
4,287,499
c
Avis
Budget
Car
Rental
LLC
/
Avis
Budget
Finance,
Inc.
,
Senior
Note
,
144A,
8.25
%
,
1/15/30
..........................
United
States
20,400,000
20,883,698
c
First
Student
Bidco,
Inc.
/
First
Transit
Parent,
Inc.
,
Senior
Secured
Note
,
144A,
4
%
,
7/31/29
.....................
United
States
13,400,000
12,584,530
Franklin
High
Income
Trust
Schedule
of
Investments
Franklin
High
Income
Fund
(continued)
The
accompanying
notes
are
an
integral
part
of
these
financial
statements.
Annual
Report
a
a
Country
Principal
Amount
*
a
Value
a
a
a
a
a
Corporate
Bonds
(continued)
Ground
Transportation
(continued)
c
Watco
Cos.
LLC
/
Watco
Finance
Corp.
,
Senior
Note
,
144A,
7.125
%
,
8/01/32
...................................
United
States
10,100,000
$
10,535,633
c
XPO,
Inc.
,
Senior
Note
,
144A,
7.125
%
,
2/01/32
.............
United
States
12,100,000
12,748,354
61,039,714
Health
Care
Equipment
&
Supplies
1.1%
c
Bausch
+
Lomb
Corp.
,
Senior
Secured
Note
,
144A,
8.375
%
,
10/01/28
........................................
United
States
10,000,000
10,587,500
c
Medline
Borrower
LP
,
Senior
Note
,
144A,
5.25
%
,
10/01/29
....
United
States
10,300,000
10,113,804
c
Neogen
Food
Safety
Corp.
,
Senior
Note
,
144A,
8.625
%
,
7/20/30
United
States
9,000,000
9,969,804
30,671,108
Health
Care
Providers
&
Services
4.1%
c
CHS/Community
Health
Systems,
Inc.
,
Secured
Note
,
144A,
6.125
%
,
4/01/30
..................
United
States
6,800,000
5,819,767
Senior
Secured
Note
,
144A,
5.625
%
,
3/15/27
............
United
States
5,900,000
5,810,398
Senior
Secured
Note
,
144A,
8
%
,
12/15/27
...............
United
States
1,200,000
1,204,927
Senior
Secured
Note
,
144A,
6
%
,
1/15/29
................
United
States
6,000,000
5,830,350
Senior
Secured
Note
,
144A,
5.25
%
,
5/15/30
.............
United
States
6,500,000
5,987,314
Senior
Secured
Note
,
144A,
10.875
%
,
1/15/32
...........
United
States
8,500,000
9,377,498
c
Concentra
Escrow
Issuer
Corp.
,
Senior
Note
,
144A,
6.875
%
,
7/15/32
.........................................
United
States
5,200,000
5,474,367
c
DaVita,
Inc.
,
Senior
Note
,
144A,
4.625
%
,
6/01/30
...................
United
States
16,700,000
15,932,387
Senior
Note
,
144A,
6.875
%
,
9/01/32
...................
United
States
7,700,000
7,961,069
c
Kedrion
SpA
,
Senior
Secured
Note
,
144A,
6.5
%
,
9/01/29
......
Italy
18,700,000
17,823,531
c
MPH
Acquisition
Holdings
LLC
,
Senior
Note
,
144A,
5.75
%
,
11/01/28
........................................
United
States
22,200,000
10,190,547
Tenet
Healthcare
Corp.
,
Secured
Note
,
6.25
%
,
2/01/27
........................
United
States
9,800,000
9,821,403
Senior
Secured
Note
,
6.125
%
,
6/15/30
.................
United
States
14,600,000
14,856,843
116,090,401
Health
Care
REITs
0.8%
MPT
Operating
Partnership
LP
/
MPT
Finance
Corp.
,
Senior
Bond
,
5.25
%
,
8/01/26
.........................
United
States
11,400,000
10,866,709
Senior
Bond
,
3.5
%
,
3/15/31
..........................
United
States
16,200,000
11,844,008
22,710,717
Hotel
&
Resort
REITs
1.0%
c
,d
Pebblebrook
Hotel
LP
/
PEB
Finance
Corp.
,
Senior
Note
,
144A,
6.375
%
,
10/15/29
..................................
United
States
3,300,000
3,324,651
c
RHP
Hotel
Properties
LP
/
RHP
Finance
Corp.
,
Senior
Note
,
144A,
7.25
%
,
7/15/28
....................
United
States
6,000,000
6,283,584
Senior
Note
,
144A,
4.5
%
,
2/15/29
.....................
United
States
6,500,000
6,294,718
Senior
Note
,
144A,
6.5
%
,
4/01/32
.....................
United
States
12,300,000
12,720,488
28,623,441
Hotels,
Restaurants
&
Leisure
7.2%
c
1011778
BC
ULC
/
New
Red
Finance,
Inc.
,
Secured
Bond
,
144A,
4
%
,
10/15/30
.....................................
Canada
8,500,000
7,845,719
b
,c
,f
24
Hour
Fitness
Worldwide,
Inc.
,
Senior
Note
,
144A,
8
%
,
6/01/22
United
States
23,000,000
—
c
Allwyn
Entertainment
Financing
UK
plc
,
Senior
Secured
Note
,
144A,
7.875
%
,
4/30/29
..............................
Czech
Republic
15,500,000
16,344,347
c
Boyne
USA,
Inc.
,
Senior
Note
,
144A,
4.75
%
,
5/15/29
.........
United
States
2,600,000
2,501,411
Franklin
High
Income
Trust
Schedule
of
Investments
Franklin
High
Income
Fund
(continued)
Annual
Report
The
accompanying
notes
are
an
integral
part
of
these
financial
statements.
a
a
Country
Principal
Amount
*
a
Value
a
a
a
a
a
Corporate
Bonds
(continued)
Hotels,
Restaurants
&
Leisure
(continued)
c
Caesars
Entertainment,
Inc.
,
Senior
Note
,
144A,
4.625
%
,
10/15/29
..................
United
States
6,900,000
$
6,567,854
Senior
Secured
Note
,
144A,
7
%
,
2/15/30
................
United
States
6,800,000
7,108,591
Senior
Secured
Note
,
144A,
6.5
%
,
2/15/32
..............
United
States
12,700,000
13,144,995
c
Carnival
Corp.
,
Senior
Note
,
144A,
7.625
%
,
3/01/26
...................
United
States
2,200,000
2,221,747
Senior
Note
,
144A,
5.75
%
,
3/01/27
....................
United
States
24,000,000
24,321,059
c
Carnival
Holdings
Bermuda
Ltd.
,
Senior
Note
,
144A,
10.375
%
,
5/01/28
.........................................
United
States
10,000,000
10,796,934
c
Fertitta
Entertainment
LLC
/
Fertitta
Entertainment
Finance
Co.,
Inc.
,
Senior
Note
,
144A,
6.75
%
,
1/15/30
.................
United
States
13,200,000
12,306,530
c
NCL
Corp.
Ltd.
,
Senior
Note
,
144A,
5.875
%
,
3/15/26
.........
United
States
5,200,000
5,203,570
c
Royal
Caribbean
Cruises
Ltd.
,
Senior
Note
,
144A,
5.5
%
,
8/31/26
.....................
United
States
4,000,000
4,041,780
Senior
Note
,
144A,
5.375
%
,
7/15/27
...................
United
States
4,900,000
4,947,182
Senior
Note
,
144A,
6.25
%
,
3/15/32
....................
United
States
7,000,000
7,265,748
Senior
Note
,
144A,
6
%
,
2/01/33
......................
United
States
9,000,000
9,232,281
c
Six
Flags
Entertainment
Corp.
/
Six
Flags
Theme
Parks,
Inc.
,
Senior
Secured
Note
,
144A,
6.625
%
,
5/01/32
.............
United
States
17,400,000
18,031,933
c
Station
Casinos
LLC
,
Senior
Note
,
144A,
4.5
%
,
2/15/28
......
United
States
9,800,000
9,470,271
c
Viking
Cruises
Ltd.
,
Senior
Note
,
144A,
5.875
%
,
9/15/27
...................
United
States
4,900,000
4,900,006
Senior
Note
,
144A,
7
%
,
2/15/29
......................
United
States
9,900,000
10,032,472
c
Wynn
Resorts
Finance
LLC
/
Wynn
Resorts
Capital
Corp.
,
Senior
Note
,
144A,
7.125
%
,
2/15/31
.........................
United
States
25,000,000
26,988,069
203,272,499
Household
Durables
2.3%
c
Ashton
Woods
USA
LLC
/
Ashton
Woods
Finance
Co.
,
Senior
Note
,
144A,
4.625
%
,
8/01/29
...................
United
States
10,300,000
9,896,708
Senior
Note
,
144A,
4.625
%
,
4/01/30
...................
United
States
8,000,000
7,671,325
c
Dream
Finders
Homes,
Inc.
,
Senior
Note
,
144A,
8.25
%
,
8/15/28
United
States
9,000,000
9,518,985
KB
Home
,
Senior
Note
,
7.25
%
,
7/15/30
...................
United
States
9,000,000
9,405,999
c
LGI
Homes,
Inc.
,
Senior
Note
,
144A,
8.75
%
,
12/15/28
........
United
States
14,200,000
15,215,882
M/I
Homes,
Inc.
,
Senior
Note
,
3.95
%
,
2/15/30
..............
United
States
12,600,000
11,842,018
63,550,917
Household
Products
0.3%
c
Energizer
Holdings,
Inc.
,
Senior
Note
,
144A,
4.375
%
,
3/31/29
..
United
States
8,400,000
7,963,200
Independent
Power
and
Renewable
Electricity
Producers
1.2%
c
Calpine
Corp.
,
Senior
Note
,
144A,
5.125
%
,
3/15/28
...................
United
States
10,300,000
10,164,271
Senior
Secured
Note
,
144A,
4.5
%
,
2/15/28
..............
United
States
7,200,000
7,034,933
c
Clearway
Energy
Operating
LLC
,
Senior
Bond
,
144A,
3.75
%
,
1/15/32
....................
United
States
8,800,000
7,970,269
Senior
Note
,
144A,
4.75
%
,
3/15/28
....................
United
States
3,500,000
3,437,164
Senior
Note
,
144A,
3.75
%
,
2/15/31
....................
United
States
7,000,000
6,416,200
35,022,837
Insurance
2.4%
c
Acrisure
LLC
/
Acrisure
Finance,
Inc.
,
Senior
Note
,
144A,
8.5
%
,
6/15/29
.....................
United
States
7,200,000
7,524,662
Senior
Secured
Note
,
144A,
7.5
%
,
11/06/30
.............
United
States
8,900,000
9,166,733
c
Alliant
Holdings
Intermediate
LLC
/
Alliant
Holdings
Co-Issuer
,
Senior
Note
,
144A,
6.75
%
,
10/15/27
...................
United
States
5,400,000
5,384,043
Senior
Note
,
144A,
7.375
%
,
10/01/32
..................
United
States
3,600,000
3,654,369
Franklin
High
Income
Trust
Schedule
of
Investments
Franklin
High
Income
Fund
(continued)
The
accompanying
notes
are
an
integral
part
of
these
financial
statements.
Annual
Report
a
a
Country
Principal
Amount
*
a
Value
a
a
a
a
a
Corporate
Bonds
(continued)
Insurance
(continued)
c
Alliant
Holdings
Intermediate
LLC
/
Alliant
Holdings
Co-Issuer,
(continued)
Senior
Secured
Note
,
144A,
6.75
%
,
4/15/28
.............
United
States
2,500,000
$
2,542,345
Senior
Secured
Note
,
144A,
7
%
,
1/15/31
................
United
States
13,400,000
13,780,198
c
HUB
International
Ltd.
,
Senior
Secured
Note
,
144A,
7.25
%
,
6/15/30
.........................................
United
States
8,700,000
9,071,537
Jones
Deslauriers
Insurance
Management,
Inc.
,
c
Senior
Note
,
144A,
10.5
%
,
12/15/30
...................
Canada
15,300,000
16,651,694
67,775,581
IT
Services
1.9%
c
Cablevision
Lightpath
LLC
,
Senior
Secured
Note
,
144A,
3.875
%
,
9/15/27
.........................................
United
States
8,500,000
8,123,505
c
Cogent
Communications
Group
LLC
,
Senior
Note
,
144A,
7
%
,
6/15/27
.........................................
United
States
4,000,000
4,073,776
c
Cogent
Communications
Group,
Inc.
/
Cogent
Communications
Finance,
Inc.
,
Senior
Note
,
144A,
7
%
,
6/15/27
............
United
States
9,400,000
9,561,511
c
Fortress
Intermediate
3,
Inc.
,
Senior
Secured
Note
,
144A,
7.5
%
,
6/01/31
.........................................
United
States
10,700,000
11,302,164
c
Gartner,
Inc.
,
Senior
Bond
,
144A,
3.75
%
,
10/01/30
...................
United
States
6,000,000
5,636,621
Senior
Note
,
144A,
4.5
%
,
7/01/28
.....................
United
States
9,300,000
9,212,720
Senior
Note
,
144A,
3.625
%
,
6/15/29
...................
United
States
4,400,000
4,203,368
52,113,665
Machinery
1.9%
c
Calderys
Financing
LLC
,
Senior
Secured
Note
,
144A,
11.25
%
,
6/01/28
.........................................
France
13,700,000
14,744,857
c
Esab
Corp.
,
Senior
Note
,
144A,
6.25
%
,
4/15/29
.............
United
States
11,200,000
11,517,050
Hillenbrand,
Inc.
,
Senior
Note
,
6.25
%
,
2/15/29
..............
United
States
10,200,000
10,392,423
c
Manitowoc
Co.,
Inc.
(The)
,
Secured
Note
,
144A,
9.25
%
,
10/01/31
United
States
9,500,000
9,749,375
c
Terex
Corp.
,
Senior
Bond
,
144A,
6.25
%
,
10/15/32
...........
United
States
6,100,000
6,100,000
52,503,705
Media
3.8%
c
Clear
Channel
Outdoor
Holdings,
Inc.
,
Senior
Note
,
144A,
7.75
%
,
4/15/28
....................
United
States
2,700,000
2,418,265
Senior
Note
,
144A,
7.5
%
,
6/01/29
.....................
United
States
8,700,000
7,500,479
Senior
Secured
Note
,
144A,
9
%
,
9/15/28
................
United
States
3,500,000
3,723,643
Senior
Secured
Note
,
144A,
7.875
%
,
4/01/30
............
United
States
11,000,000
11,511,896
c
CSC
Holdings
LLC
,
Senior
Note
,
144A,
11.25
%
,
5/15/28
...................
United
States
13,700,000
13,236,077
Senior
Note
,
144A,
11.75
%
,
1/31/29
...................
United
States
7,000,000
6,770,513
c
,f
Diamond
Sports
Group
LLC
/
Diamond
Sports
Finance
Co.
,
Senior
Note
,
144A,
6.625
%
,
8/15/27
...................
United
States
11,300,000
148,313
Senior
Secured
Note
,
144A,
5.375
%
,
8/15/26
............
United
States
13,300,000
174,562
c
Directv
Financing
LLC
/
Directv
Financing
Co-Obligor,
Inc.
,
Senior
Secured
Note
,
144A,
5.875
%
,
8/15/27
..................
United
States
10,400,000
10,218,388
c
LCPR
Senior
Secured
Financing
DAC
,
Senior
Secured
Note
,
144A,
6.75
%
,
10/15/27
..............................
United
States
3,990,000
3,654,414
c
McGraw-Hill
Education,
Inc.
,
Senior
Secured
Note
,
144A,
7.375
%
,
9/01/31
...................................
United
States
15,600,000
16,198,385
c
News
Corp.
,
Senior
Note
,
144A,
3.875
%
,
5/15/29
...........
United
States
4,400,000
4,164,917
c
Outfront
Media
Capital
LLC
/
Outfront
Media
Capital
Corp.
,
Senior
Bond
,
144A,
4.625
%
,
3/15/30
...................
United
States
3,200,000
3,043,424
Senior
Note
,
144A,
4.25
%
,
1/15/29
....................
United
States
8,000,000
7,624,388
Franklin
High
Income
Trust
Schedule
of
Investments
Franklin
High
Income
Fund
(continued)
Annual
Report
The
accompanying
notes
are
an
integral
part
of
these
financial
statements.
a
a
Country
Principal
Amount
*
a
Value
a
a
a
a
a
Corporate
Bonds
(continued)
Media
(continued)
c
Outfront
Media
Capital
LLC
/
Outfront
Media
Capital
Corp.,
(continued)
Senior
Secured
Note
,
144A,
7.375
%
,
2/15/31
............
United
States
4,100,000
$
4,380,543
c
Sirius
XM
Radio,
Inc.
,
Senior
Note
,
144A,
4
%
,
7/15/28
.......
United
States
12,600,000
11,896,914
106,665,121
Metals
&
Mining
2.3%
ATI,
Inc.
,
Senior
Note
,
7.25
%
,
8/15/30
....................
United
States
11,900,000
12,683,341
c
Cleveland-Cliffs,
Inc.
,
Senior
Note
,
144A,
7
%
,
3/15/32
........
United
States
11,000,000
11,134,648
c
Constellium
SE
,
Senior
Note
,
144A,
3.75
%
,
4/15/29
....................
United
States
16,000,000
14,957,118
Senior
Note
,
144A,
6.375
%
,
8/15/32
...................
United
States
5,600,000
5,752,511
c
FMG
Resources
August
2006
Pty.
Ltd.
,
Senior
Bond
,
144A,
4.375
%
,
4/01/31
...................................
Australia
9,500,000
8,886,012
c
Novelis
Corp.
,
Senior
Bond
,
144A,
4.75
%
,
1/30/30
....................
United
States
7,700,000
7,471,856
Senior
Bond
,
144A,
3.875
%
,
8/15/31
...................
United
States
2,200,000
2,013,356
Senior
Note
,
144A,
3.25
%
,
11/15/26
...................
United
States
1,600,000
1,545,389
64,444,231
Mortgage
Real
Estate
Investment
Trusts
(REITs)
1.0%
c
Apollo
Commercial
Real
Estate
Finance,
Inc.
,
Senior
Secured
Note
,
144A,
4.625
%
,
6/15/29
.........................
United
States
24,900,000
22,310,081
c
Ladder
Capital
Finance
Holdings
LLLP
/
Ladder
Capital
Finance
Corp.
,
Senior
Note
,
144A,
4.75
%
,
6/15/29
...............
United
States
5,700,000
5,571,653
27,881,734
Oil,
Gas
&
Consumable
Fuels
12.4%
c
Antero
Resources
Corp.
,
Senior
Note
,
144A,
7.625
%
,
2/01/29
...................
United
States
4,422,000
4,571,667
Senior
Note
,
144A,
5.375
%
,
3/01/30
...................
United
States
4,300,000
4,251,302
c
Calumet
Specialty
Products
Partners
LP
/
Calumet
Finance
Corp.
,
Senior
Note
,
144A,
8.125
%
,
1/15/27
...................
United
States
7,400,000
7,208,118
Senior
Secured
Note
,
144A,
9.25
%
,
7/15/29
.............
United
States
14,700,000
15,121,758
Cheniere
Energy
Partners
LP
,
Senior
Note
,
4.5
%
,
10/01/29
.........................
United
States
2,600,000
2,566,073
Senior
Note
,
4
%
,
3/01/31
...........................
United
States
11,600,000
10,986,402
c
Chesapeake
Energy
Corp.
,
Senior
Note
,
144A,
5.875
%
,
2/01/29
...................
United
States
5,000,000
5,029,625
Senior
Note
,
144A,
6.75
%
,
4/15/29
....................
United
States
10,300,000
10,500,417
c
CITGO
Petroleum
Corp.
,
Senior
Secured
Note
,
144A,
8.375
%
,
1/15/29
.........................................
United
States
8,900,000
9,268,027
c
Civitas
Resources,
Inc.
,
Senior
Note
,
144A,
8.375
%
,
7/01/28
...................
United
States
12,800,000
13,321,203
Senior
Note
,
144A,
8.75
%
,
7/01/31
....................
United
States
12,800,000
13,565,287
c
,d
Coronado
Finance
Pty.
Ltd.
,
Senior
Secured
Note
,
144A,
9.25
%
,
10/01/29
........................................
Australia
5,100,000
5,247,722
c
CrownRock
LP
/
CrownRock
Finance,
Inc.
,
Senior
Note
,
144A,
5
%
,
5/01/29
......................................
United
States
5,100,000
5,163,913
c
DT
Midstream,
Inc.
,
Senior
Bond
,
144A,
4.375
%
,
6/15/31
...................
United
States
3,900,000
3,694,639
Senior
Note
,
144A,
4.125
%
,
6/15/29
...................
United
States
5,600,000
5,360,776
EnLink
Midstream
LLC
,
Senior
Bond
,
5.375
%
,
6/01/29
........................
United
States
2,100,000
2,154,701
c
Senior
Note
,
144A,
6.5
%
,
9/01/30
.....................
United
States
10,300,000
11,111,836
c
EQM
Midstream
Partners
LP
,
Senior
Note
,
144A,
7.5
%
,
6/01/27
United
States
1,900,000
1,957,146
Franklin
High
Income
Trust
Schedule
of
Investments
Franklin
High
Income
Fund
(continued)
The
accompanying
notes
are
an
integral
part
of
these
financial
statements.
Annual
Report
a
a
Country
Principal
Amount
*
a
Value
a
a
a
a
a
Corporate
Bonds
(continued)
Oil,
Gas
&
Consumable
Fuels
(continued)
c
Harbour
Energy
plc
,
Senior
Note
,
144A,
5.5
%
,
10/15/26
......
United
Kingdom
14,800,000
$
14,748,150
c
Hess
Midstream
Operations
LP
,
Senior
Note
,
144A,
6.5
%
,
6/01/29
United
States
9,100,000
9,425,844
c
Hilcorp
Energy
I
LP
/
Hilcorp
Finance
Co.
,
Senior
Bond
,
144A,
6
%
,
2/01/31
......................
United
States
3,100,000
3,020,844
Senior
Bond
,
144A,
6.25
%
,
4/15/32
....................
United
States
4,300,000
4,188,965
Senior
Note
,
144A,
8.375
%
,
11/01/33
..................
United
States
2,100,000
2,265,646
c
Kinetik
Holdings
LP
,
Senior
Note
,
144A,
6.625
%
,
12/15/28
..................
United
States
4,800,000
4,985,592
Senior
Note
,
144A,
5.875
%
,
6/15/30
...................
United
States
9,200,000
9,270,113
c
Kraken
Oil
&
Gas
Partners
LLC
,
Senior
Note
,
144A,
7.625
%
,
8/15/29
.........................................
United
States
12,000,000
11,994,728
c
Martin
Midstream
Partners
LP
/
Martin
Midstream
Finance
Corp.
,
Secured
Note
,
144A,
11.5
%
,
2/15/28
...................
United
States
30,800,000
33,935,471
c
Matador
Resources
Co.
,
Senior
Note
,
144A,
6.5
%
,
4/15/32
.....................
United
States
11,400,000
11,391,523
Senior
Note
,
144A,
6.25
%
,
4/15/33
....................
United
States
9,600,000
9,462,988
b
,e
,f
,g
Murray
Energy
Corp.
,
Secured
Note
,
144A,
PIK,
12
%
,
4/15/24
.
United
States
18,564,500
—
c
Northriver
Midstream
Finance
LP
,
Senior
Secured
Note
,
144A,
6.75
%
,
7/15/32
...................................
Canada
20,100,000
20,761,933
c
PBF
Holding
Co.
LLC
/
PBF
Finance
Corp.
,
Senior
Note
,
144A,
7.875
%
,
9/15/30
...................................
United
States
2,800,000
2,886,808
c
Sunoco
LP
,
Senior
Note
,
144A,
7.25
%
,
5/01/32
.............
United
States
3,000,000
3,182,511
Sunoco
LP
/
Sunoco
Finance
Corp.
,
Senior
Note
,
6
%
,
4/15/27
...........................
United
States
2,200,000
2,208,956
Senior
Note
,
4.5
%
,
5/15/29
..........................
United
States
2,700,000
2,597,910
Senior
Note
,
4.5
%
,
4/30/30
..........................
United
States
5,000,000
4,794,267
c
Venture
Global
Calcasieu
Pass
LLC
,
Senior
Secured
Bond
,
144A,
4.125
%
,
8/15/31
............
United
States
4,900,000
4,559,546
Senior
Secured
Note
,
144A,
3.875
%
,
8/15/29
............
United
States
5,900,000
5,580,231
Senior
Secured
Note
,
144A,
6.25
%
,
1/15/30
.............
United
States
4,100,000
4,300,576
c
Venture
Global
LNG,
Inc.
,
Senior
Secured
Note
,
144A,
8.125
%
,
6/01/28
............
United
States
12,900,000
13,457,145
Senior
Secured
Note
,
144A,
9.5
%
,
2/01/29
..............
United
States
3,100,000
3,494,102
Senior
Secured
Note
,
144A,
8.375
%
,
6/01/31
............
United
States
9,800,000
10,354,739
c
Viper
Energy,
Inc.
,
Senior
Note
,
144A,
7.375
%
,
11/01/31
......
United
States
12,100,000
12,807,596
Vital
Energy,
Inc.
,
Senior
Note
,
9.75
%
,
10/15/30
........................
United
States
9,000,000
9,624,915
c
Senior
Note
,
144A,
7.875
%
,
4/15/32
...................
United
States
3,100,000
3,005,295
349,387,006
Paper
&
Forest
Products
0.3%
c
Glatfelter
Corp.
,
Senior
Note
,
144A,
4.75
%
,
11/15/29
.........
United
States
8,200,000
7,372,941
Passenger
Airlines
1.1%
c
American
Airlines,
Inc.
/
AAdvantage
Loyalty
IP
Ltd.
,
Senior
Secured
Note
,
144A,
5.5
%
,
4/20/26
..............
United
States
9,916,667
9,896,511
Senior
Secured
Note
,
144A,
5.75
%
,
4/20/29
.............
United
States
2,000,000
1,998,335
c
Delta
Air
Lines,
Inc.
/
SkyMiles
IP
Ltd.
,
Senior
Secured
Note
,
144A,
4.75
%
,
10/20/28
..............................
United
States
10,200,000
10,190,935
c
United
Airlines,
Inc.
,
Senior
Secured
Note
,
144A,
4.375
%
,
4/15/26
............
United
States
2,700,000
2,658,794
Senior
Secured
Note
,
144A,
4.625
%
,
4/15/29
............
United
States
5,500,000
5,318,055
30,062,630
Franklin
High
Income
Trust
Schedule
of
Investments
Franklin
High
Income
Fund
(continued)
Annual
Report
The
accompanying
notes
are
an
integral
part
of
these
financial
statements.
a
a
Country
Principal
Amount
*
a
Value
a
a
a
a
a
Corporate
Bonds
(continued)
Personal
Care
Products
0.4%
c
Coty,
Inc.
/
HFC
Prestige
Products,
Inc.
/
HFC
Prestige
International
US
LLC
,
Senior
Secured
Note
,
144A,
6.625
%
,
7/15/30
.........................................
United
States
12,200,000
$
12,687,651
Pharmaceuticals
1.3%
c
1375209
BC
Ltd.
,
Senior
Secured
Note
,
144A,
9
%
,
1/30/28
....
Canada
6,021,000
5,973,012
c
Endo
Finance
Holdings,
Inc.
,
Senior
Secured
Note
,
144A,
8.5
%
,
4/15/31
.........................................
United
States
4,500,000
4,827,524
Teva
Pharmaceutical
Finance
Netherlands
III
BV
,
Senior
Note
,
4.75
%
,
5/09/27
.........................
Israel
10,600,000
10,463,892
Senior
Note
,
5.125
%
,
5/09/29
........................
Israel
900,000
893,491
Senior
Note
,
7.875
%
,
9/15/29
........................
Israel
6,400,000
7,078,541
Senior
Note
,
8.125
%
,
9/15/31
........................
Israel
6,400,000
7,345,625
36,582,085
Real
Estate
Management
&
Development
1.0%
c
Five
Point
Operating
Co.
LP
/
Five
Point
Capital
Corp.
,
Senior
Note
,
144A,
10.5
%
,
1/15/28
..........................
United
States
11,670,252
11,950,817
c
Forestar
Group,
Inc.
,
Senior
Note
,
144A,
3.85
%
,
5/15/26
......
United
States
11,000,000
10,764,378
c
Greystar
Real
Estate
Partners
LLC
,
Senior
Secured
Note
,
144A,
7.75
%
,
9/01/30
...................................
United
States
5,800,000
6,164,692
28,879,887
Software
0.8%
c
Camelot
Finance
SA
,
Senior
Secured
Note
,
144A,
4.5
%
,
11/01/26
United
States
6,800,000
6,706,854
c
McAfee
Corp.
,
Senior
Note
,
144A,
7.375
%
,
2/15/30
..........
United
States
9,400,000
9,177,574
c
Rocket
Software,
Inc.
,
Senior
Note
,
144A,
6.5
%
,
2/15/29
......
United
States
6,700,000
6,381,890
22,266,318
Specialized
REITs
0.7%
c
Iron
Mountain,
Inc.
,
Senior
Bond
,
144A,
5.625
%
,
7/15/32
...................
United
States
6,400,000
6,389,367
Senior
Note
,
144A,
7
%
,
2/15/29
......................
United
States
12,600,000
13,143,337
19,532,704
Specialty
Retail
0.5%
c
Evergreen
Acqco
1
LP
/
TVI,
Inc.
,
Senior
Secured
Note
,
144A,
9.75
%
,
4/26/28
...................................
United
States
12,880,000
13,594,428
Textiles,
Apparel
&
Luxury
Goods
0.6%
c
Hanesbrands,
Inc.
,
Senior
Note
,
144A,
9
%
,
2/15/31
..........
United
States
14,700,000
15,881,057
Trading
Companies
&
Distributors
2.2%
c
EquipmentShare.com,
Inc.
,
Secured
Note
,
144A,
9
%
,
5/15/28
.....................
United
States
15,400,000
16,101,054
Secured
Note
,
144A,
8.625
%
,
5/15/32
..................
United
States
9,800,000
10,293,411
c
Herc
Holdings,
Inc.
,
Senior
Note
,
144A,
6.625
%
,
6/15/29
......
United
States
15,600,000
16,171,038
c
United
Rentals
North
America,
Inc.
,
Senior
Bond
,
144A,
6.125
%
,
3/15/34
.........................................
United
States
15,400,000
15,934,334
c
WESCO
Distribution,
Inc.
,
Senior
Note
,
144A,
6.375
%
,
3/15/29
.
United
States
4,600,000
4,758,051
63,257,888
Wireless
Telecommunication
Services
1.5%
c
Altice
France
Holding
SA
,
Senior
Note
,
144A,
6
%
,
2/15/28
......................
Luxembourg
3,100,000
968,466
Senior
Secured
Note
,
144A,
10.5
%
,
5/15/27
.............
Luxembourg
17,400,000
6,035,500
Franklin
High
Income
Trust
Schedule
of
Investments
Franklin
High
Income
Fund
(continued)
The
accompanying
notes
are
an
integral
part
of
these
financial
statements.
Annual
Report
a
a
Country
Principal
Amount
*
a
Value
a
a
a
a
a
Corporate
Bonds
(continued)
Wireless
Telecommunication
Services
(continued)
c
Connect
Finco
SARL
/
Connect
US
Finco
LLC
,
Senior
Secured
Note
,
144A,
9
%
,
9/15/29
............................
United
Kingdom
14,000,000
$
13,565,791
b
Digicel
Group
Holdings
Ltd.
,
Zero
Cpn.,
11/17/33
...............................
Bermuda
445,997
12,491
Zero
Cpn.,
11/17/33
...............................
Bermuda
3,630
2,392
c
Zegona
Finance
plc
,
Senior
Secured
Note
,
144A,
8.625
%
,
7/15/29
.........................................
United
Kingdom
19,700,000
21,066,688
41,651,328
Total
Corporate
Bonds
(Cost
$
2,709,597,587
)
.................................
2,635,784,201
h
Senior
Floating
Rate
Interests
2.3%
i
Chemicals
1.0%
Hexion
Holdings
Corp.,
First
Lien,
Initial
CME
Term
Loan
,
9.771
%
,
(
3-month
SOFR
+
4.5
%
),
3/15/29
......................
United
States
8,504,250
8,453,394
Hexion
Holdings
Corp.,
Second
Lien,
Initial
CME
Term
Loan
,
12.383
%
,
(
1-month
SOFR
+
7.438
%
),
3/15/30
............
United
States
9,279,070
8,405,306
PMHC
II,
Inc.,
First
Lien,
Initial
CME
Term
Loan
,
9.704
%
,
(
3-month
SOFR
+
4.25
%
),
4/23/29
.....................
United
States
12,838,000
12,550,365
29,409,065
a
a
a
a
a
a
Health
Care
Technology
0.4%
i
athenahealth
Group,
Inc.,
First
Lien,
Initial
CME
Term
Loan
,
8.095
%
,
(
1-month
SOFR
+
3.25
%
),
2/15/29
..............
United
States
11,415,706
11,363,423
Hotels,
Restaurants
&
Leisure
0.4%
i
Fertitta
Entertainment
LLC,
First
Lien,
Initial
CME
Term
Loan,
B
,
8.847
%
,
(
1-month
SOFR
+
3.75
%
),
1/29/29
..............
United
States
12,772,500
12,751,681
Media
0.1%
f,i
Diamond
Sports
Group
LLC,
First
Lien,
CME
Term
Loan
,
14.944
%
,
(
1-month
SOFR
+
10
%
),
5/26/26
...............
United
States
1,175,779
1,043,257
e
Diamond
Sports
Group
LLC,
First
Lien,
Debtor-In-Possession
Term
Loan
,
PIK,
5
%
,
12/02/24
........................
United
States
1,393,839
1,695,264
2,738,521
a
a
a
a
a
a
Software
0.4%
i
McAfee
Corp.,
First
Lien,
CME
Term
Loan,
B1
,
8.451
%
,
(
1-month
SOFR
+
3.25
%
),
3/01/29
............................
United
States
10,192,455
10,169,369
Total
Senior
Floating
Rate
Interests
(Cost
$
67,068,144
)
........................
66,432,059
Shares
a
Escrows
and
Litigation
Trusts
0.0%
†
a,b
Alpha
Natural
Resources,
Inc.,
Escrow
Account
.............
United
States
25,000,000
—
a
Chesapeake
Energy
Corp.,
Escrow
Account
...............
United
States
13,700,000
282,563
a,b
Endo
DAC,
Escrow
Account
...........................
United
States
11,577,000
—
a,b
Endo,
Inc.,
Escrow
Account
............................
United
States
8,973,000
—
Total
Escrows
and
Litigation
Trusts
(Cost
$
450,960
)
...........................
282,563
Total
Long
Term
Investments
(Cost
$
2,805,789,077
)
...........................
2,712,388,195
a
Franklin
High
Income
Trust
Schedule
of
Investments
Franklin
High
Income
Fund
(continued)
Annual
Report
The
accompanying
notes
are
an
integral
part
of
these
financial
statements.
Short
Term
Investments
3.0%
a
a
Country
Shares
a
Value
a
a
a
a
a
a
Money
Market
Funds
3.0%
j,k
Institutional
Fiduciary
Trust
-
Money
Market
Portfolio
,
4.74
%
...
United
States
83,953,281
$
83,953,281
Total
Money
Market
Funds
(Cost
$
83,953,281
)
................................
83,953,281
Total
Short
Term
Investments
(Cost
$
83,953,281
)
..............................
83,953,281
a
Total
Investments
(Cost
$
2,889,742,358
)
99.4
%
................................
$2,796,341,476
Other
Assets,
less
Liabilities
0.6
%
...........................................
17,558,478
Net
Assets
100.0%
.........................................................
$2,813,899,954
a
a
a
See
Abbreviations
on
page
35
.
*
The
principal
amount
is
stated
in
U.S.
dollars
unless
otherwise
indicated.
†
Rounds
to
less
than
0.1%
of
net
assets.
a
Non-income
producing.
b
Fair
valued
using
significant
unobservable
inputs.
See
Note
10
regarding
fair
value
measurements.
c
Security
was
purchased
pursuant
to
Rule
144A
or
Regulation
S
under
the
Securities
Act
of
1933.
144A
securities
may
be
sold
in
transactions
exempt
from
registration
only
to
qualified
institutional
buyers
or
in
a
public
offering
registered
under
the
Securities
Act
of
1933.
Regulation
S
securities
cannot
be
sold
in
the
United
States
without
either
an
effective
registration
statement
filed
pursuant
to
the
Securities
Act
of
1933,
or
pursuant
to
an
exemption
from
registration.
At
September
30,
2024,
the
aggregate
value
of
these
securities
was
$2,394,823,276,
representing
85.1%
of
net
assets.
d
A
portion
or
all
of
the
security
purchased
on
a
delayed
delivery
basis.
See
Note
1(c).
e
Income
may
be
received
in
additional
securities
and/or
cash.
f
Defaulted
security
or
security
for
which
income
has
been
deemed
uncollectible.
See
Note
6.
g
See
Note
7
regarding
restricted
securities.
h
See
Note
1(e)
regarding
senior
floating
rate
interests.
i
The
coupon
rate
shown
represents
the
rate
inclusive
of
any
caps
or
floors,
if
applicable,
in
effect
at
period
end.
j
See
Note
3(f)
regarding
investments
in
affiliated
management
investment
companies.
k
The
rate
shown
is
the
annualized
seven-day
effective
yield
at
period
end.
Franklin
High
Income
Trust
Financial
Statements
Statement
of
Assets
and
Liabilities
September
30,
2024
The
accompanying
notes
are
an
integral
part
of
these
financial
statements.
Annual
Report
Franklin
High
Income
Fund
Assets:
Investments
in
securities:
Cost
-
Unaffiliated
issuers
...................................................................
$2,805,789,077
Cost
-
Non-controlled
affiliates
(Note
3f)
........................................................
83,953,281
Value
-
Unaffiliated
issuers
..................................................................
$2,712,388,195
Value
-
Non-controlled
affiliates
(Note
3f)
........................................................
83,953,281
Cash
....................................................................................
302,769
Receivables:
Capital
shares
sold
........................................................................
5,087,337
Interest
.................................................................................
46,356,692
Total
assets
..........................................................................
2,848,088,274
Liabilities:
Payables:
Investment
securities
purchased
..............................................................
30,300,000
Capital
shares
redeemed
...................................................................
1,635,880
Management
fees
.........................................................................
1,064,295
Distribution
fees
..........................................................................
401,410
Transfer
agent
fees
........................................................................
655,912
Trustees'
fees
and
expenses
.................................................................
2,299
Accrued
expenses
and
other
liabilities
...........................................................
128,524
Total
liabilities
.........................................................................
34,188,320
Net
assets,
at
value
.................................................................
$2,813,899,954
Net
assets
consist
of:
Paid-in
capital
.............................................................................
$3,764,789,440
Total
distributable
earnings
(losses)
.............................................................
(950,889,486)
Net
assets,
at
value
.................................................................
$2,813,899,954
Franklin
High
Income
Trust
Financial
Statements
Statement
of
Assets
and
Liabilities
(continued)
September
30,
2024
Annual
Report
The
accompanying
notes
are
an
integral
part
of
these
financial
statements.
Franklin
High
Income
Fund
Class
A:
Net
assets,
at
value
.......................................................................
$886,357,151
Shares
outstanding
........................................................................
506,420,531
Net
asset
value
per
share
a,b
..................................................................
$1.75
Maximum
offering
price
per
share
(net
asset
value
per
share
÷
96.25%)
b
................................
$1.82
Class
A1:
Net
assets,
at
value
.......................................................................
$1,288,613,170
Shares
outstanding
........................................................................
727,466,974
Net
asset
value
per
share
a,b
..................................................................
$1.77
Maximum
offering
price
per
share
(net
asset
value
per
share
÷
96.25%)
b
................................
$1.84
Class
C:
Net
assets,
at
value
.......................................................................
$77,858,285
Shares
outstanding
........................................................................
43,174,756
Net
asset
value
and
maximum
offering
price
per
share
a,b
............................................
$1.80
Class
R:
Net
assets,
at
value
.......................................................................
$59,228,863
Shares
outstanding
........................................................................
32,555,193
Net
asset
value
and
maximum
offering
price
per
share
b
.............................................
$1.82
Class
R6:
Net
assets,
at
value
.......................................................................
$203,691,069
Shares
outstanding
........................................................................
115,737,614
Net
asset
value
and
maximum
offering
price
per
share
b
.............................................
$1.76
Advisor
Class:
Net
assets,
at
value
.......................................................................
$298,151,416
Shares
outstanding
........................................................................
168,510,469
Net
asset
value
and
maximum
offering
price
per
share
b
.............................................
$1.77
a
Redemption
price
is
equal
to
net
asset
value
less
contingent
deferred
sales
charges,
if
applicable.
b
Net
asset
value
per
share
may
not
recalculate
due
to
rounding.
Franklin
High
Income
Trust
Financial
Statements
Statement
of
Operations
for
the
year
ended
September
30,
2024
The
accompanying
notes
are
an
integral
part
of
these
financial
statements.
Annual
Report
Franklin
High
Income
Fund
Investment
income:
Dividends:
Unaffiliated
issuers
........................................................................
$1,118,297
Non-controlled
affiliates
(Note
3
f
and
8
)
.........................................................
6,114,281
Interest:
Unaffiliated
issuers
........................................................................
181,518,774
Income
from
securities
loaned:
Unaffiliated
entities
(net
of
fees
and
rebates)
.....................................................
15,147
Total
investment
income
...................................................................
188,766,499
Expenses:
Management
fees
(Note
3
a
)
...................................................................
12,261,641
Distribution
fees:
(Note
3c
)
Class
A
................................................................................
1,973,607
Class
A1
...............................................................................
1,922,623
Class
C
................................................................................
496,673
Class
R
................................................................................
290,611
Transfer
agent
fees:
(Note
3e
)
Class
A
................................................................................
913,960
Class
A1
...............................................................................
1,478,198
Class
C
................................................................................
88,177
Class
R
................................................................................
67,068
Class
R6
...............................................................................
61,458
Advisor
Class
............................................................................
345,200
Custodian
fees
............................................................................
13,126
Reports
to
shareholders
fees
..................................................................
29,311
Registration
and
filing
fees
....................................................................
134,755
Professional
fees
...........................................................................
73,490
Trustees'
fees
and
expenses
..................................................................
31,966
Interest
expense
...........................................................................
1,614
Other
....................................................................................
65,153
Total
expenses
.........................................................................
20,248,631
Expenses
waived/paid
by
affiliates
(Note
3
f
and
3
g
)
..............................................
(281,553)
Net
expenses
.........................................................................
19,967,078
Net
investment
income
................................................................
168,799,421
Realized
and
unrealized
gains
(losses):
Net
realized
gain
(loss)
from:
Investments:
Unaffiliated
issuers
......................................................................
(20,374,999)
Net
change
in
unrealized
appreciation
(depreciation)
on:
Investments:
Unaffiliated
issuers
......................................................................
234,241,036
Net
realized
and
unrealized
gain
(loss)
............................................................
213,866,037
Net
increase
(decrease)
in
net
assets
resulting
from
operations
..........................................
$382,665,458
Franklin
High
Income
Trust
Financial
Statements
Statements
of
Changes
in
Net
Assets
Annual
Report
The
accompanying
notes
are
an
integral
part
of
these
financial
statements.
Franklin
High
Income
Fund
Year
Ended
September
30,
2024
Year
Ended
September
30,
2023
Increase
(decrease)
in
net
assets:
Operations:
Net
investment
income
.................................................
$168,799,421
$156,754,781
Net
realized
gain
(loss)
.................................................
(20,374,999)
(88,757,297)
Net
change
in
unrealized
appreciation
(depreciation)
...........................
234,241,036
218,607,102
Net
increase
(decrease)
in
net
assets
resulting
from
operations
................
382,665,458
286,604,586
Distributions
to
shareholders:
Class
A
.............................................................
(50,397,988)
(43,793,651)
Class
A1
............................................................
(81,878,983)
(83,818,560)
Class
C
.............................................................
(4,389,532)
(4,908,488)
Class
R
.............................................................
(3,400,497)
(3,415,674)
Class
R6
............................................................
(10,731,578)
(7,037,744)
Advisor
Class
........................................................
(19,544,783)
(18,731,050)
Total
distributions
to
shareholders
..........................................
(170,343,361)
(161,705,167)
Capital
share
transactions:
(Note
2
)
Class
A
.............................................................
111,023,510
38,806,961
Class
A1
............................................................
(90,568,844)
(102,183,735)
Class
C
.............................................................
(6,269,754)
(25,867,345)
Class
R
.............................................................
(2,597,980)
(3,916,072)
Class
R6
............................................................
75,935,057
20,255,453
Advisor
Class
........................................................
(21,387,489)
24,401,685
Total
capital
share
transactions
............................................
66,134,500
(48,503,053)
Net
increase
(decrease)
in
net
assets
...................................
278,456,597
76,396,366
Net
assets:
Beginning
of
year
.......................................................
2,535,443,357
2,459,046,991
End
of
year
...........................................................
$2,813,899,954
$2,535,443,357
Notes
to
Financial
Statements
Franklin
High
Income
Fund
1.
Organization
and
Significant
Accounting
Policies
Franklin
High
Income
Trust (Trust)
is
registered
under
the
Investment
Company
Act
of
1940
(1940
Act)
as
an
open-end
management
investment
company,
consisting
of one fund,
Franklin
High
Income
Fund (Fund).
The Fund
follows
the
accounting
and
reporting
guidance
in
Financial
Accounting
Standards
Board
(FASB)
Accounting
Standards
Codification
Topic
946,
Financial
Services
–
Investment
Companies
(ASC
946)
and applies
the
specialized
accounting
and
reporting
guidance
in
U.S.
Generally
Accepted
Accounting
Principles
(U.S.
GAAP),
including,
but
not
limited
to,
ASC
946.
The
Fund
offers six
classes
of
shares:
Class
A,
Class
A1,
Class
C,
Class
R,
Class
R6
and
Advisor
Class. Class
C
shares
automatically
convert
to
Class
A
shares
on
a
monthly
basis,
after
they
have
been
held
for
8
years.
Each
class
of
shares
may
differ
by
its
initial
sales
load,
contingent
deferred
sales
charges,
voting
rights
on
matters
affecting
a
single
class,
its
exchange
privilege
and
fees
due
to
differing
arrangements
for
distribution
and
transfer
agent
fees.
The
following
summarizes
the Fund's
significant
accounting
policies.
a.
Financial
Instrument
Valuation
The
Fund's
investments
in
financial
instruments
are
carried
at
fair
value
daily.
Fair
value
is
the
price
that
would
be
received
to
sell
an
asset
or
paid
to
transfer
a
liability
in
an
orderly
transaction
between
market
participants
on
the
measurement
date.
The
Fund
calculates
the
net
asset
value
(NAV)
per
share
each business
day as
of
4
p.m.
Eastern
time
or
the
regularly
scheduled
close
of
the
New
York
Stock
Exchange
(NYSE),
whichever
is
earlier.
Under
compliance
policies
and
procedures
approved
by
the Fund's
Board
of
Trustees
(the
Board),
the
Board
has
designated
the
Fund’s
investment
manager
as
the
valuation
designee
and
has
responsibility
for
oversight
of
valuation.
The
investment
manager
is
assisted
by
the
Fund’s
administrator
in
performing
this
responsibility,
including
leading
the
cross-
functional
Valuation
Committee
(VC).
The
Fund
may
utilize
independent
pricing
services,
quotations
from
securities
and
financial
instrument
dealers,
and
other
market
sources
to
determine
fair
value.
Equity
securities
listed
on
an
exchange
or
on
the
NASDAQ
National
Market
System
are
valued
at
the
last
quoted
sale
price
or
the
official
closing
price of
the
day,
respectively.
Foreign
equity
securities
are
valued
as
of
the
close
of
trading
on
the
foreign
stock
exchange
on
which
the
security
is
primarily
traded,
or
as
of
4
p.m.
Eastern
time.
The
value
is
then
converted
into
its
U.S.
dollar
equivalent
at
the
foreign
exchange
rate
in
effect
at
4
p.m.
Eastern
time
on
the
day
that
the
value
of
the
security
is
determined.
Over-the-counter
(OTC)
securities
are
valued
within
the
range
of
the
most
recent
quoted
bid
and
ask
prices.
Securities
that
trade
in
multiple
markets
or
on
multiple
exchanges
are
valued
according
to
the
broadest
and
most
representative
market.
Certain
equity
securities
are
valued
based
upon
fundamental
characteristics
or
relationships
to
similar
securities.
Debt
securities
generally
trade
in
the over-the-counter
(OTC)
market
rather
than
on
a
securities
exchange.
The
Fund's
pricing
services
use
multiple
valuation
techniques
to
determine
fair
value.
In
instances
where
sufficient
market
activity
exists,
the
pricing
services
may
utilize
a
market-based
approach
through
which
quotes
from
market
makers
are
used
to
determine
fair
value.
In
instances
where
sufficient
market
activity
may
not
exist
or
is
limited,
the
pricing
services
also
utilize
proprietary
valuation
models
which
may
consider
market
characteristics
such
as
benchmark
yield
curves,
credit
spreads,
estimated
default
rates,
anticipated
market
interest
rate
volatility,
coupon
rates,
anticipated
timing
of
principal
repayments,
underlying
collateral,
and
other
unique
security
features
in
order
to
estimate
the
relevant
cash
flows,
which
are
then
discounted
to
calculate
the
fair
value.
Investments
in open-end mutual
funds
are
valued
at
the
closing
NAV.
The
Fund
has
procedures
to
determine
the
fair
value
of
financial
instruments
for
which
market
prices
are
not
reliable
or
readily
available.
Under
these
procedures,
the Fund
primarily
employs
a
market-based
approach
which
may
use
related
or
comparable
assets
or
liabilities,
recent
transactions,
market
multiples,
and
other
relevant
information
for
the
investment
to
determine
the
fair
value
of
the
investment.
An
income-based
valuation
approach
may
also
be
used
in
which
the
anticipated
future
cash
flows
of
the
investment
are
discounted
to
calculate
fair
value.
Discounts
may
also
be
applied
due
to
the
nature
or
duration
of
any
restrictions
on
the
disposition
of
the
investments.
Due
to
the
inherent
uncertainty
of
valuations
of
such
investments,
the
fair
values
may
differ
significantly
from
the
values
that
would
have
been
used
had
an
active
market
existed.
Trading
in
securities
on
foreign
securities
stock
exchanges
and
OTC
markets
may
be
completed
before
4
p.m.
Eastern
time.
In
addition,
trading
in
certain
foreign
markets
may
not
Franklin
High
Income
Trust
Notes
to
Financial
Statements
Franklin
High
Income
Fund
(continued)
take
place
on
every
Fund's
business
day. Events
can occur
between
the
time
at
which
trading
in
a
foreign
security
is
completed
and
4
p.m.
Eastern
time
that
might
call
into
question
the
reliability
of
the
value
of
a
portfolio
security
held
by
the
Fund.
As
a
result,
differences
may
arise
between
the
value
of
the
Fund's
portfolio
securities
as
determined
at
the
foreign
market
close
and
the
latest
indications
of
value
at
4
p.m.
Eastern
time. In
order
to
minimize
the
potential
for
these
differences,
an
independent
pricing
service
may
be
used
to
adjust
the
value
of
the
Fund's
portfolio
securities
to
the
latest
indications
of
fair
value
at
4
p.m.
Eastern
time.
When
the
last
day
of
the
reporting
period
is
a
non-business
day,
certain
foreign
markets
may
be
open
on
those
days
that
the
Fund's
NAV
is
not
calculated,
which
could
result
in
differences
between
the
value
of
the
Fund's
portfolio
securities
on
the
last
business
day
and
the
last
calendar
day
of
the
reporting
period.
Any
security
valuation
changes
due
to
an
open
foreign
market
are
adjusted
and
reflected
by
the
Fund
for
financial
reporting
purposes.
b.
Foreign
Currency
Translation
Portfolio
securities
and
other
assets
and
liabilities
denominated
in
foreign
currencies
are
translated
into
U.S.
dollars
based
on
the
exchange
rate
of
such
currencies
against
U.S.
dollars
on
the
date
of
valuation.
The
Fund
may
enter
into
foreign
currency
exchange
contracts
to
facilitate
transactions
denominated
in
a
foreign
currency.
Purchases
and
sales
of
securities,
income
and
expense
items
denominated
in
foreign
currencies
are
translated
into
U.S.
dollars
at
the
exchange
rate
in
effect
on
the
transaction
date.
Portfolio
securities
and
assets
and
liabilities
denominated
in
foreign
currencies
contain
risks
that
those
currencies
will
decline
in
value
relative
to
the
U.S.
dollar.
Occasionally,
events
may
impact
the
availability
or
reliability
of
foreign
exchange
rates
used
to
convert
the
U.S.
dollar
equivalent
value.
If
such
an
event
occurs,
the
foreign
exchange
rate
will
be
valued
at
fair
value
using
procedures
established
and
approved
by
the
Board.
The
Fund
does
not
separately
report
the
effect
of
changes
in
foreign
exchange
rates
from
changes
in
market
prices
on
securities
held.
Such
changes
are
included
in
net
realized
and
unrealized
gain
or
loss
from
investments
in
the
Statement of
Operations.
Realized
foreign
exchange
gains
or
losses
arise
from
sales
of
foreign
currencies,
currency
gains
or
losses
realized
between
the
trade
and
settlement
dates
on
securities
transactions
and
the
difference
between
the
recorded
amounts
of
dividends,
interest,
and
foreign
withholding
taxes
and
the
U.S.
dollar
equivalent
of
the
amounts
actually
received
or
paid.
Net
unrealized
foreign
exchange
gains
and
losses
arise
from
changes
in
foreign
exchange
rates
on
foreign
denominated
assets
and
liabilities
other
than
investments
in
securities
held
at
the
end
of
the
reporting
period.
c.
Securities
Purchased
on
a
When-Issued,
Forward
Commitment or
Delayed
Delivery
Basis
The
Fund
may
purchase
securities
on
a when-issued,
forward
commitment
or
delayed
delivery basis,
with
payment
and
delivery
scheduled
for
a
future
date.
These
transactions
are
subject
to
market
fluctuations
and
are
subject
to
the
risk
that
the
value
at
delivery
may
be
more
or
less
than
the
trade
date
purchase
price.
Although
the
Fund
will
generally
purchase
these
securities
with
the
intention
of
holding
the
securities, it
may
sell
the
securities
before
the
settlement
date.
d.
Securities
Lending
The
Fund
participates
in
an
agency
based
securities
lending
program
to
earn
additional
income.
The
Fund
receives
collateral
in
the
form
of
cash
and/or
U.S.
Government
and
Agency
securities
against
the
loaned
securities
in
an
amount
equal
to
at
least
102%
of
the
fair
value
of
the
loaned
securities.
Collateral
is
maintained
over
the
life
of
the
loan
in
an
amount
not
less
than
100%
of
the
fair
value
of
loaned
securities,
as
determined
at
the
close
of
Fund
business
each
day;
any
additional
collateral
required
due
to
changes
in
security
values
is
delivered
to
the
Fund
on
the
next
business
day.
The
Fund
may
receive
income
from
the
investment
of
cash
collateral,
in
addition
to
lending
fees
paid
by
the
borrower.
Income
from
securities
loaned,
net
of
fees
paid
to
the
securities
lending
agent
and/or
third-party
vendor,
is
reported
separately
in
the
Statement
of
Operations.
The
Fund
bears
the
market
risk
with
respect
to any
cash collateral
investment,
securities
loaned,
and
the
risk
that
the
agent
may
default
on
its
obligations
to
the
Fund.
If
the
borrower
defaults
on
its
obligation
to
return
the
securities
loaned,
the
Fund
has
the
right
to
repurchase
the
securities
in
the
open
market
using
the
collateral
received.
The
securities
1.
Organization
and
Significant
Accounting
Policies
(continued)
a.
Financial
Instrument
Valuation
(continued)
Franklin
High
Income
Trust
Notes
to
Financial
Statements
Franklin
High
Income
Fund
(continued)
lending
agent
has
agreed
to
indemnify
the
Fund
in
the
event
of
default
by
a
third
party
borrower.
At
September
30,
2024,
the
Fund
had
no
securities
on
loan.
e.
Senior
Floating
Rate
Interests
The
Fund
invests
in
senior
secured
corporate
loans
that
pay
interest
at
rates
which
are
periodically
reset
by
reference
to
a
base
lending
rate
plus
a
spread.
These
base
lending
rates
are
generally
the
prime
rate
offered
by
a
designated
U.S.
bank
or
the
Secured
Overnight
Financing
Rate
(SOFR).
Senior
secured
corporate
loans
often
require
prepayment
of
principal
from
excess
cash
flows
or
at
the
discretion
of
the
borrower.
As
a
result,
actual
maturity
may
be
substantially
less
than
the
stated
maturity.
Senior
secured
corporate
loans
in
which
the Fund
invests
are
generally
readily
marketable,
but
may
be
subject
to
certain
restrictions
on
resale.
f.
Income
and
Deferred
Taxes
It
is the Fund's
policy
to
qualify
as
a
regulated
investment
company
under
the
Internal
Revenue
Code. The Fund
intends
to
distribute
to
shareholders
substantially
all
of
its
taxable
income
and
net
realized
gains
to
relieve
it
from
federal
income
and
excise
taxes.
As
a
result,
no
provision
for
U.S.
federal
income
taxes
is
required.
The Fund
may
be
subject
to
foreign
taxation
related
to
income
received,
capital
gains
on
the
sale
of
securities
and
certain
foreign
currency
transactions
in
the
foreign
jurisdictions
in
which
it
invests.
Foreign
taxes,
if
any,
are
recorded
based
on
the
tax
regulations
and
rates
that
exist
in
the
foreign
markets
in
which
the
Fund
invests.
When
a
capital
gain
tax
is
determined
to
apply,
the
Fund
records
an
estimated
deferred
tax
liability
in
an
amount
that
would
be
payable
if
the
securities
were
disposed
of
on
the
valuation
date.
The Fund
may
recognize
an
income
tax
liability
related
to
its
uncertain
tax
positions
under
U.S.
GAAP
when
the
uncertain
tax
position
has
a
less
than
50%
probability
that
it
will
be
sustained
upon
examination
by
the
tax
authorities
based
on
its
technical
merits.
As
of
September
30,
2024, the Fund
has
determined
that
no
tax
liability
is
required
in
its
financial
statements
related
to
uncertain
tax
positions
for
any
open
tax
years
(or
expected
to
be
taken
in
future
tax
years).
Open
tax
years
are
those
that
remain
subject
to
examination
and
are
based
on
the
statute
of
limitations
in
each
jurisdiction
in
which
the Fund
invests.
g.
Security
Transactions,
Investment
Income,
Expenses
and
Distributions
Security
transactions
are
accounted
for
on
trade
date.
Realized
gains
and
losses
on
security
transactions
are
determined
on
a
specific
identification
basis.
Interest
income
(including
interest
income
from
payment-in-kind
securities,
if
any)
and
estimated
expenses
are
accrued
daily.
Amortization
of
premium
and
accretion
of
discount
on
debt
securities
are
included
in
interest
income.
Paydown
gains
and
losses
are
recorded
as
an
adjustment
to
interest
income.
The
Fund
may
receive
other
income
from
investments
in
senior
secured
corporate
loans
or
unfunded
commitments,
including
amendment
fees,
consent
fees
or
commitment
fees.
These
fees
are
recorded
as
income
when
received
by
the
Fund.
Facility
fees
are
recognized
as
income
over
the
expected
term
of
the
loan.
Dividend
income
is
recorded
on
the
ex-
dividend
date
except
for
certain
dividends
from
securities
where
the
dividend
rate
is
not
available.
In
such
cases,
the
dividend
is
recorded
as
soon
as
the
information
is
received
by
the
Fund.
Distributions
to
shareholders
are
recorded
on
the
ex-dividend
date.
Distributable
earnings
are
determined
according
to
income
tax
regulations
(tax
basis)
and
may
differ
from
earnings
recorded
in
accordance
with
U.S.
GAAP.
These
differences
may
be
permanent
or
temporary.
Permanent
differences
are
reclassified
among
capital
accounts
to
reflect
their
tax
character.
These
reclassifications
have
no
impact
on
net
assets
or
the
results
of
operations.
Temporary
differences
are
not
reclassified,
as
they
may
reverse
in
subsequent
periods.
Realized
and
unrealized
gains
and
losses
and
net
investment
income,
excluding
class
specific
expenses,
are
allocated
daily
to
each
class
of
shares
based
upon
the
relative
proportion
of
net
assets
of
each
class.
Differences
in
per
share
distributions
by
class
are
generally
due
to
differences
in
class
specific
expenses.
h.
Accounting
Estimates
The
preparation
of
financial
statements
in
accordance
with
U.S.
GAAP
requires
management
to
make
estimates
and
assumptions
that
affect
the
reported
amounts
of
assets
and
liabilities
at
the
date
of
the
financial
statements
and
the
amounts
of
income
and
expenses
during
the
reporting
period.
Actual
results
could
differ
from
those
estimates.
1.
Organization
and
Significant
Accounting
Policies
(continued)
d.
Securities
Lending
(continued)
Franklin
High
Income
Trust
Notes
to
Financial
Statements
Franklin
High
Income
Fund
(continued)
i.
Guarantees
and
Indemnifications
Under
the Fund's
organizational
documents,
its
officers
and trustees
are
indemnified
by
the
Fund against
certain
liabilities
arising
out
of
the
performance
of
their
duties
to
the
Fund.
Additionally,
in
the
normal
course
of
business,
the
Fund
enters
into
contracts
with
service
providers
that
contain
general
indemnification
clauses.
The Fund's
maximum
exposure
under
these
arrangements
is
unknown
as
this
would
involve
future
claims
that
may
be
made
against
the Fund
that
have
not
yet
occurred.
Currently,
the Fund
expects
the
risk
of
loss
to
be
remote.
2.
Shares
of
Beneficial
Interest
At
September
30,
2024,
there
were
an
unlimited
number
of
shares
authorized
(without
par
value).
Transactions
in
the
Fund's
shares
were
as
follows:
Year
Ended
September
30,
2024
Year
Ended
September
30,
2023
Shares
Amount
Shares
Amount
Class
A
Shares:
Shares
sold
a
...................................
179,172,725
$303,694,538
164,259,008
$266,498,198
Shares
issued
in
reinvestment
of
distributions
..........
28,048,109
47,360,919
25,369,529
40,986,737
Shares
redeemed
...............................
(141,948,369)
(240,031,947)
(165,727,347)
(268,677,974)
Net
increase
(decrease)
..........................
65,272,465
$111,023,510
23,901,190
$38,806,961
Class
A1
Shares:
Shares
sold
...................................
24,951,539
$42,777,306
31,275,796
$51,183,105
Shares
issued
in
reinvestment
of
distributions
..........
42,169,099
71,949,430
45,166,418
73,731,606
Shares
redeemed
...............................
(120,326,117)
(205,295,580)
(138,736,468)
(227,098,446)
Net
increase
(decrease)
..........................
(53,205,479)
$(90,568,844)
(62,294,254)
$(102,183,735)
Class
C
Shares:
Shares
sold
...................................
9,440,841
$16,440,073
8,237,311
$13,715,527
Shares
issued
in
reinvestment
of
distributions
..........
2,361,969
4,098,063
2,765,299
4,586,429
Shares
redeemed
a
..............................
(15,486,212)
(26,807,890)
(26,737,253)
(44,169,301)
Net
increase
(decrease)
..........................
(3,683,402)
$(6,269,754)
(15,734,643)
$(25,867,345)
Class
R
Shares:
Shares
sold
...................................
8,203,685
$14,395,641
5,971,275
$10,046,457
Shares
issued
in
reinvestment
of
distributions
..........
1,932,258
3,380,292
2,034,038
3,401,699
Shares
redeemed
...............................
(11,604,859)
(20,373,913)
(10,333,832)
(17,364,228)
Net
increase
(decrease)
..........................
(1,468,916)
$(2,597,980)
(2,328,519)
$(3,916,072)
Class
R6
Shares:
Shares
sold
...................................
74,796,347
$126,685,732
54,327,226
$88,684,219
Shares
issued
in
reinvestment
of
distributions
..........
5,865,975
9,989,891
4,118,456
6,697,631
Shares
redeemed
...............................
(35,729,192)
(60,740,566)
(45,938,906)
(75,126,397)
Net
increase
(decrease)
..........................
44,933,130
$75,935,057
12,506,776
$20,255,453
Advisor
Class
Shares:
Shares
sold
...................................
95,432,249
$160,904,436
117,682,569
$192,591,222
Shares
issued
in
reinvestment
of
distributions
..........
10,732,721
18,278,967
10,742,738
17,526,512
Shares
redeemed
...............................
(118,246,478)
(200,570,892)
(113,307,304)
(185,716,049)
Net
increase
(decrease)
..........................
(12,081,508)
$(21,387,489)
15,118,003
$24,401,685
1.
Organization
and
Significant
Accounting
Policies
(continued)
Franklin
High
Income
Trust
Notes
to
Financial
Statements
Franklin
High
Income
Fund
(continued)
3.
Transactions
with
Affiliates
Franklin
Resources,
Inc.
is
the
holding
company
for
various
subsidiaries
that
together
are
referred
to
as
Franklin
Templeton.
Certain
officers
and trustees
of
the Fund are
also
officers
and/or
directors
of
the
following
subsidiaries:
a.
Management
Fees
The
Fund
pays
an
investment
management
fee,
calculated
daily
and
paid
monthly,
to
Advisers
based
on
the
month-end
net
assets
of
the
Fund
as
follows:
For
the
year
ended
September
30,
2024,
the
gross
effective
investment
management
fee
rate
was 0.460%
of
the
Fund’s
average daily
net
assets.
b.
Administrative
Fees
Under
an
agreement
with
Advisers,
FT
Services
provides
administrative
services
to
the
Fund.
The
fee
is
paid
by
Advisers
based
on
the
Fund's
average
daily
net
assets,
and
is
not
an
additional
expense
of
the
Fund.
c.
Distribution
Fees
The
Board
has
adopted
distribution
plans
for
each
share
class,
with
the
exception
of
Class
R6
and
Advisor
Class
shares,
pursuant
to
Rule
12b-1
under
the
1940
Act.
Under
the
Fund's
Class
A
and
A1
reimbursement
distribution
plan,
the
Fund
reimburses
Distributors
for
costs
incurred
in
connection
with
the
servicing,
sale
and
distribution
of the
Fund's
shares
up
to
the
maximum
annual
plan
rate
for
each
class.
Under
the
Class
A
and
A1
reimbursement
distribution
plan,
costs
exceeding
the
maximum
for
the
current
plan
year
cannot
be
reimbursed
in
subsequent
periods.
In
addition,
under
the
Fund's
Class
C
and
R
compensation
distribution
plans,
the
Fund
pays
Distributors
for
costs
incurred
in
connection
with
the
servicing,
sale
and
distribution
of
the
Fund's
shares
up
to
the
maximum
annual
plan
rate
for
each
class.
The
plan
year,
for
purposes
of
monitoring
compliance
with
the
maximum
annual
plan
rates,
is
February
1
through
January
31.
a
May
include
a
portion
of
Class
C
shares
that
were
automatically
converted
to
Class
A.
Subsidiary
Affiliation
Franklin
Advisers,
Inc.
(Advisers)
Investment
manager
Franklin
Templeton
Services,
LLC
(FT
Services)
Administrative
manager
Franklin
Distributors,
LLC
(Distributors)
Principal
underwriter
Franklin
Templeton
Investor
Services,
LLC
(Investor
Services)
Transfer
agent
Annualized
Fee
Rate
Net
Assets
0.625%
Up
to
and
including
$100
million
0.500%
Over
$100
million,
up
to
and
including
$250
million
0.450%
Over
$250
million,
up
to
and
including
$7.5
billion
0.440%
Over
$7.5
billion,
up
to
and
including
$10
billion
0.430%
Over
$10
billion,
up
to
and
including
$12.5
billion
0.420%
Over
$12.5
billion,
up
to
and
including
$15
billion
0.400%
Over
$15
billion,
up
to
and
including
$17.5
billion
0.380%
Over
$17.5
billion,
up
to
and
including
$20
billion
0.360%
Over
$20
billion,
up
to
and
including
$35
billion
0.355%
Over
$35
billion,
up
to
and
including
$50
billion
0.350%
In
excess
of
$50
billion
2.
Shares
of
Beneficial
Interest
(continued)
Franklin
High
Income
Trust
Notes
to
Financial
Statements
Franklin
High
Income
Fund
(continued)
The
maximum
annual
plan
rates,
based
on
the
average
daily
net
assets,
for
each
class,
are
as
follows:
d.
Sales
Charges/Underwriting
Agreements
Front-end
sales
charges
and
contingent
deferred
sales
charges
(CDSC)
do
not
represent
expenses
of
the
Fund.
These
charges
are
deducted
from
the
proceeds
of
sales
of
fund
shares
prior
to
investment
or
from
redemption
proceeds
prior
to
remittance,
as
applicable.
Distributors
has
advised
the
Fund
of
the
following
commission
transactions
related
to
the
sales
and
redemptions
of
the
Fund's
shares
for
the
year:
e.
Transfer
Agent
Fees
Each
class
of
shares pays
transfer
agent
fees,
calculated
monthly
and
paid
monthly, to
Investor
Services
for
its
performance
of
shareholder
servicing
obligations. Effective
October
1,
2023,
the
fees
are based
on
a
fixed
margin
earned
by
Investor
Services
and
are allocated
to
the Fund
based
upon
relative
assets
and
relative
transactions.
Prior
to
October
1,
2023,
the
fees
were
based
on
an
annualized
asset
based
fee
of
0.016%
plus
a
transaction
based
fee. In
addition,
each
class reimburses
Investor
Services
for
out
of
pocket
expenses
incurred
and,
except
for
Class
R6, reimburses
shareholder
servicing
fees
paid
to
third
parties.
These
fees
paid
to
third
parties
are
accrued
and
allocated
daily
based
upon
their
relative
proportion
of
such
classes'
aggregate
net
assets.
Class
R6
pays
Investor
Services
transfer
agent
fees
allocated
specifically
to
that
class
based
upon
its
relative
assets
and
relative
transactions.
For
the
year
ended
September
30,
2024,
the Fund
paid
transfer
agent
fees
as
noted
in
the
Statement of
Operations,
of
which
$1,094,393
was
retained
by
Investor
Services.
f.
Investments
in
Affiliated
Management
Investment
Companies
The
Fund
invests
in
one
or
more
affiliated
management
investment
companies.
As
defined
in
the
1940
Act,
an
investment
is
deemed
to
be
a
“Controlled
Affiliate”
of
a
fund
when
a
fund
owns,
either
directly
or
indirectly,
25%
or
more
of
the
affiliated
fund’s
outstanding
shares
or
has
the
power
to
exercise
control
over
management
or
policies
of
such
fund.
The
Fund
does
not
invest
for
purposes
of
exercising
a
controlling
influence
over
the
management
or
policies.
Management
fees
paid
by
the
Fund
are
waived
on
assets
invested
in
the
affiliated
management
investment
companies,
as
noted
in
the
Statement
of
Operations,
in
an
amount
not
to
exceed
the
management
and
administrative
fees
paid
directly
or
indirectly
by
each
affiliate.
During
the
year
ended
September
30,
2024,
the
Fund
held
investments
in
affiliated
management
investment
companies
as
follows:
Class
A
....................................................................................
0.25%
Class
A1
...................................................................................
0.15%
Class
C
....................................................................................
0.65%
Class
R
....................................................................................
0.50%
Sales
charges
retained
net
of
commissions
paid
to
unaffiliated
brokers/dealers
..............................
$102,875
CDSC
retained
..............................................................................
$28,703
3.
Transactions
with
Affiliates
(continued)
c.
Distribution
Fees
(continued)
Franklin
High
Income
Trust
Notes
to
Financial
Statements
Franklin
High
Income
Fund
(continued)
g.
Waiver
and
Expense
Reimbursements
Transfer
agent
fees
on
Class
R6
shares
of
the
Fund have
been
capped
so
that
transfer
agent
fees
for
that
class
do
not
exceed
0.03%
based
on
the
average
net
assets
of
the
class
until January 31,
2025.
4.
Income
Taxes
For
tax
purposes,
capital
losses
may
be
carried
over
to
offset
future
capital
gains.
At
September
30,
2024,
the
capital
loss
carryforwards
were
as
follows:
The
tax
character
of
distributions
paid
during
the
years
ended
September
30,
2024
and
2023
,
was
as
follows:
At
September
30,
2024,
the
cost
of
investments,
net
unrealized
appreciation
(depreciation)
and
undistributed
ordinary
income for
income
tax
purposes
were
as
follows:
Differences
between
income
and/or
capital
gains
as
determined
on
a
book
basis
and
a
tax
basis
are
primarily
due
to
differing
treatments
of
defaulted
securities
and
bond
discounts
and
premiums.
aa
Value
at
Beginning
of
Year
Purchases
Sales
Realized
Gain
(Loss)
Net
Change
in
Unrealized
Appreciation
(Depreciation)
Value
at
End
of
Year
Number
of
Shares
Held
at
End
of
Year
Investment
Income
a
a
a
a
a
a
a
a
Franklin
High
Income
Fund
Non-Controlled
Affiliates
Dividends
Institutional
Fiduciary
Trust
-
Money
Market
Portfolio,
4.74%
.
$49,084,957
$845,016,049
$(810,147,725)
$—
$—
$83,953,281
83,953,281
$3,870,448
Total
Affiliated
Securities
...
$49,084,957
$845,016,049
$(810,147,725)
$—
$—
$83,953,281
$3,870,448
Capital
loss
carryforwards
not
subject
to
expiration:
Long
term
................................................................................
$848,807,102
2024
2023
Distributions
paid
from:
Ordinary
income
..........................................................
$170,343,361
$161,705,167
Cost
of
investments
..........................................................................
$2,899,418,089
Unrealized
appreciation
........................................................................
$78,164,421
Unrealized
depreciation
........................................................................
(181,241,034)
Net
unrealized
appreciation
(depreciation)
..........................................................
$(103,076,613)
Distributable
earnings:
Undistributed
ordinary
income
...................................................................
$994,230
3.
Transactions
with
Affiliates
(continued)
f.
Investments
in
Affiliated
Management
Investment
Companies
(continued)
Franklin
High
Income
Trust
Notes
to
Financial
Statements
Franklin
High
Income
Fund
(continued)
5.
Investment
Transactions
Purchases
and
sales
of
investments (excluding
short
term
securities) for
the
year
ended
September
30,
2024,
aggregated
$987,348,522 and
$946,194,858,
respectively.
6.
Credit
Risk
and
Defaulted
Securities
At
September
30,
2024,
the
Fund
had 86.6%
of
its
portfolio
invested
in
high
yield
securities,
senior
secured
floating
rate
loans,
or
other
securities
rated
below
investment
grade
and
unrated
securities.
These
securities
may
be
more
sensitive
to
economic
conditions
causing
greater
price
volatility
and
are
potentially
subject
to
a
greater
risk
of
loss
due
to
default
than
higher
rated
securities.
The
Fund held
defaulted
securities
and/or
other
securities
for
which
the
income
has
been
deemed
uncollectible.
At
September
30,
2024,
the
aggregate
value
of
these
securities
represents
less
than
0.1%
of
the
Fund's
net
assets.
The
Fund
discontinues
accruing
income
on
securities
for
which
income
has
been
deemed
uncollectible
and
provides
an
estimate
for
losses
on
interest
receivable.
The
securities
have
been
identified
in
the
accompanying
Schedule
of
Investments.
7.
Restricted
Securities
The
Fund
invests
in
securities
that
are
restricted
under
the
Securities
Act
of
1933
(1933
Act).
Restricted
securities
are
often
purchased
in
private
placement
transactions,
and
cannot
be
sold
without
prior
registration
unless
the
sale
is
pursuant
to
an
exemption
under
the
1933
Act.
Disposal
of
these
securities
may
require
greater
effort
and
expense,
and
prompt
sale
at
an
acceptable
price
may
be
difficult.
The Fund
may
have
registration
rights
for
restricted
securities.
The
issuer
generally
incurs
all
registration
costs.
At
September
30,
2024,
investments
in
restricted
securities,
excluding
securities
exempt
from
registration
under
the
1933
Act,
were
as
follows:
8.
Holdings
of
5%
Voting
Securities
of
Portfolio
Companies
The
1940
Act
defines
"affiliated
companies"
to
include
investments
in
portfolio
companies
in
which
a
fund
owns
5%
or
more
of
the
outstanding
voting
securities.
Additionally,
as
defined
in
the
1940
Act,
an
investment
is
deemed
to
be
a
“Controlled
Affiliate”
of
a
fund
when
a
fund
owns,
either
directly
or
indirectly,
25%
or
more
of
the
affiliated
companies’
outstanding
shares
or
has
the
power
to
exercise
control
over
management
or
policies
of
such
company.
During
the
year
ended
September
30,
2024,
investments
in
“affiliated
companies”
were
as
follows:
Principal
Amount
*
Issuer
Acquisition
Date
Cost
Value
Franklin
High
Income
Fund
18,564,500
Murray
Energy
Corp.,
Secured
Note,
144A,
PIK,
12%,
4/15/24
..................................
4/09/15
-
4/15/19
$
20,764,441
$
—
Total
Restricted
Securities
(Value
is
—%
of
Net
Assets)
..............
$20,764,441
$—
*
In
U.S.
dollars
unless
otherwise
indicated.
Franklin
High
Income
Trust
Notes
to
Financial
Statements
Franklin
High
Income
Fund
(continued)
9.
Credit
Facility
The
Fund,
together
with
other
U.S.
registered
and
foreign
investment
funds
(collectively,
Borrowers),
managed
by
Franklin
Templeton,
are
borrowers
in
a
joint
syndicated
senior
unsecured
credit
facility
totaling
$2.675
billion
(Global
Credit
Facility)
which
matures
on
January
31,
2025.
This
Global
Credit
Facility
provides
a
source
of
funds
to
the
Borrowers
for
temporary
and
emergency
purposes,
including
the
ability
to
meet
future
unanticipated
or
unusually
large
redemption
requests.
Under
the
terms
of
the
Global
Credit
Facility,
the
Fund
shall,
in
addition
to
interest
charged
on
any
borrowings
made
by
the
Fund
and
other
costs
incurred
by
the
Fund,
pay
its
share
of
fees
and
expenses
incurred
in
connection
with
the
implementation
and
maintenance
of
the
Global
Credit
Facility,
based
upon
its
relative
share
of
the
aggregate
net
assets
of
all
of
the
Borrowers,
including
an
annual
commitment
fee
of
0.15%
based
upon
the
unused
portion
of
the
Global
Credit
Facility.
These
fees
are
reflected
in
other
expenses
in
the
Statement
of
Operations.
During
the
year
ended
September
30,
2024,
the Fund
did
not
use
the
Global
Credit
Facility.
10.
Fair
Value
Measurements
The
Fund
follows
a
fair
value
hierarchy
that
distinguishes
between
market
data
obtained
from
independent
sources
(observable
inputs)
and
the Fund's
own
market
assumptions
(unobservable
inputs).
These
inputs
are
used
in
determining
the
value
of
the
Fund's financial
instruments
and
are
summarized
in
the
following
fair
value
hierarchy:
Level
1
–
quoted
prices
in
active
markets
for
identical
financial
instruments
Level
2
–
other
significant
observable
inputs
(including
quoted
prices
for
similar
financial
instruments,
interest
rates,
prepayment
speed,
credit
risk,
etc.)
Level
3
–
significant
unobservable
inputs
(including
the
Fund's
own
assumptions
in
determining
the
fair
value
of
financial
instruments)
Value
at
Beginning
of
Year
Purchases
Sales
Realized
Gain
(Loss)
Net
Change
in
Unrealized
Appreciation
(Depreciation)
Value
at
End
of
Year
Number
of
Shares
Held
at
End
of
Year
Investment
Income
Franklin
High
Income
Fund
Non-Controlled
Affiliates
Dividends
Birch
Permian
Holdings,
Inc
.............
$
8,716,426
$
—
$
—
$
—
$
—
a
$
—
a
—
a
$
2,243,833
Total
Affiliated
Securities
(Value
is
—%
of
Net
Assets)
..........
$8,716,426
$—
$—
$—
$—
$—
$2,243,833
a
As
of
September
30,
2024,
no
longer
an
affiliate.
8.
Holdings
of
5%
Voting
Securities
of
Portfolio
Companies
(continued)
Franklin
High
Income
Trust
Notes
to
Financial
Statements
Franklin
High
Income
Fund
(continued)
The
input
levels
are
not
necessarily
an
indication
of
the
risk
or
liquidity
associated
with
financial
instruments
at
that
level.
A
summary
of
inputs
used
as
of
September
30,
2024,
in
valuing
the
Fund's assets carried
at
fair
value,
is
as
follows:
Level
1
Level
2
Level
3
Total
Franklin
High
Income
Fund
Assets:
Investments
in
Securities:
Common
Stocks
:
Metals
&
Mining
.......................
$
1,026,438
$
—
$
—
$
1,026,438
Oil,
Gas
&
Consumable
Fuels
.............
132,338
4,983,725
—
5,116,063
Pharmaceuticals
.......................
3,691,899
—
—
3,691,899
Specialty
Retail
........................
—
—
—
a
—
Warrants
:
Oil,
Gas
&
Consumable
Fuels
.............
54,972
—
—
a
54,972
Corporate
Bonds
:
Aerospace
&
Defense
...................
—
48,949,588
—
48,949,588
Automobile
Components
.................
—
70,012,857
—
70,012,857
Automobiles
..........................
—
18,196,181
—
18,196,181
Beverages
...........................
—
11,037,896
—
11,037,896
Biotechnology
.........................
—
9,375,595
—
9,375,595
Broadline
Retail
.......................
—
3,902,449
—
3,902,449
Building
Products
......................
—
69,905,889
—
69,905,889
Capital
Markets
........................
—
15,041,060
—
15,041,060
Chemicals
...........................
—
92,007,079
—
a
92,007,079
Commercial
Services
&
Supplies
...........
—
74,863,874
—
74,863,874
Communications
Equipment
..............
—
13,731,813
—
13,731,813
Construction
&
Engineering
...............
—
8,651,765
—
8,651,765
Consumer
Finance
.....................
—
79,382,822
—
79,382,822
Consumer
Staples
Distribution
&
Retail
......
—
10,940,876
—
10,940,876
Containers
&
Packaging
.................
—
92,956,026
—
92,956,026
Distributors
...........................
—
18,429,837
—
18,429,837
Diversified
Consumer
Services
............
—
13,436,852
—
13,436,852
Diversified
REITs
......................
—
42,975,338
—
42,975,338
Diversified
Telecommunication
Services
.....
—
58,190,141
—
58,190,141
Electric
Utilities
........................
—
27,824,630
—
27,824,630
Electrical
Equipment
....................
—
34,642,461
—
34,642,461
Electronic
Equipment,
Instruments
&
Components
........................
—
13,835,912
—
13,835,912
Energy
Equipment
&
Services
.............
—
73,836,886
—
73,836,886
Entertainment
.........................
—
15,915,106
—
15,915,106
Financial
Services
......................
—
104,041,884
—
104,041,884
Food
Products
........................
—
32,214,590
—
32,214,590
Ground
Transportation
..................
—
61,039,714
—
61,039,714
Health
Care
Equipment
&
Supplies
.........
—
30,671,108
—
30,671,108
Health
Care
Providers
&
Services
..........
—
116,090,401
—
116,090,401
Health
Care
REITs
.....................
—
22,710,717
—
22,710,717
Hotel
&
Resort
REITs
...................
—
28,623,441
—
28,623,441
Hotels,
Restaurants
&
Leisure
.............
—
203,272,499
—
a
203,272,499
Household
Durables
....................
—
63,550,917
—
63,550,917
Household
Products
....................
—
7,963,200
—
7,963,200
Independent
Power
and
Renewable
Electricity
Producers
..........................
—
35,022,837
—
35,022,837
Insurance
............................
—
67,775,581
—
67,775,581
IT
Services
...........................
—
52,113,665
—
52,113,665
Machinery
............................
—
52,503,705
—
52,503,705
Media
...............................
—
106,665,121
—
106,665,121
Metals
&
Mining
.......................
—
64,444,231
—
64,444,231
10.
Fair
Value
Measurements
(continued)
Franklin
High
Income
Trust
Notes
to
Financial
Statements
Franklin
High
Income
Fund
(continued)
a
Includes
financial
instruments
determined
to
have
no
value
.
A
reconciliation
in
which
Level
3
inputs
are
used
in
determining
fair
value
is
presented
when
there
are
significant
Level
3
assets
and/or
liabilities
at
the
beginning
and/or
end
of
the
year
.
11.
Subsequent
Events
The
Fund
has
evaluated
subsequent
events
through
the
issuance
of
the
financial
statements
and
determined
that
no
events
have
occurred
that
require
disclosure.
Abbreviations
Level
1
Level
2
Level
3
Total
Franklin
High
Income
Fund
(continued)
Assets:
(continued)
Investments
in
Securities:
Corporate
Bonds:
Mortgage
Real
Estate
Investment
Trusts
(REITs)
............................
$
—
$
27,881,734
$
—
$
27,881,734
Oil,
Gas
&
Consumable
Fuels
.............
—
349,387,006
—
a
349,387,006
Paper
&
Forest
Products
.................
—
7,372,941
—
7,372,941
Passenger
Airlines
.....................
—
30,062,630
—
30,062,630
Personal
Care
Products
.................
—
12,687,651
—
12,687,651
Pharmaceuticals
.......................
—
36,582,085
—
36,582,085
Real
Estate
Management
&
Development
....
—
28,879,887
—
28,879,887
Software
.............................
—
22,266,318
—
22,266,318
Specialized
REITs
......................
—
19,532,704
—
19,532,704
Specialty
Retail
........................
—
13,594,428
—
13,594,428
Textiles,
Apparel
&
Luxury
Goods
..........
—
15,881,057
—
15,881,057
Trading
Companies
&
Distributors
..........
—
63,257,888
—
63,257,888
Wireless
Telecommunication
Services
.......
—
41,636,445
14,883
41,651,328
Senior
Floating
Rate
Interests
...............
—
66,432,059
—
66,432,059
Escrows
and
Litigation
Trusts
...............
—
282,563
—
a
282,563
Short
Term
Investments
...................
83,953,281
—
—
83,953,281
Total
Investments
in
Securities
...........
$88,858,928
$2,707,467,665
$14,883
$2,796,341,476
Selected
Portfolio
CME
Chicago
Mercantile
Exchange
PIK
Payment-In-Kind
REIT
Real
Estate
Investment
Trust
SOFR
Secured
Overnight
Financing
Rate
10.
Fair
Value
Measurements
(continued)
Report
of
Independent
Registered
Public
Accounting
Firm
To
the
Board
of
Trustees
of
Franklin
High
Income
Trust
and
Shareholders
of
Franklin
High
Income
Fund
Opinion
on
the
Financial
Statements
We
have
audited
the
accompanying
statement
of
assets
and
liabilities,
including
the
schedule
of
investments,
of
Franklin
High
Income
Fund
(the
"Fund")
as
of
September
30,
2024,
the
related
statement
of
operations
for
the
year
ended
September
30,
2024,
the
statement
of
changes
in
net
assets
for
each
of
the
two
years
in
the
period
ended
September
30,
2024,
including
the
related
notes,
and
the
financial
highlights
for
each
of
the
two
years
in
the
period
ended
September
30,
2024,
the
period
June
1,
2022
to
September
30,
2022
and
each
of
the
three
years
in
the
period
ended
May
31,
2022
(collectively
referred
to
as
the
“financial
statements”).
In
our
opinion,
the
financial
statements
present
fairly,
in
all
material
respects,
the
financial
position
of
the
Fund
as
of
September
30,
2024,
the
results
of
its
operations
for
the
year
then
ended,
the
changes
in
its
net
assets
for
each
of
the
two
years
in
the
period
ended
September
30,
2024
and
the
financial
highlights
for
each
of
the
two
years
in
the
period
ended
September
30,
2024,
the
period
June
1,
2022
to
September
30,
2022,
and
each
of
the
three
years
in
the
period
ended
May
31,
2022
in
conformity
with
accounting
principles
generally
accepted
in
the
United
States
of
America.
Basis
for
Opinion
These
financial
statements
are
the
responsibility
of
the
Fund’s
management.
Our
responsibility
is
to
express
an
opinion
on
the
Fund’s
financial
statements
based
on
our
audits.
We
are
a
public
accounting
firm
registered
with
the
Public
Company
Accounting
Oversight
Board
(United
States)
(PCAOB)
and
are
required
to
be
independent
with
respect
to
the
Fund
in
accordance
with
the
U.S.
federal
securities
laws
and
the
applicable
rules
and
regulations
of
the
Securities
and
Exchange
Commission
and
the
PCAOB.
We
conducted
our
audits
of
these
financial
statements
in
accordance
with
the
standards
of
the
PCAOB.
Those
standards
require
that
we
plan
and
perform
the
audit
to
obtain
reasonable
assurance
about
whether
the
financial
statements
are
free
of
material
misstatement,
whether
due
to
error
or
fraud.
Our
audits
included
performing
procedures
to
assess
the
risks
of
material
misstatement
of
the
financial
statements,
whether
due
to
error
or
fraud,
and
performing
procedures
that
respond
to
those
risks.
Such
procedures
included
examining,
on
a
test
basis,
evidence
regarding
the
amounts
and
disclosures
in
the
financial
statements.
Our
audits
also
included
evaluating
the
accounting
principles
used
and
significant
estimates
made
by
management,
as
well
as
evaluating
the
overall
presentation
of
the
financial
statements.
Our
procedures
included
confirmation
of
securities
owned
as
of
September
30,
2024
by
correspondence
with
the
custodian,
transfer
agent
and
brokers;
when
replies
were
not
received
from
brokers,
we
performed
other
auditing
procedures.
We
believe
that
our
audits
provide
a
reasonable
basis
for
our
opinion.
/s/PricewaterhouseCoopers
LLP
San
Francisco,
California
November
18,
2024
We
have
served
as
the
auditor
of
one
or
more
investment
companies
in
the
Franklin
Templeton
Group
of
Funds
since
1948.
Tax
Information
(unaudited)
Franklin
High
Income
Fund
By
mid-February,
tax
information
related
to
a
shareholder's
proportionate
share
of
distributions
paid
during
the
preceding
calendar
year
will
be
received,
if
applicable.
Please
also
refer
to
www.franklintempleton.com
for
per
share
tax
information
related
to
any
distributions
paid
during
the
preceding
calendar
year.
Shareholders
are
advised
to
consult
with
their
tax
advisors
for
further
information
on
the
treatment
of
these
amounts
on
their
tax
returns.
The
following
tax
information
for
the
Fund
is
required
to
be
furnished
to
shareholders
with
respect
to
income
earned
and
distributions
paid
during
its
fiscal
year.
The
Fund
hereby
reports
the
following
amounts,
or
if
subsequently
determined
to
be
different,
the
maximum
allowable
amounts,
for
the
fiscal
year
ended
September
30,
2024:
Pursuant
to:
Amount
Reported
Income
Eligible
for
Dividends
Received
Deduction
(DRD)
§854(b)(1)(A)
$3,362,373
Qualified
Dividend
Income
Earned
(QDI)
§854(b)(1)(B)
$3,362,373
Qualified
Net
Interest
Income
(QII)
§871(k)(1)(C)
$131,010,989
Section
163(j)
Interest
Earned
§163(j)
$164,428,191
FRANKLIN
HIGH
INCOME
TRUST
Franklin
High
Income
Fund
(Fund)
At
an
in-person
meeting
held
on
May
22,
2024
(Meeting),
the
Board
of
Trustees
(Board)
of
Franklin
High
Income
Trust
(Trust),
including
a
majority
of
the
trustees
who
are
not
“interested
persons”
as
defined
in
the
Investment
Company
Act
of
1940
(Independent
Trustees),
reviewed
and
approved
the
continuance
of
the
investment
management
agreement
between
Franklin
Advisers,
Inc.
(Manager)
and
the
Trust,
on
behalf
of
the
Fund
(Management
Agreement)
for
an
additional
one-year
period.
The
Independent
Trustees
received
advice
from
and
met
separately
with
Independent
Trustee
counsel
in
considering
whether
to
approve
the
continuation
of
the
Management
Agreement.
In
considering
the
continuation
of
the
Management
Agreement,
the
Board
reviewed
and
considered
information
provided
by
the
Manager
at
the
Meeting
and
throughout
the
year
at
meetings
of
the
Board
and
its
committees.
The
Board
also
reviewed
and
considered
information
provided
in
response
to
a
detailed
set
of
requests
for
information
submitted
to
the
Manager
by
Independent
Trustee
counsel
on
behalf
of
the
Independent
Trustees
in
connection
with
the
annual
contract
renewal
process.
In
addition,
prior
to
the
Meeting,
the
Independent
Trustees
held
a
virtual
contract
renewal
meeting
at
which
the
Independent
Trustees
first
conferred
amongst
themselves
and
Independent
Trustee
counsel
about
contract
renewal
matters,
and
then
met
with
management
to
request
additional
information
that
the
Independent
Trustees
reviewed
and
considered
prior
to
and
at
the
Meeting.
The
Board
reviewed
and
considered
all
of
the
factors
it
deemed
relevant
in
approving
the
continuance
of
the
Management
Agreement,
including,
but
not
limited
to:
(i)
the
nature,
extent
and
quality
of
the
services
provided
by
the
Manager;
(ii)
the
investment
performance
of
the
Fund;
(iii)
the
costs
of
the
services
provided
and
profits
realized
by
the
Manager
and
its
affiliates
from
the
relationship
with
the
Fund;
(iv)
the
extent
to
which
economies
of
scale
are
realized
as
the
Fund
grows;
and
(v)
whether
fee
levels
reflect
these
economies
of
scale
for
the
benefit
of
Fund
investors.
Changes
In
and
Disagreements
with
Accountants
For
the
period
covered
by
this
report
Not
applicable.
Results
of
Meeting(s)
of
Shareholders
For
the
period
covered
by
this
report
Not
applicable.
Remuneration
Paid
to
Directors,
Officers
and
Others
For
the
period
covered
by
this
report
Refer
to
the
financial
statements
included
herein.
Board
Approval
of
Management
and
Subadvisory
Agreements
For
the
period
covered
by
this
report
In
approving
the
continuance
of
the
Management
Agreement,
the
Board,
including
a
majority
of
the
Independent
Trustees,
determined,
through
the
exercise
of
its
business
judgment,
that
the
terms
of
the
Management
Agreement
are
fair
and
reasonable
and
that
the
continuance
of
the
Management
Agreement
is
in
the
best
interests
of
the
Fund
and
its
shareholders.
While
attention
was
given
to
all
information
furnished,
the
following
discusses
some
primary
factors
relevant
to
the
Board’s
determination.
Nature,
Extent
and
Quality
of
Services
The
Board
reviewed
and
considered
information
regarding
the
nature,
extent
and
quality
of
investment
management
services
provided
by
the
Manager
and
its
affiliates
to
the
Fund
and
its
shareholders.
This
information
included,
among
other
things,
the
qualifications,
background
and
experience
of
the
senior
management
and
investment
personnel
of
the
Manager,
as
well
as
information
on
succession
planning
where
appropriate;
the
structure
of
investment
personnel
compensation;
oversight
of
third-
party
service
providers;
investment
performance
reports
and
related
financial
information
for
the
Fund;
reports
on
expenses
and
shareholder
services;
legal
and
compliance
matters;
risk
controls;
pricing
and
other
services
provided
by
the
Manager
and
its
affiliates;
and
management
fees
charged
by
the
Manager
and
its
affiliates
to
US
funds
and
other
accounts,
including
management’s
explanation
of
differences
among
accounts
where
relevant.
The
Board
also
reviewed
and
considered
an
annual
report
on
payments
made
by
Franklin
Templeton
(FT)
or
the
Fund
to
financial
intermediaries,
as
well
as
a
memorandum
relating
to
third-party
servicing
arrangements.
The
Board
acknowledged
the
ongoing
integration
of
the
Putnam
family
of
funds
into
the
FT
family
of
funds
and
management’s
continued
development
of
strategies
to
address
areas
of
heightened
concern
in
the
mutual
fund
industry,
including
various
regulatory
initiatives
and
continuing
geopolitical
concerns.
The
Board
also
reviewed
and
considered
the
benefits
provided
to
Fund
shareholders
of
investing
in
a
fund
that
is
part
of
the
FT
family
of
funds.
The
Board
noted
the
financial
position
of
Franklin
Resources,
Inc.
(FRI),
the
Manager’s
parent,
and
its
commitment
to
the
mutual
fund
business
as
evidenced
by
its
continued
reassessment
of
the
fund
offerings
in
response
to
FT
acquisitions
and
the
market
environment,
as
well
as
project
initiatives
and
capital
investments
relating
to
the
services
provided
to
the
Fund
by
the
FT
organization.
The
Board
specifically
noted
FT’s
commitment
to
technological
innovation
and
advancement,
including
its
initiative
to
create
a
new
enterprise-wide
artificial
intelligence
platform.
Following
consideration
of
such
information,
the
Board
was
satisfied
with
the
nature,
extent
and
quality
of
services
provided
by
the
Manager
and
its
affiliates
to
the
Fund
and
its
shareholders.
Fund
Performance
The
Board
reviewed
and
considered
the
performance
results
of
the
Fund
over
various
time
periods
ended
December
31,
2023.
The
Board
considered
the
performance
returns
for
the
Fund
in
comparison
to
the
performance
returns
of
mutual
funds
deemed
comparable
to
the
Fund
included
in
a
universe
(Performance
Universe)
selected
by
Broadridge
Financial
Solutions,
Inc.
(Broadridge),
an
independent
provider
of
investment
company
data.
The
Board
received
a
description
of
the
methodology
used
by
Broadridge
to
select
the
mutual
funds
included
in
a
Performance
Universe.
The
Board
also
reviewed
and
considered
Fund
performance
reports
provided
and
discussions
that
occurred
with
portfolio
managers
at
Board
meetings
throughout
the
year.
A
summary
of
the
Fund’s
performance
results
is
below.
The
Performance
Universe
for
the
Fund
included
the
Fund
and
all
retail
and
institutional
high
yield
funds.
The
Board
noted
that
the
Fund’s
annualized
income
return
and
annualized
total
return
for
the
one-,
three-,
five-
and
10-year
periods
were
above
the
medians
of
its
Performance
Universe.
The
Board
further
noted
management’s
representation
regarding
the
income-
related
attributes
of
the
Fund
(e.g.,
a
fund’s
investment
objective)
as
set
forth
in
the
Fund’s
registration
statement
and
that
the
evaluation
of
the
Fund’s
performance
relative
to
its
peers
on
an
income
return
basis
was
appropriate
given
these
attributes.
The
Board
concluded
that
the
Fund’s
performance
was
satisfactory.
Comparative
Fees
and
Expenses
The
Board
reviewed
and
considered
information
regarding
the
Fund’s
actual
total
expense
ratio
and
its
various
components,
including,
as
applicable,
management
fees;
transfer
agent
expenses;
underlying
fund
expenses;
Rule
12b-1
and
non-Rule
12b-1
service
fees;
and
other
non-management
fees.
The
Board
also
noted
the
quarterly
and
annual
reports
it
receives
on
all
marketing
support
payments
made
by
FT
to
financial
intermediaries.
The
Board
considered
the
actual
total
expense
ratio
and,
separately,
the
contractual
management
fee
rate,
without
the
effect
of
fee
waivers,
if
any
(Management
Rate)
of
the
Fund
in
comparison
to
the
median
expense
ratio
and
median
Management
Rate,
respectively,
of
other
mutual
funds
deemed
comparable
to
and
with
a
similar
expense
structure
to
the
Fund
selected
by
Broadridge
(Expense
Group).
Broadridge
fee
and
expense
data
is
based
upon
information
taken
from
each
fund’s
most
recent
annual
or
semi-annual
report,
which
reflects
historical
asset
levels
that
may
be
quite
different
from
those
currently
existing,
particularly
in
a
period
of
market
volatility.
While
recognizing
such
inherent
limitation
and
the
fact
that
expense
ratios
and
Management
Rates
generally
increase
as
assets
decline
and
decrease
as
assets
grow,
the
Board
believed
the
independent
analysis
conducted
by
Broadridge
to
be
an
appropriate
measure
of
comparative
fees
and
expenses.
The
Broadridge
Management
Rate
includes
administrative
charges,
and
the
actual
total
expense
ratio,
for
comparative
consistency,
was
shown
for
Class
A1
shares
for
the
Fund
and
for
Class
A
shares
for
the
other
funds
in
the
Expense
Group.
The
Board
received
a
description
of
the
methodology
used
by
Broadridge
to
select
the
mutual
funds
included
in
an
Expense
Group.
The
Expense
Group
for
the
Fund
included
the
Fund
and
13
other
high
yield
funds.
The
Board
noted
that
the
Management
Rate
and
actual
total
expense
ratio
were
below
the
medians
and
in
the
first
quintile
(least
expensive)
of
its
Expense
Group.
The
Board
concluded
that
the
Management
Rate
charged
to
the
Fund
is
reasonable.
Profitability
The
Board
reviewed
and
considered
information
regarding
the
profits
realized
by
the
Manager
and
its
affiliates
in
connection
with
the
operation
of
the
Fund.
In
this
respect,
the
Board
considered
the
Fund
profitability
analysis
provided
by
the
Manager
that
addresses
the
overall
profitability
of
FT’s
US
fund
business,
as
well
as
its
profits
in
providing
investment
management
and
other
services
to
each
of
the
individual
funds
during
the
12-month
period
ended
September
30,
2023,
being
the
most
recent
fiscal
year-end
for
FRI.
The
Board
noted
that
although
management
continually
makes
refinements
to
its
methodologies
used
in
calculating
profitability
in
response
to
organizational
and
product-related
changes,
the
overall
methodology
has
remained
consistent
with
that
used
in
the
Fund’s
profitability
report
presentations
from
prior
years.
The
Board
also
noted
that
an
independent
registered
public
accounting
firm
has
been
engaged
by
the
Manager
to
periodically
review
and
assess
the
allocation
methodologies
to
be
used
solely
by
the
Fund’s
Board
with
respect
to
the
profitability
analysis.
The
Board
noted
management’s
belief
that
costs
incurred
in
establishing
the
infrastructure
necessary
for
the
type
of
mutual
fund
operations
conducted
by
the
Manager
and
its
affiliates
may
not
be
fully
reflected
in
the
expenses
allocated
to
the
Fund
in
determining
its
profitability,
as
well
as
the
fact
that
the
level
of
profits,
to
a
certain
extent,
reflected
operational
cost
savings
and
efficiencies
initiated
by
management.
As
part
of
this
evaluation,
the
Board
considered
management’s
outsourcing
of
certain
operations,
which
effort
has
required
considerable
up-front
expenditures
by
the
Manager
but,
over
the
long
run
is
expected
to
result
in
greater
efficiencies.
The
Board
also
noted
management’s
expenditures
in
improving
shareholder
services
provided
to
the
Fund,
as
well
as
the
need
to
implement
systems
and
meet
additional
regulatory
and
compliance
requirements
resulting
from
recent
US
Securities
and
Exchange
Commission
and
other
regulatory
requirements.
The
Board
also
considered
the
extent
to
which
the
Manager
and
its
affiliates
might
derive
ancillary
benefits
from
fund
operations,
including
revenues
generated
from
transfer
agent
services,
potential
benefits
resulting
from
personnel
and
systems
enhancements
necessitated
by
fund
growth,
as
well
as
increased
leverage
with
service
providers
and
counterparties.
Based
upon
its
consideration
of
all
these
factors,
the
Board
concluded
that
the
level
of
profits
realized
by
the
Manager
and
its
affiliates
from
providing
services
to
the
Fund
was
not
excessive
in
view
of
the
nature,
extent
and
quality
of
services
provided
to
the
Fund.
Economies
of
Scale
The
Board
reviewed
and
considered
the
extent
to
which
the
Manager
may
realize
economies
of
scale,
if
any,
as
the
Fund
grows
larger
and
whether
the
Fund’s
management
fee
structure
reflects
any
economies
of
scale
for
the
benefit
of
shareholders.
With
respect
to
possible
economies
of
scale,
the
Board
noted
the
existence
of
management
fee
breakpoints,
which
operate
generally
to
share
any
economies
of
scale
with
the
Fund’s
shareholders
by
reducing
the
Fund’s
effective
management
fees
as
the
Fund
grows
in
size.
The
Board
considered
the
Manager’s
view
that
any
analyses
of
potential
economies
of
scale
in
managing
a
particular
fund
are
inherently
limited
in
light
of
the
joint
and
common
costs
and
investments
the
Manager
incurs
across
the
FT
family
of
funds
as
a
whole.
The
Board
concluded
that
to
the
extent
economies
of
scale
may
be
realized
by
the
Manager
and
its
affiliates,
the
Fund’s
management
fee
structure
provided
a
sharing
of
benefits
with
the
Fund
and
its
shareholders
as
the
Fund
grows.
Conclusion
Based
on
its
review,
consideration
and
evaluation
of
all
factors
it
believed
relevant,
including
the
above-described
factors
and
conclusions,
the
Board
unanimously
approved
the
continuation
of
the
Management
Agreement
for
an
additional
one-year
period.
©
2024
Franklin
Templeton
Investments.
All
rights
reserved.
Item 8. Changes in and Disagreements with Accountants for Open-End Management Investment Companies.
The information is disclosed as part of the Financial Statements included in Item 7 of this Form N-CSR.
Item 9. Proxy Disclosures for Open-End Management Investment Companies.
The information is disclosed as part of the Financial Statements included in Item 7 of this Form N-CSR.
Item 10. Remuneration Paid to Directors, Officers, and Others of Open-End Management Investment Companies.
The information is disclosed as part of the Financial Statements included in Item 7 of this Form N-CSR.
Item 11. Statement Regarding Basis for Approval of Investment Advisory Contract.
The information is disclosed as part of the Financial Statements included in Item 7 of this Form N-CSR.
Item 12. Disclosure of Proxy Voting Policies and Procedures for Closed-End Management Investment Companies. N/A
Item 13. Portfolio Managers of Closed-End Management Investment Companies. N/A
Item 14. Purchases of Equity Securities by Closed-End Management Investment Company and Affiliated Purchasers. N/A
Item 15. Submission of Matters to a Vote of Security Holders.
There have been no changes to the procedures by which shareholders may recommend nominees to the Registrant's Board of Trustees that would require disclosure herein.
Item 16. Controls and Procedures.
(a) Evaluation of Disclosure Controls and Procedures. The Registrant maintains disclosure controls and procedures that are designed to provide reasonable assurance that information required to be disclosed in the Registrant’s filings under the Securities Exchange Act of 1934, as amended, and the Investment Company Act of 1940 is recorded, processed, summarized and reported within the periods specified in the rules and forms of the Securities and Exchange Commission. Such information is accumulated and communicated to the Registrant’s management, including its principal executive officer and principal financial officer, as appropriate, to allow timely decisions regarding required disclosure. The Registrant’s management, including the principal executive officer and the principal financial officer, recognizes that any set of controls and procedures, no matter how well designed and operated, can provide only reasonable assurance of achieving the desired control objectives.
Within 90 days prior to the filing date of this Shareholder Report on Form N-CSR, the Registrant had carried out an evaluation, under the supervision and with the participation of the Registrant’s management, including the Registrant’s principal executive officer and the Registrant’s principal financial officer, of the effectiveness of the design and operation of the Registrant’s disclosure controls and procedures. Based on such evaluation, the Registrant’s principal executive officer and principal financial officer concluded that the Registrant’s disclosure controls and procedures are effective.
(b) Changes in Internal Controls. There have been no changes in the Registrant’s internal control over financial reporting that occurred during the period covered by this report that has materially affected, or is reasonably likely to materially affect the internal control over financial reporting.
Item 17. Disclosure of Securities Lending Activities for Closed-End Management Investment Company. N/A
Item 18. Recovery of Erroneously Awarded Compensation.
(a) N/A
(b) N/A
Item 19. Exhibits.
(a)(1) Code of Ethics
(a)(2) Certifications pursuant to Section 302 of the Sarbanes-Oxley Act of 2002 of Christopher Kings, Chief Executive Officer - Finance and Administration, and Jeffrey White, Chief Financial Officer, Chief Accounting Officer and Treasurer
(b) Certifications pursuant to Section 906 of the Sarbanes-Oxley Act of 2002 of Christopher Kings, Chief Executive Officer - Finance and Administration, and Jeffrey White, Chief Financial Officer, Chief Accounting Officer and Treasurer
SIGNATURES
Pursuant to the requirements of the Securities Exchange Act of 1934 and the Investment Company Act of 1940, the registrant has duly caused this report to be signed on its behalf by the undersigned, thereunto duly authorized.
FRANKLIN HIGH INCOME TRUST
| By | /s/ CHRISTOPHER KINGS | |
| | Christopher Kings | |
| | Chief Executive Officer - Finance and Administration | |
| | | |
| Date | November 27, 2024 | |
Pursuant to the requirements of the Securities Exchange Act of 1934 and the Investment Company Act of 1940, this report has been signed below by the following persons on behalf of the registrant and in the capacities and on the dates indicated.
| By | /s/ CHRISTOPHER KINGS | |
| | Christopher Kings | |
| | Chief Executive Officer - Finance and Administration | |
| | | |
| Date | November 27, 2024 | |
| By | /s/ JEFFREY WHITE | |
| | Jeffrey White | |
| | Chief Financial Officer, Chief Accounting Officer and Treasurer | |
| | | |
| Date | November 27, 2024 | |