UNITED STATES
SECURITIES AND EXCHANGE COMMISSION
Washington, D.C. 20549
FORM N-CSR
CERTIFIED SHAREHOLDER REPORT OF REGISTERED
MANAGEMENT INVESTMENT COMPANIES
Investment Company Act File Number: 811-02871
lord abbett developing growth fund, inc.
(Exact name of Registrant as specified in charter)
90 Hudson Street, Jersey City, NJ 07302
(Address of principal executive offices) (Zip code)
John T. Fitzgerald, Esq., Vice President & Assistant Secretary
90 Hudson Street, Jersey City, NJ 07302
(Name and address of agent for service)
Registrant’s telephone number, including area code: (888) 522-2388
Date of fiscal year end: 7/31
Date of reporting period: 7/31/2020
| Item 1: | Report(s) to Shareholders. |

LORD ABBETT
ANNUAL REPORT
Lord Abbett
Developing Growth Fund
For the fiscal year ended July 31, 2020
Important Information on Paperless Delivery
Beginning in March 2021, as permitted by regulations adopted by the Securities and Exchange Commission, paper copies of the Fund’s shareholder reports like this one will no longer be sent by mail, unless you specifically request paper copies of the reports from the Fund or from your financial intermediary, such as a broker-dealer, investment advisor or bank. Instead, the reports will be made available on Lord Abbett’s website and you will be notified by mail each time a report is posted and provided with a website link to access the report.
If you already elected to receive shareholder reports electronically, you will not be affected by this change and you need not take any action. Shareholders who hold accounts directly with the Fund may elect to receive shareholder reports and other communications from the Fund electronically by signing into your Lord Abbett online account at lordabbett.com and selecting “Log In.” For further information, you may also contact the Fund at (800) 821-5129. Shareholders who hold accounts through a financial intermediary should contact them directly.
You may elect to receive all future reports in paper free of charge by contacting the Fund at (800) 821-5129. Your election to receive reports in paper will apply to all funds held with Lord Abbett. If your fund shares are held through a financial intermediary please contact them directly. Your election applies to all funds held with that intermediary.
Table of Contents
Lord Abbett Developing Growth Fund
Annual Report
For the fiscal year ended July 31, 2020

From left to right: James L.L. Tullis, Independent Chairman of the Lord Abbett Funds and Douglas B. Sieg, Director, President, and Chief Executive Officer of the Lord Abbett Funds. | | Dear Shareholders: We are pleased to provide you with this overview of the performance of Lord Abbett Developing Growth Fund for the fiscal year ended July 31, 2020. On this page and the following pages, we discuss the major factors that influenced fiscal year performance. For additional information about the Fund, please visit our website at www.lordabbett.com, where you also can access quarterly commentaries that provide updates on the Fund’s performance and other portfolio related updates. Thank you for investing in Lord Abbett mutual funds. We value the trust that you place in us and look forward to serving your investment needs in the years to come. Best regards, 
Douglas B. Sieg Director, President, and Chief Executive Officer |
| | | |
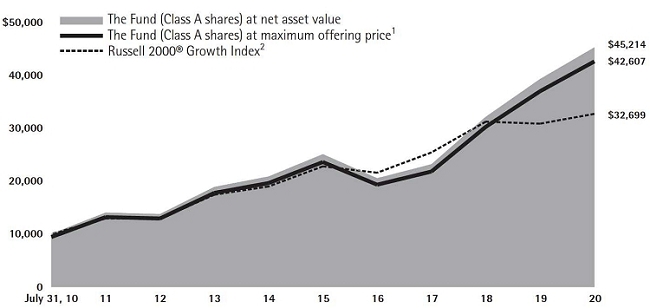
For the fiscal year ended July 31, 2020, the Fund returned 15.24%, reflecting performance at the net asset value (NAV) of Class A shares with all distributions reinvested, compared to its benchmark, the Russell 2000® Growth Index,1 which returned 6.00% over the same period.
U.S. stocks experienced multiple bouts of volatility during the period, mostly as a result of escalating and de-escalating trade tensions with China, U.S. monetary policy decisions, and shifting sentiment about global growth prospects amid the global spread of the novel coronavirus (COVID-19). Trade tensions continued to ebb and flow
in the final four months of 2019. In January of 2020, U.S. President Donald Trump signed a “phase one” trade deal with China and markets priced in a likelihood of two more interest rate cuts in 2020. The tide turned abruptly in February and March as the outbreak of the COVID-19 pandemic and the expected economic damage resulting from a sudden slowdown in corporate spending, individual spending, consumer confidence, and thus recessionary and deflationary pressures, triggered a severe sell-off. Furthermore, as the COVID-19 pandemic fueled fears of slowing global growth, oil prices fell
1
precipitously, with the primary U.S. oil contract closing in negative territory for the first time in history, although it has since rebounded. During the month of March, the S&P 500 Index2 experienced its fastest bear market since 1987 and the CBOE volatility Index3 reached levels not seen since the financial crisis. Notably, the longest U.S. economic expansion in history ended at 128 months.
The U.S. Federal Reserve (Fed) responded to COVID-19 with a breadth of policy measures which lifted investors’ confidence in the markets. The Fed launched a $700 billion quantitative easing program, decreased the reserve requirements to zero for thousands of banks, and cut the federal funds rate to the current target range of 0-0.25%. In the back half of March, the Fed announced additional stimulus programs, including open-ended asset purchases, purchases of corporate debt, and a commitment to a new small business lending program. Additionally, the central bank announced $2.3 trillion of additional credit support by expanding the Primary Market Corporate Credit Facility (PMCCF), the Secondary Market Corporate Credit Facility (SMCCF), and the Term Asset-Backed Securities Loan Facility (TALF). Most notably, the expanded measures included the purchase of select fallen angel bond issues.
One of the leading contributors to the Fund’s relative performance during the period was security selection in the information technology sector. Within this
sector, the Fund’s position in Inphi Corp., a provider of semiconductor solutions, contributed to relative performance. Inphi experienced an acceleration in demand trends for its services, as well as an exponential step-up in the value of the innovation the company delivers to various businesses, leading to a strong beat and significant guidance raise for the second half of 2020. Another contributor to the Fund’s relative performance was the Fund’s position in Five9, Inc., a provider of cloud software for call and contact centers. Shares of Five9 benefited from the firm’s ability to capitalize on its vast and growing addressable market and increased demand due to customers’ work-from-home needs. Additionally, the company cemented two important partnerships, with AT&T and Zoom, during the period.
The Fund’s position in Redfin, Inc., a provider of traditional and internet-based real estate brokerage services, contributed to relative performance. Shares of Redfin appreciated as real estate brokerage firms faced considerable structural changes in their business models due to social distancing guidelines and restrictions. The company’s differentiated technology and business model helped it increase market share during the period.
Security selection within the communication services sector detracted from relative performance during the period. Within the sector, the Fund’s position in Huya, Inc., a live streaming platform, detracted. Shares of Huya
2
declined as increased concerns that the spread of COVID-19 would cancel e-sporting events weighed on the stock. Additionally, the Fund’s position in CarGurus, Inc., a provider of online auto shopping services, detracted from relative performance as the company reported a decline in user activity growth and its 2019 forward guidance implied a slight deceleration in revenue growth.
The Fund’s position in Planet Fitness, Inc., an operator of fitness franchises, was also a detractor from the Fund’s relative
performance. Shares of Planet Fitness declined precipitously as investors correctly predicted the mass disruption caused by COVID-19 to brick & mortar models. The company’s leverage was also a concern as centers were shut down and revenue declined.
The Fund’s portfolio is actively managed and, therefore, its holdings and the weightings of a particular issuer or particular sector as a percentage of portfolio assets are subject to change. Sectors may include many industries.
1 The Russell 2000® Growth Index measures the performance of those Russell 2000® companies with higher price-to-book ratios and higher forecasted growth values.
2 The S&P 500® Index is widely regarded as the standard for measuring large cap U.S. stock market performance and includes a representative sample of leading companies in leading industries.
3 The CBOE Volatility Index® is a calculation designed to produce a measure of constant, 30-day expected volatility of the U.S. stock market, derived from real-time, mid-quote prices of S&P 500® Index call and put options.
Unless otherwise specified, indexes reflect total return, with all dividends reinvested. Indexes are unmanaged, do not reflect the deduction of fees or expenses, and are not available for direct investment.
Important Performance and Other Information
Performance data quoted in the following pages reflect past performance and are no guarantee of future results. Current performance may be higher or lower than the performance quoted. The investment return and principal value of an investment in the Fund will fluctuate so that shares, on any given day or when redeemed, may be worth more or less than their original cost. You can obtain performance data current to the most recent month end by calling Lord Abbett at 888-522-2388 or referring to www.lordabbett.com.
During certain periods shown, expense waivers and reimbursements were in place. Without such expense waivers and reimbursements, the Fund’s returns would have been lower.
Except where noted, comparative Fund performance does not account for the deduction of sales charges and would be different if sales charges were included. The Fund offers classes of shares with distinct pricing options. For a full description of the differences in pricing alternatives, please see the Fund’s prospectus.
The annual commentary above discusses the views of the Fund’s management and various portfolio holdings of the Fund as of July 31, 2020. These views and portfolio holdings may have changed after this date. Information provided in the commentary is not a recommendation to buy or sell securities. Because the Fund’s portfolio is actively managed and may change significantly, the Fund may no longer own the securities described above or may have otherwise changed its position in the securities. For more recent information about the Fund’s portfolio holdings, please visit www.lordabbett.com.
A Note about Risk: See Notes to Financial Statements for a discussion of investment risks. For a more detailed discussion of the risks associated with the Fund, please see the Fund’s prospectus.
Mutual funds are not insured by the FDIC, are not deposits or other obligations of, or guaranteed by, banks, and are subject to investment risks including possible loss of principal amount invested.
3
Investment Comparison
Below is a comparison of a $10,000 investment in Class A shares with the same investment in the Russell 2000® Growth Index, assuming reinvestment of all dividends and distributions. The performance of other classes will be greater than or less than the performance shown in the graph below due to different sales loads and expenses applicable to such classes. The graph and performance table below do not reflect the deduction of taxes that a shareholder would pay on Fund distributions or the redemption of Fund shares. Past performance is no guarantee of future results.
Average Annual Total Returns at Maximum Applicable
Sales Charge for the Periods Ended July 31, 2020 |
| | | 1 Year | | 5 Years | | 10 Years | | Life of Class | |
| Class A3 | | 8.63% | | 11.23% | | 15.60% | | – | |
| Class C4 | | 13.50% | | 11.67% | | 15.44% | | – | |
| Class F5 | | 15.37% | | 12.70% | | 16.51% | | – | |
| Class F36 | | 15.61% | | – | | – | | 25.21% | |
| Class I5 | | 15.50% | | 12.83% | | 16.62% | | – | |
| Class P5 | | 14.97% | | 12.45% | | 16.23% | | – | |
| Class R25 | | 14.76% | | 12.14% | | 15.92% | | – | |
| Class R35 | | 14.93% | | 12.26% | | 16.04% | | – | |
| Class R47 | | 15.21% | | 12.54% | | – | | 12.36% | |
| Class R57 | | 15.50% | | 12.83% | | – | | 12.65% | |
| Class R67 | | 15.61% | | 12.95% | | – | | 12.78% | |
1 Reflects the deduction of the maximum initial sales charge of 5.75%.
2 Performance of the unmanaged index does not reflect any fees or expenses. The performance of the index is not necessarily representative of the Fund’s performance.
3 Total return, which is the percentage change in net asset value, after deduction of the maximum initial sales charge of 5.75% applicable to Class A shares, with all dividends and distributions reinvested for periods shown ended July 31, 2020, is calculated using the SEC-required uniform method to compute such return.
4 The 1% CDSC for Class C shares normally applies before the first anniversary of the purchase date.
5 Performance is at net asset value.
6 Commenced operations and performance for the class began on April 4, 2017. Performance is at net asset value.
7 Commenced operations and performance for the classes began on June 30, 2015. Performance is at net asset value.
4
Expense Example
As a shareholder of the Fund, you incur two types of costs: (1) transaction costs, including sales charges (loads) on purchase payments (these charges vary among the share classes); and (2) ongoing costs, including management fees; distribution and service (12b-1) fees (these charges vary among the share classes); and other Fund expenses. This Example is intended to help you understand your ongoing costs (in dollars) of investing in the Fund and to compare these costs with the ongoing costs of investing in other mutual funds.
The Example is based on an investment of $1,000 invested at the beginning of the period and held for the entire period (February 1, 2020 through July 31, 2020).
Actual Expenses
For each class of the Fund, the first line of the table on the following page provides information about actual account values and actual expenses. You may use the information in this line, together with the amount you invested, to estimate the expenses that you paid over the period. Simply divide your account value by $1,000 (for example, an $8,600 account value divided by $1,000 = 8.6), then multiply the result by the number in the first line under the heading titled “Expenses Paid During Period 2/1/20 – 7/31/20” to estimate the expenses you paid on your account during this period.
Hypothetical Example for Comparison Purposes
For each class of the Fund, the second line of the table on the following page provides information about hypothetical account values and hypothetical expenses based on the Fund’s actual expense ratio and an assumed rate of return of 5% per year before expenses, which is not the Fund’s actual return. The hypothetical account values and expenses may not be used to estimate the actual ending account balance or expenses you paid for the period. You may use this information to compare the ongoing costs of investing in the Fund and other funds. To do so, compare this 5% hypothetical example with the 5% hypothetical examples that appear in the shareholder reports of the other funds.
5
Please note that the expenses shown in the table are meant to highlight your ongoing costs only and do not reflect any transactional costs, such as sales charges (loads). Therefore, the second line of the table is useful in comparing ongoing costs only, and will not help you determine the relative total costs of owning different funds. In addition, if these transactional costs were included, your costs would have been higher.
| | | | Beginning
Account
Value | | Ending
Account
Value | | Expenses
Paid During
Period† | |
| | | | 2/1/20 | | 7/31/20 | | 2/1/20 -
7/31/20 | |
| Class A | | | | | | | | |
| Actual | | | $1,000.00 | | $1,219.30 | | $5.08 | |
| Hypothetical (5% Return Before Expenses) | | | $1,000.00 | | $1,020.29 | | $4.62 | |
| Class C | | | | | | | | |
| Actual | | | $1,000.00 | | $1,214.20 | | $9.14 | |
| Hypothetical (5% Return Before Expenses) | | | $1,000.00 | | $1,016.61 | | $8.32 | |
| Class F | | | | | | | | |
| Actual | | | $1,000.00 | | $1,219.50 | | $4.19 | |
| Hypothetical (5% Return Before Expenses) | | | $1,000.00 | | $1,021.08 | | $3.82 | |
| Class F3 | | | | | | | | |
| Actual | | | $1,000.00 | | $1,220.80 | | $3.20 | |
| Hypothetical (5% Return Before Expenses) | | | $1,000.00 | | $1,021.98 | | $2.92 | |
| Class I | | | | | | | | |
| Actual | | | $1,000.00 | | $1,220.50 | | $3.70 | |
| Hypothetical (5% Return Before Expenses) | | | $1,000.00 | | $1,021.53 | | $3.37 | |
| Class P | | | | | | | | |
| Actual | | | $1,000.00 | | $1,217.60 | | $6.18 | |
| Hypothetical (5% Return Before Expenses) | | | $1,000.00 | | $1,019.29 | | $5.62 | |
| Class R2 | | | | | | | | |
| Actual | | | $1,000.00 | | $1,216.50 | | $7.00 | |
| Hypothetical (5% Return Before Expenses) | | | $1,000.00 | | $1,018.55 | | $6.37 | |
| Class R3 | | | | | | | | |
| Actual | | | $1,000.00 | | $1,217.60 | | $6.45 | |
| Hypothetical (5% Return Before Expenses) | | | $1,000.00 | | $1,019.05 | | $5.87 | |
| Class R4 | | | | | | | | |
| Actual | | | $1,000.00 | | $1,219.00 | | $5.08 | |
| Hypothetical (5% Return Before Expenses) | | | $1,000.00 | | $1,020.29 | | $4.62 | |
| Class R5 | | | | | | | | |
| Actual | | | $1,000.00 | | $1,220.60 | | $3.64 | |
| Hypothetical (5% Return Before Expenses) | | | $1,000.00 | | $1,021.58 | | $3.32 | |
| Class R6 | | | | | | | | |
| Actual | | | $1,000.00 | | $1,220.80 | | $3.26 | |
| Hypothetical (5% Return Before Expenses) | | | $1,000.00 | | $1,021.93 | | $2.97 | |
| † | For each class of the Fund, net expenses are equal to the annualized expense ratio for such class (0.92% for Class A, 1.66% for Class C, 0.76% for Class F, 0.58% for Class F3, 0.67% for Class I, 1.12% for Class P, 1.27% for Class R2, 1.17% for Class R3, 0.92% for Class R4, 0.66% for Class R5 and 0.59% for Class R6) multiplied by the average account value over the period, multiplied by 182/366 (to reflect one-half year period). |
6
Portfolio Holdings Presented by Sector
July 31, 2020
| Sector* | | %** |
| Consumer Discretionary | | | 19.91 | % |
| Consumer Staples | | | 3.05 | % |
| Financials | | | 2.41 | % |
| Health Care | | | 28.12 | % |
| Industrials | | | 11.23 | % |
| Information Technology | | | 27.85 | % |
| Real Estate | | | 2.15 | % |
| Technology | | | 0.58 | % |
| Repurchase Agreement | | | 2.69 | % |
| Money Market Fund(a) | | | 1.81 | % |
| Time Deposit(a) | | | 0.20 | % |
| Total | | | 100.00 | % |
| * | | A sector may comprise several industries. |
| ** | | Represents percent of total investments. |
| (a) | | Securities were purchased with the cash collateral from loaned securities. |
7
Schedule of Investments
July 31, 2020
| Investments | | Shares | | | Fair
Value
(000) | |
| COMMON STOCKS 97.65% | | | | | | |
| | | | | | | |
| Aerospace & Defense 1.44% | | | | | | |
| Axon Enterprise, Inc.* | | | 442,605 | | | $ | 36,794 | |
| | | | | | | | | |
| Air Freight & Logistics 0.68% | | | | | | | | |
| XPO Logistics, Inc.* | | | 230,151 | | | | 17,266 | |
| | | | | | | | | |
| Automobiles 0.93% | | | | | | | | |
| Winnebago Industries, Inc. | | | 391,372 | | | | 23,643 | |
| | | | | | | | | |
| Beverages 1.46% | | | | | | | | |
| Boston Beer Co., Inc. (The) Class A* | | | 45,830 | | | | 37,142 | |
| | | | | | | | | |
| Biotechnology 16.94% | | | | | | | | |
| Acceleron Pharma, Inc.* | | | 304,522 | | | | 30,199 | |
| Allogene Therapeutics, Inc.* | | | 280,294 | | | | 10,278 | |
| Arena Pharmaceuticals, Inc.* | | | 496,704 | | | | 30,493 | |
| Argenx SE ADR* | | | 68,264 | | | | 15,709 | |
| Blueprint Medicines Corp.* | | | 229,525 | | | | 16,797 | |
| Bridgebio Pharma, Inc.*(a) | | | 763,601 | | | | 21,488 | |
| ChemoCentryx, Inc.* | | | 365,109 | | | | 19,245 | |
| Coherus Biosciences, Inc.* | | | 543,726 | | | | 9,564 | |
| Constellation Pharmaceuticals, Inc.* | | | 596,692 | | | | 16,045 | |
| CRISPR Therapeutics AG (Switzerland)*(b) | | | 229,893 | | | | 19,647 | |
| Deciphera Pharmaceuticals, Inc.* | | | 254,967 | | | | 11,823 | |
| Emergent BioSolutions, Inc.* | | | 126,029 | | | | 14,019 | |
| Immunomedics, Inc.* | | | 858,314 | | | | 36,247 | |
| Invitae Corp.* | | | 390,959 | | | | 11,416 | |
| Iovance Biotherapeutics, Inc.* | | | 564,664 | | | | 16,415 | |
| Karuna Therapeutics, Inc.* | | | 152,513 | | | | 12,475 | |
| Mirati Therapeutics, Inc.* | | | 276,627 | | | | 33,558 | |
| Myovant Sciences Ltd. (United Kingdom)*(b) | | | 631,100 | | | | 9,593 | |
| Natera, Inc.* | | | 552,774 | | | | 26,544 | |
| Relay Therapeutics, Inc.* | | | 177,015 | | | | 6,277 | |
| Rocket Pharmaceuticals, Inc.* | | | 670,681 | | | | 15,781 | |
| TG Therapeutics, Inc.* | | | 1,232,262 | | | | 24,128 | |
| Investments | | Shares | | | Fair
Value
(000) | |
| Biotechnology (continued) | | | | | | | | |
| Turning Point Therapeutics, Inc.* | | | 275,099 | | | $ | 16,294 | |
| Zymeworks, Inc. (Canada)*(b) | | | 247,342 | | | | 7,551 | |
| Total | | | | | | | 431,586 | |
| | | | | | | | | |
| Building Products 2.12% | | | | | | | | |
| AZEK Co., Inc. (The)* | | | 653,523 | | | | 22,547 | |
| Trex Co., Inc.* | | | 226,178 | | | | 31,513 | |
| Total | | | | | | | 54,060 | |
| | | | | | | | | |
| Capital Markets 0.85% | | | | | | | | |
| Assetmark Financial Holdings, Inc. | | | 773,701 | | | | 21,548 | |
| | | | | | | | | |
| Commercial Services & Supplies 0.50% | | | | | | | | |
| MSA Safety, Inc. | | | 106,527 | | | | 12,627 | |
| | | | | | | | | |
| Communications Equipment 1.80% | | | | | | | | |
| Calix, Inc.* | | | 621,822 | | | | 12,754 | |
| Lumentum Holdings, Inc.* | | | 356,179 | | | | 33,064 | |
| Total | | | | | | | 45,818 | |
| | | | | | | | | |
| Diversified Consumer Services 2.07% | | | | | | | | |
| Chegg, Inc.* | | | 250,765 | | | | 20,304 | |
| frontdoor, Inc.* | | | 421,063 | | | | 17,683 | |
| Strategic Education, Inc. | | | 117,171 | | | | 14,788 | |
| Total | | | | | | | 52,775 | |
| | | | | | | | | |
| Electrical Equipment 2.72% | | | | | | | | |
| Generac Holdings, Inc.* | | | 282,404 | | | | 44,501 | |
| Vivint Solar, Inc.* | | | 1,223,260 | | | | 24,881 | |
| Total | | | | | | | 69,382 | |
| | | | | | | | | |
| Food & Staples Retailing 0.73% | | | | | | | | |
| Grocery Outlet Holding Corp.* | | | 425,495 | | | | 18,718 | |
| | | | | | | | | |
| Food Products 0.93% | | | | | | | | |
| Freshpet, Inc.* | | | 246,599 | | | | 23,686 | |
| | | | | | | | | |
| Health Care Equipment & Supplies 5.97% | | | | | | | | |
| Axonics Modulation Technologies, Inc.*(a) | | | 531,295 | | | | 22,506 | |
| iRhythm Technologies, Inc.* | | | 258,914 | | | | 32,230 | |
| 8 | See Notes to Financial Statements. |
Schedule of Investments (continued)
July 31, 2020
| Investments | | Shares | | | Fair
Value
(000) | |
| Health Care Equipment & Supplies (continued) | | | | |
| Nevro Corp.* | | | 256,327 | | | $ | 34,081 | |
| Penumbra, Inc.* | | | 128,434 | | | | 28,501 | |
| Tandem Diabetes Care, Inc.* | | | 332,924 | | | | 34,777 | |
| Total | | | | | | | 152,095 | |
| | | | | | | | | |
| Health Care Providers & Services 0.62% | | | | |
| Guardant Health, Inc.* | | | 185,293 | | | | 15,783 | |
| | | | | | | | | |
| Health Care Technology 2.17% | | | | | | | | |
| Inspire Medical Systems, Inc.* | | | 427,257 | | | | 42,452 | |
| Schrodinger, Inc.*(a) | | | 177,281 | | | | 12,832 | |
| Total | | | | | | | 55,284 | |
| | | | | | | | | |
| Hotels, Restaurants & Leisure 1.85% | | | | | | | | |
| Wingstop, Inc. | | | 302,280 | | | | 47,231 | |
| | | | | | | | | |
| Household Durables 3.44% | | | | | | | | |
| Helen of Troy Ltd.* | | | 196,753 | | | | 37,039 | |
| LGI Homes, Inc.* | | | 444,332 | | | | 50,702 | |
| Total | | | | | | | 87,741 | |
| | | | | | | | | |
| Information Technology Services 2.05% | | | | | | | | |
| Endava plc ADR* | | | 397,836 | | | | 20,548 | |
| Limelight Networks, Inc.* | | | 3,117,005 | | | | 19,544 | |
| Shift4 Payments, Inc. Class A* | | | 316,825 | | | | 12,134 | |
| Total | | | | | | | 52,226 | |
| | | | | | | | | |
| Insurance 1.62% | | | | | | | | |
| Goosehead Insurance, Inc. Class A* | | | 353,869 | | | | 36,565 | |
| Lemonade, Inc.*(a) | | | 82,731 | | | | 4,814 | |
| Total | | | | | | | 41,379 | |
| | | | | | | | | |
| Internet & Direct Marketing Retail 4.08% | | | | |
| Fiverr International Ltd. (Israel)*(b) | | | 519,616 | | | | 48,547 | |
| RealReal, Inc. (The)* | | | 855,788 | | | | 11,673 | |
| Stamps.com, Inc.* | | | 168,145 | | | | 43,765 | |
| Total | | | | | | | 103,985 | �� |
| Investments | | Shares | | | Fair
Value
(000) | |
| Internet Software & Services 0.45% |
| Cardlytics, Inc.* | | | 174,265 | | | $ | 11,575 | |
| | | | | | | | | |
| Leisure Products 2.95% | | | | | | | | |
| Malibu Boats, Inc. Class A* | | | 578,182 | | | | 33,986 | |
| YETI Holdings, Inc.* | | | 842,656 | | | | 41,197 | |
| Total | | | | | | | 75,183 | |
| | | | | |
| Life Sciences Tools & Services 1.76% | | | | |
| Berkeley Lights, Inc.* | | | 93,495 | | | | 5,607 | |
| Repligen Corp.* | | | 260,029 | | | | 39,241 | |
| Total | | | | | | | 44,848 | |
| | | | | | | | | |
| Machinery 3.27% | | | | | | | | |
| Chart Industries, Inc.* | | | 348,617 | | | | 23,891 | |
| Evoqua Water Technologies Corp.* | | | 1,798,193 | | | | 34,579 | |
| Federal Signal Corp. | | | 803,366 | | | | 24,832 | |
| Total | | | | | | | 83,302 | |
| | | | | | | | | |
| Pharmaceuticals 1.36% | | | | | | | | |
| GW Pharmaceuticals plc ADR* | | | 95,928 | | | | 12,243 | |
| MyoKardia, Inc.* | | | 248,442 | | | | 22,392 | |
| Total | | | | | | | 34,635 | |
| | | | | | | | | |
| Professional Services 0.77% | | | | | | | | |
| FTI Consulting, Inc.* | | | 165,216 | | | | 19,733 | |
| | | | | | | | | |
| Real Estate Management & Development 2.21% | |
| Redfin Corp.* | | | 1,353,156 | | | | 56,264 | |
| | | | | | | | | |
| Semiconductors & Semiconductor Equipment 9.04% | |
| CEVA, Inc.* | | | 443,689 | | | | 17,836 | |
| Cirrus Logic, Inc.* | | | 220,567 | | | | 15,115 | |
| Enphase Energy, Inc.* | | | 399,687 | | | | 24,125 | |
| Inphi Corp.* | | | 530,920 | | | | 69,370 | |
| MKS Instruments, Inc. | | | 291,628 | | | | 37,165 | |
| Monolithic Power Systems, Inc. | | | 112,043 | | | | 29,693 | |
| Semtech Corp.* | | | 472,717 | | | | 26,345 | |
| Silicon Laboratories, Inc.* | | | 107,741 | | | | 10,829 | |
| Total | | | | | | | 230,478 | |
| | See Notes to Financial Statements. | 9 |
Schedule of Investments (continued)
July 31, 2020
| Investments | | Shares | | | Fair
Value
(000) | |
| Software 15.79% | | | | | | | | |
| 2U, Inc.* | | | 282,074 | | | $ | 13,284 | |
| Alteryx, Inc. Class A* | | | 74,961 | | | | 13,155 | |
| Appian Corp.*(a) | | | 527,850 | | | | 26,852 | |
| Avalara, Inc.* | | | 167,455 | | | | 22,514 | |
| Blackline, Inc.* | | | 337,694 | | | | 30,024 | |
| Everbridge, Inc.* | | | 287,535 | | | | 41,060 | |
| Five9, Inc.* | | | 467,073 | | | | 56,432 | |
| Globant SA (Argentina)*(b) | | | 207,115 | | | | 35,818 | |
| Jamf Holding Corp.* | | | 375,355 | | | | 15,239 | |
| nCino, Inc.* | | | 7,076 | | | | 560 | |
| Paylocity Holding Corp.* | | | 228,209 | | | | 30,397 | |
| Q2 Holdings, Inc.* | | | 291,187 | | | | 27,386 | |
| Qualys, Inc.* | | | 113,327 | | | | 13,994 | |
| Sprout Social, Inc. Class A* | | | 665,306 | | | | 19,221 | |
| SVMK, Inc.* | | | 2,007,943 | | | | 48,151 | |
| Yext, Inc.* | | | 489,716 | | | | 8,237 | |
| Total | | | | | | | 402,324 | |
| | | | | | | | | |
| Specialty Retail 3.73% | | | | | | | | |
| National Vision Holdings, Inc.* | | | 1,066,427 | | | | 34,115 | |
| RH* | | | 130,197 | | | | 37,422 | |
| Vroom, Inc.* | | | 395,532 | | | | 23,412 | |
| Total | | | | | | | 94,949 | |
| | | | | | | | | |
| Textiles, Apparel & Luxury Goods 1.35% | | | | |
| Deckers Outdoor Corp.* | | | 165,009 | | | | 34,529 | |
Total Common Stocks
(cost $1,798,285,777) | | | | | | | 2,488,589 | |
| Investments | | Principal
Amount
(000) | | | Fair
Value
(000) | |
| SHORT-TERM INVESTMENTS 4.82% | | | | | | | | |
| | | | | | | | | |
| Repurchase Agreement 2.76% | | | | | | | | |
Repurchase Agreement dated 7/31/2020, 0.00% due 8/3/2020 with Fixed Income Clearing Corp. collateralized by $66,758,600 of U.S. Treasury Note at 2.00% due 4/30/2024; value: $71,671,632; proceeds: $70,266,280
(cost $70,266,280) | | $ | 70,266 | | | $ | 70,266 | |
| | | | | | | | | |
| | | Shares | | | | |
| Money Market Fund 1.85% | | | | | | | | |
Fidelity Government Portfolio(c)
(cost $47,216,986) | | | 47,216,986 | | | | 47,217 | |
| | | | | | | | | |
| Time Deposit 0.21% | | | | | | | | |
CitiBank N.A.(c)
(cost $5,246,332) | | | 5,246,332 | | | | 5,246 | |
Total Short-Term Investments
(cost $122,729,598) | | | | | | | 122,729 | |
Total Investments in Securities 102.47%
(cost $1,921,015,375) | | | | | | | 2,611,318 | |
| Liabilities in Excess of Other Assets (2.47)% | | | | | | | (62,965 | ) |
| Net Assets 100.00% | | | | | | $ | 2,548,353 | |
| ADR | | American Depositary Receipt. |
| * | | Non-income producing security. |
| (a) | | All or a portion of these securities are temporarily on loan to unaffiliated broker/dealers. |
| (b) | | Foreign security traded in U.S. dollars. |
| (c) | | Security was purchased with the cash collateral from loaned securities. |
| 10 | See Notes to Financial Statements. |
Schedule of Investments (concluded)
July 31, 2020
The following is a summary of the inputs used as of July 31, 2020 in valuing the Fund’s investments carried at fair value(1):
| Investment Type(2) | | Level 1
(000) | | | Level 2 (000) | | | Level 3 (000) | | | Total
(000) | |
| Common Stocks | | $ | 2,488,589 | | | $ | – | | | $ | – | | | $ | 2,488,589 | |
| Short-Term Investments | | | | | | | | | | | | | | | | |
| Repurchase Agreement | | | – | | | | 70,266 | | | | – | | | | 70,266 | |
| Money Market Fund | | | 47,217 | | | | – | | | | – | | | | 47,217 | |
| Time Deposit | | | – | | | | 5,246 | | | | – | | | | 5,246 | |
| Total | | $ | 2,535,806 | | | $ | 75,512 | | | $ | – | | | $ | 2,611,318 | |
| (1) | | Refer to Note 2(g) for a description of fair value measurements and the three-tier hierarchy of inputs. |
| (2) | | See Schedule of Investments for fair values in each industry and identification of foreign issuers and/or geography. |
| | See Notes to Financial Statements. | 11 |
Statement of Assets and Liabilities
July 31, 2020
| ASSETS: | | | |
| Investments in securities, at fair value including $50,141,941 of securities loaned (cost $1,921,015,375) | | $ | 2,611,318,129 | |
| Receivables: | | | | |
| Capital shares sold | | | 11,715,355 | |
| Investment securities sold | | | 11,707,543 | |
| Securities lending income receivable | | | 101,424 | |
| Prepaid expenses and other assets | | | 190,485 | |
| Total assets | | | 2,635,032,936 | |
| LIABILITIES: | | | | |
| Payables: | | | | |
| Investment securities purchased | | | 29,224,849 | |
| Capital shares reacquired | | | 2,657,204 | |
| Management fee | | | 1,046,333 | |
| Directors’ fees | | | 408,508 | |
| 12b-1 distribution plan | | | 402,623 | |
| Fund administration | | | 82,013 | |
| Payable for collateral due to broker for securities lending | | | 52,463,318 | |
| Accrued expenses | | | 395,426 | |
| Total liabilities | | | 86,680,274 | |
| Commitments and contingent liabilities | | | | |
| NET ASSETS | | $ | 2,548,352,662 | |
| COMPOSITION OF NET ASSETS: | | | | |
| Paid-in capital | | $ | 1,673,407,337 | |
| Total distributable earnings (loss) | | | 874,945,325 | |
| Net Assets | | $ | 2,548,352,662 | |
| | |
| 12 | See Notes to Financial Statements. |
Statement of Assets and Liabilities (concluded)
July 31, 2020
| Net assets by class: | | | |
| Class A Shares | | $ | 765,171,840 | |
| Class C Shares | | $ | 16,876,216 | |
| Class F Shares | | $ | 348,248,179 | |
| Class F3 Shares | | $ | 130,386,982 | |
| Class I Shares | | $ | 593,675,177 | |
| Class P Shares | | $ | 20,792,738 | |
| Class R2 Shares | | $ | 2,811,901 | |
| Class R3 Shares | | $ | 88,635,614 | |
| Class R4 Shares | | $ | 8,255,492 | |
| Class R5 Shares | | $ | 6,613,278 | |
| Class R6 Shares | | $ | 566,885,245 | |
| Outstanding shares by class: | | | | |
| Class A Shares (1.12 billion shares of common stock authorized, $.001 par value) | | | 31,286,341 | |
| Class C Shares (35 million shares of common stock authorized, $.001 par value) | | | 1,214,785 | |
| Class F Shares (134.1 million shares of common stock authorized, $.001 par value) | | | 13,390,791 | |
| Class F3 Shares (89.4 million shares of common stock authorized, $.001 par value) | | | 4,241,076 | |
| Class I Shares (335.3 million shares of common stock authorized, $.001 par value) | | | 19,465,957 | |
| Class P Shares (30 million shares of common stock authorized, $.001 par value) | | | 899,695 | |
| Class R2 Shares (98.8 million shares of common stock authorized, $.001 par value) | | | 125,060 | |
| Class R3 Shares (98.8 million shares of common stock authorized, $.001 par value) | | | 3,825,069 | |
| Class R4 Shares (98.8 million shares of common stock authorized, $.001 par value) | | | 337,691 | |
| Class R5 Shares (98.8 million shares of common stock authorized, $.001 par value) | | | 216,851 | |
| Class R6 Shares (98.8 million shares of common stock authorized, $.001 par value) | | | 18,440,481 | |
| Net asset value, offering and redemption price per share (Net assets divided by outstanding shares): | | | | |
| Class A Shares-Net asset value | | | $24.46 | |
| Class A Shares-Maximum offering price (Net asset value plus sales charge of 5.75%) | | | $25.95 | |
| Class C Shares-Net asset value | | | $13.89 | |
| Class F Shares-Net asset value | | | $26.01 | |
| Class F3 Shares-Net asset value | | | $30.74 | |
| Class I Shares-Net asset value | | | $30.50 | |
| Class P Shares-Net asset value | | | $23.11 | |
| Class R2 Shares-Net asset value | | | $22.48 | |
| Class R3 Shares-Net asset value | | | $23.17 | |
| Class R4 Shares-Net asset value | | | $24.45 | |
| Class R5 Shares-Net asset value | | | $30.50 | |
| Class R6 Shares-Net asset value | | | $30.74 | |
| | | |
| | See Notes to Financial Statements. | 13 |
Statement of Operations
For the Year Ended July 31, 2020
| Investment income: | | | |
| Dividends | | $ | 2,341,835 | |
| Securities lending net income | | | 661,441 | |
| Interest and other | | | 218,471 | |
| Interest earned from Interfund Lending (See Note 10) | | | 1,106 | |
| Total investment income | | | 3,222,853 | |
| Expenses: | | | | |
| Management fee | | | 9,715,979 | |
| 12b-1 distribution plan-Class A | | | 1,521,023 | |
| 12b-1 distribution plan-Class C | | | 149,560 | |
| 12b-1 distribution plan-Class F | | | 137,859 | |
| 12b-1 distribution plan-Class P | | | 83,419 | |
| 12b-1 distribution plan-Class R2 | | | 20,351 | |
| 12b-1 distribution plan-Class R3 | | | 433,451 | |
| 12b-1 distribution plan-Class R4 | | | 14,973 | |
| Shareholder servicing | | | 1,598,866 | |
| Fund administration | | | 757,278 | |
| Registration | | | 171,462 | |
| Professional | | | 103,728 | |
| Reports to shareholders | | | 89,613 | |
| Directors’ fees | | | 52,021 | |
| Custody | | | 29,144 | |
| Other | | | 210,506 | |
| Gross expenses | | | 15,089,233 | |
| Expense reductions (See Note 8) | | | (26,714 | ) |
| Fees waived and expenses reimbursed (See Note 3) | | | (16,626 | ) |
| Net expenses | | | 15,045,893 | |
| Net investment loss | | | (11,823,040 | ) |
| Net realized and unrealized gain (loss): | | | | |
| Net realized gain (loss) on investments | | | 331,996,531 | |
| Net change in unrealized appreciation/depreciation on investments | | | 2,700,989 | |
| Net realized and unrealized gain (loss) | | | 334,697,520 | |
| Net Increase in Net Assets Resulting From Operations | | $ | 322,874,480 | |
| | |
| 14 | See Notes to Financial Statements. |
Statements of Changes in Net Assets
| | | For the Year Ended | | | For the Year Ended | |
| INCREASE IN NET ASSETS | | July 31, 2020 | | | July 31, 2019 | |
| Operations: | | | | | | | | |
| Net investment loss | | $ | (11,823,040 | ) | | $ | (11,681,683 | ) |
| Net realized gain (loss) on investments | | | 331,996,531 | | | | 313,011,497 | |
| Net change in unrealized appreciation/depreciation on investments | | | 2,700,989 | | | | 85,138,161 | |
| Net increase in net assets resulting from operations | | | 322,874,480 | | | | 386,467,975 | |
| Distributions to shareholders: | | | | | | | | |
| Class A | | | (114,658,673 | ) | | | (143,990,315 | ) |
| Class C | | | (4,179,282 | ) | | | (7,182,646 | ) |
| Class F | | | (17,755,452 | ) | | | (20,259,583 | ) |
| Class F3 | | | (476,152 | ) | | | (554,521 | ) |
| Class I | | | (117,432,735 | ) | | | (152,166,447 | ) |
| Class P | | | (3,744,986 | ) | | | (4,878,718 | ) |
| Class R2 | | | (771,276 | ) | | | (1,263,450 | ) |
| Class R3 | | | (17,648,373 | ) | | | (23,230,994 | ) |
| Class R4 | | | (1,111,799 | ) | | | (1,144,059 | ) |
| Class R5 | | | (356,352 | ) | | | (557,791 | ) |
| Class R6 | | | (36,493,579 | ) | | | (38,576,002 | ) |
| Total distributions to shareholders | | | (314,628,659 | ) | | | (393,804,526 | ) |
| Capital share transactions (Net of share conversions) (See Note 14): | | | |
| Net proceeds from sales of shares | | | 956,839,859 | | | | 333,218,567 | |
| Reinvestment of distributions | | | 299,702,239 | | | | 374,586,927 | |
| Cost of shares reacquired | | | (819,458,931 | ) | | | (575,897,153 | ) |
| Net increase in net assets resulting from capital share transactions | | | 437,083,167 | | | | 131,908,341 | |
| Net increase in net assets | | | 445,328,988 | | | | 124,571,790 | |
| NET ASSETS: | | | | | | | | |
| Beginning of year | | $ | 2,103,023,674 | | | $ | 1,978,451,884 | |
| End of year | | $ | 2,548,352,662 | | | $ | 2,103,023,674 | |
| | | |
| | See Notes to Financial Statements. | 15 |
Financial Highlights
| | | | | | Per Share Operating Performance: |
| | | | | | Investment Operations: | | Distributions
to
shareholders
from: |
| | | | | | | | |
| | | Net asset
value,
beginning
of period | | Net
investment
income
(loss)(a) | | Net
realized and
unrealized
gain (loss) | | Total from
investment
operations | | Net
realized
gain |
| Class A | | | | | | | | | | | | | | | | | | | | |
| 7/31/2020 | | $ | 26.30 | | | $ | (0.16 | ) | | $ | 2.81 | | | $ | 2.65 | | | $ | (4.49 | ) |
| 7/31/2019 | | | 28.59 | | | | (0.18 | ) | | | 4.14 | | | | 3.96 | | | | (6.25 | ) |
| 7/31/2018 | | | 20.61 | | | | (0.15 | ) | | | 8.13 | | | | 7.98 | | | | – | |
| 7/31/2017 | | | 18.26 | | | | (0.07 | ) | | | 2.42 | | | | 2.35 | | | | – | |
| 7/31/2016 | | | 24.45 | | | | (0.12 | ) | | | (4.22 | ) | | | (4.34 | ) | | | (1.85 | ) |
| Class C | | | | | | | | | | | | | | | | | | | | |
| 7/31/2020 | | | 17.24 | | | | (0.19 | ) | | | 1.33 | | | | 1.14 | | | | (4.49 | ) |
| 7/31/2019 | | | 21.30 | | | | (0.25 | ) | | | 2.44 | | | | 2.19 | | | | (6.25 | ) |
| 7/31/2018 | | | 15.49 | | | | (0.24 | ) | | | 6.05 | | | | 5.81 | | | | – | |
| 7/31/2017 | | | 13.82 | | | | (0.16 | ) | | | 1.83 | | | | 1.67 | | | | – | |
| 7/31/2016 | | | 19.17 | | | | (0.20 | ) | | | (3.30 | ) | | | (3.50 | ) | | | (1.85 | ) |
| Class F | | | | | | | | | | | | | | | | | | | | |
| 7/31/2020 | | | 27.61 | | | | (0.14 | ) | | | 3.03 | | | | 2.89 | | | | (4.49 | ) |
| 7/31/2019 | | | 29.63 | | | | (0.15 | ) | | | 4.38 | | | | 4.23 | | | | (6.25 | ) |
| 7/31/2018 | | | 21.32 | | | | (0.12 | ) | | | 8.43 | | | | 8.31 | | | | – | |
| 7/31/2017 | | | 18.86 | | | | (0.05 | ) | | | 2.51 | | | | 2.46 | | | | – | |
| 7/31/2016 | | | 25.16 | | | | (0.10 | ) | | | (4.35 | ) | | | (4.45 | ) | | | (1.85 | ) |
| Class F3 | | | | | | | | | | | | | | | | | | | | |
| 7/31/2020 | | | 31.66 | | | | (0.13 | ) | | | 3.70 | | | | 3.57 | | | | (4.49 | ) |
| 7/31/2019 | | | 32.88 | | | | (0.11 | ) | | | 5.14 | | | | 5.03 | | | | (6.25 | ) |
| 7/31/2018 | | | 23.62 | | | | (0.09 | ) | | | 9.35 | | | | 9.26 | | | | – | |
| 4/4/2017 to 7/31/2017(c) | | | 22.09 | | | | (0.04 | ) | | | 1.57 | | | | 1.53 | | | | – | |
| Class I | | | | | | | | | | | | | | | | | | | | |
| 7/31/2020 | | | 31.48 | | | | (0.13 | ) | | | 3.64 | | | | 3.51 | | | | (4.49 | ) |
| 7/31/2019 | | | 32.76 | | | | (0.14 | ) | | | 5.11 | | | | 4.97 | | | | (6.25 | ) |
| 7/31/2018 | | | 23.55 | | | | (0.10 | ) | | | 9.31 | | | | 9.21 | | | | – | |
| 7/31/2017 | | | 20.81 | | | | (0.03 | ) | | | 2.77 | | | | 2.74 | | | | – | |
| 7/31/2016 | | | 27.51 | | | | (0.08 | ) | | | (4.77 | ) | | | (4.85 | ) | | | (1.85 | ) |
| Class P | | | | | | | | | | | | | | | | | | | | |
| 7/31/2020 | | | 25.18 | | | | (0.19 | ) | | | 2.61 | | | | 2.42 | | | | (4.49 | ) |
| 7/31/2019 | | | 27.72 | | | | (0.22 | ) | | | 3.93 | | | | 3.71 | | | | (6.25 | ) |
| 7/31/2018 | | | 19.99 | | | | (0.15 | ) | | | 7.88 | | | | 7.73 | | | | – | |
| 7/31/2017 | | | 17.71 | | | | (0.07 | ) | | | 2.35 | | | | 2.28 | | | | – | |
| 7/31/2016 | | | 23.78 | | | | (0.12 | ) | | | (4.10 | ) | | | (4.22 | ) | | | (1.85 | ) |
| 16 | See Notes to Financial Statements. |
| | | | | | | Ratios to Average Net Assets: | | Supplemental Data: |
| | | | | | | | | |
Net asset
value,
end of
period | | Total
return(b)
(%) | | Total
expenses
after waivers
and/or
reimburse-
ments
(%) | | Total
expenses
(%) | | Net
investment
income (loss)
(%) | | Net assets,
end of
period
(000) | | Portfolio
turnover
rate
(%) |
| | | | | | | | | | | | | | | | | | | | |
| $ | 24.46 | | | | 15.24 | | | | 0.93 | | | | 0.93 | | | | (0.76 | ) | | $ | 765,172 | | | | 122 | |
| | 26.30 | | | | 22.26 | | | | 0.94 | | | | 0.94 | | | | (0.72 | ) | | | 708,935 | | | | 88 | |
| | 28.59 | | | | 38.72 | | | | 0.93 | | | | 0.93 | | | | (0.62 | ) | | | 686,002 | | | | 90 | |
| | 20.61 | | | | 12.87 | | | | 0.97 | | | | 0.97 | | | | (0.39 | ) | | | 628,782 | | | | 134 | |
| | 18.26 | | | | (18.13 | ) | | | 1.01 | | | | 1.01 | | | | (0.65 | ) | | | 831,225 | | | | 204 | |
| | | | | | | | | | | | | | | | | | | | | | | | | | | |
| | 13.89 | | | | 14.30 | | | | 1.68 | | | | 1.68 | | | | (1.51 | ) | | | 16,876 | | | | 122 | |
| | 17.24 | | | | 21.38 | | | | 1.69 | | | | 1.69 | | | | (1.47 | ) | | | 21,394 | | | | 88 | |
| | 21.30 | | | | 37.51 | | | | 1.69 | | | | 1.69 | | | | (1.37 | ) | | | 26,175 | | | | 90 | |
| | 15.49 | | | | 12.08 | | | | 1.72 | | | | 1.72 | | | | (1.14 | ) | | | 44,838 | | | | 134 | |
| | 13.82 | | | | (18.79 | ) | | | 1.76 | | | | 1.76 | | | | (1.41 | ) | | | 64,562 | | | | 204 | |
| | | | | | | | | | | | | | | | | | | | | | | | | | | |
| | 26.01 | | | | 15.37 | | | | 0.78 | | | | 0.78 | | | | (0.62 | ) | | | 348,248 | | | | 122 | |
| | 27.61 | | | | 22.43 | | | | 0.79 | | | | 0.79 | | | | (0.58 | ) | | | 116,807 | | | | 88 | |
| | 29.63 | | | | 38.98 | | | | 0.79 | | | | 0.79 | | | | (0.48 | ) | | | 100,650 | | | | 90 | |
| | 21.32 | | | | 13.04 | | | | 0.82 | | | | 0.82 | | | | (0.25 | ) | | | 111,360 | | | | 134 | |
| | 18.86 | | | | (18.05 | ) | | | 0.86 | | | | 0.86 | | | | (0.52 | ) | | | 121,768 | | | | 204 | |
| | | | | | | | | | | | | | | | | | | | | | | | | | | |
| | 30.74 | | | | 15.61 | | | | 0.59 | | | | 0.59 | | | | (0.46 | ) | | | 130,387 | | | | 122 | |
| | 31.66 | | | | 22.64 | | | | 0.60 | | | | 0.60 | | | | (0.39 | ) | | | 3,321 | | | | 88 | |
| | 32.88 | | | | 39.25 | | | | 0.59 | | | | 0.59 | | | | (0.31 | ) | | | 2,941 | | | | 90 | |
| | 23.62 | | | | 6.93 | (d) | | | 0.60 | (e) | | | 0.60 | (e) | | | (0.50 | )(e) | | | 431 | | | | 134 | |
| | | | | | | | | | | | | | | | | | | | | | | | | | | |
| | 30.50 | | | | 15.50 | | | | 0.69 | | | | 0.69 | | | | (0.51 | ) | | | 593,675 | | | | 122 | |
| | 31.48 | | | | 22.56 | | | | 0.69 | | | | 0.69 | | | | (0.48 | ) | | | 853,159 | | | | 88 | |
| | 32.76 | | | | 39.11 | | | | 0.69 | | | | 0.69 | | | | (0.37 | ) | | | 824,588 | | | | 90 | |
| | 23.55 | | | | 13.17 | | | | 0.72 | | | | 0.72 | | | | (0.14 | ) | | | 787,341 | | | | 134 | |
| | 20.81 | | | | (17.96 | ) | | | 0.76 | | | | 0.76 | | | | (0.41 | ) | | | 1,182,207 | | | | 204 | |
| | | | | | | | | | | | | | | | | | | | | | | | | | | |
| | 23.11 | | | | 14.97 | | | | 1.14 | | | | 1.14 | | | | (0.96 | ) | | | 20,793 | | | | 122 | |
| | 25.18 | | | | 22.02 | | | | 1.14 | | | | 1.14 | | | | (0.92 | ) | | | 22,082 | | | | 88 | |
| | 27.72 | | | | 38.67 | | | | 0.97 | | | | 0.97 | | | | (0.66 | ) | | | 22,591 | | | | 90 | |
| | 19.99 | | | | 12.94 | | | | 0.97 | | | | 0.97 | | | | (0.40 | ) | | | 22,629 | | | | 134 | |
| | 17.71 | | | | (18.18 | ) | | | 1.01 | | | | 1.01 | | | | (0.66 | ) | | | 25,784 | | | | 204 | |
| | See Notes to Financial Statements. | 17 |
Financial Highlights (concluded)
| | | | | | Per Share Operating Performance: |
| | | | | | Investment Operations: | | Distributions
to
shareholders
from: |
| | | | | | | | |
| | | Net asset
value,
beginning
of period | | Net
investment
income
(loss)(a) | | Net
realized and
unrealized
gain (loss) | | Total from
investment
operations | | Net
realized
gain |
| Class R2 | | | | | | | | | | | | | | | | | | | | |
| 7/31/2020 | | $ | 24.67 | | | $ | (0.22 | ) | | $ | 2.52 | | | $ | 2.30 | | | $ | (4.49 | ) |
| 7/31/2019 | | | 27.33 | | | | (0.25 | ) | | | 3.84 | | | | 3.59 | | | | (6.25 | ) |
| 7/31/2018 | | | 19.77 | | | | (0.23 | ) | | | 7.79 | | | | 7.56 | | | | – | |
| 7/31/2017 | | | 17.58 | | | | (0.14 | ) | | | 2.33 | | | | 2.19 | | | | – | |
| 7/31/2016 | | | 23.70 | | | | (0.18 | ) | | | (4.09 | ) | | | (4.27 | ) | | | (1.85 | ) |
| Class R3 | | | | | | | | | | | | | | | | | | | | |
| 7/31/2020 | | | 25.24 | | | | (0.20 | ) | | | 2.62 | | | | 2.42 | | | | (4.49 | ) |
| 7/31/2019 | | | 27.79 | | | | (0.23 | ) | | | 3.93 | | | | 3.70 | | | | (6.25 | ) |
| 7/31/2018 | | | 20.08 | | | | (0.20 | ) | | | 7.91 | | | | 7.71 | | | | – | |
| 7/31/2017 | | | 17.83 | | | | (0.12 | ) | | | 2.37 | | | | 2.25 | | | | – | |
| 7/31/2016 | | | 23.99 | | | | (0.16 | ) | | | (4.15 | ) | | | (4.31 | ) | | | (1.85 | ) |
| Class R4 | | | | | | | | | | | | | | | | | | | | |
| 7/31/2020 | | | 26.29 | | | | (0.16 | ) | | | 2.81 | | | | 2.65 | | | | (4.49 | ) |
| 7/31/2019 | | | 28.59 | | | | (0.18 | ) | | | 4.13 | | | | 3.95 | | | | (6.25 | ) |
| 7/31/2018 | | | 20.60 | | | | (0.15 | ) | | | 8.14 | | | | 7.99 | | | | – | |
| 7/31/2017 | | | 18.25 | | | | (0.07 | ) | | | 2.42 | | | | 2.35 | | | | – | |
| 7/31/2016 | | | 24.45 | | | | (0.10 | ) | | | (4.25 | ) | | | (4.35 | ) | | | (1.85 | ) |
| Class R5 | | | | | | | | | | | | | | | | | | | | |
| 7/31/2020 | | | 31.47 | | | | (0.14 | ) | | | 3.66 | | | | 3.52 | | | | (4.49 | ) |
| 7/31/2019 | | | 32.75 | | | | (0.14 | ) | | | 5.11 | | | | 4.97 | | | | (6.25 | ) |
| 7/31/2018 | | | 23.55 | | | | (0.11 | ) | | | 9.31 | | | | 9.20 | | | | – | |
| 7/31/2017 | | | 20.81 | | | | (0.03 | ) | | | 2.77 | | | | 2.74 | | | | – | |
| 7/31/2016 | | | 27.50 | | | | (0.07 | ) | | | (4.77 | ) | | | (4.84 | ) | | | (1.85 | ) |
| Class R6 | | | | | | | | | | | | | | | | | | | | |
| 7/31/2020 | | | 31.66 | | | | (0.11 | ) | | | 3.68 | | | | 3.57 | | | | (4.49 | ) |
| 7/31/2019 | | | 32.88 | | | | (0.11 | ) | | | 5.14 | | | | 5.03 | | | | (6.25 | ) |
| 7/31/2018 | | | 23.62 | | | | (0.08 | ) | | | 9.34 | | | | 9.26 | | | | – | |
| 7/31/2017 | | | 20.85 | | | | (0.01 | ) | | | 2.78 | | | | 2.77 | | | | – | |
| 7/31/2016 | | | 27.51 | | | | (0.04 | ) | | | (4.77 | ) | | | (4.81 | ) | | | (1.85 | ) |
| (a) | Calculated using average shares outstanding during the period. |
| (b) | Total return for Classes A and C does not consider the effects of sales loads and assumes the reinvestment of all distributions. Total return for all other classes assumes the reinvestment of all distributions. |
| (c) | Commenced on April 4, 2017. |
| (d) | Not annualized. |
| (e) | Annualized. |
| 18 | See Notes to Financial Statements. |
| | | | | | | Ratios to Average Net Assets: | | Supplemental Data: |
| | | | | | | | | |
Net asset
value,
end of
period | | Total
return(b)
(%) | | Total
expenses
after waivers
and/or
reimburse-
ments
(%) | | Total
expenses
(%) | | Net
investment
income (loss)
(%) | | Net assets,
end of
period
(000) | | Portfolio
turnover
rate
(%) |
| | | | | | | | | | | | | | | | | | | | | | | | | | | |
| $ | 22.48 | | | | 14.76 | | | | 1.29 | | | | 1.29 | | | | (1.11 | ) | | $ | 2,812 | | | | 122 | |
| | 24.67 | | | | 21.87 | | | | 1.29 | | | | 1.29 | | | | (1.06 | ) | | | 4,718 | | | | 88 | |
| | 27.33 | | | | 38.24 | | | | 1.29 | | | | 1.29 | | | | (0.97 | ) | | | 6,530 | | | | 90 | |
| | 19.77 | | | | 12.52 | | | | 1.32 | | | | 1.32 | | | | (0.75 | ) | | | 6,275 | | | | 134 | |
| | 17.58 | | | | (18.47 | ) | | | 1.36 | | | | 1.36 | | | | (1.00 | ) | | | 10,212 | | | | 204 | |
| | | | | | | | | | | | | | | | | | | | | | | | | | | |
| | 23.17 | | | | 14.93 | | | | 1.19 | | | | 1.19 | | | | (1.01 | ) | | | 88,636 | | | | 122 | |
| | 25.24 | | | | 21.92 | | | | 1.19 | | | | 1.19 | | | | (0.97 | ) | | | 107,373 | | | | 88 | |
| | 27.79 | | | | 38.40 | | | | 1.19 | | | | 1.19 | | | | (0.88 | ) | | | 111,564 | | | | 90 | |
| | 20.08 | | | | 12.62 | | | | 1.22 | | | | 1.22 | | | | (0.64 | ) | | | 131,974 | | | | 134 | |
| | 17.83 | | | | (18.37 | ) | | | 1.26 | | | | 1.26 | | | | (0.91 | ) | | | 197,382 | | | | 204 | |
| | | | | | | | | | | | | | | | | | | | | | | | | | | |
| | 24.45 | | | | 15.21 | | | | 0.93 | | | | 0.93 | | | | (0.76 | ) | | | 8,255 | | | | 122 | |
| | 26.29 | | | | 22.23 | | | | 0.94 | | | | 0.94 | | | | (0.73 | ) | | | 6,222 | | | | 88 | |
| | 28.59 | | | | 38.79 | | | | 0.93 | | | | 0.93 | | | | (0.63 | ) | | | 5,489 | | | | 90 | |
| | 20.60 | | | | 12.88 | | | | 0.95 | | | | 0.95 | | | | (0.38 | ) | | | 3,053 | | | | 134 | |
| | 18.25 | | | | (18.18 | ) | | | 0.97 | | | | 0.97 | | | | (0.62 | ) | | | 626 | | | | 204 | |
| | | | | | | | | | | | | | | | | | | | | | | | | | | |
| | 30.50 | | | | 15.50 | | | | 0.68 | | | | 0.68 | | | | (0.52 | ) | | | 6,613 | | | | 122 | |
| | 31.47 | | | | 22.53 | | | | 0.69 | | | | 0.69 | | | | (0.48 | ) | | | 3,247 | | | | 88 | |
| | 32.75 | | | | 39.11 | | | | 0.68 | | | | 0.68 | | | | (0.38 | ) | | | 3,313 | | | | 90 | |
| | 23.55 | | | | 13.17 | | | | 0.71 | | | | 0.71 | | | | (0.12 | ) | | | 2,520 | | | | 134 | |
| | 20.81 | | | | (17.93 | ) | | | 0.70 | | | | 0.70 | | | | (0.34 | ) | | | 1,006 | | | | 204 | |
| | | | | | | | | | | | | | | | | | | | | | | | | | | |
| | 30.74 | | | | 15.61 | | | | 0.60 | | | | 0.60 | | | | (0.43 | ) | | | 566,885 | | | | 122 | |
| | 31.66 | | | | 22.68 | | | | 0.60 | | | | 0.60 | | | | (0.39 | ) | | | 255,766 | | | | 88 | |
| | 32.88 | | | | 39.20 | | | | 0.59 | | | | 0.59 | | | | (0.28 | ) | | | 188,610 | | | | 90 | |
| | 23.62 | | | | 13.29 | | | | 0.60 | | | | 0.60 | | | | (0.04 | ) | | | 202,128 | | | | 134 | |
| | 20.85 | | | | (17.80 | ) | | | 0.60 | | | | 0.60 | | | | (0.19 | ) | | | 200,641 | | | | 204 | |
| | See Notes to Financial Statements. | 19 |
Notes to Financial Statements
Lord Abbett Developing Growth Fund, Inc. (the “Fund”) is registered under the Investment Company Act of 1940, as amended (the “Act”), as a diversified, open-end management investment company. The Fund was incorporated under Maryland law on August 21, 1978. The Fund’s predecessor corporation was organized on July 11, 1973.
The Fund’s investment objective is long-term growth of capital through a diversified and actively managed portfolio consisting of developing growth companies, many of which are traded over the counter. The Fund has eleven active classes of shares: Class A, C, F, F3, I, P, R2, R3, R4, R5 and R6, each with different expenses and dividends. A front-end sales charge is normally added to the net asset value (“NAV”) for Class A shares. There is no front-end sales charge in the case of Class C, F, I, F3, P, R2, R3, R4, R5 and R6 shares, although there may be a contingent deferred sales charge (“CDSC”) in certain cases as follows: Class A shares purchased without a sales charge and redeemed before the first day of the month in which the one-year anniversary of the purchase falls (subject to certain exceptions as set forth in the Fund’s prospectus); and Class C shares redeemed before the first anniversary of purchase. Effective June 30, 2020, Class C shares will automatically convert to Class A shares on the 25th day of the month (or, if the 25th is not a business day, the next business day thereafter) following the eighth anniversary of the month on which the purchase order was accepted, provided that the Fund or financial intermediary through which a shareholder purchased Class C shares has records verifying that the C shares have been held at least eight years. The first conversion of Class C to A Shares under this new policy took place on July 25, 2020 for all Class C shares that were held for more than eight years as of June 30, 2020. Prior to June 30, 2020, Class C shares converted following the tenth anniversary of the month which the purchase order was accepted.
The preparation of the financial statements in conformity with accounting principles generally accepted in the United States of America (“U.S. GAAP”) requires management to make certain estimates and assumptions that affect the reported amounts of assets and liabilities and disclosure of contingent assets and liabilities at the date of the financial statements and the reported amounts of increases and decreases in net assets from operations during the reporting period. Actual results could differ from those estimates. The Fund is considered an investment company under U.S. GAAP and follows the accounting and reporting guidance applicable to investment companies.
| 2. | SIGNIFICANT ACCOUNTING POLICIES |
| (a) | Investment Valuation–Under procedures approved by the Fund’s Board of Directors (the “Board”), Lord, Abbett & Co. LLC (“Lord Abbett”), the Fund’s investment manager, has formed a Pricing Committee to administer the pricing and valuation of portfolio investments and to ensure that prices utilized reasonably reflect fair value. Among other things, these procedures allow the Fund to utilize independent pricing services, quotations from securities and financial instrument dealers and other market sources to determine fair value. |
| | |
| | Securities actively traded on any recognized U.S. or non-U.S. exchange or on The NASDAQ Stock Market LLC are valued at the last sale price or official closing price on the exchange or system on which they are principally traded. Events occurring after the close of trading on non-U.S. exchanges may result in adjustments to the valuation of foreign securities to reflect their fair value as of the close of regular trading on the New York Stock Exchange. The Fund may utilize an independent fair valuation service in adjusting the valuations of foreign securities. Unlisted equity securities are valued at the last quoted sale price or, if no sale price is available, at the mean between the most recently quoted bid and asked prices. |
20
Notes to Financial Statements (continued)
| | Securities for which prices are not readily available are valued at fair value as determined by the Pricing Committee. The Pricing Committee considers a number of factors, including observable and unobservable inputs, when arriving at fair value. The Pricing Committee may use related or comparable assets or liabilities, recent transactions, market multiples, book values and other relevant information to determine the fair value of portfolio investments. The Board or a designated committee thereof regularly reviews fair value determinations made by the Pricing Committee and may employ techniques such as reviewing related market activity, reviewing inputs and assumptions, and retrospectively comparing prices of subsequent purchases and sales transactions to fair value determinations made by the Pricing Committee. Short-term securities with 60 days or less remaining to maturity are valued using the amortized cost method, which approximates fair value. |
| | |
| (b) | Security Transactions–Security transactions are recorded as of the date that the securities are purchased or sold (trade date). Realized gains and losses on sales of portfolio securities are calculated using the identified-cost method. Realized and unrealized gains (losses) are allocated to each class of shares based upon the relative proportion of net assets at the beginning of the day. |
| | |
| (c) | Investment Income–Dividend income is recorded on the ex-dividend date. Interest income is recorded on the accrual basis as earned. Discounts are accreted and premiums are amortized using the effective interest method and are included in Interest and other on the Statement of Operations. Withholding taxes on foreign dividends have been provided for in accordance with the applicable country’s tax rules and rates. Investment income is allocated to each class of shares based upon the relative proportion of net assets at the beginning of the day. |
| | |
| (d) | Income Taxes–It is the policy of the Fund to meet the requirements of Subchapter M of the Internal Revenue Code applicable to regulated investment companies and to distribute substantially all taxable income and capital gains to its shareholders. Therefore, no income tax provision is required. |
| | |
| | The Fund files U.S. federal and various state and local tax returns. No income tax returns are currently under examination. The statute of limitations on the Fund’s filed U.S. federal tax returns remains open for the fiscal years ended July 31, 2017 through July 31, 2020. The statutes of limitations on the Fund’s state and local tax returns may remain open for an additional year depending upon the jurisdiction. |
| | |
| (e) | Expenses–Expenses, excluding class-specific expenses, are allocated to each class of shares based upon the relative proportion of net assets at the beginning of the day. In addition, Class F3 and R6 bear only their class-specific shareholder servicing expenses. Class A, C, F, P, R2, R3 and R4 shares bear their class-specific share of all expenses and fees relating to the Fund’s 12b-1 Distribution Plan. |
| | |
| (f) | Repurchase Agreements–The Fund may enter into repurchase agreements with respect to securities. A repurchase agreement is a transaction in which a fund acquires a security and simultaneously commits to resell that security to the seller (a bank or securities dealer) at an agreed-upon price on an agreed-upon date. The Fund requires at all times that the repurchase agreement be collateralized by cash, or by securities of the U.S. Government, its agencies, its instrumentalities, or U.S. Government sponsored enterprises having a value equal to, or in excess of, the value of the repurchase agreement (including accrued interest). If the seller of the agreement defaults on its obligation to repurchase the underlying securities at a time when the fair value of these securities has declined, the Fund may incur a loss upon disposition of the securities. |
21
Notes to Financial Statements (continued)
| (g) | Fair Value Measurements–Fair value is defined as the price that the Fund would receive upon selling an investment or transferring a liability in an orderly transaction to an independent buyer in the principal or most advantageous market of the investment. A three-tier hierarchy is used to maximize the use of observable market data and minimize the use of unobservable inputs and to establish classification of fair value measurements for disclosure purposes. Inputs refer broadly to the assumptions that market participants would use in pricing the asset or liability, including assumptions about risk - for example, the risk inherent in a particular valuation technique used to measure fair value (such as a pricing model) and/or the risk inherent in the inputs to the valuation technique. Inputs may be observable or unobservable. Observable inputs reflect the assumptions market participants would use in pricing the asset or liability. Observable inputs are based on market data obtained from sources independent of the reporting entity. Unobservable inputs reflect the reporting entity’s own assumptions about the assumptions market participants would use in pricing the asset or liability. Unobservable inputs are based on the best information available in the circumstances. The three-tier hierarchy classification is determined based on the lowest level of inputs that is significant to the fair value measurement, and is summarized in the three broad Levels listed below: |
| | • | Level 1 – | unadjusted quoted prices in active markets for identical investments; |
| | • | Level 2 – | other significant observable inputs (including quoted prices for similar investments, interest rates, prepayment speeds, credit risk, etc.); and |
| | • | Level 3 – | significant unobservable inputs (including the Fund’s own assumptions in determining the fair value of investments). |
| | A summary of inputs used in valuing the Fund’s investments as of July 31, 2020 and, if applicable, Level 3 rollforwards for the fiscal year then ended is included in the Fund’s Schedule of Investments. |
| | |
| | Changes in valuation techniques may result in transfers into or out of an assigned level within the three-tier hierarchy. The inputs or methodology used for valuing securities are not necessarily an indication of the risk associated with investing in those securities. |
| 3. | MANAGEMENT FEE AND OTHER TRANSACTIONS WITH AFFILIATES |
Management Fee
The Fund has a management agreement with Lord Abbett, pursuant to which Lord Abbett supplies the Fund with investment management services and executive and other personnel, provides office space and pays for ordinary and necessary office and clerical expenses relating to research and statistical work and supervision of the Fund’s investment portfolio.
The management fee is based on the Fund’s average daily net assets at the following annual rate:
| First $100 million | .75% |
| Over $100 million | .50% |
For the fiscal year ended July 31, 2020, the effective management fee was at an annualized rate of 0.51% of the Fund’s average daily net assets.
In addition, Lord Abbett provides certain administrative services to the Fund pursuant to an Administrative Services Agreement in return for a fee at an annual rate of .04% of the Fund’s average daily net assets. Lord Abbett voluntarily waived $16,626 of fund administration fees during the fiscal year ended July 31, 2020.
22
Notes to Financial Statements (continued)
12b-1 Distribution Plan
The Fund has adopted a distribution plan with respect to Class A, C, F, P, R2, R3 and R4 shares pursuant to Rule 12b-1 under the Act, which provides for the payment of ongoing distribution and service fees to Lord Abbett Distributor LLC (the “Distributor”), an affiliate of Lord Abbett. The following annual rates have been authorized by the Board pursuant to the plan:
| Fees* | | Class A(1) | | Class C | | Class F(2) | | Class P | | Class R2 | | Class R3 | | Class R4 |
| Service | | .25% | | .25% | | – | | .25% | | .25% | | .25% | | .25% |
| Distribution | | – | | .75% | | .10% | | .20% | | .35% | | .25% | | – |
| * | The Fund may designate a portion of the aggregate fee as attributable to service activities for purposes of calculating Financial Industry Regulatory Authority, Inc. (“FINRA”) sales charge limitations. |
| (1) | Annual Service fee on shares sold prior to June 1, 1990 is .15% of the average daily net assets attributable to Class A shares. |
| (2) | The Class F share Rule 12b-1 fee may be designated as a service fee in limited circumstances as described in the Fund’s prospectus. |
Class F3, I, R5 and R6 shares do not have a distribution plan.
Commissions
Distributor received the following commissions on sales of shares of the Fund, after concessions were paid to authorized dealers, for the fiscal year ended July 31, 2020:
Distributor
Commissions | Dealers’
Concessions |
| $93,158 | $510,061 |
Distributor received CDSCs of $623 and $1,245 for Class A and Class C shares, respectively, for the fiscal year ended July 31, 2020.
Other Related Parties
As of July 31, 2020, the percentage of the Fund’s outstanding shares owned by Lord Abbett Alpha Strategy Fund was 4.76%.
One Director and certain of the Fund’s officers have an interest in Lord Abbett.
| 4. | DISTRIBUTIONS AND CAPITAL LOSS CARRYFORWARDS |
Dividends from net investment income, if any, are declared and paid at least annually. Taxable net realized gains from investment transactions, reduced by allowable capital loss carryforwards, if any, are declared and distributed to shareholders at least annually. The capital loss carryforward amount, if any, is available to offset future net capital gains. Dividends and distributions to shareholders are recorded on the ex-dividend date. The amounts of dividends and distributions from net investment income and net realized capital gains are determined in accordance with federal income tax regulations, which may differ from U.S. GAAP. These book/tax differences are either considered temporary or permanent in nature. To the extent these differences are permanent in nature, such amounts are reclassified within the components of net assets based on their federal tax basis treatment; temporary differences do not require reclassification. Dividends and distributions that exceed earnings and profits for tax purposes are reported as a tax return of capital.
The tax character of distributions paid during the fiscal year ended July 31, 2020 and fiscal year ended July 31, 2019 was as follows:
| | Year Ended
7/31/2020 | | Year Ended
7/31/2019 |
| Distributions paid from: | | | |
| Net long-term capital gains | $314,628,659 | | $393,804,526 |
| Total distributions paid | $314,628,659 | | $393,804,526 |
23
Notes to Financial Statements (continued)
As of July 31, 2020, the components of accumulated gains on a tax-basis were as follows:
| Undistributed long-term capital gains | | $ | 198,699,221 | |
| Total undistributed earnings | | $ | 198,699,221 | |
| Temporary differences | | | (7,483,384 | ) |
| Unrealized gains - net | | | 683,729,488 | |
| Total accumulated gains - net | | $ | 874,945,325 | |
At the Fund’s election, certain losses incurred within the taxable year (“Qualified Late-Year Losses”) are deemed to arise on the first business day of the Fund’s next taxable year. The Fund incurred and will elect to defer late-year ordinary losses of $7,074,876 during fiscal year 2020.
As of July 31, 2020, the aggregate unrealized security gains and losses on investments and other financial instruments based on cost for U.S. federal income tax purposes were as follows:
| Tax cost | | $ | 1,927,588,641 | |
| Gross unrealized gain | | | 718,800,092 | |
| Gross unrealized loss | | | (35,070,604 | ) |
| Net unrealized security gain | | $ | 683,729,488 | |
The difference between book-basis and tax basis unrealized gains (losses) is attributable to the tax treatment of wash sales.
Permanent items identified during the fiscal year ended July 31, 2020 have been reclassified among the components of net assets based on their tax basis treatment as follows:
Total
Distributable
Earnings (loss) | Paid-in Capital |
| $(2,371,248) | $2,371,248 |
The permanent differences are attributable primarily to the tax treatment of net investment losses and certain distributions.
| 5. | PORTFOLIO SECURITIES TRANSACTIONS |
Purchases and sales of investment securities (excluding short-term investments) for the fiscal year ended July 31, 2020 were as follows:
| Purchases | Sales |
| $2,369,504,684 | $2,288,673,091 |
There were no purchases or sales of U.S. Government securities for the fiscal year ended July 31, 2020.
The Fund is permitted to purchase and sell securities (“cross-trade”) from and to other Lord Abbett funds or client accounts pursuant to procedures approved by the Board in compliance with Rule 17a-7 under the Act (the “Rule”). Each cross-trade is executed at a fair market price in compliance with provisions of the Rule. For the year ended July 31, 2020 the Fund engaged in cross-trades purchases of $19,173,261 and sales of $14,919,156, which resulted in net realized gains of $7,885,556.
24
Notes to Financial Statements (continued)
| 6. | DISCLOSURES ABOUT OFFSETTING ASSETS AND LIABILITIES |
The Financial Accounting Standards Board (“FASB”) requires disclosures intended to help better assess the effect or potential effect of offsetting arrangements on a fund’s financial position. The following tables illustrate gross and net information about recognized assets and liabilities eligible for offset in the Statement of Assets and Liabilities; and disclose such amounts subject to an enforceable master netting agreement or similar agreement, by counterparty. A master netting agreement is an agreement between the Fund and a counterparty which provides for the net settlement of amounts owed under all contracts traded under that agreement, as well as cash collateral, through a single payment by one party to the other in the event of default on or termination of any one contract. The Fund’s accounting policy with respect to balance sheet offsetting is that, absent an event of default by the counterparty or a termination of the agreement, the master netting agreement does not result in an offset of reported amounts of financial assets and liabilities in the Statement of Assets and Liabilities across transactions between the Fund and the applicable counterparty:
| Description | | Gross Amounts of
Recognized Assets | | | Gross Amounts
Offset in the
Statement of Assets
and Liabilities | | | Net Amounts of
Assets Presented
in the Statement of
Assets and Liabilities | |
| Repurchase Agreement | | | $70,266,280 | | | | $ – | | | | $70,266,280 | |
| Total | | | $70,266,280 | | | | $ – | | | | $70,266,280 | |
| | | Net Amounts
of Assets
Presented in | | | Amounts Not Offset in the
Statement of Assets and Liabilities | | | | |
| Counterparty | | the Statement
of Assets and
Liabilities | | | Financial
Instruments | | | Cash
Collateral
Received(a) | | | Securities
Collateral
Received(a) | | | Net
Amount(b) | |
| Fixed Income Clearing Corp. | | | $70,266,280 | | | | $ – | | | $ | – | | | | $(70,266,280 | ) | | $ | – | |
| Total | | | $70,266,280 | | | | $ – | | | $ | – | | | | $(70,266,280 | ) | | $ | – | |
| (a) | Collateral disclosed is limited to an amount not to exceed 100% of the net amount of assets (liabilities) presented in the Statement of Assets and Liabilities, for each respective counterparty. |
| (b) | Net amount represents the amount owed to the Fund by the counterparty as of July 31, 2020. |
| 7. | DIRECTORS’ REMUNERATION |
The Fund’s officers and one Director, who are associated with Lord Abbett, do not receive any compensation from the Fund for serving in such capacities. Independent Directors’ fees are allocated among all Lord Abbett-sponsored funds based on the net assets of each fund. There is an equity-based plan available to all Independent Directors under which Independent Directors must defer receipt of a portion of, and may elect to defer receipt of an additional portion of Directors’ fees. The deferred amounts are treated as though equivalent dollar amounts had been invested in the funds. Such amounts and earnings accrued thereon are included in Directors’ fees on the Statement of Operations and in Directors’ fees payable on the Statement of Assets and Liabilities and are not deductible for U.S. federal income tax purposes until such amounts are paid.
The Fund has entered into an arrangement with its transfer agent and custodian, whereby credits realized as a result of uninvested cash balances are used to reduce a portion of the Fund’s expenses.
25
Notes to Financial Statements (continued)
For the period ended July 31, 2020, the Fund and certain other funds managed by Lord Abbett (collectively, the “Participating Funds”) entered into a syndicated line of credit facility with various lenders for $1.17 billion (the “Syndicated Facility”) whereas State Street Bank and Trust Company (“SSB”) participated as a lender and as agent for the lenders. The Participating Funds were subject to graduated borrowing limits of one-third of Fund net assets (if Fund net assets are less than $750 million), $250 million, $300 million, $350 million, $500 million, or $1 billion, based on past borrowings and likelihood of future borrowings, among other factors. Effective August 6, 2020, the Participating Funds are subject to graduated borrowing limits of one-third of Fund net assets (if Fund net assets are less than $750 million), $250 million, $300 million, $600 million, or $900 million, based on past borrowings and likelihood of future borrowings, among other factors.
For the period ended July 31, 2020, the Participating Funds were party to an additional line of credit facility with SSB for $330 million (the “Bilateral Facility”), $250 million committed and $80 million uncommitted. Under the Bilateral Facility, the Participating Funds are subject to graduated borrowing limits of one-third of Fund net assets (if net assets are less than $750 million), $250 million, $300 million, or $330 million, based on past borrowings and likelihood of future borrowings, among other factors.
The Syndicated Facility and the Bilateral Facility are to be used for temporary or emergency purposes as an additional source of liquidity to satisfy redemptions.
For the year ended July 31, 2020, the Fund did not utilize the Facilities.
| 10. | INTERFUND LENDING PROGRAM |
Pursuant to an exemptive order issued by the U.S. Securities and Exchange Commission (“SEC exemptive order”) certain registered open-end management investment companies managed by Lord Abbett, including the Fund, participate in a joint lending and borrowing program (the “Interfund Lending Program”). The SEC exemptive order allows the funds to borrow money from and lend money to each other for temporary or emergency purposes subject to the limitations and conditions.
During the fiscal year ended July 31, 2020, the Fund participated as a lender in the Interfund Lending Program. For the period in which the loan was outstanding, the average amount loaned, average interest rate and interest income were as follows:
Average
Loan | | Average
Interest Rate | | Interest
Income* |
| $24,540,000 | | 0.55% | | $1,106 |
| * | included in the Statement of Operations |
| 11. | CUSTODIAN AND ACCOUNTING AGENT |
SSB is the Fund’s custodian and accounting agent. SSB performs custodial, accounting and recordkeeping functions relating to portfolio transactions and calculating the Fund’s NAV.
| 12. | SECURITIES LENDING AGREEMENT |
The Fund has established a securities lending agreement with Citibank, N.A. (the “agent”) for the lending of securities to qualified brokers in exchange for securities or cash collateral equal to at least the market value of securities loaned, plus interest, if applicable. Cash collateral is invested in an approved money market fund. In accordance with the Fund’s securities lending agreement, the
26
Notes to Financial Statements (continued)
market value of securities on loan is determined each day at the close of business and any additional collateral required to cover the value of securities on loan is delivered to the Fund on the next business day. As with other extensions of credit, the Fund may experience a delay in the recovery of its securities or incur a loss should the borrower of the securities breach its agreement with the Fund or become insolvent at a time when the collateral is insufficient to cover the cost of repurchasing securities on loan. Any income earned from securities lending is included in Securities Lending Income on the Statement of Operations.
The initial collateral received by the Fund is required to have a value equal to at least 100% of the market value of the securities loaned. The collateral must be marked-to-market daily to cover increases in the market value of the securities loaned (or potentially a decline in the value of the collateral). In general, the risk of borrower default will be borne by the Fund’s agent; the Fund will bear the risk of loss with respect to the investment of the cash collateral. The advantage of such loans is that the Fund continues to receive income on loaned securities while receiving a portion of any securities lending fees and earning returns on the cash amounts which may be reinvested for the purchase of investments in securities.
As of July 31, 2020, the market value of securities loaned and collateral received for the Fund was as follows:
Market Value
of Securities
Loaned | | Collateral
Received(1) | |
| $50,141,941 | | $ 52,463,318 | |
| (1) | Statement of Assets and Liabilities location: Payable for collateral due to broker for securities lending. |
The Fund is subject to the general risks and considerations associated with equity investing. The value of an investment will fluctuate in response to movements in the equity securities market in general, and to the changing prospects of individual companies in which the Fund invests.
The Fund has particular risks associated with growth stocks. Different types of stocks shift in and out of favor over time depending on market and economic conditions. The market may fail to recognize the intrinsic value of particular value stocks for a long time. Growth stocks tend to be more volatile than other stocks. Growth stocks are often more sensitive to market fluctuations than other securities because their market prices are highly sensitive to future earnings expectations. In addition, if the Fund’s assessment of a company’s potential for growth or market conditions is wrong, it could suffer losses or produce poor performance relative to other funds, even in a favorable market. The Fund invests primarily in small-cap growth company stocks, which tend to be more volatile and can be less liquid than other types of stocks, especially over the short term. Small-cap companies may also have more limited product lines, markets or financial resources, and typically experience a higher risk of failure than large-cap companies. Because the Fund may invest a portion of its assets in foreign securities and American Depositary Receipts, it may experience increased market, industry and sector, liquidity, currency, political, information and other risks. The securities of foreign companies also may be subject to inadequate exchange control regulations, the imposition of economic sanctions or other government restrictions, higher transaction and other costs, and delays in settlement to the extent they are traded on non-U.S. exchanges or markets.
27
Notes to Financial Statements (continued)
Geopolitical and other events (e.g., wars, terrorism, natural disasters, epidemics or pandemics such as the COVID-19 outbreak which began in late 2019) may disrupt securities markets and adversely affect global economies and markets, thereby decreasing the value of the Fund’s investments. Market disruptions can also prevent the Fund from implementing its investment strategies and achieving its investment objective.
The transmission of COVID-19 and efforts to contain its spread have resulted in, among other things, border closings and other significant travel restrictions and disruptions, significant disruptions to business operations, supply chains and customer activity, lower consumer demand for goods and services, event cancellations and restrictions, service cancellations, reductions and other changes, significant challenges in healthcare service preparation and delivery, and prolonged quarantines, as well as general concern and uncertainty. The impact of the COVID-19 outbreak could negatively affect the global economy, the economies of individual countries, and the financial performance of individual issuers, sectors, industries, asset classes, and markets in significant and unforeseen ways.
The COVID-19 pandemic and its effects may last for an extended period of time, and in either case could result in significant market volatility, exchange trading suspensions and closures, declines in global financial markets, higher default rates, and a substantial economic downturn or recession. The foregoing could disrupt the operations of the Fund and its service providers, adversely affect the value and liquidity of the Fund’s investments, and negatively impact the Fund’s performance and your investment in the Fund.
These factors can affect the Fund’s performance.
| 14. | SUMMARY OF CAPITAL TRANSACTIONS |
Transactions in shares of beneficial interest were as follows:
| | | | | | Year Ended
July 31, 2020 | | | | | | Year Ended
July 31, 2019 | |
| Class A Shares | | Shares | | | Amount | | | Shares | | | Amount | |
| Shares sold | | | 5,836,533 | | | $ | 120,030,824 | | | | 2,533,856 | | | $ | 60,161,045 | |
| Converted from Class C* | | | 548,316 | | | | 12,316,006 | | | | 159,663 | | | | 3,960,186 | |
| Reinvestment of distributions | | | 5,647,701 | | | | 106,007,351 | | | | 6,991,031 | | | | 132,689,761 | |
| Shares reacquired | | | (7,699,122 | ) | | | (159,116,642 | ) | | | (6,723,749 | ) | | | (160,492,891 | ) |
| Increase | | | 4,333,428 | | | $ | 79,237,539 | | | | 2,960,801 | | | $ | 36,318,101 | |
| Class C Shares | | | | | | | | | | | | | | | | |
| Shares sold | | | 963,842 | | | $ | 11,402,912 | | | | 94,394 | | | $ | 1,422,303 | |
| Reinvestment of distributions | | | 351,016 | | | | 3,762,889 | | | | 513,207 | | | | 6,415,091 | |
| Shares reacquired | | | (409,254 | ) | | | (5,202,343 | ) | | | (356,484 | ) | | | (5,526,253 | ) |
| Converted to Class A* | | | (932,112 | ) | | | (12,316,006 | ) | | | (238,611 | ) | | | (3,960,186 | ) |
| Increase (decrease) | | | (26,508 | ) | | $ | (2,352,548 | ) | | | 12,506 | | | $ | (1,649,045 | ) |
| Class F Shares | | | | | | | | | | | | | | | | |
| Shares sold | | | 10,716,644 | | | $ | 234,409,115 | | | | 1,132,648 | | | $ | 27,861,522 | |
| Reinvestment of distributions | | | 788,289 | | | | 15,718,473 | | | | 889,730 | | | | 17,705,628 | |
| Shares reacquired | | | (2,344,390 | ) | | | (51,846,089 | ) | | | (1,189,240 | ) | | | (29,283,329 | ) |
| Increase | | | 9,160,543 | | | $ | 198,281,499 | | | | 833,138 | | | $ | 16,283,821 | |
28
Notes to Financial Statements (concluded)
| | | | | | Year Ended
July 31, 2020 | | | | | | Year Ended
July 31, 2019 | |
| Class F3 Shares | | Shares | | | Amount | | | Shares | | | Amount | |
| Shares sold | | | 4,209,213 | | | $ | 114,485,523 | | | | 11,635 | | | $ | 356,161 | |
| Reinvestment of distributions | | | 20,227 | | | | 476,152 | | | | 24,332 | | | | 554,521 | |
| Shares reacquired | | | (93,246 | ) | | | (2,516,803 | ) | | | (20,508 | ) | | | (586,581 | ) |
| Increase | | | 4,136,194 | | | $ | 112,444,872 | | | | 15,459 | | | $ | 324,101 | |
| Class I Shares | | | | | | | | | | | | | | | | |
| Shares sold | | | 4,483,104 | | | $ | 114,101,929 | | | | 3,816,110 | | | $ | 109,225,109 | |
| Reinvestment of distributions | | | 4,971,625 | | | | 116,137,155 | | | | 6,642,840 | | | | 150,593,194 | |
| Shares reacquired | | | (17,092,628 | ) | | | (435,204,712 | ) | | | (8,528,902 | ) | | | (240,583,019 | ) |
| Increase (decrease) | | | (7,637,899 | ) | | $ | (204,965,628 | ) | | | 1,930,048 | | | $ | 19,235,284 | |
| Class P Shares | | | | | | | | | | | | | | | | |
| Shares sold | | | 53,425 | | | $ | 1,074,366 | | | | 90,663 | | | $ | 2,284,636 | |
| Reinvestment of distributions | | | 208,649 | | | | 3,705,614 | | | | 265,237 | | | | 4,824,657 | |
| Shares reacquired | | | (239,410 | ) | | | (4,586,091 | ) | | | (293,872 | ) | | | (6,905,095 | ) |
| Increase | | | 22,664 | | | $ | 193,889 | | | | 62,028 | | | $ | 204,198 | |
| Class R2 Shares | | | | | | | | | | | | | | | | |
| Shares sold | | | 17,182 | | | $ | 322,527 | | | | 54,100 | | | $ | 1,203,449 | |
| Reinvestment of distributions | | | 38,651 | | | | 668,658 | | | | 52,877 | | | | 943,322 | |
| Shares reacquired | | | (122,041 | ) | | | (2,302,663 | ) | | | (154,611 | ) | | | (3,696,703 | ) |
| Decrease | | | (66,208 | ) | | $ | (1,311,478 | ) | | | (47,634 | ) | | $ | (1,549,932 | ) |
| Class R3 Shares | | | | | | | | | | | | | | | | |
| Shares sold | | | 846,398 | | | $ | 16,745,305 | | | | 1,136,267 | | | $ | 26,693,829 | |
| Reinvestment of distributions | | | 990,925 | | | | 17,648,372 | | | | 1,273,628 | | | | 23,230,982 | |
| Shares reacquired | | | (2,265,708 | ) | | | (44,550,210 | ) | | | (2,171,619 | ) | | | (50,882,528 | ) |
| Increase (decrease) | | | (428,385 | ) | | $ | (10,156,533 | ) | | | 238,276 | | | $ | (957,717 | ) |
| Class R4 Shares | | | | | | | | | | | | | | | | |
| Shares sold | | | 154,317 | | | $ | 3,346,277 | | | | 69,536 | | | $ | 1,729,775 | |
| Reinvestment of distributions | | | 59,264 | | | | 1,111,799 | | | | 60,309 | | | | 1,144,059 | |
| Shares reacquired | | | (112,520 | ) | | | (2,327,790 | ) | | | (85,213 | ) | | | (2,074,355 | ) |
| Increase | | | 101,061 | | | $ | 2,130,286 | | | | 44,632 | | | $ | 799,479 | |
| Class R5 Shares | | | | | | | | | | | | | | | | |
| Shares sold | | | 190,355 | | | $ | 4,735,300 | | | | 83,022 | | | $ | 2,314,160 | |
| Reinvestment of distributions | | | 15,255 | | | | 356,352 | | | | 24,605 | | | | 557,791 | |
| Shares reacquired | | | (91,935 | ) | | | (2,448,216 | ) | | | (105,598 | ) | | | (3,234,985 | ) |
| Increase (decrease) | | | 113,675 | | | $ | 2,643,436 | | | | 2,029 | | | $ | (363,034 | ) |
| Class R6 Shares | | | | | | | | | | | | | | | | |
| Shares sold | | | 13,203,129 | | | $ | 336,185,781 | | | | 3,367,761 | | | $ | 99,966,578 | |
| Reinvestment of distributions | | | 1,448,998 | | | | 34,109,424 | | | | 1,576,477 | | | | 35,927,921 | |
| Shares reacquired | | | (4,289,731 | ) | | | (109,357,372 | ) | | | (2,602,300 | ) | | | (72,631,414 | ) |
| Increase | | | 10,362,396 | | | $ | 260,937,833 | | | | 2,341,938 | | | $ | 63,263,085 | |
| * | Effective June 30, 2020, automatic conversion of Class C shares occurs on the 25th day of the month (or, if the 25th day was not a business day, the next business day thereafter) following the eighth anniversary of the day on which the purchase order was accepted. Prior to June 30, 2020, conversion occurred following the tenth anniversary of the day on which the purchase was accepted. |
29
Report of Independent Registered Public Accounting Firm
To the shareholders and the Board of Directors of Lord Abbett Developing Growth Fund, Inc.
Opinion on the Financial Statements and Financial Highlights
We have audited the accompanying statement of assets and liabilities of Lord Abbett Developing Growth Fund, Inc. (the “Fund”), including the schedule of investments, as of July 31, 2020, the related statement of operations for the year then ended, the statements of changes in net assets for each of the two years in the period then ended, the financial highlights for each of the five years in the period then ended, and the related notes. In our opinion, the financial statements and financial highlights present fairly, in all material respects, the financial position of the Fund as of July 31, 2020, and the results of its operations for the year then ended, the changes in its net assets for each of the two years in the period then ended, and the financial highlights for each of the five years in the period then ended in conformity with accounting principles generally accepted in the United States of America.
Basis for Opinion
These financial statements and financial highlights are the responsibility of the Fund’s management. Our responsibility is to express an opinion on the Fund’s financial statements and financial highlights based on our audits. We are a public accounting firm registered with the Public Company Accounting Oversight Board (United States) (PCAOB) and are required to be independent with respect to the Fund in accordance with the U.S. federal securities laws and the applicable rules and regulations of the Securities and Exchange Commission and the PCAOB.
We conducted our audits in accordance with the standards of the PCAOB. Those standards require that we plan and perform the audit to obtain reasonable assurance about whether the financial statements and financial highlights are free of material misstatement, whether due to error or fraud. The Fund is not required to have, nor were we engaged to perform, an audit of its internal control over financial reporting. As part of our audits we are required to obtain an understanding of internal control over financial reporting but not for the purpose of expressing an opinion on the effectiveness of the Fund’s internal control over financial reporting. Accordingly, we express no such opinion.
Our audits included performing procedures to assess the risks of material misstatement of the financial statements and financial highlights, whether due to error or fraud, and performing procedures that respond to those risks. Such procedures included examining, on a test basis, evidence regarding the amounts and disclosures in the financial statements and financial highlights. Our audits also included evaluating the accounting principles used and significant estimates made by management, as well as evaluating the overall presentation of the financial statements and financial highlights. Our procedures included confirmation of securities owned as of July 31, 2020, by correspondence with the custodian and brokers; when replies were not received from brokers, we performed other auditing procedures. We believe that our audits provide a reasonable basis for our opinion.
DELOITTE & TOUCHE LLP
New York, New York
September 23, 2020
We have served as the auditor of one or more Lord Abbett Family of Funds’ investment companies since 1932.
30
Basic Information About Management
The Board is responsible for the management of the business and affairs of the Fund in accordance with the laws of the state of organization. The Board elects officers who are responsible for the day-to-day operations of the Fund and who execute policies authorized by the Board. The Board also approves an investment adviser to the Fund and continues to monitor the cost and quality of the services the investment adviser provides, and annually considers whether to renew the contract with the investment adviser. Generally, each Board member holds office until his/her successor is elected and qualified or until his/her earlier resignation or removal, as provided in the Fund’s organizational documents.
Lord, Abbett & Co. LLC (“Lord Abbett”), a Delaware limited liability company, is the Fund’s investment adviser. Designated Lord Abbett personnel are responsible for the day-to-day management of the Fund.
Interested Board Members
Mr. Sieg is affiliated with Lord Abbett and is an “interested person” of the Fund as defined in the Act. Mr. Sieg is a board member of each of the 14 investment companies in the Lord Abbett Family of Funds, which consist of 59 investment portfolios. Mr. Sieg is an officer of the Lord Abbett Family of Funds.
Name, Address and
Year of Birth | | Current Position and
Length of Service
with the Fund | | Principal Occupation and Other Directorships
During the Past Five Years |
| | | | | |
Douglas B. Sieg
Lord, Abbett & Co. LLC
90 Hudson Street
Jersey City, NJ 07302
(1969) | | Board member since 2016;
President and Chief Executive Officer since 2018 | | Principal Occupation: Managing Partner (since 2018) and was formerly Head of Client Services, joined Lord Abbett in 1994.
Other Directorships: None. |
Independent Board Members
The following Independent Board Members also are board members of each of the 14 investment companies in the Lord Abbett Family of Funds, which consist of 59 investment portfolios.
Name, Address and
Year of Birth | | Current Position and
Length of Service
with the Fund | | Principal Occupation and Other Directorships
During the Past Five Years |
| | | | | |
Evelyn E. Guernsey
Lord, Abbett & Co. LLC
c/o Legal Dept.
90 Hudson Street
Jersey City, NJ 07302
(1955) | | Board member since 2011 | | Principal Occupation: None.
Other Directorships: None. |
| | | | | |
Julie A. Hill
Lord, Abbett & Co. LLC
c/o Legal Dept.
90 Hudson Street
Jersey City, NJ 07302
(1946) | | Board member since 2004 | | Principal Occupation: Owner and CEO of The Hill Company, a business consulting firm (since 1998).
Other Directorships: Currently serves as director of Anthem, Inc., a health benefits company (since 1994). |
31
Basic Information About Management (continued)
Name, Address and
Year of Birth | | Current Position and
Length of Service
with the Fund | | Principal Occupation and Other Directorships
During the Past Five Years |
| | | | | |
Kathleen M. Lutito
Lord, Abbett & Co. LLC
c/o Legal Dept.
90 Hudson Street
Jersey City, NJ 07302
(1963) | | Board member since 2017 | | Principal Occupation: President and Chief Investment Officer of CenturyLink Investment Management Company (since 2006).
Other Directorships: None. |
| | | | | |
James M. McTaggart
Lord, Abbett & Co. LLC
c/o Legal Dept.
90 Hudson Street
Jersey City, NJ 07302
(1947) | | Board member since 2012 | | Principal Occupation: Independent management advisor and consultant (since 2012).
Other Directorships: Blyth, Inc., a home products company (2004 – 2015). |
| | | | | |
Charles O. Prince
Lord, Abbett & Co. LLC
c/o Legal Dept.
90 Hudson Street
Jersey City, NJ 07302
(1950) | | Board member since 2019 | | Principal Occupation: None. Formerly Chairman and Chief Executive Officer, Citigroup, Inc. (Retired 2007).
Other Directorships: Currently serves as director of Johnson & Johnson (2006 – Present). Previously served as director of Xerox Corporation (2008 – 2018). |
| | | | | |
Karla M. Rabusch
Lord, Abbett & Co. LLC
c/o Legal Dept.
90 Hudson Street
Jersey City, NJ 07302
(1959) | | Board member since 2017 | | Principal Occupation: President and Director of Wells Fargo Funds Management, LLC (2003 – 2017); President of Wells Fargo Funds (2003 – 2016).
Other Directorships: None. |
| | | | | |
Mark A. Schmid
Lord, Abbett & Co. LLC
c/o Legal Dept.
90 Hudson Street
Jersey City, NJ 07302
(1959) | | Board member since 2016 | | Principal Occupation: Vice President and Chief Investment Officer of the University of Chicago (since 2009).
Other Directorships: None. |
| | | | | |
James L.L. Tullis
Lord, Abbett & Co. LLC
c/o Legal Dept.
90 Hudson Street
Jersey City, NJ 07302
(1947) | | Board member since 2006;
Chairman since 2017 | | Principal Occupation: Chairman of Tullis Health Investors – FL LLC (since 2018); CEO of Tullis-Dickerson and Co. Inc., a venture capital management firm (1990 – 2016).
Other Directorships: Currently serves as director of Crane Co. (since 1998), Alphatec Spine (since 2018), electroCore, Inc. (since 2018), and Exagen Inc. (since 2019). |
32
Basic Information About Management (continued)
Officers
None of the officers listed below have received compensation from the Fund. All of the officers of the Fund also may be officers of the other Lord Abbett Funds and maintain offices at 90 Hudson Street, Jersey City, NJ 07302. Unless otherwise indicated, the position(s) and title(s) listed under the “Principal Occupation During the Past Five Years” column indicate each officer’s position(s) and title(s) with Lord Abbett. Each officer serves for an indefinite term (i.e., until his or her death, resignation, retirement, or removal).
Name and
Year of Birth | | Current Position
with the Fund | | Length of Service
of Current
Position | | Principal Occupation
During the Past Five Years |
| | | | | | | |
Douglas B. Sieg
(1969) | | President and Chief Executive Officer | | Elected as President and Chief Executive Officer in 2018 | | Managing Partner of Lord Abbett (since 2018) and was formerly Head of Client Services, joined Lord Abbett in 1994. |
| | | | | | | |
Jackson C. Chan
(1964) | | AML Compliance Officer | | Elected in 2018 | | Deputy Chief Compliance Officer and Director of Regulatory Affairs, joined Lord Abbett in 2014. |
| | | | | | | |
Pamela P. Chen
(1978) | | Vice President, Assistant Secretary and Privacy Officer | | Elected as Vice President and Assistant Secretary in 2018 and Privacy Officer in 2019 | | Associate General Counsel, joined Lord Abbett in 2017 and was formerly Special Counsel at Schulte, Roth & Zabel LLP (2005 – 2017). |
| | | | | | | |
John T. Fitzgerald
(1975) | | Vice President and Assistant Secretary | | Elected in 2018 | | Deputy General Counsel, joined Lord Abbett in 2018 and was formerly Deputy Head of U.S. Funds Legal, Executive Director and Assistant General Counsel at JPMorgan Chase (2005 – 2018). |
| | | | | | | |
Vito A. Fronda
(1969) | | Chief Financial Officer and Treasurer | | Elected as Chief Financial Officer in 2020 and Treasurer in 2018 | | Partner and Director of U.S. Fund Treasury & Global Taxation, joined Lord Abbett in 2003. |
| | | | | | | |
Linda Y. Kim
(1980) | | Vice President and Assistant Secretary | | Elected in 2016 | | Counsel, joined Lord Abbett in 2015. |
| | | | | | | |
Joseph M. McGill
(1962) | | Chief Compliance Officer | | Elected in 2014 | | Partner and Chief Compliance Officer, joined Lord Abbett in 2014. |
| | | | | | | |
Amanda S. Ryan
(1978) | | Vice President and Assistant Secretary | | Elected in 2018 | | Counsel, joined Lord Abbett in 2016 and was formerly a Director and Corporate Counsel at PGIM Investments (2012 – 2016). |
33
Basic Information About Management (concluded)
Name and
Year of Birth | | Current Position
with the Fund | | Length of Service
of Current
Position | | Principal Occupation
During the Past Five Years |
| | | | | | | |
Lawrence B. Stoller
(1963) | | Vice President, Secretary and Chief Legal Officer | | Elected as Vice President and Secretary in 2007 and Chief Legal Officer in 2019 | | Partner and General Counsel, joined Lord Abbett in 2007. |
Please call 888-522-2388 for a copy of the statement of additional information, which contains further information about the Fund’s Board members. It is available free upon request.
34
Liquidity Risk Management Program
Pursuant to Rule 22e-4 under the 1940 Act, the Fund has adopted a Liquidity Risk Management Program and Policy (“Program”). The Program is designed to assess, manage and periodically review the Fund’s liquidity risk. Liquidity risk is defined under Rule 22e-4 as the risk that the Fund could not meet redemption requests without significant dilution of remaining investors’ interests in the Fund.
The Board has appointed Lord Abbett as the administrator for the Fund’s Program. At the May 28-29, 2020 meeting, Lord Abbett provided the Board with a report addressing the operation of the Program and assessing its adequacy and effectiveness of implementation for the period December 1, 2018 through February 28, 2020. Lord Abbett reported that the Program operated effectively during the period. In particular, Lord Abbett reported that: the Fund did not breach its 15% limit on illiquid investments at any point during the period and all regulatory reporting related to Rule 22e-4 was completed on time and without issue during the period.
There can be no assurance that the Program will achieve its objectives in the future. Please refer to the Fund’s prospectus for more information regarding the Fund’s exposure to liquidity risk and other principal risks to which an investment in the Fund may be subject.
Householding
The Fund has adopted a policy that allows it to send only one copy of the Fund’s prospectus, proxy material, annual report and semiannual report to certain shareholders residing at the same “household.” This reduces Fund expenses, which benefits you and other shareholders. If you need additional copies or do not want your mailings to be “householded,” please call Lord Abbett at 888-522-2388 or send a written request with your name, the name of your fund or funds and your account number or numbers to Lord Abbett Family of Funds, P.O. Box 219336, Kansas City, MO 64121.
Proxy Voting Policies, Procedures and Records
A description of the policies and procedures that Lord Abbett uses to vote proxies related to the Fund’s portfolio securities, and information on how Lord Abbett voted the Fund’s proxies during the 12-month period ended June 30 are available without charge, upon request, (i) by calling 888-522-2388; (ii) on Lord Abbett’s Website at www.lordabbett.com; and (iii) on the Securities and Exchange Commission’s (“SEC”) Website at www.sec.gov.
Shareholder Reports and Quarterly Portfolio Disclosure
The Fund is required to file its complete schedule of portfolio holdings with the SEC for its first and third fiscal quarters as an attachment to Form N-PORT. Copies of the filings are available without charge, upon request on the SEC’s Website at www.sec.gov and may be available by calling Lord Abbett at 888-522-2388.
Tax Information (unaudited) Of the distributions paid to shareholders during the fiscal year ended July 31, 2020, $314,628,659 represent long-term capital gains. |
35


| This report, when not used for the general information of shareholders of the Fund, is to be distributed only if preceded or accompanied by a current fund prospectus. | | |
| | | |
| Lord Abbett mutual fund shares are distributed by | | LADG-2 |
| LORD ABBETT DISTRIBUTOR LLC. | Lord Abbett Developing Growth Fund, Inc. | (09/20) |
| (a) | In accordance with applicable requirements, the Registrant adopted a Sarbanes-Oxley Code of Ethics on June 19, 2003 that applies to the principal executive officer and senior financial officers of the Registrant (“Code of Ethics”). The Code of Ethics was in effect during the fiscal year ended July 31, 2020 (the “Period”). |
| (c) | The Registrant has not amended the Code of Ethics as described in Form N-CSR during the Period. |
| (d) | The Registrant has not granted any waiver, including an implicit waiver, from a provision of the Code of Ethics as described in Form N-CSR during the Period. |
| (f) | See Item 12(a)(1) concerning the filing of the Code of Ethics. |
| Item 3: | Audit Committee Financial Expert. |
The Registrant’s board of directors has determined that each of the following independent directors who are members of the audit committee is an audit committee financial expert: Evelyn E. Guernsey, Karla M. Rabusch and Mark A. Schmid. Each of these persons is independent within the meaning of the Form N-CSR.
| Item 4: | Principal Accountant Fees and Services. |
In response to sections (a), (b), (c) and (d) of Item 4, the aggregate fees billed to the Registrant for the fiscal years ended July 31, 2020 and 2019 by the Registrant’s principal accounting firm, Deloitte & Touche LLP, the member firms of Deloitte Touche Tohmatsu and their respective affiliates (collectively, “Deloitte”) were as follows:
| | | Fiscal year ended: |
| | | 2020 | | 2019 |
| Audit Fees {a} | | $45,000 | | $45,300 |
| Audit-Related Fees {b} | | - 0 - | | 0 |
| Total audit and audit-related fees | | $45,000 | | $45,300 |
| | | | | |
| Tax Fees {c} | | 4,957 | | 4,916 |
| All Other Fees | | - 0 - | | - 0 - |
| | | | | |
| Total Fees | | $49,957 | | $50,216 |
| | | | | |
{a} Consists of fees for audits of the Registrant’s annual financial statements.
{b} Consists of fees for assurance and related services reasonably related to the audit of the Registrant’s financial statements, but which are not included in the amount for “Audit Fees.”
{c} Fees for the fiscal year ended July 31, 2020 and 2019 consist of fees for preparing the U.S. Income Tax Return for Regulated Investment Companies, New Jersey Corporation Business Tax Return, New Jersey Annual Report Form, U.S. Return of Excise Tax on Undistributed Income of Investment Companies, IRS Forms 1099-MISC and 1096 Annual Summary and Transmittal of U.S. Information Returns.
(e) (1) Pursuant to Rule 2-01(c) (7) of Regulation S-X, the Registrant’s Audit Committee has adopted pre-approval policies and procedures. Such policies and procedures generally provide that the Audit Committee must pre-approve:
| | • | any audit, audit-related, tax, and other services to be provided to the Lord Abbett Funds, including the Registrant, and |
| | • | any audit-related, tax, and other services to be provided to the Registrant’s investment adviser and any entity controlling, controlled by or under common control with the investment adviser that provides ongoing services to one or more Funds comprising the Registrant if the engagement relates directly to operations and financial reporting of a Fund, by the independent auditor to assure that the provision of such services does not impair the auditor’s independence. |
The Audit Committee has delegated pre-approval authority to its Chairman, subject to a fee limit of $10,000 per event, and not to exceed $25,000 annually. The Chairman will report any pre-approval decisions to the Audit Committee at its next scheduled meeting. Unless a type of service to be provided by the independent auditor has received general pre-approval, it must be pre-approved by the Audit Committee. Any proposed services exceeding pre-approved cost levels will require specific pre-approval by the Audit Committee.
(e) (2) The Registrant’s Audit Committee has approved 100% of the services described in this Item 4 (b) through (d).
(f) Not applicable.
(g) The aggregate non-audit fees billed by Deloitte for services rendered to the Registrant are shown above in the response to Item 4 (a), (b), (c) and (d) as “All Other Fees”.
The aggregate non-audit fees billed by Deloitte for services rendered to the Registrant’s investment adviser, Lord, Abbett & Co. LLC (“Lord Abbett”), for the fiscal years ended July 31, 2020 and 2019 were:
| | | Fiscal year ended: |
| | | 2020 | | 2019 |
| All Other Fees {a} | | $259,525 | | $170,000 |
{a} Consist of fees for Independent Services Auditors’ Report on Controls Placed in Operation and Tests of Operating Effectiveness related to Lord Abbett’s Asset Management Services (“SOC-1 Report”).
The aggregate non-audit fees billed by Deloitte for services rendered to entities under the common control of Lord Abbett for the fiscal years ended July 31, 2020 and 2019 were:
| | | Fiscal year ended: |
| | | 2020 | | 2019 |
| All Other Fees | | $ - 0 - | | $ - 0 - |
(h) The Registrant’s Audit Committee has considered the provision of non-audit services that were rendered to the Registrant’s investment adviser, and any entity controlling, controlled by or under common control with the investment adviser that provides ongoing services to the Registrant, that were not pre-approved pursuant to Rule 2-01 (c)(7)(ii) of Regulation S-X and has determined that the provision of such services is compatible with maintaining Deloitte’s independence.
| Item 5: | Audit Committee of Listed Registrants. |
| | Not applicable. |
| | |
| Item 6: | Investments. |
| | Not applicable. |
| | |
| Item 7: | Disclosure of Proxy Voting Policies and Procedures for Closed-End Management Investment Companies. |
| | Not applicable. |
| | |
| Item 8: | Portfolio Managers of Closed-End Management Investment Companies. |
| | Not applicable. |
| | |
| Item 9: | Purchases of Equity Securities by Closed-End Management Investment Company and Affiliated Purchasers. |
| | Not applicable. |
| | |
| Item 10: | Submission of Matters to a Vote of Security Holders. |
| | Not applicable. |
| | |
| Item 11: | Controls and Procedures. |
| (a) | The principal executive officer and principal financial & accounting officer have concluded as of a date within 90 days of the filing date of this report, based on their evaluation of the Registrant’s disclosure controls and procedures (as defined in Rule 30a-3(c) under the Investment Company Act of 1940), that the design of such procedures is effective to provide reasonable assurance that material information required to be disclosed by the Registrant on Form N-CSR is recorded, processed, summarized and reported within the time periods specified in the Commission’s rules and forms. |
| (b) | There were no changes in the Registrant’s internal control over financial reporting (as defined in Rule 30a-3(d) under the Investment Company Act of 1940) that occurred during the period covered by this report that have materially |
| | affected, or are reasonably likely to materially affect, the Registrant’s internal control over financial reporting. |
| Item 12: | Disclosure of Securities Lending Activities for Closed-End Management Investment Companies. |
| | Not Applicable. |
| | |
| Item 13: | Exhibits. |
SIGNATURES
Pursuant to the requirements of the Securities Exchange Act of 1934 and the Investment Company Act of 1940, the Registrant has duly caused this report to be signed on its behalf by the undersigned, thereunto duly authorized.
| | LORD ABBETT DEVELOPING GROWTH FUND, INC. |
| | | | |
| | | By: | /s/Douglas B. Sieg |
| | | | Douglas B. Sieg |
| | | | President and Chief Executive Officer |
Date: September 23, 2020
Pursuant to the requirements of the Securities Exchange Act of 1934 and the Investment Company Act of 1940, this report has been signed below by the following persons on behalf of the Registrant and in the capacities and on the dates indicated.
| | | By: | /s/Douglas B. Sieg |
| | | | President and Chief Executive Officer |
Date: September 23, 2020
| | | By: | /s/Vito A. Fronda |
| | | | Vito A. Fronda |
| | | | Chief Financial Officer and Treasurer |
Date: September 23, 2020