UNITED STATES
SECURITIES AND EXCHANGE COMMISSION
Washington, D.C. 20549
FORM 10-K
(Mark One)
☒ ANNUAL REPORT PURSUANT TO SECTION 13 OR 15(d) OF THE SECURITIES EXCHANGE ACT OF 1934
For the fiscal year ended December 31, 2024
OR
☐ TRANSITION REPORT PURSUANT TO SECTION 13 OR 15(d) OF THE SECURITIES EXCHANGE ACT OF 1934
For the transition period from ______ to _______
Commission file number 1-5684
W.W. Grainger, Inc.
(Exact name of registrant as specified in its charter)
| | | | | | | | | | | | | | | | | | | | |
| Illinois | | | 36-1150280 |
| (State or other jurisdiction of incorporation or organization) | | | (I.R.S. Employer Identification No.) |
| 100 Grainger Parkway | | | |
| Lake Forest, | Illinois | | | 60045-5201 |
| (Address of principal executive offices) | | | (Zip Code) |
Registrant’s telephone number, including area code: (847) 535-1000
Securities registered pursuant to Section 12(b) of the Act:
| | | | | | | | |
| Title of Each Class | Trading Symbol(s) | Name of Each Exchange on Which Registered |
| Common Stock | GWW | New York Stock Exchange |
Securities registered pursuant to Section 12(g) of the Act: None
Indicate by check mark if the registrant is a well-known seasoned issuer, as defined in Rule 405 of the Securities Act.
Yes ☒ No ☐
Indicate by check mark if the registrant is not required to file reports pursuant to Section 13 or Section 15(d) of the Act.
Yes ☐ No ☒
Indicate by check mark whether the registrant (1) has filed all reports required to be filed by Section 13 or 15(d) of the Securities Exchange Act of 1934 during the preceding 12 months (or for such shorter period that the registrant was required to file such reports), and (2) has been subject to such filing requirements for the past 90 days. Yes ☒ No ☐
Indicate by check mark whether the registrant has submitted electronically every Interactive Data File required to be submitted pursuant to Rule 405 of Regulation S-T (§232.405 of this chapter) during the preceding 12 months (or for such shorter period that the registrant was required to submit such files). Yes ☒ No ☐
Indicate by check mark whether the registrant is a large accelerated filer, an accelerated filer, a non-accelerated filer, a smaller reporting company or an emerging growth company. See the definitions of “large accelerated filer,” “accelerated filer,” “smaller reporting company,” and "emerging growth company" in Rule 12b-2 of the Exchange Act.
Large Accelerated Filer ☒ Accelerated Filer ☐ Non-accelerated Filer ☐ Smaller Reporting Company ☐ Emerging Growth Company ☐
If an emerging growth company, indicate by check mark if the registrant has elected not to use the extended transition period for complying with any new or revised financial accounting standards provided pursuant to Section 13(a) of the Exchange Act.☐
Indicate by check mark whether the registrant has filed a report on and attestation to its management’s assessment of the effectiveness of its internal control over financial reporting under Section 404(b) of the Sarbanes-Oxley Act (15 U.S.C. 7262(b)) by the registered public accounting firm that prepared or issued its audit report. ☒
If securities are registered pursuant to Section 12(b) of the Act, indicate by check mark whether the financial statements of the registrant included in the filing reflect the correction of an error to previously issued financial statements. ☐
Indicate by check mark whether any of those error corrections are restatements that require a recovery analysis of incentive-based compensation received by any of the registrant's executive officers during the relevant recovery period pursuant to §2401.10D-1(b). ☐
Indicate by check mark whether the registrant is a shell company (as defined in Rule 12b-2 of the Exchange Act).
Yes ☐ No ☒
The aggregate market value of the voting common equity held by non-affiliates of the registrant was $40,147,032,828 as of the close of trading as reported on the New York Stock Exchange on June 30, 2024. The Company does not have nonvoting common equity.
The registrant had 48,216,708 shares of the Company’s Common Stock outstanding as of February 14, 2025.
DOCUMENTS INCORPORATED BY REFERENCE
Portions of the registrant's definitive proxy statement to be filed in connection with the annual meeting of shareholders to be held on April 30, 2025, are incorporated by reference into Part III of this Annual Report on Form 10-K for the fiscal year ended December 31, 2024 (Form 10-K) where indicated. The registrant's definitive proxy statement will be filed with the Securities and Exchange Commission within 120 days after the end of the fiscal year to which this report relates.
| | | | | | | | | | | | | | | | | | | | |
| TABLE OF CONTENTS | Page |
|
| PART I | |
| Item 1: | BUSINESS | |
| Item 1A: | RISK FACTORS | |
| Item 1B: | UNRESOLVED STAFF COMMENTS | |
| Item 1C: | CYBERSECURITY | |
| Item 2: | PROPERTIES | |
| Item 3: | LEGAL PROCEEDINGS | |
| Item 4: | MINE SAFETY DISCLOSURES | |
| PART II | |
| Item 5: | MARKET FOR REGISTRANT'S COMMON EQUITY, RELATED SHAREHOLDER | |
| | MATTERS AND ISSUER PURCHASES OF EQUITY SECURITIES | |
| Item 6: | RESERVED | |
| Item 7: | MANAGEMENT'S DISCUSSION AND ANALYSIS OF FINANCIAL | |
| | CONDITION AND RESULTS OF OPERATIONS | |
| Item 7A: | QUANTITATIVE AND QUALITATIVE DISCLOSURES ABOUT MARKET RISK | |
| Item 8: | FINANCIAL STATEMENTS AND SUPPLEMENTARY DATA | |
| Item 9: | CHANGES IN AND DISAGREEMENTS WITH ACCOUNTANTS | |
| | ON ACCOUNTING AND FINANCIAL DISCLOSURE | |
| Item 9A: | CONTROLS AND PROCEDURES | |
| Item 9B: | OTHER INFORMATION | |
| Item 9C: | DISCLOSURE REGARDING FOREIGN JURISDICTIONS THAT PREVENT INSPECTIONS | |
| PART III | |
| Item 10: | DIRECTORS, EXECUTIVE OFFICERS AND CORPORATE GOVERNANCE | |
| Item 11: | EXECUTIVE COMPENSATION | |
| Item 12: | SECURITY OWNERSHIP OF CERTAIN BENEFICIAL OWNERS AND MANAGEMENT AND | |
| | RELATED STOCKHOLDER MATTERS | |
| Item 13: | CERTAIN RELATIONSHIPS AND RELATED TRANSACTIONS AND DIRECTOR | |
| | INDEPENDENCE | |
| Item 14: | PRINCIPAL ACCOUNTANT FEES AND SERVICES | |
| PART IV | |
| Item 15: | EXHIBITS AND FINANCIAL STATEMENT SCHEDULES | |
| Item 16: | FORM 10-K SUMMARY | |
| Signatures | | | | | |
Forward-Looking Statements
From time to time in this Annual Report on Form 10-K as well as in other written reports, communications and verbal statements, Grainger (as defined below) makes forward-looking statements that are not historical in nature but concern forecasts of future results, business plans, analyses, prospects, strategies, objectives and other matters that may be deemed to be “forward-looking statements” under the federal securities laws. Forward-looking statements can generally be identified by their use of terms such as “anticipate,” “estimate,” “believe,” “expect,” “could,” “forecast,” “may,” “intend,” “plan,” “predict,” “project,” “will,” or “would,” and similar terms and phrases, including references to assumptions.
Grainger cannot guarantee that any forward-looking statement will be realized and achievement of future results is subject to risks and uncertainties, many of which are beyond Grainger's control, which could cause Grainger's results to differ materially from those that are presented.
Important factors that could cause actual results to differ materially from those presented or implied in the forward-looking statements include, without limitation: inflation, higher product costs or other expenses, including operational and administrative expenses; a major loss of customers; loss or disruption of sources of supply; changes in customer or product mix; increased competitive pricing pressures; changes in third-party practices regarding digital advertising; failure to enter into or sustain contractual arrangements on a satisfactory basis with group purchasing organizations; failure to develop, manage or implement new technology initiatives or business strategies, including with respect to Grainger's eCommerce platforms and artificial intelligence; failure to adequately protect intellectual property or successfully defend against infringement claims; fluctuations or declines in Grainger's gross profit margin; Grainger's responses to market pressures; the outcome of pending and future litigation or governmental or regulatory proceedings, including with respect to wage and hour, anti-bribery and corruption, environmental, regulations related to advertising, marketing and the internet, consumer protection, pricing (including disaster or emergency declaration pricing statutes), product liability, compliance or safety, trade and export compliance, general commercial disputes, or privacy and cybersecurity matters; investigations, inquiries, audits and changes in laws and regulations; failure to comply with laws, regulations and standards, including new or stricter environmental laws or regulations; government contract matters; the impact of any government shutdown; disruption or breaches of information technology or data security systems involving Grainger or third parties on which Grainger depends; general industry, economic, market or political conditions; general global economic conditions including existing, new, or increased tariffs, trade issues and changes in trade policies, inflation, and interest rates; currency exchange rate fluctuations; market volatility, including price and trading volume volatility or price declines of Grainger's common stock; commodity price volatility; facilities disruptions or shutdowns; higher fuel costs or disruptions in transportation services; effects of outbreaks of pandemic disease or viral contagions, global conflicts, natural or human induced disasters, extreme weather, and other catastrophes or conditions; effects of climate change; failure to execute on our efforts and programs related to environmental, social and governance matters; competition for, or failure to attract, retain, train, motivate and develop executives and key team members; loss of key members of management or key team members; loss of operational flexibility and potential for work stoppages or slowdowns if team members unionize or join a collective bargaining arrangement; changes in effective tax rates; changes in credit ratings or outlook; Grainger's incurrence of indebtedness or failure to comply with restrictions and obligations under its debt agreements and instruments and other factors identified under Part I, Item 1A: Risk Factors and elsewhere in this Form 10-K.
The preceding list is not intended to be an exhaustive list of all of the factors that could impact Grainger's forward-looking statements. Given these risks and uncertainties, you are cautioned not to place undue reliance on Grainger's forward looking-statements and Grainger undertakes no obligation to update or revise any of its forward-looking statements, whether as a result of new information, future events or otherwise, except as required by law.
PART I
Item 1: Business
W.W. Grainger, Inc., incorporated in the State of Illinois in 1928, is a broad line, distributor of maintenance, repair and operating (MRO) products and services with operations primarily in North America, Japan and the United Kingdom (U.K.). In this report, the words “Grainger” or “Company” mean W.W. Grainger, Inc. and its subsidiaries, except where the context makes it clear that the reference is only to W.W. Grainger, Inc. itself and not its subsidiaries.
For financial information regarding the Company, see the Consolidated Financial Statements and Notes included in Part II, Item 8: Financial Statements and Supplementary Data of this Form 10-K.
The Grainger Edge
Grainger's strategic framework, “The Grainger Edge,” uniquely defines the Company by asserting why it exists, how it serves customers and how team members work together to achieve its objectives. Grainger’s purpose is We Keep the World Working®, which in turn allows customers to focus on the core of their businesses and do what they do best.
This framework also outlines a set of principles that define the behaviors expected from Grainger’s team members in working with each other and the Company's customers, suppliers and communities as Grainger executes its strategy and creates value for shareholders. For further information on the Company's principles, see below "Human Capital - Workplace Practices and Policies."
General
Grainger's two reportable segments are High-Touch Solutions North America (High-Touch Solutions N.A.) and Endless Assortment. These reportable segments align with Grainger's go-to-market strategies and bifurcated business models of high-touch solutions and endless assortment. For further segment information, see Part II, Item 7: Management’s Discussion and Analysis (MD&A) of Financial Condition and Results of Operations and Note 12 of the Notes to Consolidated Financial Statements in Part II, Item 8: Financial Statements and Supplementary Data of this Form 10-K.
Below is a description of Grainger’s reportable segments and other businesses.
High-Touch Solutions N.A.
The Company's High-Touch Solutions N.A. segment provides value-added MRO solutions that are rooted in deep product knowledge and customer expertise. The high-touch solutions model serves customers with complex buying needs. This segment primarily includes the Grainger-branded businesses in the United States (U.S.), Canada, Mexico and Puerto Rico.
Endless Assortment
The Company’s Endless Assortment segment provides a streamlined and transparent online platform with one-stop shopping for millions of products. The Endless Assortment segment includes the Company’s Zoro Tools, Inc. (Zoro) and MonotaRO Co., Ltd. (MonotaRO) online channels which operate predominately in the U.S. and Japan.
Other
Other businesses is primarily comprised of the Company's Cromwell business in the U.K. and a wholly owned captive insurance entity. These businesses individually and in the aggregate do not meet the criteria of a reportable segment.
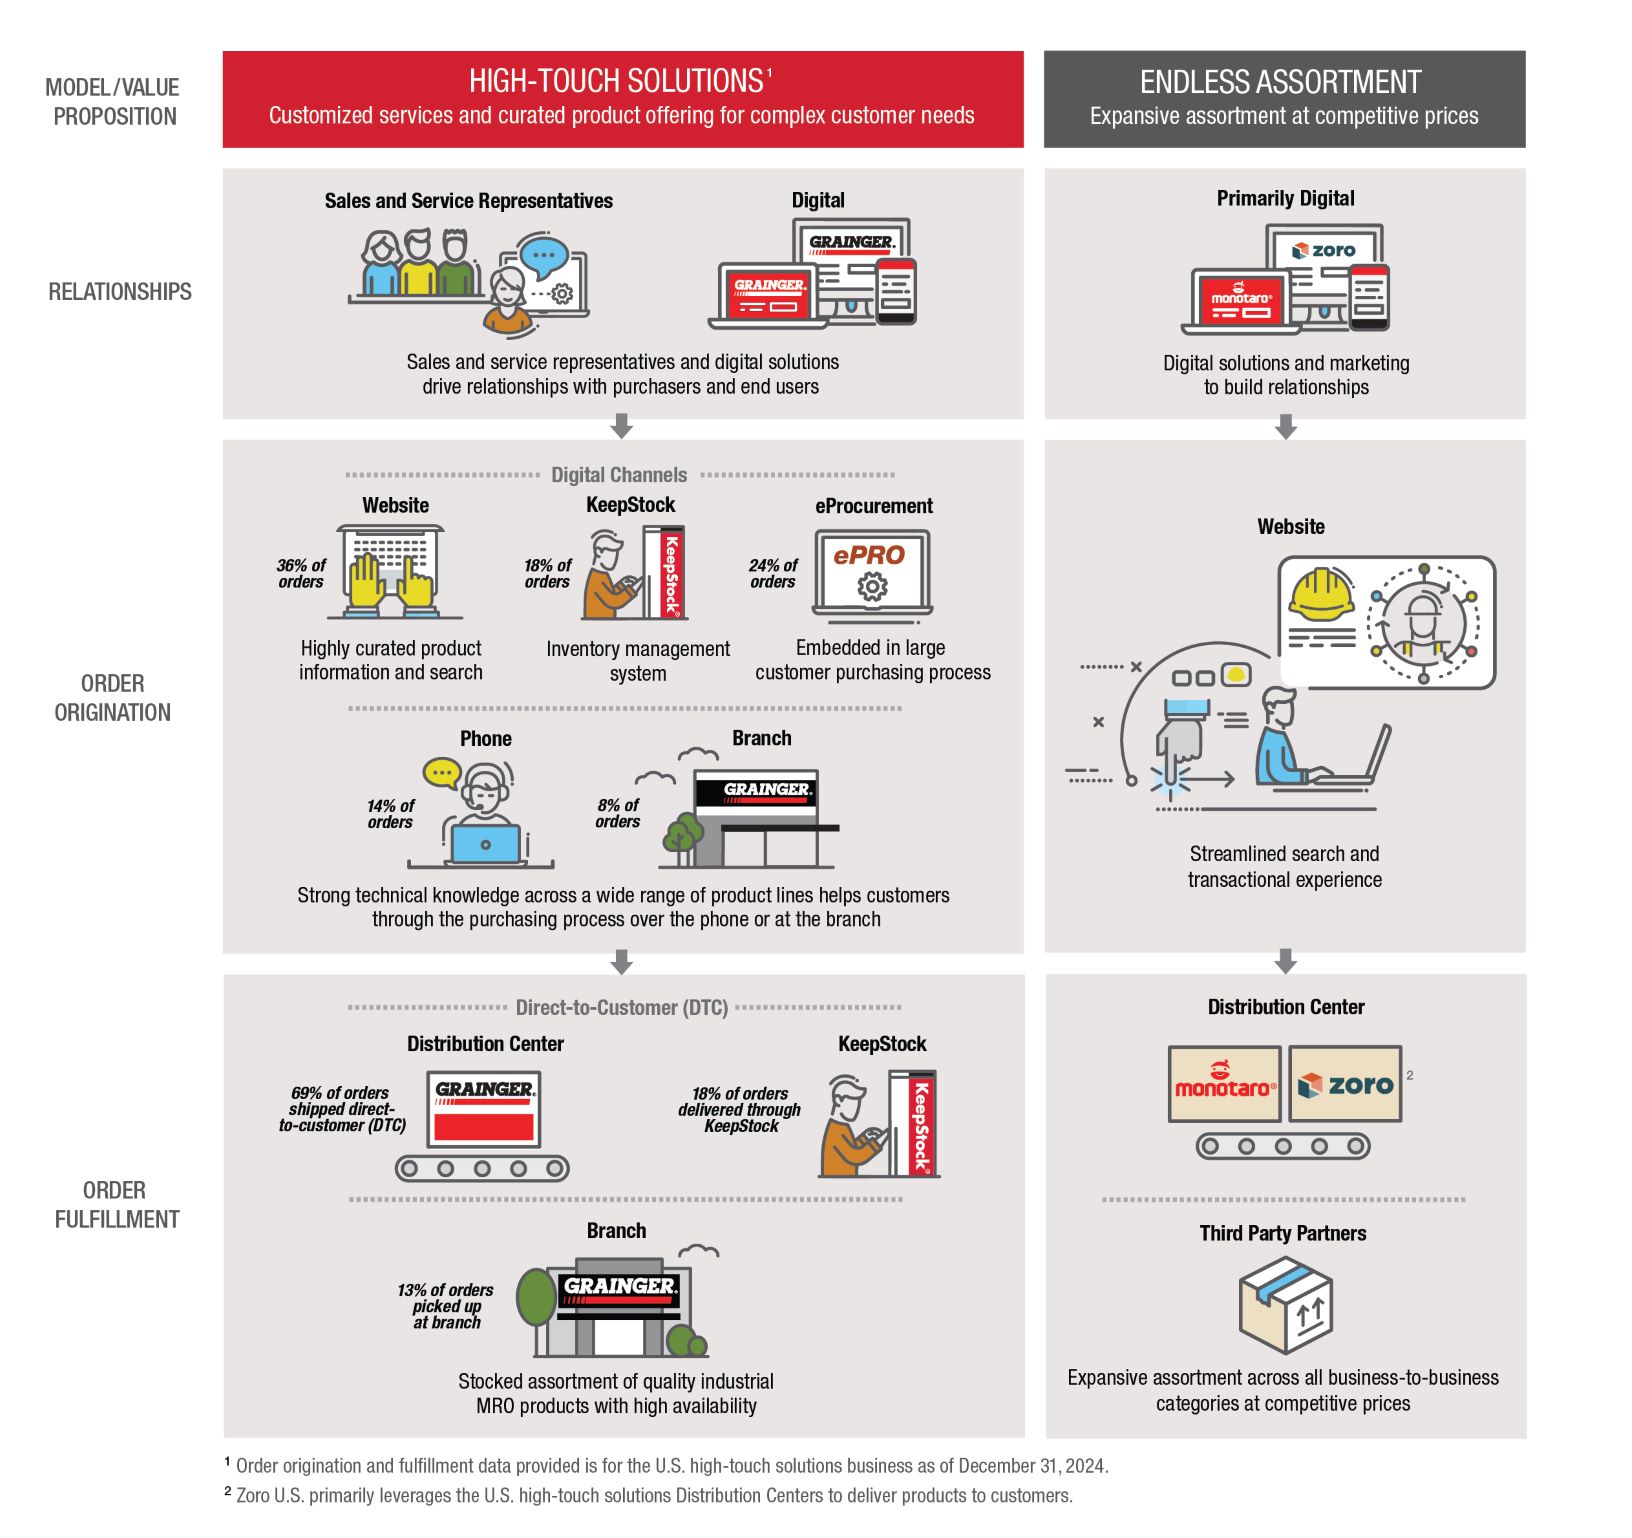
Business Models
Competing with both high-touch solutions and endless assortment business models allows Grainger to leverage its scale and advantaged supply chain to meet the changing needs of its customers. The following provides a high-level view of the Company's business models:
Customers
The Company uses a combination of its two business models to serve its more than 4.5 million customers worldwide which rely on Grainger for products and services that enable them to run safe, sustainable and productive operations. Grainger’s customers range from smaller businesses to large corporations, government entities and other institutions, representing a broad collection of industries, including, but not limited to commercial, healthcare, and manufacturing. No single end customer accounted for more than 10% of total sales for the year ended December 31, 2024.
In the High-Touch Solutions N.A. segment, customers are typically mid-size and large businesses with complex purchasing operations and processes. Many customers served in this segment expect product and service depth and are focused on total cost of procurement. Customers in this segment utilize sophisticated electronic purchasing platforms that communicate directly with Grainger.com through eProcurement technology. Sales and service representatives drive relationships with customers by helping select the right products and reducing costs by utilizing Grainger as a consistent source of supply. KeepStock®, Grainger's inventory management solution, serves customers on site, offering valuable insights to drive efficiencies and cost savings. The North American Customer Service Centers handle customer interactions for the region via phone, email, eCommerce portals and online chat.
In the Endless Assortment segment, customers are typically smaller and mid-size businesses with less complex purchasing operations and processes. Customers served in this segment have straight-forward product and service needs. Additionally, MonotaRO continues to attract and retain large enterprise customers. Customers purchasing through the endless assortment platforms are focused on transparent pricing and an easy-to-navigate procurement process. MonotaRO and Zoro offer an innovative customer experience by allowing customers to quickly find competitively priced products through intuitive business-focused eCommerce platforms with intelligent analytic capabilities.
Products and Services
Grainger’s product offering is grouped under several broad categories, including safety and security, material handling and storage, pumps and plumbing equipment, cleaning and maintenance, metalworking and hand tools. Products are regularly added and removed from Grainger's product lines based on customer demand, market research, suppliers' recommendations and other factors. No single product category comprised more than 20% of the Company's sales for the year ended December 31, 2024.
In the High-Touch Solutions N.A. segment, Grainger.com provides real-time price and product availability, detailed product information and features, such as product search and compare capabilities. The high-touch solutions businesses offer approximately 2 million products and several services, such as technical support and inventory management.
In the Endless Assortment segment, Grainger offers an expansive product assortment that contains millions of products including those outside of traditional industrial MRO categories. Zoro offers more than 14 million products and MonotaRO provides access to more than 24 million products, primarily through its websites and catalogs. The endless assortment businesses continue to enhance assortment by strategically adding products and expanding the offer of third party held products.
Distribution and Sources of Supply
In the large and fragmented MRO industry, Grainger holds an advantaged position with its supply chain infrastructure and a broad in-stock product offering. More than 5,000 primary suppliers worldwide provide Grainger businesses with more than 1.4 million products stocked in Distribution Centers (DCs) and branches globally. No single supplier comprised more than 5% of Grainger's total purchases for the year ended December 31, 2024.
In the High-Touch Solutions N.A. segment, DCs are the primary order fulfillment channel, mainly through direct shipments to customers. Automation in the DCs allows orders to ship complete with next-day delivery and also replenish branches that provide same-day availability to customers. Grainger’s North American distribution network supplies inventory planning and management, transportation and distribution services to all Grainger businesses in the North American region. Branches serve the immediate needs of customers by allowing them to directly pick up items and leverage branch staff for their technical product expertise and search-and-select support. Additionally,
Grainger offers comprehensive inventory management through its KeepStock® program that includes vendor-managed inventory, customer-managed inventory and onsite vending machines.
In the Endless Assortment segment, orders are placed primarily through online channels. Zoro leverages the High-Touch Solution N.A.'s DC network and third-party drop shipments to deliver seamless service and product fulfillment to customers. MonotaRO fulfills customer orders through local DCs and third-party drop shipments.
For further information on the Company’s properties, see Part I, Item 2: Properties of this Form 10-K.
Trademarks and Service Marks
Grainger conducts business under various trademarks and service marks. Approximately 20% of 2024 sales were private label MRO items bearing Grainger’s registered trademarks, including DAYTON®, GRAINGER®, CONDOR®, WESTWARD®, TOUGH GUY®, SPEEDAIRE®, LUMAPRO®, and AIR HANDLER®. Grainger also provides a suite of inventory services to its customers under the KEEPSTOCK® brand, which is a registered service mark. Grainger has taken steps to protect these service marks and trademarks against infringement and believes they will remain available for future use in its business.
Seasonality
Grainger sells products that may have seasonal demand fluctuations during the winter or summer seasons or during periods of natural disasters. However, historical seasonality impacts have not been material to Grainger’s operating results.
Competition
Grainger faces competition from a variety of competitors, including manufacturers (including some of its own suppliers) that sell directly to certain segments of the market, wholesale distributors, retailers and internet-based businesses. Also, competitors vary by size, from large broad line distributors and eCommerce retailers to small local and regional competitors. Grainger differentiates itself by providing local product availability, a broad product line, sales and service representatives and advanced electronic and eCommerce technology. Grainger also offers other services, such as inventory management and technical support.
Government Regulations
Grainger’s business is subject to a wide array of laws, regulations and standards in each domestic and foreign jurisdiction where Grainger operates. In addition to Grainger’s U.S. based operations, which in 2024 generated approximately 82% of its consolidated net sales, Grainger operates its business principally through wholly owned subsidiaries in Canada, Mexico and the U.K., and through its majority-owned subsidiary in Japan. Compliance with these laws, regulations and standards requires the dedication of time and effort of team members as well as financial resources. In 2024, compliance with the applicable laws, regulations and standards did not have a material effect on capital expenditures, earnings or competitive position. See Part I, Item 1A: Risk Factors of this Form 10-K for a discussion of the risks associated with government regulations that may materially impact Grainger.
Human Capital
The Company strongly believes that its corporate culture must be aligned with its business strategy and aspiration to create value. To that end, Grainger's Board of Directors (the Board) and senior management are actively involved in cultivating Grainger’s culture. The Compensation Committee of the Board, which is comprised of independent directors, oversees the Company's human capital management programs and policies and routinely provides updates to the Board.
Grainger believes that a purpose-driven culture is an asset that creates a sustainable, competitive advantage for the Company. Building on its strong foundation while evolving a framework to address the future is critical to Grainger’s continued success. Grainger has been consistently recognized for its commitment to its culture, an inclusive workplace and team member engagement.
Team Member Profile
As of December 31, 2024, Grainger had more than 26,000 team members worldwide, of whom approximately 23,500 were full-time and 3,000 were part-time or temporary. Approximately 85% of these team members are located in North America, 9% in Asia and 6% in Europe.
Workplace Practices and Policies
The Company's strategic framework, The Grainger Edge, outlines a set of principles that define the behaviors expected from Grainger’s team members in working with each other and the Company's customers, suppliers and communities. This framework helps the Company execute its strategy and create value for shareholders.
The Grainger Edge principles work as a system and guide the Company’s actions supporting health and safety, an inclusive workplace, and team member experience, including talent acquisition, retention, development and compensation and benefits. The Grainger Edge principles are:
| | | | | |
•Start with the Customer | •Win as One Team |
•Embrace Curiosity | •Invest in our Success |
•Act with Intent | •Do the Right Thing |
•Compete with Urgency | |
Grainger’s purpose-driven culture and principles help the Company attract, retain, motivate and develop its workforce and drive team member engagement. The Company believes an engaged workforce leads to a more innovative, productive and profitable company and measures team member engagement on an ongoing basis. The results from engagement surveys are used to inform programs and processes designed and implemented to enhance the culture Grainger aspires to achieve.
Health and Safety
Grainger strives to provide a safe work environment in which team members are properly prepared to perform the many tasks required to support customers. The Company’s Environmental, Health and Safety (EHS) program is designed to integrate EHS into Grainger’s business operations and comply with applicable regulations. To that end, the Company requires each of its locations to perform regular safety audits to confirm proper safety policies, programs and procedures.
The Company is focused on promoting a culture of safety and education. Operational team members must complete routine training to fully understand the expectation of behaviors defined by the Company’s global EHS policy. Managing and reducing risks at DCs and other facilities remain a core objective and injury rates continue to be low. In 2024, the Company’s Occupational Safety and Health Administration Total Recordable Incident Rate in the U.S. was 1.3 and the Company’s Lost Time Incident Rate in the U.S. was 0.5 based upon the number of incidents per 100 team members (or per 200,000 work hours).
Inclusive Workplace
Grainger believes a broad talent pool is essential to live its principles, foster innovation, build high-performing teams and drive business results. The Company understands that future business success requires a mix of current and new skill sets, multiple experiences, and a broad array of backgrounds and perspectives, and strives to reflect this in its hiring, retention and promotion practices. The Company aspires to increasingly promote a welcoming, inclusive culture that values all people.
Grainger's commitment to inclusion applies throughout the organization. As of December 31, 2024, the Company’s Board of Directors is comprised of approximately 31% female and 23% racially and ethnically diverse directors. Grainger also maintains this commitment with the executive leadership teams. Grainger's global executive leadership team is comprised of approximately 33% women leaders. The U.S. based executive leadership team is comprised of approximately 27% racially and ethnically diverse leaders. Within Grainger’s global workforce, approximately 42% of team members were women and approximately 39% of U.S. team members were racially and ethnically diverse.
Talent Acquisition, Retention and Development
Grainger believes that a great customer experience starts with a great team member experience. The Company is committed to providing team members with resources designed to help them succeed. Grainger focuses on creating opportunities for team member growth, development and training, including offering a comprehensive talent program that continues throughout a team member’s career. This talent program is comprised of performance
management, career management, professional development learning opportunities and milestone leadership development programs.
Compensation and Benefits
Grainger believes that its future success is highly dependent upon the Company’s continued ability to attract, retain and motivate team members. As part of its efforts in these areas, the Company offers competitive compensation and benefits to meet the needs of team members and support their physical and mental health and well-being, financial future and work-life balance. Team members are given access to health plan resources which include 24-hour virtual health services, disease management, tobacco cessation, parental support, stress management and weight loss programs with access to online support communities. In addition, Grainger provides retirement savings, paid holidays and time off, educational assistance and income protection benefits as well as a variety of other programs.
Available Information
Grainger's annual reports on Form 10-K, quarterly reports on Form 10-Q, current reports on Form 8-K and all amendments to reports filed pursuant to Sections 13(a) and 15(d) of the Securities Exchange Act of 1934, as amended (the Exchange Act), are filed with the U.S. Securities and Exchange Commission (SEC). Such reports and other information filed with the SEC are available free of charge as soon as reasonably practicable after these materials are electronically filed with, or furnished to, the SEC, on the Company's website at www.grainger.com, and its investor relations website, invest.grainger.com. This includes press releases and other information about financial performance, information on environmental, social and governance matters, and details related to the Company’s annual meeting of shareholders. The content of the Company's website and investor relations website is not incorporated by reference into this Form 10-K or in any other report or document filed with the SEC, and any references to Grainger’s website and investor relations website are intended to be inactive textual references only. The SEC also maintains a website at www.sec.gov that contains reports, proxy and information statements and other information regarding issuers that file electronically with the SEC.
Information about Executive Officers
Following is information about the executive officers of Grainger, including age, as of January 31, 2025. Executive officers of Grainger generally serve until the next annual appointment of officers, or until earlier resignation or removal.
| | | | | |
| Name and Age | Positions and Offices Held and Principal Occupation and Employment |
| Nancy L. Berardinelli-Krantz (47) | Senior Vice President and Chief Legal Officer since January 2023. Ms. Berardinelli-Krantz previously served as Senior Vice President and Deputy Chief Legal Officer at Eaton Corporation (Eaton), a power management company, from June 2022 to December 2022. Prior to being promoted to that role, she held a variety of senior leadership roles at Eaton. Ms. Berardinelli-Krantz served in senior leadership positions at The Goodyear Tire & Rubber Company, a multinational tire manufacturer, and worked at Jones Day, an international law firm. Ms. Berardinelli-Krantz is a veteran of the United States Army and Judge Advocate General’s Corps, where she served as a trial attorney in Fort Hood, Texas, and for the Contract Appeals Division in Washington, D.C. She also served as a trial defense counsel in Baghdad, Iraq. |
| Jonny LeRoy (53) | Senior Vice President and Chief Technology Officer since April 2020. Mr. LeRoy previously served as Head of Technology for North America for ThoughtWorks, a technology consultancy, from 2013 to March 2020. Prior to being promoted to Head of Technology for North America, Mr. LeRoy held roles of increasing responsibility at ThoughtWorks. Prior to joining ThoughtWorks, Mr. LeRoy was a founder and Chief Technology Officer of Whatsonwhen, an online travel information company. |
| D.G. Macpherson (57) | Chairman of the Board, since October 2017 and Chief Executive Officer since October 2016 at which time he was also appointed to the Board of Directors. Mr. Macpherson previously served as Chief Operating Officer from August 2015 to September 2016, Senior Vice President and Group President, Global Supply Chain and International from September 2013 to July 2015, Senior Vice President and President, Global Supply Chain and Corporate Strategy from January 2012 to August 2013, and Senior Vice President, Global Supply Chain from November 2008 to December 2011. Prior to Grainger, Mr. Macpherson served as Partner and Managing Director at Boston Consulting Group, a global management consulting firm. |
| Deidra C. Merriwether (56) | Senior Vice President and Chief Financial Officer, since January 2021. Ms. Merriwether previously served as Senior Vice President, and President, North American Sales & Services, from November 2019 to December 2020, Senior Vice President, U.S. Direct Sales and Strategic Initiatives, from September 2017 to November 2019, Vice President, Pricing and Indirect Procurement from April 2016 to August 2017 and Vice President in Finance from 2013 to 2016. Prior to Grainger, Ms. Merriwether held various positions of increasing responsibility at Sears Holdings Corporation, a broadline retailer, PricewaterhouseCoopers LLP, a global professional services firm, and Eli Lilly & Company, a global pharmaceutical company. |
| Paige K. Robbins (56) | Senior Vice President and President, Grainger Business Unit since January 2021. Ms. Robbins previously served as Senior Vice President and Chief Technology, Merchandising, Marketing, Strategy Officer from November 2019 to December 2020, Senior Vice President and Chief Merchandising, Marketing, Digital, Strategy Officer from May 2019 to October 2019, Senior Vice President and Chief Digital Officer from September 2017 to April 2019, Senior Vice President, Global Supply Chain, Branch Network, Contact Centers and Corporate Strategy from November 2016 to August 2017 and various other positions since joining Grainger in September 2010. Prior to Grainger, Ms. Robbins served as Partner and Managing Director at Boston Consulting Group, a global management consulting firm. |
| | | | | |
Laurie R. Thomson (51)
| Vice President, Controller and principal accounting officer since May 2021. Ms. Thomson previously served as Vice President, Internal Audit and Finance Continuous Improvement from November 2019 to April 2021, Vice President, Internal Audit from October 2016 to November 2019, as Senior Director, Finance from June 2011 to September 2016, and Director, Internal Audit from February 2008 to June 2011. Prior to Grainger, Ms. Thomson served as Director, Internal Audit at CVS Health Corporation, a pharmacy healthcare provider, and Audit Manager at Arthur Andersen LLP, a professional services firm. Ms. Thomson is a certified public accountant. |
| |
|
Item 1A: Risk Factors
The following represents a discussion of risk factors relevant to Grainger’s business that could adversely affect its financial condition, results of operations and cash flows, along with the accuracy of forward-looking statements. The risks included below are not exhaustive. As Grainger operates in a rapidly changing environment, it is not possible for management to predict all risks and the corresponding impact of each such risk or a combination of risks. The presented risks and any new risks could cause actual results to differ materially from those contained in any forward-looking statements. The risk factors discussed in this section should be considered together with information included elsewhere in this Annual Report on Form 10-K and should not be considered the only risks to which Grainger is exposed.
Industry and Market Risks
Inflation could cause Grainger's operating and administrative expenses to grow more rapidly than net sales, which could result in lower gross margins and lower net earnings.
Market variables, such as inflation of product costs, labor rates, fuel, freight and energy costs, as well as geopolitical events, could negatively impact Grainger's ability to effectively manage its operating and administrative expenses. For example, geopolitical conflicts and related international responses have and may continue to exacerbate inflationary pressures, including increases in fuel and other energy costs. Additionally, climate-related policies, carbon pricing mechanisms, and regulations aimed at reducing emissions may increase energy and raw material costs, which could put additional pressure on Grainger’s margins. Inflation may also reduce demand for products, resulting in lower sales volumes. In addition, Grainger's inability to pass on increases in costs to customers in a timely manner, or at all, could cause Grainger's operating and administrative expenses to grow more rapidly than net sales, which could result in lower gross profit margins and lower net earnings.
Disruptions in Grainger’s supply chain could result in an adverse impact on results of operations.
Grainger’s logistics or supply chain network could be disrupted by the occurrence of: one or more natural or weather-related disasters, including earthquakes, tsunamis, storms, hurricanes, floods, fires, droughts, tornados and other extreme weather events or conditions; longer-term climate shifts that affect transportation infrastructure or material availability; pandemic diseases or viral contagions; geopolitical events, such as war, civil unrest or terrorist attacks in a country in which Grainger operates or in which its suppliers are located; disruptions to transportation infrastructure and networks, including from transport providers or third-party work stoppages related to labor strikes or lockouts; and the imposition of measures that create barriers to or increases in costs associated with international trade.
Even when Grainger is able to find alternate sources for certain products, they may cost more or require Grainger to incur higher transportation costs, which could adversely impact Grainger's profitability and financial condition. For example, disruptions to global transportation networks, such as rising sea levels impacting ports or extreme weather damaging logistics hubs, could increase delays and costs. Any of these circumstances could impair Grainger's ability to meet customer demand for products and result in lost sales, increased supply chain costs, penalties or damage to Grainger's reputation. Grainger’s ability to provide same-day shipping and next-day delivery is an integral component of Grainger’s business strategy and any such disruption could adversely impact results of operations and financial performance.
Further escalation of geopolitical tensions across the world and potential actions taken in response to them could have a broad impact on markets where Grainger does business, adversely affect its suppliers and disrupt the sourcing, manufacturing and transportation of products. It is not possible to predict whether certain geopolitical events which could adversely affect Grainger's business will occur, or the broader consequences of these events if they did occur, which could include further instability, geopolitical shifts and adverse effects on the global economy or possible sanctions, embargoes or other trade barriers.
Weakness in the economy, market trends and other conditions affecting the profitability and financial stability of Grainger’s customers could negatively impact Grainger’s sales growth and results of operations.
Economic, political and industry trends affect Grainger’s business environment. Grainger serves several industries and markets in which the demand for its products and services is sensitive to the production activity, capital spending and demand for products and services of Grainger’s customers. Many of these customers operate in markets that are subject to fluctuations resulting from market uncertainty, trade and tariff policies, costs of goods
sold, currency exchange rates, interest rate fluctuations, government spending and government shutdowns, economic downturns, recessions, foreign competition, offshoring of production, oil and natural gas prices, geopolitical developments, labor shortages, work stoppages, natural or human induced disasters, extreme weather, outbreaks of pandemic disease, inflation, deflation, and a variety of other factors beyond Grainger’s control. Any of these factors could cause customers to idle or close facilities, delay purchases, reduce production levels, or experience reductions in the demand for their own products or services.
Any of these events could also reduce the volume of products and services these customers purchase from Grainger or impair the ability of Grainger’s customers to make full and timely payments and could cause increased pressure on Grainger’s pricing and terms of sale. Accordingly, a significant or prolonged slowdown in economic activity in Canada, Japan, Mexico, the U.K., the U.S. or any other major world economy, or a segment of any such economy, could negatively impact Grainger’s sales and results of operations.
Unexpected product shortages, tariffs, product cost increases and risks associated with Grainger’s suppliers could negatively impact customer relationships or result in an adverse impact on results of operations.
Grainger's products are purchased from more than 5,000 primary suppliers located in various countries around the world, not one of which accounted for more than 5% of total purchases.
Disruptions in procuring sources of supply could occur due to factors beyond Grainger’s control. These factors could include economic downturns, recessions, outbreaks of pandemic disease, natural or human induced disasters, cybersecurity attacks, extreme weather, geopolitical unrest, new, threatened or increased tariffs, trade issues and policies, detention orders or withhold release orders on imported products, labor problems or shortages experienced by Grainger’s suppliers or others in the supply chain, transportation availability, staffing and cost, shortage of raw materials, supplier consolidation, unilateral product cost increases by suppliers of products in short supply, inflation and other factors, any of which could adversely affect a supplier’s ability to manufacture or deliver products or could result in an increase in Grainger’s product costs.
Further, Grainger sources products from Asia and other areas of the world. This increases the risk of supply disruption due to the additional lead time required, distances involved, and the range of potential consequences of various geopolitical risks. If Grainger was unable to promptly replace sources of supply that become disrupted, there could be adverse effects on inventory levels, results of operations, customer relationships and Grainger’s reputation. In addition, Grainger has strategic relationships with a number of vendors. In the event Grainger was unable to maintain those relations, there might be a loss of competitive pricing arrangements which could, in turn, adversely affect results of operations.
For products sold in the U.S., Canada, and Mexico, Grainger requires its suppliers and sub-suppliers, to comply with Grainger’s Supplier Code of Ethics, or other similar responsible sourcing standards, as a condition of doing business with Grainger. Grainger’s Supplier Code of Ethics focuses on four main areas of ethical sourcing: (i) human rights and labor standards (including prohibitions on child and forced labor); (ii) environment, health and safety; (iii) sanctions, trade, bribery and corruption; and (iv) privacy and information security. The Code also addresses how to report potential Code violations and related concerns. Grainger does not control its suppliers and their sub-suppliers, and neither Grainger nor its suppliers or other partners may be able to uncover all instances of noncompliance with Grainger’s Supplier Code of Ethics and ethical and lawful business practices. Even an isolated incident, or the aggregate effect of individually insignificant incidents, can erode trust and confidence, particularly if they result in adverse publicity, governmental investigations, product recalls, or litigation, and as a result, could tarnish Grainger’s brand and lead to adverse effects on Grainger’s business.
Volatility in commodity prices may adversely affect gross margins.
Some of Grainger’s products contain significant amounts of commodity-priced materials, such as steel, copper, petroleum derivatives, rare earth minerals, or other materials or inputs required to manufacture certain products and are subject to price changes based on fluctuations in the commodities market. Certain policies, including carbon pricing, emissions trading systems, and regulations limiting industrial emissions, may further contribute to cost fluctuations for fuel, energy, and raw materials.
Further changes in U.S. trade policy (including new or additional increases in duties or tariffs) and retaliatory actions by U.S. trade partners could result in a worsening of economic conditions. The level of demand for Grainger's products and services is influenced in multiple ways by the price and availability of raw materials and commodities, including fuel. For example, climate-related regulations on transportation emissions could increase fuel costs,
thereby impacting the cost of product distribution. Fluctuations in the price of fuel or increased demand for freight services could affect transportation costs. Grainger’s ability to pass on such increases in costs in a timely manner depends on market conditions. The inability to pass along cost increases could result in lower gross margins. In addition, higher prices could reduce demand for these products, resulting in lower sales volumes.
Fluctuations in foreign currency could have an effect on reported results of operations.
Grainger’s exposure to fluctuations in foreign currency rates results primarily from the translation exposure associated with the preparation of the Consolidated Financial Statements, as well as from transactions in currencies other than an entity’s functional currency. While the Consolidated Financial Statements are reported in U.S. dollars, the Financial Statements of Grainger’s subsidiaries outside the U.S. are prepared using the local currency as the functional currency and translated into U.S. dollars. In addition, Grainger is exposed to foreign currency exchange rate risk with respect to the U.S. dollar relative to the local currencies of Grainger’s international subsidiaries, primarily the Japanese yen, Mexican peso, Canadian dollar, and British pound sterling, arising from transactions in the normal course of business, such as sales and loans to wholly owned subsidiaries, sales to customers, purchases from suppliers, and bank loans and lines of credit denominated in foreign currencies. The foreign currency exchange rate is driven by a variety of macroeconomic factors and fiscal decisions of various governments and central banks, all over which Grainger has no control. Grainger also has foreign currency exposure to the extent receipts and expenditures are not denominated in a subsidiary’s functional currency and that could have an impact on sales, costs and cash flows. These fluctuations in foreign currency exchange rates have affected and may continue to affect Grainger’s results of operations and impact reported net sales and net earnings.
The facilities maintenance industry is highly competitive, and changes in competition and other risks could increase our costs, impact demand for Grainger’s products and services or impact the profitability of our business.
Grainger competes in a variety of ways, including product assortment and availability, services offered to customers, pricing, purchasing convenience and the overall experience Grainger offers. This includes the ease of use of Grainger’s high-touch operations, eCommerce platforms and delivery of products.
There are several large competitors in the industry, as well as small local and regional competitors. Grainger faces competition from manufacturers (including some of its own suppliers) that sell directly to customers, wholesale distributors, catalog houses, retail enterprises and online businesses.
To remain competitive, Grainger must be willing and able to respond to market pressures. Downward pressure on sales prices, changes in the volume of orders, and an inability to pass higher product costs on to customers could cause Grainger’s gross profit percentage to fluctuate or decline. Grainger may not be able to pass rising product costs to customers if those customers have ready product or supplier alternatives in the marketplace. These pressures could have a material effect on Grainger’s sales and profitability.
To manage these potential pressures, Grainger continuously considers the adoption of new operating initiatives, including new marketing programs, productivity improvements, inventory management and loss prevention initiatives, practical applications of artificial intelligence (AI) and other similar strategies. If Grainger is unable to sustain or grow sales, reduce costs, and prevent loss and fraud, among other actions, Grainger's results of operations and financial condition may be adversely affected.
Moreover, Grainger expects technological advancements, innovations and the increased use of eCommerce solutions within the industry to continue to evolve at a rapid pace. As a result, Grainger’s ability to effectively compete requires Grainger to respond and adapt to new industry trends and developments. Developing, upgrading, managing or implementing new technologies, including AI, business applications, strategies and innovations may require significant investment of resources by Grainger, may result in unexpected costs and disruptions to operations, may take longer than expected, may increase Grainger's vulnerability to cyber breaches, attacks or intrusions, and may not provide all anticipated benefits.
Changes in customer base or product mix could cause changes in Grainger’s revenue or gross margin, or affect Grainger’s competitive position.
From time to time, Grainger experiences changes in its customer base and product mix that affect gross margin. Changes in customer base and product mix result primarily from business acquisitions and divestitures, changes in customer demand, customer acquisitions, selling and marketing activities, competition and the increased use of eCommerce by Grainger and its competitors.
In addition, Grainger has entered, and may in the future continue to enter, into contracts with group purchasing organizations (GPOs) that aggregate the buying power of their member customers in negotiating selling prices. If Grainger is unable to enter into, or sustain, contractual arrangements on a satisfactory commercial basis with GPOs, Grainger's results of operations could be adversely affected.
As its customer base and product mix change over time, Grainger must identify new products, product lines and services that respond to industry trends and customer needs. The inability to introduce new products and services and effectively integrate them into Grainger’s existing assortment could have a negative impact on future sales growth and Grainger’s competitive position. The inclusion of Grainger-branded products in the product assortment could subject Grainger to increased claims and litigation activity. In addition, any insurance or indemnification rights, including against the manufacturer of such products, may be insufficient or unavailable to protect Grainger against potential loss exposures.
Grainger’s common stock may be subject to volatility or price declines.
The trading prices and volumes of Grainger’s common stock may be subject to broad and unpredictable fluctuations due to changes in economic, political and market conditions, the financial results and business strategies of Grainger and its competitors, changes in expectations as to Grainger’s future financial or operating performance, including estimates by securities analysts and investors, Grainger’s failure to meet the financial performance guidance or other forward-looking statements provided to the public, speculation, coverage or sentiment in the media or investment community or by groups of individual investors, changes in capital structure, share repurchases or dividends, economic decline, political unrest or geopolitical conflict, outbreak of pandemic disease, and a number of other factors, including those discussed in this Item 1A. These factors, many of which are outside of Grainger’s control, could cause stock price and trading volume volatility or Grainger’s stock price to decline. Volatility in the price of Grainger's securities could result in the filing of securities class action litigation, which could result in substantial costs and the diversion of management time and resources.
Grainger has a controlling ownership interest in MonotaRO, which is listed on the Tokyo Stock Exchange (TSE). MonotaRO's disclosure and reporting obligations under TSE listing requirements and Japanese securities laws, including the timing of such obligations, may vary from Grainger's obligations under New York Stock Exchange listing requirements and U.S. securities laws. MonotaRO's listed securities may be subject to the same volatility, price and securities litigation risks to which Grainger's common stock is subject.
Operational Risks
The growth of Grainger’s eCommerce platforms exposes Grainger to additional risks which could adversely affect Grainger’s reputation, financial condition and operating results.
The successful execution of Grainger’s eCommerce growth strategy depends on a number of factors, including Grainger’s investment in its eCommerce platforms, consumer preferences and purchasing trends, and the ability to deliver a seamless procurement experience across digital and also physical retail channels. As its eCommerce platforms have grown in recent years, Grainger has increased, and expects to continue to increase, its investments in developing, managing and implementing technology information systems, software development and other capabilities to provide simplified customer interactions and to provide high-quality, user-friendly service to its customers and streamline customer interactions. Grainger has also made significant investments in digital advertising and customer acquisition and retention efforts for its eCommerce channels, including through paid and non-paid advertising such as display advertising, search engine optimization, email and mobile “push” notifications. If Grainger’s customer-facing technology systems are perceived as more difficult or less compelling for customers to use than those of Grainger’s competitors, or if digital marketing efforts are unsuccessful or if Grainger is otherwise unsuccessful at realizing the benefits of these investments, its reputation, financial condition and operating results may be adversely affected. Additionally, Grainger faces many risks and uncertainties beyond the Company's control, including theft, credit card fraud, and other fraudulent behavior.
Further, if these investments in Grainger’s eCommerce platforms are less successful at attracting and retaining customers than similar investments by our competitors, or if Grainger is otherwise unsuccessful at realizing the benefits of these technological investments generally, its reputation, financial condition and operating results may be adversely affected.
In addition, the successful operation of Grainger’s eCommerce channels depends in part upon third parties and factors over which Grainger has limited or no control. For example, Grainger relies in part on internet search engines to drive traffic to its websites, and the reach of Grainger’s eCommerce channels is impacted by how and
where its websites rank in both paid and unpaid search results. Potential changes to search engine ranking rules could cause Grainger’s websites to place lower in search results and cause Grainger to incur increased advertising costs in order to increase its visibility. Further, ongoing changes in the legal and regulatory requirements surrounding data privacy, online tracking technologies such as cookies, digital advertising and other eCommerce matters could require Grainger to modify its eCommerce strategy, incur significant additional costs to comply with such changes or otherwise adversely affect Grainger’s business, results of operations or financial condition. Grainger also relies on email and other messaging services to promote its websites and product offerings, and changes in Grainger’s current or prospective customers’ use of email or other messaging services or actions by third parties to block, restrict or charge for the delivery of such messages could adversely affect sales through Grainger’s eCommerce channels and Grainger’s results of operations.
Grainger’s eCommerce channels are subject to risks related to online payment methods and other online transactions, including through purchasing platforms.
Grainger accepts a variety of payment methods via its eCommerce channels, including credit card, debit card, PayPal and other payment methods and other online transactions, including through its eProcurement technologies which communicate directly with Grainger.com and Grainger's other eCommerce channels. Although Grainger generally relies on third parties to facilitate eCommerce payments and payment processing services, Grainger may become subject to additional compliance requirements and regulations regarding these transactions and may also suffer losses from online fraudulent transactions on its eCommerce channels. In addition, Grainger must pay certain transaction fees relating to these transactions, which may increase over time and could have an impact on product margin, operating costs and profitability. Grainger’s eCommerce channels may become subject to further rules and regulations, and changes in these rules and regulations, or their interpretation, could increase the cost of doing business and adversely affect results of operations.
Grainger’s inability to adequately protect its intellectual property or successfully defend against infringement claims by others may have an adverse impact on operations.
Grainger’s business relies on the use, validity and continued protection of certain proprietary information and intellectual property, which includes current and future patents, trade secrets, trademarks, service marks, copyrights and confidentiality agreements as well as license and sublicense agreements to use intellectual property owned by affiliated entities or third parties. Unauthorized use of Grainger’s intellectual property by others could result in harm to various aspects of the business and may result in costly and protracted litigation in order to protect Grainger’s rights. In addition, Grainger may be subject to claims that it has infringed on the intellectual property rights of others, which could subject Grainger to liability, require Grainger to obtain licenses to use those rights at significant cost or otherwise cause Grainger to modify its operations.
In order to compete, Grainger must attract, train, motivate, develop and retain key team members, and the failure to do so could have an adverse effect on results of operations.
In order to compete and have continued growth, Grainger must attract, train, motivate, develop, and retain executives and other key team members, including those in managerial, technical, sales, supply chain, technology development and information technology positions. Grainger competes to hire team members at increasingly competitive wage rates and then must train them and develop their skills and competencies. Qualified individuals needed to fill open positions may be in short supply in some areas. Further, changes in market compensation rates may adversely affect Grainger's labor costs. Competition for qualified team members could require Grainger to pay higher wages to attract a sufficient number of team members. In addition to intense competition for talent, workforce dynamics are constantly evolving. If Grainger does not manage changing workforce dynamics effectively, it could materially adversely affect Grainger's culture, reputation, and operational flexibility.
Additionally, collective bargaining or unionization of team members could decrease Grainger's operational flexibility and lead to work stoppages or slowdowns. The performance of Grainger’s stock price could impact Grainger’s use of equity-based compensation to attract and retain executives and other key team members. The success of Grainger's team member hiring and retention also depends on Grainger's ability to build and maintain a workplace culture that enables all team members to have the opportunity for a fulfilling and meaningful career.
Generally, higher wages and benefit costs, competition for talent, and the risk of an increase in team member turnover, could adversely affect Grainger's results of operations. Moreover, changes in immigration policies may impair our ability to recruit and hire technical and professional talent globally. Further, failure to successfully hire executives and key team members or adequately plan for the succession, transition, and assimilation of executive leaders and team members in key roles, or to plan for the loss of executives and key team members, could adversely affect Grainger's business results and financial condition.
Grainger’s continued success is substantially dependent on positive perceptions of Grainger’s reputation.
One of the reasons customers choose to do business with Grainger and team members choose Grainger as a place of employment is the reputation that Grainger has built over many years. Grainger devotes time and resources to initiatives that align with its corporate values and are designed to strengthen its business and protect and preserve its reputation. These efforts include maintaining high standards of product quality and safety, ethical business practices, strong customer relationships, operational reliability, and a commitment to providing a positive workplace environment. These programs could be challenging to implement and costly to maintain, and Grainger’s actual or perceived failure to achieve its goals or uphold its commitments could adversely affect its reputation, business, and financial performance.
To be successful in the future, Grainger must continue to preserve, grow and leverage the value of Grainger’s brand. Reputational value is based in large part on perceptions of subjective qualities. An isolated incident, or the aggregate effect of individually insignificant incidents, negative or inaccurate postings, articles, or comments on social media or the internet can erode trust and confidence, particularly if they result in adverse publicity, governmental investigations or litigation, and as a result, could tarnish Grainger’s brand and lead to adverse effects on Grainger’s business.
Grainger’s disclosures related to environmental and social matters expose it to risks that could adversely affect its reputation and performance.
Grainger has established and publicly announced environmental and social programs, including its efforts to address climate change, human rights, and an inclusive workplace. These statements reflect its current plans and are not guarantees that Grainger will be able to achieve them. Grainger’s pursuit of or inability to update, achieve, or accurately report its goals could damage its reputation, financial performance, and growth, leading to increased scrutiny from customers, enforcement authorities, and other various stakeholders and potential risks related to "anti-ESG sentiment", such as reputational harm, lawsuits, or market access restrictions.
Grainger’s ability to achieve any environmental or social change is subject to numerous risks, some of which are outside of its control. For example, evolving climate-related regulations in multiple jurisdictions—such as stricter emissions limits, carbon disclosure mandates, and supply chain sustainability requirements—may require Grainger to adjust its operations and increase compliance investments. New environmental laws, regulations, and enforcement could strain Grainger's suppliers and result in increased compliance-related costs, which could result in higher product costs that are passed to Grainger. For instance, California's new climate disclosure requirements and SEC-mandated climate risk reporting could increase compliance burdens and legal exposure. Furthermore, our customers may adopt procurement policies that include environmental or social provisions or requirements that their suppliers should comply with, or they may seek to include such provisions or requirements in their procurement terms and conditions.
Standards for tracking and reporting Grainger's activity, if any, related to environmental and social matters continue to evolve. Grainger’s selection of voluntary disclosure frameworks and standards, and the interpretation or application of those frameworks and standards, may change from time to time or differ from those of others. Methodologies for reporting environmental and social data may be updated and previously reported data may be adjusted to reflect improvement in availability and quality of third-party data, changing assumptions, changes in the nature and scope of Grainger’s operations and other changes in circumstances. Grainger’s processes and controls for reporting such matters across its operations and supply chain are evolving along with multiple disparate standards for identification, measurement, and reporting Regulatory disclosure standards are or may become required by the SEC, European and other regulators (including, but not limited to, the EU Corporate Sustainability Reporting Directive, the EU Corporate Sustainability Due Diligence Directive, the state of California’s new climate change disclosure requirements, and climate-change disclosure requirements from the SEC that may become effective), and such standards may change over time, which could result in revisions to Grainger’s current goals, reported progress in achieving such goals, or ability to achieve such goals in the future. If Grainger’s environmental and social practices do not meet evolving government, investor or other stakeholder expectations and standards, then Grainger’s reputation or its attractiveness as an investment, business partner, product or service provider or employer could be negatively impacted, and Grainger could be subject to litigation or regulatory proceedings.
Technology Risks
Interruptions in the proper functioning of information systems could disrupt operations and cause unanticipated increases in costs and/or decreases in revenues.
The functioning of Grainger’s information systems is critical to the operation of its business. Grainger continues to invest in software, hardware and network infrastructures to effectively manage its information systems. However, Grainger may not be able to maintain or update its information systems to capture and use data in ways that result in operational efficiency, including as a result of ineffective software, difficulties obtaining the right talent and ability to manage the increasing volume of data available to, and managed by Grainger. Furthermore, although Grainger’s information systems are protected with backup and security systems, including physical and software safeguards and remote processing capabilities, information systems are still vulnerable to damage or interruption from natural or human induced disasters, extreme weather, power losses, telecommunication failures, user error, third-party actions such as malicious computer programs, denial-of-service attacks and cybersecurity breaches, and other problems. In addition, Grainger relies on the information technology (IT) systems of third parties to assist in conducting its business.
The implementation of new systems and upgrades to existing systems could impact Grainger's operations by imposing substantial capital expenditures, demands on management's time and risks of delays or difficulties in transitioning to new systems. In addition, Grainger's systems implementations may not result in productivity improvements at the levels anticipated. Systems implementation disruption and any other IT disruption could have an adverse effect on the Company.
If Grainger’s systems or those of third parties on which Grainger depends are damaged, breached, cease to function properly or are otherwise disrupted, Grainger may require a significant investment to repair or replace them and may suffer interim interruptions in its business operations. If critical information systems fail or otherwise become unavailable, Grainger’s ability to operate its digital platforms, process orders, maintain proper levels of inventories, collect accounts receivable, disburse funds, manage its supply chain, monitor results of operations, and process and store team member or customer data, among other functions, could be adversely affected. Any such interruption of Grainger’s information systems could have a material adverse effect on its business or results of operations. Grainger has experienced these incidents in the past, which it deemed immaterial to its business and operations individually and in the aggregate, and may be subject to other incidents in the future. There can be no assurance that any future incidents will not be material to Grainger’s business, operations or financial condition.
The proliferation of AI may impact our industry and the markets in which we compete, and the development and use of AI presents competitive, reputational and liability risks.
Grainger has also increased, and expects to continue to increase, its investments in developing, managing and implementing AI, such as large language model technologies. Grainger believes the proliferation of AI will have a significant impact on customer preferences and market dynamics in its industry, and Grainger’s ability to effectively compete in this space will be critical to its financial performance. Grainger also believes that the effective use of AI in its internal operations is important to its long-term success. Grainger is working to incorporate AI capabilities into its digital platforms, as well as across Grainger in its own internal operations, and its research into and continued development of such technologies remain ongoing. As with many innovations, AI presents risks, challenges, and unintended consequences that could affect its rate and success of adoption, and therefore Grainger’s business, and there is no guarantee that Grainger’s use of AI or incorporation of AI capabilities into its business will benefit its business operations or result in solutions that are preferred by its customers. Grainger has invested, and expects to continue to invest, significant resources to build and support its AI products. If Grainger’s digital platforms fail to operate as anticipated or as well as competing products or otherwise do not meet customer needs or if Grainger is unable to bring AI-enabled products and solutions to market as effectively, or with the same speed or in the same volumes, as our competitors, Grainger may fail to recoup its investments in AI or improve its financial performance, its competitive position may be harmed, and its business and reputation may be adversely impacted.
In addition, AI algorithms may be flawed. Datasets may be insufficient or contain biased information. AI models deployed by Grainger or its partners may lead to unexpected or unintended outcomes that could erode trust in its digital platforms and potentially cause harm to individuals or society. These deficiencies and other failures of AI systems could subject Grainger to competitive harm, regulatory action, legal liability, including under new proposed legislation regulating AI in jurisdictions such as the U.S. and European Union, new applications of existing data protection, privacy, intellectual property, and other laws, and brand or reputational harm. Additionally, Grainger’s obligations to comply with the evolving legal and regulatory landscape could entail significant costs or limit its ability to incorporate certain AI capabilities into its digital platforms. Some AI capabilities also present ethical issues, and Grainger may be unsuccessful in identifying or resolving issues before they arise. If Grainger enables or offers AI products or solutions or implement AI capabilities in its internal operations that are controversial because of their impact on human rights, the environment, privacy, employment, or other social, economic, or political issues, Grainger may experience brand or reputational harm or greater team member attrition.
Cybersecurity threats and incidents, including breaches of information systems security could damage Grainger’s reputation, disrupt operations, increase costs and/or decrease revenues.
Through Grainger’s sales and digital channels, as well as its ordinary course of business, Grainger collects and stores personally identifiable, confidential, proprietary and other information from customers, team members, suppliers, website visitors, and other entities or individuals so that they may, among other things, purchase products or services, enroll in promotional programs, register on Grainger’s websites or otherwise communicate or interact with Grainger. Moreover, Grainger’s operations routinely involve receiving, storing, processing and transmitting sensitive information pertaining to its business, customers, suppliers and team members, and other sensitive matters.
Cybersecurity threats are rapidly evolving and some of the means for obtaining access to information in digital and other storage media are becoming increasingly sophisticated. Each year, cybersecurity threat actors make numerous attempts to access the information stored in Grainger's information systems or Grainger's third-party business partners. Loss of customer, supplier, and team member information, intellectual property or other business information, or failure to comply with data privacy and security laws, or failure to maintain systems or software, could, for example, disrupt operations, damage Grainger’s reputation and expose Grainger to claims from customers, suppliers, financial institutions, regulators, payment card associations, team members and others, any of which could have a material adverse effect on Grainger, including its business strategy, financial condition and results of operations. If successful, cybersecurity incidents may expose Grainger to risk of loss or misuse of proprietary or confidential information or disruptions of business operations.
Grainger's IT infrastructure also includes products and services provided by suppliers, vendors and other third-party business partners, and these third parties can experience cybersecurity threats, breaches, attacks, disruptions, and cybersecurity incidents that impact the security of systems and proprietary or confidential information. Moreover, Grainger shares information with these third parties in connection with the products and services they provide to the business. Although Grainger performs risk assessments on third parties where Grainger deems appropriate to learn about their security program, there is a risk that the confidentiality of data held or accessed by them may be compromised or their systems may be disrupted or interrupted by threat actors.
Moreover, Grainger, and its third-party business partners, may face cybersecurity threats and cybersecurity incidents which can include unauthorized access to information systems, business email compromise, viruses, malicious code, ransomware, denial-of-service attacks, and organized cyber-attacks. Cybersecurity incidents can also include team member failures, fraud, phishing or other social engineering attempts or other methods to cause confidential information, payments, account access or access credentials, or other data to be transmitted to an unintended recipient. Cybersecurity threat actors also may attempt to exploit vulnerabilities in software that is commonly used by companies in cloud-based services and bundled software. If successful, those attempting to penetrate Grainger’s or its third-party business partners’ information systems may misappropriate intellectual property or personally identifiable, credit card, confidential, proprietary or other sensitive customer, supplier, team member or business information, or cause systems disruption. Further, cybersecurity threats or cybersecurity incidents that impact Grainger’s systems, or those of its third-party business partners, could have a material adverse effect on Grainger, including its business strategy, financial condition and results of operations, including major disruptions to business operations, alteration or corruption of data or systems, costs related to remediation or the payment of ransom, and litigation including individual claims or consumer class actions, commercial litigation, administrative, and civil or criminal investigations or actions, regulatory intervention and sanctions or fines, investigation and remediation costs and possible prolonged negative publicity. While many of Grainger's agreements with these third parties include indemnification provisions, Grainger may not be able to recover sufficiently, or at all, under such provisions to adequately offset any losses it may incur.
In addition, a Grainger team member, contractor or other third party with whom Grainger does business may attempt to circumvent security measures or otherwise access Grainger’s information. Grainger’s systems are integrated with customer systems and a breach of Grainger's systems could be used as an attempt to gain illicit access to customer systems and information. There can be no assurance that any future incidents will not be material to Grainger's business, operations or financial condition.
Techniques used to obtain unauthorized access or to sabotage systems change frequently and may not be recognized until they are launched against a target. Grainger may be unable to anticipate these techniques or implement preventative measures. Further, security measures and efforts may not be effective in each instance and may be subject to human error or failures. Any breach of Grainger’s security measures or any breach, error or
malfeasance by its third-party business partners could cause Grainger to incur significant costs to protect any customers, suppliers, team members and other parties whose information is compromised. Such a breach could also cause Grainger to make changes to its information systems and administrative processes to address security issues. Although Grainger maintains insurance coverage that may, subject to policy terms and conditions, cover certain aspects of cybersecurity risks, depending on the nature, location and extent of any event, such insurance coverage may be insufficient to cover all losses.
Grainger has experienced certain cybersecurity incidents, and in each instance, Grainger provided notifications where required by applicable law and adopted remedial measures. None of these incidents have been deemed to be material to Grainger and Grainger has neither incurred any material net expenses nor been materially penalized or subject to any material settlement amounts with respect to such incidents. However, there can be no assurance that a future breach or incident would not be material to Grainger’s operations and financial condition.
For further information regarding Grainger's cybersecurity risk management strategy and the Board's oversight role, see Part I, Item 1C: Cybersecurity of this Form 10-K.
Regulatory, Legal and Tax Risks
Grainger is subject to a complex array of laws, regulations and standards globally. Failure to comply or unforeseen developments in related contingencies such as litigation and other regulatory proceedings could adversely affect Grainger's financial condition, profitability, reputation, and cash flows.
Grainger’s business is subject to legislative, legal, and regulatory risks and conditions specific to the countries in which it operates. In addition to Grainger’s U.S. operations, which in 2024 generated approximately 82% of its consolidated net sales, Grainger operates its business principally through wholly owned subsidiaries in Canada, Mexico, and the U.K., and its majority-owned subsidiary in Japan.
The wide array of laws, regulations and standards in each jurisdiction where Grainger operates, include, but are not limited to, advertising, marketing and internet regulations (including the use of proprietary or third-party “cookies” in connection with Grainger’s eCommerce platforms), anti-bribery and corruption laws, competition and antitrust regulations, data protection (including, because Grainger accepts credit cards, the Payment Card Industry Data Security Standard), data privacy (including in the U.S., the California Consumer Privacy Act and Privacy Rights Act, in Japan, the Act on Protection of Personal Information, and in the European Union, the General Data Protection Regulation) and cybersecurity requirements (including protection of information and incident responses), environmental protection laws, currency exchange controls and cash repatriation restrictions, health and safety laws, import and export compliance (including the U.S. Commerce Department’s Export Administration Regulations, trade sanctions promulgated by the Office of Foreign Asset Control and anti-money laundering regulations), intellectual property laws, labor laws (including federal and state wage and hour laws), product compliance or safety laws, supplier regulations regarding the sources of supplies or products, tax laws (including as to U.S. taxes on international subsidiaries), unclaimed property laws and laws, regulations and standards applicable to other commercial matters. Moreover, Grainger is also subject to audits and inquiries in the normal course of business.
Failure to comply with any of these laws, regulations and standards could result in civil, criminal, monetary and non-monetary fines, penalties, remediation costs and/or significant legal fees as well as potential damage to Grainger’s reputation. Changes in these laws, regulations and standards, or in their interpretation, could increase the cost of doing business, including, among other factors, as a result of increased investments in technology and the development of new operational processes. Furthermore, while Grainger has implemented policies and procedures and provides training designed to facilitate compliance with these laws, regulations and standards, there can be no assurance that team members, contractors, suppliers, vendors, or other third parties will not violate such laws, regulations and standards or Grainger’s policies. Any such failure to comply or violation could individually or in the aggregate materially adversely affect Grainger’s financial condition, results of operations and cash flows.
Grainger is subject to a number of rules and regulations related to its government contracts, which may result in increased compliance costs and potential liabilities.
Grainger’s contracts with federal, state and local government entities are subject to various and changing regulations related to procurement, formation and performance. In addition, Grainger’s government contracts may provide for termination, reduction or modification by the government at any time, with or without cause. From time to time, Grainger is subject to governmental or regulatory investigations or audits related to its compliance with these rules and regulations. Violations of these terms, rules, and regulations could result in fines, criminal sanctions, the inability to participate in existing or future government contracting and other administrative sanctions. Any such
penalties could result in damage to Grainger’s reputation, increased costs of compliance and/or remediation and could adversely affect Grainger’s financial condition and results of operations.
In conducting its business, Grainger may become subject to legal proceedings or governmental investigations, including in connection with product liability or product compliance claims if people, property or the environment are harmed by Grainger’s products or services.
Grainger is, and from time to time may become, party to legal proceedings or governmental investigations for alleged violations of laws, rules or regulations. Grainger also may be subject to disputes and proceedings incidental to its business, including product-related claims for personal injury or illness, death, environmental or property damage or other commercial disputes, and the types of matters discussed in Note 13 to the Consolidated Financial Statements included in Part II, Item 8: Financial Statements and Supplementary Data of this Form 10-K. The defense of any proceedings may require significant expenses and divert management’s time and attention, and Grainger may be required to pay damages that could individually or in the aggregate materially adversely affect its financial condition, results of operations and cash flows. In addition, any insurance or indemnification rights that Grainger may have with respect to such matters may be insufficient or unavailable to protect Grainger against potential loss exposures. Grainger also may be requested or required to recall products or take other actions. Grainger's reputation could also be adversely affected by any resulting negative publicity.
Tax changes could affect Grainger’s effective tax rate and future profitability.
Grainger’s future results could be adversely affected by changes in the effective tax rate as a result of Grainger’s relative overall profitability and the mix of earnings in countries with differing statutory tax rates, changes in tax legislation, the results of the examination of previously filed tax returns, and continuing assessment of Grainger's tax exposures.
Credit and Liquidity Risks
Changes in Grainger’s credit ratings and outlook may reduce access to capital and increase borrowing costs.
Grainger’s credit ratings are based on a number of factors, including the Company’s financial strength and factors outside of Grainger’s control, such as conditions affecting Grainger’s industry generally or the introduction of new rating practices and methodologies. Grainger cannot provide assurances that its current credit ratings will remain in effect or that the ratings will not be lowered, suspended or withdrawn entirely by the rating agencies. If rating agencies lower, suspend or withdraw the ratings, the market price or marketability of Grainger’s securities may be adversely affected. In addition, any change in ratings could make it more difficult for the Company to raise capital on favorable terms, impact the Company’s ability to obtain adequate financing, and result in higher interest costs for the Company’s existing credit facilities or on future financings.
Grainger has incurred indebtedness and may incur additional indebtedness, which could adversely affect cash flow, decrease business flexibility, or prevent Grainger from fulfilling its obligations.
As of December 31, 2024, Grainger’s consolidated indebtedness was approximately $2.8 billion. The Company’s indebtedness could, among other things, limit Grainger’s ability to respond to rapidly changing business and economic conditions, require the Company to dedicate a substantial portion of its cash flows to the payment of principal and interest on its indebtedness, reducing the funds available for other business purposes, and make it more difficult to satisfy the Company’s financial obligations as they come due during periods of adverse economic and industry conditions.
The agreements governing Grainger’s debt agreements and instruments contain representations, warranties, affirmative, negative and financial covenants, and default provisions. Grainger’s failure to comply with these restrictions and obligations could result in a default under such agreements, which may allow Grainger’s creditors to accelerate the related indebtedness. Any such acceleration could have a material adverse effect on Grainger’s business, financial condition, results of operations, cash flows, and its ability to obtain financing on favorable terms in the future.
In addition, Grainger may in the future seek to raise additional financing for working capital, capital expenditures, refinancing of indebtedness, share repurchases, dividends, corporate investments, mergers and acquisitions, joint ventures, or other general corporate purposes. Grainger’s ability to obtain additional financing will be dependent on, among other things, the Company’s financial condition, prevailing market conditions and numerous other factors beyond the Company’s control. Such additional financing may not be available on commercially reasonable terms or at all. Any inability to obtain financing when needed could materially adversely affect the Company’s business, financial condition or results of operations.
Item 1B: Unresolved Staff Comments
None.
Item 1C: Cybersecurity
Risk Management and Strategy
Grainger has a dedicated cybersecurity team that works to prevent, detect, and respond to cybersecurity threats. The cybersecurity team is led by the Vice President and Chief Information Security Officer (CISO), who is responsible for assessing and managing material risks from cybersecurity threats. Grainger’s CISO has over 20 years of cybersecurity experience and maintains industry recognized security certifications. The cybersecurity team has implemented processes designed to assess, identify and manage material risks from cybersecurity threats and vulnerabilities to the Company’s security posture, including prioritizing and remediating such risks. The team also works to assess and manage cybersecurity risks by: (i) reviewing risks from cybersecurity threats with senior management; (ii) incorporating cybersecurity in its enterprise risk processes; (iii) establishing regular reviews of cybersecurity risks and mitigation efforts, including with the Audit Committee and the Board; and (iv) using third parties as needed for reviews and testing.
Grainger regularly identifies its enterprise risks. Grainger’s cybersecurity team reviews and updates its information security strategy and aligns plans based on cybersecurity prioritization with the identified top enterprise risks. Grainger engages with third parties in order to enhance, implement, assess and monitor its cybersecurity processes, controls, and posture.
Grainger has developed a cybersecurity risk intake process to facilitate the identification of cybersecurity risks, including those related to third-party vendors. Identified risks are tracked by management, and incorporated into mitigation plans.
Grainger has been subject to unauthorized access of systems on which certain supplier, customer, and team member information was stored, which have been deemed immaterial to our business and operations individually and in the aggregate. As of the date of this filing, Grainger does not believe that any risks from cybersecurity threats, including as a result of past cybersecurity incidents, have had, or are reasonably likely to have, a material adverse effect on Grainger, including its business strategy, results of operations or financial condition. However, Grainger, or third-party service providers engaged by Grainger, may be subject to cybersecurity incidents, or other unauthorized access of information systems in the future. There can be no assurance that any future cybersecurity incident or unauthorized access to or breach of these information systems will not be material to Grainger’s business, strategy, results of operations or financial condition. See Part I, Item 1A: Risk Factors of this Form 10-K.
Governance
The Audit Committee assists the Board in its oversight of the Company’s Enterprise Risk Management (ERM) program and processes, including with respect to cybersecurity.
As part of its ERM oversight, the Board oversees and regularly reviews the Company’s programs and processes for cybersecurity risks, including the Company’s framework for preventing, detecting, and addressing cybersecurity incidents and identifying emerging risks both broadly and within related industries. The Company’s CISO routinely provides material cybersecurity updates to the Audit Committee and information to the Board.
Item 2: Properties
As of December 31, 2024, Grainger’s owned and leased facilities totaled approximately 30.3 million square feet. Grainger owns and leases facilities primarily in the U.S., Japan, Canada(5), Mexico(6), Puerto Rico(7) and the U.K.(8) The Company owns its corporate headquarters in Lake Forest, Illinois and leases other general offices in the Chicago Metropolitan area that consists of approximately one million square feet. Grainger believes that its properties are generally in excellent condition, well maintained and suitable for the conduct of business.
The following table includes Grainger's material facilities:
| | | | | | | | | | | | | | | | | | | | |
| Location | | Facility and Use(9) | | Size in Square Feet (in thousands) | | Segment |
U.S.(1) | | DCs | | 11,642 | | High-Touch Solutions N.A. |
U.S.(2) | | Branch locations | | 6,327 | | High-Touch Solutions N.A. |
Japan(3) | | DCs | | 3,380 | | Endless Assortment |
U.S.(4) | | Other facilities | | 3,847 | | High-Touch Solutions N.A. |
| | | | | | |
| | | | | | |
| The square footage of Grainger's corporate headquarters in Lake Forest, Illinois and other general offices in the Chicago Metropolitan area are not included in the total square footage of Grainger's U.S. Other facilities provided above. Square footage of the Company's owned and leased properties provided below are presented as approximates. |
| | | | | | |
| | | | | | |
(1) Consists of 21 DCs that range in size from approximately 60,000 to 1.5 million square feet, including six leased facilities that primarily manage bulk products. The remaining DCs are primarily owned. |
|
(2) Consists of 245 branches, 65 onsite and four will-call express locations. These facilities range in size from under 1,000 to 110,000 square feet. These facilities are primarily owned. |
|
(3) Consists of four DCs that range in size from approximately 160,000 to 2.1 million square feet. These facilities are both owned and leased. Other facilities include office space that range in size from approximately 1,000 to 90,000 square feet. These facilities are primarily leased. |
|
(4) Primarily consists of storage facilities, office space and customer service centers. These facilities are owned and leased. These facilities range in size from under 1,000 to over 1 million square feet. |
|
(5) In Canada, Grainger has 32 branch locations, five DCs and other facilities which total two million square feet. |
|
(6) In Mexico, Grainger has 15 branch locations, two DCs and one other location which total 650,000 square feet. |
|
(7) In Puerto Rico, Grainger has three branch locations and one DC which total 95,000 square feet. |
|
(8) In the U.K., Grainger has 33 branch and other facility locations and one DC which total 685,000 square feet. |
|
(9) Owned facilities are not subject to any mortgages. |
Item 3: Legal Proceedings
For a description of legal proceedings, see the disclosure contained in Note 13 to the Consolidated Financial Statements included in Part II, Item 8: Financial Statements and Supplementary Data of this Form 10-K, which is incorporated herein by reference.
Item 4: Mine Safety Disclosures
Not applicable.
PART II
Item 5: Market for Registrant’s Common Equity, Related Shareholder Matters and Issuer Purchases of Equity Securities
Market Information and Dividends
Grainger's common stock is listed and traded on the New York Stock Exchange, under the symbol GWW.
Dividends
Grainger expects that its practice of paying quarterly dividends on its common stock will continue, although the payment of future dividends is at the discretion of Grainger’s Board of Directors and will depend upon Grainger’s earnings, capital requirements, financial condition and other factors.
Holders
As of February 14, 2025, there were 496 shareholders of record of Grainger’s common stock. A substantially greater number of holders of Grainger common stock are "street name" or beneficial holders, whose shares of record are held by banks, brokers, and other financial institutions.
Purchases of Equity Securities by the Issuer and Affiliated Purchasers
The following table provides information relating to Grainger's repurchase of common stock during the three months ended December 31, 2024:
| | | | | | | | | | | | | | | | | |
| Period | Total Number of Shares Purchased (A) (D) | Average Price Paid Per Share (B) | Total Number of Shares Purchased as Part of Publicly Announced Plans or Programs (C) | Maximum Number of
Shares That May Yet be Purchased Under the
Plans or Programs |
| Oct. 1 – Oct. 31 | 11,339 | $1,023.97 | 11,332 | 4,570,888 | | shares |
| Nov. 1 – Nov. 30 | 148,340 | $1,190.32 | 148,340 | 4,422,548 | | shares |
| Dec. 1 – Dec. 31 | 241,646 | $1,132.63 | 241,447 | 4,181,101 | | shares |
| Total | 401,325 | | 401,119 | | |
(A)There were no shares withheld to satisfy tax withholding obligations.
(B)Average price paid per share excludes commissions of $0.02 per share paid.
(C)Prior to April 28, 2024, purchases were made pursuant to a share repurchase program approved by Grainger's Board of Directors and announced on April 28, 2021 (2021 Program). On April 24, 2024, Grainger's Board of Directors authorized a program for the Company to repurchase an aggregate amount of up to five million shares in the open market, through privately negotiated transactions and block transactions, pursuant to a trading plan or otherwise (2024 Program) with no expiration date. In authorizing the 2024 Program, the Board of Directors terminated the 2021 Program.
(D)The difference of 206 shares between the Total Number of Shares Purchased and the Total Number of Shares Purchased as Part of Publicly Announced Plans or Programs represents shares purchased by the administrator and record keeper of the W.W. Grainger, Inc. Retirement Savings Plan for the benefit of the team members who participate in the plan.
Company Performance
The following stock price performance graph compares the cumulative total return on an investment in Grainger common stock with the cumulative total return of an investment in each of the Dow Jones US Industrial Suppliers Total Stock Market Index, which includes Grainger, and the S&P 500 Stock Index. It covers the period commencing December 31, 2019 and ending December 31, 2024. The graph assumes that the value for the investment in Grainger common stock and in each index was $100 on December 31, 2019, and that all dividends were reinvested.
| | | | | | | | | | | | | | | | | | | | |
| December 31, |
| 2019 | 2020 | 2021 | 2022 | 2023 | 2024 |
| W.W. Grainger, Inc. | $ | 100 | | $ | 123 | | $ | 158 | | $ | 172 | | $ | 259 | | $ | 332 | |
| Dow Jones US Industrial Suppliers Total Stock Market Index | 100 | | 125 | | 170 | | 151 | | 223 | | 260 | |
| S&P 500 Stock Index | 100 | | 118 | | 152 | | 125 | | 158 | | 197 | |
Item 6: [Reserved]
Item 7: Management’s Discussion and Analysis of Financial Condition and Results of Operations
Objective
The following Management’s Discussion and Analysis (MD&A) of Financial Condition and Results of Operations is intended to help the reader understand the results of operations and financial condition of W.W. Grainger, Inc. (Grainger or Company) as it is viewed by the Company. The following discussion should be read in conjunction with the Consolidated Financial Statements and accompanying notes included in Part II, Item 8: Financial Statements and Supplementary Data of this Form 10-K. This section of this Form 10-K generally discusses 2024 and 2023 items and year-to-year comparisons between 2024 and 2023. Discussions of 2022 items and year-to-year comparisons between 2023 and 2022 are not included in this Form 10-K, and can be found in MD&A of Financial Condition and Results of Operations in Part II, Item 7 of the Company’s Annual Report on Form 10-K for the fiscal year ended December 31, 2023.
Percentage figures included in this section have not been calculated on the basis of such rounded figures but on the basis of such amounts prior to rounding. For this reason, percentage amounts in this section may vary slightly from those obtained by performing the same calculations using the figures in the Company's Consolidated Financial Statements or in the associated text.
Overview
W.W. Grainger, Inc. is a broad line distributor of maintenance, repair and operating (MRO) products and services with operations primarily in North America, Japan and the United Kingdom (U.K.). Grainger uses its high-touch solutions and endless assortment businesses to serve customers worldwide, who rely on Grainger for products and services that enable them to run safe, sustainable and productive operations.
Strategic Priorities
The Company’s continued strategic aspiration for 2025 is to relentlessly expand Grainger’s leadership position by being the go-to partner for people who build and run safe, sustainable, and productive operations. To achieve this, each Grainger business has a set of strategic growth drivers to drive top-line revenue and MRO market outgrowth. The High-Touch Solutions North America (High-Touch Solutions N.A.) segment is focused on three areas: advantaged MRO solutions, differentiated sales and services, and unparalleled customer service. In the Endless Assortment segment, the business is focused on product assortment expansion and innovative customer acquisition and retention capabilities. Additionally, all Grainger businesses are focused on continuously enhancing our operational processes to improve service and cost through customer experience, technology and supply chain infrastructure which ultimately delivers long-term returns for shareholders.
Recent Events
Macroeconomic Conditions
The global economy continues to experience volatility and uncertainty including to the commodity, labor and transportation markets, arising from a combination of geopolitical conditions and events, and various economic and financial factors. These conditions have affected the Company's operations and may continue to affect the Company's business, financial condition and results of operations.
The Company continues to monitor economic conditions in the U.S. and globally, and the impact of macroeconomic pressures, including repercussions from changes in interest rates, currency exchange fluctuations, changing inflationary environment, and a potential recession on the Company’s business, customers, suppliers and other third parties. The Company has implemented strategies designed to mitigate certain adverse effects from the impact of the changing inflationary environment while remaining market price competitive. Historically, the Company’s broad and diverse customer base and the nondiscretionary nature of the Company’s products to its customers has helped to insulate it from the effects of recessionary periods in the industrial MRO market. The full extent and impact of these conditions are uncertain and cannot be predicted at this time.
For further discussion of the Company's risks and uncertainties, see Part I, Item 1A: Risk Factors of this Form 10-K.
Results of Operations
In this section, Grainger utilizes non-GAAP (as defined below) measures where it believes it will assist users of its financial statements in understanding its business. Non-GAAP measures exclude certain items affecting comparability that can affect the year-over-year assessment of operating results and other one-time items that do not directly reflect ongoing operating results. For further information regarding the Company's non-GAAP measures including reconciliations to the most directly comparable U.S. generally accepted accounting principles (GAAP) measures, see "Non-GAAP Measures."
The following table is included as an aid to understanding the changes in Grainger's Consolidated Statements of Earnings for the twelve months ended December 31, 2024 and 2023 (in millions of dollars).
| | | | | | | | | | | | | | | | | | | | | | | | | | | | | |
| For the Years Ended December 31, |
| | | | % of Net Sales |
| 2024 | | 2023 | | % Change | 2024 | | 2023 |
Net sales(1) | $ | 17,168 | | | $ | 16,478 | | | 4.2 | % | | 100.0 | % | | 100.0 | % |
| Cost of goods sold | 10,410 | | | 9,982 | | | 4.3 | | | 60.6 | | | 60.6 | |
| Gross profit | 6,758 | | | 6,496 | | | 4.0 | | | 39.4 | | | 39.4 | |
| Selling, general and administrative expenses | 4,121 | | | 3,931 | | | 4.8 | | | 24.0 | | | 23.8 | |
| Operating earnings | 2,637 | | | 2,565 | | | 2.8 | | | 15.4 | | | 15.6 | |
| Other expense – net | 53 | | | 65 | | | (18.5) | | | 0.3 | | | 0.4 | |
| Income tax provision | 595 | | | 597 | | | (0.3) | | | 3.5 | | | 3.6 | |
| Net earnings | 1,989 | | | 1,903 | | | 4.5 | | | 11.6 | | | 11.6 | |
| Less noncontrolling interest | 80 | | | 74 | | | (8.1) | | | 0.5 | | | 0.5 | |
| Net earnings attributable to W.W. Grainger, Inc. | $ | 1,909 | | | $ | 1,829 | | | 4.4 | | | 11.1 | % | | 11.1 | % |
| Diluted earnings per share: | $ | 38.71 | | | $ | 36.23 | | | 6.8 | % | | | | |
| | | | | | | | | |
(1) For further information regarding the Company's disaggregated revenue, see Note 2 of the Notes to the Consolidated Financial Statements in Part II, Item 8: Financial Statements and Supplementary Data of this Form 10-K. |
The following table is included as an aid to understanding the changes of Grainger's total net sales, daily net sales and daily organic constant currency net sales from the prior period for the twelve months ended December 31, 2024 (in millions of dollars):
| | | | | | | | | | | | | | | | | | | | | | | |
| For the Years Ended December 31, |
| 2024 | | % Change(1) | | 2023 | | % Change(1) |
| Net sales | $ | 17,168 | | | 4.2 | % | | $ | 16,478 | | | 8.2 | % |
| | | | | | | |
Daily net sales(2) | $ | 66.5 | | | 3.4 | % | | $ | 65.2 | | | 8.6 | % |
| | | | | | | |
Daily, organic constant currency net sales(2) | $ | 67.4 | | | 4.7 | % | | $ | 65.8 | | | 9.5 | % |
| | | | | | | |
(1) Calculated on the basis of prior year reported net sales for the years ended December 31, 2024 and 2023. |
(2) Daily net sales are adjusted for the difference in U.S. selling days relative to the prior year period. Daily, organic constant currency net sales are also adjusted to exclude the impact on net sales due to year-over-year foreign currency exchange rate fluctuations and the prior year period results of E&R divested in the fourth quarter of 2023. There were 256 and 254 sales days in the full year 2024 and 2023, respectively. For further information regarding the Company's non-GAAP measures, including reconciliations to the most directly comparable GAAP measure, see below "Non-GAAP Measures." |
|
Net sales of $17,168 million for the year ended December 31, 2024 increased $690 million, or 4%, and on a daily, organic constant currency basis, net sales increased 5% compared to the same period in 2023. Both High-Touch Solutions N.A. and the Endless Assortment segments contributed to sales growth in 2024. For further discussion on the Company's net sales, see the Segment Analysis section below.
Gross profit of $6,758 million for the year ended December 31, 2024 increased $262 million, or 4%, and gross profit margin of 39.4% was flat compared to the same period in 2023. Both segments contributed to gross profit dollar expansion in 2024. For further discussion on the Company's gross profit, see the Segment Analysis section below.
Selling, general, and administrative (SG&A) expenses of $4,121 million for the year ended December 31, 2024 increased $190 million, or 5%. Adjusted SG&A of $4,105 million increased $200 million, or 5%, compared to the same period in 2023 driven by higher marketing and payroll and benefit expenses. SG&A leverage and adjusted SG&A leverage decreased 20 basis points in 2024.
Operating earnings of $2,637 million for the year ended December 31, 2024 increased $72 million, or 3%. Adjusted operating earnings of $2,653 million increased $62 million, or 2%, compared to the same period in 2023 due to higher gross profit dollars, partially offset by increased SG&A expense. Operating margin and adjusted operating margin decreased 20 basis points in 2024.
Income tax provision of $595 million for the year ended December 31, 2024 decreased $2 million, compared to the same period in 2023. Adjusted income taxes of $599 million decreased $2 million compared to the same period in 2023. Grainger's effective tax rates were 23.0% and 23.9% for the years ended December 31, 2024 and 2023, respectively. The adjusted effective tax rates were 23.0% and 23.8%. The Company's effective tax rate was positively impacted from the expiration of a statute of limitation period in 2024.
Diluted earnings per share was $38.71 for the year ended December 31, 2024, an increase of 7% compared to $36.23 for the same period in 2023. Adjusted diluted earnings per share was $38.96 for the year ended December 31, 2024, an increase of 6% compared to $36.67 for the same period in 2023.
Segment Analysis
In this section, Grainger utilizes non-GAAP measures where it believes it will assist users of its financial statements in understanding its business. For further information regarding the Company's non-GAAP measures including reconciliations to the most directly comparable GAAP measures, see "Non-GAAP Measures." For further segment information, see Note 12 of the Notes to Consolidated Financial Statements in Part II, Item 8: Financial Statements and Supplementary Data of this Form 10-K.
High-Touch Solutions N.A.
The following table shows reported segment results (in millions of dollars):
| | | | | | | | | | | | | | | | | | | | |
| | For the Years Ended December 31, | | |
| | 2024 | | 2023 | | % Change |
| Net sales | | $ | 13,720 | | | $ | 13,267 | | | 3.4 | % |
| | | | | | |
| Gross profit | | 5,741 | | | 5,546 | | | 3.5 | |
| Selling, general and administrative expenses | | 3,356 | | | 3,212 | | | 4.5 | |
| Operating earnings | | $ | 2,385 | | | $ | 2,334 | | | 2.2 | % |
Net sales of $13,720 million for the year ended December 31, 2024 increased $453 million, or 3% compared to the same period in 2023. The increase was primarily due to volume.
Gross profit of $5,741 million for the year ended December 31, 2024 increased $195 million, or 4%, and gross profit margin of 41.8% was flat compared to the same period in 2023.
SG&A of $3,356 million for the year ended December 31, 2024 increased $144 million, or 5%, and adjusted SG&A of $3,341 million increased $155 million, or 5% compared to the same period in 2023. The increase was primarily due to higher marketing and payroll and benefit expenses. SG&A leverage decreased 20 basis points and adjusted SG&A leverage decreased 30 basis points compared to the same period in 2023.
Operating earnings of $2,385 million for the year ended December 31, 2024 increased $51 million, or 2%, and adjusted operating earnings of $2,400 million increased $40 million, or 2% compared to the same period in 2023.
Endless Assortment
The following table shows reported segment results (in millions of dollars):
| | | | | | | | | | | | | | | | | | | | |
| | For the Years Ended December 31, | | |
| | 2024 | | 2023 | | % Change |
| Net sales | | $ | 3,134 | | | $ | 2,916 | | | 7.5 | % |
| | | | | | |
| Gross profit | | 923 | | | 864 | | | 6.8 | |
| Selling, general and administrative expenses | | 663 | | | 631 | | | 5.1 | |
| Operating earnings | | $ | 260 | | | $ | 233 | | | 11.6 | % |
Net sales of $3,134 million for the year ended December 31, 2024 increased $218 million, or 7%, and on a daily constant currency basis, increased 12% compared to the same period in 2023. The increase was due to sales growth of 12%, driven by customer acquisition for the segment and enterprise customer growth at MonotaRO. Sales growth was partially offset by unfavorable currency exchange of 5% due to changes in the exchange rate between U.S. dollar and the Japanese yen.
Gross profit of $923 million for the year ended December 31, 2024 increased $59 million, or 7%, and gross profit margin of 29.5% decreased 10 basis points compared to the same period in 2023.
SG&A of $663 million for the year ended December 31, 2024 increased $32 million, or 5%, compared to the same period in 2023. The increase was primarily due to higher marketing expenses in 2024. SG&A leverage improved 40 basis points compared to the same period in 2023.
Operating earnings of $260 million for the year ended December 31, 2024 increased $27 million, or 12%, compared to the same period in 2023.
Non-GAAP Measures
Grainger utilizes non-GAAP measures where it believes it will assist users of its financial statements in understanding its business. Non-GAAP measures exclude certain items affecting comparability that can affect the year-over-year assessment of operating results and other one-time items that do not directly reflect ongoing operating results. The Company adjusts its reported net sales when there are differences in the number of U.S. selling days relative to the prior year period and also excludes the impact on reported net sales due to changes in foreign currency exchange rate fluctuations and results of certain divested businesses. Adjusted results including adjusted SG&A, adjusted operating earnings, adjusted net earnings and adjusted diluted EPS exclude certain non-recurring items, including restructuring charges, asset impairments, gains and losses associated with business divestitures and other non-recurring, infrequent or unusual gains and losses from the Company’s most directly comparable reported U.S. generally accepted accounting principles (GAAP) results. The Company believes its non-GAAP measures provide meaningful information to assist investors in understanding financial results and assessing prospects for future performance as they provide a better baseline for analyzing the ongoing performance of its businesses by excluding items that may not be indicative of core operating results. Grainger’s non-GAAP financial measures should be considered in addition to, and not as a replacement for or as a superior measure to its most directly comparable GAAP measures and may not be comparable to similarly titled measures reported by other companies.
Restructuring Actions
In the second quarter of 2024, the Company recorded restructuring charges in SG&A of $15 million in the High-Touch Solutions N.A. segment and $1 million in Grainger's Other businesses. The charges consisted primarily of team member severance and benefit costs. The Company does not expect these actions to have a material effect on its future results of operations.
Business Divestitures
In the fourth quarter of 2023, Grainger divested E & R Industrial Sales, Inc. (E&R) and recorded a one-time pre-tax loss on the divestiture of $26 million in SG&A. The Company does not expect this business exit to have a material effect on its future results of operations.
The following table provides a reconciliation of reported net sales growth from the prior year period in accordance with GAAP to the Company's non-GAAP measures daily net sales and daily, organic constant currency net sales for the twelve months ended December 31, 2024 (in millions of dollars):
| | | | | | | | | | | | | | | | | | | | | | | | | | | | | | | | | | | | | | | | |
| | For the Years Ended December 31, |
| | High-Touch Solutions N.A. | | Endless Assortment | | Total Company(1) | | |
| | 2024 | | % Change(2) | | 2024 | | % Change(2) | | 2024 | | % Change(2) | | |
| Reported net sales | | $ | 13,720 | | | 3.4 | % | | $ | 3,134 | | | 7.5 | % | | $ | 17,168 | | | 4.2 | % | | |
| | | | | | | | | | | | | | |
Daily impact(3) | | (0.4) | | | (0.8) | | | (0.1) | | | (0.9) | | | (0.5) | | | (0.8) | | | |
| Daily net sales | | 53.2 | | | 2.6 | | | 12.1 | | | 6.6 | | | 66.5 | | | 3.4 | | | |
Foreign currency exchange(4) | | 0.1 | | | 0.1 | | | 0.6 | | | 5.0 | | | 0.6 | | | 0.9 | | | |
Business divestiture(5) | | 0.3 | | | 0.5 | | | — | | | — | | | 0.3 | | | 0.4 | | | |
| Daily, organic constant currency net sales | | $ | 53.6 | | | 3.2 | % | | $ | 12.7 | | | 11.6 | % | | $ | 67.4 | | | 4.7 | % | | |
|
| | 2023 | | % Change(2) | | 2023 | | % Change(2) | | 2023 | | % Change(2) | | |
| Reported net sales | | $ | 13,267 | | | 8.9 | % | | $ | 2,916 | | | 4.7 | % | | $ | 16,478 | | | 8.2 | % | | |
| | | | | | | | | | | | | | |
Daily impact(3) | | 0.2 | | | 0.4 | | | — | | | 0.4 | | | 0.3 | | | 0.4 | | | |
| Daily net sales | | 52.4 | | | 9.3 | | | 11.5 | | | 5.1 | | | 65.2 | | | 8.6 | | | |
Foreign currency exchange(4) | | — | | | — | | | 0.6 | | | 5.3 | | | 0.6 | | | 0.9 | | | |
Business divestiture(5) | | — | | | 0.1 | | | — | | | — | | | — | | | — | | | |
| Daily, organic constant currency net sales | | $ | 52.4 | | | 9.4 | % | | $ | 12.1 | | | 10.4 | % | | 65.8 | | | 9.5 | % | | |
| | | | | | | | | | | | | | |
(1) Total Company includes Other. Grainger's businesses reported in Other do not meet the criteria of a reportable segment. | | |
(2) Compared to net sales in the prior year period. |
(3) Excludes the impact on net sales due to the difference in U.S. selling days relative to the prior year period on a daily basis. There were 256 and 254 sales days in the full year 2024 and 2023, respectively. |
(4) Excludes the impact on net sales due to year-over-year foreign currency exchange rate fluctuations on a daily basis. |
(5) Excludes the net sales results of the divested E&R business in the prior year period on a daily basis. |
The following tables provide a reconciliation of reported SG&A expenses, operating earnings, net earnings attributable to W.W. Grainger, Inc. and diluted earnings per share determined in accordance with GAAP to the Company's non-GAAP measures adjusted SG&A, adjusted operating earnings, adjusted net earnings attributable to W.W. Grainger, Inc. and adjusted diluted earnings per share for the twelve months ended December 31, 2024 and 2023 (in millions of dollars):
| | | | | | | | | | | | | | | | | | | | | | | | | | | | | |
| Twelve Months Ended December 31, 2024 | Reported | | Adjustment(1) | | Adjusted | | % Change Reported(2) | | % Change Adjusted(2) |
| Selling, general and administrative expenses | | | | | | | | | |
| High-Touch Solutions N.A. | $ | 3,356 | | | $ | (15) | | | $ | 3,341 | | | | | |
| Endless Assortment | 663 | | | — | | | 663 | | | | | |
Other(3) | 102 | | | (1) | | | 101 | | | | | |
| Selling, general and administrative expenses | $ | 4,121 | | | $ | (16) | | | $ | 4,105 | | | 4.8% | | 5.1% |
| | | | | | | | | |
| Earnings | | | | | | | | | |
| High-Touch Solutions N.A. | $ | 2,385 | | | $ | 15 | | | $ | 2,400 | | | | | |
| Endless Assortment | 260 | | | — | | | 260 | | | | | |
Other(3) | (8) | | | 1 | | | (7) | | | | | |
| Operating earnings | $ | 2,637 | | | $ | 16 | | | $ | 2,653 | | | 2.8% | | 2.4% |
| Total other expense – net | (53) | | | — | | | (53) | | | | | |
Income tax provision(4) | (595) | | | (4) | | | (599) | | | | | |
| Net earnings | $ | 1,989 | | | $ | 12 | | | $ | 2,001 | | | | | |
| Noncontrolling interest | (80) | | | — | | | (80) | | | | | |
| Net earnings attributable to W.W. Grainger, Inc. | $ | 1,909 | | | $ | 12 | | | $ | 1,921 | | | 4.4% | | 3.8% |
| Diluted earnings per share | $ | 38.71 | | | $ | 0.25 | | | $ | 38.96 | | | 6.8% | | 6.2% |
| | | | | | | | | |
| Twelve Months Ended December 31, 2023 | Reported | | Adjustment(1) | | Adjusted | | % Change Reported(2) | | % Change Adjusted(2) |
| Selling, general and administrative expenses | | | | | | | | | |
| High-Touch Solutions N.A. | $ | 3,212 | | | $ | (26) | | | $ | 3,186 | | | | | |
| Endless Assortment | 631 | | | — | | | 631 | | | | | |
Other(3) | 88 | | | — | | | 88 | | | | | |
| Selling, general and administrative expenses | $ | 3,931 | | | $ | (26) | | | $ | 3,905 | | | 8.2% | | 6.8% |
| | | | | | | | | |
| Earnings | | | | | | | | | |
| High-Touch Solutions N.A. | $ | 2,334 | | | $ | 26 | | | $ | 2,360 | | | | | |
| Endless Assortment | 233 | | | — | | | 233 | | | | | |
Other(3) | (2) | | | — | | | (2) | | | | | |
| Operating earnings | $ | 2,565 | | | $ | 26 | | | $ | 2,591 | | | 15.8% | | 18.1% |
| Total other expense – net | (65) | | | — | | | (65) | | | | | |
Income tax provision(5) | (597) | | | (4) | | | (601) | | | | | |
| Net earnings | $ | 1,903 | | | $ | 22 | | | $ | 1,925 | | | | | |
| Noncontrolling interest | (74) | | | — | | | (74) | | | | | |
| Net earnings attributable to W.W. Grainger, Inc. | $ | 1,829 | | | $ | 22 | | | $ | 1,851 | | | 18.2% | | 21.2% |
| Diluted earnings per share | $ | 36.23 | | | $ | 0.44 | | | $ | 36.67 | | | 20.5% | | 23.6% |
| | | | | | | | | |
(1) Reflects restructuring costs incurred in the second quarter of 2024 and the loss on divestiture of E&R in the fourth quarter of 2023. |
(2) Compared to the reported and adjusted results of the prior year period. |
(3) Grainger's businesses reported in Other do not meet the criteria of a reportable segment. |
(4) Reflects a tax benefit related to the restructuring costs incurred in the second quarter of 2024. Grainger's reported and adjusted effective tax rates were 23.0% for the year ended December 31, 2024. |
(5) Reflects a one-time tax benefit recognized upon the divestiture of E&R in the fourth quarter of 2023. Grainger's reported and adjusted effective tax rates were 23.9% and 23.8%, respectively, for the year ended December 31, 2023. |
Liquidity and Capital Resources
Grainger believes its current balances of cash and cash equivalents, marketable securities and availability under its revolving credit facility will be sufficient to meet its liquidity needs for the next twelve months. The Company expects to continue to invest in its business and return excess cash to shareholders through cash dividends and share repurchases, which it plans to fund through cash flows generated from operations. Grainger also maintains access to capital markets and may issue debt or equity securities from time to time, which may provide an additional source of liquidity.
Sources of Liquidity
Cash and Cash Equivalents
As of December 31, 2024 and 2023, Grainger had cash and cash equivalents of $1,036 million and $660 million, respectively. The increase in cash was primarily due to cash flows from operations and issuance of new long-term debt, partially offset by continued capital expenditure spend and higher volume of share repurchases. The Company had approximately $2.3 billion in available liquidity as of December 31, 2024.
Cash Flows
The following table shows the Company's cash flow activity for the periods presented (in millions of dollars):
| | | | | | | | | | | |
| For the Years Ended December 31, |
| 2024 | | 2023 |
| Total cash provided by (used in): | | | |
| Operating activities | $ | 2,111 | | | $ | 2,031 | |
| Investing activities | (520) | | | (422) | |
| Financing activities | (1,180) | | | (1,278) | |
| Effect of exchange rate changes on cash and cash equivalents | (35) | | | 4 | |
| Increase in cash and cash equivalents | $ | 376 | | | $ | 335 | |
Net cash provided by operating activities was $2,111 million and $2,031 million for the year ended December 31, 2024 and 2023, respectively. The increase was primarily driven by continued growth in net earnings.
Net cash used in investing activities was $520 million and $422 million for the year ended December 31, 2024 and 2023, respectively. The increase reflects the continued investment in U.S. supply chain capacity expansion throughout 2024.
Net cash used in financing activities was $1,180 million and $1,278 million for the year ended December 31, 2024 and 2023, respectively. The decrease in cash used in financing activities was due to the issuance of long-term debt, which includes $500 million in unsecured senior notes partially offset by higher treasury stock repurchases in 2024.
Debt
Grainger maintains a debt ratio and liquidity position that provides flexibility in funding working capital needs and long-term cash requirements. Grainger has various sources of financing available. For further information regarding the Company's debt instruments and available financing sources, see Note 5 of the Notes to the Consolidated Financial Statements in Part II, Item 8: Financial Statements and Supplementary Data of this Form 10-K.
Total debt as a percent of total capitalization was 42.9% and 40.1%, as of December 31, 2024 and 2023, respectively.
Credit Ratings
Grainger receives ratings from two independent credit ratings agencies: Moody's Investor Service (Moody's) and Standard & Poor's (S&P). Both credit rating agencies currently rate the Company's corporate credit at investment grade.
The following table summarizes the Company's credit ratings as of December 31, 2024:
| | | | | | | | | | | | | | | | | |
| Corporate | | Senior Unsecured | | Short-term |
| Moody's | A2 | | A2 | | P1 |
| S&P | A+ | | A+ | | A1 |
Uses of Liquidity
Internally generated cash flows are the primary source of Grainger's working capital and growth initiatives, including capital expenditures. The Company expects to continue to return excess capital to shareholders through share repurchases and dividends.
Working Capital
Working capital as of December 31, 2024 was $3,282 million, an increase of $204 million compared to $3,078 million as of December 31, 2023. The increase was primarily due to sustained sales growth. As of December 31, 2024 and 2023, the ratio of current assets to current liabilities was 2.9 and 2.8, respectively.
Capital Expenditures
In fiscal 2024, the Company's capital expenditures were $541 million and $445 million for the years ended December 31, 2024 and 2023, respectively. Capital project spending for 2025 is expected to be in the range of $450 and $550 million. This includes continued supply chain capacity expansion and technology enhancements across the Company.
Share Repurchases
For the years ended December 31, 2024 and 2023, Grainger repurchased shares of its common stock in the open market for $1,201 million and $850 million, respectively. Share repurchases are executed at prices the Company determines appropriate subject to various factors, including market conditions and the Company's financial performance and may be affected through accelerated share repurchase programs, open market purchases or privately negotiated transactions, including through Rule 10b5-1 plans. Share repurchases for 2025 are expected to be in the range of $1,150 and $1,250 million.
Dividends
For the years ended December 31, 2024 and 2023, Grainger declared and paid $421 million and $392 million, respectively, in dividends to holders of the Company's common stock.
Commitments and Other Contractual Obligations
The Company's material cash requirements include the following commitments and other contractual obligations.
Debt
As of December 31, 2024, the Company had outstanding debt obligations with varying maturities for an aggregate principal amount of $2,803 million, with $502 million payable within 12 months. Total future interest payments associated with the Company's outstanding debt obligations was $1,855 million, with $101 million payable within 12 months.
Purchase Obligations
Grainger had purchase obligations of approximately $1,687 million as of December 31, 2024, which includes approximately $1,021 million payable within 12 months. Grainger's purchase obligations primarily include commitments to purchase inventory, uncompleted additions to property, buildings and equipment and other goods and services. Purchase obligations are made in the normal course of business to meet operating needs and are primarily noncancelable.
Leases
The Company has lease arrangements for certain properties, buildings and equipment (including branches, warehouses, DCs and office space). As of December 31, 2024, the Company had fixed operating lease payment obligations of $437 million, with $91 million payable within 12 months.
Critical Accounting Estimates
The preparation of Grainger’s Consolidated Financial Statements and accompanying notes are in conformity with GAAP and the Company’s discussion and analysis of its financial condition and operating results require the Company’s management to make assumptions and estimates that affect the reported amounts. The Company considers an accounting policy to be a critical estimate if: (1) it involves assumptions that are uncertain when judgment was applied, and (2) changes in the estimate assumptions, or selection of a different estimate methodology, could have a significant impact on Grainger’s consolidated financial position and results. While the Company believes the assumptions and estimates used are reasonable, the Company’s management bases its estimates on historical experience and on various other assumptions it believes to be reasonable under the circumstances. Note 1 of the Notes to Consolidated Financial Statements in Part II, Item 8: Financial Statements and Supplementary Data of this Form 10-K describes the significant accounting policies and methods used in the preparation of the Company’s Consolidated Financial Statements.
Inventories
Company inventories primarily consist of merchandise purchased for resale and are valued at the lower of cost or market value. The majority of the Company’s inventory is accounted for using the last-in, first-out (LIFO) method. Market value is based on an analysis of inventory trends including, but not limited to, reviews of inventory levels, sales and cost information and on-hand quantities relative to the sales history for the product and shelf-life. The Company's methodology for estimating whether adjustments are necessary is continually evaluated for factors including significant changes in product demand, liquidation or disposition history values and market conditions such as inflation and other acquisition costs, including freight and duties. If business or economic conditions change, estimates and assumptions may be adjusted as deemed appropriate.
Goodwill
The Company evaluates goodwill for impairment annually during the fourth quarter and more frequently if impairment indicators exist. The fair value of reporting units is calculated primarily using the discounted cash flow method and utilizing value indicators from a market approach to evaluate the reasonableness of the resulting fair values.
The estimates used to calculate the fair values of reporting units involve the use of significant assumptions, estimates and judgments and changes from year to year based on operating results, market conditions, macroeconomic developments and other factors. Changes in these estimates and assumptions could materially affect the determination of fair value and impairment for each reporting unit. For further information on the Company's goodwill, see Note 4 of the Notes to Consolidated Financial Statements in Part II, Item 8: Financial Statements and Supplementary Data of this Form 10-K.
Contingencies and Legal Matters
The Company is subject to various claims and legal proceedings that arise in the ordinary course of business, the outcomes of which are inherently uncertain. The Company accrues for costs relating to litigation claims and other contingent matters when it is probable that a liability has been incurred and the amount of the assessment can be reasonably estimated. For further information on the Company's contingencies and legal matters, see Note 13 of the Notes to Consolidated Financial Statements in Part II, Item 8: Financial Statements and Supplementary Data of this Form 10-K.
Item 7A: Quantitative and Qualitative Disclosures About Market Risk
Grainger's primary market risk exposures is as follows:
Foreign Currency Exchange Rates
Grainger’s financial results, including the value of assets and liabilities, are exposed to foreign currency exchange rate risk when the financial statements of the business units outside the U.S., as stated in their local currencies, are translated into U.S. dollars. For the fiscal year ended December 31, 2024, approximately 18% of the Company's net sales were denominated in a currency other than the Company's functional U.S. dollar currency. Consequently, the Company is exposed to the impact of exchange rate volatility primarily between the U.S. dollar and the Japanese yen, Mexican peso, Canadian dollar and the British pound sterling. A hypothetical 10% change in the relative value of the U.S. dollar would not materially impact the Company's net earnings for 2024.
Interest Rate Risks
Grainger is exposed to interest rate risk on its long-term debt. In February 2020, Grainger entered into certain derivative instrument agreements to hedge a portion of its fixed-rate long-term debt to manage this risk. The annualized effect of a hypothetical 1 percentage point increase in interest rates on Grainger’s variable-rate debt obligations would not materially impact the Company's net earnings for 2024.
For debt and derivative instrument information, see Note 5 of the Notes to Consolidated Financial Statements in Part II, Item 8: Financial Statements and Supplementary Data of this Form 10-K.
Commodity Price Risks
Grainger’s transportation costs are exposed to fluctuations in the price of fuel and some sourced products contain commodity-priced materials. The Company regularly monitors commodity trends and, as a broad line supplier, mitigates any material exposure to commodity price risk by having alternative sourcing plans in place that mitigate the risk of supplier concentration, passing commodity-related inflation to customers and continuing to scale its distribution networks, including its transportation infrastructure.
Item 8: Financial Statements and Supplementary Data
Report of Independent Registered Public Accounting Firm
To the Shareholders and the Board of Directors of
W.W. Grainger, Inc.
Opinion on the Financial Statements
We have audited the accompanying consolidated balance sheets of W.W. Grainger, Inc. and subsidiaries (the Company) as of December 31, 2024 and 2023, the related consolidated statements of earnings, comprehensive earnings, shareholders’ equity and cash flows for each of the three years in the period ended December 31, 2024, and the related notes (collectively referred to as the “consolidated financial statements”). In our opinion, the consolidated financial statements present fairly, in all material respects, the financial position of the Company at December 31, 2024 and 2023, and the results of its operations and its cash flows for each of the three years in the period ended December 31, 2024, in conformity with U.S. generally accepted accounting principles.
We also have audited, in accordance with the standards of the Public Company Accounting Oversight Board (United States) (PCAOB), the Company’s internal control over financial reporting as of December 31, 2024, based on criteria established in Internal Control-Integrated Framework issued by the Committee of Sponsoring Organizations of the Treadway Commission (2013 framework), and our report dated February 20, 2025 expressed an unqualified opinion thereon.
Basis for Opinion
These financial statements are the responsibility of the Company’s management. Our responsibility is to express an opinion on the Company’s financial statements based on our audits. We are a public accounting firm registered with the PCAOB and are required to be independent with respect to the Company in accordance with the U.S. federal securities laws and the applicable rules and regulations of the Securities and Exchange Commission and the PCAOB.
We conducted our audits in accordance with the standards of the PCAOB. Those standards require that we plan and perform the audit to obtain reasonable assurance about whether the financial statements are free of material misstatement, whether due to error or fraud. Our audits included performing procedures to assess the risks of material misstatement of the financial statements, whether due to error or fraud, and performing procedures that respond to those risks. Such procedures included examining, on a test basis, evidence regarding the amounts and disclosures in the financial statements. Our audits also included evaluating the accounting principles used and significant estimates made by management, as well as evaluating the overall presentation of the financial statements. We believe that our audits provide a reasonable basis for our opinion.
Critical Audit Matter
The critical audit matter communicated below is a matter arising from the current period audit of the financial statements that was communicated or required to be communicated to the audit committee and that: (1) relates to accounts or disclosures that are material to the financial statements and (2) involved our especially challenging, subjective or complex judgments. The communication of the critical audit matter does not alter in any way our opinion on the consolidated financial statements, taken as a whole, and we are not, by communicating the critical audit matter below, providing a separate opinion on the critical audit matter or on the accounts or disclosures to which it relates.
| | | | | |
| Valuation of Goodwill for the Canadian Reporting Unit |
| Description of the Matter | At December 31, 2024, the goodwill balance of the Canada business reporting unit was $114 million. As discussed in Notes 1 and 4 to the financial statements, goodwill is tested at the reporting unit level annually during the fourth quarter and more frequently if impairment indicators exist. Auditing management’s annual goodwill impairment analysis for the Canada business reporting unit was complex due to certain assumptions that were significant to the analysis. Management performed an annual impairment analysis in the fourth quarter to evaluate changes in key assumptions and operating results since the last impairment test. The more subjective assumptions used in the analysis were projections of future revenue growth and operating expenditures, which are all affected by expectations about future market or economic conditions. |
| How We Addressed the Matter in Our Audit | Our audit procedures included obtaining an understanding, evaluating the design and testing the operating effectiveness of controls over the Company’s goodwill impairment analysis, including controls over management’s review of the changes in key assumptions and operating results since the last impairment test. |
| To test management's annual goodwill impairment analysis of the Canada business reporting unit, we performed audit procedures that included evaluating the key assumptions and operating results considering the relevant events and circumstances identified since the date of the last fair value calculation. We compared the significant assumptions used by management to current industry and economic trends, changes to the Company’s business model, customer product mix, and other relevant factors. We also assessed the historical accuracy of management’s estimates and performed sensitivity analyses of significant assumptions to evaluate the changes in fair value that would result from changes in the assumptions utilized in the last quantitative assessment. |
/s/ Ernst & Young LLP
We have served as the Company’s auditor since 2005.
Chicago, Illinois
February 20, 2025
W.W. Grainger, Inc. and Subsidiaries
CONSOLIDATED STATEMENTS OF EARNINGS
(In millions, except for per share amounts)
| | | | | | | | | | | | | | | | | |
| For the Years Ended December 31, |
| | 2024 | | 2023 | | 2022 |
| Net sales | $ | 17,168 | | | $ | 16,478 | | | $ | 15,228 | |
| Cost of goods sold | 10,410 | | | 9,982 | | | 9,379 | |
| Gross profit | 6,758 | | | 6,496 | | | 5,849 | |
| Selling, general and administrative expenses | 4,121 | | | 3,931 | | | 3,634 | |
| Operating earnings | 2,637 | | | 2,565 | | | 2,215 | |
| Other (income) expense: | | | | | |
| Interest expense – net | 77 | | | 93 | | | 93 | |
| Other – net | (24) | | | (28) | | | (24) | |
| Total other expense – net | 53 | | | 65 | | | 69 | |
| Earnings before income taxes | 2,584 | | | 2,500 | | | 2,146 | |
| Income tax provision | 595 | | | 597 | | | 533 | |
| Net earnings | 1,989 | | | 1,903 | | | 1,613 | |
| Less net earnings attributable to noncontrolling interest | 80 | | | 74 | | | 66 | |
| Net earnings attributable to W.W. Grainger, Inc. | $ | 1,909 | | | $ | 1,829 | | | $ | 1,547 | |
| Earnings per share: | | | | | |
| Basic | $ | 38.84 | | | $ | 36.39 | | | $ | 30.22 | |
| Diluted | $ | 38.71 | | | $ | 36.23 | | | $ | 30.06 | |
| Weighted average number of shares outstanding: | | | | | |
| Basic | 48.9 | | 49.9 | | 50.9 | |
| Diluted | 49.0 | | 50.1 | | 51.1 | |
The accompanying notes are an integral part of these financial statements.
W.W. Grainger, Inc. and Subsidiaries
CONSOLIDATED STATEMENTS OF COMPREHENSIVE EARNINGS
(In millions of dollars)
| | | | | | | | | | | | | | | | | |
| For the Years Ended December 31, |
| 2024 | | 2023 | | 2022 |
| Net earnings | $ | 1,989 | | | $ | 1,903 | | | $ | 1,613 | |
| Other comprehensive earnings (losses): | | | | | |
| Foreign currency translation adjustments | (137) | | | (11) | | | (101) | |
| | | | | |
| Postretirement benefit plan losses – net of tax expense of $0, $2, and $6, respectively | (1) | | | (2) | | | (17) | |
| | | | | |
| Total other comprehensive earnings (losses) | (138) | | | (13) | | | (118) | |
| Comprehensive earnings – net of tax | 1,851 | | | 1,890 | | | 1,495 | |
| Less comprehensive earnings (losses) attributable to noncontrolling interest | | | | | |
| Net earnings | 80 | | | 74 | | | 66 | |
| Foreign currency translation adjustments | (36) | | | (21) | | | (34) | |
| Total comprehensive earnings (losses) attributable to noncontrolling interest | 44 | | | 53 | | | 32 | |
| Comprehensive earnings attributable to W.W. Grainger, Inc. | $ | 1,807 | | | $ | 1,837 | | | $ | 1,463 | |
The accompanying notes are an integral part of these financial statements.
W.W. Grainger, Inc. and Subsidiaries
CONSOLIDATED BALANCE SHEETS
(In millions of dollars, except for share and per share amounts)
| | | | | | | | | | | |
| As of December 31, |
| Assets | 2024 | | 2023 |
| Current assets | | | |
| Cash and cash equivalents | $ | 1,036 | | | $ | 660 | |
| Accounts receivable (less allowance for credit losses of $32 and $35, respectively) | 2,232 | | | 2,192 | |
| Inventories – net | 2,306 | | | 2,266 | |
| Prepaid expenses and other current assets | 163 | | | 156 | |
| Total current assets | 5,737 | | | 5,274 | |
| Property, buildings and equipment – net | 1,927 | | | 1,658 | |
| Goodwill | 355 | | | 370 | |
| Intangibles – net | 243 | | | 234 | |
| Operating lease right-of-use | 371 | | | 429 | |
| Other assets | 196 | | | 182 | |
| Total assets | $ | 8,829 | | | $ | 8,147 | |
| | | |
| Liabilities and shareholders' equity | |
| Current liabilities | | | |
| | | |
| Current maturities | 499 | | | 34 | |
| Trade accounts payable | 952 | | | 954 | |
| Accrued compensation and benefits | 324 | | | 327 | |
| Operating lease liability | 78 | | | 71 | |
| Accrued expenses | 407 | | | 397 | |
| Income taxes payable | 45 | | | 48 | |
| Total current liabilities | 2,305 | | | 1,831 | |
| Long-term debt | 2,279 | | | 2,266 | |
| Long-term operating lease liability | 327 | | | 381 | |
| Deferred income taxes and tax uncertainties | 101 | | | 104 | |
| Other non-current liabilities | 114 | | | 124 | |
| Shareholders' equity | | | |
| Cumulative preferred stock – $5 par value – 12,000,000 shares authorized; none issued or outstanding | — | | | — | |
| Common Stock – $0.50 par value – 300,000,000 shares authorized; 109,659,219 shares issued | 55 | | | 55 | |
| Additional contributed capital | 1,399 | | | 1,355 | |
| Retained earnings | 13,677 | | | 12,162 | |
| Accumulated other comprehensive losses | (274) | | | (172) | |
| Treasury stock, at cost – 61,326,349 and 60,341,817 shares, respectively | (11,499) | | | (10,285) | |
| Total W.W. Grainger, Inc. shareholders’ equity | 3,358 | | | 3,115 | |
| Noncontrolling interest | 345 | | | 326 | |
| Total shareholders' equity | 3,703 | | | 3,441 | |
| Total liabilities and shareholders' equity | $ | 8,829 | | | $ | 8,147 | |
The accompanying notes are an integral part of these financial statements.
W.W. Grainger, Inc. and Subsidiaries
CONSOLIDATED STATEMENTS OF CASH FLOWS
(In millions of dollars)
| | | | | | | | | | | | | | | | | |
| For the Years Ended December 31, |
| | 2024 | | 2023 | | 2022 |
| Cash flows from operating activities: | | | | | |
| Net earnings | $ | 1,989 | | | $ | 1,903 | | | $ | 1,613 | |
| Adjustments to reconcile net earnings to net cash provided by operating activities: | | | | | |
| Provision for credit losses | 23 | | | 23 | | | 19 | |
| Deferred income taxes and tax uncertainties | (8) | | | (9) | | | 8 | |
| Depreciation and amortization | 237 | | | 214 | | | 205 | |
| Non-cash lease expense | 84 | | | 76 | | | 70 | |
| | | | | |
| Net losses (gains) from sales of assets and business divestitures | — | | | 17 | | | (14) | |
| Stock-based compensation | 62 | | | 62 | | | 48 | |
| | | | | |
| Change in operating assets and liabilities: | | | | | |
| Accounts receivable | (110) | | | (98) | | | (436) | |
| Inventories | (77) | | | (16) | | | (412) | |
| Prepaid expenses and other assets | (36) | | | 101 | | | (158) | |
| Trade accounts payable | 20 | | | (65) | | | 225 | |
| Operating lease liabilities | (96) | | | (88) | | | (76) | |
| Accrued liabilities | 20 | | | (91) | | | 218 | |
| Income taxes – net | (3) | | | (4) | | | 42 | |
| Other non-current liabilities | 6 | | | 6 | | | (19) | |
| | | | | |
| Net cash provided by operating activities | 2,111 | | | 2,031 | | | 1,333 | |
| Cash flows from investing activities: | | | | | |
| Capital expenditures | (541) | | | (445) | | | (256) | |
| Proceeds from sales of assets and business divestitures | 3 | | | 21 | | | 28 | |
| Other – net | 18 | | | 2 | | | (35) | |
| | | | | |
| | | | | |
| Net cash used in investing activities | (520) | | | (422) | | | (263) | |
| Cash flows from financing activities: | | | | | |
| Proceeds from debt | 503 | | | 7 | | | 16 | |
| Payments of debt | (39) | | | (37) | | | (15) | |
| Proceeds from stock options exercised | 30 | | | 34 | | | 26 | |
| | | | | |
| Payments for employee taxes withheld from stock awards | (50) | | | (37) | | | (23) | |
| Purchases of treasury stock | (1,201) | | | (850) | | | (603) | |
| Cash dividends paid | (421) | | | (392) | | | (370) | |
| Other – net | (2) | | | (3) | | | (3) | |
| Net cash used in financing activities | (1,180) | | | (1,278) | | | (972) | |
| Exchange rate effect on cash and cash equivalents | (35) | | | 4 | | | (14) | |
| Net change in cash and cash equivalents | 376 | | | 335 | | | 84 | |
| Cash and cash equivalents at beginning of year | 660 | | | 325 | | | 241 | |
| Cash and cash equivalents at end of period | $ | 1,036 | | | $ | 660 | | | $ | 325 | |
| Supplemental cash flow information: | | | | | |
| Cash payments for interest (net of amounts capitalized) | $ | 111 | | | $ | 109 | | | $ | 91 | |
| Cash payments for income taxes | $ | 606 | | | $ | 615 | | | $ | 479 | |
The accompanying notes are an integral part of these financial statements.
W.W. Grainger, Inc. and Subsidiaries
CONSOLIDATED STATEMENTS OF SHAREHOLDERS' EQUITY
(In millions of dollars, except for per share amounts)
| | | | | | | | | | | | | | | | | | | | | | | |
| Common Stock | Additional Contributed Capital | Retained Earnings | Accumulated Other Comprehensive Earnings (Losses) | Treasury Stock | Noncontrolling
Interest | Total |
| Balance at January 1, 2022 | $ | 55 | | $ | 1,270 | | $ | 9,500 | | $ | (96) | | $ | (8,855) | | $ | 286 | | $ | 2,160 | |
| Stock-based compensation | — | | 40 | | — | | — | | 12 | | 1 | | 53 | |
| Purchases of treasury stock | — | | — | | — | | — | | (602) | | (1) | | (603) | |
| Net earnings | — | | — | | 1,547 | | — | | — | | 66 | | 1,613 | |
| Other comprehensive earnings (losses) | — | | — | | — | | (84) | | — | | (34) | | (118) | |
| | | | | | | |
| Cash dividends paid ($6.78 per share) | — | | — | | (347) | | — | | — | | (23) | | (370) | |
| Balance at December 31, 2022 | $ | 55 | | $ | 1,310 | | $ | 10,700 | | $ | (180) | | $ | (9,445) | | $ | 295 | | $ | 2,735 | |
| Stock-based compensation | — | | 46 | | — | | — | | 12 | | 2 | | 60 | |
| Purchases of treasury stock | — | | — | | — | | — | | (852) | | (1) | | (853) | |
| Net earnings | — | | — | | 1,829 | | — | | — | | 74 | | 1,903 | |
| Other comprehensive earnings (losses) | — | | — | | — | | 8 | | — | | (21) | | (13) | |
| Capital contribution | — | | (1) | | — | | — | | — | | 3 | | 2 | |
| Cash dividends paid ($7.30 per share) | — | | — | | (367) | | — | | — | | (26) | | (393) | |
| Balance at December 31, 2023 | $ | 55 | | $ | 1,355 | | $ | 12,162 | | $ | (172) | | $ | (10,285) | | $ | 326 | | $ | 3,441 | |
| Stock-based compensation | — | | 47 | | — | | — | | (5) | | 1 | | 43 | |
| Purchases of treasury stock | — | | — | | — | | — | | (1,209) | | (1) | | (1,210) | |
| Net earnings | — | | — | | 1,909 | | — | | — | | 80 | | 1,989 | |
| Other comprehensive earnings (losses) | — | | — | | — | | (102) | | — | | (36) | | (138) | |
| Capital contribution | — | | (3) | | — | | — | | — | | 3 | | — | |
| Cash dividends paid ($8.01 per share) | — | | — | | (394) | | — | | — | | (28) | | (422) | |
| Balance at December 31, 2024 | $ | 55 | | $ | 1,399 | | $ | 13,677 | | $ | (274) | | $ | (11,499) | | $ | 345 | | $ | 3,703 | |
The accompanying notes are an integral part of these financial statements.
NOTE 1 - SUMMARY OF SIGNIFICANT ACCOUNTING POLICIES
W.W. Grainger, Inc. is a broad line distributor of maintenance, repair and operating (MRO) products and services with operations primarily in North America, Japan and the United Kingdom (U.K.). In this report, the words “Grainger” or “Company” mean W.W. Grainger, Inc. and its subsidiaries, except where the context makes it clear that the reference is only to W.W. Grainger, Inc. itself and not its subsidiaries.
Principles of Consolidation
The Consolidated Financial Statements include the accounts of the Company and its subsidiaries over which the Company exercises control. All significant intercompany transactions are eliminated from the Consolidated Financial Statements. The Company has a controlling ownership interest in MonotaRO, the endless assortment business in Japan, with the residual representing the noncontrolling interest.
The Company reports MonotaRO on a one-month calendar lag allowing for the timely preparation of financial statements. This one-month reporting lag is with the exception of significant transactions or events that occur during the intervening period.
Use of Estimates
The preparation of the Company's Consolidated Financial Statements in conformity with U.S. generally accepted accounting principles requires management to make estimates and assumptions affecting reported amounts in the Consolidated Financial Statements and accompanying notes. Actual results may differ from those estimates.
Foreign Currency Translation
The U.S. dollar is the Company's reporting currency for all periods presented. The financial statements of the Company’s foreign operating subsidiaries are measured using the local currency as the functional currency. Assets and liabilities of the Company’s foreign operating subsidiaries are translated into U.S. dollars at the exchange rate in effect at the balance sheet date. Revenues and expenses are translated at average rates in effect during the period. Translation gains or losses are recorded as a separate component of other comprehensive earnings (losses).
Revenue Recognition
The Company recognizes revenue when a sales arrangement with a customer exists (e.g., contract, purchase orders, others), the transaction price is fixed or determinable and the Company has satisfied its performance obligation per the sales arrangement.
The majority of Company revenue originates from contracts with a single performance obligation to deliver products, whereby performance obligations are satisfied when control of the product is transferred to the customer per the arranged shipping terms. Some Company contracts contain a combination of product sales and services, which are distinct and accounted for as separate performance obligations and are satisfied when the services are rendered. Total service revenue is not material and accounted for approximately 1% of the Company's revenue for the years ended December 31, 2024, 2023 and 2022.
The Company’s revenue is measured at the determinable transaction price, net of any variable considerations granted to customers and any taxes collected from customers and subsequently remitted to governmental authorities. Variable considerations include rights to return products and sales incentives, which primarily consist of volume rebates. These variable considerations are estimated throughout the year based on various factors, including contract terms, historical experience and performance levels. Total accrued sales returns were approximately $52 million as of December 31, 2024 and 2023, and are reported as a reduction of Accounts receivable – net. Total accrued sales incentives were approximately $109 million and $114 million as of December 31, 2024 and 2023, respectively, and are reported as part of Accrued expenses.
The Company records a contract asset when it has a right to payment from a customer that is conditioned on events other than the passage of time. The Company also records a contract liability when customers prepay but the Company has not yet satisfied its performance obligation. The Company did not have any material unsatisfied performance obligations, contract assets or liabilities as of December 31, 2024 and 2023.
Cost of Goods Sold (COGS)
COGS, exclusive of depreciation and amortization, includes the purchase cost of goods sold net of vendor considerations, in-bound shipping costs, outbound shipping and handling costs and service costs. The Company receives vendor considerations, such as rebates to promote their products, which are generally recorded as a reduction to COGS. Rebates earned from vendors that are based on product purchases are capitalized into inventory and rebates earned based on products sold are credited directly to COGS. Total accrued vendor rebates were $150 million and $155 million as of December 31, 2024 and 2023, respectively, and are reported in Trade accounts payable.
Selling, General and Administrative Expenses (SG&A)
Company SG&A is primarily comprised of payroll and benefits, advertising, depreciation and amortization, lease, indirect purchasing, supply chain and branch operations, technology, and selling expenses, as well as other types of general and administrative costs.
Advertising
Advertising costs, which include online marketing, are generally expensed in the year the related advertisement is first presented or when incurred. Total advertising expense was $750 million, $638 million and $519 million for 2024, 2023 and 2022, respectively.
Stock Incentive Plans
The Company measures all share-based payments using fair-value-based methods and records compensation expense on a straight-line basis over the vesting periods, net of estimated forfeitures.
Income Taxes
The Company recognizes the provision for income taxes using the asset and liability method, under which deferred tax assets and liabilities are recognized for the expected future tax consequences of temporary differences between the financial reporting and tax basis of assets and liabilities, and for operating losses and tax credit carryforwards. Deferred tax assets and liabilities are measured using the currently enacted tax rates that apply to taxable income in effect for the years in which those tax assets are expected to be realized or settled. Also, the Company evaluates deferred income taxes to determine if valuation allowances are required using a “more likely than not” standard. This assessment considers the nature, frequency and amount of book and taxable income and losses, the duration of statutory carryback and forward periods, future reversals of existing taxable temporary differences and tax planning strategies, among other matters.
The Company recognizes tax benefits from uncertain tax positions only if (based on the technical merits of the position) it is more likely than not that the tax positions will be sustained on examination by the tax authority. The Company recognizes interest expense and penalties to its tax uncertainties in the provision for income taxes.
Other Comprehensive Earnings (Losses)
The Company's Other comprehensive earnings (losses) include foreign currency translation adjustments and unrecognized gains (losses) on postretirement and other employment-related benefit plans. Accumulated other comprehensive earnings (losses) (AOCE) are presented separately as part of shareholders' equity.
Cash and Cash Equivalents
The Company considers cash equivalents to be short term, highly liquid investments that are both readily convertible to known amounts of cash and so near their maturity that they present insignificant risk of changes in value because of changes in interest rates.
Concentration of Credit Risk
The Company places temporary cash investments with institutions of high credit quality and, by policy, limits the amount of credit exposure to any one institution. Also, the Company has a broad customer base representing many diverse industries across North America, Japan and U.K. Consequently, no significant concentration of credit risk is considered to exist.
Accounts Receivable and Allowance for Credit Losses
The Company’s accounts receivable arises primarily from sales on credit to customers and are stated at their estimated net realizable value. The Company establishes allowances for credit losses on customer accounts that are potentially uncollectible. These allowances are determined based on several factors, including the age of the receivables, historical collection trends and economic conditions that may have an impact on a specific industry, group of customers or a specific customer.
The Company establishes an allowance for credit losses to present the net amount of accounts receivable expected to be collected. The allowance is determined by using the loss-rate method, which requires an estimation of loss rates based upon historical loss experience adjusted for factors that are relevant to determining the expected collectability of accounts receivable. Some of these factors include macroeconomic conditions that correlate with historical loss experience, delinquency trends, aging behavior of receivables and credit and liquidity quality indicators for industry groups, customer classes or individual customers.
Inventories
Company inventories primarily consist of merchandise purchased for resale. The Company uses the last-in, first-out (LIFO) method, valued at the lower of cost or market, to account for approximately 79% of total inventory and the first-in, first-out (FIFO) method, valued at the lower of cost or net realizable value, for the remaining inventory. The Company regularly reviews inventory to evaluate continued demand and records excess and obsolete provisions representing the difference between excess and obsolete inventories and market value. Estimated market value considers various variables, including product demand, aging and shelf life, market conditions, and liquidation or disposition history and values.
If FIFO had been used for all of the Company’s inventories, they would have been $804 million and $770 million higher than reported as of December 31, 2024 and December 31, 2023, respectively. Concurrently, net earnings would have increased by $26 million, $58 million and $139 million for the years ended December 31, 2024, 2023 and 2022, respectively.
Property, Buildings and Equipment
Property, buildings and equipment are stated at cost, less accumulated depreciation. Depreciation is computed over the estimated useful lives of the asset classes using the straight-line method. Useful lives for buildings, structures and improvements range from 10 to 50 years and furniture, fixtures, machinery and equipment from 3 to 15 years. Amounts expended for maintenance and repairs are charged to expense as incurred.
Long-Lived Assets
The carrying value of long-lived assets, primarily property, buildings and equipment and amortizable intangibles, is evaluated whenever events or changes in circumstances indicate that the carrying value of the asset group may be impaired. An impairment loss is recognized when estimated undiscounted future cash flows resulting from use of the asset, including disposition, are less than their carrying value. Impairment is measured as the amount by which the asset's carrying amount exceeds the fair value.
Leases
The Company leases certain properties, buildings and equipment (including branches, warehouses, DCs and office space) under various arrangements which provide the right to use the underlying asset and require lease payments for the lease term. The Company determines if an arrangement contains a lease at inception. Leases with an initial term of more than 12 months are recorded on the balance sheet as right-of-use (ROU) assets representing the right to use the underlying asset for the lease term and the corresponding current and long-term lease liabilities representing the obligation to make lease payments arising from the lease.
ROU assets and lease liabilities are recognized at the lease commencement or possession date based on the present value of lease payments over the lease term and include options to extend or terminate the lease when they are reasonably certain to be exercised. The present value of lease payments is determined using the incremental borrowing rate based on the information available at the lease commencement date. The incremental borrowing rate, the ROU asset and the lease liability are re-evaluated upon a lease modification.
Certain lease agreements include variable lease payments that primarily include payments for non-lease components including pass-through operating expenses such as certain maintenance costs and utilities, and
payments for non-components such as real estate taxes and insurance. Lease agreements with fixed lease and non-lease components are generally accounted for as a single lease component for all underlying classes of assets. Certain of the Company’s lease arrangements contain renewal provisions from 1 to 30 years, exercisable at the Company's option. The Company’s lease agreements do not contain any material residual value guarantees or material restrictive covenants.
The Company’s operating lease expense is recognized on a straight-line basis over the lease term and is recorded in SG&A.
Goodwill and Other Intangible Assets
In a business acquisition, the Company recognizes goodwill as the excess purchase price of an acquired reporting unit over the net amount assigned to assets acquired including intangible assets and liabilities assumed. Acquired intangibles include both assets with indefinite lives and assets that are subject to amortization, which are amortized straight-line over their estimated useful lives.
The Company tests goodwill and indefinite-lived intangibles for impairment annually during the fourth quarter and more frequently if impairment indicators exist. The Company performs qualitative assessments of significant events and circumstances, such as reporting units' historical and current results, assumptions regarding future performance, strategic initiatives and overall economic factors to determine the existence of impairment indicators and assess if it is more likely than not that the fair value of the reporting unit or indefinite-lived intangible asset is less than its carrying value that would necessitate a quantitative impairment test. In the quantitative test, Grainger compares the carrying value of the reporting unit or an indefinite-lived intangible asset with its fair value. Any excess of the carrying value over fair value is recorded as an impairment charge, presented as part of SG&A.
The fair value of reporting units is calculated primarily using the discounted cash flow method and utilizing value indicators from a market approach to evaluate the reasonableness of the resulting fair values. Estimates of market-participant risk-adjusted weighted average cost of capital are used as a basis for determining the discount rates to apply to the reporting units’ future expected cash flows and terminal value.
The Company’s indefinite-lived intangibles are primarily trade names. The fair value of trade names is calculated primarily using the relief-from-royalty method, which estimates the expected royalty savings attributable to the ownership of the trade name asset. The key assumptions when valuing a trade name are the revenue base, the royalty rate and the discount rate.
Additionally, the Company capitalizes certain costs related to the purchase and development of internal-use software, which are presented as intangible assets. Amortization of capitalized software is on a straight-line basis over 3 or 5 years.
Accounting for Derivative Instruments
The Company recognizes all derivative instruments as assets or liabilities in the Consolidated Balance Sheets at fair value. The accounting for changes in the fair value of a derivative instrument depends on whether it has been designated and qualifies as part of a hedging relationship and, further, on the type of hedging relationship.
To qualify for hedge accounting, a derivative must be highly effective at reducing the risk associated with the exposure being hedged. In addition, for a derivative to be designated as a hedge, the risk management objective and strategy must be documented. Hedge documentation must identify the derivative hedging instrument, the asset or liability or forecasted transaction, type of risk to be hedged, and how the effectiveness of the derivative is assessed prospectively and retrospectively. To assess effectiveness, the Company uses statistical methods and qualitative comparisons of critical terms. The extent to which a derivative has been and is expected to continue to be highly effective at offsetting changes in the fair value or cash flows of the hedged item is assessed and documented periodically. If it is determined that a derivative is not highly effective at hedging the designated exposure, hedge accounting is discontinued. For those derivative instruments that are designated and qualify as hedging instruments, the Company classifies them as fair value hedges or cash flow hedges.
Contingencies
The Company records a liability when a particular contingency is both probable and estimable. If the probable loss cannot be reasonably estimated, no accrual is recorded, but the loss contingency and the reasons to the effect that
it cannot be reasonably estimated are disclosed. If a loss is reasonably possible, the Company will provide disclosure to that effect.
For further discussion on the Company's contingencies, see Note 13.
New Accounting Standards
Accounting Pronouncements Recently Adopted
In November 2023, the FASB issued Accounting Standards Update (ASU) 2023-07, Segment Reporting (Topic 280): Improvements to Reportable Segment Disclosures. This update requires public entities to disclose significant segment expenses and other segment items on an annual and interim basis. The effective date is for fiscal years beginning after December 15, 2023, with the option to early adopt prior to the effective date and requires application on a retrospective basis. The Company adopted this ASU effective December 31, 2024 on a retrospective basis and it did not have a material impact on the Consolidated Financial Statements. For the related segment reporting disclosure, see Note 12.
Accounting Pronouncements Recently Issued
In December 2023, the FASB issued ASU 2023-09, Income Taxes (Topic 740): Improvements to Income Tax Disclosures. This update requires public entities to disclose consistent categories and greater disaggregation of information in the rate reconciliation, and income taxes paid disaggregated by jurisdiction. The effective date is for fiscal years beginning after December 15, 2024, with the option to early adopt prior to the effective date and should be applied on prospective basis, but retrospective application is permitted. The Company is evaluating the impact of the requirements on the related income tax disclosures.
In November 2024, the FASB issued ASU 2024-03, Income Statement - Reporting Comprehensive Income - Expense Disaggregation Disclosures (Subtopic 220-40): Disaggregation of Income Statement Expenses. This update requires public entities to disclose required information for inventory purchases, employee compensation, depreciation, intangible asset amortization and selling expense. The effective date is for fiscal years beginning after December 15, 2026, with the option to early adopt prior to the effective date and should be applied on prospective basis, but retrospective application is permitted. The Company is evaluating the impact of the requirements on the related income statement line items disclosures.
NOTE 2 - REVENUE
Grainger serves a large number of customers in diverse industries, which are subject to different economic and market-specific factors. The Company's revenue is primarily comprised of MRO product sales and related activities.
The Company's presentation of revenue by segment and customer industry most reasonably depicts how the nature, amount, timing and uncertainty of the Company's revenue and cash flows are affected by economic and market-specific factors. The majority of Company revenue originates from contracts with a single performance obligation to deliver products, whereby performance obligations are satisfied when control of the product is transferred to the customer per the arranged shipping terms.
The following tables present the Company's percentage of revenue by reportable segment and by customer industry:
| | | | | | | | | | | | | | | | | | | | | | | | | | | | | | | | | | | | | | | | | | | | | | | | | | | | | |
| | Twelve Months Ended December 31, |
| 2024 | | 2023 | | 2022(1) |
| | High-Touch Solutions N.A. | | Endless Assortment | | Total Company (2) | | High-Touch Solutions N.A. | | Endless Assortment | | Total Company (2) | | High-Touch Solutions N.A. | | Endless Assortment | | Total Company (2) |
| Manufacturing | 31 | % | | 29 | % | | 31 | % | | 30 | % | | 30 | % | | 30 | % | | 31 | % | | 30 | % | | 30 | % |
| Government | 19 | % | | 3 | % | | 16 | % | | 19 | % | | 3 | % | | 16 | % | | 18 | % | | 3 | % | | 15 | % |
| Wholesale | 7 | % | | 18 | % | | 9 | % | | 7 | % | | 16 | % | | 9 | % | | 7 | % | | 16 | % | | 9 | % |
| Commercial Services | 7 | % | | 12 | % | | 8 | % | | 7 | % | | 12 | % | | 8 | % | | 7 | % | | 13 | % | | 8 | % |
| Contractors | 5 | % | | 12 | % | | 6 | % | | 5 | % | | 12 | % | | 6 | % | | 5 | % | | 12 | % | | 6 | % |
| Healthcare | 7 | % | | 2 | % | | 6 | % | | 7 | % | | 2 | % | | 6 | % | | 7 | % | | 2 | % | | 6 | % |
| Retail | 4 | % | | 4 | % | | 4 | % | | 4 | % | | 4 | % | | 4 | % | | 4 | % | | 4 | % | | 4 | % |
| Transportation | 4 | % | | 2 | % | | 4 | % | | 4 | % | | 2 | % | | 4 | % | | 4 | % | | 2 | % | | 4 | % |
| Utilities | 3 | % | | 2 | % | | 3 | % | | 3 | % | | 2 | % | | 3 | % | | 3 | % | | 2 | % | | 3 | % |
| Warehousing | 3 | % | | — | % | | 2 | % | | 4 | % | | — | % | | 3 | % | | 5 | % | | — | % | | 4 | % |
Other(3) | 10 | % | | 16 | % | | 11 | % | | 10 | % | | 17 | % | | 11 | % | | 9 | % | | 16 | % | | 11 | % |
| Total net sales | 100 | % | | 100 | % | | 100 | % | | 100 | % | | 100 | % | | 100 | % | | 100 | % | | 100 | % | | 100 | % |
| Percent of total company revenue | 80 | % | | 18 | % | | 100 | % | | 81 | % | | 18 | % | | 100 | % | | 80 | % | | 18 | % | | 100 | % |
| | | | | | | | | | | | |
(1) Customer industry results for the twelve months ended December 31, 2022 were reclassified to reflect the Company's current classifications, which primarily uses the North American Industry Classification System (NAICS) beginning January 1, 2023. |
(2) Total Company includes Other, which includes the Cromwell business. Other accounts for approximately 2%, 1% and 2% of revenue for the twelve months ended December 31, 2024, 2023 and 2022, respectively. |
(3) Other primarily includes revenue from industries and customers that are not material individually, including hospitality, restaurants, property management and natural resources. |
NOTE 3 - PROPERTY, BUILDINGS AND EQUIPMENT
Grainger's property, buildings and equipment consisted of the following (in millions of dollars):
| | | | | | | | | | | |
| | As of |
| | December 31, 2024 | | December 31, 2023 |
| Land and land improvements | $ | 415 | | | $ | 397 | |
| Building, structures and improvements | 1,723 | | | 1,469 | |
| Furniture, fixtures, machinery and equipment | 1,945 | | | 1,852 | |
| Property, buildings and equipment | $ | 4,083 | | | $ | 3,718 | |
| Less: Accumulated depreciation and amortization | 2,156 | | | 2,060 | |
| Property, buildings and equipment, net | $ | 1,927 | | | $ | 1,658 | |
Depreciation expense on property, buildings and equipment was $164 million, $146 million and $139 million for the years ended December 31, 2024, 2023 and 2022, respectively.
NOTE 4 - GOODWILL AND OTHER INTANGIBLE ASSETS
Grainger completed its annual impairment testing of goodwill and intangible assets during the fourth quarter of 2024 and 2023. Based on the results of that testing, the Company did not identify any significant events or changes in circumstances that indicated the existence of impairment indicators and concluded that it was more likely than not that the fair value of the reporting units exceeded their carrying amounts at each respective period.
High-Touch Solutions N.A. – Canada Business
As of December 31, 2024 and 2023, the Canada business reporting unit had goodwill of $114 million and $124 million, respectively. As part of our annual impairment testing, the Company compared the current results to forecasted expectations of the most recent quantitative analysis, along with analyzing macroeconomic conditions, current industry trends and transactions, and other market data of industry peers. The Company also performed various sensitivities over key assumptions, including projections of future revenue growth and operating expenditures used in the analysis. The Company did not identify any significant events or changes in circumstances that indicated the existence of impairment indicators for its Canada business, and concluded it was more likely than not its fair value exceeded its carrying value.
The Company's balances and changes in the carrying amount of goodwill by segment are as follows (in millions of dollars):
| | | | | | | | | | | | | | | | | | | | | | |
| | High-Touch Solutions N.A. | | Endless Assortment | | | | Total |
| Balance at December 31, 2022 | | $ | 313 | | | $ | 58 | | | | | $ | 371 | |
| | | | | | | | |
| | | | | | | | |
| Translation | | 2 | | | (3) | | | | | (1) | |
| Balance at December 31, 2023 | | 315 | | | 55 | | | | | 370 | |
| | | | | | | | |
| | | | | | | | |
| Translation | | (9) | | | (6) | | | | | (15) | |
| Balance at December 31, 2024 | | $ | 306 | | | $ | 49 | | | | | $ | 355 | |
Grainger's cumulative goodwill impairment as of December 31, 2024, was $137 million. No goodwill impairment was recorded for the twelve months ended December 31, 2024, 2023 and 2022.
The balances and changes in intangible assets – net are as follows (in millions of dollars):
| | | | | | | | | | | | | | | | | | | | | | | | | | | | | | | | | | | | | | | | | |
| | | As of December 31, |
| | | 2024 | | 2023 |
| Weighted average life | | Gross carrying amount | | Accumulated amortization | | Net carrying amount | | Gross carrying amount | | Accumulated amortization | | Net carrying amount |
| Customer lists and relationships | 10.7 years | | $ | 164 | | | $ | 155 | | | $ | 9 | | | $ | 166 | | | $ | 153 | | | $ | 13 | |
| Trademarks, trade names and other | 14.9 years | | 31 | | | 24 | | | 7 | | | 31 | | | 23 | | | 8 | |
| Non-amortized trade names and other | Indefinite | | 18 | | | — | | | 18 | | | 20 | | | — | | | 20 | |
| Capitalized software | 4.3 years | | 714 | | | 505 | | | 209 | | | 659 | | | 466 | | | 193 | |
| Total intangible assets | 6.1 years | | $ | 927 | | | $ | 684 | | | $ | 243 | | | $ | 876 | | | $ | 642 | | | $ | 234 | |
Amortization expense of intangible assets recorded in SG&A was $70 million, $64 million and $61 million for the years ended December 31, 2024, 2023 and 2022, respectively.
Estimated amortization expense for future periods is as follows (in millions of dollars):
| | | | | | | | |
| Year | | Expense |
| 2025 | | $ | 76 | |
| 2026 | | 62 | |
| 2027 | | 48 | |
| 2028 | | 30 | |
| 2029 | | 9 | |
| Thereafter | | — | |
| Total | | $ | 225 | |
NOTE 5 - DEBT
Total debt, including long-term, current maturities and debt issuance costs and discounts – net, consisted of the following (in millions of dollars):
| | | | | | | | | | | | | | | | | | | | | | | |
| As of December 31, |
| | 2024 | | 2023 |
| Carrying Value | | Fair Value | | Carrying Value | | Fair Value |
| 4.60% senior notes due 2045 | $ | 1,000 | | | $ | 894 | | | $ | 1,000 | | | $ | 967 | |
| 1.85% senior notes due 2025 | — | | | — | | | 500 | | | 483 | |
| 4.45% senior notes due 2034 | 500 | | | 477 | | | — | | | — | |
| 3.75% senior notes due 2046 | 400 | | | 332 | | | 400 | | | 336 | |
| 4.20% senior notes due 2047 | 400 | | | 312 | | | 400 | | | 361 | |
| Debt issuance costs – net of amortization and other | (21) | | | (21) | | | (34) | | | (34) | |
| Long-term debt | 2,279 | | | 1,994 | | | 2,266 | | | 2,113 | |
| 1.85% senior notes due 2025 | 500 | | | 498 | | | — | | | — | |
| Japanese yen term loan | — | | | — | | | 32 | | | 32 | |
| Other | (1) | | | (1) | | | 2 | | | 2 | |
| Current maturities | $ | 499 | | | $ | 497 | | | $ | 34 | | | $ | 34 | |
| Total debt | $ | 2,778 | | | $ | 2,491 | | | $ | 2,300 | | | $ | 2,147 | |
Revolving Credit Facility
In October 2023, the Company entered into a five-year unsecured revolving credit facility agreement (2023 Credit Facility). Grainger may obtain loans in various currencies on a revolving basis in an aggregate amount not exceeding $1.25 billion, which may be increased up to $1.875 billion at the request of the Company, subject to obtaining additional commitments and other customary conditions. The primary purpose of the 2023 Credit Facility is to support the Company's commercial paper program and for general corporate purposes.
There were no borrowings outstanding under the Company's 2023 Credit Facility as of December 31, 2024 and 2023.
Senior Notes
In the years 2015-2020, Grainger issued $2.3 billion in unsecured long-term debt (Senior Notes) primarily to provide flexibility in funding general working capital needs, share repurchases and long-term cash requirements. The Senior Notes require no principal payments until maturity and interest is paid semi-annually.
In September 2024, Grainger issued $500 million in unsecured 4.45% Senior Notes (4.45% Notes). Grainger intends to use the net proceeds from this offering to repay the 1.85% Senior Notes that mature in February 2025 and any remaining net proceeds for general corporate purposes. The 4.45% Notes mature in September 2034, require no principal payments until maturity, and interest is paid semi-annually in arrears, beginning March 15, 2025.
The Company incurred debt issuance costs related to the Senior Notes representing underwriting fees and other expenses. These costs were recorded as a contra-liability in Long-term debt and are being amortized over the term of the Senior Notes using the straight-line method to Interest expense – net. As of December 31, 2024 and 2023, the unamortized costs were $22 million and $19 million, respectively.
Grainger uses interest rate swaps with an outstanding notional amount of $450 million as of December 31, 2024 and 2023, to hedge a portion of the interest rate risk associated with the 1.85% Senior Notes. These derivative instruments qualified and were designated for fair value hedge accounting treatment. Under this method, the resulting carrying value adjustments as of December 31, 2024 and 2023, are presented in Other in the table above and the estimated fair value of the interest rate swaps, based on Level 2 inputs within the fair value hierarchy, are reported on the Consolidated Balance Sheets in Other non-current liabilities.
The gain or loss on the interest rate swaps as well as the offsetting gain or loss on the 1.85% Senior Notes, are recognized in the Consolidated Statements of Earnings in Interest expense – net and the effect for the twelve months ended December 31, 2024 and 2023 was not material.
MonotaRO Term Loan
In August 2020, MonotaRO Co., Ltd (MonotaRO) entered into a ¥9 billion term loan agreement to fund technology investments and the expansion of its distribution center (DC) network. In the third quarter of 2024, the term loan was paid in full.
Fair Value
The estimated fair value of the Company’s senior notes was based on available external pricing data and current market rates for similar debt instruments, among other factors, which are classified as Level 2 inputs within the fair value hierarchy.
The Company's debt instruments include affirmative and negative covenants that are usual and customary for companies with similar credit ratings and do not contain any financial performance covenants. The Company was in compliance with all debt covenants as of December 31, 2024 and 2023.
The Company's foreign subsidiaries utilize various financing sources for working capital purposes and other operating needs. These financing sources in aggregate were not material as of December 31, 2024 and 2023.
The scheduled aggregate principal payments required on the Company's indebtedness, based on the maturity dates defined within the debt arrangements, for the succeeding five years, excluding debt issuance costs and the impact of derivatives, are due as follows (in millions of dollars):
| | | | | | | | |
| Year | | Payment Amount |
| 2025 | | $ | 502 | |
| 2026 | | 1 | |
| 2027 | | — | |
| 2028 | | — | |
| 2029 | | — | |
| Thereafter | | 2,300 | |
| Total | | $ | 2,803 | |
NOTE 6 - EMPLOYEE BENEFITS
The Company provides various retirement benefits to eligible team members, including contributions to defined contribution plans, pension benefits associated with defined benefit plans, postretirement medical benefits and other benefits. Eligibility requirements and benefit levels vary depending on team member location. Various foreign benefit plans cover team members in accordance with local legal requirements.
Defined Contribution Plans
A majority of the Company's U.S. team members are covered by a retirement savings plan, which provides for an automatic contribution equal to 6% of the eligible team member's total eligible compensation. The total retirement savings plan expense was $91 million, $85 million, and $87 million for 2024, 2023 and 2022, respectively.
The Company sponsors additional defined contribution plans available to certain U.S. and foreign team members for which contributions are made by the Company and participating team members. The expense associated with these defined contribution plans totaled $20 million, $21 million and $11 million for 2024, 2023 and 2022, respectively.
Postretirement Healthcare Benefits Plans
The Company has a postretirement healthcare benefit plan that provides coverage for certain U.S. team members. Covered team members become eligible for participation when they qualify for retirement while working for the Company. Participation in the plan is voluntary and requires participants to make contributions toward the cost of the plan, as determined by the Company.
The net periodic benefits costs were valued with a measurement date of January 1 for each year and consisted of the following components (in millions of dollars):
| | | | | | | | | | | | | | | | | |
| For the Years Ended December 31, |
| 2024 | | 2023 | | 2022 |
| SG&A | | | | | |
| Service cost | $ | 2 | | | $ | 2 | | | $ | 4 | |
| Other (income) expense | | | | | |
| Interest cost | 5 | | | 5 | | | 4 | |
| Expected return on assets | (7) | | | (6) | | | (8) | |
| Amortization of prior service credit | (9) | | | (10) | | | (10) | |
| Amortization of unrecognized gains | (8) | | | (7) | | | (9) | |
| Net periodic benefits | $ | (17) | | | $ | (16) | | | $ | (19) | |
Reconciliations of the beginning and ending balances of the postretirement benefit asset, which is calculated as of December 31 measurement date, the fair value of plan assets available for benefits and the funded status of the benefit asset follow (in millions of dollars):
| | | | | | | | | | | |
| 2024 | | 2023 |
| Benefit obligation at beginning of year | $ | 114 | | | $ | 112 | |
| Service cost | 2 | | | 2 | |
| Interest cost | 5 | | | 5 | |
| Plan participants' contributions | 3 | | | 3 | |
| Actuarial (gain) loss | (12) | | | 2 | |
| Benefits paid | (9) | | | (10) | |
| Benefit obligation at end of year | $ | 103 | | | $ | 114 | |
| | | |
| Plan assets available for benefits at beginning of year | $ | 173 | | | $ | 162 | |
| Actual returns on plan assets | 11 | | | 18 | |
| Plan participants' contributions | 3 | | | 3 | |
| Benefits paid | (9) | | | (10) | |
| Plan assets available for benefits at end of year | 178 | | | 173 | |
| | | |
| Noncurrent postretirement benefit asset | $ | 75 | | | $ | 59 | |
The amounts recognized in AOCE consisted of the following (in millions of dollars):
| | | | | | | | | | | |
| As of December 31, |
| 2024 | | 2023 |
| Prior service credit | $ | 13 | | | $ | 23 | |
| Unrecognized gains | 88 | | | 79 | |
| Deferred tax liability | (25) | | | (25) | |
| Net accumulated gains | $ | 76 | | | $ | 77 | |
The Company has elected to amortize the amount of net unrecognized gains over a period equal to the average remaining service period for active plan participants expected to retire and receive benefits of approximately 10 years for 2024.
The postretirement benefit obligation is determined by applying the terms of the plan and actuarial models. These models include various actuarial assumptions, including discount rates, long-term rates of return on plan assets, healthcare cost trend rate, mortality and cost-sharing between the Company and the retirees. The actuarial gain recognized during the plan year is primarily related to the change in discount rate assumption.
The following assumptions were used to determine net periodic benefit costs as of January 1:
| | | | | | | | | | | | | | | | | |
| For the Years Ended December 31, |
| 2024 | | 2023 | | 2022 |
| Discount rate | 4.73 | % | | 4.92 | % | | 2.57 | % |
| Expected long-term rate of return on plan assets – net of tax | 4.04 | % | | 4.04 | % | | 4.04 | % |
| Initial healthcare cost trend rate (pre age 65) | 7.20 | % | | 7.50 | % | | 6.50 | % |
| Ultimate healthcare cost trend rate | 4.50 | % | | 4.50 | % | | 4.50 | % |
| Year ultimate healthcare cost trend rate reached | 2033 | | 2033 | | 2030 |
The following assumptions were used to determine benefit obligations as of December 31:
| | | | | | | | | | | | | | | | | |
| 2024 | | 2023 | | 2022 |
| Discount rate | 5.39 | % | | 4.73 | % | | 4.92 | % |
| Expected long-term rate of return on plan assets – net of tax | 4.04 | % | | 4.04 | % | | 4.04 | % |
| Initial healthcare cost trend rate (pre age 65) | 6.90 | % | | 7.20 | % | | 7.50 | % |
| Ultimate healthcare cost trend rate | 4.50 | % | | 4.50 | % | | 4.50 | % |
| Year ultimate healthcare cost trend rate reached | 2033 | | 2033 | | 2033 |
The Company's investment strategy reflects the long-term nature of the plan obligation and seeks to reach a balance allocation between Fixed Income securities and Equities of approximately 65% and 35%, respectively. Current allocations may differ from targeted allocations based on investment results and other timing factors. The plan's assets are stated at fair value, which represents the net asset value of shares held by the plan in the registered investment companies at the quoted market prices (Level 1 input) or at significant other observable inputs (Level 2 input).
The plan assets available for benefits consisted of the following as of December 31 (in millions of dollars):
| | | | | | | | | | | |
| 2024 | | 2023 |
| Asset class | | | |
| Level 1 inputs: | | | |
| | | |
| Mutual funds - corporate bonds fund | 10 | | | 10 | |
| Level 2 Inputs: | | | |
| Fixed Income: | | | |
| Corporate bonds | 48 | | | 56 | |
| Government/municipal bonds | 8 | | | 9 | |
| Equity funds | 101 | | | 88 | |
| Plan assets | 167 | | | 163 | |
| Trust assets | 11 | | | 10 | |
| Plan assets available for benefits | $ | 178 | | | $ | 173 | |
The Company forecasts the following benefit payments related to postretirement (which include a projection for expected future team member service) for the next ten years (in millions of dollars):
| | | | | | | | |
| Year | | Estimated Gross Benefit Payments |
| 2025 | | $ | 9 | |
| 2026 | | 9 | |
| 2027 | | 9 | |
| 2028 | | 8 | |
| 2029 | | 8 | |
| 2030-2034 | | 41 | |
| Total | | $ | 84 | |
NOTE 7 - LEASES
The Company leases certain properties, buildings and equipment (including branches, warehouses, DCs and office space) under various arrangements which provide the right to use the underlying asset and require lease payments for the lease term. The Company’s lease portfolio consists mainly of operating leases that expire at various dates through 2037.
Information related to operating leases is as follows (in millions of dollars):
| | | | | | | | | | | | | | |
| | As of December 31, |
| | 2024 | | 2023 |
| Right-of-use assets | | | | |
| Operating lease right-of-use | | $ | 371 | | | $ | 429 | |
| | | | |
| | | | |
| | | | |
| Operating lease liabilities | | | | |
| Operating lease liability | | 78 | | | 71 | |
| Long-term operating lease liability | | 327 | | | 381 | |
| Total operating lease liabilities | | $ | 405 | | | $ | 452 | |
| | | | | | | | | | | | | | |
| | As of December 31, |
| | 2024 | | 2023 |
| Weighted average remaining lease term | | 6 years | | 7 years |
| Weighted average incremental borrowing rate | | 2.57 | % | | 2.19 | % |
| Cash paid for operating leases | | $ | 96 | | | $ | 88 | |
| Right-of-use assets obtained in exchange for operating lease obligations | | $ | 48 | | | $ | 161 | |
Rent expense was $103 million, $102 million and $93 million for 2024, 2023 and 2022, respectively. These amounts are net of sublease income of $2 million for 2024, 2023 and 2022.
The remaining maturity of existing lease liabilities as of December 31, 2024 are as follows (in millions of dollars):
| | | | | | | | |
| Year | | Operating Leases |
| 2025 | | $ | 91 | |
| 2026 | | 85 | |
| 2027 | | 72 | |
| 2028 | | 63 | |
| 2029 | | 50 | |
| Thereafter | | 76 | |
| Total lease payments | | 437 | |
| Less interest | | 32 | |
| Present value of lease liabilities | | $ | 405 | |
As of December 31, 2024 and 2023, the Company's finance leases and service contracts with lease arrangements were not material. Finance leases are reported in Property, buildings and equipment – net, and as a short and long-term finance lease liability in Accrued expenses and Other non-current liabilities.
NOTE 8 - STOCK INCENTIVE PLANS
The Company maintains stock incentive plans under which the Company may grant a variety of incentive awards to team members and executives, which include restricted stock units (RSUs), performance shares and deferred stock units. As of December 31, 2024, there were 1.4 million shares available for grant under the plans. When awards are exercised or settled, shares of the Company’s treasury stock are issued.
Pretax stock-based compensation expense included in SG&A was $62 million, $62 million, and $48 million in 2024, 2023 and 2022, respectively, and was primarily comprised of RSUs. Related income tax benefits recognized in earnings were $34 million, $34 million, and $19 million in 2024, 2023 and 2022, respectively.
Restricted Stock Units
The Company awards RSUs to certain team members and executives. RSUs vest generally over periods from one to seven years from issuance. The RSU grant date fair value is based on the closing price of the Company's common stock on the last trading day preceding the date of the grant. RSU expense for the years ended December 31, 2024, 2023 and 2022 was approximately $48 million, $43 million and $34 million, respectively.
The following table summarizes RSU activity (in millions of dollars, except for share and per share amounts):
| | | | | | | | | | | | | | | | | | | | | | | | | | |
| 2024 | | 2023 | | 2022 |
| Shares | Weighted
Average Price Per Share | | Shares | Weighted
Average Price Per Share | | Shares | Weighted
Average Price Per Share |
| Beginning nonvested units | 172,984 | | $ | 550.62 | | | 191,032 | | $ | 409.77 | | | 202,321 | | $ | 318.40 | |
| Issued | 57,012 | | $ | 1,008.98 | | | 81,174 | | $ | 692.02 | | | 96,940 | | $ | 520.67 | |
| Canceled | (10,221) | | $ | 701.36 | | | (7,943) | | $ | 512.31 | | | (17,038) | | $ | 345.30 | |
| Vested | (83,575) | | $ | 489.57 | | | (91,279) | | $ | 384.92 | | | (91,191) | | $ | 336.99 | |
| Ending nonvested units | 136,200 | | $ | 768.64 | | | 172,984 | | $ | 550.62 | | | 191,032 | | $ | 409.77 | |
| Fair Value of Shares Vested | $ | 41 | | | | $ | 35 | | | | $ | 31 | | |
As of December 31, 2024, there was $67 million of total unrecognized compensation expense related to nonvested RSUs the Company expects to recognize over a weighted average period of 2 years.
NOTE 9 - CAPITAL STOCK
The Company had no shares of preferred stock outstanding as of December 31, 2024 and 2023. The activity related to outstanding common stock and common stock held in treasury was as follows:
| | | | | | | | | | | | | | | | | | | | | | | | | | |
| 2024 | | 2023 | | 2022 |
| Outstanding Common Stock | Treasury Stock | | Outstanding Common Stock | Treasury Stock | | Outstanding Common Stock | Treasury Stock |
| Balance at beginning of period | 49,317,402 | | 60,341,817 | | | 50,256,323 | | 59,402,896 | | | 51,220,205 | | 58,439,014 | |
| Exercise of stock options | 113,274 | | (113,274) | | | 139,189 | | (139,189) | | | 101,802 | | (101,802) | |
| Settlement of restricted stock units – net of 39,118, 32,800 and 31,132 shares retained, respectively | 79,400 | | (79,400) | | | 83,795 | | (83,795) | | | 64,649 | | (64,649) | |
| Settlement of performance share units – net of 9,629, 18,521 and 10,359 shares retained, respectively | 15,110 | | (15,110) | | | 28,135 | | (28,135) | | | 13,890 | | (13,890) | |
| Purchase of treasury shares | (1,192,316) | | 1,192,316 | | | (1,190,040) | | 1,190,040 | | | (1,144,223) | | 1,144,223 | |
| Balance at end of period | 48,332,870 | | 61,326,349 | | | 49,317,402 | | 60,341,817 | | | 50,256,323 | | 59,402,896 | |
NOTE 10 - ACCUMULATED OTHER COMPREHENSIVE EARNINGS (LOSSES) (AOCE)
The components of AOCE consisted of the following (in millions of dollars):
| | | | | | | | | | | | | | | | | | | | | |
| Foreign Currency Translation and Other | Defined Postretirement Benefit Plan | Other Employment-related Benefit Plans | | Total | Foreign Currency Translation Attributable to Noncontrolling Interests | AOCE Attributable to W.W. Grainger, Inc. |
| Balance at December 31, 2022 – net of tax | $ | (320) | | $ | 82 | | $ | (6) | | | $ | (244) | | $ | (64) | | $ | (180) | |
| Other comprehensive earnings (loss) before reclassifications – net of tax | $ | (11) | | $ | 8 | | $ | 3 | | | $ | — | | $ | (21) | | $ | 21 | |
| Amounts reclassified to net earnings | $ | — | | $ | (13) | | $ | — | | | $ | (13) | | $ | — | | $ | (13) | |
| | | | | | | |
| Net current period activity | $ | (11) | | $ | (5) | | $ | 3 | | | $ | (13) | | $ | (21) | | $ | 8 | |
| Balance at December 31, 2023 – net of tax | $ | (331) | | $ | 77 | | $ | (3) | | | $ | (257) | | $ | (85) | | $ | (172) | |
| Other comprehensive earnings (loss) before reclassifications – net of tax | $ | (137) | | $ | 12 | | $ | — | | | $ | (125) | | $ | (36) | | $ | (89) | |
| Amounts reclassified to net earnings | $ | — | | $ | (13) | | $ | — | | | $ | (13) | | $ | — | | $ | (13) | |
| Net current period activity | $ | (137) | | $ | (1) | | $ | — | | | $ | (138) | | $ | (36) | | $ | (102) | |
| Balance at December 31, 2024 – net of tax | $ | (468) | | $ | 76 | | $ | (3) | | | $ | (395) | | $ | (121) | | $ | (274) | |
NOTE 11 - INCOME TAXES
Earnings before income taxes by geographical area consisted of the following (in millions of dollars):
| | | | | | | | | | | | | | | | | |
| For the Years Ended December 31, |
| 2024 | | 2023 | | 2022 |
| U.S. | $ | 2,265 | | | $ | 2,211 | | | $ | 1,903 | |
| Foreign | 319 | | | 289 | | | 243 | |
| Total | $ | 2,584 | | | $ | 2,500 | | | $ | 2,146 | |
Income tax expense consisted of the following (in millions of dollars):
| | | | | | | | | | | | | | | | | |
| For the Years Ended December 31, |
| 2024 | | 2023 | | 2022 |
| Current income tax expense: | | | | | |
| U.S. Federal | $ | 404 | | | $ | 431 | | | $ | 374 | |
| U.S. State | 84 | | | 100 | | | 77 | |
| Foreign | 89 | | | 81 | | | 78 | |
| Total current | 577 | | | 612 | | | 529 | |
| Deferred income tax (benefit) expense | 18 | | | (15) | | | 4 | |
| Total income tax expense | $ | 595 | | | $ | 597 | | | $ | 533 | |
The income tax effects of temporary differences that gave rise to the net deferred tax asset (liability) as of December 31, 2024 and 2023 were as follows (in millions of dollars):
| | | | | | | | | | | |
| As of December 31, |
| 2024 | | 2023 |
| Deferred tax assets: | | | |
| | | |
| Accrued expenses | 172 | | | 177 | |
| U.S. and foreign loss carryforwards | 82 | | | 84 | |
| Accrued employment-related benefits | 42 | | | 51 | |
| Tax credit carryforward | 20 | | | 22 | |
| Other | 23 | | | 30 | |
| | | |
| Deferred tax assets | 339 | | | 364 | |
| Less valuation allowance | (100) | | | (93) | |
| Deferred tax assets – net of valuation allowance | $ | 239 | | | $ | 271 | |
| Deferred tax liabilities: | | | |
| Property, buildings, equipment and other capital assets | (216) | | | (238) | |
| Intangibles | (55) | | | (58) | |
| Inventory | (16) | | | (11) | |
| Other | (14) | | | (11) | |
| | | |
| Deferred tax liabilities | (301) | | | (318) | |
| Net deferred tax liability | $ | (62) | | | $ | (47) | |
| | | |
| The net deferred tax asset (liability) is classified as follows: | | | |
| | | |
| Noncurrent assets | $ | 15 | | | $ | 10 | |
| Noncurrent liabilities (foreign) | (77) | | | (57) | |
| Net deferred tax liability | $ | (62) | | | $ | (47) | |
As of December 31, 2024 and 2023, the Company had $328 million and $335 million, respectively, of gross loss carryforwards related to foreign operations and U.S. transactions. Some of the loss carryforwards may expire at various dates through 2044. The Company has recorded a valuation allowance, which represents a provision for uncertainty as to the realization of the tax benefits of these carryforwards and deferred tax assets that may not be realized.
The Company's valuation allowance changed as follows (in millions of dollars):
| | | | | | | | | | | |
| For the Years Ended December 31, |
| 2024 | | 2023 |
| Balance at beginning of period | $ | (93) | | | $ | (71) | |
| Increases primarily related to foreign NOLs | (8) | | | (5) | |
| Releases primarily related to foreign NOLs | — | | | 1 | |
| | | |
| | | |
| Foreign exchange rate changes | 1 | | | (2) | |
| Decrease related to U.S. foreign tax credits | 2 | | | 3 | |
| Increase related to capital loss carryforwards | (1) | | | (19) | |
| Other changes – net | (1) | | | — | |
| Balance at end of period | $ | (100) | | | $ | (93) | |
A reconciliation of income tax expense with federal income taxes at the statutory rate follows (in millions of dollars):
| | | | | | | | | | | | | | | | | |
| For the Years Ended December 31, |
| 2024 | | 2023 | | 2022 |
| Federal income tax | $ | 543 | | | $ | 525 | | | $ | 451 | |
| State income taxes – net of federal income tax benefit | 68 | | | 74 | | | 64 | |
| | | | | |
| Stock compensation | (16) | | | (16) | | | (5) | |
| Foreign rate difference | 33 | | | 31 | | | 26 | |
| | | | | |
Change in valuation allowance(1) | 2 | | | 6 | | | 7 | |
| Other – net | (35) | | | (23) | | | (10) | |
| | | | | |
| Income tax expense | $ | 595 | | | $ | 597 | | | $ | 533 | |
| Effective tax rate | 23.0 | % | | 23.9 | % | | 24.8 | % |
| | | | | |
(1) Net of changes in related tax attributes. |
The decrease to the Company's effective tax rate for the year ended December 31, 2024 was primarily driven by the expiration of a statute of limitation period in 2024.
Foreign Undistributed Earnings
Estimated gross undistributed earnings of foreign subsidiaries as of December 31, 2024 and 2023, totaled $651 million and $544 million, respectively. The Company considers these undistributed earnings permanently reinvested in its foreign operations and is not recording a deferred tax liability for any foreign withholding taxes on such amounts. If at some future date the Company ceases to be permanently reinvested in its foreign subsidiaries, the Company may be subject to foreign withholding and other taxes on these undistributed earnings and may need to record a deferred tax liability for any outside basis difference in its investments in its foreign subsidiaries.
Tax Uncertainties
The Company recognizes in the financial statements a provision for tax uncertainties, resulting from application of complex tax regulations in multiple tax jurisdictions.
The changes in the liability for tax uncertainties, excluding interest, are as follows (in millions of dollars):
| | | | | | | | | | | | | | | | | |
| For the Years Ended December 31, |
| 2024 | | 2023 | | 2022 |
| Balance at beginning of year | $ | 42 | | | $ | 41 | | | $ | 38 | |
| Additions for tax positions related to the current year | 3 | | | 6 | | | 4 | |
| Additions for tax positions of prior years | — | | | 1 | | | 2 | |
| Reductions for tax positions of prior years | (1) | | | (1) | | | — | |
| Reductions due to statute lapse | (22) | | | (3) | | | (2) | |
| Settlements, audit payments, refunds – net | (1) | | | (2) | | | (1) | |
| Balance at end of year | $ | 21 | | | $ | 42 | | | $ | 41 | |
The Company classifies the liability for tax uncertainties in deferred income taxes and tax uncertainties. Included in
this amount is $4 million as of December 31, 2024, of tax positions for which the ultimate deductibility is highly certain but for which there is uncertainty about the timing of such deductibility. Any changes in the timing of deductibility of these items would not affect the annual effective tax rate but would accelerate the payment of cash to the taxing authorities to an earlier period. In 2024, 2023 and 2022, the changes to tax positions were primarily related to the impact of expiring statutes and current year state and local reserves.
The Company is regularly subject to examination of its federal income tax returns by the Internal Revenue Service (IRS). The Company’s 2021 and 2022 tax years are currently under IRS audit. Tax year 2023 is open. The Company is also subject to audit by state, local and foreign taxing authorities. Tax years 2012 through 2023 remain subject to state, local and foreign audits. The amount of liability associated with the Company's tax uncertainties may change within the next 12 months due to pending audit activity, expiring statute of limitations periods or tax payments.
NOTE 12 - SEGMENT INFORMATION
The Company routinely evaluates whether its operating and reportable segments continue to reflect the way the chief operating decision maker (CODM) evaluates the business. The determination is based on: (1) how the Company’s CODM evaluates the performance of the business, including resource allocation decisions, and (2) whether discrete financial information for each reporting segment is available. The Company considers D.G. Macpherson, its Chief Executive Officer and Chairman of the Board, its CODM.
The CODM evaluates performance based on the results of the Company’s two reportable segments High-Touch Solutions N.A. and Endless Assortment. These reportable segments align with Grainger's go-to-market strategies and bifurcated business models of high-touch solutions and endless assortment that generate sales primarily through the distribution of MRO products. The remaining businesses are classified as Other to reconcile to consolidated results. These businesses individually and in the aggregate do not meet the criteria of a reportable segment.
The accounting policies of the Company’s reportable segments are the same as those described in the summary of significant accounting policies. For further discussion on Grainger’s accounting policies, see Note 1.
All expenses directly attributable to each reportable segment are included in the operating results for each segment. Operating segment performance is evaluated by Grainger's CODM based on operating earnings as disclosed on the Company's Consolidated Statement of Earnings as the key determinant of the economic return and resource allocation among the segments. The CODM is not regularly provided and does not evaluate the segments using total asset or capital expenditure information and it is therefore not disclosed.
The following is a summary of segment results for the twelve months ended December 31, 2024, 2023 and 2022 (in millions of dollars):
| | | | | | | | | | | | | | | | | |
| 2024 |
| High-Touch Solutions N.A | | Endless Assortment | | Total |
Net sales(1) | $ | 13,720 | | | $ | 3,134 | | | $ | 16,854 | |
| | | | | |
| Reconciliation of net sales | | | | | |
| Other net sales | | | | | 314 | |
| Total company net sales | | | | | $ | 17,168 | |
| | | | | |
| Less: | | | | | |
| Cost of goods sold | 7,979 | | | 2,211 | | | |
Other segment items(2) | 3,356 | | | 663 | | | |
| Segment operating earnings | $ | 2,385 | | | $ | 260 | | | $ | 2,645 | |
| | | | | |
| Reconciliation of operating earnings | | | | | |
| Other operating earnings | | | | | (8) | |
| Total company operating earnings | | | | | $ | 2,637 | |
| | | | | | | | | | | | | | | | | |
| 2023 |
| High-Touch Solutions N.A | | Endless Assortment | | Total |
Net sales(1) | $ | 13,267 | | | $ | 2,916 | | | $ | 16,183 | |
| | | | | |
| Reconciliation of net sales | | | | | |
| Other net sales | | | | | 295 | |
| Total company net sales | | | | | $ | 16,478 | |
| | | | | |
| Less: | | | | | |
| Cost of goods sold | 7,721 | | | 2,052 | | | |
Other segment items(2) | 3,212 | | | 631 | | | |
| Segment operating earnings | $ | 2,334 | | | $ | 233 | | | $ | 2,567 | |
| | | | | |
| Reconciliation of operating earnings | | | | | |
| Other operating earnings (losses) | | | | | (2) | |
| Total company operating earnings | | | | | $ | 2,565 | |
| | | | | | | | | | | | | | | | | |
| 2022 |
| High-Touch Solutions N.A | | Endless Assortment | | Total |
Net sales(1) | $ | 12,182 | | | $ | 2,787 | | | $ | 14,969 | |
| | | | | |
| Reconciliation of net sales | | | | | |
| Other net sales | | | | | 259 | |
| Total company net sales | | | | | $ | 15,228 | |
| | | | | |
| Less: | | | | | |
| Cost of goods sold | 7,231 | | | 1,970 | | | |
Other segment items(2) | 2,968 | | | 594 | | | |
| Segment operating earnings | $ | 1,983 | | | $ | 223 | | | $ | 2,206 | |
| | | | | |
| Reconciliation of operating earnings | | | | | |
| Other operating earnings | | | | | 9 | |
| Total company operating earnings | | | | | $ | 2,215 | |
|
(1) Intersegment sales are recorded at values based on market prices, which creates intercompany profit sales that are eliminated within each segment to present only the impact of net sales to external customers. |
(2) Other segment items for HTSNA and EA consist of selling, general and administrative expenses primarily comprised of payroll and benefits, marketing expense, depreciation, amortization and non-cash lease expense, corporate overhead expenses allocated to each segment based upon benefits received, occupancy and other miscellaneous expenses. Intersegment expenses including fees and certain incurred costs for shared services are also included within the amounts shown above. |
Depreciation, amortization and non-cash lease expense presented below is related to long-lived assets, capitalized software and ROU assets. Long-lived assets consist of property, buildings and equipment.
| | | | | | | | | | | | | | | | | |
| 2024 | | 2023 | | 2022 |
| Depreciation, amortization and non-cash lease expense: | | | | | |
| High-Touch Solutions N.A. | $ | 234 | | | $ | 206 | | | $ | 168 | |
| Endless Assortment | 71 | | | 63 | | | 35 | |
| Other | 6 | | | 8 | | | 3 | |
| Total | $ | 311 | | | $ | 277 | | | $ | 206 | |
| | | | | |
|
Following is revenue by geographic location for the twelve months ended December 31, 2024, 2023 and 2022 (in millions of dollars):
| | | | | | | | | | | | | | | | | |
| 2024 | | 2023 | | 2022 |
Revenue by geographic location(1): | | | | | |
| United States | $ | 13,947 | | | $ | 13,389 | | | $ | 12,325 | |
| Japan | 1,893 | | | 1,797 | | | 1,719 | |
| Canada | 661 | | | 646 | | | 621 | |
| Other foreign countries | 667 | | | 646 | | | 563 | |
| $ | 17,168 | | | $ | 16,478 | | | $ | 15,228 | |
| | | | | |
(1) Revenue presented above is attributed to the destination country where the customer is located. |
The Company is a broad line distributor of MRO products. Products are regularly added and removed from the Company's inventory. Accordingly, it would be impractical to provide sales information by product category due to the way the business is managed, and the dynamic nature of the inventory offered, including the evolving list of products stocked and additional products available online but not stocked. For further information regarding the Company's sales by segment and major customer industry, see Note 2.
NOTE 13 - CONTINGENCIES AND LEGAL MATTERS
From time to time the Company is involved in various legal and administrative proceedings, including claims related to: product liability, safety or compliance; privacy and cybersecurity matters; negligence; contract disputes; environmental issues; unclaimed property; wage and hour laws; intellectual property; advertising and marketing; consumer protection; pricing (including disaster or emergency declaration pricing statutes); employment practices; regulatory compliance, including trade and export matters; anti-bribery and corruption; and other matters and actions brought by team members, consumers, competitors, suppliers, customers, governmental entities and other third parties.
The Company remains in litigation involving KMCO, LLC (KMCO) as previously disclosed. The Company continues to contest the remaining KMCO-related lawsuits and cannot predict the timing, outcome or any estimate of possible loss or range of losses on the remaining KMCO lawsuits.
Also, as a government contractor selling to federal, state and local governmental entities, the Company may be subject to governmental or regulatory inquiries or audits or other proceedings, including those related to contract administration, pricing and product compliance.
While the Company is unable to predict the outcome of any of these proceedings and other matters, it believes that their ultimate resolution will not have, either individually or in the aggregate, a material adverse effect on the Company’s consolidated financial condition or results of operations.
NOTE 14 - SUBSEQUENT EVENTS
On January 29, 2025, Grainger's Board of Directors declared a quarterly cash dividend of $2.05 per share of common stock, payable March 1, 2025 to shareholders of record on February 10, 2025.
On February 18, 2025 Grainger repaid the principal amount of $500 million for the 1.85% Senior Notes that matured in February 2025.
Item 9: Changes in and Disagreements with Accountants on Accounting and Financial Disclosure
None.
Item 9A: Controls and Procedures
Evaluation of Disclosures and Controls
The Company, under the supervision and with the participation of its management, including the Chief Executive Officer and the Chief Financial Officer, evaluated the effectiveness of the design and operation of Grainger's disclosure controls and procedures pursuant to Rule 13a-15 of the Securities Exchange Act of 1934, as amended (Exchange Act). Based upon that evaluation, the Chief Executive Officer and the Chief Financial Officer concluded that Grainger's disclosure controls and procedures were effective as of the end of the period covered by this report.
Management's Annual Report on Internal Control Over Financial Reporting
The management of W.W. Grainger, Inc. (Grainger) is responsible for establishing and maintaining adequate internal control over financial reporting. Grainger's internal control system was designed to provide reasonable assurance to Grainger's management and Board of Directors regarding the reliability of financial reporting and the preparation of financial statements for external purposes in accordance with accounting principles generally accepted in the United States of America.
Because of its inherent limitations, internal control over financial reporting may not prevent or detect misstatements under all potential conditions. Therefore, effective internal control over financial reporting provides only reasonable, and not absolute, assurance with respect to the preparation and presentation of financial statements.
Grainger's management assessed the effectiveness of Grainger's internal control over financial reporting as of December 31, 2024, based on criteria established in Internal Control - Integrated Framework issued by the Committee of Sponsoring Organizations of the Treadway Commission (2013 framework) (the COSO criteria). Based on its assessment under that framework and the criteria established therein, Grainger's management concluded that Grainger's internal control over financial reporting was effective as of December 31, 2024.
Ernst & Young LLP, an independent registered public accounting firm, has audited Grainger's internal control over financial reporting as of December 31, 2024, as stated in their report, which is included herein.
Changes in Internal Control Over Financial Reporting
There were no changes to Grainger's internal control over financial reporting for the quarter ending December 31, 2024 that have materially affected, or are reasonably likely to materially affect, Grainger's internal control over financial reporting.
Report of Independent Registered Public Accounting Firm
To the Shareholders and the Board of Directors of
W.W. Grainger, Inc.
Opinion on Internal Control over Financial Reporting
We have audited W.W. Grainger, Inc. and subsidiaries’ internal control over financial reporting as of December 31, 2024, based on criteria established in Internal Control—Integrated Framework issued by the Committee of Sponsoring Organizations of the Treadway Commission (2013 framework) (the COSO criteria). In our opinion, W.W Grainger, Inc. and subsidiaries (the Company) maintained, in all material respects, effective internal control over financial reporting as of December 31, 2024, based on the COSO criteria.
We also have audited, in accordance with the standards of the Public Company Accounting Oversight Board (United States) (PCAOB), the consolidated balance sheets of the Company as of December 31, 2024 and 2023, the related consolidated statements of earnings, comprehensive earnings, shareholders’ equity and cash flows for each of the three years in the period ended December 31, 2024, and the related notes and our report dated February 20, 2025 expressed an unqualified opinion thereon.
Basis for Opinion
The Company’s management is responsible for maintaining effective internal control over financial reporting and for its assessment of the effectiveness of internal control over financial reporting included in the accompanying Management’s Annual Report on Internal Controls Over Financial Reporting. Our responsibility is to express an opinion on the Company’s internal control over financial reporting based on our audit. We are a public accounting firm registered with the PCAOB and are required to be independent with respect to the Company in accordance with the U.S. federal securities laws and the applicable rules and regulations of the Securities and Exchange Commission and the PCAOB.
We conducted our audit in accordance with the standards of the PCAOB. Those standards require that we plan and perform the audit to obtain reasonable assurance about whether effective internal control over financial reporting was maintained in all material respects.
Our audit included obtaining an understanding of internal control over financial reporting, assessing the risk that a material weakness exists, testing and evaluating the design and operating effectiveness of internal control based on the assessed risk, and performing such other procedures as we considered necessary in the circumstances. We believe that our audit provides a reasonable basis for our opinion.
Definition and Limitations of Internal Control Over Financial Reporting
A company’s internal control over financial reporting is a process designed to provide reasonable assurance regarding the reliability of financial reporting and the preparation of financial statements for external purposes in accordance with generally accepted accounting principles. A company’s internal control over financial reporting includes those policies and procedures that (1) pertain to the maintenance of records that, in reasonable detail, accurately and fairly reflect the transactions and dispositions of the assets of the company; (2) provide reasonable assurance that transactions are recorded as necessary to permit preparation of financial statements in accordance with generally accepted accounting principles, and that receipts and expenditures of the company are being made only in accordance with authorizations of management and directors of the company; and (3) provide reasonable assurance regarding prevention or timely detection of unauthorized acquisition, use, or disposition of the company’s assets that could have a material effect on the financial statements.
Because of its inherent limitations, internal control over financial reporting may not prevent or detect misstatements. Also, projections of any evaluation of effectiveness to future periods are subject to the risk that controls may become inadequate because of changes in conditions, or that the degree of compliance with the policies or procedures may deteriorate.
/s/ Ernst & Young LLP
Chicago, Illinois
February 20, 2025
Item 9B: Other Information
None of the Company's directors or officers adopted, modified or terminated a Rule 10b5-1 trading arrangement or a non-Rule 10b5-1 trading arrangement during the Company's quarter ended December 31, 2024.
Item 9C: Disclosure Regarding Foreign Jurisdictions that Prevent Inspections
None.
PART III
Item 10: Directors, Executive Officers and Corporate Governance
The information required by this item is incorporated by reference to Grainger's proxy statement relating to the annual meeting of shareholders to be held April 30, 2025, under the captions “Board Qualifications, Attributes, Skills and Background,” “Annual Election of Directors,” “Candidates for Board Membership,” “Director Nominees’ Experience and Qualifications,” “Audit Committee,” and “Board Affairs and Nominating Committee”. Information required by this item regarding executive officers of Grainger is set forth in Part I, Item 1, under the caption “Information about our Executive Officers.”
Grainger has adopted a code of ethics that applies to its principal executive officer, principal financial officer and principal accounting officer and controller. This code of ethics is part of Grainger’s Business Conduct Guidelines for directors, officers and team members, which is available free of charge through Grainger’s website at invest.grainger.com. A copy of the Business Conduct Guidelines is also available in print without charge to any person upon request to Grainger's Corporate Secretary. Grainger intends to disclose on its website any amendment to any provision of the Business Conduct Guidelines that relates to any element of the definition of “code of ethics” enumerated in Item 406(b) of Regulation S-K under the Exchange Act and any waiver from any such provision granted to Grainger’s principal executive officer, principal financial officer, principal accounting officer and controller or persons performing similar functions. Grainger has also adopted Operating Principles for the Board of Directors, which are available on its website and are available in print to any person who requests them.
The Company has adopted an insider trading policy and program that govern the purchase, sale and other disposition of its securities by the Company’s directors, officers, team members and contractors, and family members of any of the foregoing, as well as the Company itself. The insider trading policy provides that the Company will comply with insider trading laws, rules and regulations and the New York Stock Exchange listing standards. The foregoing summary of the Company’s insider trading policy and program is qualified in its entirety by reference to the full text thereof attached hereto as Exhibit 19.
Item 11: Executive Compensation
The information required by this item is incorporated by reference to Grainger’s proxy statement relating to the annual meeting of shareholders to be held April 30, 2025, under the captions “Director Compensation,” “Compensation Discussion and Analysis,” “Compensation Committee of the Board,” “Report of the Compensation Committee of the Board,” and “CEO Pay Ratio.”
Item 12: Security Ownership of Certain Beneficial Owners and Management and Related Stockholder Matters
The information required by this item is incorporated by reference to Grainger's proxy statement relating to the annual meeting of shareholders to be held April 30, 2025, under the captions “Ownership of Grainger Stock” and “Equity Compensation Plans.”
Item 13: Certain Relationships and Related Transactions and Director Independence
The information required by this item is incorporated by reference to Grainger's proxy statement relating to the annual meeting of shareholders to be held April 30, 2025, under the captions “Director Independence,” “Annual Election of Directors” and “Transactions with Related Persons.”
Item 14: Principal Accountant Fees and Services
The information required by this item is incorporated by reference to Grainger's proxy statement relating to the annual meeting of shareholders to be held April 30, 2025, under the caption “Audit Fees and Audit Committee Pre-Approval Policies and Procedures.”
PART IV
Item 15: Exhibits and Financial Statements Schedules
(a) Documents filed as part of this Form 10-K
(1) All Financial Statements
INDEX TO CONSOLIDATED FINANCIAL STATEMENTS
| | | | | | | | |
| Page |
| REPORT OF INDEPENDENT REGISTERED PUBLIC ACCOUNTING FIRM PCAOB ID: | 42 | |
| CONSOLIDATED STATEMENTS OF EARNINGS FOR THE YEARS ENDED DECEMBER 31, 2024, 2023 AND 2022 | | |
| CONSOLIDATED STATEMENTS OF COMPREHENSIVE EARNINGS FOR THE YEARS ENDED DECEMBER 31, 2024, 2023 AND 2022 | | |
| CONSOLIDATED BALANCE SHEETS AS OF DECEMBER 31, 2024 AND 2023 | | |
| CONSOLIDATED STATEMENTS OF CASH FLOWS FOR THE YEARS ENDED DECEMBER 31, 2024, 2023 AND 2022 | | |
| CONSOLIDATED STATEMENTS OF SHAREHOLDERS' EQUITY FOR THE YEARS ENDED DECEMBER 31, 2024, 2023 AND 2022 | | |
| NOTES TO CONSOLIDATED FINANCIAL STATEMENTS | | |
(2) Financial Statement Schedules: the schedules listed in Rule 5-04 of Regulation S-X have been omitted because they are either not applicable or the required information is shown in the Consolidated Financial Statements or notes thereto.
(3) Exhibits Required by Item 601 of Regulation S-K
| | | | | | | | |
| EXHIBIT INDEX |
| EXHIBIT NO. | | DESCRIPTION |
| | Share Purchase Agreement, dated as of July 30, 2015, by and among Grainger, GWW UK Holdings Limited, Gregory Family Office Limited and Michael Gregory, incorporated by reference to Exhibit 2.1 to W.W. Grainger, Inc.’s Current Report on Form 8-K dated July 31, 2015. |
| | Restated Articles of Incorporation, incorporated by reference to Exhibit 3(i) to W.W. Grainger, Inc.’s Quarterly Report on Form 10-Q for the quarter ended June 30, 1998. |
| | By-laws, as amended on March 9, 2017, incorporated by reference to Exhibit 3.1.1 to W.W. Grainger, Inc.’s Current Report on Form 8-K dated March 9, 2017. |
| | Indenture, dated as of June 11, 2015, between W.W. Grainger, Inc. and U.S. Bank National Association, as trustee, incorporated by reference to Exhibit 4.1 to W.W. Grainger, Inc.’s Current Report on Form 8-K dated June 11, 2015. |
| | First Supplemental Indenture, dated as of June 11, 2015, between W.W. Grainger, Inc. and U.S. Bank National Association, as trustee, and Form of 4.60% Senior Notes due 2045, incorporated by reference to Exhibit 4.2 to W.W. Grainger, Inc.’s Current Report on Form 8-K dated June 11, 2015. |
| | Second Supplemental Indenture, dated as of May 16, 2016, between W.W. Grainger, Inc., and U.S. Bank National Association, as trustee, incorporated by reference to Exhibit 4.1 to W.W. Grainger, Inc.’s Current Report on Form 8-K dated May 16, 2016. |
| | Third Supplemental Indenture, dated as of May 22, 2017, between W.W. Grainger, Inc., and U.S. Bank National Association, as trustee, incorporated by reference to Exhibit 4.1 to W.W. Grainger, Inc.’s Current Report on Form 8-K dated May 22, 2017. |
| | Form of 3.75% Senior Notes due 2046 (included in Exhibit 4.3), incorporated by reference to Exhibit 4.1 to W.W. Grainger, Inc.’s Current Report on Form 8-K dated May 16, 2016. |
| | Form of 4.20% Senior Notes due 2047 (included in Exhibit 4.4), incorporated by reference to Exhibit 4.1 to W.W. Grainger, Inc.’s Current Report on Form 8-K dated May 22, 2017. |
| | Description of Registrant's Securities Pursuant to Section 12 of the Securities Exchange Act of 1934.** |
| | Fourth Supplemental Indenture, dated as of February 26, 2020, between W.W. Grainger, Inc., and U.S. Bank National Association, as trustee incorporated by reference to Exhibit 4.1 to W.W. Grainger, Inc.'s Current Report on Form 8-K dated February 21, 2020. |
| | | | | | | | |
| | Form of 1.85% Senior Notes due 2025 (included in Exhibit 4.8), incorporated by reference to Exhibit 4.1 to W.W. Grainger, Inc.'s Current Report on Form 8-K dated February 21, 2020. |
| | Fifth Supplemental Indenture, dated as of September 12, 2024, by and between the Company and U.S. Bank Trust Company, National Association, as Trustee (including Form of Note), incorporated by reference to Exhibit 4.1 to W.W. Grainger, Inc.’s Quarterly Report on Form 10-Q for the quarter ended September 30, 2024. |
| | Form of Indemnification Agreement between W.W. Grainger, Inc. and each of its directors and certain of its executive officers, incorporated by reference to Exhibit 10(b)(i) to W.W. Grainger, Inc.’s Quarterly Report on Form 10-Q for the quarter ended March 31, 2009.* |
| | Frozen Executive Death Benefit Plan, as amended, incorporated by reference to Exhibit 10(b)(v) to W.W. Grainger, Inc.’s Annual Report on Form 10-K for the year ended December 31, 2007.* |
| | First amendment to the Frozen Executive Death Benefit Plan, incorporated by reference to Exhibit 10(b)(v)(1) to W.W. Grainger, Inc.’s Annual Report on Form 10-K for the year ended December 31, 2008.* |
| | Second amendment to the Frozen Executive Death Benefit Plan, incorporated by reference to Exhibit 10(b)(iv)(2) to W.W. Grainger, Inc.’s Annual Report on Form 10-K for the year ended December 31, 2009.* |
| | Supplemental Profit Sharing Plan, as amended, incorporated by reference to Exhibit 10(viii) to W.W. Grainger, Inc.’s Annual Report on Form 10-K for the year ended December 31, 2003.* |
| | Supplemental Profit Sharing Plan II, as amended, incorporated by reference to Exhibit 10(b)(ix) to W.W. Grainger, Inc.’s Annual Report on Form 10-K for the year ended December 31, 2007.* |
| | Voluntary Salary and Incentive Deferral Plan, as amended, incorporated by reference to Exhibit 10(b)(xi) to W.W. Grainger, Inc.’s Annual Report on Form 10-K for the year ended December 31, 2007.* |
| | Summary Description of the Directors Compensation Program.* |
| | 2010 Incentive Plan, incorporated by reference to Appendix B of W.W. Grainger, Inc.’s Proxy Statement dated March 12, 2010.* |
| | Summary Description of the Company Management Incentive Program, incorporated by reference to Exhibit 10.10 to W.W. Grainger, Inc's Annual Report on Form 10-K for the year ended December 31, 2023.* |
| | Incentive Program Recoupment Agreement, incorporated by reference to Exhibit 10(b)(xxv) to W.W. Grainger, Inc.’s Annual Report on Form 10-K for the year ended December 31, 2009.* |
| | Form of Change in Control Employment Agreement between W.W. Grainger, Inc. and certain of its executive officers, incorporated by reference to Exhibit 10(b)(xxvii) to W.W. Grainger, Inc.’s Annual Report on Form 10-K for the year ended December 31, 2010.* |
| | W.W. Grainger, Inc. 2015 Incentive Plan, incorporated by reference to Exhibit B of W.W. Grainger, Inc.’s Proxy Statement dated March 13, 2015.* |
| | First Amendment to the W.W. Grainger, Inc. 2015 Incentive Plan, incorporated by reference to 10.1 of W.W. Grainger, Inc.’s Quarterly Report on Form 10-Q for the quarter ended March 31, 2017.* |
| | W.W. Grainger, Inc. 2015 Incentive Plan as Amended and Restated Effective October 31, 2018, incorporated by reference to Exhibit 10.1 to W.W. Grainger, Inc.'s Quarterly Report on Form 10-Q for the quarter ended September 30, 2018.* |
| | Form of Stock Option Award Agreement between W.W. Grainger, Inc. and certain of its executive officers, incorporated by reference to Exhibit 10.1 to W.W. Grainger, Inc.’s Quarterly Report on Form 10-Q for the quarter ended June 30, 2016.* |
| | Form of Stock Option Award Agreement between W.W. Grainger, Inc. and certain of its executive officers, incorporated by reference to Exhibit 10.2 to W.W. Grainger, Inc.’s Quarterly Report on Form 10-Q for the quarter ended March 31, 2017.* |
| | Form of Restricted Stock Unit Award Agreement between W.W. Grainger, Inc. and certain of its executive officers, incorporated by reference to Exhibit 10.3 to W.W. Grainger, Inc.’s Quarterly Report on Form 10-Q for the quarter ended March 31, 2017.* |
| | Form of 2017 Performance Share Award Agreement between W.W. Grainger, Inc. and certain of its executive officers, incorporated by reference to Exhibit 10.4 to W.W. Grainger, Inc.’s Quarterly Report on Form 10-Q for the quarter ended March 31, 2017.* |
| | Form of 2018 W.W. Grainger, Inc. 2015 Incentive Plan Stock Option Agreement between W.W. Grainger, Inc. and certain of its executive officers, incorporated by reference to Exhibit 10.3 to W.W. Grainger, Inc.'s Quarterly Report on Form 10-Q for the quarter ended March 31, 2018.* |
| | | | | | | | |
| | Form of 2018 W.W. Grainger, Inc. 2015 Incentive Plan Restricted Stock Unit Agreement between W.W. Grainger, Inc. and certain of its executive officers, incorporated by reference to Exhibit 10.4 to W.W. Grainger, Inc.'s Quarterly Report on Form 10-Q for the quarter ended March 31, 2018.* |
| | Form of 2018 W.W. Grainger, Inc. 2015 Incentive Plan Performance Restricted Stock Unit Agreement between W.W. Grainger, Inc. and certain of its executive officers, incorporated by reference to Exhibit 10.5 to W.W. Grainger, Inc.'s Quarterly Report on Form 10-Q for the quarter ended March 31, 2018.* |
| | Form of 2019 W.W. Grainger, Inc. 2015 Stock Incentive Plan Stock Option Agreement between W.W. Grainger, Inc. and certain of its executive officers, incorporated by reference to Exhibit 10.1 to W.W. Grainger, Inc.’s Quarterly Report on Form 10-Q for the quarter ended March 31, 2019.* |
| | Form of 2019 W.W. Grainger, Inc. 2015 Stock Incentive Plan Restricted Stock Unit Agreement between W.W. Grainger, Inc. and certain of its executive officers, incorporated by reference to Exhibit 10.2 to W.W. Grainger, Inc.’s Quarterly Report on Form 10-Q for the quarter ended March 31, 2019.* |
| | Form of 2019 W.W. Grainger, Inc. 2015 Stock Incentive Plan Performance Restricted Stock Unit Agreement between W.W. Grainger, Inc. and certain of its executive officers, incorporated by reference to Exhibit 10.3 to W.W. Grainger, Inc.’s Quarterly Report on Form 10-Q for the quarter ended March 31, 2019.* |
| | Credit Agreement dated as of February 14, 2020, by and among W.W. Grainger, Inc., the lenders party thereto, and JPMorgan Chase Bank, N.A., as Administrative Agent, incorporated by reference to Exhibit 10.1 to W.W. Grainger, Inc.'s Current Report on Form 8-K dated February 14, 2020. |
| | First Amendment to Credit Agreement, dated as of August 29, 2022, by and among W.W. Grainger, Inc., the lenders party thereto and JPMorgan Chase, N.A., as Administrative Agent, incorporated by reference to Exhibit 10.1 to W.W. Grainger, Inc.’s Current Report on Form 8 K dated August 30, 2022. |
| | Form of 2020 W.W. Grainger, Inc. 2015 Incentive Plan Restricted Stock Unit Agreement between W.W. Grainger, Inc. and certain of its executive officers, incorporated by reference to Exhibit 10.1 to W.W. Grainger, Inc.’s Quarterly Report on Form 10-Q for the quarter ended March 31, 2020.* |
| | Form of 2020 W.W. Grainger, Inc. 2015 Incentive Plan Performance Stock Unit Agreement between W.W. Grainger, Inc. and certain of its executive officers, incorporated by reference to Exhibit 10.2 to W.W. Grainger, Inc.’s Quarterly Report on Form 10-Q for the quarter ended March 31, 2020.* |
| | 2022 Form of W.W. Grainger, Inc. 2015 Incentive Plan Performance Stock Unit Agreement between W.W. Grainger, Inc. and certain of its executive officers incorporated by reference to Exhibit 10.35 to W.W. Grainger, Inc.'s Annual Report on Form 10-K for the year ended December 31, 2021.* |
| | 2022 Form of W.W. Grainger, Inc. 2022 Incentive Plan Restricted Stock Unit Award Agreement between W.W. Grainger, Inc. and certain of its executive officers, incorporated by reference to Exhibit 10.1 to W.W. Grainger, Inc.’s Quarterly Report on Form 10-Q for the quarter ended June 30, 2022.* |
| | 2022 Form of W.W. Grainger, Inc. 2022 Incentive Plan Performance Stock Unit Award Agreement between W.W. Grainger, Inc. and certain of its executive officers, incorporated by reference to Exhibit 10.2 to W.W. Grainger, Inc.’s Quarterly Report on Form 10-Q for the quarter ended June 30, 2022.* |
| | W.W. Grainger, Inc. 2022 Incentive Plan, incorporated by reference to Appendix C of the Company's Definitive Proxy Statement on Schedule 14A filed on March 17, 2022.* |
| | Compensation Continuation - Severance Policy Guidance, incorporated by reference to Exhibit 10.1 to W.W. Grainger, Inc.’s Quarterly Report on Form 10-Q for the quarter ended September 30, 2022.* |
| | 2023 Form of W.W. Grainger, Inc. 2022 Incentive Plan Restricted Stock Unit Award Agreement between W.W. Grainger, Inc. and certain of its executive officers, incorporated by reference to Exhibit 10.41 to W.W. Grainger, Inc.'s Annual Report on Form 10-K for the year ended December 31, 2022.* |
| | 2023 Form of W.W. Grainger, Inc. 2022 Incentive Plan Performance Stock Unit Award Agreement between W.W. Grainger, Inc. and certain of its executive officers, incorporated by reference to Exhibit 10.42 to W.W. Grainger, Inc.'s Annual Report on Form 10-K for the year ended December 31, 2022.* |
| | | | | | | | |
| | Shareholder Agreement, Dated as of February 17, 2023, by and among W.W. Grainger, Inc. and MonotaRO Co., Ltd., incorporated by reference to Exhibit 10.43 to W.W. Grainger, Inc.'s Annual Report on Form 10-K for the year ended December 31, 2022.* |
| | Transition Agreement and General Release, dated July 6, 2023, by and between John L. Howard and W.W. Grainger, Inc., incorporated by reference to Exhibit 10.1 to W.W. Grainger, Inc.'s Quarterly Report on Form 10-Q for the quarter ended September 30, 2023.* |
| | Credit Agreement dated as of October 11, 2023, by and among W.W. Grainger, Inc. the lenders party thereto, and JP Morgan Chase Bank, N.A., as Administrative Agent, incorporated by reference to Exhibit 10.1 to W.W. Grainger, Inc.'s Current Report on Form 8-K filed on October 12, 2023. |
| | Separation Agreement and General Release between W.W. Grainger, Inc. and Matthew E. Fortin dated as of August 23, 2024.** |
| | 2024 Form of W.W. Grainger, Inc. 2022 Incentive Plan Restricted Stock Unit Award Agreement between W.W. Grainger, Inc. and certain of its executive officers, incorporated by reference to Exhibit 10.1 to W.W. Grainger, Inc's Quarterly Report on Form 10-Q for the quarter ended March 31, 2024.* |
| | 2024 Form of W.W. Grainger, Inc. 2022 Incentive Plan Performance Stock Unit Award Agreement between W.W. Grainger, Inc. and certain of its executive officers, incorporated by reference to Exhibit 10.2 to W.W. Grainger, Inc's Quarterly Report on Form 10-Q for the quarter ended March 31, 2024.* |
| | 2024 Form of Confidentiality, Invention Assignment, Non-Competition and Non-Solicitation Agreement between W.W. Grainger, Inc. and certain of its executive officers, incorporated by reference to Exhibit 10.3 to W.W. Grainger, Inc's Quarterly Report on Form 10-Q for the quarter ended March 31, 2024.* |
| | Insider Trading Policy.** |
| | Subsidiaries of Grainger.** |
| | Consent of Independent Registered Public Accounting Firm.** |
| | Certification of Principal Executive Officer pursuant to Section 302 of the Sarbanes-Oxley Act of 2002.** |
| | Certification of Principal Financial Officer pursuant to Section 302 of the Sarbanes-Oxley Act of 2002.** |
| | Certification of Principal Executive Officer and Principal Financial Officer pursuant to 18 U.S.C. Section 1350, as adopted pursuant to Section 906 of the Sarbanes-Oxley Act of 2002.*** |
| | W.W. Grainger, Inc. Financial Statement Executive Compensation Recoupment Policy (effective October 25, 2023), incorporated by reference to Exhibit 97 to W.W. Grainger, Inc's Annual Report on Form 10-K for the year ended December 31, 2023. |
| 101.INS | | XBRL Instance Document - the instance document does not appear in the interactive data file because its XBRL tags are embedded within the inline XBRL document.** |
| 101.SCH | | XBRL Taxonomy Extension Schema Document.** |
| 101.CAL | | XBRL Taxonomy Extension Calculation Linkbase Document.** |
| 101.DEF | | XBRL Taxonomy Extension Definition Linkbase Document.** |
| 101.LAB | | XBRL Taxonomy Extension Label Linkbase Document.** |
| 101.PRE | | XBRL Taxonomy Extension Presentation Linkbase Document.** |
| 104 | | Cover Page Interactive Data File (formatted as inline XBRL and contained in Exhibit 101).** |
| | |
| | |
(*) Management contract or compensatory plan or arrangement. |
(**) Filed herewith. |
(***) Furnished herewith. |
|
Item 16: Form 10-K Summary
None.
SIGNATURES
Pursuant to the requirements of Section 13 or 15(d) of the Securities Exchange Act of 1934, the registrant has duly caused this report to be signed on its behalf by the undersigned, thereunto duly authorized.
DATE: February 20, 2025
| | | | | |
| W.W. GRAINGER, INC. |
| |
| By: | /s/ D.G. Macpherson |
| D.G. Macpherson |
| Chairman of the Board |
| and Chief Executive Officer |
Pursuant to the requirements of the Securities Exchange Act of 1934, this report has been signed below by the following persons on behalf of the registrant on February 20, 2025, in the capacities indicated.
| | | | | | | | |
| | |
| /s/ D.G. Macpherson | | /s/ Rodney C. Adkins |
| D.G. Macpherson | | Rodney C. Adkins |
| Chairman of the Board | | Director |
| and Chief Executive Officer, Director | | |
| (Principal Executive Officer) | | /s/ George Davis |
| | George Davis |
| /s/ Deidra C. Merriwether | | Director |
| Deidra C. Merriwether | | |
| Senior Vice President | | /s/ Katherine D. Jaspon |
| and Chief Financial Officer | | Katherine D. Jaspon |
| (Principal Financial Officer) | | Director |
| | |
| /s/ Laurie R. Thomson | | /s/ Chris Klein |
| Laurie R. Thomson | | Chris Klein |
| Vice President and Controller | | Director |
| (Principal Accounting Officer) | | |
| | /s/ Stuart L. Levenick |
| | Stuart L. Levenick |
| | Director |
| | |
| | /s/ Neil S. Novich |
| | Neil S. Novich |
| | Director |
| | |
| | /s/ E. Scott Santi |
| | E. Scott Santi |
| | Director |