
Federal Signal Q2 2019 Earnings Call July 31, 2019 Jennifer Sherman, President & Chief Executive Officer Ian Hudson, SVP, Chief Financial Officer
Safe Harbor This presentation contains unaudited financial information and various forward-looking statements as of the date hereof and we undertake no obligation to update these forward- looking statements regardless of new developments or otherwise. Statements in this presentation that are not historical are forward-looking statements. Such statements are subject to various risks and uncertainties that could cause actual results to vary materially from those stated. Such risks and uncertainties include but are not limited to: economic conditions in various regions, product and price competition, supplier and raw material prices, risks associated with acquisitions such as integration of operations and achieving anticipated revenue and cost benefits, foreign currency exchange rate changes, interest rate changes, increased legal expenses and litigation results, legal and regulatory developments and other risks and uncertainties described in filings with the Securities and Exchange Commission. This presentation also contains references to certain non-GAAP financial information. Such items are reconciled herein and in our earnings news release provided as of the date of this presentation. 2
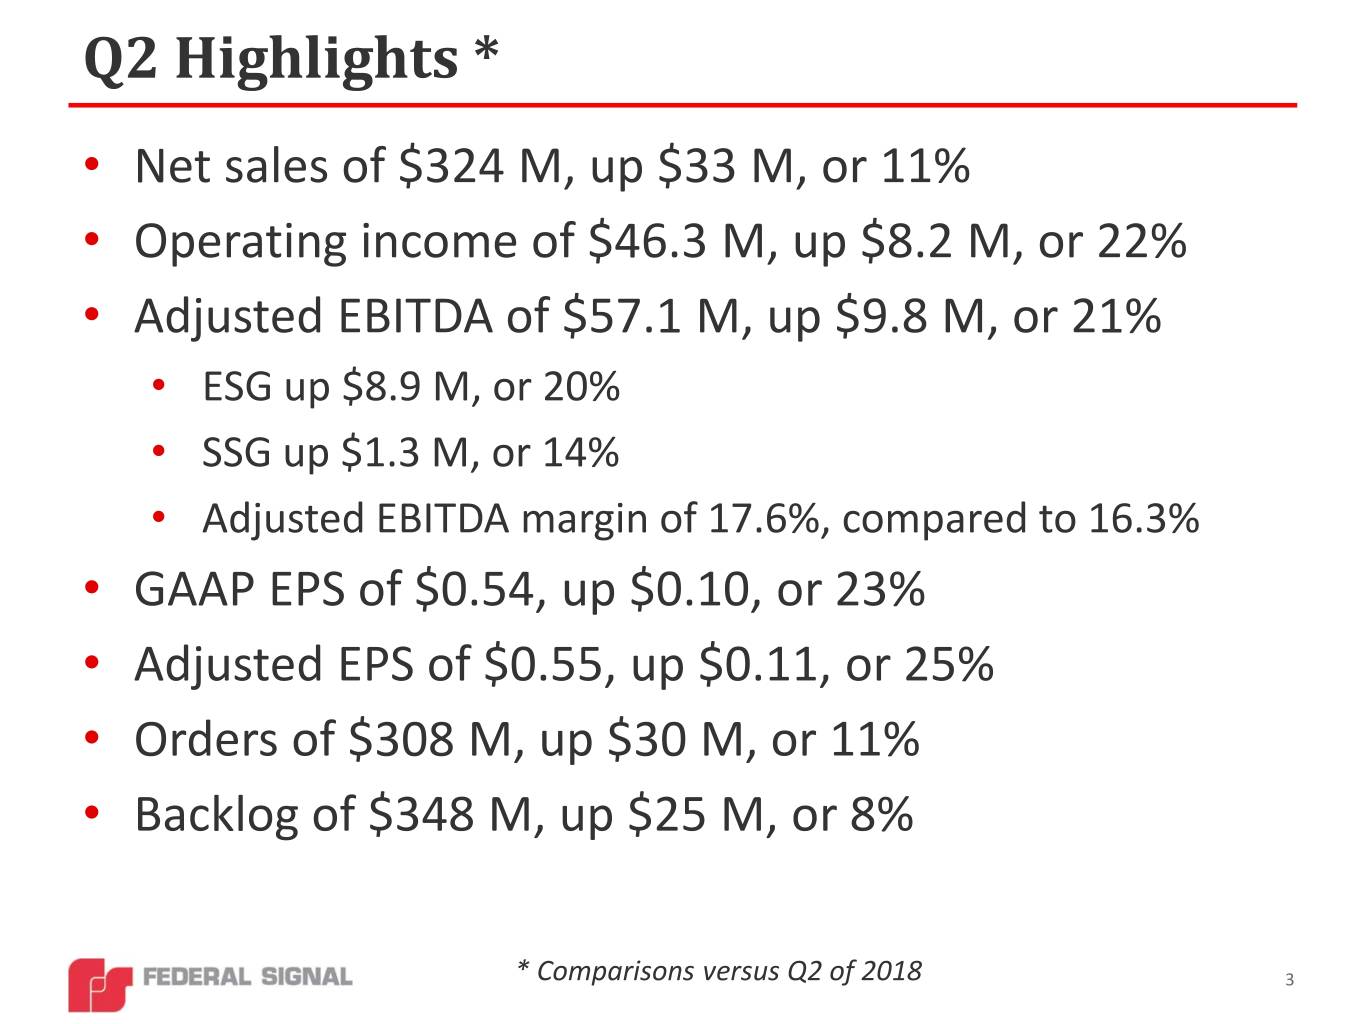
Q2 Highlights * • Net sales of $324 M, up $33 M, or 11% • Operating income of $46.3 M, up $8.2 M, or 22% • Adjusted EBITDA of $57.1 M, up $9.8 M, or 21% • ESG up $8.9 M, or 20% • SSG up $1.3 M, or 14% • Adjusted EBITDA margin of 17.6%, compared to 16.3% • GAAP EPS of $0.54, up $0.10, or 23% • Adjusted EPS of $0.55, up $0.11, or 25% • Orders of $308 M, up $30 M, or 11% • Backlog of $348 M, up $25 M, or 8% * Comparisons versus Q2 of 2018 3
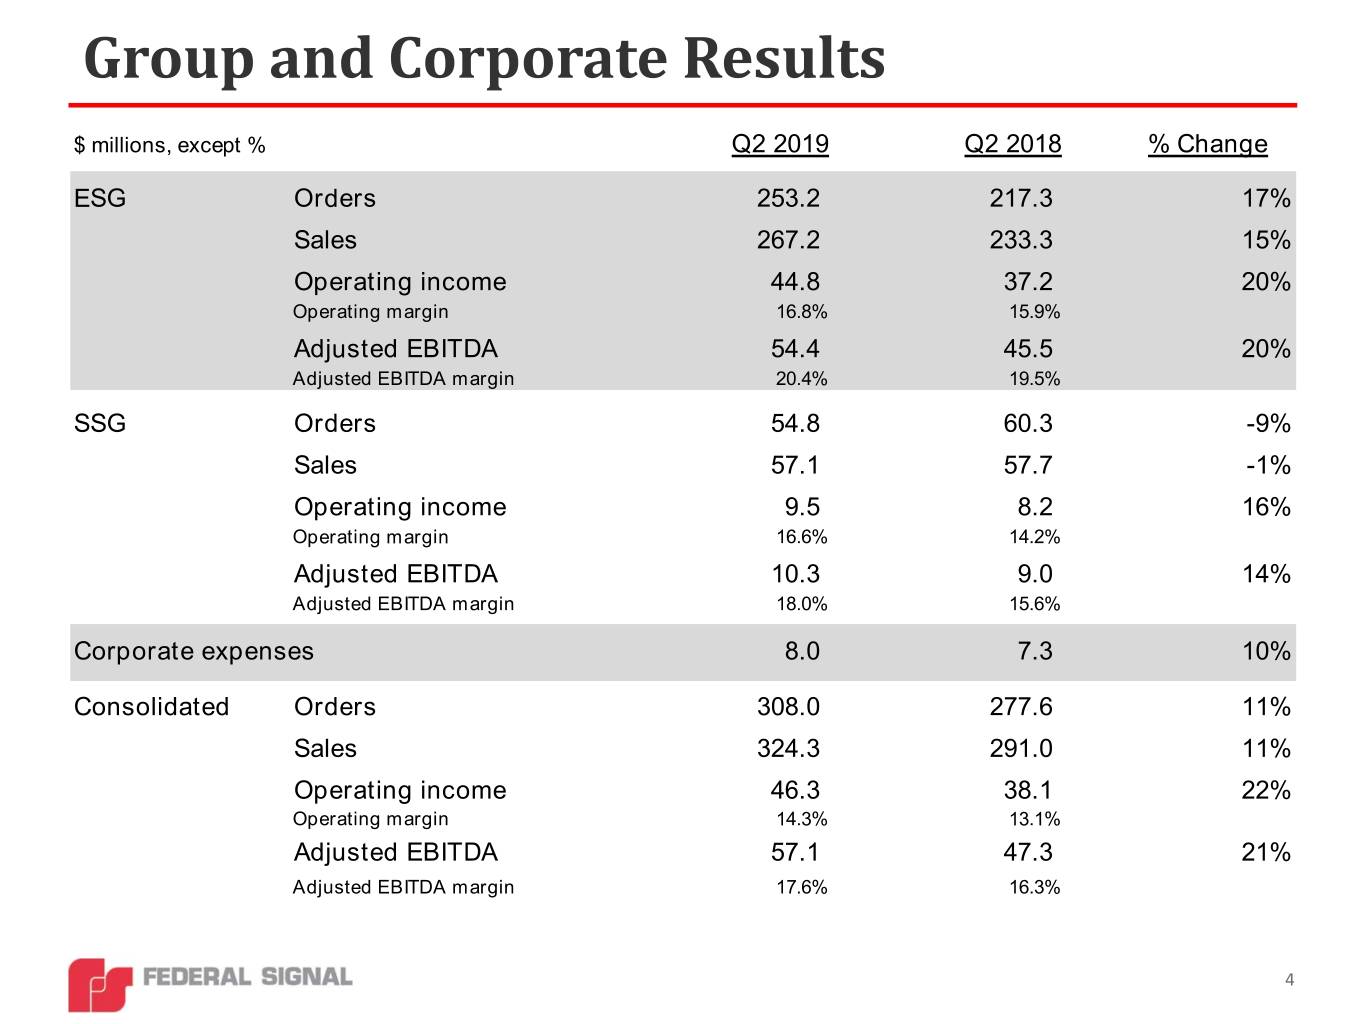
Group and Corporate Results $ millions, except % Q2 2019 Q2 2018 % Change ESG Orders 253.2 217.3 17% Sales 267.2 233.3 15% Operating income 44.8 37.2 20% Operating margin 16.8% 15.9% Adjusted EBITDA 54.4 45.5 20% Adjusted EBITDA margin 20.4% 19.5% SSG Orders 54.8 60.3 -9% Sales 57.1 57.7 -1% Operating income 9.5 8.2 16% Operating margin 16.6% 14.2% Adjusted EBITDA 10.3 9.0 14% Adjusted EBITDA margin 18.0% 15.6% Corporate expenses 8.0 7.3 10% Consolidated Orders 308.0 277.6 11% Sales 324.3 291.0 11% Operating income 46.3 38.1 22% Operating margin 14.3% 13.1% Adjusted EBITDA 57.1 47.3 21% Adjusted EBITDA margin 17.6% 16.3% 4
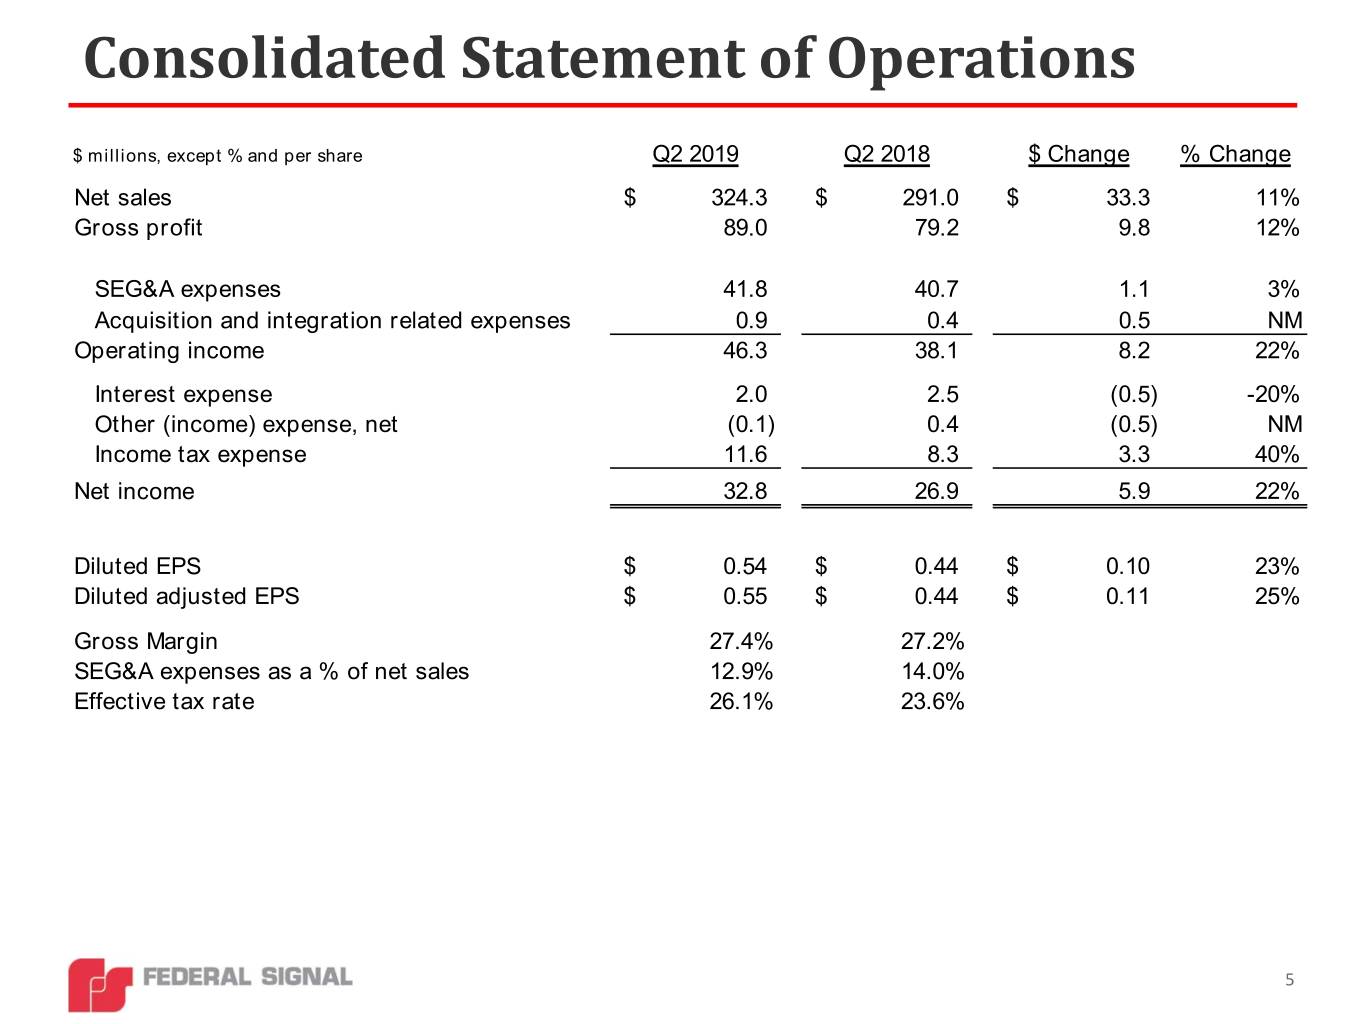
Consolidated Statement of Operations $ millions, except % and per share Q2 2019 Q2 2018 $ Change % Change Net sales $ 324.3 $ 291.0 $ 33.3 11% Gross profit 89.0 79.2 9.8 12% SEG&A expenses 41.8 40.7 1.1 3% Acquisition and integration related expenses 0.9 0.4 0.5 NM Operating income 46.3 38.1 8.2 22% Interest expense 2.0 2.5 (0.5) -20% Other (income) expense, net (0.1) 0.4 (0.5) NM Income tax expense 11.6 8.3 3.3 40% Net income 32.8 26.9 5.9 22% Diluted EPS $ 0.54 $ 0.44 $ 0.10 23% Diluted adjusted EPS $ 0.55 $ 0.44 $ 0.11 25% Gross Margin 27.4% 27.2% SEG&A expenses as a % of net sales 12.9% 14.0% Effective tax rate 26.1% 23.6% 5
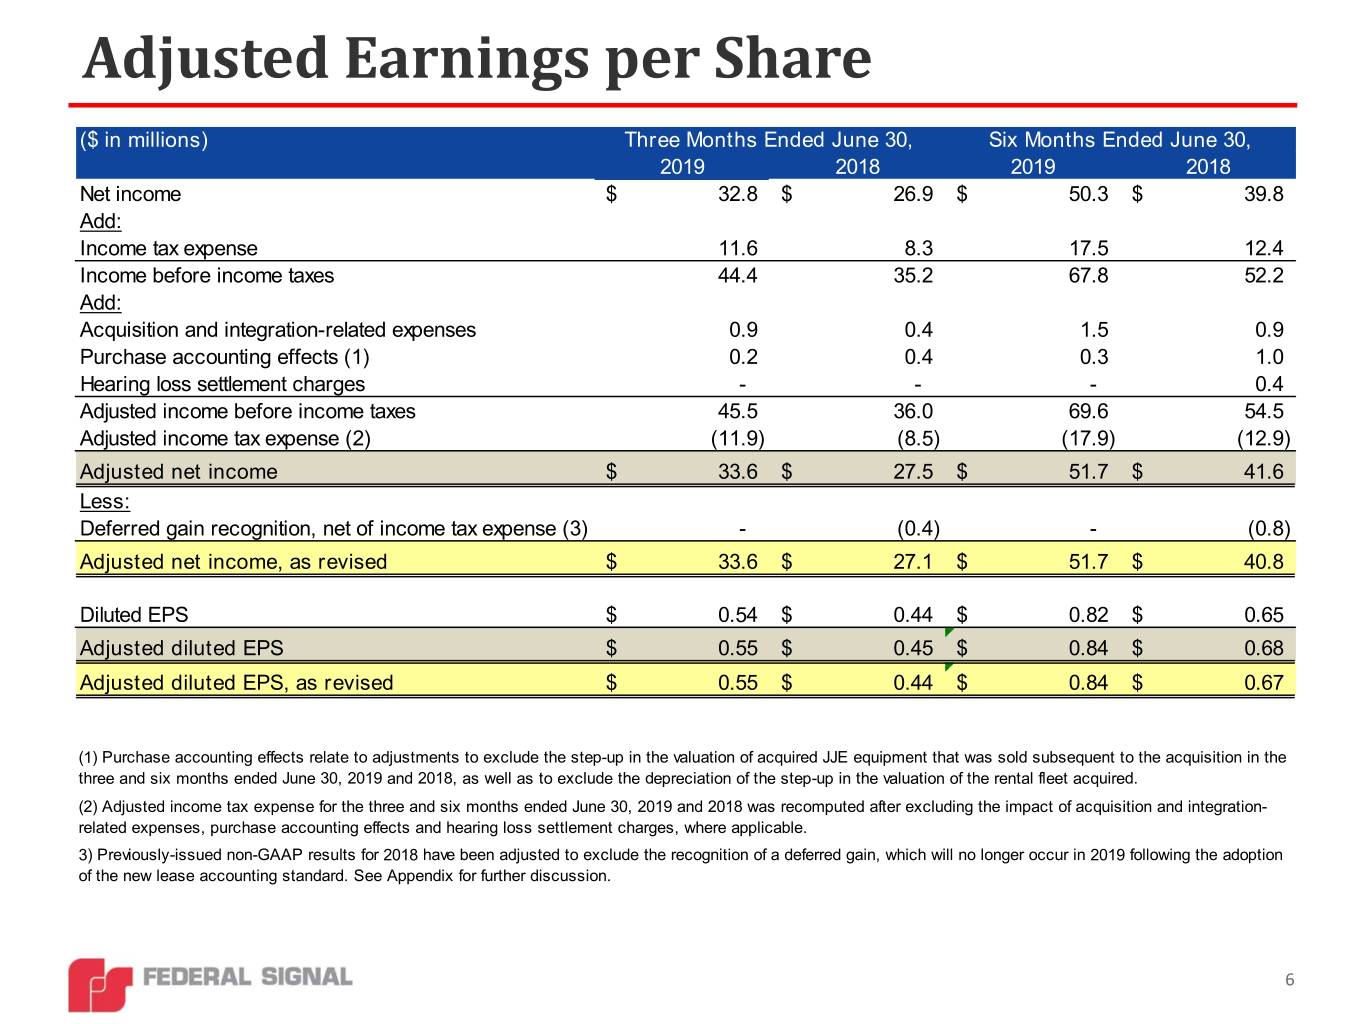
Adjusted Earnings per Share ($ in millions) Three Months Ended June 30, Six Months Ended June 30, 2019 2018 2019 2018 Net income $ 32.8 $ 26.9 $ 50.3 $ 39.8 Add: Income tax expense 11.6 8.3 17.5 12.4 Income before income taxes 44.4 35.2 67.8 52.2 Add: Acquisition and integration-related expenses 0.9 0.4 1.5 0.9 Purchase accounting effects (1) 0.2 0.4 0.3 1.0 Hearing loss settlement charges - - - 0.4 Adjusted income before income taxes 45.5 36.0 69.6 54.5 Adjusted income tax expense (2) (11.9) (8.5) (17.9) (12.9) Adjusted net income $ 33.6 $ 27.5 $ 51.7 $ 41.6 Less: Deferred gain recognition, net of income tax expense (3) - (0.4) - (0.8) Adjusted net income, as revised $ 33.6 $ 27.1 $ 51.7 $ 40.8 Diluted EPS $ 0.54 $ 0.44 $ 0.82 $ 0.65 Adjusted diluted EPS $ 0.55 $ 0.45 $ 0.84 $ 0.68 Adjusted diluted EPS, as revised $ 0.55 $ 0.44 $ 0.84 $ 0.67 (1) Purchase accounting effects relate to adjustments to exclude the step-up in the valuation of acquired JJE equipment that was sold subsequent to the acquisition in the three and six months ended June 30, 2019 and 2018, as well as to exclude the depreciation of the step-up in the valuation of the rental fleet acquired. (2) Adjusted income tax expense for the three and six months ended June 30, 2019 and 2018 was recomputed after excluding the impact of acquisition and integration- related expenses, purchase accounting effects and hearing loss settlement charges, where applicable. 3) Previously-issued non-GAAP results for 2018 have been adjusted to exclude the recognition of a deferred gain, which will no longer occur in 2019 following the adoption of the new lease accounting standard. See Appendix for further discussion. 6
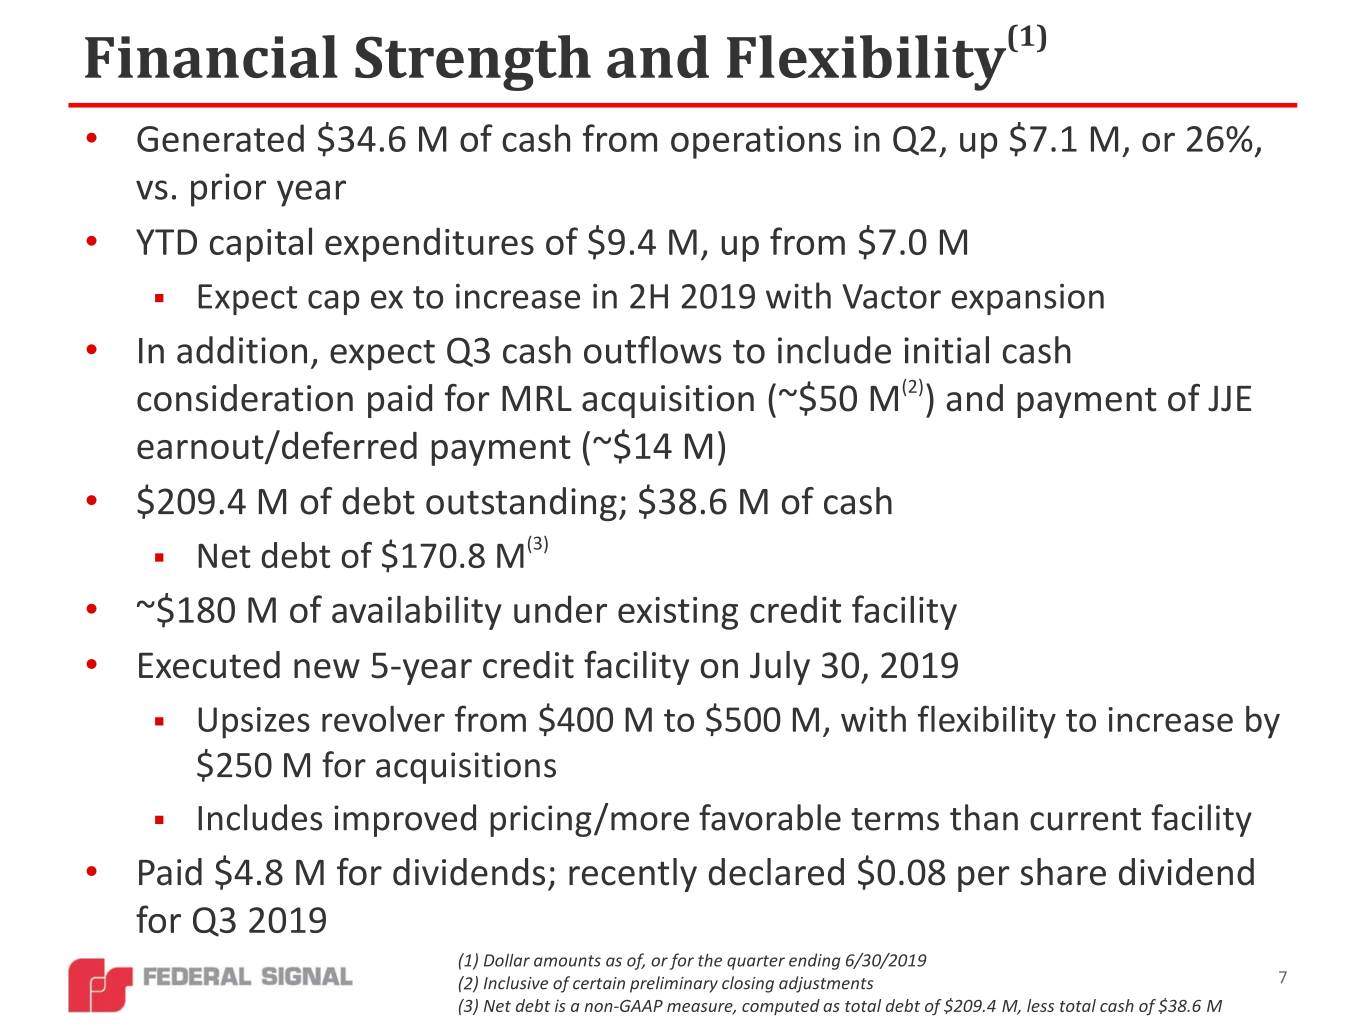
Financial Strength and Flexibility(1) • Generated $34.6 M of cash from operations in Q2, up $7.1 M, or 26%, vs. prior year • YTD capital expenditures of $9.4 M, up from $7.0 M . Expect cap ex to increase in 2H 2019 with Vactor expansion • In addition, expect Q3 cash outflows to include initial cash consideration paid for MRL acquisition (~$50 M(2)) and payment of JJE earnout/deferred payment (~$14 M) • $209.4 M of debt outstanding; $38.6 M of cash . Net debt of $170.8 M(3) • ~$180 M of availability under existing credit facility • Executed new 5-year credit facility on July 30, 2019 . Upsizes revolver from $400 M to $500 M, with flexibility to increase by $250 M for acquisitions . Includes improved pricing/more favorable terms than current facility • Paid $4.8 M for dividends; recently declared $0.08 per share dividend for Q3 2019 (1) Dollar amounts as of, or for the quarter ending 6/30/2019 (2) Inclusive of certain preliminary closing adjustments 7 (3) Net debt is a non-GAAP measure, computed as total debt of $209.4 M, less total cash of $38.6 M
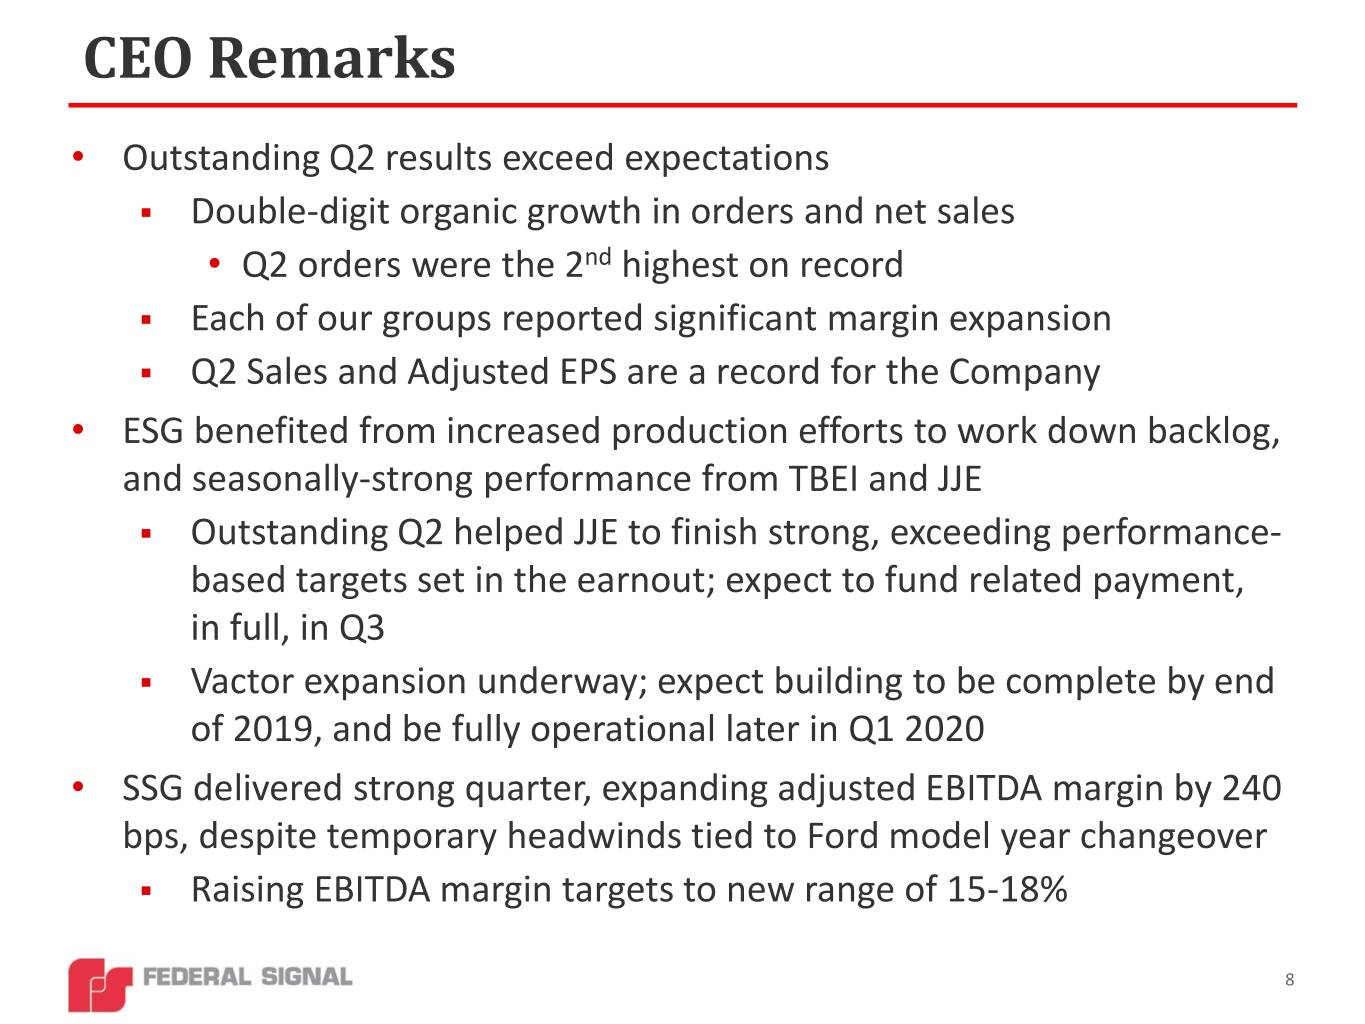
CEO Remarks • Outstanding Q2 results exceed expectations . Double-digit organic growth in orders and net sales • Q2 orders were the 2nd highest on record . Each of our groups reported significant margin expansion . Q2 Sales and Adjusted EPS are a record for the Company • ESG benefited from increased production efforts to work down backlog, and seasonally-strong performance from TBEI and JJE . Outstanding Q2 helped JJE to finish strong, exceeding performance- based targets set in the earnout; expect to fund related payment, in full, in Q3 . Vactor expansion underway; expect building to be complete by end of 2019, and be fully operational later in Q1 2020 • SSG delivered strong quarter, expanding adjusted EBITDA margin by 240 bps, despite temporary headwinds tied to Ford model year changeover . Raising EBITDA margin targets to new range of 15-18% 8
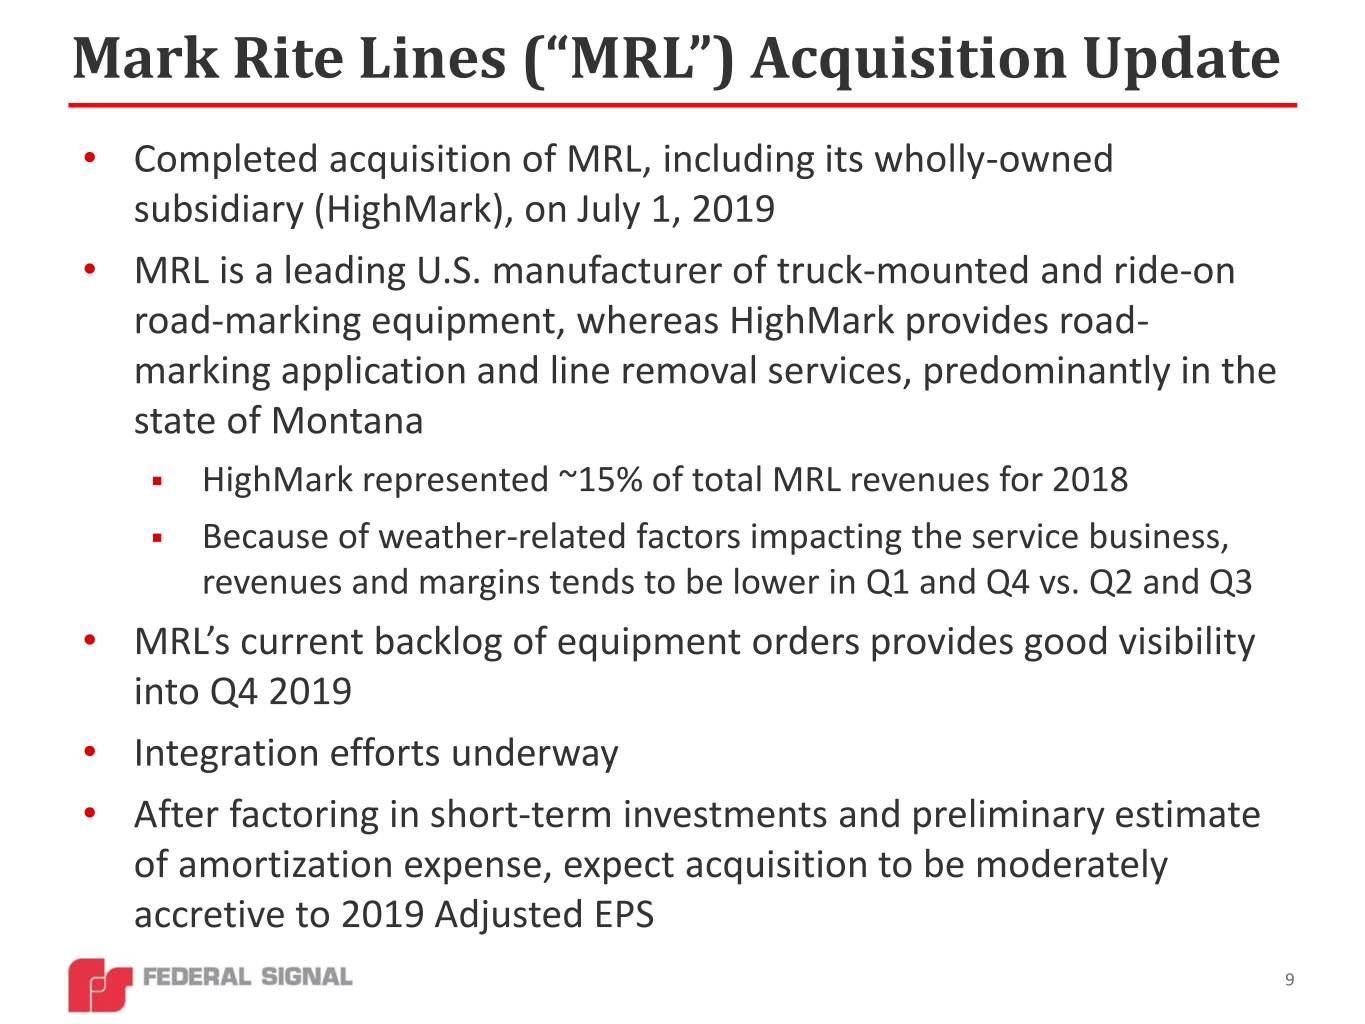
Mark Rite Lines (“MRL”) Acquisition Update • Completed acquisition of MRL, including its wholly-owned subsidiary (HighMark), on July 1, 2019 • MRL is a leading U.S. manufacturer of truck-mounted and ride-on road-marking equipment, whereas HighMark provides road- marking application and line removal services, predominantly in the state of Montana . HighMark represented ~15% of total MRL revenues for 2018 . Because of weather-related factors impacting the service business, revenues and margins tends to be lower in Q1 and Q4 vs. Q2 and Q3 • MRL’s current backlog of equipment orders provides good visibility into Q4 2019 • Integration efforts underway • After factoring in short-term investments and preliminary estimate of amortization expense, expect acquisition to be moderately accretive to 2019 Adjusted EPS 9

2019 Outlook Raising adjusted EPS* outlook range to a new range of $1.64 to $1.72, from a range of $1.50 to $1.60 Key Assumptions . Adjustments to include acquisition-related . Interest expense of ~4% items . . Increase in pension expense (non- Depreciation and amortization expense to operating) of $0.5 M increase by ~$5 M to $6 M vs. 2018 . Effective income tax rate of ~25%- . Not expecting to maintain same level of 26% debt repayment as in 2018: . Cap ex of up to $35 M . Modest contribution from . Including Vactor and Rugby facility recently-acquired MRL expansion projects . JJE earnout to be paid in Q3 * Adjusted EPS is a non-GAAP measure, which includes certain adjustments to reported GAAP net income and diluted EPS. Our outlook assumes certain adjustments to exclude the impact of acquisition and integration-related expenses and purchase accounting effects, where applicable. In 2018, we also made adjustments to exclude the impact of hearing loss settlement charges and special tax items, where applicable. Should any similar items occur during 2019, we would expect to exclude them from the determination of adjusted EPS. However, because of the underlying uncertainty in quantifying amounts which may not yet be known, a reconciliation of our Adjusted EPS outlook to the most applicable GAAP measure is excluded based on the unreasonable efforts exception in Item 10(e)(1)(i)(B). 10
Federal Signal Q2 2019 Earnings Call Q&A July 31, 2019 Jennifer Sherman, President & Chief Executive Officer Ian Hudson, SVP, Chief Financial Officer 11
Investor Information Stock Ticker - NYSE:FSS Company website: federalsignal.com/investors HEADQUARTERS 1415 West 22nd Street, Suite 1100 Oak Brook, IL 60523 INVESTOR RELATIONS CONTACTS 630-954-2000 Ian Hudson Svetlana Vinokur SVP, Chief Financial Officer VP, Treasurer and Corporate Development IHudson@federalsignal.com SVinokur@federalsignal.com 12
Federal Signal Q2 2019 Earnings Call Appendix 13
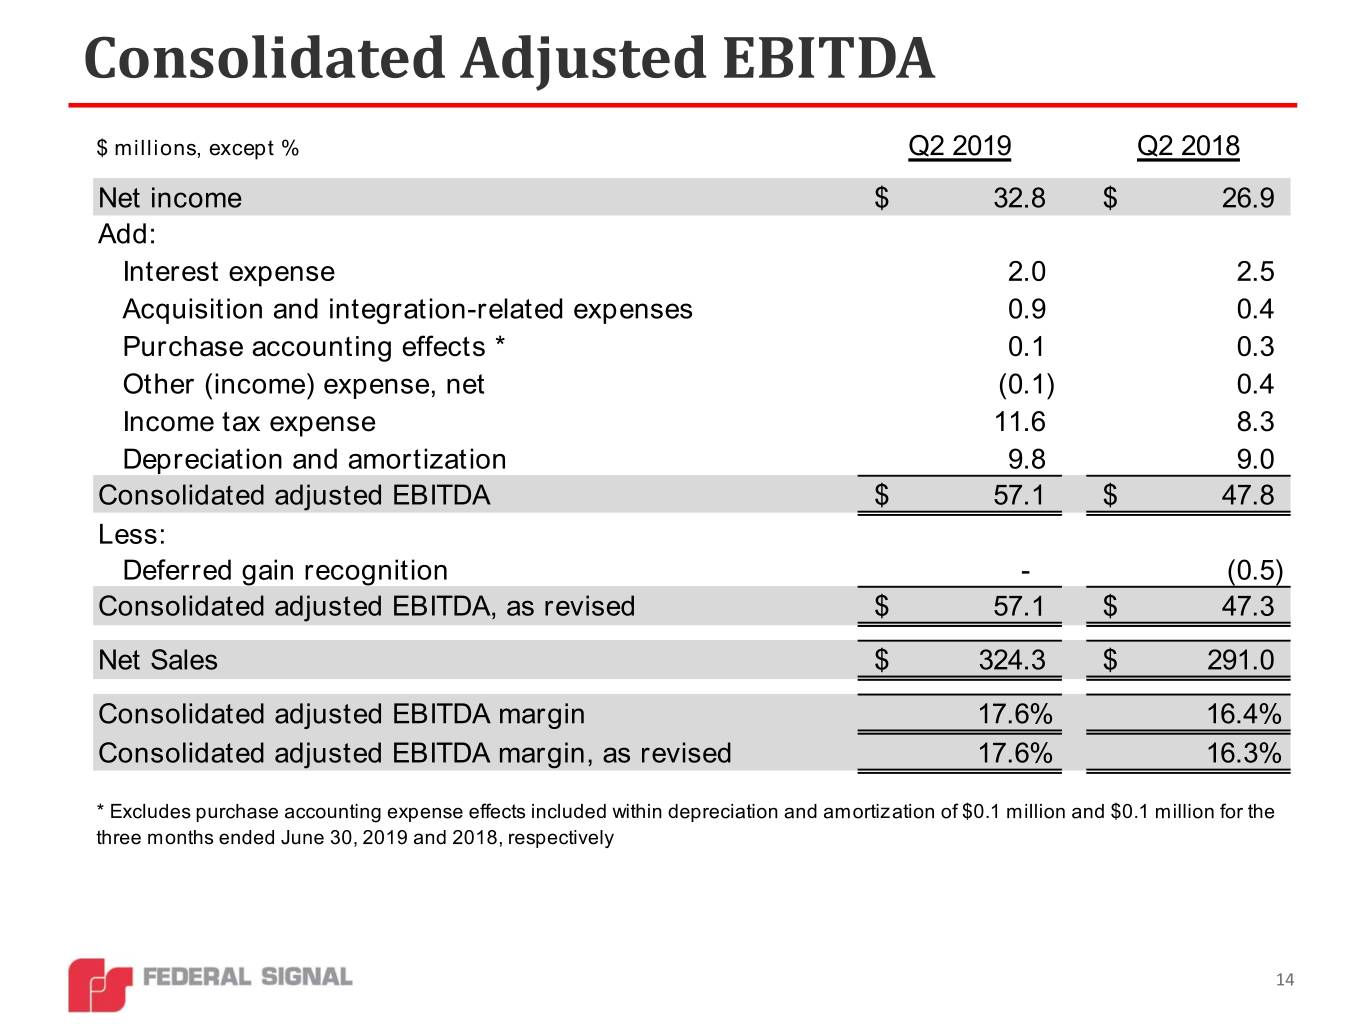
Consolidated Adjusted EBITDA $ millions, except % Q2 2019 Q2 2018 Net income $ 32.8 $ 26.9 Add: Interest expense 2.0 2.5 Acquisition and integration-related expenses 0.9 0.4 Purchase accounting effects * 0.1 0.3 Other (income) expense, net (0.1) 0.4 Income tax expense 11.6 8.3 Depreciation and amortization 9.8 9.0 Consolidated adjusted EBITDA $ 57.1 $ 47.8 Less: Deferred gain recognition - (0.5) Consolidated adjusted EBITDA, as revised $ 57.1 $ 47.3 Net Sales $ 324.3 $ 291.0 Consolidated adjusted EBITDA margin 17.6% 16.4% Consolidated adjusted EBITDA margin, as revised 17.6% 16.3% * Excludes purchase accounting expense effects included within depreciation and amortization of $0.1 million and $0.1 million for the three months ended June 30, 2019 and 2018, respectively 14
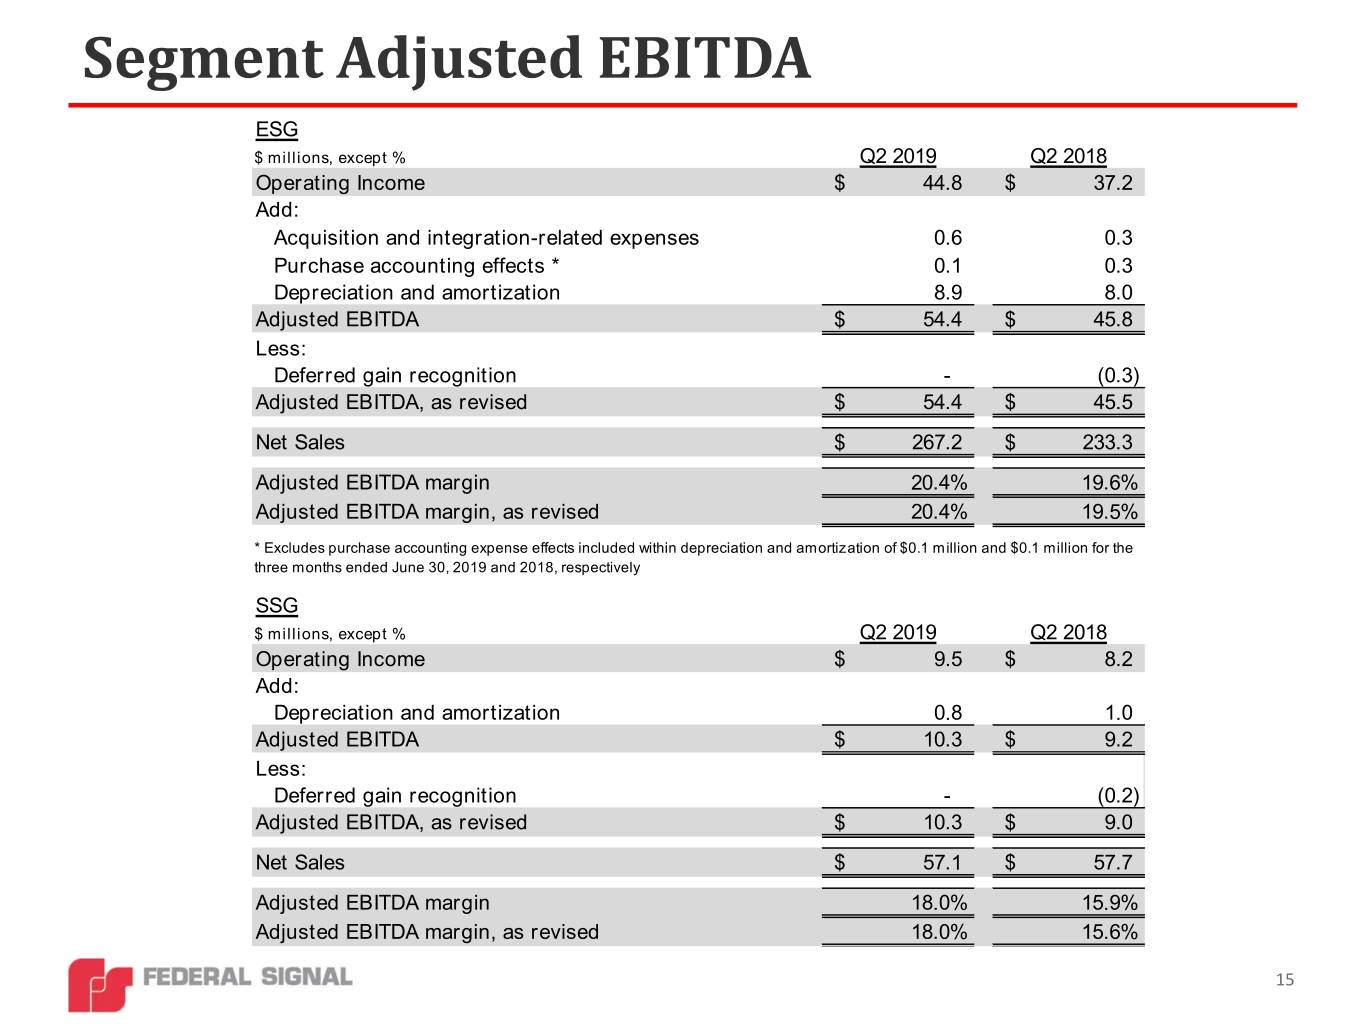
Segment Adjusted EBITDA ESG $ millions, except % Q2 2019 Q2 2018 Operating Income $ 44.8 $ 37.2 Add: Acquisition and integration-related expenses 0.6 0.3 Purchase accounting effects * 0.1 0.3 Depreciation and amortization 8.9 8.0 Adjusted EBITDA $ 54.4 $ 45.8 Less: Deferred gain recognition - (0.3) Adjusted EBITDA, as revised $ 54.4 $ 45.5 Net Sales $ 267.2 $ 233.3 Adjusted EBITDA margin 20.4% 19.6% Adjusted EBITDA margin, as revised 20.4% 19.5% * Excludes purchase accounting expense effects included within depreciation and amortization of $0.1 million and $0.1 million for the three months ended June 30, 2019 and 2018, respectively SSG $ millions, except % Q2 2019 Q2 2018 Operating Income $ 9.5 $ 8.2 Add: Depreciation and amortization 0.8 1.0 Adjusted EBITDA $ 10.3 $ 9.2 Less: Deferred gain recognition - (0.2) Adjusted EBITDA, as revised $ 10.3 $ 9.0 Net Sales $ 57.1 $ 57.7 Adjusted EBITDA margin 18.0% 15.9% Adjusted EBITDA margin, as revised 18.0% 15.6% 15
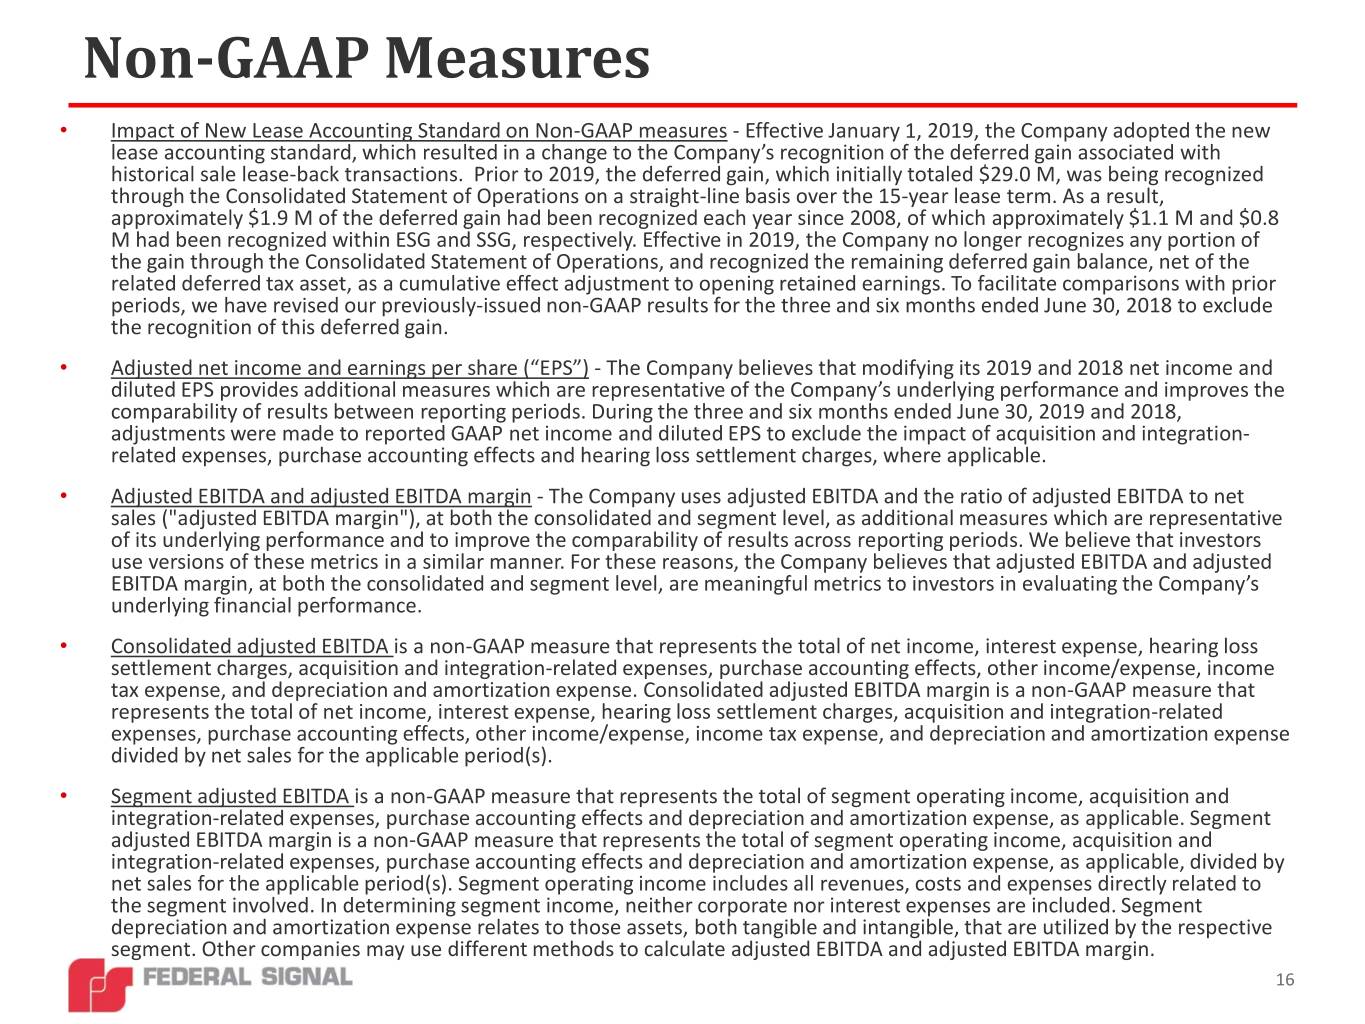
Non-GAAP Measures • Impact of New Lease Accounting Standard on Non-GAAP measures - Effective January 1, 2019, the Company adopted the new lease accounting standard, which resulted in a change to the Company’s recognition of the deferred gain associated with historical sale lease-back transactions. Prior to 2019, the deferred gain, which initially totaled $29.0 M, was being recognized through the Consolidated Statement of Operations on a straight-line basis over the 15-year lease term. As a result, approximately $1.9 M of the deferred gain had been recognized each year since 2008, of which approximately $1.1 M and $0.8 M had been recognized within ESG and SSG, respectively. Effective in 2019, the Company no longer recognizes any portion of the gain through the Consolidated Statement of Operations, and recognized the remaining deferred gain balance, net of the related deferred tax asset, as a cumulative effect adjustment to opening retained earnings. To facilitate comparisons with prior periods, we have revised our previously-issued non-GAAP results for the three and six months ended June 30, 2018 to exclude the recognition of this deferred gain. • Adjusted net income and earnings per share (“EPS”) - The Company believes that modifying its 2019 and 2018 net income and diluted EPS provides additional measures which are representative of the Company’s underlying performance and improves the comparability of results between reporting periods. During the three and six months ended June 30, 2019 and 2018, adjustments were made to reported GAAP net income and diluted EPS to exclude the impact of acquisition and integration- related expenses, purchase accounting effects and hearing loss settlement charges, where applicable. • Adjusted EBITDA and adjusted EBITDA margin - The Company uses adjusted EBITDA and the ratio of adjusted EBITDA to net sales ("adjusted EBITDA margin"), at both the consolidated and segment level, as additional measures which are representative of its underlying performance and to improve the comparability of results across reporting periods. We believe that investors use versions of these metrics in a similar manner. For these reasons, the Company believes that adjusted EBITDA and adjusted EBITDA margin, at both the consolidated and segment level, are meaningful metrics to investors in evaluating the Company’s underlying financial performance. • Consolidated adjusted EBITDA is a non-GAAP measure that represents the total of net income, interest expense, hearing loss settlement charges, acquisition and integration-related expenses, purchase accounting effects, other income/expense, income tax expense, and depreciation and amortization expense. Consolidated adjusted EBITDA margin is a non-GAAP measure that represents the total of net income, interest expense, hearing loss settlement charges, acquisition and integration-related expenses, purchase accounting effects, other income/expense, income tax expense, and depreciation and amortization expense divided by net sales for the applicable period(s). • Segment adjusted EBITDA is a non-GAAP measure that represents the total of segment operating income, acquisition and integration-related expenses, purchase accounting effects and depreciation and amortization expense, as applicable. Segment adjusted EBITDA margin is a non-GAAP measure that represents the total of segment operating income, acquisition and integration-related expenses, purchase accounting effects and depreciation and amortization expense, as applicable, divided by net sales for the applicable period(s). Segment operating income includes all revenues, costs and expenses directly related to the segment involved. In determining segment income, neither corporate nor interest expenses are included. Segment depreciation and amortization expense relates to those assets, both tangible and intangible, that are utilized by the respective segment. Other companies may use different methods to calculate adjusted EBITDA and adjusted EBITDA margin. 16
