
Disciplined Growth Investor Presentation March 2023

This presentation contains unaudited financial information and forward-looking statements. Statements that are not historical are forward-looking statements and may contain words such as “may”, “will” ,“believe”, “expect”, “anticipate”, “intend”, “plan”, “project”, “estimate”, and “objective” or similar terminology, concerning the company’s future financial performance, business strategy, plans, goals and objectives. These expressions are intended to identify forward-looking statements within the meaning of the Private Securities Litigation Reform Act of 1995. Forward-looking statements include information concerning the Company’s possible or assumed future performance or results of operations and are not guarantees. While these statements are based on assumptions and judgments that management has made in light of industry experience as well as perceptions of historical trends, current conditions, expected future developments and other factors believed to be appropriate under the circumstances, they are subject to risks, uncertainties and other factors that may cause the Company’s actual results, performance or achievements to be materially different. Such risks and uncertainties include, but are not limited to: direct and indirect impacts of the coronavirus pandemic and the associated government response, risks and adverse economic effects associated with emerging geopolitical conflicts, product and price competition, supply chain disruptions, work stoppages, availability and pricing of raw materials, cybersecurity risks, risks associated with acquisitions such as integration of operations and achieving anticipated revenue and cost benefits, foreign currency exchange rate changes, interest rate changes, increased legal expenses and litigation results, legal and regulatory developments and other risks and uncertainties described in filings with the Securities and Exchange Commission (“SEC”). Such forward-looking statements are made as of the date hereof and we undertake no obligation to update these forward-looking statements regardless of new developments or otherwise. This presentation also contains certain measures that are not in accordance with U.S. generally accepted accounting principles (“GAAP”). The non-GAAP financial information presented herein should be considered supplemental to, and not a substitute for, or superior to, financial measures calculated in accordance with GAAP. The Company has provided this supplemental information to investors, analysts, and other interested parties to enable them to perform additional analyses of operating results, to illustrate the results of operations giving effect to the non-GAAP adjustments shown in the reconciliations, and to provide an additional measure of performance which management considers in operating the business. A reconciliation of these items to the most comparable GAAP measures is provided in our filings with the SEC and/or in the Appendix to this presentation. Safe Harbor Statement 2
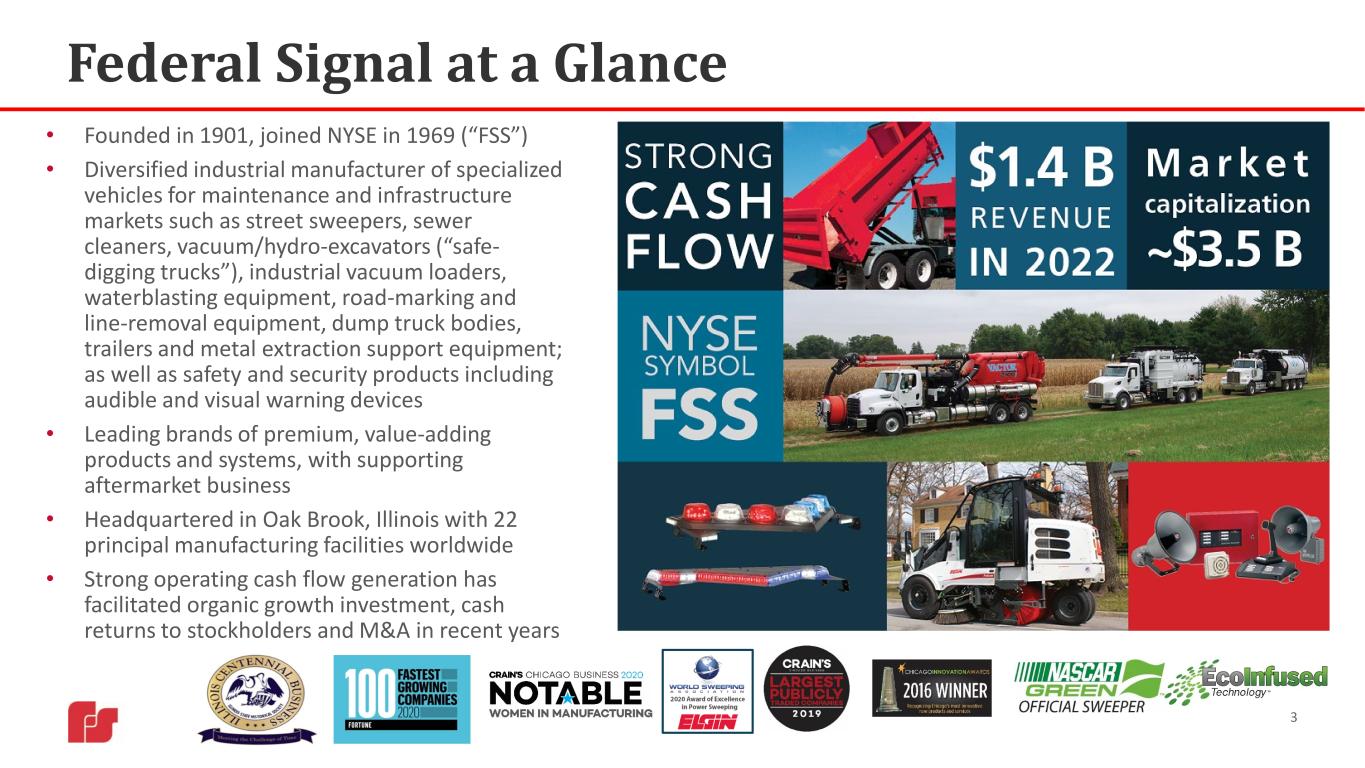
Federal Signal at a Glance • Founded in 1901, joined NYSE in 1969 (“FSS”) • Diversified industrial manufacturer of specialized vehicles for maintenance and infrastructure markets such as street sweepers, sewer cleaners, vacuum/hydro-excavators (“safe- digging trucks”), industrial vacuum loaders, waterblasting equipment, road-marking and line-removal equipment, dump truck bodies, trailers and metal extraction support equipment; as well as safety and security products including audible and visual warning devices • Leading brands of premium, value-adding products and systems, with supporting aftermarket business • Headquartered in Oak Brook, Illinois with 22 principal manufacturing facilities worldwide • Strong operating cash flow generation has facilitated organic growth investment, cash returns to stockholders and M&A in recent years 3

Why Federal Signal? 4 Composition of Businesses • Clearly-defined strategy, with two groups – ESG and SSG – each of which have strong growth potential through a combination of organic initiatives and M&A End Market Exposures • Typical annual revenue mix of ~50% publicly-funded / ~50% industrial • Publicly-funded revenues derived from sale of essential products to municipalities in the U.S., Canada, Europe and Latin America; sewer cleaner purchases typically funded through water taxes • Within industrial, markets at different points in the cycle such as construction, utility, oil and gas, infrastructure, waste, rendering, landscaping, military Revenue Streams • Balanced portfolio of new and used equipment sales and other aftermarket offerings including parts, rentals and service; • Aftermarket revenues represented ~27% of ESG’s sales in 2022 Financial Position • Increased borrowing capacity by executing new, 5-year $800 M credit facility in October 2022 • Low debt leverage; strong balance sheet and healthy cash flow generation Opportunity for M&A • Completed acquisitions of TowHaul (Q4 2022) and Blasters (Q1 2023); Trackless acquisition signed February 2023, with closing expected Q2 2023 • Ample opportunity for further M&A due to strong financial position, active pipeline and clear view of what we are looking for in acquisition candidates Operational Performance • Consistent performance within target EBITDA margin ranges • Focus on operational excellence, with Eighty-Twenty Improvement (“ETI”) initiatives the cornerstone of our operational philosophies New Product Development (“NPD”) • Customer-focused NPD process with emphasis on electrification initiatives; several recent EV product launches
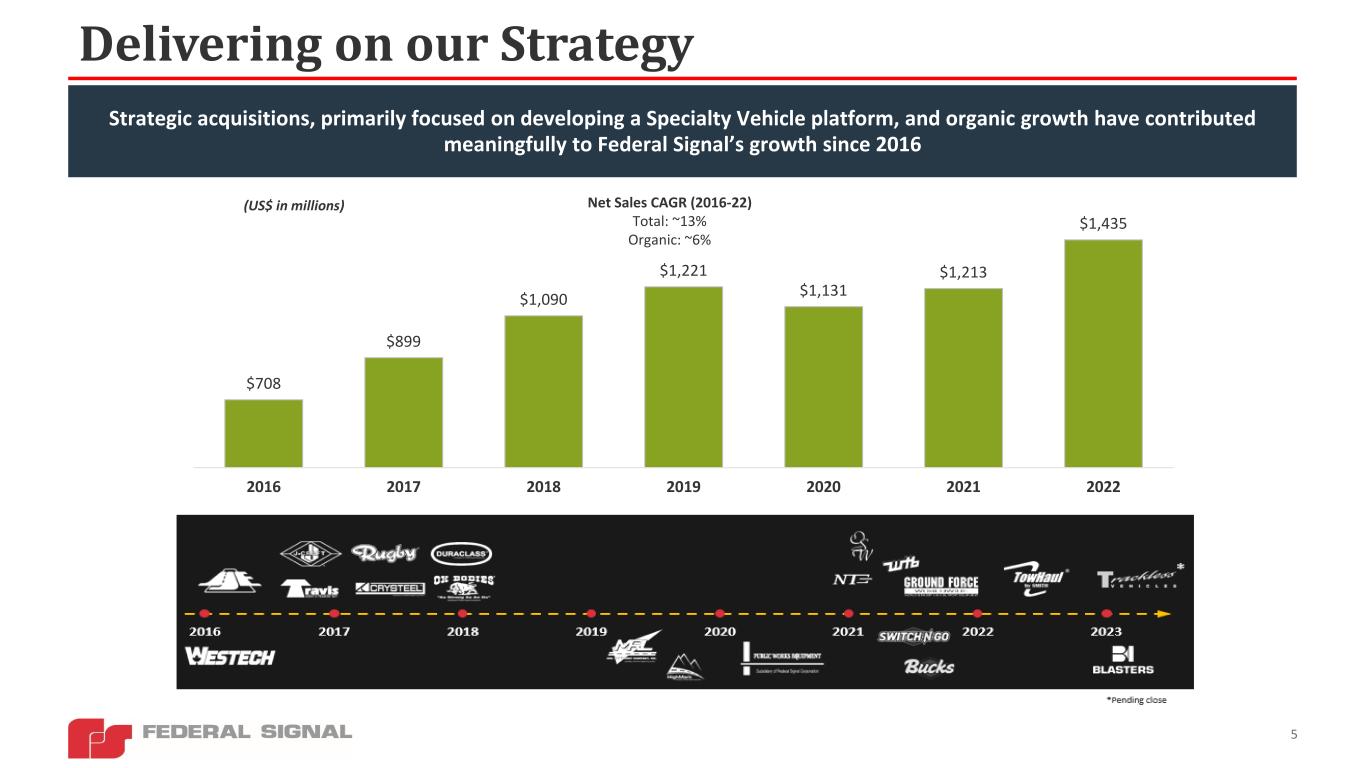
$708 $899 $1,090 $1,221 $1,131 $1,213 $1,435 2016 2017 2018 2019 2020 2021 2022 Delivering on our Strategy 5 Net Sales CAGR (2016-22) Total: ~13% Organic: ~6% Strategic acquisitions, primarily focused on developing a Specialty Vehicle platform, and organic growth have contributed meaningfully to Federal Signal’s growth since 2016 (US$ in millions)

Serves the needs of municipalities and industrial verticals for audible and visual safety and security notification devices and systems Two Attractive Platforms 6 *2022 net sales Environmental Solutions Group (ESG) Safety and Security Systems Group (SSG) $1.19 B* $244 M* Serves publicly-funded, industrial, and utility markets for surface and sub-surface cleaning, safe-digging, road-marking, infrastructure maintenance and material hauling 6 • Lights and Sirens • Signaling Devices • Warning Systems • Street Sweeping • Sewer Cleaning • Safe Digging • Industrial Cleaning • Dump Bodies and Trailers • Metal Extraction Support • Road-Marking and Line-Removal Se gm en t M ar ke ts Pr od uc ts
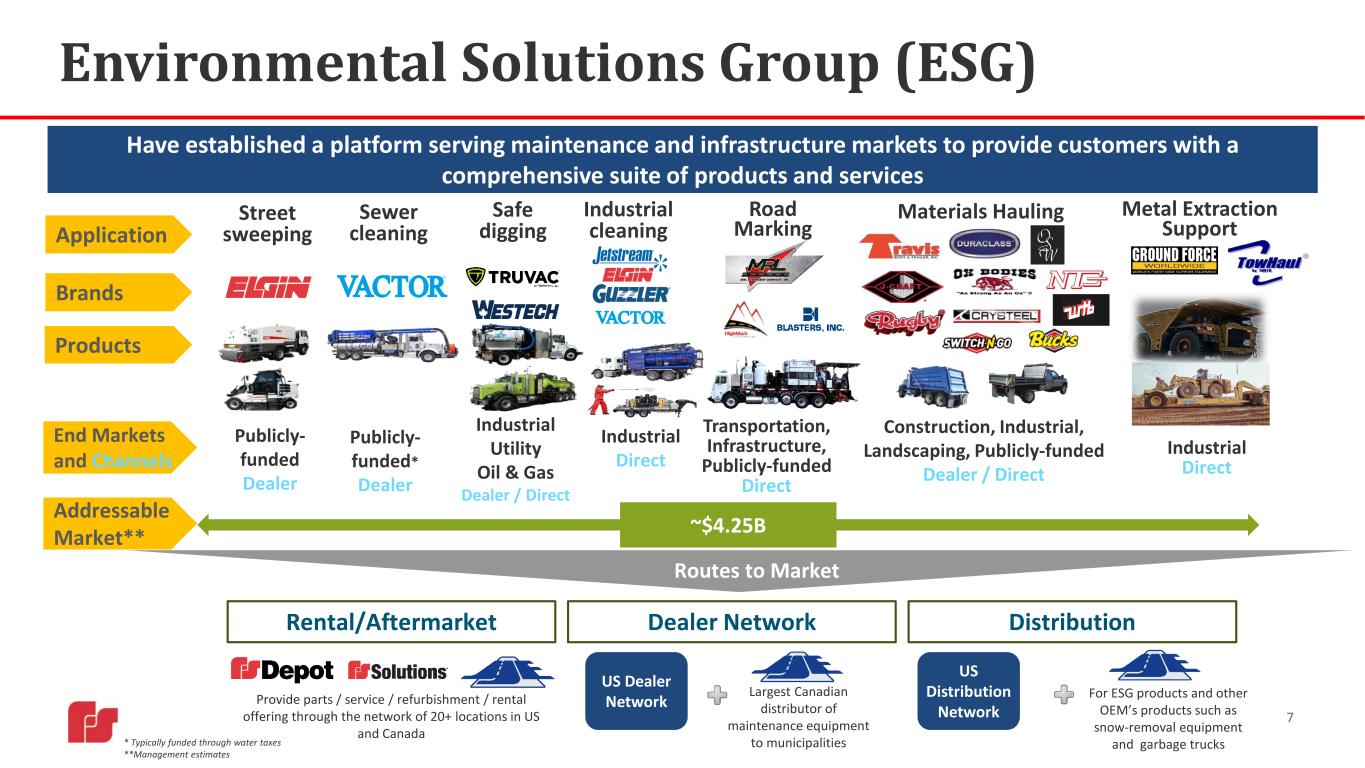
7 Environmental Solutions Group (ESG) Have established a platform serving maintenance and infrastructure markets to provide customers with a comprehensive suite of products and services Rental/Aftermarket Distribution Brands End Markets and Channels Street sweeping Publicly- funded Dealer Sewer cleaning Publicly- funded* Dealer Safe digging Industrial Utility Oil & Gas Dealer / Direct Industrial cleaning Industrial Direct Application Products Provide parts / service / refurbishment / rental offering through the network of 20+ locations in US and Canada Largest Canadian distributor of maintenance equipment to municipalities For ESG products and other OEM’s products such as snow-removal equipment and garbage trucks Materials Hauling Dealer Network Construction, Industrial, Landscaping, Publicly-funded Dealer / Direct Addressable Market** Routes to Market US Dealer Network ~$4.25B US Distribution Network * Typically funded through water taxes **Management estimates Metal Extraction Support Industrial Direct Road Marking Transportation, Infrastructure, Publicly-funded Direct
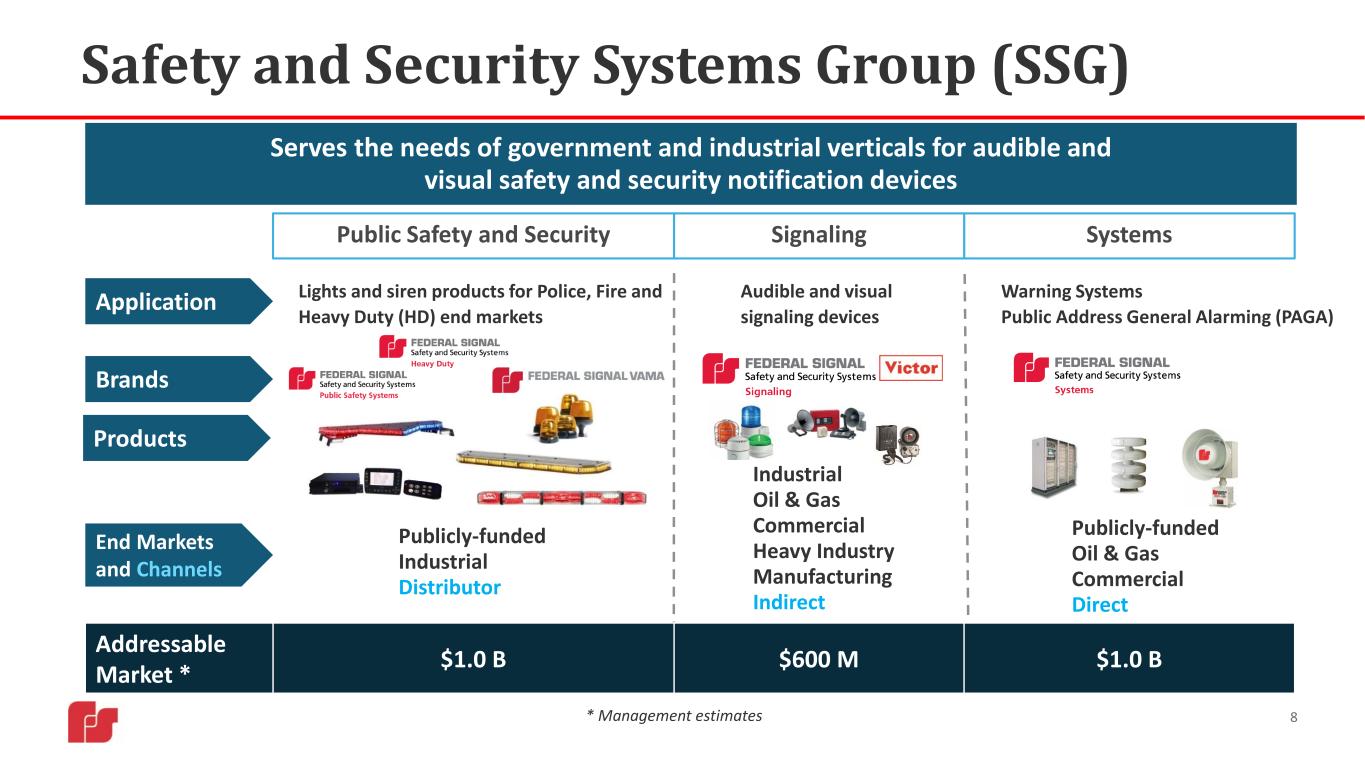
Safety and Security Systems Group (SSG) 8 Serves the needs of government and industrial verticals for audible and visual safety and security notification devices Public Safety and Security Signaling Systems Brands Lights and siren products for Police, Fire and Heavy Duty (HD) end markets Audible and visual signaling devices Publicly-funded Industrial Distributor Industrial Oil & Gas Commercial Heavy Industry Manufacturing Indirect Warning Systems Public Address General Alarming (PAGA) Publicly-funded Oil & Gas Commercial Direct Application End Markets and Channels Products * Management estimates Addressable Market * $1.0 B $600 M $1.0 B

Macro Factors Driving Demand Infrastructure Bill • $550 billion of government spending over five years to fund improvements to the nation’s transportation, water, electric power and digital infrastructure • Federal Signal’s equipment sales and rentals of materials hauling, road-marking, street sweeping, sewer cleaning, safe digging, and industrial cleaning equipment stand to benefit from an infrastructure investment . Proposed Infrastructure Spending Allocation Plan COVID Relief Stimulus • $350 billion of government spending designated for cities, states, tribal governments and U.S. territories • First $175 billion tranche distributed in 2021; second $175 billion tranche distributed in 2022. Funds to be obligated by end of 2024 and expended by end of 2026. • As a provider of equipment used to support essential services such as sewer cleaning and street sweeping, Federal Signal is well-positioned to meet the needs of its customers Product Portfolio Federal Signal’s diverse portfolio of specialty vehicles is well-positioned to capitalize on favorable macro trends across its core end markets 9 Metal Extraction Support
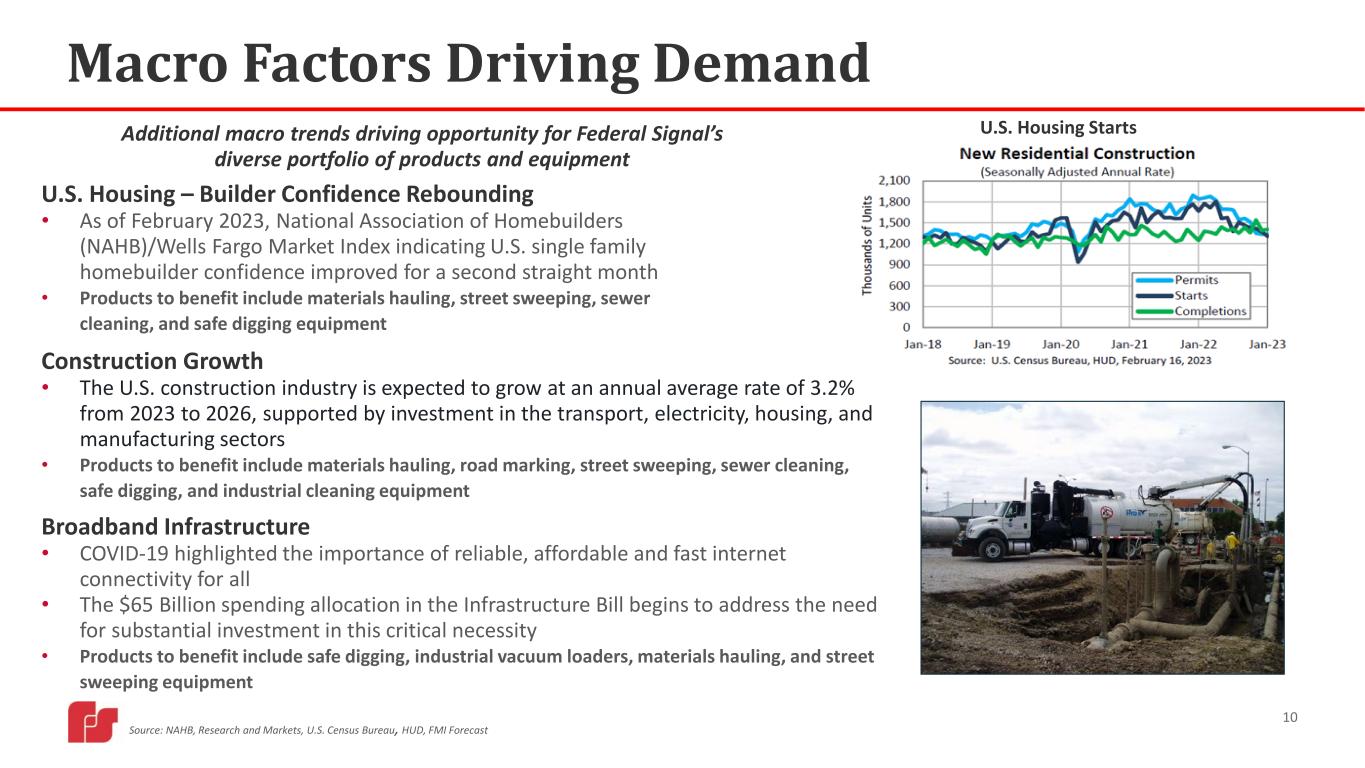
Macro Factors Driving Demand Source: NAHB, Research and Markets, U.S. Census Bureau, HUD, FMI Forecast U.S. Housing – Builder Confidence Rebounding • As of February 2023, National Association of Homebuilders (NAHB)/Wells Fargo Market Index indicating U.S. single family homebuilder confidence improved for a second straight month • Products to benefit include materials hauling, street sweeping, sewer cleaning, and safe digging equipment Construction Growth • The U.S. construction industry is expected to grow at an annual average rate of 3.2% from 2023 to 2026, supported by investment in the transport, electricity, housing, and manufacturing sectors • Products to benefit include materials hauling, road marking, street sweeping, sewer cleaning, safe digging, and industrial cleaning equipment U.S. Housing Starts Broadband Infrastructure • COVID-19 highlighted the importance of reliable, affordable and fast internet connectivity for all • The $65 Billion spending allocation in the Infrastructure Bill begins to address the need for substantial investment in this critical necessity • Products to benefit include safe digging, industrial vacuum loaders, materials hauling, and street sweeping equipment Additional macro trends driving opportunity for Federal Signal’s diverse portfolio of products and equipment 10

Key Strategic Initiatives 11 Supported By Ar ea s o f Fo cu s Safe Digging Aftermarket Parts and Services Specialty Vehicles for Diverse End-Markets Audible and Visual Warning Devices Flexible Manufacturing & “ETI” Culture New Product Development Technology as an Enabler Disciplined M&A

Strategic Initiative– Safe Digging 12 Federal Signal is well positioned to establish a leading position in an emerging application for vacuum-excavation technology; increased regulation expected to accelerate growth What is it? • Vacuum excavation or “Safe Digging” involves the use of pressurized air or water (“hydro-excavation”) to dig (coupled with a vacuum system) as an alternative to the use of traditional equipment such as backhoes and mechanical excavators • Acceptance of safe-digging applications continues to improve significantly over the last decade • Application has been widely accepted in Canada; US is behind but great early indicators – 19 states now include vacuum excavation as part of “safe excavation practices” Why is it Attractive? • In many circumstances, vacuum excavation is a safer and more productive means for digging (in comparison to traditional excavation) • Significantly minimizes chances of damage to underground infrastructure during the digging process • Less intrusive to the surrounding site at point of digging; environmental benefits • Provides significant environmental benefits by minimizing damage to tree roots (as demonstrated in the image below) • Provides opportunity for the use of our broad range of offerings in new and emerging end markets beyond oil and gas Why Federal Signal? • Sole manufacturer of complete range of truck-mounted safe-digging equipment, with applications across a number of end-markets • Optional safe-digging package offered with sewer cleaner product line; included in ~70% sewer cleaner orders • 30-year track record of manufacturing leading vacuum- excavation products • Widest service and support network for vacuum- excavation products • Best-in-class payload for Ontario market • Dedicated and experienced sales organization in place to support initiative • 2022 orders for safe-digging trucks up 41% YoY

Continued M&A Execution Grass Attachments Maintenance Attachments MT7 Tractor Snow AttachmentsLiquidator Certified Pre-Owned Water Blasters Rentals Contracting • Fills critical product gap in road marking/line-removal business and establishes Florida location for other aftermarket opportunities • Transaction closed on January 4, 2023 • Manufacturer of multi-purpose, off-road municipal tractors and a variety of attachments • Attractive aftermarket business with opportunities to leverage distribution channel • Signed February 23, 2023; transaction expected to close during Q2 2023 13 Lowboy Trailer Multi-Purpose Gooseneck Road Conditioning Truck Dragline Bucket Transporter • Product line addition to Ground Force (acquired in 2021) • Establishes platform serving a global customer base within the metal and minerals extraction industry • Transaction closed on October 3, 2022

14 Net Sales Full Year 2022 Highlights3: • Record net sales of $1.43B, up $222M, or 18%, with organic growth of $130M, or 11% • Operating income of $160.8M, up $30.1M, or 23% • Adjusted EBITDA* of $215.0M, up $34.5M, or 19% • Adjusted EBITDA margin* of 15.0%, up from 14.9% • GAAP EPS of $1.97, up $0.34, or 21% • Record adjusted EPS* of $1.96, up $0.21, or 12% • Record orders of $1.69B, up $153M, or 10% • Record backlog of $879M, up $250M, or 40% • Cash and cash equivalents of $48M and ~$428M of availability under credit facility • Net debt of ~$316M4 Adjusted EBITDA Margin* (Consolidated) Financial Overview *Adjusted EBITDA, Adjusted EBITDA Margin and Adjusted EPS are non-GAAP measures. See Appendix for additional information, including reconciliation to GAAP measures. Orders Target EBITDA Margin ranges1 • ESG: 15% - 18% • SSG: 17% - 21% (new) 2 • Consolidated: 12% - 16% Historical EBITDA margins and targets place Federal Signal in the top tier of its peer group of specialty vehicle manufacturers 1. Underlying assumptions: Absence of extraordinary factors affecting demand from end-markets; No unusual hearing loss litigation expenses 2. Increased SSG target margin range in March 2023 from the previous range of 15% to 18% 3. Comparisons to full year 2021 4. Net debt is a non-GAAP measure, computed as total debt of $363.0M, less total cash and cash equivalents of $47.5M 1,018 1,173 1,269 1,047 1,539 1,692 806 946 1,038 840 1,297 1,444 212 227 231 207 242 248 2017 2018 2019 2020 2021 2022 $ in m ill io ns ESG SSG 12.4% 14.6% 15.7% 16.1% 14.9% 15.0% 2017 2018 2019 2020 2021 2022Ad ju st ed E BI TD A M ar gi n % 899 1,090 1,221 1,131 1,213 1,435 693 864 993 916 1,004 1,191 206 226 228 215 209 244 2017 2018 2019 2020 2021 2022 $ in m ill io ns ESG SSG
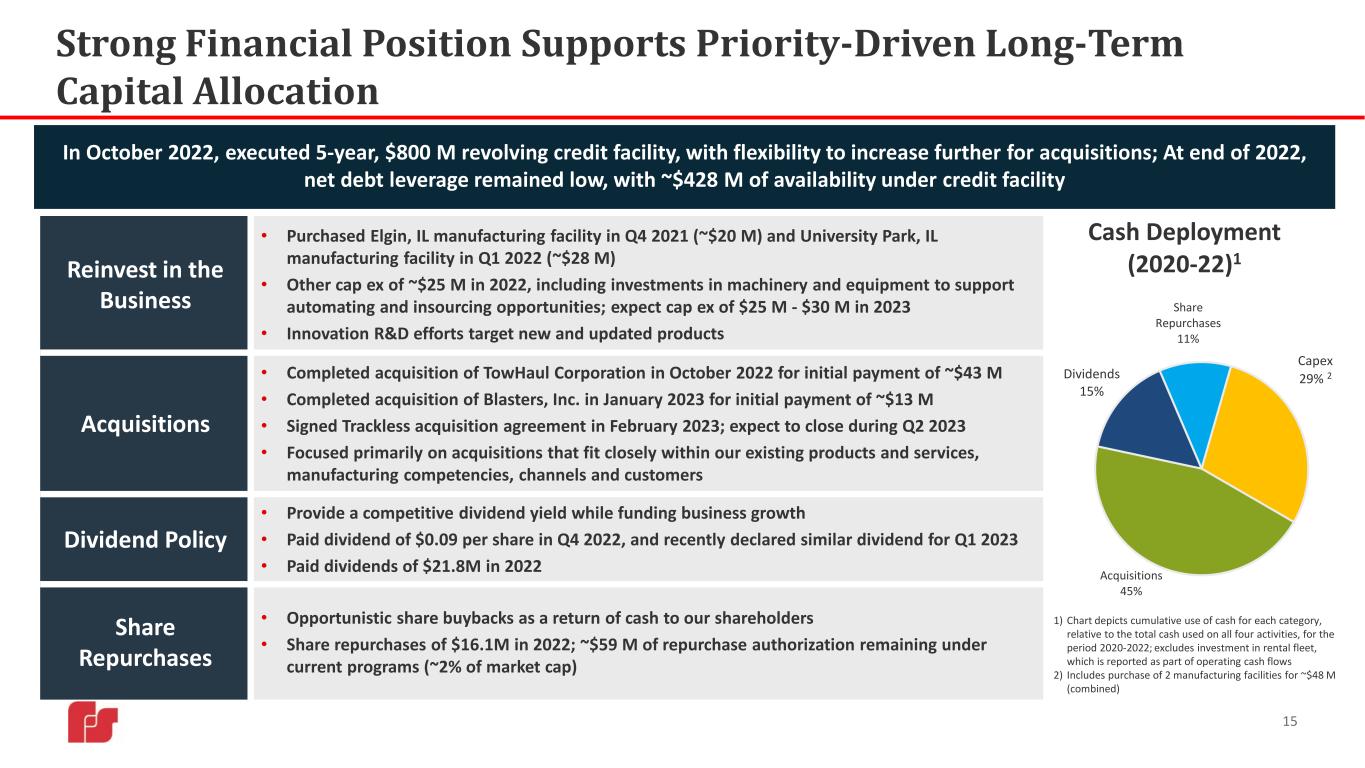
Strong Financial Position Supports Priority-Driven Long-Term Capital Allocation 15 Capex 29% 2 Acquisitions 45% Dividends 15% Share Repurchases 11% Cash Deployment (2020-22)1 1) Chart depicts cumulative use of cash for each category, relative to the total cash used on all four activities, for the period 2020-2022; excludes investment in rental fleet, which is reported as part of operating cash flows 2) Includes purchase of 2 manufacturing facilities for ~$48 M (combined) Reinvest in the Business • Purchased Elgin, IL manufacturing facility in Q4 2021 (~$20 M) and University Park, IL manufacturing facility in Q1 2022 (~$28 M) • Other cap ex of ~$25 M in 2022, including investments in machinery and equipment to support automating and insourcing opportunities; expect cap ex of $25 M - $30 M in 2023 • Innovation R&D efforts target new and updated products Acquisitions • Completed acquisition of TowHaul Corporation in October 2022 for initial payment of ~$43 M • Completed acquisition of Blasters, Inc. in January 2023 for initial payment of ~$13 M • Signed Trackless acquisition agreement in February 2023; expect to close during Q2 2023 • Focused primarily on acquisitions that fit closely within our existing products and services, manufacturing competencies, channels and customers Dividend Policy • Provide a competitive dividend yield while funding business growth • Paid dividend of $0.09 per share in Q4 2022, and recently declared similar dividend for Q1 2023 • Paid dividends of $21.8M in 2022 Share Repurchases • Opportunistic share buybacks as a return of cash to our shareholders • Share repurchases of $16.1M in 2022; ~$59 M of repurchase authorization remaining under current programs (~2% of market cap) In October 2022, executed 5-year, $800 M revolving credit facility, with flexibility to increase further for acquisitions; At end of 2022, net debt leverage remained low, with ~$428 M of availability under credit facility

2023 Outlook Adjusted EPS* ranging from $2.15 to $2.40 Would represent highest EPS in Company’s history and YoY growth of 10%-22%, despite aggregate headwind of ~$0.23 from higher interest expense and normalization of tax rate 16 Revenue of $1.58 B to $1.72 B; represents YoY growth of 10%- 20% vs. $1.43 B in 2022 Double-digit improvement in pre-tax earnings Depreciation and amortization expense of ~$62 M -$65 M Capital expenditures of $25 M to $30 M Interest expense of ~$18-20 M; YoY EPS headwind of ~$0.11 Effective tax rate resets to a normalized rate between 25% and 26%, excluding discrete items; YoY EPS headwind of ~$0.12 ~61-62 M weighted average shares outstanding Key Assumptions YoY earnings improvement expected in Q1, although seasonal effects typically result in Q1 earnings being lower than subsequent quarters Expect Q1 2023 earnings to represent similar % of full- year earnings as in 2022 No significant deterioration in current supply chain environment; assumes supply chain improves throughout year, with steady flow of customer-provided chassis No significant increase in current input costs Includes nominal contribution from Trackless acquisition, expected to close during Q2 *Adjusted earnings per share (“EPS”) is a non-GAAP measure, which includes certain adjustments to reported GAAP net income and diluted EPS. In 2022, we made adjustments to exclude the impact of acquisition and integration-related expenses (benefits) and debt settlement charges, where applicable. Should any similar items occur in 2023, we would expect to exclude them from the determination of adjusted EPS. However, because of the underlying uncertainty in quantifying amounts which may not yet be known, a reconciliation of our Adjusted EPS outlook to the most applicable GAAP measure is excluded based on the unreasonable efforts exception in Item 10(e)(1)(i)(B).

Positioned for Long-Term Growth 17 Long-Term Organic Revenue Growth Value-Added Acquisitions (Couple of % points > GDP) ESG: 15-18% SSG: 17-21% (new) Consolidated: 12-16% High Single Digit Revenue Growth EBITDA Margin Targets: Cash Conversion: ~100% of net income ROIC > Cost of Capital With continued focus on organic growth and M&A, and margin performance above that of many of our peers, our financial framework aims to create long-term shareholder value

Appendix 18 I. Segments Overview II. Environmental, Social and Governance Initiatives III. Eighty-Twenty Improvement Culture IV. New Product Development V. Non-GAAP Measures VI. Executive Compensation VII. Investor Information

Appendix I: ESG Products 19

20 Appendix I: ESG Products (continued)

Appendix I: ESG - Market Influencers & Where We Play 21 2022 End Markets by Users Many ESG products support essential services that are focused on cleaning COVID relief stimulus includes $350 B for state, local and territorial governments; package targets maintenance of essential infrastructure, such as sewer systems and streets Anticipate that meaningful investment in U.S. infrastructure would provide upside potential with most of our product offerings expected to benefit Aging infrastructure, pipeline and broadband expansion and increasing urbanization support long-term demand for safe digging products, industrial vacuum loaders, dump bodies and trailers Improving industrial activity supports growth opportunities for dump bodies and trailers Funding for sewer cleaners through water tax revenues adds further stability Tracking new housing starts, Class 8 truck chassis, public funding sources, oil rig counts, and overall industrial activity Market Dynamics Source: Management Estimates 2022 Sales by Geography 84% 16% U.S. Non-U.S. Publicly-funded Industrial Utility Oil and Gas

Appendix I: SSG Products 22
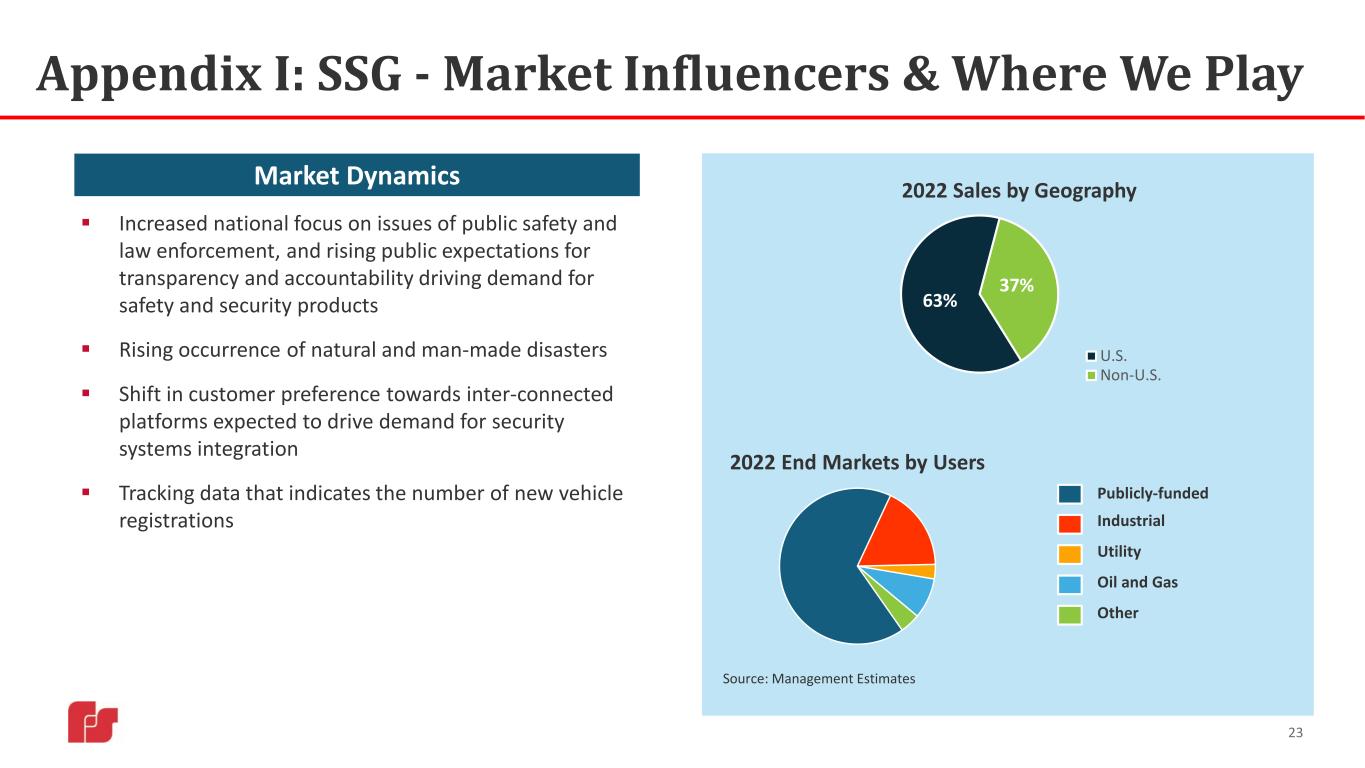
Appendix I: SSG - Market Influencers & Where We Play 23 Publicly-funded Industrial Utility Oil and Gas Other 2022 End Markets by Users Increased national focus on issues of public safety and law enforcement, and rising public expectations for transparency and accountability driving demand for safety and security products Rising occurrence of natural and man-made disasters Shift in customer preference towards inter-connected platforms expected to drive demand for security systems integration Tracking data that indicates the number of new vehicle registrations Market Dynamics Source: Management Estimates 63% 37% 2022 Sales by Geography U.S. Non-U.S.

Appendix II: Environmental, Social and Governance Initiatives Social • Diversity, Equity, & Inclusion (DEI) • Ongoing DEI training at executive and employee level • Workforce data analysis and various programs promoting diverse cultures and viewpoints found at Federal Signal • 60% of current executive officers are gender diverse • Community Engagement • Active participation with local charities, promoting and participating in educational and wellness programs • Volunteering in local communities • Federal Signal and our employees are committed to giving back and improving our surrounding areas at a national and local level Corporate Governance • Board Composition • 29% of directors are gender diverse • 44% of directors are considered diverse • Lead independent director • ESG Governance • Published 2022 Sustainability Report • Completed annual Materiality Assessment • Held Environmental Compliance Oversight Committee review We know that as a global manufacturer of critical infrastructure products, we have the responsibility to do the right thing-operate sustainably 24 Environmental • Products • Continue to search for ways to integrate electrification into our suite of products, with a focus on improved air quality and a reduced carbon footprint • Fully electric sweeper to be introduced this month at ConExpo • Fully electric Switch-N-Go product to be introduced at NTEA work truck show • Resource Consumption • Ongoing energy consumption assessments and adopting energy efficient measures to reduce CO2 emissions and energy intensity • Launched environmental education and awareness programs to implement best practices • Enhanced measuring and reporting practices and energy consumption audits
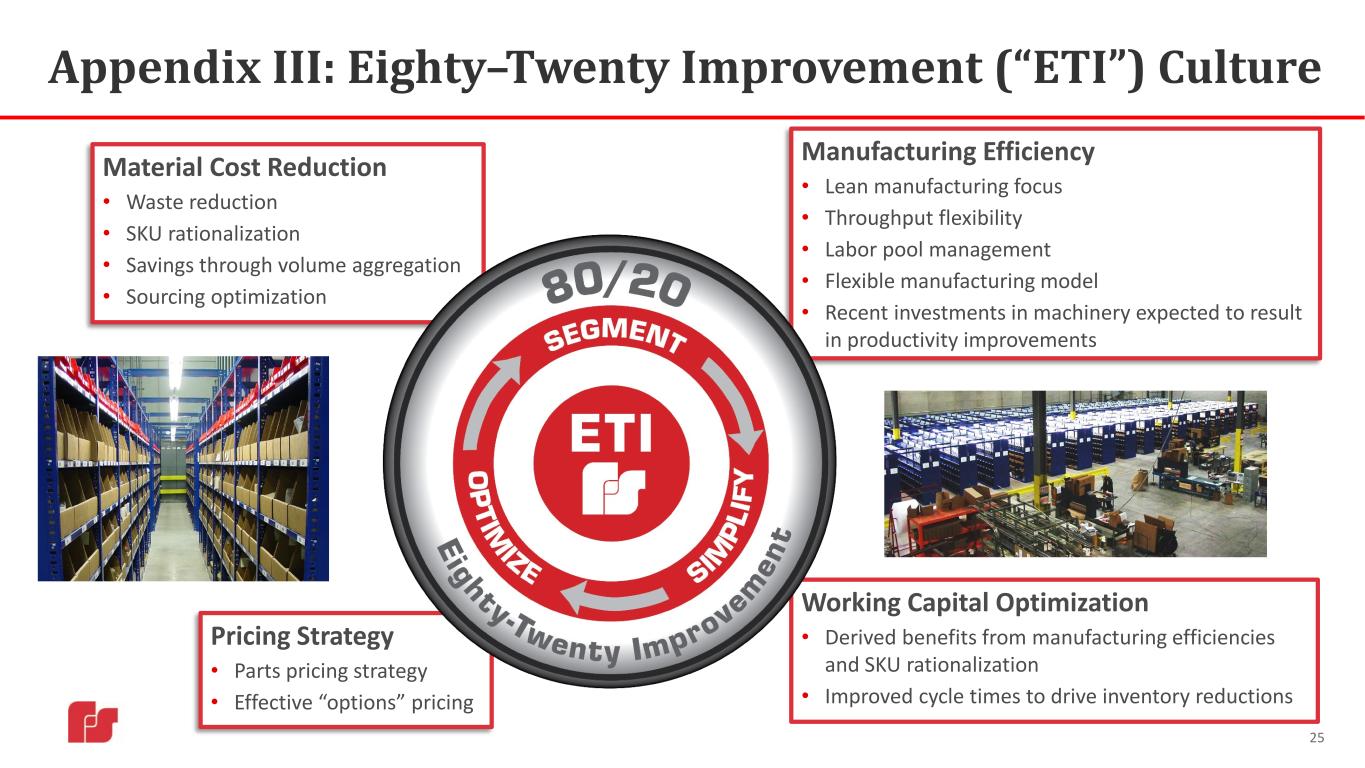
Appendix III: Eighty–Twenty Improvement (“ETI”) Culture 25 Pricing Strategy • Parts pricing strategy • Effective “options” pricing Material Cost Reduction • Waste reduction • SKU rationalization • Savings through volume aggregation • Sourcing optimization Working Capital Optimization • Derived benefits from manufacturing efficiencies and SKU rationalization • Improved cycle times to drive inventory reductions Manufacturing Efficiency • Lean manufacturing focus • Throughput flexibility • Labor pool management • Flexible manufacturing model • Recent investments in machinery expected to result in productivity improvements
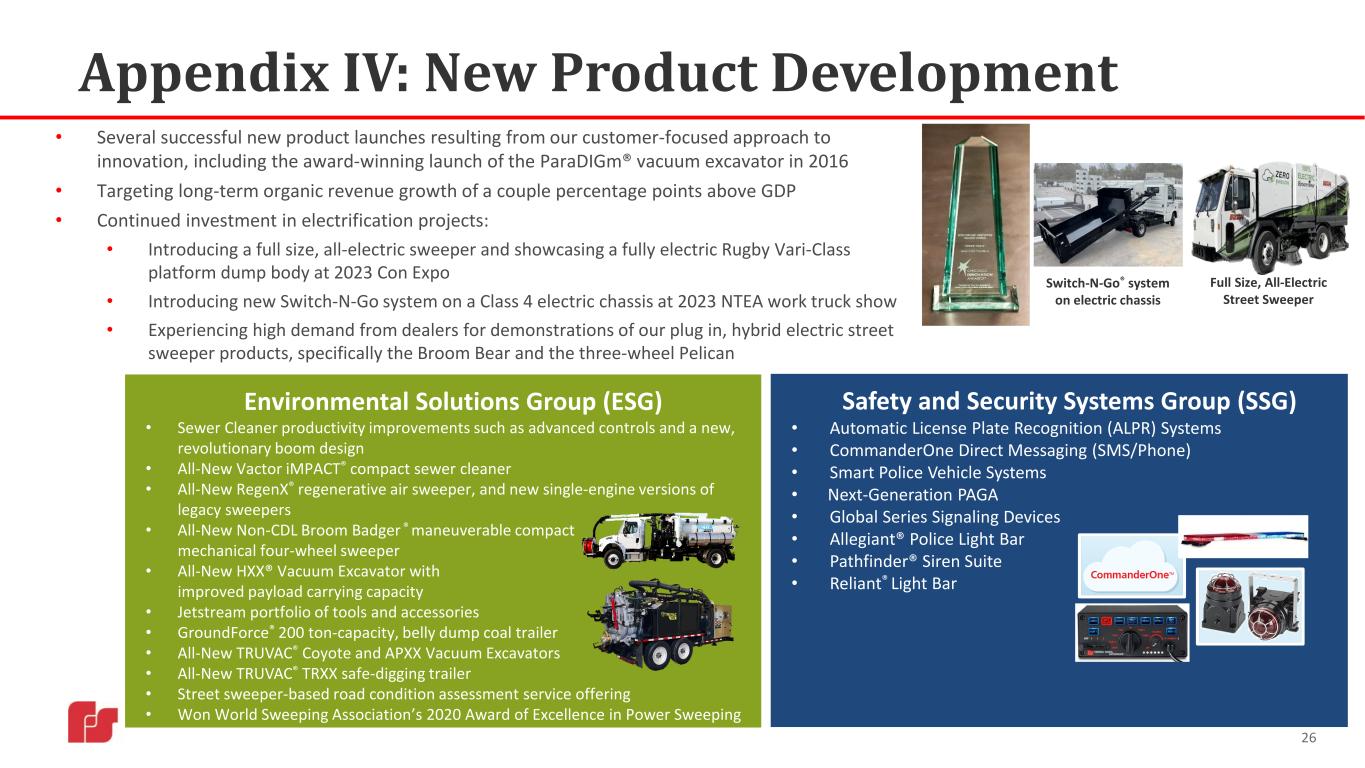
Appendix IV: New Product Development 26 Safety and Security Systems Group (SSG) • Automatic License Plate Recognition (ALPR) Systems • CommanderOne Direct Messaging (SMS/Phone) • Smart Police Vehicle Systems • Next-Generation PAGA • Global Series Signaling Devices • Allegiant® Police Light Bar • Pathfinder® Siren Suite • Reliant® Light Bar • Several successful new product launches resulting from our customer-focused approach to innovation, including the award-winning launch of the ParaDIGm® vacuum excavator in 2016 • Targeting long-term organic revenue growth of a couple percentage points above GDP • Continued investment in electrification projects: • Introducing a full size, all-electric sweeper and showcasing a fully electric Rugby Vari-Class platform dump body at 2023 Con Expo • Introducing new Switch-N-Go system on a Class 4 electric chassis at 2023 NTEA work truck show • Experiencing high demand from dealers for demonstrations of our plug in, hybrid electric street sweeper products, specifically the Broom Bear and the three-wheel Pelican Environmental Solutions Group (ESG) • Sewer Cleaner productivity improvements such as advanced controls and a new, revolutionary boom design • All-New Vactor iMPACT® compact sewer cleaner • All-New RegenX® regenerative air sweeper, and new single-engine versions of legacy sweepers • All-New Non-CDL Broom Badger ® maneuverable compact mechanical four-wheel sweeper • All-New HXX® Vacuum Excavator with improved payload carrying capacity • Jetstream portfolio of tools and accessories • GroundForce® 200 ton-capacity, belly dump coal trailer • All-New TRUVAC® Coyote and APXX Vacuum Excavators • All-New TRUVAC® TRXX safe-digging trailer • Street sweeper-based road condition assessment service offering • Won World Sweeping Association’s 2020 Award of Excellence in Power Sweeping Switch-N-Go® system on electric chassis Full Size, All-Electric Street Sweeper
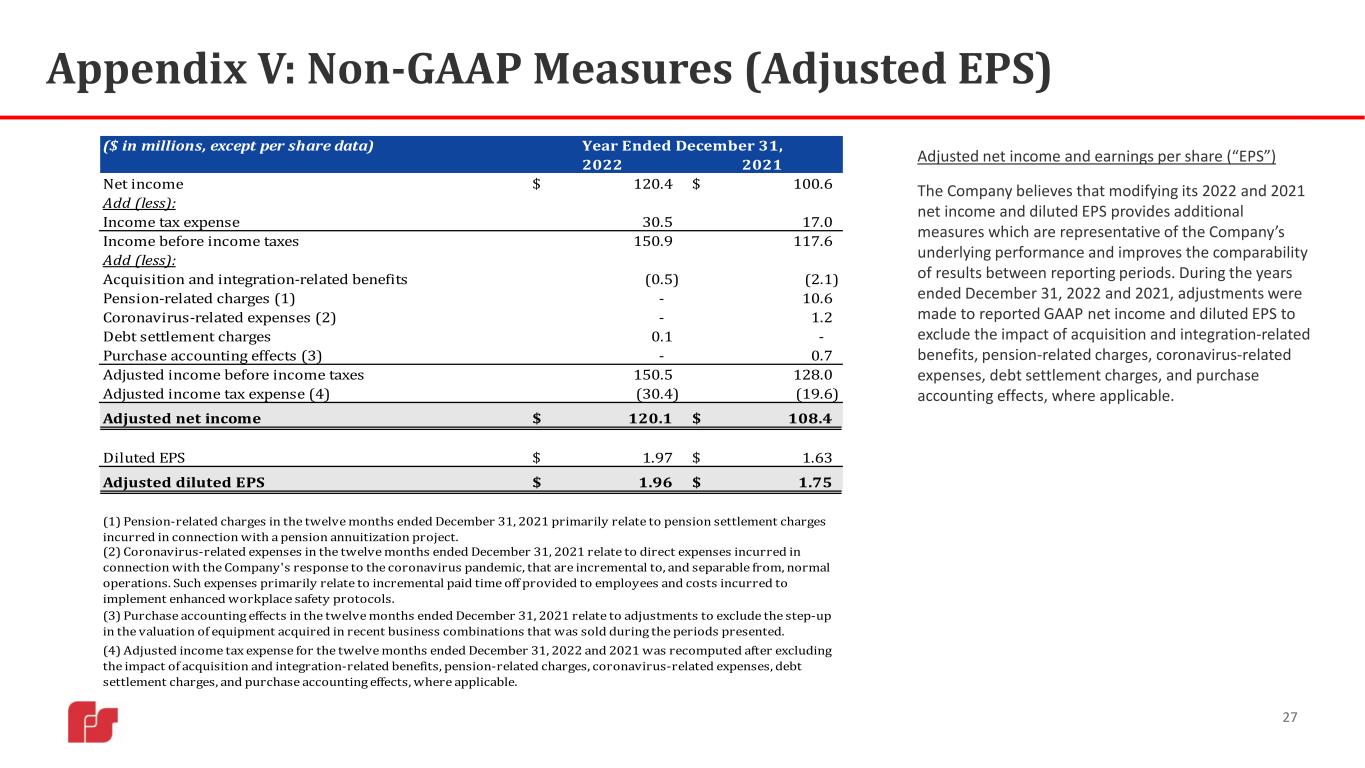
Appendix V: Non-GAAP Measures (Adjusted EPS) 27 Adjusted net income and earnings per share (“EPS”) The Company believes that modifying its 2022 and 2021 net income and diluted EPS provides additional measures which are representative of the Company’s underlying performance and improves the comparability of results between reporting periods. During the years ended December 31, 2022 and 2021, adjustments were made to reported GAAP net income and diluted EPS to exclude the impact of acquisition and integration-related benefits, pension-related charges, coronavirus-related expenses, debt settlement charges, and purchase accounting effects, where applicable. ($ in millions, except per share data) 2022 2021 Net income 120.4$ 100.6$ Add (less): Income tax expense 30.5 17.0 Income before income taxes 150.9 117.6 Add (less): Acquisition and integration-related benefits (0.5) (2.1) Pension-related charges (1) - 10.6 Coronavirus-related expenses (2) - 1.2 Debt settlement charges 0.1 - Purchase accounting effects (3) - 0.7 Adjusted income before income taxes 150.5 128.0 Adjusted income tax expense (4) (30.4) (19.6) Adjusted net income 120.1$ 108.4$ Diluted EPS 1.97$ 1.63$ Adjusted diluted EPS 1.96$ 1.75$ (4) Adjusted income tax expense for the twelve months ended December 31, 2022 and 2021 was recomputed after excluding the impact of acquisition and integration-related benefits, pension-related charges, coronavirus-related expenses, debt settlement charges, and purchase accounting effects, where applicable. Year Ended December 31, (1) Pension-related charges in the twelve months ended December 31, 2021 primarily relate to pension settlement charges incurred in connection with a pension annuitization project. (2) Coronavirus-related expenses in the twelve months ended December 31, 2021 relate to direct expenses incurred in connection with the Company's response to the coronavirus pandemic, that are incremental to, and separable from, normal operations. Such expenses primarily relate to incremental paid time off provided to employees and costs incurred to implement enhanced workplace safety protocols. (3) Purchase accounting effects in the twelve months ended December 31, 2021 relate to adjustments to exclude the step-up in the valuation of equipment acquired in recent business combinations that was sold during the periods presented.

Appendix V: Non-GAAP Measures (Adjusted EBITDA) 28 Adjusted EBITDA and adjusted EBITDA margin The Company uses adjusted EBITDA and adjusted EBITDA margin as additional measures which are representative of its underlying performance and to improve the comparability of results across reporting periods. We believe that investors use versions of these metrics in a similar manner. For these reasons, the Company believes that adjusted EBITDA and adjusted EBITDA margin are meaningful metrics to investors in evaluating the Company’s underlying financial performance. Adjusted EBITDA is a non-GAAP measure that represents the total of net income (from continuing operations), interest expense, pension settlement charges, hearing loss settlement charges, acquisition and integration-related expenses (benefits), coronavirus-related expenses, restructuring activity, executive severance costs, debt settlement charges, purchase accounting effects, other income/expense, income tax expense, depreciation and amortization expense, and the impact of adoption of a new lease accounting standard, where applicable. Consolidated adjusted EBITDA margin is a non-GAAP measure that represents the total of net income (from continuing operations), interest expense, pension settlement charges, hearing loss settlement charges, acquisition and integration-related expenses (benefits), coronavirus-related expenses, restructuring activity, executive severance costs, purchase accounting effects, other income/expense, income tax expense, depreciation and amortization expense, and the impact of adoption of a new lease accounting standard, where applicable, divided by net sales for the applicable period(s). Other companies may use different methods to calculate adjusted EBITDA and adjusted EBITDA margin. ($ in millions) 2017 2018 2019 2020 2021 2022 Net income (from continuing operations) 60.5$ 93.7$ 108.4$ 96.1$ 100.6$ 120.4$ Add (less): Interest expense 7.3 9.3 7.9 5.7 4.5 10.3 Pension settlement charges 6.1 - - - 10.3 - Hearing loss settlement charges 1.5 0.4 - - - - Acquisition and integration-related expenses (benefits) 2.7 1.5 2.5 2.1 (2.1) (0.5) Coronavirus-related expenses - - - 2.3 1.2 - Restructuring 0.6 - - 1.3 - - Executive severance costs 0.7 - - - - - Debt settlement charges - - - - - 0.1 Purchase accounting effects (a) 4.4 0.7 0.2 0.3 0.3 - Other (income) expense, net (0.8) 0.6 0.6 1.1 (1.7) (0.5) Income tax expense 0.5 17.9 30.2 28.5 17.0 30.5 Depreciation and amortization 30.0 36.4 41.5 44.8 50.4 54.7 Deferred gain recognition (b) (2.0) (1.9) - - - - Adjusted EBITDA 111.5$ 158.6$ 191.3$ 182.2$ 180.5$ 215.0$ Net Sales 898.5$ 1,089.5$ 1,221.3$ 1,130.8$ 1,213.2$ 1,434.8$ - - Adjusted EBITDA Margin 12.4% 14.6% 15.7% 16.1% 14.9% 15.0% (b) Adjustment to exclude recognition of deferred gain associated with historical sale lease-back transactions. Effective 2019, the Company no longer recognizes the gain due to the adoption of new lease accounting standard. (a) Excludes purchase accounting effects reflected in depreciation and amortization of $0.4 M, $0.5 M, $0.6 M, $0.4 M and $0.4 M for 2017, 2018, 2019, 2020 and 2021, respectively.

Appendix VI: Executive Compensation Aligned with Long-term Objectives 29 One Year Three Years Ten Years • The Company continues to focus on executing against a number of key long-term objectives, which include (i) creating disciplined growth, (ii) improving manufacturing efficiencies and costs; (iii) leveraging invested capital; and (iv) diversifying our customer base Cash Bonus (STIP) • Earnings (60%) • EBITDA Margin (20%) • Individual Objectives (20%) Short-Term Annual Goals 1. Profitability and growth 2. Market share Performance Share Units • EPS (75%) • Return on Invested Capital (25%) • Relative TSR (modifier) Long-Term 3-year Performance and Vesting Periods 1. Profitability and growth 2. Shareholder value creation 3. Efficient use of capital 4. Facilitates stock ownership 5. Executive retention 6. TSR component introduced in 2022 to measure performance vs. peers Restricted Stock Awards Long-Term 3-year Cliff Vesting 1. Executive recruitment 2. Executive retention Share Price Appreciation • Stock Options Longer-Term 3-year Ratable Vesting Period and 10 Year Exercise Period 1. Shareholder value creation 2. Facilitates stock ownership 3. Executive retention
30 Appendix VII: Investor Information Stock Ticker: NYSE:FSS Company website: federalsignal.com/investors HEADQUARTERS 1415 West 22nd Street, Suite 1100 Oak Brook, IL 60523 INVESTOR RELATIONS CONTACTS 630-954-2000 Ian Hudson SVP & Chief Financial Officer IHudson@federalsignal.com


