UNITED STATES
SECURITIES AND EXCHANGE COMMISSION
Washington, D.C. 20549
FORM N-CSR
CERTIFIED SHAREHOLDER REPORT OF REGISTERED
MANAGEMENT INVESTMENT COMPANIES
Investment Company Act file number 811-02884
Barrett Opportunity Fund, Inc.
(Exact name of registrant as specified in charter)
90 Park Avenue
New York, NY 10016
(Address of principal executive offices) (Zip code)
Peter Shriver
90 Park Avenue
New York, NY 10016
(Name and address of agent for service)
(212) 983-5080
Registrant's telephone number, including area code
Date of fiscal year end: August 31, 2019
Date of reporting period: August 31, 2019
Item 1. Reports to Stockholders.
Annual Report
August 31, 2019
| INVESTMENT PRODUCTS: NOT FDIC INSURED • NO BANK GUARANTEE • MAY LOSE VALUE | |
BARRETT
OPPORTUNITY FUND, INC.
| Annual Report | • | August 31, 2019 |
| Fund Objectives | The Fund seeks to achieve above average long-term capital appreciation. Current income is a secondary objective. The Fund invests primarily in common stocks and securities convertible into or exchangeable for common stock such as convertible preferred stock or convertible debt securities. |
| What’s Inside | Letter from the Chairperson | 1 |
| | Manager Overview | 1 |
| | Fund at a Glance | 4 |
| | Fund Expenses | 5 |
| | Historical Performance | 6 |
| | Schedule of Investments | 7 |
| | Statement of Assets & Liabilities | 9 |
| | Statement of Operations | 10 |
| | Statements of Changes in Net Assets | 11 |
| | Financial Highlights | 12 |
| | Notes to Financial Statements | 13 |
| | Report of Independent Registered Public Accounting Firm | 20 |
| | Additional Information | 21 |
| | Important Tax Information | 23 |
BARRETT
OPPORTUNITY FUND, INC.
| | |
Letter from the
| Dear Shareholder, |
| Chairperson | |
| We are pleased to provide the annual report of the Barrett Opportunity Fund, Inc. (the “Fund”) for the twelve-month period ended August 31st, 2019. |
| | |
| | The management team at Barrett Asset Management, LLC has prepared the enclosed Manager’s Overview, which includes a brief market look, as well as a performance review. I urge you to read it as well as the accompanying financial statements. A detailed summary of the Fund’s performance and other pertinent information are included. I am sure you will find it informative and useful. |
| | |
| | On behalf of the Directors and the Officers of the Fund, I thank you for your ongoing confidence in the Fund and its investment policies. |
| | |
| | Sincerely, |
| | |
| |  |
| | |
| | David H. Kochman |
| | Chairperson |
| | September 9th, 2019 |
| Manager | Market Overview |
| Overview | |
| | The equity markets have gradually recovered from a nearly 20% decline at the end of 2018. Threats of tariffs, particularly between China and the U.S., have disrupted the relative calm that the financial markets had been enjoying over the previous couple of years. Initial indications of declining industrial activity in Europe had also diminished forecasts of positive economic growth. |
| | |
| | Global tensions constrained corporate investments and started to impact consumer behavior as well. Corporations have held back on investments while they look for greater clarity of any trade restrictions. Meanwhile, consumers have not lost their optimism, as seen in continued favorable retail spending. The result has been a gradually slowing yet positive economic outlook worldwide. Central banks are actively pursuing accommodative monetary policies to spur activity in the face of muted inflationary pressure. Domestically, the Federal Reserve has reduced rates twice in 2019. The anticipation of lower rates has driven investors to maintain their favorable outlook for equities over cash or fixed income. |
BARRETT
OPPORTUNITY FUND, INC.
| | Portfolio and Performance Review |
| | |
| | During the twelve month period ending in August 2019, the Fund declined -3.27% versus a -0.22% decline of the Lipper Large Cap Value Index and an increase of +2.92% in the S&P 500 Index. |
| | |
| | The Fund’s performance was negatively impacted relative to the broader index by its overweighting in the Industrial, Energy and Financial sectors. The Fund benefited from favorable stock selection in the Consumer and Technology sectors. Underperformance in Real Estate and Financial holdings led to the overall negative performance. |
| | |
| | Microsoft Corp., Koninklijke Philips and Automatic Data Processing Inc. were the top contributing investments to performance for the Fund over the twelve month period, while Bank of New York Mellon Corp., Murphy Oil Corp. and Royal Dutch Shell were the largest detractors. |
| | |
| | In the face of growing concerns about global growth projections, we believe investors will shift more investable funds into companies that offer stable earnings and dividend growth. We have sought to shift the Fund’s assets towards companies that could benefit from this trend in recent quarters. The Fund’s performance in recent months has benefited from these decisions. Many of the holdings continue to increase dividends and the forecasts of earnings remain positive, which may ultimately lead to favorable performance. |
| | |
| | Thank you for your continued interest in the Fund. |
| | |
| | Sincerely, |
| |  |  |
| | | |
| | Robert Milnamow | E. Wells Beck, CFA |
| | Portfolio Manager | Portfolio Manager |
BARRETT
OPPORTUNITY FUND, INC.
| | Earnings growth is not representative of the Fund’s future performance. |
| | |
| | Past performance is not a guarantee of future results. |
| | |
| | The outlook, views, and opinions presented are those of the Adviser as of August 31, 2019. These are not intended to be a forecast of future events, a guarantee of future results, or investment advice. |
| | |
| | Must be preceded or accompanied by a prospectus. |
| | |
| | Mutual fund investing involves risk. Principal loss is possible. The Fund is non-diversified, which means that it can invest a higher percentage of its assets in any one issuer. Investing in a non-diversified fund may entail greater risks than is normally associated with more widely diversified funds. Small- and Medium- capitalization companies tend to have limited liquidity and greater price volatility than large-capitalization companies. Investing in foreign securities is subject to certain risks not associated with domestic investing, such as currency fluctuations and changes in political and economic conditions. These risks are magnified in emerging or developing markets. Some securities held by the fund may be illiquid and can be difficult to value and sell. |
| | |
| | The Lipper Large-Cap Value Funds Index includes funds that, by portfolio practice, invest at least 75% of their equity assets in companies with market capitalizations (on a three year weighted basis) above Lipper’s U.S. Diversified Equity large-cap floor. The S&P 500® Index is a capitalization weighted index of five hundred large capitalization stocks, which is designed to measure broad domestic securities markets. |
| | |
| | Investors cannot invest directly in an index. |
| | |
| | Fund holdings and sector allocations are subject to change and should not be considered a recommendation to buy or sell any security. For a complete list of portfolio holdings, please refer to the Schedule of Investments provided in this report. |
| | |
| | The Barrett Opportunity Fund is distributed by Quasar Distributors, LLC. |
BARRETT
OPPORTUNITY FUND, INC.
Fund at a Glance (Unaudited)
| | Top Ten Holdings - as of 8/31/2019 | |
| | (As a percentage of Total Investments) | |
| | General Dynamics Corp. | | | 16.4 | % |
| | The Bank of New York Mellon Corp. | | | 12.0 | % |
| | Royal Dutch Shell PLC – Class A – ADR | | | 9.8 | % |
| | Koninklijke Philips Electronics | | | | |
| | NV – NY Registered Shares – ADR | | | 9.5 | % |
| | Automatic Data Processing, Inc. | | | 4.4 | % |
| | Microsoft Corp. | | | 4.2 | % |
| | Alphabet, Inc. – Class C | | | 3.6 | % |
| | Apple, Inc. | | | 3.5 | % |
| | Murphy Oil Corp. | | | 3.4 | % |
| | Berkshire Hathaway, Inc. – Class B | | | 3.1 | % |
Sector Weightings - as of 8/31/2019
(As a percentage of Total Investments)
BARRETT
OPPORTUNITY FUND, INC.
Fund Expenses (Unaudited)
Example
As a shareholder of the Fund, you may incur two types of costs: (1) transaction costs and (2) ongoing costs, including management fees and other Fund expenses. This example is intended to help you understand your ongoing costs (in dollars) of investing in the Fund and to compare these costs with the ongoing costs of investing in other mutual funds.
This example is based on an investment of $1,000 invested on March 1, 2019, and held for the six months ended August 31, 2019.
Actual Expenses
The row of the table below titled “Actual Barrett Opportunity Fund, Inc. Expenses” provides information about actual account values and actual expenses. You may use the information provided in this table, together with the amount you invested, to estimate the expenses that you paid over the period. To estimate the expenses you paid on your account, divide your ending account value by $1,000 (for example, an $8,600 ending account value divided by $1,000 = 8.6), then multiply the result by the number under the heading entitled “Expenses Paid During the Period.”
Hypothetical Example for Comparison Purposes
The row of the table below titled “Hypothetical Expenses” provides information about hypothetical account values and hypothetical expenses based on the actual expense ratio and an assumed rate of return of 5.00% per year before expenses, which is not the Fund’s actual return. The hypothetical account values and expenses may not be used to estimate the actual ending account balance or expenses you paid for the period. You may use the information provided in this table to compare the ongoing costs of investing in the Fund and other funds. To do so, compare the 5.00% hypothetical example relating to the Fund with the 5.00% hypothetical examples that appear in the shareholder reports of the other funds.
Please note that the expenses shown in the table below are meant to highlight your ongoing costs only and do not reflect any transactional costs. Therefore, the table is useful in comparing ongoing costs only, and will not help you determine the relative total costs of owning different funds. In addition, if these transaction costs were included, your costs would have been higher.
| | | | Expenses Paid |
| | Beginning | Ending | During the Period* |
| | Account | Account | March 1, 2019 to |
| | Value | Value | August 31, 2019 |
| Actual Barrett Opportunity Fund, Inc. Expenses | $1,000.00 | $1,007.00 | $6.22 |
| | | | |
| Hypothetical Expenses | | | |
| (5% return per year before expenses) | $1,000.00 | $1,019.00 | $6.26 |
* | Expenses are equal to the Fund’s annualized six-month expense ratio of 1.23%, multiplied by the average account value over the period, multiplied by 184/365 (to reflect the one-half year period). |
| | |
BARRETT
OPPORTUNITY FUND, INC.
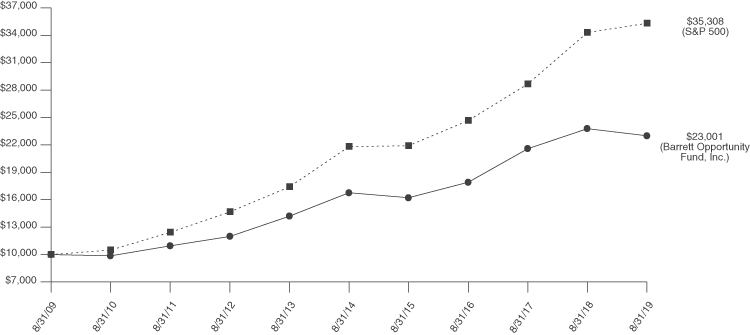
Historical Performance (Unaudited)
Value of $10,000 Invested in Barrett Opportunity Fund, Inc. vs.
the S&P 500® Index† (August 2009 – August 2019)
† | Hypothetical illustration of $10,000 invested in Barrett Opportunity Fund, Inc. on August 31, 2009 assuming the reinvestment of all distributions, including returns of capital, if any, at net asset value through August 31, 2019. The S&P 500® Index is a market-value weighted index comprised of 500 widely held common stocks. The Index is unmanaged and it is not subject to the same management and trading expenses of a mutual fund. Please note that an investor cannot invest directly in an index. |
Fund Performance
Average Annual Total Returns* (Unaudited)
| | | | | Since |
| | | | | Inception |
| | 1 Year | 5 Years | 10 Years | (2/28/1979) |
| Barrett Opportunity Fund, Inc. | -3.27% | 6.52% | 8.69% | 10.58% |
| S&P 500 Index | 2.92% | 10.11% | 13.45% | 11.81% |
* | Assumes the reinvestment of all distributions at net asset value but does not reflect deductions of taxes that a shareholder would pay on Fund distributions and the redemption of Fund shares. All figures represent past performance and are not a guarantee of future results. Investment return and principal value of an investment will fluctuate so that an investor’s shares, when redeemed, may be worth more or less than their original cost. |
BARRETT
OPPORTUNITY FUND, INC.
Schedule of Investments
August 31, 2019
| Shares | | | | Value | |
| | | COMMON STOCKS - 91.61% | | | |
| | | | | | |
| | | Administrative and | | | |
| | | Support Services - 1.66% | | | |
| | 7,000 | | Fidelity National Information | | | |
| | | | Services, Inc. | | $ | 953,540 | |
| | | | | | | | |
| | | | Beverage and | | | | |
| | | | Tobacco Product | | | | |
| | | | Manufacturing - 2.38% | | | | |
| | 10,000 | | PepsiCo., Inc. | | | 1,367,300 | |
| | | | | | | | |
| | | | Broadcasting | | | | |
| | | | (except Internet) - 1.67% | | | | |
| | 7,000 | | The Walt Disney Company | | | 960,820 | |
| | | | | | | | |
| | | | Building Material and | | | | |
| | | | Garden Equipment and | | | | |
| | | | Supplies Dealers - 1.59% | | | | |
| | 4,000 | | The Home Depot, Inc. | | | 911,640 | |
| | | | | | | | |
| | | | Chemical | | | | |
| | | | Manufacturing - 5.67% | | | | |
| | 12,000 | | Abbott Laboratories | | | 1,023,840 | |
| | 12,000 | | AbbVie, Inc. | | | 788,880 | |
| | 2,500 | | International Flavors | | | | |
| | | | & Fragrances, Inc. | | | 274,375 | |
| | 5,000 | | Johnson & Johnson | | | 641,800 | |
| | 15,000 | | Pfizer, Inc. | | | 533,250 | |
| | | | | | | 3,262,145 | |
| | | | | | | | |
| | | | Computer and | | | | |
| | | | Electronic Product | | | | |
| | | | Manufacturing - 14.67% | | | | |
| | 9,500 | | Apple, Inc. | | | 1,983,030 | |
| | 115,710 | | Koninklijke Philips Electronics | | | | |
| | | | NV - NY Registered | | | | |
| | | | Shares - ADR | | | 5,447,627 | |
| | 3,500 | | Thermo Fisher Scientific, Inc. | | | 1,004,710 | |
| | | | | | | 8,435,367 | |
| | | | | | | | |
| | | | Credit Intermediation and | | | | |
| | | | Related Activities - 12.03% | | | | |
| | 164,471 | | The Bank of New York | | | | |
| | | | Mellon Corp. | | | 6,917,650 | |
| | | | | | | | |
| | | | Data Processing, Hosting | | | | |
| | | | and Related Services - 4.43% | | | | |
| | 15,000 | | Automatic Data | | | | |
| | | | Processing, Inc. | | | 2,547,600 | |
| | | | | | | | |
| | | | Insurance Carriers and | | | | |
| | | | Related Activities - 3.10% | | | | |
| | 8,750 | | Berkshire Hathaway, | | | | |
| | | | Inc. - Class B (a) | | | 1,779,838 | |
| | | | | | | | |
| | | | Merchant Wholesalers, | | | | |
| | | | Durable Goods - 2.27% | | | | |
| | 70,000 | | Jefferies Financial Group, Inc. | | | 1,304,800 | |
| | | | | | | | |
| | | | Miscellaneous | | | | |
| | | | Manufacturing - 2.81% | | | | |
| | 10,000 | | 3M Co. | | | 1,617,200 | |
| | | | | | | | |
| | | | Motor Vehicle and | | | | |
| | | | Parts Dealers - 3.39% | | | | |
| | 21,825 | | Murphy USA, Inc. (a) | | | 1,951,155 | |
| | | | | | | | |
| | | | Other Information | | | | |
| | | | Services - 3.62% | | | | |
| | 1,750 | | Alphabet, Inc. - Class C (a) | | | 2,079,175 | |
| | | | | | | | |
| | | | Petroleum and Coal Products | | | | |
| | | | Manufacturing - 11.70% | | | | |
| | 60,600 | | Murphy Oil Corp. | | | 1,104,738 | |
| | 101,100 | | Royal Dutch Shell PLC - | | | | |
| | | | Class A - ADR | | | 5,621,160 | |
| | | | | | | 6,725,898 | |
| | | | | | | | |
| | | | Publishing Industries | | | | |
| | | | (except Internet) - 4.20% | | | | |
| | 17,500 | | Microsoft Corp. | | | 2,412,550 | |
The accompanying notes are an integral part of these financial statements.
BARRETT
OPPORTUNITY FUND, INC.
Schedule of Investments (continued)
August 31, 2019
| Shares | | | | Value | |
| | | COMMON STOCKS | | | |
| | | (continued) | | | |
| | | | | | |
| | | Transportation Equipment | | | |
| | | Manufacturing - 16.42% | | | |
| | 49,400 | | General Dynamics Corp. | | $ | 9,448,738 | |
| | | | Total Common Stocks | | | | |
| | | | (Cost $13,258,110) | | | 52,675,416 | |
| | | | | | | | |
| | | | REAL ESTATE INVESTMENT | | | | |
| | | | TRUSTS (REITS) - 3.55% | | | | |
| | | | | | | | |
| | | | Real Estate - 3.55% | | | | |
| | 24,854 | | Alexander & Baldwin, Inc. | | | 568,908 | |
| | 54,985 | | Rayonier, Inc. | | | 1,473,598 | |
| | | | Total Real Estate Investment | | | | |
| | | | Trusts (Cost $535,219) | | | 2,042,506 | |
| | | | | | | | |
| | | | SHORT-TERM | | | | |
| | | | INVESTMENTS - 4.80% | | | | |
| | | | | | | | |
| | | | Money Market Funds - 4.80% | | | | |
| | 2,758,126 | | Fidelity Institutional Money | | | | |
| | | | Market Fund - Government | | | | |
| | | | Portfolio - Class I, 2.00% (b) | | | 2,758,126 | |
| | | | Total Short-Term Investments | | | | |
| | | | (Cost $2,758,126) | | | 2,758,126 | |
| | | | Total Investments | | | | |
| | | | (Cost $16,551,455) - 99.96% | | | 57,476,048 | |
| | | | Other Assets in Excess | | | | |
| | | | of Liabilities - 0.04% | | | 24,196 | |
| | | | Total Net Assets - 100.00% | | $ | 57,500,244 | |
Percentages stated are a percentage of net assets.
ADR - American Depository Receipt
| (a) | Non-income producing security. |
| (b) | Rate shown is the 7-day effective yield as of August 31, 2019. |
Schedule Of Written Options
| Number of | | | | | |
| Contracts | | | | Value | |
| | | | | | |
| | | Call Options | | | |
| | 100 | | Bank of New York Mellon Corp. | | | |
| | | | Expiration: January 2020, | | | |
| | | | Exercise Price: $55.00 | | $ | 500 | |
| | 50 | | General Dynamics Corp. | | | | |
| | | | Expiration: January 2020, | | | | |
| | | | Exercise Price: $190.00 | | | 55,500 | |
| | | | Total Options Written | | | | |
| | | | (Premiums | | | | |
| | | | Received $76,378) | | $ | 56,000 | |
The accompanying notes are an integral part of these financial statements.
BARRETT
OPPORTUNITY FUND, INC.
Statement of Assets & Liabilities
August 31, 2019
| ASSETS: | | | |
| Investments, at value (cost $16,551,455) | | $ | 57,476,048 | |
| Dividends and interest receivable | | | 138,919 | |
| Other assets | | | 31,412 | |
| Total Assets | | | 57,646,379 | |
| | | | | |
| LIABILITIES: | | | | |
| Written options, at value (Premium received $76,378) | | | 56,000 | |
| Payable to adviser | | | 34,077 | |
| Payable to directors | | | 6,802 | |
| Other accrued expenses | | | 49,256 | |
| Total Liabilities | | | 146,135 | |
| | | | | |
| NET ASSETS | | $ | 57,500,244 | |
| | | | | |
| NET ASSETS CONSIST OF: | | | | |
| Capital stock | | $ | 11,069,208 | |
| Total distributable earnings | | | 46,431,036 | |
| Total Net Assets | | $ | 57,500,244 | |
| | | | | |
| Shares outstanding | | | 2,231,083 | |
| Net asset value, offering price and redemption price | | | | |
| per share (15,000,000 shares authorized, $0.01 par value) | | $ | 25.77 | |
The accompanying notes are an integral part of these financial statements.
BARRETT
OPPORTUNITY FUND, INC.
Statement of Operations
Year Ended August 31, 2019
| INVESTMENT INCOME: | | | |
| Dividend income* | | $ | 1,298,326 | |
| Interest income | | | 69,987 | |
| Total investment income | | | 1,368,313 | |
| | | | | |
| EXPENSES: | | | | |
| Investment advisory fees (see Note 2) | | | 411,396 | |
| Legal fees | | | 67,923 | |
| Administration fees | | | 48,142 | |
| Directors’ fees and expenses | | | 40,706 | |
| Transfer agent fees and expenses | | | 32,198 | |
| Federal and state registration fees | | | 30,383 | |
| Fund accounting fees | | | 28,728 | |
| Insurance fees | | | 22,265 | |
| Audit fees | | | 18,000 | |
| Reports to shareholders | | | 9,981 | |
| Custody fees | | | 5,470 | |
| Other | | | 10,580 | |
| Net expenses | | | 725,772 | |
| Net investment income | | | 642,541 | |
| | | | | |
| REALIZED AND UNREALIZED GAIN (LOSS) ON INVESTMENTS: | | | | |
| Net realized gain on investments | | | 4,998,348 | |
| Net change in unrealized appreciation (depreciation) on: | | | | |
| Investments | | | (8,068,300 | ) |
| Written options | | | 20,378 | |
Total net change in unrealized depreciation | | | (8,047,922 | ) |
Net realized and unrealized loss on investments | | | (3,049,574 | ) |
NET DECREASE IN NET ASSETS RESULTING FROM OPERATIONS | | $ | (2,407,033 | ) |
* | Net of $73,704 of foreign taxes withheld. |
The accompanying notes are an integral part of these financial statements.
BARRETT
OPPORTUNITY FUND, INC.
Statements of Changes in Net Assets
| | | Year Ended | | | Year Ended | |
| | | August 31, 2019 | | | August 31, 2018 | |
| OPERATIONS: | | | | | | |
| Net investment income | | $ | 642,541 | | | $ | 797,659 | |
| Net realized gain on: | | | | | | | | |
| Investments | | | 4,998,348 | | | | 7,078,765 | |
| Written options | | | — | | | | 26,847 | |
| Change in net unrealized appreciation (depreciation) on: | | | | | | | | |
| Investments | | | (8,068,300 | ) | | | (1,720,218 | ) |
| Written options | | | 20,378 | | | | 79,350 | |
| Net increase/decrease in net assets resulting from operations | | | (2,407,033 | ) | | | 6,262,403 | |
| | | | | | | | | |
| DIVIDENDS AND DISTRIBUTIONS TO SHAREHOLDERS: | | | | | | | | |
| Net dividends and distributions | | | (7,625,000 | ) | | | (3,801,048 | ) |
Total distributions1 | | | (7,625,000 | ) | | | (3,801,048 | ) |
| | | | | | | | | |
| CAPITAL SHARE TRANSACTIONS: | | | | | | | | |
| Shares sold | | | 102,367 | | | | 456,183 | |
| Shares issued in reinvestment of dividends | | | 4,405,220 | | | | 2,098,429 | |
| Shares redeemed | | | (1,755,415 | ) | | | (3,011,911 | ) |
| Net increase (decrease) in net assets | | | | | | | | |
| from capital share transactions | | | 2,752,172 | | | | (457,299 | ) |
| TOTAL INCREASE IN NET ASSETS | | | (7,279,861 | ) | | | 2,004,056 | |
| | | | | | | | | |
| NET ASSETS: | | | | | | | | |
| Beginning of year | | | 64,780,105 | | | | 62,776,049 | |
End of year2 | | $ | 57,500,244 | | | $ | 64,780,105 | |
| 1 | Includes net investment income distributions and net realized gain distributions of $752,989 and $3,048,059, respectively, for year ended August 31, 2018. |
| 2 | Includes accumulated undistributed net investment income of $378,335 for the year ended August 31, 2018. |
The accompanying notes are an integral part of these financial statements.
BARRETT
OPPORTUNITY FUND, INC.
Financial Highlights
| | | Year Ended August 31, | |
| | | 2019 | | | 2018 | | | 2017 | | | 2016 | | | 2015 | |
| Per Share Data: | | | | | | | | | | | | | | | |
| Net asset value, beginning of year | | $ | 30.75 | | | $ | 29.62 | | | $ | 31.14 | | | $ | 31.52 | | | $ | 36.34 | |
| | | | | | | | | | | | | | | | | | | | | |
| Income (loss) from investment operations: | | | | | | | | | | | | | | | | | | | | |
| Net investment income | | | 0.29 | | | | 0.38 | | | | 0.23 | | | | 0.33 | | | | 0.29 | |
| Net realized and unrealized | | | | | | | | | | | | | | | | | | | | |
| gain (loss) on investments | | | (1.62 | ) | | | 2.56 | | | | 5.31 | | | | 2.57 | | | | (1.40 | ) |
| Total from investment operations | | | (1.33 | ) | | | 2.94 | | | | 5.54 | | | | 2.90 | | | | (1.11 | ) |
| | | | | | | | | | | | | | | | | | | | | |
| Less distributions: | | | | | | | | | | | | | | | | | | | | |
| Net investment income | | | (0.25 | ) | | | (0.36 | ) | | | (0.33 | ) | | | (0.28 | ) | | | (0.41 | ) |
| Net realized gain on investments | | | (3.40 | ) | | | (1.45 | ) | | | (6.73 | ) | | | (3.00 | ) | | | (3.30 | ) |
| Total distributions | | | (3.65 | ) | | | (1.81 | ) | | | (7.06 | ) | | | (3.28 | ) | | | (3.71 | ) |
| | | | | | | | | | | | | | | | | | | | | |
| Net asset value, end of year | | $ | 25.77 | | | $ | 30.75 | | | $ | 29.62 | | | $ | 31.14 | | | $ | 31.52 | |
| | | | | | | | | | | | | | | | | | | | | |
| Total return | | | (3.27 | )% | | | 10.15 | % | | | 20.49 | % | | | 10.45 | % | | | (3.27 | )% |
| | | | | | | | | | | | | | | | | | | | | |
| Supplemental data and ratios: | | | | | | | | | | | | | | | | | | | | |
| Net assets, end of year (millions) | | $ | 58 | | | $ | 65 | | | $ | 63 | | | $ | 60 | | | $ | 59 | |
| Ratio of net expenses | | | | | | | | | | | | | | | | | | | | |
| to average net assets | | | 1.23 | % | | | 1.13 | % | | | 1.22 | % | | | 1.27 | % | | | 1.17 | % |
| Ratio of net investment income | | | | | | | | | | | | | | | | | | | | |
| to average net assets | | | 1.09 | % | | | 1.23 | % | | | 0.78 | % | | | 1.11 | % | | | 0.84 | % |
| Portfolio turnover rate | | | 8 | % | | | 4 | % | | | 1 | % | | | 6 | % | | | 2 | % |
The accompanying notes are an integral part of these financial statements.
BARRETT
OPPORTUNITY FUND, INC.
Notes to Financial Statements
| 1. | ORGANIZATION | Barrett Opportunity Fund, Inc. (“the “Fund”), a Maryland corporation organized in 1978, is registered as a non-diversified, open-end |
| | AND | management investment company under the Investment Company Act of 1940, as amended (the “1940 Act). The Fund is an investment |
| | SIGNIFICANT | company and accordingly follows the investment company accounting and reporting guidance of the Financial Accounting Standards |
| | ACCOUNTING | Board (“FASB”) Accounting Codification Topic 946 “Financial Services – Investment Companies.” The Fund’s investment objective is |
| | POLICIES | to achieve above average long-term capital appreciation. Current income is a secondary objective. |
| | |
|
| | | The following are significant accounting policies consistently followed by the Fund and are in conformity with generally accepted accounting principles in the United States of America (“GAAP”). |
| | | |
| | | (a) Investment Valuation |
| | | Equity securities, including common stocks and REITs, for which market quotations are available are valued at the last reported sales price or official closing price on the primary market or exchange on which they trade. |
| | | |
| | | Redeemable securities issued by open-end, registered investment companies, including money market funds, are valued at the net asset value (“NAV”) of such companies for purchase and/or redemption orders placed on that day. |
| | | |
| | | Exchange traded options, including options written, are valued at the composite price, using the National Best Bid and Offer quotes (“NBBO”). NBBO consists of the highest bid price and lowest ask price across any of the exchanges on which an option is quoted, thus providing a view across the entire U.S. options marketplace. Specifically, composite pricing looks at the last trades on the exchanges where the options are traded. If there are no trades for the option on a given business day, composite option pricing calculates the mean of the highest bid price and lowest ask price across the exchanges where the option is traded. |
| | | |
| | | When prices are not readily available, or are determined not to reflect fair value, such as, when the value of a security has been significantly affected by events after the close of the exchange or market on which the security is principally traded, but before the Fund calculates its net asset value, the Fund values these securities at fair value as determined in accordance with procedures approved by the Fund’s Board of Directors. |
| | | |
| | | The Fund uses valuation techniques to measure fair value that are consistent with the market approach and/or income approach, depending on the type of the security and the particular circumstance. The market approach uses prices and other relevant information generated by market transactions involving identical or comparable securities. The income approach uses valuation techniques to discount estimated future cash flows to present value. |
BARRETT
OPPORTUNITY FUND, INC.
| | | Financial Accounting Standards Board (“FASB”) Accounting Standards Codification, “Fair Value Measurements and Disclosures” Topic 820 (“ASC Topic 820”), establishes a single definition of fair value, creates a three-tier hierarchy as a framework for measuring fair value based on inputs used to value the Fund’s investments, and requires additional disclosure about fair value. The hierarchy of inputs is summarized below: |
| | | • Level 1 – | quoted prices in active markets for identical investments as of the measurement date |
| | | | |
| | | • Level 2 – | other significant observable inputs (including quoted prices for similar investments, interest rates, prepayment speeds, credit risk, etc.) |
| | | | |
| | | • Level 3 – | significant unobservable inputs (including the Fund’s own assumptions in determining the fair value of investments) |
| | | Inputs refer broadly to the assumptions that market participants use to make valuation decisions, including assumptions about risk. Inputs may include price information, volatility statistics, specific and broad credit data, liquidity statistics, and other factors. A financial instrument’s level within the fair value hierarchy is based on the lowest level of input that is significant to the fair value measurement. However, the determination of what constitutes “observable” requires significant judgment by the Fund. The Fund considers observable data to be that market data which is readily available, regularly distributed or updated, reliable and verifiable, not proprietary, and provided by independent sources that are actively involved in the relevant market. The categorization of a financial instrument within the hierarchy is based upon the pricing transparency of the instrument and does not necessarily correspond to the Fund’s perceived risk of that instrument. |
| | | |
| | | Investments whose values are based on quoted market prices in active markets include listed equities, including common stocks and REITs, and certain money market securities, and are classified within Level 1. Instruments that trade in markets that are not considered to be active, but are valued based on quoted market prices, dealer quotations or alternative pricing sources supported by observable inputs, are classified within Level 2. Investments classified within Level 3 have significant unobservable inputs, as they trade infrequently or not at all. |
| | | |
| | | The following is a summary of the inputs used in valuing the Fund’s assets carried at fair value as of August 31, 2019. The inputs and methodologies used to value securities may not be an indication of the risk associated with investing in these securities. |
BARRETT
OPPORTUNITY FUND, INC.
| | | | | | | Other | | | | | | | |
| | | | | | | Significant | | | Significant | | | | |
| | | | Quoted | | | Observable | | | Unobservable | | | | |
| | | | Prices | | | Inputs | | | Inputs | | | | |
| | Description | | (Level 1) | | | (Level 2) | | | (Level 3) | | | Total | |
| | Assets | | | | | | | | | | | | |
| | Common Stocks | | $ | 52,675,416 | | | $ | — | | | $ | — | | | $ | 52,675,416 | |
| | REITs | | | 2,042,506 | | | | — | | | | — | | | | 2,042,506 | |
| | Money Market Funds | | | 2,758,126 | | | | — | | | | — | | | | 2,758,126 | |
| | Total Investments | | | | | | | | | | | | | | | | |
| | in Securities | | $ | 57,476,048 | | | $ | — | | | $ | — | | | $ | 57,476,048 | |
| | Liabilities | | | | | | | | | | | | | | | | |
| | Written Options | | $ | (55,500 | ) | | $ | (500 | ) | | $ | — | | | $ | (56,000 | ) |
| | There were no transfers of securities between levels during the reporting period. The Fund did not hold any Level 3 securities during the year. |
| | |
| | Derivative Instruments |
| | The Fund may invest in derivative instruments. The use of derivatives included written options. Written options are presented in the Statement of Assets and Liabilities. |
| | |
| | The effect of derivative instruments on the Statement of Operations for the fiscal year ended August 31, 2019: |
| | Derivatives not | |
| | accounted for as | on Derivatives Transactions |
| | hedging instruments | Written Options |
| | Equity Contracts | $0 |
| | |
|
| | Derivatives not | Change in Net Unrealized Appreciation |
| | accounted for as | on Derivatives Recognized in Income |
| | hedging instruments | Written Options |
| | Equity Contracts | $20,378 |
| | The Fund is not subject to any Master Netting Agreements; therefore, the Fund was not required to offset any assets or liabilities. |
| | |
| | (b) Options |
| | GAAP requires enhanced disclosures about the Fund’s derivative activities, including how such activities are accounted for and their effect on the Fund’s financial position and results of operations. |
| | |
| | The Fund is subject to equity price risk in the normal course of pursuing its investment objective. The Fund enters into written call options to hedge against changes in the value of equities. The Fund’s option component of the overall investment strategy is often referred to as a “buy-write” strategy (also called a “covered call” strategy), in which the Adviser (as defined below) writes (sells) a |
BARRETT
OPPORTUNITY FUND, INC.
| | call option contract while at the same time owning an equivalent number of shares of the underlying stock to generate moderate current income. The writing of call options is intended to reduce the volatility of the portfolio and to earn premium income. Written call options expose the Fund to minimal counterparty credit risk since they are exchange traded and the exchange’s clearing house guarantees the options against default. |
| | |
| | As the writer of a call option, the Fund has the obligation to sell the security at the exercise price during the exercise period in the event the option is exercised. |
| | |
| | When the Fund writes an option, an amount equal to the premium received by the Fund is recorded as a liability and is subsequently adjusted to the current fair value of the option written. Premiums received from writing options that expire unexercised are treated by the Fund on the expiration date as realized gains from options written. The difference between the premium and the amount paid on effecting a closing purchase transaction, including brokerage commissions, is also treated as a realized gain, or, if the premium is less than the amount paid for the closing purchase transaction, as a realized loss. If a call option is exercised, the premium is added to the proceeds from the sale of the underlying security or currency in determining whether the Fund has realized a gain or a loss. The Fund as writer of an option bears the market risk of an unfavorable change in the price of the security underlying the written option. The average notional amount for written options during the year ended August 31, 2019, was $728,788. |
| | |
| | (c) Security Transactions and Investment Income |
| | Security transactions are accounted for on a trade date basis. Interest income, adjusted for amortization of premium and accretion of discount, is recorded on the accrual basis. Dividend income is recorded on the ex-dividend date. Non-cash dividends are recorded at the fair market value of the securities received. Under applicable tax laws, a withholding tax may be imposed on interest, dividends, and capital gains at various rates and withholding taxes on foreign dividends have been provided for in accordance with the Fund’s understanding of the applicable country’s tax rules and rates. The cost of investments sold is determined by use of the specific identification method for computing the gain/loss on the transaction. It is the Fund’s policy to recognize a loss on a worthless security once it is determined beyond a reasonable doubt that there is no possibility of future worth. Proceeds from bankruptcy settlements will generally be recognized as a realized gain if the security is no longer held and as a return of capital if the security is still held. |
| | |
| | (d) Distributions to Shareholders |
| | The Fund will distribute any net investment income and any net realized long- or short-term capital gains at least annually. Distributions from net realized gains for book purposes may include short-term capital gains. All short-term capital gains are included in ordinary income for tax purposes. Distributions to shareholders are recorded on the ex-dividend date. The Fund may also pay a special distribution at the end of the calendar year to comply with federal tax requirements. |
BARRETT
OPPORTUNITY FUND, INC.
| | (e) REIT Distributions |
| | The character of distributions received from REITs held by the Fund is generally comprised of net investment income, capital gains, and return of capital. It is the policy of the Fund to estimate the character of distributions received from underlying REITs based on historical data provided by the REITs. After each calendar year end, REITs report the actual tax character of these distributions. Differences between the estimated and actual amounts reported by the REITs are reflected in the Fund’s records in the year in which they are reported by the REITs by adjusting related investment cost basis, capital gains and income, as necessary. |
| | |
| | (f) Federal Income Taxes |
| | It is the Fund’s policy to comply with the federal income and excise tax requirements of subchapter M of the Internal Revenue Code of 1986, as amended (the “Code”), necessary to qualify as a regulated investment company. Accordingly, the Fund intends to distribute its taxable income and net realized gains, if any, to shareholders in accordance with timing requirements imposed by the Code. Therefore, no federal income tax provision is provided in the Fund’s financial statements. |
| | |
| | As of and during the year ended August 31, 2019, the Fund did not have a liability of any unrecognized tax benefits. The Fund recognizes interest and penalties, if any, related to uncertain tax benefits as income tax expense in the Statement of Operations. During the year, the Fund did not incur any interest or penalties. The Fund is not subject to examination by U.S. taxing authorities for tax periods prior to 2016. |
| | |
| | (g) Use of Estimates |
| | The preparation of financial statements in conformity with GAAP requires management to make estimates and assumptions that affect the reported amounts of assets and liabilities and disclosure of contingent assets and liabilities as the date of the financial statements and the reported amounts of revenues and expenses during the reporting period. Actual results could differ from those estimates. |
| | |
| | (h) Indemnification |
| | In the normal course of business the Fund enters into contracts that contain general indemnification clauses. The Fund’s maximum exposure under these agreements is unknown, as this would involve future claims against the Fund that have not yet occurred. Based on experience, the Fund expects the risk of loss to be remote. |
| | |
| | (i) Beneficial Ownership |
| | The beneficial ownership, either directly or indirectly, of more than 25% of the voting securities of a fund creates a presumption of control of the fund, under Section 2(a)(9) of the 1940 Act. At August 31, 2019 John B. Gaguine had control of 30.15% of the outstanding shares of the Fund. |
BARRETT
OPPORTUNITY FUND, INC.
| 2. | INVESTMENT ADVISER AGREEMENT AND OTHER | The Fund has an Investment Advisory Agreement with Barrett Asset Management, LLC (“Barrett Asset Management” or the “Adviser”). Under the Investment Advisory Agreement, the Fund pays an advisory fee, calculated daily and paid monthly, in accordance with the following breakpoint schedule: |
|
| | TRANSACTIONS | | Average Daily Net Assets | Annual Rate | |
| | WITH AFFILIATES | | First $1 billion | 0.700% | |
| | | | Next $1 billion | 0.675% | |
| | | | Next $3 billion | 0.650% | |
| | | | Next $5 billion | 0.625% | |
| | | | Over $10 billion | 0.600% | |
| | | For the year ended August 31, 2019, the advisory fee totaled $411,396. |
| | | |
| | | The officers of the Fund are also officers and employees of Barrett Asset Management and do not receive compensation from the Fund. |
| | | |
| 3. | INVESTMENTS | During the year ended August 31, 2019, the aggregate cost of purchases and proceeds from sales of investments (excluding short-term investments) were as follows: |
| | | Purchases | Sales | |
| | | $4,847,762 | $4,253,679 | |
| 4. | CAPITAL SHARES | At August 31, 2019, the Fund had 15,000,000 shares of capital stock authorized with a par value of $0.01 per share. Transactions in shares of the Fund were as follows: |
| | | | Year Ended | | | Year Ended | |
| | | | August 31, 2019 | | | August 31, 2018 | |
| | Shares sold | | | 2,612 | | | | 14,687 | |
| | Shares issued on reinvestment | | | 186,110 | | | | 70,464 | |
| | Shares redeemed | | | (64,107 | ) | | | (98,234 | ) |
| | Net increase (decrease) | | | 124,615 | | | | (13,083 | ) |
| 5. | INCOME TAX | The tax character of distributions paid during the fiscal years ended August 31 | |
| | INFORMATION | were as follows: | | | | | | |
| | AND | | | | 2019 | | | | 2018 | |
| | DISTRIBUTIONS | Distributions Paid From: | | | | | | | | |
| | TO | Ordinary income | | $ | 545,834 | | | $ | 1,058,532 | |
| | SHAREHOLDERS | Long-term capital gain | | | | | | | 2,742,516 | |
| | | Total Distributions Paid | | | | | | $ | 3,801,048 | |
| | The Funds designated as long-term capital gain dividend, pursuant to Internal Revenue Cose Section 852(b)(3), to reduce the earnings and profits of the Fund related to net capital gain to zero for the tax year ended August 31, 2019. |
| | |
BARRETT
OPPORTUNITY FUND, INC.
| | As of August 31, 2019, the components of accumulated earnings (losses) for income tax purposes were as follows: |
| | Tax cost of Investments and Written options | | $ | 16,475,077 | |
| | Unrealized Appreciation | | | 40,991,011 | |
| | Unrealized Depreciation | | | (46,040 | ) |
| | Net unrealized appreciation (depreciation) | | | 40,944,971 | |
| | Undistributed operating income | | | 525,118 | |
| | Undistributed long-term gains | | | 4,983,473 | |
| | Distributable earnings | | | 5,508,591 | |
| | Other accumulated gain/(loss) | | | (22,526 | ) |
| | Total accumulated gain/(loss) | | $ | 46,431,036 | |
| | Additionally, U.S. generally accepted accounting principles require that certain components of net assets relating to permanent differences be reclassified between financial and tax reporting. These reclassifications have no effect on net assets or net asset value per share. For the year ended August 31, 2019, the following table shows the reclassifications made: |
| | Undistributed Net | Accumulated Net | Paid In |
| | Investment Income/(Loss) | Realized Gain/(Loss) | Capital |
| | $— | $— | $— |
| 6. | RECENT | The Securities and Exchange Commission adopted amendments to Regulation S-X, for the presentation of distributable earnings |
| | ACCOUNTING | and distributions to align with GAAP. The compliance date of the amendments to Regulation S-X was November 5, 2018. |
| | PRONOUNCE- | This report incorporates the amendments to Regulation S-X. |
| | MENTS |
|
| | | On August 28, 2018, the FASB issued Accounting Standards Update No. 2018-13 (“ASU 2018-13”), Fair Value Measurement (Topic 820): Disclosure Framework –Changes to the Disclosure Requirements for Fair Value Measurement, which changes the fair value measurement disclosure requirements of ASC Topic 820. ASU 2018-13’s amendments are effective for annual periods beginning after December 15, 2019. Early adoption is permitted. Management has adopted certain disclosures of ASU 2018-13 as permitted by the standard. |
| | | |
| 7. | SUBSEQUENT | As of October 7, 2019, the Fund changed Legal Counsel. Management has evaluated the impact of all subsequent events on the Fund
|
| | EVENT | through the date the financial statements were issued, and has determined that there were no other subsequent events requiring recognition |
| | DISCLOSURE | or disclosure in the financial statements.
Shareholder reports for the Fund will likely be delivered by paper (unless a shareholder has already elected, or elects in the future, to receive shareholder reports electronically) until at least January 1, 2022. |
| | | |
BARRETT
OPPORTUNITY FUND, INC.
| REPORT OF | To the Shareholders and Board of Directors of Barrett Opportunity Fund, Inc. |
| INDEPENDENT | |
| REGISTERED | Opinion on the Financial Statements |
| PUBLIC | |
ACCOUNTING FIRM | We have audited the accompanying statement of assets and liabilities, including the schedule of investments and schedule of written options, of Barrett Opportunity Fund, Inc. (the “Fund”) as of August 31, 2019, and the related statement of operations for the year then ended, the statements of changes in net assets for each of the two years in the period then ended, including the related notes, and the financial highlights for each of the five years in the period then ended (collectively referred to as the “financial statements”). In our opinion, the financial statements present fairly, in all material respects, the financial position of the Fund as of August 31, 2019, the results of its operations for the year then ended, the changes in its net assets for each of the two years in the period then ended, and the financial highlights for each of the five years in the period then ended, in conformity with accounting principles generally accepted in the United States of America. |
| | |
| | Basis for Opinion |
| | |
| | These financial statements are the responsibility of the Fund’s management. Our responsibility is to express an opinion on the Fund’s financial statements based on our audits. We are a public accounting firm registered with the Public Company Accounting Oversight Board (United States) (“PCAOB”) and are required to be independent with respect to the Fund in accordance with the U.S. federal securities laws and the applicable rules and regulations of the Securities and Exchange Commission and the PCAOB. |
| | |
| | We conducted our audits in accordance with the standards of the PCAOB. Those standards require that we plan and perform the audit to obtain reasonable assurance about whether the financial statements are free of material misstatement, whether due to error or fraud. |
| | |
| | Our audits included performing procedures to assess the risks of material misstatement of the financial statements, whether due to error or fraud, and performing procedures that respond to those risks. Such procedures included examining, on a test basis, evidence regarding the amounts and disclosures in the financial statements. Our procedures included confirmation of securities owned as of August 31, 2019, by correspondence with the custodian and brokers. Our audits also included evaluating the accounting principles used and significant estimates made by management, as well as evaluating the overall presentation of the financial statements. We believe that our audits provide a reasonable basis for our opinion. |
| | |
| | We have served as the Fund’s auditor since 2011. We have served as the auditor of one or more investment companies advised by Barrett Asset Management since 2010. |
| | |
| |  |
| | |
| | COHEN & COMPANY, LTD. |
| | Cleveland, Ohio |
| | October 30, 2019 |
BARRETT
OPPORTUNITY FUND, INC.
Additional Information (Unaudited)
1. INFORMATION ABOUT DIRECTORS AND OFFICERS
The business and affairs of the Fund are conducted by management under the supervision and subject to the direction of its Board of Directors. The business address of each Director is c / o Barrett Asset Management, LLC, the Fund’s investment manager (“Barrett Asset Management”), 90 Park Avenue, 34th Floor, New York, New York, 10016. Information pertaining to the Directors and officers of the Fund is set forth below.
The Statement of Additional Information includes additional information about the Directors and is available, without charge, upon request by calling the Fund at 1-877-363-6333.
| | | | | Number of | |
| | | | | Portfolios | |
| | | | | in Fund | Other Board |
| | Position(s) | Term of Office* | | Complex | Memberships |
| Name, Address | Held with | and Length of | Principal Occupation(s) | Overseen | Held by |
and Birth Year | Fund | Time Served** | During Past 5 Years | by Director | Director |
| |
INDEPENDENT DIRECTORS†: |
| | | | | | |
| Barry Handel, CPA | Director | Since 2005 | Partner, Shalik, Morris & | 1 | None |
| Birth Year: 1951 | | | Company, LLP | | |
| | | | (accounting firm) | | |
| | | | | | |
David H. Kochman(1) | Director | Since 2011 | Member, Harris Beach PLLC | 1 | None |
| Birth Year: 1959 | Chairperson | Since 2017 | (law firm) | | |
| | | | | | |
Rosalind A. Kochman(2) | Director | Since 1990 | Retired (since 2002); formerly, | 1 | None |
| Birth Year: 1937 | | | Chief Executive Officer, | | |
| | | | Brooklyn Eye Surgery Center, | | |
| | | | and Administrator, Kochman, | | |
| | | | Lebowitz & Mogil, MDs | | |
| | | | | | |
| William Morris, Jr., CPA | Director | Since 2005 | President, William | 1 | None |
| Birth Year: 1948 | | | Morris & Associates P.C. | | |
| | | | (accounting firm) | | |
| (1) | Mr. Kochman is Ms. Kochman’s son. |
| (2) | Ms. Kochman is Mr. Kochman’s mother. |
† | Directors who are not “interested persons” of the Fund within the meaning of Section 2(a)(19) of the 1940 Act. |
BARRETT
OPPORTUNITY FUND, INC.
| | | | | Number of | |
| | | | | Portfolios | |
| | | | | in Fund | Other Board |
| | Position(s) | Term of Office* | | Complex | Memberships |
| Name, Address | Held with | and Length of | Principal Occupation(s) | Overseen | Held by |
and Birth Year | Fund | Time Served** | During Past 5 Years | by Director | Director |
| | | | | | |
| OFFICERS: | | | | | |
| | | | | | |
| Peter H. Shriver, CFA | President | Since 2006 | Chief Executive Officer | N/A | N/A |
| Barrett Asset Management | and Chief | | of Barrett Asset | | |
| 90 Park Avenue | Executive | | Management (since 2011); | | |
| New York, NY 10016 | Officer | | President of Barrett Asset | | |
| Birth Year: 1952 | | | Management (2011-2014) | | |
| | | | | | |
| E. Wells Beck, CFA | Vice | Since 2010 | Managing Director and | N/A | N/A |
| Barrett Asset Management | President | | Director of Research, Barrett | | |
| 90 Park Avenue | and | | Asset Management | | |
| New York, NY 10016 | Investment | | (since 2011) | | |
| Birth Year: 1968 | Officer | | | | |
| | | | | | |
| Robert J. Milnamow | Vice | Since 2014 | President and Chief | N/A | N/A |
| Barrett Asset Management | President | | Investment Officer of | | |
| 90 Park Avenue | and Chief | | Barrett Asset Management | | |
| New York, NY 10016 | Investment | | (since 2011); Executive Vice | | |
| Birth Year: 1950 | Officer | | President, Barrett Asset | | |
| | | | Management (2006-2014) | | |
| | | | | | |
| Madeleine Morreale | Chief | Since 2011 | Chief Compliance Officer, | N/A | N/A |
| Barrett Asset Management | Compliance | | Barrett Asset Management | | |
| 90 Park Avenue | Officer | | (2011-Present) | | |
| New York, NY 10016 | and | | | | |
| Birth Year: 1956 | Anti-Money | | | | |
| | Laundering | | | | |
| | Officer | | | | |
| | | | | | |
| John G. Youngman | Chief | Since 2011 | Managing Director, | N/A | N/A |
| Barrett Asset Management | Financial | | Barrett Asset Management | | |
| 90 Park Avenue | Officer | | (2011-Present) | | |
| New York, NY 10016 | and | | | | |
| Birth Year: 1968 | Treasurer | | | | |
| * | | Directors and officers serve until their respective successor has been duly elected and qualified or until their earlier death, resignation, retirement or removal. |
| ** | | Indicates the earliest year in which the Director became a board member or the officer took such office. |
BARRETT
OPPORTUNITY FUND, INC.
2. IMPORTANT TAX INFORMATION
For the fiscal year ended August 31, 2019, certain dividends paid by the Funds may be subject to a maximum tax rate of 23.8%, as provided for by the Jobs and Growth Tax Relief Reconciliation Act of 2003.
The percentage of dividends declared from ordinary income designated as qualified dividend income was as follows:
Barrett Opportunity Fund | | | 100.00 | % |
For corporate shareholders, the percent of ordinary income distributions qualifying for the corporate dividends received deduction for the fiscal year ended August 31, 2019, was as follows:
Barrett Opportunity Fund | | | 100.00 | % |
The Percentage of taxable ordinary income distributions that are designated as short-term capital gain distributions under Internal Revenue Section 871(k)(2)(C) for each Fund were as follows (unaudited).
Barrett Opportunity Fund | | | 5.05 | % |
3. CONSIDERATION OF INVESTMENT ADVISORY AGREEMENT (UNAUDITED)
Section 15(c) under the 1940 Act, requires that a registered investment company’s board of directors, including a majority of independent directors voting separately, approve any new investment advisory agreement for the fund and thereafter review and approve the terms of the fund’s investment advisory agreement on an annual basis.
At a meeting (the “Meeting”) held in-person on April 18, 2019, the Board of Directors (the “Board”) of the Fund, including a majority of its members that are not “interested persons” under the 1940 Act (the “Independent Directors”), considered and approved the continuation of the Investment Advisory Agreement between the Fund and Barrett Asset Management for an additional one-year term.
In reaching its decisions, the Board considered the information furnished and discussed throughout the year at regularly scheduled Board meetings and the information provided specifically in response to a request from the Independent Directors in connection with the annual consideration of the approval of the Investment Advisory Agreement. In addition to evaluating, among other things, the written information provided by the Adviser, the Board also considered the answers to questions posed by the Board to representatives of the Adviser at the Meeting. The Directors’ decisions also reflected the knowledge and familiarity gained as Board members of the Fund with respect to the services provided to the Fund by the Adviser. A written description of directors’ statutory responsibilities and the legal standards that are applicable to approvals of advisory agreements was also provided to the Directors.
The Independent Directors received assistance from, and met separately with, their independent legal counsel to review and consider the information provided regarding the Investment Advisory Agreement. The Directors’ decisions were made on the basis of each Director’s business judgment after consideration of all of the factors taken in their entirety. In its deliberations, the Board did not identify any single factor or group of factors as all-important or controlling, but considered all factors together. Although not meant to be all-inclusive, some of the factors and conclusions that formed the basis for the Board’s determinations are discussed below:
Nature, Extent and Quality of the Investment Advisory Services Provided to the Fund. The Directors considered the information provided regarding the nature, quality and extent of services that the Adviser provides
BARRETT
OPPORTUNITY FUND, INC.
to the Fund, including, but not limited to, making the day-to-day decisions for investing the Fund’s assets in accordance with the Fund’s objectives, policies and investment restrictions, subject to the supervision and direction of the Board. The Directors noted that the Adviser also provides the Fund with certain administrative services, office facilities and Fund officers, among other services, and coordinates and arranges the performance of the Fund’s outside service providers, including the Fund’s administrator, transfer agent and custodian.
In addition, the Directors considered the education, background and experience of the personnel and management team at the Adviser. The Directors considered the Adviser’s employee compensation structure and its ability to retain quality and experienced personnel. The Adviser presented information at the Meeting regarding the financial resources available to support its activities with respect to the Fund. Based on these and other relevant factors, including those discussed below, the Board concluded that the services provided to the Fund under the Investment Advisory Agreement continued to be satisfactory.
Fund Performance. The Board received and considered performance information for the Fund, as well as for a group of funds identified by Morningstar® DirectSM (“Morningstar”), an independent provider of investment company data, that are comparable to the Fund in their objectives and strategies and that have assets ranging from $25 million to $100 million (the “Morningstar Large Value Category”). The Board considered that the Fund outperformed the average of its Morningstar Large Value Category peers in the one-, three- and five-year periods. The Board took into consideration that the Fund is managed in a tax-aware manner in light of its substantial unrealized capital gains and that the Fund’s investment strategy is conservative. The Directors also received and considered the information provided by the Adviser comparing past investment performance of the Fund against the S&P 500® Index and the Lipper Large-Cap Value Funds Index. The Directors concluded that, in light of the Fund’s investment approach and the constraints upon the Fund’s investment program, the Adviser has appropriate expertise to continue to manage the Fund in accordance with its investment objectives and strategies.
Investment Advisory Fees and Expense Ratio. The Board reviewed and considered the advisory fee paid by the Fund to the Adviser under the Investment Advisory Agreement (the “Advisory Fee”). The Board received and considered information and analyses prepared by Morningstar, comparing the Advisory Fee and the Fund’s overall expenses with its peers in the Morningstar Large Value Category. The Directors noted that the Fund’s Advisory Fee ranked in the second quartile of its Morningstar Large Value Category and was below (i.e., better than) the category average and median on a contractual fee basis. On a “net,” or actual basis, the Advisory Fee was above (i.e., worse than) the category average. The Fund’s total expense ratio was ranked in the third quartile of its Morningstar Large Value Category and was above (i.e., worse than) the category average. The Board took into consideration the Adviser’s explanation that other constituent funds in the Morningstar Large Value Category, unlike the Fund, may have opportunities to realize economies of scale and to share certain costs as members of fund families with multiple funds.
The Board noted that the Adviser does not manage any funds with objectives, strategies and assets comparable to the Fund, but that it does manage institutional accounts with similar objectives and strategies. After reviewing the information provided, the Board noted that the services provided to such other accounts are very different than the services provided to the Fund and noted that the Fund, as a registered investment company, is subject to heightened regulatory requirements and supervision.
BARRETT
OPPORTUNITY FUND, INC.
Adviser Profitability. The Directors took into account information provided by the Adviser as to the profitability of its relationship with the Fund. Given the need to assure continuity in the investment advisory services to the Fund and the absence of any realistic alternative to the Investment Advisory Agreement especially in light of the Fund’s size, the Directors did not give significant weight to the profitability to the Adviser from its relationship with the Fund. However, the Directors noted that the Adviser’s profitability appeared not to be excessive in light of the nature, quality and extent of investment advisory and other services provided to the Fund by the Adviser.
Economies of Scale. The Directors considered that, while the Investment Advisory Agreement does contain breakpoints for the Adviser to pass on economies of scale to the Fund, economies of scale are not likely to be realized since the Fund is not actively marketed.
Other Benefits to the Investment Adviser. The Board considered other benefits received by the Adviser as a result of its relationship with the Fund, including the opportunity to obtain research services from brokers who effect Fund portfolio transactions, but did not regard such benefits as excessive as the Fund’s low turnover limits the amount of commission dollars.
The Directors, including the Independent Directors, concluded that the terms of the Investment Advisory Agreement are acceptable and that the fees stated therein are reasonable in light of the services to be provided to the Fund and the need to assure continuity of investment advisory services to the Fund. In considering whether to approve the continuation of the Investment Advisory Agreement, the Board determined that continuation of the Fund’s operations would be in the interests of the Fund and its shareholders.
The Fund files its complete schedule of portfolio holdings with the Securities and Exchange Commission (“SEC”) for the first and third quarters of each fiscal year on Form N-Q. The Fund’s Forms N-Q are available on the SEC’s website at www.sec.gov. The Fund’s Forms N-Q may be reviewed and copied at the SEC’s Public Reference Room in Washington, D.C., and information on the operation of the Public Reference Room may be obtained by calling 1-800-SEC-0330. To obtain information on Form N-Q from the Fund, shareholders can call the Fund at 1-877-363-6333.
Information on how the Fund voted proxies relating to portfolio securities during the prior 12-month period ended June 30th of each year and a description of the policies and procedures that the Fund uses to determine how to vote proxies related to portfolio transactions are available (1) without charge, upon request, by calling the Fund at 1-877-363-6333 and (2) on the SEC’s website at www.sec.gov.
BARRETT OPPORTUNITY FUND, INC.c/o U.S. Bank Global Fund Services
615 E. Michigan Street
Milwaukee, WI 53202
DIRECTORS
Barry Handel, CPA
David H. Kochman, Chairperson
Rosalind A. Kochman
William Morris, Jr., CPA
INVESTMENT MANAGER
Barrett Asset Management, LLC
90 Park Avenue
New York, NY 10016
ADMINISTRATOR, FUND ACCOUNTANT & TRANSFER AGENT
U.S. Bank Global Fund Services
615 East Michigan Street
Milwaukee, WI 53202
DISTRIBUTOR
Quasar Distributors, LLC
777 East Wisconsin Avenue, 6th Floor
Milwaukee, WI 53202
CUSTODIAN
U.S. Bank, N.A.
Custody Operations
1555 River Center Drive, Suite 302
Milwaukee, WI 53212
LEGAL COUNSEL
Stradley Ronon Stevens & Young, LLP
2005 Market Street, Suite 2600
Philadelphia, PA 19103
INDEPENDENT REGISTERED PUBLIC ACCOUNTING FIRM
Cohen & Company, Ltd.
1350 Euclid Avenue, Suite 800
Cleveland, OH 44115
This report is transmitted to the shareholders of Barrett Opportunity Fund, Inc. for their information. This is not a prospectus, circular or representation intended for use in the purchase of shares of the Fund or any securities mentioned in this report.
This report must be preceded or accompanied by a free prospectus. Investors should consider the Fund’s investment objective, risks, charges and expenses carefully before investing. The prospectus contains this and other important information about the Fund. Please read the prospectus carefully before investing.
Item 2. Code of Ethics.
The registrant has adopted a code of ethics that applies to the registrant’s principal executive officer and principal financial officer. The registrant has not made any substantive amendments to its code of ethics during the period covered by this report. The registrant has not granted any waivers from any provisions of the code of ethics during the period covered by this report. Filed herewith.
Item 3. Audit Committee Financial Expert.
The registrant’s board of directors has determined that there is at least one audit committee financial expert serving on its audit committee. Mr. William Morris is the “audit committee financial expert” and is considered to be “independent” as each term is defined in Item 3 of Form N‑CSR.
Item 4. Principal Accountant Fees and Services.
The registrant has engaged its principal accountant to perform audit services, audit-related services, tax services and other services during the past two fiscal years. “Audit services” refer to performing an audit of the registrant's annual financial statements or services that are normally provided by the accountant in connection with statutory and regulatory filings or engagements for those fiscal years. “Audit-related services” refer to the assurance and related services by the principal accountant that are reasonably related to the performance of the audit. “Tax services” refer to professional services rendered by the principal accountant for tax compliance, tax advice, and tax planning. There were no “Other services” provided by the principal accountant. The following table details the aggregate fees billed or expected to be billed for each of the last two fiscal years for audit fees, audit-related fees, tax fees and other fees by the principal accountant.
| | FYE 08/31/2019 | FYE 08/31/2018 |
Audit Fees | 15,500 | 15,000 |
Audit-Related Fees | 0 | 0 |
Tax Fees | 2,500 | 2,500 |
All Other Fees | 0 | 0 |
The audit committee has adopted pre-approval policies and procedures that require the audit committee to pre‑approve all audit and non‑audit services of the registrant, including services provided to any entity affiliated with the registrant.
The percentage of fees billed by Cohen & Company, Ltd. applicable to non-audit services pursuant to waiver of pre-approval requirement were as follows:
| | FYE 08/31/2019 | FYE 08/31/2018 |
Audit-Related Fees | 0% | 0% |
Tax Fees | 0% | 0% |
All Other Fees | 0% | 0% |
All of the principal accountant’s hours spent on auditing the registrant’s financial statements were attributed to work performed by full‑time permanent employees of the principal accountant.
The following table indicates the non-audit fees billed or expected to be billed by the registrant’s accountant for services to the registrant and to the registrant’s investment adviser (and any other controlling entity, etc.—not sub-adviser) for the last two years. The audit committee of the board of trustees/directors has considered whether the provision of non-audit services that were rendered to the registrant's investment adviser is compatible with maintaining the principal accountant's independence and has concluded that the provision of such non-audit services by the accountant has not compromised the accountant’s independence.
Non-Audit Related Fees | FYE 08/31/2019 | FYE 08/31/2018 |
Registrant | 2,500 | 2,500 |
Registrant’s Investment Adviser | 0 | 0 |
Item 5. Audit Committee of Listed Registrants.
Not applicable to registrants who are not listed issuers (as defined in Rule 10A-3 under the Securities Exchange Act of 1934).
Item 6. Investments.
Schedule of Investments is included as part of the report to shareholders filed under Item 1 of this Form.
Item 7. Disclosure of Proxy Voting Policies and Procedures for Closed-End Management Investment Companies.
Not applicable to open-end investment companies.
Item 8. Portfolio Managers of Closed-End Management Investment Companies.
Not applicable to open-end investment companies.
Item 9. Purchases of Equity Securities by Closed‑End Management Investment Company and Affiliated Purchasers.
Not applicable to open-end investment companies.
Item 10. Submission of Matters to a Vote of Security Holders.
Not Applicable.
Item 11. Controls and Procedures.
(a) | The Registrant’s President and Treasurer have reviewed the Registrant's disclosure controls and procedures (as defined in Rule 30a-3(c) under the Investment Company Act of 1940 (the “Act”)) as of a date within 90 days of the filing of this report, as required by Rule 30a-3(b) under the Act and Rules 13a-15(b) or 15d‑15(b) under the Securities Exchange Act of 1934. Based on their review, such officers have concluded that the disclosure controls and procedures are effective in ensuring that information required to be disclosed in this report is appropriately recorded, processed, summarized and reported and made known to them by others within the Registrant and by the Registrant’s service provider. |
(b) | There were no changes in the Registrant's internal control over financial reporting (as defined in Rule 30a-3(d) under the Act) that occurred during the second fiscal quarter of the period covered by this report that has materially affected, or is reasonably likely to materially affect, the Registrant's internal control over financial reporting. |
Item 12. Disclosure of Securities Lending Activities for Closed-End Management Investment Companies
Not applicable to open-end investment companies.
Item 13. Exhibits.
| (a) | (1) Any code of ethics or amendment thereto, that is the subject of the disclosure required by Item 2, to the extent that the registrant intends to satisfy Item 2 requirements through filing an exhibit. Filed herewith. |
(2) A separate certification for each principal executive and principal financial officer pursuant to Section 302 of the Sarbanes-Oxley Act of 2002. Filed herewith.
(3) Any written solicitation to purchase securities under Rule 23c‑1 under the Act sent or given during the period covered by the report by or on behalf of the registrant to 10 or more persons. Not applicable to open-end investment companies.
| (b) | Certifications pursuant to Section 906 of the Sarbanes‑Oxley Act of 2002. Furnished herewith. |
SIGNATURES
Pursuant to the requirements of the Securities Exchange Act of 1934 and the Investment Company Act of 1940, the registrant has duly caused this report to be signed on its behalf by the undersigned, thereunto duly authorized.
(Registrant) Barrett Opportunity Fund, Inc.
By (Signature and Title)* /s/Robert Milnamow
Robert Milnamow, Chief Investment Officer
Date November 12, 2019
Pursuant to the requirements of the Securities Exchange Act of 1934 and the Investment Company Act of 1940, this report has been signed below by the following persons on behalf of the registrant and in the capacities and on the dates indicated.
By (Signature and Title)* /s/Robert Milnamow
Robert Milnamow, Chief Investment Officer
Date November 12, 2019
By (Signature and Title)* /s/John G. Youngman
John G. Youngman, Treasurer
Date November 12, 2019
* Print the name and title of each signing officer under his or her signature.