Annual Report
August 31, 2023
INVESTMENT PRODUCTS: NOT FDIC INSURED • NO BANK GUARANTEE • MAY LOSE VALUE
| Annual Report | • | August 31, 2023 |
| | | |
| | | |
| Fund Objectives | | The Fund seeks to achieve above average long-term capital appreciation. Current income is a secondary objective. The Fund invests primarily in common stocks and securities convertible into or exchangeable for common stock such as convertible preferred stock or convertible debt securities. |
| What’s Inside | | Letter from the Chairperson | 1 |
| | | Manager Overview | 1 |
| | | Fund at a Glance | 5 |
| | | Fund Expenses | 6 |
| | | Historical Performance | 7 |
| | | Schedule of Investments | 8 |
| | | Statement of Assets & Liabilities | 10 |
| | | Statement of Operations | 11 |
| | | Statements of Changes in Net Assets | 12 |
| | | Financial Highlights | 13 |
| | | Notes to Financial Statements | 14 |
| | | Report of Independent Registered Public Accounting Firm | 22 |
| | | Additional Information | 23 |
| | | Important Tax Information | 25 |
| Letter from the Chairperson | | Dear Shareholder, |
| | | We are pleased to provide the annual report of the Barrett Opportunity Fund, Inc.1 (the”Fund”) for the twelve-month period ended August 31, 2023. |
| | | |
| | | The management team at Barrett Asset Management, LLC (“Barrett”) has prepared the enclosed Manager’s Overview, which includes a brief market overview, as well as a performance review. I urge you to read it as well as the accompanying financial statements. A detailed summary of the Fund’s performance and other pertinent information are also included in this report. I am sure you will find it informative and useful. |
| | | |
| | | On behalf of the Directors and the officers of the Fund, I thank you for your ongoing confidence in the Fund and its investment policies. |
| | | |
| | | Sincerely, |
| | |  |
| | | David H. Kochman |
| | | Chairperson |
| | | October 5, 2023 |
| | | 1 | The Fund was formerly known as the Salomon Brothers Opportunity Fund Inc. The Fund name, investment manager and certain investment policies were changed effective December 1, 2006. |
Manager Overview | | Market Overview |
| | | Stocks have enjoyed a strong twelve-month period ending August 31, 2023. It appears market participants are more optimistic the U.S. economy can achieve a “soft landing”, defined as a cyclical slowdown in productivity that avoids recession. The Federal Reserve’s strategic efforts to reduce inflationary pressures have apparently not choked off our domestic economic engine. While risks related to lingering inflationary pressures and geopolitical issues remain unresolved, we believe the lack of negative news (since the banking turmoil back in March) has enabled the equity markets to grind out positive performance in recent months. |
| | | |
| | | Although prospects of a recession have seemingly diminished, there are reasons to remain vigilant. To start, we emphasize a collection of leading economic indicators (statistics that change before an economy shows any signs of change) that appear to have peaked last Spring. If history is any guide, this may imply a recession could materialize in the coming quarters. |
| | | We further believe consumer spending may be running lower on fuel. Excess savings from the pandemic appear spent. We also observe the quit rate, a measure of job hopping, has returned to pre-pandemic levels. This is a lead signal that appears to suggest average pay growth could moderate. We further expect government spending (which positively contributed to business activity in the past few years) to swing to a more neutral stance going forward. Certain benefits, such as childcare provider stabilization funds or student loan payment pause, have either expired or are set to expire in the Fall. In our view, cost-of-living adjustments for government distributions, such as social security benefits, should also decline as these adjustments are correlated to inflation growth. |
| | | |
| | | A bigger reason behind our more cautious tone is the risk of monetary policy error. The Fed has kept the possibility of rate hikes open-ended. We hold the view that there are “long and variable” lags in monetary policy with the rationale being transactions have prices (which impact inflation) and quantities (which impact employment) agreed upon well in advance. Said differently, it takes time for certain contracts (think rent leases or bank loans) to reflect higher levels of interest rates. Therefore, we anticipate economic activity should slow further into 2024. We also think interest rates above 5% may prompt consumers to shift behavior more dramatically than when rates were at 2%. Regardless of the level of market optimism in recent months, we worry an overly aggressive monetary stance could result in harsher economic repercussions. |
| | | |
| | | Investment Outlook |
| | | |
| | | Longer term, we are constructive on the outlook for economic growth. We are encouraged by the continued strength in U.S. labor market, and the pace of technology innovation, which could add to domestic productivity. However, it has been noted that tight employment may keep inflation stickier than expected. Companies are managing well in the current environment, at least in our view, by raising prices and/or curbing expenses. Corporate capital allocation strategies, such as mergers & acquisitions, and buybacks, may further support earnings growth rates. |
| | | While concerns of a potential domestic recession have seemingly diminished, we continue to monitor macroeconomic factors. Levels of inflation remain elevated in many international regions. In such an environment, we believe companies with strong market positions should perform well. |
| | | |
| | | Portfolio and Performance Review |
| | | |
| | | During the twelve-month period ending August 31, 2023, the Fund appreciated 10.4% versus a gain of 11.5% for the Lipper Large Cap Value Fund Index and 15.9% for the S&P 500 Index. |
| | | |
| | | The fund’s performance relative to the broader equity market was supported by its underweighting in utilities as well as its overweighting and favorable stock selection in energy. The fund’s performance was negatively impacted by its underweighting in information technology and stock selection in the industrial sector. |
| | | Microsoft, Shell, and Alphabet were the leading contributors to the fund’s performance over the twelve month period ending August 2023. Crown Castle, Rayonier, and Philips were the largest detractors to the fund’s performance over the same time period. |
| | | |
| | | Going forward, as investors continue to assess the possibility of a recession, and still worry over inflation, higher interest rates, and geopolitical tensions, we would anticipate greater stock market volatility. Accordingly, we continue to favor high-quality business models and balance sheets as an anchor to windward. We also prefer companies with strong track records in returning value to shareholders. |
| | | |
| | | We have designed the Fund to achieve diversification across a variety of sectors and geographies. Our goal is to outpace market returns through time and believe our selection of companies will achieve this as they are constantly innovating to sustain healthy growth profiles and paying dividends back to shareholders. |
| | | |
| | | We thank you for your continued interest in the Fund. |
| | | |
| | | Sincerely, |
| | |  |  |
| | | Amy Kong | E. Wells Beck, CFA |
| | | Portfolio Manager | Portfolio Manager |
| | | Important Disclosure Information |
| | | |
| | | This information is for educational purposes and is not intended to provide, and should not be relied upon for, accounting, legal, tax, insurance, or investment advice. This does not constitute an offer to provide any services, nor a solicitation to purchase securities. The contents are not intended to be advice tailored to any particular person or situation. We believe the information provided is accurate and reliable, but do not warrant it as to completeness or accuracy. This information may include opinions or forecasts, including investment strategies and economic and market conditions; however, there is no guarantee that such opinions or forecasts will prove to be correct, and they also may change without notice. We encourage you to speak with a qualified professional regarding your scenario and the then-current applicable laws and rules. |
| | | |
| | | Different types of investments involve degrees of risk. The future performance of any investment or wealth management strategy, including those recommended by us, may not be profitable or suitable or prove successful. Past performance is not indicative of future results. One cannot invest directly in an index or benchmark, and those do not reflect the deduction of various fees that would diminish results. Any index or benchmark performance figures are for comparison purposes only, and client account holdings will not directly correspond to any such data. |
| | | |
| | | Advisory services are offered through Corient Private Wealth LLC and its affiliates, each being a registered investment adviser (“RIA”) regulated by the U.S. Securities and Exchange Commission (“SEC”). The advisory services are only offered in jurisdictions where the RIA is appropriately registered. The use of the term “registered” does not imply any particular level of skill or training and does not imply any approval by the SEC. For a complete discussion of the |
| | | scope of advisory services offered, fees, and other disclosures, please review the RIA’s Disclosure Brochure (Form ADV Part 2A) and Form CRS, available upon request from the RIA and online at https://adviserinfo.sec.gov/. We also encourage you to review the RIA’s Privacy Policy and Code of Ethics, which are available upon request. |
| | | |
| | | Our clients must, in writing, advise us of personal, financial, or investment objective changes and any restrictions desired on our services so that we may re-evaluate any previous recommendations and adjust our advisory services as needed. For current clients, please advise us immediately if you are not receiving monthly account statements from your custodian. We encourage you to compare your custodial statements to any information we provide to you. |
| | | |
| | | Lipper Large Cap Value Fund Index refers to an equally weighted performance index of the 30 largest qualifying mutual funds (based on net assets) in the Lipper Large-Cap classification. |
Fund at a Glance (Unaudited)
Top Ten Holdings – as of 8/31/2023
(As a percentage of Total Investments)
| | General Dynamics Corp. | 9.8% |
| | Shell PLC – Class A – ADR | 9.5% |
| | Microsoft Corp. | 9.3% |
| | Apple, Inc. | 8.6% |
| | Alphabet, Inc. – Class C | 7.4% |
| | Murphy USA Inc. | 7.2% |
| | The Bank of New York Mellon Corp. | 6.4% |
| | Automatic Data Processing, Inc. | 5.1% |
| | Murphy Oil Corp. | 4.7% |
| | Jefferies Financial Group, Inc. | 4.4% |
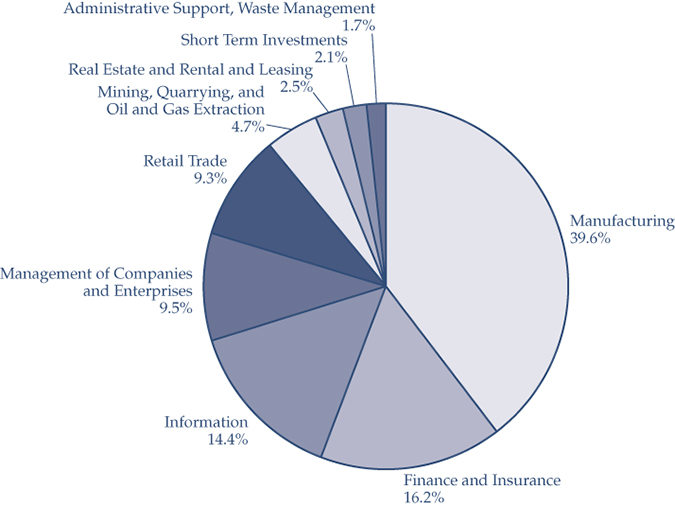
Sector Weightings – as of 8/31/2023
(As a percentage of Total Investments)
Fund Expenses (Unaudited)
Example
As a shareholder of the Fund, you may incur two types of costs: (1) transaction costs and (2) ongoing costs, including management fees and other Fund expenses. This example is intended to help you understand your ongoing costs (in dollars) of investing in the Fund and to compare these costs with the ongoing costs of investing in other mutual funds.
This example is based on an investment of $1,000 invested on March 1, 2023, and held for the six months ended August 31, 2023.
Actual Expenses
The row of the table below titled “Actual Barrett Opportunity Fund, Inc. Expenses” provides information about actual account values and actual expenses. You may use the information provided in this table, together with the amount you invested, to estimate the expenses that you paid over the period. To estimate the expenses you paid on your account, divide your ending account value by $1,000 (for example, an $8,600 ending account value divided by $1,000 = 8.6), then multiply the result by the number under the heading entitled “Expenses Paid During the Period.”
Hypothetical Example for Comparison Purposes
The row of the table below titled “Hypothetical Expenses” provides information about hypothetical account values and hypothetical expenses based on the actual expense ratio and an assumed rate of return of 5.00% per year before expenses, which is not the Fund’s actual return. The hypothetical account values and expenses may not be used to estimate the actual ending account balance or expenses you paid for the period. You may use the information provided in this table to compare the ongoing costs of investing in the Fund and other funds. To do so, compare the 5.00% hypothetical example relating to the Fund with the 5.00% hypothetical examples that appear in the shareholder reports of the other funds.
Please note that the expenses shown in the table below are meant to highlight your ongoing costs only and do not reflect any transactional costs. Therefore, the table is useful in comparing ongoing costs only, and will not help you determine the relative total costs of owning different funds. In addition, if these transaction costs were included, your costs would have been higher.
| | | | | | Expenses Paid |
| | Beginning | | Ending | | During the Period* |
| | Account | | Account | | March 1, 2023 to |
| | Value | | Value | | August 31, 2023 |
| Actual Barrett Opportunity Fund, Inc. Expenses | $1,000.00 | | $1,093.90 | | $7.12 |
| Hypothetical Expenses | | | | | |
| (5% return per year before expenses) | $1,000.00 | | $1,018.40 | | $6.87 |
| * | Expenses are equal to the Fund’s annualized six-month expense ratio of 1.35%, multiplied by the average account value over the period, multiplied by 184/365 (to reflect the one-half year period). |
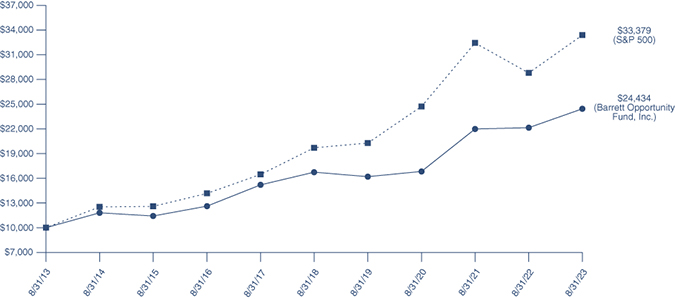
Historical Performance (Unaudited)
Value of $10,000 Invested in Barrett Opportunity Fund, Inc. vs.
the S&P 500® Index† (August 2013 – August 2023)
| † | Hypothetical illustration of $10,000 invested in Barrett Opportunity Fund, Inc. on August 31, 2013 assuming the reinvestment of all distributions, including returns of capital, if any, at net asset value through August 31, 2023. The S&P 500® Index is a market-value weighted index comprised of 500 widely held common stocks. The Index is unmanaged and it is not subject to the same management and trading expenses of a mutual fund. Please note that an investor cannot invest directly in an index. |
Fund Performance
Average Annual Total Returns*
| | | | | | | | Since |
| | | | | | | | Inception |
| | 1 Year | | 5 Years | | 10 Years | | (2/28/1979) |
| Barrett Opportunity Fund, Inc. | 10.35% | | 7.85% | | 9.34% | | 10.60% |
| S&P 500 Index | 15.94% | | 11.12% | | 12.81% | | 11.94% |
| * | Assumes the reinvestment of all distributions at net asset value but does not reflect deductions of taxes that a shareholder would pay on Fund distributions and the redemption of Fund shares. All figures represent past performance and are not a guarantee of future results. Investment return and principal value of an investment will fluctuate so that an investor’s shares, when redeemed, may be worth more or less than their original cost. |
Schedule of Investments
August 31, 2023
| Shares | | | | Value | |
| | | | | | |
| | | COMMON STOCKS - 94.37% | | | |
| | | | | | |
| | | Administrative and | | | |
| | | Support Services - 1.70% | | | |
| | 2,750 | | FleetCor Technologies, Inc. (a) | | $ | 747,257 | |
| | | | | | | | |
| | | | Beverage and | | | | |
| | | | Tobacco Product | | | | |
| | | | Manufacturing - 3.34% | | | | |
| | 8,247 | | PepsiCo., Inc. | | | 1,467,306 | |
| | | | | | | | |
| | | | Building Material and | | | | |
| | | | Garden Equipment and | | | | |
| | | | Supplies Dealers - 2.07% | | | | |
| | 2,749 | | The Home Depot, Inc. | | | 907,995 | |
| | | | | | | | |
| | | | Chemical | | | | |
| | | | Manufacturing - 6.09% | | | | |
| | 9,163 | | Abbott Laboratories | | | 942,873 | |
| | 7,560 | | AbbVie, Inc. | | | 1,111,018 | |
| | 3,849 | | Johnson & Johnson | | | 622,306 | |
| | | | | | | 2,676,197 | |
| | | | Computer and | | | | |
| | | | Electronic Product | | | | |
| | | | Manufacturing - 18.72% | | | | |
| | 23,367 | | Alphabet, Inc. - Class C (a) | | | 3,209,458 | |
| | 19,885 | | Apple, Inc. | | | 3,735,795 | |
| | 2,291 | | Thermo Fisher Scientific, Inc. | | | 1,276,316 | |
| | | | | | | 8,221,569 | |
| | | | | | | | |
| | | | Credit Intermediation and | | | | |
| | | | Related Activities - 6.37% | | | | |
| | 62,311 | | The Bank of New York | | | | |
| | | | Mellon Corp. | | | 2,795,895 | |
| | | | | | | | |
| | | | Data Processing, Hosting | | | | |
| | | | and Related Services - 5.02% | | | | |
| | 8,663 | | Automatic Data Processing, Inc. | | | 2,205,686 | |
| | | | | | | | |
| | | | Diversified Financials - 1.02% | | | | |
| | 641 | | BlackRock, Inc. | | | 449,046 | |
| | | | | | | | |
| | | | Insurance Carriers and | | | | |
| | | | Related Activities - 2.37% | | | | |
| | 7,789 | | Progressive Corp. | | $ | 1,039,598 | |
| | | | | | | | |
| | | | Machinery | | | | |
| | | | Manufacturing - 1.31% | | | | |
| | 5,500 | | EnerSys, Inc. | | | 577,390 | |
| | | | | | | | |
| | | | Management of Companies | | | | |
| | | | and Enterprises - 9.40% | | | | |
| | 66,526 | | Shell PLC - Class A - ADR | | | 4,130,599 | |
| | | | | | | | |
| | | | Merchant Wholesalers, | | | | |
| | | | Durable Goods - 4.39% | | | | |
| | 54,064 | | Jefferies Financial Group, Inc. | | | 1,929,544 | |
| | | | | | | | |
| | | | Motor Vehicle and | | | | |
| | | | Parts Dealers - 7.16% | | | | |
| | 9,897 | | Murphy USA, Inc. | | | 3,143,683 | |
| | | | | | | | |
| | | | Petroleum and | | | | |
| | | | Coal Products | | | | |
| | | | Manufacturing - 4.60% | | | | |
| | 44,534 | | Murphy Oil Corp. | | | 2,021,844 | |
| | | | | | | | |
| | | | Publishing Industries | | | | |
| | | | (except Internet) - 9.23% | | | | |
| | 12,370 | | Microsoft Corp. | | | 4,054,391 | |
| | | | | | | | |
| | | | Securities, Commodity | | | | |
| | | | Contracts, and Other | | | | |
| | | | Financial Investments and | | | | |
| | | | Related Activities - 1.89% | | | | |
| | 8,018 | | Ares Management Corp. | | | 829,382 | |
| | | | | | | | |
| | | | Transportation Equipment | | | | |
| | | | Manufacturing - 9.69% | | | | |
| | 18,785 | | General Dynamics Corp. | | | 4,257,432 | |
| | | | | | | | |
| | | | Total Common Stocks | | | | |
| | | | (Cost $8,073,501) | | | 41,454,814 | |
| | | | | | | | |
The accompanying notes are an integral part of these financial statements.
Schedule of Investments (continued)
August 31, 2023
| Shares | | | | Value | |
| | | | | | |
| | | REAL ESTATE INVESTMENT | | | |
| | | TRUSTS (REITs) - 2.47% | | | |
| | | | | | |
| | | Real Estate - 2.47% | | | |
| | 36,234 | | Rayonier, Inc. | | $ | 1,083,397 | |
| | | | | | | | |
| | | | Total Real Estate Investment | | | | |
| | | | Trusts (Cost $178,977) | | | 1,083,397 | |
| | | | | | | | |
| | | | SHORT-TERM | | | | |
| | | | INVESTMENTS - 2.09% | | | | |
| | | | | | | | |
| | | | Money Market Funds - 2.09% | | | | |
| | 918,230 | | Fidelity Institutional Money | | | | |
| | | | Market Fund - Government | | | | |
| | | | Portfolio - Class I, 5.24% (b) | | | 918,230 | |
| | | | | | | | |
| | | | Total Short-Term Investments | | | | |
| | | | (Cost $918,230) | | | 918,230 | |
| | | | | | | | |
| | | | Total Investments | | | | |
| | | | (Cost $9,170,708) - 98.93% | | | 43,456,441 | |
| | | | | | | | |
| | | | Other Assets in Excess | | | | |
| | | | of Liabilities - 1.07% | | | 469,682 | |
| | | | | | | | |
| | | | Total Net Assets - 100.00% | | $ | 43,926,123 | |
ADR – American Depository Receipt
PLC – Public Limited Company
| (a) | Non-income producing security. |
| (b) | Rate shown is the 7-day effective yield as of August 31, 2023. |
The accompanying notes are an integral part of these financial statements.
Statement of Assets & Liabilities
August 31, 2023
| ASSETS: | | | |
| Investments, at value (cost $9,170,708) | | $ | 43,456,441 | |
| Dividends and interest receivable | | | 93,825 | |
| Receivable for investments sold | | | 1,012,182 | |
| Other assets | | | 18,262 | |
| Total Assets | | | 44,580,710 | |
| | | | | |
| LIABILITIES: | | | | |
| Payable to adviser | | | 25,806 | |
| Payable to custodian | | | 1,111 | |
| Payable for investments purchased | | | 575,832 | |
| Other accrued expenses | | | 51,838 | |
| Total Liabilities | | | 654,587 | |
| | | | | |
| NET ASSETS | | $ | 43,926,123 | |
| | | | | |
| NET ASSETS CONSIST OF: | | | | |
| Capital stock | | $ | (337,213 | ) |
| Total distributable earnings | | | 44,263,336 | |
| Total Net Assets | | $ | 43,926,123 | |
| | | | | |
| Shares outstanding | | | 1,690,848 | |
| Net asset value, offering price and redemption price | | | | |
| per share (15,000,000 shares authorized, $0.01 par value) | | $ | 25.98 | |
The accompanying notes are an integral part of these financial statements.
Statement of Operations
Year Ended August 31, 2023
| INVESTMENT INCOME: | | | |
| Dividend income | | $ | 908,945 | |
| Interest income | | | 52,953 | |
| Total investment income | | | 961,898 | |
| | | | | |
| EXPENSES: | | | | |
| Investment advisory fees (see Note 2) | | | 330,286 | |
| Transfer agent fees and expenses | | | 47,962 | |
| Administration fees | | | 46,390 | |
| Directors’ fees and expenses | | | 34,997 | |
| Federal and state registration fees | | | 28,589 | |
| Fund accounting fees | | | 28,026 | |
| Legal fees | | | 27,731 | |
| Insurance fees | | | 24,179 | |
| Audit fees | | | 19,003 | |
| Reports to shareholders | | | 10,040 | |
| Custody fees | | | 6,535 | |
| Other | | | 7,002 | |
| Total expenses | | | 610,740 | |
| Net investment income | | | 351,158 | |
| | | | | |
| REALIZED AND UNREALIZED GAIN (LOSS) ON INVESTMENTS: | | | | |
| Net realized gain on: | | | | |
| Investments | | | 9,585,953 | |
| Written options | | | 218,766 | |
| In-kind redemptions (see Note 1) | | | 2,796,952 | |
| Total net realized gain | | | 12,601,671 | |
| Net change in unrealized appreciation/depreciation on: | | | | |
| Investments | | | (8,331,531 | ) |
| Written options | | | (132,453 | ) |
| Total net change in unrealized appreciation/depreciation | | | (8,463,984 | ) |
| Net realized and unrealized gain on investments | | | 4,137,687 | |
| NET INCREASE IN NET ASSETS RESULTING FROM OPERATIONS | | $ | 4,488,845 | |
The accompanying notes are an integral part of these financial statements.
Statements of Changes in Net Assets
| | | Year Ended | | | Year Ended | |
| | | August 31, 2023 | | | August 31, 2022 | |
| OPERATIONS: | | | | | | |
| Net investment income | | $ | 351,158 | | | $ | 330,355 | |
| Net realized gain on: | | | | | | | | |
| Investments | | | 9,585,953 | | | | 9,432,692 | |
| Written options | | | 218,766 | | | | — | |
| In-kind redemptions (see Note 1) | | | 2,796,952 | | | | — | |
| Change in net unrealized appreciation/depreciation on: | | | | | | | | |
| Investments | | | (8,331,531 | ) | | | (9,586,765 | ) |
| Written options | | | (132,453 | ) | | | 366,727 | |
| Net increase/decrease in net assets resulting from operations | | | 4,488,845 | | | | 543,009 | |
| | | | | | | | | |
| DIVIDENDS AND DISTRIBUTIONS TO SHAREHOLDERS: | | | | | | | | |
| Net dividends and distributions | | | (5,630,063 | ) | | | (7,474,749 | ) |
| Net decrease in net assets resulting from distributions paid | | | (5,630,063 | ) | | | (7,474,749 | ) |
| | | | | | | | | |
| CAPITAL SHARE TRANSACTIONS: | | | | | | | | |
| Shares sold | | | 22,566 | | | | 19,556 | |
| Shares issued in reinvestment of dividends | | | 2,966,597 | | | | 4,394,312 | |
| Shares redeemed | | | | | | | | |
| Cash redemptions | | | (12,598,839 | ) | | | (3,122,070 | ) |
| In-kind redemptions (see Note 1) | | | (3,701,088 | ) | | | — | |
| Net increase (decrease) in net assets | | | | | | | | |
| from capital share transactions | | | (13,310,764 | ) | | | 1,291,798 | |
| TOTAL INCREASE (DECREASE) IN NET ASSETS | | | (14,451,982 | ) | | | (5,639,942 | ) |
| | | | | | | | | |
| NET ASSETS: | | | | | | | | |
| Beginning of year | | | 58,378,105 | | | | 64,018,047 | |
| End of year | | $ | 43,926,123 | | | $ | 58,378,105 | |
The accompanying notes are an integral part of these financial statements.
Financial Highlights
| | | Year Ended August 31, | |
| | | 2023 | | | 2022 | | | 2021 | | | 2020 | | | 2019 | |
| Per Share Data: | | | | | | | | | | | | | | | |
| Net asset value, beginning of year | | $ | 26.68 | | | $ | 29.92 | | | $ | 24.33 | | | $ | 25.77 | | | $ | 30.75 | |
| | | | | | | | | | | | | | | | | | | | | |
| Income (loss) from investment operations: | | | | | | | | | | | | | | | | | | | | |
| Net investment income | | | 0.19 | (1) | | | 0.15 | (1) | | | 0.21 | (1) | | | 0.29 | (1) | | | 0.29 | |
| Net realized and unrealized | | | | | | | | | | | | | | | | | | | | |
gain (loss) on investments(2) | | | 2.26 | | | | 0.18 | | | | 6.91 | | | | 0.85 | | | | (1.62 | ) |
| Total from investment operations | | | 2.45 | | | | 0.33 | | | | 7.12 | | | | 1.14 | | | | (1.33 | ) |
| | | | | | | | | | | | | | | | | | | | | |
| Less distributions: | | | | | | | | | | | | | | | | | | | | |
| Net investment income | | | (0.21 | ) | | | (0.20 | ) | | | (0.22 | ) | | | (0.33 | ) | | | (0.25 | ) |
| Net realized gain on investments | | | (2.94 | ) | | | (3.37 | ) | | | (1.31 | ) | | | (2.25 | ) | | | (3.40 | ) |
| Total distributions | | | (3.15 | ) | | | (3.57 | ) | | | (1.53 | ) | | | (2.58 | ) | | | (3.65 | ) |
| | | | | | | | | | | | | | | | | | | | | |
| Net asset value, end of year | | $ | 25.98 | | | $ | 26.68 | | | $ | 29.92 | | | $ | 24.33 | | | $ | 25.77 | |
| | | | | | | | | | | | | | | | | | | | | |
| Total return | | | 10.35 | % | | | 0.69 | % | | | 30.65 | % | | | 3.94 | % | | | (3.27 | )% |
| | | | | | | | | | | | | | | | | | | | | |
| Supplemental data and ratios: | | | | | | | | | | | | | | | | | | | | |
| Net assets, end of year (millions) | | $ | 44 | | | $ | 58 | | | $ | 64 | | | $ | 52 | | | $ | 58 | |
| Ratio of net expenses to average net assets | | | 1.29 | % | | | 1.18 | % | | | 1.18 | % | | | 1.25 | % | | | 1.23 | % |
| Ratio of net investment income | | | | | | | | | | | | | | | | | | | | |
| to average net assets | | | 0.74 | % | | | 0.53 | % | | | 0.75 | % | | | 1.08 | % | | | 1.09 | % |
| Portfolio turnover rate | | | 4 | % | | | 8 | % | | | 3 | % | | | 1 | % | | | 8 | % |
(1) | Net Investment income per share has been calculated based on average shares outstanding during the period. |
(2) | Realized and unrealized gains and losses per share in this caption are balancing amounts necessary to reconcile the change in net asset value per share for the period, and may not reconcile with the aggregate gains and losses in the Statement of Operations due to share transactions for the year. |
The accompanying notes are an integral part of these financial statements.
Notes to Financial Statements
| 1. | ORGANIZATION | | Barrett Opportunity Fund, Inc. (“the “Fund”), a Maryland corporation organized in 1978, is registered as a non-diversified, open-end management investment company under the Investment Company Act of 1940, as amended (the “1940 Act). The Fund is an investment company and accordingly follows the investment company accounting and reporting guidance of the Financial Accounting Standards Board (“FASB”) Accounting Codification Topic 946 “Financial Services – Investment Companies.” The Fund’s investment objective is to achieve above average long-term capital appreciation. Current income is a secondary objective.
The following are significant accounting policies consistently followed by the Fund and are in conformity with generally accepted accounting principles in the United States of America (“GAAP”). |
| | AND | |
| | SIGNIFICANT | |
| | ACCOUNTING | |
| | POLICIES | |
| | | |
| | | | |
| | | | (a) Investment Valuation |
| | | | |
| | | | Equity securities, including common stocks and REITs, for which market quotations are available are valued at the last reported sales price or official closing price on the primary market or exchange on which they trade. |
| | | | |
| | | | Redeemable securities issued by open-end, registered investment companies, including money market funds, are valued at the net asset value (“NAV”) of such companies for purchase and / or redemption orders placed on that day. |
| | | | |
| | | | Exchange traded options, including options written, are valued at the composite price, using the National Best Bid and Offer quotes (“NBBO”). NBBO consists of the highest bid price and lowest ask price across any of the exchanges on which an option is quoted, thus providing a view across the entire U.S. options marketplace. Specifically, composite pricing looks at the last trades on the exchanges where the options are traded. If there are no trades for the option on a given business day, composite option pricing calculates the mean of the highest bid price and lowest ask price across the exchanges where the option is traded. |
| | | | |
| | | | When prices are not readily available, or are determined not to reflect fair value, such as, when the value of a security has been significantly affected by events after the close of the exchange or market on which the security is principally traded, but before the Fund calculates its net asset value, the Fund values these securities at fair value as determined in accordance with procedures approved by the Fund’s Board of Directors. |
| | | | |
| | | | The Fund uses valuation techniques to measure fair value that are consistent with the market approach and/or income approach, depending on the type of the security and the particular circumstance. The market approach uses prices and other relevant information generated by market transactions involving identical or comparable securities. The income approach uses valuation techniques to discount estimated future cash flows to present value. |
| | | | FASB Accounting Standards Codification, “Fair Value Measurements and Disclosures” Topic 820 (“ASC Topic 820”), establishes a single definition of fair value, creates a three-tier hierarchy as a framework for measuring fair value based on inputs used to value the Fund’s investments, and requires additional disclosure about fair value. The hierarchy of inputs is summarized below: |
| | | | • Level 1 – | quoted prices in active markets for identical investments as of the measurement date |
| | | | | |
| | | | • Level 2 – | other significant observable inputs (including quoted prices for similar investments, interest rates, prepayment speeds, credit risk, etc.) |
| | | | | |
| | | | • Level 3 – | significant unobservable inputs (including the Fund’s own assumptions in determining the fair value of investments) |
| | | | Inputs refer broadly to the assumptions that market participants use to make valuation decisions, including assumptions about risk. Inputs may include price information, volatility statistics, specific and broad credit data, liquidity statistics, and other factors. A financial instrument’s level within the fair value hierarchy is based on the lowest level of input that is significant to the fair value measurement. However, the determination of what constitutes “observable” requires significant judgment by the Fund. The Fund considers observable data to be that market data which is readily available, regularly distributed or updated, reliable and verifiable, not proprietary, and provided by independent sources that are actively involved in the relevant market. The categorization of a financial instrument within the hierarchy is based upon the pricing transparency of the instrument and does not necessarily correspond to the Fund’s perceived risk of that instrument. |
| | | | |
| | | | Investments whose values are based on quoted market prices in active markets include listed equities, including common stocks and REITs, and certain money market securities, and are classified within Level 1. Instruments that trade in markets that are not considered to be active, but are valued based on quoted market prices, dealer quotations or alternative pricing sources supported by observable inputs, are classified within Level 2. Investments classified within Level 3 have significant unobservable inputs, as they trade infrequently or not at all. |
| | | | The following is a summary of the inputs used in valuing the Fund’s assets carried at fair value as of August 31, 2023. The inputs and methodologies used to value securities may not be an indication of the risk associated with investing in these securities. |
| | | | | | | Other | | | | | | | |
| | | | | | | Significant | | | Significant | | | | |
| | | | Quoted | | | Observable | | | Unobservable | | | | |
| | | | Prices | | | Inputs | | | Inputs | | | | |
| | Description | | (Level 1) | | | (Level 2) | | | (Level 3) | | | Total | |
| | Assets | | | | | | | | | | | | |
| | Common Stocks | | $ | 41,454,814 | | | $ | — | | | $ | — | | | $ | 41,454,814 | |
| | REITs | | | 1,083,397 | | | | — | | | | — | | | | 1,083,397 | |
| | Money Market Funds | | | 918,230 | | | | — | | | | — | | | | 918,230 | |
| | Total Investments | | | | | | | | | | | | | | | | |
| | in Securities | | $ | 43,456,441 | | | $ | — | | | $ | — | | | $ | 43,456,441 | |
| | | | There were no transfers of securities between levels during the reporting period. The Fund did not hold any Level 3 securities during the year. |
| | | | |
| | | | Derivative Instruments |
| | | | |
| | | | The Fund may invest in derivative instruments. The use of derivatives included written options. |
| | | | |
| | | | As of August 31, 2023, the Fund did not hold derivative instruments. |
| | | | |
| | | | The effect of derivative instruments on the Statement of Operations for the fiscal year ended August 31, 2023: |
| | | | Derivatives not | | Amount of Realized Gains | |
| | | | accounted for as | | on Derivatives Transactions | |
| | | | hedging instruments | | Written Options
| |
| | | | Equity Contracts | | $218,766 | |
| | | | Derivatives not | | Change in Net Unrealized Appreciation | |
| | | | accounted for as | | on Derivatives Recognized in Income | |
| | | | hedging instruments | | Written Options | |
| | | | Equity Contracts | | ($132,453) | |
| | | | The Fund is not subject to any Master Netting Agreements; therefore, the Fund was not required to offset any assets or liabilities. |
| | | | |
| | | | (b) Options |
| | | | |
| | | | GAAP requires enhanced disclosures about the Fund’s derivative activities, including how such activities are accounted for and their effect on the Fund’s financial position and results of operations. |
| | | | |
| | | | The Fund is subject to equity price risk in the normal course of pursuing its investment objective. The Fund enters into written call options to hedge against |
| | | | changes in the value of equities. The Fund’s option component of the overall investment strategy is often referred to as a “buy-write” strategy (also called a “covered call” strategy), in which the Adviser (as defined below) writes (sells) a call option contract while at the same time owning an equivalent number of shares of the underlying stock to generate moderate current income. The writing of call options is intended to reduce the volatility of the portfolio and to earn premium income. Written call options expose the Fund to minimal counterparty credit risk since they are exchange traded and the exchange’s clearing house guarantees the options against default. |
| | | | |
| | | | As the writer of a call option, the Fund has the obligation to sell the security at the exercise price during the exercise period in the event the option is exercised. |
| | | | |
| | | | When the Fund writes an option, an amount equal to the premium received by the Fund is recorded as a liability and is subsequently adjusted to the current fair value of the option written. Premiums received from writing options that expire unexercised are treated by the Fund on the expiration date as realized gains from options written. The difference between the premium and the amount paid on effecting a closing purchase transaction, including brokerage commissions, is also treated as a realized gain, or, if the premium is less than the amount paid for the closing purchase transaction, as a realized loss. If a call option is exercised, the premium is added to the proceeds from the sale of the underlying security or currency in determining whether the Fund has realized a gain or a loss. The Fund as writer of an option bears the market risk of an unfavorable change in the price of the security underlying the written option. The average notional amount for written options during the year ended August 31, 2023, was $1,547,015. |
| | | | |
| | | | (c) Security Transactions and Investment Income |
| | | | |
| | | | Security transactions are accounted for on a trade date basis. Interest income, adjusted for amortization of premium and accretion of discount, is recorded on the accrual basis. Dividend income is recorded on the ex-dividend date. Under applicable tax laws, a withholding tax may be imposed on interest, dividends, and capital gains at various rates and withholding taxes on foreign dividends have been provided for in accordance with the Fund’s understanding of the applicable country’s tax rules and rates. The cost of investments sold is determined by use of the specific identification method for computing the gain/loss on the transaction. It is the Fund’s policy to recognize a loss on a worthless security once it is determined beyond a reasonable doubt that there is no possibility of future worth. Proceeds from bankruptcy settlements will generally be recognized as a realized gain if the security is no longer held and as a return of capital if the security is still held. |
| | | | |
| | | | (d) Distributions to Shareholders |
| | | | |
| | | | The Fund will distribute any net investment income and any net realized long- or short-term capital gains at least annually. Distributions from net realized gains for book purposes may include short-term capital gains. All short-term |
| | | | capital gains are included in ordinary income for tax purposes. Distributions to shareholders are recorded on the ex-dividend date. The Fund may also pay a special distribution at the end of the calendar year to comply with federal tax requirements. |
| | | | |
| | | | (e) REIT Distributions |
| | | | |
| | | | The character of distributions received from REITs held by the Fund is generally comprised of net investment income, capital gains, and return of capital. It is the policy of the Fund to estimate the character of distributions received from underlying REITs based on historical data provided by the REITs. After each calendar year end, REITs report the actual tax character of these distributions. Differences between the estimated and actual amounts reported by the REITs are reflected in the Fund’s records in the year in which they are reported by the REITs by adjusting related investment cost basis, capital gains and income, as necessary. |
| | | | |
| | | | (f) Federal Income Taxes |
| | | | |
| | | | It is the Fund’s policy to comply with the federal income and excise tax requirements of subchapter M of the Internal Revenue Code of 1986, as amended (the “Code”), necessary to qualify as a regulated investment company. Accordingly, the Fund intends to distribute its taxable income and net realized gains, if any, to shareholders in accordance with timing requirements imposed by the Code. Therefore, no federal income tax provision is provided in the Fund’s financial statements. |
| | | | |
| | | | As of and during the year ended August 31, 2023, the Fund did not have a liability of any unrecognized tax benefits. The Fund recognizes interest and penalties, if any, related to uncertain tax benefits as income tax expense in the Statement of Operations. During the year, the Fund did not incur any interest or penalties. The Fund is not subject to examination by U.S. taxing authorities for tax periods prior to 2019. |
| | | | |
| | | | (g) Use of Estimates |
| | | | |
| | | | The preparation of financial statements in conformity with GAAP requires management to make estimates and assumptions that affect the reported amounts of assets and liabilities and disclosure of contingent assets and liabilities as the date of the financial statements and the reported amounts of revenues and expenses during the reporting period. Actual results could differ from those estimates. |
| | | | |
| | | | (h) Indemnification |
| | | | |
| | | | In the normal course of business the Fund enters into contracts that contain general indemnification clauses. The Fund’s maximum exposure under these agreements is unknown, as this would involve future claims against the Fund that have not yet occurred. Based on experience, the Fund expects the risk of loss to be remote. |
| | | | (i) In-Kind Redemptions |
| | | | |
| | | | Net capital gains or losses resulting from in-kind redemptions are excluded from the Fund’s taxable gains and are not distributed to shareholders. |
| | | | |
| | | | A redemption-in-kind is the process of making a distribution to shareholders through assets and cash rather than cash alone. During the year ended August 31, 2023, the Fund recorded redemptions for securities redeemed in-kind at a fair value of $3,701,088. The Fund recognized a realized gain in the amount of $2,796,952 on the is transaction, which is reflected in the Statement of Operations. |
| | | | |
| 2. | INVESTMENT | | The Fund has an Investment Advisory Agreement with Barrett Asset Management, LLC (“Barrett Asset Management” or the “Adviser”). Under the Investment Advisory Agreement, the Fund pays an advisory fee, calculated daily and paid monthly, in accordance with the following breakpoint schedule: |
| | ADVISER |
| | AGREEMENT |
| | AND OTHER |
| | TRANSACTIONS | | Average Daily Net Assets | Annual Rate | |
| | WITH AFFILIATES | | First $1 billion | 0.700% | |
| | | | Next $1 billion | 0.675% | |
| | | | Next $3 billion | 0.650% | |
| | | | Next $5 billion | 0.625% | |
| | | | Over $10 billion | 0.600% | |
| | | | For the year ended August 31, 2023, the advisory fee totaled $330,286. |
| | | | |
| | | | The officers of the Fund are also officers and employees of Barrett Asset Management and do not receive compensation from the Fund. |
| | | | |
| 3. | INVESTMENTS | | During the year ended August 31, 2023, the aggregate cost of purchases and proceeds from sales of investments (excluding short-term investments and excluding in-kind redemptions) were as follows: |
| | | | Purchases | Sales | |
| | | | $2,031,741 | $16,448,411 | |
| 4. | CAPITAL SHARES | | At August 31, 2023, the Fund had 15,000,000 shares of capital stock authorized with a par value of $0.01 per share. Transactions in shares of the Fund were as follows: |
| | | | Year Ended | | | Year Ended | |
| | | | August 31, 2023 | | | August 31, 2022 | |
| | Shares sold | | | 872 | | | | 684 | |
| | Shares issued on reinvestment | | | 125,597 | | | | 158,811 | |
| | Shares redeemed | | | (468,270 | ) | | | (110,989 | ) |
| | In-kind redemptions | | | (155,508 | ) | | | — | |
| | Net increase (decrease) | | | (497,309 | ) | | | 48,506 | |
| 5. | INCOME TAX | | The tax character of distributions paid during the fiscal year ended August 31 |
| | INFORMATION | | were as follows: |
| | AND | | | | 2023 | | | 2022 | |
| | DISTRIBUTIONS | | Distributions paid from: | | | | | | |
| | TO | | Ordinary Income | | $ | 374,744 | | | $ | 489,998 | |
| | SHAREHOLDERS | | Long Term Capital Gain | | | 5,255,319 | | | | 6,984,751 | |
| | | | Total Distributions Paid | | $ | 5,630,063 | | | $ | 7,474,749 | |
| | | | The Funds designated as long-term capital gain dividend, pursuant to Internal Revenue Code Section 852(b)(3), to reduce the earnings and profits of the Fund related to net capital gain to zero for the tax year ended August 31, 2023. |
| | | | |
| | | | As of August 31, 2023, the components of distributable earnings for income tax purposes were as follows: |
| | Tax cost of Investments | | $ | 9,170,707 | |
| | Unrealized Appreciation | | $ | 34,294,653 | |
| | Unrealized Depreciation | | | (8,919 | ) |
| | Net unrealized appreciation (depreciation) | | | 34,285,734 | |
| | Undistributed Ordinary Income | | | 209,271 | |
| | Undistributed Long-Term Capital Gains | | | 9,777,212 | |
| | Distributable earnings | | | 9,986,483 | |
| | Other accumulated gain/(loss) | | | (8,881 | ) |
| | Total accumulated gain/(loss) | | $ | 44,263,336 | |
| | | | Additionally, U.S. generally accepted accounting principles require that certain components of net assets relating to permanent differences be reclassified between financial and tax reporting. The permanent tax differences relate to redemption-in-kind transactions. Such reclassifications may result in negative paid in capital. These reclassifications have no effect on net assets or net asset value per share. For the year ended August 31, 2023, the following table shows the reclassifications made: |
| | | | Total Distributable | | Paid In | |
| | | | Gain (Loss) | | Capital | |
| | | Barrett Opportunity Fund | (2,800,450) | | 2,800,450 | |
| | | | As of August 31, 2023, the Fund did not have any tax basis capital losses to carry forward. |
| | | | |
| 6. | RECENT MARKET EVENTS | | U.S. and international markets have experienced significant periods of volatility in recent years due to a number of economic, political and global macro factors including the impact of the coronavirus as a global pandemic and related public health issues, growth concerns in the U.S. and overseas, uncertainties regarding interest rates, trade tensions and the threat of tariffs imposed by the U.S. and other countries. These developments as well as other events, could result in further market volatility and negatively affect financial asset prices, the liquidity of certain securities and the normal operations of securities exchanges and other |
| | |
| | |
| | | | markets. As a result, the risk environment remains elevated. The Fund’s investment adviser will monitor developments and seek to manage the Fund in a manner consistent with achieving the Fund’s investment objective, but there can be no assurance that it will be successful in doing so. |
| | | | |
| 7. | SUBSEQUENT EVENT DISCLOSURE | | Management has evaluated the impact of all subsequent events on the Fund through the date the financial statements were issued. On July 11, 2023, the Board voted to approve an Agreement and Plan of Reorganization (“Reorganization”) whereby the Fund would reorganize into a newly created corresponding series (the “New Fund”) of the same name of the Segall Bryant & Hamill Trust to be effective November 18, 2023. If the Reorganization is approved by shareholders, the New Fund would have the same name, investment objective and principal investment strategies as the Fund. However, the Reorganization would result in the New Fund having a new investment adviser, Segall Bryant & Hamill, LLC, with which the Fund’s current portfolio managers will be employed. The New Fund will retain the same portfolio managers as the Fund and the day-to-day management of the Fund is not expected to change as a result of the Reorganization. |
| | |
| | |
REPORT OF INDEPENDENT REGISTERED PUBLIC ACCOUNTING FIRM | | To the Shareholders and Board of Directors of Barrett Opportunity Fund, Inc.
Opinion on the Financial Statements
We have audited the accompanying statement of assets and liabilities, including the schedule of investments, of Barrett Opportunity Fund, Inc. (the “Fund”) as of August 31, 2023, the related statement of operations for the year then ended, the statements of changes in net assets for each of the two years in the period then ended, the related notes, and the financial highlights for each of the five years in the period then ended (collectively referred to as the “financial statements”). In our opinion, the financial statements present fairly, in all material respects, the financial position of the Fund as of August 31, 2023, the results of its operations for the year then ended, the changes in net assets for each of the two years in the period then ended, and the financial highlights for each of the five years in the period then ended, in conformity with accounting principles generally accepted in the United States of America. |
|
|
| |
| | | Basis for Opinion |
| | | |
| | | These financial statements are the responsibility of the Fund’s management. Our responsibility is to express an opinion on the Fund’s financial statements based on our audits. We are a public accounting firm registered with the Public Company Accounting Oversight Board (United States) (“PCAOB”) and are required to be independent with respect to the Fund in accordance with the U.S. federal securities laws and the applicable rules and regulations of the Securities and Exchange Commission and the PCAOB. |
| | | |
| | | We conducted our audits in accordance with the standards of the PCAOB. Those standards require that we plan and perform the audit to obtain reasonable assurance about whether the financial statements are free of material misstatement whether due to error or fraud. |
| | | |
| | | Our audits included performing procedures to assess the risks of material misstatement of the financial statements, whether due to error or fraud, and performing procedures that respond to those risks. Such procedures included examining, on a test basis, evidence regarding the amounts and disclosures in the financial statements. Our procedures included confirmation of securities owned as of August 31, 2023, by correspondence with the custodian and brokers. Our audits also included evaluating the accounting principles used and significant estimates made by management, as well as evaluating the overall presentation of the financial statements. We believe that our audits provide a reasonable basis for our opinion. |
| | | |
| | | We have served as the Fund’s auditor since 2011. We have served as the auditor of one or more investment companies advised by Barrett Asset Management, LLC since 2010. |
| | | |
| | |  |
| | | COHEN & COMPANY, LTD. |
| | | Milwaukee, Wisconsin |
| | | October 27, 2023 |
Additional Information (Unaudited)
1. INFORMATION ABOUT DIRECTORS AND OFFICERS
The business and affairs of the Fund are conducted by management under the supervision and subject to the direction of its Board of Directors. The business address of each Director is c/o Barrett Asset Management, LLC, the Fund’s investment manager (“Barrett Asset Management”), 90 Park Avenue, 34th Floor, New York, New York, 10016. Information pertaining to the Directors and officers of the Fund is set forth below.
The Statement of Additional Information includes additional information about the Directors and is available, without charge, upon request by calling the Fund at 1-877-363-6333.
| | | | | | | | Number of | | |
| | | | | | | | Portfolios | | |
| | | | | | | | in Fund | | Other Board |
| | Position(s) | | Term of Office* | | | | Complex | | Memberships |
| Name, Address | Held with | | and Length of | | Principal Occupation(s) | | Overseen | | Held by |
and Birth Year | Fund | | Time Served** | | During Past 5 Years | | by Director | | Director |
INDEPENDENT DIRECTORS+: | | | | | | | | | |
| | | | | | | | | | |
| Barry Handel, CPA | Director | | Since 2005 | | Partner, Shalik, Morris & | | 1 | | None |
| Birth Year: 1951 | | | | | Company, LLP | | | | |
| | | | | | (accounting firm) | | | | |
| | | | | | | | | | |
David H. Kochman(1) | Director | | Since 2011 | | Member, Harris Beach PLLC | | 1 | | None |
| Birth Year: 1959 | Chairperson | | Since 2017 | | (law firm) | | | | |
| | | | | | | | | | |
Rosalind A. Kochman(2) | Director | | Since 1990 | | Retired (since 2002); | | 1 | | None |
| Birth Year: 1937 | | | | | formerly, Chief Executive | | | | |
| | | | | | Officer, Brooklyn Eye | | | | |
| | | | | | Surgery Center, and | | | | |
| | | | | | Administrator, Kochman, | | | | |
| | | | | | Lebowitz & Mogil, MDs | | | | |
| | | | | | | | | | |
| William Morris, Jr., CPA | Director | | Since 2005 | | Of Counsel: Stemmy, Tidler, | | 1 | | None |
| Birth Year: 1948 | | | | | & Morris, P.A. (accounting | | | | |
| | | | | | firm); formerly, President, | | | | |
| | | | | | William Morris & Associates | | | | |
| | | | | | P.C. (accounting firm) | | | | |
| (1) | Mr. Kochman is Ms. Kochman’s son. |
| (2) | Ms. Kochman is Mr. Kochman’s mother. |
| + | Directors who are not “interested persons” of the Fund within the meaning of Section 2(a)(19) of the 1940 Act. |
| | | | | | | | Number of | | |
| | | | | | | | Portfolios | | |
| | | | | | | | in Fund | | Other Board |
| | Position(s) | | Term of Office* | | | | Complex | | Memberships |
| Name, Address | Held with | | and Length of | | Principal Occupation(s) | | Overseen | | Held by |
and Birth Year | Fund | | Time Served** | | During Past 5 Years | | by Director | | Director |
| OFFICERS: | | | | | | | | | |
| | | | | | | | | | |
| John G. Youngman | President | | Since 2021 | | Managing Director, | | N/A | | N/A |
| Barrett Asset Management | and Chief | | | | Barrett Asset Management | | | | |
| 90 Park Avenue | Executive | | | | (2011-Present); | | | | |
| New York, NY 10016 | Officer | | | | Chief Financial Officer and | | | | |
| Birth Year: 1968 | | | | | Treasurer (2011-2021) | | | | |
| | | | | | | | | | |
| E. Wells Beck, CFA | Vice | | Since 2010 | | Managing Director and | | N/A | | N/A |
| Barrett Asset Management | President | | | | Director of Research, | | | | |
| 90 Park Avenue | and | | | | Barrett Asset Management | | | | |
| New York, NY 10016 | Investment | | | | (since 2011) | | | | |
| Birth Year: 1968 | Officer | | | | | | | | |
| | | | | | | | | | |
| Amy Kong | Vice | | Since 2021 | | Chief Investment Officer & | | N/A | | N/A |
| Barrett Asset Management | President | | | | Managing Director, Barrett | | | | |
| 90 Park Avenue | and | | | | Asset Management (2020- | | | | |
| New York, NY 10016 | Investment | | | | Present); Managing Director, | | | | |
| Birth Year: 1981 | Officer | | | | Fiduciary Trust Company | | | | |
| | | | | | International (2013-2020) | | | | |
| | | | | | | | | | |
| Larry Nakamura | Chief | | Since 2022 | | Chief Compliance Officer, | | N/A | | N/A |
| CI Financial Corp. | Compliance | | | | Barrett Asset Management | | | | |
| 2 S Biscayne Blvd, | Officer | | | | (2022-Present) VP, Head of | | | | |
| Suite 1480 | | | | | US Compliance, CI Financial | | | | |
| Miami, FL 33131 | | | | | Corp., (2020-Present); Chief | | | | |
| Birth Year: 1972 | | | | | Compliance Officer, Dowling | | | | |
| | | | | | & Yahnke, LLC (2019-2020) | | | | |
| | | | | | Executive Regulatory | | | | |
| | | | | | Consultant, National | | | | |
| | | | | | Regulatory Services | | | | |
| | | | | | (2010-2019) | | | | |
| | | | | | | | | | |
| Christina Bater | Chief | | Since 2023 | | Partner, Wealth Advisor, | | N/A | | N/A |
| Barrett Asset Management | Financial | | | | Director of Financial | | | | |
| 90 Park Avenue | Officer | | | | Planning, CI Barrett Private | | | | |
| New York, NY 10016 | and | | | | Wealth (2023-Present) | | | | |
| Birth Year: 1986 | Treasurer | | | | Managing Director, Barrett | | | | |
| | | | | | Asset Management | | | | |
| | | | | | (2011-Present) | | | | |
| * | Each Director and officer serves until his respective successor has been duly elected and qualified or until his earlier death, resignation, retirement or removal. |
| ** | Indicates the earliest year in which the Director became a board member or the officer took such office. |
2. IMPORTANT TAX INFORMATION
QUALIFIED DIVIDEND INCOME/DIVIDENDS RECEIVED DEDUCTION
For the fiscal year ended August 31, 2023, certain dividends paid by the Funds may be subject to a maximum tax rate of 23.8%, as provided for by the Jobs and Growth Tax Relief Reconciliation Act of 2003.
The percentage of dividends declared from ordinary income designated as qualified dividend income was as follows:
| Barrett Opportunity Fund | 100.00% | |
For corporate shareholders, the percent of ordinary income distributions qualifying for the corporate dividends received deduction for the fiscal year ended August 31, 2023, was as follows:
| Barrett Opportunity Fund | 100.00% | |
The Percentage of taxable ordinary income distributions that are designated as short-term capital gain distributions under Internal Revenue Section 871(k)(2)(C) for each Fund were as follows (unaudited).
| Barrett Opportunity Fund | 0.00% | |
3. CONSIDERATION OF INVESTMENT ADVISORY AGREEMENT
At a meeting of the Board of Directors (the “Board”) of Barrett Opportunity Fund, Inc. (the “Fund”) held on July 11, 2023 (the “July Meeting”), the Directors, including a majority of the Directors who are not considered to be “interested persons” within the meaning of the Investment Company Act of 1940 (the “Independent Directors”), considered the renewal of the investment advisory agreement between the Fund and Barrett Asset Management, LLC (“Barrett AM”) dated July 15, 2021 (the “Agreement”).
The Independent Directors were assisted in their considerations by independent legal counsel, who provided the Board with a memorandum regarding the legal standard applicable to its review of the Agreement, including a detailed review of the various factors that the Board should consider, such as, among other things: (i) the nature, extent and quality of the services provided by Barrett AM, (ii) the investment performance of Barrett AM, (iii) the costs of the services to be provided and profits to be realized (including any fall-out benefits) by Barrett AM and its affiliates from its relationship with the Fund, (iv) the extent to which economies of scale would be realized as the Fund grows, and (v) whether fee levels reflect the economies of scale for the benefit of Fund’s investors. The Board met with independent legal counsel separately from representatives of Barrett AM in executive session prior to the July Meeting to further discuss the Agreement and certain other considerations relevant to the Board’s deliberations.
Before considering the Agreement, the Board requested, and Barrett AM provided, information for the Board’s consideration at the July Meeting, including information about a proposed reorganization of the Fund into a series of Segall Bryant & Hamill Trust. The Board also considered the materials provided to the Board by Barrett AM throughout the year relating to the services provided by Barrett AM to the Fund, the performance of the Fund, the fees and expenses of the Fund and other information relating to the Fund’s operations. The Directors asked questions of, and received answers from, representatives of Barrett AM relating to the renewal of the Agreement, which they answered.
The Board also considered whether (i) Barrett AM continued to have the capabilities, resources, and personnel necessary to provide satisfactory advisory services to the Fund, and (ii) the Fund’s advisory
fees were reasonable given the services Barrett AM provided, the costs to Barrett AM of providing those services, any economies of scale, and the fees and other expenses paid by similar funds and such other matters that the Board considered relevant in the exercise of their reasonable judgment. In making their decision to approve the Agreement, the Directors gave attention to all information furnished and did not give weights to any factors considered. The following discussion identifies the factors that the Directors collectively considered and the conclusions they reached.
Nature, Extent and Quality of Services. The Board considered the overall services that Barrett AM historically has provided to the Fund and its shareholders, including the Fund’s performance, Barrett AM’s compliance program, and the availability of Barrett AM’s personnel to provide information and other services. They considered the many reports furnished to them during the year at regular Board meetings covering matters such as Barrett AM’s compliance with the Fund’s investment objectives, policies, strategies and limitations, and its continued focus on the capital gains embedded in the Fund. The Board also considered Barrett AM’s personnel and the extent to which they possess the experience to provide competent investment management services to the Fund. The Board also considered the financial condition Barrett AM and its parent company.
Based on the information provided by Barrett AM, the Board concluded that the nature, extent and quality of the services provided by Barrett AM under the Agreement are appropriate.
Investment Performance. The Board considered the short-term and long-term relative performance of the Fund compared against applicable industry benchmarks, as well as appropriate peer funds with similar investment objectives, strategies and policies. After that discussion, the Board concluded that the performance of the Fund was in line with its benchmark indices and its peers.
Comparative Fees. The Directors then considered the fees to be paid by the Fund and the total expense ratio of the Fund as compared to its peers. After considering all of the information regarding the Fund’s fees provided at the July Meeting, the Board concluded that the advisory fees and total expense ratios for the Fund under the Agreement are reasonable in relation to the quality of services Barrett AM has provided and will continue to provide.
Management Profitability. The Board considered that Barrett AM’s profitability was reasonable.
Economies of Scale. The Board noted that it had considered the structure of the fee and concluded that the Fund would experience economies of scale if the Fund grew in assets.
Fall-Out Benefits. The Board noted that it had considered any fall-out benefits that Barrett AM receives for managing the Fund.
Conclusion. After evaluating in detail each factor, taking into consideration the information presented at the July Meeting and deliberating in executive session with independent legal counsel, the Board unanimously approved the Agreement. In arriving at its decision, the Board did not identify any single factor that alone was responsible for their decision, but instead made its determination in light of all the circumstances. Each Director may have placed differing weight on each of the factors discussed above.
4. LIQUIDITY RISK MANAGEMENT PROGRAM
The Fund has adopted a liquidity risk management program (the “Program”) pursuant to Rule 22e-4 under the 1940 Act for the purpose of assessing and managing the Fund’s liquidity risk, which is the risk that a Fund could not meet requests to redeem shares issued by the Fund without significant dilution of
remaining investors’ interests in the Fund. The Board has designated the Adviser to administer the Program, and the Adviser has established a Liquidity Risk Management Committee to be responsible for the Program’s operation. Under the Program, the Liquidity Risk Management Committee manages the Fund’s liquidity risk by monitoring the liquidity of the Fund’s investments, limiting the amount of the Fund’s illiquid investments, and utilizing various risk management tools available to the Fund for meeting shareholder redemptions, among other means. From September 1, 2022 through August 31, 2023, the Program supported the Fund’s ability to honor redemption requests timely and the Adviser’s management of the Fund’s liquidity risk. There can be no assurance that the Program will achieve its objectives under all circumstances in the future. Please refer to the Fund’s prospectus for more information regarding the Fund’s exposure to liquidity risk and other risks to which it may be subject.
The Fund files its complete schedule of portfolio holdings with the Securities and Exchange Commission (“SEC”) for the first and third quarters of each fiscal year on Form N-PORT Part F. The Fund’s Forms N-PORT Part F are available on the SEC’s website at www.sec.gov. The Fund’s Forms N-PORT Part F may be reviewed and copied at the SEC’s Public Reference Room in Washington, D.C., and information on the operation of the Public Reference Room may be obtained by calling 1-800-SEC-0330. To obtain information on Form N-PORT Part F from the Fund, shareholders can call the Fund at 1-877-363-6333.
Information on how the Fund voted proxies relating to portfolio securities during the prior 12-month period ended June 30th of each year and a description of the policies and procedures that the Fund uses to determine how to vote proxies related to portfolio transactions are available (1) without charge, upon request, by calling the Fund at 1-877-363-6333 and (2) on the SEC’s website at www.sec.gov.
(This Page Intentionally Left Blank.)
BARRETT OPPORTUNITY FUND, INC.
c/o U.S. Bank Global Fund Services
615 East Michigan Street
Milwaukee, WI 53202
DIRECTORS
Barry Handel, CPA
David H. Kochman, Chairperson
Rosalind A. Kochman
William Morris, Jr., CPA
INVESTMENT MANAGER
Barrett Asset Management, LLC
90 Park Avenue
New York, NY 10016
ADMINISTRATOR, FUND ACCOUNTANT & TRANSFER AGENT
U.S. Bank Global Fund Services
615 East Michigan Street
Milwaukee, WI 53202
DISTRIBUTOR
Quasar Distributors, LLC
111 East Kilbourn Avenue, Suite 2200
Milwaukee, WI 53202
CUSTODIAN
U.S. Bank, N.A.
Custody Operations
1555 River Center Drive, Suite 302
Milwaukee, WI 53212
LEGAL COUNSEL
Stradley Ronon Stevens & Young, LLP
2005 Market Street, Suite 2600
Philadelphia, PA 19103
INDEPENDENT REGISTERED PUBLIC ACCOUNTING FIRM
Cohen & Company, Ltd.
342 North Water Street, Suite 830
Milwaukee, WI 53202
This report is transmitted to the shareholders of Barrett Opportunity Fund, Inc. for their information. This is not a prospectus, circular or representation intended for use in the purchase of shares of the Fund or any securities mentioned in this report.
This report must be preceded or accompanied by a free prospectus. Investors should consider the Fund’s investment objective, risks, charges and expenses carefully before investing. The prospectus contains this and other important information about the Fund. Please read the prospectus carefully before investing.
Item 2. Code of Ethics.
The registrant has adopted a code of ethics that applies to the registrant’s principal executive officer and principal financial officer. The registrant has not made any substantive amendments to its code of ethics during the period covered by this report. The registrant has not granted any waivers from any provisions of the code of ethics during the period covered by this report.
Item 3. Audit Committee Financial Expert.
The registrant’s board of directors has determined that there is at least one audit committee financial expert serving on its audit committee. Mr. William Morris is the “audit committee financial expert” and is considered to be “independent” as each term is defined in Item 3 of Form N‑CSR.
Item 4. Principal Accountant Fees and Services.
The registrant has engaged its principal accountant to perform audit services, audit-related services, tax services and other services during the past two fiscal years. “Audit services” refer to performing an audit of the registrant's annual financial statements or services that are normally provided by the accountant in connection with statutory and regulatory filings or engagements for those fiscal years. “Audit-related services” refer to the assurance and related services by the principal accountant that are reasonably related to the performance of the audit. “Tax services” refer to professional services rendered by the principal accountant for tax compliance, tax advice, and tax planning. There were no “Other services” provided by the principal accountant. The following table details the aggregate fees billed or expected to be billed for each of the last two fiscal years for audit fees, audit-related fees, tax fees and other fees by the principal accountant.
| | FYE 08/31/2023 | FYE 08/31/2022 |
Audit Fees | 17,000 | 15,500 |
Audit-Related Fees | 0 | 0 |
Tax Fees | 3,000 | 3,000 |
All Other Fees | 0 | 0 |
The audit committee has adopted pre-approval policies and procedures that require the audit committee to pre‑approve all audit and non‑audit services of the registrant, including services provided to any entity affiliated with the registrant.
The percentage of fees billed by Cohen & Company, Ltd. applicable to non-audit services pursuant to waiver of pre-approval requirement were as follows:
| | FYE 08/31/2023
| FYE 08/31/2022 |
Audit-Related Fees | 0% | 0% |
Tax Fees | 0% | 0% |
All Other Fees | 0% | 0% |
All of the principal accountant’s hours spent on auditing the registrant’s financial statements were attributed to work performed by full‑time permanent employees of the principal accountant.
The following table indicates the non-audit fees billed or expected to be billed by the registrant’s accountant for services to the registrant and to the registrant’s investment adviser (and any other controlling entity, etc.—not sub-adviser) for the last two years.
Non-Audit Related Fees | FYE 08/31/2023 | FYE 08/31/2022 |
Registrant | 3,000 | 3,000 |
Registrant’s Investment Adviser | 0 | 0 |
The audit committee of the board of trustees/directors has considered whether the provision of non-audit services that were rendered to the registrant's investment adviser is compatible with maintaining the principal accountant's independence and has concluded that the provision of such non-audit services by the accountant has not compromised the accountant’s independence.
Item 5. Audit Committee of Listed Registrants.
Not applicable to registrants who are not listed issuers (as defined in Rule 10A-3 under the Securities Exchange Act of 1934).
Item 6. Investments.
| (a) | Schedule of Investments is included as part of the report to shareholders filed under Item 1 of this Form. |
Item 7. Disclosure of Proxy Voting Policies and Procedures for Closed-End Management Investment Companies.
Not applicable to open-end investment companies.
Item 8. Portfolio Managers of Closed-End Management Investment Companies.
Not applicable to open-end investment companies.
Item 9. Purchases of Equity Securities by Closed‑End Management Investment Company and Affiliated Purchasers.
Not applicable to open-end investment companies.
Item 10. Submission of Matters to a Vote of Security Holders.
Not Applicable.
Item 11. Controls and Procedures.
| (a) | The Registrant’s President and Treasurer have reviewed the Registrant's disclosure controls and procedures (as defined in Rule 30a-3(c) under the Investment Company Act of 1940 (the “Act”)) as of a date within 90 days of the filing of this report, as required by Rule 30a-3(b) under the Act and Rules 13a-15(b) or 15d‑15(b) under the Securities Exchange Act of 1934. Based on their review, such officers have concluded that the disclosure controls and procedures are effective in ensuring that information required to be disclosed in this report is appropriately recorded, processed, summarized and reported and made known to them by others within the Registrant and by the Registrant’s service provider. |
| (b) | There were no changes in the Registrant's internal control over financial reporting (as defined in Rule 30a-3(d) under the Act) that occurred during the period covered by this report that have materially affected, or are reasonably likely to materially affect, the Registrant's internal control over financial reporting. |
Item 12. Disclosure of Securities Lending Activities for Closed-End Management Investment Companies
Not applicable to open-end investment companies.
Item 13. Exhibits.
(3) Any written solicitation to purchase securities under Rule 23c‑1 under the Act sent or given during the period covered by the report by or on behalf of the registrant to 10 or more persons. Not applicable to open-end investment companies.
(4) Change in the registrant’s independent public accountant. There was no change in the registrant’s independent public accountant for the period covered by this report.
Pursuant to the requirements of the Securities Exchange Act of 1934 and the Investment Company Act of 1940, the registrant has duly caused this report to be signed on its behalf by the undersigned, thereunto duly authorized.
(Registrant) Barrett Opportunity Fund, Inc.
By (Signature and Title)* /s/ John G. Youngman
John G. Youngman, President
Date: 11/2/23
Pursuant to the requirements of the Securities Exchange Act of 1934 and the Investment Company Act of 1940, this report has been signed below by the following persons on behalf of the registrant and in the capacities and on the dates indicated.
By (Signature and Title)* /s/ John G. Youngman
John G. Youngman, President
Date: 11/2/23
By (Signature and Title)* /s/ Christina Bater
Christina Bater, Treasurer
Date: 11/2/23