UNITED STATES
SECURITIES AND EXCHANGE COMMISSION
Washington, D.C. 20549
FORM 10-K
S ANNUAL REPORT PURSUANT TO SECTION 13 OR 15(d) OF THE SECURITIES EXCHANGE ACT OF 1934 |
For the fiscal year ended December 31, 2008
OR
£ TRANSITION REPORT PURSUANT TO SECTION 13 OR 15(d) OF THE SECURITIES EXCHANGE ACT OF 1934 |
For the transition period from ______________ to ______________
Commission file number 000-11917
THE DAVEY TREE EXPERT COMPANY
(Exact name of registrant as specified in its charter)
| Ohio | 34-0176110 |
| (State or other jurisdiction of incorporation or organization) | (I.R.S. Employer Identification Number) |
1500 North Mantua Street
P.O. Box 5193
Kent, Ohio 44240
(Address of principal executive offices) (Zip code)
(330) 673-9511
(Registrant's telephone number, including area code)
Securities registered pursuant to Section 12(b) of the Act:
None
Securities registered pursuant to Section 12(g) of the Act:
Common Shares, $1.00 par value
Indicate by check mark if the registrant is a well-known seasoned issuer (as defined in Rule 405 of the Securities Act). Yes £ No S
Indicate by check mark if the registrant is not required to file reports pursuant to Section 13 or 15(d) of the Act. Yes £ No S
Indicate by check mark whether the registrant (1) has filed all reports required to be filed by Section 13 or 15(d) of the Securities Exchange Act of 1934 during the preceding 12 months (or for such shorter period that the registrant was required to file such reports), and (2) has been subject to such filing requirements for the past 90 days. Yes S No £
Indicate by check mark if disclosure of delinquent filers pursuant to Item 405 of Regulation S-K is not contained herein, and will not be contained, to the best of registrant's knowledge, in definitive proxy or information statements incorporated by reference in Part III of this Form 10-K or any amendment to this Form 10-K. S
Indicate by check mark whether the registrant is a large accelerated filer, an accelerated filer, a non-accelerated filer, or a smaller reporting company. See the definitions of “large accelerated filer,” ��accelerated filer” and “smaller reporting company” in Rule 12b-2 of the Exchange Act.
(Check one): Large Accelerated Filer £ Accelerated Filer S Non-Accelerated Filer £ Smaller Reporting Company £
Indicate by check mark whether the registrant is a shell company (as defined in Rule 12b-2 of the Act). Yes £ No S
There were 14,533,174 Common Shares outstanding as of March 3, 2009. The aggregate market value of the Common Shares held by nonaffiliates of the registrant as of June 28, 2008 was $190,927,685. For purposes of this calculation, it is assumed that the registrant's affiliates include the registrant's Board of Directors and its executive officers.
DOCUMENTS INCORPORATED BY REFERENCE
Portions of the registrant's definitive Proxy Statement for the 2009 Annual Meeting of Shareholders, to be held on May 19, 2009 are incorporated by reference into Part III (to be filed).
This annual report on Form 10-K contains forward-looking statements (within the meaning of the Private Securities Litigation Reform Act of 1995) in "Item 7 - Management's Discussion and Analysis of Financial Condition and Results of Operations," "Item 7A - Quantitative and Qualitative Disclosures About Market Risk," and elsewhere. These statements relate to future events or our future financial performance. In some cases, forward-looking statements may be identified by terminology such as "may," "will," "should," "expects," "plans," "anticipates," "believes," "estimates," "predicts," "potential," "continue" or the negative of these terms or other comparable terminology. These statements are only predictions and involve known and unknown risks, uncertainties and other factors that may cause our or our industry's actual results, levels of activity, performance or achievements to differ materially from what is expressed or implied in these forward-looking statements. Some important factors that could cause actual results to differ materially from those in the forward-looking statements include:
| § | Our business, other than tree services to utility customers, is highly seasonal and weather dependent. |
| § | The current economic downturn and the financial and credit crisis may reduce our customers’ spending, adversely impact pricing for our services, and impede our collection of accounts receivable. |
| § | Significant customers, particularly utilities, may experience financial difficulties, resulting in payment delays or delinquencies. |
| § | The seasonal nature of our business and changes in general and local economic conditions, among other factors, may cause our quarterly results to fluctuate, and our prior performance is not necessarily indicative of future results. |
| § | The current economic downturn may limit our access to capital, including access to funds under our revolving credit facility. |
| § | Significant increases in fuel prices for extended periods of time will increase our operating expenses. |
| § | We have significant contracts with our utility, commercial and government customers that include liability risk exposure as part of those contracts. Consequently, we have substantial insurance, and increases in the cost of obtaining adequate insurance, or the inadequacy of our self-insurance accruals or insurance coverages, could negatively impact our liquidity. |
| § | Because no public market exists for our common shares, the ability of shareholders to sell their common shares is limited. |
| § | We are subject to intense competition. |
| § | Our failure to comply with environmental laws could result in significant liabilities, fines and/or penalties. |
| § | We may encounter difficulties obtaining surety bonds or letters of credit necessary to support our operations. |
| § | We are dependent, in part, on our reputation of quality, integrity and performance. If our reputation is damaged, we may be adversely affected. |
| § | We may be unable to attract and retain a sufficient number of qualified employees for our field operations, and we may be unable to attract and retain qualified management personnel. |
| § | Our facilities could be damaged or our operations could be disrupted, or our customers or vendors may be adversely affected, by events such as natural disasters, pandemics, terrorist attacks or other external events. |
| § | We may become subject to claims and litigation that may have an adverse effect on us. |
| § | We may misjudge a competitive bid and be contractually bound to an unprofitable contract. |
Although we believe that the expectations reflected in the forward-looking statements are reasonable, we cannot guarantee future results, levels of activity, performance or achievements. We are under no duty to update any of the forward-looking statements after the date of this annual report on Form 10-K to conform these statements to actual future results.
THE DAVEY TREE EXPERT COMPANY FORM 10-K For the Year Ended December 31, 2008 |
| | |
| | Page |
| 2 |
| | |
| PART I | |
| 4 |
| 6 |
| 9 |
| 9 |
| 10 |
| 10 |
| 10 |
| | |
| PART II | |
| 12 |
| 15 |
| 16 |
| 27 |
| 27 |
| 27 |
| 27 |
| 29 |
| | |
| PART III | |
| 30 |
| 30 |
| 30 |
| 30 |
| 30 |
| | |
| PART IV | |
| 30 |
| | |
| 31 |
| | |
| 32 |
“We,” “Us,” “Our,” “Davey” and “Davey Tree,” unless the context otherwise requires, means The Davey Tree Expert Company and its subsidiaries.
PART I
General
The Davey Tree Expert Company, which was founded in 1880 and incorporated in 1909, and its subsidiaries ("we" or "us") have two primary operating segments which provide a variety of horticultural services to our customers throughout the United States and Canada.
Our Residential and Commercial Services segment provides for the treatment, preservation, maintenance, cultivation, planting and removal of trees, shrubs and other plant life; its services also include the practices of landscaping, tree surgery, tree feeding, and tree spraying, as well as the application of fertilizers, herbicides and insecticides.
Our Utility Services segment is principally engaged in the practice of line clearing for public utilities, including the clearing of tree growth from power lines, clearance of rights-of-way and chemical brush control.
We also provide other services related to natural resource management and consulting, urban and utility forestry research and development and environmental planning. We also maintain research, technical support and laboratory diagnostic facilities.
Competition and Customers
Our Residential and Commercial Services group is one of the largest national tree care organizations, and competes with other national and local firms with respect to its services. On a national level, our competition is primarily landscape construction and maintenance companies as well as residential and commercial lawn care companies. At a local and regional level, our competition comes mainly from small, local companies which are engaged primarily in tree care and lawn services. Our Utility Services group is the second largest organization in the industry, and competes principally with one major national competitor, as well as several smaller regional firms.
Principal methods of competition in both operating segments are customer service, marketing, image, performance and reputation. Our program to meet our competition stresses the necessity for our employees to have and project to customers a thorough knowledge of all horticultural services provided, and utilization of modern, well-maintained equipment. Pricing is not always a critical factor in a customer's decision with respect to Residential and Commercial Services; however, pricing is generally the principal method of competition for our Utility Services, although in most instances consideration is given to reputation and past production performance.
We provide a wide range of horticultural services to private companies, public utilities, local, state and federal agencies, and a variety of industrial, commercial and residential customers. During 2008, we had sales of approximately $66.6 million, or approximately 11% of revenues, to Pacific Gas & Electric Company (“PG&E”), one of our largest customers.
Regulation and Environment
Our facilities and operations, in common with those of the industry generally, are subject to governmental regulations designed to protect the environment. This is particularly important with respect to our services regarding insect and disease control, because these services involve to a considerable degree the blending and application of spray materials, which require formal licensing in most areas. Constant changes in environmental conditions, environmental awareness, technology and social attitudes make it necessary for us to maintain a high degree of awareness of the impact such changes have on the market for our services. We believe that we comply in all material respects with existing federal, state and local laws regulating the use of materials in our spraying operations as well as the other aspects of our business that are subject to any such regulation.
Marketing
We solicit business from residential customers principally through referrals, direct mail programs and to a lesser extent through the placement of advertisements in national magazines and trade journals, local newspapers and "yellow pages" telephone directories. Business from utility and commercial customers is obtained principally through negotiated contracts and competitive bidding. We carry out all of our sales and services through our employees. We generally do not use agents, and do not franchise our name or business.
Seasonality
Our business is seasonal, primarily due to fluctuations in horticultural services provided to Residential and Commercial customers and to a lesser extent by budget constraints imposed on our Utility customers. Because of this seasonality, we have historically incurred losses in the first quarter, while sales and earnings are generally highest in the second and third quarters of the calendar year. Consequently, this has created heavy demands for additional working capital at various times throughout the year. We borrow primarily against bank commitments in the form of a revolving credit facility to provide the necessary funds for our operations. You can find more information about our bank commitments in “Liquidity and Capital Resources” under “Management’s Discussion and Analysis of Financial Condition and Results of Operations” on pages 16-27 of this report.
Other Factors
Due to rapid changes in equipment technology and intensity of use, we must constantly update our equipment and processes to ensure that we provide competitive services to our customers. Also, we must continue to assure our compliance with the Occupational Safety and Health Act.
We own several trademarks including "Davey," "Davey and design," "Arbor Green Pro," "Arbor Green," "Davey Tree and design," "Davey Expert Co. and design" and "Davey and design (Canada)." Through substantial advertising and use, we believe that these trademarks have become of value in the identification and acceptance of our products and services.
Employees
We employed approximately 6,500 employees at December 31, 2008. However, employment levels fluctuate due to seasonal factors affecting our business. We consider our employee relations to be good.
Domestic and Foreign Operations
We sell our services to customers in the United States and Canada.
We do not consider the risks attendant to our business with foreign customers, other than currency exchange risks, to be materially different from those attendant to our business with domestic customers.
Financial Information About Segments and Geographic Areas
Certain financial information regarding our operations by segment and geographic area is contained in Note P to our consolidated financial statements, which are included in Part II, Item 8 of this report.
Access to Company Information
Davey Tree’s internet address is http://www.davey.com. Through our internet website, by hyperlink to the SEC’s website (http://www.sec.gov), we make available, free of charge, our Annual Report on Form 10-K, quarterly reports on Form 10-Q, current reports on Form 8-K, and all amendments to those reports. Availability of the reports occurs contemporaneously with the electronic posting to the SEC’s website as the reports are electronically filed with or furnished to the Securities and Exchange Commission.
The following documents are also made available on our website and a copy will be mailed, without charge, upon request to our Corporate Secretary:
| § | Code of Ethics for Financial Matters |
The factors described below represent the principal risks we face. Except as otherwise indicated, these factors may or may not occur and we are not in a position to express a view on the likelihood of any such factor occurring. Other factors may exist that we do not consider to be significant based on information that is currently available or that we are not currently able to anticipate.
Our business is highly seasonal and weather dependent.
Our business, other than tree services to utility customers, is highly seasonal and weather dependent, primarily due to fluctuations in horticultural services provided to Residential and Commercial customers. We have historically incurred losses in the first quarter, while revenue and operating income are generally highest in the second and third quarters of the calendar year. Inclement weather, such as uncharacteristically low or high (drought) temperatures, in the second and third quarters could dampen the demand for our horticultural services, resulting in reduced revenues that would have an adverse effect on our results of operations.
The current economic downturn and the financial and credit crisis may adversely impact our customers’ future spending as well as pricing and payment for our services, thus negatively impacting our operations and growth.
Based on a number of economic indicators, the economic activity has slowed substantially. At the present time, the rate at which the economy will recover or deteriorate and the length of time that the economy will remain slow have become increasingly uncertain. Slowing economic activity may adversely impact the demand for our services and potentially result in depressed prices for our services and the delay or cancellation of projects. This makes it difficult to estimate our customers’ requirements for our services and, therefore, adds uncertainty to the determination of our backlog. A reduction in cash flow and the lack of availability of debt or equity financing may result in a reduction in our customers’ spending for our services and may also impact the ability of our customers to pay amounts owed to us, which could have a material adverse effect on our operations and our ability to grow at historical levels.
Financial difficulties or the bankruptcy of one or more of our major customers could adversely affect our results.
Our ability to collect our accounts receivable and future sales depends, in part, on the financial strength of our customers. We grant credit, generally without collateral, to our customers. Consequently, we are subject to credit risk related to changes in business and economic factors throughout the United States and Canada. In the event customers experience financial difficulty, and particularly if bankruptcy results, our profitability may be adversely impacted by our failure to collect our accounts receivable in excess of our estimated allowance for uncollectible accounts. Additionally, our future revenues could be reduced by the loss of a customer due to bankruptcy. Our failure to collect accounts receivable and/or the loss of one or more major customers could have an adverse effect on our net income and financial condition.
Our business is dependent upon service to our utility customers and we may be affected by developments in the utility industry.
We derive approximately 52% of our total revenues from our Utility Services segment, including approximately 11% of our total revenues from PG&E. Significant adverse developments in the utility industry generally, or specifically for our major utility customers, could result in pressure to reduce costs by utility industry service providers (such as us), delays in payments of our accounts receivable, or increases in uncollectible accounts receivable, among other things. As a result, such developments could have an adverse effect on our results of operations.
Our quarterly results may fluctuate.
We have experienced and expect to continue to experience quarterly variations in revenues and operating income as a result of many factors, including:
| § | the seasonality of our business; |
| § | the timing and volume of customers' projects; |
| § | budgetary spending patterns of customers; |
| § | the commencement or termination of service agreements; |
| § | costs incurred to support growth internally or through acquisitions; |
| § | changes in our mix of customers, contracts and business activities; |
| § | fluctuations in insurance expense due to changes in claims experience and actuarial assumptions; and |
| § | general and local economic conditions. |
Accordingly, our operating results in any particular quarter may not be indicative of the results that you can expect for any other quarter or for the entire year.
We may not have access to capital in the future due to the current economic downturn.
We may need new or additional financing in the future to conduct our operations, expand our business or refinance existing indebtedness. Any sustained weakness in the general economic conditions and/or financial markets in the United States or globally could affect adversely our ability to raise capital on favorable terms or at all. From time-to-time we have relied, and may also rely in the future, on access to financial markets as a source of liquidity for working capital requirements, acquisitions and general corporate purposes. Our access to funds under our revolving credit facility is dependent on the ability of the financial institutions that are parties to the facility to meet their funding commitments. Those financial institutions may not be able to meet their funding commitments if they experience shortages of capital and liquidity or if they experience excessive volumes of borrowing requests within a short-period of time. The continuation of these economic disruptions and any resulting limitations on future funding, including any restrictions on access to funds under our revolving credit facility, could have a material adverse effect on us.
We are subject to the risk of increased fuel costs.
The cost of fuel is a major operating expense of our business. Significant increases in fuel prices for extended periods of time will increase our operating expenses. An increase in cost with partial or no corresponding compensation from customers leads to lower margins that would have an adverse effect on our results of operations.
We could be negatively impacted if our self-insurance accruals or our insurance coverages prove to be inadequate.
We are generally self-insured for losses and liabilities related to workers' compensation, vehicle liability and general liability claims (including California fire-suppression claims). A liability for unpaid claims and associated expenses, including incurred but not reported losses, is actuarially determined and reflected in our consolidated balance sheet as an accrued liability. The determination of such claims and expenses, and the extent of the need for accrued liability, are continually reviewed and updated. If we were to experience insurance claims or costs above our estimates and were unable to offset such increases with earnings, our business could be adversely affected. Also, where we self-insure, a deterioration in claims management, whether by our management or by a third-party claims administrator, could lead to delays in settling claims, thereby increasing claim costs, particularly as it relates to workers’ compensation. In addition, catastrophic uninsured claims filed against us or the inability of our insurance carriers to pay otherwise-insured claims would have an adverse effect on our financial condition.
Furthermore, many customers, particularly utilities, prefer to do business with contractors with significant financial resources, who can provide substantial insurance coverage. Should we be unable to renew our umbrella and other commercial insurance policies at competitive rates, this loss would have an adverse effect on our financial condition and results of operations.
Because no public market exists for our common shares, your ability to sell your common shares may be limited.
Our common shares are not traded on any national exchange, market system or over-the-counter bulletin board. Because no public market exists for our common shares, your ability to sell these shares is limited.
We are subject to intense competition.
We believe that each aspect of our business is highly competitive. Principal methods of competition in both operating segments are customer service, marketing, image, performance and reputation. Pricing is not always a critical factor in a customer’s decision with respect to Residential and Commercial Services; however, pricing is generally the principal method of competition for our Utility Services, although in most instances consideration is given to reputation and past production performance. On a national level, our competition is primarily landscape construction and maintenance companies as well as residential and commercial lawn care companies. At a local and regional level, our competition comes mainly from small, local companies which are engaged primarily in tree care and lawn services. Our Utility Services group competes principally with one major national competitor, as well as several smaller regional firms. Furthermore, competitors may have lower costs because privately-owned companies operating in a limited geographic area may have significantly lower labor and overhead costs. We cannot be certain that our competitors will not develop the expertise, experience and resources to provide services that are superior in both price and quality to our services. These strong competitive pressures could inhibit our success in bidding for profitable business.
Our failure to comply with environmental laws could result in significant liabilities.
Our facilities and operations are subject to governmental regulations designed to protect the environment, particularly with respect to our services regarding insect and disease control, because these services involve to a considerable degree the blending and application of spray materials, which require formal licensing in most areas. Continual changes in environmental laws, regulations and licensing requirements, environmental conditions, environmental awareness, technology and social attitudes make it necessary for us to maintain a high degree of awareness of the impact such changes have on our compliance programs and the market for our services. We believe that we comply in all material respects with existing federal, state and local laws, regulations and licensing requirements regulating the use of materials in our spraying operations as well as the other aspects of our business that are subject to any such regulation. However, if we fail to comply with such laws, regulations or licensing requirements, we may become subject to significant liabilities, fines and/or penalties, which could adversely affect our financial condition and results of operations.
We may be adversely affected if we are unable to obtain necessary surety bonds or letters of credit.
Surety market conditions are currently difficult as a result of significant losses incurred by many sureties in recent periods, both in the construction industry as well as in certain larger corporate bankruptcies. As a result, less bonding capacity is available in the market and terms have become more expensive and restrictive. Further, under standard terms in the surety market, sureties issue or continue bonds on a project-by-project basis and can decline to issue bonds at any time or require the posting of collateral as a condition to issuing or renewing any bonds. If surety providers were to limit or eliminate our access to bonding, we would need to post other forms of collateral for project performance, such as letters of credit or cash. We may be unable to secure sufficient letters of credit on acceptable terms, or at all. Accordingly, if we were to experience an interruption or reduction in the availability of bonding capacity, our liquidity may be adversely affected.
We may be adversely affected if our reputation is damaged.
We are dependent upon our reputation of quality, integrity and performance. If our reputation were damaged in some way, it may impact our ability to grow or maintain our business.
We may be unable to employ a sufficient workforce for our field operations.
Our industry operates in an environment that requires heavy manual labor. We may experience slower growth in the labor force for this type of work than in the past. As a result, we may experience labor shortages or the need to pay more to attract and retain qualified employees.
We may be unable to attract and retain skilled management.
Our success depends, in part, on our ability to attract and retain key managers. Competition for the best people can be intense and we may not be able to promote, hire or retain skilled managers. The loss of services of one or more of our key managers could have a material adverse impact on our business because of the loss of the manager's skills, knowledge of our industry and years of industry experience, and the difficulty of promptly finding qualified replacement personnel.
Natural disasters, pandemics, terrorist attacks and other external events could adversely affect our business.
Natural disasters, pandemics, terrorist attacks and other adverse external events could materially damage our facilities or disrupt our operations, or damage the facilities or disrupt the operations of our customers or vendors. The occurrence of any such event could adversely affect our business, financial condition and results of operations.
We are subject to claims and litigation.
From time-to-time, customers, vendors or employees may make claims and take legal action against us. Whether these claims and legal actions are founded or unfounded, if such claims and legal actions are not resolved in our favor, they may result in significant financial liability. Any financial liability could have a material adverse effect on our financial condition and results of operations. Any such claims and legal actions may also require significant management attention and may detract from management's focus on our operations.
We may be adversely affected if we enter into a major unprofitable contract.
Our Residential and Commercial Services and our Utility Services segments frequently operate in a competitive bid contract environment. As a result, we may misjudge a bid and be contractually bound to an unprofitable contract, which could adversely affect our results of operations.
There are no unresolved comments from the Staff of the Securities and Exchange Commission.
Our corporate headquarters campus is located in Kent, Ohio which, along with several other properties in the surrounding area, includes the Davey Institute's research, technical support and laboratory diagnostic facilities.
We conduct administrative functions through our headquarters and our offices in Livermore, California (Utility Services). Our Canadian operations’ administrative functions are conducted through properties located in the provinces of Ontario and British Columbia. We believe our properties are well maintained, in good condition and suitable for our present operations. A summary of our properties follows:
| Segment | Number of Properties | How Held | Square Footage | Number of
States or
Provinces |
| | | | | |
| Residential and Commercial | 28 | Owned | 174,052 | 15 |
| | | | | |
| Utility | 3 | Owned | 36,037 | 3 |
| | | | | |
| Residential and Commercial, and Utility | 2 | Owned | 12,400 | 2 |
| | | | | |
We also rent approximately 118 properties in 29 states and four provinces.
None of our owned or rented properties used by our business segments is individually material to our operations.
We are a party to routine litigation incidental to our business. We do not believe that this litigation, individually or in the aggregate, will have a material effect on our business, financial condition or results of operations.
No matters were submitted to a vote of our shareholders during the fourth quarter of 2008.
| Our executive officers and their present positions and ages as of March 3, 2009 follows: |
| | | |
| Name | Position | Age |
| | | |
| Karl J. Warnke | President and Chief Executive Officer | 57 |
| | | |
| David E. Adante | Executive Vice President, Chief Financial Officer and Secretary | 57 |
| | | |
| Howard D. Bowles | Senior Vice President and General Manager, Davey Tree Surgery Company | 65 |
| | | |
| C. Kenneth Celmer | Senior Vice President and General Manager, Residential and Commercial Services | 62 |
| | | |
| Marjorie L. Conner, Esquire | Assistant Secretary and Counsel | 51 |
| | | |
| Patrick M. Covey | Executive Vice President - Operations | 45 |
| | | |
| George M. Gaumer | Vice President and General Manager, Commercial Landscape Services | 56 |
| | | |
| Fred W. Johnson | Vice President, Operations Support Services | 64 |
| | | |
| Steven A. Marshall | Executive Vice President - Operations | 57 |
| | | |
| Gordon L. Ober | Vice President - Personnel Recruiting and Development | 59 |
| | | |
| Joseph R. Paul, CPA | Treasurer | 47 |
| | | |
| Richard A. Ramsey | Vice President and General Manager, Canadian Operations | 59 |
| | | |
| Nicholas R. Sucic, CPA | Vice President and Controller | 62 |
Mr. Warnke was elected President and Chief Executive Officer, effective January 1, 2007, and elected President and Chief Operating Officer in March 1999. Prior to that time, he served as Executive Vice President and General Manager - Utility Services, having been appointed in January 1993. Previously, having joined the Company in 1980, Mr. Warnke performed all aspects of tree services and also held various managerial positions, including Operations Manager, Operations Support Services, Equipment and Safety functions and Operations Vice President.
Mr. Adante was elected Executive Vice President, Chief Financial Officer and Secretary in May 1993.
Mr. Bowles was elected Senior Vice President and General Manager of Davey Tree Surgery Company in January 2000. Prior to that time, he served as Vice President and General Manager of Davey Tree Surgery Company.
Mr. Celmer was elected Senior Vice President and General Manager - Residential and Commercial Services in January 2000. Prior to that time, he served as Vice President and General Manager - Residential Services.
Ms. Conner was elected Assistant Secretary and Counsel in May 1998. Prior to that time, she served as Manager of Legal and Treasury Services.
Mr. Covey was elected Executive Vice President - Operations, effective January 1, 2007, and served as Vice President and General Manager of the Davey Resource Group, having been appointed in March 2005. Prior to that time, Mr. Covey was Vice President - Southern Operations, Utility Services, having been appointed in January 2003. Previously, having joined the Company in August 1991, Mr. Covey held various managerial positions, including Manager of Systems and Process Management and Administrative Manager, Utility Services.
Mr. Gaumer was elected Vice President and General Manager of Commercial Landscape Services in March 2005. Prior to that time, he served as Vice President of Commercial Grounds Management, having been appointed in 2001.
Mr. Johnson was elected Vice President, Operations Support Services, a corporate vice-president, in January 2003. From 1999 to January 2003, he served as Vice President of Operations Support Services. Prior to joining us, Mr. Johnson served in various capacities, including director of operations and director of sales, at Lesco, Inc., a specialty provider of products for the professional turf care and green industry markets, from 1986 to 1999. Prior to joining Lesco, Mr. Johnson held various management positions at TruGreen/Chemlawn, a provider of lawn care, tree and shrub services and a segment of The Servicemaster Company, from 1979 to 1986.
Mr. Marshall was elected Executive Vice President - Operations, effective January 1, 2007, and served as Vice President and General Manager of Eastern Utility Services, having been appointed in January 2003. Prior to that time, he served as Vice President - Southern Operations, Utility Services, having been appointed in January 1997. Previously, having joined the Company in 1977, Mr. Marshall held various managerial positions, including Operations Manager, Regional Manager and District Manager.
Mr. Ober was elected Vice President - Personnel Recruiting and Development in February 2000. Prior to that time, he served as Vice President - New Ventures.
Mr. Paul was elected Treasurer in December 2005 when he joined the Company. He is a certified public accountant. Prior to joining us, Mr. Paul served as corporate controller for AccessPoint Openings, LLC, a holding company of distribution and manufacturing companies in the building products industry, having been associated with that firm since 1998. Mr. Paul served in various capacities including director of business expansion and integration at Applied Industrial Technologies, an industrial distributor, from 1993 to 1998. Prior to joining Applied Industrial Technologies, Mr. Paul was an audit manager with Deloitte & Touche, having been associated with that firm since 1986.
Mr. Ramsey was elected Vice President and General Manager - Canadian Operations in January 2000. Prior to that time, he served as Vice President and General Manager - Commercial Services.
Mr. Sucic was elected Vice President and Controller, effective January 1, 2007, and served as Corporate Controller and Chief Accounting Officer since having joined the Company in November 2001. He is a certified public accountant. Prior to joining us, Mr. Sucic served as chief financial officer of Vesper Corporation, a manufacturer of products for industry, from 2000 to 2001; of Advanced Lighting Technologies, Inc., a designer, manufacturer and marketer of metal halide lighting products, from 1996 to 2000; and of various asset management units at The Prudential Investment Corporation, from 1989 to 1996. Prior to joining Prudential, Mr. Sucic was a partner with Ernst & Young LLP, having been associated with that firm since 1970.
Our officers serve from the date of their election to the next organizational meeting of the Board of Directors and until their respective successors are elected.
PART II
Item 5. Market for Company's Common Equity, Related Stockholder Matters and Issuer Purchases of Equity Securities.
Our common shares are not listed or traded on an established public trading market and market prices are, therefore, not available. Semiannually, for purposes of our 401KSOP, the fair market value of our common shares is determined by an independent stock valuation firm, based upon our performance and financial condition, using a peer group of comparable companies selected by that firm. The peer group currently consists of ABM Industries Incorporated, Comfort Systems USA, Inc., Dycom Industries, Inc., FirstService Corporation, Quanta Services, Inc., Rollins, Inc., and Scotts Miracle-Gro Company. The semiannual valuations are effective for a period of six months and the per-share price established by those valuations is the price at which our Board of Directors has determined our common shares will be bought and sold during that six-month period in transactions involving the Company or one of its employee benefit or stock purchase plans. Since 1979, we have provided a ready market for all shareholders through our direct purchase of their common shares, although we are under no obligation to do so. The purchases described above are added to our treasury stock.
Record Holders and Common Shares
On March 3, 2009 we had 2,910 record holders of our common shares.
On March 3, 2009 we had 14,533,174 common shares outstanding, options exercisable to purchase 1,037,579 common shares, partially-paid subscriptions for 969,718 common shares and purchase rights outstanding for 495,864 common shares.
The partially-paid subscriptions related to common shares purchased at $6.00 per share, in connection with the stock subscription offering completed in August 2002, whereby some employees opted to finance their subscription with a down-payment of at least 10% of their total purchase price and a seven-year promissory note for the balance due, with interest at 4.75%. Promissory note payments, of both principal and interest, are made either by payroll deduction or annual lump-sum payment. The promissory notes are collateralized with the common shares subscribed and the common shares are only issued when the related promissory note is paid-in-full. Dividends are paid on all unissued subscribed shares.
The purchase rights outstanding were granted to nonofficer employees to purchase one additional common share at the price of $6.00 per share for every two common shares purchased in connection with the stock subscription offering completed in August 2002. Each right may be exercised at the rate of one-seventh per year and will expire seven years after the date that the right was granted. Employees may not exercise a right should they cease to be employed by us.
Dividends
The following table sets forth, for the periods indicated, the dividends declared per common share (in cents):
| | | Year Ended December 31, |
| Quarter | | 2008 | | 2007 |
| 1 | | 4.25 | | 4.00 |
| 2 | | 4.25 | | 4.00 |
| 3 | | 4.25 | | 4.00 |
| 4 | | 4.25 | | 4.25 |
| Total | | 17.00 | | 16.25 |
We presently expect to pay comparable cash dividends in 2009.
Recent Sale of Unregistered Securities
None.
Purchases of Equity Securities
The following table provides information on purchases made by the Company of its common shares during the fiscal year ended December 31, 2008.
| Period | | Total
Number of
Shares
Purchased | | | Average
Price Paid
per Share | | | Total Number of
Shares Purchased
as Part of Publicly Announced Plans
or Programs | | | Maximum Number (or Approximate Dollar Value) of Shares that May Yet Be Purchased Under the Plans
or Programs | |
| | | | | | | | | | | | | |
| Fiscal 2008 | | | | | | | | | | | | |
| | | | | | | | | | | | | |
| January 1 to January 26 | | | - | | | | - | | | | n/a | | | | n/a | |
| January 27 to February 23 | | | - | | | | - | | | | n/a | | | | n/a | |
| February 24 to March 29 | | | 77,816 | | | $ | 15.80 | | | | n/a | | | | n/a | |
| | | | | | | | | | | | | | | | | |
| Total First Quarter | | | 77,816 | | | | 15.80 | | | | | | | | | |
| | | | | | | | | | | | | | | | | |
| March 30 to April 26 | | | 277,358 | | | | 15.80 | | | | n/a | | | | n/a | |
| April 27 to May 24 | | | 148,898 | | | | 15.80 | | | | n/a | | | | n/a | |
| May 25 to June 28 | | | 127,546 | | | | 15.80 | | | | n/a | | | | n/a | |
| | | | | | | | | | | | | | | | | |
| Total Second Quarter | | | 553,802 | | | | 15.80 | | | | | | | | | |
| | | | | | | | | | | | | | | | | |
| June 29 to July 26 | | | - | | | | 16.40 | | | | n/a | | | | n/a | |
| July 27 to August 23 | | | 42,198 | | | | 16.40 | | | | n/a | | | | n/a | |
| August 24 to September 27 | | | 89,528 | | | | 16.40 | | | | n/a | | | | n/a | |
| | | | | | | | | | | | | | | | | |
| Total Third Quarter | | | 131,726 | | | | 16.40 | | | | | | | | | |
| | | | | | | | | | | | | | | | | |
| September 28 to October 25 | | | 456,712 | | | | 16.40 | | | | n/a | | | | n/a | |
| October 26 to November 29 | | | 186,730 | | | | 16.40 | | | | n/a | | | | n/a | |
| November 30 to December 31 | | | 514,478 | | | | 16.40 | | | | n/a | | | | n/a | |
| | | | | | | | | | | | | | | | | |
| Total Fourth Quarter | | | 1,157,920 | | | | 16.40 | | | | | | | | | |
| | | | | | | | | | | | | | | | | |
| Total Year-to-Date | | | 1,921,264 | | | | 16.20 | | | | | | | | | |
| | | | | | | | | | | | | | | | | |
| n/a--Not applicable. There are no publicly announced plans or programs to purchase common shares. | |
Stock Performance Graph
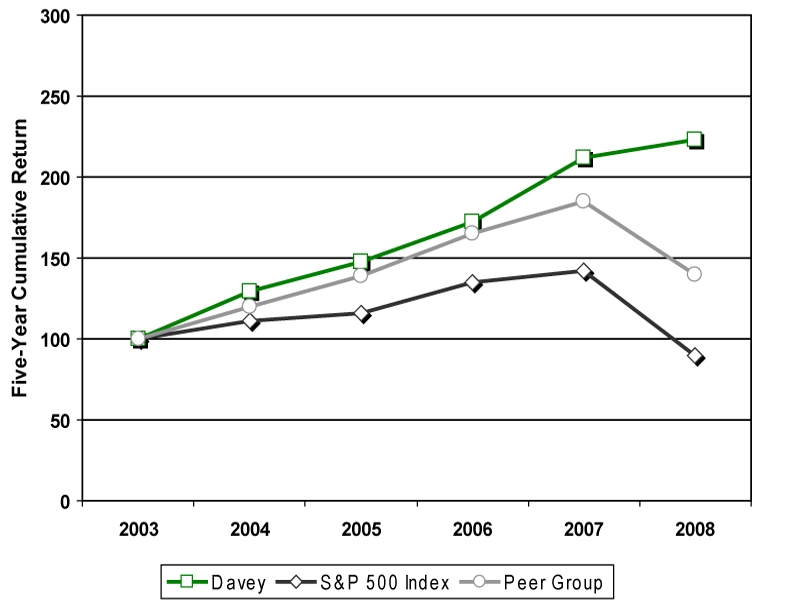
Comparison of five-year cumulative return among The Davey Tree Expert Company, S&P 500 Stock Index and Selected Peer Group Companies Index
The following Performance Graph compares cumulative total shareholder returns for The Davey Tree Expert Company common shares during the last five years to the Standard & Poor’s 500 Stock Index and to an index of selected peer group companies. The peer group, which is the same group used by the Company’s independent stock valuation firm, consists of: ABM Industries Incorporated; Comfort Systems USA, Inc.; Dycom Industries, Inc.; FirstService Corporation; Quanta Services, Inc.; Rollins, Inc.; and Scotts Miracle-Gro Company. Each of the three measures of cumulative total return assumes reinvestment of dividends.
Comparison of Five-Year Cumulative Total Return
The Davey Tree Expert Company
| | 2003 | 2004 | 2005 | 2006 | 2007 | 2008 |
| Davey Tree | 100 | 129 | 148 | 172 | 212 | 223 |
| S&P 500 Index | 100 | 111 | 116 | 135 | 142 | 90 |
| Peer Group | 100 | 120 | 139 | 165 | 185 | 140 |
The Performance Graph and related information above shall not be deemed “soliciting material” or be “filed” with the Securities and Exchange Commission, nor shall such information be incorporated by reference into any future filing under the Securities Act of 1933 or Securities Exchange Act of 1934, each as amended, except to the extent that we specifically incorporate it by reference into such filing.
Item 6. Selected Financial Data for the Past Five Years.
| | | Fiscal Year Ended December 31, | |
| | | 2008 | | | 2007 | | | 2006 | | | 2005 | | | 2004 | |
| | | (In thousands, except ratio and per share data) | |
| Operating Statement Data: | | | | | | | | | | | | | |
| | | | | | | | | | | | | | | | |
| Revenues | | $ | 595,797 | | | $ | 506,138 | | | $ | 467,534 | | | $ | 431,611 | | | $ | 398,648 | |
| | | | | | | | | | | | | | | | | | | | | |
| Costs and expenses: | | | | | | | | | | | | | | | | | | | | |
| Operating | | | 382,143 | | | | 324,415 | | | | 305,106 | | | | 283,596 | | | | 263,080 | |
| Selling | | | 95,327 | | | | 82,449 | | | | 74,513 | | | | 69,944 | | | | 64,010 | |
| General and administrative | | | 45,607 | | | | 38,476 | | | | 34,126 | | | | 29,815 | | | | 27,908 | |
| Depreciation | | | 34,374 | | | | 28,085 | | | | 26,991 | | | | 24,147 | | | | 21,083 | |
| Amortization of intangible assets | | | 1,482 | | | | 1,148 | | | | 1,291 | | | | 1,416 | | | | 1,545 | |
| Gain on sale of assets, net | | | (992 | ) | | | (515 | ) | | | (309 | ) | | | (521 | ) | | | (552 | ) |
| Income from operations | | | 37,856 | | | | 32,080 | | | | 25,816 | | | | 23,214 | | | | 21,574 | |
| | | | | | | | | | | | | | | | | | | | | |
| Interest expense | | | (3,417 | ) | | | (3,422 | ) | | | (2,768 | ) | | | (2,196 | ) | | | (1,827 | ) |
| Interest income | | | 220 | | | | 404 | | | | 176 | | | | 260 | | | | 1,949 | |
| Other expense | | | (2,920 | ) | | | (542 | ) | | | (1,301 | ) | | | (825 | ) | | | (800 | ) |
| | | | | | | | | | | | | | | | | | | | | |
| Income before income taxes | | | 31,739 | | | | 28,520 | | | | 21,923 | | | | 20,453 | | | | 20,896 | |
| Income taxes | | | 12,718 | | | | 10,441 | | | | 7,906 | | | | 7,142 | | | | 8,643 | |
| Net income | | $ | 19,021 | | | $ | 18,079 | | | $ | 14,017 | | | $ | 13,311 | | | $ | 12,253 | |
| | | | | | | | | | | | | | | | | | | | | |
| Earnings per share--diluted* | | $ | 1.14 | | | $ | 1.07 | | | $ | .80 | | | $ | .75 | | | $ | .69 | |
| | | | | | | | | | | | | |
| Shares used for computing per share amounts--diluted* | | | 16,751 | | | | 16,844 | | | | 17,460 | | | | 17,768 | | | | 17,846 | |
| | | | | | | | | | | | | | | | | | | | | |
| Other Financial Data: | | | | | | | | | | | | | | | | | | | | |
| | | | | | | | | | | | | | | | | | | | | |
| Depreciation and amortization | | $ | 35,856 | | | $ | 29,233 | | | $ | 28,282 | | | $ | 25,563 | | | $ | 22,628 | |
| | | | | | | | | | | | | | | | | | | | | |
| Capital expenditures | | | 37,033 | | | | 37,587 | | | | 32,435 | | | | 31,985 | | | | 38,482 | |
| | | | | | | | | | | | | | | | | | | | | |
| Cash flow provided by (used in): | | | | | | | | | | | | | | | | | |
| Operating activities | | | 55,283 | | | | 52,341 | | | | 38,372 | | | | 32,237 | | | | 54,010 | |
| Investing activities | | | (51,356 | ) | | | (38,801 | ) | | | (34,419 | ) | | | (31,682 | ) | | | (38,119 | ) |
| Financing activities | | | (2,383 | ) | | | (13,822 | ) | | | (5,297 | ) | | | 1,646 | | | | (14,858 | ) |
| | | | | | | | | | | | | | | | | | | | | |
| Cash dividends declared per share* | | $ | .1700 | | | $ | .1625 | | | $ | .1525 | | | $ | .1425 | | | $ | .1325 | |
| | | | | | | | | | | | | | | | | | | | | |
| *Adjusted for two-for-one stock split. | | | | | | | | | | | | | |
| | | As of December 31, | |
| | | 2008 | | | 2007 | | | 2006 | | | 2005 | | | 2004 | |
| | | (In thousands, except ratio and per share data) | |
| Balance Sheet Data: | | | | | | | | | | | | | | | |
| | | | | | | | | | | | | | | | |
| Working capital | | $ | 20,803 | | | $ | 20,443 | | | $ | 24,598 | | | $ | 26,859 | | | $ | 22,207 | |
| | | | | | | | | | | | | | | | | | | | | |
| Current ratio | | | 1.23 | | | | 1.29 | | | | 1.38 | | | | 1.46 | | | | 1.38 | |
| | | | | | | | | | | | | | | | | | | | | |
| Property and equipment, net | | | 141,013 | | | | 108,239 | | | | 96,522 | | | | 90,768 | | | | 83,600 | |
| | | | | | | | | | | | | | | | | | | | | |
| Total assets | | | 291,002 | | | | 231,649 | | | | 207,980 | | | | 194,129 | | | | 183,105 | |
| | | | | | | | | | | | | | | | | | | | | |
| Long-term debt | | | 60,187 | | | | 32,099 | | | | 31,951 | | | | 29,065 | | | | 19,830 | |
| | | | | | | | | | | | | | | | | | | | | |
| Other long-term liabilities | | | 45,523 | | | | 33,728 | | | | 29,283 | | | | 28,108 | | | | 34,681 | |
| | | | | | | | | | | | | | | | | | | | | |
| Shareholders' equity | | | 94,783 | | | | 94,382 | | | | 82,076 | | | | 78,553 | | | | 70,203 | |
| | | | | | | | | | | | | | | | | | | | | |
| Common shares:* | | | | | | | | | | | | | | | | | | | | |
| Issued | | | 21,457 | | | | 21,457 | | | | 21,457 | | | | 21,457 | | | | 21,457 | |
| In treasury | | | 6,939 | | | | 6,926 | | | | 6,436 | | | | 6,456 | | | | 6,148 | |
| Net outstanding | | | 14,518 | | | | 14,531 | | | | 15,021 | | | | 15,001 | | | | 15,309 | |
| | | | | | | | | | | | | | | | | | | | | |
| Stock options:* | | | | | | | | | | | | | | | | | | | | |
| Outstanding | | | 1,331 | | | | 1,422 | | | | 1,536 | | | | 1,812 | | | | 1,980 | |
| Exercisable | | | 1,039 | | | | 848 | | | | 666 | | | | 1,198 | | | | 1,160 | |
| | | | | | | | | | | | | | | | | | | | | |
| ESOT valuation per share* | | $ | 16.40 | | | $ | 15.80 | | | $ | 12.95 | | | $ | 11.25 | | | $ | 10.00 | |
| | | | | | | | | | | | | | | | | | | | | |
| *Adjusted for two-for-one stock split. | | | | | | | | | | | | | |
Item 7. Management's Discussion and Analysis of Financial Condition and Results of Operations.
(Amounts in thousands, except share data)
Management’s Discussion and Analysis of Results of Operations and Financial Condition (“MD&A”) is provided as a supplement to the accompanying consolidated financial statements and notes to help provide an understanding of our financial condition, cash flows and results of operations. MD&A is organized as follows:
| § | Overview of 2008 Results; |
| § | Results of Operations, including fiscal 2008 compared to fiscal 2007, fiscal 2007 compared to fiscal 2006, and Canadian dollar translation adjustments and rate-change effects; |
| § | Liquidity and Capital Resources, including cash flow summary, off-balance sheet arrangements, and capital resources; |
| § | New Accounting Pronouncements; |
| § | Critical Accounting Policies and Estimates; and |
| § | Market Risk Information, including interest rate risk and foreign currency rate risk. |
OVERVIEW OF 2008 RESULTS
General
We provide a wide range of horticultural services to residential, commercial, utility and institutional customers throughout the United States and Canada.
Our Business--Our operating results are reported in two segments: Residential and Commercial Services, and Utility Services for operations in the United States and Canada. Residential and Commercial Services provides for the treatment, preservation, maintenance, cultivation, planting and removal of trees, shrubs and other plant life; its services also include the practice of landscaping, tree surgery, tree feeding, and tree spraying, as well as the application of fertilizer, herbicides and insecticides. Utility Services is principally engaged in the practice of line clearing for investor-owned and municipal utilities, including the clearing of tree growth from power lines, clearance of rights-of-way and chemical brush control.
Davey Resource Group, which provides services related to natural resource management and consulting, forestry research and development, and environmental planning and also maintains research, technical support and laboratory diagnostic facilities, is a nonreportable segment and, along with other operating activities, is included in “All Other.”
Results of Operations
The following table sets forth our consolidated results of operations as a percentage of revenues and the percentage change in dollar amounts of the results of operations for the periods presented.
| | | Year Ended December 31, | | | Percentage Change | |
| | | 2008 | | | 2007 | | | 2006 | | | | 2008/2007 | | | | 2007/2006 | |
| | | | | | | | | | | | | | | | | | |
| Revenues | | | 100.0 | % | | | 100.0 | % | | | 100.0 | % | | | 17.7 | % | | | 8.3 | % |
| Costs and expenses: | | | | | | | | | | | | | | | | | | | | |
| Operating | | | 64.1 | | | | 64.1 | | | | 65.3 | | | | 17.8 | | | | 6.3 | |
| Selling | | | 16.0 | | | | 16.3 | | | | 15.9 | | | | 15.6 | | | | 10.7 | |
| General and administrative | | | 7.7 | | | | 7.6 | | | | 7.3 | | | | 18.5 | | | | 12.7 | |
| Depreciation | | | 5.8 | | | | 5.6 | | | | 5.8 | | | | 22.4 | | | | 4.1 | |
| Amortization of intangible assets | | | .2 | | | | .2 | | | | .3 | | | | 29.1 | | | | (11.1 | ) |
| Gain on sale of assets, net | | | (.2 | ) | | | (.1 | ) | | | (.1 | ) | | | 92.6 | | | | 66.7 | |
| | | | 93.6 | | | | 93.7 | | | | 94.5 | | | | 17.7 | | | | 7.3 | |
| Income from operations | | | 6.4 | | | | 6.3 | | | | 5.5 | | | | 18.0 | | | | 24.3 | |
| | | | | | | | | | | | | | | | | | | | | |
| Other income (expense): | | | | | | | | | | | | | | | | | | | | |
| Interest expense | | | (.6 | ) | | | (.7 | ) | | | (.6 | ) | | | (.1 | ) | | | 23.6 | |
| Interest income | | | - | | | | - | | | | - | | | | (45.5 | ) | | | 129.5 | |
| Other | | | (.5 | ) | | | - | | | | (.2 | ) | | nm | | | | (58.3 | ) |
| Income before income taxes | | | 5.3 | | | | 5.6 | | | | 4.7 | | | | 11.3 | | | | 30.1 | |
| Income taxes | | | 2.1 | | | | 2.0 | | | | 1.7 | | | | 32.1 | | | | 32.1 | |
| Net income | | | 3.2 | % | | | 3.6 | % | | | 3.0 | % | | | 5.2 | % | | | 29.0 | % |
| | | | | | | | | | | | | | | | | | | | | |
| nm--not meaningful | | | | | | | | | | | | | | | | | | | | |
Revenues of $595,797 were 17.7% higher than last year’s revenues of $506,138. Utility Services revenues increased 24.4% and Residential and Commercial Services increased 12.0%.
Overall, income from operations of $37,856 increased 18.0% from the $32,080 experienced in the prior year. Income from operations was $21,624 in Utility Services (a 36.2% increase over 2007) and $17,786 for Residential and Commercial Services (a 11.5% decrease over 2007).
Net income of $19,021 was $942, or 5.2%, higher than the $18,079 earned in 2007. The increase in net income was due to higher revenues in 2008 and slightly better operating margins.
Operating activities in 2008 provided cash of $55,283 as compared to $52,341 provided in 2007. The $2,942 net increase was primarily attributable to (i) an increase in net income of $942, (ii) an increase of $6,623 in depreciation and amortization expense and, (iii) less cash of $5,247 provided by changes in other operating assets and liabilities.
Investing activities used $51,356 in cash, or $12,555 more than that used in 2007, primarily the result of expenditures for purchases of businesses.
Financing activities used $2,383 in 2008, a decrease of $11,439 compared with $13,822 used in 2007. Our revolving credit facility provided $24,350 more than the $300 provided in 2007. Purchases of common shares for treasury of $28,081 were partially offset by net cash received of $6,519 from the sale of common shares and common share subscriptions. Dividends paid during 2008 totaled $2,690.
Fiscal 2008 Compared to Fiscal 2007
A comparison of our fiscal year 2008 results to 2007 follows:
| | | Year Ended December 31, | |
| | | 2008 | | | 2007 | | | Change | | | % Change | |
| | | | | | | | | | | | | |
| Revenues | | $ | 595,797 | | | $ | 506,138 | | | $ | 89,659 | | | | 17.7 | % |
| | | | | | | | | | | | | | | | | |
| Costs and expenses: | | | | | | | | | | | | | | | | |
| Operating | | | 382,143 | | | | 324,415 | | | | 57,728 | | | | 17.8 | |
| Selling | | | 95,327 | | | | 82,449 | | | | 12,878 | | | | 15.6 | |
| General and administrative | | | 45,607 | | | | 38,476 | | | | 7,131 | | | | 18.5 | |
| Depreciation | | | 34,374 | | | | 28,085 | | | | 6,289 | | | | 22.4 | |
| Amortization of intangible assets | | | 1,482 | | | | 1,148 | | | | 334 | | | | 29.1 | |
| Gain on sale of assets, net | | | (992 | ) | | | (515 | ) | | | (477 | ) | | | 92.6 | |
| | | | 557,941 | | | | 474,058 | | | | 83,883 | | | | 17.7 | |
| | | | | | | | | | | | | | | | | |
| Income from operations | | | 37,856 | | | | 32,080 | | | | 5,776 | | | | 18.0 | |
| | | | | | | | | | | | | | | | | |
| Other income (expense): | | | | | | | | | | | | | | | | |
| Interest expense | | | (3,417 | ) | | | (3,422 | ) | | | 5 | | | | (0.1 | ) |
| Interest income | | | 220 | | | | 404 | | | | (184 | ) | | | (45.5 | ) |
| Other | | | (2,920 | ) | | | (542 | ) | | | (2,378 | ) | | | 438.7 | |
| | | | | | | | | | | | | | | | | |
| Income before income taxes | | | 31,739 | | | | 28,520 | | | | 3,219 | | | | 11.3 | |
| | | | | | | | | | | | | | | | | |
| Income taxes | | | 12,718 | | | | 10,441 | | | | 2,277 | | | | 21.8 | |
| | | | | | | | | | | | | | | | | |
| Net income | | $ | 19,021 | | | $ | 18,079 | | | $ | 942 | | | | 5.2 | % |
| | | | | | | | | | | | | | | | | |
Revenues--Revenues of $595,797 increased $89,659 over the $506,138 reported in 2007. Utility Services increased $60,491 or 24.4% from the prior year. New business from an acquisition, storm damage arising from hurricane damage incurred in the southern United States (primarily from hurricanes Gustav and Ike) as well as new contracts and increases in existing contracts accounted for the increase. Residential and Commercial Services increased $26,701 or 12.0% from 2007. New business from acquisitions and expanded operations accounted for the increase. Total consolidated revenues of $595,797 include production incentive revenue, recognized under the completed-performance method of $4,872, as compared with $3,401 in 2007.
Operating Expenses--Operating expenses of $382,143 increased $57,728 from the prior year, and as a percentage of revenues remained stable at 64.1%. Utility Services experienced an increase of $44,411 or 24.2% from 2007, but as a percentage of revenues decreased .1% to 74.0%. Increases in labor expense, subcontractor expense, equipment and crew travel expense associated with the storm damage work and increased revenues in all utility operations account for the increase. Residential and Commercial Services increased $14,033 or 12.0% compared with 2007 but as a percentage of revenue decreased .1% to 52.5%. The increase is attributable to additional labor, equipment, subcontractor, and material expense associated with the increased revenue.
The increase in fuel prices impacted operating expenses within all segments. For 2008, fuel expense of $31,203 increased $8,244, or 35.9 %, more than the fuel expense of $22,959 for 2007. Approximately $1,623 of the 2008 increase related to usage. Fuel costs for 2008 may not be indicative of fuel costs for 2009.
Selling Expenses--Selling expenses of $95,327 increased $12,878 from 2007 but as a percentage of revenues decreased .3% to 16.0%. Utility Services increased $4,420 or 19.1% over 2007, primarily for field management wages and incentives, travel expenses, employee development and training expense and rent expense associated with the increased revenue. Residential and Commercial Services experienced an increase of $6,935 or 11.8% over the prior year 2007, the result of increases in field management wages and incentives, field management auto expense and branch office wages.
General and Administrative Expenses--General and administrative expenses increased $7,131 to $45,607, a 18.5% increase, from the $38,476 experienced in 2007 and as a percentage of revenues increased .1% to 7.7%. The increase of $7,131 includes general and administrative expenses of the acquired businesses of $4,880 as well as increases in salary expense, professional services and office supplies. These increases were partially offset by reductions in incentive expense and stock-based compensation expense.
Depreciation and Amortization Expense--Depreciation and amortization expense of $35,856 increased $6,623 from the prior year and as a percentage of revenues increased ..2% to 6.0%. The increase is attributable to additional capital expenditures for buildings, purchases of businesses and equipment necessary to support the increase in business levels.
Gain on Sale of Assets--Gain on the sale of assets of $992 increased $477 from the $515 experienced in 2007. The increase is due to an increase in the number of vehicles disposed of and the amount received for those vehicles as compared to the prior year.
Interest Expense--Interest expense of $3,417 decreased $5 or .1% from the $3,422 incurred in 2007. Increases in our bank borrowings were offset by significantly lower interest rates charged on those bank borrowings as compared with 2007.
Other, Net--Other, net of $2,920 increased $2,378 from the $542 experienced in 2007. Other, net, includes foreign currency losses of $1,029 for 2008 as compared with foreign currency gains of $1,024 for 2007 on the intercompany balances of our Canadian operations.
Income Taxes--Income tax expense for 2008 was $12,718. The 2008 effective tax rate of 40.1% includes a 3.9% state income tax rate, net of federal benefit. The 2007 tax rate of 36.6% included a 2.9% state income tax rate, net of federal benefit.
Net Income--Net income of $19,021 was $942 higher than the $18,079 earned in 2007. The 5.2% increase in net income was primarily due to higher revenues in 2008 and better operating margins.
Fiscal 2007 Compared to Fiscal 2006
A comparison of our fiscal year 2007 results to 2006 follows:
| | | Year Ended December 31, | |
| | | 2007 | | | 2006 | | | Change | | | % Change | |
| | | | | | | | | | | | | |
| Revenues | | $ | 506,138 | | | $ | 467,534 | | | $ | 38,604 | | | | 8.3 | % |
| | | | | | | | | | | | | | | | | |
| Costs and expenses: | | | | | | | | | | | | | | | | |
| Operating | | | 324,415 | | | | 305,106 | | | | 19,309 | | | | 6.3 | |
| Selling | | | 82,449 | | | | 74,513 | | | | 7,936 | | | | 10.7 | |
| General and administrative | | | 38,476 | | | | 34,126 | | | | 4,350 | | | | 12.7 | |
| Depreciation | | | 28,085 | | | | 26,991 | | | | 1,094 | | | | 4.1 | |
| Amortization of intangible assets | | | 1,148 | | | | 1,291 | | | | (143 | ) | | | (11.1 | ) |
| Gain on sale of assets, net | | | (515 | ) | | | (309 | ) | | | (206 | ) | | | 66.7 | |
| | | | 474,058 | | | | 441,718 | | | �� | 32,340 | | | | 7.3 | |
| | | | | | | | | | | | | | | | | |
| Income from operations | | | 32,080 | | | | 25,816 | | | | 6,264 | | | | 24.3 | |
| | | | | | | | | | | | | | | | | |
| Other income (expense): | | | | | | | | | | | | | | | | |
| Interest expense | | | (3,422 | ) | | | (2,768 | ) | | | (654 | ) | | | 23.6 | |
| Interest income | | | 404 | | | | 176 | | | | 228 | | | | 129.5 | |
| Other | | | (542 | ) | | | (1,301 | ) | | | 759 | | | | (58.3 | ) |
| | | | | | | | | | | | | | | | | |
| Income before income taxes | | | 28,520 | | | | 21,923 | | | | 6,597 | | | | 30.1 | |
| | | | | | | | | | | | | | | | | |
| Income taxes | | | 10,441 | | | | 7,906 | | | | 2,535 | | | | 32.1 | |
| | | | | | | | | | | | | | | | | |
| Net income | | $ | 18,079 | | | $ | 14,017 | | | $ | 4,062 | | | | 29.0 | % |
| | | | | | | | | | | | | | | | | |
Revenues--Revenues of $506,138 increased $38,604 over the $467,534 reported in 2006. Utility Services increased $14,335 or 6.1% from the prior year. Increases in existing contracts and new contracts primarily in our Canadian and western utility operations were partially offset by reductions in an existing contract in the southeastern United States and customer-imposed budget restrictions on another contract within our eastern utility operations. Residential and Commercial Services increased $15,045 or 7.2% from 2006. New and expanded operations, favorable weather conditions and storm-related work in the northwestern and northeastern parts of the United States coupled with increased consumer demand for our services account for the increase. Total consolidated revenues of $506,138 include production incentive revenue, recognized under the completed-performance method of $3,401, as compared with $356 in 2006.
Operating Expenses--Operating expenses of $324,415 increased $19,309 from the prior year, but as a percentage of revenues decreased 1.2% to 64.1%. Utility Services experienced an increase of $5,656 or 3.2% from 2006, but as a percentage of revenues decreased 2.0% to 74.1%. Increases in labor expense, subcontractor expense, fuel expense and crew travel expense in our western and Canadian utility operations were partially offset by reductions of labor and subcontractor expense within our eastern utility operations, the result of contract reductions and customer-imposed budget restrictions. Residential and Commercial Services increased $5,960 or 5.4% compared with 2006 but as a percentage of revenue decreased 1.0% to 52.5%. The increase is attributable to additional labor, subcontractor, equipment and fuel expense associated with the increased revenue. The remaining change between consolidated operating expenses and segment operating expenses was an increase of $7,693.
Utility Services costs, in all categories including operating expenses, were higher because of the negative impact of one contract in California. Initially, operating results on this contract were negatively affected by weather factors giving rise to excess vegetation and tree growth. The initial three-year period of this contract ended June 30, 2007, with the customer exercising the first of three one-year options. The first option period terminated on June 30, 2008 with two one-year options remaining thereafter. Because of managerial and production efforts and changes in subcontracting, operating results on this contract improved during 2007 as compared with 2006. However, operating results on this contract continue to be adversely affected for the remaining term of this contract because of weather and expected subsequent excess growth patterns. Operating losses on this contract include provision for anticipated loss.
Selling Expenses--Selling expenses of $82,449 increased $7,936 from 2006 and as a percentage of revenues increased .4% to 16.3%. Utility Services increased $1,643 or 7.6% over 2006, primarily for field management wages and incentives, travel expenses and employee development and training expense associated with the increased revenue. Residential and Commercial Services experienced an increase of $4,561 or 8.4% over the prior year 2006, the result of increases in field management wages and incentives, sales, field management travel and auto expense, marketing expense and branch office wages and expenses. The remaining change between consolidated selling expenses and segment selling expenses was an increase of $1,732.
General and Administrative Expenses--General and administrative expenses increased $4,350 to $38,476, a 12.7% increase, from the $34,126 experienced in 2006 and as a percentage of revenues increased .3% to 7.6%. Increases in salaries and incentive expense of $2,714, the result of increased revenues and stronger earnings performance, as well as increases in professional services, stock-based compensation expense, relocation expense and pension expense account for the increase.
Depreciation and Amortization Expense--Depreciation and amortization expense of $29,233 increased $951 from the prior year and as a percentage of revenues decreased .3% to 5.8%. The increase is attributable to additional capital expenditures for buildings, purchases of businesses and equipment necessary to support the increase in business levels.
Gain on Sale of Assets--Gain on the sale of assets of $515 increased $206 from the $309 experienced in 2006. The increase is due to an increase in the number of vehicles disposed of and the amount received for those vehicles as compared to the prior year.
Interest Expense--Interest expense of $3,422 increased $654 or 23.6% from the $2,768 incurred in 2006. The increase is attributable to higher interest rates on bank borrowings and higher average debt levels as compared with the prior year.
Income Taxes--Income tax expense for 2007 was $10,441. The 2007 effective tax rate of 36.6% includes a 2.9% state income tax rate, net of federal benefit. The 2006 tax rate of 36.1% included a 4.5% state income tax rate, net of federal benefit.
Net Income--Net income of $18,079 was $4,062 higher than the $14,017 earned in 2006. The 29.0% increase in net income was primarily due to higher revenues in 2007 and better operating margins.
Canadian Dollar Translation Adjustments and Rate-Change Effects
Currency Translation Adjustments--All assets and liabilities of the Company’s Canadian operations are translated into United States dollars at balance-sheet date exchange rates while revenues and expenses are translated at weighted-average exchange rates in effect during the interim periods of operations reported. Currency translation adjustments are a component of other comprehensive income or loss and are recorded as accumulated other comprehensive loss in shareholders’ equity.
Canadian Dollar Rate-Change Effects--During 2008, the United States dollar strengthened in relation to the Canadian dollar. As a result, the weighted-average exchange rate for the year ended December 31, 2008 compared unfavorably with the Canadian-dollar exchange rates that existed for the year ended December 31, 2007.
It is not possible to precisely measure the impact on operating results from Canadian dollar exchange rate changes. However, if Canadian operating results for the year ended December 31, 2008 were translated at the exchange rates in effect during the comparable period of 2007, revenues would have been approximately $90 higher and income from operations would have been approximately $11 higher.
The effect of exchange rate changes on cash balances held in Canadian dollars was not significant.
LIQUIDITY AND CAPITAL RESOURCES
Our principal financial requirements are for capital spending, working capital and business acquisitions.
Cash Flow Summary
Our cash flows from operating, investing and financing activities, as reflected in the Consolidated Statements of Cash Flow for the years ended December 31, 2008 and December 31, 2007 are summarized as follows:
| | | 2008 | | | 2007 | |
| Cash provided by (used in): | | | | | | |
| Operating activities | | $ | 55,283 | | | $ | 52,341 | |
| Investing activities | | | (51,356 | ) | | | (38,801 | ) |
| Financing activities | | | (2,383 | ) | | | (13,822 | ) |
| Increase(Decrease) in cash | | $ | 1,544 | | | $ | (282 | ) |
| | | | | | | | | |
Net Cash Provided by Operating Activities--Operating activities in 2008 provided cash of $55,283 as compared to $52,341 provided in 2007. The $2,942 net increase was primarily attributable to (i) an increase in net income of $942, (ii) an increase of $6,623 in depreciation and amortization expense and, (iii) less cash of $5,247 provided by changes in other operating assets and liabilities.
Overall, accounts receivable dollars increased $1,327 in 2008 as compared to the $1,582 increase experienced in 2007. With respect to the change in accounts receivable arising from business levels, the “days-sales-outstanding” in accounts receivable (“DSO”) at the end of 2008 decreased 3 days to 50 days, as compared to 2007. The DSO at December 31, 2007 was 53 days.
Accounts payable and accrued expenses increased $659 in 2008, compared to an increase of $5,411 experienced in 2007. Increases in trade payables and employee compensation expense were partially offset by reductions in compensated-absence accruals, accrued interest, self-insured medical claims and advance payments from customers.
Self-insurance accruals increased $3,296 in 2008, $2,743 less than the increase of $6,039 experienced in 2007. The increase occurred in all classifications—workers’ compensation, general liability and vehicle liability--and resulted primarily from an overall increase in deductible amounts under commercial insurance or the self-insured risk retention as well as increased accruals from our 2008 acquisitions.
Other assets, net, increased $279 in 2008, $1,993 lower than the $2,272 increase in 2007. The increase attributable to increases in operating supplies, prepaid expenses and tax deposits.
Net Cash Used in Investing Activities--Investing activities used $51,356 in cash, $12,555 more than the $38,801 used in 2007. The use of cash in 2008 includes the purchase of businesses totaling $15,718, offset by a decrease in capital expenditures for equipment and land and buildings as compared to 2007.
Net Cash Used in Financing Activities--Financing activities used $2,383 in 2008, a decrease of $11,439 from the $13,822 used in 2007. Our revolving credit facility provided $24,350 more than the $300 provided in 2007. We use the credit facility primarily for capital expenditures and payments of notes payable, primarily related to acquisitions. Included in the revolving credit facility for 2008 was $15,718 related to our investment in six businesses. Payments of long-term debt and capital leases totaled $5,129. Purchases of common shares for treasury of $28,081 were partially offset by net cash received of $6,519 from the sale of common shares and common share subscriptions. Dividends paid during 2008 totaled $2,690.
Revolving Credit Facility--We have a $159,000 revolving credit facility with a group of banks, which will expire in December 2011 and permits borrowings, as defined, up to $159,000 (increased in May 2008 from $147,000) with a letter of credit sublimit of $100,000. The revolving credit facility contains certain affirmative and negative covenants customary for this type of facility and includes financial covenant ratios, as defined, with respect to funded debt to EBITDA (earnings before interest, taxes, depreciation and amortization), and funded debt to capitalization. Included in the credit facility is a $7,000 seven-year term loan entered into in November 2007 that requires quarterly principal installments of $250, plus interest.
Contractual Obligations Summary
The following is a summary of our long-term contractual obligations, as at December 31, 2008, to make future payments for the periods indicated.
| | | | | | Contractual Obligations Due -- Year Ending December 31, | | | | |
| Description | | Total | | | 2009 | | | 2010 | | | 2011 | | | 2012 | | | 2013 | | | Thereafter | |
| | | | | | | | | | | | | | | | | | | | | | |
| Revolving credit facility | | $ | 56,450 | | | $ | 1,000 | | | $ | 1,000 | | | $ | 51,700 | | | $ | 1,000 | | | $ | 1,000 | | | $ | 750 | |
| Term loans | | | 11,101 | | | | 6,364 | | | | 2,465 | | | | 2,072 | | | | 100 | | | | 100 | | | | - | |
| Capital lease obligations | | | 981 | | | | 818 | | | | 163 | | | | - | | | | - | | | | - | | | | - | |
| Operating lease obligations | | | 14,625 | | | | 5,197 | | | | 3,850 | | | | 2,420 | | | | 1,338 | | | | 910 | | | | 910 | |
| Self-insurance accruals | | | 60,069 | | | | 22,069 | | | | 15,569 | | | | 9,855 | | | | 4,649 | | | | 2,075 | | | | 5,852 | |
| Purchase obligations | | | 2,497 | | | | 2,497 | | | | - | | | | - | | | | - | | | | - | | | | - | |
| Other liabilities | | | 10,408 | | | | 2,821 | | | | 297 | | | | 463 | | | | 561 | | | | 397 | | | | 5,869 | |
| | | $ | 156,131 | | | $ | 40,766 | | | $ | 23,344 | | | $ | 66,510 | | | $ | 7,648 | | | $ | 4,482 | | | $ | 13,381 | |
The self-insurance accruals in the summary above reflect the total of the undiscounted amount accrued, for which amounts estimated to be due each year may differ from actual payments required to fund claims. Purchase obligations in the summary above represent open purchase-order amounts we anticipate will become payable within the next year for goods and services we have negotiated for delivery as of December 31, 2008. Other liabilities include estimates of future expected funding requirements related to retirement plans and other sundry items. Because their future cash outflows are uncertain, accrued income tax liabilities for uncertain tax positions, as of December 31, 2008, have not been included in the summary above. Noncurrent deferred taxes and payments related to defined benefit pension plans are also not included in the summary.
As at December 31, 2008, we were contingently liable to our principal banks for letters of credit in the amount of $61,181 of which $58,926 is committed under the revolving credit facility. Substantially all of these letters of credit, which expire within a year, are planned for renewal as appropriate.
Also, as is common with our industry, we have performance obligations that are supported by surety bonds, which expire during 2009 through 2011. We intend to renew the performance bonds where appropriate and as necessary.
Off-Balance Sheet Arrangements
There are no “off-balance sheet arrangements” as that term is defined in Regulation S-K, Item 303(a)(4)(ii) under the Securities Exchange Act of 1934.
Capital Resources
Cash generated from operations and our revolving credit facility are our primary sources of capital.
Business seasonality results in higher revenues during the second and third quarters as compared with the first and fourth quarters of the year, while our methods of accounting for fixed costs, such as depreciation and interest expense, are not significantly impacted by business seasonality. Capital resources during these periods are equally affected. We satisfy seasonal working capital needs and other financing requirements with the revolving credit facility and several other short-term lines of credit. We are continuously reviewing our existing sources of financing and evaluating alternatives. At December 31, 2008, we had working capital of $20,803, unused short-term lines of credit approximating $11,005, and $43,624 available under our revolving credit facility.
Our sources of capital presently allow us the financial flexibility to meet our capital spending plan and to complete business acquisitions.
NEW ACCOUNTING PRONOUNCEMENTS
New Accounting Standards--Recently Adopted
FIN No. 48--Effective January 1, 2007, we adopted Financial Accounting Standards Board (“FASB”) Interpretation No. 48, “Accounting for Uncertainty in Income Taxes,” an interpretation of FASB Statement No. 109, “Accounting for Income Taxes” (“FIN 48”). FIN 48 applies to all “tax positions” accounted for under FASB Statement No. 109. FIN 48 refers to “tax positions” as positions taken in a previously-filed tax return or positions expected to be taken in a future tax return that are reflected in measuring current or deferred income tax assets and liabilities reported in the financial statements. FIN 48 clarifies the accounting for income taxes by prescribing a minimum recognition threshold a tax position is required to meet before being recognized in the financial statements. FIN 48 also provides guidance on derecognition, measurement, classification, interest and penalties, accounting in interim periods, disclosure and transition. The adoption of FIN 48 had no effect on the results of operations or financial position.
FAS No. 157--In September 2006, the FASB issued Statement No. 157, “Fair Value Measurements” (“FAS 157”), which establishes a framework for measuring fair value and requires expanded presentations regarding fair value measurements. In February 2008, the FASB issued FASB Staff Position No. FAS 157-2, “Effective Date of FASB Statement No. 157” (“FSP FAS 157-2”), which allows for the deferral of the adoption date of FAS 157 for all nonfinancial assets and nonfinancial liabilities, except those that are recognized or presented at fair value in the financial statements on a recurring basis. We have elected to defer the adoption of FAS 157 for the assets and liabilities within the scope of FSP FAS 157-2. The effective provisions of FAS 157, adopted January 1, 2008, are included in Note R, “Fair Value Measurements.” The adoption of FAS 157 for those assets and liabilities within the scope of FSP FAS 157-2 is effective for us beginning January 1, 2009.
FAS No. 159--In February 2007, the FASB issued Statement No. 159, “The Fair Value Option for Financial Assets and Financial Liabilities–Including an amendment of FASB Statement No. 115” (“FAS 159”). FAS 159 permits entities to choose, at specified election dates, to measure eligible financial assets and liabilities at fair value. FAS 159 requires unrealized gains and losses on items for which the fair value option is elected to be reported in earnings at each subsequent reporting date. This statement was effective for us on January 1, 2008. We did not elect to apply the fair value option to any of our outstanding instruments and, therefore, FAS 159 did not have an impact on our consolidated financial statements.
New Accounting Standards--Recently Issued, But Not Yet Adopted
FAS No. 161--In March 2008, the FASB issued FAS 161, “Disclosures about Derivative Instruments and Hedging Activities-an amendment of FASB Statement 133” (“FAS 161”). FAS 161 requires entities to provide enhanced reporting relating to: (a) how and why an entity uses derivative instruments; (b) how derivative instruments and related hedge items are accounted for under FAS 133, “Accounting for Derivative Instruments and Hedging Activities” (“FAS 133”) and its related interpretations; and (c) how derivative instruments and related hedged items affect an entity’s financial position, financial performance, and cash flows. FAS 161 must be applied prospectively to all derivative instruments and nonderivative instruments that are designated and qualify as hedging instruments and related hedged items accounted for under FAS 133 for all financial statements issued for fiscal years and interim periods beginning after November 15, 2008, which for us begins with our 2009 calendar year, with early application encouraged. The adoption of FAS 161 will not have a material effect on our financial position, results of operation or cash flows.
FAS No. 141R--In December 2007, the FASB issued Statement No. 141 (revised 2007), “Business Combinations” (“FAS 141R”), which replaces FAS No. 141, “Business Combinations.” FAS 141R retains the underlying concepts of FAS 141 in that all business combinations are still required to be accounted for at fair value under the acquisition method of accounting but FAS 141R changed the method of applying the acquisition method in a number of significant aspects. FAS 141R is to be applied prospectively to business combinations for which the acquisition date is on or after January 1, 2009, except as it relates to certain income tax accounting matters. We expect FAS 141R will have an impact on our accounting for future business combinations once adopted, but the effect is dependent upon the acquisitions that are made in the future.
FSP FAS No. 142-3--In April 2008, the FASB issued FASB Staff Position No. 142-3, “Determination of the Useful Life of Intangible Assets” (“FSP FAS 142-3”), which amends the factors that should be considered in developing renewal or extension assumptions used to determine the useful life of a recognized intangible asset under FAS 142, “Goodwill and Other Intangible Assets.” Early adoption is not permitted. We are required to adopt FSP FAS 142-3 prospectively for any intangibles acquired on or after January 1, 2009. The adoption of FSP FAS 142-3 will not have a material effect on our financial position, results of operation or cash flows.
FSP FAS No. 132R-1--In December 2008, the FASB issued FASB Staff Position No.132 (R)-1, “Employers’ Disclosures about Pensions and Other Postretirement Benefits” (“FSP FAS 132R-1”). FSP FAS 132R-1 requires enhanced information about the plan assets of a Company’s defined benefit pension and other postretirement plans. The enhanced information required by this FSP is intended to provide users of financial statements with a greater understanding of: (a) how investment allocation decisions are made, including the factors that are pertinent to an understanding of investment policies and strategies; (b) the major categories of plan assets; (c) the inputs and valuation techniques used to measure the fair value of plan assets; (d) the effect of fair value measurements using significant unobservable inputs (referred to as Level 3 inputs) on changes in plan assets for the period; and (e) significant concentrations of risk within plan assets. This FSP is effective for us for the year ending December 31, 2009.
CRITICAL ACCOUNTING POLICIES AND ESTIMATES
Our consolidated financial statements are prepared in accordance with accounting principles generally accepted in the United States (“GAAP”). The preparation of these financial statements requires the use of estimates, judgments and assumptions that affect the reported amounts of assets and liabilities at the date of the financial statements and the reported amounts of revenues and expenses during the periods presented.
On an ongoing basis, we evaluate our estimates and assumptions, including those related to accounts receivable, specifically those receivables under contractual arrangements primarily arising from Utility Services customers; allowance for doubtful accounts; and self-insurance accruals. We base our estimates on historical experience and on various other factors that we believe to be reasonable under the circumstances, the results of which form the basis for making judgments about the carrying values of assets and liabilities that are not readily apparent from other sources. Actual results could differ from these estimates.
We believe the following are our “critical accounting policies and estimates”--those most important to the financial presentations and those that require the most difficult, subjective or complex judgments.
Revenue Recognition--Revenues from Residential and Commercial Services are recognized as the services are provided and amounts are determined to be collectible. Revenues from contractual arrangements, primarily with Utility Services customers, are recognized based on costs incurred to total estimated contract costs. Changes in estimates and assumptions related to total estimated contract costs may have a material effect on the amounts reported as receivables arising from contractual arrangements and the corresponding amounts of revenues and profit.
Utility Services Customers--We generate a significant portion of revenues and corresponding accounts receivable from our Utility Services customers in the utility industry. One Utility Services customer, PG&E, approximated 11% of revenues during 2008, 10% during 2007 and 9% during 2006. Adverse conditions in the utility industry or individual utility customer operations may affect the collectibility of our receivables or our ability to generate ongoing revenues.
Allowance for Doubtful Accounts--In determining the allowance for doubtful accounts, we evaluate the collectibility of our accounts receivable based on a combination of factors. In circumstances where we are aware of a specific customer’s inability to meet its financial obligations to us (e.g., bankruptcy filings), we record a specific allowance for doubtful accounts against amounts due to reduce the net recognized receivable to the amount we reasonably believe will be collected. For all other customers, we recognize allowances for doubtful accounts based on the length of time the receivables are past due. If circumstances change (e.g., unexpected material adverse changes in a major customer’s ability to meet its financial obligation to us or higher than expected customer defaults), our estimates of the recoverability of amounts could differ from the actual amounts recovered.
Self-Insurance Accruals--We are generally self-insured for losses and liabilities related primarily to workers’ compensation, vehicle liability and general liability claims. We use commercial insurance as a risk-reduction strategy to minimize catastrophic losses. We accrue ultimate losses based upon estimates of the aggregate liability for claims incurred using certain actuarial assumptions followed in the insurance industry and based on our specific experience.
Our self-insurance accruals include claims for which the ultimate losses will develop over a period of years. Accordingly, our estimates of ultimate losses can change as claims mature. Our accruals also are affected by changes in the number of new claims incurred and claim severity. The methodology for estimating ultimate losses and the total cost of claims were determined by third-party consulting actuaries; the resulting accruals are continually reviewed by us, and any adjustments arising from changes in estimates are reflected in income.
Our self-insurance accruals are based on estimates and, while we believe that the amounts accrued are adequate, the ultimate claims may be in excess of or less than the amounts provided.
MARKET RISK INFORMATION
In the normal course of business, we are exposed to market risk related to changes in interest rates and changes in foreign currency exchange rates. We do not hold or issue derivative financial instruments for trading or speculative purposes.
Interest Rate Risk
We are exposed to market risk related to changes in interest rates on long-term debt obligations. The interest rates on substantially all of our long-term debt outstanding are variable. We have entered into interest rate contracts -- derivative financial instruments with the objective of altering interest rate exposures related to variable debt.
The following table provides information, as of December 31, 2008, about our debt obligations and interest rate contract. For debt obligations, the table presents principal cash flows, weighted-average interest rates by expected maturity dates and fair values. For the interest rate contracts, the table presents the underlying face (notional) amount, weighted-average interest rate by contractual maturity dates and the fair value to settle the contract at December 31, 2008. Weighted-average interest rates used for variable rate obligations are based on rates as derived from published spot rates, in effect as at December 31, 2008.
| | | | | | | | | | | | | | | | | | | | | | | | Fair Value | |
| | | Expected Maturity Date | | | | | | | | | December 31, | |
| | | 2009 | | | 2010 | | | 2011 | | | 2012 | | | 2013 | | | Thereafter | | | Total | | | 2008 | |
| Liabilities | | | | | | | | | | | | | | | | | | | | | | | | |
| Long-term debt: | | | | | | | | | | | | | | | | | | | | | | | | |
| Fixed rate | | $ | 3,744 | | | $ | 154 | | | $ | 155 | | | $ | 100 | | | $ | 100 | | | $ | - | | | $ | 4,253 | | | $ | 4,301 | |
| Average interest rate | | | 5.2% | | | | 7.8% | | | | 7.8% | | | | - | | | | - | | | | | | | | | | | | | |
| | | | | | | | | | | | | | | | | | | | | | | | | | | | | | | | | |
| | | | | | | | | | | | | | | | | | | | | | | | | | | | | | | | | |
| Variable rate | | $ | 3,620 | | | $ | 3,311 | | | $ | 53,618 | | | $ | 1,000 | | | $ | 1,000 | | | $ | 750 | | | $ | 63,299 | | | $ | 63,299 | |
| Average interest rate | | | 2.2% | | | | 2.9% | | | | 3.5% | | | | 3.8% | | | | 4.0% | | | | 4.3% | | | | | | | | | |
| | | | | | | | | | | | | | | | | | | | | | | | | | | | | | | | | |
| Interest rate derivative instruments | | | | | | | | | | | | | | | | | | | | | | | | | | | | | | | | |
| Interest rate contracts: | | | | | | | | | | | | | | | | | | | | | | | | | | | | | | | | |
| Pay fixed, notional amount | | $ | - | | | $ | - | | | $ | 10,000 | | | $ | 10,000 | | | $ | - | | | $ | - | | | $ | 20,000 | | | $ | (1,704 | ) |
| Average pay rate | | | | | | | | | | | 3.42% | | | | 5.15% | | | | | | | | | | | | | | | | | |
| Average receive rate | | | | | | | | | | | 2.47% | | | | 4.18% | | | | | | | | | | | | | | | | | |
| | | | | | | | | | | | | | | | | | | | | | | | | | | | | | | | | |
Interest rates, as of December 31, 2008, on the variable-rate debt ranged from 2.1% to 3.9%.
The interest rate contracts each have an underlying face (notional) amount of $10,000, which is used to calculate the cash flow to be exchanged and does not represent the exposure to credit loss. If we were to have settled the contracts at December 31, 2008 (fair value), we would have paid $1,704.
Foreign Currency Rate Risk
We are exposed to market risk related to foreign currency exchange rate risk resulting from our operations in Canada, where we provide a comprehensive range of horticultural services.
Our financial results could be affected by factors such as changes in the foreign currency exchange rate or differing economic conditions in the Canadian markets as compared with the markets for our services in the United States. Our earnings are affected by translation exposures from currency fluctuations in the value of the U.S. dollar as compared to the Canadian dollar. Similarly, the Canadian dollar-denominated assets and liabilities may result in financial exposure as to the timing of transactions and the net asset / liability position of our Canadian operations.
For the year ended December 31, 2008, the result of a hypothetical 10% uniform change in the value of the U.S. dollar as compared with the Canadian dollar would not have a material effect on our results of operations or our financial position. Our sensitivity analysis of the effects of changes in foreign currency exchange rates does not factor in a potential change in sales levels or local currency prices.
Impact of Inflation
The impact of inflation on the results of operations has not been significant in recent years.
Item 7A. Quantitative and Qualitative Disclosures About Market Risk.
The information set forth in “Market Risk Information” under Item 7. “Management’s Discussion and Analysis of Financial Condition and Results of Operations” is incorporated herein by reference.
Item 8. Financial Statements and Supplementary Data.
Our consolidated financial statements are attached hereto and listed on page F-1 of this annual report.
Item 9. Changes in and Disagreements with Accountants on Accounting and Financial Disclosure.
None.
(a) Management’s Discussion of Controls Over Financial Reporting
Our management is responsible for establishing and maintaining adequate internal control over financial reporting. Our internal control framework and processes were designed to provide reasonable assurance to management and the Board of Directors that our financial reporting is reliable and that our consolidated financial statements for external purposes have been prepared in accordance with accounting principles generally accepted in the United States.
Our management recognizes its responsibility for fostering a strong ethical climate so that our affairs are conducted according to the highest standards of personal and corporate conduct.
Our internal controls over financial reporting include policies and procedures that:
| § | provide for the maintenance of records that, in reasonable detail, accurately and fairly reflect our business transactions; |
| § | provide reasonable assurance that transactions are recorded properly to allow for the preparation of financial statements in accordance with GAAP; and |
| § | provide reasonable assurance that the unauthorized acquisition, use, or disposition of our assets will be prevented, or at the minimum, detected in a timely manner. |
We maintain a dynamic system of internal controls and processes--including internal controls over financial reporting--designed to ensure reliable financial recordkeeping, transparent financial reporting and protection of physical and intellectual property.
No system of internal control over financial reporting can provide absolute guarantees, but only reasonable assurances of the prevention or detection of misstatements. Our processes, however, contain self-monitoring mechanisms, and actions will be taken to correct deficiencies as they are identified.
Our management assessed the effectiveness of our internal control over financial reporting and concluded that, as of December 31, 2008, such internal control is effective. In making this assessment, management used the criteria set forth by the Committee of Sponsoring Organizations of the Treadway Commission (“COSO”) in “Internal Control--Integrated Framework.” To comply with the requirements of Section 404 of the Sarbanes-Oxley Act of 2002, we designed and implemented a structured and comprehensive compliance process to evaluate our internal control over financial reporting across the enterprise.
In addition, we maintain a testing program that assesses the effectiveness of internal control over financial reporting, including testing of the five COSO elements, and recommend improvements.
Our independent auditor, Ernst & Young LLP, with direct access to our Board of Directors through our Audit Committee, has audited the consolidated financial statements prepared by us. Their report on the consolidated financial statements is included elsewhere herein.
(b) Management’s Evaluation of Disclosure Controls and Procedures
As of the end of the period covered by this Form 10-K, we carried out an evaluation, under the supervision and with the participation of our management, including our Chief Executive Officer and Chief Financial Officer, of the effectiveness of the design and operation of our disclosure controls and procedures (as defined in Rule 13a-15(e) under the Securities Exchange Act of 1934). Based on that evaluation, our Chief Executive Officer and Chief Financial Officer concluded that the design and operation of our disclosure controls and procedures were effective as of the end of the period covered by this Form 10-K in ensuring that information required to be disclosed in the reports that we file or submit under the Securities Exchange Act of 1934 is recorded, processed, summarized and reported within the time periods specified in the SEC’s rules and forms and is accumulated and communicated to our management, including our Chief Executive Officer and our Chief Financial Officer, as appropriate to allow timely decisions regarding required disclosure.
(c) Management’s Annual Report on Internal Control Over Financial Reporting
Our management is responsible for establishing and maintaining adequate internal control over financial reporting. Under the supervision and with the participation of our management, including our Chief Executive Officer and Chief Financial Officer, we conducted an evaluation of the effectiveness of our internal control over financial reporting as of December 31, 2008 based on the framework in “Internal Control--Integrated Framework” issued by the Committee of Sponsoring Organizations of the Treadway Commission (“COSO”). Based on that evaluation, our management concluded that our internal control over financial reporting was effective as of December 31, 2008.
Our independent auditor, Ernst & Young LLP, an independent registered public accounting firm, has issued an audit report on our internal control over financial reporting, which is included in this report.
| /s/ Karl J. Warnke | | /s/ David E. Adante | | /s/ Nicholas R. Sucic |
President and Chief Executive Officer | | Executive Vice President, Chief Financial Officer and Secretary | | Vice President and Controller |
Kent, Ohio
March 10, 2009
(d) Changes in Internal Control Over Financial Reporting
There have been no significant changes in our internal control over financial reporting or in other factors that have materially affected or are reasonably likely to materially affect these internal controls over financial reporting subsequent to the date we carried out our evaluation.
(e) Report of Independent Registered Public Accounting Firm
The Board of Directors and Shareholders of
The Davey Tree Expert Company
We have audited The Davey Tree Expert Company’s internal control over financial reporting as of December 31, 2008, based on criteria established in Internal Control—Integrated Framework issued by the Committee of Sponsoring Organizations of the Treadway Commission (the COSO criteria). The Davey Tree Expert Company’s management is responsible for maintaining effective internal control over financial reporting, and for its assessment of the effectiveness of internal control over financial reporting included in the accompanying Management’s Annual Report on Internal Control Over Financial Reporting. Our responsibility is to express an opinion on the company’s internal control over financial reporting based on our audit.
We conducted our audit in accordance with the standards of the Public Company Accounting Oversight Board (United States). Those standards require that we plan and perform the audit to obtain reasonable assurance about whether effective internal control over financial reporting was maintained in all material respects. Our audit included obtaining an understanding of internal control over financial reporting, assessing the risk that a material weakness exists, testing and evaluating the design and operating effectiveness of internal control based on the assessed risk, and performing such other procedures as we considered necessary in the circumstances. We believe that our audit provides a reasonable basis for our opinion.
A company’s internal control over financial reporting is a process designed to provide reasonable assurance regarding the reliability of financial reporting and the preparation of financial statements for external purposes in accordance with generally accepted accounting principles. A company’s internal control over financial reporting includes those policies and procedures that (1) pertain to the maintenance of records that, in reasonable detail, accurately and fairly reflect the transactions and dispositions of the assets of the company; (2) provide reasonable assurance that transactions are recorded as necessary to permit preparation of financial statements in accordance with generally accepted accounting principles, and that receipts and expenditures of the company are being made only in accordance with authorizations of management and directors of the company; and (3) provide reasonable assurance regarding prevention or timely detection of unauthorized acquisition, use or disposition of the company’s assets that could have a material effect on the financial statements.
Because of its inherent limitations, internal control over financial reporting may not prevent or detect misstatements. Also, projections of any evaluation of effectiveness to future periods are subject to the risk that controls may become inadequate because of changes in conditions, or that the degree of compliance with the policies or procedures may deteriorate.
In our opinion, The Davey Tree Expert Company maintained, in all material respects, effective internal control over financial reporting as of December 31, 2008, based on the COSO criteria.
We also have audited, in accordance with the standards of the Public Company Accounting Oversight Board (United States), the consolidated balance sheets of The Davey Tree Expert Company as of December 31, 2008 and 2007, and the related consolidated statements of operations, shareholders' equity, and cash flows for each of the three years in the period ended December 31, 2008 of The Davey Tree Expert Company and our report dated March 12, 2009 expressed an unqualified opinion thereon.
/s/ Ernst & Young LLP
Akron, Ohio
March 12, 2009
None.
PART III
Item 10. Directors, Executive Officers and Corporate Governance.
Information about our executive officers is in the section "Executive Officers of the Registrant" in Part I, Item 4A of this report.
Information about our directors is in the section "Election of Directors" of our 2009 Proxy Statement, which is incorporated into this report by reference.
Information about our audit committee and our audit committee financial experts is in the section “Committees of the Board of Directors; Shareholder Nominations; Attendance” of our 2009 Proxy Statement, which is incorporated into this report by reference.
Information required by Item 405 of Regulation S-K is in the section “Section 16(a) Beneficial Ownership Reporting Compliance” of our 2009 Proxy Statement, which is incorporated into this report by reference.
We have adopted a Code of Ethics for Financial Matters that applies to our principal executive officer, principal financial officer and principal accounting officer, or persons performing similar functions. That Code is available on our website or upon request, as described in this report in Item 1. “Business - Access to Company Information.” We intend to disclose, on our website, any amendments to, or waiver of, any provision of that Code that would otherwise be required to be disclosed under the rules of the Securities and Exchange Commission.
Information about executive and director compensation is in the sections “Compensation Discussion and Analysis,” "Compensation of Executive Officers" and "Compensation of Directors" of our 2009 Proxy Statement, which are incorporated into this report by reference.
Item 12. Security Ownership of Certain Beneficial Owners and Management and Related Stockholder Matters.
Information about ownership of our common shares by certain persons is in the section "Ownership of Common Shares" of our 2009 Proxy Statement, which is incorporated into this report by reference. Information about our securities authorized for issuance under equity compensation plans is in the section “Equity Compensation Plans Information” of our 2009 Proxy Statement, which is incorporated into this report by reference.
Item 13. Certain Relationships and Related Transactions, and Director Independence.
Information about certain transactions between us and our affiliates and certain other persons and the independence of directors is in the section “Corporate Governance” of our 2009 Proxy Statement, which is incorporated into this report by reference.
Item 14. Principal Accountant Fees and Services.
Information about our principal accountant’s fees and services is in the section “Independent Auditors” of our 2008 Proxy Statement, which is incorporated into this report by reference.
PART IV
Item 15. Exhibits and Financial Statement Schedules.
(a) (1) and (a) (2) Financial Statements and Schedules.
The response to this portion of Item 15 is set forth on page F-1 of this report.
(b) Exhibits.
The exhibits to this Form 10-K are submitted as a separate section of this report. See Exhibit Index.
|
| |
Pursuant to the requirements of Section 13 or 15(d) of the Securities Exchange Act of 1934, the registrant has duly caused this report to be signed on its behalf by the undersigned, thereunto duly authorized on March 13, 2009. |
| | | |
| | | THE DAVEY TREE EXPERT COMPANY |
| | | |
| | | |
| | | By: /s/ Karl J. Warnke |
| | | Karl J. Warnke, President and |
| | | Chief Executive Officer |
| | | |
| Pursuant to the requirements of the Securities Exchange Act of 1934, this report has been signed below by the following persons on behalf of the registrant and in the capacities indicated on March 13, 2009. |
| | | |
| | | |
| | | |
| /s/ R. Douglas Cowan | | /s/ Robert A. Stefanko |
| R. Douglas Cowan, Director, | | Robert A. Stefanko, Director |
| Chairman of the Board | | |
| | | |
| | | |
| | | /s/ John E. Warfel |
| /s/ J. Dawson Cunningham | | John E. Warfel, Director |
| J. Dawson Cunningham, Director | | |
| | | |
| | | |
| | | /s/ Karl J. Warnke |
| /s/ William J. Ginn | | Karl J. Warnke, Director, |
| William J. Ginn, Director | | President and Chief Executive Officer |
| | | (Principal Executive Officer) |
| | | |
| | | |
| /s/ Douglas K. Hall | | |
| Douglas K. Hall, Director | | /s/ David E. Adante |
| | | David E. Adante, Executive Vice President, |
| | | Chief Financial Officer and Secretary |
| | | (Principal Financial Officer) |
| /s/ Sandra W. Harbrecht | | |
| Sandra W. Harbrecht, Director | | |
| | | |
| | | /s/ Nicholas R. Sucic |
| | | Nicholas R. Sucic, Vice President and Controller |
| /s/ William L. Phipps | | (Principal Accounting Officer) |
| William L. Phipps, Director | | |
|
| | | | | |
| Exhibit No. | | Description | | |
| | | | | |
| 3.1 | | 2003 Amended Articles of Incorporation (Incorporated by reference to Exhibit 3.3 to the Registrant’s Quarterly Report on Form 10-Q for the quarter ended September 27, 2003). | | |
| | | | | |
| 3.2 | | 1987 Amended and Restated Regulations of The Davey Tree Expert Company (Incorporated by reference to Exhibit 3.2 to the Registrant’s Annual Report on Form 10-K for the year ended December 31, 2006). | | |
| | | | | |
| 10.1 | | Amended and Restated Credit Agreement among the Company, as borrower, Various Lending Institutions, as banks, KeyBank National Association, as lead arranger, syndication agent and administrative agent, and National City Bank, as documentation agent, dated as of November 21, 2006 (Incorporated by reference to Exhibit 10.1 to the Registrant’s Current Report on Form 8-K dated November 22, 2006). | | |
| | | | | |
| 10.2 | | Acknowledgment of Commitment Increase dated as of May 15, 2008, made to the Amended and Restated Credit Agreement among the Company, as borrower, Various Lending Institutions, as banks, and KeyBank National Association, as administrative agent for the banks, dated as of November 21, 2006 (Incorporated by reference to Exhibit 10.1 to the Registrant’s Quarterly Report on Form 10-Q for the quarter ended June 28, 2008). | | |
| | | | | |
| 10.3 | | 1994 Omnibus Stock Plan (Incorporated by reference to Exhibit 10.1 to the Registrant’s Annual Report on Form 10-K for the year ended December 31, 2004). | | |
| | | | | |
| 10.4 | | 2004 Omnibus Stock Plan (Incorporated by reference to Exhibit 10.1 to the Registrant’s Quarterly Report on Form 10-Q for the quarter ended July 3, 2004). | | |
| | | | | |
| 10.5 | | 2004 401KSOP Match Restoration Plan (Incorporated by reference to Exhibit 10.2 to the Registrant’s Quarterly Report on Form 10-Q for the quarter ended July 3, 2004). | | |
| | | | | |
| 10.6 | | Supplemental Executive Retirement Plan (Incorporated by reference to Exhibit 10.3 to the Registrant’s Quarterly Report on Form 10-Q for the quarter ended July 3, 2004). | | |
| | | | | |
| 10.7 | | Retirement Benefit Restoration Plan (Incorporated by reference to Exhibit 10.4 to the Registrant’s Quarterly Report on Form 10-Q for the quarter ended July 3, 2004). | | |
| | | | | |
| 10.8 | | The Davey Tree Expert Company Board of Directors Revised Deferred Compensation Plan (Incorporated by reference to Exhibit 10.9 to the Registrant’s Annual Report on Form 10-K for the year ended December 31, 2004). | | |
| | | | | |
| 10.9 | | Agreement, dated as of December 8, 2006, between the Company and R. Douglas Cowan (Incorporated by reference to Exhibit 10.8 to the Registrant’s Annual Report on Form 10-K for the year ended December 31, 2006). | | |
| | | | | |
| 21 | | Subsidiaries of the Registrant. | | Filed Herewith |
| | | | | |
| 23 | | Consent of Ernst & Young LLP, Independent Registered Public Accounting Firm. | | Filed Herewith |
| | | | | |
| 31.1 | | Certification of Chief Executive Officer pursuant to Section 302 of the Sarbanes-Oxley Act of 2002. | | Filed Herewith |
| | | | | |
| 31.2 | | Certification of Chief Financial Officer pursuant to Section 302 of the Sarbanes-Oxley Act of 2002. | | Filed Herewith |
| | | | | |
| 32.1 | | Certification of Chief Executive Officer pursuant to Section 906 of the Sarbanes-Oxley Act of 2002, 18 U.S.C. Section 1350. | | Furnished Herewith |
| | | | | |
| 32.2 | | Certification of Chief Financial Officer pursuant to Section 906 of the Sarbanes-Oxley Act of 2002, 18 U.S.C. Section 1350. | | Furnished Herewith |
The documents listed as Exhibits 10.3 through 10.9 constitute management contracts or compensatory plans or arrangements.
The Registrant is a party to certain instruments, copies of which will be furnished to the Securities and Exchange Commission upon request, defining the rights of holders of long-term debt.
ANNUAL REPORT ON FORM 10-K
ITEM 8, ITEM 15(a)(1) and (2)
LIST OF FINANCIAL STATEMENTS AND FINANCIAL STATEMENT SCHEDULES
FINANCIAL STATEMENTS AND SUPPLEMENTARY DATA
CERTAIN EXHIBITS
FINANCIAL STATEMENTS SCHEDULES
YEAR ENDED DECEMBER 31, 2008
THE DAVEY TREE EXPERT COMPANY
KENT, OHIO
|
| | |
| FORM 10-K - ITEM 15(a)(1) AND (2) | |
| | |
| THE DAVEY TREE EXPERT COMPANY | |
| | |
| The following consolidated financial statements of The Davey Tree Expert Company are included in Item 8: | |
| | |
| | |
| Audited Consolidated Financial Statements: | |
| | |
| F-2 |
| | |
| F-3 |
| | |
| F-4 |
| | |
| F-5 |
| | |
| F-6 |
| | |
| Notes to Consolidated Financial Statements -- December 31, 2008 | |
| F-7 |
| F-7 |
| F-11 |
| F-12 |
| | |
| F-13 |
| F-15 |
| F-16 |
| F-16 |
| | |
| F-17 |
| F-18 |
| F-19 |
| F-23 |
| | |
| F-28 |
| F-30 |
| F-31 |
| F-31 |
| | |
| F-33 |
| F-33 |
| F-34 |
| | |
| Financial Statement Schedules: | |
| | |
| None | |
| | |
| All schedules for which provision is made in the applicable accounting regulations of the Securities and Exchange Commission are not required under the related instructions or are inapplicable and therefore have been omitted. | |
The Board of Directors and Shareholders of
The Davey Tree Expert Company
We have audited the accompanying consolidated balance sheets of The Davey Tree Expert Company as of December 31, 2008 and 2007, and the related consolidated statements of operations, shareholders' equity, and cash flows for each of the three years in the period ended December 31, 2008. These financial statements are the responsibility of the Company's management. Our responsibility is to express an opinion on these financial statements based on our audits.
We conducted our audits in accordance with the standards of the Public Company Accounting Oversight Board (United States). Those standards require that we plan and perform the audit to obtain reasonable assurance about whether the financial statements are free of material misstatement. An audit includes examining, on a test basis, evidence supporting the amounts and disclosures in the financial statements. An audit also includes assessing the accounting principles used and significant estimates made by management, as well as evaluating the overall financial statement presentation. We believe that our audits provide a reasonable basis for our opinion.
In our opinion, the financial statements referred to above present fairly, in all material respects, the consolidated financial position of The Davey Tree Expert Company at December 31, 2008 and 2007, and the consolidated results of its operations and its cash flows for each of the three years in the period ended December 31, 2008, in conformity with U.S. generally accepted accounting principles.
As discussed in Note B to the consolidated financial statements, “Accounting Policies,” in 2007 the Company adopted the provisions of Financial Accounting Standards Board Interpretation No. 48, Accounting for Uncertainty in Income Taxes an interpretation of FASB Statement No. 109.
We also have audited, in accordance with the standards of the Public Company Accounting Oversight Board (United States), The Davey Tree Expert Company’s internal control over financial reporting as of December 31, 2008, based on criteria established in Internal Control-Integrated Framework issued by the Committee of Sponsoring Organizations of the Treadway Commission and our report dated March 10, 2009 expressed an unqualified opinion thereon.
Akron, Ohio
March 12, 2009
THE DAVEY TREE EXPERT COMPANY
(In thousands, except per share dollar amounts)
| | | December 31, | |
| | | 2008 | | | 2007 | |
| Assets | | | | | | |
| Current assets: | | | | | | |
| Cash | | $ | 3,363 | | | $ | 1,819 | |
| Accounts receivable, net | | | 81,751 | | | | 72,011 | |
| Operating supplies | | | 5,520 | | | | 3,688 | |
| Prepaid expenses | | | 5,391 | | | | 4,607 | |
| Other current assets | | | 15,287 | | | | 9,758 | |
| Total current assets | | | 111,312 | | | | 91,883 | |
| | | | | | | | | |
| Property and equipment: | | | | | | | | |
| Land and land improvements | | | 12,687 | | | | 10,541 | |
| Buildings and leasehold improvements | | | 24,337 | | | | 21,999 | |
| Equipment | | | 348,552 | | | | 307,492 | |
| | | | 385,576 | | | | 340,032 | |
| Less accumulated depreciation | | | 244,563 | | | | 231,793 | |
| | | | 141,013 | | | | 108,239 | |
| | | | | | | | | |
| Other assets | | | 12,026 | | | | 19,797 | |
| Identified intangible assets and goodwill, net | | | 26,651 | | | | 11,730 | |
| | | $ | 291,002 | | | $ | 231,649 | |
| | | | | | | | | |
| Liabilities and shareholders' equity | | | | | | | | |
| Current liabilities: | | | | | | | | |
| Short-term debt | | $ | 8,584 | | | $ | 3,970 | |
| Accounts payable | | | 29,869 | | | | 20,419 | |
| Accrued expenses | | | 29,171 | | | | 26,311 | |
| Self-insurance accruals | | | 22,069 | | | | 20,253 | |
| Current portion of capital lease obligations | | | 816 | | | | 487 | |
| Total current liabilities | | | 90,509 | | | | 71,440 | |
| | | | | | | | | |
| Long-term debt | | | 60,187 | | | | 32,099 | |
| Capital lease obligations | | | 165 | | | | 444 | |
| Self-insurance accruals | | | 34,950 | | | | 28,710 | |
| Other liabilities | | | 10,408 | | | | 4,574 | |
| | | | 196,219 | | | | 137,267 | |
| | | | | | | | | |
| Common shareholders' equity:* | | | | | | | | |
| | | | | | | | | |
Common shares, $1.00 par value, per share; 24,000 shares authorized; 21,457 shares issued and
outstanding as of December 31, 2008 and 2007 | | | 21,457 | | | | 10,728 | |
| Additional paid-in capital | | | 4,848 | | | | 7,953 | |
| Common shares subscribed, unissued | | | 5,850 | | | | 7,571 | |
| Retained earnings | | | 153,464 | | | | 137,132 | |
| Accumulated other comprehensive income (loss) | | | (9,633 | ) | | | 400 | |
| | | | 175,986 | | | | 163,784 | |
| Less: Cost of Common shares held in treasury: | | | | | | | | |
| 6,939 in 2008 and 6,926 in 2007 | | | 80,356 | | | | 67,310 | |
| Common shares subscription receivable | | | 847 | | | | 2,092 | |
| | | | 94,783 | | | | 94,382 | |
| | | $ | 291,002 | | | $ | 231,649 | |
| | | | | | | | | |
| * Adjusted for two-for-one stock split. | | | | | | | | |
| | | | | | | | | |
| See notes to consolidated financial statements. | | | | | | | | |
| | | | | | | | | |
THE DAVEY TREE EXPERT COMPANY
(In thousands, except per share dollar amounts)
| | | Year Ended December 31, | |
| | | 2008 | | | 2007 | | | 2006 | |
| | | | | | | | | | |
| Revenues | | $ | 595,797 | | | $ | 506,138 | | | $ | 467,534 | |
| | | | | | | | | | | | | |
| Costs and expenses: | | | | | | | | | | | | |
| Operating | | | 382,143 | | | | 324,415 | | | | 305,106 | |
| Selling | | | 95,327 | | | | 82,449 | | | | 74,513 | |
| General and administrative | | | 45,607 | | | | 38,476 | | | | 34,126 | |
| Depreciation | | | 34,374 | | | | 28,085 | | | | 26,991 | |
| Amortization of intangible assets | | | 1,482 | | | | 1,148 | | | | 1,291 | |
| Gain on sale of assets, net | | | (992 | ) | | | (515 | ) | | | (309 | ) |
| | | | 557,941 | | | | 474,058 | | | | 441,718 | |
| | | | | | | | | | | | | |
| Income from operations | | | 37,856 | | | | 32,080 | | | | 25,816 | |
| | | | | | | | | | | | | |
| Other income (expense): | | | | | | | | | | | | |
| Interest expense | | | (3,417 | ) | | | (3,422 | ) | | | (2,768 | ) |
| Interest income | | | 220 | | | | 404 | | | | 176 | |
| Other | | | (2,920 | ) | | | (542 | ) | | | (1,301 | ) |
| | | | | | | | | | | | | |
| Income before income taxes | | | 31,739 | | | | 28,520 | | | | 21,923 | |
| | | | | | | | | | | | | |
| Income taxes | | | 12,718 | | | | 10,441 | | | | 7,906 | |
| | | | | | | | | | | | | |
| Net income | | $ | 19,021 | | | $ | 18,079 | | | $ | 14,017 | |
| | | | | | | | | | | | | |
| Share data:* | | | | | | | | | | | | |
| Earnings per share--basic | | $ | 1.21 | | | $ | 1.13 | | | $ | .85 | |
| | | | | | | | | | | | | |
| Earnings per share--diluted | | $ | 1.14 | | | $ | 1.07 | | | $ | .80 | |
| | | | | | | | | | | | | |
| Weighted-average shares outstanding:* | | | | | | | | | | | | |
| Basic | | | 15,784 | | | | 15,992 | | | | 16,474 | |
| | | | | | | | | | | | | |
| Diluted | | | 16,751 | | | | 16,844 | | | | 17,460 | |
| | | | | | | | | | | | | |
| Dividends declared per share* | | $ | .1700 | | | $ | .1625 | | | $ | .1525 | |
| | | | | | | | | | | | | |
| *Adjusted for two-for-one stock split. | | | | | | | | | | | | |
| | | | | | | | | | | | | |
| See notes to consolidated financial statements. | | | | | | | | | | | | |
| THE DAVEY TREE EXPERT COMPANY | |
| |
| (In thousands, except per share data) | |
| | | | | | | | | | | | | | | | | | | |
| | | | | | | | | | | | | | | | | | | |
| | | 2008 | | | 2007 | | | 2006 | |
| | | Shares* | | | Amount | | | Shares* | | | Amount | | | Shares* | | | Amount | |
| Common shares | | | | | | | | | | | | | | | | | | |
| At beginning and end of year | | | 21,457 | | | $ | 21,457 | | | | 21,457 | | | $ | 10,728 | | | | 21,457 | | | $ | 10,728 | |
| | | | | | | | | | | | | | | | | | | | | | | | | |
| Additional paid-in capital | | | | | | | | | | | | | | | | | | | | | | | | |
| At beginning of year | | | | | | | 7,953 | | | | | | | | 5,453 | | | | | | | | 6,799 | |
| Shares sold to employees | | | | | | | 3,071 | | | | | | | | 1,563 | | | | | | | | 1,049 | |
| Shares issued in connection with stock split | | | | (10,729 | ) | | | | | | | - | | | | | | | | - | |
| Shares issued in connection with acquisition | | | | 5,254 | | | | | | | | - | | | | | | | | - | |
| Options exercised | | | | | | | (397 | ) | | | | | | | (185 | ) | | | | | | | (3,326 | ) |
| Subscription shares, issued | | | | | | | (1,275 | ) | | | | | | | (396 | ) | | | | | | | (208 | ) |
| Stock-based compensation | | | | | | | 971 | | | | | | | | 1,518 | | | | | | | | 1,139 | |
| At end of year | | | | | | | 4,848 | | | | | | | | 7,953 | | | | | | | | 5,453 | |
| | | | | | | | | | | | | | | | | | | | | | | | | |
| Common shares subscribed, unissued | | | | | | | | | | | | | | | | | | | | | | | | |
| At beginning of year | | | 1,262 | | | | 7,571 | | | | 1,394 | | | | 8,369 | | | | 1,480 | | | | 8,876 | |
| Common shares, issued | | | (287 | ) | | | (1,721 | ) | | | (122 | ) | | | (740 | ) | | | (80 | ) | | | (475 | ) |
| Cancellations | | | - | | | | - | | | | (10 | ) | | | (58 | ) | | | (6 | ) | | | (32 | ) |
| At end of year | | | 975 | | | | 5,850 | | | | 1,262 | | | | 7,571 | | | | 1,394 | | | | 8,369 | |
| | | | | | | | | | | | | | | | | | | | | | | | | |
| Retained earnings | | | | | | | | | | | | | | | | | | | | | | | | |
| At beginning of year | | | | | | | 137,132 | | | | | | | | 121,624 | | | | | | | | 110,119 | |
| Net income | | | | | | | 19,021 | | | | | | | | 18,079 | | | | | | | | 14,017 | |
| Dividends, $ .1525 per share | | | | | | | - | | | | | | | | - | | | | | | | | (2,512 | ) |
| Dividends, $ .1625 per share | | | | | | | - | | | | | | | | (2,571 | ) | | | | | | | - | |
| Dividends, $ .1700 per share | | | | | | | (2,689 | ) | | | | | | | - | | | | | | | | - | |
| At end of year | | | | | | | 153,464 | | | | | | | | 137,132 | | | | | | | | 121,624 | |
| | | | | | | | | | | | | | | | | | | | | | | | | |
| Accumulated other comprehensive income (loss), net of tax | | | | | | | | | | | | | | | | | | | | | | | | |
| At beginning of year | | | | | | | 400 | | | | | | | | (3,025 | ) | | | | | | | 525 | |
| Currency translation adjustment | | | | | | | (3,806 | ) | | | | | | | 2,320 | | | | | | | | (35 | ) |
| Net (loss) gain on interest rate contracts | | | | (715 | ) | | | | | | | (354 | ) | | | | | | | 55 | |
| Net minimum pension liability | | | | | | | - | | | | | | | | - | | | | | | | | 122 | |
| Pension plans -- FAS158 adjustment, net | | | | (5,512 | ) | | | | | | | 1,459 | | | | | | | | (3,692 | ) |
| At end of year | | | | | | | (9,633 | ) | | | | | | | 400 | | | | | | | | (3,025 | ) |
| | | | | | | | | | | | | | | | | | | | | | | | | |
| Common shares held in treasury | | | | | | | | | | | | | | | | | | | | | | | | |
| At beginning of year | | | 6,926 | | | | (67,310 | ) | | | 6,436 | | | | (57,654 | ) | | | 6,456 | | | | (53,753 | ) |
| Shares purchased | | | 1,921 | | | | (28,081 | ) | | | 1,176 | | | | (16,974 | ) | | | 1,284 | | | | (15,062 | ) |
| Shares sold to employees | | | (606 | ) | | | 2,087 | | | | (478 | ) | | | 5,413 | | | | (478 | ) | | | 4,063 | |
| Shares issued in connection with acquisition | | | (930 | ) | | | 9,438 | | | | - | | | | - | | | | - | | | | - | |
| Options exercised | | | (85 | ) | | | 514 | | | | (84 | ) | | | 769 | | | | (746 | ) | | | 6,385 | |
| Subscription shares, issued | | | (287 | ) | | | 2,996 | | | | (124 | ) | | | 1,136 | | | | (80 | ) | | | 713 | |
| At end of year | | | 6,939 | | | | (80,356 | ) | | | 6,926 | | | | (67,310 | ) | | | 6,436 | | | | (57,654 | ) |
| | | | | | | | | | | | | | | | | | | | | | | | | |
| Common shares subscription receivable | | | | | | | | | | | | | | | | | | | | | | | | |
| At beginning of year | | | (1,262 | ) | | | (2,092 | ) | | | (1,394 | ) | | | (3,419 | ) | | | (1,480 | ) | | | (4,741 | ) |
| Payments | | | 287 | | | | 1,245 | | | | 122 | | | | 1,275 | | | | 80 | | | | 1,291 | |
| Cancellations | | | - | | | | - | | | | 10 | | | | 52 | | | | 6 | | | | 31 | |
| At end of year | | | (975 | ) | | | (847 | ) | | | (1,262 | ) | | | (2,092 | ) | | | (1,394 | ) | | | (3,419 | ) |
| | | | | | | | | | | | | | | | | | | | | | | | | |
Common Shareholders' Equity at December 31 | | | 14,518 | | | $ | 94,783 | | | | 14,531 | | | $ | 94,382 | | | | 15,021 | | | $ | 82,076 | |
| | | | | | | | | | | | | | | | | | | | | | | | | |
| Comprehensive Income | | | | | | | | | | | | | | | | | | | | | | | | |
| Net income | | | | | | $ | 19,021 | | | | | | | $ | 18,079 | | | | | | | $ | 14,017 | |
| Net other comprehensive income (loss) | | | | (10,033 | ) | | | | | | | 3,425 | | | | | | | | (142 | ) |
| | | | | | | | | | | | | | | | | | | | | | | | | |
| Total comprehensive income | | | | | | $ | 8,988 | | | | | | | $ | 21,504 | | | | | | | $ | 13,875 | |
| | | | | | | | | | | | | | | | | | | | | | | | | |
| *Adjusted for two-for-one stock split | | | | | | | | | | | | | | | | | | | | | | | | |
| | | | | | | | | | | | | | | | | | | | | | | | | |
| See notes to consolidated financial statements. | | | | | | | | | | | | | | | | | | | | | |
THE DAVEY TREE EXPERT COMPANY
(In thousands)
| | | Year Ended December 31, | |
| | | | | | | | | | |
| | | 2008 | | | 2007 | | | 2006 | |
| Operating activities | | | | | | | | | |
| Net income | | $ | 19,021 | | | $ | 18,079 | | | $ | 14,017 | |
| Adjustments to reconcile net income to net cash provided by operating activities: | | | | | | | | | | | | |
| Depreciation | | | 34,374 | | | | 28,085 | | | | 26,991 | |
| Amortization | | | 1,482 | | | | 1,148 | | | | 1,291 | |
| Gain on sale of property | | | (992 | ) | | | (515 | ) | | | (309 | ) |
| Deferred income taxes | | | 294 | | | | (2,100 | ) | | | (2,444 | ) |
| Other | | | (1,245 | ) | | | 48 | | | | 350 | |
| Changes in operating assets and liabilities: | | | | | | | | | | | | |
| Accounts receivable | | | (1,327 | ) | | | (1,582 | ) | | | (1,544 | ) |
| Accounts payable and accrued expenses | | | 659 | | | | 5,411 | | | | 61 | |
| Self-insurance accruals | | | 3,296 | | | | 6,039 | | | | 5,414 | |
| Other assets, net | | | (279 | ) | | | (2,272 | ) | | | (5,455 | ) |
| | | | 36,262 | | | | 34,262 | | | | 24,355 | |
| | | | | | | | | | | | | |
| Net cash provided by operating activities | | | 55,283 | | | | 52,341 | | | | 38,372 | |
| | | | | | | | | | | | | |
| Investing activities | | | | | | | | | | | | |
| Capital expenditures: | | | | | | | | | | | | |
| Equipment | | | (36,171 | ) | | | (32,670 | ) | | | (31,807 | ) |
| Land and buildings | | | (862 | ) | | | (4,917 | ) | | | (628 | ) |
| Proceeds from sales of property and equipment | | | 1,395 | | | | 1,261 | | | | 513 | |
| Purchases of businesses | | | (15,718 | ) | | | (2,475 | ) | | | (2,497 | ) |
| Net cash used in investing activities | | | (51,356 | ) | | | (38,801 | ) | | | (34,419 | ) |
| | | | | | | | | | | | | |
| | | | | | | | | | | | | |
| Financing activities | | | | | | | | | | | | |
| Revolving credit facility proceeds (payments), net | | | 24,650 | | | | 300 | | | | 2,900 | |
| Borrowings (payments) of notes payable | | | 2,348 | | | | 49 | | | | 2,469 | |
| Payments of long-term debt and capital leases | | | (5,129 | ) | | | (3,455 | ) | | | (2,583 | ) |
| Purchase of common shares for treasury | | | (28,081 | ) | | | (16,974 | ) | | | (15,062 | ) |
| Sale of common shares from treasury | | | 5,274 | | | | 7,554 | | | | 8,200 | |
| Cash received on common share subscriptions | | | 1,245 | | | | 1,275 | | | | 1,291 | |
| Dividends | | | (2,690 | ) | | | (2,571 | ) | | | (2,512 | ) |
| Net cash used in financing activities | | | (2,383 | ) | | | (13,822 | ) | | | (5,297 | ) |
| | | | | | | | | | | | | |
| | | | | | | | | | | | | |
| Increase (Decrease) in cash | | | 1,544 | | | | (282 | ) | | | (1,344 | ) |
| Cash, beginning of year | | | 1,819 | | | | 2,101 | | | | 3,445 | |
| Cash, end of year | | $ | 3,363 | | | $ | 1,819 | | | $ | 2,101 | |
| | | | | | | | | | | | | |
| See notes to consolidated financial statements. | | | | | | | | | | | | |
The Davey Tree Expert Company
Notes to Consolidated Financial Statements
December 31, 2008
(In thousands, except share data)
We provide a wide range of horticultural services to residential, commercial, utility and institutional customers throughout the United States and Canada.
Residential and Commercial Services provides for the treatment, preservation, maintenance, cultivation, planting and removal of trees, shrubs and other plant life; its services also include the practice of landscaping, tree surgery, tree feeding, and tree spraying, as well as the application of fertilizer, herbicides and insecticides.
Utility Services is principally engaged in the practice of line clearing for public utilities, including the clearing of tree growth from power lines, clearance of rights-of-way and chemical brush control.
Resource Group provides services related to natural resource management and consulting, forestry research and development, and environmental planning and also maintains research, technical support and laboratory diagnostic facilities.
“We,” “us,” “our,” “Davey,” “Davey Tree” and the “Company” means The Davey Tree Expert Company and its subsidiaries, unless the context indicates otherwise.
Principles of Consolidation and Basis of Presentation--The consolidated financial statements include the accounts of Davey Tree and our wholly-owned subsidiaries and were prepared in accordance with accounting principles generally accepted in the United States of America (“U.S. GAAP”). All significant intercompany accounts and transactions have been eliminated.
Common Share Information--All common share and per share data have been retroactively adjusted to recognize a two-for-one stock split of our common shares effective October 1, 2008.
Use of Estimates in Financial Statement Preparation--The preparation of financial statements in accordance with U.S. GAAP requires management to make estimates and assumptions that affect reported amounts. Estimates are used for, but not limited to, accounts receivable valuation, depreciable lives of fixed assets, valuation of acquired intangibles and goodwill and self-insurance accruals. Actual results could differ from those estimates.
Property and Equipment--Property and equipment are stated at cost. Repair and maintenance costs are expensed as incurred. Depreciation is computed for financial reporting purposes by the straight-line method for land improvements, building and leasehold improvements and by the declining method for equipment, based on the estimated useful lives of the assets, as follows:
| Land improvements | 5 to 20 years |
| Buildings | 5 to 20 years |
| Equipment | 3 to 10 years |
| Leasehold improvements | Shorter of lease term or estimated useful life; ranging from 5 to 20 years |
The amortization of assets acquired under capital leases is included in depreciation expense.
The Davey Tree Expert Company
Notes to Consolidated Financial Statements--(Continued)
December 31, 2008
(In thousands, except share data)
B. Accounting Policies (continued)
Long-Lived Assets--We assess potential impairment to our long-lived assets, other than goodwill, when there is evidence that events or changes in circumstances have made recovery of the asset’s carrying value unlikely and the carrying amount of the asset exceeds the estimated future undiscounted cash flow. In the event the assessment indicates that the carrying amounts may not be recoverable, an impairment loss would be recognized to reduce the asset’s carrying amount to its estimated fair value based on the present value of the estimated future cash flows.
Intangible Assets--Intangible assets with finite lives, primarily customer lists, noncompete agreements and tradenames, are amortized by the straight-line method based on their estimated useful lives, ranging from one to ten years.
Goodwill--Goodwill is recorded when the cost of acquired businesses exceeds the fair value of the identified net assets acquired. Goodwill is not amortized, but tested for impairment annually or when events or circumstances indicated that impairment may have occurred. Annually, we perform the impairment tests for goodwill during the fourth quarter. Impairment of goodwill is tested at the reporting-unit level, which for us are also our business segments. Impairment of goodwill is tested by comparing the reporting unit’s carrying amount, including goodwill, to the fair value of the reporting unit. The fair values of the reporting units are estimated using discounted projected cash flows. If the carrying amount of the reporting unit exceeds its fair value, goodwill is considered impaired and a second step is performed to measure the amount of impairment loss, if any. We conducted our annual impairment tests and determined there to be no impairment during 2008 or 2007. There were no events or circumstances from the date of our assessment through December 31, 2008 that would impact this conclusion.
Self-Insurance Accruals--We are generally self-insured for losses and liabilities related primarily to workers’ compensation, vehicle liability and general liability claims. We use commercial insurance as a risk-reduction strategy to minimize catastrophic losses. Ultimate losses are accrued based upon estimates of the aggregate liability for claims incurred using certain actuarial assumptions followed in the insurance industry and based on Company-specific experience.
The self-insurance accruals include claims for which the ultimate losses will develop over a period of years. Accordingly, the estimates of ultimate losses can change as claims mature. The accruals also are affected by changes in the number of new claims incurred and claim severity. The methods for estimating the ultimate losses and the total cost of claims were determined by external consulting actuaries; the resulting accruals are continually reviewed by management, and any adjustments arising from changes in estimates are reflected in income. The self-insurance accruals are based on estimates, and while management believes that the amounts accrued are adequate and not excessive, the ultimate claims may be in excess of or less than the amounts provided.
Stock-Based Compensation--Effective January 1, 2006, we adopted Financial Accounting Standards Board (“FASB”) Statement of Financial Accounting Standards No. 123 (revised), “Share-Based Payment” (“FAS 123R”). FAS 123R requires all share-based payments to employees, including grants of stock options, to be recognized as compensation costs in the financial statements based on their estimated fair values over the requisite employee service period. Stock-based compensation is discussed in Note K, “Stock-Based Compensation.”
Defined Benefit Pension Plans--On December 31, 2006, we adopted FASB Statement No. 158, “Employers’ Accounting for Defined Benefit Pension and Other Postretirement Plans” (“FAS 158”)—an amendment of FASB Statements No. 87, 88, 106 and 132(R). The adoption of FAS 158 had no effect on our consolidated statement of operations for the year ended December 31, 2006, or for any prior period presented, and it will not affect our operating results in future periods. As a result of adopting FAS 158, the funded status of the defined benefit pension plans was recognized in the balance sheet as of December 31, 2006 with subsequent changes in the funded status recognized in comprehensive income (loss) in the years in which they occur. Our defined benefit pension plans are discussed in Note L, “Defined Benefit Pension Plans.”
The Davey Tree Expert Company
Notes to Consolidated Financial Statements--(Continued)
December 31, 2008
(In thousands, except share data)
B. Accounting Policies (continued)
Income Taxes--We compute taxes on income in accordance with the tax rules and regulations where the income is earned. The income tax rates imposed by these taxing authorities vary. Taxable income may differ from pretax income for financial reporting purposes. To the extent differences are due to revenue and expense items reported in one period for tax purposes and in another period for financial reporting purposes, provision for deferred taxes is made. Changes in tax rates and laws are reflected in income in the period when such changes are enacted.
Earnings Per Share--Basic earnings per share is determined by dividing the income available to common shareholders by the weighted-average number of common shares outstanding. Diluted earnings per share is computed similar to basic earnings per share except that the weighted-average number of shares is increased to include the effect of stock awards that were granted and outstanding during the period and the assumed exercise of stock subscription rights.
Revenue Recognition--Revenues from residential and commercial services are recognized as the services are provided and amounts are determined to be collectible. Revenues from contractual arrangements, primarily with utility services customers, are recognized based on costs incurred to total estimated contract costs. During the performance of such contracts, estimated final contract prices and costs are periodically reviewed and revisions are made, as required, to the revenue recognized. On cost-plus-fee contracts, revenue is recognized to the extent of costs incurred plus a proportionate amount of fees earned, and on time-and-material contracts, revenue is recognized to the extent of billable rates times hours worked, plus material and other reimbursable costs incurred. Revisions arise in the normal course of providing services to utility services customers and generally relate to changes in contract specifications and cost allowability. Such revisions are recorded when realization is probable and can be reliably estimated.
Concentration of Credit Risk--Credit risk represents the accounting loss that would be recognized if the counterparties failed to perform as contracted. The principal financial instruments subject to credit risk follow:
Cash and Interest Rate Contracts: To limit our exposure, we transact our business and maintain interest rate contracts with high credit-quality financial institutions.
Accounts Receivable: Our residential and commercial customers are located geographically throughout the United States and Canada and, as to commercial customers, within differing industries; thus, minimizing credit risk. The credit exposure of utility services customers is directly affected by conditions within the utility industries as well as the financial condition of individual customers. One utility services customer approximated 11% of revenues during 2008, 10% during 2007 and 9% during 2006. To reduce credit risk, we evaluate the credit of customers, but generally do not require advance payments or collateral. Exposure to losses on receivables is principally dependent on each customer’s financial condition.
Currency Translation Adjustments--All assets and liabilities of our Canadian operations are translated into United States dollars at year-end exchange rates while revenues and expenses are translated at weighted-average exchange rates in effect during the year. Translation adjustments are recorded as accumulated other comprehensive income (loss) in shareholders’ equity.
Interest Rate Risk Management--We have entered into interest rate contracts with the objective of altering interest rate exposures related to variable rate debt. In the interest rate contracts, we have agreed with a financial institution to exchange, at specified intervals, the difference between fixed and floating interest amounts calculated on an agreed-upon notional principal amount.
The Davey Tree Expert Company
Notes to Consolidated Financial Statements--(Continued)
December 31, 2008
(In thousands, except share data)
B. Accounting Policies (continued)
Comprehensive Income (Loss)--Comprehensive income (loss) includes net income and other comprehensive income or loss. Other comprehensive income (loss) refers to revenues, expenses, gains and losses that under U.S. GAAP are included in comprehensive income but are excluded from net income as these amounts are recorded directly as an adjustment to shareholders’ equity, net of tax.
Fair Values--The carrying amount of cash, receivables, accounts payable and debt approximates fair value.
New Accounting Standards--Recently Adopted
FIN No. 48--Effective January 1, 2007, we adopted Financial Accounting Standards Board (“FASB”) Interpretation No. 48, “Accounting for Uncertainty in Income Taxes,” an interpretation of FASB Statement No. 109, “Accounting for Income Taxes” (“FIN 48”). FIN 48 applies to all “tax positions” accounted for under FASB Statement No. 109. FIN 48 refers to “tax positions” as positions taken in a previously-filed tax return or positions expected to be taken in a future tax return that are reflected in measuring current or deferred income tax assets and liabilities reported in the financial statements. FIN 48 clarifies the accounting for income taxes by prescribing a minimum recognition threshold a tax position is required to meet before being recognized in the financial statements. FIN 48 also provides guidance on derecognition, measurement, classification, interest and penalties, accounting in interim periods, disclosure and transition. The adoption of FIN 48 had no effect on the results of operations or financial position.
FAS No. 157--In September 2006, the FASB issued Statement No. 157, “Fair Value Measurements” (“FAS 157”), which establishes a framework for measuring fair value and requires expanded presentations regarding fair value measurements. In February 2008, the FASB issued FASB Staff Position No. FAS 157-2, “Effective Date of FASB Statement No. 157” (“FSP FAS 157-2”), which allows for the deferral of the adoption date of FAS 157 for all nonfinancial assets and nonfinancial liabilities, except those that are recognized or presented at fair value in the financial statements on a recurring basis. We have elected to defer the adoption of FAS 157 for the assets and liabilities within the scope of FSP FAS 157-2. The effective provisions of FAS 157, adopted January 1, 2008, are discussed in Note R, “Fair Value Measurements.” The adoption of FAS 157 for those assets and liabilities within the scope of FSP FAS 157-2 is effective for us beginning January 1, 2009.
FAS No. 159--In February 2007, the FASB issued Statement No. 159, “The Fair Value Option for Financial Assets and Financial Liabilities–Including an amendment of FASB Statement No. 115” (“FAS 159”). FAS 159 permits entities to choose, at specified election dates, to measure eligible financial assets and liabilities at fair value. FAS 159 requires unrealized gains and losses on items for which the fair value option is elected to be reported in earnings at each subsequent reporting date. This statement was effective for us on January 1, 2008. We did not elect to apply the fair value option to any of our outstanding instruments and, therefore, FAS 159 did not have an impact on our consolidated financial statements.
New Accounting Standards--Recently Issued, But Not Yet Adopted
FAS No. 161--In March 2008, the FASB issued Statement No.161, “Disclosures about Derivative Instruments and Hedging Activities-an amendment of FASB Statement 133” (“FAS 161”). FAS 161 requires entities to provide enhanced reporting relating to: (a) how and why an entity uses derivative instruments; (b) how derivative instruments and related hedge items are accounted for under FAS 133, “Accounting for Derivative Instruments and Hedging Activities” (“FAS 133”) and its related interpretations; and (c) how derivative instruments and related hedged items affect an entity’s financial position, financial performance, and cash flows. FAS 161 must be applied prospectively to all derivative instruments and nonderivative instruments that are designated and qualify as hedging instruments and related hedged items accounted for under FAS 133 for all financial statements issued for fiscal years and interim periods beginning after November 15, 2008, which for us begins with our 2009 calendar year, with early application encouraged. The adoption of FAS 161 will not have a material effect on our financial position, results of operations or cash flows.
The Davey Tree Expert Company
Notes to Consolidated Financial Statements--(Continued)
December 31, 2008
(In thousands, except share data)
B. Accounting Policies (continued)
FAS No. 141R--In December 2007, the FASB issued Statement No. 141 (revised 2007), “Business Combinations” (“FAS 141R”), which replaces FAS No. 141, “Business Combinations.” FAS 141R retains the underlying concepts of FAS 141 in that all business combinations are still required to be accounted for at fair value under the acquisition method of accounting but FAS 141R changed the method of applying the acquisition method in a number of significant aspects. FAS 141R is to be applied prospectively to business combinations for which the acquisition date is on or after January 1, 2009, except as it relates to certain income tax accounting matters. We expect FAS 141R will have an impact on our accounting for future business combinations once adopted, but the effect is dependent upon the acquisitions that are made in the future.
FSP FAS No. 142-3--In April 2008, the FASB issued FASB Staff Position No. 142-3, “Determination of the Useful Life of Intangible Assets” (“FSP FAS 142-3”), which amends the factors that should be considered in developing renewal or extension assumptions used to determine the useful life of a recognized intangible asset under FAS 142, “Goodwill and Other Intangible Assets.” Early adoption is not permitted. We are required to adopt FSP FAS 142-3 prospectively for any intangibles acquired on or after January 1, 2009. The adoption of FSP FAS 142-3 will not have a material effect on our financial position, results of operations or cash flows.
FSP FAS No. 132R-1--In December 2008, the FASB issued FASB Staff Position No.132 (R)-1, “Employers’ Disclosures about Pensions and Other Postretirement Benefits” (“FSP FAS 132R-1”). FSP FAS 132R-1 requires enhanced information about the plan assets of a Company’s defined benefit pension and other postretirement plans. The enhanced information required by this FSP is intended to provide users of financial statements with a greater understanding of: (a) how investment allocation decisions are made, including the factors that are pertinent to an understanding of investment policies and strategies; (b) the major categories of plan assets; (c) the inputs and valuation techniques used to measure the fair value of plan assets; (d) the effect of fair value measurements using significant unobservable inputs (referred to as Level 3 inputs) on changes in plan assets for the period; and (e) significant concentrations of risk within plan assets. This FSP is effective for us for the year ending December 31, 2009.
C. Accounts Receivable, Net
Accounts receivable, net, consisted of the following:
| | | December 31, | |
| | | 2008 | | | 2007 | |
| | | | | | | |
| Accounts receivable | | $ | 76,328 | | | $ | 69,326 | |
| Receivables under contractual arrangements | | | 7,858 | | | | 5,426 | |
| | | | | | | | | |
| | | | 84,186 | | | | 74,752 | |
| Less allowances for doubtful accounts | | | 2,435 | | | | 2,741 | |
| | | | | | | | | |
| | | $ | 81,751 | | | $ | 72,011 | |
| | | | | | | | | |
Receivables under contractual arrangements consist of work-in-process in accordance with the terms of contracts, primarily with utility services customers.
The Davey Tree Expert Company
Notes to Consolidated Financial Statements--(Continued)
December 31, 2008
(In thousands, except share data)
D. Supplemental Balance Sheet, Operating and Cash Flow Information
The following items comprise the amounts included in the balance sheets:
| | | December 31, | |
| Other current assets | | 2008 | | | 2007 | |
| | | | | | | |
| Refundable income taxes | | $ | 4,776 | | | $ | 1,099 | |
| Deferred income taxes | | | 7,674 | | | | 7,297 | |
| Other | | | 2,837 | | | | 1,362 | |
| Total | | $ | 15,287 | | | $ | 9,758 | |
| | | | | | | | | |
| | | December 31, | |
| Other assets, noncurrent | | 2008 | | | 2007 | |
| | | | | | | | | |
| Pension assets | | $ | - | | | $ | 4,356 | |
| Deferred income taxes | | | 4,317 | | | | 5,114 | |
| Deposits | | | 1,420 | | | | 1,667 | |
| Assets invested for self-insurance | | | 6,289 | | | | 8,660 | |
| Total | | $ | 12,026 | | | $ | 19,797 | |
| | | | | | | | | |
| | | December 31, | |
| Accrued expenses | | 2008 | | | 2007 | |
| | | | | | | | | |
| Employee compensation | | $ | 13,100 | | | $ | 11,554 | |
| Accrued compensated absences | | | 5,064 | | | | 4,904 | |
| Self-insured medical claims | | | 2,601 | | | | 2,698 | |
| Customer advances, deposits | | | 1,995 | | | | 2,711 | |
| Taxes, other than income | | | 1,803 | | | | 1,043 | |
| Other | | | 4,608 | | | | 3,401 | |
| Total | | $ | 29,171 | | | $ | 26,311 | |
| | | | | | | | | |
| | | December 31, | |
| Other liabilities, noncurrent | | 2008 | | | 2007 | |
| | | | | | | | | |
| Pension and retirement plans | | $ | 8,034 | | | $ | 2,492 | |
| Other | | | 2,374 | | | | 2,082 | |
| Total | | $ | 10,408 | | | $ | 4,574 | |
| | | | | | | | | |
Other nonoperating income (expense), net, included in the statements of operations follows:
| | | Year ended December 31, | |
| | | 2008 | | | 2007 | | | 2006 | |
| | | | | | | | | | |
| Other nonoperating expense, net | | $ | (2,920 | ) | | $ | (542 | ) | | $ | (1,301 | ) |
| | | | | | | | | | | | | |
Other nonoperating income (expense), net, includes foreign currency (i) losses of $1,029 for 2008, (ii) gains of $1,024 for 2007 and (iii) losses of $76 for 2006 on the intercompany balances of our Canadian operations.
The Davey Tree Expert Company
Notes to Consolidated Financial Statements--(Continued)
December 31, 2008
(In thousands, except share data)
D. Supplemental Balance Sheet, Operating and Cash Flow Information (continued)
Supplemental cash flow information follows:
| | | Year Ended December 31, | |
| Supplemental cash flow information | | 2008 | | | 2007 | | | 2006 | |
| | | | | | | | | | |
| Interest paid | | $ | 3,434 | | | $ | 3,249 | | | $ | 2,804 | |
| Income taxes paid, net | | | 13,211 | | | | 14,963 | | | | 11,806 | |
| | | | | | | | | | | | | |
| Noncash transactions: | | | | | | | | | | | | |
| Common shares, two-for-one split | | $ | 10,729 | | | $ | - | | | $ | - | |
| Debt issued for purchases of businesses | | | 6,239 | | | | 1,807 | | | | 1,467 | |
| Common shares issued for purchase of business | | | 14,692 | | | | - | | | | - | |
| | | | | | | | | | | | | |
| Detail of acquisitions: | | | | | | | | | | | | |
| Assets acquired: | | | | | | | | | | | | |
| Cash | | $ | 55 | | | $ | - | | | $ | 49 | |
| Receivables | | | 8,413 | | | | - | | | | 547 | |
| Operating supplies | | | 897 | | | | - | | | | - | |
| Prepaid expense | | | 339 | | | | - | | | | - | |
| Equipment | | | 33,038 | | | | 811 | | | | 614 | |
| Deposits and other | | | 917 | | | | - | | | | - | |
| Intangibles | | | 16,523 | | | | 3,801 | | | | 3,914 | |
| Liabilities assumed | | | (23,478 | ) | | | (330 | ) | | | (1,111 | ) |
| Debt issued for purchases of businesses | | | (6,239 | ) | | | (1,807 | ) | | | (1,467 | ) |
| Common shares issued for purchase of business | | | (14,692 | ) | | | - | | | | - | |
| Cash paid | | $ | 15,773 | | | $ | 2,475 | | | $ | 2,546 | |
| | | | | | | | | | | | | |
E. Business Combinations, Identified Intangible Assets and Goodwill, Net
Business Combinations--Our investments in businesses were: (a) $60,182 in 2008, including liabilities assumed of $23,478 and debt issued of $6,239; (b) $4,612 in 2007, including liabilities assumed of $330 and debt issued of $1,807; and (c) $5,124 in 2006.
The net assets of the businesses acquired are accounted for under the purchase method and were recorded at their fair values at the dates of acquisition. The excess of the purchase price over the estimated fair values of the net assets acquired was recorded as an increase in goodwill of approximately $11,703 in 2008 (of which $1,797 is deductible for tax purposes and $9,906 is not deductible for tax purposes.), $1,820 in 2007 (all of which is deductible for tax purposes); and $1,999 in 2006 (of which $262 is deductible for tax purposes and $1,737 is not deductible for tax purposes).
The results of operations of acquired businesses have been included in the consolidated statements of operations beginning as of the effective dates of acquisition. The effect of these acquisitions on our consolidated revenues and results of operations for the year ended December 31, 2008 was not significant.
The Davey Tree Expert Company
Notes to Consolidated Financial Statements--(Continued)
December 31, 2008
(In thousands, except share data)
E. Business Combinations, Identified Intangible Assets and Goodwill, Net (continued)
Identified Intangible Assets and Goodwill, Net--The carrying amount of the identified intangibles and goodwill acquired in connection with our investments in businesses were as follows.
| | Weighted- | | | | | | | | | | | | |
| | Average | | December 31, 2008 | | | December 31, 2007 | |
| | Amortization | | Carrying | | | Accumulated | | | Carrying | | | Accumulated | |
| | Period (Years) | | Amount | | | Amortization | | | Amount | | | Amortization | |
| | | | | | | | | | | | | | |
| Amortized intangible assets: | | | | | | | | | | | | | |
| Customer lists/relationships | 6.0 years | | $ | 8,971 | | | $ | 7,121 | | | $ | 8,435 | | | $ | 6,509 | |
| Employment-related | 4.7 years | | | 4,796 | | | | 2,744 | | | | 2,847 | | | | 2,235 | |
| Tradenames | 6.1 years | | | 3,785 | | | | 1,208 | | | | 1,489 | | | | 866 | |
| | | | | | | | | | | | | | | | | | |
| Total | | | | 17,552 | | | $ | 11,073 | | | | 12,771 | | | $ | 9,610 | |
| | | | | | | | | | | | | | | | | | |
| Less accumulated amortization | | | 11,073 | | | | | | | | 9,610 | | | | | |
| | | | | | | | | | | | | | | | | | |
| Identified intangibles, net | | | 6,479 | | | | | | | | 3,161 | | | | | |
| Unamortized intangible assets: | | | | | | | | | | | | | | | | | |
| Goodwill | Not amortized | | | 20,172 | | | | | | | | 8,569 | | | | | |
| | | | | | | | | | | | | | | | | | |
| | | | $ | 26,651 | | | | | | | $ | 11,730 | | | | | |
| | | | | | | | | | | | | | | | | | |
The changes in the carrying amounts of goodwill, by segment, for the year ended December 31, 2008 follow:
| | | | | | | | | | | | | |
| | | Balance at | | | | | | Translation | | | Balance at | |
| | | January 1, | | | | | | and Other | | | December 31, | |
| | | 2008 | | | Acquisitions | | | Adjustments | | | 2008 | |
| | | | | | | | | | | | | |
| Utility Services | | $ | - | | | $ | 1,314 | | | $ | - | | | $ | 1,314 | |
| Residential and Commercial Services | | | 6,830 | | | | 10,381 | | | | (100 | ) | | | 17,111 | |
| Resource Group | | | 1,739 | | | | 8 | | | | - | | | | 1,747 | |
| Total | | $ | 8,569 | | | $ | 11,703 | | | $ | (100 | ) | | $ | 20,172 | |
| | | | | | | | | | | | | | | | | |
Estimated future aggregate amortization expense of intangible assets--The estimated aggregate amortization expense of intangible assets, as of December 31, 2008, in each of the next five years follows.
| | | Estimated Future Amortization Expense | |
| Year ending December 31, 2009 | | $ | 1,592 | |
| 2010 | | | 1,470 | |
| 2011 | | | 1,225 | |
| 2012 | | | 961 | |
| 2013 | | | 618 | |
The Davey Tree Expert Company
Notes to Consolidated Financial Statements--(Continued)
December 31, 2008
(In thousands, except share data)
Short-term debt consisted of the following:
| | | December 31, | |
| | | 2008 | | | 2007 | |
| Notes payable | | $ | 1,220 | | | $ | 127 | |
| Current portion of long-term debt | | | 7,364 | | | | 3,843 | |
| | | $ | 8,584 | | | $ | 3,970 | |
| | | | | | | | | |
At December 31, 2008, we also had unused short-term lines of credit with several banks totaling $11,005, generally at the banks' prime rate or LIBOR plus a margin adjustment of 1.0% or 1.75%. Long-term debt consisted of the following:
| | | December 31, | |
| | | 2008 | | | 2007 | |
| Revolving credit facility | | | | | | |
| Prime rate borrowings | | $ | 3,700 | | | $ | 7,800 | |
| LIBOR borrowings | | | 47,000 | | | | 17,000 | |
| Term loan | | | 5,750 | | | | 7,000 | |
| | | | 56,450 | | | | 31,800 | |
| Term loans | | | 11,101 | | | | 4,142 | |
| | | | 67,551 | | | | 35,942 | |
| Less current portion | | | 7,364 | | | | 3,843 | |
| | | $ | 60,187 | | | $ | 32,099 | |
| | | | | | | | | |
Revolving Credit Facility--We have a $159,000 revolving credit facility with a group of banks, which will expire in December 2011 and permits borrowings, as defined, up to $159,000 (increased in May 2008 from $147,000) with a letter of credit sublimit of $100,000. The revolving credit facility contains certain affirmative and negative covenants customary for this type of facility and includes financial covenant ratios, as defined, with respect to funded debt to EBITDA (earnings before interest, taxes, depreciation and amortization), and funded debt to capitalization. Included in the credit facility is a $7,000 seven-year term loan entered into in November 2007 that requires quarterly principal installments of $250, plus interest.
As of December 31, 2008, we had unused commitments under the facility approximating $43,624, with $115,376 committed under the facility, consisting of borrowings of $56,450 (including the $5,750 term loan) and issued letters of credit of $58,926. Borrowings outstanding bear interest, at our option, at the agent bank’s prime rate or LIBOR plus a margin adjustment ranging from .65% to 1.45%, based on a ratio of funded debt to EBITDA. A commitment fee ranging from .11% to .19% is also required based on the average daily unborrowed commitment.
Term Loans, Weighted-Average Interest Rate--The weighted-average interest on the term loans approximated 5.33% at December 31, 2008 and 7.32% at December 31, 2007.
Aggregate Maturities of Long-Term Debt--Aggregate maturities of long-term debt for the five years subsequent to December 31, 2008 were as follows: 2009--$7,364; 2010--$3,465; 2011--$53,772; 2012--$1,100; 2013--$1,100.
Interest Rate Contracts--We use interest rate contracts to effectively convert a portion of variable-rate revolving credit borrowings to a fixed rate, thus reducing the impact of interest rate changes on future interest expense. As of December 31, 2008, we had two interest rate contracts outstanding, each with an underlying notional amount totaling $10,000, requiring interest to be paid at 3.42% maturing in December 2011 and 5.15% maturing in March 2012.
The Davey Tree Expert Company
Notes to Consolidated Financial Statements--(Continued)
December 31, 2008
(In thousands, except share data)
Components of our self-insurance accruals for workers’ compensation, vehicle liability and general liability follow:
| | | December 31, | |
| | | 2008 | | | 2007 | |
| | | | | | | |
| Workers' compensation | | $ | 33,264 | | | $ | 28,160 | |
| Present value discount | | | 3,050 | | | | 2,485 | |
| | | | 30,214 | | | | 25,675 | |
| Vehicle liability | | | 4,712 | | | | 6,111 | |
| General liability | | | 22,093 | | | | 17,177 | |
| Total | | | 57,019 | | | | 48,963 | |
| Less current portion | | | 22,069 | | | | 20,253 | |
| Noncurrent portion | | $ | 34,950 | | | $ | 28,710 | |
| | | | | | | | | |
The changes in our self-insurance accruals and the discount rate used for the workers’ compensation accrual are summarized in the table below.
| | | December 31, | |
| | | 2008 | | | 2007 | |
| | | | | | | |
| Balance, beginning of year | | $ | 48,963 | | | $ | 42,924 | |
| Acquired businesses | | | 4,760 | | | | - | |
| Provision for claims | | | 27,090 | | | | 26,044 | |
| Payment of claims | | | 23,794 | | | | 20,005 | |
| Balance, end of year | | $ | 57,019 | | | $ | 48,963 | |
| | | | | | | | | |
| Workers' compensation discount rate | | | 4.50 | % | | | 4.50 | % |
Assets acquired under capital leases and included in property and equipment consisted of the following:
| | | December 31, | |
| | | 2008 | | | 2007 | |
| Equipment | | $ | 511 | | | $ | 316 | |
| Less accumulated amortization | | | 227 | | | | 256 | |
| | | $ | 284 | | | $ | 60 | |
| | | | | | | | | |
The Davey Tree Expert Company
Notes to Consolidated Financial Statements--(Continued)
December 31, 2008
(In thousands, except share data)
H. Lease Obligations (continued)
We also lease facilities under noncancelable operating leases, which are used for district office and warehouse operations. These leases extend for varying periods of time up to five years and, in some cases, contain renewal options. Minimum rental commitments under all capital and noncancelable operating leases, as of December 31, 2008 were as follows:
| | | Lease Obligations | |
| Minimum lease obligations | | Capital | | | Operating | |
| | | | | | | |
| Year ending December 31, 2009 | | $ | 854 | | | $ | 5,197 | |
| 2010 | | | 166 | | | | 3,850 | |
| 2011 | | | - | | | | 2,420 | |
| 2012 | | | - | | | | 1,338 | |
| 2013 | | | - | | | | 910 | |
| 2014 and after | | | - | | | | 910 | |
| Total minimum lease payments | | | 1,020 | | | $ | 14,625 | |
| Amounts representing interest | | | 39 | | | | | |
| Present value of net minimum lease payments | | | 981 | | | | | |
| Less current portion | | | 816 | | | | | |
| Long-term capital lease obligations, December 31, 2008 | | $ | 165 | | | | | |
| | | | | | | | | |
Total rent expense under all operating leases was $4,856 in 2008, $3,643 in 2007 and $3,115 in 2006.
Common Stock Split--On September 12, 2008, our Board of Directors adopted a resolution effecting a two-for-one forward stock split of our common shares, paid as a stock dividend to shareholders of record as of September 27, 2008. The effective time of the forward stock split was the open of business on October 1, 2008. The par value of each common share remains at $1.00. Accordingly, $10,729 was reclassified to the common shares account from additional paid-in capital and shareholders received an additional common share for each common share held.
Preferred Shares--We have authorized a class of 4,000,000 preferred shares, no par value, of which none were issued.
Common Shares--The number of common shares authorized is 24,000,000, par value $1.00. The number of common shares issued was 21,456,880 during each of the three years in the period ended December 31, 2008 (adjusted for the two-for-one stock split). The number of shares in the treasury for each of the three years in the period ended December 31, 2008 was as follows: 2008--6,938,836; 2007--6,925,100; and 2006--6,436,118.
Our common shares are not listed or traded on an established public trading market, and market prices are, therefore, not available. Semiannually, an independent stock valuation firm determines the fair market value of our common shares based upon our performance and financial condition. Since 1979, we have provided a ready market for all shareholders through our direct purchase of their common shares, although we are under no obligation to do so. During 2008, purchases of common shares totaled 1,921,264 shares for $28,081 in cash; we also had direct sales to directors and employees of 142,808 shares for $1,054, excluding those shares issued through either the exercise of options or the Employee Stock Purchase Plan and 929,780 shares totaling $14,692 for purchase of a business. We also sold 255,789 shares to our 401(k) plan for $1,222 and issued 70,094 shares to participant accounts to satisfy our liability for the 2007 employer match in the amount of $1,107. The liability accrued at December 31, 2008 for the 2008 employer match was $1,166. There were also 136,737 shares purchased during 2008 under the Employee Stock Purchase Plan.
The Davey Tree Expert Company
Notes to Consolidated Financial Statements--(Continued)
December 31, 2008
(In thousands, except share data)
I. Common Shares and Preferred Shares (continued)
Common Shares Outstanding--The table below reconciles the activity of the common shares outstanding (adjusted for the two-for-one stock split).
| | | December 31, | |
| | | 2008 | | | 2007 | |
| | | | | | | |
| Shares outstanding, beginning of year | | | 14,531,780 | | | | 15,020,762 | |
| | | | | | | | | |
| Shares purchased | | | (1,921,264 | ) | | | (1,175,708 | ) |
| Shares sold | | | 605,428 | | | | 478,852 | |
| Shares issued for purchase of business | | | 929,890 | | | | - | |
| Stock subscription offering -- cash purchases | | | 286,844 | | | | 123,340 | |
| Options exercised | | | 85,366 | | | | 84,534 | |
| | | | (13,736 | ) | | | (488,982 | ) |
| | | | | | | | | |
| Shares outstanding, end of year | | | 14,518,044 | | | | 14,531,780 | |
On December 31, 2008, we had 14,518,044 common shares outstanding, options exercisable to purchase 1,038,550 common shares, partially-paid subscriptions for 975,050 common shares and purchase rights outstanding for 495,864 common shares.
The partially-paid subscriptions relate to common shares purchased at $6.00 per share, in connection with the stock subscription offering completed in August 2002, whereby some employees opted to finance their subscription with a down-payment of at least 10% of their total purchase price and a seven- year promissory note for the balance due, bearing interest at 4.75% per year. Promissory note payments, of both principal and interest, are made either by payroll deduction or annual lump-sum payment. The promissory notes are collateralized with the common shares subscribed and the common shares are only issued when the related promissory note is paid-in-full. Dividends are paid on all unissued subscribed shares.
The purchase rights outstanding were granted, in connection with the stock subscription offering completed in August 2002, to all employees (excluding directors, officers and certain operations management) that purchased $5 or more of common stock. A right to purchase one additional common share at $6.00 per share was granted for every two common shares purchased. Each right may be exercised at the rate of one-seventh per year and will expire seven years after the date that the right was granted. Employees may not exercise a right should they cease to be employed by us.
On March 15, 1979, we consummated a plan, which transferred control of the Company to our employees. As a part of this plan, we initially sold 120,000 common shares (presently, 11,520,000 common shares adjusted for stock splits) to our Employee Stock Ownership Trust (“ESOT”) for $2,700. The Employee Stock Ownership Plan (“ESOP”), in conjunction with the related ESOT, provided for the grant to certain employees of certain ownership rights in, but not possession of, the common shares held by the trustee of the Trust. Annual allocations of shares have been made to individual accounts established for the benefit of the participants.
Defined Contribution and Savings Plans--Most employees are eligible to participate in The Davey 401KSOP and ESOP. Effective January 1, 1997, the plan commenced operations and retained the existing ESOP participant accounts and incorporated a deferred savings plan (401(k) plan) feature. Participants in the plan are allowed to make before-tax contributions, within Internal Revenue Service established limits, through payroll deductions. We will match, in either cash or our common shares, 50% of each participant's before-tax contribution, limited to the first 3% of the employee's compensation deferred each year. All nonbargaining domestic employees who attained age 21 and completed one year of service are eligible to participate. In May 2004, we adopted the 401K Match Restoration Plan, a defined contribution plan that supplements the retirement benefits of certain employees that participate in the savings plan feature of The Davey 401KSOP and ESOP Plan, but are limited in contributions because of tax rules and regulations.
The Davey Tree Expert Company
Notes to Consolidated Financial Statements--(Continued)
December 31, 2008
(In thousands, except share data)
J. The Davey 401KSOP and Employee Stock Ownership Plan (continued)
During the fourth quarter of 2008, our Board of Directors approved an amendment to freeze the (i) Employee Retirement Plan and the (ii) Benefit Restoration Pension Plan, effective December 31, 2008 and enhanced benefits were implemented to our defined contribution savings plan—The Davey 401KSOP and ESOP—effective January 1, 2009. Our matching contributions to The Davey 401KSOP and ESOP (i) increased to a 2009 potential maximum of 100% of the first one percent and 50% of the next three percent―up to a four percent deferral―from (ii) the 2008 potential maximum of 50% of a three percent deferral (subject to the Internal Revenue Service limit of $16,500 in 2009 for employee contributions). This represents an increase in our potential maximum contribution from 1.5% to 2.5%.
Total compensation for these plans, consisting primarily of the employer match was $1,166 in 2008, $1,107 in 2007, and $1,015 in 2006.
The Davey Tree Expert Company 2004 Omnibus Stock Plan (the “Stock Plan”) was approved by our shareholders at our annual shareholders' meeting in May 2004. The Stock Plan is administered by the Compensation Committee of the Board of Directors, with the maximum number of common shares that may be granted to or purchased by all employees and directors under the Stock Plan being 10,000,000. In addition to the maintenance of the Employee Stock Purchase Plan, the Stock Plan provides for the grant of stock options, restricted stock, stock appreciation rights, stock purchase rights, stock equivalent units, cash awards, and other stock or performance-based incentives. These awards are payable in cash or common shares, or any combination thereof, as established by the Compensation Committee.
Stock-Based Plans--The Stock Plan consolidates into a single plan provisions for the grant of stock options and other stock-based incentives and maintenance of the Employee Stock Purchase Plan. Prior to adoption of the Stock Plan and its predecessor, the 1994 Omnibus Stock Plan, we had two qualified stock option plans available for officers and management employees; the final grant of awards under those plans was December 10, 1993. The maximum number of shares that may be issued upon exercise of stock options, other than director options and nonqualified stock options, is 3,200,000 during the ten-year term of the Stock Plan. Shares purchased since 1994 under the Employee Stock Purchase Plan were 3,303,185. Each nonemployee director elected or appointed, and reelected or reappointed, will receive a director option that gives the right to purchase, for six years, 4,000 common shares at the fair market value per share at date of grant. The director options are exercisable six months from the date of grant. The aggregate number of common shares available for grant and the maximum number of shares granted annually are based on formulas defined in the Stock Plan. The grant of awards, other than director options, is at the discretion of the Compensation Committee of the Board of Directors. Shares available for grant at December 31, 2008 were 993,805.
Adoption of FASB Statement No. 123R (“FAS 123R”)--Effective January 1, 2006, we adopted FAS 123R, “Share-Based Payment.” FAS 123R requires all share-based payments to employees, including grants of stock options, to be recognized as compensation costs in the financial statements based on their estimated fair values over the requisite employee service period (that is, pro forma disclosure is no longer an alternative to financial statement recognition).
Prior to January 1, 2006, in accordance with FASB Statement No. 123, “Accounting for Stock-Based Compensation,” we followed APB 25, “Accounting for Stock Issued to Employees.” Under APB 25, no stock-based compensation expense was recognized related to our stock options and Employee Stock Purchase Plan, as all options granted under the stock option plans had an exercise price equal to the market value of the underlying common stock on the date of grant and, with respect to the Employee Stock Purchase Plan, the discount did not exceed 15%.
The Davey Tree Expert Company
Notes to Consolidated Financial Statements--(Continued)
December 31, 2008
(In thousands, except share data)
K. Stock-Based Compensation (continued)
Under FAS 123R, all new grants of employee stock options awarded after December 31, 2005 to employees and subscriptions to purchase shares under the Employee Stock Purchase Plan after December 31, 2005 result in compensation costs being recognized. In adopting FAS 123R, there was no effect on prior period financial statements as compensation costs are only permitted to be recognized prospectively.
Stock-based compensation expense under all share-based payment plans – our Employee Stock Purchase Plan, stock option plans, and performance-based restricted stock units – included in the results of operations follows:
| | | Year Ended December 31, | |
| | | 2008 | | | 2007 | | | 2006 | |
| | | | | | | | | | |
| Compensation expense, all share-based payment plans | | $ | 1,201 | | | $ | 1,520 | | | $ | 1,139 | |
| Income tax benefit | | | 304 | | | | 442 | | | | 346 | |
Stock-based compensation consisted of the following:
Employee Stock Purchase Plan--Under the Employee Stock Purchase Plan, all full-time employees with one year of service are eligible to purchase, through payroll deduction, common shares. Employee purchases under the Employee Stock Purchase Plan are at 85% of the fair market value of the common shares--a 15% discount. Purchases under the plan, at 85% of the fair market value of the common shares, have been as follows:
| | | Year Ended December 31, | |
| | | 2008 | | | 2007 | | | 2006 | |
| | | | | | | | | | |
| Number of employees participating | | | 1,200 | | | | 990 | | | | 918 | |
| | | | | | | | | | | | | |
| Shares purchased during the year | | | 136,737 | | | | 125,274 | | | | 131,244 | |
| | | | | | | | | | | | | |
| Weighted-average per share purchase price paid | | $ | 13.70 | | | $ | 11.61 | | | $ | 9.88 | |
| | | | | | | | | | | | | |
| Cumulative shares purchased since 1982 | | | 7,922,993 | | | | 7,786,256 | | | | 7,660,982 | |
Compensation costs are recognized as payroll deductions are made. The 15% discount of total shares purchased under the plan resulted in compensation cost recognized of $331 in 2008, $256 in 2007 and $229 in 2006.
Stock Option Plans--Since adopting FAS 123R on January 1, 2006 and through the year ended December 31, 2008 there were 524,000 stock option awards granted. The stock option awards were granted at an exercise price equal to the fair market value of our common shares at the dates of grant. The stock options were awarded under a graded vesting schedule and have a term of ten years. Compensation costs for stock options are recognized over the requisite service period on the straight-line recognition method. Compensation cost recognized for stock options was $349 in 2008, $343 in 2007 and $217 in 2006.
The Davey Tree Expert Company
Notes to Consolidated Financial Statements--(Continued)
December 31, 2008
(In thousands, except share data)
K. Stock-Based Compensation (continued)
Performance-Based Restricted Stock Units--During February 2008, the Compensation Committee of the Board of Directors awarded 31,070 Performance-Based Restricted Stock Units to certain management employees. Similar awards were made in prior periods. The awards vest over specified periods. The following table summarizes Performance-Based Restricted Stock Units as of December 31, 2008.
| | | | | | | | Weighted- | | | | |
| | | | | | Weighted- | | Average | | | | |
| | | | | | Average | | Remaining | | Unrecognized | | Aggregate |
| Performance-Based | | Number of | | | Grant Date | | Contractual | | Compensation | | Intrinsic |
| Restricted Stock Units | | Stock Units | | | Value | | Life | | Cost | | Value |
| | | | | | | | | | | | |
| Unvested, January 1, 2008 | | | 285,682 | | | $ | 10.00 | | | | | | |
| Granted | | | 31,070 | | | | 15.57 | | | | | | |
| Forfeited | | | - | | | | | | | | | | |
| Vested | | | (192,772 | ) | | | 9.64 | | | | | | |
| | | | | | | | | | | | | | |
| Unvested, December 31, 2008 | | | 123,980 | | | $ | 11.96 | | 2.8 years | | $ 823 | | $ 2,033 |
| | | | | | | | | | | | | | |
The fair value of the restricted stock units for awards made prior to January 1, 2006 is based on the market price of our common shares on the date of award and is recognized as compensation cost on the straight-line recognition method over the vesting period. Under the provisions of FAS 123R, compensation cost for awards made after December 31, 2005 is determined using a fair-value method, amortized over the requisite service period. “Intrinsic value” is defined as the amount by which the fair market value of a common share of stock exceeds the exercise price of a performance-based restricted stock unit. Compensation expense on restricted stock awards totaled $521 in 2008, $921 in 2007 and $693 in 2006.
For stock-based awards issued on or after January 1, 2006, the fair value of each award was estimated on the date of grant using a binomial option-pricing model. The binomial model considers a range of assumptions related to volatility, risk-free interest rate and employee exercise behavior. Expected volatilities utilized in the binomial model are based on historical volatility of our share prices and other factors. Similarly, the dividend yield is based on historical experience and expected future changes. The binomial model also incorporates exercise and forfeiture assumptions based on an analysis of historical data. The expected life of the stock-based awards is derived from the output of the binomial model and represents the period of time that awards granted are expected to be outstanding.
The fair values of stock-based awards granted during the year ended December 31, 2008 were estimated at the dates of grant with the following weighted-average assumptions: volatility—12.8%; expected dividend yield—1.5%; risk-free interest rate—2.2%; and, expected life of the award—7.5 years. The fair values of stock-based awards granted during the year ended December 31, 2007 were estimated at the dates of the grant with the following weighted-average assumptions: volatility—13.4%; expected dividend yield—1.5%; risk-free interest rate—4.6%; and expected life of the award—5.0 years.
The Davey Tree Expert Company
Notes to Consolidated Financial Statements--(Continued)
December 31, 2008
(In thousands, except share data)
K. Stock-Based Compensation (continued)
General Stock Option Information--The following table summarizes activity under the stock option plans for the year ended December 31, 2008.
| | | | | | | | Weighted- | | | | | | |
| | | | | | Weighted- | | Average | | | | | | |
| | | Number of | | Average | | Remaining | | Unrecognized | | | Aggregate | |
| | | Options | | | Exercise | | Contractual | | Compensation | | | Instrinic | |
| Stock Options | | Outstanding | | Price | | Life | | Cost | | | Value | |
| Outstanding, January 1, 2008 | | | 1,421,916 | | | $ | 8.35 | | | | | | | | |
| Granted | | | 40,000 | | | | 16.04 | | | | | | | | |
| Exercised | | | (85,366 | ) | | | 7.14 | | | | | | | | |
| Forfeited | | | (46,000 | ) | | | 9.11 | | | | | | | | |
| Outstanding, December 31, 2008 | | | 1,330,550 | | | | 8.63 | | 5.7 years | | $ | 11,483 | | | $ | 10,338 | |
| | | | | | | | | | | | | | | | | | |
| Exercisable, December 31, 2008 | | | 1,038,550 | | | | 7.81 | | 5.3 years | | | | | | $ | 8,921 | |
| | | | | | | | | | | | | | | | | | |
“Intrinsic value” is defined as the amount by which the market price of a common share of stock exceeds the exercise price of an option. Information regarding the stock options outstanding at December 31, 2008 is summarized below:
| | | | | | Weighted- | | Weighted- | | | | | | Weighted- | |
| | | | | | Average | | Average | | | | | | Average | |
| Stock Options | | | Number | | Remaining | | Exercise | | | Number | | | Exercise | |
| Exercise Price | | | Outstanding | | Contractual Life | | Price | | | Exercisable | | | Price | |
| Employee options: | | | | | | | | | | | | | |
| | $6.75 | | | | 807,550 | | 4.9 years | | $ | 6.75 | | | | 807,550 | | | $ | 6.75 | |
| | 11.25 | | | | 443,000 | | 7.4 years | | | 11.25 | | | | 167,000 | | | | 11.25 | |
| | | | | | 1,250,550 | | 5.8 years | | | 8.34 | | | | 974,550 | | | | 7.52 | |
| Director options: | | | | | | | | | | | | | | | | | |
| | $6.00 to $16.40 | | | | 80,000 | | 4.2 years | | | 13.07 | | | | 64,000 | | | | 12.23 | |
| | | | | | 1,330,550 | | 5.7 years | | | 8.63 | | | | 1,038,550 | | | | 7.81 | |
| | | | | | | | | | | | | | | | | | | | |
We issue common shares from treasury upon the exercise of stock options, restricted stock units or purchases under the Employee Stock Purchase Plan.
The Davey Tree Expert Company
Notes to Consolidated Financial Statements--(Continued)
December 31, 2008
(In thousands, except share data)
Substantially all of our domestic employees are covered by noncontributory defined benefit pension plans. A plan for nonbargaining employees provides a benefit based primarily on annual compensation up to a defined level and years of credited service. Another plan is for bargaining employees not covered by union pension plans and provides benefits at a fixed monthly amount based upon length of service. During May 2004, we adopted a Supplemental Executive Retirement Plan (“SERP”) and a Benefit Restoration Pension Plan (“Restoration Plan”) for certain key employees. Both the SERP and the Restoration Plan are defined benefit plans under which nonqualifed supplemental pension benefits will be paid in addition to amounts paid under our qualified retirement defined benefit pension plans, which are subject to Internal Revenue Service limitations on covered compensation.
Because of the deterioration in the global stock and financial markets during 2008, the value of the assets held by our Employee Retirement Plan (“ERP”) was negatively affected. Given the lower asset values, it was anticipated that our cash flow and earnings in 2009 and beyond would be negatively affected, with the belief that the adverse financial impacts on us were far in excess of the benefits that would accrue to our employees. After careful consideration, during the fourth quarter 2008, our Board of Directors approved an amendment to freeze the (i) ERP and the Restoration Plan, effective December 31, 2008 and implemented enhanced benefits to our defined contribution saving plan—The Davey 401KSOP and ESOP—effective January 1, 2009.
In connection with the freeze of the ERP and Restoration Plan, (i) benefits currently being paid to retirees continue and (ii) benefits accrued through December 31, 2008 for employees covered by the ERP were not affected. All ERP and Restoration Plan balances remain intact and participant account balances, as well as service credits for vesting and retirement eligibility, remain intact and continue in accordance with the terms of the plans. The freeze of the ERP and Restoration Plan eliminated future accruals only.
In connection with the freeze of the ERP and the Restoration Plan, we recognized a curtailment charge of $80 and, in connection with the finalization of our pension actuarial valuations as of December 31, 2008, we recognized a reduction in the pension benefit obligation of $2,906 and a reduction in the net actuarial loss reported in other comprehensive income (loss) of $1,801, net of tax, during 2008.
As of December 31, 2008, our defined benefit pension plans had an aggregate of $12,574 of actuarial losses that have not yet been included in net periodic benefit expense. Also, as of December 31, 2008, there was $134 in unrecognized prior service cost and $206 of unrecognized transition asset, recorded in adopting FASB Statement No. 87, "Employers' Accounting for Pensions"("FAS 87"), in 1986, that have not yet been included in net periodic benefit expense. Total unrecognized amounts as of December 31, 2008 were $12,503. Total unrecognized amounts as of December 31, 2007 were $3,602.
Unrecognized actuarial losses represent the cumulative effect, since the inception of FAS 87 of demographic and investment experience, as well as assumption changes that have been made in measuring the plans' liabilities. Investment experience includes actual losses on plan assets for 2008 of $8,195 as compared with actual gains on plan assets for 2007 of $3,781.
The total 2008 actuarial loss recognized in other comprehensive income was $11,889 as compared with an actuarial gain in 2007 of $2,165.
To the extent actuarial losses exceed the greater of 10% of the projected benefit obligation or market-related value of plan assets, the unrecognized actuarial losses will be amortized straight-line on a plan-by-plan basis, over the remaining expected future working lifetime of active participants. The total amount of unrecognized prior service cost and transition asset are also amortized straight-line on a plan-by-plan basis. The total amortization associated with these amounts that is expected to be recognized in net periodic benefit expense for 2009 is $786.
The Davey Tree Expert Company
Notes to Consolidated Financial Statements--(Continued)
December 31, 2008
(In thousands, except share data)
L. Defined Benefit Pension Plans (continued)
The change in benefit obligations and the fair value of plans assets follows:
| | | December 31, | |
| | | 2008 | | | 2007 | |
| Change in benefit obligation | | | | | | |
| Projected benefit obligation at beginning of year | | $ | 25,532 | | | $ | 25,622 | |
| Service cost | | | 1,806 | | | | 1,581 | |
| Interest cost | | | 1,660 | | | | 1,589 | |
| Curtailments | | | (2,906 | ) | | | - | |
| Settlements | | | - | | | | 101 | |
| Actuarial loss (gain) | | | 1,449 | | | | (530 | ) |
| Benefits paid | | | (1,782 | ) | | | (2,831 | ) |
| | | | | | | | | |
| Projected benefit obligation at end of year | | $ | 25,759 | | | $ | 25,532 | |
| | | | | | | | | |
| Accumulated benefit obligation at end of year | | $ | 25,604 | | | $ | 22,569 | |
| | | | | | | | | |
| | | December 31, | |
| | | 2008 | | | 2007 | |
| Change in fair value of plan assets | | | | | | | | |
| Fair value of plan assets at beginning of year | | $ | 28,615 | | | $ | 27,501 | |
| Actual return on plan assets | | | (8,195 | ) | | | 3,781 | |
| Employer contributions | | | 375 | | | | 164 | |
| Benefits paid | | | (1,782 | ) | | | (2,831 | ) |
| | | | | | | | | |
| Fair value of plan assets at end of year | | $ | 19,013 | | | $ | 28,615 | |
| | | | | | | | | |
| | | December 31, | |
| | | 2008 | | | 2007 | |
| Funded status of the plans | | | | | | | | |
| Fair value of plan assets | | $ | 19,013 | | | $ | 28,615 | |
| Projected benefit obligation | | | 25,759 | | | | 25,532 | |
| Funded status of the plans | | $ | (6,746 | ) | | $ | 3,083 | |
| | | | | | | | | |
The Davey Tree Expert Company
Notes to Consolidated Financial Statements--(Continued)
December 31, 2008
(In thousands, except share data)
L. Defined Benefit Pension Plans (continued)
| | | | | | | |
| | | December 31, | |
| | | 2008 | | | 2007 | |
| Amounts reported in the consolidated balance sheets | | | | | | |
| Noncurrent assets | | $ | - | | | $ | 4,356 | |
| Current liability | | | (14 | ) | | | (12 | ) |
| Noncurrent liability | | | (6,732 | ) | | | (1,261 | ) |
| Funded status of the plans | | $ | (6,746 | ) | | $ | 3,083 | |
| | | | | | | | | |
Adoption of FASB Statement No. 158 (“FAS 158”)--On December 31, 2006, we adopted FASB Statement No. 158, “Employers’ Accounting for Defined Benefit Pension and Other Postretirement Plans” (“FAS 158”)—an amendment of FASB Statements No. 87, 88, 106 and 132(R). The adoption of FAS 158 had no effect on our consolidated statement of operations for the year ended December 31, 2006. As a result of adopting FAS 158, on December 31, 2006, we reflected the funded status of our defined benefit pension plans by reducing our net pension asset by $5,834 to reflect actuarial and investment losses that had been deferred pursuant to prior pension accounting rules and recorded (i) a corresponding deferred tax asset of $2,217, (ii) a reduction in accrued pension obligations of $208 and (iii) a net after-tax charge of $3,409 in accumulated other comprehensive income (loss) in shareholders’ equity.
The adjustment to accumulated other comprehensive income at the adoption of FAS 158 represented the net unrecognized actuarial losses, unrecognized prior service costs, and unrecognized transition asset remaining from the initial adoption of FAS 87, all of which were previously netted against the plan’s funded status in our consolidated balance sheet pursuant to the requirements of FAS 87. These amounts will be subsequently recognized as net periodic pension cost pursuant to our historical accounting policy for amortizing such amounts. Further, actuarial gains and losses that arise in subsequent periods and are not recognized as net periodic pension cost in the same periods will be recognized as a component of other comprehensive income. Those amounts will be subsequently recognized as a component of net periodic pension expense on the same basis as the amounts recognized in accumulated other comprehensive income at adoption of FAS 158.
Amounts included in accumulated other comprehensive income (loss), related to FAS 158 follow:
| | | At December 31, 2008 | | | At December 31, 2007 | |
| | | Pretax | | | Net of Tax | | | Pretax | | | Net of Tax | |
| Amounts reported in accumulated other comprehensive income | | | | | | | | | | |
| Unrecognized net actuarial loss | | $ | 12,574 | | | $ | 7,789 | | | $ | 3,632 | | | $ | 2,252 | |
| Unrecognized prior service cost | | | 134 | | | | 83 | | | | 245 | | | | 152 | |
| Unrecognized transition asset | | | (205 | ) | | | (127 | ) | | | (275 | ) | | | (171 | ) |
| | | $ | 12,503 | | | $ | 7,745 | | | $ | 3,602 | | | $ | 2,233 | |
| | | | | | | | | | | | | | | | | |
The Davey Tree Expert Company
Notes to Consolidated Financial Statements--(Continued)
December 31, 2008
(In thousands, except share data)
L. Defined Benefit Pension Plans (continued)
The estimated costs that will be amortized from accumulated other comprehensive loss into net periodic pension expense during the year ending December 31, 2009 follow:
| | | Year Ending | |
| | | December 31, 2009 | |
| | | Pretax | | | Net of Tax | |
| Amortization of Costs Expected to be Recognized Next Year | | | | | | |
| | | | | | | |
| Unrecognized net actuarial loss | | $ | 841 | | | $ | 521 | |
| Unrecognized prior service cost | | | 14 | | | | 9 | |
| Unrecognized transition asset | | | (69 | ) | | | (43 | ) |
| | | $ | 786 | | | $ | 487 | |
| | | | | | | | | |
The aggregate projected benefit obligation, accumulated benefit obligation and fair value of plan assets for plans in which the fair value of plan assets is less than either the projected benefit obligation or accumulated benefit obligation follow:
| | | December 31, | |
| | | 2008 | | | 2007 | |
For pension plans with accumulated benefit obligations in excess of plan assets | | | | | | |
| | | | | | | |
| Projected benefit obligation | | $ | 25,759 | | | $ | 2,123 | |
| Accumulated benefit obligation | | | 25,604 | | | | 1,904 | |
| Fair value of plan assets | | | 19,013 | | | | 850 | |
| | | | | | | | | |
The actuarial assumptions follow. The discount rates were used to measure the year-end benefit obligation and compute pension expense for the subsequent year.
| | | December 31, | |
| | | 2008 | | | 2007 | | | 2006 | |
| Actuarial assumptions | | | | | | | | | |
| | | | | | | | | | |
| Discount rate | | | 6.25 | % | | | 6.25 | % | | | 6.00 | % |
| Expected long-term rate of return on plan assets | | | 8.00 | | | | 8.00 | | | | 8.00 | |
| Rate of increase in future compensation levels | | | 3.50 | | | | 4.50 | | | | 4.50 | |
Net periodic benefit expense (income) associated with the defined benefit pension plans included the following components:
| | | Year Ended December 31, | |
| | | 2008 | | | 2007 | | | 2006 | |
| Components of pension expense (income) | | | | | | | | | |
| | | | | | | | | | |
| Service costs--increase in benefit obligation earned | | $ | 1,806 | | | $ | 1,581 | | | $ | 1,357 | |
| Interest cost on projected benefit obligation | | | 1,660 | | | | 1,589 | | | | 1,476 | |
| Expected return on plan assets | | | (2,245 | ) | | | (2,146 | ) | | | (2,177 | ) |
| Curtailments | | | 80 | | | | - | | | | - | |
| Settlements | | | - | | | | 72 | | | | - | |
| Amortization of net actuarial loss | | | 40 | | | | 256 | | | | 220 | |
| Amortization of prior service cost | | | 31 | | | | 32 | | | | 71 | |
| Amortization of transition asset | | | (69 | ) | | | (72 | ) | | | (72 | ) |
| Net pension expense of defined benefit pension plans | | $ | 1,303 | | | $ | 1,312 | | | $ | 875 | |
| | | | | | | | | | | | | |
The Davey Tree Expert Company
Notes to Consolidated Financial Statements--(Continued)
December 31, 2008
(In thousands, except share data)
L. Defined Benefit Pension Plans (continued)
In 2007, the post-retirement mortality table was updated to better anticipate future experience. “Settlements” in the above table reflects vested obligations fully-settled with former employees whose accrued benefits had a present value of less than $5.
Multiemployer Pension Plans Contributions--In addition to the Company-sponsored defined benefit plans, we contribute to several multiemployer plans. Total pension expense for multiemployer plans was $1,054 in 2008, $986 in 2007, and $758 in 2006.
Plan Assets--The percentages of the fair value of total plan assets, by major category, were as follows, along with the target range-of-percentage allocations for 2008 used as investment strategy.
| | | Percentage of | | | | |
| | | Plan Assets | | | Target | |
| | | at December 31, | | | Allocations | |
| | | 2008 | | | 2007 | | | 2008 | |
| Plan assets -- asset category | | | | | | | | | |
| | | | | | | | | | |
| Equity securities | | | 69 | % | | | 71 | % | | 65% to 75% | |
| Debt securities | | | 26 | | | | 29 | | | 25% to 35% | |
| Other | | | 5 | | | | - | | | | * | |
| Total | | | 100 | % | | | 100 | % | | | | |
| | | | | | | | | | | | | |
| * Target allocation included with debt securities. | | | | | | | | | |
Investment Strategy and Risk Management for Plan Assets--Our investment strategy for the plan assets is to manage the assets in order to pay retirement benefits to plan participants while minimizing our cash contributions over the life of the plans. This is accomplished by preserving capital through diversification in high-quality investments and earning an acceptable long-term rate of return consistent with an acceptable degree of risk, while considering the liquidity needs of the plans. Target range-of-percentage allocations to major categories of plan assets are based on the expected returns for the following 12-to-18 months. Equity securities are expected to be well-diversified and consist mainly of domestic and foreign issues, with no single holding exceeding 7% of total equity securities. Debt securities consist of fixed-income issues, generally with a laddered-maturity structure ranging from 1-to-12 years. There is no specific prohibition to investing in real estate. Derivatives, options or leverage are not used.
Rate-of-return-on-assets assumptions are made by major category of plan assets according to historical analysis, tempered for an assessment of possible future influences that could cause the returns to exceed or trail long-term patterns. The overall expected long-term rate-of-return-on-plan assets, as at December 31, 2008, was 8%.
Expected Benefit Plan Payments--The benefits, as of December 31, 2008, expected to be paid to defined-benefit plan participants in each of the next five years, and in the aggregate for the five years thereafter, follow.
| | | Participants | |
| | | Benefits | |
| | | | |
| Estimated future payments | | | |
| | | | |
| Year ending December 31, 2009 | | $ | 1,103 | |
| 2010 | | | 1,150 | |
| 2011 | | | 1,183 | |
| 2012 | | | 1,223 | |
| 2013 | | | 1,266 | |
| Years 2014 to 2018 | | | 7,422 | |
| | | | | |
The Davey Tree Expert Company
Notes to Consolidated Financial Statements--(Continued)
December 31, 2008
(In thousands, except share data)
L. Defined Benefit Pension Plans (continued)
Expected Benefit Plan Contributions--We expect, as of December 31, 2008, to make defined-benefit contributions totaling $139 before December 31, 2009.
Income before income taxes was attributable to the following sources:
| | | Year Ended December 31, | |
| | | 2008 | | | 2007 | | | 2006 | |
| | | | | | | | | | |
| United States | | $ | 27,033 | | | $ | 21,432 | | | $ | 17,936 | |
| Canada | | | 4,706 | | | | 7,088 | | | | 3,987 | |
| Totals | | $ | 31,739 | | | $ | 28,520 | | | $ | 21,923 | |
| | | | | | | | | | | | | |
The provision for income taxes follows:
| | | | Year Ended December 31, | |
| | | | 2008 | | | 2007 | | | 2006 | |
| Currently payable: | | | | | | | | | |
| | Federal | | $ | 6,384 | | | $ | 9,629 | | | $ | 8,004 | |
| | State | | | 1,850 | | | | 1,333 | | | | 1,573 | |
| | Canadian | | | 1,992 | | | | 2,112 | | | | 1,223 | |
| | | | | | | | | | | | | | |
| Total current | | | 10,226 | | | | 13,074 | | | | 10,800 | |
| | | | | | | | | | | | | | |
| Deferred taxes | | | 2,492 | | | | (2,633 | ) | | | (2,894 | ) |
| Total taxes on income | | $ | 12,718 | | | $ | 10,441 | | | $ | 7,906 | |
| | | | | | | | | | | | | | |
A reconciliation of the expected statutory U.S. federal rate to our actual effective income tax rate follows:
| | | Year Ended December 31, | |
| | | 2008 | | | 2007 | | | 2006 | |
| Statutory U.S. federal tax rate | | | 35.0 | % | | | 35.0 | % | | | 35.0 | % |
| State income taxes, net of federal benefit | | | 3.9 | | | | 2.9 | | | | 4.5 | |
| Effect of Canadian income taxes | | | .3 | | | | (.6 | ) | | | (.5 | ) |
| All other, net | | | .9 | | | | (.7 | ) | | | (2.9 | ) |
| | | | | | | | | | | | | |
| Effective income tax rate | | | 40.1 | % | | | 36.6 | % | | | 36.1 | % |
| | | | | | | | | | | | | |
The Davey Tree Expert Company
Notes to Consolidated Financial Statements--(Continued)
December 31, 2008
(In thousands, except share data)
M. Income Taxes (continued)
Significant components of our current net deferred tax assets and liabilities at December 31, were as follows:
| | | December 31, | |
| | | 2008 | | | 2007 | |
| Deferred tax assets: | | | | | | |
| Accrued compensated absences | | $ | 1,043 | | | $ | 1,056 | |
| Self-insurance accruals | | | 5,909 | | | | 5,641 | |
| Other assets (liabilities), net | | | 722 | | | | 600 | |
| Net deferred income tax assets--current | | $ | 7,674 | | | $ | 7,297 | |
| | | | | | | | | |
Significant components of our noncurrent net deferred tax assets and liabilities at December 31, were as follows:
| | | December 31, | |
| | | 2008 | | | 2007 | |
| Deferred tax assets: | | | | | | |
| Self-insurance accruals | | $ | 13,918 | | | $ | 11,608 | |
| Intangibles | | | 251 | | | | 745 | |
| Accrued expenses and other liabilities | | | 427 | | | | 336 | |
| Accrued stock compensation | | | 1,047 | | | | 895 | |
| Defined benefit pension plans | | | 2,417 | | | | - | |
| Other future deductible amounts, net | | | 1,349 | | | | 1,078 | |
| | | | 19,409 | | | | 14,662 | |
| Deferred tax liabilities: | | | | | | | | |
| Property and equipment | | | 15,092 | | | | 8,322 | |
| Defined benefit pension plans | | | - | | | | 1,226 | |
| | | | 15,092 | | | | 9,548 | |
| Net deferred income tax assets --noncurrent | | $ | 4,317 | | | $ | 5,114 | |
| | | | | | | | | |
The balance of unrecognized benefits and the amount of related interest and penalties at December 31, were as follows:
| | | December 31, | |
| | | 2008 | | | 2007 | |
| Unrecognized tax benefits | | $ | 1,910 | | | $ | 1,518 | |
| Portion, if recognized, would reduce tax expense and effective tax rate | | | 1,310 | | | | 918 | |
| Accrued interest on unrecognized tax benefits | | | 220 | | | | 202 | |
| Accrued penalties on unrecognized benefits | | | - | | | | - | |
The Davey Tree Expert Company
Notes to Consolidated Financial Statements--(Continued)
December 31, 2008
(In thousands, except share data)
M. Income Taxes (continued)
The changes in our unrecognized tax benefits are summarized in the table below.
| | | Year Ended December 31, | |
| | | 2008 | | | 2007 | |
| Balance, beginning of year | | $ | 1,518 | | | $ | 1,832 | |
| Additions based on tax positions related to the current year | | | 542 | | | | 222 | |
| Additions for tax positions of prior years | | | 705 | | | | 187 | |
| Reductions for tax positions of prior years | | | - | | | | (274 | ) |
| Lapses in statutes of limitations | | | (855 | ) | | | (449 | ) |
| Balance, end of year | | $ | 1,910 | | | $ | 1,518 | |
| | | | | | | | | |
Comprehensive income (loss) is comprised of net income and other adjustments that relate to currency translation adjustments, changes in the fair value of interest rate contracts qualifying as cash flow hedges, and defined benefit pension plan adjustments. We do not provide income taxes on currency translation adjustments, as the earnings of our Canadian operations are considered to be indefinitely reinvested. The adjustment to accumulated other comprehensive income at adoption of FAS 158 on December 31, 2006 represented the net unrecognized actuarial losses, unrecognized prior service costs, and unrecognized transition asset remaining from the initial adoption of FAS 87, all of which were previously netted against the plan’s funded status in our consolidated balance sheet pursuant to the requirements of FAS 87.
The following summarizes the components of other comprehensive income (loss) accumulated in shareholders’ equity:
| | | | | | | | | Defined | | | | | | Accumulated | |
| | | Currency | | | Interest | | | Benefit | | | Minimum | | | Other | |
| | | Translation | | | Rate | | | Pension | | | Pension | | | Comprehensive | |
| | | Adjustments | | | Contracts | | | Plans | | | Liability | | | Income/(Loss) | |
| Balance at January 1, 2006 | | $ | 690 | | | $ | (43 | ) | | $ | - | | | $ | (122 | ) | | $ | 525 | |
| Unrealized gains (losses) | | | (35 | ) | | | - | | | | - | | | | - | | | | (35 | ) |
| Unrealized gains in fair value | | | - | | | | 88 | | | | - | | | | - | | | | 88 | |
Adjustment to initially apply FAS 158 to defined benefit
plans and other changes | | | - | | | | - | | | | (5,955 | ) | | | 197 | | | | (5,758 | ) |
| Tax effect | | | - | | | | (33 | ) | | | 2,263 | | | | (75 | ) | | | 2,155 | |
| Net of tax amount | | | (35 | ) | | | 55 | | | | (3,692 | ) | | | 122 | | | | (3,550 | ) |
| | | | | | | | | | | | | | | | | | | | | |
| Balance at December 31, 2006 | | | 655 | | | | 12 | | | | (3,692 | ) | | | - | | | | (3,025 | ) |
| Unrealized gains (losses) | | | 2,320 | | | | - | | | | - | | | | - | | | | 2,320 | |
| Unrealized losses in fair value | | | - | | | | (570 | ) | | | - | | | | - | | | | (570 | ) |
Unrecognized amounts from defined benefit pension plans | | | - | | | | - | | | | 2,352 | | | | - | | | | 2,352 | |
| Tax effect | | | - | | | | 216 | | | | (893 | ) | | | - | | | | (677 | ) |
| Net of tax amount | | | 2,320 | | | | (354 | ) | | | 1,459 | | | | - | | | | 3,425 | |
| | | | | | | | | | | | | | | | | | | | | |
| Balance at December 31, 2007 | | | 2,975 | | | | (342 | ) | | | (2,233 | ) | | | - | | | | 400 | |
| Unrealized gains (losses) | | | (3,806 | ) | | | - | | | | - | | | | - | | | | (3,806 | ) |
| Unrealized losses in fair value | | | - | | | | (1,153 | ) | | | - | | | | - | | | | (1,153 | ) |
Unrecognized amounts from defined benefit pension plans | | | - | | | | - | | | | (8,900 | ) | | | - | | | | (8,900 | ) |
| Tax effect | | | - | | | | 438 | | | | 3,388 | | | | - | | | | 3,826 | |
| Net of tax amount | | | (3,806 | ) | | | (715 | ) | | | (5,512 | ) | | | - | | | | (10,033 | ) |
| | | | | | | | | | | | | | | | | | | | | |
| Balance at December 31, 2008 | | $ | (831 | ) | | $ | (1,057 | ) | | $ | (7,745 | ) | | $ | - | | | $ | (9,633 | ) |
| | | | | | | | | | | | | | | | | | | | | |
The Davey Tree Expert Company
Notes to Consolidated Financial Statements--(Continued)
December 31, 2008
(In thousands, except share data)
Earnings per share is computed as follows (adjusted for the two-for-one stock split):
| | | Year Ended December 31, | |
| | | 2008 | | | 2007 | | | 2006 | |
| Income available to common shareholders: | | | | | | | | | |
| Net income | | $ | 19,021 | | | $ | 18,079 | | | $ | 14,017 | |
| | | | | | | | | | | | | |
| Weighted-average shares: | | | | | | | | | | | | |
| Basic: | | | | | | | | | | | | |
| Outstanding | | | 14,809,035 | | | | 14,730,058 | | | | 15,079,234 | |
| Partially-paid share subscriptions | | | 975,050 | | | | 1,261,894 | | | | 1,394,784 | |
| Basic weighted-average shares | | | 15,784,085 | | | | 15,991,952 | | | | 16,474,018 | |
| | | | | | | | | | | | | |
| Diluted: | | | | | | | | | | | | |
| Basic from above | | | 15,784,085 | | | | 15,991,952 | | | | 16,474,018 | |
| Incremental shares from assumed: | | | | | | | | | | | | |
| Exercise of stock subscription purchase rights | | | 311,070 | | | | 279,418 | | | | 244,010 | |
| Exercise of stock options | | | 655,424 | | | | 572,860 | | | | 741,714 | |
| Diluted weighted-average shares | | | 16,750,579 | | | | 16,844,230 | | | | 17,459,742 | |
| | | | | | | | | | | | | |
| Share data: | | | | | | | | | | | | |
| Earnings per share--basic | | $ | 1.21 | | | $ | 1.13 | | | $ | .85 | |
| Earnings per share--diluted | | $ | 1.14 | | | $ | 1.07 | | | $ | .80 | |
| | | | | | | | | | | | | |
Our operating results are reported in two segments: Residential and Commercial Services, and Utility Services.
Residential and Commercial Services provides for the treatment, preservation, maintenance, cultivation, planting and removal of trees, shrubs and other plant life; its services also include the practice of landscaping, tree surgery, tree feeding, and tree spraying, as well as the application of fertilizer, herbicides and insecticides. Utility Services is principally engaged in the practice of line clearing for investor-owned and municipal utilities, including the clearing of tree growth from power lines, clearance of rights-of-way and chemical brush control. Davey Resource Group, which provides services related to natural resource management and consulting, forestry research and development, and environmental planning and also maintains research, technical support and laboratory diagnostic facilities, is a nonreportable segment and, along with other operating activities, is included in “All Other.”
Measurement of Segment Profit and Loss and Segment Assets--We evaluate performance and allocate resources based primarily on operating income and also actively manage business unit operating assets. The accounting policies of the reportable segments are the same as those described in the summary of significant accounting policies except that (a) we compute and recognize depreciation expense for our segments only by the straight-line method and (b) state income taxes are allocated to the segments. Corporate expenses are substantially allocated among the operating segments, but the nature of expenses allocated may differ from year-to-year. There are no intersegment revenues.
Segment assets are those generated or directly used by each segment, and include accounts receivable, inventory, and property and equipment.
The Davey Tree Expert Company
Notes to Consolidated Financial Statements--(Continued)
December 31, 2008
(In thousands, except share data)
P. Operations by Business Segment and Geographic Information (continued)
Information on reportable segments and reconciliation to the consolidated financial statements follows:
| | | | | | Residential | | | | | | | | | | | |
| | | Utility | | | Commercial | | | All | | | Reconciling | | | | |
| | | Services | | | Services | | | Other | | | Adjustments | | | | Consolidated | |
| | | | | | | | | | | | | | | | | |
| Fiscal Year 2008 | | | | | | | | | | | | | | | | |
| Revenues | | $ | 308,245 | | | $ | 249,457 | | | $ | 38,095 | | | $ | - | | | | $ | 595,797 | |
| Income (loss) from operations | | | 21,624 | | | | 17,786 | | | | 5,249 | | | | (6,803 | ) | (a) | | | 37,856 | |
| Interest expense | | | | | | | | | | | | | | | (3,417 | ) | | | | (3,417 | ) |
| Interest income | | | | | | | | | | | | | | | 220 | | | | | 220 | |
| Other income (expense), net | | | | | | | | | | | | | | | (2,920 | ) | | | | (2,920 | ) |
| Income before income taxes | | | | | | | | | | | | | | | | | | | $ | 31,739 | |
| | | | | | | | | | | | | | | | | | | | | | |
| Depreciation | | $ | 17,932 | | | $ | 12,171 | | | $ | 1,378 | | | $ | 2,893 | | (b) | | $ | 34,374 | |
| Capital expenditures | | | 29,829 | | | | 5,162 | | | | 757 | | | | 1,285 | | | | | 37,033 | |
| Segment assets, total | | | 129,922 | | | | 98,422 | | | | 12,150 | | | | 50,508 | | (c) | | | 291,002 | |
| | | | | | | | | | | | | | | | | | | | | | |
| Fiscal Year 2007 | | | | | | | | | | | | | | | | | | | | | |
| Revenues | | $ | 247,754 | | | $ | 222,756 | | | $ | 35,628 | | | $ | - | | | | $ | 506,138 | |
| Income (loss) from operations | | | 16,145 | | | | 20,096 | | | | 5,066 | | | | (9,227 | ) | (a) | | | 32,080 | |
| Interest expense | | | | | | | | | | | | | | | (3,422 | ) | | | | (3,422 | ) |
| Interest income | | | | | | | | | | | | | | | 404 | | | | | 404 | |
| Other income (expense), net | | | | | | | | | | | | | | | (542 | ) | | | | (542 | ) |
| Income before income taxes | | | | | | | | | | | | | | | | | | | $ | 28,520 | |
| | | | | | | | | | | | | | | | | | | | | | |
| Depreciation | | $ | 13,949 | | | $ | 9,730 | | | $ | 1,123 | | | $ | 3,283 | | (b) | | $ | 28,085 | |
| Capital expenditures | | | 18,343 | | | | 13,052 | | | | 1,192 | | | | 5,000 | | | | | 37,587 | |
| Segment assets, total | | | 96,929 | | | | 73,441 | | | | 11,167 | | | | 50,112 | | (c) | | | 231,649 | |
| | | | | | | | | | | | | | | | | | | | | | |
| Fiscal Year 2006 | | | | | | | | | | | | | | | | | | | | | |
| Revenues | | $ | 233,419 | | | $ | 207,711 | | | $ | 26,404 | | | $ | - | | | | $ | 467,534 | |
| Income (loss) from operations | | | 10,338 | | | | 17,258 | | | | 6,906 | | | | (8,686 | ) | (a) | | | 25,816 | |
| Interest expense | | | | | | | | | | | | | | | (2,768 | ) | | | | (2,768 | ) |
| Interest income | | | | | | | | | | | | | | | 176 | | | | | 176 | |
| Other income (expense), net | | | | | | | | | | | | | | | (1,301 | ) | | | | (1,301 | ) |
| Income before income taxes | | | | | | | | | | | | | | | | | | | $ | 21,923 | |
| | | | | | | | | | | | | | | | | | | | | | |
| Depreciation | | $ | 12,981 | | | $ | 9,543 | | | $ | 738 | | | $ | 3,729 | | (b) | | $ | 26,991 | |
| Capital expenditures | | | 16,602 | | | | 11,407 | | | | 402 | | | | 4,024 | | | | | 32,435 | |
| Segment assets, total | | | 87,149 | | | | 59,566 | | | | 6,645 | | | | 54,724 | | (c) | | | 208,084 | |
| | | | | | | | | | | | | | | | | | | | | | |
Reconciling adjustments from segment reporting to consolidated external financial reporting include unallocated corporate items:
| (a) | Reclassification of depreciation expense and allocation of corporate expenses. |
| (b) | Reduction to straight-line depreciation expense from declining balance method and depreciation and amortization of corporate assets. |
| (c) | Corporate assets include cash, prepaid expenses, corporate facilities, enterprise-wide information systems, intangibles, and deferred and other nonoperating assets. |
The Davey Tree Expert Company
Notes to Consolidated Financial Statements--(Continued)
December 31, 2008
(In thousands, except share data)
P. Operations by Business Segment and Geographic Information (continued)
Geographic Information--The following presents revenues and long-lived assets by geographic territory:
| | | Year Ended December 31, | |
| | | 2008 | | | 2007 | | | 2006 | |
| Revenues | | | | | | | | | |
| | | | | | | | | | |
| United States | | $ | 535,308 | | | $ | 451,078 | | | $ | 424,466 | |
| Canada | | | 60,489 | | | | 55,060 | | | | 43,068 | |
| | | $ | 595,797 | | | $ | 506,138 | | | $ | 467,534 | |
| | | | | | | | | | | | | |
| | | | | | | | | | | | | |
| | | December 31, | |
| | | 2008 | | | 2007 | | | 2006 | |
| Long-lived assets, net | | | | | | | | | | | | |
| | | | | | | | | | | | | |
| United States | | $ | 130,228 | | | $ | 102,966 | | | $ | 92,348 | |
| Canada | | | 15,069 | | | | 17,003 | | | | 13,287 | |
| | | $ | 145,297 | | | $ | 119,969 | | | $ | 105,635 | |
| | | | | | | | | | | | | |
At December 31, 2008, we were contingently liable to our principal banks in the amount of $61,181 for letters of credit outstanding primarily related to insurance coverage.
In certain circumstances, we have performance obligations that are supported by surety bonds in connection with our contractual commitments.
We are party to a number of lawsuits, threatened lawsuits and other claims arising out of the normal course of business. Management is of the opinion that liabilities which may result are adequately covered by insurance, or reflected in the self-insurance accruals, and would not be material in relation to the financial position or results of operations.
On January 1, 2008, we adopted FASB Statement No. 157, “Fair Value Measurements” (“FAS 157”) for our financial assets and financial liabilities, which had no effect on our financial position, results of operations or cash flows. FAS 157 establishes a common definition for fair value to be applied to U.S. GAAP requiring use of fair value, establishes a framework for measuring fair value, and expands presentations about such fair value measurements. FAS 157 indicates, among other things, that a fair value measurement assumes that the transaction to sell an asset or transfer a liability occurs in the principal market for the asset or liability or, in the absence of a principal market, the most advantageous market for the asset or liability. FAS 157 defines fair value based upon an exit price model.
Valuation Hierarchy--FAS 157 establishes a valuation hierarchy for presentation of the inputs to valuation used to measure fair value. This hierarchy prioritizes the inputs into three broad levels. Level 1 inputs are quoted prices (unadjusted) in active markets for identical assets or liabilities. Level 2 inputs are quoted prices for similar assets and liabilities in active markets or inputs that are observable for the asset or liability, either directly or indirectly through market corroboration, for substantially the full term of the financial instrument. Level 3 inputs are unobservable inputs based on our own assumptions used to measure assets and liabilities at fair value. A financial asset or liability’s classification within the hierarchy is determined based on the lowest level input that is significant to the fair value measurement.
The Davey Tree Expert Company
Notes to Consolidated Financial Statements--(Continued)
December 31, 2008
(In thousands, except share data)
R. Fair Value Measurements (continued)
As of December 31, 2008, we held interest rate contracts—cash-flow hedges—to effectively convert a portion of our variable-rate revolving credit borrowings to a fixed rate, thus reducing the impact of interest-rate changes on future interest expense. The fair value of the cash-flow hedges is the amount quoted by the financial institution that we would pay or receive to terminate the agreement.
Our assets and liabilities measured at fair value on a recurring basis subject to the presentation requirements of FAS 157 at December 31, 2008, were as follows:
| | | Total | | | Fair Value Measurements at December 31, 2008 Using: | |
| | | Carrying | | | Quoted prices | | | Significant | | | Significant | |
| | | Value at | | | in | | | other observable | | | unobservable | |
| | | December 31, | | | active markets | | | inputs | | | inputs | |
| Description | | 2008 | | | (Level 1) | | | (Level 2) | | | (Level 3) | |
| | | | | | | | | | | | | |
| Assets: | | $ | - | | | $ | - | | | $ | - | | | $ | - | |
| | | | | | | | | | | | | | | | | |
| Liabilities: | | | | | | | | | | | | | | | | |
| Interest rate contracts, classified as accrued expenses | | $ | 1,704 | | | $ | - | | | $ | 1,704 | | | $ | - | |
The following is a summary of the results of operations for each quarter of 2008 and 2007.
| | | | | | | | | | | | | |
| | | Fiscal 2008, Three Months Ended | |
| | | Mar 29 | | | Jun 28 | | | Sept 27 | | | Dec 31 | |
| | | | | | | | | | | | | |
| Revenues | | $ | 115,599 | | | $ | 158,826 | | | $ | 173,559 | | | $ | 147,813 | |
| Gross profit | | | 36,278 | | | | 58,011 | | | | 63,122 | | | | 56,243 | |
| Income (loss) from operations | | | (940 | ) | | | 17,165 | | | | 12,772 | | | | 8,859 | |
| Net income (loss) | | | (1,334 | ) | | | 9,623 | | | | 6,894 | | | | 3,838 | |
| | | | | | | | | | | | | | | | | |
| Net income (loss) per share -- Basic | | $ | (.09 | ) | | $ | .65 | | | $ | .44 | | | $ | .25 | |
| Net income (loss) per share -- Diluted | | $ | (.09 | ) | | $ | .62 | | | $ | .42 | | | $ | .24 | |
| | | | | | | | | | | | | | | | | |
| ESOT Valuation per share | | $ | 15.80 | | | $ | 16.40 | | | $ | 16.40 | | | $ | 16.40 | |
| | | | | | | | | | | | | | | | | |
| | | Fiscal 2007, Three Months Ended | |
| | | Mar 31 | | | Jun 30 | | | Sept 29 | | | Dec 31 | |
| | | | | | | | | | | | | | | | | |
| Revenues | | $ | 103,841 | | | $ | 143,380 | | | $ | 134,300 | | | $ | 124,617 | |
| Gross profit | | | 32,001 | | | | 55,644 | | | | 48,768 | | | | 45,310 | |
| Income (loss) from operations | | | (1,185 | ) | | | 16,851 | | | | 9,577 | | | | 6,837 | |
| Net income (loss) | | | (1,481 | ) | | | 9,853 | | | | 5,650 | | | | 4,057 | |
| | | | | | | | | | | | | | | | | |
| Net income (loss) per share -- Basic | | $ | (.10 | ) | | $ | .65 | | | $ | .38 | | | $ | .28 | |
| Net income (loss) per share -- Diluted | | $ | (.10 | ) | | $ | .62 | | | $ | .36 | | | $ | .26 | |
| | | | | | | | | | | | | | | | | |
| ESOT Valuation per share | | $ | 12.95 | | | $ | 14.35 | | | $ | 14.35 | | | $ | 15.80 | |
| | | | | | | | | | | | | | | | | |
Fourth quarters 2008 and 2007 include a decrease in casualty insurance expense that had the effect of increasing the fourth quarter gross profit for 2008 and 2007 by approximately $7,355 and $5,618, respectively. | |
* * * * *