Janus Emerging Markets Fund
Additional Information (unaudited)
Mathematical Funds
· For INTECH Global Income Managed Volatility Fund (formerly named INTECH Global Dividend Fund), the Trustees noted that the Fund’s performance was in the second Lipper quartile for the 12 months ended May 31, 2014.
· For INTECH International Managed Volatility Fund (formerly named INTECH International Fund), the Trustees noted that the Fund’s performance was in the second Lipper quartile for the 36 months ended May 31, 2014 and the first Lipper quartile for the 12 months ended May 31, 2014.
· For INTECH U.S. Core Fund, the Trustees noted that the Fund’s performance was in the first Lipper quartile for the 36 months ended May 31, 2014 and the second Lipper quartile for the 12 months ended May 31, 2014.
· For INTECH U.S. Managed Volatility Fund (formerly named INTECH U.S. Value Fund), the Trustees noted that the Fund’s performance was in the first Lipper quartile for the 36 months ended May 31, 2014 and the second Lipper quartile for the 12 months ended May 31, 2014.
· For INTECH U.S. Managed Volatility Fund II (formerly named INTECH U.S. Growth Fund), the Trustees noted that the Fund’s performance was in the second Lipper quartile for the 36 months ended May 31, 2014 and the second Lipper quartile for the 12 months ended May 31, 2014.
Growth and Core Funds
· For Janus Balanced Fund, the Trustees noted that the Fund’s performance was in the first Lipper quartile for the 36 months ended May 31, 2014 and the first Lipper quartile for the 12 months ended May 31, 2014.
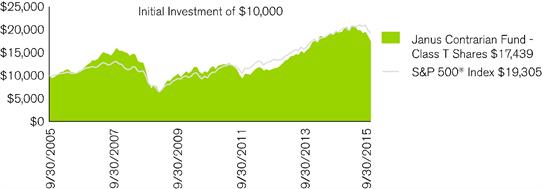
· For Janus Contrarian Fund, the Trustees noted that the Fund’s performance was in the first Lipper quartile for the 36 months ended May 31, 2014 and the first Lipper quartile for the 12 months ended May 31, 2014.
· For Janus Enterprise Fund, the Trustees noted that the Fund’s performance was in the third Lipper quartile for the 36 months ended May 31, 2014 and the third Lipper quartile for the 12 months ended May 31, 2014. The Trustees noted the reasons for the Fund’s underperformance and the steps Janus Capital had taken or was taking to improve performance.
· For Janus Forty Fund, the Trustees noted that the Fund’s performance was in the third Lipper quartile for the 36 months ended May 31, 2014 and the bottom Lipper quartile for the 12 months ended May 31, 2014. The Trustees noted the reasons for the Fund’s underperformance, noting that the Fund has a performance fee structure that results in lower management fees during periods of underperformance, and the steps Janus Capital had taken or was taking to improve performance.
· For Janus Fund, the Trustees noted that the Fund’s performance was in the bottom Lipper quartile for the 36 months ended May 31, 2014 and the third Lipper quartile for the 12 months ended May 31, 2014. The Trustees noted the reasons for the Fund’s underperformance, noting that the Fund has a performance fee structure that results in lower management fees during periods of under-performance, and the steps Janus Capital had taken or was taking to improve performance.
· For Janus Growth and Income Fund, the Trustees noted that the Fund’s performance was in the third Lipper quartile for the 36 months ended May 31, 2014 and in the second Lipper quartile for the 12 months ended May 31, 2014. The Trustees noted the reasons for the Fund’s underperformance, the steps Janus Capital had taken or was taking to improve performance, and that the performance trend was improving.
· For Janus Research Fund, the Trustees noted that the Fund’s performance was in the second Lipper quartile for the 36 months ended May 31, 2014 and the first Lipper quartile for the 12 months ended May 31, 2014.
· For Janus Triton Fund, the Trustees noted that the Fund’s performance was in the first Lipper quartile for the 36 months ended May 31, 2014 and the second Lipper quartile for the 12 months ended May 31, 2014.
· For Janus Twenty Fund, the Trustees noted that the Fund’s performance was in the second Lipper quartile for the 36 months ended May 31, 2014 and the second Lipper quartile for the 12 months ended May 31, 2014.
· For Janus Venture Fund, the Trustees noted that the Fund’s performance was in the first Lipper quartile for the 36 months ended May 31, 2014 and the second Lipper quartile for the 12 months ended May 31, 2014.
Janus Emerging Markets Fund
Additional Information (unaudited)
Global and International Funds
· For Janus Asia Equity Fund, the Trustees noted that the Fund’s performance was in the third Lipper quartile for the 12 months ended May 31, 2014. The Trustees noted the reasons for the Fund’s underperformance, noting that the Fund has a performance fee structure that results in lower management fees during periods of underperformance, and its limited performance history.
· For Janus Emerging Markets Fund, the Trustees noted that the Fund’s performance was in the bottom Lipper quartile for the 36 months ended May 31, 2014 and the second Lipper quartile for the 12 months ended May 31, 2014. The Trustees noted the reasons for the Fund’s underperformance, noting that the Fund has a performance fee structure that results in lower management fees during periods of underperformance, and that the performance trend was improving.
· For Janus Global Life Sciences Fund, the Trustees noted that the Fund’s performance was in the first Lipper quartile for the 36 months ended May 31, 2014 and the first Lipper quartile for the 12 months ended May 31, 2014.
· For Janus Global Real Estate Fund, the Trustees noted that the Fund’s performance was in the second Lipper quartile for the 36 months ended May 31, 2014 and the first Lipper quartile for the 12 months ended May 31, 2014.
· For Janus Global Research Fund, the Trustees noted that the Fund’s performance was in the second Lipper quartile for the 36 months ended May 31, 2014 and the first Lipper quartile for the 12 months ended May 31, 2014.
· For Janus Global Select Fund, the Trustees noted that the Fund’s performance was in the bottom Lipper quartile for the 36 months ended May 31, 2014 and the second Lipper quartile for the 12 months ended May 31, 2014. The Trustees noted the reasons for the Fund’s underperformance, the steps Janus Capital had taken or was taking to improve performance, and that the performance trend was improving.
· For Janus Global Technology Fund, the Trustees noted that the Fund’s performance was in the first Lipper quartile for the 36 months ended May 31, 2014 and the third Lipper quartile for the 12 months ended May 31, 2014.
· For Janus International Equity Fund, the Trustees noted that the Fund’s performance was in the second Lipper quartile for the 36 months ended May 31, 2014 and the third Lipper quartile for the 12 months ended May 31, 2014.
· For Janus Overseas Fund, the Trustees noted that the Fund’s performance was in the bottom Lipper quartile for the 36 months ended May 31, 2014 and the third Lipper quartile for the 12 months ended May 31, 2014. The Trustees noted the reasons for the Fund’s underperformance, noting that the Fund has a performance fee structure that results in lower management fees during periods of underperformance, and the steps Janus Capital had taken or was taking to improve performance.
Preservation Series
· For Janus Preservation Series – Global, the Trustees noted that the Fund’s performance was in the bottom Lipper quartile for the 12 months ended May 31, 2014. The Trustees noted the reasons for the Fund’s underperformance, the steps Janus Capital had taken or was taking to improve performance, and its limited performance history.
· For Janus Preservation Series – Growth, the Trustees noted that the Fund’s performance was in the bottom Lipper quartile for the 36 months ended May 31, 2014 and the bottom Lipper quartile for the 12 months ended May 31, 2014. The Trustees noted the reasons for the Fund’s underperformance, and the steps Janus Capital had taken or was taking to improve performance.
Janus Aspen Series
· For Janus Aspen Balanced Portfolio, the Trustees noted that the Fund’s performance was in the first Lipper quartile for the 36 months ended May 31, 2014 and the first Lipper quartile for the 12 months ended May 31, 2014.
Janus Emerging Markets Fund
Additional Information (unaudited)
· For Janus Aspen Enterprise Portfolio, the Trustees noted that the Fund’s performance was in the third Lipper quartile for the 36 months ended May 31, 2014 and the third Lipper quartile for the 12 months ended May 31, 2014. The Trustees noted the reasons for the Fund’s underperformance and the steps Janus Capital had taken or was taking to improve performance.
· For Janus Aspen Flexible Bond Portfolio, the Trustees noted that the Fund’s performance was in the first Lipper quartile for the 36 months ended May 31, 2014 and the first Lipper quartile for the 12 months ended May 31, 2014.
· For Janus Aspen Forty Portfolio, the Trustees noted that the Fund’s performance was in the third Lipper quartile for the 36 months ended May 31, 2014 and the bottom Lipper quartile for the 12 months ended May 31, 2014. The Trustees noted the reasons for the Fund’s underperformance, noting that the Fund has a performance fee structure that results in lower management fees during periods of underperformance, and the steps Janus Capital had taken or was taking to improve performance.
· For Janus Aspen Global Allocation Portfolio – Moderate, the Trustees noted that the Fund’s performance was in the first Lipper quartile for the 12 months ended May 31, 2014.
· For Janus Aspen Global Research Portfolio, the Trustees noted that the Fund’s performance was in the third Lipper quartile for the 36 months ended May 31, 2014 and the first Lipper quartile for the 12 months ended May 31, 2014. The Trustees noted the reasons for the Fund’s underperformance, noting that the Fund has a performance fee structure that results in lower management fees during periods of underperformance, the steps Janus Capital had taken or was taking to improve performance, and that the performance trend was improving.
· For Janus Aspen Global Technology Portfolio, the Trustees noted that the Fund’s performance was in the second Lipper quartile for the 36 months ended May 31, 2014 and the third Lipper quartile for the 12 months ended May 31, 2014.
· For Janus Aspen INTECH U.S. Low Volatility Portfolio, the Trustees noted that the Fund’s performance was in the first Lipper quartile for the 12 months ended May 31, 2014.
· For Janus Aspen Janus Portfolio, the Trustees noted that the Fund’s performance was in the third Lipper quartile for the 36 months ended May 31, 2014 and the third Lipper quartile for the 12 months ended May 31, 2014. The Trustees noted the reasons for the Fund’s underperformance, noting that the Fund has a performance fee structure that results in lower management fees during periods of underperformance and the steps Janus Capital had taken or was taking to improve performance.
· For Janus Aspen Overseas Portfolio, the Trustees noted that the Fund’s performance was in the bottom Lipper quartile for the 36 months ended May 31, 2014 and the third Lipper quartile for the 12 months ended May 31, 2014. The Trustees noted the reasons for the Fund’s underperformance, noting that the Fund has a performance fee structure that results in lower management fees during periods of underperformance, and the steps Janus Capital had taken or was taking to improve performance.
· For Janus Aspen Perkins Mid Cap Value Portfolio, the Trustees noted that the Fund’s performance was in the bottom Lipper quartile for the 36 months ended May 31, 2014 and the bottom Lipper quartile for the 12 months ended May 31, 2014. The Trustees noted the reasons for the Fund’s underperformance, noting that the Fund has a performance fee structure that results in lower management fees during periods of underperformance, and the steps Janus Capital and Perkins had taken or were taking to improve performance.
· For Janus Aspen Preservation Series – Growth, the Trustees noted that the Fund’s performance was in the bottom Lipper quartile for the 12 months ended May 31, 2014. The Trustees noted the reasons for the Fund’s underperformance and its limited performance history.
In consideration of each Fund’s performance, the Trustees concluded that, taking into account the factors relevant to performance, as well as other considerations, including steps taken to improve performance, the Fund’s performance warranted continuation of the Fund’s investment advisory agreement(s).
Janus Emerging Markets Fund
Additional Information (unaudited)
Costs of Services Provided
The Trustees examined information regarding the fees and expenses of each Fund in comparison to similar information for other comparable funds as provided by an independent data provider. They also reviewed an analysis of that information provided by their independent fee consultant and noted that the rate of management (investment advisory and any administration, but excluding out-of-pocket costs) fees for many of the Funds, after applicable waivers, was below the mean management fee rate of the respective peer group of funds selected by an independent data provider. The Trustees also examined information regarding the subadvisory fees charged for subadvisory services, as applicable, noting that all such fees were paid by Janus Capital out of its management fees collected from such Fund.
In this regard, the independent fee consultant provided its belief that the management fees charged by Janus Capital to each of the Funds under the current investment advisory and administration agreements are reasonable in relation to the services provided by Janus Capital. The independent fee consultant found: (1) the total expenses and management fees of the Funds to be reasonable relative to other mutual funds; (2) total expenses, on average, were 19% below the mean total expenses of their respective Lipper Expense Group peers and 29% below the mean total expenses for their Lipper Expense Universes; (3) management fees for the Funds, on average, were 15% below the mean management fees for their Expense Groups and 20% below the mean for their Expense Universes; and (4) Janus fund expenses at the functional level for each asset and share class category were reasonable. The Trustees also considered how the total expenses for each share class of each Fund compared to the mean total expenses for its Lipper Expense Group peers and to mean total expenses for its Lipper Expense Universe.
The independent fee consultant concluded that, based on its strategic review of expenses at the complex, category and individual fund level, Fund expenses were found to be reasonable relative to both Expense Group and Expense Universe benchmarks. Further, for certain Funds, the independent fee consultant also performed a systematic “focus list” analysis of expenses in the context of the performance or service delivered to each set of investors in each share class in each selected Fund. Based on this analysis, the independent fee consultant found that the combination of service quality/performance and expenses on these individual Funds and share classes were reasonable in light of performance trends, performance histories, and existence of performance fees on such Funds.
The Trustees considered the methodology used by Janus Capital and each subadviser in determining compensation payable to portfolio managers, the competitive environment for investment management talent, and the competitive market for mutual funds in different distribution channels.
The Trustees also reviewed management fees charged by Janus Capital and each subadviser to comparable separate account clients and to comparable non-affiliated funds subadvised by Janus Capital or by a subadviser (for which Janus Capital or the subadviser provides only or primarily portfolio management services). Although in most instances subadvisory and separate account fee rates for various investment strategies were lower than management fee rates for Funds having a similar strategy, the Trustees considered that Janus Capital noted that, under the terms of the management agreements with the Funds, Janus Capital performs significant additional services for the Funds that it does not provide to those other clients, including administration services, oversight of the Funds’ other service providers, trustee support, regulatory compliance and numerous other services, and that, in serving the Funds, Janus Capital assumes many legal risks that it does not assume in servicing its other clients. Moreover, they noted that the independent fee consultant found that: (1) the management fees Janus Capital charges to the Funds are reasonable in relation to the management fees Janus Capital charges to its institutional and subadvised accounts; (2) these institutional and subadvised accounts have different service and infrastructure needs; (3) the average spread between management fees charged to the Funds and those charged to Janus Capital’s institutional accounts is reasonable relative to the average spreads seen in the industry; and (4) the retained fee margins implied by Janus Capital’s subadvised fees when compared to its mutual fund fees are reasonable relative to retained fee margins in the industry.
The Trustees considered the fees for each Fund for its fiscal year ended in 2013, and noted the following with regard to each Fund’s total expenses, net of applicable fee waivers (the Fund’s “total expenses”):
Fixed-Income Funds and Money Market Funds
· For Janus Flexible Bond Fund, the Trustees noted that, although the Fund’s total expenses exceeded the peer group mean for certain share classes, overall the Fund’s total expenses were reasonable. The Trustees also noted that Janus Capital has contractually agreed to limit the Fund’s expenses, although this limit did not apply because the Fund’s total expenses were already below the applicable fee limit.
Janus Emerging Markets Fund
Additional Information (unaudited)
· For Janus Global Bond Fund, the Trustees noted that although the Fund’s total expenses were equal to or below the peer group mean for all share classes, overall the Fund’s total expenses were reasonable. The Trustees also noted that Janus Capital has contractually agreed to limit the Fund’s expenses.
· For Janus High-Yield Fund, the Trustees noted that, although the Fund’s total expenses exceeded the peer group mean for certain share classes, overall the Fund’s total expenses were reasonable. The Trustees also noted that Janus Capital has contractually agreed to limit the Fund’s expenses, although this limit did not apply because the Fund’s total expenses were already below the applicable fee limit.
· For Janus Real Return Fund, the Trustees noted that, although the Fund’s total expenses exceeded the peer group mean for all share classes, overall the Fund’s total expenses were reasonable. The Trustees also noted that Janus Capital has contractually agreed to limit the Fund’s expenses.
· For Janus Short-Term Bond Fund, the Trustees noted that, although the Fund’s total expenses exceeded the peer group mean for certain share classes, overall the Fund’s total expenses were reasonable. The Trustees also noted that Janus Capital has contractually agreed to limit the Fund’s expenses.
· For Janus Government Money Market Fund, the Trustees noted that the Fund’s total expenses exceeded the peer group mean for both share classes. The Trustees considered that management fees for this Fund are higher than the peer group mean due to the Fund’s management fee including other costs, such as custody and transfer agent services, while many funds in the peer group pay these expenses separately from their management fee. In addition, the Trustees considered that Janus Capital voluntarily waives one-half of its advisory fee and other expenses in order to maintain a positive yield.
· For Janus Money Market Fund, the Trustees noted that the Fund’s total expenses were below the peer group mean for both share classes. In addition, the Trustees considered that Janus Capital voluntarily waives one-half of its advisory fee and other expenses in order to maintain a positive yield.
Asset Allocation Funds
· For Janus Global Allocation Fund – Conservative, the Trustees noted that the Fund’s total expenses were below the peer group mean for all share classes.
· For Janus Global Allocation Fund – Growth, the Trustees noted that the Fund’s total expenses were below the peer group mean for all share classes.
· For Janus Global Allocation Fund – Moderate, the Trustees noted that the Fund’s total expenses were below the peer group mean for all share classes.
Alternative Funds
· For Janus Diversified Alternatives Fund, the Trustees noted that, although the Fund’s total expenses exceeded the peer group mean for one share class, overall the Fund’s total expenses were reasonable. The Trustees also noted that Janus Capital has contractually agreed to limit the Fund’s expenses.
Value Funds
· For Perkins International Value Fund, the Trustees noted that, although the Fund’s total expenses exceeded the peer group mean for certain share classes, overall the Fund’s total expenses were reasonable. The Trustees also noted that Janus Capital has contractually agreed to limit the Fund’s expenses.
· For Perkins Global Value Fund, the Trustees noted that the Fund’s total expenses were below the peer group mean for all share classes.
· For Perkins Large Cap Value Fund, the Trustees noted that, although the Fund’s total expenses exceeded the peer group mean for one share class, overall the Fund’s total expenses were reasonable. The Trustees also noted that Janus Capital has contractually agreed to limit the Fund’s expenses.
· For Perkins Mid Cap Value Fund, the Trustees noted that, although the Fund’s total expenses exceeded the peer group mean for one share class, overall the Fund’s total expenses were reasonable. The Trustees also noted that Janus Capital has contractually agreed to limit the Fund’s expenses, although this limit did not apply because the Fund’s total expenses were already below the applicable fee limit.
Janus Emerging Markets Fund
Additional Information (unaudited)
· For Perkins Select Value Fund, the Trustees noted that, although the Fund’s total expenses exceeded the peer group mean for one share class, overall the Fund’s total expenses were reasonable. The Trustees also noted that Janus Capital has contractually agreed to limit the Fund’s expenses.
· For Perkins Small Cap Value Fund, the Trustees noted that, although the Fund’s total expenses exceeded the peer group mean for one share class, overall the Fund’s total expenses were reasonable. The Trustees also noted that Janus Capital has contractually agreed to limit the Fund’s expenses, although this limit did not apply because the Fund’s total expenses were already below the applicable fee limit.
· For Perkins Value Plus Income Fund, the Trustees noted that the Fund’s total expenses were below the peer group mean for all share classes.
Mathematical Funds
· For INTECH Global Income Managed Volatility Fund (formerly named INTECH Global Dividend Fund), the Trustees noted that the Fund’s total expenses were below the peer group mean for all share classes.
· For INTECH International Managed Volatility Fund (formerly named INTECH International Fund), the Trustees noted that the Fund’s total expenses were below the peer group mean for all share classes.
· For INTECH U.S. Core Fund, the Trustees noted that the Fund’s total expenses were below the peer group mean for all share classes.
· For INTECH U.S. Managed Volatility Fund (formerly named INTECH U.S. Value Fund), the Trustees noted that the Fund’s total expenses were below the peer group mean for all share classes.
· For INTECH U.S. Managed Volatility Fund II (formerly named INTECH U.S. Growth Fund), the Trustees noted that the Fund’s total expenses were below the peer group mean for all share classes.
Growth and Core Funds
· For Janus Balanced Fund, the Trustees noted that, although the Fund’s total expenses exceeded the peer group mean for certain share classes, overall the Fund’s total expenses were reasonable. The Trustees also noted that Janus Capital has contractually agreed to limit the Fund’s expenses, although this limit did not apply because the Fund’s total expenses were already below the applicable fee limit.
· For Janus Contrarian Fund, the Trustees noted that, although the Fund’s total expenses exceeded the peer group mean for one share class, overall the Fund’s total expenses were reasonable. The Trustees also noted that Janus Capital has contractually agreed to limit the Fund’s expenses, although this limit did not apply because the Fund’s total expenses were already below the applicable fee limit.
· For Janus Enterprise Fund, the Trustees noted that, although the Fund’s total expenses exceeded the peer group mean for certain share classes, overall the Fund’s total expenses were reasonable. The Trustees also noted that Janus Capital has contractually agreed to limit the Fund’s expenses, although this limit did not apply because the Fund’s total expenses were already below the applicable fee limit.
· For Janus Forty Fund, the Trustees noted that, although the Fund’s total expenses exceeded the peer group mean for one share class, overall the Fund’s total expenses were reasonable. The Trustees also noted that Janus Capital has contractually agreed to limit the Fund’s expenses, although this limit did not apply because the Fund’s total expenses were already below the applicable fee limit.
· For Janus Fund, the Trustees noted that the Fund’s total expenses were below the peer group mean for all share classes.
· For Janus Growth and Income Fund, the Trustees noted that, although the Fund’s total expenses exceeded the peer group mean for certain share classes, overall the Fund’s total expenses were reasonable. The Trustees also noted that Janus Capital has contractually agreed to limit the Fund’s expenses, although this limit did not apply because the Fund’s total expenses were already below the applicable fee limit.
· For Janus Research Fund, the Trustees noted that the Fund’s total expenses were below the peer group mean for all share classes.
Janus Emerging Markets Fund
Additional Information (unaudited)
· For Janus Triton Fund, the Trustees noted that, although the Fund’s total expenses exceeded the peer group mean for one share class, overall the Fund’s total expenses were reasonable. The Trustees also noted that Janus Capital has contractually agreed to limit the Fund’s expenses, although this limit did not apply because the Fund’s total expenses were already below the applicable fee limit.
· For Janus Twenty Fund, the Trustees noted that the Fund’s total expenses were below the peer group mean for all share classes.
· For Janus Venture Fund, the Trustees noted that the Fund’s total expenses were below the peer group mean for all share classes.
Global and International Funds
· For Janus Asia Equity Fund, the Trustees noted that the Fund’s total expenses were below the peer group mean for all share classes.
· For Janus Emerging Markets Fund, the Trustees noted that the Fund’s total expenses were below the peer group mean for all share classes.
· For Janus Global Life Sciences Fund, the Trustees noted that the Fund’s total expenses were below the peer group mean for all share classes.
· For Janus Global Real Estate Fund, the Trustees noted that, although the Fund’s total expenses exceeded the peer group mean for one share class, overall the Fund’s total expenses were reasonable. The Trustees also noted that Janus Capital has contractually agreed to limit the Fund’s expenses.
· For Janus Global Research Fund, the Trustees noted that the Fund’s total expenses were below the peer group mean for all share classes.
· For Janus Global Select Fund, the Trustees noted that, although the Fund’s total expenses exceeded the peer group mean for one share class, overall the Fund’s total expenses were reasonable. The Trustees also noted that Janus Capital has contractually agreed to limit the Fund’s expenses, although this limit did not apply because the Fund’s total expenses were already below the applicable fee limit.
· For Janus Global Technology Fund, the Trustees noted that the Fund’s total expenses were below the peer group mean for all share classes.
· For Janus International Equity Fund, the Trustees noted that, although the Fund’s total expenses exceeded the peer group mean for one share class, overall the Fund’s total expenses were reasonable. The Trustees also noted that Janus Capital has contractually agreed to limit the Fund’s expenses, although this limit did not apply because the Fund’s total expenses were already below the applicable fee limit.
· For Janus Overseas Fund, the Trustees noted that the Fund’s total expenses were below the peer group mean for all share classes.
Preservation Series
· For Janus Preservation Series – Global, the Trustees noted that the Fund’s total expenses were below the peer group mean for all share classes.
· For Janus Preservation Series - Growth, the Trustees noted that the Fund’s total expenses were below the peer group mean for all share classes.
Janus Aspen Series
· For Janus Aspen Balanced Portfolio, the Trustees noted that the Fund’s total expenses were below the peer group mean for both share classes.
· For Janus Aspen Enterprise Portfolio, the Trustees noted that the Fund’s total expenses were below the peer group mean for both share classes.
· For Janus Aspen Flexible Bond Portfolio, the Trustees noted that the Fund’s total expenses were below the peer group mean for both share classes.
Janus Emerging Markets Fund
Additional Information (unaudited)
· For Janus Aspen Forty Portfolio, the Trustees noted that the Fund’s total expenses were below the peer group mean for both share classes.
· For Janus Aspen Global Allocation Portfolio - Moderate, the Trustees noted that, although the Fund’s total expenses exceeded the peer group mean for both share classes, overall the Fund’s total expenses were reasonable. The Trustees also noted that Janus Capital has contractually agreed to limit the Fund’s expenses.
· For Janus Aspen Global Research Portfolio, the Trustees noted that the Fund’s total expenses were below the peer group mean for both share classes.
· For Janus Aspen Global Technology Portfolio, the Trustees noted that the Fund’s total expenses were below the peer group mean for both share classes.
· For Janus Aspen INTECH U.S. Low Volatility Portfolio, the Trustees noted that, although the Fund’s total expenses were above the peer group mean for its sole share class, overall the Fund’s total expenses were reasonable. The Trustees also noted that Janus Capital has contractually agreed to limit the Fund’s expenses, although this limit did not apply because the Fund’s total expenses were already below the applicable limit.
· For Janus Aspen Janus Portfolio, the Trustees noted that the Fund’s total expenses were below the peer group mean for both share classes.
· For Janus Aspen Overseas Portfolio, the Trustees noted that the Fund’s total expenses were below the peer group mean for both share classes.
· For Janus Aspen Perkins Mid Cap Value Portfolio, the Trustees noted that the Fund’s total expenses were below the peer group mean for both share classes.
· For Janus Aspen Preservation Series - Growth, the Trustees noted that the Fund’s total expenses were below the peer group mean for both share classes.
The Trustees reviewed information on the profitability to Janus Capital and its affiliates of their relationships with each Fund, as well as an explanation of the methodology utilized by Janus Capital when allocating various expenses of Janus Capital and its affiliates with respect to contractual relationships with the Funds and other clients. The Trustees also reviewed the financial statements and corporate structure of Janus Capital’s parent company. In their review, the Trustees considered whether Janus Capital and each subadviser receive adequate incentives to manage the Funds effectively. The Trustees recognized that profitability comparisons among fund managers are difficult because very little comparative information is publicly available, and the profitability of any fund manager is affected by numerous factors, including the organizational structure of the particular fund manager, the types of funds and other accounts it manages, possible other lines of business, the methodology for allocating expenses, and the fund manager’s capital structure and cost of capital. However, taking into account those factors and the analysis provided by the Trustees’ independent fee consultant, and based on the information available, the Trustees concluded that Janus Capital’s profitability with respect to each Fund in relation to the services rendered was not unreasonable.
In this regard, the independent fee consultant found that, while assessing the reasonableness of expenses in light of Janus Capital’s profits is dependent on comparisons with other publicly-traded mutual fund advisers, and that these comparisons are limited in accuracy by differences in complex size, business mix, institutional account orientation, and other factors, after accepting these limitations, the level of profit earned by Janus Capital from managing the Funds is reasonable.
The Trustees concluded that the management fees and other compensation payable by each Fund to Janus Capital and its affiliates, as well as the fees paid by Janus Capital to the subadvisers of subadvised Funds, were reasonable in relation to the nature, extent, and quality of the services provided, taking into account the fees charged by other advisers for managing comparable mutual funds with similar strategies, the fees Janus Capital and the subadvisers charge to other clients, and, as applicable, the impact of fund performance on management fees payable by the Funds. The Trustees also concluded that each Fund’s total expenses were reasonable, taking into account the size of the Fund, the quality of services provided by Janus Capital and any subadviser, the investment performance of the Fund, and any expense limitations agreed to or provided by Janus Capital.
Janus Emerging Markets Fund
Additional Information (unaudited)
Economies of Scale
The Trustees considered information about the potential for Janus Capital to realize economies of scale as the assets of the Funds increase. They noted that their independent fee consultant had provided analysis of economies of scale during prior years. They also noted that, although many Funds pay advisory fees at a base fixed rate as a percentage of net assets, without any breakpoints, the base contractual management fee rate paid by most of the Funds, before any adjustment for performance, if applicable, was below the mean contractual management fee rate of the Fund’s peer group identified by an independent data provider. They also noted that for those Funds whose expenses are being reduced by the contractual expense limitations of Janus Capital, Janus Capital is subsidizing the Funds because they have not reached adequate scale. Moreover, as the assets of many of the Funds have declined in the past few years, certain Funds have benefited from having advisory fee rates that have remained constant rather than increasing as assets declined. In addition, performance fee structures have been implemented for various Funds that have caused the effective rate of advisory fees payable by such a Fund to vary depending on the investment performance of the Fund relative to its benchmark index over the measurement period; and a few Funds have fee schedules with breakpoints and reduced fee rates above certain asset levels. The Trustees also noted that the Funds share directly in economies of scale through the lower charges of third-party service providers that are based in part on the combined scale of all of the Funds. Based on all of the information they reviewed, including research and analysis conducted by the Trustees’ independent fee consultant, the Trustees concluded that the current fee structure of each Fund was reasonable and that the current rates of fees do reflect a sharing between Janus Capital and the Fund of any economies of scale that may be present at the current asset level of the Fund.
In this regard, the independent fee consultant concluded that, given the limitations of various analytical approaches to economies of scale considered in prior years, and their conflicting results, it could not confirm or deny the existence of economies of scale in the Janus complex. Further, the independent fee consultant provided its belief that Fund investors are well-served by the fee levels and performance fee structures in place on the Funds in light of any economies of scale that may be present at Janus Capital.
Other Benefits to Janus Capital
The Trustees also considered benefits that accrue to Janus Capital and its affiliates and subadvisers to the Funds from their relationships with the Funds. They recognized that two affiliates of Janus Capital separately serve the Funds as transfer agent and distributor, respectively, and the transfer agent receives compensation directly from the non-money market funds for services provided. The Trustees also considered Janus Capital’s past and proposed use of commissions paid by the Funds on their portfolio brokerage transactions to obtain proprietary and third-party research products and services benefiting the Fund and/or other clients of Janus Capital and/or a subadviser to a Fund. The Trustees concluded that Janus Capital’s and the subadvisers’ use of these types of client commission arrangements to obtain proprietary and third-party research products and services was consistent with regulatory requirements and guidelines and was likely to benefit each Fund. The Trustees also concluded that, other than the services provided by Janus Capital and its affiliates and subadvisers pursuant to the agreements and the fees to be paid by each Fund therefor, the Funds and Janus Capital and the subadvisers may potentially benefit from their relationship with each other in other ways. They concluded that Janus Capital and/or the subadvisers benefits from the receipt of research products and services acquired through commissions paid on portfolio transactions of the Funds and that the Funds benefit from Janus Capital’s and/or the subadvisers’ receipt of those products and services as well as research products and services acquired through commissions paid by other clients of Janus Capital and/or other clients of the subadvisers. They further concluded that the success of any Fund could attract other business to Janus Capital, the subadvisers or other Janus funds, and that the success of Janus Capital and the subadvisers could enhance Janus Capital’s and the subadvisers’ ability to serve the Funds.
Janus Emerging Markets Fund
Useful Information About Your Fund Report (unaudited)
Management Commentary
The Management Commentary in this report includes valuable insight as well as statistical information to help you understand how your Fund’s performance and characteristics stack up against those of comparable indices.
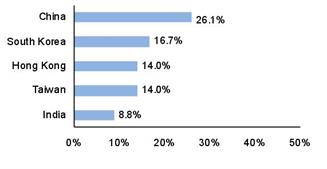
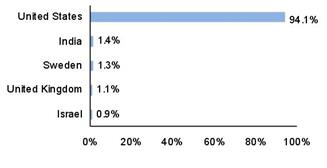
If the Fund invests in foreign securities, this report may include information about country exposure. Country exposure is based primarily on the country of risk. A company may be allocated to a country based on other factors such as location of the company’s principal office, the location of the principal trading market for the company’s securities, or the country where a majority of the company’s revenues are derived.
Please keep in mind that the opinions expressed in the Management Commentary are just that: opinions. They are a reflection based on best judgment at the time this report was compiled, which was September 30, 2015. As the investing environment changes, so could opinions. These views are unique and are not necessarily shared by fellow employees or by Janus in general.
Performance Overviews
Performance overview graphs compare the performance of a hypothetical $10,000 investment in the Fund with one or more widely used market indices. When comparing the performance of the Fund with an index, keep in mind that market indices are not available for investment and do not reflect deduction of expenses.
Average annual total returns are quoted for a Fund with more than one year of performance history. Average annual total return is calculated by taking the growth or decline in value of an investment over a period of time, including reinvestment of dividends and distributions, then calculating the annual compounded percentage rate that would have produced the same result had the rate of growth been constant throughout the period. Average annual total return does not reflect the deduction of taxes that a shareholder would pay on Fund distributions or redemptions of Fund shares.
Cumulative total returns are quoted for a Fund with less than one year of performance history. Cumulative total return is the growth or decline in value of an investment over time, independent of the period of time involved. Cumulative total return does not reflect the deduction of taxes that a shareholder would pay on Fund distributions or redemptions of Fund shares.
Pursuant to federal securities rules, expense ratios shown in the performance chart reflect subsidized (if applicable) and unsubsidized ratios. The total annual fund operating expenses ratio is gross of any fee waivers, reflecting the Fund’s unsubsidized expense ratio. The net annual fund operating expenses ratio (if applicable) includes contractual waivers of Janus Capital and reflects the Fund’s subsidized expense ratio. Ratios may be higher or lower than those shown in the “Financial Highlights” in this report.
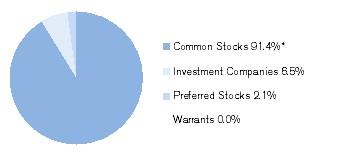
Schedule of Investments
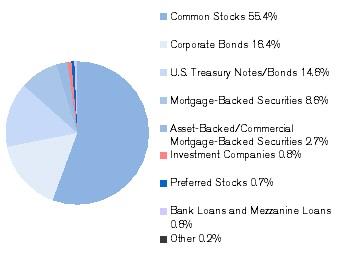
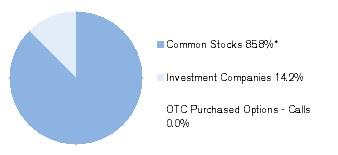
Following the performance overview section is the Fund’s Schedule of Investments. This schedule reports the types of securities held in the Fund on the last day of the reporting period. Securities are usually listed by type (common stock, corporate bonds, U.S. Government obligations, etc.) and by industry classification (banking, communications, insurance, etc.). Holdings are subject to change without notice.
The value of each security is quoted as of the last day of the reporting period. The value of securities denominated in foreign currencies is converted into U.S. dollars.
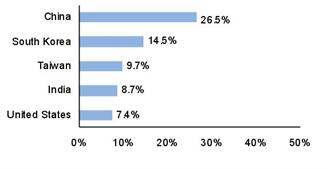
If the Fund invests in foreign securities, it will also provide a summary of investments by country. This summary reports the Fund exposure to different countries by providing the percentage of securities invested in each country. The country of each security represents the country of risk. The Fund’s Schedule of Investments relies upon the industry group and country classifications published by Barclays and/or MSCI Inc.
Tables listing details of individual forward currency contracts, futures, written options, and swaps follow the Fund’s Schedule of Investments (if applicable).
Statement of Assets and Liabilities
This statement is often referred to as the “balance sheet.” It lists the assets and liabilities of the Fund on the last day of the reporting period.
Janus Emerging Markets Fund
Useful Information About Your Fund Report (unaudited)
The Fund’s assets are calculated by adding the value of the securities owned, the receivable for securities sold but not yet settled, the receivable for dividends declared but not yet received on securities owned, and the receivable for Fund shares sold to investors but not yet settled. The Fund’s liabilities include payables for securities purchased but not yet settled, Fund shares redeemed but not yet paid, and expenses owed but not yet paid. Additionally, there may be other assets and liabilities such as unrealized gain or loss on forward currency contracts.
The section entitled “Net Assets Consist of” breaks down the components of the Fund’s net assets. Because the Fund must distribute substantially all earnings, you will notice that a significant portion of net assets is shareholder capital.
The last section of this statement reports the net asset value (“NAV”) per share on the last day of the reporting period. The NAV is calculated by dividing the Fund’s net assets for each share class (assets minus liabilities) by the number of shares outstanding.
Statement of Operations
This statement details the Fund’s income, expenses, realized gains and losses on securities and currency transactions, and changes in unrealized appreciation or depreciation of Fund holdings.
The first section in this statement, entitled “Investment Income,” reports the dividends earned from securities and interest earned from interest-bearing securities in the Fund.
The next section reports the expenses incurred by the Fund, including the advisory fee paid to the investment adviser, transfer agent fees and expenses, and printing and postage for mailing statements, financial reports and prospectuses. Expense offsets and expense reimbursements, if any, are also shown.
The last section lists the amounts of realized gains or losses from investment and foreign currency transactions, and changes in unrealized appreciation or depreciation of investments and foreign currency-denominated assets and liabilities. The Fund will realize a gain (or loss) when it sells its position in a particular security. A change in unrealized gain (or loss) refers to the change in net appreciation or depreciation of the Fund during the reporting period. “Net Realized and Unrealized Gain/(Loss) on Investments” is affected both by changes in the market value of Fund holdings and by gains (or losses) realized during the reporting period.
Statements of Changes in Net Assets
These statements report the increase or decrease in the Fund’s net assets during the reporting period. Changes in the Fund’s net assets are attributable to investment operations, dividends and distributions to investors, and capital share transactions. This is important to investors because it shows exactly what caused the Fund’s net asset size to change during the period.
The first section summarizes the information from the Statement of Operations regarding changes in net assets due to the Fund’s investment operations. The Fund’s net assets may also change as a result of dividend and capital gains distributions to investors. If investors receive their dividends and/or distributions in cash, money is taken out of the Fund to pay the dividend and/or distribution. If investors reinvest their dividends and/or distributions, the Fund’s net assets will not be affected. If you compare the Fund’s “Net Decrease from Dividends and Distributions” to “Reinvested Dividends and Distributions,” you will notice that dividends and distributions have little effect on the Fund’s net assets. This is because the majority of the Fund’s investors reinvest their dividends and/or distributions.
The reinvestment of dividends and distributions is included under “Capital Share Transactions.” “Capital Shares” refers to the money investors contribute to the Fund through purchases or withdrawals via redemptions. The Fund’s net assets will increase and decrease in value as investors purchase and redeem shares from the Fund.
Financial Highlights
This schedule provides a per-share breakdown of the components that affect the Fund’s NAV for current and past reporting periods as well as total return, asset size, ratios, and portfolio turnover rate.
The first line in the table reflects the NAV per share at the beginning of the reporting period. The next line reports the net investment income/(loss) per share. Following is the per share total of net gains/(losses), realized and unrealized. Per share dividends and distributions to investors are then subtracted to arrive at the NAV per share at the end of the period. The next line reflects the total return for the period. The total return may include adjustments in accordance with generally accepted accounting principles required at the period end for financial reporting purposes. As a result, the