Returns quoted are past performance and do not guarantee future results; current performance may be lower or higher. Investment returns and principal value will vary; there may be a gain or loss when shares are sold. For the most recent month-end performance call 800.668.0434 (or 800.525.3713 if you hold shares directly with Janus Henderson) or visit janushenderson.com/performance (or janushenderson.com/allfunds if you hold shares directly with Janus Henderson).
Maximum Offering Price (MOP) returns include the maximum sales charge of 5.75%. Net Asset Value (NAV) returns exclude this charge, which would have reduced returns.
CDSC returns include a 1% contingent deferred sales charge (CDSC) on Shares redeemed within 12 months of purchase. Net Asset Value (NAV) returns exclude this charge, which would have reduced returns.
Net expense ratios reflect the expense waiver, if any, contractually agreed to through February 1, 2019.
The expense ratios shown are estimated.
Performance may be affected by risks that include those associated with non-diversification, portfolio turnover, short sales, potential conflicts of interest,
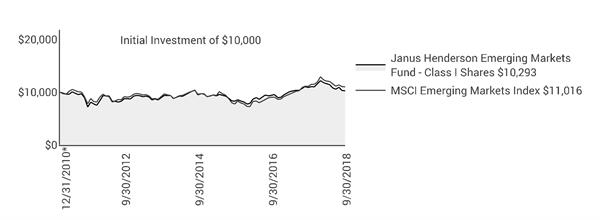
Janus Henderson Emerging Markets Fund (unaudited)
Performance
foreign and emerging markets, initial public offerings (IPOs), high-yield and high-risk securities, undervalued, overlooked and smaller capitalization companies, real estate related securities including Real Estate Investment Trusts (REITs), derivatives, and commodity-linked investments. Each product has different risks. Please see the prospectus for more information about risks, holdings and other details.
The Fund will normally invest at least 80% of its net assets, measured at the time of purchase, in the type of securities described by its name.
Returns include reinvestment of all dividends and distributions and do not reflect the deduction of taxes that a shareholder would pay on Fund distributions or redemptions of Fund shares. The returns do not include adjustments in accordance with generally accepted accounting principles required at the period end for financial reporting purposes.
See Financial Highlights for actual expense ratios during the reporting period.
Returns of the Fund shown prior to June 5, 2017 are those for Henderson Emerging Markets Fund (the “Predecessor Fund”), which merged into the Fund after the close of business on June 2, 2017. The Predecessor Fund was advised by Henderson Global Investors (North America) Inc. and subadvised by Henderson Investment Management Limited. Class A Shares, Class C Shares, Class I Shares, and Class R6 Shares of the Predecessor Fund were reorganized into Class A Shares, Class C Shares, Class I Shares, and Class N Shares, respectively, of the Fund. In connection with this reorganization, certain shareholders of the Predecessor Fund who held shares directly with the Predecessor Fund and not through an intermediary had the Class A Shares, Class C Shares, Class I Shares, and Class N Shares of the Fund received in the reorganization automatically exchanged for Class D Shares of the Fund following the reorganization. Class A Shares, Class C Shares and Class I Shares of the Predecessor Fund commenced operations with the Predecessor Fund’s inception on December 31, 2010. Class R6 Shares of the Predecessor Fund commenced operations on November 30, 2015. Class D Shares, Class S Shares, and Class T Shares commenced operations on June 5, 2017.
Performance of Class A Shares shown for periods prior to June 5, 2017, reflects the performance of Class A Shares of the Predecessor Fund, calculated using the fees and expenses of Class A Shares of the Predecessor Fund, in effect during the periods shown, net of any applicable fee and expense limitations or waivers.
Performance of Class C Shares shown for periods prior to June 5, 2017, reflects the performance of Class C Shares of the Predecessor Fund, calculated using the fees and expenses of Class C Shares of the Predecessor Fund, in effect during the periods shown, net of any applicable fee and expense limitations or waivers.
Performance of Class I Shares shown for periods prior to June 5, 2017, reflects the performance of Class I Shares of the Predecessor Fund, calculated using the fees and expenses of Class I Shares of the Predecessor Fund, in effect during the periods shown, net of any applicable fee and expense limitations or waivers.
Performance of Class N Shares shown for periods prior to June 5, 2017, reflects the performance of Class R6 Shares of the Predecessor Fund, calculated using the fees and expenses of Class R6 Shares of the Predecessor Fund, in effect during the periods shown, net of any applicable fee and expense limitations or waivers, except that for periods prior to November 30, 2015, performance for Class N Shares reflects the performance of Class I Shares of the Predecessor Fund, calculated using the estimated fees and expenses of Class N Shares, net of any applicable fee and expense limitations or waivers.
Performance of Class S Shares shown for periods prior to June 5, 2017, reflects the performance of Class I Shares of the Predecessor Fund, calculated using the estimated fees and expenses of Class S Shares, net of any applicable fee and expense limitations or waivers.
Performance of Class T Shares shown for periods prior to June 5, 2017, reflects the performance of Class I Shares of the Predecessor Fund, calculated using the estimated fees and expenses of Class T Shares, net of any applicable fee and expense limitations or waivers.
Performance of Class D Shares shown for periods prior to June 5, 2017, reflects the performance of Class I Shares of the Predecessor Fund, calculated using the estimated fees and expenses of Class D Shares, net of any applicable fee and expense limitations or waivers.
If each share class of the Fund had been available during periods prior to its commencement, the performance shown may have been different. The performance shown for periods following the Fund’s commencement of each share class reflects the fees and expenses of each respective share class, net of any applicable fee and expense limitations or waivers. Please refer to the Fund’s prospectuses for further details concerning historical performance.
Ranking is for the share class shown only; other classes may have different performance characteristics. When an expense waiver is in effect, it may have a material effect on the total return, and therefore the ranking for the period.
© 2018 Morningstar, Inc. All Rights Reserved.
There is no assurance that the investment process will consistently lead to successful investing.
See Notes to Schedule of Investments and Other Information for index definitions.
Index performance does not reflect the expenses of managing a portfolio as an index is unmanaged and not available for direct investment.
See “Useful Information About Your Fund Report.”
*The Predecessor Fund’s inception date – December 31, 2010
(1) Closed to certain new investors.
Janus Henderson Emerging Markets Fund (unaudited)
Expense Examples
As a shareholder of the Fund, you incur two types of costs: (1) transaction costs, such as sales charges (loads) on purchase payments (applicable to Class A Shares only); and (2) ongoing costs, including management fees; 12b-1 distribution and shareholder servicing fees; transfer agent fees and expenses payable pursuant to the Transfer Agency Agreement; and other Fund expenses. This example is intended to help you understand your ongoing costs (in dollars) of investing in the Fund and to compare these costs with the ongoing costs of investing in other mutual funds. To do so, compare this 5% hypothetical example with the 5% hypothetical examples that appear in the shareholder reports of the other funds. The example is based upon an investment of $1,000 invested at the beginning of the period and held for the six-months indicated, unless noted otherwise in the table and footnotes below.
Actual Expenses
The information in the table under the heading “Actual” provides information about actual account values and actual expenses. You may use the information in these columns, together with the amount you invested, to estimate the expenses that you paid over the period. Simply divide your account value by $1,000 (for example, an $8,600 account value divided by $1,000 = 8.6), then multiply the result by the number in the appropriate column for your share class under the heading entitled “Expenses Paid During Period” to estimate the expenses you paid on your account during the period.
Hypothetical Example for Comparison Purposes
The information in the table under the heading “Hypothetical (5% return before expenses)” provides information about hypothetical account values and hypothetical expenses based upon the Fund’s actual expense ratio and an assumed rate of return of 5% per year before expenses, which is not the Fund’s actual return. The hypothetical account values and expenses may not be used to estimate the actual ending account balance or expenses you paid for the period. You may use this information to compare the ongoing costs of investing in the Fund and other funds. To do so, compare this 5% hypothetical example with the 5% hypothetical examples that appear in the shareholder reports of the other funds. Additionally, for an analysis of the fees associated with an investment in any share class or other similar funds, please visit www.finra.org/fundanalyzer.
Please note that the expenses shown in the table are meant to highlight your ongoing costs only and do not reflect any transaction costs. These fees are fully described in the Fund’s prospectuses. Therefore, the hypothetical examples are useful in comparing ongoing costs only, and will not help you determine the relative total costs of owning different funds. In addition, if these transaction costs were included, your costs would have been higher.
| | | | | | | | | | | |
| | | | | | | | | |
| | | | Actual | | Hypothetical
(5% return before expenses) | |
| Beginning
Account
Value
(4/1/18) | Ending
Account
Value
(9/30/18) | Expenses
Paid During
Period
(4/1/18 - 9/30/18)† | | Beginning
Account
Value
(4/1/18) | Ending
Account
Value
(9/30/18) | Expenses
Paid During
Period
(4/1/18 - 9/30/18)† | Net Annualized
Expense Ratio
(4/1/18 - 9/30/18) |
Class A Shares | $1,000.00 | $880.20 | $6.27 | | $1,000.00 | $1,018.40 | $6.73 | 1.33% |
Class C Shares | $1,000.00 | $877.90 | $9.74 | | $1,000.00 | $1,014.69 | $10.45 | 2.07% |
Class D Shares | $1,000.00 | $880.80 | $5.56 | | $1,000.00 | $1,019.15 | $5.97 | 1.18% |
Class I Shares | $1,000.00 | $881.60 | $5.14 | | $1,000.00 | $1,019.60 | $5.52 | 1.09% |
Class N Shares | $1,000.00 | $881.70 | $4.86 | | $1,000.00 | $1,019.90 | $5.22 | 1.03% |
Class S Shares | $1,000.00 | $879.70 | $6.88 | | $1,000.00 | $1,017.75 | $7.39 | 1.46% |
Class T Shares | $1,000.00 | $880.80 | $5.89 | | $1,000.00 | $1,018.80 | $6.33 | 1.25% |
† | Expenses Paid During Period are equal to the Net Annualized Expense Ratio multiplied by the average account value over the period, multiplied by 183/365 (to reflect the one-half year period). Expenses in the examples include the effect of applicable fee waivers and/or expense reimbursements, if any. Had such waivers and/or reimbursements not been in effect, your expenses would have been higher. Please refer to the Notes to Financial Statements or the Fund’s prospectuses for more information regarding waivers and/or reimbursements. |
Janus Henderson Emerging Markets Fund
Schedule of Investments
September 30, 2018
| | | | | | | | |
Shares
| | | Value | |
Common Stocks – 92.5% | | | |
Auto Components – 1.0% | | | |
| | Fuyao Glass Industry Group Co Ltd (144A) | | 200,000 | | | $726,887 | |
| | Mahle-Metal Leve SA | | 182,766 | | | 1,097,565 | |
| | | 1,824,452 | |
Banks – 8.3% | | | |
| | Banco Bradesco SA | | 409,283 | | | 2,609,900 | |
| | City Union Bank Ltd | | 394,358 | | | 967,090 | |
| | Commercial International Bank Egypt SAE (GDR) | | 608,958 | | | 2,776,849 | |
| | Guaranty Trust Bank PLC | | 2,986,163 | | | 299,641 | |
| | Guaranty Trust Bank PLC (GDR) | | 297,309 | | | 1,560,872 | |
| | Kasikornbank PCL | | 264,800 | | | 1,785,537 | |
| | Komercni banka as | | 34,709 | | | 1,425,630 | |
| | Standard Bank Group Ltd | | 244,952 | | | 3,032,935 | |
| | | 14,458,454 | |
Beverages – 10.9% | | | |
| | China Resources Beer Holdings Co Ltd | | 422,000 | | | 1,695,461 | |
| | Cia Cervecerias Unidas SA (ADR) | | 185,962 | | | 5,188,340 | |
| | Fomento Economico Mexicano SAB de CV | | 42,126 | | | 416,915 | |
| | Fomento Economico Mexicano SAB de CV (ADR) | | 54,165 | | | 5,360,710 | |
| | Guinness Nigeria PLC | | 2,794,559 | | | 613,767 | |
| | Heineken Holding NV | | 54,955 | | | 4,976,190 | |
| | Nigerian Breweries PLC | | 2,949,693 | | | 740,966 | |
| | | 18,992,349 | |
Capital Markets – 1.1% | | | |
| | Aditya Birla Capital Ltd* | | 1,163,693 | | | 1,840,684 | |
Chemicals – 1.6% | | | |
| | African Oxygen Ltd | | 1,329,798 | | | 2,822,611 | |
Communications Equipment – 0.3% | | | |
| | VTech Holdings Ltd | | 42,400 | | | 489,654 | |
Construction Materials – 2.8% | | | |
| | Grasim Industries Ltd | | 343,800 | | | 4,845,193 | |
Containers & Packaging – 1.6% | | | |
| | Greatview Aseptic Packaging Co Ltd | | 3,094,000 | | | 1,972,312 | |
| | Nampak Ltd* | | 821,339 | | | 891,440 | |
| | | 2,863,752 | |
Diversified Financial Services – 1.9% | | | |
| | Remgro Ltd | | 240,207 | | | 3,352,330 | |
Electric Utilities – 0.8% | | | |
| | Tata Power Co Ltd | | 1,492,636 | | | 1,356,053 | |
Electronic Equipment, Instruments & Components – 0.8% | | | |
| | Delta Electronics Inc | | 196,465 | | | 842,977 | |
| | Delta Electronics Thailand PCL | | 233,300 | | | 503,331 | |
| | | 1,346,308 | |
Food & Staples Retailing – 0.9% | | | |
| | Shoprite Holdings Ltd | | 116,424 | | | 1,578,685 | |
Food Products – 18.7% | | | |
| | Century Pacific Food Inc | | 4,344,900 | | | 1,142,125 | |
| | China Mengniu Dairy Co Ltd* | | 538,800 | | | 1,793,040 | |
| | Grupo Herdez SAB de CV | | 1,441,695 | | | 3,261,555 | |
| | Nestle Nigeria PLC | | 405,792 | | | 1,559,667 | |
| | Standard Foods Corp | | 1,305,041 | | | 2,171,435 | |
| | Tiger Brands Ltd | | 371,271 | | | 6,961,676 | |
| | Uni-President China Holdings Ltd | | 4,336,000 | | | 4,625,200 | |
| | Uni-President Enterprises Corp | | 3,434,280 | | | 8,965,056 | |
| | Universal Robina Corp | | 769,220 | | | 2,057,614 | |
| | | 32,537,368 | |
Gas Utilities – 0.4% | | | |
| | China Resources Gas Group Ltd | | 168,000 | | | 683,555 | |
Hotels, Restaurants & Leisure – 0.5% | | | |
| | City Lodge Hotels Ltd | | 85,914 | | | 849,189 | |
| | |
See Notes to Schedule of Investments and Other Information and Notes to Financial Statements. |
| |
Janus Investment Fund | 7 |
Janus Henderson Emerging Markets Fund
Schedule of Investments
September 30, 2018
| | | | | | | | |
Shares
| | | Value | |
Common Stocks – (continued) | | | |
Household Durables – 0.6% | | | |
| | Pepkor Holdings Ltd* | | 866,604 | | | $976,131 | |
Household Products – 2.6% | | | |
| | PZ Cussons PLC | | 791,620 | | | 2,411,978 | |
| | Vinda International Holdings Ltd | | 1,270,000 | | | 2,180,508 | |
| | | 4,592,486 | |
Independent Power and Renewable Electricity Producers – 0.8% | | | |
| | Engie Brasil Energia SA | | 154,112 | | | 1,354,076 | |
Industrial Conglomerates – 5.1% | | | |
| | LG Corp | | 72,425 | | | 4,740,830 | |
| | Quinenco SA | | 1,353,054 | | | 4,115,610 | |
| | | 8,856,440 | |
Information Technology Services – 7.4% | | | |
| | Cognizant Technology Solutions Corp | | 49,725 | | | 3,836,284 | |
| | Infosys Ltd | | 297,561 | | | 2,997,060 | |
| | Tata Consultancy Services Ltd | | 202,258 | | | 6,093,482 | |
| | | 12,926,826 | |
Insurance – 0.8% | | | |
| | Samsung Fire & Marine Insurance Co Ltd | | 5,548 | | | 1,420,640 | |
Leisure Products – 2.0% | | | |
| | Merida Industry Co Ltd | | 733,000 | | | 3,433,199 | |
Machinery – 0.4% | | | |
| | WEG SA | | 129,153 | | | 631,676 | |
Metals & Mining – 3.1% | | | |
| | Newcrest Mining Ltd | | 381,456 | | | 5,350,915 | |
Oil, Gas & Consumable Fuels – 1.1% | | | |
| | Cairn Energy PLC* | | 644,298 | | | 1,953,029 | |
Paper & Forest Products – 1.7% | | | |
| | Duratex SA | | 1,351,270 | | | 3,021,710 | |
Personal Products – 3.8% | | | |
| | LG Household & Health Care Ltd | | 1,456 | | | 1,675,102 | |
| | Unilever PLC | | 89,746 | | | 4,930,919 | |
| | | 6,606,021 | |
Pharmaceuticals – 3.0% | | | |
| | Cipla Ltd/India | | 339,530 | | | 3,063,768 | |
| | Mega Lifesciences PCL | | 1,811,400 | | | 2,087,060 | |
| | | 5,150,828 | |
Technology Hardware, Storage & Peripherals – 2.1% | | | |
| | Asustek Computer Inc | | 423,000 | | | 3,657,659 | |
Textiles, Apparel & Luxury Goods – 1.3% | | | |
| | Stella International Holdings Ltd | | 596,500 | | | 532,651 | |
| | Yue Yuen Industrial Holdings Ltd | | 654,300 | | | 1,817,988 | |
| | | 2,350,639 | |
Thrifts & Mortgage Finance – 1.8% | | | |
| | Housing Development Finance Corp Ltd | | 127,794 | | | 3,093,361 | |
Water Utilities – 2.6% | | | |
| | Inversiones Aguas Metropolitanas SA | | 2,462,604 | | | 3,664,972 | |
| | Manila Water Co Inc | | 1,880,000 | | | 852,647 | |
| | | 4,517,619 | |
Wireless Telecommunication Services – 0.7% | | | |
| | Vodafone Idea Ltd* | | 2,185,834 | | | 1,162,541 | |
Total Common Stocks (cost $160,684,265) | | 160,896,433 | |
Preferred Stocks – 1.2% | | | |
Beverages – 1.2% | | | |
| | Embotelladora Andina SA | | 621,236 | | | 2,088,141 | |
Oil, Gas & Consumable Fuels – 0% | | | |
| | International Petroleum Ltd*,¢ | | 955,965 | | | 0 | |
Total Preferred Stocks (cost $2,469,279) | | 2,088,141 | |
| | |
See Notes to Schedule of Investments and Other Information and Notes to Financial Statements. |
| |
8 | SEPTEMBER 30, 2018 |
Janus Henderson Emerging Markets Fund
Schedule of Investments
September 30, 2018
| | | | | | | | |
Shares
| | | Value | |
Investment Companies – 5.7% | | | |
Money Markets – 5.7% | | | |
| | Fidelity Investments Money Market Treasury Portfolio, 1.9300%ºº (cost $9,859,355) | | 9,859,355 | | | $9,859,355 | |
Total Investments (total cost $173,012,899) – 99.4% | | 172,843,929 | |
Cash, Receivables and Other Assets, net of Liabilities – 0.6% | | 1,040,794 | |
Net Assets – 100% | | $173,884,723 | |
| | | | | | |
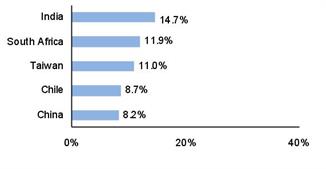
Summary of Investments by Country - (Long Positions) (unaudited) |
| |
| | | | | % of | |
| | | | | Investment | |
Country | | Value | | Securities | |
India | | $25,419,232 | | 14.7 | % |
South Africa | | 20,464,997 | | 11.9 | |
Taiwan | | 19,070,326 | | 11.0 | |
Chile | | 15,057,063 | | 8.7 | |
China | | 14,209,614 | | 8.2 | |
United States | | 13,695,639 | | 7.9 | |
United Kingdom | | 9,295,926 | | 5.4 | |
Mexico | | 9,039,180 | | 5.2 | |
Brazil | | 8,714,927 | | 5.1 | |
South Korea | | 7,836,572 | | 4.5 | |
Australia | | 5,350,915 | | 3.1 | |
Netherlands | | 4,976,190 | | 2.9 | |
Nigeria | | 4,774,913 | | 2.8 | |
Thailand | | 4,375,928 | | 2.5 | |
Philippines | | 4,052,386 | | 2.4 | |
Egypt | | 2,776,849 | | 1.6 | |
Hong Kong | | 2,307,642 | | 1.3 | |
Czech Republic | | 1,425,630 | | 0.8 | |
| | | | | | |
| | | | | | |
Total | | $172,843,929 | | 100.0 | % |
| | |
See Notes to Schedule of Investments and Other Information and Notes to Financial Statements. |
| |
Janus Investment Fund | 9 |
Janus Henderson Emerging Markets Fund
Notes to Schedule of Investments and Other Information
| | |
MSCI Emerging Markets IndexSM | MSCI Emerging Markets IndexSM reflects the equity market performance of emerging markets. |
| | |
ADR | American Depositary Receipt |
GDR | Global Depositary Receipt |
PCL | Public Company Limited |
PLC | Public Limited Company |
| | |
144A | Securities sold under Rule 144A of the Securities Act of 1933, as amended, are subject to legal and/or contractual restrictions on resale and may not be publicly sold without registration under the 1933 Act. Unless otherwise noted, these securities have been determined to be liquid under guidelines established by the Board of Trustees. The total value of 144A securities as of the year ended September 30, 2018 is $726,887, which represents 0.4% of net assets. |
| | |
* | Non-income producing security. |
| | |
ºº | Rate shown is the 7-day yield as of September 30, 2018. |
| | |
¢ | Security is valued using significant unobservable inputs. |
| | | | | | | | | | | | | |
The following is a summary of the inputs that were used to value the Fund’s investments in securities and other financial instruments as of September 30, 2018. See Notes to Financial Statements for more information. |
| |
Valuation Inputs Summary |
| | | | | | | |
| | | | | Level 2 - | | Level 3 - |
| | | Level 1 - | | Other Significant | | Significant |
| | | Quoted Prices | | Observable Inputs | | Unobservable Inputs |
| | | | | | | |
Assets | | | | | | |
Investments in Securities: | | | | | | |
Common Stocks | $ | 160,896,433 | $ | - | $ | - |
Preferred Stocks | | | | | | |
Beverages | | - | | 2,088,141 | | - |
Oil, Gas & Consumable Fuels | | - | | - | | 0 |
Investment Companies | | 9,859,355 | | - | | - |
Total Assets | $ | 170,755,788 | $ | 2,088,141 | $ | 0 |
| | | | | | | |
Janus Henderson Emerging Markets Fund
Statement of Assets and Liabilities
September 30, 2018
| |
See footnotes at the end of the Statement. |
| | | | | | | |
| | | | | | |
Assets: | | | | |
| | Investments, at value(1) | | $ | 172,843,929 | |
| | Non-interested Trustees' deferred compensation | | | 3,728 | |
| | Receivables: | | | | |
| | | Investments sold | | | 925,070 | |
| | | Fund shares sold | | | 685,984 | |
| | | Dividends | | | 310,686 | |
| | | Foreign tax reclaims | | | 1,043 | |
| | Other assets | | | 18,190 | |
Total Assets | | | 174,788,630 | |
Liabilities: | | | | |
| | Payables: | | | — | |
| | | Investments purchased | | | 474,568 | |
| | | Foreign tax liability | | | 116,468 | |
| | | Fund shares repurchased | | | 93,939 | |
| | | Advisory fees | | | 68,708 | |
| | | Audit fee payable | | | 40,427 | |
| | | Transfer agent fees and expenses | | | 22,140 | |
| | | Registration fees | | | 13,380 | |
| | | Custodian fees | | | 13,135 | |
| | | 12b-1 Distribution and shareholder servicing fees | | | 8,601 | |
| | | Printing fees | | | 7,382 | |
| | | Non-interested Trustees' deferred compensation fees | | | 3,728 | |
| | | Professional fees | | | 2,544 | |
| | | Non-interested Trustees' fees and expenses | | | 1,188 | |
| | | Affiliated fund administration fees payable | | | 355 | |
| | | Accrued expenses and other payables | | | 37,344 | |
Total Liabilities | | | 903,907 | |
Net Assets | | $ | 173,884,723 | |
| | |
See Notes to Financial Statements. |
| |
Janus Investment Fund | 11 |
Janus Henderson Emerging Markets Fund
Statement of Assets and Liabilities
September 30, 2018
| | | | | | | |
| | | | | | |
| | | | | | | |
Net Assets Consist of: | | | | |
| | Capital (par value and paid-in surplus) | | $ | 171,575,444 | |
| | Total distributable earnings (loss)(2) | | | 2,309,279 | |
Total Net Assets | | $ | 173,884,723 | |
Net Assets - Class A Shares | | $ | 15,770,542 | |
| | Shares Outstanding, $0.01 Par Value (unlimited shares authorized) | | | 1,664,300 | |
Net Asset Value Per Share(3) | | $ | 9.48 | |
Maximum Offering Price Per Share(4) | | $ | 10.06 | |
Net Assets - Class C Shares | | $ | 5,984,748 | |
| | Shares Outstanding, $0.01 Par Value (unlimited shares authorized) | | | 656,304 | |
Net Asset Value Per Share(3) | | $ | 9.12 | |
Net Assets - Class D Shares | | $ | 13,104,255 | |
| | Shares Outstanding, $0.01 Par Value (unlimited shares authorized) | | | 1,375,593 | |
Net Asset Value Per Share | | $ | 9.53 | |
Net Assets - Class I Shares | | $ | 107,276,493 | |
| | Shares Outstanding, $0.01 Par Value (unlimited shares authorized) | | | 11,263,701 | |
Net Asset Value Per Share | | $ | 9.52 | |
Net Assets - Class N Shares | | $ | 25,133,731 | |
| | Shares Outstanding, $0.01 Par Value (unlimited shares authorized) | | | 2,637,018 | |
Net Asset Value Per Share | | $ | 9.53 | |
Net Assets - Class S Shares | | $ | 1,753,005 | |
| | Shares Outstanding, $0.01 Par Value (unlimited shares authorized) | | | 184,357 | |
Net Asset Value Per Share | | $ | 9.51 | |
Net Assets - Class T Shares | | $ | 4,861,949 | |
| | Shares Outstanding, $0.01 Par Value (unlimited shares authorized) | | | 510,864 | |
Net Asset Value Per Share | | $ | 9.52 | |
| |
(1) Includes cost of $173,012,899. (2) Includes $116,469 of foreign capital gains tax on investments. (3) Redemption price per share may be reduced for any applicable contingent deferred sales charge. (4) Maximum offering price is computed at 100/94.25 of net asset value. |
| | |
See Notes to Financial Statements. |
| |
12 | SEPTEMBER 30, 2018 |
Janus Henderson Emerging Markets Fund
Statement of Operations
For the year ended September 30, 2018
| |
See footnotes at the end of the Statement. |
| | | | | | |
| | | | | |
Investment Income: | | | |
| Dividends | $ | 4,894,710 | |
| | Other income | | 159,726 | |
| | Foreign tax withheld | | (620,488) | |
Total Investment Income | | 4,433,948 | |
Expenses: | | | |
| | Advisory fees | | 1,969,333 | |
| | 12b-1 Distribution and shareholder servicing fees: | | | |
| | | Class A Shares | | 40,152 | |
| | | Class C Shares | | 82,851 | |
| | | Class S Shares | | 2,970 | |
| | Transfer agent administrative fees and expenses: | | | |
| | | Class D Shares | | 18,676 | |
| | | Class S Shares | | 2,970 | |
| | | Class T Shares | | 18,134 | |
| | Transfer agent networking and omnibus fees: | | | |
| | | Class A Shares | | 5,471 | |
| | | Class C Shares | | 5,088 | |
| | | Class I Shares | | 70,268 | |
| | Other transfer agent fees and expenses: | | | |
| | | Class A Shares | | 1,810 | |
| | | Class C Shares | | 904 | |
| | | Class D Shares | | 1,121 | |
| | | Class I Shares | | 3,905 | |
| | | Class N Shares | | 898 | |
| | | Class S Shares | | 10 | |
| | | Class T Shares | | 59 | |
| | Registration fees | | 128,497 | |
| | Professional fees | | 97,664 | |
| | Custodian fees | | 92,807 | |
| | Shareholder reports expense | | 32,913 | |
| | Affiliated fund administration fees | | 9,746 | |
| | Non-interested Trustees’ fees and expenses | | 5,119 | |
| | Other expenses | | 42,823 | |
Total Expenses | | 2,634,189 | |
Less: Excess Expense Reimbursement and Waivers | | (346,874) | |
Net Expenses | | 2,287,315 | |
Net Investment Income/(Loss) | | 2,146,633 | |
| | | | | | |
| | |
See Notes to Financial Statements. |
| |
Janus Investment Fund | 13 |
Janus Henderson Emerging Markets Fund
Statement of Operations
For the year ended September 30, 2018
| | | | | | |
| | | | | |
Net Realized Gain/(Loss) on Investments: | | | |
| | Investments and foreign currency transactions(1) | $ | 4,021,591 | |
Total Net Realized Gain/(Loss) on Investments | | 4,021,591 | |
Change in Unrealized Net Appreciation/Depreciation: | | | |
| | Investments, foreign currency translations and non-interested Trustees’ deferred compensation(2) | | (17,308,273) | |
Total Change in Unrealized Net Appreciation/Depreciation | | (17,308,273) | |
Net Increase/(Decrease) in Net Assets Resulting from Operations | $ | (11,140,049) | |
| | | | | | |
| |
(1) Includes realized foreign capital gains tax on investments of $(16,075). (2) Includes change in unrealized appreciation/depreciation of $(88,690) due to foreign capital gains tax on investments. |
| | |
See Notes to Financial Statements. |
| |
14 | SEPTEMBER 30, 2018 |
Janus Henderson Emerging Markets Fund
Statements of Changes in Net Assets
| | | | | | | | | | | | |
| | | | | | | | | | | | |
| | | Year ended
September 30, 2018 | | Period ended
September 30, 2017(1) | | Year ended
July 31, 2017(2) | |
| | | | | | | | | | | | |
Operations: | | | | | | | | | |
| | Net investment income/(loss) | $ | 2,146,633 | | $ | 795,495 | | $ | 1,596,268 | |
| | Net realized gain/(loss) on investments | | 4,021,591 | | | 980,181 | | | 6,353,838 | |
| | Change in unrealized net appreciation/depreciation | | (17,308,273) | | | 1,609,480 | | | 5,444,904 | |
Net Increase/(Decrease) in Net Assets Resulting from Operations | | (11,140,049) | | | 3,385,156 | | | 13,395,010 | |
Dividends and Distributions to Shareholders(3) | | | | | | | | | |
| | | Class A Shares | | (459,832) | | | N/A | | | N/A | |
| | | Class C Shares | | (200,053) | | | N/A | | | N/A | |
| | | Class D Shares | | (475,263) | | | N/A | | | N/A | |
| | | Class I Shares | | (3,741,499) | | | N/A | | | N/A | |
| | | Class N Shares | | (902,442) | | | N/A | | | N/A | |
| | | Class S Shares | | (9,313) | | | N/A | | | N/A | |
| | | Class T Shares | | (237,676) | | | N/A | | | N/A | |
| Total Dividends and Distributions to Shareholders | | (6,026,078) | | | N/A | | | N/A | |
| | Dividends from Net Investment Income(3) | | | | | | | | | |
| | | Class A Shares | | N/A | | | — | | | (84,478) | |
| | | Class C Shares | | N/A | | | — | | | (10,078) | |
| | | Class I Shares | | N/A | | | — | | | (467,218) | |
| | | Class N Shares | | N/A | | | — | | | (18,614) | |
| Total Dividends from Net Investment Income | | N/A | | | — | | | (580,388) | |
Net Decrease from Dividends and Distributions to Shareholders | | (6,026,078) | | | — | | | (580,388) | |
Capital Share Transactions: (Note 5) | | | | | | | | | |
| | | Class A Shares | | 1,667,423 | | | 180,695 | | | 6,952,439 | |
| | | Class C Shares | | (2,358,097) | | | 350,563 | | | 4,245,080 | |
| | | Class D Shares | | (1,628,266) | | | (761,157) | | | 16,083,829 | |
| | | Class I Shares | | 5,040,165 | | | 3,603,991 | | | 62,540,753 | |
| | | Class N Shares | | (13,936,642) | | | (307,870) | | | 38,887,654 | |
| | | Class S Shares | | 1,685,020 | | | 7,058 | | | 296,026 | |
| | | Class T Shares | | (2,295,108) | | | 6,742 | | | 7,394,663 | |
Net Increase/(Decrease) from Capital Share Transactions | | (11,825,505) | | | 3,080,022 | | | 136,400,444 | |
Net Increase/(Decrease) in Net Assets | | (28,991,632) | | | 6,465,178 | | | 149,215,066 | |
Net Assets: | | | | | | | | | |
| | Beginning of period | | 202,876,355 | | | 196,411,177 | | | 47,196,111 | |
| End of period(4) | $ | 173,884,723 | | $ | 202,876,355 | | $ | 196,411,177 | |
| | | | | | | | | | | | |
| |
(1) Period from August 1, 2017 through September 30, 2017. The Fund changed its fiscal year end from July 31 to September 30. (2) Period from June 5, 2017 (inception date) through July 31, 2017 for Class D Shares, Class S Shares and Class T Shares. (3) The requirement to disclose distributions paid to shareholders net investments income; and/or net realized gain from investment transactions was eliminated by the SEC (Securities Exchange Commission) for 2018. (4) Net assets - End of period includes undistributed (overdistributed) net investment income of $1,657,803 as of September 30, 2017 and $912,164 as of July 31, 2017. The requirement to parenthetically disclose undistributed net investment income was eliminated by the SEC for 2018. |
| | |
See Notes to Financial Statements. |
| |
Janus Investment Fund | 15 |
Janus Henderson Emerging Markets Fund
Financial Highlights
| | | | | | | | | | |
Class A Shares | | | | | | |
For a share outstanding during the year or period ended September 30 | | 2018 | | | 2017(1) | |
| | Net Asset Value, Beginning of Period | | $10.36 | | | $10.19 | |
| | Income/(Loss) from Investment Operations: | | | | | | |
| | | Net investment income/(loss)(2) | | 0.10 | | | 0.04 | |
| | | Net realized and unrealized gain/(loss) | | (0.67) | | | 0.13 | |
| | Total from Investment Operations | | (0.57) | | | 0.17 | |
| | Less Dividends and Distributions: | | | | | | |
| | | Dividends (from net investment income) | | (0.10) | | | — | |
| | | Distributions (from capital gains) | | (0.21) | | | — | |
| | Total Dividends and Distributions | | (0.31) | | | — | |
| | Net Asset Value, End of Period | | $9.48 | | | $10.36 | |
| | Total Return* | | (5.80)% | | | 1.67% | |
| | Net Assets, End of Period (in thousands) | | $15,771 | | | $15,562 | |
| | Average Net Assets for the Period (in thousands) | | $16,103 | | | $15,471 | |
| | Ratios to Average Net Assets**: | | | | | | |
| | | Ratio of Gross Expenses | | 1.51% | | | 1.75% | |
| | | Ratio of Net Expenses (After Waivers and Expense Offsets) | | 1.33% | | | 1.46% | |
| | | Ratio of Net Investment Income/(Loss) | | 0.93% | | | 2.18% | |
| | Portfolio Turnover Rate | | 26% | | | 2% | |
| | | | | | | | | | |
| | | | | | | | | | |
Class C Shares | | | | | | |
For a share outstanding during the year ended September 30 | | 2018 | | | 2017(1) | |
| | Net Asset Value, Beginning of Period | | $9.98 | | | $9.83 | |
| | Income/(Loss) from Investment Operations: | | | | | | |
| | | Net investment income/(loss)(2) | | 0.01 | | | 0.02 | |
| | | Net realized and unrealized gain/(loss) | | (0.65) | | | 0.13 | |
| | Total from Investment Operations | | (0.64) | | | 0.15 | |
| | Less Dividends and Distributions: | | | | | | |
| | | Dividends (from net investment income) | | (0.01) | | | — | |
| | | Distributions (from capital gains) | | (0.21) | | | — | |
| | Total Dividends and Distributions | | (0.22) | | | — | |
| | Net Asset Value, End of Period | | $9.12 | | | $9.98 | |
| | Total Return* | | (6.59)%(3) | | | 1.53% | |
| | Net Assets, End of Period (in thousands) | | $5,985 | | | $9,017 | |
| | Average Net Assets for the Period (in thousands) | | $8,442 | | | $8,877 | |
| | Ratios to Average Net Assets**: | | | | | | |
| | | Ratio of Gross Expenses | | 2.26% | | | 2.65% | |
| | | Ratio of Net Expenses (After Waivers and Expense Offsets) | | 2.07% | | | 2.35% | |
| | | Ratio of Net Investment Income/(Loss) | | 0.11% | | | 1.29% | |
| | Portfolio Turnover Rate | | 26% | | | 2% | |
| | | | | | | | | | |
| |
* Total return not annualized for periods of less than one full year. ** Annualized for periods of less than one full year. (1) Period from August 1, 2017 through September 30, 2017. The Fund changed its fiscal year end from July 31 to September 30. (2) Per share amounts are calculated based on average shares outstanding during the year or period. (3) The return includes adjustments in accordance with generally accepted accounting principles required at period end date. |
| | |
See Notes to Financial Statements. |
| |
16 | SEPTEMBER 30, 2018 |
Janus Henderson Emerging Markets Fund
Financial Highlights
| | | | | | | | | | | | | | | | |
Class A Shares | | | | | | | | | | | | |
For a share outstanding during the year ended July 31 | | 2017 | | | 2016 | | | 2015 | | | 2014 | |
| | Net Asset Value, Beginning of Period | | $9.10 | | | $8.60 | | | $9.82 | | | $8.49 | |
| | Income/(Loss) from Investment Operations: | | | | | | | | | | | | |
| | | Net investment income/(loss)(1) | | 0.10 | | | 0.13 | | | 0.02 | | | 0.02 | |
| | | Net realized and unrealized gain/(loss) | | 1.05 | | | 0.39 | | | (1.24) | | | 1.31 | |
| | Total from Investment Operations | | 1.15 | | | 0.52 | | | (1.22) | | | 1.33 | |
| | Less Dividends and Distributions: | | | | | | | | | | | | |
| | | Dividends (from net investment income) | | (0.06) | | | (0.02) | | | — | | | — | |
| | Total Dividends and Distributions | | (0.06) | | | (0.02) | | | — | | | — | |
| | Net Asset Value, End of Period | | $10.19 | | | $9.10 | | | $8.60 | | | $9.82 | |
| | Total Return* | | 12.80% | | | 6.07% | | | (12.42)% | | | 15.67% | |
| | Net Assets, End of Period (in thousands) | | $15,124 | | | $6,510 | | | $8,272 | | | $8,656 | |
| | Average Net Assets for the Period (in thousands) | | $12,523 | | | $5,958 | | | $8,108 | | | $10,236 | |
| | Ratios to Average Net Assets**: | | | | | | | | | | | | |
| | | Ratio of Gross Expenses | | 1.76% | | | 2.36%(2) | | | 2.13% | | | 1.97% | |
| | | Ratio of Net Expenses (After Waivers and Expense Offsets) | | 1.54% | | | 1.79% | | | 1.79% | | | 1.79% | |
| | | Ratio of Net Investment Income/(Loss) | | 1.05% | | | 1.64% | | | 0.21% | | | 0.26% | |
| | Portfolio Turnover Rate | | 32% | | | 86% | | | 148% | | | 97% | |
| | | | | | | | | | | | | | 1 | | |
| | | | | | | | | | | | | | | | |
Class C Shares | | | | | | | | | | | | |
For a share outstanding during the year ended July 31 | | 2017 | | | 2016 | | | 2015 | | | 2014 | |
| | Net Asset Value, Beginning of Period | | $8.79 | | | $8.35 | | | $9.61 | | | $8.37 | |
| | Income/(Loss) from Investment Operations: | | | | | | | | | | | | |
| | | Net investment income/(loss)(1) | | 0.03 | | | 0.06 | | | (0.06) | | | (0.04) | |
| | | Net realized and unrealized gain/(loss) | | 1.02 | | | 0.38 | | | (1.20) | | | 1.28 | |
| | Total from Investment Operations | | 1.05 | | | 0.44 | | | (1.26) | | | 1.24 | |
| | Less Dividends and Distributions: | | | | | | | | | | | | |
| | | Dividends (from net investment income) | | (0.01) | | | — | | | — | | | — | |
| | Total Dividends and Distributions | | (0.01) | | | — | | | — | | | — | |
| | Net Asset Value, End of Period | | $9.83 | | | $8.79 | | | $8.35 | | | $9.61 | |
| | Total Return* | | 12.03% | | | 5.27% | | | (13.11)% | | | 14.81% | |
| | Net Assets, End of Period (in thousands) | | $8,530 | | | $3,553 | | | $3,049 | | | $4,036 | |
| | Average Net Assets for the Period (in thousands) | | $6,219 | | | $3,028 | | | $3,471 | | | $3,584 | |
| | Ratios to Average Net Assets**: | | | | | | | | | | | | |
| | | Ratio of Gross Expenses | | 2.53% | | | 3.16%(2) | | | 2.90% | | | 2.74% | |
| | | Ratio of Net Expenses (After Waivers and Expense Offsets) | | 2.29% | | | 2.54% | | | 2.54% | | | 2.54% | |
| | | Ratio of Net Investment Income/(Loss) | | 0.37% | | | 0.70% | | | (0.62)% | | | (0.42)% | |
| | Portfolio Turnover Rate | | 32% | | | 86% | | | 148% | | | 97% | |
| | | | | | | | | | | | | | | | |
| |
* Total return not annualized for periods of less than one full year. ** Annualized for periods of less than one full year. (1) Per share amounts are calculated based on average shares outstanding during the year or period. (2) The Ratio of Gross Expenses include a reimbursement of prior period custodian out-of-pocket expenses. The Ratio of Gross Expenses would have been 0.07% higher had the custodian not reimbursed the Fund. |
| | |
See Notes to Financial Statements. |
| |
Janus Investment Fund | 17 |
Janus Henderson Emerging Markets Fund
Financial Highlights
| | | | | | | | | | |
Class D Shares | | | | | | |
For a share outstanding during the year or period ended September 30 | | 2018 | | | 2017(1) | |
| | Net Asset Value, Beginning of Period | | $10.41 | | | $10.24 | |
| | Income/(Loss) from Investment Operations: | | | | | | |
| | | Net investment income/(loss)(2) | | 0.11 | | | 0.04 | |
| | | Net realized and unrealized gain/(loss) | | (0.67) | | | 0.13 | |
| | Total from Investment Operations | | (0.56) | | | 0.17 | |
| | Less Dividends and Distributions: | | | | | | |
| | | Dividends (from net investment income) | | (0.11) | | | — | |
| | | Distributions (from capital gains) | | (0.21) | | | — | |
| | Total Dividends and Distributions | | (0.32) | | | — | |
| | Net Asset Value, End of Period | | $9.53 | | | $10.41 | |
| | Total Return* | | (5.64)% | | | 1.66% | |
| | Net Assets, End of Period (in thousands) | | $13,104 | | | $16,053 | |
| | Average Net Assets for the Period (in thousands) | | $15,607 | | | $16,501 | |
| | Ratios to Average Net Assets**: | | | | | | |
| | | Ratio of Gross Expenses | | 1.38% | | | 1.80% | |
| | | Ratio of Net Expenses (After Waivers and Expense Offsets) | | 1.15% | | | 1.46% | |
| | | Ratio of Net Investment Income/(Loss) | | 1.08% | | | 2.18% | |
| | Portfolio Turnover Rate | | 26% | | | 2% | |
| | | | | | | | | | |
| | | | | | | | | | |
Class I Shares | | | | | | |
For a share outstanding during the year ended September 30 | | 2018 | | | 2017(1) | |
| | Net Asset Value, Beginning of Period | | $10.42 | | | $10.24 | |
| | Income/(Loss) from Investment Operations: | | | | | | |
| | | Net investment income/(loss)(2) | | 0.12 | | | 0.04 | |
| | | Net realized and unrealized gain/(loss) | | (0.69) | | | 0.14 | |
| | Total from Investment Operations | | (0.57) | | | 0.18 | |
| | Less Dividends and Distributions: | | | | | | |
| | | Dividends (from net investment income) | | (0.12) | | | — | |
| | | Distributions (from capital gains) | | (0.21) | | | — | |
| | Total Dividends and Distributions | | (0.33) | | | — | |
| | Net Asset Value, End of Period | | $9.52 | | | $10.42 | |
| | Total Return* | | (5.72)%(3) | | | 1.76% | |
| | Net Assets, End of Period (in thousands) | | $107,276 | | | $112,952 | |
| | Average Net Assets for the Period (in thousands) | | $119,036 | | | $110,859 | |
| | Ratios to Average Net Assets**: | | | | | | |
| | | Ratio of Gross Expenses | | 1.26% | | | 1.49% | |
| | | Ratio of Net Expenses (After Waivers and Expense Offsets) | | 1.09% | | | 1.20% | |
| | | Ratio of Net Investment Income/(Loss) | | 1.17% | | | 2.42% | |
| | Portfolio Turnover Rate | | 26% | | | 2% | |
| | | | | | | | | | |
| |
* Total return not annualized for periods of less than one full year. ** Annualized for periods of less than one full year. (1) Period from August 1, 2017 through September 30, 2017. The Fund changed its fiscal year end from July 31 to September 30. (2) Per share amounts are calculated based on average shares outstanding during the year or period. (3) The return includes adjustments in accordance with generally accepted accounting principles required at period end date. |
| | |
See Notes to Financial Statements. |
| |
18 | SEPTEMBER 30, 2018 |
Janus Henderson Emerging Markets Fund
Financial Highlights
| | | | | | | |
Class D Shares | | | |
For a share outstanding during the period ended July 31 | | 2017(1) | |
| | Net Asset Value, Beginning of Period | | $10.05 | |
| | Income/(Loss) from Investment Operations: | | | |
| | | Net investment income/(loss)(2) | | 0.07 | |
| | | Net realized and unrealized gain/(loss) | | 0.12 | |
| | Total from Investment Operations | | 0.19 | |
| | Less Dividends and Distributions: | | | |
| | | Dividends (from net investment income) | | — | |
| | Total Dividends and Distributions | | — | |
| | Net Asset Value, End of Period | | $10.24 | |
| | Total Return* | | 1.89% | |
| | Net Assets, End of Period (in thousands) | | $16,527 | |
| | Average Net Assets for the Period (in thousands) | | $14,711 | |
| | Ratios to Average Net Assets**: | | | |
| | | Ratio of Gross Expenses | | 1.35% | |
| | | Ratio of Net Expenses (After Waivers and Expense Offsets) | | 1.32% | |
| | | Ratio of Net Investment Income/(Loss) | | 4.63% | |
| | Portfolio Turnover Rate | | 32% | |
| | | | | | | |
| | | | | | | | | | | | | | | | |
Class I Shares | | | | | | | | | | | | |
For a share outstanding during the year ended July 31 | | 2017 | | | 2016 | | | 2015 | | | 2014 | |
| | Net Asset Value, Beginning of Period | | $9.13 | | | $8.63 | | | $9.86 | | | $8.49 | |
| | Income/(Loss) from Investment Operations: | | | | | | | | | | | | |
| | | Net investment income/(loss)(2) | | 0.15 | | | 0.13 | | | 0.03 | | | 0.05 | |
| | | Net realized and unrealized gain/(loss) | | 1.03 | | | 0.42 | | | (1.25) | | | 1.32 | |
| | Total from Investment Operations | | 1.18 | | | 0.55 | | | (1.22) | | | 1.37 | |
| | Less Dividends and Distributions: | | | | | | | | | | | | |
| | | Dividends (from net investment income) | | (0.07) | | | (0.05) | | | (0.01) | | | — | |
| | Total Dividends and Distributions | | (0.07) | | | (0.05) | | | (0.01) | | | — | |
| | Net Asset Value, End of Period | | $10.24 | | | $9.13 | | | $8.63 | | | $9.86 | |
| | Total Return* | | 13.15% | | | 6.41% | | | (12.34)% | | | 16.14% | |
| | Net Assets, End of Period (in thousands) | | $107,513 | | | $36,815 | | | $12,652 | | | $16,057 | |
| | Average Net Assets for the Period (in thousands) | | $62,396 | | | $21,242 | | | $15,071 | | | $13,724 | |
| | Ratios to Average Net Assets**: | | | | | | | | | | | | |
| | | Ratio of Gross Expenses | | 1.46% | | | 2.09%(3) | | | 1.85% | | | 1.66% | |
| | | Ratio of Net Expenses (After Waivers and Expense Offsets) | | 1.27% | | | 1.54% | | | 1.54% | | | 1.54% | |
| | | Ratio of Net Investment Income/(Loss) | | 1.63% | | | 1.52% | | | 0.37% | | | 0.56% | |
| | Portfolio Turnover Rate | | 32% | | | 86% | | | 148% | | | 97% | |
| | | | | | | | | | | | | | | | |
| |
* Total return not annualized for periods of less than one full year. ** Annualized for periods of less than one full year. (1) Period from June 5, 2017 (inception date) through July 31, 2017. (2) Per share amounts are calculated based on average shares outstanding during the year or period. (3) The Ratio of Gross Expenses include a reimbursement of prior period custodian out-of-pocket expenses. The Ratio of Gross Expenses would have been 0.07% higher had the custodian not reimbursed the Fund. |
| | |
See Notes to Financial Statements. |
| |
Janus Investment Fund | 19 |
Janus Henderson Emerging Markets Fund
Financial Highlights
| | | | | | | | | | |
Class N Shares | | | | | | |
For a share outstanding during the year or period ended September 30 | | 2018 | | | 2017(1) | |
| | Net Asset Value, Beginning of Period | | $10.42 | | | $10.24 | |
| | Income/(Loss) from Investment Operations: | | | | | | |
| | | Net investment income/(loss)(2) | | 0.12 | | | 0.05 | |
| | | Net realized and unrealized gain/(loss) | | (0.68) | | | 0.13 | |
| | Total from Investment Operations | | (0.56) | | | 0.18 | |
| | Less Dividends and Distributions: | | | | | | |
| | | Dividends (from net investment income) | | (0.12) | | | — | |
| | | Distributions (from capital gains) | | (0.21) | | | — | |
| | Total Dividends and Distributions | | (0.33) | | | — | |
| | Net Asset Value, End of Period | | $9.53 | | | $10.42 | |
| | Total Return* | | (5.63)%(3) | | | 1.76% | |
| | Net Assets, End of Period (in thousands) | | $25,134 | | | $41,206 | |
| | Average Net Assets for the Period (in thousands) | | $29,832 | | | $41,394 | |
| | Ratios to Average Net Assets**: | | | | | | |
| | | Ratio of Gross Expenses | | 1.20% | | | 1.35% | |
| | | Ratio of Net Expenses (After Waivers and Expense Offsets) | | 1.03% | | | 1.05% | |
| | | Ratio of Net Investment Income/(Loss) | | 1.15% | | | 2.59% | |
| | Portfolio Turnover Rate | | 26% | | | 2% | |
| | | | | | | | | | |
| | | | | | | | | | |
Class S Shares | | | | | | |
For a share outstanding during the year or period ended September 30 | | 2018 | | | 2017(1) | |
| | Net Asset Value, Beginning of Period | | $10.41 | | | $10.23 | |
| | Income/(Loss) from Investment Operations: | | | | | | |
| | | Net investment income/(loss)(2) | | 0.13 | | | 0.04 | |
| | | Net realized and unrealized gain/(loss) | | (0.73) | | | 0.14 | |
| | Total from Investment Operations | | (0.60) | | | 0.18 | |
| | Less Dividends and Distributions: | | | | | | |
| | | Dividends (from net investment income) | | (0.09) | | | — | |
| | | Distributions (from capital gains) | | (0.21) | | | — | |
| | Total Dividends and Distributions | | (0.30) | | | — | |
| | Net Asset Value, End of Period | | $9.51 | | | $10.41 | |
| | Total Return* | | (5.98)% | | | 1.76% | |
| | Net Assets, End of Period (in thousands) | | $1,753 | | | $316 | |
| | Average Net Assets for the Period (in thousands) | | $1,189 | | | $311 | |
| | Ratios to Average Net Assets**: | | | | | | |
| | | Ratio of Gross Expenses | | 1.85% | | | 1.91% | |
| | | Ratio of Net Expenses (After Waivers and Expense Offsets) | | 1.47% | | | 1.51% | |
| | | Ratio of Net Investment Income/(Loss) | | 1.28% | | | 2.11% | |
| | Portfolio Turnover Rate | | 26% | | | 2% | |
| | | | | | | | | | |
| |
* Total return not annualized for periods of less than one full year. ** Annualized for periods of less than one full year. (1) Period from August 1, 2017 through September 30, 2017. The Fund changed its fiscal year end from July 31 to September 30. (2) Per share amounts are calculated based on average shares outstanding during the year or period. (3) The return includes adjustments in accordance with generally accepted accounting principles required at period end date. |
| | |
See Notes to Financial Statements. |
| |
20 | SEPTEMBER 30, 2018 |
Janus Henderson Emerging Markets Fund
Financial Highlights
| | | | | | | | | | |
Class N Shares | | | | | | |
For a share outstanding during the year or period ended July 31 | | 2017 | | | 2016(1) | |
| | Net Asset Value, Beginning of Period | | $9.13 | | | $8.06 | |
| | Income/(Loss) from Investment Operations: | | | | | | |
| | | Net investment income/(loss)(2) | | 0.40 | | | 0.06 | |
| | | Net realized and unrealized gain/(loss) | | 0.79 | | | 1.06 | |
| | Total from Investment Operations | | 1.19 | | | 1.12 | |
| | Less Dividends and Distributions: | | | | | | |
| | | Dividends (from net investment income) | | (0.08) | | | (0.05) | |
| | Total Dividends and Distributions | | (0.08) | | | (0.05) | |
| | Net Asset Value, End of Period | | $10.24 | | | $9.13 | |
| | Total Return* | | 13.17% | | | 13.92% | |
| | Net Assets, End of Period (in thousands) | | $40,785 | | | $318 | |
| | Average Net Assets for the Period (in thousands) | | $6,417 | | | $282 | |
| | Ratios to Average Net Assets**: | | | | | | |
| | | Ratio of Gross Expenses | | 1.32% | | | 2.17%(3) | |
| | | Ratio of Net Expenses (After Waivers and Expense Offsets) | | 1.24% | | | 1.54% | |
| | | Ratio of Net Investment Income/(Loss) | | 4.20% | | | 1.07% | |
| | Portfolio Turnover Rate | | 32% | | | 86% | |
| | | | | | | | | | |
| | | | | | | |
Class S Shares | | | |
For a share outstanding during the period ended July 31 | | 2017(4) | |
| | Net Asset Value, Beginning of Period | | $10.05 | |
| | Income/(Loss) from Investment Operations: | | | |
| | | Net investment income/(loss)(2) | | 0.07 | |
| | | Net realized and unrealized gain/(loss) | | 0.11 | |
| | Total from Investment Operations | | 0.18 | |
| | Less Dividends and Distributions: | | | |
| | | Dividends (from net investment income) | | — | |
| | Total Dividends and Distributions | | — | |
| | Net Asset Value, End of Period | | $10.23 | |
| | Total Return* | | 1.79% | |
| | Net Assets, End of Period (in thousands) | | $304 | |
| | Average Net Assets for the Period (in thousands) | | $266 | |
| | Ratios to Average Net Assets**: | | | |
| | | Ratio of Gross Expenses | | 1.69% | |
| | | Ratio of Net Expenses (After Waivers and Expense Offsets) | | 1.59% | |
| | | Ratio of Net Investment Income/(Loss) | | 4.51% | |
| | Portfolio Turnover Rate | | 32% | |
| | | | | | | |
| |
* Total return not annualized for periods of less than one full year. ** Annualized for periods of less than one full year. (1) Period from November 30, 2015 (inception date) through July 31, 2016. (2) Per share amounts are calculated based on average shares outstanding during the year or period. (3) The Ratio of Gross Expenses include a reimbursement of prior period custodian out-of-pocket expenses. The Ratio of Gross Expenses would have been 0.07% higher had the custodian not reimbursed the Fund. (4) Period from June 5, 2017 (inception date) through July 31, 2017. |
| | |
See Notes to Financial Statements. |
| |
Janus Investment Fund | 21 |
Janus Henderson Emerging Markets Fund
Financial Highlights
| | | | | | | | | | |
Class T Shares | | | | | | |
For a share outstanding during the year or period ended September 30 | | 2018 | | | 2017 |