United States Securities and Exchange Commission
Washington, D.C. 20549
Form N-CSR
Certified Shareholder Report of Registered Management Investment Companies
Investment Company Act file number 811-01879
Janus Investment Fund
(Exact name of registrant as specified in charter)
151 Detroit Street, Denver, Colorado 80206
(Address of principal executive offices) (Zip code)
Kathryn Santoro, 151 Detroit Street, Denver, Colorado 80206
(Name and address of agent for service)
Registrant's telephone number, including area code: 303-333-3863
Date of fiscal year end: 9/30
Date of reporting period: 9/30/19
Item 1 - Reports to Shareholders
ANNUAL REPORT September 30, 2019 | |||
Janus Henderson Asia Equity Fund | |||
Janus Investment Fund | |||
Beginning on January 1, 2021, as permitted by regulations adopted by the Securities and Exchange Commission, paper copies of the Fund’s shareholder reports will no longer be sent by mail, unless you specifically request paper copies of the reports from the Fund or your plan sponsor, broker-dealer, or financial intermediary, or if you invest directly with the Fund, by contacting a Janus Henderson representative. Instead, the reports will be made available on a website, and you will be notified by mail each time a report is posted and provided with a website link to access the report. If you already elected to receive shareholder reports electronically, you will not be affected by this change and you need not take any action. You may elect to receive shareholder reports and other communications from the Fund electronically by contacting your plan sponsor, broker-dealer, or financial intermediary, or if you invest directly with the Fund, by visiting janushenderson.com/edelivery. You may elect to receive all future reports in paper free of charge. If you do not invest directly with the Fund, you should contact your plan sponsor, broker-dealer, or financial intermediary, to request to continue receiving paper copies of your shareholder reports. If you invest directly with the Fund, you can call 1-800-525-3713 to let the Fund know that you wish to continue receiving paper copies of your shareholder reports. Your election to receive reports in paper will apply to all Janus Henderson mutual funds where held (i.e., all Janus Henderson mutual funds held in your account if you invest through your financial intermediary or all Janus Henderson mutual funds held with the fund complex if you invest directly with a fund).
| |||
HIGHLIGHTS · Portfolio management perspective · Investment strategy behind your fund · Fund performance, characteristics | |||
|

Table of Contents
Janus Henderson Asia Equity Fund
Janus Henderson Asia Equity Fund (unaudited)


PERFORMANCE
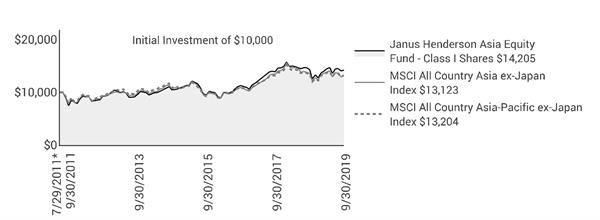
The Janus Henderson Asia Equity Fund Class I Shares returned -0.68% over the one-year period ended September 30, 2019. The Fund’s primary benchmark, the MSCI All Country Asia ex Japan IndexSM, returned -3.44%. The Fund’s secondary benchmark, the MSCI All Country Asia Pacific ex Japan IndexSM, returned -1.77%.
INVESTMENT ENVIRONMENT
Asian equity markets declined by close to 3% during the 12-month period, as the highly publicized U.S.-China trade wars weighed on market sentiment. This hit equity markets in particular in the final quarter of 2018, after which we saw a recovery through the early part of 2019 before hopes of a clear resolution faded. With the threat of increased tariffs from those originally proposed and a general deterioration in global economic data, Asian equity markets ended the period weaker.
In other political news, incumbents in both India and Indonesia won re-election. This was expected in Indonesia, but in India the strength of Prime Minister Narendra Modi’s victory was a surprise. In both cases, there is increased optimism for bolder reforms in their second terms of government. At the end of the period, the Indian government delivered a surprising and significant cut in corporate taxes as well as other incentives to attract foreign direct investments, a move that we believe bodes well for the future.
Economic data was sluggish but it is worth stressing that economic growth rates in the region remain among the highest in the world, with GDP growth above 5% in many Asian economies. Interest-rate policy is also conventional and we already have seen some interest-rate cuts in the region as a response to the softer data. There is more policy flexibility available in the future across much of the region, given higher interest rates than compared to much of the developed world.
PERFORMANCE DISCUSSION
The Fund outperformed its primary and secondary benchmarks over the 12-month period, posting a small decline. Our overweight position to India proved the most significant contributor in terms of asset allocation. Modi’s victory and the Indian government’s corporate tax cut were supportive, but the Indian economy is also more domestically demand-driven, and therefore is less impacted by the trade disputes. By sector, our financials exposure was the greatest contributor, driven primarily by stock selection, although our overweight also proved positive given the sector outperformed. Within financials, we can find both structural growth in the case of life insurance and emerging-market banks, as well as defensive attributes and a good dividend yield in markets like Taiwan and Singapore. Two Indian private-sector financials, HDFC Bank and its parent company, HDFC Ltd.; Taiwanese bank E Sun Financial Holding; and Ping An Insurance, a Chinese life insurance company, were among our top contributors for the year.
Consumer discretionary was the biggest detractor, due primarily to stock selection from positions in Chinese car manufacturer Brilliance China Automotive and global luggage company Samsonite International SA. We have maintained the position in the latter, but have exited the position in the former, given some industry challenges on top of various company-specific issues. At the country level, our holdings in Hong Kong detracted, as ongoing demonstrations created volatility. Baidu.com, a Chinese multinational technology company, and Catcher Technology, a Taiwan-based electronic component manufacturer, also detracted.
In terms of portfolio activity, during the 12-month period we increased our exposure to Southeast Asia (ASEAN) and to Indonesia in particular, where we added two banks to the portfolio. Both offer the potential for good structural growth and an attractive return on equity, and further, we believe that ASEAN is less impacted from the trade
Janus Investment Fund | 1 |
Janus Henderson Asia Equity Fund (unaudited)
dispute versus North Asia. We also exited a tobacco company in India, as we felt that the unfavorable regulatory environment would continue to dampen the company’s growth prospects. We redeployed the proceeds into another Indian consumer staples company, where we felt its dominant position in the oral-care industry will continue to drive sustainable growth going forward in an area where penetration rates remain relatively low. We added to a number of existing holdings in China on relative market weakness toward the end of the period. Other changes made through the year were more company-specific and we continue to run a focused portfolio of fewer than 40 companies.
OUTLOOK
The trade war will continue to dictate sentiment in the near-term, and there is a possibility of a relief rally on any kind of resolution, hence our decision to narrow some of our underweight to China toward the period-end. We remain cautious on China as there still is no sign of any major stimulus; economic weakness may continue for longer and valuations particularly in the local A share market look a little stretched. Hong Kong-listed China shares are more reasonably priced. We remain overweight to India and Taiwan as we are comfortable with the structural-growth opportunities and high return on capital available in India, while Taiwanese companies provide a good combination of strong balance sheets and cash flow at reasonable prices. For the region as a whole, corporate earnings growth remains lackluster so we are still slightly cautious until we see stronger earnings revisions. A trade deal could help this as it will give more certainty for companies to invest, and we suspect it also will boost consumer sentiment. Longer-term, the case for Asia remains very positive given its economic growth and valuations at an attractive discount to developed-market equities.
2 | SEPTEMBER 30, 2019 |
Janus Henderson Asia Equity Fund (unaudited)
Fund At A Glance
September 30, 2019
5 Top Performers - Holdings |
|
|
| 5 Bottom Performers - Holdings |
| |
Contribution | Contribution | |||||
HDFC Bank Ltd | 1.14% | Brilliance China Automotive Holdings Ltd | -0.97% | |||
Housing Development Finance Corp Ltd | 0.68% | Samsonite International SA | -0.95% | |||
E.Sun Financial Holding Co Ltd | 0.59% | Baidu Inc (ADR) | -0.56% | |||
Advantech Co Ltd | 0.58% | Catcher Technology Co Ltd | -0.50% | |||
Ping An Insurance Group Co of China Ltd | 0.45% | BOC Hong Kong Holdings Ltd | -0.41% | |||
5 Top Performers - Sectors* |
|
|
|
|
| |
Fund | Fund Weighting | MSCI All Country Asia ex-Japan Index | ||||
Contribution | (Average % of Equity) | Weighting | ||||
Financials | 3.52% | 33.24% | 23.97% | |||
Health Care | 0.76% | 0.00% | 2.92% | |||
Industrials | 0.68% | 2.72% | 6.90% | |||
Materials | 0.54% | 0.00% | 4.63% | |||
Information Technology | 0.49% | 21.29% | 16.78% | |||
5 Bottom Performers - Sectors* |
|
|
|
|
| |
Fund | Fund Weighting | MSCI All Country Asia ex-Japan Index | ||||
Contribution | (Average % of Equity) | Weighting | ||||
Consumer Discretionary | -1.31% | 14.57% | 12.91% | |||
Real Estate | -0.25% | 4.89% | 6.27% | |||
Utilities | -0.13% | 0.00% | 3.33% | |||
Communication Services | 0.08% | 5.18% | 12.61% | |||
Consumer Staples | 0.16% | 13.25% | 5.05% | |||
Security contribution to performance is measured by using an algorithm that multiplies the daily performance of each security with the previous day’s ending weight in the portfolio and is gross of advisory fees. Fixed income securities and certain equity securities, such as private placements and some share classes of equity securities, are excluded. | ||||||
* | Based on sector classification according to the Global Industry Classification Standard (“GICS”) codes, which are the exclusive property and a service mark of MSCI Inc. and Standard & Poor’s. | |||||
Janus Investment Fund | 3 |
Janus Henderson Asia Equity Fund (unaudited)
Fund At A Glance
September 30, 2019
5 Largest Equity Holdings - (% of Net Assets) | |
Tencent Holdings Ltd | |
Interactive Media & Services | 5.3% |
Alibaba Group Holding Ltd (ADR) | |
Internet & Direct Marketing Retail | 5.1% |
AIA Group Ltd | |
Insurance | 5.0% |
Taiwan Semiconductor Manufacturing Co Ltd | |
Semiconductor & Semiconductor Equipment | 5.0% |
HDFC Bank Ltd | |
Banks | 4.7% |
25.1% | |
Asset Allocation - (% of Net Assets) | |||||
Common Stocks | 91.3% | ||||
Investment Companies | 4.9% | ||||
Preferred Stocks | 4.3% | ||||
Other | (0.5)% | ||||
100.0% | |||||
Emerging markets comprised 76.3% of total net assets.
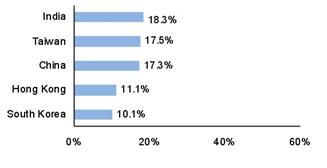
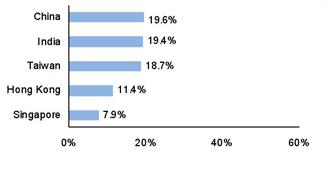
Top Country Allocations - Long Positions - (% of Investment Securities) | |
As of September 30, 2019
| As of September 30, 2018
|
4 | SEPTEMBER 30, 2019 |
Janus Henderson Asia Equity Fund (unaudited)
Performance
See important disclosures on the next page. |
| |||||||||
Average Annual Total Return - for the periods ended September 30, 2019 |
|
| Expense Ratios | ||||||
|
| One | Five | Since |
|
| Total Annual Fund | Net Annual Fund | |
Class A Shares at NAV |
| -0.95% | 5.96% | 4.08% |
|
| 2.08% | 1.51% | |
Class A Shares at MOP |
| -6.66% | 4.71% | 3.33% |
|
|
|
| |
Class C Shares at NAV | -1.45% | 5.24% | 3.37% |
|
| 2.79% | 2.22% | ||
Class C Shares at CDSC |
| -2.36% | 5.24% | 3.37% |
|
|
|
| |
Class D Shares(1) |
| -0.78% | 6.16% | 4.25% |
|
| 1.72% | 1.29% | |
Class I Shares |
| -0.68% | 6.29% | 4.39% |
|
| 1.44% | 1.16% | |
Class N Shares |
| -0.68% | 5.88% | 3.83% |
|
| 1.75% | 1.13% | |
Class S Shares |
| -0.81% | 5.99% | 4.06% |
|
| 2.36% | 1.63% | |
Class T Shares |
| -0.66% | 6.15% | 4.23% |
|
| 1.81% | 1.38% | |
MSCI All Country Asia ex-Japan Index |
| -3.44% | 4.23% | 3.38% |
|
|
|
| |
MSCI All Country Asia-Pacific ex-Japan Index |
| -1.77% | 4.07% | 3.46% |
|
|
|
| |
Morningstar Quartile - Class I Shares |
| 3rd | 1st | 2nd |
|
|
|
| |
Morningstar Ranking - based on total returns for Pacific/Asia ex-Japan Stock Funds |
| 57/89 | 14/78 | 18/68 |
|
|
|
| |
Returns quoted are past performance and do not guarantee future results; current performance may be lower or higher. Investment returns and principal value will vary; there may be a gain or loss when shares are sold. For the most recent month-end performance call 800.668.0434 (or 800.525.3713 if you hold shares directly with Janus Henderson) or visit janushenderson.com/performance (or janushenderson.com/allfunds if you hold shares directly with Janus Henderson).
Maximum Offering Price (MOP) returns include the maximum sales charge of 5.75%. Net Asset Value (NAV) returns exclude this charge, which would have reduced returns.
CDSC returns include a 1% contingent deferred sales charge (CDSC) on Shares redeemed within 12 months of purchase. Net Asset Value (NAV) returns exclude this charge, which would have reduced returns.
Net expense ratios reflect the expense waiver, if any, contractually agreed to through February 1, 2020.
This Fund has a performance-based management fee that may adjust up or down based on the Fund’s performance.
Janus Investment Fund | 5 |
Janus Henderson Asia Equity Fund (unaudited)
Performance
Performance may be affected by risks that include those associated with non-diversification, portfolio turnover, short sales, potential conflicts of interest, foreign and emerging markets, initial public offerings (IPOs), high-yield and high-risk securities, undervalued, overlooked and smaller capitalization companies, real estate related securities including Real Estate Investment Trusts (REITs), derivatives, and commodity-linked investments. Each product has different risks. Please see the prospectus for more information about risks, holdings and other details.
The Fund will normally invest at least 80% of its net assets, measured at the time of purchase, in the type of securities described by its name.
Returns include reinvestment of all dividends and distributions and do not reflect the deduction of taxes that a shareholder would pay on Fund distributions or redemptions of Fund shares. The returns do not include adjustments in accordance with generally accepted accounting principles required at the period end for financial reporting purposes.
Class N Shares commenced operations on January 26, 2018. Performance shown for periods prior to January 26, 2018, reflects the historical performance of the Fund's Class I Shares, calculated using the fees and expenses of Class N Shares, without the effect of any fee and expense limitations or waivers.
If Class N Shares of the Fund had been available during periods prior to January 26, 2018, the performance shown may have been different. The performance shown for periods following the Fund's commencement of Class N Shares reflects the fees and expenses of Class N Shares, net of any applicable fee and expense limitations or waivers. Please refer to the Fund's prospectuses for further details concerning historical performance.
Ranking is for the share class shown only; other classes may have different performance characteristics. When an expense waiver is in effect, it may have a material effect on the total return, and therefore the ranking for the period.
© 2019 Morningstar, Inc. All Rights Reserved.
There is no assurance that the investment process will consistently lead to successful investing.
See Notes to Schedule of Investments and Other Information for index definitions.
Index performance does not reflect the expenses of managing a portfolio as an index is unmanaged and not available for direct investment.
See “Useful Information About Your Fund Report.”
*The Fund’s inception date – July 29, 2011
‡ As stated in the prospectus. See Financial Highlights for actual expense ratios during the reporting period.
(1) Closed to certain new investors.
6 | SEPTEMBER 30, 2019 |
Janus Henderson Asia Equity Fund (unaudited)
Expense Examples
As a shareholder of the Fund, you incur two types of costs: (1) transaction costs, such as sales charges (loads) on purchase payments (applicable to Class A Shares only); and (2) ongoing costs, including management fees; 12b-1 distribution and shareholder servicing fees; transfer agent fees and expenses payable pursuant to the Transfer Agency Agreement; and other Fund expenses. This example is intended to help you understand your ongoing costs (in dollars) of investing in the Fund and to compare these costs with the ongoing costs of investing in other mutual funds. To do so, compare this 5% hypothetical example with the 5% hypothetical examples that appear in the shareholder reports of the other funds. The example is based upon an investment of $1,000 invested at the beginning of the period and held for the six-months indicated, unless noted otherwise in the table and footnotes below.
Actual Expenses
The information in the table under the heading “Actual” provides information about actual account values and actual expenses. You may use the information in these columns, together with the amount you invested, to estimate the expenses that you paid over the period. Simply divide your account value by $1,000 (for example, an $8,600 account value divided by $1,000 = 8.6), then multiply the result by the number in the appropriate column for your share class under the heading entitled “Expenses Paid During Period” to estimate the expenses you paid on your account during the period.
Hypothetical Example for Comparison Purposes
The information in the table under the heading “Hypothetical (5% return before expenses)” provides information about hypothetical account values and hypothetical expenses based upon the Fund’s actual expense ratio and an assumed rate of return of 5% per year before expenses, which is not the Fund’s actual return. The hypothetical account values and expenses may not be used to estimate the actual ending account balance or expenses you paid for the period. You may use this information to compare the ongoing costs of investing in the Fund and other funds. To do so, compare this 5% hypothetical example with the 5% hypothetical examples that appear in the shareholder reports of the other funds. Additionally, for an analysis of the fees associated with an investment in any share class or other similar funds, please visit www.finra.org/fundanalyzer.
Please note that the expenses shown in the table are meant to highlight your ongoing costs only and do not reflect any transaction costs. These fees are fully described in the Fund’s prospectuses. Therefore, the hypothetical examples are useful in comparing ongoing costs only, and will not help you determine the relative total costs of owning different funds. In addition, if these transaction costs were included, your costs would have been higher.
Actual | Hypothetical | |||||||||
| Beginning | Ending | Expenses |
| Beginning | Ending | Expenses | Net Annualized | ||
Class A Shares | $1,000.00 | $983.00 | $7.51 |
| $1,000.00 | $1,017.50 | $7.64 | 1.51% | ||
Class C Shares | $1,000.00 | $980.80 | $9.73 |
| $1,000.00 | $1,015.24 | $9.90 | 1.96% | ||
Class D Shares | $1,000.00 | $983.20 | $6.76 |
| $1,000.00 | $1,018.25 | $6.88 | 1.36% | ||
Class I Shares | $1,000.00 | $984.10 | $6.12 |
| $1,000.00 | $1,018.90 | $6.23 | 1.23% | ||
Class N Shares | $1,000.00 | $984.10 | $5.97 |
| $1,000.00 | $1,019.05 | $6.07 | 1.20% | ||
Class S Shares | $1,000.00 | $983.90 | $6.07 |
| $1,000.00 | $1,018.95 | $6.17 | 1.22% | ||
Class T Shares | $1,000.00 | $983.00 | $7.16 |
| $1,000.00 | $1,017.85 | $7.28 | 1.44% | ||
† | Expenses Paid During Period are equal to the Net Annualized Expense Ratio multiplied by the average account value over the period, multiplied by 183/365 (to reflect the one-half year period). Expenses in the examples include the effect of applicable fee waivers and/or expense reimbursements, if any. Had such waivers and/or reimbursements not been in effect, your expenses would have been higher. Please refer to the Notes to Financial Statements or the Fund’s prospectuses for more information regarding waivers and/or reimbursements. | |||||||||
Janus Investment Fund | 7 |
Janus Henderson Asia Equity Fund
Schedule of Investments
September 30, 2019
| Value | ||||||
Common Stocks – 91.3% | |||||||
Banks – 13.5% | |||||||
Bank Central Asia Tbk PT | 224,500 | $480,167 | |||||
Bank Rakyat Indonesia Persero Tbk PT | 2,001,300 | 581,068 | |||||
E.Sun Financial Holding Co Ltd | 657,374 | 556,007 | |||||
HDFC Bank Ltd | 67,567 | 1,170,387 | |||||
Oversea-Chinese Banking Corp Ltd | 67,400 | 529,718 | |||||
3,317,347 | |||||||
Beverages – 5.0% | |||||||
Jiangsu Yanghe Brewery Joint-Stock Co Ltd | 23,971 | 349,192 | |||||
| �� | Treasury Wine Estates Ltd | 71,558 | 896,696 | ||||
1,245,888 | |||||||
Diversified Financial Services – 6.4% | |||||||
Ayala Corp | 58,150 | 992,736 | |||||
Bajaj Holdings & Investment Ltd | 11,376 | 576,857 | |||||
1,569,593 | |||||||
Food Products – 5.4% | |||||||
Uni-President Enterprises Corp | 385,000 | 926,779 | |||||
Vietnam Dairy Products JSC | 72,854 | 407,292 | |||||
1,334,071 | |||||||
Hotels, Restaurants & Leisure – 2.3% | |||||||
Sands China Ltd | 122,800 | 556,223 | |||||
Household Durables – 9.4% | |||||||
Midea Group Co Ltd | 68,778 | 492,283 | |||||
Nien Made Enterprise Co Ltd | 55,000 | 480,740 | |||||
Techtronic Industries Co Ltd | 98,000 | 682,092 | |||||
Woongjin Coway Co Ltd | 9,313 | 658,762 | |||||
2,313,877 | |||||||
Information Technology Services – 5.5% | |||||||
Infosys Ltd | 62,956 | 715,772 | |||||
Tata Consultancy Services Ltd | 21,447 | 635,378 | |||||
1,351,150 | |||||||
Insurance – 8.5% | |||||||
AIA Group Ltd | 129,800 | 1,226,372 | |||||
Ping An Insurance Group Co of China Ltd | 76,000 | 873,212 | |||||
2,099,584 | |||||||
Interactive Media & Services – 5.3% | |||||||
Tencent Holdings Ltd | 31,300 | 1,318,693 | |||||
Internet & Direct Marketing Retail – 5.1% | |||||||
Alibaba Group Holding Ltd (ADR)* | 7,538 | 1,260,580 | |||||
Personal Products – 3.6% | |||||||
Colgate-Palmolive India Ltd | 14,000 | 297,134 | |||||
LG Household & Health Care Ltd | 538 | 587,931 | |||||
885,065 | |||||||
Real Estate Management & Development – 5.1% | |||||||
City Developments Ltd | 78,200 | 555,742 | |||||
Land & Houses PCL (REG) | 2,206,000 | 692,531 | |||||
1,248,273 | |||||||
Semiconductor & Semiconductor Equipment – 5.0% | |||||||
Taiwan Semiconductor Manufacturing Co Ltd | 140,000 | 1,226,124 | |||||
Technology Hardware, Storage & Peripherals – 5.4% | |||||||
Advantech Co Ltd | 88,797 | 780,900 | |||||
Catcher Technology Co Ltd | 49,000 | 369,400 | |||||
Samsung Electronics Co Ltd | 4,466 | 183,158 | |||||
1,333,458 | |||||||
Textiles, Apparel & Luxury Goods – 1.2% | |||||||
Samsonite International SA (144A) | 138,600 | 293,558 | |||||
Thrifts & Mortgage Finance – 4.6% | |||||||
Housing Development Finance Corp Ltd | 40,770 | 1,137,494 | |||||
Total Common Stocks (cost $19,848,833) | 22,490,978 | ||||||
See Notes to Schedule of Investments and Other Information and Notes to Financial Statements. | |
8 | SEPTEMBER 30, 2019 |
Janus Henderson Asia Equity Fund
Schedule of Investments
September 30, 2019
| Value | ||||||
Preferred Stocks – 4.3% | |||||||
Technology Hardware, Storage & Peripherals – 4.3% | |||||||
Samsung Electronics Co Ltd (cost $920,237) | 32,056 | $1,058,706 | |||||
Investment Companies – 4.9% | |||||||
Money Markets – 4.9% | |||||||
Fidelity Investments Money Market Treasury Portfolio, 1.8200%ºº (cost $1,213,782) | 1,213,782 | 1,213,782 | |||||
Total Investments (total cost $21,982,852) – 100.5% | 24,763,466 | ||||||
Liabilities, net of Cash, Receivables and Other Assets – (0.5)% | (123,672) | ||||||
Net Assets – 100% | $24,639,794 | ||||||
Summary of Investments by Country - (Long Positions) (unaudited) | |||||
% of | |||||
Investment | |||||
Country | Value | Securities | |||
India | $4,533,022 | 18.3 | % | ||
Taiwan | 4,339,950 | 17.5 | |||
China | 4,293,960 | 17.3 | |||
Hong Kong | 2,758,245 | 11.1 | |||
South Korea | 2,488,557 | 10.1 | |||
United States | 1,213,782 | 4.9 | |||
Singapore | 1,085,460 | 4.4 | |||
Indonesia | 1,061,235 | 4.3 | |||
Philippines | 992,736 | 4.0 | |||
Australia | 896,696 | 3.6 | |||
Thailand | 692,531 | 2.8 | |||
Vietnam | 407,292 | 1.7 | |||
Total | $24,763,466 | 100.0 | % |
See Notes to Schedule of Investments and Other Information and Notes to Financial Statements. | |
Janus Investment Fund | 9 |
Janus Henderson Asia Equity Fund
Notes to Schedule of Investments and Other Information
MSCI All Country Asia ex-Japan IndexSM | MSCI All Country Asia ex-Japan IndexSM reflects the equity market performance of Asia, excluding Japan. |
MSCI All Country Asia-Pacific ex-Japan IndexSM | The MSCI All Country Asia-Pacific ex-Japan IndexSM reflects the performance of large and mid-cap companies in developed and emerging markets in the Asia Pacific region, excluding Japan. |
ADR | American Depositary Receipt |
PCL | Public Company Limited |
REG | Registered |
144A | Securities sold under Rule 144A of the Securities Act of 1933, as amended, are subject to legal and/or contractual restrictions on resale and may not be publicly sold without registration under the 1933 Act. Unless otherwise noted, these securities have been determined to be liquid under guidelines established by the Board of Trustees. The total value of 144A securities as of the year ended September 30, 2019 is $293,558, which represents 1.2% of net assets. |
* | Non-income producing security. |
ºº | Rate shown is the 7-day yield as of September 30, 2019. |
The following is a summary of the inputs that were used to value the Fund’s investments in securities and other financial instruments as of September 30, 2019. See Notes to Financial Statements for more information. | ||||||||||||
Valuation Inputs Summary | ||||||||||||
Level 2 - | Level 3 - | |||||||||||
Level 1 - | Other Significant | Significant | ||||||||||
Quoted Prices | Observable Inputs | Unobservable Inputs | ||||||||||
Assets | ||||||||||||
Investments In Securities: | ||||||||||||
Common Stocks | ||||||||||||
Banks | $ | 2,761,340 | $ | 556,007 | $ | - | ||||||
Beverages | 896,696 | 349,192 | - | |||||||||
Food Products | 407,292 | 926,779 | - | |||||||||
Household Durables | 1,340,854 | 973,023 | - | |||||||||
Real Estate Management & Development | 555,742 | 692,531 | - | |||||||||
Semiconductor & Semiconductor Equipment | - | 1,226,124 | - | |||||||||
Technology Hardware, Storage & Peripherals | 183,158 | 1,150,300 | - | |||||||||
All Other | 10,471,940 | - | - | |||||||||
Preferred Stocks | - | 1,058,706 | - | |||||||||
Investment Companies | 1,213,782 | - | - | |||||||||
Total Assets | $ | 17,830,804 | $ | 6,932,662 | $ | - | ||||||
10 | SEPTEMBER 30, 2019 |
Janus Henderson Asia Equity Fund
Statement of Assets and Liabilities
September 30, 2019
See footnotes at the end of the Statement. |
|
|
|
|
|
|
|
Assets: | ||||||
Investments, at value(1) | $ | 24,763,466 | ||||
Cash denominated in foreign currency(2) | 1,992 | |||||
Non-interested Trustees' deferred compensation | 637 | |||||
Receivables: | ||||||
Investments sold | 205,249 | |||||
Dividends | 61,715 | |||||
Fund shares sold | 3,568 | |||||
Foreign tax reclaims | 1,069 | |||||
Other assets | 2,458 | |||||
Total Assets |
|
| 25,040,154 |
| ||
Liabilities: | ||||||
Payables: | — | |||||
Investments purchased | 154,610 | |||||
Foreign tax liability | 141,074 | |||||
Professional fees | 43,075 | |||||
Fund shares repurchased | 19,699 | |||||
Non-affiliated fund administration fees payable | 14,431 | |||||
Advisory fees | 8,754 | |||||
Custodian fees | 4,490 | |||||
Transfer agent fees and expenses | 3,707 | |||||
12b-1 Distribution and shareholder servicing fees | 709 | |||||
Non-interested Trustees' deferred compensation fees | 637 | |||||
Non-interested Trustees' fees and expenses | 158 | |||||
Affiliated fund administration fees payable | 51 | |||||
Accrued expenses and other payables | 8,965 | |||||
Total Liabilities |
|
| 400,360 |
| ||
Net Assets |
| $ | 24,639,794 |
| ||
See Notes to Financial Statements. | |
Janus Investment Fund | 11 |
Janus Henderson Asia Equity Fund
Statement of Assets and Liabilities
September 30, 2019
|
|
|
|
|
|
|
Net Assets Consist of: | ||||||
Capital (par value and paid-in surplus) | $ | 22,862,450 | ||||
Total distributable earnings (loss)(3) | 1,777,344 | |||||
Total Net Assets |
| $ | 24,639,794 |
| ||
Net Assets - Class A Shares | $ | 822,497 | ||||
Shares Outstanding, $0.01 Par Value (unlimited shares authorized) | 79,184 | |||||
Net Asset Value Per Share(4) |
| $ | 10.39 |
| ||
Maximum Offering Price Per Share(5) |
| $ | 11.02 |
| ||
Net Assets - Class C Shares | $ | 535,491 | ||||
Shares Outstanding, $0.01 Par Value (unlimited shares authorized) | 52,368 | |||||
Net Asset Value Per Share(4) |
| $ | 10.23 |
| ||
Net Assets - Class D Shares | $ | 11,198,373 | ||||
Shares Outstanding, $0.01 Par Value (unlimited shares authorized) | 1,063,595 | |||||
Net Asset Value Per Share |
| $ | 10.53 |
| ||
Net Assets - Class I Shares | $ | 1,406,029 | ||||
Shares Outstanding, $0.01 Par Value (unlimited shares authorized) | 133,366 | |||||
Net Asset Value Per Share |
| $ | 10.54 |
| ||
Net Assets - Class N Shares | $ | 8,886,431 | ||||
Shares Outstanding, $0.01 Par Value (unlimited shares authorized) | 844,438 | |||||
Net Asset Value Per Share |
| $ | 10.52 |
| ||
Net Assets - Class S Shares | $ | 481,010 | ||||
Shares Outstanding, $0.01 Par Value (unlimited shares authorized) | 46,216 | |||||
Net Asset Value Per Share |
| $ | 10.41 |
| ||
Net Assets - Class T Shares | $ | 1,309,963 | ||||
Shares Outstanding, $0.01 Par Value (unlimited shares authorized) | 125,834 | |||||
Net Asset Value Per Share |
| $ | 10.41 |
| ||
(1) Includes cost of $21,982,852. (2) Includes cost of $1,992. (3) Includes $141,074 of foreign capital gains tax on investments. (4) Redemption price per share may be reduced for any applicable contingent deferred sales charge. (5) Maximum offering price is computed at 100/94.25 of net asset value. |
See Notes to Financial Statements. | |
12 | SEPTEMBER 30, 2019 |
Janus Henderson Asia Equity Fund
Statement of Operations
For the year ended September 30, 2019
|
|
|
|
|
|
Investment Income: | |||||
| Dividends | $ | 590,725 | ||
Interest | 4,469 | ||||
Foreign tax withheld | (55,961) | ||||
Total Investment Income |
| 539,233 |
| ||
Expenses: | |||||
Advisory fees | 233,033 | ||||
12b-1 Distribution and shareholder servicing fees: | |||||
Class A Shares | 1,963 | ||||
Class C Shares | 5,997 | ||||
Class S Shares | 243 | ||||
Transfer agent administrative fees and expenses: | |||||
Class D Shares | 13,892 | ||||
Class S Shares | 1,167 | ||||
Class T Shares | 3,025 | ||||
Transfer agent networking and omnibus fees: | |||||
Class A Shares | 529 | ||||
Class C Shares | 684 | ||||
Class I Shares | 351 | ||||
Other transfer agent fees and expenses: | |||||
Class A Shares | 218 | ||||
Class C Shares | 159 | ||||
Class D Shares | 6,485 | ||||
Class I Shares | 258 | ||||
Class N Shares | 1,167 | ||||
Class S Shares | 70 | ||||
Class T Shares | 185 | ||||
Registration fees | 108,368 | ||||
Professional fees | 72,779 | ||||
Non-affiliated fund administration fees | 66,928 | ||||
Custodian fees | 14,566 | ||||
Shareholder reports expense | 10,767 | ||||
Non-interested Trustees’ fees and expenses | 643 | ||||
Affiliated fund administration fees | 566 | ||||
Other expenses | 4,894 | ||||
Total Expenses |
| 548,937 |
| ||
Less: Excess Expense Reimbursement and Waivers |
| (235,396) |
| ||
Net Expenses |
| 313,541 |
| ||
Net Investment Income/(Loss) |
| 225,692 |
| ||
Net Realized Gain/(Loss) on Investments: | |||||
Investments and foreign currency transactions(1) | (1,041,868) | ||||
Total Net Realized Gain/(Loss) on Investments |
| (1,041,868) |
| ||
Change in Unrealized Net Appreciation/Depreciation: | |||||
Investments, foreign currency translations and non-interested Trustees’ deferred compensation(2) | 500,895 | ||||
Total Change in Unrealized Net Appreciation/Depreciation |
| 500,895 |
| ||
Net Increase/(Decrease) in Net Assets Resulting from Operations | $ | (315,281) |
| ||
(1) Includes realized foreign capital gains tax on investments of $(3,910). (2) Includes change in unrealized appreciation/depreciation of $(45,383) due to foreign capital gains tax on investments. |
See Notes to Financial Statements. | |
Janus Investment Fund | 13 |
Janus Henderson Asia Equity Fund
Statements of Changes in Net Assets
|
|
| Year ended |
| Year ended | |||
Operations: | ||||||||
Net investment income/(loss) | $ | 225,692 | $ | 231,650 | ||||
Net realized gain/(loss) on investments | (1,041,868) | 2,156,515 | ||||||
Change in unrealized net appreciation/depreciation | 500,895 | (949,637) | ||||||
Net Increase/(Decrease) in Net Assets Resulting from Operations |
| (315,281) |
|
| 1,438,528 | |||
Dividends and Distributions to Shareholders | ||||||||
Class A Shares | (63,549) | (27,500) | ||||||
Class C Shares | (85,343) | (26,838) | ||||||
Class D Shares | (916,560) | (653,620) | ||||||
Class I Shares | (97,500) | (337,205) | ||||||
Class N Shares | (632,223) | — | ||||||
Class S Shares | (37,204) | (12,848) | ||||||
Class T Shares | (67,544) | (80,293) | ||||||
Net Decrease from Dividends and Distributions to Shareholders |
| (1,899,923) |
|
| (1,138,304) | |||
Capital Share Transactions: | ||||||||
Class A Shares | 89,862 | 484,453 | ||||||
Class C Shares | (566,502) | 315,110 | ||||||
Class D Shares | (824,350) | (8,674,983) | ||||||
Class I Shares | 471,095 | (12,337,210) | ||||||
Class N Shares | 1,119,910 | 9,035,795 | ||||||
Class S Shares | 37,204 | 12,848 | ||||||
Class T Shares | 332,850 | (1,925,915) | ||||||
Net Increase/(Decrease) from Capital Share Transactions |
| 660,069 |
|
| (13,089,902) | |||
Net Increase/(Decrease) in Net Assets |
| (1,555,135) |
|
| (12,789,678) | |||
Net Assets: | ||||||||
Beginning of period | 26,194,929 | 38,984,607 | ||||||
| End of period | $ | 24,639,794 |
| $ | 26,194,929 | ||
(1) Period from January 26, 2018 (inception date) through September 30, 2018 for Class N Shares. |
See Notes to Financial Statements. | |
14 | SEPTEMBER 30, 2019 |
Janus Henderson Asia Equity Fund
Financial Highlights
Class A Shares | ||||||||||||||||||
For a share outstanding during the year ended September 30 |
| 2019 |
|
| 2018 |
|
| 2017 |
|
| 2016 |
|
| 2015 |
| |||
Net Asset Value, Beginning of Period |
| $11.42 |
|
| $11.45 |
|
| $9.42 |
|
| $8.31 |
|
| $9.79 |
| |||
Income/(Loss) from Investment Operations: | ||||||||||||||||||
Net investment income/(loss)(1) | 0.10 | 0.07 | 0.02 | 0.05 | 0.01 | |||||||||||||
Net realized and unrealized gain/(loss) | (0.27) | 0.22 | 2.12 | 1.44 | (0.95) | |||||||||||||
Total from Investment Operations |
| (0.17) |
|
| 0.29 |
|
| 2.14 |
|
| 1.49 |
|
| (0.94) |
| |||
Less Dividends and Distributions: | ||||||||||||||||||
Dividends (from net investment income) | (0.02) | (0.05) | (0.11) | — | (0.17) | |||||||||||||
Distributions (from capital gains) | (0.84) | (0.27) | — | (0.38) | (0.37) | |||||||||||||
Total Dividends and Distributions |
| (0.86) |
|
| (0.32) |
|
| (0.11) |
|
| (0.38) |
|
| (0.54) |
| |||
Net Asset Value, End of Period | $10.39 | $11.42 | $11.45 | $9.42 | $8.31 | |||||||||||||
Total Return* |
| (0.69)% |
|
| 2.48% |
|
| 23.10% |
|
| 18.58% |
|
| (10.07)% |
| |||
Net Assets, End of Period (in thousands) | $822 | $816 | $366 | $253 | $348 | |||||||||||||
Average Net Assets for the Period (in thousands) | $822 | $954 | $293 | $333 | $400 | |||||||||||||
Ratios to Average Net Assets**: |
|
|
|
|
|
|
|
|
|
|
|
|
|
|
| |||
Ratio of Gross Expenses | 2.72% | 2.08% | 2.49% | 3.51% | 2.87% | |||||||||||||
Ratio of Net Expenses (After Waivers and Expense Offsets) | 1.49% | 1.53% | 1.63% | 1.56% | 1.61% | |||||||||||||
Ratio of Net Investment Income/(Loss) | 0.95% | 0.60% | 0.17% | 0.64% | 0.07% | |||||||||||||
Portfolio Turnover Rate | 34% | 41% | 120% | 59% | 152% | |||||||||||||
Class C Shares | ||||||||||||||||||
For a share outstanding during the year ended September 30 |
| 2019 |
|
| 2018 |
|
| 2017 |
|
| 2016 |
|
| 2015 |
| |||
Net Asset Value, Beginning of Period |
| $11.30 |
|
| $11.36 |
|
| $9.34 |
|
| $8.29 |
|
| $9.72 |
| |||
Income/(Loss) from Investment Operations: | ||||||||||||||||||
Net investment income/(loss)(1) | (0.03) | (0.01) | (0.04) | 0.01 | (0.03) | |||||||||||||
Net realized and unrealized gain/(loss) | (0.20) | 0.22 | 2.10 | 1.42 | (0.98) | |||||||||||||
Total from Investment Operations |
| (0.23) |
|
| 0.21 |
|
| 2.06 |
|
| 1.43 |
|
| (1.01) |
| |||
Less Dividends and Distributions: | ||||||||||||||||||
Dividends (from net investment income) | — | — | (0.04) | — | (0.05) | |||||||||||||
Distributions (from capital gains) | (0.84) | (0.27) | — | (0.38) | (0.37) | |||||||||||||
Total Dividends and Distributions |
| (0.84) |
|
| (0.27) |
|
| (0.04) |
|
| (0.38) |
|
| (0.42) |
| |||
Net Asset Value, End of Period | $10.23 | $11.30 | $11.36 | $9.34 | $8.29 | |||||||||||||
Total Return* |
| (1.28)% |
|
| 1.80% |
|
| 22.17% |
|
| 17.87% |
|
| (10.81)% |
| |||
Net Assets, End of Period (in thousands) | $535 | $1,244 | $957 | $413 | $360 | |||||||||||||
Average Net Assets for the Period (in thousands) | $746 | $1,233 | $519 | $381 | $373 | |||||||||||||
Ratios to Average Net Assets**: |
|
|
|
|
|
|
|
|
|
|
|
|
|
|
| |||
Ratio of Gross Expenses | 3.35% | 2.78% | 3.09% | 4.23% | 3.59% | |||||||||||||
Ratio of Net Expenses (After Waivers and Expense Offsets) | 2.07% | 2.25% | 2.33% | 2.25% | 2.30% | |||||||||||||
Ratio of Net Investment Income/(Loss) | (0.28)% | (0.04)% | (0.42)% | 0.10% | (0.31)% | |||||||||||||
Portfolio Turnover Rate | 34% | 41% | 120% | 59% | 152% | |||||||||||||
* Total return includes adjustments in accordance with generally accepted accounting principles required at the year or period end and are not annualized for periods of less than one full year. ** Annualized for periods of less than one full year. (1) Per share amounts are calculated based on average shares outstanding during the year or period. |
See Notes to Financial Statements. | |
Janus Investment Fund | 15 |
Janus Henderson Asia Equity Fund
Financial Highlights
Class D Shares | ||||||||||||||||||
For a share outstanding during the year ended September 30 |
| 2019 |
|
| 2018 |
|
| 2017 |
|
| 2016 |
|
| 2015 |
| |||
Net Asset Value, Beginning of Period |
| $11.54 |
|
| $11.56 |
|
| $9.49 |
|
| $8.35 |
|
| $9.84 |
| |||
Income/(Loss) from Investment Operations: | ||||||||||||||||||
Net investment income/(loss)(1) | 0.09 | 0.07 | 0.07 | 0.08 | 0.07 | |||||||||||||
Net realized and unrealized gain/(loss) | (0.23) | 0.23 | 2.11 | 1.45 | (1.00) | |||||||||||||
Total from Investment Operations |
| (0.14) |
|
| 0.30 |
|
| 2.18 |
|
| 1.53 |
|
| (0.93) |
| |||
Less Dividends and Distributions: | ||||||||||||||||||
Dividends (from net investment income) | (0.03) | (0.05) | (0.11) | (0.01) | (0.19) | |||||||||||||
Distributions (from capital gains) | (0.84) | (0.27) | — | (0.38) | (0.37) | |||||||||||||
Total Dividends and Distributions |
| (0.87) |
|
| (0.32) |
|
| (0.11) |
|
| (0.39) |
|
| (0.56) |
| |||
Net Asset Value, End of Period | $10.53 | $11.54 | $11.56 | $9.49 | $8.35 | |||||||||||||
Total Return* |
| (0.44)% |
|
| 2.57% |
|
| 23.30% |
|
| 18.95% |
|
| (9.99)% |
| |||
Net Assets, End of Period (in thousands) | $11,198 | $13,089 | $21,577 | $5,314 | $5,640 | |||||||||||||
Average Net Assets for the Period (in thousands) | $11,599 | $21,221 | $11,542 | $5,013 | $6,632 | |||||||||||||
Ratios to Average Net Assets**: |
|
|
|
|
|
|
|
|
|
|
|
|
|
|
| |||
Ratio of Gross Expenses | 2.29% | 1.72% | 2.19% | 3.38% | 2.75% | |||||||||||||
Ratio of Net Expenses (After Waivers and Expense Offsets) | 1.33% | 1.33% | 1.44% | 1.36% | 1.42% | |||||||||||||
Ratio of Net Investment Income/(Loss) | 0.88% | 0.55% | 0.67% | 0.89% | 0.67% | |||||||||||||
Portfolio Turnover Rate | 34% | 41% | 120% | 59% | 152% | |||||||||||||
Class I Shares | ||||||||||||||||||
For a share outstanding during the year ended September 30 |
| 2019 |
|
| 2018 |
|
| 2017 |
|
| 2016 |
|
| 2015 |
| |||
Net Asset Value, Beginning of Period |
| $11.45 |
|
| $11.56 |
|
| $9.51 |
|
| $8.37 |
|
| $9.85 |
| |||
Income/(Loss) from Investment Operations: | ||||||||||||||||||
Net investment income/(loss)(1) | 0.13 | (0.03) | 0.11 | 0.10 | 0.06 | |||||||||||||
Net realized and unrealized gain/(loss) | (0.17) | 0.26 | 2.07 | 1.44 | (0.98) | |||||||||||||
Total from Investment Operations |
| (0.04) |
|
| 0.23 |
|
| 2.18 |
|
| 1.54 |
|
| (0.92) |
| |||
Less Dividends and Distributions: | ||||||||||||||||||
Dividends (from net investment income) | (0.03) | (0.07) | (0.13) | (0.02) | (0.19) | |||||||||||||
Distributions (from capital gains) | (0.84) | (0.27) | — | (0.38) | (0.37) | |||||||||||||
Total Dividends and Distributions |
| (0.87) |
|
| (0.34) |
|
| (0.13) |
|
| (0.40) |
|
| (0.56) |
| |||
Net Asset Value, End of Period | $10.54 | $11.45 | $11.56 | $9.51 | $8.37 | |||||||||||||
Total Return* |
| 0.45% |
|
| 1.90% |
|
| 23.39% |
|
| 19.09% |
|
| (9.79)% |
| |||
Net Assets, End of Period (in thousands) | $1,406 | $1,029 | $12,675 | $2,665 | $2,470 | |||||||||||||
Average Net Assets for the Period (in thousands) | $1,208 | $5,848 | $7,408 | $2,528 | $3,017 | |||||||||||||
Ratios to Average Net Assets**: |
|
|
|
|
|
|
|
|
|
|
|
|
|
|
| |||
Ratio of Gross Expenses | 2.32% | 1.44% | 2.00% | 3.19% | 2.56% | |||||||||||||
Ratio of Net Expenses (After Waivers and Expense Offsets) | 1.21% | 1.26% | 1.32% | 1.21% | 1.27% | |||||||||||||
Ratio of Net Investment Income/(Loss) | 1.28% | (0.25)% | 1.01% | 1.14% | 0.57% | |||||||||||||
Portfolio Turnover Rate | 34% | 41% | 120% | 59% | 152% | |||||||||||||
* Total return includes adjustments in accordance with generally accepted accounting principles required at the year or period end and are not annualized for periods of less than one full year. ** Annualized for periods of less than one full year. (1) Per share amounts are calculated based on average shares outstanding during the year or period. |
See Notes to Financial Statements. | |
16 | SEPTEMBER 30, 2019 |
Janus Henderson Asia Equity Fund
Financial Highlights
Class N Shares | |||||||||
For a share outstanding during the year or period ended September 30 |
| 2019 |
|
| 2018(1) |
| |||
Net Asset Value, Beginning of Period |
| $11.56 |
|
| $12.73 |
| |||
Income/(Loss) from Investment Operations: | |||||||||
Net investment income/(loss)(2) | 0.11 | 0.16 | |||||||
Net realized and unrealized gain/(loss) | (0.26) | (1.33)(3) | |||||||
Total from Investment Operations |
| (0.15) |
|
| (1.17) |
| |||
Less Dividends and Distributions: | |||||||||
Dividends (from net investment income) | (0.05) | — | |||||||
Distributions (from capital gains) | (0.84) | — | |||||||
Total Dividends and Distributions |
| (0.89) |
|
| — |
| |||
Net Asset Value, End of Period | $10.52 | $11.56 | |||||||
Total Return* |
| (0.51)% |
|
| (9.19)% |
| |||
Net Assets, End of Period (in thousands) | $8,886 | $8,501 | |||||||
Average Net Assets for the Period (in thousands) | $7,989 | $7,978 | |||||||
Ratios to Average Net Assets**: |
|
|
|
|
|
| |||
Ratio of Gross Expenses | 2.05% | 1.75% | |||||||
Ratio of Net Expenses (After Waivers and Expense Offsets) | 1.17% | 1.13% | |||||||
Ratio of Net Investment Income/(Loss) | 1.08% | 1.96% | |||||||
Portfolio Turnover Rate | 34% | 41% | |||||||
Class S Shares | ||||||||||||||||||
For a share outstanding during the year ended September 30 |
| 2019 |
|
| 2018 |
|
| 2017 |
|
| 2016 |
|
| 2015 |
| |||
Net Asset Value, Beginning of Period |
| $11.45 |
|
| $11.48 |
|
| $9.43 |
|
| $8.32 |
|
| $9.79 |
| |||
Income/(Loss) from Investment Operations: | ||||||||||||||||||
Net investment income/(loss)(2) | 0.09 | 0.06 | 0.01 | 0.07 | 0.07 | |||||||||||||
Net realized and unrealized gain/(loss) | (0.25) | 0.22 | 2.14 | 1.42 | (1.00) | |||||||||||||
Total from Investment Operations |
| (0.16) |
|
| 0.28 |
|
| 2.15 |
|
| 1.49 |
|
| (0.93) |
| |||
Less Dividends and Distributions: | ||||||||||||||||||
Dividends (from net investment income) | (0.04) | (0.04) | (0.10) | — | (0.17) | |||||||||||||
Distributions (from capital gains) | (0.84) | (0.27) | — | (0.38) | (0.37) | |||||||||||||
Total Dividends and Distributions |
| (0.88) |
|
| (0.31) |
|
| (0.10) |
|
| (0.38) |
|
| (0.54) |
| |||
Net Asset Value, End of Period | $10.41 | $11.45 | $11.48 | $9.43 | $8.32 | |||||||||||||
Total Return* |
| (0.55)% |
|
| 2.37% |
|
| 23.07% |
|
| 18.56% |
|
| (9.97)% |
| |||
Net Assets, End of Period (in thousands) | $481 | $484 | $472 | $368 | $310 | |||||||||||||
Average Net Assets for the Period (in thousands) | $467 | $501 | $413 | $329 | $390 | |||||||||||||
Ratios to Average Net Assets**: |
|
|
|
|
|
|
|
|
|
|
|
|
|
|
| |||
Ratio of Gross Expenses | 2.98% | 2.36% | 2.64% | 3.67% | 3.06% | |||||||||||||
Ratio of Net Expenses (After Waivers and Expense Offsets) | 1.34% | 1.58% | 1.66% | 1.56% | 1.48% | |||||||||||||
Ratio of Net Investment Income/(Loss) | 0.91% | 0.52% | 0.15% | 0.83% | 0.71% | |||||||||||||
Portfolio Turnover Rate | 34% | 41% | 120% | 59% | 152% | |||||||||||||
* Total return includes adjustments in accordance with generally accepted accounting principles required at the year or period end and are not annualized for periods of less than one full year. ** Annualized for periods of less than one full year. (1) Period from January 26, 2018 (inception date) through September 30, 2018. (2) Per share amounts are calculated based on average shares outstanding during the year or period. (3) The amount shown does not correlate with the change in the aggregate gains and losses in the Fund’s securities for the year or period due to the timing of sales and repurchases of the Fund’s shares in relation to fluctuating market values for the Fund’s securities. |
See Notes to Financial Statements. | |
Janus Investment Fund | 17 |
Janus Henderson Asia Equity Fund
Financial Highlights
Class T Shares | ||||||||||||||||||
For a share outstanding during the year ended September 30 |
| 2019 |
|
| 2018 |
|
| 2017 |
|
| 2016 |
|
| 2015 |
| |||
Net Asset Value, Beginning of Period |
| $11.37 |
|
| $11.42 |
|
| $9.36 |
|
| $8.25 |
|
| $9.81 |
| |||
Income/(Loss) from Investment Operations: | ||||||||||||||||||
Net investment income/(loss)(1) | 0.10 | 0.06 | 0.06 | 0.04 | 0.04 | |||||||||||||
Net realized and unrealized gain/(loss) | (0.21) | 0.20 | 2.08 | 1.46 | (0.96) | |||||||||||||
Total from Investment Operations |
| (0.11) |
|
| 0.26 |
|
| 2.14 |
|
| 1.50 |
|
| (0.92) |
| |||
Less Dividends and Distributions: | ||||||||||||||||||
Dividends (from net investment income) | (0.01) | (0.04) | (0.08) | (0.01) | (0.27) | |||||||||||||
Distributions (from capital gains) | (0.84) | (0.27) | — | (0.38) | (0.37) | |||||||||||||
Total Dividends and Distributions |
| (0.85) |
|
| (0.31) |
|
| (0.08) |
|
| (0.39) |
|
| (0.64) |
| |||
Net Asset Value, End of Period | $10.41 | $11.37 | $11.42 | $9.36 | $8.25 | |||||||||||||
Total Return* |
| (0.14)% |
|
| 2.27% |
|
| 23.18% |
|
| 18.88% |
|
| (9.98)% |
| |||
Net Assets, End of Period (in thousands) | $1,310 | $1,032 | $2,937 | $230 | $306 | |||||||||||||
Average Net Assets for the Period (in thousands) | $1,210 | $2,799 | $756 | $332 | $566 | |||||||||||||
Ratios to Average Net Assets**: |
|
|
|
|
|
|
|
|
|
|
|
|
|
|
| |||
Ratio of Gross Expenses | 2.53% | 1.81% | 2.14% | 3.41% | 2.73% | |||||||||||||
Ratio of Net Expenses (After Waivers and Expense Offsets) | 1.40% | 1.41% | 1.55% | 1.44% | 1.39% | |||||||||||||
Ratio of Net Investment Income/(Loss) | 0.98% | 0.54% | 0.55% | 0.47% | 0.46% | |||||||||||||
Portfolio Turnover Rate | 34% | 41% | 120% | 59% | 152% | |||||||||||||
* Total return includes adjustments in accordance with generally accepted accounting principles required at the year or period end and are not annualized for periods of less than one full year. ** Annualized for periods of less than one full year. (1) Per share amounts are calculated based on average shares outstanding during the year or period. |
See Notes to Financial Statements. | |
18 | SEPTEMBER 30, 2019 |
Janus Henderson Asia Equity Fund
Notes to Financial Statements
1. Organization and Significant Accounting Policies
Janus Henderson Asia Equity Fund (the “Fund”) is a series of Janus Investment Fund (the “Trust”), which is organized as a Massachusetts business trust and is registered under the Investment Company Act of 1940, as amended (the “1940 Act”), as an open-end management investment company, and therefore has applied the specialized accounting and reporting guidance in Financial Accounting Standards Board (“FASB”) Accounting Standards Codification (“ASC”) Topic 946. The Trust offers 47 funds, each of which offers multiple share classes, with differing investment objectives and policies. The Fund seeks long-term growth of capital. The Fund is classified as diversified, as defined in the 1940 Act.
The Fund offers multiple classes of shares in order to meet the needs of various types of investors. Each class represents an interest in the same portfolio of investments. Certain financial intermediaries may not offer all classes of shares. Class D Shares are closed to certain new investors.
Class A Shares are offered through financial intermediary platforms including, but not limited to, traditional brokerage platforms, mutual fund wrap fee programs, bank trust platforms, and retirement platforms.
Class C Shares are offered through financial intermediary platforms including, but not limited to, traditional brokerage platforms, mutual fund wrap fee programs, and bank trust platforms.
Class C Shares are closed to investments by new employer-sponsored retirement plans and existing employer-sponsored retirement plans are no longer able to make additional purchases or exchanges into Class C Shares.
The Funds have adopted an auto-conversion policy pursuant to which Class C Shares that have been held for ten years will be automatically converted to Class A Shares without the imposition of any sales charge, fee or other charge. The conversion will generally occur no later than ten business days in the month following the month of the tenth anniversary of the date of purchase. Class C Shares purchased through the reinvestment of dividends and other distributions on Class C Shares will convert to Class A Shares at the same time as the Class C Shares with respect to which they were purchased. For Class C Shares held in omnibus accounts on intermediary platforms, the Fund will rely on these intermediaries to implement this conversion feature. Your financial intermediary may have separate policies and procedures as to when and how Class C Shares may be converted to Class A Shares. Please contact your financial intermediary for additional information.
Class D Shares are generally no longer being made available to new investors who do not already have a direct account with the Janus Henderson funds. Class D Shares are available only to investors who hold accounts directly with the Janus Henderson funds, to immediate family members or members of the same household of an eligible individual investor, and to existing beneficial owners of sole proprietorships or partnerships that hold accounts directly with the Janus Henderson funds.
Class I Shares are available through certain financial intermediary platforms including, but not limited to, mutual fund wrap fee programs, managed account programs, asset allocation programs, bank trust platforms, as well as certain retirement platforms. Class I Shares are also available to certain direct institutional investors including, but not limited to, corporations, certain retirement plans, public plans, and foundations/endowments, who established Class I Share accounts before August 4, 2017.
Class N Shares are generally available only to financial intermediaries purchasing on behalf of: 1) certain adviser-assisted, employer-sponsored retirement plans, including 401(k) plans, 457 plans, 403(b) plans, Taft-Hartley multi-employer plans, profit-sharing and money purchase pension plans, defined benefit plans and certain welfare benefit plans, such as health savings accounts, and nonqualified deferred compensation plans; and 2) retail investors purchasing in qualified or nonqualified accounts, whose accounts are held through an omnibus account at their financial intermediary, and where the financial intermediary requires no payment or reimbursement from the Fund, Janus Capital Management LLC (“Janus Capital”), or its affiliates. Class N Shares are also available to Janus Henderson proprietary products and to certain direct institutional investors approved by Janus Distributors LLC dba Janus Henderson Distributors (“Janus Henderson Distributors”) including, but not limited to, corporations, certain retirement plans, public plans, and foundations and endowments, subject to minimum investment requirements.
Class S Shares are offered through financial intermediary platforms including, but not limited to, retirement platforms and asset allocation, mutual fund wrap, or other discretionary or nondiscretionary fee-based investment advisory
Janus Investment Fund | 19 |
Janus Henderson Asia Equity Fund
Notes to Financial Statements
programs. In addition, Class S Shares may be available through certain financial intermediaries who have an agreement with Janus Capital or its affiliates to offer Class S Shares on their supermarket platforms.
Class T Shares are available through certain financial intermediary platforms including, but not limited to, mutual fund wrap fee programs, managed account programs, asset allocation programs, bank trust platforms, as well as certain retirement platforms. In addition, Class T Shares may be available through certain financial intermediaries who have an agreement with Janus Capital or its affiliates to offer Class T Shares on their supermarket platforms.
The following accounting policies have been followed by the Fund and are in conformity with accounting principles generally accepted in the United States of America.
Investment Valuation
Securities held by the Fund are valued in accordance with policies and procedures established by and under the supervision of the Trustees (the “Valuation Procedures”). Equity securities traded on a domestic securities exchange are generally valued at the closing prices on the primary market or exchange on which they trade. If such price is lacking for the trading period immediately preceding the time of determination, such securities are valued at their current bid price. Equity securities that are traded on a foreign exchange are generally valued at the closing prices on such markets. In the event that there is no current trading volume on a particular security in such foreign exchange, the bid price from the primary exchange is generally used to value the security. Securities that are traded on the over-the-counter (“OTC”) markets are generally valued at their closing or latest bid prices as available. Foreign securities and currencies are converted to U.S. dollars using the applicable exchange rate in effect at the close of the New York Stock Exchange (“NYSE”). The Fund will determine the market value of individual securities held by it by using prices provided by one or more approved professional pricing services or, as needed, by obtaining market quotations from independent broker-dealers. Most debt securities are valued in accordance with the evaluated bid price supplied by the pricing service that is intended to reflect market value. The evaluated bid price supplied by the pricing service is an evaluation that may consider factors such as security prices, yields, maturities and ratings. Certain short-term securities maturing within 60 days or less may be evaluated and valued on an amortized cost basis provided that the amortized cost determined approximates market value. Securities for which market quotations or evaluated prices are not readily available or deemed unreliable are valued at fair value determined in good faith under the Valuation Procedures. Circumstances in which fair value pricing may be utilized include, but are not limited to: (i) a significant event that may affect the securities of a single issuer, such as a merger, bankruptcy, or significant issuer-specific development; (ii) an event that may affect an entire market, such as a natural disaster or significant governmental action; (iii) a nonsignificant event such as a market closing early or not opening, or a security trading halt; and (iv) pricing of a nonvalued security and a restricted or nonpublic security. Special valuation considerations may apply with respect to “odd-lot” fixed-income transactions which, due to their small size, may receive evaluated prices by pricing services which reflect a large block trade and not what actually could be obtained for the odd-lot position. The Fund uses systematic fair valuation models provided by independent third parties to value international equity securities in order to adjust for stale pricing, which may occur between the close of certain foreign exchanges and the close of the NYSE.
Valuation Inputs Summary
FASB ASC 820, Fair Value Measurements and Disclosures (“ASC 820”), defines fair value, establishes a framework for measuring fair value, and expands disclosure requirements regarding fair value measurements. This standard emphasizes that fair value is a market-based measurement that should be determined based on the assumptions that market participants would use in pricing an asset or liability and establishes a hierarchy that prioritizes inputs to valuation techniques used to measure fair value. These inputs are summarized into three broad levels:
Level 1 – Unadjusted quoted prices in active markets the Fund has the ability to access for identical assets or liabilities.
Level 2 – Observable inputs other than unadjusted quoted prices included in Level 1 that are observable for the asset or liability either directly or indirectly. These inputs may include quoted prices for the identical instrument on an inactive market, prices for similar instruments, interest rates, prepayment speeds, credit risk, yield curves, default rates and similar data.
Assets or liabilities categorized as Level 2 in the hierarchy generally include: debt securities fair valued in accordance with the evaluated bid or ask prices supplied by a pricing service; securities traded on OTC markets and listed securities for which no sales are reported that are fair valued at the latest bid price (or yield equivalent thereof) obtained from one or more dealers transacting in a market for such securities or by a pricing service
20 | SEPTEMBER 30, 2019 |
Janus Henderson Asia Equity Fund
Notes to Financial Statements
approved by the Fund’s Trustees; certain short-term debt securities with maturities of 60 days or less that are fair valued at amortized cost; and equity securities of foreign issuers whose fair value is determined by using systematic fair valuation models provided by independent third parties in order to adjust for stale pricing which may occur between the close of certain foreign exchanges and the close of the NYSE. Other securities that may be categorized as Level 2 in the hierarchy include, but are not limited to, preferred stocks, bank loans, swaps, investments in unregistered investment companies, options, and forward contracts.
Level 3 – Unobservable inputs for the asset or liability to the extent that relevant observable inputs are not available, representing the Fund’s own assumptions about the assumptions that a market participant would use in valuing the asset or liability, and that would be based on the best information available.
There have been no significant changes in valuation techniques used in valuing any such positions held by the Fund since the beginning of the fiscal year.
The inputs or methodology used for fair valuing securities are not necessarily an indication of the risk associated with investing in those securities. The summary of inputs used as of September 30, 2019 to fair value the Fund’s investments in securities and other financial instruments is included in the “Valuation Inputs Summary” in the Notes to Schedule of Investments and Other Information.
Investment Transactions and Investment Income
Investment transactions are accounted for as of the date purchased or sold (trade date). Dividend income is recorded on the ex-dividend date. Certain dividends from foreign securities will be recorded as soon as the Fund is informed of the dividend, if such information is obtained subsequent to the ex-dividend date. Dividends from foreign securities may be subject to withholding taxes in foreign jurisdictions. Interest income is recorded daily on an accrual basis and includes amortization of premiums and accretion of discounts. The Fund classifies gains and losses on prepayments received as an adjustment to interest income. Debt securities may be placed in non-accrual status and related interest income may be reduced by stopping current accruals and writing off interest receivables when collection of all or a portion of interest has become doubtful. Gains and losses are determined on the identified cost basis, which is the same basis used for federal income tax purposes. Income, as well as gains and losses, both realized and unrealized, are allocated daily to each class of shares based upon the ratio of net assets represented by each class as a percentage of total net assets.
Expenses
The Fund bears expenses incurred specifically on its behalf. Each class of shares bears a portion of general expenses, which are allocated daily to each class of shares based upon the ratio of net assets represented by each class as a percentage of total net assets. Expenses directly attributable to a specific class of shares are charged against the operations of such class.
Estimates
The preparation of financial statements in conformity with accounting principles generally accepted in the United States of America requires management to make estimates and assumptions that affect the reported amount of assets and liabilities and disclosure of contingent assets and liabilities at the date of the financial statements, and the reported amounts of income and expenses during the reporting period. Actual results could differ from those estimates.
Indemnifications
In the normal course of business, the Fund may enter into contracts that contain provisions for indemnification of other parties against certain potential liabilities. The Fund’s maximum exposure under these arrangements is unknown, and would involve future claims that may be made against the Fund that have not yet occurred. Currently, the risk of material loss from such claims is considered remote.
Foreign Currency Translations
The Fund does not isolate that portion of the results of operations resulting from the effect of changes in foreign exchange rates on investments from the fluctuations arising from changes in market prices of securities held at the date of the financial statements. Net unrealized appreciation or depreciation of investments and foreign currency translations arise from changes in the value of assets and liabilities, including investments in securities held at the date of the financial statements, resulting from changes in the exchange rates and changes in market prices of securities held.
Janus Investment Fund | 21 |
Janus Henderson Asia Equity Fund
Notes to Financial Statements
Currency gains and losses are also calculated on payables and receivables that are denominated in foreign currencies. The payables and receivables are generally related to foreign security transactions and income translations.
Foreign currency-denominated assets and forward currency contracts may involve more risks than domestic transactions, including currency risk, counterparty risk, political and economic risk, regulatory risk and equity risk. Risks may arise from unanticipated movements in the value of foreign currencies relative to the U.S. dollar.
Dividends and Distributions
The Fund generally declares and distributes dividends of net investment income and realized capital gains (if any) annually. The Fund may treat a portion of the amount paid to redeem shares as a distribution of investment company taxable income and realized capital gains that are reflected in the net asset value. This practice, commonly referred to as “equalization,” has no effect on the redeeming shareholder or a Fund’s total return, but may reduce the amounts that would otherwise be required to be paid as taxable dividends to the remaining shareholders. It is possible that the Internal Revenue Service (IRS) could challenge the Funds’ equalization methodology or calculations, and any such challenge could result in additional tax, interest, or penalties to be paid by the Fund.
The Fund may make certain investments in real estate investment trusts (“REITs”) which pay dividends to their shareholders based upon funds available from operations. It is quite common for these dividends to exceed the REITs’ taxable earnings and profits, resulting in the excess portion of such dividends being designated as a return of capital. If the Fund distributes such amounts, such distributions could constitute a return of capital to shareholders for federal income tax purposes.
Federal Income Taxes
The Fund intends to continue to qualify as a regulated investment company and distribute all of its taxable income in accordance with the requirements of Subchapter M of the Internal Revenue Code. Management has analyzed the Fund’s tax positions taken for all open federal income tax years, generally a three-year period, and has concluded that no provision for federal income tax is required in the Fund’s financial statements. The Fund is not aware of any tax positions for which it is reasonably possible that the total amounts of unrecognized tax benefits will significantly change in the next twelve months.
2. Other Investments and Strategies
Additional Investment Risk
In the aftermath of the 2007-2008 financial crisis, the financial sector experienced reduced liquidity in credit and other fixed-income markets, and an unusually high degree of volatility, both domestically and internationally. In response to the crisis, the United States and certain foreign governments, along with the U.S. Federal Reserve and certain foreign central banks, took steps to support the financial markets. For example, the enactment of the Dodd-Frank Act in 2010 provided for widespread regulation of financial institutions, consumer financial products and services, broker-dealers, over-the-counter derivatives, investment advisers, credit rating agencies, and mortgage lending, which expanded federal oversight in the financial sector, including the investment management industry. The withdrawal of this support, a failure of measures put in place to respond to the crisis, or investor perception that such efforts were not sufficient could each negatively affect financial markets generally, and the value and liquidity of specific securities. In addition, policy and legislative changes in the United States and in other countries continue to impact many aspects of financial regulation.
A number of countries in the European Union (“EU”) have experienced, and may continue to experience, severe economic and financial difficulties. In particular, many EU nations are susceptible to economic risks associated with high levels of debt. Many non-governmental issuers, and even certain governments, have defaulted on, or been forced to restructure, their debts. Many other issuers have faced difficulties obtaining credit or refinancing existing obligations. Financial institutions have in many cases required government or central bank support, have needed to raise capital, and/or have been impaired in their ability to extend credit. As a result, financial markets in the EU experienced extreme volatility and declines in asset values and liquidity. Responses to these financial problems by European governments, central banks, and others, including austerity measures and reforms, may not work, may result in social unrest, and may limit future growth and economic recovery or have other unintended consequences. The risk of investing in securities in the European markets may also be heightened due to the referendum in which the United Kingdom voted to exit the EU (commonly known as “Brexit”). There is considerable uncertainty about how Brexit will be conducted, how negotiations of necessary treaties and trade agreements will conclude, or how financial markets will react.
22 | SEPTEMBER 30, 2019 |
Janus Henderson Asia Equity Fund
Notes to Financial Statements
Certain areas of the world have historically been prone to and economically sensitive to environmental events such as, but not limited to, hurricanes, earthquakes, typhoons, flooding, tidal waves, tsunamis, erupting volcanoes, wildfires or droughts, tornadoes, mudslides, or other weather-related phenomena. Such disasters, and the resulting physical or economic damage, could have a severe and negative impact on the Fund’s investment portfolio and, in the longer term, could impair the ability of issuers in which the Fund invests to conduct their businesses as they would under normal conditions. Adverse weather conditions may also have a particularly significant negative effect on issuers in the agricultural sector and on insurance companies that insure against the impact of natural disasters.
Emerging Market Investing
Within the parameters of its specific investment policies, the Fund may invest in securities of issuers or companies from or with exposure to one or more “developing countries” or “emerging market countries.” To the extent that the Fund invests a significant amount of its assets in one or more of these countries, its returns and net asset value may be affected to a large degree by events and economic conditions in such countries. The risks of foreign investing are heightened when investing in emerging markets, which may result in the price of investments in emerging markets experiencing sudden and sharp price swings. In many developing markets, there is less government supervision and regulation of business and industry practices (including the potential lack of strict finance and accounting controls and standards), stock exchanges, brokers, and listed companies, making these investments potentially more volatile in price and less liquid than investments in developed securities markets, resulting in greater risk to investors. There is a risk in developing countries that a future economic or political crisis could lead to price controls, forced mergers of companies, expropriation or confiscatory taxation, imposition or enforcement of foreign ownership limits, seizure, nationalization, sanctions or imposition of restrictions by various governmental entities on investment and trading, or creation of government monopolies, any of which may have a detrimental effect on the Fund’s investments. In addition, the Fund’s investments may be denominated in foreign currencies and therefore, changes in the value of a country’s currency compared to the U.S. dollar may affect the value of the Fund’s investments. To the extent that the Fund invests a significant portion of its assets in the securities of issuers in or companies of a single country or region, it is more likely to be impacted by events or conditions affecting that country or region, which could have a negative impact on the Fund’s performance. Additionally, foreign and emerging market risks, including, but not limited to, price controls, expropriation or confiscatory taxation, imposition or enforcement of foreign ownership limits, nationalization, and restrictions on repatriation of assets may be heightened to the extent the Fund invests in Chinese local market securities.
Real Estate Investing
The Fund may invest in equity and debt securities of real estate-related companies. Such companies may include those in the real estate industry or real estate-related industries. These securities may include common stocks, corporate bonds, preferred stocks, and other equity securities, including, but not limited to, mortgage-backed securities, real estate-backed securities, securities of REITs and similar REIT-like entities. A REIT is a trust that invests in real estate-related projects, such as properties, mortgage loans, and construction loans. REITs are generally categorized as equity, mortgage, or hybrid REITs. A REIT may be listed on an exchange or traded OTC.
3. Investment Advisory Agreements and Other Transactions with Affiliates
The Fund pays Janus Capital an investment advisory fee which is calculated daily and paid monthly. The Fund’s "base" fee rate prior to any performance adjustment (expressed as an annual rate) is 0.92%.
The investment advisory fee rate is determined by calculating a base fee and applying a performance adjustment. The base fee rate is the same as the contractual investment advisory fee rate. The performance adjustment either increases or decreases the base fee depending on how well the Fund has performed relative to its benchmark index. The Fund's benchmark index used in the calculation is the MSCI All Country Asia ex-Japan Index.
The calculation of the performance adjustment applies as follows:
Investment Advisory Fee = Base Fee Rate +/- Performance Adjustment
The investment advisory fee rate paid to Janus Capital by the Fund consists of two components: (1) a base fee calculated by applying the contractual fixed rate of the advisory fee to the Fund’s average daily net assets during the previous month (“Base Fee Rate”), plus or minus (2) a performance-fee adjustment (“Performance Adjustment”) calculated by applying a variable rate of up to 0.15% (positive or negative) to the Fund’s average daily net assets based on the Fund’s relative performance compared to the cumulative investment record of its benchmark index over a 36-
Janus Investment Fund | 23 |
Janus Henderson Asia Equity Fund
Notes to Financial Statements
month performance measurement period or shorter time period, as applicable. The investment performance of the Fund’s Class A Shares (waiving the upfront sales load) for the performance measurement period is used to calculate the Performance Adjustment. No Performance Adjustment is applied unless the difference between the Fund’s investment performance and the cumulative investment record of the Fund’s benchmark index is 0.50% or greater (positive or negative) during the applicable performance measurement period.
The Fund’s prospectuses and statement(s) of additional information contain additional information about performance-based fees. The amount shown as advisory fees on the Statement of Operations reflects the Base Fee Rate plus/minus any Performance Adjustment. For the year ended September 30, 2019, the performance adjusted investment advisory fee rate before any waivers and/or reimbursements of expenses is 0.97%.
Janus Capital has entered into a personnel-sharing arrangement with its foreign (non-U.S.) affiliates, Henderson Global Investors Limited, Henderson Global Investors (Japan) Ltd., and Henderson Global Investors (Singapore) Ltd. (collectively, “HGIL”), pursuant to which HGIL and certain employees of HGIL serve as ���associated persons” of Janus Capital. In this capacity, such employees of HGIL are subject to the oversight and supervision of Janus Capital and may provide portfolio management, research, and related services to the Fund on behalf of Janus Capital.
Janus Capital has contractually agreed to waive the advisory fee payable by the Fund or reimburse expenses in an amount equal to the amount, if any, that the Fund’s total annual fund operating expenses, including the investment advisory fee, but excluding any performance adjustments to management fees (if applicable), the fees payable pursuant to a Rule 12b-1 plan, shareholder servicing fees, such as transfer agency fees (including out-of-pocket costs), administrative services fees and any networking/omnibus/administrative fees payable by any share class, brokerage commissions, interest, dividends, taxes, acquired fund fees and expenses, and extraordinary expenses, exceed the annual rate of 1.11% of the Fund’s average daily net assets. Janus Capital has agreed to continue the waiver until at least February 1, 2020. If applicable, amounts waived and/or reimbursed to the Fund by Janus Capital are disclosed as “Excess Expense Reimbursement and Waivers” on the Statement of Operations.
Janus Services LLC (“Janus Services”), a wholly-owned subsidiary of Janus Capital, is the Fund’s transfer agent. In addition, Janus Services provides or arranges for the provision of certain other administrative services including, but not limited to, recordkeeping, accounting, order processing, and other shareholder services for the Fund. Janus Services is not compensated for its services related to the shares, except for out-of-pocket costs. These amounts are disclosed as “Other transfer agent fees and expenses” on the Statement of Operations.
Certain, but not all, intermediaries may charge administrative fees (such as networking and omnibus) to investors in Class A Shares, Class C Shares, and Class I Shares for administrative services provided on behalf of such investors. These administrative fees are paid by the Class A Shares, Class C Shares, and Class I Shares of the Fund to Janus Services, which uses such fees to reimburse intermediaries. Consistent with the Transfer Agency Agreement between Janus Services and the Fund, Janus Services may negotiate the level, structure, and/or terms of the administrative fees with intermediaries requiring such fees on behalf of the Fund. Janus Capital and its affiliates benefit from an increase in assets that may result from such relationships. The Funds’ Trustees have set limits on fees that the Funds may incur with respect to administrative fees paid for omnibus or networked accounts. Such limits are subject to change by the Trustees in the future. These amounts are disclosed as “Transfer agent networking and omnibus fees” on the Statement of Operations.
Effective July 1, 2019, the Board of Trustees of Janus Investment Fund approved a new administrative fee rate for Class D Shares detailed in the table below.
Average Daily Net Assets of Class D Shares of the Janus Henderson funds | Administrative Services Fee |
Under $40 billion | 0.12% |
$40 billion – $49.9 billion | 0.10% |
Over $49.9 billion | 0.08% |
The Fund’s actual Class D administrative fee rate was 0.12% for the reporting period.
Prior to July 1, 2019, the Fund’s Class D Shares paid an administrative services fee at an annual rate of 0.12% of the average daily net assets of Class D Shares for shareholder services provided by Janus Services. Janus Services provides or arranges for the provision of shareholder services including, but not limited to, recordkeeping, accounting, answering inquiries regarding accounts, transaction processing, transaction confirmations, and the mailing of
24 | SEPTEMBER 30, 2019 |
Janus Henderson Asia Equity Fund
Notes to Financial Statements
prospectuses and shareholder reports. These amounts are disclosed as “Transfer agent administrative fees and expenses” on the Statement of Operations.
Janus Services receives an administrative services fee at an annual rate of up to 0.25% of the average daily net assets of the Fund’s Class S Shares and Class T Shares for providing or procuring administrative services to investors in Class S Shares and Class T Shares of the Fund. Janus Services expects to use all or a significant portion of this fee to compensate retirement plan service providers, broker-dealers, bank trust departments, financial advisors, and other financial intermediaries for providing these services. Janus Services or its affiliates may also pay fees for services provided by intermediaries to the extent the fees charged by intermediaries exceed the 0.25% of net assets charged to Class S Shares and Class T Shares of the Fund. Janus Services may keep certain amounts retained for reimbursement of out-of-pocket costs incurred for servicing clients of Class S Shares and Class T Shares. These amounts are disclosed as “Transfer agent administrative fees and expenses” on the Statement of Operations.
Services provided by these financial intermediaries may include, but are not limited to, recordkeeping, subaccounting, order processing, providing order confirmations, periodic statements, forwarding prospectuses, shareholder reports, and other materials to existing customers, answering inquiries regarding accounts, and other administrative services. Order processing includes the submission of transactions through the National Securities Clearing Corporation (“NSCC”) or similar systems, or those processed on a manual basis with Janus Capital. For all share classes, Janus Services also seeks reimbursement for costs it incurs as transfer agent and for providing servicing.
Janus Services is compensated for its services related to the Fund’s Class D Shares. These amounts are disclosed as “Other transfer agent fees and expenses” on the Statement of Operations.
Under a distribution and shareholder servicing plan (the “Plan”) adopted in accordance with Rule 12b-1 under the 1940 Act, the Fund pays the Trust’s distributor, Janus Henderson Distributors, a wholly-owned subsidiary of Janus Capital, a fee for the sale and distribution and/or shareholder servicing of the Shares at an annual rate of up to 0.25% of the Class A Shares’ average daily net assets, of up to 1.00% of the Class C Shares’ average daily net assets, and of up to 0.25% of the Class S Shares’ average daily net assets. Under the terms of the Plan, the Trust is authorized to make payments to Janus Henderson Distributors for remittance to retirement plan service providers, broker-dealers, bank trust departments, financial advisors, and other financial intermediaries, as compensation for distribution and/or shareholder services performed by such entities for their customers who are investors in the Fund. These amounts are disclosed as “12b-1 Distribution and shareholder servicing fees” on the Statement of Operations. Payments under the Plan are not tied exclusively to actual 12b-1 distribution and shareholder service expenses, and the payments may exceed 12b-1 distribution and shareholder service expenses actually incurred. If any of the Fund’s actual 12b-1 distribution and shareholder service expenses incurred during a calendar year are less than the payments made during a calendar year, the Fund will be refunded the difference. Refunds, if any, are included in “12b-1 Distribution and shareholder servicing fees” in the Statement of Operations.
Janus Capital serves as administrator to the Fund pursuant to an administration agreement between Janus Capital and the Trust. Under the administration agreement, Janus Capital is obligated to provide or arrange for the provision of certain administration, compliance, and accounting services to the Fund, including providing office space for the Fund, and is reimbursed by the Fund for certain of its costs in providing these services (to the extent Janus Capital seeks reimbursement and such costs are not otherwise waived). In addition, employees of Janus Capital and/or its affiliates may serve as officers of the Trust. The Fund pays for some or all of the salaries, fees, and expenses of Janus Capital employees and Fund officers, with respect to certain specified administration functions they perform on behalf of the Fund. The Fund pays these costs based on out-of-pocket expenses incurred by Janus Capital, and these costs are separate and apart from advisory fees and other expenses paid in connection with the investment advisory services Janus Capital (or any subadvisor, as applicable) provides to the Fund. These amounts are disclosed as “Affiliated fund administration fees” on the Statement of Operations. In addition, some expenses related to compensation payable to the Fund’s Chief Compliance Officer and certain compliance staff, all of whom are employees of Janus Capital and/or its affiliates, are shared with the Fund. Total compensation of $484,142 was paid to the Chief Compliance Officer and certain compliance staff by the Trust during the year ended September 30, 2019. The Fund's portion is reported as part of “Other expenses” on the Statement of Operations.
The Board of Trustees has adopted a deferred compensation plan (the “Deferred Plan”) for independent Trustees to elect to defer receipt of all or a portion of the annual compensation they are entitled to receive from the Fund. All deferred fees are credited to an account established in the name of the Trustees. The amounts credited to the account
Janus Investment Fund | 25 |
Janus Henderson Asia Equity Fund
Notes to Financial Statements
then increase or decrease, as the case may be, in accordance with the performance of one or more of the Janus Henderson funds that are selected by the Trustees. The account balance continues to fluctuate in accordance with the performance of the selected fund or funds until final payment of all amounts are credited to the account. The fluctuation of the account balance is recorded by the Fund as unrealized appreciation/(depreciation) and is included as of September 30, 2019 on the Statement of Assets and Liabilities in the asset, “Non-interested Trustees’ deferred compensation,” and liability, “Non-interested Trustees’ deferred compensation fees.” Additionally, the recorded unrealized appreciation/(depreciation) is included in “Unrealized net appreciation/(depreciation) of investments, foreign currency translations and non-interested Trustees’ deferred compensation” on the Statement of Assets and Liabilities. Deferred compensation expenses for the year ended September 30, 2019 are included in “Non-interested Trustees’ fees and expenses” on the Statement of Operations. Trustees are allowed to change their designation of mutual funds from time to time. Amounts will be deferred until distributed in accordance with the Deferred Plan. Deferred fees of $475,338 were paid by the Trust to the Trustees under the Deferred Plan during the year ended September 30, 2019.
Class A Shares include a 5.75% upfront sales charge of the offering price of the Fund. The sales charge is allocated between Janus Henderson Distributors and financial intermediaries. During the year ended September 30, 2019, Janus Henderson Distributors retained upfront sales charges of $1,503.
A contingent deferred sales charge (“CDSC”) of 1.00% will be deducted with respect to Class A Shares purchased without a sales load and redeemed within 12 months of purchase, unless waived. Any applicable CDSC will be 1.00% of the lesser of the original purchase price or the value of the redemption of the Class A Shares redeemed. There were no CDSCs paid by redeeming shareholders of Class A Shares to Janus Henderson Distributors during the year ended September 30, 2019.
A CDSC of 1.00% will be deducted with respect to Class C Shares redeemed within 12 months of purchase, unless waived. Any applicable CDSC will be 1.00% of the lesser of the original purchase price or the value of the redemption of the Class C Shares redeemed. During the year ended September 30, 2019, redeeming shareholders of Class C Shares paid CDSCs of $197.
As of September 30, 2019, shares of the Fund were owned by affiliates of Janus Henderson Investors, and/or other funds advised by Janus Henderson, as indicated in the table below:
Class | % of Class Owned |
| % of Fund Owned |
| |
Class A Shares | - | % | - | % | |
Class C Shares | - | - | |||
Class D Shares | - | - | |||
Class I Shares | - | - | |||
Class N Shares | 96 | 35 | |||
Class S Shares | 96 | 2 | |||
Class T Shares | - | - | |||
In addition, other shareholders, including other funds, individuals, accounts, as well as the Fund’s portfolio manager(s) and/or investment personnel, may from time to time own (beneficially or of record) a significant percentage of the Fund’s Shares and can be considered to “control” the Fund when that ownership exceeds 25% of the Fund’s assets (and which may differ from control as determined in accordance with accounting principles generally accepted in the United States of America).
26 | SEPTEMBER 30, 2019 |
Janus Henderson Asia Equity Fund
Notes to Financial Statements
4. Federal Income Tax
The tax components of capital shown in the table below represent: (1) distribution requirements the Fund must satisfy under the income tax regulations; (2) losses or deductions the Fund may be able to offset against income and gains realized in future years; and (3) unrealized appreciation or depreciation of investments for federal income tax purposes (reduced by foreign tax liability).
Other book to tax differences primarily consist of deferred compensation. The Fund has elected to treat gains and losses on forward foreign currency contracts as capital gains and losses, if applicable. Other foreign currency gains and losses on debt instruments are treated as ordinary income for federal income tax purposes pursuant to Section 988 of the Internal Revenue Code.
Loss Deferrals | Other Book | Net Tax | |||||
Undistributed | Undistributed | Accumulated | Late-Year | Post-October | to Tax | Appreciation/ | |
$ 204,972 | $ - | $ (1,036,305) | $ - | $ - | $ (1,379) | $ 2,610,056 | |
Accumulated capital losses noted below represent net capital loss carryovers, as of September 30, 2019, that may be available to offset future realized capital gains and thereby reduce future taxable gains distributions. The following table shows these capital loss carryovers.
Capital Loss Carryover Schedule | |||||
For the year ended September 30, 2019 | |||||
No Expiration | |||||
| Short-Term | Long-Term | Accumulated | ||
| $ (774,404) | $ (261,901) | $ (1,036,305) | ||
The aggregate cost of investments and the composition of unrealized appreciation and depreciation of investment securities for federal income tax purposes as of September 30, 2019 are noted below. The primary differences between book and tax appreciation or depreciation of investments are wash sale loss deferrals.
Federal Tax Cost | Unrealized | Unrealized | Net Tax Appreciation/ |
$ 22,012,336 | $ 3,494,193 | $ (743,063) | $ 2,751,130 |
Janus Investment Fund | 27 |
Janus Henderson Asia Equity Fund
Notes to Financial Statements
Income and capital gains distributions are determined in accordance with income tax regulations that may differ from accounting principles generally accepted in the United States of America. These differences are due to differing treatments for items such as net short-term gains, deferral of wash sale losses, foreign currency transactions, and capital loss carryovers. Certain permanent differences such as tax returns of capital and net investment losses noted below have been reclassified to capital.
For the year ended September 30, 2019 | ||||
Distributions | ||||
From Ordinary Income | From Long-Term Capital Gains | Tax Return of Capital | Net Investment Loss | |
$ 475,669 | $ 1,424,254 | $ - | $ - | |
For the year ended September 30, 2018 | ||||
Distributions | ||||
From Ordinary Income | From Long-Term Capital Gains | Tax Return of Capital | Net Investment Loss | |
$ 614,580 | $ 523,724 | $ - | $ - | |
Permanent book to tax basis differences may result in reclassifications between the components of net assets. These differences have no impact on the results of operations or net assets. The following reclassifications have been made to the Fund:
Increase/(Decrease) to Capital | Increase/(Decrease) to Undistributed | Increase/(Decrease) to Undistributed |
$ - | $ (20,791) | $ 20,791 |
28 | SEPTEMBER 30, 2019 |
Janus Henderson Asia Equity Fund
Notes to Financial Statements
5. Capital Share Transactions
Year ended September 30, 2019 | Year ended September 30, 2018(1) | |||||
Shares | Amount | Shares | Amount | |||
Class A Shares: | ||||||
Shares sold | 38,021 | $ 393,823 | 88,209 | $ 1,064,767 | ||
Reinvested dividends and distributions | 6,736 | 63,182 | 2,333 | 27,500 | ||
Shares repurchased | (37,040) | (367,143) | (51,015) | (607,814) | ||
Net Increase/(Decrease) | 7,717 | $ 89,862 |
| 39,527 | $ 484,453 | |
Class C Shares: | ||||||
Shares sold | 10,176 | $ 101,691 | 29,714 | $ 358,544 | ||
Reinvested dividends and distributions | 9,206 | 85,343 | 2,288 | 26,838 | ||
Shares repurchased | (77,092) | (753,536) | (6,159) | (70,272) | ||
Net Increase/(Decrease) | (57,710) | $ (566,502) |
| 25,843 | $ 315,110 | |
Class D Shares: | ||||||
Shares sold | 153,680 | $1,601,409 | 824,634 | $ 10,061,423 | ||
Reinvested dividends and distributions | 94,663 | 898,352 | 54,013 | 643,296 | ||
Shares repurchased | (319,202) | (3,324,111) | (1,611,063) | (19,379,702) | ||
Net Increase/(Decrease) | (70,859) | $ (824,350) |
| (732,416) | $ (8,674,983) | |
Class I Shares: | ||||||
Shares sold | 100,625 | $1,063,486 | 103,861 | $ 1,247,856 | ||
Reinvested dividends and distributions | 10,263 | 97,500 | 28,337 | 337,205 | ||
Shares repurchased | (67,386) | (689,891) | (1,138,895) | (13,922,271) | ||
Net Increase/(Decrease) | 43,502 | $ 471,095 |
| (1,006,697) | $(12,337,210) | |
Class N Shares: | ||||||
Shares sold | 159,659 | $1,706,729 | 802,257 | $ 9,826,191 | ||
Reinvested dividends and distributions | 66,690 | 632,223 | - | - | ||
Shares repurchased | (117,517) | (1,219,042) | (66,651) | (790,396) | ||
Net Increase/(Decrease) | 108,832 | $1,119,910 |
| 735,606 | $ 9,035,795 | |
Class S Shares: | ||||||
Shares sold | - | $ - | - | $ - | ||
Reinvested dividends and distributions | 3,966 | 37,204 | 1,086 | 12,848 | ||
Shares repurchased | - | - | - | - | ||
Net Increase/(Decrease) | 3,966 | $ 37,204 |
| 1,086 | $ 12,848 | |
Class T Shares: | ||||||
Shares sold | 102,159 | $1,026,567 | 109,999 | $ 1,329,447 | ||
Reinvested dividends and distributions | 6,744 | 63,330 | 6,689 | 78,728 | ||
Shares repurchased | (73,842) | (757,047) | (283,108) | (3,334,090) | ||
Net Increase/(Decrease) | 35,061 | $ 332,850 |
| (166,420) | $ (1,925,915) | |
(1) | Period from January 26, 2018 (inception date) through September 30, 2018 for Class N Shares. | |||||
6. Purchases and Sales of Investment Securities
For the year ended September 30, 2019, the aggregate cost of purchases and proceeds from sales of investment securities (excluding any short-term securities, short-term options contracts, TBAs, and in-kind transactions, as applicable) was as follows:
Purchases of | Proceeds from Sales | Purchases of Long- | Proceeds from Sales |
$ 7,895,575 | $ 9,718,121 | $ - | $ - |
Janus Investment Fund | 29 |
Janus Henderson Asia Equity Fund
Notes to Financial Statements
7. Recent Accounting Pronouncements
The FASB issued Accounting Standards Update No. 2017-08, Receivables – Nonrefundable Fees and Other Costs (Subtopic 310-20), Premium Amortization on Purchased Callable Debt Securities ("ASU 2017-08") to amend the amortization period for certain purchased callable debt securities held at a premium. The guidance requires certain premiums on callable debt securities to be amortized to the earliest call date. The amortization period for callable debt securities purchased at a discount will not be impacted. The amendments are effective for fiscal years and interim periods within those fiscal years, beginning after December 15, 2018. Management is currently evaluating the impacts of ASU 2017-08 on the Fund’s financial statements.
The FASB issued Accounting Standards Update 2018-13, Fair Value Measurement (Topic 820) in August 2018. The new guidance removes, modifies and enhances the disclosures to Topic 820. For public entities, the amendments are effective for financial statements issued for fiscal years beginning after December 15, 2019, and interim periods within those fiscal years. An entity is permitted, and Management has decided, to early adopt the removed and modified disclosures in these financial statements.
8. Subsequent Event
Management has evaluated whether any events or transactions occurred subsequent to September 30, 2019 and through the date of issuance of the Fund’s financial statements and determined that there were no material events or transactions that would require recognition or disclosure in the Fund’s financial statements.
30 | SEPTEMBER 30, 2019 |
Janus Henderson Asia Equity Fund
Report of Independent Registered Public Accounting Firm
To the Board of Trustees of Janus Investment Fund and Shareholders of Janus Henderson Asia Equity Fund:
Opinion on the Financial Statements
We have audited the accompanying statement of assets and liabilities, including the schedule of investments, of Janus Henderson Asia Equity Fund (one of the funds constituting Janus Investment Fund, referred to hereafter as the "Fund") as of September 30, 2019, the related statement of operations for the year ended September 30, 2019, the statements of changes in net assets for each of the two years in the period ended September 30, 2019, including the related notes, and the financial highlights for each of the periods indicated therein (collectively referred to as the “financial statements”). In our opinion, the financial statements present fairly, in all material respects, the financial position of the Fund as of September 30, 2019, the results of its operations for the year then ended, the changes in its net assets for each of the two years in the period ended September 30, 2019 and the financial highlights for each of the periods indicated therein in conformity with accounting principles generally accepted in the United States of America.
Basis for Opinion
These financial statements are the responsibility of the Fund’s management. Our responsibility is to express an opinion on the Fund’s financial statements based on our audits. We are a public accounting firm registered with the Public Company Accounting Oversight Board (United States) (PCAOB) and are required to be independent with respect to the Fund in accordance with the U.S. federal securities laws and the applicable rules and regulations of the Securities and Exchange Commission and the PCAOB.
We conducted our audits of these financial statements in accordance with the standards of the PCAOB. Those standards require that we plan and perform the audit to obtain reasonable assurance about whether the financial statements are free of material misstatement, whether due to error or fraud.
Our audits included performing procedures to assess the risks of material misstatement of the financial statements, whether due to error or fraud, and performing procedures that respond to those risks. Such procedures included examining, on a test basis, evidence regarding the amounts and disclosures in the financial statements. Our audits also included evaluating the accounting principles used and significant estimates made by management, as well as evaluating the overall presentation of the financial statements. Our procedures included confirmation of securities owned as of September 30, 2019 by correspondence with the custodian and brokers; when replies were not received from brokers, we performed other auditing procedures. We believe that our audits provide a reasonable basis for our opinion.

Denver, Colorado
November 15, 2019
We have served as the auditor of one or more investment companies in Janus Henderson Funds since 1990.
Janus Investment Fund | 31 |
Janus Henderson Asia Equity Fund
Additional Information (unaudited)
Proxy Voting Policies and Voting Record
A description of the policies and procedures that the Fund uses to determine how to vote proxies relating to its portfolio securities is available without charge: (i) upon request, by calling 1-800-525-1093; (ii) on the Fund’s website at janushenderson.com/proxyvoting; and (iii) on the SEC’s website at http://www.sec.gov. Additionally, information regarding the Fund’s proxy voting record for the most recent twelve-month period ended June 30 is also available, free of charge, through janushenderson.com/proxyvoting and from the SEC’s website at http://www.sec.gov.
Full Holdings
The Fund is required to disclose its complete holdings on Form N-Q within 60 days of the end of the first and third fiscal quarters, and in the annual report and semiannual report to Fund shareholders. These reports (i) are available on the SEC’s website at http://www.sec.gov; (ii) may be reviewed and copied at the SEC’s Public Reference Room in Washington, D.C. (information on the Public Reference Room may be obtained by calling 1-800-SEC-0330); and (iii) are available without charge, upon request, by calling a Janus Henderson representative at 1-877-335-2687 (toll free) (or 1-800-525-3713 if you hold Class D Shares). Portfolio holdings consisting of at least the names of the holdings are generally available on a monthly basis with a 30-day lag. Holdings are generally posted approximately two business days thereafter under Full Holdings for the Fund at janushenderson.com/info (or janushenderson.com/reports if you hold Class D Shares).
APPROVAL OF ADVISORY AGREEMENTS DURING THE PERIOD
Renewal of Advisory and Sub-Advisory Agreements with Janus Capital and Janus Capital Affiliates during the Period
The Trustees of Janus Investment Fund, each of whom serves as an “independent” Trustee (the “Trustees”), oversee the management of each Fund of Janus Investment Fund (each, a “JIF Fund,” and collectively, the “JIF Funds”), as well as each Portfolio of Janus Aspen Series (together with the JIF Funds, the “Janus Henderson Funds,” and each, a “Janus Henderson Fund”). As required by law, the Trustees determine annually whether to continue the investment advisory agreement for each Janus Henderson Fund and the subadvisory agreement for each Janus Henderson Funds that utilizes a subadviser.
In connection with their most recent consideration of those agreements for each Janus Henderson Fund, the Trustees received and reviewed information provided by Janus Capital and each subadviser in response to requests of the Trustees and their independent legal counsel. They also received and reviewed information and analysis provided by, and in response to requests of, their independent fee consultant. Throughout their consideration of the agreements, the Trustees were advised by their independent legal counsel. The Trustees met with management to consider the agreements and the information provided, and also met separately in executive session with their independent legal counsel and their independent fee consultant.
At a meeting held on December 6, 2018, based on the Trustees’ evaluation of the information provided by Janus Capital, the subadvisers, and the independent fee consultant, as well as other information, the Trustees determined that the overall arrangements between each Janus Henderson Fund and Janus Capital and each subadviser, as applicable, were fair and reasonable in light of the nature, extent and quality of the services provided by Janus Capital, its affiliates and the subadvisers, the fees charged for those services, and other matters that the Trustees considered relevant in the exercise of their business judgment. At that meeting, the Trustees unanimously approved the continuation of the investment advisory agreement for each Janus Henderson Fund, and the subadvisory agreement for each subadvised Janus Henderson Fund, for the period from February 1, 2019 through February 1, 2020, subject to earlier termination as provided for in each agreement.
In considering the continuation of those agreements, the Trustees reviewed and analyzed various factors that they determined were relevant, including the factors described below, none of which by itself was considered dispositive. However, the material factors and conclusions that formed the basis for the Trustees’ determination to approve the continuation of the agreements are discussed separately below. Also included is a summary of the independent fee consultant’s conclusions and opinions that arose during, and were included as part of, the Trustees’ consideration of the agreements. “Management fees,” as used herein, refer to actual annual advisory fees (and, for the purposes of peer comparisons any administration fees excluding out of pocket costs), net of any waivers, paid by a fund as a percentage of average net assets.
32 | SEPTEMBER 30, 2019 |
Janus Henderson Asia Equity Fund
Additional Information (unaudited)
Nature, Extent and Quality of Services
The Trustees reviewed the nature, extent and quality of the services provided by Janus Capital and the subadvisers to the Janus Henderson Funds, taking into account the investment objective, strategies and policies of each Janus Henderson Fund, and the knowledge the Trustees gained from their regular meetings with management on at least a quarterly basis and their ongoing review of information related to the Janus Henderson Funds. In addition, the Trustees reviewed the resources and key personnel of Janus Capital and each subadviser, particularly noting those employees who provide investment and risk management services to the Janus Henderson Funds. The Trustees also considered other services provided to the Janus Henderson Funds by Janus Capital or the subadvisers, such as managing the execution of portfolio transactions and the selection of broker-dealers for those transactions. The Trustees considered Janus Capital’s role as administrator to the Janus Henderson Funds, noting that Janus Capital does not receive a fee for its services but is reimbursed for its out-of-pocket costs. The Trustees considered the role of Janus Capital in monitoring adherence to the Janus Henderson Funds’ investment restrictions, providing support services for the Trustees and Trustee committees, and overseeing communications with fund shareholders and the activities of other service providers, including monitoring compliance with various policies and procedures of the Janus Henderson Funds and with applicable securities laws and regulations.
In this regard, the independent fee consultant noted that Janus Capital provides a number of different services for the Janus Henderson Funds and fund shareholders, ranging from investment management services to various other servicing functions, and that, in its view, Janus Capital is a capable provider of those services. The independent fee consultant also expressed the view that Janus Capital has developed a number of institutional competitive advantages that should enable it to provide superior investment and service performance over the long term.
The Trustees concluded that the nature, extent and quality of the services provided by Janus Capital and the subadviser to each Janus Henderson Fund that utilizes a subadviser were appropriate and consistent with the terms of the respective investment advisory and subadvisory agreements, and that, taking into account steps taken to address those Janus Henderson Funds whose performance lagged that of their peers for certain periods, the Janus Henderson Funds were likely to benefit from the continued provision of those services. They also concluded that Janus Capital and each subadviser had sufficient personnel, with the appropriate education and experience, to serve the Janus Henderson Funds effectively and had demonstrated its ability to attract well-qualified personnel.
Performance of the Funds
The Trustees considered the performance results of each Janus Henderson Fund over various time periods. They noted that they considered Janus Henderson Fund performance data throughout the year, including periodic meetings with each Janus Henderson Fund’s portfolio manager(s), and also reviewed information comparing each Janus Henderson Fund’s performance with the performance of comparable funds and peer groups identified by Broadridge Financial Solutions, Inc. (“Broadridge”), an independent data provider, and with the Janus Henderson Fund’s benchmark index. In this regard, the independent fee consultant found that the overall Janus Henderson Funds’ performance has been reasonable: for the 36 months ended September 30, 2018, approximately 48% of the Janus Henderson Funds were in the top two quartiles of performance, as reported by Morningstar, and for the 12 months ended September 30, 2018, approximately 56% of the Janus Henderson Funds were in the top two quartiles of performance, as reported by Morningstar.
The Trustees considered the performance of each Janus Henderson Fund, noting that performance may vary by share class, and noted the following with respect to the JIF Funds:
Alternative Fund
· For Janus Henderson Diversified Alternatives Fund, the Trustees noted that the Fund’s performance was in the second Broadridge quartile for the 36 months ended May 31, 2018 and the second Broadridge quartile for the 12 months ended May 31, 2018.
Asset Allocation Funds
· For Janus Henderson Global Allocation Fund – Conservative, the Trustees noted that the Fund’s performance was in the second Broadridge quartile for the 36 months ended May 31, 2018 and the first Broadridge quartile for the 12 months ended May 31, 2018.
Janus Investment Fund | 33 |
Janus Henderson Asia Equity Fund
Additional Information (unaudited)
· For Janus Henderson Global Allocation Fund – Growth, the Trustees noted that the Fund’s performance was in the third Broadridge quartile for the 36 months ended May 31, 2018 and the first Broadridge quartile for the 12 months ended May 31, 2018. The Trustees noted the reasons for the Fund’s underperformance, the steps Janus Capital had taken or was taking to improve performance, and that the performance trend was improving.
· For Janus Henderson Global Allocation Fund – Moderate, the Trustees noted that the Fund’s performance was in the third Broadridge quartile for the 36 months ended May 31, 2018 and the first Broadridge quartile for the 12 months ended May 31, 2018. The Trustees noted the reasons for the Fund’s underperformance, the steps Janus Capital had taken or was taking to improve performance, and that the performance trend was improving.
Fixed-Income Funds
· For Janus Henderson Flexible Bond Fund, the Trustees noted that the Fund’s performance was in the bottom Broadridge quartile for the 36 months ended May 31, 2018 and the third Broadridge quartile for the 12 months ended May 31, 2018. The Trustees noted the reasons for the Fund’s underperformance and the steps Janus Capital had taken or was taking to improve performance.
· For Janus Henderson Global Bond Fund, the Trustees noted that the Fund’s performance was in the bottom Broadridge quartile for the 36 months ended May 31, 2018 and the first Broadridge quartile for the 12 months ended May 31, 2018. The Trustees noted the reasons for the Fund’s underperformance, the steps Janus Capital had taken or was taking to improve performance, and that the performance trend was improving.
· For Janus Henderson Absolute Return Income Opportunities Fund (formerly, Janus Henderson Global Unconstrained Bond Fund), the Trustees noted that the Fund’s performance was in the bottom Broadridge quartile for the 36 months ended May 31, 2018 and the bottom Broadridge quartile for the 12 months ended May 31, 2018. The Trustees noted the reasons for the Fund’s underperformance and the steps Janus Capital had taken or was taking to improve performance.
· For Janus Henderson High-Yield Fund, the Trustees noted that the Fund’s performance was in the second Broadridge quartile for the 36 months ended May 31, 2018 and the third Broadridge quartile for the 12 months ended May 31, 2018.
· For Janus Henderson Multi-Sector Income Fund, the Trustees noted that the Fund’s performance was in the first Broadridge quartile for the 36 months ended May 31, 2018 and the first Broadridge quartile for the 12 months ended May 31, 2018.
· For Janus Henderson Short-Term Bond Fund, the Trustees noted that the Fund’s performance was in the bottom Broadridge quartile for the 36 months ended May 31, 2018 and the bottom Broadridge quartile for the 12 months ended May 31, 2018. The Trustees noted the reasons for the Fund’s underperformance and the steps Janus Capital had taken or was taking to improve performance.
· For Janus Henderson Developed World Bond Fund (formerly, Janus Henderson Strategic Income Fund), the Trustees noted that the Fund’s performance was in the second Broadridge quartile for the 36 months ended May 31, 2018 and the third Broadridge quartile for the 12 months ended May 31, 2018.
Global and International Equity Funds
· For Janus Henderson Asia Equity Fund, the Trustees noted that the Fund’s performance was in the third Broadridge quartile for the 36 months ended May 31, 2018 and the bottom Broadridge quartile for the 12 months ended May 31, 2018. The Trustees noted the reasons for the Fund’s underperformance, noting that the Fund has a performance fee structure that results in lower management fees during periods of underperformance, and the steps Janus Capital had taken or was taking to improve performance.
· For Janus Henderson Emerging Markets Fund, the Trustees noted that the Fund’s performance was in the third Broadridge quartile for the 36 months ended May 31, 2018 and the bottom Broadridge quartile for the 12 months ended May 31, 2018. The Trustees noted the reasons for the Fund’s underperformance and the steps Janus Capital had taken or was taking to improve performance.
· For Janus Henderson European Focus Fund, the Trustees noted that the Fund’s performance was in the bottom Broadridge quartile for the 36 months ended May 31, 2018 and the bottom Broadridge quartile for the 12 months
34 | SEPTEMBER 30, 2019 |
Janus Henderson Asia Equity Fund
Additional Information (unaudited)
ended May 31, 2018. The Trustees noted the reasons for the Fund’s underperformance and the steps Janus Capital had taken or was taking to improve performance.
· For Janus Henderson Global Equity Income Fund, the Trustees noted that the Fund’s performance was in the bottom Broadridge quartile for the 36 months ended May 31, 2018 and the bottom Broadridge quartile for the 12 months ended May 31, 2018. The Trustees noted the reasons for the Fund’s underperformance and the steps Janus Capital had taken or was taking to improve performance.
· For Janus Henderson Global Life Sciences Fund, the Trustees noted that the Fund’s performance was in the second Broadridge quartile for the 36 months ended May 31, 2018 and the first Broadridge quartile for the 12 months ended May 31, 2018.
· For Janus Henderson Global Real Estate Fund, the Trustees noted that the Fund’s performance was in the first Broadridge quartile for the 36 months ended May 31, 2018 and the first Broadridge quartile for the 12 months ended May 31, 2018.
· For Janus Henderson Global Research Fund, the Trustees noted that the Fund’s performance was in the third Broadridge quartile for the 36 months ended May 31, 2018 and the third Broadridge quartile for the 12 months ended May 31, 2018. The Trustees noted the reasons for the Fund’s underperformance, while also noting that the Fund has a performance fee structure that results in lower management fees during periods of underperformance, and the steps Janus Capital had taken or was taking to improve performance.
· For Janus Henderson Global Select Fund, the Trustees noted that the Fund’s performance was in the third Broadridge quartile for the 36 months ended May 31, 2018 and the first Broadridge quartile for the 12 months ended May 31, 2018. The Trustees noted the reasons for the Fund’s underperformance, the steps Janus Capital had taken or was taking to improve performance, and that the performance trend was improving.
· For Janus Henderson Global Technology Fund, the Trustees noted that the Fund’s performance was in the second Broadridge quartile for the 36 months ended May 31, 2018 and the third Broadridge quartile for the 12 months ended May 31, 2018.
· For Janus Henderson Global Value Fund, the Trustees noted that the Fund’s performance was in the bottom Broadridge quartile for the 36 months ended May 31, 2018 and the third Broadridge quartile for the 12 months ended May 31, 2018. The Trustees noted the reasons for the Fund’s underperformance, while also noting that the Fund has a performance fee structure that results in lower management fees during periods of underperformance, and the steps Janus Capital and Perkins had taken or were taking to improve performance.
· For Janus Henderson International Opportunities Fund, the Trustees noted that the Fund’s performance was in the bottom Broadridge quartile for the 36 months ended May 31, 2018 and the bottom Broadridge quartile for the 12 months ended May 31, 2018. The Trustees noted the reasons for the Fund’s underperformance and the steps Janus Capital had taken or was taking to improve performance.
· For Janus Henderson International Small Cap Fund, the Trustees noted that the Fund’s performance was in the second Broadridge quartile for the 12 months ended May 31, 2018.
· For Janus Henderson International Value Fund, the Trustees noted that the Fund’s performance was in the bottom Broadridge quartile for the 36 months ended May 31, 2018 and the bottom Broadridge quartile for the 12 months ended May 31, 2018. The Trustees noted the reasons for the Fund’s underperformance and the steps Janus Capital and Perkins had taken or were taking to improve performance.
· For Janus Henderson Overseas Fund, the Trustees noted that the Fund’s performance was in the bottom Broadridge quartile for the 36 months ended May 31, 2018 and the second Broadridge quartile for the 12 months ended May 31, 2018. The Trustees noted the reasons for the Fund’s underperformance, while also noting that the Fund has a performance fee structure that results in lower management fees during periods of underperformance, the steps Janus Capital had taken or was taking to improve performance, and that the performance trend was improving.
Janus Investment Fund | 35 |
Janus Henderson Asia Equity Fund
Additional Information (unaudited)
Money Market Funds
· For Janus Henderson Government Money Market Fund, the Trustees noted that the Fund’s performance was in the second Broadridge quartile for the 36 months ended May 31, 2018 and the second Broadridge quartile for the 12 months ended May 31, 2018.
· For Janus Henderson Money Market Fund, the Trustees noted that the Fund’s performance was in the third Broadridge quartile for the 36 months ended May 31, 2018 and the third Broadridge quartile for the 12 months ended May 31, 2018. The Trustees noted the reasons for the Fund’s underperformance, including the impact of waivers on comparative peer performance.
Multi-Asset Funds
· For Janus Henderson Adaptive Global Allocation Fund, the Trustees noted that the Fund’s performance was in the bottom Broadridge quartile for the 12 months ended May 31, 2018. The Trustees noted the reasons for the Fund’s underperformance, the steps Janus Capital had taken or was taking to improve performance, and the Fund’s limited performance history.
· For Janus Henderson All Asset Fund, the Trustees noted that the Fund’s performance was in the third Broadridge quartile for the 36 months ended May 31, 2018 and the third Broadridge quartile for the 12 months ended May 31, 2018. The Trustees noted the reasons for the Fund’s underperformance and the steps Janus Capital had taken or was taking to improve performance.
· For Janus Henderson Dividend & Income Builder Fund, the Trustees noted that the Fund’s performance was in the second Broadridge quartile for the 36 months ended May 31, 2018 and the third Broadridge quartile for the 12 months ended May 31, 2018.
· For Janus Henderson Value Plus Income Fund, the Trustees noted that the Fund’s performance was in the second Broadridge quartile for the 36 months ended May 31, 2018 and the third Broadridge quartile for the 12 months ended May 31, 2018.
Multi-Asset U.S. Equity Funds
· For Janus Henderson Balanced Fund, the Trustees noted that the Fund’s performance was in the first Broadridge quartile for the 36 months ended May 31, 2018 and the first Broadridge quartile for the 12 months ended May 31, 2018.
· For Janus Henderson Contrarian Fund, the Trustees noted that the Fund’s performance was in the bottom Broadridge quartile for the 36 months ended May 31, 2018 and the third Broadridge quartile for the 12 months ended May 31, 2018. The Trustees noted the reasons for the Fund’s underperformance, while also noting that the Fund has a performance fee structure that results in lower management fees during periods of underperformance, and the steps Janus Capital had taken or was taking to improve performance.
· For Janus Henderson Enterprise Fund, the Trustees noted that the Fund’s performance was in the first Broadridge quartile for the 36 months ended May 31, 2018 and the second Broadridge quartile for the 12 months ended May 31, 2018.
· For Janus Henderson Forty Fund, the Trustees noted that the Fund’s performance was in the second Broadridge quartile for the 36 months ended May 31, 2018 and the third Broadridge quartile for the 12 months ended May 31, 2018.
· For Janus Henderson Growth and Income Fund, the Trustees noted that the Fund’s performance was in the first Broadridge quartile for the 36 months ended May 31, 2018 and the first Broadridge quartile for the 12 months ended May 31, 2018.
· For Janus Henderson Research Fund, the Trustees noted that the Fund’s performance was in the third Broadridge quartile for the 36 months ended May 31, 2018 and the third Broadridge quartile for the 12 months ended May 31, 2018. The Trustees noted the reasons for the Fund’s underperformance, noting that the Fund has a performance fee structure that results in lower management fees during periods of underperformance, and the steps Janus Capital had taken or was taking to improve performance.
36 | SEPTEMBER 30, 2019 |
Janus Henderson Asia Equity Fund
Additional Information (unaudited)
· For Janus Henderson Triton Fund, the Trustees noted that the Fund’s performance was in the second Broadridge quartile for the 36 months ended May 31, 2018 and the third Broadridge quartile for the 12 months ended May 31, 2018.
· For Janus Henderson U.S. Growth Opportunities Fund, the Trustees noted that the Fund’s performance was in the third Broadridge quartile for the 36 months ended May 31, 2018 and the third Broadridge quartile for the 12 months ended May 31, 2018. The Trustees noted the reasons for the Fund’s underperformance, and the steps Janus Capital and Geneva had taken or were taking to improve performance.
· For Janus Henderson Venture Fund, the Trustees noted that the Fund’s performance was in the second Broadridge quartile for the 36 months ended May 31, 2018 and the third Broadridge quartile for the 12 months ended May 31, 2018.
Quantitative Equity Funds
· For Janus Henderson Emerging Markets Managed Volatility Fund, the Trustees noted that the Fund’s performance was in the third Broadridge quartile for the 36 months ended May 31, 2018 and the first Broadridge quartile for the 12 months ended May 31, 2018. The Trustees noted the reasons for the Fund’s underperformance, the steps Janus Capital and Intech had taken or were taking to improve performance, and that the performance trend was improving.
· For Janus Henderson Global Income Managed Volatility Fund, the Trustees noted that the Fund’s performance was in the first Broadridge quartile for the 36 months ended May 31, 2018 and the bottom Broadridge quartile for the 12 months ended May 31, 2018.
· For Janus Henderson International Managed Volatility Fund, the Trustees noted that the Fund’s performance was in the second Broadridge quartile for the 36 months ended May 31, 2018 and the second Broadridge quartile for the 12 months ended May 31, 2018.
· For Janus Henderson U.S. Managed Volatility Fund, the Trustees noted that the Fund’s performance was in the first Broadridge quartile for the 36 months ended May 31, 2018 and the first Broadridge quartile for the 12 months ended May 31, 2018.
U.S. Equity Funds
· For Janus Henderson Large Cap Value Fund, the Trustees noted that the Fund’s performance was in the third Broadridge quartile for the 36 months ended May 31, 2018 and the third Broadridge quartile for the 12 months ended May 31, 2018. The Trustees noted the reasons for the Fund’s underperformance, while also noting that the Fund has a performance fee structure that results in lower management fees during periods of underperformance, and the steps Janus Capital and Perkins had taken or were taking to improve performance.
· For Janus Henderson Mid Cap Value Fund, the Trustees noted that the Fund’s performance was in the second Broadridge quartile for the 36 months ended May 31, 2018 and the third Broadridge quartile for the 12 months ended May 31, 2018.
· For Janus Henderson Small-Mid Cap Value Fund (formerly, Janus Henderson Select Value Fund), the Trustees noted that the Fund’s performance was in the second Broadridge quartile for the 36 months ended May 31, 2018 and the bottom Broadridge quartile for the 12 months ended May 31, 2018.
· For Janus Henderson Small Cap Value Fund, the Trustees noted that the Fund’s performance was in the second Broadridge quartile for the 36 months ended May 31, 2018 and the bottom Broadridge quartile for the 12 months ended May 31, 2018.
In consideration of each Janus Henderson Fund’s performance, the Trustees concluded that, taking into account the factors relevant to performance, as well as other considerations, including steps taken to improve performance, the Janus Henderson Fund’s performance warranted continuation of such Janus Henderson Fund’s investment advisory and subadvisory agreement(s).
Costs of Services Provided
The Trustees examined information regarding the fees and expenses of each Janus Henderson Fund in comparison to similar information for other comparable funds as provided by Broadridge, an independent data provider. They also
Janus Investment Fund | 37 |
Janus Henderson Asia Equity Fund
Additional Information (unaudited)
reviewed an analysis of that information provided by their independent fee consultant and noted that the management fee rate (investment advisory and any administration fees, but excluding out-of-pocket costs) for many of the Janus Henderson Funds, net of waivers, was below the average management fee rate of the respective peer group of funds selected by Broadridge. The Trustees also examined information regarding the subadvisory fees charged for subadvisory services, as applicable, noting that all such fees were paid by Janus Capital out of its management fees collected from such Janus Henderson Fund. The Trustees also considered the total expenses for each share class of each Janus Henderson Fund compared to the average total expenses for its Broadridge Expense Group peers and to average total expenses for its Broadridge Expense Universe.
The independent fee consultant expressed the view that the management fees charged by Janus Capital to each of the Janus Henderson Funds under the current investment advisory and administration agreements are reasonable in relation to the services provided by Janus Capital. At the fund complex level, the independent fee consultant found: (1) the total expenses and management fees of the Janus Henderson Funds to be reasonable relative to other mutual funds; (2) total expenses, on average, were 10% under the average total expenses for the respective Broadridge Expense Group peers and 19% under the average total expenses for the respective Broadridge Expense Universes; (3) management fees for the Janus Henderson Funds, on average, were 8% under the average management fees for the respective Expense Groups and 10% under the average for the respective Expense Universes; and (4) Janus Henderson Fund expenses by function for each asset and share class category were reasonable relative to peer benchmarks.
The independent fee consultant concluded that, based on its strategic review of expenses at the complex, category and individual share class level, Janus Henderson Fund expenses were found to be reasonable relative to peer benchmarks. Further, for certain Janus Henderson Funds, the independent fee consultant also performed a systematic “focus list” analysis of expenses in the context of the performance or service delivered to investors in each Janus Henderson Fund. Based on this analysis, the independent fee consultant found that the combination of service quality/performance and expenses on these individual Janus Henderson Funds were reasonable in light of performance trends, performance histories, and existence of performance fees, breakpoints, and expense waivers on such “focus list” Funds.
The Trustees considered the methodology used by Janus Capital and each subadviser in determining compensation payable to portfolio managers, the competitive environment for investment management talent, and the competitive market for mutual funds in different distribution channels.
The Trustees also reviewed management fees charged by Janus Capital and each subadviser to comparable separate account clients and to comparable non-affiliated funds subadvised by Janus Capital or by a subadviser (for which Janus Capital or the subadviser provides only or primarily portfolio management services). Although in most instances comparable subadvisory and separate account fee rates for various investment strategies were lower than management fee rates for Janus Henderson Funds having a similar strategy, while subadviser fee rates charged to the Janus Henderson Funds were generally within a reasonable range of the fee rates that the subadviser charges to comparable separate account clients or non-affiliated funds. The Trustees considered that Janus Capital noted that, under the terms of the management agreements with the Janus Henderson Funds, Janus Capital performs significant additional services for the Janus Henderson Funds that it does not provide to those other clients, including administration services, oversight of the Janus Henderson Funds’ other service providers, trustee support, regulatory compliance and numerous other services, and that, in serving the Janus Henderson Funds, Janus Capital assumes many legal risks and other costs that it does not assume in servicing its other clients. Moreover, the Trustees noted that the independent fee consultant found that: (1) the management fees Janus Capital charges to the Janus Henderson Funds are reasonable in relation to the management fees Janus Capital charges to its institutional clients and to the fees Janus Capital charges to funds subadvised by Janus Capital; (2) these institutional and subadvised accounts have different service and infrastructure needs; (3) Janus Henderson mutual fund investors enjoy reasonable fees relative to the fees charged to Janus Henderson institutional and subadvised fund investors; (4) in three of five product categories, the Janus Henderson Funds receive proportionally better pricing than the industry in relation to Janus Henderson institutional clients; and (5) in six of seven strategies, Janus Capital has lower management fees than the management fees charged to funds subadvised by Janus Capital.
The Trustees considered the fees for each Janus Henderson Fund for its fiscal year ended in 2017, including the JIF Funds, and noted the following with regard to each JIF Fund’s total expenses, net of applicable fee waivers (the JIF Fund’s “total expenses”):
38 | SEPTEMBER 30, 2019 |
Janus Henderson Asia Equity Fund
Additional Information (unaudited)
Alternative Fund
· For Janus Henderson Diversified Alternatives Fund, the Trustees noted that, although the Fund’s total expenses exceeded the peer group average for certain share classes, overall the Fund’s total expenses were reasonable. The Trustees also noted that Janus Capital has contractually agreed to limit the Fund’s expenses.
Asset Allocation Funds
· For Janus Henderson Global Allocation Fund – Conservative, the Trustees noted that, although the Fund’s total expenses exceeded the peer group average for certain share classes, overall the Fund’s total expenses were reasonable. The Trustees also noted that Janus Capital has contractually agreed to limit the Fund’s expenses, although this limit did not apply because the Fund’s total expenses were already below the applicable fee limit.
· For Janus Henderson Global Allocation Fund – Growth, the Trustees noted that, although the Fund’s total expenses exceeded the peer group average for certain share classes, overall the Fund’s total expenses were reasonable. The Trustees also noted that Janus Capital has contractually agreed to limit the Fund’s expenses, although this limit did not apply because the Fund’s total expenses were already below the applicable fee limit.
· For Janus Henderson Global Allocation Fund – Moderate, the Trustees noted that, although the Fund’s total expenses exceeded the peer group average for certain share classes, overall the Fund’s total expenses were reasonable. The Trustees also noted that Janus Capital has contractually agreed to limit the Fund’s expenses, although this limit did not apply because the Fund’s total expenses were already below the applicable fee limit.
Fixed-Income Funds
· For Janus Henderson Flexible Bond Fund, the Trustees noted that, although the Fund’s total expenses exceeded the peer group average for certain share classes, overall the Fund’s total expenses were reasonable. The Trustees also noted that Janus Capital has contractually agreed to limit the Fund’s expenses.
· For Janus Henderson Global Bond Fund, the Trustees noted that, although the Fund’s total expenses exceeded the peer group average for certain share classes, overall the Fund’s total expenses were reasonable. The Trustees also noted that Janus Capital has contractually agreed to limit the Fund’s expenses.
· For Janus Henderson Absolute Return Income Opportunities Fund (formerly, Janus Henderson Global Unconstrained Bond Fund), the Trustees noted that, although the Fund’s total expenses exceeded the peer group average for all share classes, overall the Fund’s total expenses were reasonable. The Trustees also noted that Janus Capital has contractually agreed to limit the Fund’s expenses, although this limit did not apply because the Fund’s total expenses were already below the applicable fee limit.
· For Janus Henderson High-Yield Fund, the Trustees noted that, although the Fund’s total expenses exceeded the peer group average for certain share classes, overall the Fund’s total expenses were reasonable. The Trustees also noted that Janus Capital has contractually agreed to limit the Fund’s expenses, although this limit did not apply because the Fund’s total expenses were already below the applicable fee limit.
· For Janus Henderson Multi-Sector Income Fund, the Trustees noted that, although the Fund’s total expenses exceeded the peer group average for certain share classes, overall the Fund’s total expenses were reasonable. The Trustees also noted that Janus Capital has contractually agreed to limit the Fund’s expenses.
· For Janus Henderson Short-Term Bond Fund, the Trustees noted that, although the Fund’s total expenses exceeded the peer group average for all share classes, overall the Fund’s total expenses were reasonable. The Trustees also noted that the peer group comparisons did not take into account a recent management fee reduction for the Fund, effective December 14, 2018 and that Janus Capital has contractually agreed to limit the Fund’s expenses at a lower (more favorable) level.
· For Janus Henderson Developed World Bond Fund (formerly, Janus Henderson Strategic Income Fund), the Trustees noted that, although the Fund’s total expenses exceeded the peer group average for certain share classes, overall the Fund’s total expenses were reasonable. The Trustees also noted that Janus Capital has contractually agreed to limit the Fund’s expenses.
Janus Investment Fund | 39 |
Janus Henderson Asia Equity Fund
Additional Information (unaudited)
Global and International Equity Funds
· For Janus Henderson Asia Equity Fund, the Trustees noted that, although the Fund’s total expenses exceeded the peer group average for certain share classes, overall the Fund’s total expenses were reasonable. The Trustees also noted that Janus Capital has contractually agreed to limit the Fund’s expenses.
· For Janus Henderson Emerging Markets Fund, the Trustees noted that, although the Fund’s total expenses exceeded the peer group average for one share class, overall the Fund’s total expenses were reasonable. The Trustees also noted that Janus Capital has contractually agreed to limit the Fund’s expenses.
· For Janus Henderson European Focus Fund, the Trustees noted that, although the Fund’s total expenses exceeded the peer group average for certain share classes, overall the Fund’s total expenses were reasonable. The Trustees also noted that Janus Capital has contractually agreed to limit the Fund’s expenses.
· For Janus Henderson Global Equity Income Fund, the Trustees noted that the Fund’s total expenses were below the peer group average for all share classes.
· For Janus Henderson Global Life Sciences Fund, the Trustees noted that the Fund’s total expenses were below the peer group average for all share classes.
· For Janus Henderson Global Real Estate Fund, the Trustees noted that the Fund’s total expenses were below the peer group average for all share classes.
· For Janus Henderson Global Research Fund, the Trustees noted that the Fund’s total expenses were below the peer group average for all share classes.
· For Janus Henderson Global Select Fund, the Trustees noted that, although the Fund’s total expenses exceeded the peer group average for one share class, overall the Fund’s total expenses were reasonable. The Trustees also noted that Janus Capital has contractually agreed to limit the Fund’s expenses, although this limit did not apply because the Fund’s total expenses were already below the applicable fee limit.
· For Janus Henderson Global Technology Fund, the Trustees noted that the Fund’s total expenses were below the peer group average for all share classes.
· For Janus Henderson Global Value Fund, the Trustees noted that the Fund’s total expenses were below the peer group average for all share classes.
· For Janus Henderson International Opportunities Fund, the Trustees noted that, although the Fund’s total expenses exceeded the peer group average for certain share classes, overall the Fund’s total expenses were reasonable. The Trustees also noted that Janus Capital has contractually agreed to limit the Fund’s expenses.
· For Janus Henderson International Small Cap Fund, the Trustees noted that, although the Fund’s total expenses exceeded the peer group average for one share class, overall the Fund’s total expenses were reasonable. The Trustees also noted that Janus Capital has contractually agreed to limit the Fund’s expenses.
· For Janus Henderson International Value Fund, the Trustees noted that, although the Fund’s total expenses exceeded the peer group average for one share class, overall the Fund’s total expenses were reasonable. The Trustees also noted that Janus Capital has contractually agreed to limit the Fund’s expenses.
· For Janus Henderson Overseas Fund, the Trustees noted that the Fund’s total expenses were below the peer group average for all share classes.
Money Market Funds
· For Janus Henderson Government Money Market Fund, the Trustees noted that, although the Fund’s total expenses exceeded the peer group average for one share class, overall the Fund’s total expenses were reasonable. In addition, the Trustees considered that Janus Capital voluntarily waives one-half of its advisory fee and other expenses in order to maintain a positive yield.
· For Janus Henderson Money Market Fund, the Trustees noted that the Fund’s total expenses were above the peer group average for both share classes. In addition, the Trustees considered that Janus Capital voluntarily waives one-half of its advisory fee and other expenses in order to maintain a positive yield.
40 | SEPTEMBER 30, 2019 |
Janus Henderson Asia Equity Fund
Additional Information (unaudited)
Multi-Asset Funds
· For Janus Henderson Adaptive Global Allocation Fund, the Trustees noted that, although the Fund’s total expenses exceeded the peer group average for one share class, overall the Fund’s total expenses were reasonable. The Trustees also noted that Janus Capital has contractually agreed to limit the Fund’s expenses.
· For Janus Henderson All Asset Fund, the Trustees noted that, although the Fund’s total expenses exceeded the peer group average for one share class, overall the Fund’s total expenses were reasonable. The Trustees also noted that Janus Capital has contractually agreed to limit the Fund’s total expenses.
· For Janus Henderson Dividend & Income Builder Fund, the Trustees noted that the Fund’s total expenses were below the peer group average for all share classes.
· For Janus Henderson Value Plus Income Fund, the Trustees noted that the Fund’s total expenses were below the peer group average for all share classes.
Multi-Asset U.S. Equity Funds
· For Janus Henderson Balanced Fund, the Trustees noted that, although the Fund’s total expenses were equal to or exceeded the peer group average for certain share classes, overall the Fund’s total expenses were reasonable. The Trustees also noted that Janus Capital has contractually agreed to limit the Fund’s expenses, although this limit did not apply because the Fund’s total expenses were already below the applicable fee limit.
· For Janus Henderson Contrarian Fund, the Trustees noted that the Fund’s total expenses were below the peer group average for all share classes.
· For Janus Henderson Enterprise Fund, the Trustees noted that the Fund’s total expenses were below the peer group average for all share classes.
· For Janus Henderson Forty Fund, the Trustees noted that, although the Fund’s total expenses exceeded the peer group average for certain share classes, overall the Fund’s total expenses were reasonable. The Trustees also noted that Janus Capital has contractually agreed to limit the Fund’s expenses, although this limit did not apply because the Fund’s total expenses were already below the applicable fee limit.
· For Janus Henderson Growth and Income Fund, the Trustees noted that, although the Fund’s total expenses exceeded the peer group average for certain share classes, overall the Fund’s total expenses were reasonable. The Trustees also noted that Janus Capital has contractually agreed to limit the Fund’s expenses, although this limit did not apply because the Fund’s total expenses were already below the applicable fee limit.
· For Janus Henderson Research Fund, the Trustees noted that the Fund’s total expenses were below the peer group average for all share classes.
· For Janus Henderson Triton Fund, the Trustees noted that the Fund’s total expenses were below the peer group average for all share classes.
· For Janus Henderson U.S. Growth Opportunities Fund, the Trustees noted that, although the Fund’s total expenses exceeded the peer group average for one share class, overall the Fund’s total expenses were reasonable. The Trustees also noted that Janus Capital has contractually agreed to limit the Fund’s expenses.
· For Janus Henderson Venture Fund, the Trustees noted that the Fund’s total expenses were below the peer group average for all share classes.
Quantitative Equity Funds
· For Janus Henderson Emerging Markets Managed Volatility Fund, the Trustees noted that, although the Fund’s total expenses exceeded the peer group average for certain share classes, overall the Fund’s total expenses were reasonable taking into account the limited peer group for the Fund. The Trustees also noted that Janus Capital has contractually agreed to limit the Fund’s expenses.
· For Janus Henderson Global Income Managed Volatility Fund, the Trustees noted that the Fund’s total expenses were below the peer group average for all share classes.
Janus Investment Fund | 41 |
Janus Henderson Asia Equity Fund
Additional Information (unaudited)
· For Janus Henderson International Managed Volatility Fund, the Trustees noted that, although the Fund’s total expenses exceeded the peer group average for one share class, overall the Fund’s total expenses were reasonable. The Trustees also noted that Janus Capital has contractually agreed to limit the Fund’s expenses, although this limit did not apply because the Fund’s total expenses were already below the applicable fee limit.
· For Janus Henderson U.S. Managed Volatility Fund, the Trustees noted that, although the Fund’s total expenses exceeded the peer group average for one share class, overall the Fund’s total expenses were reasonable. The Trustees also noted that Janus Capital has contractually agreed to limit the Fund’s expenses, although this limit did not apply because the Fund’s total expenses were already below the applicable fee limit.
U.S. Equity Funds
· For Janus Henderson Large Cap Value Fund, the Trustees noted that the Fund’s total expenses were below the peer group average for all share classes.
· For Janus Henderson Mid Cap Value Fund, the Trustees noted that the Fund’s total expenses were below the peer group average for all share classes.
· For Janus Henderson Small-Mid Cap Value Fund (formerly, Janus Henderson Select Value Fund), the Trustees noted that, although the Fund’s total expenses exceeded the peer group average for certain share classes, overall the Fund’s total expenses were reasonable. The Trustees also noted that Janus Capital has contractually agreed to limit the Fund’s expenses.
· For Janus Henderson Small Cap Value Fund, the Trustees noted that, although the Fund’s total expenses exceeded the peer group average for certain share classes, overall the Fund’s total expenses were reasonable. The Trustees also noted that Janus Capital has contractually agreed to limit the Fund’s expenses, although this limit did not apply because the Fund’s total expenses were already below the applicable fee limit.
The Trustees reviewed information on the overall profitability to Janus Capital and its affiliates of their relationship with the Janus Henderson Funds, and considered profitability data of other publicly traded fund managers. The Trustees recognized that profitability comparisons among fund managers are difficult because of the variation in the type of comparative information that is publicly available, and the profitability of any fund manager is affected by numerous factors, including the organizational structure of the particular fund manager, differences in complex size, differences in product mix, differences in types of business (mutual fund, institutional and other), differences in the methodology for allocating expenses, and the fund manager’s capital structure and cost of capital.
Additionally, the Trustees considered the estimated profitability to Janus Capital from the investment management services it provides to each Janus Henderson Fund. In their review, the Trustees considered whether Janus Capital and each subadviser receive adequate incentives and resources to manage the Janus Henderson Funds effectively. In reviewing profitability, the Trustees noted that the estimated profitability for an individual Janus Henderson Fund is necessarily a product of the allocation methodology utilized by Janus Capital to allocate its expenses as part of the estimated profitability calculation. In this regard, the Trustees noted that the independent fee consultant concluded that (1) the expense allocation methodology utilized by Janus Capital was reasonable and (2) the estimated profitability to Janus Capital from the investment management services it provided to each Janus Henderson Fund was reasonable. The Trustees also considered that the estimated profitability for an individual Janus Henderson Fund was influenced by a number of factors, including not only the allocation methodology selected, but also the presence of fee waivers and expense caps, and whether the Janus Henderson Fund’s investment management agreement contained breakpoints or a performance fee component. The Trustees determined, after taking into account these factors, among others, that Janus Capital’s estimated profitability with respect to each Janus Henderson Fund was not unreasonable in relation to the services provided, and that the variation in the range of such estimated profitability among the Janus Henderson Funds was not a material factor in the Board’s approval of the reasonableness of any Janus Henderson Fund’s investment management fees.
The Trustees concluded that the management fees payable by each Janus Henderson Fund to Janus Capital, as well as the fees paid by Janus Capital to the subadvisers of subadvised Janus Henderson Funds, were reasonable in relation to the nature, extent, and quality of the services provided, taking into account the fees charged by other advisers for managing comparable mutual funds with similar strategies, the fees Janus Capital and the subadvisers charge to other clients, and, as applicable, the impact of fund performance on management fees payable by the Janus Henderson Funds. The Trustees also concluded that each Janus Henderson Fund’s total expenses were reasonable,
42 | SEPTEMBER 30, 2019 |
Janus Henderson Asia Equity Fund
Additional Information (unaudited)
taking into account the size of the Janus Henderson Fund, the quality of services provided by Janus Capital and any subadviser, the investment performance of the Janus Henderson Fund, and any expense limitations agreed to or provided by Janus Capital.
Economies of Scale
The Trustees considered information about the potential for Janus Capital to realize economies of scale as the assets of the Janus Henderson Funds increase. They noted the independent fee consultant’s analysis of economies of scale in prior years. They also noted that, although many Janus Henderson Funds pay advisory fees at a base fixed rate as a percentage of net assets, without any breakpoints or performance fees, the independent fee consultant concluded that 74% of these Janus Henderson Funds’ share classes have contractual management fees (gross of waivers) below their Broadridge Expense Group averages. They also noted that for those Janus Henderson Funds whose expenses are being reduced by contractual expense limitations with Janus Capital, Janus Capital is subsidizing certain of these Janus Henderson Funds because they have not reached adequate scale. Moreover, as the assets of some of the Janus Henderson Funds have declined in the past few years, certain Janus Henderson Funds have benefited from having advisory fee rates that have remained constant rather than increasing as assets declined. In addition, performance fee structures have been implemented for various Janus Henderson Funds that have caused the effective rate of advisory fees payable by such a Janus Henderson Fund to vary depending on the investment performance of the Janus Henderson Fund relative to its benchmark index over the measurement period; and a few Janus Henderson Funds have fee schedules with breakpoints and reduced fee rates above certain asset levels. The Trustees also noted that the Janus Henderson Funds share directly in economies of scale through the lower charges of third-party service providers that are based in part on the combined scale of all of the Janus Henderson Funds.
The Trustees also considered information provided by the independent fee consultant, which concluded that, given the limitations of various analytical approaches to economies of scale it had considered in prior years, and their conflicting results, it is difficult to analytically confirm or deny the existence of economies of scale in the Janus Henderson complex. The independent consultant further concluded that (1) to the extent there were economies of scale at Janus Capital, Janus Capital’s general strategy of setting fixed management fees below peers appeared to share any such economies with investors even on smaller Janus Henderson Funds which have not yet achieved those economies and (2) by setting lower fixed fees from the start on these Janus Henderson Funds, Janus Capital appeared to be investing to increase the likelihood that these Janus Henderson Funds will grow to a level to achieve any scale economies that may exist. Further, the independent fee consultant expressed the view that Janus Henderson Fund investors are well-served by the performance fee structures in place on the Janus Henderson Funds in light of any economies of scale that may be present at Janus Capital.
Based on all of the information they reviewed, including past research and analysis conducted by the Trustees’ independent fee consultant, the Trustees concluded that the current fee structure of each Janus Henderson Fund was reasonable and that the current rates of fees do reflect a sharing between Janus Capital and the Janus Henderson Fund of any economies of scale that may be present at the current asset level of the Janus Henderson Fund.
Other Benefits to Janus Capital
The Trustees also considered benefits that accrue to Janus Capital and its affiliates and subadvisers to the Janus Henderson Funds from their relationships with the Janus Henderson Funds. They recognized that two affiliates of Janus Capital separately serve the Janus Henderson Funds as transfer agent and distributor, respectively, and the transfer agent receives compensation directly from the non-money market funds for services provided, and that such compensation contributes to the overall profitability of Janus Capital and its affiliates that results from their relationship with the Janus Henderson Funds. The Trustees also considered Janus Capital’s and each subadviser’s past and proposed use of commissions paid by the Janus Henderson Funds on portfolio brokerage transactions to obtain proprietary and third-party research products and services benefiting the Janus Henderson Fund and/or other clients of Janus Capital and/or Janus Capital, and/or a subadviser to a Janus Henderson Fund. The Trustees concluded that Janus Capital’s and the subadvisers’ use of these types of client commission arrangements to obtain proprietary and third-party research products and services was likely to benefit each Janus Henderson Fund. The Trustees also concluded that, other than the services provided by Janus Capital and its affiliates and subadvisers pursuant to the agreements and the fees to be paid by each Janus Henderson Fund therefor, the Janus Henderson Funds and Janus Capital and the subadvisers may potentially benefit from their relationship with each other in other ways. They concluded that Janus Capital and its affiliates share directly in economies of scale through the lower charges of third-party service providers that are based in part on the combined scale of the Janus Henderson Funds and other clients
Janus Investment Fund | 43 |
Janus Henderson Asia Equity Fund
Additional Information (unaudited)
serviced by Janus Capital and its affiliates. They also concluded that Janus Capital and/or the subadvisers benefit from the receipt of research products and services acquired through commissions paid on portfolio transactions of the Janus Henderson Funds and that the Janus Henderson Funds benefit from Janus Capital’s and/or the subadvisers’ receipt of those products and services as well as research products and services acquired through commissions paid by certain other clients of Janus Capital and/or other clients of the subadvisers. They further concluded that the success of any Janus Henderson Fund could attract other business to Janus Capital, the subadvisers or other Janus Henderson funds, and that the success of Janus Capital and the subadvisers could enhance Janus Capital’s and the subadvisers’ ability to serve the Janus Henderson Funds.
Approval of an Amended and Restated Investment Advisory Agreement for Janus Henderson Small-Mid Cap Value Fund (formerly, Janus Henderson Select Value Fund)
Janus Capital Management LLC (“Janus Capital”) met with the Trustees, each of whom serves as an “independent” Trustee (the “Trustees”), on December 5, 2018 and March 14, 2019, to discuss the Amended and Restated Investment Advisory Agreement (the “Amended Advisory Agreement”) for Janus Henderson Small-Mid Cap Value Fund (formerly, Janus Henderson Select Value Fund) (“Small-Mid Cap Value Fund”) and other matters related to investment strategy changes to shift the market capitalization focus of Small-Mid Cap Value Fund (the “Strategy Change”). At these meetings, the Trustees discussed the Amended Advisory Agreement and the Strategy Change with their independent counsel, separately from management. During the course of the meetings, the Trustees requested and considered such information as they deemed relevant to their deliberations. At the meeting held on March 14, 2019, the Trustees, upon the recommendation of Janus Capital, voted unanimously to approve the Amended Advisory Agreement for Small-Mid Cap Value Fund, and recommended that the Amended Advisory Agreement be submitted to shareholders for approval. The Trustees also approved matters related to the Strategy Change, effective upon approval of the Amended Advisory Agreement by the Fund’s shareholders.
In determining whether to approve the Amended Advisory Agreement, the Trustees noted their most recent consideration of Small-Mid Cap Value Fund’s current advisory agreement (the “Current Advisory Agreement”) as part of the Trustees’ annual review and consideration of whether to continue the investment advisory agreement and sub-advisory agreement, as applicable, for each Janus Henderson fund, including Small-Mid Cap Value Fund (the “Annual Review”). The Trustees noted that in connection with the Annual Review: (i) the Trustees received and reviewed information provided by Janus Capital and each sub-adviser, including Perkins Investment Management LLC (“Perkins”), in response to requests of the Trustees and their independent legal counsel, and also received and reviewed information and analysis provided by, and in response to requests of, their independent fee consultant; and (ii) throughout the Annual Review, the Trustees were advised by their independent legal counsel. The Trustees also noted that based on the Trustees’ evaluation of the information provided by Janus Capital, Perkins, and the independent fee consultant, as well as other information, the Trustees determined that the overall arrangements between Small-Mid Cap Value Fund and Janus Capital and Perkins were fair and reasonable in light of the nature, extent and quality of the services provided by Janus Capital, its affiliates and Perkins, the fees charged for those services, and other matters that the Trustees considered relevant in the exercise of their business judgment, and the Trustees unanimously approved the continuation of the Current Advisory Agreement for another year.
In considering the Amended Advisory Agreement, the Trustees reviewed and analyzed various factors that they determined were relevant, including the factors described below, none of which by itself was considered dispositive. However, the material factors and conclusions that formed the basis for the Trustees’ determination to approve the Amended Advisory Agreement are discussed separately below.
· The Trustees determined that the terms of the Amended Advisory Agreement are substantially similar to those of the Current Advisory Agreement, which the Trustees recently reviewed as part of the Annual Review, and the material changes made to the Amended Advisory Agreement address the proposed change to the benchmark index and the description of the period used for calculating the performance fee in order to allow for continuity of the fee based on Small-Mid Cap Value Fund’s historical performance over a 36-month measurement period.
· As part of the Strategy Change, Small-Mid Cap Value Fund will focus its investments on common stocks of companies that are small- and mid-capitalization stocks. The Trustees determined that the proposed benchmark index, the Russell 2500TM Value Index, is more closely aligned with a small- and mid-cap stock focus than Small-Mid Cap Value Fund’s current benchmark index, the Russell 3000® Value Index.
44 | SEPTEMBER 30, 2019 |
Janus Henderson Asia Equity Fund
Additional Information (unaudited)
· Under the Amended Advisory Agreement, the structure of the performance fee was not changing, other than to utilize a different benchmark and performance calculation period to implement the new benchmark over time, and that this structure had been implemented initially for Small-Mid Cap Value Fund based on analysis provided by the independent fee consultant. The Trustees considered the information provided by Janus Capital in this regard, and noted Janus Capital’s belief that this performance fee structure remained reasonable and appropriate for Small-Mid Cap Value Fund. The Trustees concluded that this performance fee structure was reasonable for Small-Mid Cap Value Fund as proposed, and also determined to seek further analysis from their independent fee consultant with respect to this matter. In this regard, Janus Capital agreed to consider further revisions to the proposed performance fee structure should that be needed based on the additional analysis provided.
· As part of the Strategy Change, Perkins will continue to provide sub-advisory services to Small-Mid Cap Value Fund, but will utilize new portfolio managers to implement Small-Mid Cap Value Fund’s focus on common stocks of companies that are small- and mid-capitalization stocks. In this regard, the Trustees noted the information provided by Janus Capital with respect to the qualifications and experience of the new portfolio managers implementing investment strategies similar to the one to be utilized by Small-Mid Cap Value Fund, and also noted that Perkins and the new portfolio managers provide sub-advisory services to other Janus Henderson funds the Trustees oversee.
· The information provided by Janus Capital with respect to (i) the impact of the Amended Advisory Agreement on the potential advisory fees to be paid by Small-Mid Cap Value Fund going forward; and (ii) the potential transaction costs and capital gains to be incurred by Small-Mid Cap Value Fund as part of the efforts to reposition Small-Mid Cap Value Fund’s portfolio to focus its investments on common stocks of companies that are small- and mid-capitalization stocks. In this regard, the Trustees noted that Small-Mid Cap Value Fund’s operating costs were not expected otherwise to materially change under the Amended Advisory Agreement.
· Janus Capital’s reasons for seeking to implement the Strategy Change, including Janus Capital’s belief that current marketplace demands for a small and mid-cap strategy, combined with Perkins’ experience in managing small- and mid-cap stocks, will provide greater opportunity for Small-Mid Cap Value Fund to grow over the long-term, and that the Strategy Change is designed to create asset growth through increased sales for Small-Mid Cap Value Fund, potentially resulting in increased operational efficiencies for Small-Mid Cap Value Fund.
· Janus Capital will pay the fees and expenses related to seeking shareholder approval of the Amended Advisory Agreement, including the costs related to the preparation and distribution of proxy materials, and all other costs incurred in connection with the solicitation of proxies.
After discussion, the Trustees determined that the overall arrangements between Small-Mid Cap Value Fund, Janus Capital, and Perkins under the Amended Advisory Agreement would continue to be fair and reasonable in light of the nature, extent, and quality of the services expected to be provided by Janus Capital, its affiliates, and Perkins following the Strategy Change.
Janus Investment Fund | 45 |
Janus Henderson Asia Equity Fund
Useful Information About Your Fund Report (unaudited)
The Management Commentary in this report includes valuable insight as well as statistical information to help you understand how your Fund’s performance and characteristics stack up against those of comparable indices.
If the Fund invests in foreign securities, this report may include information about country exposure. Country exposure is based primarily on the country of risk. A company may be allocated to a country based on other factors such as location of the company’s principal office, the location of the principal trading market for the company’s securities, or the country where a majority of the company’s revenues are derived.
Please keep in mind that the opinions expressed in the Management Commentary are just that: opinions. They are a reflection based on best judgment at the time this report was compiled, which was September 30, 2019. As the investing environment changes, so could opinions. These views are unique and are not necessarily shared by fellow employees or by Janus Henderson in general.
Performance Overviews
Performance overview graphs compare the performance of a hypothetical $10,000 investment in the Fund with one or more widely used market indices. When comparing the performance of the Fund with an index, keep in mind that market indices are not available for investment and do not reflect deduction of expenses.
Average annual total returns are quoted for a Fund with more than one year of performance history. Average annual total return is calculated by taking the growth or decline in value of an investment over a period of time, including reinvestment of dividends and distributions, then calculating the annual compounded percentage rate that would have produced the same result had the rate of growth been constant throughout the period. Average annual total return does not reflect the deduction of taxes that a shareholder would pay on Fund distributions or redemptions of Fund shares.
Cumulative total returns are quoted for a Fund with less than one year of performance history. Cumulative total return is the growth or decline in value of an investment over time, independent of the period of time involved. Cumulative total return does not reflect the deduction of taxes that a shareholder would pay on Fund distributions or redemptions of Fund shares.
Pursuant to federal securities rules, expense ratios shown in the performance chart reflect subsidized (if applicable) and unsubsidized ratios. The total annual fund operating expenses ratio is gross of any fee waivers, reflecting the Fund’s unsubsidized expense ratio. The net annual fund operating expenses ratio (if applicable) includes contractual waivers of Janus Capital and reflects the Fund’s subsidized expense ratio. Ratios may be higher or lower than those shown in the “Financial Highlights” in this report.
Schedule of Investments
Following the performance overview section is the Fund’s Schedule of Investments. This schedule reports the types of securities held in the Fund on the last day of the reporting period. Securities are usually listed by type (common stock, corporate bonds, U.S. Government obligations, etc.) and by industry classification (banking, communications, insurance, etc.). Holdings are subject to change without notice.
The value of each security is quoted as of the last day of the reporting period. The value of securities denominated in foreign currencies is converted into U.S. dollars.
If the Fund invests in foreign securities, it will also provide a summary of investments by country. This summary reports the Fund exposure to different countries by providing the percentage of securities invested in each country. The country of each security represents the country of risk. The Fund’s Schedule of Investments relies upon the industry group and country classifications published by Barclays and/or MSCI Inc.
Tables listing details of individual forward currency contracts, futures, written options, swaptions, and swaps follow the Fund’s Schedule of Investments (if applicable).
Statement of Assets and Liabilities
This statement is often referred to as the “balance sheet.” It lists the assets and liabilities of the Fund on the last day of the reporting period.
46 | SEPTEMBER 30, 2019 |
Janus Henderson Asia Equity Fund
Useful Information About Your Fund Report (unaudited)
The Fund’s assets are calculated by adding the value of the securities owned, the receivable for securities sold but not yet settled, the receivable for dividends declared but not yet received on securities owned, and the receivable for Fund shares sold to investors but not yet settled. The Fund’s liabilities include payables for securities purchased but not yet settled, Fund shares redeemed but not yet paid, and expenses owed but not yet paid. Additionally, there may be other assets and liabilities such as unrealized gain or loss on forward currency contracts.
The section entitled “Net Assets Consist of” breaks down the components of the Fund’s net assets. Because the Fund must distribute substantially all earnings, you will notice that a significant portion of net assets is shareholder capital.
The last section of this statement reports the net asset value (“NAV”) per share on the last day of the reporting period. The NAV is calculated by dividing the Fund’s net assets for each share class (assets minus liabilities) by the number of shares outstanding.
Statement of Operations
This statement details the Fund’s income, expenses, realized gains and losses on securities and currency transactions, and changes in unrealized appreciation or depreciation of Fund holdings.
The first section in this statement, entitled “Investment Income,” reports the dividends earned from securities and interest earned from interest-bearing securities in the Fund.
The next section reports the expenses incurred by the Fund, including the advisory fee paid to the investment adviser, transfer agent fees and expenses, and printing and postage for mailing statements, financial reports and prospectuses. Expense offsets and expense reimbursements, if any, are also shown.
The last section lists the amounts of realized gains or losses from investment and foreign currency transactions, and changes in unrealized appreciation or depreciation of investments and foreign currency-denominated assets and liabilities. The Fund will realize a gain (or loss) when it sells its position in a particular security. A change in unrealized gain (or loss) refers to the change in net appreciation or depreciation of the Fund during the reporting period. “Net Realized and Unrealized Gain/(Loss) on Investments” is affected both by changes in the market value of Fund holdings and by gains (or losses) realized during the reporting period.
Statements of Changes in Net Assets
These statements report the increase or decrease in the Fund’s net assets during the reporting period. Changes in the Fund’s net assets are attributable to investment operations, dividends and distributions to investors, and capital share transactions. This is important to investors because it shows exactly what caused the Fund’s net asset size to change during the period.
The first section summarizes the information from the Statement of Operations regarding changes in net assets due to the Fund’s investment operations. The Fund’s net assets may also change as a result of dividend and capital gains distributions to investors. If investors receive their dividends and/or distributions in cash, money is taken out of the Fund to pay the dividend and/or distribution. If investors reinvest their dividends and/or distributions, the Fund’s net assets will not be affected. If you compare the Fund’s “Net Decrease from Dividends and Distributions” to “Reinvested Dividends and Distributions,” you will notice that dividends and distributions have little effect on the Fund’s net assets. This is because the majority of the Fund’s investors reinvest their dividends and/or distributions.
The reinvestment of dividends and distributions is included under “Capital Share Transactions.” “Capital Shares” refers to the money investors contribute to the Fund through purchases or withdrawals via redemptions. The Fund’s net assets will increase and decrease in value as investors purchase and redeem shares from the Fund.
Financial Highlights
This schedule provides a per-share breakdown of the components that affect the Fund’s NAV for current and past reporting periods as well as total return, asset size, ratios, and portfolio turnover rate.
The first line in the table reflects the NAV per share at the beginning of the reporting period. The next line reports the net investment income/(loss) per share. Following is the per share total of net gains/(losses), realized and unrealized. Per share dividends and distributions to investors are then subtracted to arrive at the NAV per share at the end of the period. The next line reflects the total return for the period. The total return may include adjustments in accordance with generally accepted accounting principles required at the period end for financial reporting purposes. As a result, the
Janus Investment Fund | 47 |
Janus Henderson Asia Equity Fund
Useful Information About Your Fund Report (unaudited)
total return may differ from the total return reflected for individual shareholder transactions. Also included are ratios of expenses and net investment income to average net assets.
The Fund’s expenses may be reduced through expense offsets and expense reimbursements. The ratios shown reflect expenses before and after any such offsets and reimbursements.
The ratio of net investment income/(loss) summarizes the income earned less expenses, divided by the average net assets of the Fund during the reporting period. Do not confuse this ratio with the Fund’s yield. The net investment income ratio is not a true measure of the Fund’s yield because it does not take into account the dividends distributed to the Fund’s investors.
The next figure is the portfolio turnover rate, which measures the buying and selling activity in the Fund. Portfolio turnover is affected by market conditions, changes in the asset size of the Fund, fluctuating volume of shareholder purchase and redemption orders, the nature of the Fund’s investments, and the investment style and/or outlook of the portfolio manager(s) and/or investment personnel. A 100% rate implies that an amount equal to the value of the entire portfolio was replaced once during the fiscal year; a 50% rate means that an amount equal to the value of half the portfolio is traded in a year; and a 200% rate means that an amount equal to the value of the entire portfolio is traded every six months.
48 | SEPTEMBER 30, 2019 |
Janus Henderson Asia Equity Fund
Designation Requirements (unaudited)
For federal income tax purposes, the Fund designated the following for the year ended September 30, 2019:
| |
Capital Gain Distributions | $1,424,254 |
Foreign Taxes Paid | $55,961 |
Foreign Source Income | $503,147 |
Qualified Dividend Income Percentage | 100% |
Janus Investment Fund | 49 |
Janus Henderson Asia Equity Fund
Trustees and Officers (unaudited)
The Fund’s Statement of Additional Information includes additional information about the Trustees and officers and is available, without charge, by calling 1-877-335-2687.
The following are the Trustees and officers of the Trust, together with a brief description of their principal occupations during the last five years (principal occupations for certain Trustees may include periods over five years).
Each Trustee has served in that capacity since he or she was originally elected or appointed. The Trustees do not serve a specified term of office. Each Trustee will hold office until the termination of the Trust or his or her earlier death, resignation, retirement, incapacity, or removal. Under the Fund’s Governance Procedures and Guidelines, the policy is for Trustees to retire no later than the end of the calendar year in which the Trustee turns 75. The Trustees review the Fund’s Governance Procedures and Guidelines from time to time and may make changes they deem appropriate. The Fund’s Nominating and Governance Committee will consider nominees for the position of Trustee recommended by shareholders. Shareholders may submit the name of a candidate for consideration by the Committee by submitting their recommendations to the Trust’s Secretary. Each Trustee is currently a Trustee of one other registered investment company advised by Janus Capital: Janus Aspen Series. Collectively, these two registered investment companies consist of 58 series or funds referred to herein as the Fund Complex.
The Trust’s officers are elected annually by the Trustees for a one-year term. Certain officers also serve as officers of Janus Aspen Series. Certain officers of the Fund may also be officers and/or directors of Janus Capital. Except as otherwise disclosed, Fund officers receive no compensation from the Fund, except for the Fund’s Chief Compliance Officer, as authorized by the Trustees.
50 | SEPTEMBER 30, 2019 |
Janus Henderson Asia Equity Fund
Trustees and Officers (unaudited)
TRUSTEES | |||||
Name, Address, and Age | Positions Held with the Trust | Length of Time Served | Principal Occupations During the Past Five Years | Number of Portfolios/Funds in Fund Complex Overseen by Trustee | Other Directorships Held by Trustee During the Past Five Years |
Independent Trustees | |||||
William F. McCalpin | Chairman | 1/08-Present | Managing Partner, Impact Investments, Athena Capital Advisors LLC (independent registered investment advisor) (since 2016). Formerly, Managing Director, Holos Consulting LLC (provides consulting services to foundations and other nonprofit organizations) (2009-2016), Chief Executive Officer, Imprint Capital Advisors (impact investment firm) (2013-2015), and Executive Vice President and Chief Operating Officer of The Rockefeller Brothers Fund (a private family foundation) (1998-2006). | 58 | Director of Mutual Fund Directors Forum (a non-profit organization serving independent directors of U.S. mutual funds) (since 2016), Chairman of the Board and Trustee of The Investment Fund for Foundations Investment Program (TIP) (consisting of 2 funds) (since 2008), and Director of the F.B. Heron Foundation (a private grantmaking foundation) (since 2006). |
Janus Investment Fund | 51 |
Janus Henderson Asia Equity Fund
Trustees and Officers (unaudited)
TRUSTEES | |||||
Name, Address, and Age | Positions Held with the Trust | Length of Time Served | Principal Occupations During the Past Five Years | Number of Portfolios/Funds in Fund Complex Overseen by Trustee | Other Directorships Held by Trustee During the Past Five Years |
Independent Trustees | |||||
Alan A. Brown | Trustee | 1/13-Present | Principal, Curam Holdings (since 2018). Formerly, Executive Vice President, Institutional Markets, of Black Creek Group (private equity real estate investment management firm) (2012-2018), Executive Vice President and Co-Head, Global Private Client Group (2007-2010), Executive Vice President, Mutual Funds (2005-2007), and Chief Marketing Officer (2001-2005) of Nuveen Investments, Inc. (asset management). | 58 | Director of WTTW (PBS affiliate) (since 2003). Formerly, Director of MotiveQuest LLC (strategic social market research company) (2003-2016), Director of Nuveen Global Investors LLC (2007-2011), Director of Communities in Schools (2004-2010), and Director of Mutual Fund Education Alliance (until 2010). |
52 | SEPTEMBER 30, 2019 |
Janus Henderson Asia Equity Fund
Trustees and Officers (unaudited)
TRUSTEES | |||||
Name, Address, and Age | Positions Held with the Trust | Length of Time Served | Principal Occupations During the Past Five Years | Number of Portfolios/Funds in Fund Complex Overseen by Trustee | Other Directorships Held by Trustee During the Past Five Years |
Independent Trustees | |||||
William D. Cvengros | Trustee | 1/11-Present | Chief Executive Officer of SJC Capital, LLC (a personal investment company and consulting firm) (since 2002). Formerly, Venture Partner for The Edgewater Funds (a middle market private equity firm) (2002-2004), Chief Executive Officer and President of PIMCO Advisors Holdings L.P. (a publicly traded investment management firm) (1994-2000), and Chief Investment Officer (1987-1994) and Vice Chairman and Director (1990-1994) of Pacific Life Insurance Company (a mutual life insurance and annuity company) (1987-1994). | 58 | Advisory Board Member, Innovate Partners Emerging Growth and Equity Fund I (early stage venture capital fund) (since 2014). Formerly, Managing Trustee of National Retirement Partners Liquidating Trust (2013-2016), Chairman, National Retirement Partners, Inc. (formerly a network of advisors to 401(k) plans) (2005-2013), Director of Prospect Acquisition Corp. (a special purpose acquisition corporation) (2007-2009), Director of RemedyTemp, Inc. (temporary help services company) (1996-2006), and Trustee of PIMCO Funds Multi-Manager Series (1990-2000) and Pacific Life Variable Life & Annuity Trusts (1987-1994). |
Janus Investment Fund | 53 |
Janus Henderson Asia Equity Fund
Trustees and Officers (unaudited)
TRUSTEES | |||||
Name, Address, and Age | Positions Held with the Trust | Length of Time Served | Principal Occupations During the Past Five Years | Number of Portfolios/Funds in Fund Complex Overseen by Trustee | Other Directorships Held by Trustee During the Past Five Years |
Independent Trustees | |||||
Raudline Etienne | Trustee | 6/16-Present | Founder, Daraja Capital (advisory and investment firm) (since 2016), and Senior Advisor, Albright Stonebridge Group LLC (global strategy firm) (since 2016). Formerly, Senior Vice President (2011-2015), Albright Stonebridge Group LLC, and Deputy Comptroller and Chief Investment Officer, New York State Common Retirement Fund (public pension fund) (2008-2011). | 58 | Board Member, Van Alen Institute (nonprofit architectural and design organization) (since 2019), and Director of Brightwood Capital Advisors, LLC (since 2014). |
William M. | Trustee | 9/19-Present | Founder, Fitzgerald Asset | 58 | Board of Directors, Municipal |
54 | SEPTEMBER 30, 2019 |
Janus Henderson Asia Equity Fund
Trustees and Officers (unaudited)
TRUSTEES | |||||
Name, Address, and Age | Positions Held with the Trust | Length of Time Served | Principal Occupations During the Past Five Years | Number of Portfolios/Funds in Fund Complex Overseen by Trustee | Other Directorships Held by Trustee During the Past Five Years |
Independent Trustees | |||||
Gary A. Poliner | Trustee | 6/16-Present | Retired. Formerly, President (2010-2013) of Northwestern Mutual Life Insurance Company. | 58 | Director of MGIC Investment Corporation (private mortgage insurance) (since 2013) and West Bend Mutual Insurance Company (property/casualty insurance) (since 2013). Formerly, Trustee of Northwestern Mutual Life Insurance Company (2010-2013), and Director of Frank Russell Company (global asset management firm) (2008-2013). |
William D. Stewart | Trustee | 6/84-Present | Retired. Formerly, President and founder of HPS Products and Corporate Vice President of MKS Instruments, Boulder, CO (a provider of advanced process control systems for the semiconductor industry) (1976-2012). | 58 | None |
Janus Investment Fund | 55 |
Janus Henderson Asia Equity Fund
Trustees and Officers (unaudited)
TRUSTEES | |||||
Name, Address, and Age | Positions Held with the Trust | Length of Time Served | Principal Occupations During the Past Five Years | Number of Portfolios/Funds in Fund Complex Overseen by Trustee | Other Directorships Held by Trustee During the Past Five Years |
Independent Trustees | |||||
Diane L. Wallace | Trustee | 6/17-Present | Retired. | 58 | Formerly, Independent Trustee, Henderson Global Funds (13 portfolios) (2015-2017), Independent Trustee, State Farm Associates' Funds Trust, State Farm Mutual Fund Trust, and State Farm Variable Product Trust (28 portfolios) (2013-2017), Chief Operating Officer, Senior Vice President-Operations, and Chief Financial Officer for Driehaus Capital Management, LLC (1988-2006), and Treasurer for Driehaus Mutual Funds (1996-2002). |
56 | SEPTEMBER 30, 2019 |
Janus Henderson Asia Equity Fund
Trustees and Officers (unaudited)
TRUSTEES | |||||
Name, Address, and Age | Positions Held with the Trust | Length of Time Served | Principal Occupations During the Past Five Years | Number of Portfolios/Funds in Fund Complex Overseen by Trustee | Other Directorships Held by Trustee During the Past Five Years |
Independent Trustees | |||||
Linda S. Wolf | Trustee | 11/05-Present | Retired. Formerly, Chairman and Chief Executive Officer of Leo Burnett (Worldwide) (advertising agency) (2001-2005). | 58 | Director of Chicago Community Trust (Regional Community Foundation), Chicago Council on Global Affairs, InnerWorkings (U.S. provider of print procurement solutions to corporate clients), Lurie Children’s Hospital (Chicago, IL), Shirley Ryan Ability Lab and Wrapports, LLC (digital communications company). Formerly, Director of Walmart (until 2017), Director of Chicago Convention & Tourism Bureau (until 2014) and The Field Museum of Natural History (Chicago, IL) (until 2014). |
Janus Investment Fund | 57 |
Janus Henderson Asia Equity Fund
Trustees and Officers (unaudited)
OFFICERS | |||
Name, Address, and Age | Positions Held with the Trust | Term of Office* and Length of Time Served | Principal Occupations During the Past Five Years |
Andrew Gillan | Executive Vice President and Co-Portfolio Manager Janus Henderson Asia Equity Fund | 6/17-Present | Head of Asia (ex-Japan) Equities of Janus Henderson Investors and Portfolio Manager for other Janus Henderson accounts. Formerly, Senior Investment Manager at Aberdeen Asset Management (2001-2013). |
Mervyn Koh | Executive Vice President and Co-Portfolio Manager Janus Henderson Asia Equity Fund | 6/17-Present | Portfolio Manager on the Asia Equity strategy of Janus Henderson Investors and Portfolio Manager for other Janus Henderson accounts. Formerly, Vice President of Emerging Markets Group of Franklin Templeton Investments (2010-2015). |
* Officers are elected at least annually by the Trustees for a one-year term and may also be elected from time to time by the Trustees for an interim period. | |||
58 | SEPTEMBER 30, 2019 |
Janus Henderson Asia Equity Fund
Trustees and Officers (unaudited)
OFFICERS | |||
Name, Address, and Age | Positions Held with the Trust | Term of Office* and Length of Time Served | Principal Occupations During the Past Five Years |
Bruce L. Koepfgen | President and Chief Executive Officer | 7/14-Present | Executive Vice President, Head of North America at Janus Henderson Investors and Janus Capital Management LLC (since 2017), Executive Vice President and Director of Janus International Holding LLC (since 2011), Executive Vice President of Janus Distributors LLC (since 2011), Vice President and Director of Intech Investment Management LLC (since 2011), Executive Vice President and Director of Perkins Investment Management LLC (since 2011), and President and Director of Janus Management Holdings Corporation (since 2011). Formerly, President of Janus Capital Group Inc. and Janus Capital Management LLC (2013-2017), Executive Vice President of Janus Services LLC (2011-2015), Janus Capital Group Inc. and Janus Capital Management LLC (2011-2013), and Chief Financial Officer of Janus Capital Group Inc., Janus Capital Management LLC, Janus Distributors LLC, Janus Management Holdings Corporation, and Janus Services LLC (2011-2013). |
* Officers are elected at least annually by the Trustees for a one-year term and may also be elected from time to time by the Trustees for an interim period. | |||
Janus Investment Fund | 59 |
Janus Henderson Asia Equity Fund
Trustees and Officers (unaudited)
OFFICERS | |||
Name, Address, and Age | Positions Held with the Trust | Term of Office* and Length of Time Served | Principal Occupations During the Past Five Years |
Susan K. Wold | Vice President, Chief Compliance Officer, and Anti-Money Laundering Officer | 9/17-Present | Head of Compliance, North America for Janus Henderson (since September 2017). Formerly, Vice President, Head of Global Corporate Compliance, and Chief Compliance Officer for Janus Capital Management LLC (May 2017-September 2017), Vice President, Compliance at Janus Capital Group Inc. and Janus Capital Management LLC (2005-2017). |
Jesper Nergaard 151 Detroit Street Denver, CO 80206 DOB: 1962 | Chief Financial Officer Vice President, Treasurer, and Principal Accounting Officer | 3/05-Present 2/05-Present | Vice President of Janus Capital and Janus Services LLC. |
Kathryn L. Santoro | Vice President, Chief Legal Counsel, and Secretary | 12/16-Present | Assistant General Counsel of Janus Capital (since 2016). Formerly, Vice President and Associate Counsel of Curian Capital, LLC and Curian Clearing LLC (2013-2016), and General Counsel and Secretary (2011-2012) and Vice President (2009-2012) of Old Mutual Capital, Inc. |
* Officers are elected at least annually by the Trustees for a one-year term and may also be elected from time to time by the Trustees for an interim period. | |||
60 | SEPTEMBER 30, 2019 |
Janus Henderson Asia Equity Fund
Notes
NotesPage1
Janus Investment Fund | 61 |
Knowledge. Shared
At Janus Henderson, we believe in the sharing of expert insight for better investment and business decisions. We call this ethos Knowledge. Shared.
Learn more by visiting janushenderson.com.
| ||||||||
This report is submitted for the general information of shareholders of the Fund. It is not an offer or solicitation for the Fund and is not authorized for distribution to prospective investors unless preceded or accompanied by an effective prospectus. | ||||||||
Janus Henderson, Janus, Henderson, Perkins, Intech and Knowledge. Shared are trademarks of Janus Henderson Group plc or one of its subsidiaries. © Janus Henderson Group plc. Janus Henderson Distributors | ||||||||
125-02-93036 11-19 | ||||||||

ANNUAL REPORT September 30, 2019 | |||
Janus Henderson Balanced Fund | |||
Janus Investment Fund | |||
Beginning on January 1, 2021, as permitted by regulations adopted by the Securities and Exchange Commission, paper copies of the Fund’s shareholder reports will no longer be sent by mail, unless you specifically request paper copies of the reports from the Fund or your plan sponsor, broker-dealer, or financial intermediary, or if you invest directly with the Fund, by contacting a Janus Henderson representative. Instead, the reports will be made available on a website, and you will be notified by mail each time a report is posted and provided with a website link to access the report. If you already elected to receive shareholder reports electronically, you will not be affected by this change and you need not take any action. You may elect to receive shareholder reports and other communications from the Fund electronically by contacting your plan sponsor, broker-dealer, or financial intermediary, or if you invest directly with the Fund, by visiting janushenderson.com/edelivery. You may elect to receive all future reports in paper free of charge. If you do not invest directly with the Fund, you should contact your plan sponsor, broker-dealer, or financial intermediary, to request to continue receiving paper copies of your shareholder reports. If you invest directly with the Fund, you can call 1-800-525-3713 to let the Fund know that you wish to continue receiving paper copies of your shareholder reports. Your election to receive reports in paper will apply to all Janus Henderson mutual funds where held (i.e., all Janus Henderson mutual funds held in your account if you invest through your financial intermediary or all Janus Henderson mutual funds held with the fund complex if you invest directly with a fund).
| |||
HIGHLIGHTS · Portfolio management perspective · Investment strategy behind your fund · Fund performance, characteristics | |||
|

Table of Contents
Janus Henderson Balanced Fund
Janus Henderson Balanced Fund (unaudited)


PERFORMANCE SUMMARY
Janus Henderson Balanced Fund’s Class I Shares returned 8.02% for the 12-month period ended September 30, 2019. That compares with 4.25% for the Fund’s primary benchmark, the S&P 500® Index, and 10.30% for the Fund’s secondary benchmark, the Bloomberg Barclays U.S. Aggregate Bond Index. The Balanced Index, an internally calculated benchmark composed of a 55% weighting in the S&P 500 Index and a 45% weighting in the Bloomberg Barclays U.S. Aggregate Bond Index, returned 7.41%.
INVESTMENT ENVIRONMENT
The period began with a sense of nervousness as investors navigated myriad economic and political concerns. Fears of slowing global economic growth, U.S.-China trade relations, a potential policy misstep by the Federal Reserve (Fed) and the risk of a disorderly “Brexit” all played a role in heightened market volatility. Equities fell sharply at the end of 2018 and then rebounded in the early months of 2019. The recovery was driven in large part by the Fed, which pivoted its monetary policy, pausing rate hikes and indicating it would be more accommodative to sustain economic growth. Despite a resilient U.S. economy and continued consumer strength, the Fed responded to weaker manufacturing data and risks of slowing global growth with two interest rate cuts later in the period. Treasury yields fell significantly over the period, and equity sectors tied to rates, such as utilities and real estate, performed best. Stocks tied to global trade and the strong U.S. dollar, such as energy, generally struggled. Many health care stocks also performed poorly as the 2020 U.S. presidential election and rhetoric around Medicare for All policies generated uncertainty.
Despite an early-period sell-off and a few bouts of volatility, corporate credit performed well. Falling rates, persistently strong corporate earnings and a positive technical backdrop from limited new issuance supported the asset class. High yield was hit harder by intra-period volatility and underperformed investment grade. The U.S. Treasury yield curve flattened and became partially inverted for much of the period. The yield on the 10-year Treasury note ended September at 1.66%, down from 3.06% one year ago.
PERFORMANCE DISCUSSION
The Fund, which seeks to provide more consistent returns over time by allocating across the spectrum of fixed income and equity securities, outperformed the Balanced Index, its blended benchmark of the S&P 500 Index (55%) and the Bloomberg Barclays U.S. Aggregate Bond Index (45%). The Fund outperformed its primary benchmark, the S&P 500 Index, but underperformed its secondary benchmark, the Bloomberg Barclays U.S. Aggregate Bond Index.
Our equity-to-fixed income allocation ended the period approximately 63% equities, 37% fixed income and a small position in cash, compared with roughly 61% equities, 39% fixed income and the remainder in cash as of September 30, 2018. The equity allocation may vary based on market conditions, and our positioning reflects our belief that equities offered greater risk-adjusted opportunities versus fixed income throughout the period. While we are cognizant of the many potential headwinds, we remain focused on companies that are focused on innovation, which we believe are less susceptible to macro headwinds and can grow despite these scenarios. Going forward, the equity weighting will continue to be dynamic, based on market conditions and the investment opportunities our teams identify across asset classes.
The Fund’s equity sleeve outperformed the S&P 500 Index. Outperformance was led by strong stock selection in the information technology and consumer discretionary sectors. An underweight to the poor-performing energy sector also aided results.
Microsoft led absolute contributors. The company’s Azure cloud platform and subscription-based Office 365 Suite continue to grow, and the demand outlook for these
Janus Investment Fund | 1 |
Janus Henderson Balanced Fund (unaudited)
products remains robust. Microsoft’s consistent revenue growth is commendable for a company its size and we admire the consistency with which it returns capital to shareholders.
Mastercard was another top contributor on an absolute basis. The company is growing faster than its competition and benefiting from smart acquisitions and its fixed-cost business model, which is resulting in high incremental margins. Payments companies continue to benefit as credit cards and electronic payments grow in popularity among consumers and businesses, and we believe Mastercard is particularly well positioned given the majority of its revenues are generated outside the U.S., where many markets have a lower penetration of card and electronic payments and are experiencing significantly faster electronic purchase volume growth.
Other positions detracted for the period. At the sector level, our lack of exposure to the strong-performing utilities sector, which tends to not meet our earnings growth requirements, held back relative performance. Stock selection in the consumer staples sector also weighed on results.
Altria Group was the largest individual detractor. The stock fell as vaporizing-related illnesses made headlines throughout the period, and certain states introduced legislation to prohibit sales of flavored e-cigarettes. While its investment in vaporizer company Juul has been disappointing, we believe the cost of that investment is already reflected in Altria’s financials, and management recently reiterated forward-looking earnings growth guidance. Also, the decline in cigarette volumes has stabilized and Altria has been able to raise prices on its tobacco products. We believe the company can achieve modest growth in the dividend.
Managed health care company UnitedHealth Group was another detractor. Rhetoric around Medicare for All policies pressured the HMO industry during the period. We continue to have a strong opinion of UnitedHealth’s fundamentals and its future growth prospects.
The Fund’s fixed income sleeve underperformed the Bloomberg Barclays U.S. Aggregate Bond Index. The sleeve’s out-of-index allocation to high-yield corporate credit generated positive performance, but it led relative detractors given the asset class underperformed many index constituents. High-yield positions in exploration and production company Range Resources and miner Freeport McMoRan were among corporate detractors on a relative basis. Shorter-dated securities generally underperformed during the period, and while we significantly reduced our floating rate exposure early on, the lack of duration (a measure of a bond price’s sensitivity to changes in interest rates) in many of our front-end and floating-rate positions in securitized credit and bank loans still detracted from relative performance.
These detractors were partially offset by our positioning in Treasuries and investment-grade corporate bonds. The shift by the Fed and other developed world central banks toward more accommodative policy has fostered an environment in which both Treasuries and credit can perform well. As a result, we maintained our overweight allocation to corporate credit and continued adding exposure over the period. While we reduced our Treasury exposure, we remained biased to longer-dated Treasuries, which was particularly accretive in the latter half of the period as rates rallied and the curve flattened. Security selection and our ability to harvest more income than the index proved beneficial in investment-grade corporates, the strongest-performing benchmark sector. At the individual issuer level, our position in AT&T was a top contributor. We were comfortable taking a longer-duration position in the name given the defensive nature of the industry, which aided results as long-dated credit outperformed.
OUTLOOK
Despite macroeconomic concerns around slowing economic growth, Fed policy and political uncertainty, the attractive backdrop for U.S. equities remains intact. Low interest rates are supportive for growing companies that are investing in expansion, the type of companies that we would expect to take market share in a slow-growth economy. The strength of the consumer is another bright spot; consumer spending has shown no signs of abating, and unemployment remains at low levels. Further, equity valuations appear reasonable, and dividend yields are attractive compared to fixed income yields – in both Treasuries and corporate credit.
In the equity sleeve, we will continue our bottom-up focus on companies we believe have sound fundamentals and strong growth prospects. We particularly like those that are actively making investments that should drive shareholder value over time. This includes companies that are disruptors in their sectors and/or benefiting from attractive secular tailwinds, companies we believe will face less adverse impact from macroeconomic challenges.
Within the fixed income sleeve, we are mindful that fourth quarters tend to come with volatility, and we intend to
2 | SEPTEMBER 30, 2019 |
Janus Henderson Balanced Fund (unaudited)
utilize our Treasuries allocation to help mitigate negative impact to the portfolio overall. However, we are still identifying opportunities in corporate credit and remain focused on finding stable sources of yield. We continue to look to agency mortgage-backed securities and securitized credit tied to the strength of the consumer as a means to help diversify the portfolio. Across asset classes, both thorough vetting of opportunities and security avoidance remain critical as we strive to deliver on our core tenets of capital preservation and strong risk-adjusted returns.
Thank you for investing in Janus Henderson Balanced Fund.
Janus Investment Fund | 3 |
Janus Henderson Balanced Fund (unaudited)
Fund At A Glance
September 30, 2019
5 Top Performers - Holdings |
|
|
| 5 Bottom Performers - Holdings |
| |
Contribution | Contribution | |||||
Microsoft Corp | 1.25% | Altria Group Inc | -0.82% | |||
Mastercard Inc | 0.92% | Allergan PLC | -0.49% | |||
McDonald's Corp | 0.82% | UnitedHealth Group Inc | -0.29% | |||
Costco Wholesale Corp | 0.63% | EOG Resources Inc | -0.25% | |||
Comcast Corp | 0.59% | Activision Blizzard Inc | -0.23% | |||
5 Top Performers - Sectors* |
|
|
|
|
| |
Fund | Fund Weighting | S&P 500 Index | ||||
Contribution | (Average % of Equity) | Weighting | ||||
Information Technology | 1.58% | 23.61% | 21.00% | |||
Consumer Discretionary | 1.36% | 12.33% | 10.09% | |||
Financials | 0.90% | 12.83% | 13.22% | |||
Energy | 0.71% | 2.25% | 5.24% | |||
Health Care | 0.55% | 12.14% | 14.55% | |||
5 Bottom Performers - Sectors* |
|
|
|
|
| |
Fund | Fund Weighting | S&P 500 Index | ||||
Contribution | (Average % of Equity) | Weighting | ||||
Utilities | -0.66% | 0.00% | 3.27% | |||
Consumer Staples | -0.61% | 10.70% | 7.32% | |||
Materials | -0.29% | 2.14% | 2.66% | |||
Industrials | -0.20% | 12.89% | 9.40% | |||
Other** | -0.12% | 1.27% | 0.00% | |||
Security contribution to performance is measured by using an algorithm that multiplies the daily performance of each security with the previous day’s ending weight in the portfolio and is gross of advisory fees. Fixed income securities and certain equity securities, such as private placements and some share classes of equity securities, are excluded. | ||||||
* | Based on sector classification according to the Global Industry Classification Standard (“GICS”) codes, which are the exclusive property and a service mark of MSCI Inc. and Standard & Poor’s. | |||||
** | Not a GICS classified sector. | |||||
4 | SEPTEMBER 30, 2019 |
Janus Henderson Balanced Fund (unaudited)
Fund At A Glance
September 30, 2019
5 Largest Equity Holdings - (% of Net Assets) | |
Microsoft Corp | |
Software | 3.9% |
Mastercard Inc | |
Information Technology Services | 2.9% |
Alphabet Inc - Class C | |
Interactive Media & Services | 2.3% |
Boeing Co | |
Aerospace & Defense | 2.2% |
Apple Inc | |
Technology Hardware, Storage & Peripherals | 2.1% |
13.4% | |
Asset Allocation - (% of Net Assets) | |||||
Common Stocks | 62.8% | ||||
Corporate Bonds | 19.2% | ||||
Mortgage-Backed Securities | 9.7% | ||||
United States Treasury Notes/Bonds | 4.7% | ||||
Investment Companies | 3.0% | ||||
Asset-Backed/Commercial Mortgage-Backed Securities | 2.7% | ||||
Preferred Stocks | 0.1% | ||||
Other | (2.2)% | ||||
100.0% | |||||
Top Country Allocations - Long Positions - (% of Investment Securities) | |
As of September 30, 2019
| As of September 30, 2018
|
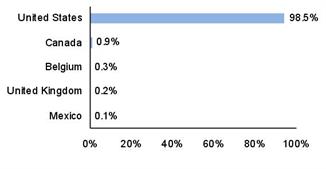
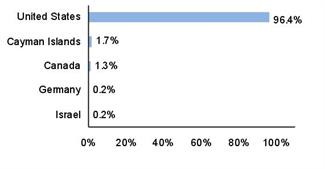
Janus Investment Fund | 5 |
Janus Henderson Balanced Fund (unaudited)
Performance
See important disclosures on the next page. |
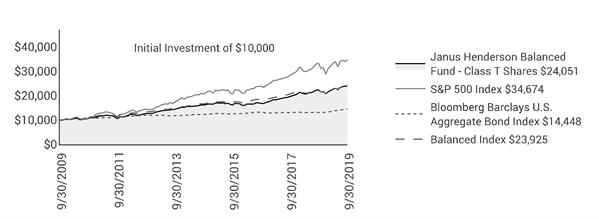
| |||||||||
Average Annual Total Return - for the periods ended September 30, 2019 |
|
| Expense Ratios | ||||||
|
| One | Five | Ten | Since |
|
| Total Annual Fund | |
Class A Shares at NAV |
| 7.70% | 8.29% | 9.05% | 9.69% |
|
| 0.95% | |
Class A Shares at MOP |
| 1.50% | 7.01% | 8.40% | 9.45% |
|
|
| |
Class C Shares at NAV | 6.98% | 7.56% | 8.28% | 9.01% |
|
| 1.64% | ||
Class C Shares at CDSC |
| 5.98% | 7.56% | 8.28% | 9.01% |
|
|
| |
Class D Shares(1) |
| 7.95% | 8.53% | 9.28% | 9.79% |
|
| 0.71% | |
Class I Shares |
| 8.02% | 8.60% | 9.36% | 9.75% |
|
| 0.64% | |
Class N Shares |
| 8.07% | 8.68% | 9.17% | 9.75% |
|
| 0.57% | |
Class R Shares |
| 7.29% | 7.88% | 8.62% | 9.30% |
|
| 1.32% | |
Class S Shares |
| 7.56% | 8.14% | 8.90% | 9.53% |
|
| 1.07% | |
Class T Shares |
| 7.85% | 8.42% | 9.17% | 9.75% |
|
| 0.82% | |
S&P 500 Index |
| 4.25% | 10.84% | 13.24% | 9.71% |
|
|
| |
Bloomberg Barclays U.S. Aggregate Bond Index |
| 10.30% | 3.38% | 3.75% | 5.41% |
|
|
| |
Balanced Index |
| 7.41% | 7.63% | 9.11% | 8.05% |
|
|
| |
Morningstar Quartile - Class T Shares |
| 1st | 1st | 1st | 1st |
|
|
| |
Morningstar Ranking - based on total returns for Allocation - 50% to 70% Equity Funds |
| 47/724 | 20/660 | 78/541 | 13/183 |
|
|
| |
Returns quoted are past performance and do not guarantee future results; current performance may be lower or higher. Investment returns and principal value will vary; there may be a gain or loss when shares are sold. For the most recent month-end performance call 800.668.0434 (or 800.525.3713 if you hold shares directly with Janus Henderson) or visit janushenderson.com/performance (or janushenderson.com/allfunds if you hold shares directly with Janus Henderson).
Maximum Offering Price (MOP) returns include the maximum sales charge of 5.75%. Net Asset Value (NAV) returns exclude this charge, which would have reduced returns.
CDSC returns include a 1% contingent deferred sales charge (CDSC) on Shares redeemed within 12 months of purchase. Net Asset Value (NAV) returns exclude this charge, which would have reduced returns.
Performance may be affected by risks that include those associated with non-diversification, portfolio turnover, short sales, potential conflicts of interest, foreign and emerging markets, initial public offerings (IPOs), high-yield and high-risk securities, undervalued, overlooked and smaller capitalization
6 | SEPTEMBER 30, 2019 |
Janus Henderson Balanced Fund (unaudited)
Performance
companies, real estate related securities including Real Estate Investment Trusts (REITs), derivatives, and commodity-linked investments. Each product has different risks. Please see the prospectus for more information about risks, holdings and other details.
Returns include reinvestment of all dividends and distributions and do not reflect the deduction of taxes that a shareholder would pay on Fund distributions or redemptions of Fund shares. The returns do not include adjustments in accordance with generally accepted accounting principles required at the period end for financial reporting purposes.
Class A Shares, Class C Shares, Class R Shares, and Class S Shares commenced operations on July 6, 2009. Performance shown for each class for periods prior to July 6, 2009, reflects the performance of the Fund’s Class J Shares, the initial share class (renamed Class T Shares effective February 16, 2010), calculated using the fees and expenses of each respective class, without the effect of any fee and expense limitations or waivers.
Class D Shares commenced operations on February 16, 2010. Performance shown for periods prior to February 16, 2010, reflects the performance of the Fund’s former Class J Shares, calculated using the fees and expenses in effect during the periods shown, net of any applicable fee and expense limitations or waivers.
Class I Shares commenced operations on July 6, 2009. Performance shown for periods prior to July 6, 2009, reflects the performance of the Fund’s former Class J Shares, calculated using the fees and expenses of Class J Shares, net of any applicable fee and expense limitations or waivers.
Class N Shares commenced operations on May 31, 2012. Performance shown for periods prior to May 31, 2012, reflects the performance of the Fund’s Class T Shares, calculated using the fees and expenses of Class T Shares, net of any applicable fee and expense limitations or waivers.
If each share class of the Fund had been available during periods prior to its commencement, the performance shown may have been different. The performance shown for periods following the Fund’s commencement of each share class reflects the fees and expenses of each respective share class, net of any applicable fee and expense limitations or waivers. Please refer to the Fund’s prospectuses for further details concerning historical performance.
Ranking is for the share class shown only; other classes may have different performance characteristics. When an expense waiver is in effect, it may have a material effect on the total return, and therefore the ranking for the period.
© 2019 Morningstar, Inc. All Rights Reserved.
There is no assurance that the investment process will consistently lead to successful investing.
See Notes to Schedule of Investments and Other Information for index definitions.
Index performance does not reflect the expenses of managing a portfolio as an index is unmanaged and not available for direct investment.
See “Useful Information About Your Fund Report.”
*The Fund’s inception date – September 1, 1992
‡ As stated in the prospectus. See Financial Highlights for actual expense ratios during the reporting period.
(1) Closed to certain new investors.
Janus Investment Fund | 7 |
Janus Henderson Balanced Fund (unaudited)
Expense Examples
As a shareholder of the Fund, you incur two types of costs: (1) transaction costs, such as sales charges (loads) on purchase payments (applicable to Class A Shares only); and (2) ongoing costs, including management fees; 12b-1 distribution and shareholder servicing fees; transfer agent fees and expenses payable pursuant to the Transfer Agency Agreement; and other Fund expenses. This example is intended to help you understand your ongoing costs (in dollars) of investing in the Fund and to compare these costs with the ongoing costs of investing in other mutual funds. To do so, compare this 5% hypothetical example with the 5% hypothetical examples that appear in the shareholder reports of the other funds. The example is based upon an investment of $1,000 invested at the beginning of the period and held for the six-months indicated, unless noted otherwise in the table and footnotes below.
Actual Expenses
The information in the table under the heading “Actual” provides information about actual account values and actual expenses. You may use the information in these columns, together with the amount you invested, to estimate the expenses that you paid over the period. Simply divide your account value by $1,000 (for example, an $8,600 account value divided by $1,000 = 8.6), then multiply the result by the number in the appropriate column for your share class under the heading entitled “Expenses Paid During Period” to estimate the expenses you paid on your account during the period.
Hypothetical Example for Comparison Purposes
The information in the table under the heading “Hypothetical (5% return before expenses)” provides information about hypothetical account values and hypothetical expenses based upon the Fund’s actual expense ratio and an assumed rate of return of 5% per year before expenses, which is not the Fund’s actual return. The hypothetical account values and expenses may not be used to estimate the actual ending account balance or expenses you paid for the period. You may use this information to compare the ongoing costs of investing in the Fund and other funds. To do so, compare this 5% hypothetical example with the 5% hypothetical examples that appear in the shareholder reports of the other funds. Additionally, for an analysis of the fees associated with an investment in any share class or other similar funds, please visit www.finra.org/fundanalyzer.
Please note that the expenses shown in the table are meant to highlight your ongoing costs only and do not reflect any transaction costs. These fees are fully described in the Fund’s prospectuses. Therefore, the hypothetical examples are useful in comparing ongoing costs only, and will not help you determine the relative total costs of owning different funds. In addition, if these transaction costs were included, your costs would have been higher.
Actual | Hypothetical | |||||||||
| Beginning | Ending | Expenses |
| Beginning | Ending | Expenses | Net Annualized | ||
Class A Shares | $1,000.00 | $1,069.40 | $4.77 |
| $1,000.00 | $1,020.46 | $4.66 | 0.92% | ||
Class C Shares | $1,000.00 | $1,065.80 | $8.34 |
| $1,000.00 | $1,017.00 | $8.14 | 1.61% | ||
Class D Shares | $1,000.00 | $1,070.50 | $3.69 |
| $1,000.00 | $1,021.51 | $3.60 | 0.71% | ||
Class I Shares | $1,000.00 | $1,070.90 | $3.37 |
| $1,000.00 | $1,021.81 | $3.29 | 0.65% | ||
Class N Shares | $1,000.00 | $1,071.00 | $2.96 |
| $1,000.00 | $1,022.21 | $2.89 | 0.57% | ||
Class R Shares | $1,000.00 | $1,067.20 | $6.84 |
| $1,000.00 | $1,018.45 | $6.68 | 1.32% | ||
Class S Shares | $1,000.00 | $1,068.60 | $5.55 |
| $1,000.00 | $1,019.70 | $5.42 | 1.07% | ||
Class T Shares | $1,000.00 | $1,070.10 | $4.26 |
| $1,000.00 | $1,020.96 | $4.15 | 0.82% | ||
† | Expenses Paid During Period are equal to the Net Annualized Expense Ratio multiplied by the average account value over the period, multiplied by 183/365 (to reflect the one-half year period). Expenses in the examples include the effect of applicable fee waivers and/or expense reimbursements, if any. Had such waivers and/or reimbursements not been in effect, your expenses would have been higher. Please refer to the Notes to Financial Statements or the Fund’s prospectuses for more information regarding waivers and/or reimbursements. | |||||||||
8 | SEPTEMBER 30, 2019 |
Janus Henderson Balanced Fund
Schedule of Investments
September 30, 2019
Shares or | Value | ||||||
Asset-Backed/Commercial Mortgage-Backed Securities – 2.7% | |||||||
Angel Oak Mortgage Trust I LLC 2018-2, 3.6740%, 7/27/48 (144A)‡ | $3,060,279 | $3,119,789 | |||||
Applebee's Funding LLC / IHOP Funding LLC, 4.1940%, 6/7/49 (144A) | 9,328,000 | 9,537,709 | |||||
Applebee's Funding LLC / IHOP Funding LLC, 4.7230%, 6/7/49 (144A) | 5,698,000 | 5,872,595 | |||||
Arroyo Mortgage Trust 2018-1, 3.7630%, 4/25/48 (144A)‡ | 3,684,488 | 3,748,502 | |||||
BAMLL Commercial Mortgage Securities Trust 2018-DSNY, | |||||||
ICE LIBOR USD 1 Month + 0.8500%, 2.8775%, 9/15/34 (144A)‡ | 6,871,000 | 6,856,735 | |||||
BBCMS 2018-TALL Mortgage Trust, | |||||||
ICE LIBOR USD 1 Month + 0.7220%, 2.7495%, 3/15/37 (144A)‡ | 19,034,000 | 18,987,874 | |||||
BBCMS Trust 2015-SRCH, 4.1970%, 8/10/35 (144A) | 9,288,000 | 10,438,081 | |||||
BX Commercial Mortgage Trust 2018-IND, | |||||||
ICE LIBOR USD 1 Month + 0.7500%, 2.7775%, 11/15/33 (144A)‡ | 16,208,369 | 16,208,505 | |||||
BXP Trust 2017-GM, 3.3790%, 6/13/39 (144A) | 4,190,000 | 4,489,213 | |||||
Chase Home Lending Mortgage Trust 2019-ATR2, | |||||||
ICE LIBOR USD 1 Month + 0.9000%, 2.9184%, 7/25/49 (144A)‡ | 2,967,793 | 2,955,214 | |||||
Connecticut Avenue Securities Trust 2019-R03, | |||||||
ICE LIBOR USD 1 Month + 2.1500%, 4.1684%, 9/25/31 (144A)‡ | 11,629,488 | 11,683,544 | |||||
Connecticut Avenue Securities Trust 2019-R04, | |||||||
ICE LIBOR USD 1 Month + 2.1000%, 4.1184%, 6/25/39 (144A)‡ | 4,412,000 | 4,425,627 | |||||
Connecticut Avenue Securities Trust 2019-R05, | |||||||
ICE LIBOR USD 1 Month + 2.0000%, 4.0184%, 7/25/39 (144A)‡ | 2,267,199 | 2,272,543 | |||||
Credit Acceptance Auto Loan Trust 2018-2, 3.9400%, 7/15/27 (144A) | 4,276,000 | 4,411,594 | |||||
DB Master Finance LLC, 3.7870%, 5/20/49 (144A) | 7,499,205 | 7,713,044 | |||||
DB Master Finance LLC, 4.0210%, 5/20/49 (144A) | 3,014,445 | 3,135,212 | |||||
DB Master Finance LLC, 4.3520%, 5/20/49 (144A) | 5,988,990 | 6,323,936 | |||||
Domino's Pizza Master Issuer LLC, 3.0820%, 7/25/47 (144A) | 2,058,980 | 2,055,423 | |||||
Domino's Pizza Master Issuer LLC, 4.1160%, 7/25/48 (144A) | 12,613,338 | 13,146,294 | |||||
Domino's Pizza Master Issuer LLC, 4.3280%, 7/25/48 (144A) | 2,290,013 | 2,414,349 | |||||
Drive Auto Receivables Trust 2017-1, 5.1700%, 9/16/24 | 12,150,000 | 12,564,930 | |||||
Drive Auto Receivables Trust 2017-2, 5.2700%, 11/15/24 | 10,594,000 | 10,981,973 | |||||
Drive Auto Receivables Trust 2017-A, 4.1600%, 5/15/24 (144A) | 5,339,000 | 5,424,983 | |||||
Drive Auto Receivables Trust 2019-1, 4.0900%, 6/15/26 | 2,488,000 | 2,568,091 | |||||
Fannie Mae Connecticut Avenue Securities, | |||||||
ICE LIBOR USD 1 Month + 3.0000%, 5.0184%, 7/25/24‡ | 10,214,882 | 10,720,653 | |||||
Fannie Mae Connecticut Avenue Securities, | |||||||
ICE LIBOR USD 1 Month + 1.1500%, 3.1684%, 9/25/29‡ | 1,004,113 | 1,005,635 | |||||
Fannie Mae Connecticut Avenue Securities, | |||||||
ICE LIBOR USD 1 Month + 0.9500%, 2.9684%, 10/25/29‡ | 869,771 | 871,046 | |||||
Fannie Mae Connecticut Avenue Securities, | |||||||
ICE LIBOR USD 1 Month + 0.6000%, 2.6184%, 7/25/30‡ | 3,350,688 | 3,349,349 | |||||
Fannie Mae Connecticut Avenue Securities, | |||||||
ICE LIBOR USD 1 Month + 0.7200%, 2.7384%, 1/25/31‡ | 601,478 | 601,526 | |||||
Fannie Mae Connecticut Avenue Securities, | |||||||
ICE LIBOR USD 1 Month + 2.0000%, 4.0184%, 3/25/31‡ | 14,590,374 | 14,642,834 | |||||
Fannie Mae Connecticut Avenue Securities 2017-C06, | |||||||
ICE LIBOR USD 1 Month + 0.7500%, 2.7684%, 2/25/30‡ | 421,981 | 421,997 | |||||
Fannie Mae Connecticut Avenue Securities 2018-C04, | |||||||
ICE LIBOR USD 1 Month + 0.7500%, 2.7684%, 2/25/30‡ | 899,214 | 899,220 | |||||
Fannie Mae Pool, 3.0000%, 10/1/49 | 16,021,167 | 16,268,645 | |||||
Fannie Mae REMICS, 3.0000%, 5/25/48 | 19,245,281 | 19,564,817 | |||||
Freddie Mac Structured Agency Credit Risk Debt Notes, | |||||||
ICE LIBOR USD 1 Month + 1.3500%, 3.3684%, 3/25/29‡ | 1,520,003 | 1,526,512 | |||||
Freddie Mac Structured Agency Credit Risk Debt Notes, | |||||||
ICE LIBOR USD 1 Month + 1.2000%, 3.2184%, 7/25/29‡ | 2,693,581 | 2,699,621 | |||||
Freddie Mac Structured Agency Credit Risk Debt Notes, | |||||||
ICE LIBOR USD 1 Month + 0.7500%, 2.7684%, 3/25/30‡ | 350,125 | 350,068 | |||||
Freddie Mac Structured Agency Credit Risk Debt Notes, | |||||||
ICE LIBOR USD 1 Month + 1.8000%, 3.8184%, 7/25/30‡ | 8,730,971 | 8,732,774 | |||||
Ginnie Mae II Pool, 3.5000%, 5/20/49 | 16,887,672 | 17,259,181 | |||||
Ginnie Mae II Pool, 3.5000%, 6/20/49 | 7,077,034 | 7,232,721 | |||||
Jack in the Box Funding, LLC 2019-1A A23, 4.9700%, 8/25/49 (144A) | 11,400,203 | 11,909,951 | |||||
See Notes to Schedule of Investments and Other Information and Notes to Financial Statements. | |
Janus Investment Fund | 9 |
Janus Henderson Balanced Fund
Schedule of Investments
September 30, 2019
Shares or | Value | ||||||
Asset-Backed/Commercial Mortgage-Backed Securities – (continued) | |||||||
Jack in the Box Funding, LLC 2019-1A A2I, 3.9820%, 8/25/49 (144A) | $12,757,429 | $13,015,879 | |||||
Jack in the Box Funding, LLC 2019-1A A2II, 4.4760%, 8/25/49 (144A) | 11,394,792 | 11,637,365 | |||||
JP Morgan Mortgage Trust, | |||||||
ICE LIBOR USD 1 Month + 0.9000%, 2.9184%, 11/25/49 (144A)‡ | 2,591,771 | 2,591,749 | |||||
JP Morgan Mortgage Trust, | |||||||
ICE LIBOR USD 1 Month + 0.9000%, 2.9184%, 12/25/49 (144A)‡ | 5,326,910 | 5,315,261 | |||||
JP Morgan Mortgage Trust 2019-7, | |||||||
ICE LIBOR USD 1 Month + 0.9000%, 2.9248%, 2/25/50 (144A)‡ | 5,831,000 | 5,819,712 | |||||
JP Morgan Mortgage Trust 2019-LTV2, | |||||||
ICE LIBOR USD 1 Month + 0.9000%, 2.9184%, 12/25/49 (144A)‡ | 8,027,602 | 7,995,111 | |||||
Mello Warehouse Securitization Trust 2018-1, | |||||||
ICE LIBOR USD 1 Month + 0.8500%, 2.8684%, 11/25/51 (144A)‡ | 23,804,714 | 23,815,536 | |||||
New Residential Mortgage Loan Trust 2018-2, 4.5000%, 2/25/58 (144A)‡ | 4,371,051 | 4,601,055 | |||||
OneMain Direct Auto Receivables Trust 2018-1, 3.8500%, 10/14/25 (144A) | 2,018,000 | 2,083,478 | |||||
OneMain Direct Auto Receivables Trust 2018-1, 4.4000%, 1/14/28 (144A) | 2,065,000 | 2,135,145 | |||||
Santander Drive Auto Receivables Trust 2016-3, 4.2900%, 2/15/24 | 12,409,000 | 12,573,433 | |||||
Santander Drive Auto Receivables Trust 2018-1, 4.3700%, 5/15/25 (144A) | 16,238,000 | 16,474,328 | |||||
Sequoia Mortgage Trust 2018-7 A19, 4.0000%, 9/25/48 (144A)‡ | 2,986,862 | 3,026,656 | |||||
Station Place Securitization Trust Series 2019-10, 2.9365%, 10/24/20 | 28,036,000 | 28,036,000 | |||||
Station Place Securitization Trust Series 2019-4, 2.9365%, 6/24/20‡ | 27,000,000 | 27,019,645 | |||||
Station Place Securitization Trust Series 2019-WL1, | |||||||
ICE LIBOR USD 1 Month + 1.2000%, 3.2184%, 8/25/52 (144A)‡ | 2,634,000 | 2,636,169 | |||||
Station Place Securitization Trust Series 2019-WL1, | |||||||
ICE LIBOR USD 1 Month + 1.4000%, 3.4184%, 8/25/52 (144A)‡ | 4,785,000 | 4,788,935 | |||||
Towd Point Asset Funding, LLC 2019-HE1 A1, | |||||||
ICE LIBOR USD 1 Month + 0.9000%, 2.9184%, 4/25/48 (144A)‡ | 8,043,374 | 8,046,897 | |||||
Wachovia Bank Commercial Mortgage Trust Series 2007-C34, 6.2863%, 5/15/46‡ | 506,706 | 514,735 | |||||
Wells Fargo Mortgage Backed Securities 2018-1, 3.5000%, 7/25/47 (144A)‡ | 2,759,543 | 2,789,109 | |||||
Wendy's Funding LLC, 3.5730%, 3/15/48 (144A) | 3,910,350 | 3,931,765 | |||||
Wendy's Funding LLC, 3.8840%, 3/15/48 (144A) | 1,221,248 | 1,254,305 | |||||
Total Asset-Backed/Commercial Mortgage-Backed Securities (cost $474,122,156) | 479,494,578 | ||||||
Corporate Bonds – 19.2% | |||||||
Banking – 2.4% | |||||||
Bank of America Corp, ICE LIBOR USD 3 Month + 1.5120%, 3.7050%, 4/24/28‡ | 49,524,000 | 52,745,194 | |||||
Bank of America Corp, ICE LIBOR USD 3 Month + 1.0700%, 3.9700%, 3/5/29‡ | 12,114,000 | 13,190,599 | |||||
Bank of America Corp, ICE LIBOR USD 3 Month + 1.2100%, 3.9740%, 2/7/30‡ | 16,343,000 | 17,891,571 | |||||
Bank of Montreal, 3.3000%, 2/5/24 | 16,193,000 | 16,851,940 | |||||
CIT Bank NA, SOFR + 1.7150%, 2.9690%, 9/27/25‡ | 5,964,000 | 5,971,455 | |||||
Citigroup Inc, ICE LIBOR USD 3 Month + 1.5630%, 3.8870%, 1/10/28‡ | 60,879,000 | 65,148,766 | |||||
Citizens Financial Group Inc, 3.7500%, 7/1/24 | 3,136,000 | 3,234,923 | |||||
Citizens Financial Group Inc, 4.3500%, 8/1/25 | 2,232,000 | 2,387,751 | |||||
Citizens Financial Group Inc, 4.3000%, 12/3/25 | 8,046,000 | 8,604,339 | |||||
First Republic Bank/CA, 4.6250%, 2/13/47 | 5,833,000 | 6,711,129 | |||||
JPMorgan Chase & Co, ICE LIBOR USD 3 Month + 1.2450%, 3.9600%, 1/29/27‡ | 29,483,000 | 31,908,428 | |||||
JPMorgan Chase & Co, ICE LIBOR USD 3 Month + 1.3370%, 3.7820%, 2/1/28‡ | 18,152,000 | 19,444,425 | |||||
JPMorgan Chase & Co, ICE LIBOR USD 3 Month + 1.3300%, 4.4520%, 12/5/29‡ | 48,819,000 | 55,221,918 | |||||
JPMorgan Chase & Co, ICE LIBOR USD 3 Month + 1.1600%, 3.7020%, 5/6/30‡ | 16,279,000 | 17,462,342 | |||||
Morgan Stanley, 4.3500%, 9/8/26 | 14,728,000 | 15,967,055 | |||||
Morgan Stanley, 3.9500%, 4/23/27 | 22,928,000 | 24,229,093 | |||||
Morgan Stanley, ICE LIBOR USD 3 Month + 1.6280%, 4.4310%, 1/23/30‡ | 31,368,000 | 35,246,643 | |||||
Synchrony Financial, 2.8500%, 7/25/22 | 1,973,000 | 1,990,391 | |||||
Synchrony Financial, 4.3750%, 3/19/24 | 3,260,000 | 3,459,615 | |||||
Synchrony Financial, 3.9500%, 12/1/27 | 13,735,000 | 14,082,735 | |||||
Synchrony Financial, 5.1500%, 3/19/29 | 16,208,000 | 17,978,626 | |||||
429,728,938 | |||||||
Basic Industry – 1.4% | |||||||
Allegheny Technologies Inc, 5.9500%, 1/15/21 | 11,882,000 | 12,141,919 | |||||
CF Industries Inc, 4.5000%, 12/1/26 (144A) | 5,333,000 | 5,818,902 | |||||
Constellium NV, 5.7500%, 5/15/24 (144A) | 15,446,000 | 15,870,765 | |||||
Freeport-McMoRan Inc, 3.5500%, 3/1/22 | 47,767,000 | 47,886,417 | |||||
See Notes to Schedule of Investments and Other Information and Notes to Financial Statements. | |
10 | SEPTEMBER 30, 2019 |
Janus Henderson Balanced Fund
Schedule of Investments
September 30, 2019
Shares or | Value | ||||||
Corporate Bonds – (continued) | |||||||
Basic Industry – (continued) | |||||||
Freeport-McMoRan Inc, 3.8750%, 3/15/23 | $15,990,000 | $16,109,925 | |||||
Freeport-McMoRan Inc, 5.0000%, 9/1/27 | 11,484,000 | 11,440,935 | |||||
Freeport-McMoRan Inc, 5.2500%, 9/1/29 | 10,799,000 | 10,769,735 | |||||
Georgia-Pacific LLC, 3.1630%, 11/15/21 (144A) | 15,454,000 | 15,709,387 | |||||
Hudbay Minerals Inc, 7.2500%, 1/15/23 (144A) | 16,098,000 | 16,621,185 | |||||
Novelis Corp, 5.8750%, 9/30/26 (144A) | 24,429,000 | 25,619,914 | |||||
Nutrien Ltd, 4.2000%, 4/1/29 | 2,962,000 | 3,261,528 | |||||
Reliance Steel & Aluminum Co, 4.5000%, 4/15/23 | 8,092,000 | 8,549,095 | |||||
Steel Dynamics Inc, 5.5000%, 10/1/24 | 14,966,000 | 15,359,606 | |||||
WRKCo Inc, 3.7500%, 3/15/25 | 953,000 | 1,003,310 | |||||
WRKCo Inc, 4.6500%, 3/15/26 | 5,765,000 | 6,328,614 | |||||
WRKCo Inc, 3.3750%, 9/15/27 | 1,030,000 | 1,047,993 | |||||
WRKCo Inc, 4.0000%, 3/15/28 | 3,464,000 | 3,690,040 | |||||
WRKCo Inc, 4.9000%, 3/15/29 | 28,604,000 | 32,349,891 | |||||
249,579,161 | |||||||
Brokerage – 0.2% | |||||||
Cboe Global Markets Inc, 3.6500%, 1/12/27 | 10,781,000 | 11,468,431 | |||||
Raymond James Financial Inc, 5.6250%, 4/1/24 | 5,610,000 | 6,331,681 | |||||
Raymond James Financial Inc, 4.9500%, 7/15/46 | 9,798,000 | 11,714,213 | |||||
29,514,325 | |||||||
Capital Goods – 0.9% | |||||||
Arconic Inc, 5.4000%, 4/15/21 | 5,661,000 | 5,856,502 | |||||
Ball Corp, 4.3750%, 12/15/20 | 7,499,000 | 7,652,804 | |||||
Boeing Co, 2.2500%, 6/15/26 | 1,857,000 | 1,852,722 | |||||
Boeing Co, 3.2500%, 3/1/28 | 2,295,000 | 2,412,890 | |||||
Boeing Co, 3.2000%, 3/1/29 | 13,547,000 | 14,225,535 | |||||
Boeing Co, 3.6000%, 5/1/34 | 19,174,000 | 20,802,019 | |||||
Entegris Inc, 4.6250%, 2/10/26 (144A) | 8,377,000 | 8,670,195 | |||||
Huntington Ingalls Industries Inc, 5.0000%, 11/15/25 (144A) | 21,929,000 | 22,970,627 | |||||
Wabtec Corp, 4.4000%, 3/15/24 | 12,942,000 | 13,784,933 | |||||
Wabtec Corp, 3.4500%, 11/15/26 | 3,625,000 | 3,664,195 | |||||
Wabtec Corp, 4.9500%, 9/15/28 | 56,563,000 | 62,421,449 | |||||
164,313,871 | |||||||
Communications – 3.1% | |||||||
AT&T Inc, 3.6000%, 7/15/25 | 6,875,000 | 7,239,817 | |||||
AT&T Inc, 4.3500%, 3/1/29 | 66,200,000 | 73,159,818 | |||||
AT&T Inc, 5.2500%, 3/1/37 | 3,121,000 | 3,674,775 | |||||
AT&T Inc, 4.8500%, 3/1/39 | 9,371,000 | 10,622,130 | |||||
AT&T Inc, 4.7500%, 5/15/46 | 10,056,000 | 11,158,753 | |||||
AT&T Inc, 5.1500%, 11/15/46 | 7,224,000 | 8,379,901 | |||||
AT&T Inc, 4.5000%, 3/9/48 | 9,253,000 | 9,946,658 | |||||
CCO Holdings LLC / CCO Holdings Capital Corp, 5.2500%, 3/15/21 | 8,070,000 | 8,076,456 | |||||
CenturyLink Inc, 6.4500%, 6/15/21 | 9,843,000 | 10,335,150 | |||||
CenturyLink Inc, 5.8000%, 3/15/22 | 5,476,000 | 5,770,335 | |||||
Charter Communications Operating LLC / Charter Communications Operating | |||||||
Capital, 5.0500%, 3/30/29 | 52,948,000 | 59,250,111 | |||||
Charter Communications Operating LLC / Charter Communications Operating | |||||||
Capital, 6.4840%, 10/23/45 | 3,508,000 | 4,274,482 | |||||
Charter Communications Operating LLC / Charter Communications Operating | |||||||
Capital, 5.3750%, 5/1/47 | 2,807,000 | 3,054,555 | |||||
Charter Communications Operating LLC / Charter Communications Operating | |||||||
Capital, 5.7500%, 4/1/48 | 12,209,000 | 13,913,196 | |||||
Comcast Corp, 3.1500%, 3/1/26 | 6,645,000 | 6,960,013 | |||||
Comcast Corp, 4.1500%, 10/15/28 | 8,193,000 | 9,192,731 | |||||
Comcast Corp, 4.2500%, 10/15/30 | 12,294,000 | 13,993,132 | |||||
Comcast Corp, 4.6000%, 10/15/38 | 7,205,000 | 8,633,499 | |||||
Comcast Corp, 4.9500%, 10/15/58 | 7,419,000 | 9,518,314 | |||||
Crown Castle International Corp, 3.6500%, 9/1/27 | 7,252,000 | 7,682,786 | |||||
Crown Castle International Corp, 4.3000%, 2/15/29 | 11,688,000 | 12,907,683 | |||||
See Notes to Schedule of Investments and Other Information and Notes to Financial Statements. | |
Janus Investment Fund | 11 |
Janus Henderson Balanced Fund
Schedule of Investments
September 30, 2019
Shares or | Value | ||||||
Corporate Bonds – (continued) | |||||||
Communications – (continued) | |||||||
Crown Castle International Corp, 3.1000%, 11/15/29 | $19,152,000 | $19,330,550 | |||||
Crown Castle International Corp, 5.2000%, 2/15/49 | 17,982,000 | 22,325,410 | |||||
CSC Holdings LLC, 6.5000%, 2/1/29 (144A) | 17,013,000 | 18,909,524 | |||||
CSC Holdings LLC, 5.7500%, 1/15/30 (144A) | 20,064,000 | 20,969,288 | |||||
Diamond Sports Group LLC / Diamond Sports Finance Co, | |||||||
5.3750%, 8/15/26 (144A) | 12,990,000 | 13,477,125 | |||||
Fox Corp, 4.0300%, 1/25/24 (144A) | 5,458,000 | 5,806,496 | |||||
Netflix Inc, 4.3750%, 11/15/26 | 9,217,000 | 9,337,282 | |||||
Netflix Inc, 5.8750%, 11/15/28 | 1,815,000 | 1,971,635 | |||||
Netflix Inc, 5.3750%, 11/15/29 (144A) | 8,099,000 | 8,422,960 | |||||
Sirius XM Radio Inc, 5.5000%, 7/1/29 (144A) | 13,041,000 | 13,921,267 | |||||
T-Mobile USA Inc, 6.3750%, 3/1/25 | 17,458,000 | 18,085,790 | |||||
UBM PLC, 5.7500%, 11/3/20 (144A) | 10,600,000 | 10,928,458 | |||||
Verizon Communications Inc, 2.6250%, 8/15/26 | 15,284,000 | 15,482,373 | |||||
Verizon Communications Inc, 4.3290%, 9/21/28 | 31,531,000 | 35,766,095 | |||||
Verizon Communications Inc, 3.8750%, 2/8/29 | 4,803,000 | 5,274,853 | |||||
Verizon Communications Inc, 4.8620%, 8/21/46 | 4,862,000 | 5,944,837 | |||||
Verizon Communications Inc, 4.5220%, 9/15/48 | 3,585,000 | 4,233,488 | |||||
Verizon Communications Inc, 5.0120%, 8/21/54 | 7,293,000 | 9,186,011 | |||||
Viacom Inc, 5.8500%, 9/1/43 | 13,669,000 | 16,810,893 | |||||
553,928,630 | |||||||
Consumer Cyclical – 1.6% | |||||||
AutoZone Inc, 3.7500%, 4/18/29 | 16,231,000 | 17,421,776 | |||||
Fiat Chrysler Automobiles NV, 4.5000%, 4/15/20 | 1,944,000 | 1,957,802 | |||||
Ford Motor Credit Co LLC, 4.3890%, 1/8/26 | 16,945,000 | 16,865,637 | |||||
Ford Motor Credit Co LLC, 3.8150%, 11/2/27 | 21,039,000 | 19,952,000 | |||||
Ford Motor Credit Co LLC, 5.1130%, 5/3/29 | 49,655,000 | 50,013,272 | |||||
General Motors Co, 5.0000%, 10/1/28 | 14,076,000 | 14,964,336 | |||||
General Motors Financial Co Inc, 4.3500%, 4/9/25 | 9,494,000 | 9,899,891 | |||||
General Motors Financial Co Inc, 4.3000%, 7/13/25 | 2,916,000 | 3,034,192 | |||||
General Motors Financial Co Inc, 4.3500%, 1/17/27 | 4,984,000 | 5,126,509 | |||||
GLP Capital LP / GLP Financing II Inc, 3.3500%, 9/1/24 | 2,572,000 | 2,586,660 | |||||
GLP Capital LP / GLP Financing II Inc, 5.2500%, 6/1/25 | 4,671,000 | 5,145,247 | |||||
GLP Capital LP / GLP Financing II Inc, 5.3750%, 4/15/26 | 5,422,000 | 5,970,977 | |||||
GLP Capital LP / GLP Financing II Inc, 4.0000%, 1/15/30 | 17,327,000 | 17,413,115 | |||||
IHS Markit Ltd, 5.0000%, 11/1/22 (144A) | 5,334,000 | 5,681,624 | |||||
IHS Markit Ltd, 4.7500%, 2/15/25 (144A) | 9,209,000 | 9,991,765 | |||||
Lowe's Cos Inc, 3.6500%, 4/5/29 | 10,017,000 | 10,713,008 | |||||
McDonald's Corp, 2.6250%, 9/1/29 | 16,366,000 | 16,306,709 | |||||
McDonald's Corp, 3.6250%, 9/1/49 | 8,343,000 | 8,441,172 | |||||
MDC Holdings Inc, 5.5000%, 1/15/24 | 8,120,000 | 8,871,100 | |||||
MGM Resorts International, 6.6250%, 12/15/21 | 5,473,000 | 5,935,469 | |||||
MGM Resorts International, 7.7500%, 3/15/22 | 1,964,000 | 2,197,245 | |||||
O'Reilly Automotive Inc, 3.6000%, 9/1/27 | 333,000 | 354,454 | |||||
O'Reilly Automotive Inc, 4.3500%, 6/1/28 | 2,564,000 | 2,865,874 | |||||
O'Reilly Automotive Inc, 3.9000%, 6/1/29 | 18,302,000 | 20,033,694 | |||||
Service Corp International/US, 5.1250%, 6/1/29 | 10,779,000 | 11,520,056 | |||||
Starbucks Corp, 4.4500%, 8/15/49 | 9,729,000 | 11,294,048 | |||||
284,557,632 | |||||||
Consumer Non-Cyclical – 3.8% | |||||||
Allergan Finance LLC, 3.2500%, 10/1/22 | 9,148,000 | 9,346,146 | |||||
Allergan Funding SCS, 3.4500%, 3/15/22 | 20,364,000 | 20,871,075 | |||||
Allergan Funding SCS, 3.8000%, 3/15/25 | 10,921,000 | 11,437,016 | |||||
Allergan Inc/United States, 2.8000%, 3/15/23 | 726,000 | 732,731 | |||||
Anheuser-Busch InBev Worldwide Inc, 4.1500%, 1/23/25 | 30,603,000 | 33,435,021 | |||||
Anheuser-Busch InBev Worldwide Inc, 4.7500%, 1/23/29 | 14,159,000 | 16,488,247 | |||||
Bausch Health Cos Inc, 7.0000%, 3/15/24 (144A) | 13,185,000 | 13,856,908 | |||||
Boston Scientific Corp, 3.7500%, 3/1/26 | 10,617,000 | 11,351,696 | |||||
Boston Scientific Corp, 4.0000%, 3/1/29 | 3,716,000 | 4,108,283 | |||||
See Notes to Schedule of Investments and Other Information and Notes to Financial Statements. | |
12 | SEPTEMBER 30, 2019 |
Janus Henderson Balanced Fund
Schedule of Investments
September 30, 2019
Shares or | Value | ||||||
Corporate Bonds – (continued) | |||||||
Consumer Non-Cyclical – (continued) | |||||||
Boston Scientific Corp, 4.7000%, 3/1/49 | $5,944,000 | $7,278,288 | |||||
Bristol-Myers Squibb Co, 3.4000%, 7/26/29 (144A) | 6,875,000 | 7,350,859 | |||||
Bristol-Myers Squibb Co, 4.1250%, 6/15/39 (144A) | 4,963,000 | 5,627,519 | |||||
Bristol-Myers Squibb Co, 4.2500%, 10/26/49 (144A) | 11,998,000 | 13,971,350 | |||||
Campbell Soup Co, 3.9500%, 3/15/25 | 6,894,000 | 7,309,127 | |||||
Campbell Soup Co, 4.1500%, 3/15/28 | 13,691,000 | 14,745,308 | |||||
Campbell Soup Co, 4.8000%, 3/15/48 | 13,163,000 | 14,847,890 | |||||
Cigna Corp, 3.4000%, 9/17/21 | 2,153,000 | 2,201,833 | |||||
Cigna Corp, 3.7500%, 7/15/23 | 8,762,000 | 9,163,212 | |||||
CVS Health Corp, 4.7500%, 12/1/22 | 4,304,000 | 4,590,303 | |||||
CVS Health Corp, 4.1000%, 3/25/25 | 18,139,000 | 19,368,744 | |||||
CVS Health Corp, 3.0000%, 8/15/26 | 1,849,000 | 1,857,835 | |||||
CVS Health Corp, 4.3000%, 3/25/28 | 7,394,000 | 7,997,442 | |||||
CVS Health Corp, 3.2500%, 8/15/29 | 2,988,000 | 3,004,357 | |||||
CVS Health Corp, 5.0500%, 3/25/48 | 31,446,000 | 35,761,412 | |||||
Elanco Animal Health Inc, 4.2720%, 8/28/23 | 5,166,000 | 5,423,632 | |||||
Elanco Animal Health Inc, 4.9000%, 8/28/28 | 4,818,000 | 5,256,671 | |||||
Eli Lilly & Co, 3.3750%, 3/15/29 | 30,975,000 | 33,540,858 | |||||
General Mills Inc, 4.2000%, 4/17/28 | 16,396,000 | 18,283,250 | |||||
GlaxoSmithKline Capital PLC, 3.3750%, 6/1/29 | 17,835,000 | 19,146,151 | |||||
HCA Inc, 4.7500%, 5/1/23 | 14,309,000 | 15,328,148 | |||||
HCA Inc, 4.5000%, 2/15/27 | 15,600,000 | 16,729,041 | |||||
HCA Inc, 4.1250%, 6/15/29 | 42,194,000 | 44,179,772 | |||||
HCA Inc, 5.1250%, 6/15/39 | 6,787,000 | 7,422,467 | |||||
HCA Inc, 5.2500%, 6/15/49 | 9,895,000 | 10,864,413 | |||||
IQVIA Inc, 5.0000%, 5/15/27 (144A) | 8,549,000 | 8,955,077 | |||||
JBS USA LUX SA / JBS USA Finance Inc, 5.8750%, 7/15/24 (144A) | 3,753,000 | 3,865,778 | |||||
JBS USA LUX SA / JBS USA Finance Inc, 5.7500%, 6/15/25 (144A) | 6,746,000 | 7,028,118 | |||||
JBS USA LUX SA / JBS USA Finance Inc, 6.7500%, 2/15/28 (144A) | 2,074,000 | 2,296,955 | |||||
JBS USA LUX SA / JBS USA Food Co / JBS USA Finance Inc, | |||||||
6.5000%, 4/15/29 (144A) | 2,949,000 | 3,273,390 | |||||
Keurig Dr Pepper Inc, 4.5970%, 5/25/28 | 18,661,000 | 20,958,842 | |||||
Keurig Dr Pepper Inc, 5.0850%, 5/25/48 | 5,998,000 | 7,081,657 | |||||
Kraft Heinz Foods Co, 3.0000%, 6/1/26 | 31,359,000 | 31,027,022 | |||||
Kraft Heinz Foods Co, 4.6250%, 1/30/29 | 5,258,000 | 5,692,675 | |||||
Kraft Heinz Foods Co, 3.7500%, 4/1/30 (144A) | 8,245,000 | 8,324,116 | |||||
Kraft Heinz Foods Co, 4.6250%, 10/1/39 (144A) | 4,207,000 | 4,231,004 | |||||
Kraft Heinz Foods Co, 5.0000%, 6/4/42 | 4,485,000 | 4,626,483 | |||||
Kraft Heinz Foods Co, 4.3750%, 6/1/46 | 11,976,000 | 11,369,674 | |||||
Kraft Heinz Foods Co, 4.8750%, 10/1/49 (144A) | 8,414,000 | 8,491,696 | |||||
Mars Inc, 2.7000%, 4/1/25 (144A) | 6,045,000 | 6,203,444 | |||||
Mars Inc, 3.2000%, 4/1/30 (144A) | 7,422,000 | 7,853,869 | |||||
Mars Inc, 3.9500%, 4/1/49 (144A) | 13,351,000 | 15,229,537 | |||||
Mars Inc, 4.2000%, 4/1/59 (144A) | 6,289,000 | 7,260,678 | |||||
Mondelez International Holdings Netherlands BV, 2.2500%, 9/19/24 (144A) | 14,117,000 | 14,064,173 | |||||
Mylan Inc, 4.5500%, 4/15/28 | 5,374,000 | 5,724,610 | |||||
Newell Brands Inc, 4.2000%, 4/1/26 | 17,094,000 | 17,856,887 | |||||
Newell Brands Inc, 5.3750%, 4/1/36 | 23,035,000 | 24,573,052 | |||||
Sysco Corp, 2.5000%, 7/15/21 | 2,241,000 | 2,255,023 | |||||
681,120,765 | |||||||
Electric – 1.2% | |||||||
NRG Energy Inc, 3.7500%, 6/15/24 (144A) | 16,897,000 | 17,388,985 | |||||
NRG Energy Inc, 7.2500%, 5/15/26 | 16,099,000 | 17,632,430 | |||||
NRG Energy Inc, 6.6250%, 1/15/27 | 18,534,000 | 20,078,809 | |||||
NRG Energy Inc, 5.7500%, 1/15/28 | 3,585,000 | 3,853,875 | |||||
NRG Energy Inc, 4.4500%, 6/15/29 (144A) | 16,284,000 | 16,969,716 | |||||
NRG Energy Inc, 5.2500%, 6/15/29 (144A) | 6,596,000 | 7,092,679 | |||||
Oncor Electric Delivery Co LLC, 2.7500%, 6/1/24 (144A) | 13,178,000 | 13,532,427 | |||||
Oncor Electric Delivery Co LLC, 3.7000%, 11/15/28 (144A) | 10,505,000 | 11,569,927 | |||||
See Notes to Schedule of Investments and Other Information and Notes to Financial Statements. | |
Janus Investment Fund | 13 |
Janus Henderson Balanced Fund
Schedule of Investments
September 30, 2019
Shares or | Value | ||||||
Corporate Bonds – (continued) | |||||||
Electric – (continued) | |||||||
Oncor Electric Delivery Co LLC, 3.8000%, 6/1/49 (144A) | $15,875,000 | $17,811,333 | |||||
PPL WEM Ltd / Western Power Distribution Ltd, 5.3750%, 5/1/21 (144A) | 9,215,000 | 9,508,706 | |||||
Southern Co, 2.9500%, 7/1/23 | 7,120,000 | 7,267,334 | |||||
Vistra Operations Co LLC, 5.5000%, 9/1/26 (144A) | 5,883,000 | 6,154,795 | |||||
Vistra Operations Co LLC, 5.6250%, 2/15/27 (144A) | 32,962,000 | 34,681,957 | |||||
Vistra Operations Co LLC, 5.0000%, 7/31/27 (144A) | 21,750,000 | 22,395,540 | |||||
205,938,513 | |||||||
Energy – 1.9% | |||||||
AmeriGas Partners LP / AmeriGas Finance Corp, 5.6250%, 5/20/24 | 563,000 | 602,762 | |||||
AmeriGas Partners LP / AmeriGas Finance Corp, 5.5000%, 5/20/25 | 21,138,000 | 22,696,927 | |||||
Cenovus Energy Inc, 4.2500%, 4/15/27 | 5,361,000 | 5,589,782 | |||||
Cheniere Energy Partners LP, 5.6250%, 10/1/26 | 7,575,000 | 8,038,211 | |||||
Continental Resources Inc/OK, 5.0000%, 9/15/22 | 11,011,000 | 11,108,007 | |||||
Continental Resources Inc/OK, 4.5000%, 4/15/23 | 13,097,000 | 13,605,087 | |||||
Energy Transfer Operating LP, 4.2500%, 3/15/23 | 5,994,000 | 6,262,769 | |||||
Energy Transfer Operating LP, 5.8750%, 1/15/24 | 5,737,000 | 6,378,659 | |||||
Energy Transfer Operating LP, 5.5000%, 6/1/27 | 4,277,000 | 4,830,670 | |||||
Energy Transfer Operating LP, 4.9500%, 6/15/28 | 705,000 | 774,967 | |||||
Energy Transfer Operating LP, 6.1250%, 12/15/45 | 29,658,000 | 34,775,669 | |||||
Energy Transfer Operating LP, 6.0000%, 6/15/48 | 14,785,000 | 17,478,036 | |||||
EnLink Midstream Partners LP, 4.1500%, 6/1/25 | 9,615,000 | 8,917,912 | |||||
EQM Midstream Partners LP, 5.5000%, 7/15/28 | 13,357,000 | 13,361,363 | |||||
Exxon Mobil Corp, 2.4400%, 8/16/29 | 21,688,000 | 21,887,229 | |||||
Exxon Mobil Corp, 3.0950%, 8/16/49 | 23,568,000 | 23,719,183 | |||||
Hess Corp, 4.3000%, 4/1/27 | 33,565,000 | 35,073,895 | |||||
HollyFrontier Corp, 5.8750%, 4/1/26 | 13,285,000 | 14,876,100 | |||||
Kinder Morgan Energy Partners LP, 5.0000%, 10/1/21 | 4,683,000 | 4,897,699 | |||||
Kinder Morgan Inc/DE, 6.5000%, 9/15/20 | 476,000 | 494,694 | |||||
Kinder Morgan Inc/DE, 4.3000%, 3/1/28 | 4,960,000 | 5,390,604 | |||||
Kinder Morgan Inc/DE, 5.5500%, 6/1/45 | 3,035,000 | 3,581,541 | |||||
Kinder Morgan Inc/DE, 5.2000%, 3/1/48 | 2,058,000 | 2,371,432 | |||||
NGPL PipeCo LLC, 4.3750%, 8/15/22 (144A) | 11,522,000 | 11,944,166 | |||||
NGPL PipeCo LLC, 4.8750%, 8/15/27 (144A) | 15,213,000 | 16,309,953 | |||||
NuStar Logistics LP, 5.6250%, 4/28/27 | 6,277,000 | 6,630,081 | |||||
Plains All American Pipeline LP / PAA Finance Corp, 4.6500%, 10/15/25 | 14,498,000 | 15,511,392 | |||||
Range Resources Corp, 5.7500%, 6/1/21 | 5,980,000 | 5,935,150 | |||||
Tallgrass Energy Partners LP / Tallgrass Energy Finance Corp, | |||||||
4.7500%, 10/1/23 (144A) | 12,631,000 | 12,662,577 | |||||
Tallgrass Energy Partners LP / Tallgrass Energy Finance Corp, | |||||||
5.5000%, 9/15/24 (144A) | 4,675,000 | 4,651,625 | |||||
340,358,142 | |||||||
Finance Companies – 0.1% | |||||||
GE Capital International Funding Co Unlimited Co, 4.4180%, 11/15/35 | 17,423,000 | 18,275,176 | |||||
Financial Institutions – 0.1% | |||||||
Jones Lang LaSalle Inc, 4.4000%, 11/15/22 | 10,463,000 | 10,888,200 | |||||
Government Sponsored – 0% | |||||||
Petroleos Mexicanos, 6.8400%, 1/23/30 (144A) | 3,562,000 | 3,683,820 | |||||
Petroleos Mexicanos, 7.6900%, 1/23/50 (144A) | 3,258,000 | 3,397,442 | |||||
7,081,262 | |||||||
Industrial Conglomerates – 0.2% | |||||||
General Electric Co, ICE LIBOR USD 3 Month + 3.3300%, 5.0000%‡,µ | 33,059,000 | 31,364,726 | |||||
Insurance – 0.2% | |||||||
Brown & Brown Inc, 4.5000%, 3/15/29 | 7,354,000 | 8,011,870 | |||||
Centene Corp, 4.7500%, 5/15/22 | 652,000 | 665,170 | |||||
Centene Corp, 6.1250%, 2/15/24 | 7,576,000 | 7,899,495 | |||||
Centene Corp, 5.3750%, 6/1/26 (144A) | 23,064,000 | 24,159,540 | |||||
Humana Inc, 3.1250%, 8/15/29 | 3,277,000 | 3,274,779 | |||||
44,010,854 | |||||||
See Notes to Schedule of Investments and Other Information and Notes to Financial Statements. | |
14 | SEPTEMBER 30, 2019 |
Janus Henderson Balanced Fund
Schedule of Investments
September 30, 2019
Shares or | Value | ||||||
Corporate Bonds – (continued) | |||||||
Real Estate Investment Trusts (REITs) – 0.2% | |||||||
Reckson Operating Partnership LP, 7.7500%, 3/15/20 | $13,713,000 | $14,032,494 | |||||
Ventas Realty LP, 3.5000%, 4/15/24 | 14,689,000 | 15,386,779 | |||||
29,419,273 | |||||||
Technology – 1.9% | |||||||
Broadcom Corp / Broadcom Cayman Finance Ltd, 3.8750%, 1/15/27 | 7,403,000 | 7,441,268 | |||||
Broadcom Inc, 4.2500%, 4/15/26 (144A) | 9,466,000 | 9,779,478 | |||||
Broadcom Inc, 4.7500%, 4/15/29 (144A) | 16,636,000 | 17,584,041 | |||||
CommScope Inc, 5.5000%, 3/1/24 (144A) | 5,980,000 | 6,151,925 | |||||
CommScope Inc, 6.0000%, 3/1/26 (144A) | 13,101,000 | 13,556,915 | |||||
Dell International LLC / EMC Corp, 5.8750%, 6/15/21 (144A) | 30,048,000 | 30,528,768 | |||||
Dell International LLC / EMC Corp, 5.3000%, 10/1/29 (144A) | 8,037,000 | 8,744,966 | |||||
Fidelity National Information Services Inc, 5.0000%, 10/15/25 | 6,581,000 | 7,480,949 | |||||
Fidelity National Information Services Inc, 3.7500%, 5/21/29 | 4,563,000 | 4,951,076 | |||||
Global Payments Inc, 3.2000%, 8/15/29 | 4,239,000 | 4,293,585 | |||||
Global Payments Inc, 4.1500%, 8/15/49 | 3,189,000 | 3,343,805 | |||||
Juniper Networks Inc, 3.7500%, 8/15/29 | 7,431,000 | 7,462,380 | |||||
Lam Research Corp, 4.0000%, 3/15/29 | 2,810,000 | 3,099,544 | |||||
Marvell Technology Group Ltd, 4.2000%, 6/22/23 | 4,911,000 | 5,147,791 | |||||
Marvell Technology Group Ltd, 4.8750%, 6/22/28 | 20,812,000 | 23,118,982 | |||||
Micron Technology Inc, 5.5000%, 2/1/25 | 4,730,000 | 4,860,909 | |||||
Micron Technology Inc, 4.9750%, 2/6/26 | 6,164,000 | 6,639,575 | |||||
Micron Technology Inc, 5.3270%, 2/6/29 | 19,291,000 | 21,205,105 | |||||
PayPal Holdings Inc, 2.4000%, 10/1/24 | 8,092,000 | 8,118,878 | |||||
PayPal Holdings Inc, 2.6500%, 10/1/26 | 24,196,000 | 24,300,698 | |||||
PayPal Holdings Inc, 2.8500%, 10/1/29 | 28,492,000 | 28,583,639 | |||||
Qorvo Inc, 5.5000%, 7/15/26 | 10,439,000 | 11,026,194 | |||||
Qorvo Inc, 4.3750%, 10/15/29 (144A) | 5,661,000 | 5,699,919 | |||||
Total System Services Inc, 4.8000%, 4/1/26 | 11,514,000 | 12,794,718 | |||||
Trimble Inc, 4.7500%, 12/1/24 | 18,202,000 | 19,538,692 | |||||
Trimble Inc, 4.9000%, 6/15/28 | 34,648,000 | 37,600,430 | |||||
Verisk Analytics Inc, 5.5000%, 6/15/45 | 5,717,000 | 7,088,780 | |||||
340,143,010 | |||||||
Total Corporate Bonds (cost $3,240,326,702) | 3,420,222,478 | ||||||
Mortgage-Backed Securities – 9.7% | |||||||
Fannie Mae: | |||||||
3.0000%, 8/25/33 | 27,637,000 | 28,250,541 | |||||
4.0000%, 9/25/48 | 37,530,833 | 38,943,494 | |||||
4.5000%, 10/25/48 | 91,897,000 | 96,747,324 | |||||
163,941,359 | |||||||
Fannie Mae Pool: | |||||||
7.5000%, 7/1/28 | 96,243 | 110,971 | |||||
6.0000%, 2/1/37 | 329,870 | 385,932 | |||||
4.5000%, 9/1/37 | 7,789,598 | 8,256,431 | |||||
4.5000%, 5/1/38 | 3,898,071 | 4,130,533 | |||||
4.5000%, 7/1/38 | 6,062,268 | 6,423,792 | |||||
4.5000%, 8/1/38 | 199,670 | 211,577 | |||||
4.5000%, 11/1/38 | 6,869,672 | 7,279,346 | |||||
3.5000%, 10/1/42 | 4,327,840 | 4,548,288 | |||||
4.5000%, 11/1/42 | 1,397,423 | 1,515,624 | |||||
3.5000%, 12/1/42 | 10,054,400 | 10,566,543 | |||||
3.0000%, 2/1/43 | 352,693 | 362,754 | |||||
3.5000%, 2/1/43 | 10,227,509 | 10,748,469 | |||||
3.5000%, 2/1/43 | 4,872,766 | 5,102,553 | |||||
3.5000%, 3/1/43 | 6,965,768 | 7,294,256 | |||||
3.5000%, 4/1/43 | 25,496,146 | 26,698,479 | |||||
3.0000%, 5/1/43 | 2,625,701 | 2,697,044 | |||||
3.5000%, 11/1/43 | 13,843,683 | 14,548,841 | |||||
3.5000%, 4/1/44 | 5,004,435 | 5,299,670 | |||||
See Notes to Schedule of Investments and Other Information and Notes to Financial Statements. | |
Janus Investment Fund | 15 |
Janus Henderson Balanced Fund
Schedule of Investments
September 30, 2019
Shares or | Value | ||||||
Mortgage-Backed Securities – (continued) | |||||||
Fannie Mae Pool – (continued) | |||||||
5.0000%, 7/1/44 | $322,461 | $354,072 | |||||
4.5000%, 10/1/44 | 3,237,139 | 3,605,649 | |||||
3.5000%, 2/1/45 | 22,784,983 | 23,859,464 | |||||
3.5000%, 2/1/45 | 3,727,097 | 3,902,857 | |||||
4.5000%, 3/1/45 | 5,073,978 | 5,651,591 | |||||
4.5000%, 6/1/45 | 3,157,496 | 3,405,592 | |||||
3.0000%, 10/1/45 | 5,201,521 | 5,337,168 | |||||
3.0000%, 10/1/45 | 3,148,438 | 3,230,544 | |||||
3.5000%, 12/1/45 | 3,229,557 | 3,424,114 | |||||
3.0000%, 1/1/46 | 741,846 | 761,192 | |||||
4.5000%, 2/1/46 | 8,311,892 | 9,014,953 | |||||
3.0000%, 3/1/46 | 23,068,147 | 23,626,882 | |||||
3.0000%, 3/1/46 | 15,603,782 | 15,981,723 | |||||
3.5000%, 5/1/46 | 2,098,960 | 2,190,489 | |||||
3.5000%, 7/1/46 | 10,554,224 | 11,050,905 | |||||
3.5000%, 7/1/46 | 5,942,522 | 6,249,864 | |||||
3.5000%, 8/1/46 | 32,866,034 | 34,299,224 | |||||
3.5000%, 8/1/46 | 3,533,662 | 3,687,754 | |||||
4.0000%, 10/1/46 | 337,721 | 365,563 | |||||
3.0000%, 11/1/46 | 5,428,828 | 5,560,320 | |||||
3.0000%, 11/1/46 | 1,629,673 | 1,676,351 | |||||
3.0000%, 11/1/46 | 1,584,013 | 1,629,384 | |||||
3.5000%, 12/1/46 | 1,091,837 | 1,139,449 | |||||
3.0000%, 2/1/47 | 14,784,174 | 15,230,721 | |||||
3.0000%, 3/1/47 | 11,193,666 | 11,502,193 | |||||
4.0000%, 5/1/47 | 2,117,538 | 2,217,782 | |||||
4.5000%, 5/1/47 | 1,173,867 | 1,270,733 | |||||
4.5000%, 5/1/47 | 988,510 | 1,057,517 | |||||
4.5000%, 5/1/47 | 933,202 | 1,003,710 | |||||
4.5000%, 5/1/47 | 718,896 | 769,081 | |||||
4.5000%, 5/1/47 | 696,735 | 754,229 | |||||
4.5000%, 5/1/47 | 551,733 | 593,420 | |||||
4.5000%, 5/1/47 | 353,296 | 379,989 | |||||
4.5000%, 5/1/47 | 237,626 | 257,235 | |||||
4.5000%, 5/1/47 | 206,882 | 223,954 | |||||
4.0000%, 6/1/47 | 1,184,485 | 1,240,558 | |||||
4.0000%, 6/1/47 | 584,181 | 613,248 | |||||
4.0000%, 6/1/47 | 506,413 | 530,386 | |||||
4.0000%, 6/1/47 | 270,913 | 283,738 | |||||
4.5000%, 6/1/47 | 4,080,352 | 4,327,129 | |||||
4.5000%, 6/1/47 | 406,288 | 439,815 | |||||
4.0000%, 7/1/47 | 907,429 | 950,386 | |||||
4.0000%, 7/1/47 | 798,261 | 836,051 | |||||
4.0000%, 7/1/47 | 374,974 | 392,726 | |||||
4.0000%, 7/1/47 | 266,617 | 279,238 | |||||
4.5000%, 7/1/47 | 3,030,722 | 3,214,018 | |||||
4.5000%, 7/1/47 | 2,412,124 | 2,558,008 | |||||
4.5000%, 7/1/47 | 2,366,162 | 2,509,266 | |||||
3.5000%, 8/1/47 | 5,258,777 | 5,486,616 | |||||
3.5000%, 8/1/47 | 3,114,506 | 3,223,832 | |||||
3.5000%, 8/1/47 | 1,771,601 | 1,881,215 | |||||
4.0000%, 8/1/47 | 25,893,868 | 27,390,521 | |||||
4.0000%, 8/1/47 | 5,779,858 | 6,053,476 | |||||
4.0000%, 8/1/47 | 1,815,677 | 1,901,631 | |||||
4.0000%, 8/1/47 | 1,058,532 | 1,108,643 | |||||
4.0000%, 8/1/47 | 506,381 | 530,353 | |||||
4.5000%, 8/1/47 | 3,557,887 | 3,773,066 | |||||
4.5000%, 8/1/47 | 561,583 | 595,547 | |||||
4.0000%, 9/1/47 | 13,208,939 | 14,262,273 | |||||
See Notes to Schedule of Investments and Other Information and Notes to Financial Statements. | |
16 | SEPTEMBER 30, 2019 |
Janus Henderson Balanced Fund
Schedule of Investments
September 30, 2019
Shares or | Value | ||||||
Mortgage-Backed Securities – (continued) | |||||||
Fannie Mae Pool – (continued) | |||||||
4.0000%, 9/1/47 | $529,572 | $554,642 | |||||
4.5000%, 9/1/47 | 2,148,848 | 2,278,809 | |||||
4.5000%, 9/1/47 | 790,438 | 838,243 | |||||
4.0000%, 10/1/47 | 2,949,160 | 3,088,774 | |||||
4.0000%, 10/1/47 | 2,243,316 | 2,349,515 | |||||
4.0000%, 10/1/47 | 2,013,986 | 2,109,328 | |||||
4.0000%, 10/1/47 | 1,448,435 | 1,517,004 | |||||
4.0000%, 10/1/47 | 1,154,686 | 1,209,349 | |||||
4.5000%, 10/1/47 | 570,299 | 604,791 | |||||
4.5000%, 10/1/47 | 213,777 | 226,706 | |||||
4.0000%, 11/1/47 | 6,160,527 | 6,516,602 | |||||
4.0000%, 11/1/47 | 3,134,948 | 3,283,356 | |||||
4.0000%, 11/1/47 | 1,131,836 | 1,185,417 | |||||
4.5000%, 11/1/47 | 2,479,445 | 2,629,400 | |||||
3.5000%, 12/1/47 | 10,203,750 | 10,744,768 | |||||
3.5000%, 12/1/47 | 4,756,971 | 4,934,432 | |||||
3.5000%, 12/1/47 | 968,042 | 1,027,938 | |||||
3.5000%, 12/1/47 | 490,000 | 520,318 | |||||
3.5000%, 1/1/48 | 7,385,587 | 7,777,182 | |||||
3.5000%, 1/1/48 | 6,891,207 | 7,146,543 | |||||
4.0000%, 1/1/48 | 24,572,583 | 25,850,279 | |||||
4.0000%, 1/1/48 | 11,404,518 | 11,986,305 | |||||
4.0000%, 1/1/48 | 2,755,091 | 2,936,748 | |||||
4.0000%, 1/1/48 | 2,169,048 | 2,271,731 | |||||
4.0000%, 1/1/48 | 1,753,327 | 1,868,933 | |||||
3.5000%, 3/1/48 | 4,672,555 | 4,906,913 | |||||
3.5000%, 3/1/48 | 862,244 | 912,378 | |||||
4.0000%, 3/1/48 | 10,294,709 | 10,808,030 | |||||
4.0000%, 3/1/48 | 1,538,260 | 1,638,112 | |||||
4.5000%, 3/1/48 | 4,550,082 | 4,822,528 | |||||
3.5000%, 4/1/48 | 9,790,939 | 10,215,136 | |||||
3.5000%, 4/1/48 | 8,468,523 | 8,954,783 | |||||
4.0000%, 4/1/48 | 3,248,527 | 3,459,394 | |||||
4.5000%, 4/1/48 | 3,673,528 | 3,893,488 | |||||
4.0000%, 5/1/48 | 14,637,113 | 15,241,738 | |||||
4.0000%, 5/1/48 | 13,858,143 | 14,430,590 | |||||
4.5000%, 5/1/48 | 2,873,402 | 3,045,453 | |||||
4.5000%, 5/1/48 | 2,672,125 | 2,832,124 | |||||
4.0000%, 6/1/48 | 6,156,758 | 6,411,080 | |||||
4.5000%, 6/1/48 | 2,988,633 | 3,167,583 | |||||
4.0000%, 10/1/48 | 2,531,279 | 2,670,645 | |||||
3.5000%, 11/1/48 | 13,950,429 | 14,751,457 | |||||
3.5000%, 1/1/49 | 3,236,098 | 3,370,095 | |||||
4.0000%, 2/1/49 | 6,481,102 | 6,748,820 | |||||
4.0000%, 5/1/49 | 10,135,491 | 10,782,572 | |||||
3.0000%, 8/1/49 | 5,881,000 | 6,044,528 | |||||
3.0000%, 8/1/49 | 3,525,199 | 3,623,221 | |||||
4.0000%, 9/1/49 | 10,870,982 | 11,347,540 | |||||
3.5000%, 8/1/56 | 17,672,161 | 18,613,988 | |||||
3.0000%, 2/1/57 | 12,307,118 | 12,642,646 | |||||
3.5000%, 2/1/57 | 37,940,860 | 39,962,894 | |||||
736,583,360 | |||||||
Freddie Mac Gold Pool: | |||||||
3.0000%, 2/1/31 | 5,633,610 | 5,781,484 | |||||
2.5000%, 11/1/31 | 1,446,915 | 1,466,115 | |||||
2.5000%, 12/1/31 | 1,722,536 | 1,745,518 | |||||
4.5000%, 5/1/38 | 10,098,892 | 10,704,493 | |||||
4.5000%, 7/1/38 | 7,766,762 | 8,232,512 | |||||
4.5000%, 8/1/38 | 6,463,359 | 6,850,948 | |||||
See Notes to Schedule of Investments and Other Information and Notes to Financial Statements. | |
Janus Investment Fund | 17 |
Janus Henderson Balanced Fund
Schedule of Investments
September 30, 2019
Shares or | Value | ||||||
Mortgage-Backed Securities – (continued) | |||||||
Freddie Mac Gold Pool – (continued) | |||||||
4.5000%, 9/1/38 | $4,944,629 | $5,241,144 | |||||
4.5000%, 10/1/38 | 1,103,700 | 1,169,886 | |||||
6.0000%, 4/1/40 | 5,943,172 | 6,981,914 | |||||
3.5000%, 2/1/43 | 3,965,530 | 4,154,460 | |||||
3.5000%, 2/1/44 | 3,934,630 | 4,122,088 | |||||
4.5000%, 5/1/44 | 152,914 | 165,011 | |||||
3.5000%, 12/1/44 | 27,696,435 | 29,015,980 | |||||
3.0000%, 1/1/45 | 8,877,809 | 9,121,619 | |||||
4.0000%, 4/1/45 | 64,284 | 68,127 | |||||
3.5000%, 7/1/46 | 29,838,161 | 31,651,466 | |||||
3.5000%, 7/1/46 | 6,398,794 | 6,692,869 | |||||
3.0000%, 10/1/46 | 13,750,240 | 14,105,006 | |||||
3.5000%, 10/1/46 | 20,706,988 | 21,619,672 | |||||
3.0000%, 12/1/46 | 16,221,211 | 16,639,730 | |||||
3.5000%, 2/1/47 | 12,666,527 | 13,224,818 | |||||
3.0000%, 9/1/47 | 9,511,789 | 9,756,531 | |||||
3.5000%, 9/1/47 | 20,365,230 | 21,090,118 | |||||
3.5000%, 9/1/47 | 11,462,449 | 11,871,218 | |||||
3.5000%, 11/1/47 | 8,711,035 | 9,177,189 | |||||
3.5000%, 11/1/47 | 2,796,078 | 2,940,890 | |||||
3.5000%, 12/1/47 | 15,249,127 | 16,038,895 | |||||
3.5000%, 12/1/47 | 6,488,517 | 6,824,563 | |||||
3.5000%, 12/1/47 | 6,262,604 | 6,597,735 | |||||
3.5000%, 2/1/48 | 6,738,725 | 7,080,439 | |||||
3.5000%, 2/1/48 | 6,589,141 | 6,810,700 | |||||
3.5000%, 3/1/48 | 16,162,211 | 16,999,269 | |||||
3.5000%, 3/1/48 | 4,011,428 | 4,192,005 | |||||
3.5000%, 4/1/48 | 1,405,541 | 1,468,813 | |||||
3.5000%, 8/1/48 | 15,339,880 | 16,030,416 | |||||
4.5000%, 8/1/48 | 7,351,484 | 7,768,658 | |||||
5.0000%, 9/1/48 | 1,216,918 | 1,305,179 | |||||
3.5000%, 11/1/48 | 19,596,347 | 20,521,518 | |||||
4.5000%, 12/1/48 | 6,096,138 | 6,567,701 | |||||
4.0000%, 1/1/49 | 13,429,368 | 14,428,953 | |||||
386,225,650 | |||||||
Freddie Mac Pool: | |||||||
2.5000%, 12/1/33 | 29,313,279 | 29,689,323 | |||||
2.5000%, 12/1/33 | 17,249,067 | 17,445,518 | |||||
4.0000%, 5/1/46 | 2,599,072 | 2,740,802 | |||||
4.0000%, 3/1/47 | 2,756,412 | 2,921,182 | |||||
4.0000%, 3/1/48 | 6,890,860 | 7,234,510 | |||||
4.0000%, 4/1/48 | 20,238,729 | 21,049,456 | |||||
4.0000%, 4/1/48 | 7,843,313 | 8,227,558 | |||||
4.0000%, 5/1/48 | 16,918,043 | 17,616,997 | |||||
4.0000%, 5/1/48 | 9,871,597 | 10,279,433 | |||||
4.0000%, 6/1/48 | 4,397,802 | 4,579,494 | |||||
4.0000%, 8/1/48 | 52,306,906 | 54,402,226 | |||||
4.0000%, 8/1/48 | 20,035,422 | 21,336,159 | |||||
3.0000%, 8/1/49 | 5,827,378 | 5,969,406 | |||||
3.0000%, 8/1/49 | 1,908,377 | 1,961,442 | |||||
3.5000%, 8/1/49 | 2,940,192 | 3,063,501 | |||||
3.0000%, 9/1/49 | 1,806,641 | 1,835,164 | |||||
3.5000%, 9/1/49 | 3,457,805 | 3,559,283 | |||||
3.0000%, 10/1/49 | 2,539,071 | 2,578,756 | |||||
3.0000%, 10/1/49 | 1,242,766 | 1,262,386 | |||||
217,752,596 | |||||||
Ginnie Mae: | |||||||
4.5000%, 7/20/48 | 35,865,000 | 37,477,132 | |||||
See Notes to Schedule of Investments and Other Information and Notes to Financial Statements. | |
18 | SEPTEMBER 30, 2019 |
Janus Henderson Balanced Fund
Schedule of Investments
September 30, 2019
Shares or | Value | ||||||
Mortgage-Backed Securities – (continued) | |||||||
Ginnie Mae – (continued) | |||||||
5.0000%, 7/20/48 | $92,428,555 | $97,428,940 | |||||
134,906,072 | |||||||
Ginnie Mae I Pool: | |||||||
6.0000%, 1/15/34 | 95,851 | 110,640 | |||||
4.0000%, 1/15/45 | 25,379,173 | 27,045,393 | |||||
4.5000%, 8/15/46 | 31,189,577 | 34,021,505 | |||||
4.0000%, 7/15/47 | 7,829,133 | 8,262,861 | |||||
4.0000%, 8/15/47 | 1,386,044 | 1,462,830 | |||||
4.0000%, 11/15/47 | 3,444,878 | 3,635,721 | |||||
4.0000%, 12/15/47 | 4,451,237 | 4,697,832 | |||||
79,236,782 | |||||||
Ginnie Mae II Pool: | |||||||
4.0000%, 8/20/47 | 2,603,263 | 2,754,126 | |||||
4.0000%, 8/20/47 | 611,297 | 649,865 | |||||
4.0000%, 8/20/47 | 311,245 | 329,283 | |||||
4.5000%, 5/20/48 | 15,798,101 | 16,493,257 | |||||
4.5000%, 5/20/48 | 2,035,514 | 2,125,082 | |||||
22,351,613 | |||||||
Total Mortgage-Backed Securities (cost $1,699,752,589) | 1,740,997,432 | ||||||
United States Treasury Notes/Bonds – 4.7% | |||||||
2.3750%, 4/30/20 | 35,489,000 | 35,590,199 | |||||
1.7500%, 7/31/21 | 13,941,000 | 13,960,060 | |||||
2.8750%, 11/30/23 | 99,947,700 | 105,187,146 | |||||
2.6250%, 12/31/23 | 17,873,700 | 18,646,598 | |||||
2.3750%, 2/29/24 | 6,499,600 | 6,725,309 | |||||
2.1250%, 3/31/24 | 3,462,000 | 3,546,116 | |||||
2.2500%, 4/30/24 | 13,752,000 | 14,168,320 | |||||
2.0000%, 5/31/24 | 118,662,600 | 121,049,758 | |||||
1.7500%, 6/30/24 | 17,680,000 | 17,832,628 | |||||
1.7500%, 7/31/24 | 59,310,000 | 59,845,180 | |||||
1.6250%, 2/15/26 | 18,428,000 | 18,435,918 | |||||
1.3750%, 8/31/26 | 5,255,000 | 5,170,633 | |||||
2.3750%, 5/15/29 | 152,308,300 | 161,785,922 | |||||
1.6250%, 8/15/29 | 26,701,000 | 26,585,226 | |||||
3.0000%, 2/15/49 | 3,637,400 | 4,340,441 | |||||
2.8750%, 5/15/49 | 32,519,000 | 37,958,311 | |||||
2.2500%, 8/15/49 | 177,328,000 | 182,557,791 | |||||
Total United States Treasury Notes/Bonds (cost $821,267,948) | 833,385,556 | ||||||
Common Stocks – 62.8% | |||||||
Aerospace & Defense – 3.6% | |||||||
Boeing Co | 1,014,631 | 386,036,657 | |||||
General Dynamics Corp | 1,366,612 | 249,721,011 | |||||
635,757,668 | |||||||
Air Freight & Logistics – 0.5% | |||||||
United Parcel Service Inc | 698,622 | 83,708,888 | |||||
Airlines – 0.6% | |||||||
Delta Air Lines Inc | 1,946,263 | 112,104,749 | |||||
Automobiles – 0.5% | |||||||
General Motors Co | 2,217,965 | 83,129,328 | |||||
Banks – 2.6% | |||||||
Bank of America Corp | 4,180,427 | 121,943,056 | |||||
US Bancorp | 6,089,674 | 337,002,559 | |||||
458,945,615 | |||||||
Capital Markets – 3.2% | |||||||
Blackstone Group Inc | 2,922,353 | 142,727,721 | |||||
CME Group Inc | 845,281 | 178,641,687 | |||||
Morgan Stanley | 2,623,728 | 111,954,474 | |||||
See Notes to Schedule of Investments and Other Information and Notes to Financial Statements. | |
Janus Investment Fund | 19 |
Janus Henderson Balanced Fund
Schedule of Investments
September 30, 2019
Shares or | Value | ||||||
Common Stocks – (continued) | |||||||
Capital Markets – (continued) | |||||||
TD Ameritrade Holding Corp | 2,994,743 | $139,854,498 | |||||
573,178,380 | |||||||
Chemicals – 1.3% | |||||||
LyondellBasell Industries NV | 2,586,141 | 231,382,035 | |||||
Consumer Finance – 1.5% | |||||||
American Express Co | 901,027 | 106,573,474 | |||||
Synchrony Financial | 4,882,208 | 166,434,471 | |||||
273,007,945 | |||||||
Electronic Equipment, Instruments & Components – 0.5% | |||||||
Corning Inc | 3,463,650 | 98,783,298 | |||||
Entertainment – 0.9% | |||||||
Walt Disney Co | 1,188,650 | 154,904,868 | |||||
Equity Real Estate Investment Trusts (REITs) – 1.3% | |||||||
Crown Castle International Corp | 777,753 | 108,115,445 | |||||
MGM Growth Properties LLC | 2,336,244 | 70,204,132 | |||||
Outfront Media Inc | 2,130,310 | 59,180,012 | |||||
237,499,589 | |||||||
Food & Staples Retailing – 3.4% | |||||||
Costco Wholesale Corp | 1,226,296 | 353,308,141 | |||||
Kroger Co | 2,045,015 | 52,720,487 | |||||
Sysco Corp | 2,568,565 | 203,944,061 | |||||
609,972,689 | |||||||
Food Products – 0.7% | |||||||
Hershey Co | 806,309 | 124,969,832 | |||||
Health Care Equipment & Supplies – 1.8% | |||||||
Abbott Laboratories | 2,130,841 | 178,287,466 | |||||
Medtronic PLC | 1,281,307 | 139,175,566 | |||||
317,463,032 | |||||||
Health Care Providers & Services – 1.5% | |||||||
UnitedHealth Group Inc | 1,234,428 | 268,265,893 | |||||
Hotels, Restaurants & Leisure – 3.4% | |||||||
Hilton Worldwide Holdings Inc | 1,424,210 | 132,608,193 | |||||
McDonald's Corp | 1,700,198 | 365,049,513 | |||||
Norwegian Cruise Line Holdings Ltd* | 1,743,785 | 90,275,749 | |||||
Six Flags Entertainment Corp | 449,607 | 22,835,540 | |||||
610,768,995 | |||||||
Household Products – 0.4% | |||||||
Clorox Co | 514,908 | 78,199,078 | |||||
Industrial Conglomerates – 0.6% | |||||||
Honeywell International Inc | 674,641 | 114,149,257 | |||||
Information Technology Services – 4.3% | |||||||
Accenture PLC | 1,248,042 | 240,060,879 | |||||
Mastercard Inc | 1,933,102 | 524,972,510 | |||||
765,033,389 | |||||||
Insurance – 1.0% | |||||||
Progressive Corp | 2,204,583 | 170,304,037 | |||||
Interactive Media & Services – 2.3% | |||||||
Alphabet Inc - Class C* | 339,147 | 413,420,193 | |||||
Internet & Direct Marketing Retail – 0.8% | |||||||
Amazon.com Inc* | 81,797 | 141,992,230 | |||||
Leisure Products – 0.7% | |||||||
Hasbro Inc | 1,010,603 | 119,948,470 | |||||
Life Sciences Tools & Services – 0.6% | |||||||
Thermo Fisher Scientific Inc | 362,717 | 105,648,581 | |||||
Machinery – 1.4% | |||||||
Deere & Co | 725,055 | 122,302,277 | |||||
Parker-Hannifin Corp | 311,511 | 56,262,002 | |||||
See Notes to Schedule of Investments and Other Information and Notes to Financial Statements. | |
20 | SEPTEMBER 30, 2019 |
Janus Henderson Balanced Fund
Schedule of Investments
September 30, 2019
Shares or | Value | ||||||
Common Stocks – (continued) | |||||||
Machinery – (continued) | |||||||
Stanley Black & Decker Inc | 515,629 | $74,461,984 | |||||
253,026,263 | |||||||
Media – 1.5% | |||||||
Comcast Corp | 5,999,566 | 270,460,435 | |||||
Oil, Gas & Consumable Fuels – 1.1% | |||||||
EOG Resources Inc | 860,115 | 63,837,735 | |||||
Suncor Energy Inc | 2,124,801 | 67,101,216 | |||||
Suncor Energy Incž | 1,926,003 | 60,759,165 | |||||
191,698,116 | |||||||
Personal Products – 0.5% | |||||||
Estee Lauder Cos Inc | 436,122 | 86,766,472 | |||||
Pharmaceuticals – 3.3% | |||||||
Bristol-Myers Squibb Co | 3,214,325 | 162,998,421 | |||||
Eli Lilly & Co | 1,459,969 | 163,268,333 | |||||
Merck & Co Inc | 3,208,128 | 270,060,215 | |||||
596,326,969 | |||||||
Real Estate Management & Development – 0.6% | |||||||
CBRE Group Inc* | 2,136,513 | 113,256,554 | |||||
Road & Rail – 1.3% | |||||||
CSX Corp | 3,394,373 | 235,128,218 | |||||
Semiconductor & Semiconductor Equipment – 3.3% | |||||||
Intel Corp | 3,463,634 | 178,481,060 | |||||
Lam Research Corp | 689,748 | 159,407,660 | |||||
NVIDIA Corp | 491,708 | 85,591,612 | |||||
Texas Instruments Inc | 1,229,920 | 158,954,861 | |||||
582,435,193 | |||||||
Software – 5.7% | |||||||
Adobe Inc* | 856,053 | 236,484,641 | |||||
Microsoft Corp | 4,997,594 | 694,801,671 | |||||
salesforce.com Inc* | 539,486 | 80,081,302 | |||||
1,011,367,614 | |||||||
Specialty Retail – 1.9% | |||||||
Home Depot Inc | 1,435,713 | 333,114,130 | |||||
Technology Hardware, Storage & Peripherals – 2.1% | |||||||
Apple Inc | 1,638,222 | 366,912,581 | |||||
Textiles, Apparel & Luxury Goods – 0.9% | |||||||
NIKE Inc | 1,756,740 | 164,993,021 | |||||
Tobacco – 1.2% | |||||||
Altria Group Inc | 5,326,815 | 217,866,733 | |||||
Total Common Stocks (cost $7,496,643,331) | 11,205,890,338 | ||||||
Preferred Stocks – 0.1% | |||||||
Semiconductor & Semiconductor Equipment – 0.1% | |||||||
Broadcom Inc, 8.0000%, 9/30/22 (cost $19,791,000) | 19,791 | 20,315,461 | |||||
Investment Companies – 3.0% | |||||||
Money Markets – 3.0% | |||||||
Janus Henderson Cash Liquidity Fund LLC, 2.0434%ºº,£ (cost $532,004,164) | 532,004,164 | 532,004,164 | |||||
Total Investments (total cost $14,283,907,890) – 102.2% | 18,232,310,007 | ||||||
Liabilities, net of Cash, Receivables and Other Assets – (2.2)% | (392,648,618) | ||||||
Net Assets – 100% | $17,839,661,389 | ||||||
See Notes to Schedule of Investments and Other Information and Notes to Financial Statements. | |
Janus Investment Fund | 21 |
Janus Henderson Balanced Fund
Schedule of Investments
September 30, 2019
Summary of Investments by Country - (Long Positions) (unaudited) | |||||
% of | |||||
Investment | |||||
Country | Value | Securities | |||
United States | $17,963,579,544 | 98.5 | % | ||
Canada | 170,184,816 | 0.9 | |||
Belgium | 49,923,268 | 0.3 | |||
United Kingdom | 41,541,117 | 0.2 | |||
Mexico | 7,081,262 | 0.1 | |||
Total | $18,232,310,007 | 100.0 | % |
Schedules of Affiliated Investments – (% of Net Assets)
Dividend Income(1) | Realized Gain/(Loss)(1) | Change in Unrealized Appreciation/ Depreciation(1) | Value at 9/30/19 | |||||||
Limited Partnership Interests - N/A | ||||||||||
Real Estate Investment Trusts (REITs) - N/A | ||||||||||
Colony America Homes III | $ | - | $ | (36,026) | $ | 33,720 | $ | - | ||
Investment Companies - 3.0% | ||||||||||
Money Markets - 3.0% | ||||||||||
Janus Henderson Cash Liquidity Fund LLC, 2.0434%ºº | 6,274,263 | 1,222 | - | 532,004,164 | ||||||
Total Affiliated Investments - 3.0% | $ | 6,274,263 | $ | (34,804) | $ | 33,720 | $ | 532,004,164 | ||
(1) For securities that were affiliated for a portion of the year ended September 30, 2019, this column reflects amounts for the entire year ended September 30, 2019 and not just the period in which the security was affiliated.
Share Balance at 9/30/18 | Purchases | Sales | Share Balance at 9/30/19 | |||||||
Limited Partnership Interests - N/A | ||||||||||
Real Estate Investment Trusts (REITs) - N/A | ||||||||||
Colony America Homes III | 6,162,871 | - | (6,162,871)Ð | - | ||||||
Investment Companies - 3.0% | ||||||||||
Money Markets - 3.0% | ||||||||||
Janus Henderson Cash Liquidity Fund LLC, 2.0434%ºº | 121,239,500 | 6,372,451,578 | (5,961,686,914) | 532,004,164 | ||||||
See Notes to Schedule of Investments and Other Information and Notes to Financial Statements. | |
22 | SEPTEMBER 30, 2019 |
Janus Henderson Balanced Fund
Notes to Schedule of Investments and Other Information
Balanced Index | Balanced Index is an internally-calculated, hypothetical combination of total returns from the S&P 500® Index (55%) and the Bloomberg Barclays U.S. Aggregate Bond Index (45%). |
Bloomberg Barclays U.S. Aggregate Bond Index | Bloomberg Barclays U.S. Aggregate Bond Index is a broad-based measure of the investment grade, US dollar-denominated, fixed-rate taxable bond market. |
S&P 500® Index | S&P 500® Index reflects U.S. large-cap equity performance and represents broad U.S. equity market performance. |
ICE | Intercontinental Exchange |
LIBOR | London Interbank Offered Rate |
LLC | Limited Liability Company |
LP | Limited Partnership |
PLC | Public Limited Company |
SOFR | Secured Overnight Financing Rate |
144A | Securities sold under Rule 144A of the Securities Act of 1933, as amended, are subject to legal and/or contractual restrictions on resale and may not be publicly sold without registration under the 1933 Act. Unless otherwise noted, these securities have been determined to be liquid under guidelines established by the Board of Trustees. The total value of 144A securities as of the year ended September 30, 2019 is $962,324,325, which represents 5.4% of net assets. |
* | Non-income producing security. |
‡ | Variable or floating rate security. Rate shown is the current rate as of September 30, 2019. Certain variable rate securities are not based on a published reference rate and spread; they are determined by the issuer or agent and current market conditions. Reference rate is as of reset date and may vary by security, which may not indicate a reference rate and/or spread in their description. |
ž | Issued by the same entity and traded on separate exchanges. |
ºº | Rate shown is the 7-day yield as of September 30, 2019. |
µ | Perpetual security. Perpetual securities have no stated maturity date, but they may be called/redeemed by the issuer. The date indicated represents the next call date. |
£ | The Fund may invest in certain securities that are considered affiliated companies. As defined by the Investment Company Act of 1940, as amended, an affiliated company is one in which the Fund owns 5% or more of the outstanding voting securities, or a company which is under common ownership or control. |
Ð | All or a portion is the result of a corporate action. |
Janus Investment Fund | 23 |
Janus Henderson Balanced Fund
Notes to Schedule of Investments and Other Information
The following is a summary of the inputs that were used to value the Fund’s investments in securities and other financial instruments as of September 30, 2019. See Notes to Financial Statements for more information. | ||||||||||||
Valuation Inputs Summary | ||||||||||||
Level 2 - | Level 3 - | |||||||||||
Level 1 - | Other Significant | Significant | ||||||||||
Quoted Prices | Observable Inputs | Unobservable Inputs | ||||||||||
Assets | ||||||||||||
Investments In Securities: | ||||||||||||
Asset-Backed/Commercial Mortgage-Backed Securities | $ | - | $ | 479,494,578 | $ | - | ||||||
Corporate Bonds | - | 3,420,222,478 | - | |||||||||
Mortgage-Backed Securities | - | 1,740,997,432 | - | |||||||||
United States Treasury Notes/Bonds | - | 833,385,556 | - | |||||||||
Common Stocks | 11,205,890,338 | - | - | |||||||||
Preferred Stocks | - | 20,315,461 | - | |||||||||
Investment Companies | - | 532,004,164 | - | |||||||||
Total Assets | $ | 11,205,890,338 | $ | 7,026,419,669 | $ | - | ||||||
24 | SEPTEMBER 30, 2019 |
Janus Henderson Balanced Fund
Statement of Assets and Liabilities
September 30, 2019
See footnotes at the end of the Statement. |
|
|
|
|
|
|
|
Assets: | ||||||
Unaffiliated investments, at value(1) | $ | 17,700,305,843 | ||||
Affiliated investments, at value(2) | 532,004,164 | |||||
Cash | 7,768,760 | |||||
Non-interested Trustees' deferred compensation | 460,935 | |||||
Receivables: | ||||||
Interest | 46,075,796 | |||||
Investments sold | 35,288,284 | |||||
Fund shares sold | 31,869,712 | |||||
Dividends | 11,712,909 | |||||
Dividends from affiliates | 953,103 | |||||
Foreign tax reclaims | 172,021 | |||||
Other assets | 41,923 | |||||
Total Assets |
|
| 18,366,653,450 |
| ||
Liabilities: | ||||||
Foreign cash due to custodian | 103 | |||||
Payables: | — | |||||
Investments purchased | 463,676,178 | |||||
Fund shares repurchased | 44,141,552 | |||||
Advisory fees | 8,011,107 | |||||
Dividends | 5,533,845 | |||||
Transfer agent fees and expenses | 2,277,108 | |||||
12b-1 Distribution and shareholder servicing fees | 2,114,354 | |||||
Non-interested Trustees' deferred compensation fees | 460,935 | |||||
Non-interested Trustees' fees and expenses | 118,337 | |||||
Professional fees | 110,541 | |||||
Affiliated fund administration fees payable | 36,414 | |||||
Custodian fees | 13,151 | |||||
Accrued expenses and other payables | 498,436 | |||||
Total Liabilities |
|
| 526,992,061 |
| ||
Net Assets |
| $ | 17,839,661,389 |
| ||
See Notes to Financial Statements. | |
Janus Investment Fund | 25 |
Janus Henderson Balanced Fund
Statement of Assets and Liabilities
September 30, 2019
|
|
|
|
|
|
|
Net Assets Consist of: | ||||||
Capital (par value and paid-in surplus) | $ | 13,707,060,673 | ||||
Total distributable earnings (loss) | 4,132,600,716 | |||||
Total Net Assets |
| $ | 17,839,661,389 |
| ||
Net Assets - Class A Shares | $ | 1,082,508,428 | ||||
Shares Outstanding, $0.01 Par Value (unlimited shares authorized) | 30,540,456 | |||||
Net Asset Value Per Share(3) |
| $ | 35.45 |
| ||
Maximum Offering Price Per Share(4) |
| $ | 37.61 |
| ||
Net Assets - Class C Shares | $ | 1,992,061,853 | ||||
Shares Outstanding, $0.01 Par Value (unlimited shares authorized) | 56,767,752 | |||||
Net Asset Value Per Share(3) |
| $ | 35.09 |
| ||
Net Assets - Class D Shares | $ | 1,860,899,611 | ||||
Shares Outstanding, $0.01 Par Value (unlimited shares authorized) | 52,360,207 | |||||
Net Asset Value Per Share |
| $ | 35.54 |
| ||
Net Assets - Class I Shares | $ | 5,225,683,585 | ||||
Shares Outstanding, $0.01 Par Value (unlimited shares authorized) | 146,989,427 | |||||
Net Asset Value Per Share |
| $ | 35.55 |
| ||
Net Assets - Class N Shares | $ | 946,741,471 | ||||
Shares Outstanding, $0.01 Par Value (unlimited shares authorized) | 26,660,607 | |||||
Net Asset Value Per Share |
| $ | 35.51 |
| ||
Net Assets - Class R Shares | $ | 366,620,694 | ||||
Shares Outstanding, $0.01 Par Value (unlimited shares authorized) | 10,406,019 | |||||
Net Asset Value Per Share |
| $ | 35.23 |
| ||
Net Assets - Class S Shares | $ | 551,984,530 | ||||
Shares Outstanding, $0.01 Par Value (unlimited shares authorized) | 15,577,598 | |||||
Net Asset Value Per Share |
| $ | 35.43 |
| ||
Net Assets - Class T Shares | $ | 5,813,161,217 | ||||
Shares Outstanding, $0.01 Par Value (unlimited shares authorized) | 163,794,929 | |||||
Net Asset Value Per Share |
| $ | 35.49 |
| ||
(1) Includes cost of $13,751,903,726. (2) Includes cost of $532,004,164. (3) Redemption price per share may be reduced for any applicable contingent deferred sales charge. (4) Maximum offering price is computed at 100/94.25 of net asset value. |
See Notes to Financial Statements. | |
26 | SEPTEMBER 30, 2019 |
Janus Henderson Balanced Fund
Statement of Operations
For the year ended September 30, 2019
|
|
|
|
|
|
Investment Income: | |||||
| Interest | $ | 230,749,439 | ||
Dividends | 213,391,126 | ||||
Dividends from affiliates | 6,274,263 | ||||
Other income | 576,600 | ||||
Foreign tax withheld | (711,386) | ||||
Total Investment Income |
| 450,280,042 |
| ||
Expenses: | |||||
Advisory fees | 91,015,773 | ||||
12b-1 Distribution and shareholder servicing fees: | |||||
Class A Shares | 2,262,913 | ||||
Class C Shares | 16,905,488 | ||||
Class R Shares | 1,733,584 | ||||
Class S Shares | 1,373,784 | ||||
Transfer agent administrative fees and expenses: | |||||
Class D Shares | 2,106,840 | ||||
Class R Shares | 869,652 | ||||
Class S Shares | 1,373,784 | ||||
Class T Shares | 13,687,944 | ||||
Transfer agent networking and omnibus fees: | |||||
Class A Shares | 867,748 | ||||
Class C Shares | 1,142,156 | ||||
Class I Shares | 2,949,537 | ||||
Other transfer agent fees and expenses: | |||||
Class A Shares | 71,744 | ||||
Class C Shares | 137,754 | ||||
Class D Shares | 210,115 | ||||
Class I Shares | 155,960 | ||||
Class N Shares | 39,109 | ||||
Class R Shares | 3,501 | ||||
Class S Shares | 5,254 | ||||
Class T Shares | 44,701 | ||||
Shareholder reports expense | 776,964 | ||||
Registration fees | 612,225 | ||||
Non-interested Trustees’ fees and expenses | 502,557 | ||||
Affiliated fund administration fees | 389,862 | ||||
Professional fees | 224,092 | ||||
Custodian fees | 161,209 | ||||
Other expenses | 1,647,056 | ||||
Total Expenses |
| 141,271,306 |
| ||
Less: Excess Expense Reimbursement and Waivers |
| (299,906) |
| ||
Net Expenses |
| 140,971,400 |
| ||
Net Investment Income/(Loss) |
| 309,308,642 |
| ||
See Notes to Financial Statements. | |
Janus Investment Fund | 27 |
Janus Henderson Balanced Fund
Statement of Operations
For the year ended September 30, 2019
|
|
|
|
|
|
Net Realized Gain/(Loss) on Investments: | |||||
Investments and foreign currency transactions(1) | $ | 963,750,326 | |||
Investments in affiliates | (34,804) | ||||
Total Net Realized Gain/(Loss) on Investments |
| 963,715,522 |
| ||
Change in Unrealized Net Appreciation/Depreciation: | |||||
Investments, foreign currency translations and non-interested Trustees’ deferred compensation | 33,539,628 | ||||
Investments in affiliates | 33,720 | ||||
Total Change in Unrealized Net Appreciation/Depreciation |
| 33,573,348 |
| ||
Net Increase/(Decrease) in Net Assets Resulting from Operations | $ | 1,306,597,512 |
| ||
(1) Includes $512,813,233 of realized gains and losses resulting from a redemption-in-kind during the year ended September 30, 2019. |
See Notes to Financial Statements. | |
28 | SEPTEMBER 30, 2019 |
Janus Henderson Balanced Fund
Statements of Changes in Net Assets
|
|
| Year ended |
| Year ended | |||
Operations: | ||||||||
Net investment income/(loss) | $ | 309,308,642 | $ | 230,346,440 | ||||
Net realized gain/(loss) on investments | 963,715,522 | 605,635,750 | ||||||
Change in unrealized net appreciation/depreciation | 33,573,348 | 1,047,424,483 | ||||||
Net Increase/(Decrease) in Net Assets Resulting from Operations |
| 1,306,597,512 |
|
| 1,883,406,673 | |||
Dividends and Distributions to Shareholders | ||||||||
Class A Shares | (52,849,111) | (30,992,137) | ||||||
Class C Shares | (95,581,853) | (56,163,240) | ||||||
Class D Shares | (114,091,382) | (81,003,352) | ||||||
Class I Shares | (248,241,782) | (117,849,780) | ||||||
Class N Shares | (151,398,502) | (111,964,032) | ||||||
Class R Shares | (20,705,389) | (15,173,092) | ||||||
Class S Shares | (34,594,747) | (28,750,295) | ||||||
Class T Shares | (349,870,163) | (241,991,501) | ||||||
Net Decrease from Dividends and Distributions to Shareholders |
| (1,067,332,929) |
|
| (683,887,429) | |||
Capital Share Transactions: | ||||||||
Class A Shares | 289,829,817 | 88,399,391 | ||||||
Class C Shares | 361,425,725 | 188,299,862 | ||||||
Class D Shares | 75,524,284 | 61,673,527 | ||||||
Class I Shares | 1,891,301,840 | 893,081,658 | ||||||
Class N Shares | (1,467,693,222) | 237,724,253 | ||||||
Class R Shares | 16,340,289 | (23,285,543) | ||||||
Class S Shares | (42,138,187) | (81,834,698) | ||||||
Class T Shares | 314,255,223 | 266,928,381 | ||||||
Net Increase/(Decrease) from Capital Share Transactions |
| 1,438,845,769 |
|
| 1,630,986,831 | |||
Net Increase/(Decrease) in Net Assets |
| 1,678,110,352 |
|
| 2,830,506,075 | |||
Net Assets: | ||||||||
Beginning of period | 16,161,551,037 | 13,331,044,962 | ||||||
| End of period | $ | 17,839,661,389 |
| $ | 16,161,551,037 | ||
See Notes to Financial Statements. | |
Janus Investment Fund | 29 |
Janus Henderson Balanced Fund
Financial Highlights
Class A Shares | ||||||||||||||||||
For a share outstanding during the year ended September 30 |
| 2019 |
|
| 2018 |
|
| 2017 |
|
| 2016 |
|
| 2015 |
| |||
Net Asset Value, Beginning of Period |
| $35.22 |
|
| $32.46 |
|
| $29.00 |
|
| $29.12 |
|
| $31.10 |
| |||
Income/(Loss) from Investment Operations: | ||||||||||||||||||
Net investment income/(loss)(1) | 0.60 | 0.50 | 0.52 | 0.47 | 0.55 | |||||||||||||
Net realized and unrealized gain/(loss) | 1.82 | 3.87 | 3.88 | 1.22 | (0.70) | |||||||||||||
Total from Investment Operations |
| 2.42 |
|
| 4.37 |
|
| 4.40 |
|
| 1.69 |
|
| (0.15) |
| |||
Less Dividends and Distributions: | ||||||||||||||||||
Dividends (from net investment income) | (0.60) | (0.50) | (0.59) | (0.48) | (0.52) | |||||||||||||
Distributions (from capital gains) | (1.59) | (1.11) | (0.35) | (1.33) | (1.31) | |||||||||||||
Total Dividends and Distributions |
| (2.19) |
|
| (1.61) |
|
| (0.94) |
|
| (1.81) |
|
| (1.83) |
| |||
Net Asset Value, End of Period | $35.45 | $35.22 | $32.46 | $29.00 | $29.12 | |||||||||||||
Total Return* |
| 7.73% |
|
| 13.81% |
|
| 15.44% |
|
| 5.86% |
|
| (0.59)% |
| |||
Net Assets, End of Period (in thousands) | $1,082,508 | $768,529 | $625,454 | $1,008,842 | $966,624 | |||||||||||||
Average Net Assets for the Period (in thousands) | $905,165 | $666,296 | $781,785 | $1,037,006 | $941,167 | |||||||||||||
Ratios to Average Net Assets**: |
|
|
|
|
|
|
|
|
|
|
|
|
|
|
| |||
Ratio of Gross Expenses | 0.93% | 0.95% | 0.94% | 0.94% | 0.93% | |||||||||||||
Ratio of Net Expenses (After Waivers and Expense Offsets) | 0.93% | 0.95% | 0.94% | 0.94% | 0.93% | |||||||||||||
Ratio of Net Investment Income/(Loss) | 1.78% | 1.48% | 1.68% | 1.63% | 1.78% | |||||||||||||
Portfolio Turnover Rate | 81%(2) | 88% | 60% | 83% | 75% | |||||||||||||
Class C Shares | ||||||||||||||||||
For a share outstanding during the year ended September 30 |
| 2019 |
|
| 2018 |
|
| 2017 |
|
| 2016 |
|
| 2015 |
| |||
Net Asset Value, Beginning of Period |
| $34.90 |
|
| $32.19 |
|
| $28.78 |
|
| $28.95 |
|
| $30.93 |
| |||
Income/(Loss) from Investment Operations: | ||||||||||||||||||
Net investment income/(loss)(1) | 0.37 | 0.27 | 0.31 | 0.26 | 0.34 | |||||||||||||
Net realized and unrealized gain/(loss) | 1.79 | 3.84 | 3.85 | 1.20 | (0.69) | |||||||||||||
Total from Investment Operations |
| 2.16 |
|
| 4.11 |
|
| 4.16 |
|
| 1.46 |
|
| (0.35) |
| |||
Less Dividends and Distributions: | ||||||||||||||||||
Dividends (from net investment income) | (0.38) | (0.29) | (0.40) | (0.30) | (0.32) | |||||||||||||
Distributions (from capital gains) | (1.59) | (1.11) | (0.35) | (1.33) | (1.31) | |||||||||||||
Total Dividends and Distributions |
| (1.97) |
|
| (1.40) |
|
| (0.75) |
|
| (1.63) |
|
| (1.63) |
| |||
Net Asset Value, End of Period | $35.09 | $34.90 | $32.19 | $28.78 | $28.95 | |||||||||||||
Total Return* |
| 6.98% |
|
| 13.06% |
|
| 14.67% |
|
| 5.09% |
|
| (1.25)% |
| |||
Net Assets, End of Period (in thousands) | $1,992,062 | $1,594,610 | $1,290,994 | $1,408,455 | $1,267,034 | |||||||||||||
Average Net Assets for the Period (in thousands) | $1,743,474 | $1,403,777 | $1,322,392 | $1,401,426 | $1,175,456 | |||||||||||||
Ratios to Average Net Assets**: |
|
|
|
|
|
|
|
|
|
|
|
|
|
|
| |||
Ratio of Gross Expenses | 1.62% | 1.62% | 1.61% | 1.65% | 1.61% | |||||||||||||
Ratio of Net Expenses (After Waivers and Expense Offsets) | 1.62% | 1.62% | 1.61% | 1.65% | 1.61% | |||||||||||||
Ratio of Net Investment Income/(Loss) | 1.10% | 0.81% | 1.03% | 0.92% | 1.10% | |||||||||||||
Portfolio Turnover Rate | 81%(2) | 88% | 60% | 83% | 75% | |||||||||||||
* Total return includes adjustments in accordance with generally accepted accounting principles required at the year or period end and are not annualized for periods of less than one full year. ** Annualized for periods of less than one full year. (1) Per share amounts are calculated based on average shares outstanding during the year or period. (2) Portfolio Turnover Rate excludes TBA (to be announced) purchase and sales commitments. |
See Notes to Financial Statements. | |
30 | SEPTEMBER 30, 2019 |
Janus Henderson Balanced Fund
Financial Highlights
Class D Shares | ||||||||||||||||||
For a share outstanding during the year ended September 30 |
| 2019 |
|
| 2018 |
|
| 2017 |
|
| 2016 |
|
| 2015 |
| |||
Net Asset Value, Beginning of Period |
| $35.30 |
|
| $32.52 |
|
| $29.06 |
|
| $29.17 |
|
| $31.14 |
| |||
Income/(Loss) from Investment Operations: | ||||||||||||||||||
Net investment income/(loss)(1) | 0.68 | 0.58 | 0.59 | 0.53 | 0.61 | |||||||||||||
Net realized and unrealized gain/(loss) | 1.82 | 3.89 | 3.88 | 1.22 | (0.69) | |||||||||||||
Total from Investment Operations |
| 2.50 |
|
| 4.47 |
|
| 4.47 |
|
| 1.75 |
|
| (0.08) |
| |||
Less Dividends and Distributions: | ||||||||||||||||||
Dividends (from net investment income) | (0.67) | (0.58) | (0.66) | (0.53) | (0.58) | |||||||||||||
Distributions (from capital gains) | (1.59) | (1.11) | (0.35) | (1.33) | (1.31) | |||||||||||||
Total Dividends and Distributions |
| (2.26) |
|
| (1.69) |
|
| (1.01) |
|
| (1.86) |
|
| (1.89) |
| |||
Net Asset Value, End of Period | $35.54 | $35.30 | $32.52 | $29.06 | $29.17 | |||||||||||||
Total Return* |
| 7.95% |
|
| 14.10% |
|
| 15.68% |
|
| 6.07% |
|
| (0.38)% |
| |||
Net Assets, End of Period (in thousands) | $1,860,900 | $1,761,817 | $1,562,693 | $1,411,125 | $1,382,693 | |||||||||||||
Average Net Assets for the Period (in thousands) | $1,759,287 | $1,667,210 | $1,477,105 | $1,415,240 | $1,453,548 | |||||||||||||
Ratios to Average Net Assets**: |
|
|
|
|
|
|
|
|
|
|
|
|
|
|
| |||
Ratio of Gross Expenses | 0.72% | 0.71% | 0.72% | 0.73% | 0.73% | |||||||||||||
Ratio of Net Expenses (After Waivers and Expense Offsets) | 0.72% | 0.71% | 0.72% | 0.73% | 0.73% | |||||||||||||
Ratio of Net Investment Income/(Loss) | 2.00% | 1.71% | 1.92% | 1.83% | 1.98% | |||||||||||||
Portfolio Turnover Rate | 81%(2) | 88% | 60% | 83% | 75% | |||||||||||||
Class I Shares | ||||||||||||||||||
For a share outstanding during the year ended September 30 |
| 2019 |
|
| 2018 |
|
| 2017 |
|
| 2016 |
|
| 2015 |
| |||
Net Asset Value, Beginning of Period |
| $35.31 |
|
| $32.53 |
|
| $29.06 |
|
| $29.18 |
|
| $31.15 |
| |||
Income/(Loss) from Investment Operations: | ||||||||||||||||||
Net investment income/(loss)(1) | 0.70 | 0.61 | 0.61 | 0.55 | 0.64 | |||||||||||||
Net realized and unrealized gain/(loss) | 1.83 | 3.88 | 3.89 | 1.21 | (0.70) | |||||||||||||
Total from Investment Operations |
| 2.53 |
|
| 4.49 |
|
| 4.50 |
|
| 1.76 |
|
| (0.06) |
| |||
Less Dividends and Distributions: | ||||||||||||||||||
Dividends (from net investment income) | (0.70) | (0.60) | (0.68) | (0.55) | (0.60) | |||||||||||||
Distributions (from capital gains) | (1.59) | (1.11) | (0.35) | (1.33) | (1.31) | |||||||||||||
Total Dividends and Distributions |
| (2.29) |
|
| (1.71) |
|
| (1.03) |
|
| (1.88) |
|
| (1.91) |
| |||
Net Asset Value, End of Period | $35.55 | $35.31 | $32.53 | $29.06 | $29.18 | |||||||||||||
Total Return* |
| 8.02% |
|
| 14.18% |
|
| 15.79% |
|
| 6.10% |
|
| (0.30)% |
| |||
Net Assets, End of Period (in thousands) | $5,225,684 | $3,197,893 | $2,096,893 | $1,636,459 | $1,510,302 | |||||||||||||
Average Net Assets for the Period (in thousands) | $4,116,708 | $2,460,247 | $1,795,486 | $1,651,399 | $1,482,511 | |||||||||||||
Ratios to Average Net Assets**: |
|
|
|
|
|
|
|
|
|
|
|
|
|
|
| |||
Ratio of Gross Expenses | 0.65% | 0.64% | 0.65% | 0.67% | 0.65% | |||||||||||||
Ratio of Net Expenses (After Waivers and Expense Offsets) | 0.65% | 0.64% | 0.65% | 0.67% | 0.65% | |||||||||||||
Ratio of Net Investment Income/(Loss) | 2.07% | 1.80% | 2.00% | 1.90% | 2.06% | |||||||||||||
Portfolio Turnover Rate | 81%(2) | 88% | 60% | 83% | 75% | |||||||||||||
* Total return includes adjustments in accordance with generally accepted accounting principles required at the year or period end and are not annualized for periods of less than one full year. ** Annualized for periods of less than one full year. (1) Per share amounts are calculated based on average shares outstanding during the year or period. (2) Portfolio Turnover Rate excludes TBA (to be announced) purchase and sales commitments. |
See Notes to Financial Statements. | |
Janus Investment Fund | 31 |
Janus Henderson Balanced Fund
Financial Highlights
Class N Shares | ||||||||||||||||||
For a share outstanding during the year ended September 30 |
| 2019 |
|
| 2018 |
|
| 2017 |
|
| 2016 |
|
| 2015 |
| |||
Net Asset Value, Beginning of Period |
| $35.28 |
|
| $32.50 |
|
| $29.04 |
|
| $29.15 |
|
| $31.11 |
| |||
Income/(Loss) from Investment Operations: | ||||||||||||||||||
Net investment income/(loss)(1) | 0.73 | 0.63 | 0.64 | 0.57 | 0.66 | |||||||||||||
Net realized and unrealized gain/(loss) | 1.81 | 3.88 | 3.87 | 1.22 | (0.69) | |||||||||||||
Total from Investment Operations |
| 2.54 |
|
| 4.51 |
|
| 4.51 |
|
| 1.79 |
|
| (0.03) |
| |||
Less Dividends and Distributions: | ||||||||||||||||||
Dividends (from net investment income) | (0.72) | (0.62) | (0.70) | (0.57) | (0.62) | |||||||||||||
Distributions (from capital gains) | (1.59) | (1.11) | (0.35) | (1.33) | (1.31) | |||||||||||||
Total Dividends and Distributions |
| (2.31) |
|
| (1.73) |
|
| (1.05) |
|
| (1.90) |
|
| (1.93) |
| |||
Net Asset Value, End of Period | $35.51 | $35.28 | $32.50 | $29.04 | $29.15 | |||||||||||||
Total Return* |
| 8.07% |
|
| 14.26% |
|
| 15.84% |
|
| 6.23% |
|
| (0.20)% |
| |||
Net Assets, End of Period (in thousands) | $946,741 | $2,480,945 | $2,054,731 | $1,834,036 | $1,709,643 | |||||||||||||
Average Net Assets for the Period (in thousands) | $1,651,136 | $2,273,486 | $1,952,775 | $1,801,032 | $1,751,330 | |||||||||||||
Ratios to Average Net Assets**: |
|
|
|
|
|
|
|
|
|
|
|
|
|
|
| |||
Ratio of Gross Expenses | 0.58% | 0.57% | 0.58% | 0.59% | 0.58% | |||||||||||||
Ratio of Net Expenses (After Waivers and Expense Offsets) | 0.58% | 0.57% | 0.58% | 0.59% | 0.58% | |||||||||||||
Ratio of Net Investment Income/(Loss) | 2.19% | 1.86% | 2.07% | 1.98% | 2.14% | |||||||||||||
Portfolio Turnover Rate | 81%(2) | 88% | 60% | 83% | 75% | |||||||||||||
Class R Shares | ||||||||||||||||||
For a share outstanding during the year ended September 30 |
| 2019 |
|
| 2018 |
|
| 2017 |
|
| 2016 |
|
| 2015 |
| |||
Net Asset Value, Beginning of Period |
| $35.02 |
|
| $32.29 |
|
| $28.87 |
|
| $29.02 |
|
| $30.99 |
| |||
Income/(Loss) from Investment Operations: | ||||||||||||||||||
Net investment income/(loss)(1) | 0.47 | 0.37 | 0.40 | 0.35 | 0.43 | |||||||||||||
Net realized and unrealized gain/(loss) | 1.80 | 3.85 | 3.87 | 1.21 | (0.68) | |||||||||||||
Total from Investment Operations |
| 2.27 |
|
| 4.22 |
|
| 4.27 |
|
| 1.56 |
|
| (0.25) |
| |||
Less Dividends and Distributions: | ||||||||||||||||||
Dividends (from net investment income) | (0.47) | (0.38) | (0.50) | (0.38) | (0.41) | |||||||||||||
Distributions (from capital gains) | (1.59) | (1.11) | (0.35) | (1.33) | (1.31) | |||||||||||||
Total Dividends and Distributions |
| (2.06) |
|
| (1.49) |
|
| (0.85) |
|
| (1.71) |
|
| (1.72) |
| |||
Net Asset Value, End of Period | $35.23 | $35.02 | $32.29 | $28.87 | $29.02 | |||||||||||||
Total Return* |
| 7.29% |
|
| 13.38% |
|
| 15.02% |
|
| 5.40% |
|
| (0.94)% |
| |||
Net Assets, End of Period (in thousands) | $366,621 | $345,667 | $341,389 | $283,729 | $281,398 | |||||||||||||
Average Net Assets for the Period (in thousands) | $347,861 | $339,637 | $327,651 | $288,241 | $297,615 | |||||||||||||
Ratios to Average Net Assets**: |
|
|
|
|
|
|
|
|
|
|
|
|
|
|
| |||
Ratio of Gross Expenses | 1.32% | 1.32% | 1.32% | 1.34% | 1.31% | |||||||||||||
Ratio of Net Expenses (After Waivers and Expense Offsets) | 1.32% | 1.32% | 1.32% | 1.34% | 1.31% | |||||||||||||
Ratio of Net Investment Income/(Loss) | 1.39% | 1.11% | 1.33% | 1.23% | 1.39% | |||||||||||||
Portfolio Turnover Rate | 81%(2) | 88% | 60% | 83% | 75% | |||||||||||||
* Total return includes adjustments in accordance with generally accepted accounting principles required at the year or period end and are not annualized for periods of less than one full year. ** Annualized for periods of less than one full year. (1) Per share amounts are calculated based on average shares outstanding during the year or period. (2) Portfolio Turnover Rate excludes TBA (to be announced) purchase and sales commitments. |
See Notes to Financial Statements. | |
32 | SEPTEMBER 30, 2019 |
Janus Henderson Balanced Fund
Financial Highlights
Class S Shares | ||||||||||||||||||
For a share outstanding during the year ended September 30 |
| 2019 |
|
| 2018 |
|
| 2017 |
|
| 2016 |
|
| 2015 |
| |||
Net Asset Value, Beginning of Period |
| $35.20 |
|
| $32.44 |
|
| $28.99 |
|
| $29.12 |
|
| $31.09 |
| |||
Income/(Loss) from Investment Operations: | ||||||||||||||||||
Net investment income/(loss)(1) | 0.55 | 0.46 | 0.48 | 0.43 | 0.50 | |||||||||||||
Net realized and unrealized gain/(loss) | 1.82 | 3.87 | 3.88 | 1.21 | (0.68) | |||||||||||||
Total from Investment Operations |
| 2.37 |
|
| 4.33 |
|
| 4.36 |
|
| 1.64 |
|
| (0.18) |
| |||
Less Dividends and Distributions: | ||||||||||||||||||
Dividends (from net investment income) | (0.55) | (0.46) | (0.56) | (0.44) | (0.48) | |||||||||||||
Distributions (from capital gains) | (1.59) | (1.11) | (0.35) | (1.33) | (1.31) | |||||||||||||
Total Dividends and Distributions |
| (2.14) |
|
| (1.57) |
|
| (0.91) |
|
| (1.77) |
|
| (1.79) |
| |||
Net Asset Value, End of Period | $35.43 | $35.20 | $32.44 | $28.99 | $29.12 | |||||||||||||
Total Return* |
| 7.56% |
|
| 13.67% |
|
| 15.30% |
|
| 5.68% |
|
| (0.71)% |
| |||
Net Assets, End of Period (in thousands) | $551,985 | $589,812 | $622,279 | $657,563 | $750,461 | |||||||||||||
Average Net Assets for the Period (in thousands) | $549,514 | $610,278 | $637,727 | $706,818 | $828,503 | |||||||||||||
Ratios to Average Net Assets**: |
|
|
|
|
|
|
|
|
|
|
|
|
|
|
| |||
Ratio of Gross Expenses | 1.08% | 1.07% | 1.07% | 1.09% | 1.08% | |||||||||||||
Ratio of Net Expenses (After Waivers and Expense Offsets) | 1.07% | 1.07% | 1.07% | 1.08% | 1.07% | |||||||||||||
Ratio of Net Investment Income/(Loss) | 1.64% | 1.36% | 1.57% | 1.48% | 1.63% | |||||||||||||
Portfolio Turnover Rate | 81%(2) | 88% | 60% | 83% | 75% | |||||||||||||
Class T Shares | |||||||||||||||||||
For a share outstanding during the year ended September 30 |
|
| 2019 |
|
| 2018 |
|
| 2017 |
|
| 2016 |
|
| 2015 |
| |||
Net Asset Value, Beginning of Period |
|
| $35.26 |
|
| $32.49 |
|
| $29.02 |
|
| $29.15 |
|
| $31.12 |
| |||
Income/(Loss) from Investment Operations: | |||||||||||||||||||
Net investment income/(loss)(1) | 0.64 | 0.54 | 0.56 | 0.50 | 0.58 | ||||||||||||||
Net realized and unrealized gain/(loss) | 1.82 | 3.88 | 3.89 | 1.20 | (0.69) | ||||||||||||||
Total from Investment Operations |
|
| 2.46 |
|
| 4.42 |
|
| 4.45 |
|
| 1.70 |
|
| (0.11) |
| |||
Less Dividends and Distributions: | |||||||||||||||||||
Dividends (from net investment income) | (0.64) | (0.54) | (0.63) | (0.50) | (0.55) | ||||||||||||||
Distributions (from capital gains) | (1.59) | (1.11) | (0.35) | (1.33) | (1.31) | ||||||||||||||
Total Dividends and Distributions |
|
| (2.23) |
|
| (1.65) |
|
| (0.98) |
|
| (1.83) |
|
| (1.86) |
| |||
Net Asset Value, End of Period | $35.49 | $35.26 | $32.49 | $29.02 | $29.15 | ||||||||||||||
Total Return* |
|
| 7.82% |
|
| 13.97% |
|
| 15.62% |
|
| 5.92% |
|
| (0.46)% |
| |||
Net Assets, End of Period (in thousands) | $5,813,161 | $5,422,276 | $4,736,612 | $4,664,334 | $4,734,896 | ||||||||||||||
Average Net Assets for the Period (in thousands) | $5,475,178 | $5,098,558 | $4,654,904 | $4,856,359 | $4,872,456 | ||||||||||||||
Ratios to Average Net Assets**: |
|
|
|
|
|
|
|
|
|
|
|
|
|
|
|
| |||
Ratio of Gross Expenses | 0.83% | 0.82% | 0.83% | 0.84% | 0.83% | ||||||||||||||
Ratio of Net Expenses (After Waivers and Expense Offsets) | 0.82% | 0.82% | 0.82% | 0.83% | 0.82% | ||||||||||||||
Ratio of Net Investment Income/(Loss) | 1.90% | 1.61% | 1.83% | 1.74% | 1.89% | ||||||||||||||
Portfolio Turnover Rate | 81%(2) | 88% | 60% | 83% | 75% | ||||||||||||||
* Total return includes adjustments in accordance with generally accepted accounting principles required at the year or period end and are not annualized for periods of less than one full year. ** Annualized for periods of less than one full year. (1) Per share amounts are calculated based on average shares outstanding during the year or period. (2) Portfolio Turnover Rate excludes TBA (to be announced) purchase and sales commitments. |
See Notes to Financial Statements. | |
Janus Investment Fund | 33 |
Janus Henderson Balanced Fund
Notes to Financial Statements
1. Organization and Significant Accounting Policies
Janus Henderson Balanced Fund (the “Fund”) is a series of Janus Investment Fund (the “Trust”), which is organized as a Massachusetts business trust and is registered under the Investment Company Act of 1940, as amended (the “1940 Act”), as an open-end management investment company, and therefore has applied the specialized accounting and reporting guidance in Financial Accounting Standards Board (“FASB”) Accounting Standards Codification (“ASC”) Topic 946. The Trust offers 47 funds, each of which offers multiple share classes, with differing investment objectives and policies. The Fund seeks long-term capital growth, consistent with preservation of capital and balanced by current income. The Fund is classified as diversified, as defined in the 1940 Act.
The Fund offers multiple classes of shares in order to meet the needs of various types of investors. Each class represents an interest in the same portfolio of investments. Certain financial intermediaries may not offer all classes of shares. Class D Shares are closed to certain new investors.
Shareholders, including other funds, individuals, accounts, as well as the Fund’s portfolio manager(s) and/or investment personnel, may from time to time own (beneficially or of record) a significant percentage of the Fund’s Shares and can be considered to “control” the Fund when that ownership exceeds 25% of the Fund’s assets (and which may differ from control as determined in accordance with accounting principles generally accepted in the United States of America).
Class A Shares are offered through financial intermediary platforms including, but not limited to, traditional brokerage platforms, mutual fund wrap fee programs, bank trust platforms, and retirement platforms.
Class C Shares are offered through financial intermediary platforms including, but not limited to, traditional brokerage platforms, mutual fund wrap fee programs, and bank trust platforms.
Class C Shares are closed to investments by new employer-sponsored retirement plans and existing employer-sponsored retirement plans are no longer able to make additional purchases or exchanges into Class C Shares.
The Funds have adopted an auto-conversion policy pursuant to which Class C Shares that have been held for ten years will be automatically converted to Class A Shares without the imposition of any sales charge, fee or other charge. The conversion will generally occur no later than ten business days in the month following the month of the tenth anniversary of the date of purchase. Class C Shares purchased through the reinvestment of dividends and other distributions on Class C Shares will convert to Class A Shares at the same time as the Class C Shares with respect to which they were purchased. For Class C Shares held in omnibus accounts on intermediary platforms, the Fund will rely on these intermediaries to implement this conversion feature. Your financial intermediary may have separate policies and procedures as to when and how Class C Shares may be converted to Class A Shares. Please contact your financial intermediary for additional information.
Class D Shares are generally no longer being made available to new investors who do not already have a direct account with the Janus Henderson funds. Class D Shares are available only to investors who hold accounts directly with the Janus Henderson funds, to immediate family members or members of the same household of an eligible individual investor, and to existing beneficial owners of sole proprietorships or partnerships that hold accounts directly with the Janus Henderson funds.
Class I Shares are available through certain financial intermediary platforms including, but not limited to, mutual fund wrap fee programs, managed account programs, asset allocation programs, bank trust platforms, as well as certain retirement platforms. Class I Shares are also available to certain direct institutional investors including, but not limited to, corporations, certain retirement plans, public plans, and foundations/endowments, who established Class I Share accounts before August 4, 2017.
Class N Shares are generally available only to financial intermediaries purchasing on behalf of: 1) certain adviser-assisted, employer-sponsored retirement plans, including 401(k) plans, 457 plans, 403(b) plans, Taft-Hartley multi-employer plans, profit-sharing and money purchase pension plans, defined benefit plans and certain welfare benefit plans, such as health savings accounts, and nonqualified deferred compensation plans; and 2) retail investors purchasing in qualified or nonqualified accounts, whose accounts are held through an omnibus account at their financial intermediary, and where the financial intermediary requires no payment or reimbursement from the Fund, Janus Capital Management LLC (“Janus Capital”), or its affiliates. Class N Shares are also available to Janus Henderson proprietary products and to certain direct institutional investors approved by Janus Distributors LLC dba Janus Henderson
34 | SEPTEMBER 30, 2019 |
Janus Henderson Balanced Fund
Notes to Financial Statements
Distributors (“Janus Henderson Distributors”) including, but not limited to, corporations, certain retirement plans, public plans, and foundations and endowments, subject to minimum investment requirements.
Class R Shares are offered through financial intermediary platforms including, but not limited to, retirement platforms.
Class S Shares are offered through financial intermediary platforms including, but not limited to, retirement platforms and asset allocation, mutual fund wrap, or other discretionary or nondiscretionary fee-based investment advisory programs. In addition, Class S Shares may be available through certain financial intermediaries who have an agreement with Janus Capital or its affiliates to offer Class S Shares on their supermarket platforms.
Class T Shares are available through certain financial intermediary platforms including, but not limited to, mutual fund wrap fee programs, managed account programs, asset allocation programs, bank trust platforms, as well as certain retirement platforms. In addition, Class T Shares may be available through certain financial intermediaries who have an agreement with Janus Capital or its affiliates to offer Class T Shares on their supermarket platforms.
The following accounting policies have been followed by the Fund and are in conformity with accounting principles generally accepted in the United States of America.
Investment Valuation
Securities held by the Fund are valued in accordance with policies and procedures established by and under the supervision of the Trustees (the “Valuation Procedures”). Equity securities traded on a domestic securities exchange are generally valued at the closing prices on the primary market or exchange on which they trade. If such price is lacking for the trading period immediately preceding the time of determination, such securities are valued at their current bid price. Equity securities that are traded on a foreign exchange are generally valued at the closing prices on such markets. In the event that there is no current trading volume on a particular security in such foreign exchange, the bid price from the primary exchange is generally used to value the security. Securities that are traded on the over-the-counter (“OTC”) markets are generally valued at their closing or latest bid prices as available. Foreign securities and currencies are converted to U.S. dollars using the applicable exchange rate in effect at the close of the New York Stock Exchange (“NYSE”). The Fund will determine the market value of individual securities held by it by using prices provided by one or more approved professional pricing services or, as needed, by obtaining market quotations from independent broker-dealers. Most debt securities are valued in accordance with the evaluated bid price supplied by the pricing service that is intended to reflect market value. The evaluated bid price supplied by the pricing service is an evaluation that may consider factors such as security prices, yields, maturities and ratings. Certain short-term securities maturing within 60 days or less may be evaluated and valued on an amortized cost basis provided that the amortized cost determined approximates market value. Securities for which market quotations or evaluated prices are not readily available or deemed unreliable are valued at fair value determined in good faith under the Valuation Procedures. Circumstances in which fair value pricing may be utilized include, but are not limited to: (i) a significant event that may affect the securities of a single issuer, such as a merger, bankruptcy, or significant issuer-specific development; (ii) an event that may affect an entire market, such as a natural disaster or significant governmental action; (iii) a nonsignificant event such as a market closing early or not opening, or a security trading halt; and (iv) pricing of a nonvalued security and a restricted or nonpublic security. Special valuation considerations may apply with respect to “odd-lot” fixed-income transactions which, due to their small size, may receive evaluated prices by pricing services which reflect a large block trade and not what actually could be obtained for the odd-lot position. The Fund uses systematic fair valuation models provided by independent third parties to value international equity securities in order to adjust for stale pricing, which may occur between the close of certain foreign exchanges and the close of the NYSE.
Valuation Inputs Summary
FASB ASC 820, Fair Value Measurements and Disclosures (“ASC 820”), defines fair value, establishes a framework for measuring fair value, and expands disclosure requirements regarding fair value measurements. This standard emphasizes that fair value is a market-based measurement that should be determined based on the assumptions that market participants would use in pricing an asset or liability and establishes a hierarchy that prioritizes inputs to valuation techniques used to measure fair value. These inputs are summarized into three broad levels:
Level 1 – Unadjusted quoted prices in active markets the Fund has the ability to access for identical assets or liabilities.
Level 2 – Observable inputs other than unadjusted quoted prices included in Level 1 that are observable for the asset or liability either directly or indirectly. These inputs may include quoted prices for the identical instrument on
Janus Investment Fund | 35 |
Janus Henderson Balanced Fund
Notes to Financial Statements
an inactive market, prices for similar instruments, interest rates, prepayment speeds, credit risk, yield curves, default rates and similar data.
Assets or liabilities categorized as Level 2 in the hierarchy generally include: debt securities fair valued in accordance with the evaluated bid or ask prices supplied by a pricing service; securities traded on OTC markets and listed securities for which no sales are reported that are fair valued at the latest bid price (or yield equivalent thereof) obtained from one or more dealers transacting in a market for such securities or by a pricing service approved by the Fund’s Trustees; certain short-term debt securities with maturities of 60 days or less that are fair valued at amortized cost; and equity securities of foreign issuers whose fair value is determined by using systematic fair valuation models provided by independent third parties in order to adjust for stale pricing which may occur between the close of certain foreign exchanges and the close of the NYSE. Other securities that may be categorized as Level 2 in the hierarchy include, but are not limited to, preferred stocks, bank loans, swaps, investments in unregistered investment companies, options, and forward contracts.
Level 3 – Unobservable inputs for the asset or liability to the extent that relevant observable inputs are not available, representing the Fund’s own assumptions about the assumptions that a market participant would use in valuing the asset or liability, and that would be based on the best information available.
There have been no significant changes in valuation techniques used in valuing any such positions held by the Fund since the beginning of the fiscal year.
The inputs or methodology used for fair valuing securities are not necessarily an indication of the risk associated with investing in those securities. The summary of inputs used as of September 30, 2019 to fair value the Fund’s investments in securities and other financial instruments is included in the “Valuation Inputs Summary” in the Notes to Schedule of Investments and Other Information.
Investment Transactions and Investment Income
Investment transactions are accounted for as of the date purchased or sold (trade date). Dividend income is recorded on the ex-dividend date. Certain dividends from foreign securities will be recorded as soon as the Fund is informed of the dividend, if such information is obtained subsequent to the ex-dividend date. Dividends from foreign securities may be subject to withholding taxes in foreign jurisdictions. Interest income is recorded daily on an accrual basis and includes amortization of premiums and accretion of discounts. The Fund classifies gains and losses on prepayments received as an adjustment to interest income. Debt securities may be placed in non-accrual status and related interest income may be reduced by stopping current accruals and writing off interest receivables when collection of all or a portion of interest has become doubtful. Gains and losses are determined on the identified cost basis, which is the same basis used for federal income tax purposes. Income, as well as gains and losses, both realized and unrealized, are allocated daily to each class of shares based upon the ratio of net assets represented by each class as a percentage of total net assets.
Expenses
The Fund bears expenses incurred specifically on its behalf. Each class of shares bears a portion of general expenses, which are allocated daily to each class of shares based upon the ratio of net assets represented by each class as a percentage of total net assets. Expenses directly attributable to a specific class of shares are charged against the operations of such class.
Estimates
The preparation of financial statements in conformity with accounting principles generally accepted in the United States of America requires management to make estimates and assumptions that affect the reported amount of assets and liabilities and disclosure of contingent assets and liabilities at the date of the financial statements, and the reported amounts of income and expenses during the reporting period. Actual results could differ from those estimates.
Indemnifications
In the normal course of business, the Fund may enter into contracts that contain provisions for indemnification of other parties against certain potential liabilities. The Fund’s maximum exposure under these arrangements is unknown, and would involve future claims that may be made against the Fund that have not yet occurred. Currently, the risk of material loss from such claims is considered remote.
36 | SEPTEMBER 30, 2019 |
Janus Henderson Balanced Fund
Notes to Financial Statements
Foreign Currency Translations
The Fund does not isolate that portion of the results of operations resulting from the effect of changes in foreign exchange rates on investments from the fluctuations arising from changes in market prices of securities held at the date of the financial statements. Net unrealized appreciation or depreciation of investments and foreign currency translations arise from changes in the value of assets and liabilities, including investments in securities held at the date of the financial statements, resulting from changes in the exchange rates and changes in market prices of securities held.
Currency gains and losses are also calculated on payables and receivables that are denominated in foreign currencies. The payables and receivables are generally related to foreign security transactions and income translations.
Foreign currency-denominated assets and forward currency contracts may involve more risks than domestic transactions, including currency risk, counterparty risk, political and economic risk, regulatory risk and equity risk. Risks may arise from unanticipated movements in the value of foreign currencies relative to the U.S. dollar.
Dividends and Distributions
Dividends of net investment income are generally declared and distributed quarterly, and realized capital gains (if any) are distributed annually. The Fund may treat a portion of the amount paid to redeem shares as a distribution of investment company taxable income and realized capital gains that are reflected in the net asset value. This practice, commonly referred to as “equalization,” has no effect on the redeeming shareholder or a Fund’s total return, but may reduce the amounts that would otherwise be required to be paid as taxable dividends to the remaining shareholders. It is possible that the Internal Revenue Service (IRS) could challenge the Funds’ equalization methodology or calculations, and any such challenge could result in additional tax, interest, or penalties to be paid by the Fund.
The Fund may make certain investments in real estate investment trusts (“REITs”) which pay dividends to their shareholders based upon funds available from operations. It is quite common for these dividends to exceed the REITs’ taxable earnings and profits, resulting in the excess portion of such dividends being designated as a return of capital. If the Fund distributes such amounts, such distributions could constitute a return of capital to shareholders for federal income tax purposes.
Federal Income Taxes
The Fund intends to continue to qualify as a regulated investment company and distribute all of its taxable income in accordance with the requirements of Subchapter M of the Internal Revenue Code. Management has analyzed the Fund’s tax positions taken for all open federal income tax years, generally a three-year period, and has concluded that no provision for federal income tax is required in the Fund’s financial statements. The Fund is not aware of any tax positions for which it is reasonably possible that the total amounts of unrecognized tax benefits will significantly change in the next twelve months.
2. Other Investments and Strategies
Additional Investment Risk
In the aftermath of the 2007-2008 financial crisis, the financial sector experienced reduced liquidity in credit and other fixed-income markets, and an unusually high degree of volatility, both domestically and internationally. In response to the crisis, the United States and certain foreign governments, along with the U.S. Federal Reserve and certain foreign central banks, took steps to support the financial markets. For example, the enactment of the Dodd-Frank Act in 2010 provided for widespread regulation of financial institutions, consumer financial products and services, broker-dealers, over-the-counter derivatives, investment advisers, credit rating agencies, and mortgage lending, which expanded federal oversight in the financial sector, including the investment management industry. The withdrawal of this support, a failure of measures put in place to respond to the crisis, or investor perception that such efforts were not sufficient could each negatively affect financial markets generally, and the value and liquidity of specific securities. In addition, policy and legislative changes in the United States and in other countries continue to impact many aspects of financial regulation.
A number of countries in the European Union (“EU”) have experienced, and may continue to experience, severe economic and financial difficulties. In particular, many EU nations are susceptible to economic risks associated with high levels of debt. Many non-governmental issuers, and even certain governments, have defaulted on, or been forced to restructure, their debts. Many other issuers have faced difficulties obtaining credit or refinancing existing obligations. Financial institutions have in many cases required government or central bank support, have needed to raise capital, and/or have been impaired in their ability to extend credit. As a result, financial markets in the EU experienced extreme
Janus Investment Fund | 37 |
Janus Henderson Balanced Fund
Notes to Financial Statements
volatility and declines in asset values and liquidity. Responses to these financial problems by European governments, central banks, and others, including austerity measures and reforms, may not work, may result in social unrest, and may limit future growth and economic recovery or have other unintended consequences. The risk of investing in securities in the European markets may also be heightened due to the referendum in which the United Kingdom voted to exit the EU (commonly known as “Brexit”). There is considerable uncertainty about how Brexit will be conducted, how negotiations of necessary treaties and trade agreements will conclude, or how financial markets will react.
Certain areas of the world have historically been prone to and economically sensitive to environmental events such as, but not limited to, hurricanes, earthquakes, typhoons, flooding, tidal waves, tsunamis, erupting volcanoes, wildfires or droughts, tornadoes, mudslides, or other weather-related phenomena. Such disasters, and the resulting physical or economic damage, could have a severe and negative impact on the Fund’s investment portfolio and, in the longer term, could impair the ability of issuers in which the Fund invests to conduct their businesses as they would under normal conditions. Adverse weather conditions may also have a particularly significant negative effect on issuers in the agricultural sector and on insurance companies that insure against the impact of natural disasters.
Loans
The Fund may invest in various commercial loans, including bank loans, bridge loans, debtor-in-possession (“DIP”) loans, mezzanine loans, and other fixed and floating rate loans. These loans may be acquired through loan participations and assignments or on a when-issued basis. Commercial loans will comprise no more than 20% of the Fund’s total assets. Below are descriptions of the types of loans held by the Fund as of September 30, 2019.
· Bank Loans - Bank loans are obligations of companies or other entities entered into in connection with recapitalizations, acquisitions, and refinancings. The Fund’s investments in bank loans are generally acquired as a participation interest in, or assignment of, loans originated by a lender or other financial institution. These investments may include institutionally-traded floating and fixed-rate debt securities.
· Floating Rate Loans – Floating rate loans are debt securities that have floating interest rates, that adjust periodically, and are tied to a benchmark lending rate, such as London Interbank Offered Rate (“LIBOR”). In other cases, the lending rate could be tied to the prime rate offered by one or more major U.S. banks or the rate paid on large certificates of deposit traded in the secondary markets. If the benchmark lending rate changes, the rate payable to lenders under the loan will change at the next scheduled adjustment date specified in the loan agreement. Floating rate loans are typically issued to companies (‘‘borrowers’’) in connection with recapitalizations, acquisitions, and refinancings. Floating rate loan investments are generally below investment grade. Senior floating rate loans are secured by specific collateral of a borrower and are senior in the borrower’s capital structure. The senior position in the borrower’s capital structure generally gives holders of senior loans a claim on certain of the borrower’s assets that is senior to subordinated debt and preferred and common stock in the case of a borrower’s default. Floating rate loan investments may involve foreign borrowers, and investments may be denominated in foreign currencies. Floating rate loans often involve borrowers whose financial condition is troubled or uncertain and companies that are highly leveraged. The Fund may invest in obligations of borrowers who are in bankruptcy proceedings. While the Fund generally expects to invest in fully funded term loans, certain of the loans in which the Fund may invest include revolving loans, bridge loans, and delayed draw term loans.
Purchasers of floating rate loans may pay and/or receive certain fees. The Fund may receive fees such as covenant waiver fees or prepayment penalty fees. The Fund may pay fees such as facility fees. Such fees may affect the Fund’s return.
· Mezzanine Loans - Mezzanine loans are secured by the stock of the company that owns the assets. Mezzanine loans are a hybrid of debt and equity financing that is typically used to fund the expansion of existing companies. A mezzanine loan is composed of debt capital that gives the lender the right to convert to an ownership or equity interest in the company if the loan is not paid back in time and in full. Mezzanine loans typically are the most subordinated debt obligation in an issuer’s capital structure.
Mortgage- and Asset-Backed Securities
Mortgage- and asset-backed securities represent interests in “pools” of commercial or residential mortgages or other assets, including consumer loans or receivables. The Fund may purchase fixed or variable rate commercial or residential mortgage-backed securities issued by the Government National Mortgage Association (“Ginnie Mae”), the Federal National Mortgage Association (“Fannie Mae”), the Federal Home Loan Mortgage Corporation (“Freddie Mac”), or other
38 | SEPTEMBER 30, 2019 |
Janus Henderson Balanced Fund
Notes to Financial Statements
governmental or government-related entities. Ginnie Mae’s guarantees are backed by the full faith and credit of the U.S. Government, which means that the U.S. Government guarantees that the interest and principal will be paid when due. Fannie Mae and Freddie Mac securities are not backed by the full faith and credit of the U.S. Government. In September 2008, the Federal Housing Finance Agency (“FHFA”), an agency of the U.S. Government, placed Fannie Mae and Freddie Mac under conservatorship. Since that time, Fannie Mae and Freddie Mac have received capital support through U.S. Treasury preferred stock purchases, and Treasury and Federal Reserve purchases of their mortgage-backed securities. The FHFA and the U.S. Treasury have imposed strict limits on the size of these entities’ mortgage portfolios. The FHFA has the power to cancel any contract entered into by Fannie Mae and Freddie Mac prior to FHFA’s appointment as conservator or receiver, including the guarantee obligations of Fannie Mae and Freddie Mac.
The Fund may also purchase other mortgage- and asset-backed securities through single- and multi-seller conduits, collateralized debt obligations, structured investment vehicles, and other similar securities. Asset-backed securities may be backed by various consumer obligations, including automobile loans, equipment leases, credit card receivables, or other collateral. In the event the underlying loans are not paid, the securities’ issuer could be forced to sell the assets and recognize losses on such assets, which could impact your return. Unlike traditional debt instruments, payments on these securities include both interest and a partial payment of principal. Mortgage- and asset-backed securities are subject to both extension risk, where borrowers pay off their debt obligations more slowly in times of rising interest rates, and prepayment risk, where borrowers pay off their debt obligations sooner than expected in times of declining interest rates. These risks may reduce the Fund’s returns. In addition, investments in mortgage- and asset-backed securities, including those comprised of subprime mortgages, may be subject to a higher degree of credit risk, valuation risk, and liquidity risk than various other types of fixed-income securities. Additionally, although mortgage-backed securities are generally supported by some form of government or private guarantee and/or insurance, there is no assurance that guarantors or insurers will meet their obligations.
Real Estate Investing
The Fund may invest in equity and debt securities of real estate-related companies. Such companies may include those in the real estate industry or real estate-related industries. These securities may include common stocks, corporate bonds, preferred stocks, and other equity securities, including, but not limited to, mortgage-backed securities, real estate-backed securities, securities of REITs and similar REIT-like entities. A REIT is a trust that invests in real estate-related projects, such as properties, mortgage loans, and construction loans. REITs are generally categorized as equity, mortgage, or hybrid REITs. A REIT may be listed on an exchange or traded OTC.
Sovereign Debt
The Fund may invest in U.S. and non-U.S. government debt securities (“sovereign debt”). Some investments in sovereign debt, such as U.S. sovereign debt, are considered low risk. However, investments in sovereign debt, especially the debt of less developed countries, can involve a high degree of risk, including the risk that the governmental entity that controls the repayment of sovereign debt may not be willing or able to repay the principal and/or to pay the interest on its sovereign debt in a timely manner. A sovereign debtor’s willingness or ability to satisfy its debt obligation may be affected by various factors including, but not limited to, its cash flow situation, the extent of its foreign currency reserves, the availability of foreign exchange when a payment is due, the relative size of its debt position in relation to its economy as a whole, the sovereign debtor’s policy toward international lenders, and local political constraints to which the governmental entity may be subject. Sovereign debtors may also be dependent on expected disbursements from foreign governments, multilateral agencies, and other entities. The failure of a sovereign debtor to implement economic reforms, achieve specified levels of economic performance, or repay principal or interest when due may result in the cancellation of third party commitments to lend funds to the sovereign debtor, which may further impair such debtor’s ability or willingness to timely service its debts. The Fund may be requested to participate in the rescheduling of such sovereign debt and to extend further loans to governmental entities, which may adversely affect the Fund’s holdings. In the event of default, there may be limited or no legal remedies for collecting sovereign debt and there may be no bankruptcy proceedings through which the Fund may collect all or part of the sovereign debt that a governmental entity has not repaid. In addition, to the extent the Fund invests in non-U.S. sovereign debt, it may be subject to currency risk.
TBA Commitments
The Fund may enter into “to be announced” or “TBA” commitments. TBAs are forward agreements for the purchase or sale of securities, including mortgage-backed securities, for a fixed price, with payment and delivery on an agreed upon future settlement date. The specific securities to be delivered are not identified at the trade date. However, delivered securities must meet specified terms, including issuer, rate, and mortgage terms. Although the particular TBA securities
Janus Investment Fund | 39 |
Janus Henderson Balanced Fund
Notes to Financial Statements
must meet industry-accepted “good delivery” standards, there can be no assurance that a security purchased on forward commitment basis will ultimately be issued or delivered by the counterparty. During the settlement period, the Fund will still bear the risk of any decline in the value of the security to be delivered. Because TBA commitments do not require the purchase and sale of identical securities, the characteristics of the security delivered to the Fund may be less favorable than the security delivered to the dealer. If the counterparty to a transaction fails to deliver the security, the Fund could suffer a loss.
When-Issued, Delayed Delivery and Forward Commitment Transactions
The Fund may purchase or sell securities on a when-issued, delayed delivery, or forward commitment basis. When purchasing a security on a when-issued, delayed delivery, or forward commitment basis, the Fund assumes the rights and risks of ownership of the security, including the risk of price and yield fluctuations, and takes such fluctuations into account when determining its net asset value. Typically, no income accrues on securities the Fund has committed to purchase prior to the time delivery of the securities is made. Because the Fund is not required to pay for the security until the delivery date, these risks are in addition to the risks associated with the Fund’s other investments. If the other party to a transaction fails to deliver the securities, the Fund could miss a favorable price or yield opportunity. If the Fund remains substantially fully invested at a time when when-issued, delayed delivery, or forward commitment purchases are outstanding, the purchases may result in a form of leverage.
When the Fund has sold a security on a when-issued, delayed delivery, or forward commitment basis, the Fund does not participate in future gains or losses with respect to the security. If the other party to a transaction fails to pay for the securities, the Fund could suffer a loss. Additionally, when selling a security on a when-issued, delayed delivery, or forward commitment basis without owning the security, the Fund will incur a loss if the security’s price appreciates in value such that the security’s price is above the agreed upon price on the settlement date. The Fund may dispose of or renegotiate a transaction after it is entered into, and may purchase or sell when-issued, delayed delivery or forward commitment securities before the settlement date, which may result in a gain or loss.
3. Investment Advisory Agreements and Other Transactions with Affiliates
The Fund pay Janus Capital an investment advisory fee which is calculated daily and paid monthly. The Fund’s contractual investment advisory fee rate (expressed as an annual rate) is 0.55% of its average daily net assets.
Janus Capital has contractually agreed to waive the advisory fee payable by the Fund or reimburse expenses in an amount equal to the amount, if any, that the Fund’s total annual fund operating expenses, including the investment advisory fee, but excluding the fees payable pursuant to a Rule 12b-1 plan, shareholder servicing fees, such as transfer agency fees (including out-of-pocket costs), administrative services fees and any networking/omnibus/administrative fees payable by any share class, brokerage commissions, interest, dividends, taxes, acquired fund fees and expenses, and extraordinary expenses, exceed the annual rate of 0.68% of the Fund’s average daily net assets. Janus Capital has agreed to continue the waivers until at least February 1, 2020. If applicable, amounts waived and/or reimbursed to the Fund by Janus Capital are disclosed as “Excess Expense Reimbursement and Waivers” on the Statement of Operations.
Janus Services LLC (“Janus Services”), a wholly-owned subsidiary of Janus Capital, is the Fund’s transfer agent. In addition, Janus Services provides or arranges for the provision of certain other administrative services including, but not limited to, recordkeeping, accounting, order processing, and other shareholder services for the Fund. Janus Services is not compensated for its services related to the shares, except for out-of-pocket costs. These amounts are disclosed as “Other transfer agent fees and expenses” on the Statement of Operations.
Certain, but not all, intermediaries may charge administrative fees (such as networking and omnibus) to investors in Class A Shares, Class C Shares, and Class I Shares for administrative services provided on behalf of such investors. These administrative fees are paid by the Class A Shares, Class C Shares, and Class I Shares of the Fund to Janus Services, which uses such fees to reimburse intermediaries. Consistent with the Transfer Agency Agreement between Janus Services and the Fund, Janus Services may negotiate the level, structure, and/or terms of the administrative fees with intermediaries requiring such fees on behalf of the Fund. Janus Capital and its affiliates benefit from an increase in assets that may result from such relationships. The Funds’ Trustees have set limits on fees that the Funds may incur with respect to administrative fees paid for omnibus or networked accounts. Such limits are subject to change by the Trustees in the future. These amounts are disclosed as “Transfer agent networking and omnibus fees” on the Statement of Operations.
40 | SEPTEMBER 30, 2019 |
Janus Henderson Balanced Fund
Notes to Financial Statements
Effective July 1, 2019, the Board of Trustees of Janus Investment Fund approved a new administrative fee rate for Class D Shares detailed in the table below.
Average Daily Net Assets of Class D Shares of the Janus Henderson funds | Administrative Services Fee |
Under $40 billion | 0.12% |
$40 billion – $49.9 billion | 0.10% |
Over $49.9 billion | 0.08% |
The Fund’s actual Class D administrative fee rate was 0.12% for the reporting period.
Prior to July 1, 2019, the Fund’s Class D Shares paid an administrative services fee at an annual rate of 0.12% of the average daily net assets of Class D Shares for shareholder services provided by Janus Services. Janus Services provides or arranges for the provision of shareholder services including, but not limited to, recordkeeping, accounting, answering inquiries regarding accounts, transaction processing, transaction confirmations, and the mailing of prospectuses and shareholder reports. These amounts are disclosed as “Transfer agent administrative fees and expenses” on the Statement of Operations.
Janus Services receives an administrative services fee at an annual rate of up to 0.25% of the average daily net assets of the Fund’s Class R Shares, Class S Shares, and Class T Shares for providing or procuring administrative services to investors in Class R Shares, Class S Shares, and Class T Shares of the Fund. Janus Services expects to use all or a significant portion of this fee to compensate retirement plan service providers, broker-dealers, bank trust departments, financial advisors, and other financial intermediaries for providing these services. Janus Services or its affiliates may also pay fees for services provided by intermediaries to the extent the fees charged by intermediaries exceed the 0.25% of net assets charged to Class R Shares, Class S Shares, and Class T Shares of the Fund. Janus Services may keep certain amounts retained for reimbursement of out-of-pocket costs incurred for servicing clients of Class R Shares, Class S Shares, and Class T Shares. These amounts are disclosed as “Transfer agent administrative fees and expenses” on the Statement of Operations.
Services provided by these financial intermediaries may include, but are not limited to, recordkeeping, subaccounting, order processing, providing order confirmations, periodic statements, forwarding prospectuses, shareholder reports, and other materials to existing customers, answering inquiries regarding accounts, and other administrative services. Order processing includes the submission of transactions through the National Securities Clearing Corporation (“NSCC”) or similar systems, or those processed on a manual basis with Janus Capital. For all share classes, Janus Services also seeks reimbursement for costs it incurs as transfer agent and for providing servicing.
Janus Services is compensated for its services related to the Fund’s Class D Shares. These amounts are disclosed as “Other transfer agent fees and expenses” on the Statement of Operations.
Under a distribution and shareholder servicing plan (the “Plan”) adopted in accordance with Rule 12b-1 under the 1940 Act, the Fund pays the Trust’s distributor, Janus Henderson Distributors, a wholly-owned subsidiary of Janus Capital, a fee for the sale and distribution and/or shareholder servicing of the Shares at an annual rate of up to 0.25% of the Class A Shares’ average daily net assets, of up to 1.00% of the Class C Shares’ average daily net assets, of up to 0.50% of the Class R Shares' average daily net assets, and of up to 0.25% of the Class S Shares’ average daily net assets. Under the terms of the Plan, the Trust is authorized to make payments to Janus Henderson Distributors for remittance to retirement plan service providers, broker-dealers, bank trust departments, financial advisors, and other financial intermediaries, as compensation for distribution and/or shareholder services performed by such entities for their customers who are investors in the Fund. These amounts are disclosed as “12b-1 Distribution and shareholder servicing fees” on the Statement of Operations. Payments under the Plan are not tied exclusively to actual 12b-1 distribution and shareholder service expenses, and the payments may exceed 12b-1 distribution and shareholder service expenses actually incurred. If any of the Fund’s actual 12b-1 distribution and shareholder service expenses incurred during a calendar year are less than the payments made during a calendar year, the Fund will be refunded the difference. Refunds, if any, are included in “12b-1 Distribution and shareholder servicing fees” in the Statement of Operations.
Janus Capital serves as administrator to the Fund pursuant to an administration agreement between Janus Capital and the Trust. Under the administration agreement, Janus Capital is obligated to provide or arrange for the provision of certain administration, compliance, and accounting services to the Fund, including providing office space for the Fund, and is reimbursed by the Fund for certain of its costs in providing these services (to the extent Janus Capital seeks
Janus Investment Fund | 41 |
Janus Henderson Balanced Fund
Notes to Financial Statements
reimbursement and such costs are not otherwise waived). In addition, employees of Janus Capital and/or its affiliates may serve as officers of the Trust. The Fund pays for some or all of the salaries, fees, and expenses of Janus Capital employees and Fund officers, with respect to certain specified administration functions they perform on behalf of the Fund. The Fund pays these costs based on out-of-pocket expenses incurred by Janus Capital, and these costs are separate and apart from advisory fees and other expenses paid in connection with the investment advisory services Janus Capital (or any subadvisor, as applicable) provides to the Fund. These amounts are disclosed as “Affiliated fund administration fees” on the Statement of Operations. In addition, some expenses related to compensation payable to the Fund’s Chief Compliance Officer and certain compliance staff, all of whom are employees of Janus Capital and/or its affiliates, are shared with the Fund. Total compensation of $484,142 was paid to the Chief Compliance Officer and certain compliance staff by the Trust during the year ended September 30, 2019. The Fund's portion is reported as part of “Other expenses” on the Statement of Operations.
The Board of Trustees has adopted a deferred compensation plan (the “Deferred Plan”) for independent Trustees to elect to defer receipt of all or a portion of the annual compensation they are entitled to receive from the Fund. All deferred fees are credited to an account established in the name of the Trustees. The amounts credited to the account then increase or decrease, as the case may be, in accordance with the performance of one or more of the Janus Henderson funds that are selected by the Trustees. The account balance continues to fluctuate in accordance with the performance of the selected fund or funds until final payment of all amounts are credited to the account. The fluctuation of the account balance is recorded by the Fund as unrealized appreciation/(depreciation) and is included as of September 30, 2019 on the Statement of Assets and Liabilities in the asset, “Non-interested Trustees’ deferred compensation,” and liability, “Non-interested Trustees’ deferred compensation fees.” Additionally, the recorded unrealized appreciation/(depreciation) is included in “Unrealized net appreciation/(depreciation) of investments, foreign currency translations and non-interested Trustees’ deferred compensation” on the Statement of Assets and Liabilities. Deferred compensation expenses for the year ended September 30, 2019 are included in “Non-interested Trustees’ fees and expenses” on the Statement of Operations. Trustees are allowed to change their designation of mutual funds from time to time. Amounts will be deferred until distributed in accordance with the Deferred Plan. Deferred fees of $475,338 were paid by the Trust to the Trustees under the Deferred Plan during the year ended September 30, 2019.
Pursuant to the provisions of the 1940 Act and related rules, the Fund may participate in an affiliated or non-affiliated cash sweep program. In the cash sweep program, uninvested cash balances of the Fund may be used to purchase shares of affiliated or non-affiliated money market funds or cash management pooled investment vehicles that operate as money market funds. The Fund is eligible to participate in the cash sweep program (the “Investing Funds”). As adviser, Janus Capital has an inherent conflict of interest because of its fiduciary duties to the affiliated money market funds or cash management pooled investment vehicles and the Investing Funds. Janus Henderson Cash Liquidity Fund LLC (the “Sweep Vehicle”) is an affiliated unregistered cash management pooled investment vehicle that invests primarily in highly-rated short-term fixed-income securities. The Sweep Vehicle operates as an “institutional” money market fund and prices its shares at NAV reflecting market-based values of its portfolio securities (i.e., a “floating” NAV) rounded to the fourth decimal place (e.g., $1.0000). The Sweep Vehicle is permitted to impose a liquidity fee (of up to 2%) on redemptions from the Sweep Vehicle or a redemption gate that temporarily suspends redemptions from the Sweep Vehicle for up to 10 business days during a 90 day period. There are no restrictions on the Fund's ability to withdraw investments from the Sweep Vehicle at will, and there are no unfunded capital commitments due from the Fund to the Sweep Vehicle. The Sweep Vehicle does not charge any management fee, sales charge or service fee.
Any purchases and sales, realized gains/losses and recorded dividends from affiliated investments during the year ended September 30, 2019 can be found in the “Schedules of Affiliated Investments” located in the Schedule of Investments.
Class A Shares include a 5.75% upfront sales charge of the offering price of the Fund. The sales charge is allocated between Janus Henderson Distributors and financial intermediaries. During the year ended September 30, 2019, Janus Henderson Distributors retained upfront sales charges of $1,028,324.
A contingent deferred sales charge (“CDSC”) of 1.00% will be deducted with respect to Class A Shares purchased without a sales load and redeemed within 12 months of purchase, unless waived. Any applicable CDSC will be 1.00% of the lesser of the original purchase price or the value of the redemption of the Class A Shares redeemed. During the year ended September 30, 2019, redeeming shareholders of Class A Shares paid CDSCs of $22,738 to Janus Henderson Distributors.
42 | SEPTEMBER 30, 2019 |
Janus Henderson Balanced Fund
Notes to Financial Statements
A CDSC of 1.00% will be deducted with respect to Class C Shares redeemed within 12 months of purchase, unless waived. Any applicable CDSC will be 1.00% of the lesser of the original purchase price or the value of the redemption of the Class C Shares redeemed. During the year ended September 30, 2019, redeeming shareholders of Class C Shares paid CDSCs of $242,700.
The Fund is permitted to purchase or sell securities (“cross-trade”) between itself and other funds or accounts managed by Janus Capital in accordance with Rule 17a-7 under the Investment Company Act of 1940 (“Rule 17a-7”), when the transaction is consistent with the investment objectives and policies of the Fund and in accordance with the Internal Cross Trade Procedures adopted by the Trust’s Board of Trustees. These procedures have been designed to ensure that any cross-trade of securities by the Fund from or to another fund or account that is or could be considered an affiliate of the Fund under certain limited circumstances by virtue of having a common investment adviser, common Officer, or common Trustee complies with Rule 17a-7. Under these procedures, each cross-trade is effected at the current market price to save costs where allowed. During the year ended September 30, 2019, the Fund engaged in cross trades amounting to $361,805,429 in purchases and $34,468,031 in sales, resulting in a net realized loss of $412,757. The net realized loss is included within the “Net Realized Gain/(Loss) on Investments” section of the Fund’s Statement of Operations.
4. Federal Income Tax
The tax components of capital shown in the table below represent: (1) distribution requirements the Fund must satisfy under the income tax regulations; (2) losses or deductions the Fund may be able to offset against income and gains realized in future years; and (3) unrealized appreciation or depreciation of investments for federal income tax purposes.
Other book to tax differences primarily consist of deferred compensation. The Fund has elected to treat gains and losses on forward foreign currency contracts as capital gains and losses, if applicable. Other foreign currency gains and losses on debt instruments are treated as ordinary income for federal income tax purposes pursuant to Section 988 of the Internal Revenue Code.
Loss Deferrals | Other Book | Net Tax | |||||
Undistributed | Undistributed | Accumulated | Late-Year | Post-October | to Tax | Appreciation/ | |
$ 54,956,663 | $ 148,785,291 | $ - | $ - | $ - | $ (415,680) | $3,929,274,442 | |
The aggregate cost of investments and the composition of unrealized appreciation and depreciation of investment securities for federal income tax purposes as of September 30, 2019 are noted below. The primary differences between book and tax appreciation or depreciation of investments are wash sale loss deferrals and investments in partnerships.
Federal Tax Cost | Unrealized | Unrealized | Net Tax Appreciation/ |
$ 14,303,035,565 | $4,064,845,388 | $(135,570,946) | $ 3,929,274,442 |
Janus Investment Fund | 43 |
Janus Henderson Balanced Fund
Notes to Financial Statements
Income and capital gains distributions are determined in accordance with income tax regulations that may differ from accounting principles generally accepted in the United States of America. These differences are due to differing treatments for items such as net short-term gains, deferral of wash sale losses, foreign currency transactions, and capital loss carryovers. Certain permanent differences such as tax returns of capital and net investment losses noted below have been reclassified to capital.
For the year ended September 30, 2019 | ||||
Distributions | ||||
From Ordinary Income | From Long-Term Capital Gains | Tax Return of Capital | Net Investment Loss | |
$ 310,066,951 | $ 757,265,978 | $ - | $ - | |
For the year ended September 30, 2018 | ||||
Distributions | ||||
From Ordinary Income | From Long-Term Capital Gains | Tax Return of Capital | Net Investment Loss | |
$ 232,344,680 | $ 451,542,749 | $ - | $ - | |
Permanent book to tax basis differences may result in reclassifications between the components of net assets. These differences have no impact on the results of operations or net assets. The following reclassifications have been made to the Fund:
Increase/(Decrease) to Capital | Increase/(Decrease) to Undistributed | Increase/(Decrease) to Undistributed |
$ 527,431,276 | $ 9,064,399 | $ (536,495,675) |
Capital has been adjusted by $17,019,211, all of which is long-term capital gain, for distributions in connection with Fund share redemptions (tax equalization).
44 | SEPTEMBER 30, 2019 |
Janus Henderson Balanced Fund
Notes to Financial Statements
5. Capital Share Transactions
Year ended September 30, 2019 | Year ended September 30, 2018 | |||||
Shares | Amount | Shares | Amount | |||
Class A Shares: | ||||||
Shares sold | 16,273,731 | $ 546,664,019 | 7,711,873 | $ 262,344,651 | ||
Reinvested dividends and distributions | 1,279,011 | 40,621,372 | 685,030 | 22,698,836 | ||
Shares repurchased | (8,834,343) | (297,455,574) | (5,846,216) | (196,644,096) | ||
Net Increase/(Decrease) | 8,718,399 | $ 289,829,817 |
| 2,550,687 | $ 88,399,391 | |
Class C Shares: | ||||||
Shares sold | 20,508,534 | $ 682,788,094 | 11,914,884 | $ 400,945,569 | ||
Reinvested dividends and distributions | 2,666,974 | 83,192,013 | 1,463,080 | 47,959,330 | ||
Shares repurchased | (12,097,343) | (404,554,382) | (7,792,574) | (260,605,037) | ||
Net Increase/(Decrease) | 11,078,165 | $ 361,425,725 |
| 5,585,390 | $ 188,299,862 | |
Class D Shares: | ||||||
Shares sold | 4,308,843 | $ 145,313,079 | 4,027,607 | $ 136,140,889 | ||
Reinvested dividends and distributions | 3,502,200 | 111,225,665 | 2,380,330 | 79,049,288 | ||
Shares repurchased | (5,359,070) | (181,014,460) | (4,547,747) | (153,516,650) | ||
Net Increase/(Decrease) | 2,451,973 | $ 75,524,284 |
| 1,860,190 | $ 61,673,527 | |
Class I Shares: | ||||||
Shares sold | 83,283,385 | $ 2,799,350,771 | 42,715,098 | $1,457,353,192 | ||
Reinvested dividends and distributions | 6,424,417 | 205,281,317 | 2,828,037 | 94,126,294 | ||
Shares repurchased | (33,278,896) | (1,113,330,248) | (19,436,315) | (658,397,828) | ||
Net Increase/(Decrease) | 56,428,906 | $ 1,891,301,840 |
| 26,106,820 | $ 893,081,658 | |
Class N Shares: | ||||||
Shares sold | 14,742,448 | $ 497,826,442 | 12,069,205 | $ 408,403,498 | ||
Reinvested dividends and distributions | 4,735,435 | 148,864,551 | 3,367,860 | 111,853,805 | ||
Shares repurchased | (63,140,484) | (2,114,384,215) | (8,331,331) | (282,533,050) | ||
Net Increase/(Decrease) | (43,662,601) | $(1,467,693,222) |
| 7,105,734 | $ 237,724,253 | |
Class R Shares: | ||||||
Shares sold | 2,670,202 | $ 89,136,212 | 1,805,672 | $ 60,736,128 | ||
Reinvested dividends and distributions | 622,703 | 19,521,398 | 426,954 | 14,042,797 | ||
Shares repurchased | (2,756,799) | (92,317,321) | (2,935,300) | (98,064,468) | ||
Net Increase/(Decrease) | 536,106 | $ 16,340,289 |
| (702,674) | $ (23,285,543) | |
Class S Shares: | ||||||
Shares sold | 3,341,925 | $ 112,023,136 | 3,061,183 | $ 103,174,114 | ||
Reinvested dividends and distributions | 1,090,566 | 34,407,371 | 864,701 | 28,595,766 | ||
Shares repurchased | (5,609,009) | (188,568,694) | (6,353,867) | (213,604,578) | ||
Net Increase/(Decrease) | (1,176,518) | $ (42,138,187) |
| (2,427,983) | $ (81,834,698) | |
Class T Shares: | ||||||
Shares sold | 36,126,617 | $ 1,205,562,581 | 30,485,638 | $1,030,049,011 | ||
Reinvested dividends and distributions | 10,938,919 | 346,719,896 | 7,228,929 | 239,724,774 | ||
Shares repurchased | (37,069,284) | (1,238,027,254) | (29,722,726) | (1,002,845,404) | ||
Net Increase/(Decrease) | 9,996,252 | $ 314,255,223 |
| 7,991,841 | $ 266,928,381 | |
6. Purchases and Sales of Investment Securities
For the year ended September 30, 2019, the aggregate cost of purchases and proceeds from sales of investment securities (excluding any short-term securities, short-term options contracts, TBAs, and in-kind transactions, as applicable) was as follows:
Purchases of | Proceeds from Sales | Purchases of Long- | Proceeds from Sales |
$8,333,577,397 | $4,895,839,759 | $ 6,461,445,328 | $ 6,770,726,338 |
Janus Investment Fund | 45 |
Janus Henderson Balanced Fund
Notes to Financial Statements
7. Recent Accounting Pronouncements
The FASB issued Accounting Standards Update No. 2017-08, Receivables – Nonrefundable Fees and Other Costs (Subtopic 310-20), Premium Amortization on Purchased Callable Debt Securities ("ASU 2017-08") to amend the amortization period for certain purchased callable debt securities held at a premium. The guidance requires certain premiums on callable debt securities to be amortized to the earliest call date. The amortization period for callable debt securities purchased at a discount will not be impacted. The amendments are effective for fiscal years and interim periods within those fiscal years, beginning after December 15, 2018. Management is currently evaluating the impacts of ASU 2017-08 on the Fund’s financial statements.
The FASB issued Accounting Standards Update 2018-13, Fair Value Measurement (Topic 820) in August 2018. The new guidance removes, modifies and enhances the disclosures to Topic 820. For public entities, the amendments are effective for financial statements issued for fiscal years beginning after December 15, 2019, and interim periods within those fiscal years. An entity is permitted, and Management has decided, to early adopt the removed and modified disclosures in these financial statements.
8. Subsequent Event
Management has evaluated whether any events or transactions occurred subsequent to September 30, 2019 and through the date of issuance of the Fund’s financial statements and determined that there were no material events or transactions that would require recognition or disclosure in the Fund’s financial statements.
46 | SEPTEMBER 30, 2019 |
Janus Henderson Balanced Fund
Report of Independent Registered Public Accounting Firm
To the Board of Trustees of Janus Investment Fund and Shareholders of Janus Henderson Balanced Fund:
Opinion on the Financial Statements
We have audited the accompanying statement of assets and liabilities, including the schedule of investments, of Janus Henderson Balanced Fund (one of the funds constituting Janus Investment Fund, referred to hereafter as the "Fund") as of September 30, 2019, the related statement of operations for the year ended September 30, 2019, the statements of changes in net assets for each of the two years in the period ended September 30, 2019, including the related notes, and the financial highlights for each of the five years in the period ended September 30, 2019 (collectively referred to as the “financial statements”). In our opinion, the financial statements present fairly, in all material respects, the financial position of the Fund as of September 30, 2019, the results of its operations for the year then ended, the changes in its net assets for each of the two years in the period ended September 30, 2019 and the financial highlights for each of the five years in the period ended September 30, 2019 in conformity with accounting principles generally accepted in the United States of America.
Basis for Opinion
These financial statements are the responsibility of the Fund’s management. Our responsibility is to express an opinion on the Fund’s financial statements based on our audits. We are a public accounting firm registered with the Public Company Accounting Oversight Board (United States) (PCAOB) and are required to be independent with respect to the Fund in accordance with the U.S. federal securities laws and the applicable rules and regulations of the Securities and Exchange Commission and the PCAOB.
We conducted our audits of these financial statements in accordance with the standards of the PCAOB. Those standards require that we plan and perform the audit to obtain reasonable assurance about whether the financial statements are free of material misstatement, whether due to error or fraud.
Our audits included performing procedures to assess the risks of material misstatement of the financial statements, whether due to error or fraud, and performing procedures that respond to those risks. Such procedures included examining, on a test basis, evidence regarding the amounts and disclosures in the financial statements. Our audits also included evaluating the accounting principles used and significant estimates made by management, as well as evaluating the overall presentation of the financial statements. Our procedures included confirmation of securities owned as of September 30, 2019 by correspondence with the custodian, transfer agent and brokers; when replies were not received from brokers, we performed other auditing procedures. We believe that our audits provide a reasonable basis for our opinion.

Denver, Colorado
November 15, 2019
We have served as the auditor of one or more investment companies in Janus Henderson Funds since 1990.
Janus Investment Fund | 47 |
Janus Henderson Balanced Fund
Additional Information (unaudited)
Proxy Voting Policies and Voting Record
A description of the policies and procedures that the Fund uses to determine how to vote proxies relating to its portfolio securities is available without charge: (i) upon request, by calling 1-800-525-1093; (ii) on the Fund’s website at janushenderson.com/proxyvoting; and (iii) on the SEC’s website at http://www.sec.gov. Additionally, information regarding the Fund’s proxy voting record for the most recent twelve-month period ended June 30 is also available, free of charge, through janushenderson.com/proxyvoting and from the SEC’s website at http://www.sec.gov.
Full Holdings
The Fund is required to disclose its complete holdings on Form N-Q within 60 days of the end of the first and third fiscal quarters, and in the annual report and semiannual report to Fund shareholders. These reports (i) are available on the SEC’s website at http://www.sec.gov; (ii) may be reviewed and copied at the SEC’s Public Reference Room in Washington, D.C. (information on the Public Reference Room may be obtained by calling 1-800-SEC-0330); and (iii) are available without charge, upon request, by calling a Janus Henderson representative at 1-877-335-2687 (toll free) (or 1-800-525-3713 if you hold Class D Shares). Portfolio holdings consisting of at least the names of the holdings are generally available on a monthly basis with a 30-day lag. Holdings are generally posted approximately two business days thereafter under Full Holdings for the Fund at janushenderson.com/info (or janushenderson.com/reports if you hold Class D Shares).
APPROVAL OF ADVISORY AGREEMENTS DURING THE PERIOD
Renewal of Advisory and Sub-Advisory Agreements with Janus Capital and Janus Capital Affiliates during the Period
The Trustees of Janus Investment Fund, each of whom serves as an “independent” Trustee (the “Trustees”), oversee the management of each Fund of Janus Investment Fund (each, a “JIF Fund,” and collectively, the “JIF Funds”), as well as each Portfolio of Janus Aspen Series (together with the JIF Funds, the “Janus Henderson Funds,” and each, a “Janus Henderson Fund”). As required by law, the Trustees determine annually whether to continue the investment advisory agreement for each Janus Henderson Fund and the subadvisory agreement for each Janus Henderson Funds that utilizes a subadviser.
In connection with their most recent consideration of those agreements for each Janus Henderson Fund, the Trustees received and reviewed information provided by Janus Capital and each subadviser in response to requests of the Trustees and their independent legal counsel. They also received and reviewed information and analysis provided by, and in response to requests of, their independent fee consultant. Throughout their consideration of the agreements, the Trustees were advised by their independent legal counsel. The Trustees met with management to consider the agreements and the information provided, and also met separately in executive session with their independent legal counsel and their independent fee consultant.
At a meeting held on December 6, 2018, based on the Trustees’ evaluation of the information provided by Janus Capital, the subadvisers, and the independent fee consultant, as well as other information, the Trustees determined that the overall arrangements between each Janus Henderson Fund and Janus Capital and each subadviser, as applicable, were fair and reasonable in light of the nature, extent and quality of the services provided by Janus Capital, its affiliates and the subadvisers, the fees charged for those services, and other matters that the Trustees considered relevant in the exercise of their business judgment. At that meeting, the Trustees unanimously approved the continuation of the investment advisory agreement for each Janus Henderson Fund, and the subadvisory agreement for each subadvised Janus Henderson Fund, for the period from February 1, 2019 through February 1, 2020, subject to earlier termination as provided for in each agreement.
In considering the continuation of those agreements, the Trustees reviewed and analyzed various factors that they determined were relevant, including the factors described below, none of which by itself was considered dispositive. However, the material factors and conclusions that formed the basis for the Trustees’ determination to approve the continuation of the agreements are discussed separately below. Also included is a summary of the independent fee consultant’s conclusions and opinions that arose during, and were included as part of, the Trustees’ consideration of the agreements. “Management fees,” as used herein, refer to actual annual advisory fees (and, for the purposes of peer comparisons any administration fees excluding out of pocket costs), net of any waivers, paid by a fund as a percentage of average net assets.
48 | SEPTEMBER 30, 2019 |
Janus Henderson Balanced Fund
Additional Information (unaudited)
Nature, Extent and Quality of Services
The Trustees reviewed the nature, extent and quality of the services provided by Janus Capital and the subadvisers to the Janus Henderson Funds, taking into account the investment objective, strategies and policies of each Janus Henderson Fund, and the knowledge the Trustees gained from their regular meetings with management on at least a quarterly basis and their ongoing review of information related to the Janus Henderson Funds. In addition, the Trustees reviewed the resources and key personnel of Janus Capital and each subadviser, particularly noting those employees who provide investment and risk management services to the Janus Henderson Funds. The Trustees also considered other services provided to the Janus Henderson Funds by Janus Capital or the subadvisers, such as managing the execution of portfolio transactions and the selection of broker-dealers for those transactions. The Trustees considered Janus Capital’s role as administrator to the Janus Henderson Funds, noting that Janus Capital does not receive a fee for its services but is reimbursed for its out-of-pocket costs. The Trustees considered the role of Janus Capital in monitoring adherence to the Janus Henderson Funds’ investment restrictions, providing support services for the Trustees and Trustee committees, and overseeing communications with fund shareholders and the activities of other service providers, including monitoring compliance with various policies and procedures of the Janus Henderson Funds and with applicable securities laws and regulations.
In this regard, the independent fee consultant noted that Janus Capital provides a number of different services for the Janus Henderson Funds and fund shareholders, ranging from investment management services to various other servicing functions, and that, in its view, Janus Capital is a capable provider of those services. The independent fee consultant also expressed the view that Janus Capital has developed a number of institutional competitive advantages that should enable it to provide superior investment and service performance over the long term.
The Trustees concluded that the nature, extent and quality of the services provided by Janus Capital and the subadviser to each Janus Henderson Fund that utilizes a subadviser were appropriate and consistent with the terms of the respective investment advisory and subadvisory agreements, and that, taking into account steps taken to address those Janus Henderson Funds whose performance lagged that of their peers for certain periods, the Janus Henderson Funds were likely to benefit from the continued provision of those services. They also concluded that Janus Capital and each subadviser had sufficient personnel, with the appropriate education and experience, to serve the Janus Henderson Funds effectively and had demonstrated its ability to attract well-qualified personnel.
Performance of the Funds
The Trustees considered the performance results of each Janus Henderson Fund over various time periods. They noted that they considered Janus Henderson Fund performance data throughout the year, including periodic meetings with each Janus Henderson Fund’s portfolio manager(s), and also reviewed information comparing each Janus Henderson Fund’s performance with the performance of comparable funds and peer groups identified by Broadridge Financial Solutions, Inc. (“Broadridge”), an independent data provider, and with the Janus Henderson Fund’s benchmark index. In this regard, the independent fee consultant found that the overall Janus Henderson Funds’ performance has been reasonable: for the 36 months ended September 30, 2018, approximately 48% of the Janus Henderson Funds were in the top two quartiles of performance, as reported by Morningstar, and for the 12 months ended September 30, 2018, approximately 56% of the Janus Henderson Funds were in the top two quartiles of performance, as reported by Morningstar.
The Trustees considered the performance of each Janus Henderson Fund, noting that performance may vary by share class, and noted the following with respect to the JIF Funds:
Alternative Fund
· For Janus Henderson Diversified Alternatives Fund, the Trustees noted that the Fund’s performance was in the second Broadridge quartile for the 36 months ended May 31, 2018 and the second Broadridge quartile for the 12 months ended May 31, 2018.
Asset Allocation Funds
· For Janus Henderson Global Allocation Fund – Conservative, the Trustees noted that the Fund’s performance was in the second Broadridge quartile for the 36 months ended May 31, 2018 and the first Broadridge quartile for the 12 months ended May 31, 2018.
Janus Investment Fund | 49 |
Janus Henderson Balanced Fund
Additional Information (unaudited)
· For Janus Henderson Global Allocation Fund – Growth, the Trustees noted that the Fund’s performance was in the third Broadridge quartile for the 36 months ended May 31, 2018 and the first Broadridge quartile for the 12 months ended May 31, 2018. The Trustees noted the reasons for the Fund’s underperformance, the steps Janus Capital had taken or was taking to improve performance, and that the performance trend was improving.
· For Janus Henderson Global Allocation Fund – Moderate, the Trustees noted that the Fund’s performance was in the third Broadridge quartile for the 36 months ended May 31, 2018 and the first Broadridge quartile for the 12 months ended May 31, 2018. The Trustees noted the reasons for the Fund’s underperformance, the steps Janus Capital had taken or was taking to improve performance, and that the performance trend was improving.
Fixed-Income Funds
· For Janus Henderson Flexible Bond Fund, the Trustees noted that the Fund’s performance was in the bottom Broadridge quartile for the 36 months ended May 31, 2018 and the third Broadridge quartile for the 12 months ended May 31, 2018. The Trustees noted the reasons for the Fund’s underperformance and the steps Janus Capital had taken or was taking to improve performance.
· For Janus Henderson Global Bond Fund, the Trustees noted that the Fund’s performance was in the bottom Broadridge quartile for the 36 months ended May 31, 2018 and the first Broadridge quartile for the 12 months ended May 31, 2018. The Trustees noted the reasons for the Fund’s underperformance, the steps Janus Capital had taken or was taking to improve performance, and that the performance trend was improving.
· For Janus Henderson Absolute Return Income Opportunities Fund (formerly, Janus Henderson Global Unconstrained Bond Fund), the Trustees noted that the Fund’s performance was in the bottom Broadridge quartile for the 36 months ended May 31, 2018 and the bottom Broadridge quartile for the 12 months ended May 31, 2018. The Trustees noted the reasons for the Fund’s underperformance and the steps Janus Capital had taken or was taking to improve performance.
· For Janus Henderson High-Yield Fund, the Trustees noted that the Fund’s performance was in the second Broadridge quartile for the 36 months ended May 31, 2018 and the third Broadridge quartile for the 12 months ended May 31, 2018.
· For Janus Henderson Multi-Sector Income Fund, the Trustees noted that the Fund’s performance was in the first Broadridge quartile for the 36 months ended May 31, 2018 and the first Broadridge quartile for the 12 months ended May 31, 2018.
· For Janus Henderson Short-Term Bond Fund, the Trustees noted that the Fund’s performance was in the bottom Broadridge quartile for the 36 months ended May 31, 2018 and the bottom Broadridge quartile for the 12 months ended May 31, 2018. The Trustees noted the reasons for the Fund’s underperformance and the steps Janus Capital had taken or was taking to improve performance.
· For Janus Henderson Developed World Bond Fund (formerly, Janus Henderson Strategic Income Fund), the Trustees noted that the Fund’s performance was in the second Broadridge quartile for the 36 months ended May 31, 2018 and the third Broadridge quartile for the 12 months ended May 31, 2018.
Global and International Equity Funds
· For Janus Henderson Asia Equity Fund, the Trustees noted that the Fund’s performance was in the third Broadridge quartile for the 36 months ended May 31, 2018 and the bottom Broadridge quartile for the 12 months ended May 31, 2018. The Trustees noted the reasons for the Fund’s underperformance, noting that the Fund has a performance fee structure that results in lower management fees during periods of underperformance, and the steps Janus Capital had taken or was taking to improve performance.
· For Janus Henderson Emerging Markets Fund, the Trustees noted that the Fund’s performance was in the third Broadridge quartile for the 36 months ended May 31, 2018 and the bottom Broadridge quartile for the 12 months ended May 31, 2018. The Trustees noted the reasons for the Fund’s underperformance and the steps Janus Capital had taken or was taking to improve performance.
· For Janus Henderson European Focus Fund, the Trustees noted that the Fund’s performance was in the bottom Broadridge quartile for the 36 months ended May 31, 2018 and the bottom Broadridge quartile for the 12 months
50 | SEPTEMBER 30, 2019 |
Janus Henderson Balanced Fund
Additional Information (unaudited)
ended May 31, 2018. The Trustees noted the reasons for the Fund’s underperformance and the steps Janus Capital had taken or was taking to improve performance.
· For Janus Henderson Global Equity Income Fund, the Trustees noted that the Fund’s performance was in the bottom Broadridge quartile for the 36 months ended May 31, 2018 and the bottom Broadridge quartile for the 12 months ended May 31, 2018. The Trustees noted the reasons for the Fund’s underperformance and the steps Janus Capital had taken or was taking to improve performance.
· For Janus Henderson Global Life Sciences Fund, the Trustees noted that the Fund’s performance was in the second Broadridge quartile for the 36 months ended May 31, 2018 and the first Broadridge quartile for the 12 months ended May 31, 2018.
· For Janus Henderson Global Real Estate Fund, the Trustees noted that the Fund’s performance was in the first Broadridge quartile for the 36 months ended May 31, 2018 and the first Broadridge quartile for the 12 months ended May 31, 2018.
· For Janus Henderson Global Research Fund, the Trustees noted that the Fund’s performance was in the third Broadridge quartile for the 36 months ended May 31, 2018 and the third Broadridge quartile for the 12 months ended May 31, 2018. The Trustees noted the reasons for the Fund’s underperformance, while also noting that the Fund has a performance fee structure that results in lower management fees during periods of underperformance, and the steps Janus Capital had taken or was taking to improve performance.
· For Janus Henderson Global Select Fund, the Trustees noted that the Fund’s performance was in the third Broadridge quartile for the 36 months ended May 31, 2018 and the first Broadridge quartile for the 12 months ended May 31, 2018. The Trustees noted the reasons for the Fund’s underperformance, the steps Janus Capital had taken or was taking to improve performance, and that the performance trend was improving.
· For Janus Henderson Global Technology Fund, the Trustees noted that the Fund’s performance was in the second Broadridge quartile for the 36 months ended May 31, 2018 and the third Broadridge quartile for the 12 months ended May 31, 2018.
· For Janus Henderson Global Value Fund, the Trustees noted that the Fund’s performance was in the bottom Broadridge quartile for the 36 months ended May 31, 2018 and the third Broadridge quartile for the 12 months ended May 31, 2018. The Trustees noted the reasons for the Fund’s underperformance, while also noting that the Fund has a performance fee structure that results in lower management fees during periods of underperformance, and the steps Janus Capital and Perkins had taken or were taking to improve performance.
· For Janus Henderson International Opportunities Fund, the Trustees noted that the Fund’s performance was in the bottom Broadridge quartile for the 36 months ended May 31, 2018 and the bottom Broadridge quartile for the 12 months ended May 31, 2018. The Trustees noted the reasons for the Fund’s underperformance and the steps Janus Capital had taken or was taking to improve performance.
· For Janus Henderson International Small Cap Fund, the Trustees noted that the Fund’s performance was in the second Broadridge quartile for the 12 months ended May 31, 2018.
· For Janus Henderson International Value Fund, the Trustees noted that the Fund’s performance was in the bottom Broadridge quartile for the 36 months ended May 31, 2018 and the bottom Broadridge quartile for the 12 months ended May 31, 2018. The Trustees noted the reasons for the Fund’s underperformance and the steps Janus Capital and Perkins had taken or were taking to improve performance.
· For Janus Henderson Overseas Fund, the Trustees noted that the Fund’s performance was in the bottom Broadridge quartile for the 36 months ended May 31, 2018 and the second Broadridge quartile for the 12 months ended May 31, 2018. The Trustees noted the reasons for the Fund’s underperformance, while also noting that the Fund has a performance fee structure that results in lower management fees during periods of underperformance, the steps Janus Capital had taken or was taking to improve performance, and that the performance trend was improving.
Janus Investment Fund | 51 |
Janus Henderson Balanced Fund
Additional Information (unaudited)
Money Market Funds
· For Janus Henderson Government Money Market Fund, the Trustees noted that the Fund’s performance was in the second Broadridge quartile for the 36 months ended May 31, 2018 and the second Broadridge quartile for the 12 months ended May 31, 2018.
· For Janus Henderson Money Market Fund, the Trustees noted that the Fund’s performance was in the third Broadridge quartile for the 36 months ended May 31, 2018 and the third Broadridge quartile for the 12 months ended May 31, 2018. The Trustees noted the reasons for the Fund’s underperformance, including the impact of waivers on comparative peer performance.
Multi-Asset Funds
· For Janus Henderson Adaptive Global Allocation Fund, the Trustees noted that the Fund’s performance was in the bottom Broadridge quartile for the 12 months ended May 31, 2018. The Trustees noted the reasons for the Fund’s underperformance, the steps Janus Capital had taken or was taking to improve performance, and the Fund’s limited performance history.
· For Janus Henderson All Asset Fund, the Trustees noted that the Fund’s performance was in the third Broadridge quartile for the 36 months ended May 31, 2018 and the third Broadridge quartile for the 12 months ended May 31, 2018. The Trustees noted the reasons for the Fund’s underperformance and the steps Janus Capital had taken or was taking to improve performance.
· For Janus Henderson Dividend & Income Builder Fund, the Trustees noted that the Fund’s performance was in the second Broadridge quartile for the 36 months ended May 31, 2018 and the third Broadridge quartile for the 12 months ended May 31, 2018.
· For Janus Henderson Value Plus Income Fund, the Trustees noted that the Fund’s performance was in the second Broadridge quartile for the 36 months ended May 31, 2018 and the third Broadridge quartile for the 12 months ended May 31, 2018.
Multi-Asset U.S. Equity Funds
· For Janus Henderson Balanced Fund, the Trustees noted that the Fund’s performance was in the first Broadridge quartile for the 36 months ended May 31, 2018 and the first Broadridge quartile for the 12 months ended May 31, 2018.
· For Janus Henderson Contrarian Fund, the Trustees noted that the Fund’s performance was in the bottom Broadridge quartile for the 36 months ended May 31, 2018 and the third Broadridge quartile for the 12 months ended May 31, 2018. The Trustees noted the reasons for the Fund’s underperformance, while also noting that the Fund has a performance fee structure that results in lower management fees during periods of underperformance, and the steps Janus Capital had taken or was taking to improve performance.
· For Janus Henderson Enterprise Fund, the Trustees noted that the Fund’s performance was in the first Broadridge quartile for the 36 months ended May 31, 2018 and the second Broadridge quartile for the 12 months ended May 31, 2018.
· For Janus Henderson Forty Fund, the Trustees noted that the Fund’s performance was in the second Broadridge quartile for the 36 months ended May 31, 2018 and the third Broadridge quartile for the 12 months ended May 31, 2018.
· For Janus Henderson Growth and Income Fund, the Trustees noted that the Fund’s performance was in the first Broadridge quartile for the 36 months ended May 31, 2018 and the first Broadridge quartile for the 12 months ended May 31, 2018.
· For Janus Henderson Research Fund, the Trustees noted that the Fund’s performance was in the third Broadridge quartile for the 36 months ended May 31, 2018 and the third Broadridge quartile for the 12 months ended May 31, 2018. The Trustees noted the reasons for the Fund’s underperformance, noting that the Fund has a performance fee structure that results in lower management fees during periods of underperformance, and the steps Janus Capital had taken or was taking to improve performance.
52 | SEPTEMBER 30, 2019 |
Janus Henderson Balanced Fund
Additional Information (unaudited)
· For Janus Henderson Triton Fund, the Trustees noted that the Fund’s performance was in the second Broadridge quartile for the 36 months ended May 31, 2018 and the third Broadridge quartile for the 12 months ended May 31, 2018.
· For Janus Henderson U.S. Growth Opportunities Fund, the Trustees noted that the Fund’s performance was in the third Broadridge quartile for the 36 months ended May 31, 2018 and the third Broadridge quartile for the 12 months ended May 31, 2018. The Trustees noted the reasons for the Fund’s underperformance, and the steps Janus Capital and Geneva had taken or were taking to improve performance.
· For Janus Henderson Venture Fund, the Trustees noted that the Fund’s performance was in the second Broadridge quartile for the 36 months ended May 31, 2018 and the third Broadridge quartile for the 12 months ended May 31, 2018.
Quantitative Equity Funds
· For Janus Henderson Emerging Markets Managed Volatility Fund, the Trustees noted that the Fund’s performance was in the third Broadridge quartile for the 36 months ended May 31, 2018 and the first Broadridge quartile for the 12 months ended May 31, 2018. The Trustees noted the reasons for the Fund’s underperformance, the steps Janus Capital and Intech had taken or were taking to improve performance, and that the performance trend was improving.
· For Janus Henderson Global Income Managed Volatility Fund, the Trustees noted that the Fund’s performance was in the first Broadridge quartile for the 36 months ended May 31, 2018 and the bottom Broadridge quartile for the 12 months ended May 31, 2018.
· For Janus Henderson International Managed Volatility Fund, the Trustees noted that the Fund’s performance was in the second Broadridge quartile for the 36 months ended May 31, 2018 and the second Broadridge quartile for the 12 months ended May 31, 2018.
· For Janus Henderson U.S. Managed Volatility Fund, the Trustees noted that the Fund’s performance was in the first Broadridge quartile for the 36 months ended May 31, 2018 and the first Broadridge quartile for the 12 months ended May 31, 2018.
U.S. Equity Funds
· For Janus Henderson Large Cap Value Fund, the Trustees noted that the Fund’s performance was in the third Broadridge quartile for the 36 months ended May 31, 2018 and the third Broadridge quartile for the 12 months ended May 31, 2018. The Trustees noted the reasons for the Fund’s underperformance, while also noting that the Fund has a performance fee structure that results in lower management fees during periods of underperformance, and the steps Janus Capital and Perkins had taken or were taking to improve performance.
· For Janus Henderson Mid Cap Value Fund, the Trustees noted that the Fund’s performance was in the second Broadridge quartile for the 36 months ended May 31, 2018 and the third Broadridge quartile for the 12 months ended May 31, 2018.
· For Janus Henderson Small-Mid Cap Value Fund (formerly, Janus Henderson Select Value Fund), the Trustees noted that the Fund’s performance was in the second Broadridge quartile for the 36 months ended May 31, 2018 and the bottom Broadridge quartile for the 12 months ended May 31, 2018.
· For Janus Henderson Small Cap Value Fund, the Trustees noted that the Fund’s performance was in the second Broadridge quartile for the 36 months ended May 31, 2018 and the bottom Broadridge quartile for the 12 months ended May 31, 2018.
In consideration of each Janus Henderson Fund’s performance, the Trustees concluded that, taking into account the factors relevant to performance, as well as other considerations, including steps taken to improve performance, the Janus Henderson Fund’s performance warranted continuation of such Janus Henderson Fund’s investment advisory and subadvisory agreement(s).
Costs of Services Provided
The Trustees examined information regarding the fees and expenses of each Janus Henderson Fund in comparison to similar information for other comparable funds as provided by Broadridge, an independent data provider. They also
Janus Investment Fund | 53 |
Janus Henderson Balanced Fund
Additional Information (unaudited)
reviewed an analysis of that information provided by their independent fee consultant and noted that the management fee rate (investment advisory and any administration fees, but excluding out-of-pocket costs) for many of the Janus Henderson Funds, net of waivers, was below the average management fee rate of the respective peer group of funds selected by Broadridge. The Trustees also examined information regarding the subadvisory fees charged for subadvisory services, as applicable, noting that all such fees were paid by Janus Capital out of its management fees collected from such Janus Henderson Fund. The Trustees also considered the total expenses for each share class of each Janus Henderson Fund compared to the average total expenses for its Broadridge Expense Group peers and to average total expenses for its Broadridge Expense Universe.
The independent fee consultant expressed the view that the management fees charged by Janus Capital to each of the Janus Henderson Funds under the current investment advisory and administration agreements are reasonable in relation to the services provided by Janus Capital. At the fund complex level, the independent fee consultant found: (1) the total expenses and management fees of the Janus Henderson Funds to be reasonable relative to other mutual funds; (2) total expenses, on average, were 10% under the average total expenses for the respective Broadridge Expense Group peers and 19% under the average total expenses for the respective Broadridge Expense Universes; (3) management fees for the Janus Henderson Funds, on average, were 8% under the average management fees for the respective Expense Groups and 10% under the average for the respective Expense Universes; and (4) Janus Henderson Fund expenses by function for each asset and share class category were reasonable relative to peer benchmarks.
The independent fee consultant concluded that, based on its strategic review of expenses at the complex, category and individual share class level, Janus Henderson Fund expenses were found to be reasonable relative to peer benchmarks. Further, for certain Janus Henderson Funds, the independent fee consultant also performed a systematic “focus list” analysis of expenses in the context of the performance or service delivered to investors in each Janus Henderson Fund. Based on this analysis, the independent fee consultant found that the combination of service quality/performance and expenses on these individual Janus Henderson Funds were reasonable in light of performance trends, performance histories, and existence of performance fees, breakpoints, and expense waivers on such “focus list” Funds.
The Trustees considered the methodology used by Janus Capital and each subadviser in determining compensation payable to portfolio managers, the competitive environment for investment management talent, and the competitive market for mutual funds in different distribution channels.
The Trustees also reviewed management fees charged by Janus Capital and each subadviser to comparable separate account clients and to comparable non-affiliated funds subadvised by Janus Capital or by a subadviser (for which Janus Capital or the subadviser provides only or primarily portfolio management services). Although in most instances comparable subadvisory and separate account fee rates for various investment strategies were lower than management fee rates for Janus Henderson Funds having a similar strategy, while subadviser fee rates charged to the Janus Henderson Funds were generally within a reasonable range of the fee rates that the subadviser charges to comparable separate account clients or non-affiliated funds. The Trustees considered that Janus Capital noted that, under the terms of the management agreements with the Janus Henderson Funds, Janus Capital performs significant additional services for the Janus Henderson Funds that it does not provide to those other clients, including administration services, oversight of the Janus Henderson Funds’ other service providers, trustee support, regulatory compliance and numerous other services, and that, in serving the Janus Henderson Funds, Janus Capital assumes many legal risks and other costs that it does not assume in servicing its other clients. Moreover, the Trustees noted that the independent fee consultant found that: (1) the management fees Janus Capital charges to the Janus Henderson Funds are reasonable in relation to the management fees Janus Capital charges to its institutional clients and to the fees Janus Capital charges to funds subadvised by Janus Capital; (2) these institutional and subadvised accounts have different service and infrastructure needs; (3) Janus Henderson mutual fund investors enjoy reasonable fees relative to the fees charged to Janus Henderson institutional and subadvised fund investors; (4) in three of five product categories, the Janus Henderson Funds receive proportionally better pricing than the industry in relation to Janus Henderson institutional clients; and (5) in six of seven strategies, Janus Capital has lower management fees than the management fees charged to funds subadvised by Janus Capital.
The Trustees considered the fees for each Janus Henderson Fund for its fiscal year ended in 2017, including the JIF Funds, and noted the following with regard to each JIF Fund’s total expenses, net of applicable fee waivers (the JIF Fund’s “total expenses”):
54 | SEPTEMBER 30, 2019 |
Janus Henderson Balanced Fund
Additional Information (unaudited)
Alternative Fund
· For Janus Henderson Diversified Alternatives Fund, the Trustees noted that, although the Fund’s total expenses exceeded the peer group average for certain share classes, overall the Fund’s total expenses were reasonable. The Trustees also noted that Janus Capital has contractually agreed to limit the Fund’s expenses.
Asset Allocation Funds
· For Janus Henderson Global Allocation Fund – Conservative, the Trustees noted that, although the Fund’s total expenses exceeded the peer group average for certain share classes, overall the Fund’s total expenses were reasonable. The Trustees also noted that Janus Capital has contractually agreed to limit the Fund’s expenses, although this limit did not apply because the Fund’s total expenses were already below the applicable fee limit.
· For Janus Henderson Global Allocation Fund – Growth, the Trustees noted that, although the Fund’s total expenses exceeded the peer group average for certain share classes, overall the Fund’s total expenses were reasonable. The Trustees also noted that Janus Capital has contractually agreed to limit the Fund’s expenses, although this limit did not apply because the Fund’s total expenses were already below the applicable fee limit.
· For Janus Henderson Global Allocation Fund – Moderate, the Trustees noted that, although the Fund’s total expenses exceeded the peer group average for certain share classes, overall the Fund’s total expenses were reasonable. The Trustees also noted that Janus Capital has contractually agreed to limit the Fund’s expenses, although this limit did not apply because the Fund’s total expenses were already below the applicable fee limit.
Fixed-Income Funds
· For Janus Henderson Flexible Bond Fund, the Trustees noted that, although the Fund’s total expenses exceeded the peer group average for certain share classes, overall the Fund’s total expenses were reasonable. The Trustees also noted that Janus Capital has contractually agreed to limit the Fund’s expenses.
· For Janus Henderson Global Bond Fund, the Trustees noted that, although the Fund’s total expenses exceeded the peer group average for certain share classes, overall the Fund’s total expenses were reasonable. The Trustees also noted that Janus Capital has contractually agreed to limit the Fund’s expenses.
· For Janus Henderson Absolute Return Income Opportunities Fund (formerly, Janus Henderson Global Unconstrained Bond Fund), the Trustees noted that, although the Fund’s total expenses exceeded the peer group average for all share classes, overall the Fund’s total expenses were reasonable. The Trustees also noted that Janus Capital has contractually agreed to limit the Fund’s expenses, although this limit did not apply because the Fund’s total expenses were already below the applicable fee limit.
· For Janus Henderson High-Yield Fund, the Trustees noted that, although the Fund’s total expenses exceeded the peer group average for certain share classes, overall the Fund’s total expenses were reasonable. The Trustees also noted that Janus Capital has contractually agreed to limit the Fund’s expenses, although this limit did not apply because the Fund’s total expenses were already below the applicable fee limit.
· For Janus Henderson Multi-Sector Income Fund, the Trustees noted that, although the Fund’s total expenses exceeded the peer group average for certain share classes, overall the Fund’s total expenses were reasonable. The Trustees also noted that Janus Capital has contractually agreed to limit the Fund’s expenses.
· For Janus Henderson Short-Term Bond Fund, the Trustees noted that, although the Fund’s total expenses exceeded the peer group average for all share classes, overall the Fund’s total expenses were reasonable. The Trustees also noted that the peer group comparisons did not take into account a recent management fee reduction for the Fund, effective December 14, 2018 and that Janus Capital has contractually agreed to limit the Fund’s expenses at a lower (more favorable) level.
· For Janus Henderson Developed World Bond Fund (formerly, Janus Henderson Strategic Income Fund), the Trustees noted that, although the Fund’s total expenses exceeded the peer group average for certain share classes, overall the Fund’s total expenses were reasonable. The Trustees also noted that Janus Capital has contractually agreed to limit the Fund’s expenses.
Janus Investment Fund | 55 |
Janus Henderson Balanced Fund
Additional Information (unaudited)
Global and International Equity Funds
· For Janus Henderson Asia Equity Fund, the Trustees noted that, although the Fund’s total expenses exceeded the peer group average for certain share classes, overall the Fund’s total expenses were reasonable. The Trustees also noted that Janus Capital has contractually agreed to limit the Fund’s expenses.
· For Janus Henderson Emerging Markets Fund, the Trustees noted that, although the Fund’s total expenses exceeded the peer group average for one share class, overall the Fund’s total expenses were reasonable. The Trustees also noted that Janus Capital has contractually agreed to limit the Fund’s expenses.
· For Janus Henderson European Focus Fund, the Trustees noted that, although the Fund’s total expenses exceeded the peer group average for certain share classes, overall the Fund’s total expenses were reasonable. The Trustees also noted that Janus Capital has contractually agreed to limit the Fund’s expenses.
· For Janus Henderson Global Equity Income Fund, the Trustees noted that the Fund’s total expenses were below the peer group average for all share classes.
· For Janus Henderson Global Life Sciences Fund, the Trustees noted that the Fund’s total expenses were below the peer group average for all share classes.
· For Janus Henderson Global Real Estate Fund, the Trustees noted that the Fund’s total expenses were below the peer group average for all share classes.
· For Janus Henderson Global Research Fund, the Trustees noted that the Fund’s total expenses were below the peer group average for all share classes.
· For Janus Henderson Global Select Fund, the Trustees noted that, although the Fund’s total expenses exceeded the peer group average for one share class, overall the Fund’s total expenses were reasonable. The Trustees also noted that Janus Capital has contractually agreed to limit the Fund’s expenses, although this limit did not apply because the Fund’s total expenses were already below the applicable fee limit.
· For Janus Henderson Global Technology Fund, the Trustees noted that the Fund’s total expenses were below the peer group average for all share classes.
· For Janus Henderson Global Value Fund, the Trustees noted that the Fund’s total expenses were below the peer group average for all share classes.
· For Janus Henderson International Opportunities Fund, the Trustees noted that, although the Fund’s total expenses exceeded the peer group average for certain share classes, overall the Fund’s total expenses were reasonable. The Trustees also noted that Janus Capital has contractually agreed to limit the Fund’s expenses.
· For Janus Henderson International Small Cap Fund, the Trustees noted that, although the Fund’s total expenses exceeded the peer group average for one share class, overall the Fund’s total expenses were reasonable. The Trustees also noted that Janus Capital has contractually agreed to limit the Fund’s expenses.
· For Janus Henderson International Value Fund, the Trustees noted that, although the Fund’s total expenses exceeded the peer group average for one share class, overall the Fund’s total expenses were reasonable. The Trustees also noted that Janus Capital has contractually agreed to limit the Fund’s expenses.
· For Janus Henderson Overseas Fund, the Trustees noted that the Fund’s total expenses were below the peer group average for all share classes.
Money Market Funds
· For Janus Henderson Government Money Market Fund, the Trustees noted that, although the Fund’s total expenses exceeded the peer group average for one share class, overall the Fund’s total expenses were reasonable. In addition, the Trustees considered that Janus Capital voluntarily waives one-half of its advisory fee and other expenses in order to maintain a positive yield.
· For Janus Henderson Money Market Fund, the Trustees noted that the Fund’s total expenses were above the peer group average for both share classes. In addition, the Trustees considered that Janus Capital voluntarily waives one-half of its advisory fee and other expenses in order to maintain a positive yield.
56 | SEPTEMBER 30, 2019 |
Janus Henderson Balanced Fund
Additional Information (unaudited)
Multi-Asset Funds
· For Janus Henderson Adaptive Global Allocation Fund, the Trustees noted that, although the Fund’s total expenses exceeded the peer group average for one share class, overall the Fund’s total expenses were reasonable. The Trustees also noted that Janus Capital has contractually agreed to limit the Fund’s expenses.
· For Janus Henderson All Asset Fund, the Trustees noted that, although the Fund’s total expenses exceeded the peer group average for one share class, overall the Fund’s total expenses were reasonable. The Trustees also noted that Janus Capital has contractually agreed to limit the Fund’s total expenses.
· For Janus Henderson Dividend & Income Builder Fund, the Trustees noted that the Fund’s total expenses were below the peer group average for all share classes.
· For Janus Henderson Value Plus Income Fund, the Trustees noted that the Fund’s total expenses were below the peer group average for all share classes.
Multi-Asset U.S. Equity Funds
· For Janus Henderson Balanced Fund, the Trustees noted that, although the Fund’s total expenses were equal to or exceeded the peer group average for certain share classes, overall the Fund’s total expenses were reasonable. The Trustees also noted that Janus Capital has contractually agreed to limit the Fund’s expenses, although this limit did not apply because the Fund’s total expenses were already below the applicable fee limit.
· For Janus Henderson Contrarian Fund, the Trustees noted that the Fund’s total expenses were below the peer group average for all share classes.
· For Janus Henderson Enterprise Fund, the Trustees noted that the Fund’s total expenses were below the peer group average for all share classes.
· For Janus Henderson Forty Fund, the Trustees noted that, although the Fund’s total expenses exceeded the peer group average for certain share classes, overall the Fund’s total expenses were reasonable. The Trustees also noted that Janus Capital has contractually agreed to limit the Fund’s expenses, although this limit did not apply because the Fund’s total expenses were already below the applicable fee limit.
· For Janus Henderson Growth and Income Fund, the Trustees noted that, although the Fund’s total expenses exceeded the peer group average for certain share classes, overall the Fund’s total expenses were reasonable. The Trustees also noted that Janus Capital has contractually agreed to limit the Fund’s expenses, although this limit did not apply because the Fund’s total expenses were already below the applicable fee limit.
· For Janus Henderson Research Fund, the Trustees noted that the Fund’s total expenses were below the peer group average for all share classes.
· For Janus Henderson Triton Fund, the Trustees noted that the Fund’s total expenses were below the peer group average for all share classes.
· For Janus Henderson U.S. Growth Opportunities Fund, the Trustees noted that, although the Fund’s total expenses exceeded the peer group average for one share class, overall the Fund’s total expenses were reasonable. The Trustees also noted that Janus Capital has contractually agreed to limit the Fund’s expenses.
· For Janus Henderson Venture Fund, the Trustees noted that the Fund’s total expenses were below the peer group average for all share classes.
Quantitative Equity Funds
· For Janus Henderson Emerging Markets Managed Volatility Fund, the Trustees noted that, although the Fund’s total expenses exceeded the peer group average for certain share classes, overall the Fund’s total expenses were reasonable taking into account the limited peer group for the Fund. The Trustees also noted that Janus Capital has contractually agreed to limit the Fund’s expenses.
· For Janus Henderson Global Income Managed Volatility Fund, the Trustees noted that the Fund’s total expenses were below the peer group average for all share classes.
Janus Investment Fund | 57 |
Janus Henderson Balanced Fund
Additional Information (unaudited)
· For Janus Henderson International Managed Volatility Fund, the Trustees noted that, although the Fund’s total expenses exceeded the peer group average for one share class, overall the Fund’s total expenses were reasonable. The Trustees also noted that Janus Capital has contractually agreed to limit the Fund’s expenses, although this limit did not apply because the Fund’s total expenses were already below the applicable fee limit.
· For Janus Henderson U.S. Managed Volatility Fund, the Trustees noted that, although the Fund’s total expenses exceeded the peer group average for one share class, overall the Fund’s total expenses were reasonable. The Trustees also noted that Janus Capital has contractually agreed to limit the Fund’s expenses, although this limit did not apply because the Fund’s total expenses were already below the applicable fee limit.
U.S. Equity Funds
· For Janus Henderson Large Cap Value Fund, the Trustees noted that the Fund’s total expenses were below the peer group average for all share classes.
· For Janus Henderson Mid Cap Value Fund, the Trustees noted that the Fund’s total expenses were below the peer group average for all share classes.
· For Janus Henderson Small-Mid Cap Value Fund (formerly, Janus Henderson Select Value Fund), the Trustees noted that, although the Fund’s total expenses exceeded the peer group average for certain share classes, overall the Fund’s total expenses were reasonable. The Trustees also noted that Janus Capital has contractually agreed to limit the Fund’s expenses.
· For Janus Henderson Small Cap Value Fund, the Trustees noted that, although the Fund’s total expenses exceeded the peer group average for certain share classes, overall the Fund’s total expenses were reasonable. The Trustees also noted that Janus Capital has contractually agreed to limit the Fund’s expenses, although this limit did not apply because the Fund’s total expenses were already below the applicable fee limit.
The Trustees reviewed information on the overall profitability to Janus Capital and its affiliates of their relationship with the Janus Henderson Funds, and considered profitability data of other publicly traded fund managers. The Trustees recognized that profitability comparisons among fund managers are difficult because of the variation in the type of comparative information that is publicly available, and the profitability of any fund manager is affected by numerous factors, including the organizational structure of the particular fund manager, differences in complex size, differences in product mix, differences in types of business (mutual fund, institutional and other), differences in the methodology for allocating expenses, and the fund manager’s capital structure and cost of capital.
Additionally, the Trustees considered the estimated profitability to Janus Capital from the investment management services it provides to each Janus Henderson Fund. In their review, the Trustees considered whether Janus Capital and each subadviser receive adequate incentives and resources to manage the Janus Henderson Funds effectively. In reviewing profitability, the Trustees noted that the estimated profitability for an individual Janus Henderson Fund is necessarily a product of the allocation methodology utilized by Janus Capital to allocate its expenses as part of the estimated profitability calculation. In this regard, the Trustees noted that the independent fee consultant concluded that (1) the expense allocation methodology utilized by Janus Capital was reasonable and (2) the estimated profitability to Janus Capital from the investment management services it provided to each Janus Henderson Fund was reasonable. The Trustees also considered that the estimated profitability for an individual Janus Henderson Fund was influenced by a number of factors, including not only the allocation methodology selected, but also the presence of fee waivers and expense caps, and whether the Janus Henderson Fund’s investment management agreement contained breakpoints or a performance fee component. The Trustees determined, after taking into account these factors, among others, that Janus Capital’s estimated profitability with respect to each Janus Henderson Fund was not unreasonable in relation to the services provided, and that the variation in the range of such estimated profitability among the Janus Henderson Funds was not a material factor in the Board’s approval of the reasonableness of any Janus Henderson Fund’s investment management fees.
The Trustees concluded that the management fees payable by each Janus Henderson Fund to Janus Capital, as well as the fees paid by Janus Capital to the subadvisers of subadvised Janus Henderson Funds, were reasonable in relation to the nature, extent, and quality of the services provided, taking into account the fees charged by other advisers for managing comparable mutual funds with similar strategies, the fees Janus Capital and the subadvisers charge to other clients, and, as applicable, the impact of fund performance on management fees payable by the Janus Henderson Funds. The Trustees also concluded that each Janus Henderson Fund’s total expenses were reasonable,
58 | SEPTEMBER 30, 2019 |
Janus Henderson Balanced Fund
Additional Information (unaudited)
taking into account the size of the Janus Henderson Fund, the quality of services provided by Janus Capital and any subadviser, the investment performance of the Janus Henderson Fund, and any expense limitations agreed to or provided by Janus Capital.
Economies of Scale
The Trustees considered information about the potential for Janus Capital to realize economies of scale as the assets of the Janus Henderson Funds increase. They noted the independent fee consultant’s analysis of economies of scale in prior years. They also noted that, although many Janus Henderson Funds pay advisory fees at a base fixed rate as a percentage of net assets, without any breakpoints or performance fees, the independent fee consultant concluded that 74% of these Janus Henderson Funds’ share classes have contractual management fees (gross of waivers) below their Broadridge Expense Group averages. They also noted that for those Janus Henderson Funds whose expenses are being reduced by contractual expense limitations with Janus Capital, Janus Capital is subsidizing certain of these Janus Henderson Funds because they have not reached adequate scale. Moreover, as the assets of some of the Janus Henderson Funds have declined in the past few years, certain Janus Henderson Funds have benefited from having advisory fee rates that have remained constant rather than increasing as assets declined. In addition, performance fee structures have been implemented for various Janus Henderson Funds that have caused the effective rate of advisory fees payable by such a Janus Henderson Fund to vary depending on the investment performance of the Janus Henderson Fund relative to its benchmark index over the measurement period; and a few Janus Henderson Funds have fee schedules with breakpoints and reduced fee rates above certain asset levels. The Trustees also noted that the Janus Henderson Funds share directly in economies of scale through the lower charges of third-party service providers that are based in part on the combined scale of all of the Janus Henderson Funds.
The Trustees also considered information provided by the independent fee consultant, which concluded that, given the limitations of various analytical approaches to economies of scale it had considered in prior years, and their conflicting results, it is difficult to analytically confirm or deny the existence of economies of scale in the Janus Henderson complex. The independent consultant further concluded that (1) to the extent there were economies of scale at Janus Capital, Janus Capital’s general strategy of setting fixed management fees below peers appeared to share any such economies with investors even on smaller Janus Henderson Funds which have not yet achieved those economies and (2) by setting lower fixed fees from the start on these Janus Henderson Funds, Janus Capital appeared to be investing to increase the likelihood that these Janus Henderson Funds will grow to a level to achieve any scale economies that may exist. Further, the independent fee consultant expressed the view that Janus Henderson Fund investors are well-served by the performance fee structures in place on the Janus Henderson Funds in light of any economies of scale that may be present at Janus Capital.
Based on all of the information they reviewed, including past research and analysis conducted by the Trustees’ independent fee consultant, the Trustees concluded that the current fee structure of each Janus Henderson Fund was reasonable and that the current rates of fees do reflect a sharing between Janus Capital and the Janus Henderson Fund of any economies of scale that may be present at the current asset level of the Janus Henderson Fund.
Other Benefits to Janus Capital
The Trustees also considered benefits that accrue to Janus Capital and its affiliates and subadvisers to the Janus Henderson Funds from their relationships with the Janus Henderson Funds. They recognized that two affiliates of Janus Capital separately serve the Janus Henderson Funds as transfer agent and distributor, respectively, and the transfer agent receives compensation directly from the non-money market funds for services provided, and that such compensation contributes to the overall profitability of Janus Capital and its affiliates that results from their relationship with the Janus Henderson Funds. The Trustees also considered Janus Capital’s and each subadviser’s past and proposed use of commissions paid by the Janus Henderson Funds on portfolio brokerage transactions to obtain proprietary and third-party research products and services benefiting the Janus Henderson Fund and/or other clients of Janus Capital and/or Janus Capital, and/or a subadviser to a Janus Henderson Fund. The Trustees concluded that Janus Capital’s and the subadvisers’ use of these types of client commission arrangements to obtain proprietary and third-party research products and services was likely to benefit each Janus Henderson Fund. The Trustees also concluded that, other than the services provided by Janus Capital and its affiliates and subadvisers pursuant to the agreements and the fees to be paid by each Janus Henderson Fund therefor, the Janus Henderson Funds and Janus Capital and the subadvisers may potentially benefit from their relationship with each other in other ways. They concluded that Janus Capital and its affiliates share directly in economies of scale through the lower charges of third-party service providers that are based in part on the combined scale of the Janus Henderson Funds and other clients
Janus Investment Fund | 59 |
Janus Henderson Balanced Fund
Additional Information (unaudited)
serviced by Janus Capital and its affiliates. They also concluded that Janus Capital and/or the subadvisers benefit from the receipt of research products and services acquired through commissions paid on portfolio transactions of the Janus Henderson Funds and that the Janus Henderson Funds benefit from Janus Capital’s and/or the subadvisers’ receipt of those products and services as well as research products and services acquired through commissions paid by certain other clients of Janus Capital and/or other clients of the subadvisers. They further concluded that the success of any Janus Henderson Fund could attract other business to Janus Capital, the subadvisers or other Janus Henderson funds, and that the success of Janus Capital and the subadvisers could enhance Janus Capital’s and the subadvisers’ ability to serve the Janus Henderson Funds.
Approval of an Amended and Restated Investment Advisory Agreement for Janus Henderson Small-Mid Cap Value Fund (formerly, Janus Henderson Select Value Fund)
Janus Capital Management LLC (“Janus Capital”) met with the Trustees, each of whom serves as an “independent” Trustee (the “Trustees”), on December 5, 2018 and March 14, 2019, to discuss the Amended and Restated Investment Advisory Agreement (the “Amended Advisory Agreement”) for Janus Henderson Small-Mid Cap Value Fund (formerly, Janus Henderson Select Value Fund) (“Small-Mid Cap Value Fund”) and other matters related to investment strategy changes to shift the market capitalization focus of Small-Mid Cap Value Fund (the “Strategy Change”). At these meetings, the Trustees discussed the Amended Advisory Agreement and the Strategy Change with their independent counsel, separately from management. During the course of the meetings, the Trustees requested and considered such information as they deemed relevant to their deliberations. At the meeting held on March 14, 2019, the Trustees, upon the recommendation of Janus Capital, voted unanimously to approve the Amended Advisory Agreement for Small-Mid Cap Value Fund, and recommended that the Amended Advisory Agreement be submitted to shareholders for approval. The Trustees also approved matters related to the Strategy Change, effective upon approval of the Amended Advisory Agreement by the Fund’s shareholders.
In determining whether to approve the Amended Advisory Agreement, the Trustees noted their most recent consideration of Small-Mid Cap Value Fund’s current advisory agreement (the “Current Advisory Agreement”) as part of the Trustees’ annual review and consideration of whether to continue the investment advisory agreement and sub-advisory agreement, as applicable, for each Janus Henderson fund, including Small-Mid Cap Value Fund (the “Annual Review”). The Trustees noted that in connection with the Annual Review: (i) the Trustees received and reviewed information provided by Janus Capital and each sub-adviser, including Perkins Investment Management LLC (“Perkins”), in response to requests of the Trustees and their independent legal counsel, and also received and reviewed information and analysis provided by, and in response to requests of, their independent fee consultant; and (ii) throughout the Annual Review, the Trustees were advised by their independent legal counsel. The Trustees also noted that based on the Trustees’ evaluation of the information provided by Janus Capital, Perkins, and the independent fee consultant, as well as other information, the Trustees determined that the overall arrangements between Small-Mid Cap Value Fund and Janus Capital and Perkins were fair and reasonable in light of the nature, extent and quality of the services provided by Janus Capital, its affiliates and Perkins, the fees charged for those services, and other matters that the Trustees considered relevant in the exercise of their business judgment, and the Trustees unanimously approved the continuation of the Current Advisory Agreement for another year.
In considering the Amended Advisory Agreement, the Trustees reviewed and analyzed various factors that they determined were relevant, including the factors described below, none of which by itself was considered dispositive. However, the material factors and conclusions that formed the basis for the Trustees’ determination to approve the Amended Advisory Agreement are discussed separately below.
· The Trustees determined that the terms of the Amended Advisory Agreement are substantially similar to those of the Current Advisory Agreement, which the Trustees recently reviewed as part of the Annual Review, and the material changes made to the Amended Advisory Agreement address the proposed change to the benchmark index and the description of the period used for calculating the performance fee in order to allow for continuity of the fee based on Small-Mid Cap Value Fund’s historical performance over a 36-month measurement period.
· As part of the Strategy Change, Small-Mid Cap Value Fund will focus its investments on common stocks of companies that are small- and mid-capitalization stocks. The Trustees determined that the proposed benchmark index, the Russell 2500TM Value Index, is more closely aligned with a small- and mid-cap stock focus than Small-Mid Cap Value Fund’s current benchmark index, the Russell 3000® Value Index.
60 | SEPTEMBER 30, 2019 |
Janus Henderson Balanced Fund
Additional Information (unaudited)
· Under the Amended Advisory Agreement, the structure of the performance fee was not changing, other than to utilize a different benchmark and performance calculation period to implement the new benchmark over time, and that this structure had been implemented initially for Small-Mid Cap Value Fund based on analysis provided by the independent fee consultant. The Trustees considered the information provided by Janus Capital in this regard, and noted Janus Capital’s belief that this performance fee structure remained reasonable and appropriate for Small-Mid Cap Value Fund. The Trustees concluded that this performance fee structure was reasonable for Small-Mid Cap Value Fund as proposed, and also determined to seek further analysis from their independent fee consultant with respect to this matter. In this regard, Janus Capital agreed to consider further revisions to the proposed performance fee structure should that be needed based on the additional analysis provided.
· As part of the Strategy Change, Perkins will continue to provide sub-advisory services to Small-Mid Cap Value Fund, but will utilize new portfolio managers to implement Small-Mid Cap Value Fund’s focus on common stocks of companies that are small- and mid-capitalization stocks. In this regard, the Trustees noted the information provided by Janus Capital with respect to the qualifications and experience of the new portfolio managers implementing investment strategies similar to the one to be utilized by Small-Mid Cap Value Fund, and also noted that Perkins and the new portfolio managers provide sub-advisory services to other Janus Henderson funds the Trustees oversee.
· The information provided by Janus Capital with respect to (i) the impact of the Amended Advisory Agreement on the potential advisory fees to be paid by Small-Mid Cap Value Fund going forward; and (ii) the potential transaction costs and capital gains to be incurred by Small-Mid Cap Value Fund as part of the efforts to reposition Small-Mid Cap Value Fund’s portfolio to focus its investments on common stocks of companies that are small- and mid-capitalization stocks. In this regard, the Trustees noted that Small-Mid Cap Value Fund’s operating costs were not expected otherwise to materially change under the Amended Advisory Agreement.
· Janus Capital’s reasons for seeking to implement the Strategy Change, including Janus Capital’s belief that current marketplace demands for a small and mid-cap strategy, combined with Perkins’ experience in managing small- and mid-cap stocks, will provide greater opportunity for Small-Mid Cap Value Fund to grow over the long-term, and that the Strategy Change is designed to create asset growth through increased sales for Small-Mid Cap Value Fund, potentially resulting in increased operational efficiencies for Small-Mid Cap Value Fund.
· Janus Capital will pay the fees and expenses related to seeking shareholder approval of the Amended Advisory Agreement, including the costs related to the preparation and distribution of proxy materials, and all other costs incurred in connection with the solicitation of proxies.
After discussion, the Trustees determined that the overall arrangements between Small-Mid Cap Value Fund, Janus Capital, and Perkins under the Amended Advisory Agreement would continue to be fair and reasonable in light of the nature, extent, and quality of the services expected to be provided by Janus Capital, its affiliates, and Perkins following the Strategy Change.
Janus Investment Fund | 61 |
Janus Henderson Balanced Fund
Useful Information About Your Fund Report (unaudited)
The Management Commentary in this report includes valuable insight as well as statistical information to help you understand how your Fund’s performance and characteristics stack up against those of comparable indices.
If the Fund invests in foreign securities, this report may include information about country exposure. Country exposure is based primarily on the country of risk. A company may be allocated to a country based on other factors such as location of the company’s principal office, the location of the principal trading market for the company’s securities, or the country where a majority of the company’s revenues are derived.
Please keep in mind that the opinions expressed in the Management Commentary are just that: opinions. They are a reflection based on best judgment at the time this report was compiled, which was September 30, 2019. As the investing environment changes, so could opinions. These views are unique and are not necessarily shared by fellow employees or by Janus Henderson in general.
Performance Overviews
Performance overview graphs compare the performance of a hypothetical $10,000 investment in the Fund with one or more widely used market indices. When comparing the performance of the Fund with an index, keep in mind that market indices are not available for investment and do not reflect deduction of expenses.
Average annual total returns are quoted for a Fund with more than one year of performance history. Average annual total return is calculated by taking the growth or decline in value of an investment over a period of time, including reinvestment of dividends and distributions, then calculating the annual compounded percentage rate that would have produced the same result had the rate of growth been constant throughout the period. Average annual total return does not reflect the deduction of taxes that a shareholder would pay on Fund distributions or redemptions of Fund shares.
Cumulative total returns are quoted for a Fund with less than one year of performance history. Cumulative total return is the growth or decline in value of an investment over time, independent of the period of time involved. Cumulative total return does not reflect the deduction of taxes that a shareholder would pay on Fund distributions or redemptions of Fund shares.
Pursuant to federal securities rules, expense ratios shown in the performance chart reflect subsidized (if applicable) and unsubsidized ratios. The total annual fund operating expenses ratio is gross of any fee waivers, reflecting the Fund’s unsubsidized expense ratio. The net annual fund operating expenses ratio (if applicable) includes contractual waivers of Janus Capital and reflects the Fund’s subsidized expense ratio. Ratios may be higher or lower than those shown in the “Financial Highlights” in this report.
Schedule of Investments
Following the performance overview section is the Fund’s Schedule of Investments. This schedule reports the types of securities held in the Fund on the last day of the reporting period. Securities are usually listed by type (common stock, corporate bonds, U.S. Government obligations, etc.) and by industry classification (banking, communications, insurance, etc.). Holdings are subject to change without notice.
The value of each security is quoted as of the last day of the reporting period. The value of securities denominated in foreign currencies is converted into U.S. dollars.
If the Fund invests in foreign securities, it will also provide a summary of investments by country. This summary reports the Fund exposure to different countries by providing the percentage of securities invested in each country. The country of each security represents the country of risk. The Fund’s Schedule of Investments relies upon the industry group and country classifications published by Barclays and/or MSCI Inc.
Tables listing details of individual forward currency contracts, futures, written options, swaptions, and swaps follow the Fund’s Schedule of Investments (if applicable).
Statement of Assets and Liabilities
This statement is often referred to as the “balance sheet.” It lists the assets and liabilities of the Fund on the last day of the reporting period.
62 | SEPTEMBER 30, 2019 |
Janus Henderson Balanced Fund
Useful Information About Your Fund Report (unaudited)
The Fund’s assets are calculated by adding the value of the securities owned, the receivable for securities sold but not yet settled, the receivable for dividends declared but not yet received on securities owned, and the receivable for Fund shares sold to investors but not yet settled. The Fund’s liabilities include payables for securities purchased but not yet settled, Fund shares redeemed but not yet paid, and expenses owed but not yet paid. Additionally, there may be other assets and liabilities such as unrealized gain or loss on forward currency contracts.
The section entitled “Net Assets Consist of” breaks down the components of the Fund’s net assets. Because the Fund must distribute substantially all earnings, you will notice that a significant portion of net assets is shareholder capital.
The last section of this statement reports the net asset value (“NAV”) per share on the last day of the reporting period. The NAV is calculated by dividing the Fund’s net assets for each share class (assets minus liabilities) by the number of shares outstanding.
Statement of Operations
This statement details the Fund’s income, expenses, realized gains and losses on securities and currency transactions, and changes in unrealized appreciation or depreciation of Fund holdings.
The first section in this statement, entitled “Investment Income,” reports the dividends earned from securities and interest earned from interest-bearing securities in the Fund.
The next section reports the expenses incurred by the Fund, including the advisory fee paid to the investment adviser, transfer agent fees and expenses, and printing and postage for mailing statements, financial reports and prospectuses. Expense offsets and expense reimbursements, if any, are also shown.
The last section lists the amounts of realized gains or losses from investment and foreign currency transactions, and changes in unrealized appreciation or depreciation of investments and foreign currency-denominated assets and liabilities. The Fund will realize a gain (or loss) when it sells its position in a particular security. A change in unrealized gain (or loss) refers to the change in net appreciation or depreciation of the Fund during the reporting period. “Net Realized and Unrealized Gain/(Loss) on Investments” is affected both by changes in the market value of Fund holdings and by gains (or losses) realized during the reporting period.
Statements of Changes in Net Assets
These statements report the increase or decrease in the Fund’s net assets during the reporting period. Changes in the Fund’s net assets are attributable to investment operations, dividends and distributions to investors, and capital share transactions. This is important to investors because it shows exactly what caused the Fund’s net asset size to change during the period.
The first section summarizes the information from the Statement of Operations regarding changes in net assets due to the Fund’s investment operations. The Fund’s net assets may also change as a result of dividend and capital gains distributions to investors. If investors receive their dividends and/or distributions in cash, money is taken out of the Fund to pay the dividend and/or distribution. If investors reinvest their dividends and/or distributions, the Fund’s net assets will not be affected. If you compare the Fund’s “Net Decrease from Dividends and Distributions” to “Reinvested Dividends and Distributions,” you will notice that dividends and distributions have little effect on the Fund’s net assets. This is because the majority of the Fund’s investors reinvest their dividends and/or distributions.
The reinvestment of dividends and distributions is included under “Capital Share Transactions.” “Capital Shares” refers to the money investors contribute to the Fund through purchases or withdrawals via redemptions. The Fund’s net assets will increase and decrease in value as investors purchase and redeem shares from the Fund.
Financial Highlights
This schedule provides a per-share breakdown of the components that affect the Fund’s NAV for current and past reporting periods as well as total return, asset size, ratios, and portfolio turnover rate.
The first line in the table reflects the NAV per share at the beginning of the reporting period. The next line reports the net investment income/(loss) per share. Following is the per share total of net gains/(losses), realized and unrealized. Per share dividends and distributions to investors are then subtracted to arrive at the NAV per share at the end of the period. The next line reflects the total return for the period. The total return may include adjustments in accordance with generally accepted accounting principles required at the period end for financial reporting purposes. As a result, the
Janus Investment Fund | 63 |
Janus Henderson Balanced Fund
Useful Information About Your Fund Report (unaudited)
total return may differ from the total return reflected for individual shareholder transactions. Also included are ratios of expenses and net investment income to average net assets.
The Fund’s expenses may be reduced through expense offsets and expense reimbursements. The ratios shown reflect expenses before and after any such offsets and reimbursements.
The ratio of net investment income/(loss) summarizes the income earned less expenses, divided by the average net assets of the Fund during the reporting period. Do not confuse this ratio with the Fund’s yield. The net investment income ratio is not a true measure of the Fund’s yield because it does not take into account the dividends distributed to the Fund’s investors.
The next figure is the portfolio turnover rate, which measures the buying and selling activity in the Fund. Portfolio turnover is affected by market conditions, changes in the asset size of the Fund, fluctuating volume of shareholder purchase and redemption orders, the nature of the Fund’s investments, and the investment style and/or outlook of the portfolio manager(s) and/or investment personnel. A 100% rate implies that an amount equal to the value of the entire portfolio was replaced once during the fiscal year; a 50% rate means that an amount equal to the value of half the portfolio is traded in a year; and a 200% rate means that an amount equal to the value of the entire portfolio is traded every six months.
64 | SEPTEMBER 30, 2019 |
Janus Henderson Balanced Fund
Designation Requirements (unaudited)
For federal income tax purposes, the Fund designated the following for the year ended September 30, 2019:
| |
Capital Gain Distributions | $774,285,189 |
Dividends Received Deduction Percentage | 55% |
Qualified Dividend Income Percentage | 58% |
Janus Investment Fund | 65 |
Janus Henderson Balanced Fund
Trustees and Officers (unaudited)
The Fund’s Statement of Additional Information includes additional information about the Trustees and officers and is available, without charge, by calling 1-877-335-2687.
The following are the Trustees and officers of the Trust, together with a brief description of their principal occupations during the last five years (principal occupations for certain Trustees may include periods over five years).
Each Trustee has served in that capacity since he or she was originally elected or appointed. The Trustees do not serve a specified term of office. Each Trustee will hold office until the termination of the Trust or his or her earlier death, resignation, retirement, incapacity, or removal. Under the Fund’s Governance Procedures and Guidelines, the policy is for Trustees to retire no later than the end of the calendar year in which the Trustee turns 75. The Trustees review the Fund’s Governance Procedures and Guidelines from time to time and may make changes they deem appropriate. The Fund’s Nominating and Governance Committee will consider nominees for the position of Trustee recommended by shareholders. Shareholders may submit the name of a candidate for consideration by the Committee by submitting their recommendations to the Trust’s Secretary. Each Trustee is currently a Trustee of one other registered investment company advised by Janus Capital: Janus Aspen Series. Collectively, these two registered investment companies consist of 58 series or funds referred to herein as the Fund Complex.
The Trust’s officers are elected annually by the Trustees for a one-year term. Certain officers also serve as officers of Janus Aspen Series. Certain officers of the Fund may also be officers and/or directors of Janus Capital. Except as otherwise disclosed, Fund officers receive no compensation from the Fund, except for the Fund’s Chief Compliance Officer, as authorized by the Trustees.
66 | SEPTEMBER 30, 2019 |
Janus Henderson Balanced Fund
Trustees and Officers (unaudited)
TRUSTEES | |||||
Name, Address, and Age | Positions Held with the Trust | Length of Time Served | Principal Occupations During the Past Five Years | Number of Portfolios/Funds in Fund Complex Overseen by Trustee | Other Directorships Held by Trustee During the Past Five Years |
Independent Trustees | |||||
William F. McCalpin | Chairman | 1/08-Present | Managing Partner, Impact Investments, Athena Capital Advisors LLC (independent registered investment advisor) (since 2016). Formerly, Managing Director, Holos Consulting LLC (provides consulting services to foundations and other nonprofit organizations) (2009-2016), Chief Executive Officer, Imprint Capital Advisors (impact investment firm) (2013-2015), and Executive Vice President and Chief Operating Officer of The Rockefeller Brothers Fund (a private family foundation) (1998-2006). | 58 | Director of Mutual Fund Directors Forum (a non-profit organization serving independent directors of U.S. mutual funds) (since 2016), Chairman of the Board and Trustee of The Investment Fund for Foundations Investment Program (TIP) (consisting of 2 funds) (since 2008), and Director of the F.B. Heron Foundation (a private grantmaking foundation) (since 2006). |
Janus Investment Fund | 67 |
Janus Henderson Balanced Fund
Trustees and Officers (unaudited)
TRUSTEES | |||||
Name, Address, and Age | Positions Held with the Trust | Length of Time Served | Principal Occupations During the Past Five Years | Number of Portfolios/Funds in Fund Complex Overseen by Trustee | Other Directorships Held by Trustee During the Past Five Years |
Independent Trustees | |||||
Alan A. Brown | Trustee | 1/13-Present | Principal, Curam Holdings (since 2018). Formerly, Executive Vice President, Institutional Markets, of Black Creek Group (private equity real estate investment management firm) (2012-2018), Executive Vice President and Co-Head, Global Private Client Group (2007-2010), Executive Vice President, Mutual Funds (2005-2007), and Chief Marketing Officer (2001-2005) of Nuveen Investments, Inc. (asset management). | 58 | Director of WTTW (PBS affiliate) (since 2003). Formerly, Director of MotiveQuest LLC (strategic social market research company) (2003-2016), Director of Nuveen Global Investors LLC (2007-2011), Director of Communities in Schools (2004-2010), and Director of Mutual Fund Education Alliance (until 2010). |
68 | SEPTEMBER 30, 2019 |
Janus Henderson Balanced Fund
Trustees and Officers (unaudited)
TRUSTEES | |||||
Name, Address, and Age | Positions Held with the Trust | Length of Time Served | Principal Occupations During the Past Five Years | Number of Portfolios/Funds in Fund Complex Overseen by Trustee | Other Directorships Held by Trustee During the Past Five Years |
Independent Trustees | |||||
William D. Cvengros | Trustee | 1/11-Present | Chief Executive Officer of SJC Capital, LLC (a personal investment company and consulting firm) (since 2002). Formerly, Venture Partner for The Edgewater Funds (a middle market private equity firm) (2002-2004), Chief Executive Officer and President of PIMCO Advisors Holdings L.P. (a publicly traded investment management firm) (1994-2000), and Chief Investment Officer (1987-1994) and Vice Chairman and Director (1990-1994) of Pacific Life Insurance Company (a mutual life insurance and annuity company) (1987-1994). | 58 | Advisory Board Member, Innovate Partners Emerging Growth and Equity Fund I (early stage venture capital fund) (since 2014). Formerly, Managing Trustee of National Retirement Partners Liquidating Trust (2013-2016), Chairman, National Retirement Partners, Inc. (formerly a network of advisors to 401(k) plans) (2005-2013), Director of Prospect Acquisition Corp. (a special purpose acquisition corporation) (2007-2009), Director of RemedyTemp, Inc. (temporary help services company) (1996-2006), and Trustee of PIMCO Funds Multi-Manager Series (1990-2000) and Pacific Life Variable Life & Annuity Trusts (1987-1994). |
Janus Investment Fund | 69 |
Janus Henderson Balanced Fund
Trustees and Officers (unaudited)
TRUSTEES | |||||
Name, Address, and Age | Positions Held with the Trust | Length of Time Served | Principal Occupations During the Past Five Years | Number of Portfolios/Funds in Fund Complex Overseen by Trustee | Other Directorships Held by Trustee During the Past Five Years |
Independent Trustees | |||||
Raudline Etienne | Trustee | 6/16-Present | Founder, Daraja Capital (advisory and investment firm) (since 2016), and Senior Advisor, Albright Stonebridge Group LLC (global strategy firm) (since 2016). Formerly, Senior Vice President (2011-2015), Albright Stonebridge Group LLC, and Deputy Comptroller and Chief Investment Officer, New York State Common Retirement Fund (public pension fund) (2008-2011). | 58 | Board Member, Van Alen Institute (nonprofit architectural and design organization) (since 2019), and Director of Brightwood Capital Advisors, LLC (since 2014). |
William M. | Trustee | 9/19-Present | Founder, Fitzgerald Asset | 58 | Board of Directors, Municipal |
70 | SEPTEMBER 30, 2019 |
Janus Henderson Balanced Fund
Trustees and Officers (unaudited)
TRUSTEES | |||||
Name, Address, and Age | Positions Held with the Trust | Length of Time Served | Principal Occupations During the Past Five Years | Number of Portfolios/Funds in Fund Complex Overseen by Trustee | Other Directorships Held by Trustee During the Past Five Years |
Independent Trustees | |||||
Gary A. Poliner | Trustee | 6/16-Present | Retired. Formerly, President (2010-2013) of Northwestern Mutual Life Insurance Company. | 58 | Director of MGIC Investment Corporation (private mortgage insurance) (since 2013) and West Bend Mutual Insurance Company (property/casualty insurance) (since 2013). Formerly, Trustee of Northwestern Mutual Life Insurance Company (2010-2013), and Director of Frank Russell Company (global asset management firm) (2008-2013). |
William D. Stewart | Trustee | 6/84-Present | Retired. Formerly, President and founder of HPS Products and Corporate Vice President of MKS Instruments, Boulder, CO (a provider of advanced process control systems for the semiconductor industry) (1976-2012). | 58 | None |
Janus Investment Fund | 71 |
Janus Henderson Balanced Fund
Trustees and Officers (unaudited)
TRUSTEES | |||||
Name, Address, and Age | Positions Held with the Trust | Length of Time Served | Principal Occupations During the Past Five Years | Number of Portfolios/Funds in Fund Complex Overseen by Trustee | Other Directorships Held by Trustee During the Past Five Years |
Independent Trustees | |||||
Diane L. Wallace | Trustee | 6/17-Present | Retired. | 58 | Formerly, Independent Trustee, Henderson Global Funds (13 portfolios) (2015-2017), Independent Trustee, State Farm Associates' Funds Trust, State Farm Mutual Fund Trust, and State Farm Variable Product Trust (28 portfolios) (2013-2017), Chief Operating Officer, Senior Vice President-Operations, and Chief Financial Officer for Driehaus Capital Management, LLC (1988-2006), and Treasurer for Driehaus Mutual Funds (1996-2002). |
72 | SEPTEMBER 30, 2019 |
Janus Henderson Balanced Fund
Trustees and Officers (unaudited)
TRUSTEES | |||||
Name, Address, and Age | Positions Held with the Trust | Length of Time Served | Principal Occupations During the Past Five Years | Number of Portfolios/Funds in Fund Complex Overseen by Trustee | Other Directorships Held by Trustee During the Past Five Years |
Independent Trustees | |||||
Linda S. Wolf | Trustee | 11/05-Present | Retired. Formerly, Chairman and Chief Executive Officer of Leo Burnett (Worldwide) (advertising agency) (2001-2005). | 58 | Director of Chicago Community Trust (Regional Community Foundation), Chicago Council on Global Affairs, InnerWorkings (U.S. provider of print procurement solutions to corporate clients), Lurie Children’s Hospital (Chicago, IL), Shirley Ryan Ability Lab and Wrapports, LLC (digital communications company). Formerly, Director of Walmart (until 2017), Director of Chicago Convention & Tourism Bureau (until 2014) and The Field Museum of Natural History (Chicago, IL) (until 2014). |
Janus Investment Fund | 73 |
Janus Henderson Balanced Fund
Trustees and Officers (unaudited)
OFFICERS | |||
Name, Address, and Age | Positions Held with the Trust | Term of Office* and Length of Time Served | Principal Occupations During the Past Five Years |
Jeremiah Buckley | Executive Vice President and Co-Portfolio Manager | 12/15-Present | Portfolio Manager for other Janus Henderson accounts. |
Marc Pinto | Executive Vice President and Co-Portfolio Manager | 5/05-Present | Portfolio Manager for other Janus Henderson accounts. |
Mayur Saigal | Executive Vice President and Co-Portfolio Manager | 12/15-Present | Portfolio Manager for other Janus Henderson accounts. |
Darrell Watters | Executive Vice President and Co-Portfolio Manager | 12/15-Present | Head of U.S. Fundamental Fixed Income of Janus Henderson Investors and Portfolio Manager for other Janus Henderson accounts. |
* Officers are elected at least annually by the Trustees for a one-year term and may also be elected from time to time by the Trustees for an interim period. | |||
74 | SEPTEMBER 30, 2019 |
Janus Henderson Balanced Fund
Trustees and Officers (unaudited)
OFFICERS | |||
Name, Address, and Age | Positions Held with the Trust | Term of Office* and Length of Time Served | Principal Occupations During the Past Five Years |
Bruce L. Koepfgen | President and Chief Executive Officer | 7/14-Present | Executive Vice President, Head of North America at Janus Henderson Investors and Janus Capital Management LLC (since 2017), Executive Vice President and Director of Janus International Holding LLC (since 2011), Executive Vice President of Janus Distributors LLC (since 2011), Vice President and Director of Intech Investment Management LLC (since 2011), Executive Vice President and Director of Perkins Investment Management LLC (since 2011), and President and Director of Janus Management Holdings Corporation (since 2011). Formerly, President of Janus Capital Group Inc. and Janus Capital Management LLC (2013-2017), Executive Vice President of Janus Services LLC (2011-2015), Janus Capital Group Inc. and Janus Capital Management LLC (2011-2013), and Chief Financial Officer of Janus Capital Group Inc., Janus Capital Management LLC, Janus Distributors LLC, Janus Management Holdings Corporation, and Janus Services LLC (2011-2013). |
Susan K. Wold | Vice President, Chief Compliance Officer, and Anti-Money Laundering Officer | 9/17-Present | Head of Compliance, North America for Janus Henderson (since September 2017). Formerly, Vice President, Head of Global Corporate Compliance, and Chief Compliance Officer for Janus Capital Management LLC (May 2017-September 2017), Vice President, Compliance at Janus Capital Group Inc. and Janus Capital Management LLC (2005-2017). |
* Officers are elected at least annually by the Trustees for a one-year term and may also be elected from time to time by the Trustees for an interim period. | |||
Janus Investment Fund | 75 |
Janus Henderson Balanced Fund
Trustees and Officers (unaudited)
OFFICERS | |||
Name, Address, and Age | Positions Held with the Trust | Term of Office* and Length of Time Served | Principal Occupations During the Past Five Years |
Jesper Nergaard | Chief Financial Officer | 3/05-Present | Vice President of Janus Capital and Janus Services LLC. |
Kathryn L. Santoro | Vice President, Chief Legal Counsel, and Secretary | 12/16-Present | Assistant General Counsel of Janus Capital (since 2016). Formerly, Vice President and Associate Counsel of Curian Capital, LLC and Curian Clearing LLC (2013-2016), and General Counsel and Secretary (2011-2012) and Vice President (2009-2012) of Old Mutual Capital, Inc. |
* Officers are elected at least annually by the Trustees for a one-year term and may also be elected from time to time by the Trustees for an interim period. | |||
76 | SEPTEMBER 30, 2019 |
Janus Henderson Balanced Fund
Notes
NotesPage1
Janus Investment Fund | 77 |
Knowledge. Shared
At Janus Henderson, we believe in the sharing of expert insight for better investment and business decisions. We call this ethos Knowledge. Shared.
Learn more by visiting janushenderson.com.
| ||||||||
This report is submitted for the general information of shareholders of the Fund. It is not an offer or solicitation for the Fund and is not authorized for distribution to prospective investors unless preceded or accompanied by an effective prospectus. | ||||||||
Janus Henderson, Janus, Henderson, Perkins, Intech and Knowledge. Shared are trademarks of Janus Henderson Group plc or one of its subsidiaries. © Janus Henderson Group plc. Janus Henderson Distributors | ||||||||
125-02-93037 11-19 | ||||||||

ANNUAL REPORT September 30, 2019 | |||
Janus Henderson Contrarian Fund | |||
Janus Investment Fund | |||
Beginning on January 1, 2021, as permitted by regulations adopted by the Securities and Exchange Commission, paper copies of the Fund’s shareholder reports will no longer be sent by mail, unless you specifically request paper copies of the reports from the Fund or your plan sponsor, broker-dealer, or financial intermediary, or if you invest directly with the Fund, by contacting a Janus Henderson representative. Instead, the reports will be made available on a website, and you will be notified by mail each time a report is posted and provided with a website link to access the report. If you already elected to receive shareholder reports electronically, you will not be affected by this change and you need not take any action. You may elect to receive shareholder reports and other communications from the Fund electronically by contacting your plan sponsor, broker-dealer, or financial intermediary, or if you invest directly with the Fund, by visiting janushenderson.com/edelivery. You may elect to receive all future reports in paper free of charge. If you do not invest directly with the Fund, you should contact your plan sponsor, broker-dealer, or financial intermediary, to request to continue receiving paper copies of your shareholder reports. If you invest directly with the Fund, you can call 1-800-525-3713 to let the Fund know that you wish to continue receiving paper copies of your shareholder reports. Your election to receive reports in paper will apply to all Janus Henderson mutual funds where held (i.e., all Janus Henderson mutual funds held in your account if you invest through your financial intermediary or all Janus Henderson mutual funds held with the fund complex if you invest directly with a fund).
| |||
HIGHLIGHTS · Portfolio management perspective · Investment strategy behind your fund · Fund performance, characteristics | |||
|

Table of Contents
Janus Henderson Contrarian Fund
Janus Henderson Contrarian Fund (unaudited)

OVERVIEW
The Janus Henderson Contrarian Fund’s Class I Shares returned 9.05% over the one-year period ended September 30, 2019. The Fund’s benchmark, the S&P 500® Index, returned 4.25%.
INVESTMENT ENVIRONMENT
The period began with a sense of nervousness as investors navigated a myriad of economic and political concerns. Fears of slowing global economic growth, U.S.-China trade relations, a potential policy misstep by the Federal Reserve (Fed) and the risk of a disorderly “Brexit” all played a role in heightened market volatility. Equities fell sharply at the end of 2018 and then rebounded in the early months of 2019. The recovery was driven in large part by the Fed, which pivoted its monetary policy, pausing rate hikes and indicating it would be more accommodative to sustain economic growth. Despite a resilient U.S. economy and continued consumer strength, the Fed responded to weaker manufacturing data and risks of slowing global growth with two interest rate cuts later in the period. Treasuries yields fell significantly over the period, and equity sectors tied to rates, such as utilities and real estate, performed best. Stocks tied to global trade and the strong U.S. dollar, such as energy, generally struggled. Many health care stocks also performed poorly as the 2020 U.S. presidential election and rhetoric around Medicare for All policies generated uncertainty.
PERFORMANCE DISCUSSION
The Fund outperformed its benchmark, the S&P 500 Index, for the period. As part of our contrarian investment approach, we seek stocks that trade at a significant discount to our estimate of fair value, whose intrinsic value we believe will grow over time, and whose management teams are aligned with shareholders. For most stocks in our portfolio, we believe the market misunderstands the business model, undervalues the company’s assets, or underappreciates the company’s long-term growth potential. We believe a concentrated, high-conviction portfolio of such companies can drive outperformance over time as the intrinsic value of these businesses gains greater appreciation by the market. This period, we were pleased to see many holdings begin to show confirmation of their true earnings potential.
Two packaging companies, Ball Corp. and Crown Holdings, were among the largest contributors for the period. Ball Corp., a metal packaging company, has benefited from the sustainability of aluminum cans and secular demand for such environmentally friendly packaging. After multiple quarters of strong stock performance, we also believe the market is simply gaining appreciation for how industry consolidation is improving Ball’s competitive position and profitability.
Crown Holdings was another large contributor. The company has three business lines: beverage can packaging, food can packaging and transit packaging. Similar to Ball Corp., Crown has seen benefits from increased demand for sustainable packaging. We believe the stock will also continue to benefit from deleveraging post Crown’s acquisition of Signode in 2018.
PagSeguro Digital was another individual contributor to performance. The digital payment solutions company has gained strong traction in Brazil, which is an underpenetrated market for debit and credit card payments. Its solutions enable small businesses and micro-merchants to accept credit card payments which is playing a vital role in increasing electronic payments within the country. The company also saw a strong launch of its digital banking business, PagBank, which offers financial services via a smartphone app and is opening a new addressable market for the company.
While we were pleased with the results of many companies in the portfolio, other holdings disappointed. ICU Medical was a top detractor. The company supplies comprehensive IV delivery solutions that include IV pumps,
Janus Investment Fund | 1 |
Janus Henderson Contrarian Fund (unaudited)
consumable bags and saline solution. Recently, some overcapacity in the IV solution market led ICU to close some of its production, leading to a decline in the stock price. We believe this action will help the IV solution market to stabilize, and we continue to like the strong competitive positioning of the company’s IV pump and consumables business. We continue to hold the position.
We exited positions in two other stocks that were large detractors during the period, Pacific Western Bank (PacWest) and technological manufacturer Flextronics, in order to redeploy capital into other more attractive investment opportunities. The negative impact from our position in Pacific Western Bank came early in the period, when bank stocks sold off broadly due to concerns about the global economy. Flextronics detracted due to a failed project with Nike, as well as the departure of the company’s CEO.
OUTLOOK
We expect geopolitical tensions to remain elevated. While we may reach a trade deal, we believe we are in a technology cold war, and technology supply chains will continue to separate between those that supply China and those that supply the West. We believe the economic uncertainty created by the trade war, combined with the beginning of the 2020 election cycle, will give corporate executives pause in thinking about spending on expansion projects. This in turn is likely to continue to hold global growth back.
Equities seem to be reasonably priced, particularly given the low interest rate backdrop. We will continue to monitor the strength of the U.S. consumer, which we expect to be the primary driver of future economic growth. Companies with misunderstood business models continue to comprise the core of our portfolio. Management execution is the key driver of performance for many of these stocks. As these management teams enhance operations, streamline corporate structures and/or focus on deleveraging initiatives, we believe these stocks will drive outperformance as the market comes to appreciate the intrinsic value of the business.
Thank you for your investment in the Janus Henderson Contrarian Fund.
2 | SEPTEMBER 30, 2019 |
Janus Henderson Contrarian Fund (unaudited)
Fund At A Glance
September 30, 2019
5 Top Performers - Holdings |
|
|
| 5 Bottom Performers - Holdings |
| |
Contribution | Contribution | |||||
Ball Corp | 1.71% | ICU Medical Inc | -1.04% | |||
PagSeguro Digital Ltd | 1.65% | Flex Ltd | -0.79% | |||
Crown Holdings Inc | 1.49% | PacWest Bancorp | -0.72% | |||
Anadarko Petroleum Corp | 1.11% | TD Ameritrade Holding Corp | -0.51% | |||
L3Harris Technologies Inc | 0.97% | Amneal Pharmaceuticals Inc | -0.42% | |||
5 Top Performers - Sectors* |
|
|
|
|
| |
Fund | Fund Weighting | S&P 500 Index | ||||
Contribution | (Average % of Equity) | Weighting | ||||
Materials | 4.48% | 13.88% | 2.66% | |||
Energy | 2.53% | 0.97% | 5.24% | |||
Information Technology | 2.14% | 12.35% | 21.00% | |||
Communication Services | 0.51% | 15.80% | 10.23% | |||
Consumer Discretionary | 0.33% | 3.52% | 10.09% | |||
5 Bottom Performers - Sectors* |
|
|
|
|
| |
Fund | Fund Weighting | S&P 500 Index | ||||
Contribution | (Average % of Equity) | Weighting | ||||
Health Care | -1.21% | 14.43% | 14.55% | |||
Financials | -1.08% | 19.81% | 13.22% | |||
Consumer Staples | -0.87% | 0.00% | 7.32% | |||
Real Estate | -0.56% | 0.01% | 3.02% | |||
Industrials | -0.25% | 12.04% | 9.40% | |||
Security contribution to performance is measured by using an algorithm that multiplies the daily performance of each security with the previous day’s ending weight in the portfolio and is gross of advisory fees. Fixed income securities and certain equity securities, such as private placements and some share classes of equity securities, are excluded. | ||||||
* | Based on sector classification according to the Global Industry Classification Standard (“GICS”) codes, which are the exclusive property and a service mark of MSCI Inc. and Standard & Poor’s. | |||||
Janus Investment Fund | 3 |
Janus Henderson Contrarian Fund (unaudited)
Fund At A Glance
September 30, 2019
5 Largest Equity Holdings - (% of Net Assets) | |
Crown Holdings Inc | |
Containers & Packaging | 5.7% |
TD Ameritrade Holding Corp | |
Capital Markets | 5.1% |
L3Harris Technologies Inc | |
Aerospace & Defense | 4.4% |
GCI Liberty Inc | |
Media | 4.1% |
Vivendi SA | |
Entertainment | 3.9% |
23.2% | |
Asset Allocation - (% of Net Assets) | |||||
Common Stocks | 92.6% | ||||
Investment Companies | 4.1% | ||||
Corporate Bonds | 3.7% | ||||
Other | (0.4)% | ||||
100.0% | |||||
Top Country Allocations - Long Positions - (% of Investment Securities) | |
As of September 30, 2019
| As of September 30, 2018
|
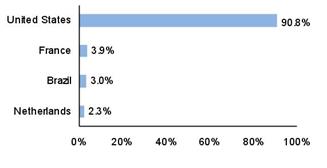
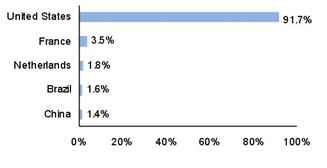
4 | SEPTEMBER 30, 2019 |
Janus Henderson Contrarian Fund (unaudited)
Performance
See important disclosures on the next page. |
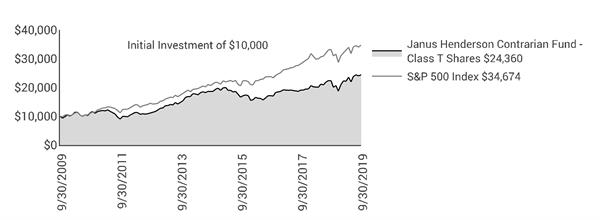
| ||||||||||
Average Annual Total Return - for the periods ended September 30, 2019 |
|
| Expense Ratios | |||||||
|
| One | Five | Ten | Since |
|
| Total Annual Fund | Net Annual Fund | |
Class A Shares at NAV |
| 8.76% | 5.34% | 9.18% | 7.11% |
|
| 0.87% | 0.87% | |
Class A Shares at MOP |
| 2.50% | 4.10% | 8.53% | 6.79% |
|
|
|
| |
Class C Shares at NAV | 8.08% | 4.59% | 8.36% | 6.31% |
|
| 1.60% | 1.60% | ||
Class C Shares at CDSC |
| 7.09% | 4.59% | 8.36% | 6.31% |
|
|
|
| |
Class D Shares(1) |
| 8.99% | 5.55% | 9.40% | 7.29% |
|
| 0.65% | 0.65% | |
Class I Shares |
| 9.05% | 5.62% | 9.48% | 7.25% |
|
| 0.57% | 0.57% | |
Class N Shares |
| 9.16% | 5.47% | 9.31% | 7.25% |
|
| 0.50% | 0.50% | |
Class R Shares |
| 8.21% | 4.87% | 8.72% | 6.64% |
|
| 1.47% | 1.42% | |
Class S Shares |
| 8.52% | 5.15% | 9.01% | 6.91% |
|
| 1.04% | 1.04% | |
Class T Shares |
| 8.92% | 5.47% | 9.31% | 7.25% |
|
| 0.74% | 0.74% | |
S&P 500 Index |
| 4.25% | 10.84% | 13.24% | 6.10% |
|
|
|
| |
Morningstar Quartile - Class T Shares |
| 1st | 3rd | 4th | 3rd |
|
|
|
| |
Morningstar Ranking - based on total returns for Mid-Cap Blend Funds |
| 14/432 | 260/360 | 252/305 | 86/158 |
|
|
|
| |
Returns quoted are past performance and do not guarantee future results; current performance may be lower or higher. Investment returns and principal value will vary; there may be a gain or loss when shares are sold. For the most recent month-end performance call 800.668.0434 (or 800.525.3713 if you hold shares directly with Janus Henderson) or visit janushenderson.com/performance (or janushenderson.com/allfunds if you hold shares directly with Janus Henderson).
Maximum Offering Price (MOP) returns include the maximum sales charge of 5.75%. Net Asset Value (NAV) returns exclude this charge, which would have reduced returns.
CDSC returns include a 1% contingent deferred sales charge (CDSC) on Shares redeemed within 12 months of purchase. Net Asset Value (NAV) returns exclude this charge, which would have reduced returns.
Net expense ratios reflect the expense waiver, if any, contractually agreed to through February 1, 2020.
This Fund has a performance-based management fee that may adjust up or down based on the Fund’s performance.
Performance may be affected by risks that include those associated with non-diversification, portfolio turnover, short sales, potential conflicts of interest,
Janus Investment Fund | 5 |
Janus Henderson Contrarian Fund (unaudited)
Performance
foreign and emerging markets, initial public offerings (IPOs), high-yield and high-risk securities, undervalued, overlooked and smaller capitalization companies, real estate related securities including Real Estate Investment Trusts (REITs), derivatives, and commodity-linked investments. Each product has different risks. Please see the prospectus for more information about risks, holdings and other details.
Returns include reinvestment of all dividends and distributions and do not reflect the deduction of taxes that a shareholder would pay on Fund distributions or redemptions of Fund shares. The returns do not include adjustments in accordance with generally accepted accounting principles required at the period end for financial reporting purposes.
Class A Shares, Class C Shares, Class R Shares, and Class S Shares commenced operations on July 6, 2009. Performance shown for each class for periods prior to July 6, 2009, reflects the performance of the Fund’s Class J Shares, the initial share class (renamed Class T Shares effective February 16, 2010), calculated using the fees and expenses of each respective class, without the effect of any fee and expense limitations or waivers.
Class D Shares commenced operations on February 16, 2010. Performance shown for periods prior to February 16, 2010, reflects the performance of the Fund’s former Class J Shares, calculated using the fees and expenses in effect during the periods shown, net of any applicable fee and expense limitations or waivers.
Class I Shares commenced operations on July 6, 2009. Performance shown for periods prior to July 6, 2009, reflects the performance of the Fund’s former Class J Shares, calculated using the fees and expenses of Class J Shares, net of any applicable fee and expense limitations or waivers.
Class N Shares commenced operations on August 4, 2017. Performance shown for periods prior to August 4, 2017, reflects the performance of the Fund’s Class T Shares, calculated using the fees and expenses of Class T Shares, net of any applicable fee and expense limitations or waivers.
If each share class of the Fund had been available during periods prior to its commencement, the performance shown may have been different. The performance shown for periods following the Fund’s commencement of each share class reflects the fees and expenses of each respective share class, net of any applicable fee and expense limitations or waivers. Please refer to the Fund’s prospectuses for further details concerning historical performance.
Ranking is for the share class shown only; other classes may have different performance characteristics. When an expense waiver is in effect, it may have a material effect on the total return, and therefore the ranking for the period.
© 2019 Morningstar, Inc. All Rights Reserved.
There is no assurance that the investment process will consistently lead to successful investing.
See Notes to Schedule of Investments and Other Information for index definitions.
Index performance does not reflect the expenses of managing a portfolio as an index is unmanaged and not available for direct investment.
See “Useful Information About Your Fund Report.”
*The Fund’s inception date – February 29, 2000
‡ As stated in the prospectus. See Financial Highlights for actual expense ratios during the reporting period.
(1) Closed to certain new investors.
6 | SEPTEMBER 30, 2019 |
Janus Henderson Contrarian Fund (unaudited)
Expense Examples
As a shareholder of the Fund, you incur two types of costs: (1) transaction costs, such as sales charges (loads) on purchase payments (applicable to Class A Shares only); and (2) ongoing costs, including management fees; 12b-1 distribution and shareholder servicing fees; transfer agent fees and expenses payable pursuant to the Transfer Agency Agreement; and other Fund expenses. This example is intended to help you understand your ongoing costs (in dollars) of investing in the Fund and to compare these costs with the ongoing costs of investing in other mutual funds. To do so, compare this 5% hypothetical example with the 5% hypothetical examples that appear in the shareholder reports of the other funds. The example is based upon an investment of $1,000 invested at the beginning of the period and held for the six-months indicated, unless noted otherwise in the table and footnotes below.
Actual Expenses
The information in the table under the heading “Actual” provides information about actual account values and actual expenses. You may use the information in these columns, together with the amount you invested, to estimate the expenses that you paid over the period. Simply divide your account value by $1,000 (for example, an $8,600 account value divided by $1,000 = 8.6), then multiply the result by the number in the appropriate column for your share class under the heading entitled “Expenses Paid During Period” to estimate the expenses you paid on your account during the period.
Hypothetical Example for Comparison Purposes
The information in the table under the heading “Hypothetical (5% return before expenses)” provides information about hypothetical account values and hypothetical expenses based upon the Fund’s actual expense ratio and an assumed rate of return of 5% per year before expenses, which is not the Fund’s actual return. The hypothetical account values and expenses may not be used to estimate the actual ending account balance or expenses you paid for the period. You may use this information to compare the ongoing costs of investing in the Fund and other funds. To do so, compare this 5% hypothetical example with the 5% hypothetical examples that appear in the shareholder reports of the other funds. Additionally, for an analysis of the fees associated with an investment in any share class or other similar funds, please visit www.finra.org/fundanalyzer.
Please note that the expenses shown in the table are meant to highlight your ongoing costs only and do not reflect any transaction costs. These fees are fully described in the Fund’s prospectuses. Therefore, the hypothetical examples are useful in comparing ongoing costs only, and will not help you determine the relative total costs of owning different funds. In addition, if these transaction costs were included, your costs would have been higher.
Actual | Hypothetical | |||||||||
| Beginning | Ending | Expenses |
| Beginning | Ending | Expenses | Net Annualized | ||
Class A Shares | $1,000.00 | $1,099.10 | $5.16 |
| $1,000.00 | $1,020.16 | $4.96 | 0.98% | ||
Class C Shares | $1,000.00 | $1,095.40 | $8.56 |
| $1,000.00 | $1,016.90 | $8.24 | 1.63% | ||
Class D Shares | $1,000.00 | $1,099.80 | $3.95 |
| $1,000.00 | $1,021.31 | $3.80 | 0.75% | ||
Class I Shares | $1,000.00 | $1,100.30 | $3.63 |
| $1,000.00 | $1,021.61 | $3.50 | 0.69% | ||
Class N Shares | $1,000.00 | $1,100.50 | $3.26 |
| $1,000.00 | $1,021.96 | $3.14 | 0.62% | ||
Class R Shares | $1,000.00 | $1,096.10 | $7.99 |
| $1,000.00 | $1,017.45 | $7.69 | 1.52% | ||
Class S Shares | $1,000.00 | $1,097.30 | $6.52 |
| $1,000.00 | $1,018.85 | $6.28 | 1.24% | ||
Class T Shares | $1,000.00 | $1,099.40 | $4.42 |
| $1,000.00 | $1,020.86 | $4.26 | 0.84% | ||
† | Expenses Paid During Period are equal to the Net Annualized Expense Ratio multiplied by the average account value over the period, multiplied by 183/365 (to reflect the one-half year period). Expenses in the examples include the effect of applicable fee waivers and/or expense reimbursements, if any. Had such waivers and/or reimbursements not been in effect, your expenses would have been higher. Please refer to the Notes to Financial Statements or the Fund’s prospectuses for more information regarding waivers and/or reimbursements. | |||||||||
Janus Investment Fund | 7 |
Janus Henderson Contrarian Fund
Schedule of Investments
September 30, 2019
Shares or | Value | ||||||
Corporate Bonds – 3.7% | |||||||
Industrial Conglomerates – 3.7% | |||||||
General Electric Co, ICE LIBOR USD 3 Month + 3.3300%, 5.0000%‡,µ (cost $103,625,531) | $112,675,000 | $106,900,406 | |||||
Common Stocks – 92.6% | |||||||
Aerospace & Defense – 5.4% | |||||||
Axon Enterprise Inc* | 529,992 | 30,092,946 | |||||
L3Harris Technologies Inc | 605,188 | 126,266,424 | |||||
156,359,370 | |||||||
Banks – 4.2% | |||||||
Citigroup Inc | 1,150,764 | 79,494,777 | |||||
Webster Financial Corp | 904,620 | 42,399,539 | |||||
121,894,316 | |||||||
Biotechnology – 3.2% | |||||||
Insmed Inc* | 2,240,547 | 39,523,249 | |||||
Neurocrine Biosciences Inc* | 574,690 | 51,785,316 | |||||
91,308,565 | |||||||
Capital Markets – 11.2% | |||||||
Apollo Global Management Inc | 2,984,344 | 112,867,890 | |||||
Intercontinental Exchange Inc | 696,129 | 64,231,823 | |||||
TD Ameritrade Holding Corp | 3,124,492 | 145,913,776 | |||||
323,013,489 | |||||||
Chemicals – 1.5% | |||||||
Air Products & Chemicals Inc | 197,967 | 43,920,959 | |||||
Construction Materials – 2.4% | |||||||
Summit Materials Inc*,£ | 3,179,690 | 70,589,118 | |||||
Containers & Packaging – 6.9% | |||||||
Ball Corp | 449,985 | 32,763,408 | |||||
Crown Holdings Inc* | 2,503,103 | 165,355,284 | |||||
198,118,692 | |||||||
Diversified Financial Services – 0.3% | |||||||
GTY Technology Holdings Inc*,# | 1,184,588 | 7,427,367 | |||||
Entertainment – 10.4% | |||||||
Liberty Media Corp-Liberty Formula One* | 2,464,565 | 102,501,258 | |||||
Vivendi SA | 4,118,380 | 113,013,087 | |||||
Walt Disney Co | 653,589 | 85,175,719 | |||||
300,690,064 | |||||||
Equity Real Estate Investment Trusts (REITs) – 1.4% | |||||||
VICI Properties Inc | 1,749,580 | 39,627,987 | |||||
Health Care Equipment & Supplies – 2.8% | |||||||
Globus Medical Inc* | 579,473 | 29,622,660 | |||||
ICU Medical Inc* | 312,025 | 49,799,190 | |||||
79,421,850 | |||||||
Hotels, Restaurants & Leisure – 2.0% | |||||||
Norwegian Cruise Line Holdings Ltd* | 1,096,465 | 56,763,993 | |||||
Independent Power and Renewable Electricity Producers – 5.1% | |||||||
NRG Energy Inc | 1,784,768 | 70,676,813 | |||||
Vistra Energy Corp | 2,873,384 | 76,805,554 | |||||
147,482,367 | |||||||
Industrial Conglomerates – 1.5% | |||||||
General Electric Co | 4,795,883 | 42,875,194 | |||||
Information Technology Services – 3.0% | |||||||
Pagseguro Digital Ltd* | 1,895,112 | 87,762,637 | |||||
Interactive Media & Services – 2.3% | |||||||
Alphabet Inc - Class C* | 54,025 | 65,856,475 | |||||
Leisure Products – 1.0% | |||||||
Hasbro Inc | 243,120 | 28,855,913 | |||||
Machinery – 6.1% | |||||||
Stanley Black & Decker Inc | 577,768 | 83,435,477 | |||||
See Notes to Schedule of Investments and Other Information and Notes to Financial Statements. | |
8 | SEPTEMBER 30, 2019 |
Janus Henderson Contrarian Fund
Schedule of Investments
September 30, 2019
Shares or | Value | ||||||
Common Stocks – (continued) | |||||||
Machinery – (continued) | |||||||
Wabtec Corp | 1,279,797 | $91,966,212 | |||||
175,401,689 | |||||||
Media – 4.1% | |||||||
GCI Liberty Inc* | 1,884,289 | 116,957,818 | |||||
Metals & Mining – 3.2% | |||||||
Constellium NV* | 5,204,894 | 66,154,203 | |||||
Freeport-McMoRan Inc | 2,799,185 | 26,788,200 | |||||
92,942,403 | |||||||
Multi-Utilities – 3.1% | |||||||
Sempra Energy | 602,436 | 88,925,578 | |||||
Pharmaceuticals – 2.0% | |||||||
Allergan PLC | 214,962 | 36,175,955 | |||||
Collegium Pharmaceutical Inc*,£ | 1,818,594 | 20,877,459 | |||||
57,053,414 | |||||||
Semiconductor & Semiconductor Equipment – 3.6% | |||||||
Lam Research Corp | 197,810 | 45,715,869 | |||||
Microchip Technology Inc | 624,766 | 58,047,009 | |||||
103,762,878 | |||||||
Software – 1.1% | |||||||
Avalara Inc* | 489,199 | 32,918,201 | |||||
Technology Hardware, Storage & Peripherals – 2.0% | |||||||
NCR Corp* | 1,782,078 | 56,242,382 | |||||
Trading Companies & Distributors – 1.3% | |||||||
Ferguson PLC | 530,256 | 38,745,641 | |||||
Wireless Telecommunication Services – 1.5% | |||||||
T-Mobile US Inc* | 544,261 | 42,871,439 | |||||
Total Common Stocks (cost $2,371,294,611) | 2,667,789,799 | ||||||
Investment Companies – 4.1% | |||||||
Investments Purchased with Cash Collateral from Securities Lending – 0% | |||||||
Janus Henderson Cash Collateral Fund LLC, 1.7248%ºº,£ | 334,750 | 334,750 | |||||
Money Markets – 4.1% | |||||||
Janus Henderson Cash Liquidity Fund LLC, 2.0434%ºº,£ | 118,196,467 | 118,196,467 | |||||
Total Investment Companies (cost $118,531,217) | 118,531,217 | ||||||
Total Investments (total cost $2,593,451,359) – 100.4% | 2,893,221,422 | ||||||
Liabilities, net of Cash, Receivables and Other Assets – (0.4)% | (11,807,248) | ||||||
Net Assets – 100% | $2,881,414,174 | ||||||
Summary of Investments by Country - (Long Positions) (unaudited) | |||||
% of | |||||
Investment | |||||
Country | Value | Securities | |||
United States | $2,626,291,495 | 90.8 | % | ||
France | 113,013,087 | 3.9 | |||
Brazil | 87,762,637 | 3.0 | |||
Netherlands | 66,154,203 | 2.3 | |||
Total | $2,893,221,422 | 100.0 | % |
See Notes to Schedule of Investments and Other Information and Notes to Financial Statements. | |
Janus Investment Fund | 9 |
Janus Henderson Contrarian Fund
Schedule of Investments
September 30, 2019
Schedules of Affiliated Investments – (% of Net Assets)
Dividend Income(1) | Realized Gain/(Loss)(1) | Change in Unrealized Appreciation/ Depreciation(1) | Value at 9/30/19 | |||||||
Common Stocks - 0.7% | ||||||||||
Construction Materials - N/A | ||||||||||
Summit Materials Inc*,š | $ | - | $ | (10,375,141) | $ | 34,244,581 | $ | N/A | ||
Health Care Providers & Services - N/A | ||||||||||
HLS Therapeutics Inc | 73,974 | 2,157,000 | (3,161,168) | - | ||||||
Pharmaceuticals - 0.7% | ||||||||||
Collegium Pharmaceutical Inc* | - | (601,886) | (3,396,185) | 20,877,459 | ||||||
Total Common Stocks | $ | 73,974 | $ | (8,820,027) | $ | 27,687,228 | $ | 20,877,459 | ||
Investment Companies - 4.1% | ||||||||||
Investments Purchased with Cash Collateral from Securities Lending - 0.0% | ||||||||||
Janus Henderson Cash Collateral Fund LLC, 1.7248%ºº | 160,586∆ | - | - | 334,750 | ||||||
Money Markets - 4.1% | ||||||||||
Janus Henderson Cash Liquidity Fund LLC, 2.0434%ºº | 1,601,726 | 3,300 | - | 118,196,467 | ||||||
Total Investment Companies | $ | 1,762,312 | $ | 3,300 | $ | - | $ | 118,531,217 | ||
Total Affiliated Investments - 4.8% | $ | 1,836,286 | $ | (8,816,727) | $ | 27,687,228 | $ | 139,408,676 | ||
(1) For securities that were affiliated for a portion of the year ended September 30, 2019, this column reflects amounts for the entire year ended September 30, 2019 and not just the period in which the security was affiliated.
Share Balance at 9/30/18 | Purchases | Sales | Share Balance at 9/30/19 | |||||||
Common Stocks - 0.7% | ||||||||||
Construction Materials - N/A | ||||||||||
Summit Materials Inc*,š | 3,645,375 | 2,276,846 | (2,742,531) | 3,179,690 | ||||||
Health Care Providers & Services - N/A | ||||||||||
HLS Therapeutics Inc | 1,935,741 | 1,935,741Ð | (3,871,482)Ð | - | ||||||
Pharmaceuticals - 0.7% | ||||||||||
Collegium Pharmaceutical Inc* | 1,171,914 | 748,589 | (101,909) | 1,818,594 | ||||||
Investment Companies - 4.1% | ||||||||||
Investments Purchased with Cash Collateral from Securities Lending - 0.0% | ||||||||||
Janus Henderson Cash Collateral Fund LLC, 1.7248%ºº | 3,301,625 | 466,622,339 | (469,589,214) | 334,750 | ||||||
Money Markets - 4.1% | ||||||||||
Janus Henderson Cash Liquidity Fund LLC, 2.0434%ºº | 59,674,290 | 1,068,887,786 | (1,010,365,609) | 118,196,467 | ||||||
See Notes to Schedule of Investments and Other Information and Notes to Financial Statements. | |
10 | SEPTEMBER 30, 2019 |
Janus Henderson Contrarian Fund
Notes to Schedule of Investments and Other Information
S&P 500® Index | S&P 500® Index reflects U.S. large-cap equity performance and represents broad U.S. equity market performance. |
ICE | Intercontinental Exchange |
LIBOR | London Interbank Offered Rate |
LLC | Limited Liability Company |
PLC | Public Limited Company |
* | Non-income producing security. |
‡ | Variable or floating rate security. Rate shown is the current rate as of September 30, 2019. Certain variable rate securities are not based on a published reference rate and spread; they are determined by the issuer or agent and current market conditions. Reference rate is as of reset date and may vary by security, which may not indicate a reference rate and/or spread in their description. |
ºº | Rate shown is the 7-day yield as of September 30, 2019. |
# | Loaned security; a portion of the security is on loan at September 30, 2019. |
µ | Perpetual security. Perpetual securities have no stated maturity date, but they may be called/redeemed by the issuer. The date indicated represents the next call date. |
£ | The Fund may invest in certain securities that are considered affiliated companies. As defined by the Investment Company Act of 1940, as amended, an affiliated company is one in which the Fund owns 5% or more of the outstanding voting securities, or a company which is under common ownership or control. |
š | Company was no longer an affiliate as of September 30, 2019. |
∆ | Net of income paid to the securities lending agent and rebates paid to the borrowing counterparties. |
Ð | All or a portion is the result of a corporate action. |
The following is a summary of the inputs that were used to value the Fund’s investments in securities and other financial instruments as of September 30, 2019. See Notes to Financial Statements for more information. | ||||||||||||
Valuation Inputs Summary | ||||||||||||
Level 2 - | Level 3 - | |||||||||||
Level 1 - | Other Significant | Significant | ||||||||||
Quoted Prices | Observable Inputs | Unobservable Inputs | ||||||||||
Assets | ||||||||||||
Investments In Securities: | ||||||||||||
Corporate Bonds | $ | - | $ | 106,900,406 | $ | - | ||||||
Common Stocks | 2,667,789,799 | - | - | |||||||||
Investment Companies | - | 118,531,217 | - | |||||||||
Total Assets | $ | 2,667,789,799 | $ | 225,431,623 | $ | - | ||||||
Janus Investment Fund | 11 |
Janus Henderson Contrarian Fund
Statement of Assets and Liabilities
September 30, 2019
|
|
|
|
|
|
|
Assets: | ||||||
Unaffiliated investments, at value(1)(2) | $ | 2,753,812,746 | ||||
Affiliated investments, at value(3) | 139,408,676 | |||||
Cash | 472 | |||||
Non-interested Trustees' deferred compensation | 74,263 | |||||
Receivables: | ||||||
Investments sold | 24,068,183 | |||||
Fund shares sold | 5,925,469 | |||||
Interest | 1,658,826 | |||||
Dividends | 1,119,081 | |||||
Foreign tax reclaims | 312,366 | |||||
Dividends from affiliates | 183,175 | |||||
Other assets | 6,886 | |||||
Total Assets |
|
| 2,926,570,143 |
| ||
Liabilities: | ||||||
Collateral for securities loaned (Note 2) | 334,750 | |||||
Payables: | — | |||||
Investments purchased | 41,667,521 | |||||
Advisory fees | 1,355,002 | |||||
Fund shares repurchased | 976,407 | |||||
Transfer agent fees and expenses | 417,578 | |||||
Non-interested Trustees' deferred compensation fees | 74,263 | |||||
Professional fees | 60,867 | |||||
Non-interested Trustees' fees and expenses | 18,512 | |||||
12b-1 Distribution and shareholder servicing fees | 13,540 | |||||
Custodian fees | 7,376 | |||||
Affiliated fund administration fees payable | 5,949 | |||||
Accrued expenses and other payables | 224,204 | |||||
Total Liabilities |
|
| 45,155,969 |
| ||
Net Assets |
| $ | 2,881,414,174 |
| ||
See Notes to Financial Statements. | |
12 | SEPTEMBER 30, 2019 |
Janus Henderson Contrarian Fund
Statement of Assets and Liabilities
September 30, 2019
|
|
|
|
|
|
|
Net Assets Consist of: | ||||||
Capital (par value and paid-in surplus) | $ | 2,269,359,343 | ||||
Total distributable earnings (loss) | 612,054,831 | |||||
Total Net Assets |
| $ | 2,881,414,174 |
| ||
Net Assets - Class A Shares | $ | 20,125,613 | ||||
Shares Outstanding, $0.01 Par Value (unlimited shares authorized) | 930,561 | |||||
Net Asset Value Per Share(4) |
| $ | 21.63 |
| ||
Maximum Offering Price Per Share(5) |
| $ | 22.95 |
| ||
Net Assets - Class C Shares | $ | 10,556,373 | ||||
Shares Outstanding, $0.01 Par Value (unlimited shares authorized) | 528,415 | |||||
Net Asset Value Per Share(4) |
| $ | 19.98 |
| ||
Net Assets - Class D Shares | $ | 1,988,710,733 | ||||
Shares Outstanding, $0.01 Par Value (unlimited shares authorized) | 91,646,747 | |||||
Net Asset Value Per Share |
| $ | 21.70 |
| ||
Net Assets - Class I Shares | $ | 90,753,813 | ||||
Shares Outstanding, $0.01 Par Value (unlimited shares authorized) | 4,176,106 | |||||
Net Asset Value Per Share |
| $ | 21.73 |
| ||
Net Assets - Class N Shares | $ | 39,055,973 | ||||
Shares Outstanding, $0.01 Par Value (unlimited shares authorized) | 1,801,212 | |||||
Net Asset Value Per Share |
| $ | 21.68 |
| ||
Net Assets - Class R Shares | $ | 779,644 | ||||
Shares Outstanding, $0.01 Par Value (unlimited shares authorized) | 37,344 | |||||
Net Asset Value Per Share |
| $ | 20.88 |
| ||
Net Assets - Class S Shares | $ | 1,032,244 | ||||
Shares Outstanding, $0.01 Par Value (unlimited shares authorized) | 47,908 | |||||
Net Asset Value Per Share |
| $ | 21.55 |
| ||
Net Assets - Class T Shares | $ | 730,399,781 | ||||
Shares Outstanding, $0.01 Par Value (unlimited shares authorized) | 33,690,814 | |||||
Net Asset Value Per Share |
| $ | 21.68 |
| ||
(1) Includes cost of $2,448,840,846. (2) Includes $317,240 of securities on loan. See Note 2 in Notes to Financial Statements. (3) Includes cost of $144,610,513. (4) Redemption price per share may be reduced for any applicable contingent deferred sales charge. (5) Maximum offering price is computed at 100/94.25 of net asset value. |
See Notes to Financial Statements. | |
Janus Investment Fund | 13 |
Janus Henderson Contrarian Fund
Statement of Operations
For the year ended September 30, 2019
|
|
|
|
|
|
Investment Income: | |||||
| Dividends | $ | 34,743,808 | ||
Interest | 3,463,861 | ||||
Dividends from affiliates | 1,675,700 | ||||
Affiliated securities lending income, net | 160,586 | ||||
Other income | 1,096 | ||||
Foreign tax withheld | (372,728) | ||||
Total Investment Income |
| 39,672,323 |
| ||
Expenses: | |||||
Advisory fees | 13,903,807 | ||||
12b-1 Distribution and shareholder servicing fees: | |||||
Class A Shares | 44,385 | ||||
Class C Shares | 110,032 | ||||
Class R Shares | 3,473 | ||||
Class S Shares | 2,438 | ||||
Transfer agent administrative fees and expenses: | |||||
Class D Shares | 2,222,359 | ||||
Class R Shares | 1,736 | ||||
Class S Shares | 2,489 | ||||
Class T Shares | 1,632,120 | ||||
Transfer agent networking and omnibus fees: | |||||
Class A Shares | 19,398 | ||||
Class C Shares | 11,187 | ||||
Class I Shares | 42,847 | ||||
Other transfer agent fees and expenses: | |||||
Class A Shares | 1,540 | ||||
Class C Shares | 1,099 | ||||
Class D Shares | 348,795 | ||||
Class I Shares | 2,457 | ||||
Class N Shares | 668 | ||||
Class R Shares | 46 | ||||
Class S Shares | 33 | ||||
Class T Shares | 8,242 | ||||
Shareholder reports expense | 386,963 | ||||
Registration fees | 147,457 | ||||
Professional fees | 98,205 | ||||
Non-interested Trustees’ fees and expenses | 76,918 | ||||
Affiliated fund administration fees | 62,015 | ||||
Custodian fees | 31,740 | ||||
Other expenses | 206,445 | ||||
Total Expenses |
| 19,368,894 |
| ||
Less: Excess Expense Reimbursement and Waivers |
| (85,427) |
| ||
Net Expenses |
| 19,283,467 |
| ||
Net Investment Income/(Loss) |
| 20,388,856 |
| ||
See Notes to Financial Statements. | |
14 | SEPTEMBER 30, 2019 |
Janus Henderson Contrarian Fund
Statement of Operations
For the year ended September 30, 2019
|
|
|
|
|
|
Net Realized Gain/(Loss) on Investments: | |||||
Investments and foreign currency transactions | $ | 304,905,165 | |||
Investments in affiliates | (8,816,727) | ||||
Total Net Realized Gain/(Loss) on Investments |
| 296,088,438 |
| ||
Change in Unrealized Net Appreciation/Depreciation: | |||||
Investments, foreign currency translations and non-interested Trustees’ deferred compensation | (117,032,138) | ||||
Investments in affiliates | 27,687,228 | ||||
Total Change in Unrealized Net Appreciation/Depreciation |
| (89,344,910) |
| ||
Net Increase/(Decrease) in Net Assets Resulting from Operations | $ | 227,132,384 |
| ||
See Notes to Financial Statements. | |
Janus Investment Fund | 15 |
Janus Henderson Contrarian Fund
Statements of Changes in Net Assets
|
|
| Year ended |
| Year ended | |||
Operations: | ||||||||
Net investment income/(loss) | $ | 20,388,856 | $ | 13,077,645 | ||||
Net realized gain/(loss) on investments | 296,088,438 | 199,980,809 | ||||||
Change in unrealized net appreciation/depreciation | (89,344,910) | 202,296,835 | ||||||
Net Increase/(Decrease) in Net Assets Resulting from Operations |
| 227,132,384 |
|
| 415,355,289 | |||
Dividends and Distributions to Shareholders | ||||||||
Class A Shares | (1,306,188) | (988,770) | ||||||
Class C Shares | (921,287) | (1,846,338) | ||||||
Class D Shares | (130,044,636) | (136,146,535) | ||||||
Class I Shares | (3,674,159) | (4,829,794) | ||||||
Class N Shares | (1,825,989) | (1,833,679) | ||||||
Class R Shares | (48,055) | (50,300) | ||||||
Class S Shares | (69,577) | (245,468) | ||||||
Class T Shares | (45,148,251) | (48,816,373) | ||||||
Net Decrease from Dividends and Distributions to Shareholders |
| (183,038,142) |
|
| (194,757,257) | |||
Capital Share Transactions: | ||||||||
Class A Shares | 4,639,832 | (773,296) | ||||||
Class C Shares | (7,795,100) | (9,770,402) | ||||||
Class D Shares | 30,574,375 | (55,211,917) | ||||||
Class I Shares | 35,268,978 | (25,520,409) | ||||||
Class N Shares | 11,502,731 | 5,120,393 | ||||||
Class R Shares | 86,405 | (115,254) | ||||||
Class S Shares | (12,857) | (3,080,689) | ||||||
Class T Shares | 43,924,102 | (51,022,860) | ||||||
Net Increase/(Decrease) from Capital Share Transactions |
| 118,188,466 |
|
| (140,374,434) | |||
Net Increase/(Decrease) in Net Assets |
| 162,282,708 |
|
| 80,223,598 | |||
Net Assets: | ||||||||
Beginning of period | 2,719,131,466 | 2,638,907,868 | ||||||
| End of period | $ | 2,881,414,174 |
| $ | 2,719,131,466 | ||
See Notes to Financial Statements. | |
16 | SEPTEMBER 30, 2019 |
Janus Henderson Contrarian Fund
Financial Highlights
Class A Shares | ||||||||||||||||||
For a share outstanding during the year ended September 30 |
| 2019 |
|
| 2018 |
|
| 2017 |
|
| 2016 |
|
| 2015 |
| |||
Net Asset Value, Beginning of Period |
| $21.61 |
|
| $19.92 |
|
| $18.53 |
|
| $18.56 |
|
| $23.11 |
| |||
Income/(Loss) from Investment Operations: | ||||||||||||||||||
Net investment income/(loss)(1) | 0.12 | 0.06 | 0.05 | 0.07 | 0.05 | |||||||||||||
Net realized and unrealized gain/(loss) | 1.36 | 3.10 | 2.02 | 0.43 | (2.26) | |||||||||||||
Total from Investment Operations |
| 1.48 |
|
| 3.16 |
|
| 2.07 |
|
| 0.50 |
|
| (2.21) |
| |||
Less Dividends and Distributions: | ||||||||||||||||||
Dividends (from net investment income) | (0.04) | — | —(2) | (0.03) | (0.06) | |||||||||||||
Distributions (from capital gains) | (1.42) | (1.47) | (0.68) | (0.50) | (2.28) | |||||||||||||
Total Dividends and Distributions |
| (1.46) |
|
| (1.47) |
|
| (0.68) |
|
| (0.53) |
|
| (2.34) |
| |||
Net Asset Value, End of Period | $21.63 | $21.61 | $19.92 | $18.53 | $18.56 | |||||||||||||
Total Return* |
| 8.76% |
|
| 16.89% |
|
| 11.24% |
|
| 2.77% |
|
| (10.76)% |
| |||
Net Assets, End of Period (in thousands) | $20,126 | $14,940 | $14,557 | $53,928 | $102,425 | |||||||||||||
Average Net Assets for the Period (in thousands) | $17,754 | $13,854 | $30,749 | $73,939 | $114,845 | |||||||||||||
Ratios to Average Net Assets**: |
|
|
|
|
|
|
|
|
|
|
|
|
|
|
| |||
Ratio of Gross Expenses | 0.94% | 0.87% | 0.82% | 0.90% | 1.13% | |||||||||||||
Ratio of Net Expenses (After Waivers and Expense Offsets) | 0.94% | 0.87% | 0.82% | 0.90% | 1.13% | |||||||||||||
Ratio of Net Investment Income/(Loss) | 0.58% | 0.31% | 0.25% | 0.37% | 0.21% | |||||||||||||
Portfolio Turnover Rate | 76% | 59% | 116% | 51% | 70% | |||||||||||||
Class C Shares | ||||||||||||||||||
For a share outstanding during the year ended September 30 |
| 2019 |
|
| 2018 |
|
| 2017 |
|
| 2016 |
|
| 2015 |
| |||
Net Asset Value, Beginning of Period |
| $20.16 |
|
| $18.80 |
|
| $17.64 |
|
| $17.79 |
|
| $22.34 |
| |||
Income/(Loss) from Investment Operations: | ||||||||||||||||||
Net investment income/(loss)(1) | (0.02) | (0.07) | (0.10) | (0.06) | (0.11) | |||||||||||||
Net realized and unrealized gain/(loss) | 1.26 | 2.90 | 1.94 | 0.41 | (2.16) | |||||||||||||
Total from Investment Operations |
| 1.24 |
|
| 2.83 |
|
| 1.84 |
|
| 0.35 |
|
| (2.27) |
| |||
Less Dividends and Distributions: | ||||||||||||||||||
Dividends (from net investment income) | — | — | — | — | — | |||||||||||||
Distributions (from capital gains) | (1.42) | (1.47) | (0.68) | (0.50) | (2.28) | |||||||||||||
Total Dividends and Distributions |
| (1.42) |
|
| (1.47) |
|
| (0.68) |
|
| (0.50) |
|
| (2.28) |
| |||
Net Asset Value, End of Period | $19.98 | $20.16 | $18.80 | $17.64 | $17.79 | |||||||||||||
Total Return* |
| 8.08% |
|
| 16.10% |
|
| 10.46% |
|
| 2.02% |
|
| (11.44)% |
| |||
Net Assets, End of Period (in thousands) | $10,556 | $19,126 | $27,507 | $47,112 | $77,497 | |||||||||||||
Average Net Assets for the Period (in thousands) | $12,089 | $21,999 | $35,731 | $58,609 | $86,160 | |||||||||||||
Ratios to Average Net Assets**: |
|
|
|
|
|
|
|
|
|
|
|
|
|
|
| |||
Ratio of Gross Expenses | 1.58% | 1.56% | 1.53% | 1.62% | 1.89% | |||||||||||||
Ratio of Net Expenses (After Waivers and Expense Offsets) | 1.58% | 1.56% | 1.53% | 1.62% | 1.89% | |||||||||||||
Ratio of Net Investment Income/(Loss) | (0.10)% | (0.38)% | (0.54)% | (0.36)% | (0.54)% | |||||||||||||
Portfolio Turnover Rate | 76% | 59% | 116% | 51% | 70% | |||||||||||||
* Total return includes adjustments in accordance with generally accepted accounting principles required at the year or period end and are not annualized for periods of less than one full year. ** Annualized for periods of less than one full year. (1) Per share amounts are calculated based on average shares outstanding during the year or period. (2) Less than $0.005 on a per share basis. |
See Notes to Financial Statements. | |
Janus Investment Fund | 17 |
Janus Henderson Contrarian Fund
Financial Highlights
Class D Shares | ||||||||||||||||||
For a share outstanding during the year ended September 30 |
| 2019 |
|
| 2018 |
|
| 2017 |
|
| 2016 |
|
| 2015 |
| |||
Net Asset Value, Beginning of Period |
| $21.65 |
|
| $19.97 |
|
| $18.60 |
|
| $18.64 |
|
| $23.18 |
| |||
Income/(Loss) from Investment Operations: | ||||||||||||||||||
Net investment income/(loss)(1) | 0.16 | 0.11 | 0.06 | 0.10 | 0.08 | |||||||||||||
Net realized and unrealized gain/(loss) | 1.37 | 3.11 | 2.06 | 0.44 | (2.27) | |||||||||||||
Total from Investment Operations |
| 1.53 |
|
| 3.22 |
|
| 2.12 |
|
| 0.54 |
|
| (2.19) |
| |||
Less Dividends and Distributions: | ||||||||||||||||||
Dividends (from net investment income) | (0.06) | (0.07) | (0.07) | (0.08) | (0.07) | |||||||||||||
Distributions (from capital gains) | (1.42) | (1.47) | (0.68) | (0.50) | (2.28) | |||||||||||||
Total Dividends and Distributions |
| (1.48) |
|
| (1.54) |
|
| (0.75) |
|
| (0.58) |
|
| (2.35) |
| |||
Net Asset Value, End of Period | $21.70 | $21.65 | $19.97 | $18.60 | $18.64 | |||||||||||||
Total Return* |
| 8.99% |
|
| 17.20% |
|
| 11.43% |
|
| 2.98% |
|
| (10.63)% |
| |||
Net Assets, End of Period (in thousands) | $1,988,711 | $1,925,749 | $1,824,343 | $1,830,310 | $1,976,590 | |||||||||||||
Average Net Assets for the Period (in thousands) | $1,855,826 | $1,841,765 | $1,882,932 | $1,856,945 | $2,354,562 | |||||||||||||
Ratios to Average Net Assets**: |
|
|
|
|
|
|
|
|
|
|
|
|
|
|
| |||
Ratio of Gross Expenses | 0.71% | 0.65% | 0.64% | 0.70% | 0.95% | |||||||||||||
Ratio of Net Expenses (After Waivers and Expense Offsets) | 0.71% | 0.65% | 0.64% | 0.70% | 0.95% | |||||||||||||
Ratio of Net Investment Income/(Loss) | 0.80% | 0.53% | 0.33% | 0.56% | 0.35% | |||||||||||||
Portfolio Turnover Rate | 76% | 59% | 116% | 51% | 70% | |||||||||||||
Class I Shares | ||||||||||||||||||
For a share outstanding during the year ended September 30 |
| 2019 |
|
| 2018 |
|
| 2017 |
|
| 2016 |
|
| 2015 |
| |||
Net Asset Value, Beginning of Period |
| $21.68 |
|
| $19.99 |
|
| $18.61 |
|
| $18.64 |
|
| $23.20 |
| |||
Income/(Loss) from Investment Operations: | ||||||||||||||||||
Net investment income/(loss)(1) | 0.17 | 0.12 | 0.07 | 0.11 | 0.10 | |||||||||||||
Net realized and unrealized gain/(loss) | 1.37 | 3.12 | 2.07 | 0.44 | (2.28) | |||||||||||||
Total from Investment Operations |
| 1.54 |
|
| 3.24 |
|
| 2.14 |
|
| 0.55 |
|
| (2.18) |
| |||
Less Dividends and Distributions: | ||||||||||||||||||
Dividends (from net investment income) | (0.07) | (0.08) | (0.08) | (0.08) | (0.10) | |||||||||||||
Distributions (from capital gains) | (1.42) | (1.47) | (0.68) | (0.50) | (2.28) | |||||||||||||
Total Dividends and Distributions |
| (1.49) |
|
| (1.55) |
|
| (0.76) |
|
| (0.58) |
|
| (2.38) |
| |||
Net Asset Value, End of Period | $21.73 | $21.68 | $19.99 | $18.61 | $18.64 | |||||||||||||
Total Return* |
| 9.05% |
|
| 17.29% |
|
| 11.54% |
|
| 3.05% |
|
| (10.60)% |
| |||
Net Assets, End of Period (in thousands) | $90,754 | $54,348 | $75,603 | $93,875 | $248,586 | |||||||||||||
Average Net Assets for the Period (in thousands) | $59,058 | $58,166 | $104,290 | $144,380 | $382,723 | |||||||||||||
Ratios to Average Net Assets**: |
|
|
|
|
|
|
|
|
|
|
|
|
|
|
| |||
Ratio of Gross Expenses | 0.65% | 0.57% | 0.56% | 0.63% | 0.86% | |||||||||||||
Ratio of Net Expenses (After Waivers and Expense Offsets) | 0.65% | 0.57% | 0.56% | 0.63% | 0.86% | |||||||||||||
Ratio of Net Investment Income/(Loss) | 0.85% | 0.60% | 0.37% | 0.61% | 0.44% | |||||||||||||
Portfolio Turnover Rate | 76% | 59% | 116% | 51% | 70% | |||||||||||||
* Total return includes adjustments in accordance with generally accepted accounting principles required at the year or period end and are not annualized for periods of less than one full year. ** Annualized for periods of less than one full year. (1) Per share amounts are calculated based on average shares outstanding during the year or period. |
See Notes to Financial Statements. | |
18 | SEPTEMBER 30, 2019 |
Janus Henderson Contrarian Fund
Financial Highlights
Class N Shares | ||||||||||||
For a share outstanding during the year or period ended September 30 |
| 2019 |
|
| 2018 |
|
| 2017(1) |
| |||
Net Asset Value, Beginning of Period |
| $21.63 |
|
| $19.96 |
|
| $19.49 |
| |||
Income/(Loss) from Investment Operations: | ||||||||||||
Net investment income/(loss)(2) | 0.19 | 0.14 | 0.01 | |||||||||
Net realized and unrealized gain/(loss) | 1.36 | 3.10 | 0.46 | |||||||||
Total from Investment Operations |
| 1.55 |
|
| 3.24 |
|
| 0.47 |
| |||
Less Dividends and Distributions: | ||||||||||||
Dividends (from net investment income) | (0.08) | (0.10) | — | |||||||||
Distributions (from capital gains) | (1.42) | (1.47) | — | |||||||||
Total Dividends and Distributions |
| (1.50) |
|
| (1.57) |
|
| — |
| |||
Net Asset Value, End of Period | $21.68 | $21.63 | $19.96 | |||||||||
Total Return* |
| 9.16% |
|
| 17.37% |
|
| 2.41% |
| |||
Net Assets, End of Period (in thousands) | $39,056 | $26,808 | $19,528 | |||||||||
Average Net Assets for the Period (in thousands) | $28,593 | $24,664 | $12,254 | |||||||||
Ratios to Average Net Assets**: |
|
|
|
|
|
|
|
|
| |||
Ratio of Gross Expenses | 0.58% | 0.50% | 0.51% | |||||||||
Ratio of Net Expenses (After Waivers and Expense Offsets) | 0.58% | 0.50% | 0.51% | |||||||||
Ratio of Net Investment Income/(Loss) | 0.92% | 0.69% | 0.44% | |||||||||
Portfolio Turnover Rate | 76% | 59% | 116% | |||||||||
Class R Shares | ||||||||||||||||||
For a share outstanding during the year ended September 30 |
| 2019 |
|
| 2018 |
|
| 2017 |
|
| 2016 |
|
| 2015 |
| |||
Net Asset Value, Beginning of Period |
| $20.97 |
|
| $19.47 |
|
| $18.19 |
|
| $18.27 |
|
| $22.81 |
| |||
Income/(Loss) from Investment Operations: | ||||||||||||||||||
Net investment income/(loss)(2) | 0.01 | (0.05) | (0.04) | —(3) | (0.05) | |||||||||||||
Net realized and unrealized gain/(loss) | 1.32 | 3.02 | 2.00 | 0.42 | (2.21) | |||||||||||||
Total from Investment Operations |
| 1.33 |
|
| 2.97 |
|
| 1.96 |
|
| 0.42 |
|
| (2.26) |
| |||
Less Dividends and Distributions: | ||||||||||||||||||
Dividends (from net investment income) | — | — | — | — | — | |||||||||||||
Distributions (from capital gains) | (1.42) | (1.47) | (0.68) | (0.50) | (2.28) | |||||||||||||
Total Dividends and Distributions |
| (1.42) |
|
| (1.47) |
|
| (0.68) |
|
| (0.50) |
|
| (2.28) |
| |||
Net Asset Value, End of Period | $20.88 | $20.97 | $19.47 | $18.19 | $18.27 | |||||||||||||
Total Return* |
| 8.21% |
|
| 16.26% |
|
| 10.81% |
|
| 2.36% |
|
| (11.13)% |
| |||
Net Assets, End of Period (in thousands) | $780 | $676 | $740 | $1,058 | $1,592 | |||||||||||||
Average Net Assets for the Period (in thousands) | $695 | $667 | $974 | $1,191 | $2,031 | |||||||||||||
Ratios to Average Net Assets**: |
|
|
|
|
|
|
|
|
|
|
|
|
|
|
| |||
Ratio of Gross Expenses | 1.74% | 1.47% | 1.23% | 1.27% | 1.54% | |||||||||||||
Ratio of Net Expenses (After Waivers and Expense Offsets) | 1.48% | 1.41% | 1.23% | 1.27% | 1.54% | |||||||||||||
Ratio of Net Investment Income/(Loss) | 0.04% | (0.24)% | (0.21)% | 0.00%(4) | (0.23)% | |||||||||||||
Portfolio Turnover Rate | 76% | 59% | 116% | 51% | 70% | |||||||||||||
* Total return includes adjustments in accordance with generally accepted accounting principles required at the year or period end and are not annualized for periods of less than one full year. ** Annualized for periods of less than one full year. (1) Period from August 4, 2017 (inception date) through September 30, 2017. (2) Per share amounts are calculated based on average shares outstanding during the year or period. (3) Less than $0.005 on a per share basis. (4) Less than 0.005%. |
See Notes to Financial Statements. | |
Janus Investment Fund | 19 |
Janus Henderson Contrarian Fund
Financial Highlights
Class S Shares | ||||||||||||||||||
For a share outstanding during the year ended September 30 |
| 2019 |
|
| 2018 |
|
| 2017 |
|
| 2016 |
|
| 2015 |
| |||
Net Asset Value, Beginning of Period |
| $21.53 |
|
| $19.89 |
|
| $18.53 |
|
| $18.55 |
|
| $23.09 |
| |||
Income/(Loss) from Investment Operations: | ||||||||||||||||||
Net investment income/(loss)(1) | 0.07 | 0.02 | —(2) | 0.04 | —(2) | |||||||||||||
Net realized and unrealized gain/(loss) | 1.37 | 3.09 | 2.04 | 0.44 | (2.25) | |||||||||||||
Total from Investment Operations |
| 1.44 |
|
| 3.11 |
|
| 2.04 |
|
| 0.48 |
|
| (2.25) |
| |||
Less Dividends and Distributions: | ||||||||||||||||||
Dividends (from net investment income) | — | — | — | — | (0.01) | |||||||||||||
Distributions (from capital gains) | (1.42) | (1.47) | (0.68) | (0.50) | (2.28) | |||||||||||||
Total Dividends and Distributions |
| (1.42) |
|
| (1.47) |
|
| (0.68) |
|
| (0.50) |
|
| (2.29) |
| |||
Net Asset Value, End of Period | $21.55 | $21.53 | $19.89 | $18.53 | $18.55 | |||||||||||||
Total Return* |
| 8.52% |
|
| 16.65% |
|
| 11.05% |
|
| 2.65% |
|
| (10.92)% |
| |||
Net Assets, End of Period (in thousands) | $1,032 | $1,033 | $3,842 | $4,052 | $4,578 | |||||||||||||
Average Net Assets for the Period (in thousands) | $996 | $3,068 | $3,920 | $4,208 | $6,905 | |||||||||||||
Ratios to Average Net Assets**: |
|
|
|
|
|
|
|
|
|
|
|
|
|
|
| |||
Ratio of Gross Expenses | 1.35% | 1.04% | 0.98% | 1.04% | 1.29% | |||||||||||||
Ratio of Net Expenses (After Waivers and Expense Offsets) | 1.18% | 1.03% | 0.97% | 1.03% | 1.28% | |||||||||||||
Ratio of Net Investment Income/(Loss) | 0.33% | 0.10% | 0.00%(3) | 0.22% | 0.01% | |||||||||||||
Portfolio Turnover Rate | 76% | 59% | 116% | 51% | 70% | |||||||||||||
Class T Shares | ||||||||||||||||||
For a share outstanding during the year ended September 30 |
| 2019 |
|
| 2018 |
|
| 2017 |
|
| 2016 |
|
| 2015 |
| |||
Net Asset Value, Beginning of Period |
| $21.63 |
|
| $19.95 |
|
| $18.58 |
|
| $18.62 |
|
| $23.15 |
| |||
Income/(Loss) from Investment Operations: | ||||||||||||||||||
Net investment income/(loss)(1) | 0.14 | 0.09 | 0.05 | 0.09 | 0.06 | |||||||||||||
Net realized and unrealized gain/(loss) | 1.38 | 3.11 | 2.05 | 0.43 | (2.26) | |||||||||||||
Total from Investment Operations |
| 1.52 |
|
| 3.20 |
|
| 2.10 |
|
| 0.52 |
|
| (2.20) |
| |||
Less Dividends and Distributions: | ||||||||||||||||||
Dividends (from net investment income) | (0.05) | (0.05) | (0.05) | (0.06) | (0.05) | |||||||||||||
Distributions (from capital gains) | (1.42) | (1.47) | (0.68) | (0.50) | (2.28) | |||||||||||||
Total Dividends and Distributions |
| (1.47) |
|
| (1.52) |
|
| (0.73) |
|
| (0.56) |
|
| (2.33) |
| |||
Net Asset Value, End of Period | $21.68 | $21.63 | $19.95 | $18.58 | $18.62 | |||||||||||||
Total Return* |
| 8.92% |
|
| 17.11% |
|
| 11.35% |
|
| 2.87% |
|
| (10.68)% |
| |||
Net Assets, End of Period (in thousands) | $730,400 | $676,452 | $672,788 | $754,333 | $940,738 | |||||||||||||
Average Net Assets for the Period (in thousands) | $652,848 | $656,674 | $741,874 | $814,169 | $1,252,238 | |||||||||||||
Ratios to Average Net Assets**: |
|
|
|
|
|
|
|
|
|
|
|
|
|
|
| |||
Ratio of Gross Expenses | 0.81% | 0.74% | 0.73% | 0.79% | 1.04% | |||||||||||||
Ratio of Net Expenses (After Waivers and Expense Offsets) | 0.79% | 0.73% | 0.72% | 0.77% | 1.02% | |||||||||||||
Ratio of Net Investment Income/(Loss) | 0.72% | 0.44% | 0.26% | 0.48% | 0.27% | |||||||||||||
Portfolio Turnover Rate | 76% | 59% | 116% | 51% | 70% | |||||||||||||
* Total return includes adjustments in accordance with generally accepted accounting principles required at the year or period end and are not annualized for periods of less than one full year. ** Annualized for periods of less than one full year. (1) Per share amounts are calculated based on average shares outstanding during the year or period. (2) Less than $0.005 on a per share basis. (3) Less than 0.005%. |
See Notes to Financial Statements. | |
20 | SEPTEMBER 30, 2019 |
Janus Henderson Contrarian Fund
Notes to Financial Statements
1. Organization and Significant Accounting Policies
Janus Henderson Contrarian Fund (the “Fund”) is a series of Janus Investment Fund (the “Trust”), which is organized as a Massachusetts business trust and is registered under the Investment Company Act of 1940, as amended (the “1940 Act”), as an open-end management investment company, and therefore has applied the specialized accounting and reporting guidance in Financial Accounting Standards Board (“FASB”) Accounting Standards Codification (“ASC”) Topic 946. The Trust offers 47 funds, each of which offers multiple share classes, with differing investment objectives and policies. The Fund seeks long-term growth of capital. The Fund is classified as nondiversified, as defined in the 1940 Act.
The Fund offers multiple classes of shares in order to meet the needs of various types of investors. Each class represents an interest in the same portfolio of investments. Certain financial intermediaries may not offer all classes of shares. Class D Shares are closed to certain new investors.
Class A Shares are offered through financial intermediary platforms including, but not limited to, traditional brokerage platforms, mutual fund wrap fee programs, bank trust platforms, and retirement platforms.
Class C Shares are offered through financial intermediary platforms including, but not limited to, traditional brokerage platforms, mutual fund wrap fee programs, and bank trust platforms.
Class C Shares are closed to investments by new employer-sponsored retirement plans and existing employer-sponsored retirement plans are no longer able to make additional purchases or exchanges into Class C Shares.
The Funds have adopted an auto-conversion policy pursuant to which Class C Shares that have been held for ten years will be automatically converted to Class A Shares without the imposition of any sales charge, fee or other charge. The conversion will generally occur no later than ten business days in the month following the month of the tenth anniversary of the date of purchase. Class C Shares purchased through the reinvestment of dividends and other distributions on Class C Shares will convert to Class A Shares at the same time as the Class C Shares with respect to which they were purchased. For Class C Shares held in omnibus accounts on intermediary platforms, the Fund will rely on these intermediaries to implement this conversion feature. Your financial intermediary may have separate policies and procedures as to when and how Class C Shares may be converted to Class A Shares. Please contact your financial intermediary for additional information.
Class D Shares are generally no longer being made available to new investors who do not already have a direct account with the Janus Henderson funds. Class D Shares are available only to investors who hold accounts directly with the Janus Henderson funds, to immediate family members or members of the same household of an eligible individual investor, and to existing beneficial owners of sole proprietorships or partnerships that hold accounts directly with the Janus Henderson funds.
Class I Shares are available through certain financial intermediary platforms including, but not limited to, mutual fund wrap fee programs, managed account programs, asset allocation programs, bank trust platforms, as well as certain retirement platforms. Class I Shares are also available to certain direct institutional investors including, but not limited to, corporations, certain retirement plans, public plans, and foundations/endowments, who established Class I Share accounts before August 4, 2017.
Class N Shares are generally available only to financial intermediaries purchasing on behalf of: 1) certain adviser-assisted, employer-sponsored retirement plans, including 401(k) plans, 457 plans, 403(b) plans, Taft-Hartley multi-employer plans, profit-sharing and money purchase pension plans, defined benefit plans and certain welfare benefit plans, such as health savings accounts, and nonqualified deferred compensation plans; and 2) retail investors purchasing in qualified or nonqualified accounts, whose accounts are held through an omnibus account at their financial intermediary, and where the financial intermediary requires no payment or reimbursement from the Fund, Janus Capital Management LLC (“Janus Capital”), or its affiliates. Class N Shares are also available to Janus Henderson proprietary products and to certain direct institutional investors approved by Janus Distributors LLC dba Janus Henderson Distributors (“Janus Henderson Distributors”) including, but not limited to, corporations, certain retirement plans, public plans, and foundations and endowments, subject to minimum investment requirements.
Class R Shares are offered through financial intermediary platforms including, but not limited to, retirement platforms.
Janus Investment Fund | 21 |
Janus Henderson Contrarian Fund
Notes to Financial Statements
Class S Shares are offered through financial intermediary platforms including, but not limited to, retirement platforms and asset allocation, mutual fund wrap, or other discretionary or nondiscretionary fee-based investment advisory programs. In addition, Class S Shares may be available through certain financial intermediaries who have an agreement with Janus Capital or its affiliates to offer Class S Shares on their supermarket platforms.
Class T Shares are available through certain financial intermediary platforms including, but not limited to, mutual fund wrap fee programs, managed account programs, asset allocation programs, bank trust platforms, as well as certain retirement platforms. In addition, Class T Shares may be available through certain financial intermediaries who have an agreement with Janus Capital or its affiliates to offer Class T Shares on their supermarket platforms.
The following accounting policies have been followed by the Fund and are in conformity with accounting principles generally accepted in the United States of America.
Investment Valuation
Securities held by the Fund are valued in accordance with policies and procedures established by and under the supervision of the Trustees (the “Valuation Procedures”). Equity securities traded on a domestic securities exchange are generally valued at the closing prices on the primary market or exchange on which they trade. If such price is lacking for the trading period immediately preceding the time of determination, such securities are valued at their current bid price. Equity securities that are traded on a foreign exchange are generally valued at the closing prices on such markets. In the event that there is no current trading volume on a particular security in such foreign exchange, the bid price from the primary exchange is generally used to value the security. Securities that are traded on the over-the-counter (“OTC”) markets are generally valued at their closing or latest bid prices as available. Foreign securities and currencies are converted to U.S. dollars using the applicable exchange rate in effect at the close of the New York Stock Exchange (“NYSE”). The Fund will determine the market value of individual securities held by it by using prices provided by one or more approved professional pricing services or, as needed, by obtaining market quotations from independent broker-dealers. Most debt securities are valued in accordance with the evaluated bid price supplied by the pricing service that is intended to reflect market value. The evaluated bid price supplied by the pricing service is an evaluation that may consider factors such as security prices, yields, maturities and ratings. Certain short-term securities maturing within 60 days or less may be evaluated and valued on an amortized cost basis provided that the amortized cost determined approximates market value. Securities for which market quotations or evaluated prices are not readily available or deemed unreliable are valued at fair value determined in good faith under the Valuation Procedures. Circumstances in which fair value pricing may be utilized include, but are not limited to: (i) a significant event that may affect the securities of a single issuer, such as a merger, bankruptcy, or significant issuer-specific development; (ii) an event that may affect an entire market, such as a natural disaster or significant governmental action; (iii) a nonsignificant event such as a market closing early or not opening, or a security trading halt; and (iv) pricing of a nonvalued security and a restricted or nonpublic security. Special valuation considerations may apply with respect to “odd-lot” fixed-income transactions which, due to their small size, may receive evaluated prices by pricing services which reflect a large block trade and not what actually could be obtained for the odd-lot position. The Fund uses systematic fair valuation models provided by independent third parties to value international equity securities in order to adjust for stale pricing, which may occur between the close of certain foreign exchanges and the close of the NYSE.
Valuation Inputs Summary
FASB ASC 820, Fair Value Measurements and Disclosures (“ASC 820”), defines fair value, establishes a framework for measuring fair value, and expands disclosure requirements regarding fair value measurements. This standard emphasizes that fair value is a market-based measurement that should be determined based on the assumptions that market participants would use in pricing an asset or liability and establishes a hierarchy that prioritizes inputs to valuation techniques used to measure fair value. These inputs are summarized into three broad levels:
Level 1 – Unadjusted quoted prices in active markets the Fund has the ability to access for identical assets or liabilities.
Level 2 – Observable inputs other than unadjusted quoted prices included in Level 1 that are observable for the asset or liability either directly or indirectly. These inputs may include quoted prices for the identical instrument on an inactive market, prices for similar instruments, interest rates, prepayment speeds, credit risk, yield curves, default rates and similar data.
Assets or liabilities categorized as Level 2 in the hierarchy generally include: debt securities fair valued in accordance with the evaluated bid or ask prices supplied by a pricing service; securities traded on OTC markets
22 | SEPTEMBER 30, 2019 |
Janus Henderson Contrarian Fund
Notes to Financial Statements
and listed securities for which no sales are reported that are fair valued at the latest bid price (or yield equivalent thereof) obtained from one or more dealers transacting in a market for such securities or by a pricing service approved by the Fund’s Trustees; certain short-term debt securities with maturities of 60 days or less that are fair valued at amortized cost; and equity securities of foreign issuers whose fair value is determined by using systematic fair valuation models provided by independent third parties in order to adjust for stale pricing which may occur between the close of certain foreign exchanges and the close of the NYSE. Other securities that may be categorized as Level 2 in the hierarchy include, but are not limited to, preferred stocks, bank loans, swaps, investments in unregistered investment companies, options, and forward contracts.
Level 3 – Unobservable inputs for the asset or liability to the extent that relevant observable inputs are not available, representing the Fund’s own assumptions about the assumptions that a market participant would use in valuing the asset or liability, and that would be based on the best information available.
There have been no significant changes in valuation techniques used in valuing any such positions held by the Fund since the beginning of the fiscal year.
The inputs or methodology used for fair valuing securities are not necessarily an indication of the risk associated with investing in those securities. The summary of inputs used as of September 30, 2019 to fair value the Fund’s investments in securities and other financial instruments is included in the “Valuation Inputs Summary” in the Notes to Schedule of Investments and Other Information.
Investment Transactions and Investment Income
Investment transactions are accounted for as of the date purchased or sold (trade date). Dividend income is recorded on the ex-dividend date. Certain dividends from foreign securities will be recorded as soon as the Fund is informed of the dividend, if such information is obtained subsequent to the ex-dividend date. Dividends from foreign securities may be subject to withholding taxes in foreign jurisdictions. Interest income is recorded daily on an accrual basis and includes amortization of premiums and accretion of discounts. The Fund classifies gains and losses on prepayments received as an adjustment to interest income. Debt securities may be placed in non-accrual status and related interest income may be reduced by stopping current accruals and writing off interest receivables when collection of all or a portion of interest has become doubtful. Gains and losses are determined on the identified cost basis, which is the same basis used for federal income tax purposes. Income, as well as gains and losses, both realized and unrealized, are allocated daily to each class of shares based upon the ratio of net assets represented by each class as a percentage of total net assets.
Expenses
The Fund bears expenses incurred specifically on its behalf. Each class of shares bears a portion of general expenses, which are allocated daily to each class of shares based upon the ratio of net assets represented by each class as a percentage of total net assets. Expenses directly attributable to a specific class of shares are charged against the operations of such class.
Estimates
The preparation of financial statements in conformity with accounting principles generally accepted in the United States of America requires management to make estimates and assumptions that affect the reported amount of assets and liabilities and disclosure of contingent assets and liabilities at the date of the financial statements, and the reported amounts of income and expenses during the reporting period. Actual results could differ from those estimates.
Indemnifications
In the normal course of business, the Fund may enter into contracts that contain provisions for indemnification of other parties against certain potential liabilities. The Fund’s maximum exposure under these arrangements is unknown, and would involve future claims that may be made against the Fund that have not yet occurred. Currently, the risk of material loss from such claims is considered remote.
Foreign Currency Translations
The Fund does not isolate that portion of the results of operations resulting from the effect of changes in foreign exchange rates on investments from the fluctuations arising from changes in market prices of securities held at the date of the financial statements. Net unrealized appreciation or depreciation of investments and foreign currency translations arise from changes in the value of assets and liabilities, including investments in securities held at the date
Janus Investment Fund | 23 |
Janus Henderson Contrarian Fund
Notes to Financial Statements
of the financial statements, resulting from changes in the exchange rates and changes in market prices of securities held.
Currency gains and losses are also calculated on payables and receivables that are denominated in foreign currencies. The payables and receivables are generally related to foreign security transactions and income translations.
Foreign currency-denominated assets and forward currency contracts may involve more risks than domestic transactions, including currency risk, counterparty risk, political and economic risk, regulatory risk and equity risk. Risks may arise from unanticipated movements in the value of foreign currencies relative to the U.S. dollar.
Dividends and Distributions
The Fund generally declares and distributes dividends of net investment income and realized capital gains (if any) annually. The Fund may treat a portion of the amount paid to redeem shares as a distribution of investment company taxable income and realized capital gains that are reflected in the net asset value. This practice, commonly referred to as “equalization,” has no effect on the redeeming shareholder or a Fund’s total return, but may reduce the amounts that would otherwise be required to be paid as taxable dividends to the remaining shareholders. It is possible that the Internal Revenue Service (IRS) could challenge the Funds’ equalization methodology or calculations, and any such challenge could result in additional tax, interest, or penalties to be paid by the Fund.
The Fund may make certain investments in real estate investment trusts (“REITs”) which pay dividends to their shareholders based upon funds available from operations. It is quite common for these dividends to exceed the REITs’ taxable earnings and profits, resulting in the excess portion of such dividends being designated as a return of capital. If the Fund distributes such amounts, such distributions could constitute a return of capital to shareholders for federal income tax purposes.
Federal Income Taxes
The Fund intends to continue to qualify as a regulated investment company and distribute all of its taxable income in accordance with the requirements of Subchapter M of the Internal Revenue Code. Management has analyzed the Fund’s tax positions taken for all open federal income tax years, generally a three-year period, and has concluded that no provision for federal income tax is required in the Fund’s financial statements. The Fund is not aware of any tax positions for which it is reasonably possible that the total amounts of unrecognized tax benefits will significantly change in the next twelve months.
2. Other Investments and Strategies
Additional Investment Risk
In the aftermath of the 2007-2008 financial crisis, the financial sector experienced reduced liquidity in credit and other fixed-income markets, and an unusually high degree of volatility, both domestically and internationally. In response to the crisis, the United States and certain foreign governments, along with the U.S. Federal Reserve and certain foreign central banks, took steps to support the financial markets. For example, the enactment of the Dodd-Frank Act in 2010 provided for widespread regulation of financial institutions, consumer financial products and services, broker-dealers, over-the-counter derivatives, investment advisers, credit rating agencies, and mortgage lending, which expanded federal oversight in the financial sector, including the investment management industry. The withdrawal of this support, a failure of measures put in place to respond to the crisis, or investor perception that such efforts were not sufficient could each negatively affect financial markets generally, and the value and liquidity of specific securities. In addition, policy and legislative changes in the United States and in other countries continue to impact many aspects of financial regulation.
A number of countries in the European Union (“EU”) have experienced, and may continue to experience, severe economic and financial difficulties. In particular, many EU nations are susceptible to economic risks associated with high levels of debt. Many non-governmental issuers, and even certain governments, have defaulted on, or been forced to restructure, their debts. Many other issuers have faced difficulties obtaining credit or refinancing existing obligations. Financial institutions have in many cases required government or central bank support, have needed to raise capital, and/or have been impaired in their ability to extend credit. As a result, financial markets in the EU experienced extreme volatility and declines in asset values and liquidity. Responses to these financial problems by European governments, central banks, and others, including austerity measures and reforms, may not work, may result in social unrest, and may limit future growth and economic recovery or have other unintended consequences. The risk of investing in securities in the European markets may also be heightened due to the referendum in which the United Kingdom voted to exit the
24 | SEPTEMBER 30, 2019 |
Janus Henderson Contrarian Fund
Notes to Financial Statements
EU (commonly known as “Brexit”). There is considerable uncertainty about how Brexit will be conducted, how negotiations of necessary treaties and trade agreements will conclude, or how financial markets will react.
Certain areas of the world have historically been prone to and economically sensitive to environmental events such as, but not limited to, hurricanes, earthquakes, typhoons, flooding, tidal waves, tsunamis, erupting volcanoes, wildfires or droughts, tornadoes, mudslides, or other weather-related phenomena. Such disasters, and the resulting physical or economic damage, could have a severe and negative impact on the Fund’s investment portfolio and, in the longer term, could impair the ability of issuers in which the Fund invests to conduct their businesses as they would under normal conditions. Adverse weather conditions may also have a particularly significant negative effect on issuers in the agricultural sector and on insurance companies that insure against the impact of natural disasters.
Counterparties
Fund transactions involving a counterparty are subject to the risk that the counterparty or a third party will not fulfill its obligation to the Fund (“counterparty risk”). Counterparty risk may arise because of the counterparty’s financial condition (i.e., financial difficulties, bankruptcy, or insolvency), market activities and developments, or other reasons, whether foreseen or not. A counterparty’s inability to fulfill its obligation may result in significant financial loss to the Fund. The Fund may be unable to recover its investment from the counterparty or may obtain a limited recovery, and/or recovery may be delayed. The extent of the Fund’s exposure to counterparty risk with respect to financial assets and liabilities approximates its carrying value. See the "Offsetting Assets and Liabilities" section of this Note for further details.
The Fund may be exposed to counterparty risk through participation in various programs, including, but not limited to, lending its securities to third parties, cash sweep arrangements whereby the Fund’s cash balance is invested in one or more types of cash management vehicles, as well as investments in, but not limited to, repurchase agreements, debt securities, and derivatives, including various types of swaps, futures and options. The Fund intends to enter into financial transactions with counterparties that Janus Capital believes to be creditworthy at the time of the transaction. There is always the risk that Janus Capital’s analysis of a counterparty’s creditworthiness is incorrect or may change due to market conditions. To the extent that the Fund focuses its transactions with a limited number of counterparties, it will have greater exposure to the risks associated with one or more counterparties.
Offsetting Assets and Liabilities
The Fund presents gross and net information about transactions that are either offset in the financial statements or subject to an enforceable master netting arrangement or similar agreement with a designated counterparty, regardless of whether the transactions are actually offset in the Statement of Assets and Liabilities.
The following table presents gross amounts of recognized assets and/or liabilities and the net amounts after deducting collateral that has been pledged by counterparties or has been pledged to counterparties (if applicable). For corresponding information grouped by type of instrument, see the Fund's Schedule of Investments.
Offsetting of Financial Assets and Derivative Assets | |||||||||
Gross Amounts | |||||||||
of Recognized | Offsetting Asset | Collateral | |||||||
Counterparty | Assets | or Liability(a) | Pledged(b) | Net Amount | |||||
Deutsche Bank AG | $ | 317,240 | $ | — | $ | (317,240) | $ | — | |
(a) | Represents the amount of assets or liabilities that could be offset with the same counterparty under master netting or similar agreements that management elects not to offset on the Statement of Assets and Liabilities. | ||||||||
(b) | Collateral pledged is limited to the net outstanding amount due to/from an individual counterparty. The actual collateral amounts pledged may exceed these amounts and may fluctuate in value. | ||||||||
Deutsche Bank AG acts as securities lending agent and a limited purpose custodian or subcustodian to receive and disburse cash balances and cash collateral, hold short-term investments, hold collateral, and perform other custodian functions in accordance with the Agency Securities Lending and Repurchase Agreement. For financial reporting purposes, the Fund does not offset financial instruments’ payables and receivables and related collateral on the Statement of Assets and Liabilities. Securities on loan will be continuously secured by collateral which may consist of cash, U.S. Government securities, domestic and foreign short-term debt instruments, letters of credit, time deposits,
Janus Investment Fund | 25 |
Janus Henderson Contrarian Fund
Notes to Financial Statements
repurchase agreements, money market mutual funds or other money market accounts, or such other collateral as permitted by the SEC. See “Securities Lending” in the “Notes to Financial Statements” for additional information.
Real Estate Investing
The Fund may invest in equity and debt securities of real estate-related companies. Such companies may include those in the real estate industry or real estate-related industries. These securities may include common stocks, corporate bonds, preferred stocks, and other equity securities, including, but not limited to, mortgage-backed securities, real estate-backed securities, securities of REITs and similar REIT-like entities. A REIT is a trust that invests in real estate-related projects, such as properties, mortgage loans, and construction loans. REITs are generally categorized as equity, mortgage, or hybrid REITs. A REIT may be listed on an exchange or traded OTC.
Securities Lending
Under procedures adopted by the Trustees, the Fund may seek to earn additional income by lending securities to certain qualified broker-dealers and institutions. Deutsche Bank AG acts as securities lending agent and a limited purpose custodian or subcustodian to receive and disburse cash balances and cash collateral, hold short-term investments, hold collateral, and perform other custodian functions in accordance with the Agency Securities Lending and Repurchase Agreement. The Fund may lend portfolio securities in an amount equal to up to 1/3 of its total assets as determined at the time of the loan origination. There is the risk of delay in recovering a loaned security or the risk of loss in collateral rights if the borrower fails financially. In addition, Janus Capital makes efforts to balance the benefits and risks from granting such loans. All loans will be continuously secured by collateral which may consist of cash, U.S. Government securities, domestic and foreign short-term debt instruments, letters of credit, time deposits, repurchase agreements, money market mutual funds or other money market accounts, or such other collateral as permitted by the SEC. If the Fund is unable to recover a security on loan, the Fund may use the collateral to purchase replacement securities in the market. There is a risk that the value of the collateral could decrease below the cost of the replacement security by the time the replacement investment is made, resulting in a loss to the Fund.
Upon receipt of cash collateral, Janus Capital may invest it in affiliated or non-affiliated cash management vehicles, whether registered or unregistered entities, as permitted by the 1940 Act and rules promulgated thereunder. Janus Capital currently intends to invest the cash collateral in a cash management vehicle for which Janus Capital serves as investment adviser, Janus Henderson Cash Collateral Fund LLC. An investment in Janus Henderson Cash Collateral Fund LLC is generally subject to the same risks that shareholders experience when investing in similarly structured vehicles, such as the potential for significant fluctuations in assets as a result of the purchase and redemption activity of the securities lending program, a decline in the value of the collateral, and possible liquidity issues. Such risks may delay the return of the cash collateral and cause the Fund to violate its agreement to return the cash collateral to a borrower in a timely manner. As adviser to the Fund and Janus Henderson Cash Collateral Fund LLC, Janus Capital has an inherent conflict of interest as a result of its fiduciary duties to both the Fund and Janus Henderson Cash Collateral Fund LLC. Additionally, Janus Capital receives an investment advisory fee of 0.05% for managing Janus Henderson Cash Collateral Fund LLC, but it may not receive a fee for managing certain other affiliated cash management vehicles in which the Fund may invest, and therefore may have an incentive to allocate preferred investment opportunities to investment vehicles for which it is receiving a fee.
The value of the collateral must be at least 102% of the market value of the loaned securities that are denominated in U.S. dollars and 105% of the market value of the loaned securities that are not denominated in U.S. dollars. Loaned securities and related collateral are marked-to-market each business day based upon the market value of the loaned securities at the close of business, employing the most recent available pricing information. Collateral levels are then adjusted based on this mark-to-market evaluation.
The cash collateral invested by Janus Capital is disclosed in the Schedule of Investments (if applicable). Income earned from the investment of the cash collateral, net of rebates paid to, or fees paid by, borrowers and less the fees paid to the lending agent are included as “Affiliated securities lending income, net” on the Statement of Operations. As of September 30, 2019, securities lending transactions accounted for as secured borrowings with an overnight and continuous contractual maturity are $317,240. Gross amounts of recognized liabilities for securities lending (collateral received) as of September 30, 2019 is $334,750, resulting in the net amount due to the counterparty of $17,510.
26 | SEPTEMBER 30, 2019 |
Janus Henderson Contrarian Fund
Notes to Financial Statements
3. Investment Advisory Agreements and Other Transactions with Affiliates
The Fund pays Janus Capital an investment advisory fee which is calculated daily and paid monthly. The Fund’s "base" fee rate prior to any performance adjustment (expressed as an annual rate) is 0.64%.
The investment advisory fee rate is determined by calculating a base fee and applying a performance adjustment. The base fee rate is the same as the contractual investment advisory fee rate. The performance adjustment either increases or decreases the base fee depending on how well the Fund has performed relative to its benchmark index. The Fund's benchmark index used in the calculation is the S&P 500® Index.
The calculation of the performance adjustment applies as follows:
Investment Advisory Fee = Base Fee Rate +/- Performance Adjustment
The investment advisory fee rate paid to Janus Capital by the Fund consists of two components: (1) a base fee calculated by applying the contractual fixed rate of the advisory fee to the Fund’s average daily net assets during the previous month (“Base Fee Rate”), plus or minus (2) a performance-fee adjustment (“Performance Adjustment”) calculated by applying a variable rate of up to 0.15% (positive or negative) to the Fund’s average daily net assets based on the Fund’s relative performance compared to the cumulative investment record of its benchmark index over a 36-month performance measurement period or shorter time period, as applicable. The investment performance of the Fund’s Class A Shares (waiving the upfront sales load) for the performance measurement period is used to calculate the Performance Adjustment. No Performance Adjustment is applied unless the difference between the Fund’s investment performance and the cumulative investment record of the Fund’s benchmark index is 0.50% or greater (positive or negative) during the applicable performance measurement period.
The Fund’s prospectuses and statement(s) of additional information contain additional information about performance-based fees. The amount shown as advisory fees on the Statement of Operations reflects the Base Fee Rate plus/minus any Performance Adjustment. For the year ended September 30, 2019, the performance adjusted investment advisory fee rate before any waivers and/or reimbursements of expenses is 0.53%.
Janus Capital has contractually agreed to waive the advisory fee payable by the Fund or reimburse expenses in an amount equal to the amount, if any, that the Fund’s total annual fund operating expenses, including the investment advisory fee, but excluding any performance adjustments to management fees (if applicable), the fees payable pursuant to a Rule 12b-1 plan, shareholder servicing fees, such as transfer agency fees (including out-of-pocket costs), administrative services fees and any networking/omnibus/administrative fees payable by any share class, brokerage commissions, interest, dividends, taxes, acquired fund fees and expenses, and extraordinary expenses, exceed the annual rate of 0.83% of the Fund’s average daily net assets. Janus Capital has agreed to continue the waivers until at least February 1, 2020. If applicable, amounts waived and/or reimbursed to the Fund by Janus Capital are disclosed as “Excess Expense Reimbursement and Waivers” on the Statement of Operations.
Janus Services LLC (“Janus Services”), a wholly-owned subsidiary of Janus Capital, is the Fund’s transfer agent. In addition, Janus Services provides or arranges for the provision of certain other administrative services including, but not limited to, recordkeeping, accounting, order processing, and other shareholder services for the Fund. Janus Services is not compensated for its services related to the shares, except for out-of-pocket costs. These amounts are disclosed as “Other transfer agent fees and expenses” on the Statement of Operations.
Certain, but not all, intermediaries may charge administrative fees (such as networking and omnibus) to investors in Class A Shares, Class C Shares, and Class I Shares for administrative services provided on behalf of such investors. These administrative fees are paid by the Class A Shares, Class C Shares, and Class I Shares of the Fund to Janus Services, which uses such fees to reimburse intermediaries. Consistent with the Transfer Agency Agreement between Janus Services and the Fund, Janus Services may negotiate the level, structure, and/or terms of the administrative fees with intermediaries requiring such fees on behalf of the Fund. Janus Capital and its affiliates benefit from an increase in assets that may result from such relationships. The Funds’ Trustees have set limits on fees that the Funds may incur with respect to administrative fees paid for omnibus or networked accounts. Such limits are subject to change by the Trustees in the future. These amounts are disclosed as “Transfer agent networking and omnibus fees” on the Statement of Operations.
Janus Investment Fund | 27 |
Janus Henderson Contrarian Fund
Notes to Financial Statements
Effective July 1, 2019, the Board of Trustees of Janus Investment Fund approved a new administrative fee rate for Class D Shares detailed in the table below.
Average Daily Net Assets of Class D Shares of the Janus Henderson funds | Administrative Services Fee |
Under $40 billion | 0.12% |
$40 billion – $49.9 billion | 0.10% |
Over $49.9 billion | 0.08% |
The Fund’s actual Class D administrative fee rate was 0.12% for the reporting period.
Prior to July 1, 2019, the Fund’s Class D Shares paid an administrative services fee at an annual rate of 0.12% of the average daily net assets of Class D Shares for shareholder services provided by Janus Services. Janus Services provides or arranges for the provision of shareholder services including, but not limited to, recordkeeping, accounting, answering inquiries regarding accounts, transaction processing, transaction confirmations, and the mailing of prospectuses and shareholder reports. These amounts are disclosed as “Transfer agent administrative fees and expenses” on the Statement of Operations.
Janus Services receives an administrative services fee at an annual rate of up to 0.25% of the average daily net assets of the Fund’s Class R Shares, Class S Shares, and Class T Shares for providing or procuring administrative services to investors in Class R Shares, Class S Shares, and Class T Shares of the Fund. Janus Services expects to use all or a significant portion of this fee to compensate retirement plan service providers, broker-dealers, bank trust departments, financial advisors, and other financial intermediaries for providing these services. Janus Services or its affiliates may also pay fees for services provided by intermediaries to the extent the fees charged by intermediaries exceed the 0.25% of net assets charged to Class R Shares, Class S Shares, and Class T Shares of the Fund. Janus Services may keep certain amounts retained for reimbursement of out-of-pocket costs incurred for servicing clients of Class R Shares, Class S Shares, and Class T Shares. These amounts are disclosed as “Transfer agent administrative fees and expenses” on the Statement of Operations.
Services provided by these financial intermediaries may include, but are not limited to, recordkeeping, subaccounting, order processing, providing order confirmations, periodic statements, forwarding prospectuses, shareholder reports, and other materials to existing customers, answering inquiries regarding accounts, and other administrative services. Order processing includes the submission of transactions through the National Securities Clearing Corporation (“NSCC”) or similar systems, or those processed on a manual basis with Janus Capital. For all share classes, Janus Services also seeks reimbursement for costs it incurs as transfer agent and for providing servicing.
Janus Services is compensated for its services related to the Fund’s Class D Shares. These amounts are disclosed as “Other transfer agent fees and expenses” on the Statement of Operations.
Under a distribution and shareholder servicing plan (the “Plan”) adopted in accordance with Rule 12b-1 under the 1940 Act, the Fund pays the Trust’s distributor, Janus Henderson Distributors, a wholly-owned subsidiary of Janus Capital, a fee for the sale and distribution and/or shareholder servicing of the Shares at an annual rate of up to 0.25% of the Class A Shares’ average daily net assets, of up to 1.00% of the Class C Shares’ average daily net assets, of up to 0.50% of the Class R Shares' average daily net assets, and of up to 0.25% of the Class S Shares’ average daily net assets. Under the terms of the Plan, the Trust is authorized to make payments to Janus Henderson Distributors for remittance to retirement plan service providers, broker-dealers, bank trust departments, financial advisors, and other financial intermediaries, as compensation for distribution and/or shareholder services performed by such entities for their customers who are investors in the Fund. These amounts are disclosed as “12b-1 Distribution and shareholder servicing fees” on the Statement of Operations. Payments under the Plan are not tied exclusively to actual 12b-1 distribution and shareholder service expenses, and the payments may exceed 12b-1 distribution and shareholder service expenses actually incurred. If any of the Fund’s actual 12b-1 distribution and shareholder service expenses incurred during a calendar year are less than the payments made during a calendar year, the Fund will be refunded the difference. Refunds, if any, are included in “12b-1 Distribution and shareholder servicing fees” in the Statement of Operations.
Janus Capital serves as administrator to the Fund pursuant to an administration agreement between Janus Capital and the Trust. Under the administration agreement, Janus Capital is obligated to provide or arrange for the provision of certain administration, compliance, and accounting services to the Fund, including providing office space for the Fund,
28 | SEPTEMBER 30, 2019 |
Janus Henderson Contrarian Fund
Notes to Financial Statements
and is reimbursed by the Fund for certain of its costs in providing these services (to the extent Janus Capital seeks reimbursement and such costs are not otherwise waived). In addition, employees of Janus Capital and/or its affiliates may serve as officers of the Trust. The Fund pays for some or all of the salaries, fees, and expenses of Janus Capital employees and Fund officers, with respect to certain specified administration functions they perform on behalf of the Fund. The Fund pays these costs based on out-of-pocket expenses incurred by Janus Capital, and these costs are separate and apart from advisory fees and other expenses paid in connection with the investment advisory services Janus Capital (or any subadvisor, as applicable) provides to the Fund. These amounts are disclosed as “Affiliated fund administration fees” on the Statement of Operations. In addition, some expenses related to compensation payable to the Fund’s Chief Compliance Officer and certain compliance staff, all of whom are employees of Janus Capital and/or its affiliates, are shared with the Fund. Total compensation of $484,142 was paid to the Chief Compliance Officer and certain compliance staff by the Trust during the year ended September 30, 2019. The Fund's portion is reported as part of “Other expenses” on the Statement of Operations.
The Board of Trustees has adopted a deferred compensation plan (the “Deferred Plan”) for independent Trustees to elect to defer receipt of all or a portion of the annual compensation they are entitled to receive from the Fund. All deferred fees are credited to an account established in the name of the Trustees. The amounts credited to the account then increase or decrease, as the case may be, in accordance with the performance of one or more of the Janus Henderson funds that are selected by the Trustees. The account balance continues to fluctuate in accordance with the performance of the selected fund or funds until final payment of all amounts are credited to the account. The fluctuation of the account balance is recorded by the Fund as unrealized appreciation/(depreciation) and is included as of September 30, 2019 on the Statement of Assets and Liabilities in the asset, “Non-interested Trustees’ deferred compensation,” and liability, “Non-interested Trustees’ deferred compensation fees.” Additionally, the recorded unrealized appreciation/(depreciation) is included in “Unrealized net appreciation/(depreciation) of investments, foreign currency translations and non-interested Trustees’ deferred compensation” on the Statement of Assets and Liabilities. Deferred compensation expenses for the year ended September 30, 2019 are included in “Non-interested Trustees’ fees and expenses” on the Statement of Operations. Trustees are allowed to change their designation of mutual funds from time to time. Amounts will be deferred until distributed in accordance with the Deferred Plan. Deferred fees of $475,338 were paid by the Trust to the Trustees under the Deferred Plan during the year ended September 30, 2019.
Pursuant to the provisions of the 1940 Act and related rules, the Fund may participate in an affiliated or non-affiliated cash sweep program. In the cash sweep program, uninvested cash balances of the Fund may be used to purchase shares of affiliated or non-affiliated money market funds or cash management pooled investment vehicles that operate as money market funds. The Fund is eligible to participate in the cash sweep program (the “Investing Funds”). As adviser, Janus Capital has an inherent conflict of interest because of its fiduciary duties to the affiliated money market funds or cash management pooled investment vehicles and the Investing Funds. Janus Henderson Cash Liquidity Fund LLC (the “Sweep Vehicle”) is an affiliated unregistered cash management pooled investment vehicle that invests primarily in highly-rated short-term fixed-income securities. The Sweep Vehicle operates as an “institutional” money market fund and prices its shares at NAV reflecting market-based values of its portfolio securities (i.e., a “floating” NAV) rounded to the fourth decimal place (e.g., $1.0000). The Sweep Vehicle is permitted to impose a liquidity fee (of up to 2%) on redemptions from the Sweep Vehicle or a redemption gate that temporarily suspends redemptions from the Sweep Vehicle for up to 10 business days during a 90 day period. There are no restrictions on the Fund's ability to withdraw investments from the Sweep Vehicle at will, and there are no unfunded capital commitments due from the Fund to the Sweep Vehicle. The Sweep Vehicle does not charge any management fee, sales charge or service fee.
Any purchases and sales, realized gains/losses and recorded dividends from affiliated investments during the year ended September 30, 2019 can be found in the “Schedules of Affiliated Investments” located in the Schedule of Investments.
Class A Shares include a 5.75% upfront sales charge of the offering price of the Fund. The sales charge is allocated between Janus Henderson Distributors and financial intermediaries. During the year ended September 30, 2019, Janus Henderson Distributors retained upfront sales charges of $6,223.
A contingent deferred sales charge (“CDSC”) of 1.00% will be deducted with respect to Class A Shares purchased without a sales load and redeemed within 12 months of purchase, unless waived. Any applicable CDSC will be 1.00% of the lesser of the original purchase price or the value of the redemption of the Class A Shares redeemed. There were no CDSCs paid by redeeming shareholders of Class A Shares to Janus Henderson Distributors during the year ended September 30, 2019.
Janus Investment Fund | 29 |
Janus Henderson Contrarian Fund
Notes to Financial Statements
A CDSC of 1.00% will be deducted with respect to Class C Shares redeemed within 12 months of purchase, unless waived. Any applicable CDSC will be 1.00% of the lesser of the original purchase price or the value of the redemption of the Class C Shares redeemed. During the year ended September 30, 2019, redeeming shareholders of Class C Shares paid CDSCs of $432.
As of September 30, 2019, shares of the Fund were owned by affiliates of Janus Henderson Investors, and/or other funds advised by Janus Henderson, as indicated in the table below:
Class | % of Class Owned |
| % of Fund Owned |
| |
Class A Shares | - | % | - | % | |
Class C Shares | - | - | |||
Class D Shares | - | - | |||
Class I Shares | - | - | |||
Class N Shares | 73 | 1 | |||
Class R Shares | - | - | |||
Class S Shares | - | - | |||
Class T Shares | - | - | |||
In addition, other shareholders, including other funds, individuals, accounts, as well as the Fund’s portfolio manager(s) and/or investment personnel, may from time to time own (beneficially or of record) a significant percentage of the Fund’s Shares and can be considered to “control” the Fund when that ownership exceeds 25% of the Fund’s assets (and which may differ from control as determined in accordance with accounting principles generally accepted in the United States of America).
The Fund is permitted to purchase or sell securities (“cross-trade”) between itself and other funds or accounts managed by Janus Capital in accordance with Rule 17a-7 under the Investment Company Act of 1940 (“Rule 17a-7”), when the transaction is consistent with the investment objectives and policies of the Fund and in accordance with the Internal Cross Trade Procedures adopted by the Trust’s Board of Trustees. These procedures have been designed to ensure that any cross-trade of securities by the Fund from or to another fund or account that is or could be considered an affiliate of the Fund under certain limited circumstances by virtue of having a common investment adviser, common Officer, or common Trustee complies with Rule 17a-7. Under these procedures, each cross-trade is effected at the current market price to save costs where allowed. During the year ended September 30, 2019, the Fund engaged in cross trades amounting to $11,936,441 in purchases .
4. Federal Income Tax
The tax components of capital shown in the table below represent: (1) distribution requirements the Fund must satisfy under the income tax regulations; (2) losses or deductions the Fund may be able to offset against income and gains realized in future years; and (3) unrealized appreciation or depreciation of investments for federal income tax purposes.
Other book to tax differences primarily consist of deferred compensation. The Fund has elected to treat gains and losses on forward foreign currency contracts as capital gains and losses, if applicable. Other foreign currency gains and losses on debt instruments are treated as ordinary income for federal income tax purposes pursuant to Section 988 of the Internal Revenue Code.
Loss Deferrals | Other Book | Net Tax | |||||
Undistributed | Undistributed | Accumulated | Late-Year | Post-October | to Tax | Appreciation/ | |
$ 55,536,642 | $ 258,637,268 | $ - | $ - | $ - | $ (66,463) | $297,947,384 | |
30 | SEPTEMBER 30, 2019 |
Janus Henderson Contrarian Fund
Notes to Financial Statements
The aggregate cost of investments and the composition of unrealized appreciation and depreciation of investment securities for federal income tax purposes as of September 30, 2019 are noted below. The primary differences between book and tax appreciation or depreciation of investments are wash sale loss deferrals and investments in partnerships.
Federal Tax Cost | Unrealized | Unrealized | Net Tax Appreciation/ |
$ 2,595,274,038 | $375,888,614 | $(77,941,230) | $ 297,947,384 |
Income and capital gains distributions are determined in accordance with income tax regulations that may differ from accounting principles generally accepted in the United States of America. These differences are due to differing treatments for items such as net short-term gains, deferral of wash sale losses, foreign currency transactions, and capital loss carryovers. Certain permanent differences such as tax returns of capital and net investment losses noted below have been reclassified to capital.
For the year ended September 30, 2019 | ||||
Distributions | ||||
From Ordinary Income | From Long-Term Capital Gains | Tax Return of Capital | Net Investment Loss | |
$ 89,769,868 | $ 93,268,274 | $ - | $ - | |
For the year ended September 30, 2018 | ||||
Distributions | ||||
From Ordinary Income | From Long-Term Capital Gains | Tax Return of Capital | Net Investment Loss | |
$ 27,021,173 | $ 167,736,084 | $ - | $ - | |
Permanent book to tax basis differences may result in reclassifications between the components of net assets. These differences have no impact on the results of operations or net assets. The following reclassifications have been made to the Fund:
Increase/(Decrease) to Capital | Increase/(Decrease) to Undistributed | Increase/(Decrease) to Undistributed |
$ 3,835,804 | $ (1,512,102) | $ (2,323,702) |
Capital has been adjusted by $3,835,803, including $3,157,748 of long-term capital gain, for distributions in connection with Fund share redemptions (tax equalization).
Janus Investment Fund | 31 |
Janus Henderson Contrarian Fund
Notes to Financial Statements
5. Capital Share Transactions
Year ended September 30, 2019 | Year ended September 30, 2018 | |||||
Shares | Amount | Shares | Amount | |||
Class A Shares: | ||||||
Shares sold | 413,666 | $ 8,224,490 | 163,878 | $ 3,339,177 | ||
Reinvested dividends and distributions | 67,958 | 1,146,458 | 43,596 | 825,705 | ||
Shares repurchased | (242,468) | (4,731,116) | (246,836) | (4,938,178) | ||
Net Increase/(Decrease) | 239,156 | $ 4,639,832 |
| (39,362) | $ (773,296) | |
Class C Shares: | ||||||
Shares sold | 58,945 | $ 1,020,053 | 43,992 | $ 818,406 | ||
Reinvested dividends and distributions | 44,462 | 696,277 | 86,158 | 1,530,158 | ||
Shares repurchased | (523,727) | (9,511,430) | (644,770) | (12,118,966) | ||
Net Increase/(Decrease) | (420,320) | $ (7,795,100) |
| (514,620) | $ (9,770,402) | |
Class D Shares: | ||||||
Shares sold | 2,847,325 | $ 56,818,834 | 1,863,725 | $ 37,760,019 | ||
Reinvested dividends and distributions | 7,467,962 | 126,208,562 | 6,992,332 | 132,434,739 | ||
Shares repurchased | (7,634,054) | (152,453,021) | (11,244,335) | (225,406,675) | ||
Net Increase/(Decrease) | 2,681,233 | $ 30,574,375 |
| (2,388,278) | $(55,211,917) | |
Class I Shares: | ||||||
Shares sold | 2,600,734 | $ 53,968,075 | 775,122 | $ 15,663,396 | ||
Reinvested dividends and distributions | 169,932 | 2,873,546 | 211,245 | 4,003,084 | ||
Shares repurchased | (1,101,908) | (21,572,643) | (2,260,733) | (45,186,889) | ||
Net Increase/(Decrease) | 1,668,758 | $ 35,268,978 |
| (1,274,366) | $(25,520,409) | |
Class N Shares: | ||||||
Shares sold | 674,798 | $ 14,173,891 | 468,821 | $ 9,399,345 | ||
Reinvested dividends and distributions | 107,622 | 1,814,499 | 97,020 | 1,833,679 | ||
Shares repurchased | (220,534) | (4,485,659) | (304,865) | (6,112,631) | ||
Net Increase/(Decrease) | 561,886 | $ 11,502,731 |
| 260,976 | $ 5,120,393 | |
Class R Shares: | ||||||
Shares sold | 8,085 | $ 148,586 | 4,582 | $ 88,787 | ||
Reinvested dividends and distributions | 2,862 | 46,801 | 2,658 | 49,098 | ||
Shares repurchased | (5,830) | (108,982) | (13,008) | (253,139) | ||
Net Increase/(Decrease) | 5,117 | $ 86,405 |
| (5,768) | $ (115,254) | |
Class S Shares: | ||||||
Shares sold | 5,525 | $ 109,528 | 13,013 | $ 266,206 | ||
Reinvested dividends and distributions | 4,132 | 69,577 | 12,981 | 245,468 | ||
Shares repurchased | (9,728) | (191,962) | (171,192) | (3,592,363) | ||
Net Increase/(Decrease) | (71) | $ (12,857) |
| (145,198) | $ (3,080,689) | |
Class T Shares: | ||||||
Shares sold | 5,035,479 | $103,383,425 | 2,400,717 | $ 48,704,842 | ||
Reinvested dividends and distributions | 2,619,366 | 44,241,090 | 2,517,400 | 47,679,561 | ||
Shares repurchased | (5,237,969) | (103,700,413) | (7,361,090) | (147,407,263) | ||
Net Increase/(Decrease) | 2,416,876 | $ 43,924,102 |
| (2,442,973) | $(51,022,860) | |
32 | SEPTEMBER 30, 2019 |
Janus Henderson Contrarian Fund
Notes to Financial Statements
6. Purchases and Sales of Investment Securities
For the year ended September 30, 2019, the aggregate cost of purchases and proceeds from sales of investment securities (excluding any short-term securities, short-term options contracts, TBAs, and in-kind transactions, as applicable) was as follows:
Purchases of | Proceeds from Sales | Purchases of Long- | Proceeds from Sales |
$1,958,775,989 | $2,047,570,025 | $ - | $ - |
7. Recent Accounting Pronouncements
The FASB issued Accounting Standards Update No. 2017-08, Receivables – Nonrefundable Fees and Other Costs (Subtopic 310-20), Premium Amortization on Purchased Callable Debt Securities ("ASU 2017-08") to amend the amortization period for certain purchased callable debt securities held at a premium. The guidance requires certain premiums on callable debt securities to be amortized to the earliest call date. The amortization period for callable debt securities purchased at a discount will not be impacted. The amendments are effective for fiscal years and interim periods within those fiscal years, beginning after December 15, 2018. Management is currently evaluating the impacts of ASU 2017-08 on the Fund’s financial statements.
The FASB issued Accounting Standards Update 2018-13, Fair Value Measurement (Topic 820) in August 2018. The new guidance removes, modifies and enhances the disclosures to Topic 820. For public entities, the amendments are effective for financial statements issued for fiscal years beginning after December 15, 2019, and interim periods within those fiscal years. An entity is permitted, and Management has decided, to early adopt the removed and modified disclosures in these financial statements.
8. Subsequent Event
Management has evaluated whether any events or transactions occurred subsequent to September 30, 2019 and through the date of issuance of the Fund’s financial statements and determined that there were no material events or transactions that would require recognition or disclosure in the Fund’s financial statements.
Janus Investment Fund | 33 |
Janus Henderson Contrarian Fund
Report of Independent Registered Public Accounting Firm
To the Board of Trustees of Janus Investment Fund and Shareholders of Janus Henderson Contrarian Fund:
Opinion on the Financial Statements
We have audited the accompanying statement of assets and liabilities, including the schedule of investments, of Janus Henderson Contrarian Fund (one of the funds constituting Janus Investment Fund, referred to hereafter as the "Fund") as of September 30, 2019, the related statement of operations for the year ended September 30, 2019, the statements of changes in net assets for each of the two years in the period ended September 30, 2019, including the related notes, and the financial highlights for each of the periods indicated therein (collectively referred to as the “financial statements”). In our opinion, the financial statements present fairly, in all material respects, the financial position of the Fund as of September 30, 2019, the results of its operations for the year then ended, the changes in its net assets for each of the two years in the period ended September 30, 2019 and the financial highlights for each of the periods indicated therein in conformity with accounting principles generally accepted in the United States of America.
Basis for Opinion
These financial statements are the responsibility of the Fund’s management. Our responsibility is to express an opinion on the Fund’s financial statements based on our audits. We are a public accounting firm registered with the Public Company Accounting Oversight Board (United States) (PCAOB) and are required to be independent with respect to the Fund in accordance with the U.S. federal securities laws and the applicable rules and regulations of the Securities and Exchange Commission and the PCAOB.
We conducted our audits of these financial statements in accordance with the standards of the PCAOB. Those standards require that we plan and perform the audit to obtain reasonable assurance about whether the financial statements are free of material misstatement, whether due to error or fraud.
Our audits included performing procedures to assess the risks of material misstatement of the financial statements, whether due to error or fraud, and performing procedures that respond to those risks. Such procedures included examining, on a test basis, evidence regarding the amounts and disclosures in the financial statements. Our audits also included evaluating the accounting principles used and significant estimates made by management, as well as evaluating the overall presentation of the financial statements. Our procedures included confirmation of securities owned as of September 30, 2019 by correspondence with the custodian, transfer agent and brokers; when replies were not received from brokers, we performed other auditing procedures. We believe that our audits provide a reasonable basis for our opinion.

Denver, Colorado
November 15, 2019
We have served as the auditor of one or more investment companies in Janus Henderson Funds since 1990.
34 | SEPTEMBER 30, 2019 |
Janus Henderson Contrarian Fund
Additional Information (unaudited)
Proxy Voting Policies and Voting Record
A description of the policies and procedures that the Fund uses to determine how to vote proxies relating to its portfolio securities is available without charge: (i) upon request, by calling 1-800-525-1093; (ii) on the Fund’s website at janushenderson.com/proxyvoting; and (iii) on the SEC’s website at http://www.sec.gov. Additionally, information regarding the Fund’s proxy voting record for the most recent twelve-month period ended June 30 is also available, free of charge, through janushenderson.com/proxyvoting and from the SEC’s website at http://www.sec.gov.
Full Holdings
The Fund is required to disclose its complete holdings on Form N-Q within 60 days of the end of the first and third fiscal quarters, and in the annual report and semiannual report to Fund shareholders. These reports (i) are available on the SEC’s website at http://www.sec.gov; (ii) may be reviewed and copied at the SEC’s Public Reference Room in Washington, D.C. (information on the Public Reference Room may be obtained by calling 1-800-SEC-0330); and (iii) are available without charge, upon request, by calling a Janus Henderson representative at 1-877-335-2687 (toll free) (or 1-800-525-3713 if you hold Class D Shares). Portfolio holdings consisting of at least the names of the holdings are generally available on a monthly basis with a 30-day lag. Holdings are generally posted approximately two business days thereafter under Full Holdings for the Fund at janushenderson.com/info (or janushenderson.com/reports if you hold Class D Shares).
APPROVAL OF ADVISORY AGREEMENTS DURING THE PERIOD
Renewal of Advisory and Sub-Advisory Agreements with Janus Capital and Janus Capital Affiliates during the Period
The Trustees of Janus Investment Fund, each of whom serves as an “independent” Trustee (the “Trustees”), oversee the management of each Fund of Janus Investment Fund (each, a “JIF Fund,” and collectively, the “JIF Funds”), as well as each Portfolio of Janus Aspen Series (together with the JIF Funds, the “Janus Henderson Funds,” and each, a “Janus Henderson Fund”). As required by law, the Trustees determine annually whether to continue the investment advisory agreement for each Janus Henderson Fund and the subadvisory agreement for each Janus Henderson Funds that utilizes a subadviser.
In connection with their most recent consideration of those agreements for each Janus Henderson Fund, the Trustees received and reviewed information provided by Janus Capital and each subadviser in response to requests of the Trustees and their independent legal counsel. They also received and reviewed information and analysis provided by, and in response to requests of, their independent fee consultant. Throughout their consideration of the agreements, the Trustees were advised by their independent legal counsel. The Trustees met with management to consider the agreements and the information provided, and also met separately in executive session with their independent legal counsel and their independent fee consultant.
At a meeting held on December 6, 2018, based on the Trustees’ evaluation of the information provided by Janus Capital, the subadvisers, and the independent fee consultant, as well as other information, the Trustees determined that the overall arrangements between each Janus Henderson Fund and Janus Capital and each subadviser, as applicable, were fair and reasonable in light of the nature, extent and quality of the services provided by Janus Capital, its affiliates and the subadvisers, the fees charged for those services, and other matters that the Trustees considered relevant in the exercise of their business judgment. At that meeting, the Trustees unanimously approved the continuation of the investment advisory agreement for each Janus Henderson Fund, and the subadvisory agreement for each subadvised Janus Henderson Fund, for the period from February 1, 2019 through February 1, 2020, subject to earlier termination as provided for in each agreement.
In considering the continuation of those agreements, the Trustees reviewed and analyzed various factors that they determined were relevant, including the factors described below, none of which by itself was considered dispositive. However, the material factors and conclusions that formed the basis for the Trustees’ determination to approve the continuation of the agreements are discussed separately below. Also included is a summary of the independent fee consultant’s conclusions and opinions that arose during, and were included as part of, the Trustees’ consideration of the agreements. “Management fees,” as used herein, refer to actual annual advisory fees (and, for the purposes of peer comparisons any administration fees excluding out of pocket costs), net of any waivers, paid by a fund as a percentage of average net assets.
Janus Investment Fund | 35 |
Janus Henderson Contrarian Fund
Additional Information (unaudited)
Nature, Extent and Quality of Services
The Trustees reviewed the nature, extent and quality of the services provided by Janus Capital and the subadvisers to the Janus Henderson Funds, taking into account the investment objective, strategies and policies of each Janus Henderson Fund, and the knowledge the Trustees gained from their regular meetings with management on at least a quarterly basis and their ongoing review of information related to the Janus Henderson Funds. In addition, the Trustees reviewed the resources and key personnel of Janus Capital and each subadviser, particularly noting those employees who provide investment and risk management services to the Janus Henderson Funds. The Trustees also considered other services provided to the Janus Henderson Funds by Janus Capital or the subadvisers, such as managing the execution of portfolio transactions and the selection of broker-dealers for those transactions. The Trustees considered Janus Capital’s role as administrator to the Janus Henderson Funds, noting that Janus Capital does not receive a fee for its services but is reimbursed for its out-of-pocket costs. The Trustees considered the role of Janus Capital in monitoring adherence to the Janus Henderson Funds’ investment restrictions, providing support services for the Trustees and Trustee committees, and overseeing communications with fund shareholders and the activities of other service providers, including monitoring compliance with various policies and procedures of the Janus Henderson Funds and with applicable securities laws and regulations.
In this regard, the independent fee consultant noted that Janus Capital provides a number of different services for the Janus Henderson Funds and fund shareholders, ranging from investment management services to various other servicing functions, and that, in its view, Janus Capital is a capable provider of those services. The independent fee consultant also expressed the view that Janus Capital has developed a number of institutional competitive advantages that should enable it to provide superior investment and service performance over the long term.
The Trustees concluded that the nature, extent and quality of the services provided by Janus Capital and the subadviser to each Janus Henderson Fund that utilizes a subadviser were appropriate and consistent with the terms of the respective investment advisory and subadvisory agreements, and that, taking into account steps taken to address those Janus Henderson Funds whose performance lagged that of their peers for certain periods, the Janus Henderson Funds were likely to benefit from the continued provision of those services. They also concluded that Janus Capital and each subadviser had sufficient personnel, with the appropriate education and experience, to serve the Janus Henderson Funds effectively and had demonstrated its ability to attract well-qualified personnel.
Performance of the Funds
The Trustees considered the performance results of each Janus Henderson Fund over various time periods. They noted that they considered Janus Henderson Fund performance data throughout the year, including periodic meetings with each Janus Henderson Fund’s portfolio manager(s), and also reviewed information comparing each Janus Henderson Fund’s performance with the performance of comparable funds and peer groups identified by Broadridge Financial Solutions, Inc. (“Broadridge”), an independent data provider, and with the Janus Henderson Fund’s benchmark index. In this regard, the independent fee consultant found that the overall Janus Henderson Funds’ performance has been reasonable: for the 36 months ended September 30, 2018, approximately 48% of the Janus Henderson Funds were in the top two quartiles of performance, as reported by Morningstar, and for the 12 months ended September 30, 2018, approximately 56% of the Janus Henderson Funds were in the top two quartiles of performance, as reported by Morningstar.
The Trustees considered the performance of each Janus Henderson Fund, noting that performance may vary by share class, and noted the following with respect to the JIF Funds:
Alternative Fund
· For Janus Henderson Diversified Alternatives Fund, the Trustees noted that the Fund’s performance was in the second Broadridge quartile for the 36 months ended May 31, 2018 and the second Broadridge quartile for the 12 months ended May 31, 2018.
Asset Allocation Funds
· For Janus Henderson Global Allocation Fund – Conservative, the Trustees noted that the Fund’s performance was in the second Broadridge quartile for the 36 months ended May 31, 2018 and the first Broadridge quartile for the 12 months ended May 31, 2018.
36 | SEPTEMBER 30, 2019 |
Janus Henderson Contrarian Fund
Additional Information (unaudited)
· For Janus Henderson Global Allocation Fund – Growth, the Trustees noted that the Fund’s performance was in the third Broadridge quartile for the 36 months ended May 31, 2018 and the first Broadridge quartile for the 12 months ended May 31, 2018. The Trustees noted the reasons for the Fund’s underperformance, the steps Janus Capital had taken or was taking to improve performance, and that the performance trend was improving.
· For Janus Henderson Global Allocation Fund – Moderate, the Trustees noted that the Fund’s performance was in the third Broadridge quartile for the 36 months ended May 31, 2018 and the first Broadridge quartile for the 12 months ended May 31, 2018. The Trustees noted the reasons for the Fund’s underperformance, the steps Janus Capital had taken or was taking to improve performance, and that the performance trend was improving.
Fixed-Income Funds
· For Janus Henderson Flexible Bond Fund, the Trustees noted that the Fund’s performance was in the bottom Broadridge quartile for the 36 months ended May 31, 2018 and the third Broadridge quartile for the 12 months ended May 31, 2018. The Trustees noted the reasons for the Fund’s underperformance and the steps Janus Capital had taken or was taking to improve performance.
· For Janus Henderson Global Bond Fund, the Trustees noted that the Fund’s performance was in the bottom Broadridge quartile for the 36 months ended May 31, 2018 and the first Broadridge quartile for the 12 months ended May 31, 2018. The Trustees noted the reasons for the Fund’s underperformance, the steps Janus Capital had taken or was taking to improve performance, and that the performance trend was improving.
· For Janus Henderson Absolute Return Income Opportunities Fund (formerly, Janus Henderson Global Unconstrained Bond Fund), the Trustees noted that the Fund’s performance was in the bottom Broadridge quartile for the 36 months ended May 31, 2018 and the bottom Broadridge quartile for the 12 months ended May 31, 2018. The Trustees noted the reasons for the Fund’s underperformance and the steps Janus Capital had taken or was taking to improve performance.
· For Janus Henderson High-Yield Fund, the Trustees noted that the Fund’s performance was in the second Broadridge quartile for the 36 months ended May 31, 2018 and the third Broadridge quartile for the 12 months ended May 31, 2018.
· For Janus Henderson Multi-Sector Income Fund, the Trustees noted that the Fund’s performance was in the first Broadridge quartile for the 36 months ended May 31, 2018 and the first Broadridge quartile for the 12 months ended May 31, 2018.
· For Janus Henderson Short-Term Bond Fund, the Trustees noted that the Fund’s performance was in the bottom Broadridge quartile for the 36 months ended May 31, 2018 and the bottom Broadridge quartile for the 12 months ended May 31, 2018. The Trustees noted the reasons for the Fund’s underperformance and the steps Janus Capital had taken or was taking to improve performance.
· For Janus Henderson Developed World Bond Fund (formerly, Janus Henderson Strategic Income Fund), the Trustees noted that the Fund’s performance was in the second Broadridge quartile for the 36 months ended May 31, 2018 and the third Broadridge quartile for the 12 months ended May 31, 2018.
Global and International Equity Funds
· For Janus Henderson Asia Equity Fund, the Trustees noted that the Fund’s performance was in the third Broadridge quartile for the 36 months ended May 31, 2018 and the bottom Broadridge quartile for the 12 months ended May 31, 2018. The Trustees noted the reasons for the Fund’s underperformance, noting that the Fund has a performance fee structure that results in lower management fees during periods of underperformance, and the steps Janus Capital had taken or was taking to improve performance.
· For Janus Henderson Emerging Markets Fund, the Trustees noted that the Fund’s performance was in the third Broadridge quartile for the 36 months ended May 31, 2018 and the bottom Broadridge quartile for the 12 months ended May 31, 2018. The Trustees noted the reasons for the Fund’s underperformance and the steps Janus Capital had taken or was taking to improve performance.
· For Janus Henderson European Focus Fund, the Trustees noted that the Fund’s performance was in the bottom Broadridge quartile for the 36 months ended May 31, 2018 and the bottom Broadridge quartile for the 12 months
Janus Investment Fund | 37 |
Janus Henderson Contrarian Fund
Additional Information (unaudited)
ended May 31, 2018. The Trustees noted the reasons for the Fund’s underperformance and the steps Janus Capital had taken or was taking to improve performance.
· For Janus Henderson Global Equity Income Fund, the Trustees noted that the Fund’s performance was in the bottom Broadridge quartile for the 36 months ended May 31, 2018 and the bottom Broadridge quartile for the 12 months ended May 31, 2018. The Trustees noted the reasons for the Fund’s underperformance and the steps Janus Capital had taken or was taking to improve performance.
· For Janus Henderson Global Life Sciences Fund, the Trustees noted that the Fund’s performance was in the second Broadridge quartile for the 36 months ended May 31, 2018 and the first Broadridge quartile for the 12 months ended May 31, 2018.
· For Janus Henderson Global Real Estate Fund, the Trustees noted that the Fund’s performance was in the first Broadridge quartile for the 36 months ended May 31, 2018 and the first Broadridge quartile for the 12 months ended May 31, 2018.
· For Janus Henderson Global Research Fund, the Trustees noted that the Fund’s performance was in the third Broadridge quartile for the 36 months ended May 31, 2018 and the third Broadridge quartile for the 12 months ended May 31, 2018. The Trustees noted the reasons for the Fund’s underperformance, while also noting that the Fund has a performance fee structure that results in lower management fees during periods of underperformance, and the steps Janus Capital had taken or was taking to improve performance.
· For Janus Henderson Global Select Fund, the Trustees noted that the Fund’s performance was in the third Broadridge quartile for the 36 months ended May 31, 2018 and the first Broadridge quartile for the 12 months ended May 31, 2018. The Trustees noted the reasons for the Fund’s underperformance, the steps Janus Capital had taken or was taking to improve performance, and that the performance trend was improving.
· For Janus Henderson Global Technology Fund, the Trustees noted that the Fund’s performance was in the second Broadridge quartile for the 36 months ended May 31, 2018 and the third Broadridge quartile for the 12 months ended May 31, 2018.
· For Janus Henderson Global Value Fund, the Trustees noted that the Fund’s performance was in the bottom Broadridge quartile for the 36 months ended May 31, 2018 and the third Broadridge quartile for the 12 months ended May 31, 2018. The Trustees noted the reasons for the Fund’s underperformance, while also noting that the Fund has a performance fee structure that results in lower management fees during periods of underperformance, and the steps Janus Capital and Perkins had taken or were taking to improve performance.
· For Janus Henderson International Opportunities Fund, the Trustees noted that the Fund’s performance was in the bottom Broadridge quartile for the 36 months ended May 31, 2018 and the bottom Broadridge quartile for the 12 months ended May 31, 2018. The Trustees noted the reasons for the Fund’s underperformance and the steps Janus Capital had taken or was taking to improve performance.
· For Janus Henderson International Small Cap Fund, the Trustees noted that the Fund’s performance was in the second Broadridge quartile for the 12 months ended May 31, 2018.
· For Janus Henderson International Value Fund, the Trustees noted that the Fund’s performance was in the bottom Broadridge quartile for the 36 months ended May 31, 2018 and the bottom Broadridge quartile for the 12 months ended May 31, 2018. The Trustees noted the reasons for the Fund’s underperformance and the steps Janus Capital and Perkins had taken or were taking to improve performance.
· For Janus Henderson Overseas Fund, the Trustees noted that the Fund’s performance was in the bottom Broadridge quartile for the 36 months ended May 31, 2018 and the second Broadridge quartile for the 12 months ended May 31, 2018. The Trustees noted the reasons for the Fund’s underperformance, while also noting that the Fund has a performance fee structure that results in lower management fees during periods of underperformance, the steps Janus Capital had taken or was taking to improve performance, and that the performance trend was improving.
38 | SEPTEMBER 30, 2019 |
Janus Henderson Contrarian Fund
Additional Information (unaudited)
Money Market Funds
· For Janus Henderson Government Money Market Fund, the Trustees noted that the Fund’s performance was in the second Broadridge quartile for the 36 months ended May 31, 2018 and the second Broadridge quartile for the 12 months ended May 31, 2018.
· For Janus Henderson Money Market Fund, the Trustees noted that the Fund’s performance was in the third Broadridge quartile for the 36 months ended May 31, 2018 and the third Broadridge quartile for the 12 months ended May 31, 2018. The Trustees noted the reasons for the Fund’s underperformance, including the impact of waivers on comparative peer performance.
Multi-Asset Funds
· For Janus Henderson Adaptive Global Allocation Fund, the Trustees noted that the Fund’s performance was in the bottom Broadridge quartile for the 12 months ended May 31, 2018. The Trustees noted the reasons for the Fund’s underperformance, the steps Janus Capital had taken or was taking to improve performance, and the Fund’s limited performance history.
· For Janus Henderson All Asset Fund, the Trustees noted that the Fund’s performance was in the third Broadridge quartile for the 36 months ended May 31, 2018 and the third Broadridge quartile for the 12 months ended May 31, 2018. The Trustees noted the reasons for the Fund’s underperformance and the steps Janus Capital had taken or was taking to improve performance.
· For Janus Henderson Dividend & Income Builder Fund, the Trustees noted that the Fund’s performance was in the second Broadridge quartile for the 36 months ended May 31, 2018 and the third Broadridge quartile for the 12 months ended May 31, 2018.
· For Janus Henderson Value Plus Income Fund, the Trustees noted that the Fund’s performance was in the second Broadridge quartile for the 36 months ended May 31, 2018 and the third Broadridge quartile for the 12 months ended May 31, 2018.
Multi-Asset U.S. Equity Funds
· For Janus Henderson Balanced Fund, the Trustees noted that the Fund’s performance was in the first Broadridge quartile for the 36 months ended May 31, 2018 and the first Broadridge quartile for the 12 months ended May 31, 2018.
· For Janus Henderson Contrarian Fund, the Trustees noted that the Fund’s performance was in the bottom Broadridge quartile for the 36 months ended May 31, 2018 and the third Broadridge quartile for the 12 months ended May 31, 2018. The Trustees noted the reasons for the Fund’s underperformance, while also noting that the Fund has a performance fee structure that results in lower management fees during periods of underperformance, and the steps Janus Capital had taken or was taking to improve performance.
· For Janus Henderson Enterprise Fund, the Trustees noted that the Fund’s performance was in the first Broadridge quartile for the 36 months ended May 31, 2018 and the second Broadridge quartile for the 12 months ended May 31, 2018.
· For Janus Henderson Forty Fund, the Trustees noted that the Fund’s performance was in the second Broadridge quartile for the 36 months ended May 31, 2018 and the third Broadridge quartile for the 12 months ended May 31, 2018.
· For Janus Henderson Growth and Income Fund, the Trustees noted that the Fund’s performance was in the first Broadridge quartile for the 36 months ended May 31, 2018 and the first Broadridge quartile for the 12 months ended May 31, 2018.
· For Janus Henderson Research Fund, the Trustees noted that the Fund’s performance was in the third Broadridge quartile for the 36 months ended May 31, 2018 and the third Broadridge quartile for the 12 months ended May 31, 2018. The Trustees noted the reasons for the Fund’s underperformance, noting that the Fund has a performance fee structure that results in lower management fees during periods of underperformance, and the steps Janus Capital had taken or was taking to improve performance.
Janus Investment Fund | 39 |
Janus Henderson Contrarian Fund
Additional Information (unaudited)
· For Janus Henderson Triton Fund, the Trustees noted that the Fund’s performance was in the second Broadridge quartile for the 36 months ended May 31, 2018 and the third Broadridge quartile for the 12 months ended May 31, 2018.
· For Janus Henderson U.S. Growth Opportunities Fund, the Trustees noted that the Fund’s performance was in the third Broadridge quartile for the 36 months ended May 31, 2018 and the third Broadridge quartile for the 12 months ended May 31, 2018. The Trustees noted the reasons for the Fund’s underperformance, and the steps Janus Capital and Geneva had taken or were taking to improve performance.
· For Janus Henderson Venture Fund, the Trustees noted that the Fund’s performance was in the second Broadridge quartile for the 36 months ended May 31, 2018 and the third Broadridge quartile for the 12 months ended May 31, 2018.
Quantitative Equity Funds
· For Janus Henderson Emerging Markets Managed Volatility Fund, the Trustees noted that the Fund’s performance was in the third Broadridge quartile for the 36 months ended May 31, 2018 and the first Broadridge quartile for the 12 months ended May 31, 2018. The Trustees noted the reasons for the Fund’s underperformance, the steps Janus Capital and Intech had taken or were taking to improve performance, and that the performance trend was improving.
· For Janus Henderson Global Income Managed Volatility Fund, the Trustees noted that the Fund’s performance was in the first Broadridge quartile for the 36 months ended May 31, 2018 and the bottom Broadridge quartile for the 12 months ended May 31, 2018.
· For Janus Henderson International Managed Volatility Fund, the Trustees noted that the Fund’s performance was in the second Broadridge quartile for the 36 months ended May 31, 2018 and the second Broadridge quartile for the 12 months ended May 31, 2018.
· For Janus Henderson U.S. Managed Volatility Fund, the Trustees noted that the Fund’s performance was in the first Broadridge quartile for the 36 months ended May 31, 2018 and the first Broadridge quartile for the 12 months ended May 31, 2018.
U.S. Equity Funds
· For Janus Henderson Large Cap Value Fund, the Trustees noted that the Fund’s performance was in the third Broadridge quartile for the 36 months ended May 31, 2018 and the third Broadridge quartile for the 12 months ended May 31, 2018. The Trustees noted the reasons for the Fund’s underperformance, while also noting that the Fund has a performance fee structure that results in lower management fees during periods of underperformance, and the steps Janus Capital and Perkins had taken or were taking to improve performance.
· For Janus Henderson Mid Cap Value Fund, the Trustees noted that the Fund’s performance was in the second Broadridge quartile for the 36 months ended May 31, 2018 and the third Broadridge quartile for the 12 months ended May 31, 2018.
· For Janus Henderson Small-Mid Cap Value Fund (formerly, Janus Henderson Select Value Fund), the Trustees noted that the Fund’s performance was in the second Broadridge quartile for the 36 months ended May 31, 2018 and the bottom Broadridge quartile for the 12 months ended May 31, 2018.
· For Janus Henderson Small Cap Value Fund, the Trustees noted that the Fund’s performance was in the second Broadridge quartile for the 36 months ended May 31, 2018 and the bottom Broadridge quartile for the 12 months ended May 31, 2018.
In consideration of each Janus Henderson Fund’s performance, the Trustees concluded that, taking into account the factors relevant to performance, as well as other considerations, including steps taken to improve performance, the Janus Henderson Fund’s performance warranted continuation of such Janus Henderson Fund’s investment advisory and subadvisory agreement(s).
Costs of Services Provided
The Trustees examined information regarding the fees and expenses of each Janus Henderson Fund in comparison to similar information for other comparable funds as provided by Broadridge, an independent data provider. They also
40 | SEPTEMBER 30, 2019 |
Janus Henderson Contrarian Fund
Additional Information (unaudited)
reviewed an analysis of that information provided by their independent fee consultant and noted that the management fee rate (investment advisory and any administration fees, but excluding out-of-pocket costs) for many of the Janus Henderson Funds, net of waivers, was below the average management fee rate of the respective peer group of funds selected by Broadridge. The Trustees also examined information regarding the subadvisory fees charged for subadvisory services, as applicable, noting that all such fees were paid by Janus Capital out of its management fees collected from such Janus Henderson Fund. The Trustees also considered the total expenses for each share class of each Janus Henderson Fund compared to the average total expenses for its Broadridge Expense Group peers and to average total expenses for its Broadridge Expense Universe.
The independent fee consultant expressed the view that the management fees charged by Janus Capital to each of the Janus Henderson Funds under the current investment advisory and administration agreements are reasonable in relation to the services provided by Janus Capital. At the fund complex level, the independent fee consultant found: (1) the total expenses and management fees of the Janus Henderson Funds to be reasonable relative to other mutual funds; (2) total expenses, on average, were 10% under the average total expenses for the respective Broadridge Expense Group peers and 19% under the average total expenses for the respective Broadridge Expense Universes; (3) management fees for the Janus Henderson Funds, on average, were 8% under the average management fees for the respective Expense Groups and 10% under the average for the respective Expense Universes; and (4) Janus Henderson Fund expenses by function for each asset and share class category were reasonable relative to peer benchmarks.
The independent fee consultant concluded that, based on its strategic review of expenses at the complex, category and individual share class level, Janus Henderson Fund expenses were found to be reasonable relative to peer benchmarks. Further, for certain Janus Henderson Funds, the independent fee consultant also performed a systematic “focus list” analysis of expenses in the context of the performance or service delivered to investors in each Janus Henderson Fund. Based on this analysis, the independent fee consultant found that the combination of service quality/performance and expenses on these individual Janus Henderson Funds were reasonable in light of performance trends, performance histories, and existence of performance fees, breakpoints, and expense waivers on such “focus list” Funds.
The Trustees considered the methodology used by Janus Capital and each subadviser in determining compensation payable to portfolio managers, the competitive environment for investment management talent, and the competitive market for mutual funds in different distribution channels.
The Trustees also reviewed management fees charged by Janus Capital and each subadviser to comparable separate account clients and to comparable non-affiliated funds subadvised by Janus Capital or by a subadviser (for which Janus Capital or the subadviser provides only or primarily portfolio management services). Although in most instances comparable subadvisory and separate account fee rates for various investment strategies were lower than management fee rates for Janus Henderson Funds having a similar strategy, while subadviser fee rates charged to the Janus Henderson Funds were generally within a reasonable range of the fee rates that the subadviser charges to comparable separate account clients or non-affiliated funds. The Trustees considered that Janus Capital noted that, under the terms of the management agreements with the Janus Henderson Funds, Janus Capital performs significant additional services for the Janus Henderson Funds that it does not provide to those other clients, including administration services, oversight of the Janus Henderson Funds’ other service providers, trustee support, regulatory compliance and numerous other services, and that, in serving the Janus Henderson Funds, Janus Capital assumes many legal risks and other costs that it does not assume in servicing its other clients. Moreover, the Trustees noted that the independent fee consultant found that: (1) the management fees Janus Capital charges to the Janus Henderson Funds are reasonable in relation to the management fees Janus Capital charges to its institutional clients and to the fees Janus Capital charges to funds subadvised by Janus Capital; (2) these institutional and subadvised accounts have different service and infrastructure needs; (3) Janus Henderson mutual fund investors enjoy reasonable fees relative to the fees charged to Janus Henderson institutional and subadvised fund investors; (4) in three of five product categories, the Janus Henderson Funds receive proportionally better pricing than the industry in relation to Janus Henderson institutional clients; and (5) in six of seven strategies, Janus Capital has lower management fees than the management fees charged to funds subadvised by Janus Capital.
The Trustees considered the fees for each Janus Henderson Fund for its fiscal year ended in 2017, including the JIF Funds, and noted the following with regard to each JIF Fund’s total expenses, net of applicable fee waivers (the JIF Fund’s “total expenses”):
Janus Investment Fund | 41 |
Janus Henderson Contrarian Fund
Additional Information (unaudited)
Alternative Fund
· For Janus Henderson Diversified Alternatives Fund, the Trustees noted that, although the Fund’s total expenses exceeded the peer group average for certain share classes, overall the Fund’s total expenses were reasonable. The Trustees also noted that Janus Capital has contractually agreed to limit the Fund’s expenses.
Asset Allocation Funds
· For Janus Henderson Global Allocation Fund – Conservative, the Trustees noted that, although the Fund’s total expenses exceeded the peer group average for certain share classes, overall the Fund’s total expenses were reasonable. The Trustees also noted that Janus Capital has contractually agreed to limit the Fund’s expenses, although this limit did not apply because the Fund’s total expenses were already below the applicable fee limit.
· For Janus Henderson Global Allocation Fund – Growth, the Trustees noted that, although the Fund’s total expenses exceeded the peer group average for certain share classes, overall the Fund’s total expenses were reasonable. The Trustees also noted that Janus Capital has contractually agreed to limit the Fund’s expenses, although this limit did not apply because the Fund’s total expenses were already below the applicable fee limit.
· For Janus Henderson Global Allocation Fund – Moderate, the Trustees noted that, although the Fund’s total expenses exceeded the peer group average for certain share classes, overall the Fund’s total expenses were reasonable. The Trustees also noted that Janus Capital has contractually agreed to limit the Fund’s expenses, although this limit did not apply because the Fund’s total expenses were already below the applicable fee limit.
Fixed-Income Funds
· For Janus Henderson Flexible Bond Fund, the Trustees noted that, although the Fund’s total expenses exceeded the peer group average for certain share classes, overall the Fund’s total expenses were reasonable. The Trustees also noted that Janus Capital has contractually agreed to limit the Fund’s expenses.
· For Janus Henderson Global Bond Fund, the Trustees noted that, although the Fund’s total expenses exceeded the peer group average for certain share classes, overall the Fund’s total expenses were reasonable. The Trustees also noted that Janus Capital has contractually agreed to limit the Fund’s expenses.
· For Janus Henderson Absolute Return Income Opportunities Fund (formerly, Janus Henderson Global Unconstrained Bond Fund), the Trustees noted that, although the Fund’s total expenses exceeded the peer group average for all share classes, overall the Fund’s total expenses were reasonable. The Trustees also noted that Janus Capital has contractually agreed to limit the Fund’s expenses, although this limit did not apply because the Fund’s total expenses were already below the applicable fee limit.
· For Janus Henderson High-Yield Fund, the Trustees noted that, although the Fund’s total expenses exceeded the peer group average for certain share classes, overall the Fund’s total expenses were reasonable. The Trustees also noted that Janus Capital has contractually agreed to limit the Fund’s expenses, although this limit did not apply because the Fund’s total expenses were already below the applicable fee limit.
· For Janus Henderson Multi-Sector Income Fund, the Trustees noted that, although the Fund’s total expenses exceeded the peer group average for certain share classes, overall the Fund’s total expenses were reasonable. The Trustees also noted that Janus Capital has contractually agreed to limit the Fund’s expenses.
· For Janus Henderson Short-Term Bond Fund, the Trustees noted that, although the Fund’s total expenses exceeded the peer group average for all share classes, overall the Fund’s total expenses were reasonable. The Trustees also noted that the peer group comparisons did not take into account a recent management fee reduction for the Fund, effective December 14, 2018 and that Janus Capital has contractually agreed to limit the Fund’s expenses at a lower (more favorable) level.
· For Janus Henderson Developed World Bond Fund (formerly, Janus Henderson Strategic Income Fund), the Trustees noted that, although the Fund’s total expenses exceeded the peer group average for certain share classes, overall the Fund’s total expenses were reasonable. The Trustees also noted that Janus Capital has contractually agreed to limit the Fund’s expenses.
42 | SEPTEMBER 30, 2019 |
Janus Henderson Contrarian Fund
Additional Information (unaudited)
Global and International Equity Funds
· For Janus Henderson Asia Equity Fund, the Trustees noted that, although the Fund’s total expenses exceeded the peer group average for certain share classes, overall the Fund’s total expenses were reasonable. The Trustees also noted that Janus Capital has contractually agreed to limit the Fund’s expenses.
· For Janus Henderson Emerging Markets Fund, the Trustees noted that, although the Fund’s total expenses exceeded the peer group average for one share class, overall the Fund’s total expenses were reasonable. The Trustees also noted that Janus Capital has contractually agreed to limit the Fund’s expenses.
· For Janus Henderson European Focus Fund, the Trustees noted that, although the Fund’s total expenses exceeded the peer group average for certain share classes, overall the Fund’s total expenses were reasonable. The Trustees also noted that Janus Capital has contractually agreed to limit the Fund’s expenses.
· For Janus Henderson Global Equity Income Fund, the Trustees noted that the Fund’s total expenses were below the peer group average for all share classes.
· For Janus Henderson Global Life Sciences Fund, the Trustees noted that the Fund’s total expenses were below the peer group average for all share classes.
· For Janus Henderson Global Real Estate Fund, the Trustees noted that the Fund’s total expenses were below the peer group average for all share classes.
· For Janus Henderson Global Research Fund, the Trustees noted that the Fund’s total expenses were below the peer group average for all share classes.
· For Janus Henderson Global Select Fund, the Trustees noted that, although the Fund’s total expenses exceeded the peer group average for one share class, overall the Fund’s total expenses were reasonable. The Trustees also noted that Janus Capital has contractually agreed to limit the Fund’s expenses, although this limit did not apply because the Fund’s total expenses were already below the applicable fee limit.
· For Janus Henderson Global Technology Fund, the Trustees noted that the Fund’s total expenses were below the peer group average for all share classes.
· For Janus Henderson Global Value Fund, the Trustees noted that the Fund’s total expenses were below the peer group average for all share classes.
· For Janus Henderson International Opportunities Fund, the Trustees noted that, although the Fund’s total expenses exceeded the peer group average for certain share classes, overall the Fund’s total expenses were reasonable. The Trustees also noted that Janus Capital has contractually agreed to limit the Fund’s expenses.
· For Janus Henderson International Small Cap Fund, the Trustees noted that, although the Fund’s total expenses exceeded the peer group average for one share class, overall the Fund’s total expenses were reasonable. The Trustees also noted that Janus Capital has contractually agreed to limit the Fund’s expenses.
· For Janus Henderson International Value Fund, the Trustees noted that, although the Fund’s total expenses exceeded the peer group average for one share class, overall the Fund’s total expenses were reasonable. The Trustees also noted that Janus Capital has contractually agreed to limit the Fund’s expenses.
· For Janus Henderson Overseas Fund, the Trustees noted that the Fund’s total expenses were below the peer group average for all share classes.
Money Market Funds
· For Janus Henderson Government Money Market Fund, the Trustees noted that, although the Fund’s total expenses exceeded the peer group average for one share class, overall the Fund’s total expenses were reasonable. In addition, the Trustees considered that Janus Capital voluntarily waives one-half of its advisory fee and other expenses in order to maintain a positive yield.
· For Janus Henderson Money Market Fund, the Trustees noted that the Fund’s total expenses were above the peer group average for both share classes. In addition, the Trustees considered that Janus Capital voluntarily waives one-half of its advisory fee and other expenses in order to maintain a positive yield.
Janus Investment Fund | 43 |
Janus Henderson Contrarian Fund
Additional Information (unaudited)
Multi-Asset Funds
· For Janus Henderson Adaptive Global Allocation Fund, the Trustees noted that, although the Fund’s total expenses exceeded the peer group average for one share class, overall the Fund’s total expenses were reasonable. The Trustees also noted that Janus Capital has contractually agreed to limit the Fund’s expenses.
· For Janus Henderson All Asset Fund, the Trustees noted that, although the Fund’s total expenses exceeded the peer group average for one share class, overall the Fund’s total expenses were reasonable. The Trustees also noted that Janus Capital has contractually agreed to limit the Fund’s total expenses.
· For Janus Henderson Dividend & Income Builder Fund, the Trustees noted that the Fund’s total expenses were below the peer group average for all share classes.
· For Janus Henderson Value Plus Income Fund, the Trustees noted that the Fund’s total expenses were below the peer group average for all share classes.
Multi-Asset U.S. Equity Funds
· For Janus Henderson Balanced Fund, the Trustees noted that, although the Fund’s total expenses were equal to or exceeded the peer group average for certain share classes, overall the Fund’s total expenses were reasonable. The Trustees also noted that Janus Capital has contractually agreed to limit the Fund’s expenses, although this limit did not apply because the Fund’s total expenses were already below the applicable fee limit.
· For Janus Henderson Contrarian Fund, the Trustees noted that the Fund’s total expenses were below the peer group average for all share classes.
· For Janus Henderson Enterprise Fund, the Trustees noted that the Fund’s total expenses were below the peer group average for all share classes.
· For Janus Henderson Forty Fund, the Trustees noted that, although the Fund’s total expenses exceeded the peer group average for certain share classes, overall the Fund’s total expenses were reasonable. The Trustees also noted that Janus Capital has contractually agreed to limit the Fund’s expenses, although this limit did not apply because the Fund’s total expenses were already below the applicable fee limit.
· For Janus Henderson Growth and Income Fund, the Trustees noted that, although the Fund’s total expenses exceeded the peer group average for certain share classes, overall the Fund’s total expenses were reasonable. The Trustees also noted that Janus Capital has contractually agreed to limit the Fund’s expenses, although this limit did not apply because the Fund’s total expenses were already below the applicable fee limit.
· For Janus Henderson Research Fund, the Trustees noted that the Fund’s total expenses were below the peer group average for all share classes.
· For Janus Henderson Triton Fund, the Trustees noted that the Fund’s total expenses were below the peer group average for all share classes.
· For Janus Henderson U.S. Growth Opportunities Fund, the Trustees noted that, although the Fund’s total expenses exceeded the peer group average for one share class, overall the Fund’s total expenses were reasonable. The Trustees also noted that Janus Capital has contractually agreed to limit the Fund’s expenses.
· For Janus Henderson Venture Fund, the Trustees noted that the Fund’s total expenses were below the peer group average for all share classes.
Quantitative Equity Funds
· For Janus Henderson Emerging Markets Managed Volatility Fund, the Trustees noted that, although the Fund’s total expenses exceeded the peer group average for certain share classes, overall the Fund’s total expenses were reasonable taking into account the limited peer group for the Fund. The Trustees also noted that Janus Capital has contractually agreed to limit the Fund’s expenses.
· For Janus Henderson Global Income Managed Volatility Fund, the Trustees noted that the Fund’s total expenses were below the peer group average for all share classes.
44 | SEPTEMBER 30, 2019 |
Janus Henderson Contrarian Fund
Additional Information (unaudited)
· For Janus Henderson International Managed Volatility Fund, the Trustees noted that, although the Fund’s total expenses exceeded the peer group average for one share class, overall the Fund’s total expenses were reasonable. The Trustees also noted that Janus Capital has contractually agreed to limit the Fund’s expenses, although this limit did not apply because the Fund’s total expenses were already below the applicable fee limit.
· For Janus Henderson U.S. Managed Volatility Fund, the Trustees noted that, although the Fund’s total expenses exceeded the peer group average for one share class, overall the Fund’s total expenses were reasonable. The Trustees also noted that Janus Capital has contractually agreed to limit the Fund’s expenses, although this limit did not apply because the Fund’s total expenses were already below the applicable fee limit.
U.S. Equity Funds
· For Janus Henderson Large Cap Value Fund, the Trustees noted that the Fund’s total expenses were below the peer group average for all share classes.
· For Janus Henderson Mid Cap Value Fund, the Trustees noted that the Fund’s total expenses were below the peer group average for all share classes.
· For Janus Henderson Small-Mid Cap Value Fund (formerly, Janus Henderson Select Value Fund), the Trustees noted that, although the Fund’s total expenses exceeded the peer group average for certain share classes, overall the Fund’s total expenses were reasonable. The Trustees also noted that Janus Capital has contractually agreed to limit the Fund’s expenses.
· For Janus Henderson Small Cap Value Fund, the Trustees noted that, although the Fund’s total expenses exceeded the peer group average for certain share classes, overall the Fund’s total expenses were reasonable. The Trustees also noted that Janus Capital has contractually agreed to limit the Fund’s expenses, although this limit did not apply because the Fund’s total expenses were already below the applicable fee limit.
The Trustees reviewed information on the overall profitability to Janus Capital and its affiliates of their relationship with the Janus Henderson Funds, and considered profitability data of other publicly traded fund managers. The Trustees recognized that profitability comparisons among fund managers are difficult because of the variation in the type of comparative information that is publicly available, and the profitability of any fund manager is affected by numerous factors, including the organizational structure of the particular fund manager, differences in complex size, differences in product mix, differences in types of business (mutual fund, institutional and other), differences in the methodology for allocating expenses, and the fund manager’s capital structure and cost of capital.
Additionally, the Trustees considered the estimated profitability to Janus Capital from the investment management services it provides to each Janus Henderson Fund. In their review, the Trustees considered whether Janus Capital and each subadviser receive adequate incentives and resources to manage the Janus Henderson Funds effectively. In reviewing profitability, the Trustees noted that the estimated profitability for an individual Janus Henderson Fund is necessarily a product of the allocation methodology utilized by Janus Capital to allocate its expenses as part of the estimated profitability calculation. In this regard, the Trustees noted that the independent fee consultant concluded that (1) the expense allocation methodology utilized by Janus Capital was reasonable and (2) the estimated profitability to Janus Capital from the investment management services it provided to each Janus Henderson Fund was reasonable. The Trustees also considered that the estimated profitability for an individual Janus Henderson Fund was influenced by a number of factors, including not only the allocation methodology selected, but also the presence of fee waivers and expense caps, and whether the Janus Henderson Fund’s investment management agreement contained breakpoints or a performance fee component. The Trustees determined, after taking into account these factors, among others, that Janus Capital’s estimated profitability with respect to each Janus Henderson Fund was not unreasonable in relation to the services provided, and that the variation in the range of such estimated profitability among the Janus Henderson Funds was not a material factor in the Board’s approval of the reasonableness of any Janus Henderson Fund’s investment management fees.
The Trustees concluded that the management fees payable by each Janus Henderson Fund to Janus Capital, as well as the fees paid by Janus Capital to the subadvisers of subadvised Janus Henderson Funds, were reasonable in relation to the nature, extent, and quality of the services provided, taking into account the fees charged by other advisers for managing comparable mutual funds with similar strategies, the fees Janus Capital and the subadvisers charge to other clients, and, as applicable, the impact of fund performance on management fees payable by the Janus Henderson Funds. The Trustees also concluded that each Janus Henderson Fund’s total expenses were reasonable,
Janus Investment Fund | 45 |
Janus Henderson Contrarian Fund
Additional Information (unaudited)
taking into account the size of the Janus Henderson Fund, the quality of services provided by Janus Capital and any subadviser, the investment performance of the Janus Henderson Fund, and any expense limitations agreed to or provided by Janus Capital.
Economies of Scale
The Trustees considered information about the potential for Janus Capital to realize economies of scale as the assets of the Janus Henderson Funds increase. They noted the independent fee consultant’s analysis of economies of scale in prior years. They also noted that, although many Janus Henderson Funds pay advisory fees at a base fixed rate as a percentage of net assets, without any breakpoints or performance fees, the independent fee consultant concluded that 74% of these Janus Henderson Funds’ share classes have contractual management fees (gross of waivers) below their Broadridge Expense Group averages. They also noted that for those Janus Henderson Funds whose expenses are being reduced by contractual expense limitations with Janus Capital, Janus Capital is subsidizing certain of these Janus Henderson Funds because they have not reached adequate scale. Moreover, as the assets of some of the Janus Henderson Funds have declined in the past few years, certain Janus Henderson Funds have benefited from having advisory fee rates that have remained constant rather than increasing as assets declined. In addition, performance fee structures have been implemented for various Janus Henderson Funds that have caused the effective rate of advisory fees payable by such a Janus Henderson Fund to vary depending on the investment performance of the Janus Henderson Fund relative to its benchmark index over the measurement period; and a few Janus Henderson Funds have fee schedules with breakpoints and reduced fee rates above certain asset levels. The Trustees also noted that the Janus Henderson Funds share directly in economies of scale through the lower charges of third-party service providers that are based in part on the combined scale of all of the Janus Henderson Funds.
The Trustees also considered information provided by the independent fee consultant, which concluded that, given the limitations of various analytical approaches to economies of scale it had considered in prior years, and their conflicting results, it is difficult to analytically confirm or deny the existence of economies of scale in the Janus Henderson complex. The independent consultant further concluded that (1) to the extent there were economies of scale at Janus Capital, Janus Capital’s general strategy of setting fixed management fees below peers appeared to share any such economies with investors even on smaller Janus Henderson Funds which have not yet achieved those economies and (2) by setting lower fixed fees from the start on these Janus Henderson Funds, Janus Capital appeared to be investing to increase the likelihood that these Janus Henderson Funds will grow to a level to achieve any scale economies that may exist. Further, the independent fee consultant expressed the view that Janus Henderson Fund investors are well-served by the performance fee structures in place on the Janus Henderson Funds in light of any economies of scale that may be present at Janus Capital.
Based on all of the information they reviewed, including past research and analysis conducted by the Trustees’ independent fee consultant, the Trustees concluded that the current fee structure of each Janus Henderson Fund was reasonable and that the current rates of fees do reflect a sharing between Janus Capital and the Janus Henderson Fund of any economies of scale that may be present at the current asset level of the Janus Henderson Fund.
Other Benefits to Janus Capital
The Trustees also considered benefits that accrue to Janus Capital and its affiliates and subadvisers to the Janus Henderson Funds from their relationships with the Janus Henderson Funds. They recognized that two affiliates of Janus Capital separately serve the Janus Henderson Funds as transfer agent and distributor, respectively, and the transfer agent receives compensation directly from the non-money market funds for services provided, and that such compensation contributes to the overall profitability of Janus Capital and its affiliates that results from their relationship with the Janus Henderson Funds. The Trustees also considered Janus Capital’s and each subadviser’s past and proposed use of commissions paid by the Janus Henderson Funds on portfolio brokerage transactions to obtain proprietary and third-party research products and services benefiting the Janus Henderson Fund and/or other clients of Janus Capital and/or Janus Capital, and/or a subadviser to a Janus Henderson Fund. The Trustees concluded that Janus Capital’s and the subadvisers’ use of these types of client commission arrangements to obtain proprietary and third-party research products and services was likely to benefit each Janus Henderson Fund. The Trustees also concluded that, other than the services provided by Janus Capital and its affiliates and subadvisers pursuant to the agreements and the fees to be paid by each Janus Henderson Fund therefor, the Janus Henderson Funds and Janus Capital and the subadvisers may potentially benefit from their relationship with each other in other ways. They concluded that Janus Capital and its affiliates share directly in economies of scale through the lower charges of third-party service providers that are based in part on the combined scale of the Janus Henderson Funds and other clients
46 | SEPTEMBER 30, 2019 |
Janus Henderson Contrarian Fund
Additional Information (unaudited)
serviced by Janus Capital and its affiliates. They also concluded that Janus Capital and/or the subadvisers benefit from the receipt of research products and services acquired through commissions paid on portfolio transactions of the Janus Henderson Funds and that the Janus Henderson Funds benefit from Janus Capital’s and/or the subadvisers’ receipt of those products and services as well as research products and services acquired through commissions paid by certain other clients of Janus Capital and/or other clients of the subadvisers. They further concluded that the success of any Janus Henderson Fund could attract other business to Janus Capital, the subadvisers or other Janus Henderson funds, and that the success of Janus Capital and the subadvisers could enhance Janus Capital’s and the subadvisers’ ability to serve the Janus Henderson Funds.
Approval of an Amended and Restated Investment Advisory Agreement for Janus Henderson Small-Mid Cap Value Fund (formerly, Janus Henderson Select Value Fund)
Janus Capital Management LLC (“Janus Capital”) met with the Trustees, each of whom serves as an “independent” Trustee (the “Trustees”), on December 5, 2018 and March 14, 2019, to discuss the Amended and Restated Investment Advisory Agreement (the “Amended Advisory Agreement”) for Janus Henderson Small-Mid Cap Value Fund (formerly, Janus Henderson Select Value Fund) (“Small-Mid Cap Value Fund”) and other matters related to investment strategy changes to shift the market capitalization focus of Small-Mid Cap Value Fund (the “Strategy Change”). At these meetings, the Trustees discussed the Amended Advisory Agreement and the Strategy Change with their independent counsel, separately from management. During the course of the meetings, the Trustees requested and considered such information as they deemed relevant to their deliberations. At the meeting held on March 14, 2019, the Trustees, upon the recommendation of Janus Capital, voted unanimously to approve the Amended Advisory Agreement for Small-Mid Cap Value Fund, and recommended that the Amended Advisory Agreement be submitted to shareholders for approval. The Trustees also approved matters related to the Strategy Change, effective upon approval of the Amended Advisory Agreement by the Fund’s shareholders.
In determining whether to approve the Amended Advisory Agreement, the Trustees noted their most recent consideration of Small-Mid Cap Value Fund’s current advisory agreement (the “Current Advisory Agreement”) as part of the Trustees’ annual review and consideration of whether to continue the investment advisory agreement and sub-advisory agreement, as applicable, for each Janus Henderson fund, including Small-Mid Cap Value Fund (the “Annual Review”). The Trustees noted that in connection with the Annual Review: (i) the Trustees received and reviewed information provided by Janus Capital and each sub-adviser, including Perkins Investment Management LLC (“Perkins”), in response to requests of the Trustees and their independent legal counsel, and also received and reviewed information and analysis provided by, and in response to requests of, their independent fee consultant; and (ii) throughout the Annual Review, the Trustees were advised by their independent legal counsel. The Trustees also noted that based on the Trustees’ evaluation of the information provided by Janus Capital, Perkins, and the independent fee consultant, as well as other information, the Trustees determined that the overall arrangements between Small-Mid Cap Value Fund and Janus Capital and Perkins were fair and reasonable in light of the nature, extent and quality of the services provided by Janus Capital, its affiliates and Perkins, the fees charged for those services, and other matters that the Trustees considered relevant in the exercise of their business judgment, and the Trustees unanimously approved the continuation of the Current Advisory Agreement for another year.
In considering the Amended Advisory Agreement, the Trustees reviewed and analyzed various factors that they determined were relevant, including the factors described below, none of which by itself was considered dispositive. However, the material factors and conclusions that formed the basis for the Trustees’ determination to approve the Amended Advisory Agreement are discussed separately below.
· The Trustees determined that the terms of the Amended Advisory Agreement are substantially similar to those of the Current Advisory Agreement, which the Trustees recently reviewed as part of the Annual Review, and the material changes made to the Amended Advisory Agreement address the proposed change to the benchmark index and the description of the period used for calculating the performance fee in order to allow for continuity of the fee based on Small-Mid Cap Value Fund’s historical performance over a 36-month measurement period.
· As part of the Strategy Change, Small-Mid Cap Value Fund will focus its investments on common stocks of companies that are small- and mid-capitalization stocks. The Trustees determined that the proposed benchmark index, the Russell 2500TM Value Index, is more closely aligned with a small- and mid-cap stock focus than Small-Mid Cap Value Fund’s current benchmark index, the Russell 3000® Value Index.
Janus Investment Fund | 47 |
Janus Henderson Contrarian Fund
Additional Information (unaudited)
· Under the Amended Advisory Agreement, the structure of the performance fee was not changing, other than to utilize a different benchmark and performance calculation period to implement the new benchmark over time, and that this structure had been implemented initially for Small-Mid Cap Value Fund based on analysis provided by the independent fee consultant. The Trustees considered the information provided by Janus Capital in this regard, and noted Janus Capital’s belief that this performance fee structure remained reasonable and appropriate for Small-Mid Cap Value Fund. The Trustees concluded that this performance fee structure was reasonable for Small-Mid Cap Value Fund as proposed, and also determined to seek further analysis from their independent fee consultant with respect to this matter. In this regard, Janus Capital agreed to consider further revisions to the proposed performance fee structure should that be needed based on the additional analysis provided.
· As part of the Strategy Change, Perkins will continue to provide sub-advisory services to Small-Mid Cap Value Fund, but will utilize new portfolio managers to implement Small-Mid Cap Value Fund’s focus on common stocks of companies that are small- and mid-capitalization stocks. In this regard, the Trustees noted the information provided by Janus Capital with respect to the qualifications and experience of the new portfolio managers implementing investment strategies similar to the one to be utilized by Small-Mid Cap Value Fund, and also noted that Perkins and the new portfolio managers provide sub-advisory services to other Janus Henderson funds the Trustees oversee.
· The information provided by Janus Capital with respect to (i) the impact of the Amended Advisory Agreement on the potential advisory fees to be paid by Small-Mid Cap Value Fund going forward; and (ii) the potential transaction costs and capital gains to be incurred by Small-Mid Cap Value Fund as part of the efforts to reposition Small-Mid Cap Value Fund’s portfolio to focus its investments on common stocks of companies that are small- and mid-capitalization stocks. In this regard, the Trustees noted that Small-Mid Cap Value Fund’s operating costs were not expected otherwise to materially change under the Amended Advisory Agreement.
· Janus Capital’s reasons for seeking to implement the Strategy Change, including Janus Capital’s belief that current marketplace demands for a small and mid-cap strategy, combined with Perkins’ experience in managing small- and mid-cap stocks, will provide greater opportunity for Small-Mid Cap Value Fund to grow over the long-term, and that the Strategy Change is designed to create asset growth through increased sales for Small-Mid Cap Value Fund, potentially resulting in increased operational efficiencies for Small-Mid Cap Value Fund.
· Janus Capital will pay the fees and expenses related to seeking shareholder approval of the Amended Advisory Agreement, including the costs related to the preparation and distribution of proxy materials, and all other costs incurred in connection with the solicitation of proxies.
After discussion, the Trustees determined that the overall arrangements between Small-Mid Cap Value Fund, Janus Capital, and Perkins under the Amended Advisory Agreement would continue to be fair and reasonable in light of the nature, extent, and quality of the services expected to be provided by Janus Capital, its affiliates, and Perkins following the Strategy Change.
48 | SEPTEMBER 30, 2019 |
Janus Henderson Contrarian Fund
Useful Information About Your Fund Report (unaudited)
The Management Commentary in this report includes valuable insight as well as statistical information to help you understand how your Fund’s performance and characteristics stack up against those of comparable indices.
If the Fund invests in foreign securities, this report may include information about country exposure. Country exposure is based primarily on the country of risk. A company may be allocated to a country based on other factors such as location of the company’s principal office, the location of the principal trading market for the company’s securities, or the country where a majority of the company’s revenues are derived.
Please keep in mind that the opinions expressed in the Management Commentary are just that: opinions. They are a reflection based on best judgment at the time this report was compiled, which was September 30, 2019. As the investing environment changes, so could opinions. These views are unique and are not necessarily shared by fellow employees or by Janus Henderson in general.
Performance Overviews
Performance overview graphs compare the performance of a hypothetical $10,000 investment in the Fund with one or more widely used market indices. When comparing the performance of the Fund with an index, keep in mind that market indices are not available for investment and do not reflect deduction of expenses.
Average annual total returns are quoted for a Fund with more than one year of performance history. Average annual total return is calculated by taking the growth or decline in value of an investment over a period of time, including reinvestment of dividends and distributions, then calculating the annual compounded percentage rate that would have produced the same result had the rate of growth been constant throughout the period. Average annual total return does not reflect the deduction of taxes that a shareholder would pay on Fund distributions or redemptions of Fund shares.
Cumulative total returns are quoted for a Fund with less than one year of performance history. Cumulative total return is the growth or decline in value of an investment over time, independent of the period of time involved. Cumulative total return does not reflect the deduction of taxes that a shareholder would pay on Fund distributions or redemptions of Fund shares.
Pursuant to federal securities rules, expense ratios shown in the performance chart reflect subsidized (if applicable) and unsubsidized ratios. The total annual fund operating expenses ratio is gross of any fee waivers, reflecting the Fund’s unsubsidized expense ratio. The net annual fund operating expenses ratio (if applicable) includes contractual waivers of Janus Capital and reflects the Fund’s subsidized expense ratio. Ratios may be higher or lower than those shown in the “Financial Highlights” in this report.
Schedule of Investments
Following the performance overview section is the Fund’s Schedule of Investments. This schedule reports the types of securities held in the Fund on the last day of the reporting period. Securities are usually listed by type (common stock, corporate bonds, U.S. Government obligations, etc.) and by industry classification (banking, communications, insurance, etc.). Holdings are subject to change without notice.
The value of each security is quoted as of the last day of the reporting period. The value of securities denominated in foreign currencies is converted into U.S. dollars.
If the Fund invests in foreign securities, it will also provide a summary of investments by country. This summary reports the Fund exposure to different countries by providing the percentage of securities invested in each country. The country of each security represents the country of risk. The Fund’s Schedule of Investments relies upon the industry group and country classifications published by Barclays and/or MSCI Inc.
Tables listing details of individual forward currency contracts, futures, written options, swaptions, and swaps follow the Fund’s Schedule of Investments (if applicable).
Statement of Assets and Liabilities
This statement is often referred to as the “balance sheet.” It lists the assets and liabilities of the Fund on the last day of the reporting period.
Janus Investment Fund | 49 |
Janus Henderson Contrarian Fund
Useful Information About Your Fund Report (unaudited)
The Fund’s assets are calculated by adding the value of the securities owned, the receivable for securities sold but not yet settled, the receivable for dividends declared but not yet received on securities owned, and the receivable for Fund shares sold to investors but not yet settled. The Fund’s liabilities include payables for securities purchased but not yet settled, Fund shares redeemed but not yet paid, and expenses owed but not yet paid. Additionally, there may be other assets and liabilities such as unrealized gain or loss on forward currency contracts.
The section entitled “Net Assets Consist of” breaks down the components of the Fund’s net assets. Because the Fund must distribute substantially all earnings, you will notice that a significant portion of net assets is shareholder capital.
The last section of this statement reports the net asset value (“NAV”) per share on the last day of the reporting period. The NAV is calculated by dividing the Fund’s net assets for each share class (assets minus liabilities) by the number of shares outstanding.
Statement of Operations
This statement details the Fund’s income, expenses, realized gains and losses on securities and currency transactions, and changes in unrealized appreciation or depreciation of Fund holdings.
The first section in this statement, entitled “Investment Income,” reports the dividends earned from securities and interest earned from interest-bearing securities in the Fund.
The next section reports the expenses incurred by the Fund, including the advisory fee paid to the investment adviser, transfer agent fees and expenses, and printing and postage for mailing statements, financial reports and prospectuses. Expense offsets and expense reimbursements, if any, are also shown.
The last section lists the amounts of realized gains or losses from investment and foreign currency transactions, and changes in unrealized appreciation or depreciation of investments and foreign currency-denominated assets and liabilities. The Fund will realize a gain (or loss) when it sells its position in a particular security. A change in unrealized gain (or loss) refers to the change in net appreciation or depreciation of the Fund during the reporting period. “Net Realized and Unrealized Gain/(Loss) on Investments” is affected both by changes in the market value of Fund holdings and by gains (or losses) realized during the reporting period.
Statements of Changes in Net Assets
These statements report the increase or decrease in the Fund’s net assets during the reporting period. Changes in the Fund’s net assets are attributable to investment operations, dividends and distributions to investors, and capital share transactions. This is important to investors because it shows exactly what caused the Fund’s net asset size to change during the period.
The first section summarizes the information from the Statement of Operations regarding changes in net assets due to the Fund’s investment operations. The Fund’s net assets may also change as a result of dividend and capital gains distributions to investors. If investors receive their dividends and/or distributions in cash, money is taken out of the Fund to pay the dividend and/or distribution. If investors reinvest their dividends and/or distributions, the Fund’s net assets will not be affected. If you compare the Fund’s “Net Decrease from Dividends and Distributions” to “Reinvested Dividends and Distributions,” you will notice that dividends and distributions have little effect on the Fund’s net assets. This is because the majority of the Fund’s investors reinvest their dividends and/or distributions.
The reinvestment of dividends and distributions is included under “Capital Share Transactions.” “Capital Shares” refers to the money investors contribute to the Fund through purchases or withdrawals via redemptions. The Fund’s net assets will increase and decrease in value as investors purchase and redeem shares from the Fund.
Financial Highlights
This schedule provides a per-share breakdown of the components that affect the Fund’s NAV for current and past reporting periods as well as total return, asset size, ratios, and portfolio turnover rate.
The first line in the table reflects the NAV per share at the beginning of the reporting period. The next line reports the net investment income/(loss) per share. Following is the per share total of net gains/(losses), realized and unrealized. Per share dividends and distributions to investors are then subtracted to arrive at the NAV per share at the end of the period. The next line reflects the total return for the period. The total return may include adjustments in accordance with generally accepted accounting principles required at the period end for financial reporting purposes. As a result, the
50 | SEPTEMBER 30, 2019 |
Janus Henderson Contrarian Fund
Useful Information About Your Fund Report (unaudited)
total return may differ from the total return reflected for individual shareholder transactions. Also included are ratios of expenses and net investment income to average net assets.
The Fund’s expenses may be reduced through expense offsets and expense reimbursements. The ratios shown reflect expenses before and after any such offsets and reimbursements.
The ratio of net investment income/(loss) summarizes the income earned less expenses, divided by the average net assets of the Fund during the reporting period. Do not confuse this ratio with the Fund’s yield. The net investment income ratio is not a true measure of the Fund’s yield because it does not take into account the dividends distributed to the Fund’s investors.
The next figure is the portfolio turnover rate, which measures the buying and selling activity in the Fund. Portfolio turnover is affected by market conditions, changes in the asset size of the Fund, fluctuating volume of shareholder purchase and redemption orders, the nature of the Fund’s investments, and the investment style and/or outlook of the portfolio manager(s) and/or investment personnel. A 100% rate implies that an amount equal to the value of the entire portfolio was replaced once during the fiscal year; a 50% rate means that an amount equal to the value of half the portfolio is traded in a year; and a 200% rate means that an amount equal to the value of the entire portfolio is traded every six months.
Janus Investment Fund | 51 |
Janus Henderson Contrarian Fund
Designation Requirements (unaudited)
For federal income tax purposes, the Fund designated the following for the year ended September 30, 2019:
| |
Capital Gain Distributions | $96,426,022 |
Dividends Received Deduction Percentage | 53% |
Qualified Dividend Income Percentage | 54% |
52 | SEPTEMBER 30, 2019 |
Janus Henderson Contrarian Fund
Trustees and Officers (unaudited)
The Fund’s Statement of Additional Information includes additional information about the Trustees and officers and is available, without charge, by calling 1-877-335-2687.
The following are the Trustees and officers of the Trust, together with a brief description of their principal occupations during the last five years (principal occupations for certain Trustees may include periods over five years).
Each Trustee has served in that capacity since he or she was originally elected or appointed. The Trustees do not serve a specified term of office. Each Trustee will hold office until the termination of the Trust or his or her earlier death, resignation, retirement, incapacity, or removal. Under the Fund’s Governance Procedures and Guidelines, the policy is for Trustees to retire no later than the end of the calendar year in which the Trustee turns 75. The Trustees review the Fund’s Governance Procedures and Guidelines from time to time and may make changes they deem appropriate. The Fund’s Nominating and Governance Committee will consider nominees for the position of Trustee recommended by shareholders. Shareholders may submit the name of a candidate for consideration by the Committee by submitting their recommendations to the Trust’s Secretary. Each Trustee is currently a Trustee of one other registered investment company advised by Janus Capital: Janus Aspen Series. Collectively, these two registered investment companies consist of 58 series or funds referred to herein as the Fund Complex.
The Trust’s officers are elected annually by the Trustees for a one-year term. Certain officers also serve as officers of Janus Aspen Series. Certain officers of the Fund may also be officers and/or directors of Janus Capital. Except as otherwise disclosed, Fund officers receive no compensation from the Fund, except for the Fund’s Chief Compliance Officer, as authorized by the Trustees.
Janus Investment Fund | 53 |
Janus Henderson Contrarian Fund
Trustees and Officers (unaudited)
TRUSTEES | |||||
Name, Address, and Age | Positions Held with the Trust | Length of Time Served | Principal Occupations During the Past Five Years | Number of Portfolios/Funds in Fund Complex Overseen by Trustee | Other Directorships Held by Trustee During the Past Five Years |
Independent Trustees | |||||
William F. McCalpin | Chairman | 1/08-Present | Managing Partner, Impact Investments, Athena Capital Advisors LLC (independent registered investment advisor) (since 2016). Formerly, Managing Director, Holos Consulting LLC (provides consulting services to foundations and other nonprofit organizations) (2009-2016), Chief Executive Officer, Imprint Capital Advisors (impact investment firm) (2013-2015), and Executive Vice President and Chief Operating Officer of The Rockefeller Brothers Fund (a private family foundation) (1998-2006). | 58 | Director of Mutual Fund Directors Forum (a non-profit organization serving independent directors of U.S. mutual funds) (since 2016), Chairman of the Board and Trustee of The Investment Fund for Foundations Investment Program (TIP) (consisting of 2 funds) (since 2008), and Director of the F.B. Heron Foundation (a private grantmaking foundation) (since 2006). |
54 | SEPTEMBER 30, 2019 |
Janus Henderson Contrarian Fund
Trustees and Officers (unaudited)
TRUSTEES | |||||
Name, Address, and Age | Positions Held with the Trust | Length of Time Served | Principal Occupations During the Past Five Years | Number of Portfolios/Funds in Fund Complex Overseen by Trustee | Other Directorships Held by Trustee During the Past Five Years |
Independent Trustees | |||||
Alan A. Brown | Trustee | 1/13-Present | Principal, Curam Holdings (since 2018). Formerly, Executive Vice President, Institutional Markets, of Black Creek Group (private equity real estate investment management firm) (2012-2018), Executive Vice President and Co-Head, Global Private Client Group (2007-2010), Executive Vice President, Mutual Funds (2005-2007), and Chief Marketing Officer (2001-2005) of Nuveen Investments, Inc. (asset management). | 58 | Director of WTTW (PBS affiliate) (since 2003). Formerly, Director of MotiveQuest LLC (strategic social market research company) (2003-2016), Director of Nuveen Global Investors LLC (2007-2011), Director of Communities in Schools (2004-2010), and Director of Mutual Fund Education Alliance (until 2010). |
Janus Investment Fund | 55 |
Janus Henderson Contrarian Fund
Trustees and Officers (unaudited)
TRUSTEES | |||||
Name, Address, and Age | Positions Held with the Trust | Length of Time Served | Principal Occupations During the Past Five Years | Number of Portfolios/Funds in Fund Complex Overseen by Trustee | Other Directorships Held by Trustee During the Past Five Years |
Independent Trustees | |||||
William D. Cvengros | Trustee | 1/11-Present | Chief Executive Officer of SJC Capital, LLC (a personal investment company and consulting firm) (since 2002). Formerly, Venture Partner for The Edgewater Funds (a middle market private equity firm) (2002-2004), Chief Executive Officer and President of PIMCO Advisors Holdings L.P. (a publicly traded investment management firm) (1994-2000), and Chief Investment Officer (1987-1994) and Vice Chairman and Director (1990-1994) of Pacific Life Insurance Company (a mutual life insurance and annuity company) (1987-1994). | 58 | Advisory Board Member, Innovate Partners Emerging Growth and Equity Fund I (early stage venture capital fund) (since 2014). Formerly, Managing Trustee of National Retirement Partners Liquidating Trust (2013-2016), Chairman, National Retirement Partners, Inc. (formerly a network of advisors to 401(k) plans) (2005-2013), Director of Prospect Acquisition Corp. (a special purpose acquisition corporation) (2007-2009), Director of RemedyTemp, Inc. (temporary help services company) (1996-2006), and Trustee of PIMCO Funds Multi-Manager Series (1990-2000) and Pacific Life Variable Life & Annuity Trusts (1987-1994). |
56 | SEPTEMBER 30, 2019 |
Janus Henderson Contrarian Fund
Trustees and Officers (unaudited)
TRUSTEES | |||||
Name, Address, and Age | Positions Held with the Trust | Length of Time Served | Principal Occupations During the Past Five Years | Number of Portfolios/Funds in Fund Complex Overseen by Trustee | Other Directorships Held by Trustee During the Past Five Years |
Independent Trustees | |||||
Raudline Etienne | Trustee | 6/16-Present | Founder, Daraja Capital (advisory and investment firm) (since 2016), and Senior Advisor, Albright Stonebridge Group LLC (global strategy firm) (since 2016). Formerly, Senior Vice President (2011-2015), Albright Stonebridge Group LLC, and Deputy Comptroller and Chief Investment Officer, New York State Common Retirement Fund (public pension fund) (2008-2011). | 58 | Board Member, Van Alen Institute (nonprofit architectural and design organization) (since 2019), and Director of Brightwood Capital Advisors, LLC (since 2014). |
William M. | Trustee | 9/19-Present | Founder, Fitzgerald Asset | 58 | Board of Directors, Municipal |
Janus Investment Fund | 57 |
Janus Henderson Contrarian Fund
Trustees and Officers (unaudited)
TRUSTEES | |||||
Name, Address, and Age | Positions Held with the Trust | Length of Time Served | Principal Occupations During the Past Five Years | Number of Portfolios/Funds in Fund Complex Overseen by Trustee | Other Directorships Held by Trustee During the Past Five Years |
Independent Trustees | |||||
Gary A. Poliner | Trustee | 6/16-Present | Retired. Formerly, President (2010-2013) of Northwestern Mutual Life Insurance Company. | 58 | Director of MGIC Investment Corporation (private mortgage insurance) (since 2013) and West Bend Mutual Insurance Company (property/casualty insurance) (since 2013). Formerly, Trustee of Northwestern Mutual Life Insurance Company (2010-2013), and Director of Frank Russell Company (global asset management firm) (2008-2013). |
William D. Stewart | Trustee | 6/84-Present | Retired. Formerly, President and founder of HPS Products and Corporate Vice President of MKS Instruments, Boulder, CO (a provider of advanced process control systems for the semiconductor industry) (1976-2012). | 58 | None |
58 | SEPTEMBER 30, 2019 |
Janus Henderson Contrarian Fund
Trustees and Officers (unaudited)
TRUSTEES | |||||
Name, Address, and Age | Positions Held with the Trust | Length of Time Served | Principal Occupations During the Past Five Years | Number of Portfolios/Funds in Fund Complex Overseen by Trustee | Other Directorships Held by Trustee During the Past Five Years |
Independent Trustees | |||||
Diane L. Wallace | Trustee | 6/17-Present | Retired. | 58 | Formerly, Independent Trustee, Henderson Global Funds (13 portfolios) (2015-2017), Independent Trustee, State Farm Associates' Funds Trust, State Farm Mutual Fund Trust, and State Farm Variable Product Trust (28 portfolios) (2013-2017), Chief Operating Officer, Senior Vice President-Operations, and Chief Financial Officer for Driehaus Capital Management, LLC (1988-2006), and Treasurer for Driehaus Mutual Funds (1996-2002). |
Janus Investment Fund | 59 |
Janus Henderson Contrarian Fund
Trustees and Officers (unaudited)
TRUSTEES | |||||
Name, Address, and Age | Positions Held with the Trust | Length of Time Served | Principal Occupations During the Past Five Years | Number of Portfolios/Funds in Fund Complex Overseen by Trustee | Other Directorships Held by Trustee During the Past Five Years |
Independent Trustees | |||||
Linda S. Wolf | Trustee | 11/05-Present | Retired. Formerly, Chairman and Chief Executive Officer of Leo Burnett (Worldwide) (advertising agency) (2001-2005). | 58 | Director of Chicago Community Trust (Regional Community Foundation), Chicago Council on Global Affairs, InnerWorkings (U.S. provider of print procurement solutions to corporate clients), Lurie Children’s Hospital (Chicago, IL), Shirley Ryan Ability Lab and Wrapports, LLC (digital communications company). Formerly, Director of Walmart (until 2017), Director of Chicago Convention & Tourism Bureau (until 2014) and The Field Museum of Natural History (Chicago, IL) (until 2014). |
60 | SEPTEMBER 30, 2019 |
Janus Henderson Contrarian Fund
Trustees and Officers (unaudited)
OFFICERS | |||
Name, Address, and Age | Positions Held with the Trust | Term of Office* and Length of Time Served | Principal Occupations During the Past Five Years |
Nick Schommer 151 Detroit Street Denver, CO 80206 DOB: 1978 | Executive Vice President and Portfolio Manager Janus Henderson Contrarian Fund | 7/17-Present | Portfolio Manager for other Janus Henderson accounts. Formerly, Associate Portfolio Manager at Thornburg Investment Management (2012-2013). |
* Officers are elected at least annually by the Trustees for a one-year term and may also be elected from time to time by the Trustees for an interim period. | |||
Janus Investment Fund | 61 |
Janus Henderson Contrarian Fund
Trustees and Officers (unaudited)
OFFICERS | |||
Name, Address, and Age | Positions Held with the Trust | Term of Office* and Length of Time Served | Principal Occupations During the Past Five Years |
Bruce L. Koepfgen | President and Chief Executive Officer | 7/14-Present | Executive Vice President, Head of North America at Janus Henderson Investors and Janus Capital Management LLC (since 2017), Executive Vice President and Director of Janus International Holding LLC (since 2011), Executive Vice President of Janus Distributors LLC (since 2011), Vice President and Director of Intech Investment Management LLC (since 2011), Executive Vice President and Director of Perkins Investment Management LLC (since 2011), and President and Director of Janus Management Holdings Corporation (since 2011). Formerly, President of Janus Capital Group Inc. and Janus Capital Management LLC (2013-2017), Executive Vice President of Janus Services LLC (2011-2015), Janus Capital Group Inc. and Janus Capital Management LLC (2011-2013), and Chief Financial Officer of Janus Capital Group Inc., Janus Capital Management LLC, Janus Distributors LLC, Janus Management Holdings Corporation, and Janus Services LLC (2011-2013). |
Susan K. Wold | Vice President, Chief Compliance Officer, and Anti-Money Laundering Officer | 9/17-Present | Head of Compliance, North America for Janus Henderson (since September 2017). Formerly, Vice President, Head of Global Corporate Compliance, and Chief Compliance Officer for Janus Capital Management LLC (May 2017-September 2017), Vice President, Compliance at Janus Capital Group Inc. and Janus Capital Management LLC (2005-2017). |
* Officers are elected at least annually by the Trustees for a one-year term and may also be elected from time to time by the Trustees for an interim period. | |||
62 | SEPTEMBER 30, 2019 |
Janus Henderson Contrarian Fund
Trustees and Officers (unaudited)
OFFICERS | |||
Name, Address, and Age | Positions Held with the Trust | Term of Office* and Length of Time Served | Principal Occupations During the Past Five Years |
Jesper Nergaard | Chief Financial Officer | 3/05-Present | Vice President of Janus Capital and Janus Services LLC. |
Kathryn L. Santoro | Vice President, Chief Legal Counsel, and Secretary | 12/16-Present | Assistant General Counsel of Janus Capital (since 2016). Formerly, Vice President and Associate Counsel of Curian Capital, LLC and Curian Clearing LLC (2013-2016), and General Counsel and Secretary (2011-2012) and Vice President (2009-2012) of Old Mutual Capital, Inc. |
* Officers are elected at least annually by the Trustees for a one-year term and may also be elected from time to time by the Trustees for an interim period. | |||
Janus Investment Fund | 63 |
Janus Henderson Contrarian Fund
Notes
NotesPage1
64 | SEPTEMBER 30, 2019 |
Janus Henderson Contrarian Fund
Notes
NotesPage1
Janus Investment Fund | 65 |
Knowledge. Shared
At Janus Henderson, we believe in the sharing of expert insight for better investment and business decisions. We call this ethos Knowledge. Shared.
Learn more by visiting janushenderson.com.
| ||||||||
This report is submitted for the general information of shareholders of the Fund. It is not an offer or solicitation for the Fund and is not authorized for distribution to prospective investors unless preceded or accompanied by an effective prospectus. | ||||||||
Janus Henderson, Janus, Henderson, Perkins, Intech and Knowledge. Shared are trademarks of Janus Henderson Group plc or one of its subsidiaries. © Janus Henderson Group plc. Janus Henderson Distributors | ||||||||
125-02-93038 11-19 | ||||||||

ANNUAL REPORT September 30, 2019 | |||
Janus Henderson Emerging Markets Fund | |||
Janus Investment Fund | |||
Beginning on January 1, 2021, as permitted by regulations adopted by the Securities and Exchange Commission, paper copies of the Fund’s shareholder reports will no longer be sent by mail, unless you specifically request paper copies of the reports from the Fund or your plan sponsor, broker-dealer, or financial intermediary, or if you invest directly with the Fund, by contacting a Janus Henderson representative. Instead, the reports will be made available on a website, and you will be notified by mail each time a report is posted and provided with a website link to access the report. If you already elected to receive shareholder reports electronically, you will not be affected by this change and you need not take any action. You may elect to receive shareholder reports and other communications from the Fund electronically by contacting your plan sponsor, broker-dealer, or financial intermediary, or if you invest directly with the Fund, by visiting janushenderson.com/edelivery. You may elect to receive all future reports in paper free of charge. If you do not invest directly with the Fund, you should contact your plan sponsor, broker-dealer, or financial intermediary, to request to continue receiving paper copies of your shareholder reports. If you invest directly with the Fund, you can call 1-800-525-3713 to let the Fund know that you wish to continue receiving paper copies of your shareholder reports. Your election to receive reports in paper will apply to all Janus Henderson mutual funds where held (i.e., all Janus Henderson mutual funds held in your account if you invest through your financial intermediary or all Janus Henderson mutual funds held with the fund complex if you invest directly with a fund).
| |||
HIGHLIGHTS · Portfolio management perspective · Investment strategy behind your fund · Fund performance, characteristics | |||
|

Table of Contents
Janus Henderson Emerging Markets Fund
Janus Henderson Emerging Markets Fund (unaudited)

PERFORMANCE
The Janus Henderson Emerging Markets Fund underperformed its benchmark, the MSCI Emerging Markets IndexSM, for the 12-month period ending September 30, 2019. The Fund’s I shares returned -4.48%, compared with a -2.02% return for the index.
INVESTMENT ENVIRONMENT
Global markets gained slightly during the 12-month period. Appetite for risk and enthusiasm for the emerging-market asset class increased during the period. We are mindful that there are a number of fault lines opening up across the region as well as globally, and that liquidity alone cannot solve these issues. In spite of speculative fervor running high, we ended the period with a number of economic indicators signifying that the global economy is plateauing and suggesting that investors should brace for continued market volatility. External shocks such as Brexit, the 2020 presidential campaign and the U.S.-China trade war impacted sentiment over the period and could present additional headwinds.
PERFORMANCE DISCUSSION
During the 12-month period, exposure to India detracted most at the regional level. Indian telecom company Vodafone Idea was the Fund’s top detractor at the stock level, as the tech service sector came under scrutiny when an American multinational IT services company issued disappointing results. Cipla, a major generic drug maker in India, also produced weak returns. Compania Cervecerias Unidas, a Chilean diversified-beverages company, and Shoprite Holdings, a food retailer and wholesaler operating in South Africa, also detracted from performance.
The Fund’s Brazilian exposure contributed to performance, with Duratex, a company that manufactures and sells reconstituted wood panels and laminated floors as well as bathroom fixtures and fittings, aiding returns, as well as Banco Bradesco, a Brazilian private-sector bank. The Fund benefited from rising commodity prices with its holdings in Australia-based gold-mining company Newcrest Mining, the biggest contributor to the Fund’s performance.
OUTLOOK
There is considerable investment appetite for loss, creating “unicorns” and initial public offerings (IPOs) in both Asian and broader global equity markets. Such conditions can be a breeding ground for increased investment risk over a sensible time-horizon. It also suggests that it is a time for caution.
We see a number of risks across the region within banking systems, that loose monetary policy may not be able to fix. Against a policy backdrop that has been focused on deleveraging, there is a risk of large and cash-rich private corporations being required to perform “national service” rather than focus on profitable growth and returning profits to shareholders. Signs of stress are becoming more visible, yet valuations in many parts of our universe do not appear to reflect this. Outside of Asia, particularly in Africa, valuations look more reasonable, as long as one is prepared to take a long-term view. We believe that as headwinds abate, many good-quality African businesses should return to growth and current valuations don’t appear to reflect this.
Janus Investment Fund | 1 |
Janus Henderson Emerging Markets Fund (unaudited)
Fund At A Glance
September 30, 2019
5 Top Performers - Holdings |
|
|
| 5 Bottom Performers - Holdings |
| |
Contribution | Contribution | |||||
Newcrest Mining Ltd | 2.28% | Vodafone Idea Ltd | -0.97% | |||
Duratex SA | 0.77% | Cipla Ltd | -0.82% | |||
Banco Bradesco SA | 0.54% | Shoprite Holdings Ltd | -0.79% | |||
Merida Industry Co Ltd | 0.50% | Grasim Industries Ltd | -0.74% | |||
China Resources Beer Holdings Co Ltd | 0.46% | Cia Cervecerias Unidas SA (ADR) | -0.51% | |||
5 Top Performers - Sectors* |
|
|
|
|
| |
Fund | Fund Weighting | MSCI Emerging Markets Index | ||||
Contribution | (Average % of Equity) | Weighting | ||||
Materials | 2.72% | 10.15% | 7.44% | |||
Utilities | 0.33% | 4.17% | 2.65% | |||
Other** | 0.28% | 5.48% | 0.00% | |||
Information Technology | -0.10% | 10.01% | 14.46% | |||
Industrials | -0.24% | 5.17% | 5.40% | |||
5 Bottom Performers - Sectors* |
|
|
|
|
| |
Fund | Fund Weighting | MSCI Emerging Markets Index | ||||
Contribution | (Average % of Equity) | Weighting | ||||
Consumer Staples | -1.06% | 39.02% | 6.61% | |||
Financials | -1.02% | 14.11% | 24.63% | |||
Communication Services | -0.67% | 0.93% | 12.82% | |||
Consumer Discretionary | -0.43% | 6.12% | 12.23% | |||
Real Estate | -0.28% | 0.03% | 2.99% | |||
Security contribution to performance is measured by using an algorithm that multiplies the daily performance of each security with the previous day’s ending weight in the portfolio and is gross of advisory fees. Fixed income securities and certain equity securities, such as private placements and some share classes of equity securities, are excluded. | ||||||
* | Based on sector classification according to the Global Industry Classification Standard (“GICS”) codes, which are the exclusive property and a service mark of MSCI Inc. and Standard & Poor’s. | |||||
** | Not a GICS classified sector. | |||||
2 | SEPTEMBER 30, 2019 |
Janus Henderson Emerging Markets Fund (unaudited)
Fund At A Glance
September 30, 2019
5 Largest Equity Holdings - (% of Net Assets) | |
Tencent Holdings Ltd | |
Interactive Media & Services | 6.7% |
Samsung Electronics Co Ltd | |
Technology Hardware, Storage & Peripherals | 5.7% |
Alibaba Group Holding Ltd (ADR) | |
Internet & Direct Marketing Retail | 5.6% |
Taiwan Semiconductor Manufacturing Co Ltd | |
Semiconductor & Semiconductor Equipment | 5.3% |
Ping An Insurance Group Co of China Ltd | |
Insurance | 3.3% |
26.6% | |
Asset Allocation - (% of Net Assets) | |||||
Common Stocks | 91.6% | ||||
Investment Companies | 4.1% | ||||
Preferred Stocks | 1.1% | ||||
Other | 3.2% | ||||
100.0% | |||||
Emerging markets comprised 83.6% of total net assets.
Top Country Allocations - Long Positions - (% of Investment Securities) | |
As of September 30, 2019
| As of September 30, 2018
|
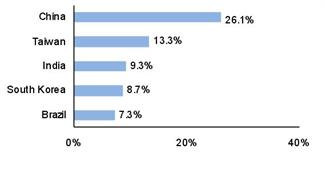
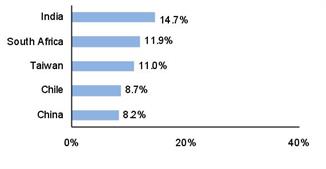
Janus Investment Fund | 3 |
Janus Henderson Emerging Markets Fund (unaudited)
Performance
See important disclosures on the next page. |
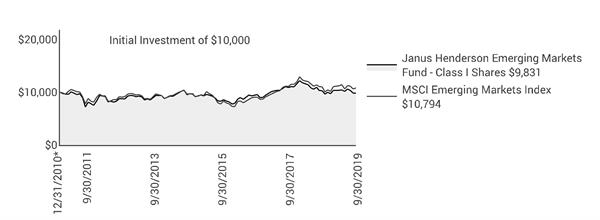
| |||||||||
Average Annual Total Return - for the periods ended September 30, 2019 |
|
| Expense Ratios | ||||||
|
| One | Five | Since |
|
| Total Annual Fund | Net Annual Fund | |
Class A Shares at NAV |
| -4.66% | 0.40% | -0.44% |
|
| 1.52% | 1.33% | |
Class A Shares at MOP |
| -10.16% | -0.78% | -1.11% |
|
|
|
| |
Class C Shares at NAV | -5.48% | -0.36% | -1.19% |
|
| 2.29% | 2.10% | ||
Class C Shares at CDSC |
| -6.41% | -0.36% | -1.19% |
|
|
|
| |
Class D Shares(1) |
| -4.59% | 0.45% | -0.44% |
|
| 1.39% | 1.17% | |
Class I Shares |
| -4.48% | 0.65% | -0.19% |
|
| 1.27% | 1.10% | |
Class N Shares |
| -4.43% | 0.63% | -0.33% |
|
| 1.21% | 1.04% | |
Class S Shares |
| -4.49% | 0.26% | -0.70% |
|
| 1.86% | 1.54% | |
Class T Shares |
| -4.66% | 0.39% | -0.51% |
|
| 1.46% | 1.29% | |
MSCI Emerging Markets Index |
| -2.02% | 2.33% | 0.88% |
|
|
|
| |
Morningstar Quartile - Class I Shares |
| 4th | 3rd | 4th |
|
|
|
| |
Morningstar Ranking - based on total returns for Diversified Emerging Markets Funds |
| 736/852 | 495/663 | 325/408 |
|
|
|
| |
Returns quoted are past performance and do not guarantee future results; current performance may be lower or higher. Investment returns and principal value will vary; there may be a gain or loss when shares are sold. For the most recent month-end performance call 800.668.0434 (or 800.525.3713 if you hold shares directly with Janus Henderson) or visit janushenderson.com/performance (or janushenderson.com/allfunds if you hold shares directly with Janus Henderson).
Maximum Offering Price (MOP) returns include the maximum sales charge of 5.75%. Net Asset Value (NAV) returns exclude this charge, which would have reduced returns.
CDSC returns include a 1% contingent deferred sales charge (CDSC) on Shares redeemed within 12 months of purchase. Net Asset Value (NAV) returns exclude this charge, which would have reduced returns.
Net expense ratios reflect the expense waiver, if any, contractually agreed to through February 1, 2020.
Performance may be affected by risks that include those associated with non-diversification, portfolio turnover, short sales, potential conflicts of interest, foreign and emerging markets, initial public offerings (IPOs), high-yield and high-risk securities, undervalued, overlooked and smaller capitalization companies, real estate related securities including Real Estate Investment Trusts (REITs), derivatives, and commodity-linked investments. Each product
4 | SEPTEMBER 30, 2019 |
Janus Henderson Emerging Markets Fund (unaudited)
Performance
has different risks. Please see the prospectus for more information about risks, holdings and other details.
The Fund will normally invest at least 80% of its net assets, measured at the time of purchase, in the type of securities described by its name.
Returns include reinvestment of all dividends and distributions and do not reflect the deduction of taxes that a shareholder would pay on Fund distributions or redemptions of Fund shares. The returns do not include adjustments in accordance with generally accepted accounting principles required at the period end for financial reporting purposes.
Returns of the Fund shown prior to June 5, 2017 are those for Henderson Emerging Markets Fund (the “Predecessor Fund”), which merged into the Fund after the close of business on June 2, 2017. The Predecessor Fund was advised by Henderson Global Investors (North America) Inc. and subadvised by Henderson Investment Management Limited. Class A Shares, Class C Shares, Class I Shares, and Class R6 Shares of the Predecessor Fund were reorganized into Class A Shares, Class C Shares, Class I Shares, and Class N Shares, respectively, of the Fund. In connection with this reorganization, certain shareholders of the Predecessor Fund who held shares directly with the Predecessor Fund and not through an intermediary had the Class A Shares, Class C Shares, Class I Shares, and Class N Shares of the Fund received in the reorganization automatically exchanged for Class D Shares of the Fund following the reorganization. Class A Shares, Class C Shares and Class I Shares of the Predecessor Fund commenced operations with the Predecessor Fund’s inception on December 31, 2010. Class R6 Shares of the Predecessor Fund commenced operations on November 30, 2015. Class D Shares, Class S Shares, and Class T Shares commenced operations on June 5, 2017.
Performance of Class A Shares shown for periods prior to June 5, 2017, reflects the performance of Class A Shares of the Predecessor Fund, calculated using the fees and expenses of Class A Shares of the Predecessor Fund, in effect during the periods shown, net of any applicable fee and expense limitations or waivers.
Performance of Class C Shares shown for periods prior to June 5, 2017, reflects the performance of Class C Shares of the Predecessor Fund, calculated using the fees and expenses of Class C Shares of the Predecessor Fund, in effect during the periods shown, net of any applicable fee and expense limitations or waivers.
Performance of Class I Shares shown for periods prior to June 5, 2017, reflects the performance of Class I Shares of the Predecessor Fund, calculated using the fees and expenses of Class I Shares of the Predecessor Fund, in effect during the periods shown, net of any applicable fee and expense limitations or waivers.
Performance of Class N Shares shown for periods prior to June 5, 2017, reflects the performance of Class R6 Shares of the Predecessor Fund, calculated using the fees and expenses of Class R6 Shares of the Predecessor Fund, in effect during the periods shown, net of any applicable fee and expense limitations or waivers, except that for periods prior to November 30, 2015, performance for Class N Shares reflects the performance of Class I Shares of the Predecessor Fund, calculated using the estimated fees and expenses of Class N Shares, net of any applicable fee and expense limitations or waivers.
Performance of Class S Shares shown for periods prior to June 5, 2017, reflects the performance of Class I Shares of the Predecessor Fund, calculated using the estimated fees and expenses of Class S Shares, net of any applicable fee and expense limitations or waivers.
Performance of Class T Shares shown for periods prior to June 5, 2017, reflects the performance of Class I Shares of the Predecessor Fund, calculated using the estimated fees and expenses of Class T Shares, net of any applicable fee and expense limitations or waivers.
Performance of Class D Shares shown for periods prior to June 5, 2017, reflects the performance of Class I Shares of the Predecessor Fund, calculated using the estimated fees and expenses of Class D Shares, net of any applicable fee and expense limitations or waivers.
If each share class of the Fund had been available during periods prior to its commencement, the performance shown may have been different. The performance shown for periods following the Fund’s commencement of each share class reflects the fees and expenses of each respective share class, net of any applicable fee and expense limitations or waivers. Please refer to the Fund’s prospectuses for further details concerning historical performance.
Ranking is for the share class shown only; other classes may have different performance characteristics. When an expense waiver is in effect, it may have a material effect on the total return, and therefore the ranking for the period.
© 2019 Morningstar, Inc. All Rights Reserved.
There is no assurance that the investment process will consistently lead to successful investing.
See Notes to Schedule of Investments and Other Information for index definitions.
Index performance does not reflect the expenses of managing a portfolio as an index is unmanaged and not available for direct investment.
See “Useful Information About Your Fund Report.”
Effective on or about April 19, 2019, Glen Finegan is removed and Stephen Deane is added as Co-Portfolio Manager of the Fund.
Effective on or about September 16, 2019, Stephen Deane and Michael Cahoon are removed as Co-Portfolio Managers, and Daniel Graña is Portfolio Manager of the Fund.
*The Predecessor Fund’s inception date – December 31, 2010
‡ As stated in the prospectus. See Financial Highlights for actual expense ratios during the reporting period.
(1) Closed to certain new investors.
Janus Investment Fund | 5 |
Janus Henderson Emerging Markets Fund (unaudited)
Expense Examples
As a shareholder of the Fund, you incur two types of costs: (1) transaction costs, such as sales charges (loads) on purchase payments (applicable to Class A Shares only); and (2) ongoing costs, including management fees; 12b-1 distribution and shareholder servicing fees; transfer agent fees and expenses payable pursuant to the Transfer Agency Agreement; and other Fund expenses. This example is intended to help you understand your ongoing costs (in dollars) of investing in the Fund and to compare these costs with the ongoing costs of investing in other mutual funds. To do so, compare this 5% hypothetical example with the 5% hypothetical examples that appear in the shareholder reports of the other funds. The example is based upon an investment of $1,000 invested at the beginning of the period and held for the six-months indicated, unless noted otherwise in the table and footnotes below.
Actual Expenses
The information in the table under the heading “Actual” provides information about actual account values and actual expenses. You may use the information in these columns, together with the amount you invested, to estimate the expenses that you paid over the period. Simply divide your account value by $1,000 (for example, an $8,600 account value divided by $1,000 = 8.6), then multiply the result by the number in the appropriate column for your share class under the heading entitled “Expenses Paid During Period” to estimate the expenses you paid on your account during the period.
Hypothetical Example for Comparison Purposes
The information in the table under the heading “Hypothetical (5% return before expenses)” provides information about hypothetical account values and hypothetical expenses based upon the Fund’s actual expense ratio and an assumed rate of return of 5% per year before expenses, which is not the Fund’s actual return. The hypothetical account values and expenses may not be used to estimate the actual ending account balance or expenses you paid for the period. You may use this information to compare the ongoing costs of investing in the Fund and other funds. To do so, compare this 5% hypothetical example with the 5% hypothetical examples that appear in the shareholder reports of the other funds. Additionally, for an analysis of the fees associated with an investment in any share class or other similar funds, please visit www.finra.org/fundanalyzer.
Please note that the expenses shown in the table are meant to highlight your ongoing costs only and do not reflect any transaction costs. These fees are fully described in the Fund’s prospectuses. Therefore, the hypothetical examples are useful in comparing ongoing costs only, and will not help you determine the relative total costs of owning different funds. In addition, if these transaction costs were included, your costs would have been higher.
Actual | Hypothetical | |||||||||
| Beginning | Ending | Expenses |
| Beginning | Ending | Expenses | Net Annualized | ||
Class A Shares | $1,000.00 | $949.90 | $5.72 |
| $1,000.00 | $1,019.20 | $5.92 | 1.17% | ||
Class C Shares | $1,000.00 | $945.00 | $9.95 |
| $1,000.00 | $1,014.84 | $10.30 | 2.04% | ||
Class D Shares | $1,000.00 | $949.20 | $5.47 |
| $1,000.00 | $1,019.45 | $5.67 | 1.12% | ||
Class I Shares | $1,000.00 | $950.20 | $5.43 |
| $1,000.00 | $1,019.50 | $5.62 | 1.11% | ||
Class N Shares | $1,000.00 | $950.30 | $4.69 |
| $1,000.00 | $1,020.26 | $4.86 | 0.96% | ||
Class S Shares | $1,000.00 | $949.40 | $3.62 |
| $1,000.00 | $1,021.36 | $3.75 | 0.74% | ||
Class T Shares | $1,000.00 | $950.20 | $5.92 |
| $1,000.00 | $1,019.00 | $6.12 | 1.21% | ||
† | Expenses Paid During Period are equal to the Net Annualized Expense Ratio multiplied by the average account value over the period, multiplied by 183/365 (to reflect the one-half year period). Expenses in the examples include the effect of applicable fee waivers and/or expense reimbursements, if any. Had such waivers and/or reimbursements not been in effect, your expenses would have been higher. Please refer to the Notes to Financial Statements or the Fund’s prospectuses for more information regarding waivers and/or reimbursements. | |||||||||
6 | SEPTEMBER 30, 2019 |
Janus Henderson Emerging Markets Fund
Schedule of Investments
September 30, 2019
| Value | ||||||
Common Stocks – 91.6% | |||||||
Automobiles – 1.2% | |||||||
Maruti Suzuki India Ltd | 9,439 | $894,571 | |||||
Banks – 7.2% | |||||||
Abu Dhabi Commercial Bank PJSC | 442,712 | 947,429 | |||||
Banco Bradesco SA | 110,540 | 831,458 | |||||
Bank Tabungan Pensiunan Nasional Syariah Tbk PT* | 3,405,100 | 791,884 | |||||
Commercial International Bank Egypt SAE | 385,133 | 1,773,537 | |||||
HDFC Bank Ltd | 55,429 | 960,134 | |||||
5,304,442 | |||||||
Beverages – 4.7% | |||||||
Fomento Economico Mexicano SAB de CV (ADR) | 14,572 | 1,334,504 | |||||
Guinness Nigeria PLC | 1,453,938 | 136,305 | |||||
Heineken Holding NV | 19,540 | 1,945,269 | |||||
3,416,078 | |||||||
Building Products – 0.9% | |||||||
China Lesso Group Holdings Ltd | 686,000 | 649,457 | |||||
Chemicals – 0.9% | |||||||
UPL Ltd | 75,453 | 643,085 | |||||
Commercial Services & Supplies – 2.8% | |||||||
A-Living Services Co Ltd (144A) | 328,500 | 757,803 | |||||
Sunny Friend Environmental Technology Co Ltd | 150,000 | 1,310,402 | |||||
2,068,205 | |||||||
Construction & Engineering – 1.9% | |||||||
Samsung Engineering Co Ltd* | 44,115 | 619,676 | |||||
Wijaya Karya Persero Tbk PT | 5,589,400 | 758,252 | |||||
1,377,928 | |||||||
Construction Materials – 0.8% | |||||||
Grasim Industries Ltd | 54,464 | 561,155 | |||||
Containers & Packaging – 0% | |||||||
Nampak Ltd* | 60,691 | 38,048 | |||||
Diversified Consumer Services – 1.0% | |||||||
Fu Shou Yuan International Group Ltd | 855,000 | 756,000 | |||||
Diversified Financial Services – 1.4% | |||||||
Chailease Holding Co Ltd | 265,000 | 1,067,043 | |||||
Electrical Equipment – 1.8% | |||||||
KEI Industries Ltd | 103,927 | 796,964 | |||||
Voltronic Power Technology Corp | 27,000 | 555,607 | |||||
1,352,571 | |||||||
Entertainment – 1.1% | |||||||
NetEase Inc (ADR) | 2,910 | 774,584 | |||||
Food & Staples Retailing – 4.5% | |||||||
CP ALL PCL (NVDR) | 371,900 | 988,125 | |||||
Jeronimo Martins SGPS SA | 45,627 | 769,732 | |||||
Shoprite Holdings Ltd | 92,648 | 750,609 | |||||
X5 Retail Group NV (GDR) (REG) | 22,013 | 770,015 | |||||
3,278,481 | |||||||
Hotels, Restaurants & Leisure – 0.8% | |||||||
Sands China Ltd | 132,400 | 599,706 | |||||
Household Durables – 1.2% | |||||||
Haier Smart Home Co Ltd | 421,195 | 902,649 | |||||
Information Technology Services – 2.8% | |||||||
Infosys Ltd | 121,845 | 1,385,304 | |||||
Pagseguro Digital Ltd* | 14,205 | 657,833 | |||||
2,043,137 | |||||||
Insurance – 5.7% | |||||||
AIA Group Ltd | 81,200 | 767,191 | |||||
IRB Brasil Resseguros S/A | 105,394 | 955,360 | |||||
Ping An Insurance Group Co of China Ltd | 213,500 | 2,453,037 | |||||
4,175,588 | |||||||
See Notes to Schedule of Investments and Other Information and Notes to Financial Statements. | |
Janus Investment Fund | 7 |
Janus Henderson Emerging Markets Fund
Schedule of Investments
September 30, 2019
| Value | ||||||
Common Stocks – (continued) | |||||||
Interactive Media & Services – 8.0% | |||||||
Tencent Holdings Ltd | 117,500 | $4,950,367 | |||||
Yandex NV* | 25,365 | 888,029 | |||||
5,838,396 | |||||||
Internet & Direct Marketing Retail – 8.8% | |||||||
Alibaba Group Holding Ltd (ADR)* | 24,441 | 4,087,268 | |||||
MercadoLibre Inc* | 1,146 | 631,710 | |||||
Naspers Ltd | 11,309 | 1,714,597 | |||||
6,433,575 | |||||||
Machinery – 2.1% | |||||||
China Conch Venture Holdings Ltd | 210,500 | 778,884 | |||||
Zhengzhou Yutong Bus Co Ltd | 383,734 | 747,118 | |||||
1,526,002 | |||||||
Metals & Mining – 0.9% | |||||||
Ivanhoe Mines Ltd* | 242,821 | 630,561 | |||||
Multiline Retail – 1.3% | |||||||
Poya International Co Ltd | 65,000 | 922,951 | |||||
Oil, Gas & Consumable Fuels – 6.4% | |||||||
CNOOC Ltd | 722,000 | 1,101,770 | |||||
Geopark Ltd* | 40,342 | 742,696 | |||||
LUKOIL PJSC (ADR) | 18,204 | 1,506,199 | |||||
Petroleo Brasileiro SA (ADR) | 93,814 | 1,357,489 | |||||
4,708,154 | |||||||
Personal Products – 4.3% | |||||||
LG Household & Health Care Ltd | 1,256 | 1,372,568 | |||||
Unilever PLC | 29,573 | 1,777,717 | |||||
3,150,285 | |||||||
Pharmaceuticals – 0.7% | |||||||
Mega Lifesciences PCL | 527,200 | 538,751 | |||||
Real Estate Management & Development – 2.0% | |||||||
Ayala Land Inc | 903,700 | 862,535 | |||||
Logan Property Holdings Co Ltd | 420,000 | 598,048 | |||||
1,460,583 | |||||||
Semiconductor & Semiconductor Equipment – 7.6% | |||||||
MediaTek Inc | 64,000 | 758,803 | |||||
Sino-American Silicon Products Inc | 369,000 | 976,645 | |||||
Taiwan Semiconductor Manufacturing Co Ltd | 440,000 | 3,853,532 | |||||
5,588,980 | |||||||
Specialty Retail – 1.1% | |||||||
Wilcon Depot Inc | 2,500,300 | 796,274 | |||||
Technology Hardware, Storage & Peripherals – 5.7% | |||||||
Samsung Electronics Co Ltd | 102,693 | 4,211,615 | |||||
Thrifts & Mortgage Finance – 1.8% | |||||||
Housing Development Finance Corp Ltd | 48,689 | 1,358,437 | |||||
Wireless Telecommunication Services – 0.2% | |||||||
Safaricom PLC | 593,774 | 157,386 | |||||
Total Common Stocks (cost $64,511,500) | 67,224,678 | ||||||
Preferred Stocks – 1.1% | |||||||
Electric Utilities – 1.1% | |||||||
Cia Paranaense de Energia | 64,529 | 770,540 | |||||
Oil, Gas & Consumable Fuels – 0% | |||||||
International Petroleum Ltd¢ | 955,965 | 0 | |||||
Total Preferred Stocks (cost $1,005,209) | 770,540 | ||||||
See Notes to Schedule of Investments and Other Information and Notes to Financial Statements. | |
8 | SEPTEMBER 30, 2019 |
Janus Henderson Emerging Markets Fund
Schedule of Investments
September 30, 2019
| Value | ||||||
Investment Companies – 4.1% | |||||||
Money Markets – 4.1% | |||||||
Fidelity Investments Money Market Treasury Portfolio, 1.8200%ºº (cost $3,015,331) | 3,015,331 | $3,015,331 | |||||
Total Investments (total cost $68,532,040) – 96.8% | 71,010,549 | ||||||
Cash, Receivables and Other Assets, net of Liabilities – 3.2% | 2,351,502 | ||||||
Net Assets – 100% | $73,362,051 | ||||||
Summary of Investments by Country - (Long Positions) (unaudited) | |||||
% of | |||||
Investment | |||||
Country | Value | Securities | |||
China | $18,556,985 | 26.1 | % | ||
Taiwan | 9,444,983 | 13.3 | |||
India | 6,599,650 | 9.3 | |||
South Korea | 6,203,859 | 8.7 | |||
Brazil | 5,204,390 | 7.3 | |||
Russia | 3,164,243 | 4.5 | |||
United States | 3,015,331 | 4.3 | |||
South Africa | 2,503,254 | 3.5 | |||
Netherlands | 1,945,269 | 2.7 | |||
United Kingdom | 1,777,717 | 2.5 | |||
Egypt | 1,773,537 | 2.5 | |||
Philippines | 1,658,809 | 2.3 | |||
Indonesia | 1,550,136 | 2.2 | |||
Thailand | 1,526,876 | 2.2 | |||
Hong Kong | 1,366,897 | 1.9 | |||
Mexico | 1,334,504 | 1.9 | |||
United Arab Emirates | 947,429 | 1.3 | |||
Portugal | 769,732 | 1.1 | |||
Chile | 742,696 | 1.1 | |||
Canada | 630,561 | 0.9 | |||
Kenya | 157,386 | 0.2 | |||
Nigeria | 136,305 | 0.2 | |||
Total | $71,010,549 | 100.0 | % |
See Notes to Schedule of Investments and Other Information and Notes to Financial Statements. | |
Janus Investment Fund | 9 |
Janus Henderson Emerging Markets Fund
Schedule of Investments
September 30, 2019
Schedules of Affiliated Investments – (% of Net Assets)
Dividend Income | Realized Gain/(Loss) | Change in Unrealized Appreciation/ Depreciation | Value at 9/30/19 | |||||||
Common Stocks - N/A | ||||||||||
Wireless Telecommunication Services - N/A | ||||||||||
Vodafone Idea Ltd | $ | - | $ | (2,932,212) | $ | 1,711,977 | $ | - | ||
Share Balance at 9/30/18 | Purchases | Sales | Share Balance at 9/30/19 | |||||||
Common Stocks - N/A | ||||||||||
Wireless Telecommunication Services - N/A | ||||||||||
Vodafone Idea Ltd | 2,185,834 | 8,586,420Ð | (10,772,254)Ð | - | ||||||
See Notes to Schedule of Investments and Other Information and Notes to Financial Statements. | |
10 | SEPTEMBER 30, 2019 |
Janus Henderson Emerging Markets Fund
Notes to Schedule of Investments and Other Information
MSCI Emerging Markets IndexSM | MSCI Emerging Markets IndexSM reflects the equity market performance of emerging markets. |
ADR | American Depositary Receipt |
GDR | Global Depositary Receipt |
NVDR | Non-Voting Depositary Receipt |
PJSC | Private Joint Stock Company |
PLC | Public Limited Company |
REG | Registered |
144A | Securities sold under Rule 144A of the Securities Act of 1933, as amended, are subject to legal and/or contractual restrictions on resale and may not be publicly sold without registration under the 1933 Act. Unless otherwise noted, these securities have been determined to be liquid under guidelines established by the Board of Trustees. The total value of 144A securities as of the year ended September 30, 2019 is $757,803, which represents 1.0% of net assets. |
* | Non-income producing security. |
ºº | Rate shown is the 7-day yield as of September 30, 2019. |
¢ | Security is valued using significant unobservable inputs. |
Ð | All or a portion is the result of a corporate action. |
The following is a summary of the inputs that were used to value the Fund’s investments in securities and other financial instruments as of September 30, 2019. See Notes to Financial Statements for more information. | ||||||||||||
Valuation Inputs Summary | ||||||||||||
Level 2 - | Level 3 - | |||||||||||
Level 1 - | Other Significant | Significant | ||||||||||
Quoted Prices | Observable Inputs | Unobservable Inputs | ||||||||||
Assets | ||||||||||||
Investments In Securities: | ||||||||||||
Common Stocks | ||||||||||||
Commercial Services & Supplies | $ | 757,803 | $ | 1,310,402 | $ | - | ||||||
Diversified Financial Services | - | 1,067,043 | - | |||||||||
Electrical Equipment | 796,964 | 555,607 | - | |||||||||
Household Durables | - | 902,649 | - | |||||||||
Machinery | 778,884 | 747,118 | - | |||||||||
Multiline Retail | - | 922,951 | - | |||||||||
Pharmaceuticals | - | 538,751 | - | |||||||||
Semiconductor & Semiconductor Equipment | - | 5,588,980 | - | |||||||||
All Other | 53,257,526 | - | - | |||||||||
Preferred Stocks | - | 770,540 | 0 | |||||||||
Investment Companies | 3,015,331 | - | - | |||||||||
Total Assets | $ | 58,606,508 | $ | 12,404,041 | $ | 0 | ||||||
Janus Investment Fund | 11 |
Janus Henderson Emerging Markets Fund
Statement of Assets and Liabilities
September 30, 2019
See footnotes at the end of the Statement. |
|
|
|
|
|
|
|
Assets: | ||||||
Investments, at value(1) | $ | 71,010,549 | ||||
Cash denominated in foreign currency(2) | 2,560,510 | |||||
Non-interested Trustees' deferred compensation | 1,895 | |||||
Receivables: | ||||||
Investments sold | 3,725,394 | |||||
Dividends | 179,937 | |||||
Foreign tax reclaims | 160,505 | |||||
Fund shares sold | 116,117 | |||||
Other assets | 12,898 | |||||
Total Assets |
|
| 77,767,805 |
| ||
Liabilities: | ||||||
Payables: | — | |||||
Investments purchased | 4,155,318 | |||||
Fund shares repurchased | 76,350 | |||||
Professional fees | 58,044 | |||||
Custodian fees | 46,589 | |||||
Transfer agent fees and expenses | 12,481 | |||||
12b-1 Distribution and shareholder servicing fees | 3,962 | |||||
Advisory fees | 3,324 | |||||
Non-interested Trustees' deferred compensation fees | 1,895 | |||||
Non-interested Trustees' fees and expenses | 829 | |||||
Affiliated fund administration fees payable | 159 | |||||
Accrued expenses and other payables | 46,803 | |||||
Total Liabilities |
|
| 4,405,754 |
| ||
Net Assets |
| $ | 73,362,051 |
| ||
See Notes to Financial Statements. | |
12 | SEPTEMBER 30, 2019 |
Janus Henderson Emerging Markets Fund
Statement of Assets and Liabilities
September 30, 2019
|
|
|
|
|
|
|
Net Assets Consist of: | ||||||
Capital (par value and paid-in surplus) | $ | 81,136,264 | ||||
Total distributable earnings (loss)(3) | (7,774,213) | |||||
Total Net Assets |
| $ | 73,362,051 |
| ||
Net Assets - Class A Shares | $ | 4,858,922 | ||||
Shares Outstanding, $0.01 Par Value (unlimited shares authorized) | 557,417 | |||||
Net Asset Value Per Share(4) |
| $ | 8.72 |
| ||
Maximum Offering Price Per Share(5) |
| $ | 9.25 |
| ||
Net Assets - Class C Shares | $ | 3,432,015 | ||||
Shares Outstanding, $0.01 Par Value (unlimited shares authorized) | 407,587 | |||||
Net Asset Value Per Share(4) |
| $ | 8.42 |
| ||
Net Assets - Class D Shares | $ | 10,956,693 | ||||
Shares Outstanding, $0.01 Par Value (unlimited shares authorized) | 1,247,304 | |||||
Net Asset Value Per Share |
| $ | 8.78 |
| ||
Net Assets - Class I Shares | $ | 34,499,164 | ||||
Shares Outstanding, $0.01 Par Value (unlimited shares authorized) | 3,929,065 | |||||
Net Asset Value Per Share |
| $ | 8.78 |
| ||
Net Assets - Class N Shares | $ | 16,530,762 | ||||
Shares Outstanding, $0.01 Par Value (unlimited shares authorized) | 1,880,730 | |||||
Net Asset Value Per Share |
| $ | 8.79 |
| ||
Net Assets - Class S Shares | $ | 76,569 | ||||
Shares Outstanding, $0.01 Par Value (unlimited shares authorized) | 8,694 | |||||
Net Asset Value Per Share |
| $ | 8.81 |
| ||
Net Assets - Class T Shares | $ | 3,007,926 | ||||
Shares Outstanding, $0.01 Par Value (unlimited shares authorized) | 342,697 | |||||
Net Asset Value Per Share |
| $ | 8.78 |
| ||
(1) Includes cost of $68,532,040. (2) Includes cost of $2,560,510. (3) Includes $157,135 of foreign capital gains tax on investments. (4) Redemption price per share may be reduced for any applicable contingent deferred sales charge. (5) Maximum offering price is computed at 100/94.25 of net asset value. |
See Notes to Financial Statements. | |
Janus Investment Fund | 13 |
Janus Henderson Emerging Markets Fund
Statement of Operations
For the year ended September 30, 2019
See footnotes at the end of the Statement. |
|
|
|
|
|
|
Investment Income: | |||||
| Dividends | $ | 3,557,859 | ||
Interest | 29,108 | ||||
Other income | 78,550 | ||||
Foreign tax withheld | (425,691) | ||||
Total Investment Income |
| 3,239,826 |
| ||
Expenses: | |||||
Advisory fees | 1,232,554 | ||||
12b-1 Distribution and shareholder servicing fees: | |||||
Class A Shares | 22,210 | ||||
Class C Shares | 45,578 | ||||
Class S Shares | 1,108 | ||||
Transfer agent administrative fees and expenses: | |||||
Class D Shares | 14,776 | ||||
Class S Shares | 1,219 | ||||
Class T Shares | 10,114 | ||||
Transfer agent networking and omnibus fees: | |||||
Class A Shares | 5,483 | ||||
Class C Shares | 3,652 | ||||
Class I Shares | 46,461 | ||||
Other transfer agent fees and expenses: | |||||
Class A Shares | 1,044 | ||||
Class C Shares | 556 | ||||
Class D Shares | 5,961 | ||||
Class I Shares | 4,450 | ||||
Class N Shares | 919 | ||||
Class S Shares | 18 | ||||
Class T Shares | 131 | ||||
Professional fees | 123,322 | ||||
Registration fees | 120,908 | ||||
Custodian fees | 116,296 | ||||
Non-affiliated fund administration fees | 75,419 | ||||
Shareholder reports expense | 44,260 | ||||
Non-interested Trustees’ fees and expenses | 3,560 | ||||
Affiliated fund administration fees | 2,846 | ||||
Other expenses | 25,217 | ||||
Total Expenses |
| 1,908,062 |
| ||
Less: Excess Expense Reimbursement and Waivers |
| (462,646) |
| ||
Net Expenses |
| 1,445,416 |
| ||
Net Investment Income/(Loss) |
| 1,794,410 |
| ||
See Notes to Financial Statements. | |
14 | SEPTEMBER 30, 2019 |
Janus Henderson Emerging Markets Fund
Statement of Operations
For the year ended September 30, 2019
|
|
|
|
|
|
Net Realized Gain/(Loss) on Investments: | |||||
Investments and foreign currency transactions(1) | $ | (7,185,672) | |||
Investments in affiliates | (2,932,212) | ||||
Net payments from affiliates (Note 3) | 228,182 | ||||
Total Net Realized Gain/(Loss) on Investments |
| (9,889,702) |
| ||
Change in Unrealized Net Appreciation/Depreciation: | |||||
Investments, foreign currency translations and non-interested Trustees’ deferred compensation(2) | 1,199,963 | ||||
Investments in affiliates | 1,711,977 | ||||
Total Change in Unrealized Net Appreciation/Depreciation |
| 2,911,940 |
| ||
Net Increase/(Decrease) in Net Assets Resulting from Operations | $ | (5,183,352) |
| ||
(1) Includes realized foreign capital gains tax on investments of $(178,063). (2) Includes change in unrealized appreciation/depreciation of $273,603 due to foreign capital gains tax on investments. |
See Notes to Financial Statements. | |
Janus Investment Fund | 15 |
Janus Henderson Emerging Markets Fund
Statements of Changes in Net Assets
|
|
| Year ended |
| Year ended | |||
Operations: | ||||||||
Net investment income/(loss) | $ | 1,794,410 | $ | 2,146,633 | ||||
Net realized gain/(loss) on investments | (9,889,702) | 4,021,591 | ||||||
Change in unrealized net appreciation/depreciation | 2,911,940 | (17,308,273) | ||||||
Net Increase/(Decrease) in Net Assets Resulting from Operations |
| (5,183,352) |
|
| (11,140,049) | |||
Dividends and Distributions to Shareholders | ||||||||
Class A Shares | (457,330) | (459,832) | ||||||
Class C Shares | (116,611) | (200,053) | ||||||
Class D Shares | (428,310) | (475,263) | ||||||
Class I Shares | (2,922,779) | (3,741,499) | ||||||
Class N Shares | (815,126) | (902,442) | ||||||
Class S Shares | (13,840) | (9,313) | ||||||
Class T Shares | (146,144) | (237,676) | ||||||
Net Decrease from Dividends and Distributions to Shareholders |
| (4,900,140) |
|
| (6,026,078) | |||
Capital Share Transactions: | ||||||||
Class A Shares | (10,008,606) | 1,667,423 | ||||||
Class C Shares | (2,184,824) | (2,358,097) | ||||||
Class D Shares | (1,182,282) | (1,628,266) | ||||||
Class I Shares | (66,839,075) | 5,040,165 | ||||||
Class N Shares | (7,083,972) | (13,936,642) | ||||||
Class S Shares | (1,596,508) | 1,685,020 | ||||||
Class T Shares | (1,543,913) | (2,295,108) | ||||||
Net Increase/(Decrease) from Capital Share Transactions |
| (90,439,180) |
|
| (11,825,505) | |||
Net Increase/(Decrease) in Net Assets |
| (100,522,672) |
|
| (28,991,632) | |||
Net Assets: | ||||||||
Beginning of period | 173,884,723 | 202,876,355 | ||||||
| End of period | $ | 73,362,051 |
| $ | 173,884,723 | ||
See Notes to Financial Statements. | |
16 | SEPTEMBER 30, 2019 |
Janus Henderson Emerging Markets Fund
Financial Highlights
Class A Shares | ||||||||||||
For a share outstanding during the year or period ended September 30 |
| 2019 |
|
| 2018 |
|
| 2017(1) |
| |||
Net Asset Value, Beginning of Period |
| $9.48 |
|
| $10.36 |
|
| $10.19 |
| |||
Income/(Loss) from Investment Operations: | ||||||||||||
Net investment income/(loss)(2) | 0.10 | 0.10 | 0.04 | |||||||||
Net realized and unrealized gain/(loss) | (0.55) | (0.67) | 0.13 | |||||||||
Total from Investment Operations |
| (0.45) |
|
| (0.57) |
|
| 0.17 |
| |||
Less Dividends and Distributions: | ||||||||||||
Dividends (from net investment income) | (0.13) | (0.10) | — | |||||||||
Distributions (from capital gains) | (0.18) | (0.21) | — | |||||||||
Total Dividends and Distributions |
| (0.31) |
|
| (0.31) |
|
| — |
| |||
Net Asset Value, End of Period | $8.72 | $9.48 | $10.36 | |||||||||
Total Return* |
| (4.66)%(3) |
|
| (5.80)% |
|
| 1.67% |
| |||
Net Assets, End of Period (in thousands) | $4,859 | $15,771 | $15,562 | |||||||||
Average Net Assets for the Period (in thousands) | $8,932 | $16,103 | $15,471 | |||||||||
Ratios to Average Net Assets**: |
|
|
|
|
|
|
|
|
| |||
Ratio of Gross Expenses | 1.65% | 1.51% | 1.75% | |||||||||
Ratio of Net Expenses (After Waivers and Expense Offsets) | 1.30% | 1.33% | 1.46% | |||||||||
Ratio of Net Investment Income/(Loss) | 1.11% | 0.93% | 2.18% | |||||||||
Portfolio Turnover Rate | 68% | 26% | 2% | |||||||||
Class C Shares | ||||||||||||
For a share outstanding during the year or period ended September 30 |
| 2019 |
|
| 2018 |
|
| 2017(1) |
| |||
Net Asset Value, Beginning of Period |
| $9.12 |
|
| $9.98 |
|
| $9.83 |
| |||
Income/(Loss) from Investment Operations: | ||||||||||||
Net investment income/(loss)(2) | 0.05 | 0.01 | 0.02 | |||||||||
Net realized and unrealized gain/(loss) | (0.55) | (0.65) | 0.13 | |||||||||
Total from Investment Operations |
| (0.50) |
|
| (0.64) |
|
| 0.15 |
| |||
Less Dividends and Distributions: | ||||||||||||
Dividends (from net investment income) | (0.02) | (0.01) | — | |||||||||
Distributions (from capital gains) | (0.18) | (0.21) | — | |||||||||
Total Dividends and Distributions |
| (0.20) |
|
| (0.22) |
|
| — |
| |||
Net Asset Value, End of Period | $8.42 | $9.12 | $9.98 | |||||||||
Total Return* |
| (5.38)%(4) |
|
| (6.59)% |
|
| 1.53% |
| |||
Net Assets, End of Period (in thousands) | $3,432 | $5,985 | $9,017 | |||||||||
Average Net Assets for the Period (in thousands) | $4,604 | $8,442 | $8,877 | |||||||||
Ratios to Average Net Assets**: |
|
|
|
|
|
|
|
|
| |||
Ratio of Gross Expenses | 2.54% | 2.26% | 2.65% | |||||||||
Ratio of Net Expenses (After Waivers and Expense Offsets) | 2.11% | 2.07% | 2.35% | |||||||||
Ratio of Net Investment Income/(Loss) | 0.56% | 0.11% | 1.29% | |||||||||
Portfolio Turnover Rate | 68% | 26% | 2% | |||||||||
* Total return includes adjustments in accordance with generally accepted accounting principles required at the year or period end and are not annualized for periods of less than one full year. ** Annualized for periods of less than one full year. (1) Period from August 1, 2017 through September 30, 2017. The Fund changed its fiscal year end from July 31 to September 30. (2) Per share amounts are calculated based on average shares outstanding during the year or period. (3) Total return without the effect of affiliated payments would have been (4.89)%. Please see Note 3 in the Notes to the Financial Statements. (4) Total return without the effect of affiliated payments would have been (5.61)%. Please see Note 3 in the Notes to the Financial Statements. |
See Notes to Financial Statements. | |
Janus Investment Fund | 17 |
Janus Henderson Emerging Markets Fund
Financial Highlights
Class A Shares | ||||||||||||
For a share outstanding during the year ended July 31 |
| 2017 |
|
| 2016 |
|
| 2015 |
| |||
Net Asset Value, Beginning of Period |
| $9.10 |
|
| $8.60 |
|
| $9.82 |
| |||
Income/(Loss) from Investment Operations: | ||||||||||||
Net investment income/(loss)(1) | 0.10 | 0.13 | 0.02 | |||||||||
Net realized and unrealized gain/(loss) | 1.05 | 0.39 | (1.24) | |||||||||
Total from Investment Operations |
| 1.15 |
|
| 0.52 |
|
| (1.22) |
| |||
Less Dividends and Distributions: | ||||||||||||
Dividends (from net investment income) | (0.06) | (0.02) | — | |||||||||
Total Dividends and Distributions |
| (0.06) |
|
| (0.02) |
|
| — |
| |||
Net Asset Value, End of Period | $10.19 | $9.10 | $8.60 | |||||||||
Total Return* |
| 12.80% |
|
| 6.07% |
|
| (12.42)% |
| |||
Net Assets, End of Period (in thousands) | $15,124 | $6,510 | $8,272 | |||||||||
Average Net Assets for the Period (in thousands) | $12,523 | $5,958 | $8,108 | |||||||||
Ratios to Average Net Assets**: |
|
|
|
|
|
|
|
|
| |||
Ratio of Gross Expenses | 1.76% | 2.36%(2) | 2.13% | |||||||||
Ratio of Net Expenses (After Waivers and Expense Offsets) | 1.54% | 1.79% | 1.79% | |||||||||
Ratio of Net Investment Income/(Loss) | 1.05% | 1.64% | 0.21% | |||||||||
Portfolio Turnover Rate | 32% | 86% | 148% | |||||||||
Class C Shares | ||||||||||||
For a share outstanding during the year ended July 31 |
| 2017 |
|
| 2016 |
|
| 2015 |
| |||
Net Asset Value, Beginning of Period |
| $8.79 |
|
| $8.35 |
|
| $9.61 |
| |||
Income/(Loss) from Investment Operations: | ||||||||||||
Net investment income/(loss)(1) | 0.03 | 0.06 | (0.06) | |||||||||
Net realized and unrealized gain/(loss) | 1.02 | 0.38 | (1.20) | |||||||||
Total from Investment Operations |
| 1.05 |
|
| 0.44 |
|
| (1.26) |
| |||
Less Dividends and Distributions: | ||||||||||||
Dividends (from net investment income) | (0.01) | — | — | |||||||||
Total Dividends and Distributions |
| (0.01) |
|
| — |
|
| — |
| |||
Net Asset Value, End of Period | $9.83 | $8.79 | $8.35 | |||||||||
Total Return* |
| 12.03% |
|
| 5.27% |
|
| (13.11)% |
| |||
Net Assets, End of Period (in thousands) | $8,530 | $3,553 | $3,049 | |||||||||
Average Net Assets for the Period (in thousands) | $6,219 | $3,028 | $3,471 | |||||||||
Ratios to Average Net Assets**: |
|
|
|
|
|
|
|
|
| |||
Ratio of Gross Expenses | 2.53% | 3.16%(2) | 2.90% | |||||||||
Ratio of Net Expenses (After Waivers and Expense Offsets) | 2.29% | 2.54% | 2.54% | |||||||||
Ratio of Net Investment Income/(Loss) | 0.37% | 0.70% | (0.62)% | |||||||||
Portfolio Turnover Rate | 32% | 86% | 148% | |||||||||
* Total return not annualized for periods of less than one full year. ** Annualized for periods of less than one full year. (1) Per share amounts are calculated based on average shares outstanding during the year or period. (2) The Ratio of Gross Expenses include a reimbursement of prior period custodian out-of-pocket expenses. The Ratio of Gross Expenses would have been 0.07% higher had the custodian not reimbursed the Fund. |
See Notes to Financial Statements. | |
18 | SEPTEMBER 30, 2019 |
Janus Henderson Emerging Markets Fund
Financial Highlights
Class D Shares | ||||||||||||
For a share outstanding during the year or period ended September 30 |
| 2019 |
|
| 2018 |
|
| 2017(1) |
| |||
Net Asset Value, Beginning of Period |
| $9.53 |
|
| $10.41 |
|
| $10.24 |
| |||
Income/(Loss) from Investment Operations: | ||||||||||||
Net investment income/(loss)(2) | 0.14 | 0.11 | 0.04 | |||||||||
Net realized and unrealized gain/(loss) | (0.59) | (0.67) | 0.13 | |||||||||
Total from Investment Operations |
| (0.45) |
|
| (0.56) |
|
| 0.17 |
| |||
Less Dividends and Distributions: | ||||||||||||
Dividends (from net investment income) | (0.12) | (0.11) | — | |||||||||
Distributions (from capital gains) | (0.18) | (0.21) | — | |||||||||
Total Dividends and Distributions |
| (0.30) |
|
| (0.32) |
|
| — |
| |||
Net Asset Value, End of Period | $8.78 | $9.53 | $10.41 | |||||||||
Total Return* |
| (4.59)%(3) |
|
| (5.64)% |
|
| 1.66% |
| |||
Net Assets, End of Period (in thousands) | $10,957 | $13,104 | $16,053 | |||||||||
Average Net Assets for the Period (in thousands) | $12,337 | $15,607 | $16,501 | |||||||||
Ratios to Average Net Assets**: |
|
|
|
|
|
|
|
|
| |||
Ratio of Gross Expenses | 1.80% | 1.38% | 1.80% | |||||||||
Ratio of Net Expenses (After Waivers and Expense Offsets) | 1.19% | 1.15% | 1.46% | |||||||||
Ratio of Net Investment Income/(Loss) | 1.51% | 1.08% | 2.18% | |||||||||
Portfolio Turnover Rate | 68% | 26% | 2% | |||||||||
Class I Shares | ||||||||||||
For a share outstanding during the year or period ended September 30 |
| 2019 |
|
| 2018 |
|
| 2017(1) |
| |||
Net Asset Value, Beginning of Period |
| $9.52 |
|
| $10.42 |
|
| $10.24 |
| |||
Income/(Loss) from Investment Operations: | ||||||||||||
Net investment income/(loss)(2) | 0.14 | 0.12 | 0.04 | |||||||||
Net realized and unrealized gain/(loss) | (0.57) | (0.69) | 0.14 | |||||||||
Total from Investment Operations |
| (0.43) |
|
| (0.57) |
|
| 0.18 |
| |||
Less Dividends and Distributions: | ||||||||||||
Dividends (from net investment income) | (0.13) | (0.12) | — | |||||||||
Distributions (from capital gains) | (0.18) | (0.21) | — | |||||||||
Total Dividends and Distributions |
| (0.31) |
|
| (0.33) |
|
| — |
| |||
Net Asset Value, End of Period | $8.78 | $9.52 | $10.42 | |||||||||
Total Return* |
| (4.38)%(4) |
|
| (5.72)% |
|
| 1.76% |
| |||
Net Assets, End of Period (in thousands) | $34,499 | $107,276 | $112,952 | |||||||||
Average Net Assets for the Period (in thousands) | $71,330 | $119,036 | $110,859 | |||||||||
Ratios to Average Net Assets**: |
|
|
|
|
|
|
|
|
| |||
Ratio of Gross Expenses | 1.45% | 1.26% | 1.49% | |||||||||
Ratio of Net Expenses (After Waivers and Expense Offsets) | 1.13% | 1.09% | 1.20% | |||||||||
Ratio of Net Investment Income/(Loss) | 1.49% | 1.17% | 2.42% | |||||||||
Portfolio Turnover Rate | 68% | 26% | 2% | |||||||||
* Total return includes adjustments in accordance with generally accepted accounting principles required at the year or period end and are not annualized for periods of less than one full year. ** Annualized for periods of less than one full year. (1) Period from August 1, 2017 through September 30, 2017. The Fund changed its fiscal year end from July 31 to September 30. (2) Per share amounts are calculated based on average shares outstanding during the year or period. (3) Total return without the effect of affiliated payments would have been (4.82)%. Please see Note 3 in the Notes to the Financial Statements. (4) Total return without the effect of affiliated payments would have been (4.61)%. Please see Note 3 in the Notes to the Financial Statements. |
See Notes to Financial Statements. | |
Janus Investment Fund | 19 |
Janus Henderson Emerging Markets Fund
Financial Highlights
Class D Shares | ||||||
For a share outstanding during the period ended July 31 |
| 2017(1) |
| |||
Net Asset Value, Beginning of Period |
| $10.05 |
| |||
Income/(Loss) from Investment Operations: | ||||||
Net investment income/(loss)(2) | 0.07 | |||||
Net realized and unrealized gain/(loss) | 0.12 | |||||
Total from Investment Operations |
| 0.19 |
| |||
Less Dividends and Distributions: | ||||||
Dividends (from net investment income) | — | |||||
Total Dividends and Distributions |
| — |
| |||
Net Asset Value, End of Period | $10.24 | |||||
Total Return* |
| 1.89% |
| |||
Net Assets, End of Period (in thousands) | $16,527 | |||||
Average Net Assets for the Period (in thousands) | $14,711 | |||||
Ratios to Average Net Assets**: |
|
|
| |||
Ratio of Gross Expenses | 1.35% | |||||
Ratio of Net Expenses (After Waivers and Expense Offsets) | 1.32% | |||||
Ratio of Net Investment Income/(Loss) | 4.63% | |||||
Portfolio Turnover Rate | 32% | |||||
Class I Shares | ||||||||||||
For a share outstanding during the year ended July 31 |
| 2017 |
|
| 2016 |
|
| 2015 |
| |||
Net Asset Value, Beginning of Period |
| $9.13 |
|
| $8.63 |
|
| $9.86 |
| |||
Income/(Loss) from Investment Operations: | ||||||||||||
Net investment income/(loss)(2) | 0.15 | 0.13 | 0.03 | |||||||||
Net realized and unrealized gain/(loss) | 1.03 | 0.42 | (1.25) | |||||||||
Total from Investment Operations |
| 1.18 |
|
| 0.55 |
|
| (1.22) |
| |||
Less Dividends and Distributions: | ||||||||||||
Dividends (from net investment income) | (0.07) | (0.05) | (0.01) | |||||||||
Total Dividends and Distributions |
| (0.07) |
|
| (0.05) |
|
| (0.01) |
| |||
Net Asset Value, End of Period | $10.24 | $9.13 | $8.63 | |||||||||
Total Return* |
| 13.15% |
|
| 6.41% |
|
| (12.34)% |
| |||
Net Assets, End of Period (in thousands) | $107,513 | $36,815 | $12,652 | |||||||||
Average Net Assets for the Period (in thousands) | $62,396 | $21,242 | $15,071 | |||||||||
Ratios to Average Net Assets**: |
|
|
|
|
|
|
|
|
| |||
Ratio of Gross Expenses | 1.46% | 2.09%(3) | 1.85% | |||||||||
Ratio of Net Expenses (After Waivers and Expense Offsets) | 1.27% | 1.54% | 1.54% | |||||||||
Ratio of Net Investment Income/(Loss) | 1.63% | 1.52% | 0.37% | |||||||||
Portfolio Turnover Rate | 32% | 86% | 148% | |||||||||
* Total return not annualized for periods of less than one full year. ** Annualized for periods of less than one full year. (1) Period from June 5, 2017 (inception date) through July 31, 2017. (2) Per share amounts are calculated based on average shares outstanding during the year or period. (3) The Ratio of Gross Expenses include a reimbursement of prior period custodian out-of-pocket expenses. The Ratio of Gross Expenses would have been 0.07% higher had the custodian not reimbursed the Fund. |
See Notes to Financial Statements. | |
20 | SEPTEMBER 30, 2019 |
Janus Henderson Emerging Markets Fund
Financial Highlights
Class N Shares | ||||||||||||
For a share outstanding during the year or period ended September 30 |
| 2019 |
|
| 2018 |
|
| 2017(1) |
| |||
Net Asset Value, Beginning of Period |
| $9.53 |
|
| $10.42 |
|
| $10.24 |
| |||
Income/(Loss) from Investment Operations: | ||||||||||||
Net investment income/(loss)(2) | 0.15 | 0.12 | 0.05 | |||||||||
Net realized and unrealized gain/(loss) | (0.57) | (0.68) | 0.13 | |||||||||
Total from Investment Operations |
| (0.42) |
|
| (0.56) |
|
| 0.18 |
| |||
Less Dividends and Distributions: | ||||||||||||
Dividends (from net investment income) | (0.14) | (0.12) | — | |||||||||
Distributions (from capital gains) | (0.18) | (0.21) | — | |||||||||
Total Dividends and Distributions |
| (0.32) |
|
| (0.33) |
|
| — |
| |||
Net Asset Value, End of Period | $8.79 | $9.53 | $10.42 | |||||||||
Total Return* |
| (4.33)%(3) |
|
| (5.63)% |
|
| 1.76% |
| |||
Net Assets, End of Period (in thousands) | $16,531 | $25,134 | $41,206 | |||||||||
Average Net Assets for the Period (in thousands) | $21,520 | $29,832 | $41,394 | |||||||||
Ratios to Average Net Assets**: |
|
|
|
|
|
|
|
|
| |||
Ratio of Gross Expenses | 1.41% | 1.20% | 1.35% | |||||||||
Ratio of Net Expenses (After Waivers and Expense Offsets) | 1.03% | 1.03% | 1.05% | |||||||||
Ratio of Net Investment Income/(Loss) | 1.65% | 1.15% | 2.59% | |||||||||
Portfolio Turnover Rate | 68% | 26% | 2% | |||||||||
Class S Shares | ||||||||||||
For a share outstanding during the year or period ended September 30 |
| 2019 |
|
| 2018 |
|
| 2017(1) |
| |||
Net Asset Value, Beginning of Period |
| $9.51 |
|
| $10.41 |
|
| $10.23 |
| |||
Income/(Loss) from Investment Operations: | ||||||||||||
Net investment income/(loss)(2) | 0.08 | 0.13 | 0.04 | |||||||||
Net realized and unrealized gain/(loss) | (0.52) | (0.73) | 0.14 | |||||||||
Total from Investment Operations |
| (0.44) |
|
| (0.60) |
|
| 0.18 |
| |||
Less Dividends and Distributions: | ||||||||||||
Dividends (from net investment income) | (0.08) | (0.09) | — | |||||||||
Distributions (from capital gains) | (0.18) | (0.21) | — | |||||||||
Total Dividends and Distributions |
| (0.26) |
|
| (0.30) |
|
| — |
| |||
Net Asset Value, End of Period | $8.81 | $9.51 | $10.41 | |||||||||
Total Return* |
| (4.49)%(4) |
|
| (5.98)% |
|
| 1.76% |
| |||
Net Assets, End of Period (in thousands) | $77 | $1,753 | $316 | |||||||||
Average Net Assets for the Period (in thousands) | $488 | $1,189 | $311 | |||||||||
Ratios to Average Net Assets**: |
|
|
|
|
|
|
|
|
| |||
Ratio of Gross Expenses | 2.25% | 1.85% | 1.91% | |||||||||
Ratio of Net Expenses (After Waivers and Expense Offsets) | 1.18% | 1.47% | 1.51% | |||||||||
Ratio of Net Investment Income/(Loss) | 0.89% | 1.28% | 2.11% | |||||||||
Portfolio Turnover Rate | 68% | 26% | 2% | |||||||||
* Total return includes adjustments in accordance with generally accepted accounting principles required at the year or period end and are not annualized for periods of less than one full year. ** Annualized for periods of less than one full year. (1) Period from August 1, 2017 through September 30, 2017. The Fund changed its fiscal year end from July 31 to September 30. (2) Per share amounts are calculated based on average shares outstanding during the year or period. (3) Total return without the effect of affiliated payments would have been (4.56)%. Please see Note 3 in the Notes to the Financial Statements. (4) Total return without the effect of affiliated payments would have been (4.72)%. Please see Note 3 in the Notes to the Financial Statements. |
See Notes to Financial Statements. | |
Janus Investment Fund | 21 |
Janus Henderson Emerging Markets Fund
Financial Highlights
Class N Shares | |||||||||
For a share outstanding during the year or period ended July 31 |
| 2017 |
|
| 2016(1) |
| |||
Net Asset Value, Beginning of Period |
| $9.13 |
|
| $8.06 |
| |||
Income/(Loss) from Investment Operations: | |||||||||
Net investment income/(loss)(2) | 0.40 | 0.06 | |||||||
Net realized and unrealized gain/(loss) | 0.79 | 1.06 | |||||||
Total from Investment Operations |
| 1.19 |
|
| 1.12 |
| |||
Less Dividends and Distributions: | |||||||||
Dividends (from net investment income) | (0.08) | (0.05) | |||||||
Total Dividends and Distributions |
| (0.08) |
|
| (0.05) |
| |||
Net Asset Value, End of Period | $10.24 | $9.13 | |||||||
Total Return* |
| 13.17% |
|
| 13.92% |
| |||
Net Assets, End of Period (in thousands) | $40,785 | $318 | |||||||
Average Net Assets for the Period (in thousands) | $6,417 | $282 | |||||||
Ratios to Average Net Assets**: |
|
|
|
|
|
| |||
Ratio of Gross Expenses | 1.32% | 2.17%(3) | |||||||
Ratio of Net Expenses (After Waivers and Expense Offsets) | 1.24% | 1.54% | |||||||
Ratio of Net Investment Income/(Loss) | 4.20% | 1.07% | |||||||
Portfolio Turnover Rate | 32% | 86% | |||||||
Class S Shares | ||||||
For a share outstanding during the period ended July 31 |
| 2017(4) |
| |||
Net Asset Value, Beginning of Period |
| $10.05 |
| |||
Income/(Loss) from Investment Operations: | ||||||
Net investment income/(loss)(2) | 0.07 | |||||
Net realized and unrealized gain/(loss) | 0.11 | |||||
Total from Investment Operations |
| 0.18 |
| |||
Less Dividends and Distributions: | ||||||
Dividends (from net investment income) | — | |||||
Total Dividends and Distributions |
| — |
| |||
Net Asset Value, End of Period | $10.23 | |||||
Total Return* |
| 1.79% |
| |||
Net Assets, End of Period (in thousands) | $304 | |||||
Average Net Assets for the Period (in thousands) | $266 | |||||
Ratios to Average Net Assets**: |
|
|
| |||
Ratio of Gross Expenses | 1.69% | |||||
Ratio of Net Expenses (After Waivers and Expense Offsets) | 1.59% | |||||
Ratio of Net Investment Income/(Loss) | 4.51% | |||||
Portfolio Turnover Rate | 32% | |||||
* Total return not annualized for periods of less than one full year. ** Annualized for periods of less than one full year. (1) Period from November 30, 2015 (inception date) through July 31, 2016. (2) Per share amounts are calculated based on average shares outstanding during the year or period. (3) The Ratio of Gross Expenses include a reimbursement of prior period custodian out-of-pocket expenses. The Ratio of Gross Expenses would have been 0.07% higher had the custodian not reimbursed the Fund. (4) Period from June 5, 2017 (inception date) through July 31, 2017. |
See Notes to Financial Statements. | |
22 | SEPTEMBER 30, 2019 |
Janus Henderson Emerging Markets Fund
Financial Highlights
Class T Shares | ||||||||||||
For a share outstanding during the year or period ended September 30 |
| 2019 |
|
| 2018 |
|
| 2017 | ||||