peers; and (3) and the management fees for the Janus Henderson Funds, on average, were 7% under the average management fees for their Expense Groups. The Trustees also considered the total expenses for each share class of each Janus Henderson Fund compared to the average total expenses for its Broadridge Expense Group peers and to average total expenses for its Broadridge Expense Universe.
For certain Janus Henderson Funds, the independent fee consultant also performed a systematic “focus list” analysis of expenses which assessed fund fees in the context of fund performance being delivered. Based on this analysis, the independent fee consultant found that the combination of service quality/performance and expenses on these individual Janus Henderson Funds was reasonable in light of performance trends, performance histories, and existence of performance fees, breakpoints, and/or expense waivers on such Janus Henderson Funds.
The Trustees considered the methodology used by Janus Capital and each subadviser in determining compensation payable to portfolio managers, the competitive environment for investment management talent, and the competitive market for mutual funds in different distribution channels.
The Trustees also reviewed management fees charged by Janus Capital and each subadviser to comparable separate account clients and to comparable non-affiliated funds subadvised by Janus Capital or by a subadviser (for which Janus Capital or the subadviser provides only or primarily portfolio management services). Although in most instances subadvisory and separate account fee rates for various investment strategies were lower than management fee rates for Janus Henderson Funds having a similar strategy, the Trustees considered that Janus Capital noted that, under the terms of the management agreements with the Janus Henderson Funds, Janus Capital performs significant additional services for the Janus Henderson Funds that it does not provide to those other clients, including administration services, oversight of the Janus Henderson Funds’ other service providers, trustee support, regulatory compliance and numerous other services, and that, in serving the Janus Henderson Funds, Janus Capital assumes many legal risks and other costs that it does not assume in servicing its other clients. Moreover, they noted that the independent fee consultant found that: (1) the management fees Janus Capital charges to the Janus Henderson Funds are reasonable in relation to the management fees Janus Capital charges to funds subadvised by Janus Capital and to the fees Janus Capital charges to its institutional separate account clients; (2) these subadvised and institutional separate accounts have different service and infrastructure needs; and (3) Janus Henderson mutual fund investors enjoy reasonable fees relative to the fees charged to Janus Henderson subadvised fund and separate account investors; (4) 11 of 12 Janus Henderson Funds have lower management fees than similar funds subadvised by Janus Capital; and (5) six of nine Janus Henderson Funds have lower management fees than similar separate accounts managed by Janus Capital.
The Trustees considered the fees for each Fund for its fiscal year ended in 2018, and noted the following with regard to each Fund’s total expenses, net of applicable fee waivers (the Fund’s “total expenses”):
Janus Henderson Absolute Return Income Opportunities Fund
Additional Information (unaudited)
Fixed-Income Funds
· For Janus Henderson Absolute Return Income Opportunities Fund, the Trustees noted that, although the Fund’s total expenses exceeded the peer group average for certain share classes, overall the Fund’s total expenses were reasonable. The Trustees also noted that Janus Capital has contractually agreed to limit the Fund’s expenses.
· For Janus Henderson Developed World Bond Fund, the Trustees noted that, although the Fund’s total expenses exceeded the peer group average for certain share classes, overall the Fund’s total expenses were reasonable. The Trustees also noted that Janus Capital has contractually agreed to limit the Fund’s expenses.
· For Janus Henderson Flexible Bond Fund, the Trustees noted that, although the Fund’s total expenses exceeded the peer group average for certain share classes, overall the Fund’s total expenses were reasonable. The Trustees also noted that Janus Capital has contractually agreed to limit the Fund’s expenses.
· For Janus Henderson Global Bond Fund, the Trustees noted that, although the Fund’s total expenses exceeded the peer group average for certain share classes, overall the Fund’s total expenses were reasonable. The Trustees also noted that Janus Capital has contractually agreed to limit the Fund’s expenses.
· For Janus Henderson High-Yield Fund, the Trustees noted that, although the Fund’s total expenses exceeded the peer group average for certain share classes, overall the Fund’s total expenses were reasonable. The Trustees also noted that Janus Capital has contractually agreed to limit the Fund’s expenses.
· For Janus Henderson Multi-Sector Income Fund, the Trustees noted that, although the Fund’s total expenses exceeded the peer group average for certain share classes, overall the Fund’s total expenses were reasonable. The Trustees also noted that Janus Capital has contractually agreed to limit the Fund’s expenses.
· For Janus Henderson Short-Term Bond Fund, the Trustees noted that, although the Fund’s total expenses exceeded the peer group average for all share classes, overall the Fund’s total expenses were reasonable. The Trustees also noted that Janus Capital has contractually agreed to limit the Fund’s expenses.
Global and International Equity Funds
· For Janus Henderson Asia Equity Fund, the Trustees noted that, although the Fund’s total expenses exceeded the peer group average for certain share classes, overall the Fund’s total expenses were reasonable. The Trustees also noted that Janus Capital has contractually agreed to limit the Fund’s expenses.
· For Janus Henderson Emerging Markets Fund, the Trustees noted that, although the Fund’s total expenses exceeded the peer group average for one share class, overall the Fund’s total expenses were reasonable. The Trustees also noted that Janus Capital has contractually agreed to limit the Fund’s expenses.
· For Janus Henderson European Focus Fund, the Trustees noted that, although the Fund’s total expenses exceeded the peer group average for certain share classes, overall the Fund’s total expenses were reasonable. The Trustees also noted that Janus Capital has contractually agreed to limit the Fund’s expenses.
· For Janus Henderson Global Equity Income Fund, the Trustees noted that the Fund’s total expenses were below the peer group average for all share classes.
· For Janus Henderson Global Life Sciences Fund, the Trustees noted that the Fund’s total expenses were below the peer group average for all share classes.
· For Janus Henderson Global Real Estate Fund, the Trustees noted although the Fund’s total expenses exceeded the peer group average for one share class, overall the Fund’s total expenses were reasonable. The Trustees also noted that Janus Capital has contractually agreed to limit the Fund’s expenses.
· For Janus Henderson Global Research Fund, the Trustees noted that the Fund’s total expenses were below the peer group average for all share classes.
· For Janus Henderson Global Select Fund, the Trustees noted that, although the Fund’s total expenses exceeded the peer group average for one share class, overall the Fund’s total expenses were reasonable. The Trustees also noted that Janus Capital has contractually agreed to limit the Fund’s expenses.
· For Janus Henderson Global Technology Fund, the Trustees noted that the Fund’s total expenses were below the peer group average for all share classes.
Janus Henderson Absolute Return Income Opportunities Fund
Additional Information (unaudited)
· For Janus Henderson Global Value Fund, the Trustees noted that although the Fund’s total expenses exceeded the peer group average for one share class, overall the Fund’s total expenses were reasonable.
· For Janus Henderson International Opportunities Fund, the Trustees noted that, although the Fund’s total expenses exceeded the peer group average for certain share classes, overall the Fund’s total expenses were reasonable. The Trustees also noted that Janus Capital has contractually agreed to limit the Fund’s expenses.
· For Janus Henderson International Small Cap Fund, the Trustees noted that the Fund’s total expenses were below the peer group average for all share classes.
· For Janus Henderson International Value Fund, the Trustees noted that, although the Fund’s total expenses exceeded the peer group average for certain share classes, overall the Fund’s total expenses were reasonable. The Trustees also noted that Janus Capital has contractually agreed to limit the Fund’s expenses.
· For Janus Henderson Overseas Fund, the Trustees noted that the Fund’s total expenses were below the peer group average for all share classes.
Money Market Funds
· For Janus Henderson Government Money Market Fund, the Trustees noted that the Fund’s total expenses were below the peer group average for both share classes.
· For Janus Henderson Money Market Fund, the Trustees noted that, although the Fund’s total expenses exceeded the peer group average for one share class, overall the Fund’s total expenses were reasonable.
Multi-Asset Funds
· For Janus Henderson Adaptive Global Allocation Fund, the Trustees noted that, although the Fund’s total expenses exceeded the peer group average for one share class, overall the Fund’s total expenses were reasonable. The Trustees also noted that Janus Capital has contractually agreed to limit the Fund’s expenses.
· For Janus Henderson Dividend & Income Builder Fund, the Trustees noted that the Fund’s total expenses were below the peer group average for all share classes.
· For Janus Henderson Value Plus Income Fund, the Trustees noted that the Fund’s total expenses were below the peer group average for all share classes.
Multi-Asset U.S. Equity Funds
· For Janus Henderson Balanced Fund, the Trustees noted that, although the Fund’s total expenses exceeded the peer group average for certain share classes, overall the Fund’s total expenses were reasonable. The Trustees also noted that Janus Capital has contractually agreed to limit the Fund’s expenses, although this limit did not apply because the Fund’s total expenses were already below the applicable fee limit.
· For Janus Henderson Contrarian Fund, the Trustees noted that the Fund’s total expenses exceeded the peer group average for one share class, overall the Fund’s total expenses were reasonable. The Trustees also noted that Janus Capital had contractually agreed to limit the Fund’s expenses.
· For Janus Henderson Enterprise Fund, the Trustees noted that the Fund’s total expenses were below the peer group average for all share classes.
· For Janus Henderson Forty Fund, the Trustees noted that, although the Fund’s total expenses exceeded the peer group average for certain share classes, overall the Fund’s total expenses were reasonable. The Trustees also noted that Janus Capital has contractually agreed to limit the Fund’s expenses, although this limit did not apply because the Fund’s total expenses were already below the applicable fee limit.
· For Janus Henderson Growth and Income Fund, the Trustees noted that, although the Fund’s total expenses exceeded the peer group average for certain share classes, overall the Fund’s total expenses were reasonable. The Trustees also noted that Janus Capital has contractually agreed to limit the Fund’s expenses, although this limit did not apply because the Fund’s total expenses were already below the applicable fee limit.
· For Janus Henderson Research Fund, the Trustees noted that the Fund’s total expenses were below the peer group average for all share classes.
Janus Henderson Absolute Return Income Opportunities Fund
Additional Information (unaudited)
· For Janus Henderson Triton Fund, the Trustees noted that, although the Fund’s expenses exceeded the peer group average for one share class, overall the Fund’s total expenses were reasonable. The Trustees also noted that Janus Capital had contractually agreed to limit the Fund’s expenses, although this limit did not apply because the Fund’s total expenses were already below the applicable fee limit.
· For Janus Henderson U.S. Growth Opportunities Fund, that Trustees noted that the Fund’s total expenses were below the peer group average for all share classes.
· For Janus Henderson Venture Fund, the Trustees noted that, although the Fund’s expenses exceeded the peer group average for one share class, overall the Fund’s total expenses were reasonable. The Trustees also noted that Janus Capital had contractually agreed to limit the Fund’s expenses, although this limit did not apply because the Fund’s total expenses were already below the applicable fee limit.
Quantitative Equity Funds
· For Janus Henderson Emerging Markets Managed Volatility Fund, the Trustees noted that, although the Fund’s total expenses exceeded the peer group average for certain share classes, overall the Fund’s total expenses were reasonable. The Trustees also noted that Janus Capital has contractually agreed to limit the Fund’s expenses.
· For Janus Henderson Global Income Managed Volatility Fund, the Trustees noted that the Fund’s total expenses were below the peer group average for all share classes.
· For Janus Henderson International Managed Volatility Fund, the Trustees noted that, although the Fund’s total expenses exceeded the peer group average for certain share classes, overall the Fund’s total expenses were reasonable. The Trustees also noted that Janus Capital has contractually agreed to limit the Fund’s expenses.
· For Janus Henderson U.S. Managed Volatility Fund, the Trustees noted that the Fund’s total expenses were below the peer group average for all share classes.
U.S. Equity Funds
· For Janus Henderson Large Cap Value Fund, the Trustees noted that the Fund’s total expenses were below the peer group average for all share classes.
· For Janus Henderson Mid Cap Value Fund, the Trustees noted that, although the Fund’s expenses exceeded the peer group average for certain share classes, overall the Fund’s total expenses were reasonable. The Trustees also noted that Janus Capital had contractually agreed to limit the Fund’s expenses, although this limit did not apply because the Fund’s total expenses were already below the applicable fee limit.
· For Janus Henderson Small Cap Value Fund, the Trustees noted that, although the Fund’s total expenses exceeded the peer group average for certain share classes, overall the Fund’s total expenses were reasonable. The Trustees also noted that Janus Capital has contractually agreed to limit the Fund’s expenses, although this limit did not apply because the Fund’s total expenses were already below the applicable fee limit.
· For Janus Henderson Small-Mid Cap Value Fund, the Trustees noted that, although the Fund’s total expenses exceeded the peer group average for certain share classes, overall the Fund’s total expenses were reasonable. The Trustees also noted that Janus Capital has contractually agreed to limit the Fund’s expenses.
The Trustees reviewed information on the overall profitability to Janus Capital and its affiliates of their relationship with the Janus Henderson Funds, and considered profitability data of other publicly traded mutual fund advisers. The Trustees recognized that profitability comparisons among fund managers are difficult because of the variation in the type of comparative information that is publicly available, and the profitability of any fund manager is affected by numerous factors, including the organizational structure of the particular fund manager, differences in complex size, difference in product mix, difference in types of business (mutual fund, institutional and other), differences in the types of funds and other accounts it manages, possible other lines of business, the methodology for allocating expenses, and the fund manager’s capital structure and cost of capital.
Additionally, the Trustees considered the estimated profitability to Janus Capital from the investment management services it provided to each Janus Henderson Fund. In their review, the Trustees considered whether Janus Capital and each subadviser receive adequate incentives and resources to manage the Janus Henderson Funds effectively. In reviewing profitability, the Trustees noted that the estimated profitability for an individual Janus Henderson Fund is
Janus Henderson Absolute Return Income Opportunities Fund
Additional Information (unaudited)
necessarily a product of the allocation methodology utilized by Janus Capital to allocate its expenses as part of the estimated profitability calculation. In this regard, the Trustees noted that the independent fee consultant found that (1) the expense allocation methodology and rationales utilized by Janus Capital were reasonable and (2) no clear correlation between expense allocations and operating margins. The Trustees also considered that the estimated profitability for an individual Janus Henderson Fund was influenced by a number of factors, including not only the allocation methodology selected, but also the presence of fee waivers and expense caps, and whether the Janus Henderson Fund’s investment management agreement contained breakpoints or a performance fee component. The Trustees determined, after taking into account these factors, among others, that Janus Capital’s estimated profitability with respect to each Janus Henderson Fund was not unreasonable in relation to the services provided, and that the variation in the range of such estimated profitability among the Janus Henderson Funds was not a material factor in the Board’s approval of the reasonableness of any Janus Henderson Fund’s investment management fees.
The Trustees concluded that the management fees payable by each Janus Henderson Fund to Janus Capital and its affiliates, as well as the fees paid by Janus Capital to the subadvisers of subadvised Janus Henderson Funds, were reasonable in relation to the nature, extent, and quality of the services provided, taking into account the fees charged by other advisers for managing comparable mutual funds with similar strategies, the fees Janus Capital and the subadvisers charge to other clients, and, as applicable, the impact of fund performance on management fees payable by the Janus Henderson Funds. The Trustees also concluded that each Janus Henderson Fund’s total expenses were reasonable, taking into account the size of the Janus Henderson Fund, the quality of services provided by Janus Capital and any subadviser, the investment performance of the Janus Henderson Fund, and any expense limitations agreed to or provided by Janus Capital.
Economies of Scale
The Trustees considered information about the potential for Janus Capital to realize economies of scale as the assets of the Janus Henderson Funds increase. They noted that their independent fee consultant published a report to the Trustees in November 2019 which provided its research and analysis into economies of scale. They also noted that, although many Janus Henderson Funds pay advisory fees at a base fixed rate as a percentage of net assets, without any breakpoints or performance fees, their independent fee consultant concluded that 64% of these Janus Henderson Funds’ share classes have contractual management fees (gross of waivers) below their Broadridge expense group averages. They also noted the following: (1) that for those Janus Henderson Funds whose expenses are being reduced by the contractual expense limitations of Janus Capital, Janus Capital is subsidizing certain of these Janus Henderson Funds because they have not reached adequate scale; (2) as the assets of some of the Janus Henderson Funds have declined in the past few years, certain Janus Henderson Funds have benefited from having advisory fee rates that have remained constant rather than increasing as assets declined; (3) performance fee structures have been implemented for various Janus Henderson Funds that have caused the effective rate of advisory fees payable by such a Janus Henderson Fund to vary depending on the investment performance of the Janus Henderson Fund relative to its benchmark index over the measurement period; and (4) a few Janus Henderson Funds have fee schedules with breakpoints and reduced fee rates above certain asset levels. The Trustees also noted that the Janus Henderson Funds share directly in economies of scale through the lower charges of third-party service providers that are based in part on the combined scale of all of the Janus Henderson Funds.
The Trustees also considered the independent fee consultant’s conclusion that, given the limitations of various analytical approaches to economies of scale and their conflicting results, it is difficult to analytically confirm or deny the existence of economies of scale in the Janus Henderson complex. In this regard, the independent consultant concluded that (1) to the extent there were economies of scale at Janus Capital, Janus Capital’s general strategy of setting fixed management fees below peers appeared to share any such economies with investors even on smaller Janus Henderson Funds which have not yet achieved those economies and (2) by setting lower fixed fees from the start on these Janus Henderson Funds, Janus Capital appeared to be investing to increase the likelihood that these Janus Henderson Funds will grow to a level to achieve any scale economies that may exist. Further, the independent fee consultant provided its belief that Janus Henderson Fund investors are well-served by the fee levels and performance fee structures in place on the Janus Henderson Funds in light of any economies of scale that may be present at Janus Capital.
Based on all of the information reviewed, including the recent and past research and analysis conducted by the Trustees’ independent fee consultant, the Trustees concluded that the current fee structure of each Janus Henderson Fund was reasonable and that the current rates of fees do reflect a sharing between Janus Capital and the Janus
Janus Henderson Absolute Return Income Opportunities Fund
Additional Information (unaudited)
Henderson Fund of any economies of scale that may be present at the current asset level of the Janus Henderson Fund.
Other Benefits to Janus Capital
The Trustees also considered benefits that accrue to Janus Capital and its affiliates and subadvisers to the Janus Henderson Funds from their relationships with the Janus Henderson Funds. They recognized that two affiliates of Janus Capital separately serve the Janus Henderson Funds as transfer agent and distributor, respectively, and the transfer agent receives compensation directly from the non-money market funds for services provided, and that such compensation contributes to the overall profitability of Janus Capital and its affiliates that results from their relationship with the Janus Henderson Funds. The Trustees also considered Janus Capital’s past and proposed use of commissions paid by the Janus Henderson Funds on portfolio brokerage transactions to obtain proprietary and third-party research products and services benefiting the Janus Henderson Fund and/or other clients of Janus Capital and/or Janus Capital, and/or a subadviser to a Janus Henderson Fund. The Trustees concluded that Janus Capital’s and the subadvisers’ use of these types of client commission arrangements to obtain proprietary and third-party research products and services was consistent with regulatory requirements and guidelines and was likely to benefit each Janus Henderson Fund. The Trustees also concluded that, other than the services provided by Janus Capital and its affiliates and subadvisers pursuant to the agreements and the fees to be paid by each Janus Henderson Fund therefor, the Janus Henderson Funds and Janus Capital and the subadvisers may potentially benefit from their relationship with each other in other ways. They concluded that Janus Capital and its affiliates share directly in economies of scale through the lower charges of third-party service providers that are based in part on the combined scale of the Janus Henderson Funds and other clients serviced by Janus Capital and its affiliates. They also concluded that Janus Capital and/or the subadvisers benefit from the receipt of research products and services acquired through commissions paid on portfolio transactions of the Janus Henderson Funds and that the Janus Henderson Funds benefit from Janus Capital’s and/or the subadvisers’ receipt of those products and services as well as research products and services acquired through commissions paid by other clients of Janus Capital and/or other clients of the subadvisers. They further concluded that the success of any Janus Henderson Fund could attract other business to Janus Capital, the subadvisers or other Janus Henderson funds, and that the success of Janus Capital and the subadvisers could enhance Janus Capital’s and the subadvisers’ ability to serve the Janus Henderson Funds.
Approval of an Amended and Restated Investment Advisory Agreement for Janus Henderson Small-Mid Cap Value Fund (formerly, Janus Henderson Select Value Fund)
Janus Capital Management LLC (“Janus Capital”) met with the Trustees, each of whom serves as an “independent” Trustee (the “Trustees”), on December 5, 2018 and March 14, 2019, to discuss the Amended and Restated Investment Advisory Agreement (the “Amended Advisory Agreement”) for Janus Henderson Small-Mid Cap Value Fund (formerly, Janus Henderson Select Value Fund) (“Small-Mid Cap Value Fund”) and other matters related to investment strategy changes to shift the market capitalization focus of Small-Mid Cap Value Fund (the “Strategy Change”). At these meetings, the Trustees discussed the Amended Advisory Agreement and the Strategy Change with their independent counsel, separately from management. During the course of the meetings, the Trustees requested and considered such information as they deemed relevant to their deliberations. At the meeting held on March 14, 2019, the Trustees, upon the recommendation of Janus Capital, voted unanimously to approve the Amended Advisory Agreement for Small-Mid Cap Value Fund, and recommended that the Amended Advisory Agreement be submitted to shareholders for approval. The Trustees also approved matters related to the Strategy Change, effective upon approval of the Amended Advisory Agreement by the Fund’s shareholders.
In determining whether to approve the Amended Advisory Agreement, the Trustees noted their most recent consideration of Small-Mid Cap Value Fund’s current advisory agreement (the “Current Advisory Agreement”) as part of the Trustees’ annual review and consideration of whether to continue the investment advisory agreement and sub-advisory agreement, as applicable, for each Janus Henderson fund, including Small-Mid Cap Value Fund (the “Annual Review”). The Trustees noted that in connection with the Annual Review: (i) the Trustees received and reviewed information provided by Janus Capital and each sub-adviser, including Perkins Investment Management LLC (“Perkins”), in response to requests of the Trustees and their independent legal counsel, and also received and reviewed information and analysis provided by, and in response to requests of, their independent fee consultant; and (ii) throughout the Annual Review, the Trustees were advised by their independent legal counsel. The Trustees also noted that based on the Trustees’ evaluation of the information provided by Janus Capital, Perkins, and the independent fee consultant, as well as other information, the Trustees determined that the overall arrangements between Small-Mid Cap
Janus Henderson Absolute Return Income Opportunities Fund
Additional Information (unaudited)
Value Fund and Janus Capital and Perkins were fair and reasonable in light of the nature, extent and quality of the services provided by Janus Capital, its affiliates and Perkins, the fees charged for those services, and other matters that the Trustees considered relevant in the exercise of their business judgment, and the Trustees unanimously approved the continuation of the Current Advisory Agreement for another year.
In considering the Amended Advisory Agreement, the Trustees reviewed and analyzed various factors that they determined were relevant, including the factors described below, none of which by itself was considered dispositive. However, the material factors and conclusions that formed the basis for the Trustees’ determination to approve the Amended Advisory Agreement are discussed separately below.
· The Trustees determined that the terms of the Amended Advisory Agreement are substantially similar to those of the Current Advisory Agreement, which the Trustees recently reviewed as part of the Annual Review, and the material changes made to the Amended Advisory Agreement address the proposed change to the benchmark index and the description of the period used for calculating the performance fee in order to allow for continuity of the fee based on Small-Mid Cap Value Fund’s historical performance over a 36-month measurement period.
· As part of the Strategy Change, Small-Mid Cap Value Fund will focus its investments on common stocks of companies that are small- and mid-capitalization stocks. The Trustees determined that the proposed benchmark index, the Russell 2500TM Value Index, is more closely aligned with a small- and mid-cap stock focus than Small-Mid Cap Value Fund’s current benchmark index, the Russell 3000® Value Index.
· Under the Amended Advisory Agreement, the structure of the performance fee was not changing, other than to utilize a different benchmark and performance calculation period to implement the new benchmark over time, and that this structure had been implemented initially for Small-Mid Cap Value Fund based on analysis provided by the independent fee consultant. The Trustees considered the information provided by Janus Capital in this regard, and noted Janus Capital’s belief that this performance fee structure remained reasonable and appropriate for Small-Mid Cap Value Fund. The Trustees concluded that this performance fee structure was reasonable for Small-Mid Cap Value Fund as proposed, and also determined to seek further analysis from their independent fee consultant with respect to this matter. In this regard, Janus Capital agreed to consider further revisions to the proposed performance fee structure should that be needed based on the additional analysis provided.
· As part of the Strategy Change, Perkins will continue to provide sub-advisory services to Small-Mid Cap Value Fund, but will utilize new portfolio managers to implement Small-Mid Cap Value Fund’s focus on common stocks of companies that are small- and mid-capitalization stocks. In this regard, the Trustees noted the information provided by Janus Capital with respect to the qualifications and experience of the new portfolio managers implementing investment strategies similar to the one to be utilized by Small-Mid Cap Value Fund, and also noted that Perkins and the new portfolio managers provide sub-advisory services to other Janus Henderson funds the Trustees oversee.
· The information provided by Janus Capital with respect to (i) the impact of the Amended Advisory Agreement on the potential advisory fees to be paid by Small-Mid Cap Value Fund going forward; and (ii) the potential transaction costs and capital gains to be incurred by Small-Mid Cap Value Fund as part of the efforts to reposition Small-Mid Cap Value Fund’s portfolio to focus its investments on common stocks of companies that are small- and mid-capitalization stocks. In this regard, the Trustees noted that Small-Mid Cap Value Fund’s operating costs were not expected otherwise to materially change under the Amended Advisory Agreement.
· Janus Capital’s reasons for seeking to implement the Strategy Change, including Janus Capital’s belief that current marketplace demands for a small and mid-cap strategy, combined with Perkins’ experience in managing small- and mid-cap stocks, will provide greater opportunity for Small-Mid Cap Value Fund to grow over the long-term, and that the Strategy Change is designed to create asset growth through increased sales for Small-Mid Cap Value Fund, potentially resulting in increased operational efficiencies for Small-Mid Cap Value Fund.
· Janus Capital will pay the fees and expenses related to seeking shareholder approval of the Amended Advisory Agreement, including the costs related to the preparation and distribution of proxy materials, and all other costs incurred in connection with the solicitation of proxies.
After discussion, the Trustees determined that the overall arrangements between Small-Mid Cap Value Fund, Janus Capital, and Perkins under the Amended Advisory Agreement would continue to be fair and reasonable in light of the
Janus Henderson Absolute Return Income Opportunities Fund
Additional Information (unaudited)
nature, extent, and quality of the services expected to be provided by Janus Capital, its affiliates, and Perkins following the Strategy Change.
Janus Henderson Absolute Return Income Opportunities Fund
Useful Information About Your Fund Report (unaudited)
Management Commentary
The Management Commentary in this report includes valuable insight as well as statistical information to help you understand how your Fund’s performance and characteristics stack up against those of comparable indices.
If the Fund invests in foreign securities, this report may include information about country exposure. Country exposure is based primarily on the country of risk. A company may be allocated to a country based on other factors such as location of the company’s principal office, the location of the principal trading market for the company’s securities, or the country where a majority of the company’s revenues are derived.
Please keep in mind that the opinions expressed in the Management Commentary are just that: opinions. They are a reflection based on best judgment at the time this report was compiled, which was December 31, 2019. As the investing environment changes, so could opinions. These views are unique and are not necessarily shared by fellow employees or by Janus Henderson in general.
Performance Overviews
Performance overview graphs compare the performance of a hypothetical $10,000 investment in the Fund with one or more widely used market indices. When comparing the performance of the Fund with an index, keep in mind that market indices are not available for investment and do not reflect deduction of expenses.
Average annual total returns are quoted for a Fund with more than one year of performance history. Average annual total return is calculated by taking the growth or decline in value of an investment over a period of time, including reinvestment of dividends and distributions, then calculating the annual compounded percentage rate that would have produced the same result had the rate of growth been constant throughout the period. Average annual total return does not reflect the deduction of taxes that a shareholder would pay on Fund distributions or redemptions of Fund shares.
Cumulative total returns are quoted for a Fund with less than one year of performance history. Cumulative total return is the growth or decline in value of an investment over time, independent of the period of time involved. Cumulative total return does not reflect the deduction of taxes that a shareholder would pay on Fund distributions or redemptions of Fund shares.
Pursuant to federal securities rules, expense ratios shown in the performance chart reflect subsidized (if applicable) and unsubsidized ratios. The total annual fund operating expenses ratio is gross of any fee waivers, reflecting the Fund’s unsubsidized expense ratio. The net annual fund operating expenses ratio (if applicable) includes contractual waivers of Janus Capital and reflects the Fund’s subsidized expense ratio. Ratios may be higher or lower than those shown in the “Financial Highlights” in this report.
Schedule of Investments
Following the performance overview section is the Fund’s Schedule of Investments. This schedule reports the types of securities held in the Fund on the last day of the reporting period. Securities are usually listed by type (common stock, corporate bonds, U.S. Government obligations, etc.) and by industry classification (banking, communications, insurance, etc.). Holdings are subject to change without notice.
The value of each security is quoted as of the last day of the reporting period. The value of securities denominated in foreign currencies is converted into U.S. dollars.
If the Fund invests in foreign securities, it will also provide a summary of investments by country. This summary reports the Fund exposure to different countries by providing the percentage of securities invested in each country. The country of each security represents the country of risk. The Fund’s Schedule of Investments relies upon the industry group and country classifications published by Barclays and/or MSCI Inc.
Tables listing details of individual forward currency contracts, futures, written options, swaptions, and swaps follow the Fund’s Schedule of Investments (if applicable).
Statement of Assets and Liabilities
This statement is often referred to as the “balance sheet.” It lists the assets and liabilities of the Fund on the last day of the reporting period.
Janus Henderson Absolute Return Income Opportunities Fund
Useful Information About Your Fund Report (unaudited)
The Fund’s assets are calculated by adding the value of the securities owned, the receivable for securities sold but not yet settled, the receivable for dividends declared but not yet received on securities owned, and the receivable for Fund shares sold to investors but not yet settled. The Fund’s liabilities include payables for securities purchased but not yet settled, Fund shares redeemed but not yet paid, and expenses owed but not yet paid. Additionally, there may be other assets and liabilities such as unrealized gain or loss on forward currency contracts.
The section entitled “Net Assets Consist of” breaks down the components of the Fund’s net assets. Because the Fund must distribute substantially all earnings, you will notice that a significant portion of net assets is shareholder capital.
The last section of this statement reports the net asset value (“NAV”) per share on the last day of the reporting period. The NAV is calculated by dividing the Fund’s net assets for each share class (assets minus liabilities) by the number of shares outstanding.
Statement of Operations
This statement details the Fund’s income, expenses, realized gains and losses on securities and currency transactions, and changes in unrealized appreciation or depreciation of Fund holdings.
The first section in this statement, entitled “Investment Income,” reports the dividends earned from securities and interest earned from interest-bearing securities in the Fund.
The next section reports the expenses incurred by the Fund, including the advisory fee paid to the investment adviser, transfer agent fees and expenses, and printing and postage for mailing statements, financial reports and prospectuses. Expense offsets and expense reimbursements, if any, are also shown.
The last section lists the amounts of realized gains or losses from investment and foreign currency transactions, and changes in unrealized appreciation or depreciation of investments and foreign currency-denominated assets and liabilities. The Fund will realize a gain (or loss) when it sells its position in a particular security. A change in unrealized gain (or loss) refers to the change in net appreciation or depreciation of the Fund during the reporting period. “Net Realized and Unrealized Gain/(Loss) on Investments” is affected both by changes in the market value of Fund holdings and by gains (or losses) realized during the reporting period.
Statements of Changes in Net Assets
These statements report the increase or decrease in the Fund’s net assets during the reporting period. Changes in the Fund’s net assets are attributable to investment operations, dividends and distributions to investors, and capital share transactions. This is important to investors because it shows exactly what caused the Fund’s net asset size to change during the period.
The first section summarizes the information from the Statement of Operations regarding changes in net assets due to the Fund’s investment operations. The Fund’s net assets may also change as a result of dividend and capital gains distributions to investors. If investors receive their dividends and/or distributions in cash, money is taken out of the Fund to pay the dividend and/or distribution. If investors reinvest their dividends and/or distributions, the Fund’s net assets will not be affected. If you compare the Fund’s “Net Decrease from Dividends and Distributions” to “Reinvested Dividends and Distributions,” you will notice that dividends and distributions have little effect on the Fund’s net assets. This is because the majority of the Fund’s investors reinvest their dividends and/or distributions.
The reinvestment of dividends and distributions is included under “Capital Share Transactions.” “Capital Shares” refers to the money investors contribute to the Fund through purchases or withdrawals via redemptions. The Fund’s net assets will increase and decrease in value as investors purchase and redeem shares from the Fund.
Financial Highlights
This schedule provides a per-share breakdown of the components that affect the Fund’s NAV for current and past reporting periods as well as total return, asset size, ratios, and portfolio turnover rate.
The first line in the table reflects the NAV per share at the beginning of the reporting period. The next line reports the net investment income/(loss) per share. Following is the per share total of net gains/(losses), realized and unrealized. Per share dividends and distributions to investors are then subtracted to arrive at the NAV per share at the end of the period. The next line reflects the total return for the period. The total return may include adjustments in accordance with generally accepted accounting principles required at the period end for financial reporting purposes. As a result, the
Janus Henderson Absolute Return Income Opportunities Fund
Useful Information About Your Fund Report (unaudited)
total return may differ from the total return reflected for individual shareholder transactions. Also included are ratios of expenses and net investment income to average net assets.
The Fund’s expenses may be reduced through expense offsets and expense reimbursements. The ratios shown reflect expenses before and after any such offsets and reimbursements.
The ratio of net investment income/(loss) summarizes the income earned less expenses, divided by the average net assets of the Fund during the reporting period. Do not confuse this ratio with the Fund’s yield. The net investment income ratio is not a true measure of the Fund’s yield because it does not take into account the dividends distributed to the Fund’s investors.
The next figure is the portfolio turnover rate, which measures the buying and selling activity in the Fund. Portfolio turnover is affected by market conditions, changes in the asset size of the Fund, fluctuating volume of shareholder purchase and redemption orders, the nature of the Fund’s investments, and the investment style and/or outlook of the portfolio manager(s) and/or investment personnel. A 100% rate implies that an amount equal to the value of the entire portfolio was replaced once during the fiscal year; a 50% rate means that an amount equal to the value of half the portfolio is traded in a year; and a 200% rate means that an amount equal to the value of the entire portfolio is traded every six months.
Janus Henderson Absolute Return Income Opportunities Fund
Notes
NotesPage1
Knowledge. Shared
At Janus Henderson, we believe in the sharing of expert insight for better investment and business decisions. We call this ethos Knowledge. Shared.
Learn more by visiting janushenderson.com.
| | | | | | | | | |
| | | | | |

| | | | |
This report is submitted for the general information of shareholders of the Fund. It is not an offer or solicitation for the Fund and is not authorized for distribution to prospective investors unless preceded or accompanied by an effective prospectus. |
Janus Henderson, Janus, Henderson, Perkins, Intech and Knowledge. Shared are trademarks of Janus Henderson Group plc or one of its subsidiaries. © Janus Henderson Group plc. Janus Henderson Distributors |
| | | | | 125-24-93024 02-20 |
| | | |
| | | |
| | | SEMIANNUAL REPORT December 31, 2019 |
| | |
| | Janus Henderson Adaptive Global Allocation Fund |
| | |
| | Janus Investment Fund |
Beginning on January 1, 2021, as permitted by regulations adopted by the Securities and Exchange Commission, paper copies of the Fund’s shareholder reports will no longer be sent by mail, unless you specifically request paper copies of the reports from the Fund or your plan sponsor, broker-dealer, or financial intermediary, or if you invest directly with the Fund, by contacting a Janus Henderson representative. Instead, the reports will be made available on a website, and you will be notified by mail each time a report is posted and provided with a website link to access the report. If you already elected to receive shareholder reports electronically, you will not be affected by this change and you need not take any action. You may elect to receive shareholder reports and other communications from the Fund electronically by contacting your plan sponsor, broker-dealer, or financial intermediary, or if you invest directly with the Fund, by visiting janushenderson.com/edelivery. You may elect to receive all future reports in paper free of charge. If you do not invest directly with the Fund, you should contact your plan sponsor, broker-dealer, or financial intermediary, to request to continue receiving paper copies of your shareholder reports. If you invest directly with the Fund, you can call 1-800-525-3713 to let the Fund know that you wish to continue receiving paper copies of your shareholder reports. Your election to receive reports in paper will apply to all Janus Henderson mutual funds where held (i.e., all Janus Henderson mutual funds held in your account if you invest through your financial intermediary or all Janus Henderson mutual funds held with the fund complex if you invest directly with a fund). |
| | | |
| | | HIGHLIGHTS · Portfolio management perspective · Investment strategy behind your fund · Fund performance, characteristics
and holdings |
| | | |
| | | 
|
Table of Contents
Janus Henderson Adaptive Global Allocation Fund
Janus Henderson Adaptive Global Allocation Fund (unaudited)
| | | | | | |
FUND SNAPSHOT This global allocation fund seeks to provide investors total return by dynamically allocating its assets across a portfolio of global equity and fixed income investments, which may involve the use of derivatives. The Fund is designed to actively adapt based on forward-looking views on extreme market movements, both positive and negative, with the goal of minimizing the risk of significant loss in a major downturn while participating in the growth potential of capital markets. | | | | 
Ashwin Alankar co-portfolio manager | 
Enrique Chang co-portfolio manager |
| | | |
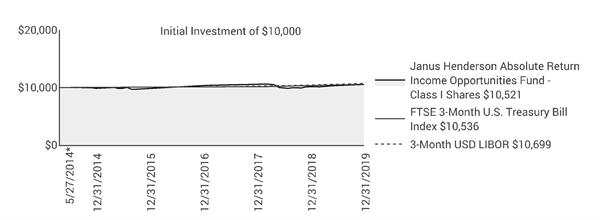
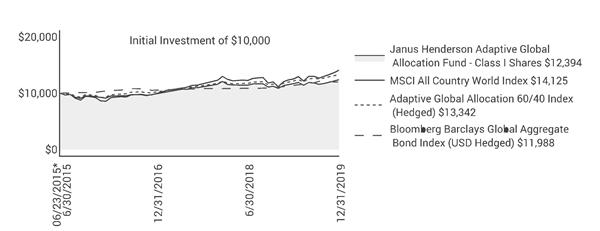
PERFORMANCE OVERVIEW
Janus Henderson Adaptive Global Allocation Fund Class I Shares returned 3.94% for the six-month period ended December 31, 2019. This compares with a return of 8.92% for its primary benchmark, the MSCI All Country World IndexSM. The Fund’s secondary benchmark, the Adaptive Global Allocation 60-40 Index, an internally calculated index that comprises the MSCI All Country World IndexSM (60%) and the Bloomberg Barclays Global Aggregate Bond Index (40%), returned 6.21%. Its tertiary benchmark, the Bloomberg Barclays Global Aggregate Bond Index, returned 2.09%.
MARKET ENVIRONMENT
Global financial markets generated positive returns during the period, with riskier assets outperforming safer government bonds as optimism brewed that heretofore slowing global growth may reaccelerate. Two developments fueling investor optimism were stabilizing global purchasing managers’ indices and headway in U.S.-China trade negotiations. Although yields across the U.S. Treasuries curve were down for the period, the curve between 2-year and 10-year maturities steepened as the former was anchored to a succession of rate cuts by the Federal Reserve (Fed) and the latter proved more susceptible to a potential uptick in global growth. Investment-grade credit marginally outperformed high-yield issuers due in part to falling interest rates. Yet for both categories, spreads between their yields and those of their risk-free benchmarks narrowed considerably. Equities rallied, with some U.S. benchmarks achieving new record closes by the end of the period, but international stocks also moved upward on improving growth prospects. This occurred after an extended period of underperformance by international stocks.
PERFORMANCE DISCUSSION
For the six-month period, the Fund underperformed its primary and tertiary benchmarks. Underperformance relative to its secondary benchmark, comprising a 60/40 allocation to equities and bonds, was largely due to an underweighting to stocks during the last four months of 2019, a period that was characterized by strong equity performance.
Underperformance relative to its primary, equities-focused benchmark was due to an underweighting in a concentrated group of stocks that drove a considerable portion of the index’s returns for the period. After beginning the period at 82% exposure to equities, the Fund de-risked to 62% by the end of August as its proprietary options-market signals indicated decreased attractiveness of? equities. Subsequently, the Fund’s proprietary signals indicated increased attractiveness of? equities during October, November and December, and the Fund consequently increased its equity exposure significantly from 69% at the end of September to 87% by the end of December.
That said, it should be noted that a key characteristic of market behavior in 2019 was multiple periods of rapid mean reversion. Under such environments, our options-sourced signals can suffer from being exposed to “whipsawed” conditions, thereby leading to underperformance.
In executing the strategy, during the period the Fund utilized derivatives, including futures and forward exchange contracts. For the period covered by this letter, the impact of derivatives on the Fund was negative. Please see the Derivative Instruments section in the “Notes to Financial Statements” for a discussion of derivatives used by the Fund.
OUTLOOK
Our signals of forward-looking inflation continue to point to the upside. The robustness of this view is reflected in its consistency over the past several months. As we start the new year, we believe that inflation is the greatest risk
Janus Henderson Adaptive Global Allocation Fund (unaudited)
faced by markets, particularly because most have written it off, citing structural headwinds. Often, an ignored risk turns out to be the most painful kind.
The central bank-manufactured “cheap” money environment that financial assets have ridden to new highs could quickly disappear in the face of unexpected inflation and a likely shift toward a tightening regime. We have seen time and again how the market responds when fears of tightening unfold, and it is not pretty.
And one must not forget that despite these structural headwinds, the year-over-over U.S. core inflation, as measured by the consumer price index, sits at 2.3%, far from any notion of disinflation. Consistent with a possible pick-up in inflation, we see nominal bonds as challenged, according to our signals.
In response to potential structural headwinds and inflation data showing restraint, the Fed and other global central banks have made it very clear that not only will accommodation last, but they are comfortable with inflation climbing above their targets. This is potentially a dangerous game to play, because inflation is rarely tame. During hibernation, a bear appears tame, but when it wakes up, it is anything but docile. History suggests that the same holds true for inflation. The good news is our signals are not currently pointing to “stagflation.” But beware that inflation could compromise today’s stimulative financial conditions as well as economic growth, as the Fed would inevitably respond by increasing interest rates, leading to higher real rates and costs of capital.
Thank you for investing in Janus Henderson Adaptive Global Allocation Fund
Janus Henderson Adaptive Global Allocation Fund (unaudited)
Fund At A Glance
December 31, 2019
| | |
5 Largest Equity Holdings - (% of Net Assets) |
Vanguard FTSE All-World ex-US | |
Exchange-Traded Funds (ETFs) | 13.9% |
Vanguard FTSE Europe | |
Exchange-Traded Funds (ETFs) | 7.2% |
Vanguard S&P 500 | |
Exchange-Traded Funds (ETFs) | 6.7% |
Vanguard FTSE Pacific | |
Exchange-Traded Funds (ETFs) | 6.4% |
Vanguard FTSE Emerging Markets | |
Exchange-Traded Funds (ETFs) | 6.2% |
| | 40.4% |
| | | | | | |
Asset Allocation - (% of Net Assets) |
Investment Companies | | 74.9% |
Common Stocks | | 21.8% |
U.S. Government Agency Notes | | 2.8% |
Investments Purchased with Cash Collateral from Securities Lending | | 0.4% |
OTC Purchased Options – Calls | | 0.1% |
Preferred Stocks | | 0.0% |
OTC Purchased Options – Puts | | 0.0% |
Other | | 0.0% |
| | | 100.0% |
| | |
Top Country Allocations - Long Positions - (% of Investment Securities) |
As of December 31, 2019 
| As of June 30, 2019 
|
Janus Henderson Adaptive Global Allocation Fund (unaudited)
Performance
| |
See important disclosures on the next page. |
| | | | | | | | | | |
| | | | | | | | | |
| | | | | | | | | |
Average Annual Total Return - for the periods ended December 31, 2019 | | | Expense Ratios |
| | Fiscal
Year-to-Date | One
Year | Since
Inception* | | | Total Annual Fund
Operating Expenses‡ | Net Annual Fund
Operating Expenses‡ |
Class A Shares at NAV | | 3.79% | 13.71% | 4.61% | | | 1.84% | 1.12% |
Class A Shares at MOP | | -2.18% | 7.22% | 3.25% | | | | |
Class C Shares at NAV | | 3.83% | 13.90% | 4.06% | | | 2.58% | 1.84% |
Class C Shares at CDSC | | 2.83% | 12.90% | 4.06% | | | | |
Class D Shares(1) | | 3.93% | 13.97% | 4.71% | | | 1.53% | 0.96% |
Class I Shares | | 3.94% | 13.96% | 4.86% | | | 1.45% | 0.87% |
Class N Shares | | 3.98% | 14.11% | 4.91% | | | 1.36% | 0.81% |
Class S Shares | | 3.86% | 13.99% | 4.57% | | | 2.10% | 1.31% |
Class T Shares | | 3.83% | 13.85% | 4.71% | | | 1.72% | 1.06% |
MSCI All Country World Index | | 8.92% | 26.60% | 7.93% | | | | |
Adaptive Global Allocation 60/40 Index (Hedged) | | 6.21% | 19.18% | 6.58% | | | | |
Bloomberg Barclays Global Aggregate Bond Index (USD Hedged) | | 2.09% | 8.22% | 4.09% | | | | |
Morningstar Quartile - Class I Shares | | - | 3rd | 2nd | | | | |
Morningstar Ranking - based on total returns for World Allocation Funds | | - | 386/480 | 171/401 | | | | |
Returns quoted are past performance and do not guarantee future results; current performance may be lower or higher. Investment returns and principal value will vary; there may be a gain or loss when shares are sold. For the most recent month-end performance call 800.668.0434 (or 800.525.3713 if you hold shares directly with Janus Henderson) or visit janushenderson.com/performance (or janushenderson.com/allfunds if you hold shares directly with Janus Henderson).
Maximum Offering Price (MOP) returns include the maximum sales charge of 5.75%. Net Asset Value (NAV) returns exclude this charge, which would have reduced returns.
CDSC returns include a 1% contingent deferred sales charge (CDSC) on Shares redeemed within 12 months of purchase. Net Asset Value (NAV) returns exclude this charge, which would have reduced returns.
Janus Henderson Adaptive Global Allocation Fund (unaudited)
Performance
Net expense ratios reflect the expense waiver, if any, contractually agreed to through October 28, 2020.
Performance may be affected by risks that include those associated with non-diversification, portfolio turnover, short sales, potential conflicts of interest, foreign and emerging markets, initial public offerings (IPOs), high-yield and high-risk securities, undervalued, overlooked and smaller capitalization companies, real estate related securities including Real Estate Investment Trusts (REITs), derivatives, and commodity-linked investments. Each product has different risks. Please see the prospectus for more information about risks, holdings and other details.
There is a risk that the Fund’s investments will correlate with stocks and bonds to a greater degree than anticipated, and the investment process may not achieve the desired results. The Fund may underperform during up markets and be negatively affected in down markets. Diversification does not assure a profit or eliminate the risk of loss.
Returns include reinvestment of all dividends and distributions and do not reflect the deduction of taxes that a shareholder would pay on Fund distributions or redemptions of Fund shares. The returns do not include adjustments in accordance with generally accepted accounting principles required at the period end for financial reporting purposes.
Ranking is for the share class shown only; other classes may have different performance characteristics. When an expense waiver is in effect, it may have a material effect on the total return, and therefore the ranking for the period.
© 2019 Morningstar, Inc. All Rights Reserved.
There is no assurance that the investment process will consistently lead to successful investing.
See Notes to Schedule of Investments and Other Information for index definitions.
Index performance does not reflect the expenses of managing a portfolio as an index is unmanaged and not available for direct investment.
See “Useful Information About Your Fund Report.”
*The Fund’s inception date – June 23, 2015
‡ As stated in the prospectus. See Financial Highlights for actual expense ratios during the reporting period.
(1) Closed to certain new investors.
Janus Henderson Adaptive Global Allocation Fund (unaudited)
Expense Examples
As a shareholder of the Fund, you incur two types of costs: (1) transaction costs, such as sales charges (loads) on purchase payments (applicable to Class A Shares only); and (2) ongoing costs, including management fees; 12b-1 distribution and shareholder servicing fees; transfer agent fees and expenses payable pursuant to the Transfer Agency Agreement; and other Fund expenses. This example is intended to help you understand your ongoing costs (in dollars) of investing in the Fund and to compare these costs with the ongoing costs of investing in other mutual funds. To do so, compare this 5% hypothetical example with the 5% hypothetical examples that appear in the shareholder reports of the other funds. The example is based upon an investment of $1,000 invested at the beginning of the period and held for the six-months indicated, unless noted otherwise in the table and footnotes below.
Actual Expenses
The information in the table under the heading “Actual” provides information about actual account values and actual expenses. You may use the information in these columns, together with the amount you invested, to estimate the expenses that you paid over the period. Simply divide your account value by $1,000 (for example, an $8,600 account value divided by $1,000 = 8.6), then multiply the result by the number in the appropriate column for your share class under the heading entitled “Expenses Paid During Period” to estimate the expenses you paid on your account during the period.
Hypothetical Example for Comparison Purposes
The information in the table under the heading “Hypothetical (5% return before expenses)” provides information about hypothetical account values and hypothetical expenses based upon the Fund’s actual expense ratio and an assumed rate of return of 5% per year before expenses, which is not the Fund’s actual return. The hypothetical account values and expenses may not be used to estimate the actual ending account balance or expenses you paid for the period. You may use this information to compare the ongoing costs of investing in the Fund and other funds. To do so, compare this 5% hypothetical example with the 5% hypothetical examples that appear in the shareholder reports of the other funds. Additionally, for an analysis of the fees associated with an investment in any share class or other similar funds, please visit www.finra.org/fundanalyzer.
Please note that the expenses shown in the table are meant to highlight your ongoing costs only and do not reflect any transaction costs. These fees are fully described in the Fund’s prospectuses. Therefore, the hypothetical examples are useful in comparing ongoing costs only, and will not help you determine the relative total costs of owning different funds. In addition, if these transaction costs were included, your costs would have been higher.
| | | | | | | | | | | |
| | | | | | | | | |
| | | | Actual | | Hypothetical
(5% return before expenses) | |
| Beginning
Account
Value
(7/1/19) | Ending
Account
Value
(12/31/19) | Expenses
Paid During
Period
(7/1/19 - 12/31/19)† | | Beginning
Account
Value
(7/1/19) | Ending
Account
Value
(12/31/19) | Expenses
Paid During
Period
(7/1/19 - 12/31/19)† | Net Annualized
Expense Ratio
(7/1/19 - 12/31/19) |
Class A Shares | $1,000.00 | $1,037.90 | $5.23 | | $1,000.00 | $1,020.01 | $5.18 | 1.02% |
Class C Shares | $1,000.00 | $1,038.30 | $5.07 | | $1,000.00 | $1,020.16 | $5.03 | 0.99% |
Class D Shares | $1,000.00 | $1,039.30 | $4.31 | | $1,000.00 | $1,020.91 | $4.27 | 0.84% |
Class I Shares | $1,000.00 | $1,039.40 | $3.95 | | $1,000.00 | $1,021.27 | $3.91 | 0.77% |
Class N Shares | $1,000.00 | $1,039.80 | $3.64 | | $1,000.00 | $1,021.57 | $3.61 | 0.71% |
Class S Shares | $1,000.00 | $1,038.60 | $4.30 | | $1,000.00 | $1,020.91 | $4.27 | 0.84% |
Class T Shares | $1,000.00 | $1,038.30 | $4.56 | | $1,000.00 | $1,020.66 | $4.52 | 0.89% |
† | Expenses Paid During Period are equal to the Net Annualized Expense Ratio multiplied by the average account value over the period, multiplied by 184/366 (to reflect the one-half year period). Expenses in the examples include the effect of applicable fee waivers and/or expense reimbursements, if any. Had such waivers and/or reimbursements not been in effect, your expenses would have been higher. Please refer to the Notes to Financial Statements or the Fund’s prospectuses for more information regarding waivers and/or reimbursements. |
Janus Henderson Adaptive Global Allocation Fund
Schedule of Investments (unaudited)
December 31, 2019
| | | | | | | | |
Shares/Principal/
Contract Amounts | | | Value | |
Common Stocks – 21.8% | | | |
Aerospace & Defense – 0.1% | | | |
| | Airbus SE | | 22 | | | $3,220 | |
| | Arconic Inc | | 151 | | | 4,646 | |
| | BAE Systems PLC | | 503 | | | 3,763 | |
| | CAE Inc | | 221 | | | 5,852 | |
| | General Dynamics Corp | | 42 | | | 7,407 | |
| | Huntington Ingalls Industries Inc | | 13 | | | 3,261 | |
| | L3Harris Technologies Inc | | 22 | | | 4,353 | |
| | Leonardo SpA | | 58 | | | 680 | |
| | Meggitt PLC | | 721 | | | 6,272 | |
| | Raytheon Co | | 36 | | | 7,911 | |
| | Thales SA | | 18 | | | 1,868 | |
| | | 49,233 | |
Air Freight & Logistics – 0% | | | |
| | Bollore SA | | 483 | | | 2,107 | |
| | Deutsche Post AG | | 13 | | | 496 | |
| | Expeditors International of Washington Inc | | 86 | | | 6,710 | |
| | FedEx Corp | | 151 | | | 22,833 | |
| | | 32,146 | |
Airlines – 0.1% | | | |
| | Alaska Air Group Inc | | 11 | | | 745 | |
| | American Airlines Group Inc | | 222 | | | 6,367 | |
| | ANA Holdings Inc | | 100 | | | 3,352 | |
| | Delta Air Lines Inc | | 21 | | | 1,228 | |
| | easyJet PLC | | 21 | | | 396 | |
| | Southwest Airlines Co | | 306 | | | 16,518 | |
| | United Airlines Holdings Inc* | | 118 | | | 10,395 | |
| | | 39,001 | |
Auto Components – 0% | | | |
| | Aptiv PLC | | 113 | | | 10,732 | |
| | Bridgestone Corp | | 100 | | | 3,746 | |
| | Cie Generale des Etablissements Michelin SCA | | 28 | | | 3,426 | |
| | NGK Spark Plug Co Ltd | | 100 | | | 1,964 | |
| | Nokian Renkaat Oyj | | 254 | | | 7,302 | |
| | Valeo SA | | 28 | | | 986 | |
| | Yokohama Rubber Co Ltd | | 100 | | | 1,962 | |
| | | 30,118 | |
Automobiles – 0.1% | | | |
| | Daimler AG | | 28 | | | 1,550 | |
| | Ferrari NV | | 24 | | | 3,981 | |
| | Fiat Chrysler Automobiles NV | | 283 | | | 4,188 | |
| | Ford Motor Co | | 3,871 | | | 36,000 | |
| | Mitsubishi Motors Corp | | 400 | | | 1,686 | |
| | Peugeot SA | | 153 | | | 3,655 | |
| | Renault SA | | 216 | | | 10,219 | |
| | Toyota Motor Corp | | 100 | | | 7,101 | |
| | | 68,380 | |
Banks – 0.5% | | | |
| | Aozora Bank Ltd | | 200 | | | 5,322 | |
| | Banco de Sabadell SA | | 11,520 | | | 13,438 | |
| | Bank of East Asia Ltd | | 3,800 | | | 8,486 | |
| | Bankia SA | | 2,001 | | | 4,270 | |
| | Bankinter SA | | 654 | | | 4,791 | |
| | Barclays PLC | | 787 | | | 1,872 | |
| | Bendigo & Adelaide Bank Ltd | | 894 | | | 6,134 | |
| | BOC Hong Kong Holdings Ltd | | 3,000 | | | 10,415 | |
| | Chiba Bank Ltd | | 400 | | | 2,331 | |
| | Citizens Financial Group Inc | | 481 | | | 19,533 | |
| | Commerzbank AG | | 140 | | | 866 | |
| | Commonwealth Bank of Australia | | 28 | | | 1,570 | |
| | |
See Notes to Schedule of Investments and Other Information and Notes to Financial Statements. |
| |
Janus Investment Fund | 7 |
Janus Henderson Adaptive Global Allocation Fund
Schedule of Investments (unaudited)
December 31, 2019
| | | | | | | | | |
Shares/Principal/
Contract Amounts | | | Value | |
Common Stocks – (continued) | | | |
Banks – (continued) | | | |
| | Concordia Financial Group Ltd | | 700 | | | $2,912 | |
| | DNB ASA | | 318 | | | 5,942 | |
| | Hang Seng Bank Ltd | | 1,700 | | | 35,127 | |
| | Intesa Sanpaolo SpA | | 3,314 | | | 8,729 | |
| | Japan Post Bank Co Ltd | | 2,900 | | | 28,028 | |
| | KeyCorp | | 1,355 | | | 27,425 | |
| | National Australia Bank Ltd | | 3,153 | | | 54,485 | |
| | Oversea-Chinese Banking Corp Ltd | | 1,700 | | | 13,882 | |
| | People's United Financial Inc | | 91 | | | 1,538 | |
| | Raiffeisen Bank International AG | | 228 | | | 5,726 | |
| | Regions Financial Corp | | 462 | | | 7,928 | |
| | Seven Bank Ltd | | 2,300 | | | 7,579 | |
| | Shizuoka Bank Ltd | | 600 | | | 4,518 | |
| | Standard Chartered PLC | | 117 | | | 1,104 | |
| | Sumitomo Mitsui Financial Group Inc | | 200 | | | 7,434 | |
| | Svenska Handelsbanken AB | | 127 | | | 1,369 | |
| | United Overseas Bank Ltd | | 500 | | | 9,821 | |
| | Westpac Banking Corp | | 217 | | | 3,689 | |
| | | 306,264 | |
Beverages – 0.1% | | | |
| | Brown-Forman Corp | | 335 | | | 22,646 | |
| | Coca-Cola Amatil Ltd | | 454 | | | 3,523 | |
| | Coca-Cola Bottlers Japan Holdings Inc | | 100 | | | 2,569 | |
| | Coca-Cola Co | | 578 | | | 31,992 | |
| | Coca-Cola HBC AG* | | 241 | | | 8,187 | |
| | Davide Campari-Milano SpA | | 817 | | | 7,459 | |
| | Heineken NV | | 100 | | | 10,646 | |
| | Suntory Beverage & Food Ltd | | 100 | | | 4,184 | |
| | Treasury Wine Estates Ltd | | 312 | | | 3,555 | |
| | | 94,761 | |
Biotechnology – 0.2% | | | |
| | AbbVie Inc | | 38 | | | 3,365 | |
| | Alexion Pharmaceuticals Inc* | | 176 | | | 19,034 | |
| | Amgen Inc | | 9 | | | 2,170 | |
| | BeiGene Ltd (ADR)* | | 10 | | | 1,658 | |
| | Biogen Inc* | | 46 | | | 13,650 | |
| | CSL Ltd | | 46 | | | 8,900 | |
| | Gilead Sciences Inc | | 869 | | | 56,468 | |
| | Grifols SA | | 652 | | | 22,984 | |
| | Incyte Corp* | | 168 | | | 14,670 | |
| | Vertex Pharmaceuticals Inc* | | 62 | | | 13,575 | |
| | | 156,474 | |
Building Products – 0% | | | |
| | Allegion PLC | | 154 | | | 19,179 | |
| | AO Smith Corp | | 155 | | | 7,384 | |
| | Cie de Saint-Gobain | | 7 | | | 287 | |
| | Masco Corp | | 58 | | | 2,783 | |
| | | 29,633 | |
Capital Markets – 0.3% | | | |
| | 3i Group PLC | | 152 | | | 2,210 | |
| | ASX Ltd | | 112 | | | 6,161 | |
| | BlackRock Inc | | 4 | | | 2,011 | |
| | CI Financial Corp | | 138 | | | 2,307 | |
| | CME Group Inc | | 54 | | | 10,839 | |
| | Deutsche Boerse AG | | 22 | | | 3,458 | |
| | E*TRADE Financial Corp | | 366 | | | 16,605 | |
| | Franklin Resources Inc | | 126 | | | 3,273 | |
| | Hong Kong Exchanges & Clearing Ltd | | 600 | | | 19,482 | |
| | Invesco Ltd | | 224 | | | 4,028 | |
| | |
See Notes to Schedule of Investments and Other Information and Notes to Financial Statements. |
| |
8 | DECEMBER 31, 2019 |
Janus Henderson Adaptive Global Allocation Fund
Schedule of Investments (unaudited)
December 31, 2019
| | | | | | | | | |
Shares/Principal/
Contract Amounts | | | Value | |
Common Stocks – (continued) | | | |
Capital Markets – (continued) | | | |
| | Japan Exchange Group Inc | | 500 | | | $8,883 | |
| | London Stock Exchange Group PLC | | 103 | | | 10,572 | |
| | MSCI Inc | | 21 | | | 5,422 | |
| | Nasdaq Inc | | 351 | | | 37,592 | |
| | Partners Group Holding AG | | 20 | | | 18,342 | |
| | S&P Global Inc | | 70 | | | 19,113 | |
| | Schroders PLC | | 128 | | | 5,652 | |
| | Singapore Exchange Ltd | | 2,300 | | | 15,155 | |
| | State Street Corp | | 58 | | | 4,588 | |
| | | 195,693 | |
Chemicals – 0.4% | | | |
| | Air Liquide SA | | 116 | | | 16,419 | |
| | Air Products & Chemicals Inc | | 6 | | | 1,410 | |
| | Air Water Inc | | 100 | | | 1,473 | |
| | Albemarle Corp | | 62 | | | 4,528 | |
| | BASF SE | | 148 | | | 11,180 | |
| | Celanese Corp | | 143 | | | 17,606 | |
| | CF Industries Holdings Inc | | 136 | | | 6,493 | |
| | Clariant AG* | | 847 | | | 18,908 | |
| | Covestro AG (144A) | | 86 | | | 3,998 | |
| | Daicel Corp | | 300 | | | 2,897 | |
| | DuPont de Nemours Inc | | 49 | | | 3,146 | |
| | Eastman Chemical Co | | 83 | | | 6,579 | |
| | Ecolab Inc | | 65 | | | 12,544 | |
| | Evonik Industries AG | | 144 | | | 4,395 | |
| | FMC Corp | | 153 | | | 15,272 | |
| | Givaudan SA | | 7 | | | 21,927 | |
| | Incitec Pivot Ltd | | 2,035 | | | 4,540 | |
| | International Flavors & Fragrances Inc | | 45 | | | 5,806 | |
| | JSR Corp | | 100 | | | 1,852 | |
| | Kaneka Corp | | 100 | | | 3,240 | |
| | Kansai Paint Co Ltd | | 100 | | | 2,464 | |
| | LANXESS AG | | 34 | | | 2,281 | |
| | Mitsubishi Gas Chemical Co Inc | | 200 | | | 3,082 | |
| | Mosaic Co | | 311 | | | 6,730 | |
| | Nissan Chemical Corp | | 100 | | | 4,230 | |
| | Orica Ltd | | 218 | | | 3,362 | |
| | Sherwin-Williams Co | | 10 | | | 5,835 | |
| | Showa Denko KK | | 100 | | | 2,668 | |
| | Sumitomo Chemical Co Ltd | | 800 | | | 3,667 | |
| | Symrise AG | | 48 | | | 5,050 | |
| | Teijin Ltd | | 200 | | | 3,765 | |
| | Tosoh Corp | | 300 | | | 4,681 | |
| | Umicore SA | | 120 | | | 5,836 | |
| | Yara International ASA | | 487 | | | 20,265 | |
| | | 238,129 | |
Commercial Services & Supplies – 0.1% | | | |
| | Brambles Ltd | | 275 | | | 2,261 | |
| | Cintas Corp | | 28 | | | 7,534 | |
| | Copart Inc* | | 31 | | | 2,819 | |
| | Edenred | | 129 | | | 6,670 | |
| | G4S PLC | | 1,932 | | | 5,578 | |
| | Rollins Inc | | 62 | | | 2,056 | |
| | Toppan Printing Co Ltd | | 100 | | | 2,081 | |
| | Waste Management Inc | | 78 | | | 8,889 | |
| | | 37,888 | |
Communications Equipment – 0.1% | | | |
| | Arista Networks Inc* | | 35 | | | 7,119 | |
| | Cisco Systems Inc | | 369 | | | 17,697 | |
| | |
See Notes to Schedule of Investments and Other Information and Notes to Financial Statements. |
| |
Janus Investment Fund | 9 |
Janus Henderson Adaptive Global Allocation Fund
Schedule of Investments (unaudited)
December 31, 2019
| | | | | | | | | |
Shares/Principal/
Contract Amounts | | | Value | |
Common Stocks – (continued) | | | |
Communications Equipment – (continued) | | | |
| | Nokia OYJ | | 7,042 | | | $26,033 | |
| | Telefonaktiebolaget LM Ericsson | | 644 | | | 5,610 | |
| | | 56,459 | |
Construction & Engineering – 0% | | | |
| | Bouygues SA | | 143 | | | 6,076 | |
| | CIMIC Group Ltd | | 101 | | | 2,348 | |
| | Ferrovial SA | | 515 | | | 15,579 | |
| | Jacobs Engineering Group Inc | | 20 | | | 1,797 | |
| | Skanska AB | | 46 | | | 1,040 | |
| | | 26,840 | |
Construction Materials – 0.1% | | | |
| | Boral Ltd | | 1,695 | | | 5,328 | |
| | HeidelbergCement AG | | 261 | | | 19,016 | |
| | Imerys SA | | 92 | | | 3,888 | |
| | James Hardie Industries PLC (CDI) | | 217 | | | 4,243 | |
| | LafargeHolcim Ltd* | | 129 | | | 7,159 | |
| | Martin Marietta Materials Inc | | 43 | | | 12,025 | |
| | Taiheiyo Cement Corp | | 200 | | | 5,919 | |
| | Vulcan Materials Co | | 66 | | | 9,503 | |
| | | 67,081 | |
Consumer Finance – 0% | | | |
| | Acom Co Ltd | | 1,600 | | | 7,320 | |
| | Synchrony Financial | | 77 | | | 2,773 | |
| | | 10,093 | |
Containers & Packaging – 0.1% | | | |
| | Avery Dennison Corp | | 206 | | | 26,949 | |
| | Ball Corp | | 57 | | | 3,686 | |
| | CCL Industries Inc | | 309 | | | 13,165 | |
| | International Paper Co | | 174 | | | 8,013 | |
| | Packaging Corp of America | | 131 | | | 14,671 | |
| | Sealed Air Corp | | 124 | | | 4,939 | |
| | Westrock Co | | 44 | | | 1,888 | |
| | | 73,311 | |
Distributors – 0.1% | | | |
| | LKQ Corp* | | 912 | | | 32,558 | |
Diversified Consumer Services – 0% | | | |
| | Benesse Holdings Inc | | 100 | | | 2,645 | |
| | H&R Block Inc | | 598 | | | 14,041 | |
| | | 16,686 | |
Diversified Financial Services – 0% | | | |
| | AMP Ltd | | 3,663 | | | 4,921 | |
| | Berkshire Hathaway Inc* | | 11 | | | 2,492 | |
| | Eurazeo SA | | 49 | | | 3,352 | |
| | Groupe Bruxelles Lambert SA | | 10 | | | 1,054 | |
| | Industrivarden AB | | 348 | | | 8,396 | |
| | Wendel SA | | 43 | | | 5,715 | |
| | | 25,930 | |
Diversified Telecommunication Services – 0.3% | | | |
| | AT&T Inc | | 2,767 | | | 108,134 | |
| | BCE Inc | | 33 | | | 1,529 | |
| | BT Group PLC | | 1,990 | | | 5,072 | |
| | CenturyLink Inc | | 232 | | | 3,065 | |
| | Deutsche Telekom AG | | 38 | | | 621 | |
| | Elisa OYJ | | 192 | | | 10,606 | |
| | HKT Trust & HKT Ltd | | 2,000 | | | 2,818 | |
| | Iliad SA | | 11 | | | 1,426 | |
| | Koninklijke KPN NV | | 4,127 | | | 12,179 | |
| | Orange SA | | 129 | | | 1,898 | |
| | PCCW Ltd | | 9,000 | | | 5,325 | |
| | |
See Notes to Schedule of Investments and Other Information and Notes to Financial Statements. |
| |
10 | DECEMBER 31, 2019 |
Janus Henderson Adaptive Global Allocation Fund
Schedule of Investments (unaudited)
December 31, 2019
| | | | | | | | | |
Shares/Principal/
Contract Amounts | | | Value | |
Common Stocks – (continued) | | | |
Diversified Telecommunication Services – (continued) | | | |
| | Singapore Telecommunications Ltd | | 2,300 | | | $5,765 | |
| | Swisscom AG (REG) | | 7 | | | 3,708 | |
| | Telefonica Deutschland Holding AG | | 3,053 | | | 8,848 | |
| | Telefonica SA | | 3,084 | | | 21,539 | |
| | Telenor ASA | | 184 | | | 3,301 | |
| | Telia Co AB | | 1,017 | | | 4,372 | |
| | Telstra Corp Ltd | | 901 | | | 2,238 | |
| | TELUS Corp | | 234 | | | 9,062 | |
| | | 211,506 | |
Electric Utilities – 0.2% | | | |
| | American Electric Power Co Inc | | 188 | | | 17,768 | |
| | AusNet Services | | 1,385 | | | 1,652 | |
| | Chugoku Electric Power Co Inc | | 300 | | | 3,949 | |
| | CLP Holdings Ltd | | 500 | | | 5,256 | |
| | Duke Energy Corp | | 141 | | | 12,861 | |
| | Electricite de France SA | | 309 | | | 3,441 | |
| | Emera Inc | | 20 | | | 859 | |
| | Endesa SA | | 156 | | | 4,163 | |
| | Enel SpA | | 689 | | | 5,465 | |
| | Eversource Energy | | 8 | | | 681 | |
| | Exelon Corp | | 173 | | | 7,887 | |
| | FirstEnergy Corp | | 63 | | | 3,062 | |
| | Fortum Oyj | | 88 | | | 2,171 | |
| | Iberdrola SA | | 1,305 | | | 13,437 | |
| | Kyushu Electric Power Co Inc | | 100 | | | 870 | |
| | NextEra Energy Inc | | 21 | | | 5,085 | |
| | Power Assets Holdings Ltd | | 2,000 | | | 14,631 | |
| | PPL Corp | | 239 | | | 8,575 | |
| | Red Electrica Corp SA | | 331 | | | 6,655 | |
| | Southern Co | | 44 | | | 2,803 | |
| | SSE PLC | | 232 | | | 4,420 | |
| | Terna Rete Elettrica Nazionale SpA | | 1,532 | | | 10,231 | |
| | Tohoku Electric Power Co Inc | | 100 | | | 996 | |
| | Tokyo Electric Power Co Holdings Inc* | | 100 | | | 430 | |
| | | 137,348 | |
Electrical Equipment – 0.1% | | | |
| | AMETEK Inc | | 159 | | | 15,859 | |
| | Fuji Electric Co Ltd | | 100 | | | 3,079 | |
| | Legrand SA | | 39 | | | 3,177 | |
| | Melrose Industries PLC | | 1,632 | | | 5,190 | |
| | Prysmian SpA | | 22 | | | 530 | |
| | Rockwell Automation Inc | | 25 | | | 5,067 | |
| | Siemens Gamesa Renewable Energy SA | | 544 | | | 9,540 | |
| | | 42,442 | |
Electronic Equipment, Instruments & Components – 0.3% | | | |
| | Alps Alpine Co Ltd | | 100 | | | 2,294 | |
| | Amphenol Corp | | 72 | | | 7,793 | |
| | CDW Corp/DE | | 711 | | | 101,559 | |
| | Hexagon AB | | 407 | | | 22,820 | |
| | IPG Photonics Corp* | | 13 | | | 1,884 | |
| | Keysight Technologies Inc* | | 199 | | | 20,423 | |
| | Kyocera Corp | | 100 | | | 6,885 | |
| | TE Connectivity Ltd | | 214 | | | 20,510 | |
| | Venture Corp Ltd | | 100 | | | 1,205 | |
| | | 185,373 | |
Energy Equipment & Services – 0.2% | | | |
| | Baker Hughes Co | | 750 | | | 19,222 | |
| | Halliburton Co | | 782 | | | 19,136 | |
| | National Oilwell Varco Inc | | 521 | | | 13,051 | |
| | |
See Notes to Schedule of Investments and Other Information and Notes to Financial Statements. |
| |
Janus Investment Fund | 11 |
Janus Henderson Adaptive Global Allocation Fund
Schedule of Investments (unaudited)
December 31, 2019
| | | | | | | | | |
Shares/Principal/
Contract Amounts | | | Value | |
Common Stocks – (continued) | | | |
Energy Equipment & Services – (continued) | | | |
| | Schlumberger Ltd | | 732 | | | $29,426 | |
| | TechnipFMC PLC | | 432 | | | 9,262 | |
| | Tenaris SA | | 890 | | | 10,032 | |
| | WorleyParsons Ltd | | 261 | | | 2,804 | |
| | | 102,933 | |
Entertainment – 4.4% | | | |
| | Activision Blizzard Inc | | 439 | | | 26,085 | |
| | Electronic Arts Inc* | | 444 | | | 47,734 | |
| | Konami Holdings Corp | | 100 | | | 4,128 | |
| | Netflix Inc* | | 97 | | | 31,386 | |
| | Take-Two Interactive Software Inc* | | 182 | | | 22,282 | |
| | Ubisoft Entertainment SA* | | 29 | | | 2,003 | |
| | Vivendi SA | | 724 | | | 20,967 | |
| | Walt Disney Co | | 18,970 | | | 2,743,631 | |
| | | 2,898,216 | |
Equity Real Estate Investment Trusts (REITs) – 0.3% | | | |
| | Alexandria Real Estate Equities Inc | | 29 | | | 4,686 | |
| | American Tower Corp | | 20 | | | 4,596 | |
| | Apartment Investment & Management Co | | 86 | | | 4,442 | |
| | Ascendas Real Estate Investment Trust | | 2,400 | | | 5,301 | |
| | AvalonBay Communities Inc | | 43 | | | 9,017 | |
| | Boston Properties Inc | | 22 | | | 3,033 | |
| | British Land Co PLC | | 130 | | | 1,100 | |
| | CapitaLand Commercial Trust | | 2,900 | | | 4,292 | |
| | CapitaLand Mall Trust | | 1,600 | | | 2,927 | |
| | Covivio | | 27 | | | 3,065 | |
| | Dexus | | 427 | | | 3,505 | |
| | Duke Realty Corp | | 80 | | | 2,774 | |
| | Equity Residential | | 87 | | | 7,040 | |
| | Essex Property Trust Inc | | 15 | | | 4,513 | |
| | Extra Space Storage Inc | | 24 | | | 2,535 | |
| | Federal Realty Investment Trust | | 50 | | | 6,436 | |
| | Gecina SA | | 2 | | | 358 | |
| | GPT Group | | 1,206 | | | 4,738 | |
| | H&R Real Estate Investment Trust | | 173 | | | 2,811 | |
| | Healthpeak Properties Inc | | 64 | | | 2,206 | |
| | Klepierre SA | | 59 | | | 2,240 | |
| | Macerich Co# | | 56 | | | 1,508 | |
| | Mid-America Apartment Communities Inc | | 40 | | | 5,274 | |
| | Mirvac Group | | 1,130 | | | 2,521 | |
| | Nippon Building Fund Inc | | 1 | | | 7,318 | |
| | Nippon Prologis REIT Inc | | 3 | | | 7,633 | |
| | Nomura Real Estate Master Fund Inc | | 19 | | | 32,459 | |
| | Public Storage | | 12 | | | 2,556 | |
| | Regency Centers Corp | | 19 | | | 1,199 | |
| | RioCan Real Estate Investment Trust | | 146 | | | 3,009 | |
| | Scentre Group | | 3,875 | | | 10,413 | |
| | Stockland | | 1,620 | | | 5,251 | |
| | UDR Inc | | 88 | | | 4,110 | |
| | Ventas Inc | | 102 | | | 5,889 | |
| | Vornado Realty Trust | | 15 | | | 998 | |
| | Weyerhaeuser Co | | 548 | | | 16,550 | |
| | | 188,303 | |
Food & Staples Retailing – 0.2% | | | |
| | Alimentation Couche-Tard Inc | | 215 | | | 6,824 | |
| | Dairy Farm International Holdings Ltd | | 100 | | | 571 | |
| | George Weston Ltd | | 109 | | | 8,648 | |
| | J Sainsbury PLC | | 1,317 | | | 4,010 | |
| | Kroger Co | | 469 | | | 13,596 | |
| | |
See Notes to Schedule of Investments and Other Information and Notes to Financial Statements. |
| |
12 | DECEMBER 31, 2019 |
Janus Henderson Adaptive Global Allocation Fund
Schedule of Investments (unaudited)
December 31, 2019
| | | | | | | | | |
Shares/Principal/
Contract Amounts | | | Value | |
Common Stocks – (continued) | | | |
Food & Staples Retailing – (continued) | | | |
| | Loblaw Cos Ltd | | 140 | | | $7,224 | |
| | METRO AG | | 851 | | | 13,697 | |
| | Metro Inc/CN | | 241 | | | 9,947 | |
| | Seven & i Holdings Co Ltd | | 100 | | | 3,685 | |
| | Sundrug Co Ltd | | 100 | | | 3,640 | |
| | Tesco PLC | �� | 386 | | | 1,305 | |
| | Walgreens Boots Alliance Inc | | 310 | | | 18,278 | |
| | Walmart Inc | | 26 | | | 3,090 | |
| | Wm Morrison Supermarkets PLC | | 2,906 | | | 7,690 | |
| | Woolworths Group Ltd | | 496 | | | 12,583 | |
| | | 114,788 | |
Food Products – 0.4% | | | |
| | Ajinomoto Co Inc | | 100 | | | 1,671 | |
| | Associated British Foods PLC | | 200 | | | 6,882 | |
| | Barry Callebaut AG (REG) | | 1 | | | 2,210 | |
| | Calbee Inc | | 100 | | | 3,272 | |
| | Campbell Soup Co | | 319 | | | 15,765 | |
| | Conagra Brands Inc | | 180 | | | 6,163 | |
| | Danone SA | | 65 | | | 5,388 | |
| | Hershey Co | | 386 | | | 56,734 | |
| | Hormel Foods Corp | | 730 | | | 32,930 | |
| | Kellogg Co | | 425 | | | 29,393 | |
| | Lamb Weston Holdings Inc | | 168 | | | 14,453 | |
| | McCormick & Co Inc/MD | | 178 | | | 30,212 | |
| | Nestle SA (REG) | | 140 | | | 15,160 | |
| | Orkla ASA | | 948 | | | 9,609 | |
| | Tyson Foods Inc | | 107 | | | 9,741 | |
| | WH Group Ltd (144A) | | 1,000 | | | 1,033 | |
| | Yakult Honsha Co Ltd | | 100 | | | 5,550 | |
| | Yamazaki Baking Co Ltd | | 100 | | | 1,794 | |
| | | 247,960 | |
Gas Utilities – 0.1% | | | |
| | APA Group | | 243 | | | 1,892 | |
| | Hong Kong & China Gas Co Ltd | | 3,200 | | | 6,251 | |
| | Naturgy Energy Group SA | | 491 | | | 12,336 | |
| | Snam SpA | | 1,064 | | | 5,592 | |
| | Toho Gas Co Ltd | | 100 | | | 4,105 | |
| | Tokyo Gas Co Ltd | | 100 | | | 2,441 | |
| | | 32,617 | |
Health Care Equipment & Supplies – 0.4% | | | |
| | Align Technology Inc* | | 8 | | | 2,232 | |
| | Asahi Intecc Co Ltd | | 100 | | | 2,946 | |
| | Baxter International Inc | | 376 | | | 31,441 | |
| | Boston Scientific Corp* | | 472 | | | 21,344 | |
| | Carl Zeiss Meditec AG | | 124 | | | 15,813 | |
| | Cooper Cos Inc | | 49 | | | 15,743 | |
| | Hologic Inc* | | 1,058 | | | 55,238 | |
| | IDEXX Laboratories Inc* | | 4 | | | 1,045 | |
| | Intuitive Surgical Inc* | | 20 | | | 11,823 | |
| | Koninklijke Philips NV | | 81 | | | 3,954 | |
| | ResMed Inc | | 201 | | | 31,149 | |
| | Smith & Nephew PLC | | 818 | | | 19,853 | |
| | Sonova Holding AG (REG) | | 1 | | | 229 | |
| | Straumann Holding AG | | 30 | | | 29,467 | |
| | Teleflex Inc | | 41 | | | 15,434 | |
| | Varian Medical Systems Inc* | | 112 | | | 15,905 | |
| | Zimmer Biomet Holdings Inc | | 67 | | | 10,029 | |
| | | 283,645 | |
| | |
See Notes to Schedule of Investments and Other Information and Notes to Financial Statements. |
| |
Janus Investment Fund | 13 |
Janus Henderson Adaptive Global Allocation Fund
Schedule of Investments (unaudited)
December 31, 2019
| | | | | | | | | |
Shares/Principal/
Contract Amounts | | | Value | |
Common Stocks – (continued) | | | |
Health Care Providers & Services – 0.4% | | | |
| | Alfresa Holdings Corp | | 100 | | | $2,051 | |
| | Anthem Inc | | 12 | | | 3,624 | |
| | Centene Corp* | | 114 | | | 7,167 | |
| | CVS Health Corp | | 291 | | | 21,618 | |
| | Fresenius Medical Care AG & Co KGaA | | 147 | | | 10,875 | |
| | Fresenius SE & Co KGaA | | 553 | | | 31,124 | |
| | Henry Schein Inc* | | 273 | | | 18,215 | |
| | Laboratory Corp of America Holdings* | | 223 | | | 37,725 | |
| | McKesson Corp | | 13 | | | 1,798 | |
| | Medipal Holdings Corp | | 100 | | | 2,221 | |
| | Quest Diagnostics Inc | | 472 | | | 50,405 | |
| | Ramsay Health Care Ltd | | 137 | | | 6,972 | |
| | Sonic Healthcare Ltd | | 347 | | | 6,999 | |
| | UnitedHealth Group Inc | | 16 | | | 4,704 | |
| | Universal Health Services Inc | | 188 | | | 26,970 | |
| | | 232,468 | |
Health Care Technology – 0% | | | |
| | Cerner Corp | | 94 | | | 6,899 | |
| | M3 Inc | | 100 | | | 3,042 | |
| | | 9,941 | |
Hotels, Restaurants & Leisure – 0.4% | | | |
| | Accor SA | | 365 | | | 17,092 | |
| | Carnival PLC | | 9 | | | 434 | |
| | Chipotle Mexican Grill Inc* | | 30 | | | 25,113 | |
| | Compass Group PLC | | 135 | | | 3,379 | |
| | Crown Resorts Ltd | | 573 | | | 4,828 | |
| | Darden Restaurants Inc | | 160 | | | 17,442 | |
| | Flight Centre Travel Group Ltd | | 13 | | | 402 | |
| | Flutter Entertainment PLC | | 102 | | | 12,396 | |
| | Galaxy Entertainment Group Ltd | | 1,000 | | | 7,367 | |
| | McDonald's Corp | | 616 | | | 121,728 | |
| | MGM China Holdings Ltd | | 2,800 | | | 4,571 | |
| | Restaurant Brands International Inc | | 163 | | | 10,392 | |
| | Sands China Ltd | | 1,200 | | | 6,414 | |
| | Starbucks Corp | | 86 | | | 7,561 | |
| | Tabcorp Holdings Ltd | | 3,143 | | | 9,989 | |
| | Whitbread PLC | | 30 | | | 1,925 | |
| | Yum! Brands Inc | | 269 | | | 27,096 | |
| | | 278,129 | |
Household Durables – 0.2% | | | |
| | DR Horton Inc | | 400 | | | 21,100 | |
| | Husqvarna AB | | 878 | | | 7,035 | |
| | Iida Group Holdings Co Ltd | | 100 | | | 1,766 | |
| | Lennar Corp | | 337 | | | 18,801 | |
| | Newell Brands Inc | | 401 | | | 7,707 | |
| | NVR Inc* | | 10 | | | 38,084 | |
| | Sekisui Chemical Co Ltd | | 200 | | | 3,505 | |
| | | 97,998 | |
Household Products – 0.3% | | | |
| | Church & Dwight Co Inc | | 55 | | | 3,869 | |
| | Clorox Co | | 331 | | | 50,822 | |
| | Colgate-Palmolive Co | | 611 | | | 42,061 | |
| | Henkel AG & Co KGaA | | 24 | | | 2,261 | |
| | Kimberly-Clark Corp | | 344 | | | 47,317 | |
| | Lion Corp | | 100 | | | 1,956 | |
| | Pigeon Corp | | 100 | | | 3,696 | |
| | Reckitt Benckiser Group PLC | | 155 | | | 12,582 | |
| | | 164,564 | |
| | |
See Notes to Schedule of Investments and Other Information and Notes to Financial Statements. |
| |
14 | DECEMBER 31, 2019 |
Janus Henderson Adaptive Global Allocation Fund
Schedule of Investments (unaudited)
December 31, 2019
| | | | | | | | | |
Shares/Principal/
Contract Amounts | | | Value | |
Common Stocks – (continued) | | | |
Independent Power and Renewable Electricity Producers – 0% | | | |
| | Electric Power Development Co Ltd | | 100 | | | $2,436 | |
| | Uniper SE | | 439 | | | 14,530 | |
| | | 16,966 | |
Industrial Conglomerates – 0.1% | | | |
| | CK Hutchison Holdings Ltd | | 2,000 | | | 19,071 | |
| | Roper Technologies Inc | | 45 | | | 15,940 | |
| | Smiths Group PLC | | 124 | | | 2,770 | |
| | | 37,781 | |
Information Technology Services – 0.8% | | | |
| | Akamai Technologies Inc* | | 710 | | | 61,330 | |
| | Alliance Data Systems Corp | | 173 | | | 19,411 | |
| | Amadeus IT Group SA | | 127 | | | 10,370 | |
| | Atos SE | | 160 | | | 13,337 | |
| | Broadridge Financial Solutions Inc | | 352 | | | 43,486 | |
| | Capgemini SA | | 76 | | | 9,283 | |
| | CGI Inc* | | 76 | | | 6,361 | |
| | Computershare Ltd | | 710 | | | 8,359 | |
| | DXC Technology Co | | 303 | | | 11,390 | |
| | Gartner Inc* | | 97 | | | 14,948 | |
| | Global Payments Inc | | 195 | | | 35,599 | |
| | International Business Machines Corp | | 51 | | | 6,836 | |
| | Jack Henry & Associates Inc | | 517 | | | 75,311 | |
| | Leidos Holdings Inc | | 117 | | | 11,453 | |
| | NTT Data Corp | | 100 | | | 1,350 | |
| | PayPal Holdings Inc* | | 445 | | | 48,136 | |
| | VeriSign Inc* | | 287 | | | 55,299 | |
| | Western Union Co | | 2,746 | | | 73,538 | |
| | Worldline SA/France (144A)* | | 209 | | | 14,803 | |
| | | 520,600 | |
Insurance – 0.7% | | | |
| | Aegon NV | | 359 | | | 1,638 | |
| | Ageas | | 259 | | | 15,303 | |
| | AIA Group Ltd | | 1,000 | | | 10,498 | |
| | Allstate Corp | | 112 | | | 12,594 | |
| | American International Group Inc | | 804 | | | 41,269 | |
| | Aon PLC | | 69 | | | 14,372 | |
| | Arthur J Gallagher & Co | | 381 | | | 36,283 | |
| | Assicurazioni Generali SpA | | 476 | | | 9,821 | |
| | Assurant Inc | | 97 | | | 12,715 | |
| | Chubb Ltd | | 41 | | | 6,382 | |
| | Cincinnati Financial Corp | | 194 | | | 20,399 | |
| | Direct Line Insurance Group PLC | | 6,099 | | | 25,242 | |
| | Everest Re Group Ltd | | 77 | | | 21,317 | |
| | Gjensidige Forsikring ASA | | 452 | | | 9,489 | |
| | Great-West Lifeco Inc | | 237 | | | 6,071 | |
| | Hartford Financial Services Group Inc | | 37 | | | 2,248 | |
| | Insurance Australia Group Ltd | | 2,549 | | | 13,699 | |
| | Intact Financial Corp | | 144 | | | 15,573 | |
| | Japan Post Holdings Co Ltd | | 2,300 | | | 21,721 | |
| | Legal & General Group PLC | | 283 | | | 1,136 | |
| | Lincoln National Corp | | 173 | | | 10,209 | |
| | Loews Corp | | 310 | | | 16,272 | |
| | Mapfre SA | | 2,986 | | | 7,904 | |
| | Marsh & McLennan Cos Inc | | 79 | | | 8,801 | |
| | Medibank Pvt Ltd | | 2,149 | | | 4,764 | �� |
| | MetLife Inc | | 118 | | | 6,014 | |
| | MS&AD Insurance Group Holdings Inc | | 300 | | | 9,971 | |
| | NN Group NV | | 43 | | | 1,631 | |
| | Poste Italiane SpA (144A) | | 804 | | | 9,126 | |
| | |
See Notes to Schedule of Investments and Other Information and Notes to Financial Statements. |
| |
Janus Investment Fund | 15 |
Janus Henderson Adaptive Global Allocation Fund
Schedule of Investments (unaudited)
December 31, 2019
| | | | | | | | | |
Shares/Principal/
Contract Amounts | | | Value | |
Common Stocks – (continued) | | | |
Insurance – (continued) | | | |
| | Power Corp of Canada | | 189 | | | $4,869 | |
| | Progressive Corp | | 122 | | | 8,832 | |
| | QBE Insurance Group Ltd | | 976 | | | 8,820 | |
| | RSA Insurance Group PLC | | 1,496 | | | 11,206 | |
| | Sampo Oyj | | 130 | | | 5,673 | |
| | SCOR SE | | 371 | | | 15,571 | |
| | Sony Financial Holdings Inc | | 400 | | | 9,676 | |
| | Travelers Cos Inc | | 52 | | | 7,121 | |
| | | 444,230 | |
Interactive Media & Services – 0.3% | | | |
| | Alphabet Inc - Class A* | | 52 | | | 69,648 | |
| | Facebook Inc* | | 260 | | | 53,365 | |
| | REA Group Ltd | | 18 | | | 1,308 | |
| | TripAdvisor Inc | | 427 | | | 12,972 | |
| | Twitter Inc* | | 2,283 | | | 73,170 | |
| | Z Holdings Corp | | 100 | | | 424 | |
| | | 210,887 | |
Internet & Direct Marketing Retail – 0.3% | | | |
| | Amazon.com Inc* | | 59 | | | 109,023 | |
| | Booking Holdings Inc* | | 3 | | | 6,161 | |
| | eBay Inc | | 1,173 | | | 42,357 | |
| | Expedia Group Inc | | 41 | | | 4,434 | |
| | Ocado Group PLC* | | 115 | | | 1,948 | |
| | Rakuten Inc | | 100 | | | 861 | |
| | | 164,784 | |
Leisure Products – 0.1% | | | |
| | Hasbro Inc | | 564 | | | 59,564 | |
| | Sankyo Co Ltd | | 100 | | | 3,337 | |
| | | 62,901 | |
Life Sciences Tools & Services – 0.1% | | | |
| | Illumina Inc* | | 33 | | | 10,947 | |
| | IQVIA Holdings Inc* | | 11 | | | 1,700 | |
| | Lonza Group AG* | | 13 | | | 4,745 | |
| | Mettler-Toledo International Inc* | | 15 | | | 11,899 | |
| | PerkinElmer Inc | | 136 | | | 13,206 | |
| | Waters Corp* | | 51 | | | 11,916 | |
| | | 54,413 | |
Machinery – 0.1% | | | |
| | Alfa Laval AB | | 216 | | | 5,442 | |
| | ANDRITZ AG | | 77 | | | 3,316 | |
| | CNH Industrial NV | | 111 | | | 1,219 | |
| | Dover Corp | | 83 | | | 9,567 | |
| | Fortive Corp | | 278 | | | 21,236 | |
| | Hino Motors Ltd | | 100 | | | 1,070 | |
| | IDEX Corp | | 75 | | | 12,900 | |
| | Ingersoll-Rand PLC | | 13 | | | 1,728 | |
| | JTEKT Corp | | 100 | | | 1,198 | |
| | Kone OYJ | | 134 | | | 8,759 | |
| | Metso OYJ | | 121 | | | 4,774 | |
| | MISUMI Group Inc | | 100 | | | 2,506 | |
| | Nabtesco Corp | | 100 | | | 3,005 | |
| | Sandvik AB | | 69 | | | 1,346 | |
| | Schindler Holding AG | | 34 | | | 8,651 | |
| | Snap-on Inc | | 37 | | | 6,268 | |
| | Wartsila OYJ Abp | | 272 | | | 3,005 | |
| | Weir Group PLC | | 36 | | | 720 | |
| | | 96,710 | |
Marine – 0% | | | |
| | Nippon Yusen KK | | 100 | | | 1,823 | |
| | |
See Notes to Schedule of Investments and Other Information and Notes to Financial Statements. |
| |
16 | DECEMBER 31, 2019 |
Janus Henderson Adaptive Global Allocation Fund
Schedule of Investments (unaudited)
December 31, 2019
| | | | | | | | | |
Shares/Principal/
Contract Amounts | | | Value | |
Common Stocks – (continued) | | | |
Media – 0.4% | | | |
| | Discovery Inc - Class A* | | 1,251 | | | $40,958 | |
| | DISH Network Corp* | | 322 | | | 11,421 | |
| | Eutelsat Communications SA | | 52 | | | 845 | |
| | Hakuhodo DY Holdings Inc | | 100 | | | 1,627 | |
| | Interpublic Group of Cos Inc | | 1,526 | | | 35,251 | |
| | ITV PLC | | 1,931 | | | 3,862 | |
| | JCDecaux SA | | 64 | | | 1,973 | |
| | News Corp | | 3,798 | | | 53,704 | |
| | Omnicom Group Inc | | 381 | | | 30,869 | |
| | Pearson PLC | | 460 | | | 3,881 | |
| | Publicis Groupe SA | | 147 | | | 6,654 | |
| | RTL Group SA | | 220 | | | 10,852 | |
| | SES SA | | 82 | | | 1,150 | |
| | Shaw Communications Inc | | 219 | | | 4,444 | |
| | Singapore Press Holdings Ltd | | 1,300 | | | 2,108 | |
| | Telenet Group Holding NV | | 101 | | | 4,538 | |
| | ViacomCBS Inc | | 1,059 | | | 44,446 | |
| | | 258,583 | |
Metals & Mining – 0.3% | | | |
| | Agnico Eagle Mines Ltd | | 176 | | | 10,841 | |
| | Anglo American PLC | | 67 | | | 1,928 | |
| | Antofagasta PLC | | 527 | | | 6,399 | |
| | Barrick Gold Corp | | 646 | | | 12,001 | |
| | BHP Group Ltd | | 361 | | | 9,858 | |
| | BlueScope Steel Ltd | | 287 | | | 3,032 | |
| | Boliden AB | | 319 | | | 8,466 | |
| | Evraz PLC | | 2,726 | | | 14,586 | |
| | Fortescue Metals Group Ltd | | 356 | | | 2,670 | |
| | Franco-Nevada Corp | | 48 | | | 4,957 | |
| | Freeport-McMoRan Inc | | 945 | | | 12,398 | |
| | Glencore PLC* | | 4,628 | | | 14,425 | |
| | Hitachi Metals Ltd | | 200 | | | 2,969 | |
| | Maruichi Steel Tube Ltd | | 100 | | | 2,835 | |
| | Newcrest Mining Ltd | | 387 | | | 8,213 | |
| | Newmont Goldcorp Corp | | 839 | | | 36,455 | |
| | Nippon Steel Corp | | 100 | | | 1,522 | |
| | Nucor Corp | | 156 | | | 8,780 | |
| | Rio Tinto PLC | | 50 | | | 2,982 | |
| | thyssenkrupp AG | | 992 | | | 13,396 | |
| | voestalpine AG | | 16 | | | 446 | |
| | | 179,159 | |
Multiline Retail – 0.1% | | | |
| | Dollar Tree Inc* | | 61 | | | 5,737 | |
| | Dollarama Inc | | 36 | | | 1,237 | |
| | Harvey Norman Holdings Ltd | | 516 | | | 1,473 | |
| | Isetan Mitsukoshi Holdings Ltd | | 200 | | | 1,811 | |
| | J Front Retailing Co Ltd | | 100 | | | 1,408 | |
| | Kohl's Corp | | 51 | | | 2,598 | |
| | Macy's Inc | | 679 | | | 11,543 | |
| | Marks & Spencer Group PLC | | 2,866 | | | 8,104 | |
| | Next PLC | | 79 | | | 7,343 | |
| | Nordstrom Inc | | 247 | | | 10,110 | |
| | Pan Pacific International Holdings Corp | | 100 | | | 1,667 | |
| | Target Corp | | 225 | | | 28,847 | |
| | Wesfarmers Ltd | | 388 | | | 11,270 | |
| | | 93,148 | |
Multi-Utilities – 0.1% | | | |
| | AGL Energy Ltd | | 329 | | | 4,739 | |
| | Atco Ltd/Canada | | 250 | | | 9,583 | |
| | |
See Notes to Schedule of Investments and Other Information and Notes to Financial Statements. |
| |
Janus Investment Fund | 17 |
Janus Henderson Adaptive Global Allocation Fund
Schedule of Investments (unaudited)
December 31, 2019
| | | | | | | | | |
Shares/Principal/
Contract Amounts | | | Value | |
Common Stocks – (continued) | | | |
Multi-Utilities – (continued) | | | |
| | Canadian Utilities Ltd | | 190 | | | $5,732 | |
| | Consolidated Edison Inc | | 95 | | | 8,595 | |
| | Dominion Energy Inc | | 89 | | | 7,371 | |
| | Public Service Enterprise Group Inc | | 292 | | | 17,243 | |
| | RWE AG | | 11 | | | 337 | |
| | Sempra Energy | | 33 | | | 4,999 | |
| | Suez | | 187 | | | 2,828 | |
| | Veolia Environnement SA | | 134 | | | 3,563 | |
| | | 64,990 | |
Oil, Gas & Consumable Fuels – 1.0% | | | |
| | Apache Corp | | 163 | | | 4,171 | |
| | BP PLC | | 4,774 | | | 29,818 | |
| | Cabot Oil & Gas Corp | | 1,149 | | | 20,004 | |
| | Caltex Australia Ltd | | 197 | | | 4,692 | |
| | Canadian Natural Resources Ltd | | 50 | | | 1,617 | |
| | Chevron Corp | | 11 | | | 1,326 | |
| | Cimarex Energy Co | | 114 | | | 5,984 | |
| | Concho Resources Inc | | 87 | | | 7,619 | |
| | ConocoPhillips | | 660 | | | 42,920 | |
| | Devon Energy Corp | | 391 | | | 10,154 | |
| | Diamondback Energy Inc | | 119 | | | 11,050 | |
| | Encana Corp | | 1,656 | | | 7,755 | |
| | Eni SpA | | 2,253 | | | 34,988 | |
| | EOG Resources Inc | | 301 | | | 25,212 | |
| | Equinor ASA | | 1,178 | | | 23,557 | |
| | Exxon Mobil Corp | | 158 | | | 11,025 | |
| | Hess Corp | | 154 | | | 10,289 | |
| | Idemitsu Kosan Co Ltd | | 100 | | | 2,789 | |
| | Imperial Oil Ltd | | 488 | | | 12,910 | |
| | Keyera Corp | | 439 | | | 11,502 | |
| | Kinder Morgan Inc/DE | | 2,830 | | | 59,911 | |
| | Koninklijke Vopak NV | | 189 | | | 10,245 | |
| | Lundin Petroleum AB | | 222 | | | 7,547 | |
| | Marathon Oil Corp | | 1,352 | | | 18,360 | |
| | Marathon Petroleum Corp | | 373 | | | 22,473 | |
| | Neste Oyj | | 405 | | | 14,091 | |
| | Occidental Petroleum Corp | | 890 | | | 36,677 | |
| | Oil Search Ltd | | 983 | | | 5,000 | |
| | OMV AG | | 633 | | | 35,556 | |
| | Origin Energy Ltd | | 1,097 | | | 6,504 | |
| | Phillips 66 | | 93 | | | 10,361 | |
| | Pioneer Natural Resources Co | | 154 | | | 23,311 | |
| | Santos Ltd | | 639 | | | 3,667 | |
| | Suncor Energy Inc | | 481 | | | 15,767 | |
| | TC Energy Corp | | 737 | | | 39,257 | |
| | TOTAL SA | | 347 | | | 19,148 | |
| | Valero Energy Corp | | 131 | | | 12,268 | |
| | Vermilion Energy Inc | | 317 | | | 5,183 | |
| | Washington H Soul Pattinson & Co Ltd | | 207 | | | 3,122 | |
| | Williams Cos Inc | | 650 | | | 15,418 | |
| | Woodside Petroleum Ltd | | 302 | | | 7,285 | |
| | | 650,533 | |
Paper & Forest Products – 0.1% | | | |
| | Mondi PLC | | 228 | | | 5,352 | |
| | Stora Enso Oyj | | 2,329 | | | 33,867 | |
| | UPM-Kymmene Oyj | | 175 | | | 6,067 | |
| | | 45,286 | |
Personal Products – 0% | | | |
| | Coty Inc | | 442 | | | 4,973 | |
| | |
See Notes to Schedule of Investments and Other Information and Notes to Financial Statements. |
| |
18 | DECEMBER 31, 2019 |
Janus Henderson Adaptive Global Allocation Fund
Schedule of Investments (unaudited)
December 31, 2019
| | | | | | | | | |
Shares/Principal/
Contract Amounts | | | Value | |
Common Stocks – (continued) | | | |
Personal Products – (continued) | | | |
| | Pola Orbis Holdings Inc | | 100 | | | $2,406 | |
| | | 7,379 | |
Pharmaceuticals – 0.3% | | | |
| | Astellas Pharma Inc | | 100 | | | 1,721 | |
| | AstraZeneca PLC | | 152 | | | 15,314 | |
| | Aurora Cannabis Inc* | | 211 | | | 453 | |
| | Bristol-Myers Squibb Co | | 339 | | | 21,760 | |
| | Eli Lilly & Co | | 376 | | | 49,418 | |
| | Merck KGaA | | 40 | | | 4,726 | |
| | Mitsubishi Tanabe Pharma Corp | | 200 | | | 3,697 | |
| | Novartis AG | | 284 | | | 26,974 | |
| | Ono Pharmaceutical Co Ltd | | 100 | | | 2,303 | |
| | Roche Holding AG | | 75 | | | 24,339 | |
| | Sanofi | | 155 | | | 15,580 | |
| | Santen Pharmaceutical Co Ltd | | 100 | | | 1,920 | |
| | UCB SA | | 95 | | | 7,555 | |
| | Vifor Pharma AG | | 200 | | | 36,513 | |
| | | 212,273 | |
Professional Services – 0.1% | | | |
| | Bureau Veritas SA | | 161 | | | 4,200 | |
| | IHS Markit Ltd* | | 304 | | | 22,906 | |
| | SEEK Ltd | | 172 | | | 2,721 | |
| | Wolters Kluwer NV | | 42 | | | 3,063 | |
| | | 32,890 | |
Real Estate Management & Development – 0.1% | | | |
| | Aeon Mall Co Ltd | | 200 | | | 3,568 | |
| | CK Asset Holdings Ltd | | 500 | | | 3,610 | |
| | Deutsche Wohnen SE | | 29 | | | 1,185 | |
| | Henderson Land Development Co Ltd | | 3,000 | | | 14,727 | |
| | Hulic Co Ltd | | 400 | | | 4,845 | |
| | New World Development Co Ltd | | 3,000 | | | 4,112 | |
| | Swire Pacific Ltd | | 1,000 | | | 9,292 | |
| | Swiss Prime Site AG (REG)* | | 9 | | | 1,041 | |
| | Vonovia SE | | 11 | | | 592 | |
| | Wharf Holdings Ltd | | 4,000 | | | 10,175 | |
| | | 53,147 | |
Road & Rail – 0.1% | | | |
| | Aurizon Holdings Ltd | | 2,097 | | | 7,695 | |
| | CSX Corp | | 136 | | | 9,841 | |
| | Hankyu Hanshin Holdings Inc | | 100 | | | 4,308 | |
| | MTR Corp Ltd | | 2,000 | | | 11,820 | |
| | Tokyu Corp | | 200 | | | 3,717 | |
| | | 37,381 | |
Semiconductor & Semiconductor Equipment – 0.2% | | | |
| | Advanced Micro Devices Inc* | | 833 | | | 38,201 | |
| | Applied Materials Inc | | 184 | | | 11,231 | |
| | ASM Pacific Technology Ltd | | 100 | | | 1,387 | |
| | ASML Holding NV | | 55 | | | 16,267 | |
| | Infineon Technologies AG | | 313 | | | 7,130 | |
| | Maxim Integrated Products Inc | | 78 | | | 4,798 | |
| | Microchip Technology Inc | | 62 | | | 6,493 | |
| | Micron Technology Inc* | | 170 | | | 9,143 | |
| | NVIDIA Corp | | 45 | | | 10,588 | |
| | NXP Semiconductors NV | | 12 | | | 1,527 | |
| | STMicroelectronics NV | | 480 | | | 12,905 | |
| | Xilinx Inc | | 384 | | | 37,544 | |
| | | 157,214 | |
Software – 0.4% | | | |
| | Adobe Inc* | | 87 | | | 28,693 | |
| | |
See Notes to Schedule of Investments and Other Information and Notes to Financial Statements. |
| |
Janus Investment Fund | 19 |
Janus Henderson Adaptive Global Allocation Fund
Schedule of Investments (unaudited)
December 31, 2019
| | | | | | | | | |
Shares/Principal/
Contract Amounts | | | Value | |
Common Stocks – (continued) | | | |
Software – (continued) | | | |
| | ANSYS Inc* | | 24 | | | $6,178 | |
| | Cadence Design Systems Inc* | | 127 | | | 8,809 | |
| | Citrix Systems Inc | | 371 | | | 41,144 | |
| | Dassault Systemes SE | | 80 | | | 13,150 | |
| | Fortinet Inc* | | 105 | | | 11,210 | |
| | Microsoft Corp | | 25 | | | 3,943 | |
| | NortonLifeLock Inc | | 1,157 | | | 29,527 | |
| | Open Text Corp | | 1,056 | | | 46,538 | |
| | Oracle Corp | | 374 | | | 19,815 | |
| | Sage Group PLC | | 919 | | | 9,116 | |
| | Salesforce.Com Inc* | | 93 | | | 15,126 | |
| | Synopsys Inc* | | 39 | | | 5,429 | |
| | Temenos AG (REG)* | | 128 | | | 20,266 | |
| | | 258,944 | |
Specialty Retail – 0.3% | | | |
| | Advance Auto Parts Inc | | 54 | | | 8,649 | |
| | AutoZone Inc* | | 34 | | | 40,505 | |
| | CarMax Inc* | | 125 | | | 10,959 | |
| | Gap Inc | | 606 | | | 10,714 | |
| | Kingfisher PLC | | 3,736 | | | 10,737 | |
| | L Brands Inc | | 397 | | | 7,194 | |
| | O'Reilly Automotive Inc* | | 14 | | | 6,136 | |
| | Ross Stores Inc | | 166 | | | 19,326 | |
| | TJX Cos Inc | | 111 | | | 6,778 | |
| | Tractor Supply Co | | 449 | | | 41,955 | |
| | Ulta Beauty Inc* | | 136 | | | 34,427 | |
| | | 197,380 | |
Technology Hardware, Storage & Peripherals – 2.9% | | | |
| | Apple Inc | | 6,390 | | | 1,876,423 | |
| | Brother Industries Ltd | | 100 | | | 2,090 | |
| | FUJIFILM Holdings Corp | | 100 | | | 4,814 | |
| | Hewlett Packard Enterprise Co | | 450 | | | 7,137 | |
| | Konica Minolta Inc | | 100 | | | 656 | |
| | NEC Corp | | 100 | | | 4,161 | |
| | NetApp Inc | | 200 | | | 12,450 | |
| | Ricoh Co Ltd | | 300 | | | 3,292 | |
| | Seagate Technology PLC | | 106 | | | 6,307 | |
| | Seiko Epson Corp | | 100 | | | 1,523 | |
| | Western Digital Corp | | 10 | | | 635 | |
| | | 1,919,488 | |
Textiles, Apparel & Luxury Goods – 2.2% | | | |
| | adidas AG | | 21 | | | 6,826 | |
| | Burberry Group PLC | | 27 | | | 788 | |
| | Capri Holdings Ltd* | | 387 | | | 14,764 | |
| | Cie Financiere Richemont SA | | 36 | | | 2,830 | |
| | EssilorLuxottica SA | | 39 | | | 5,940 | |
| | Gildan Activewear Inc | | 33 | | | 976 | |
| | Hanesbrands Inc | | 1,343 | | | 19,944 | |
| | Hermes International | | 2 | | | 1,494 | |
| | HUGO BOSS AG | | 71 | | | 3,445 | |
| | Kering SA | | 11 | | | 7,220 | |
| | Moncler SpA | | 50 | | | 2,247 | |
| | NIKE Inc | | 13,319 | | | 1,349,348 | |
| | Puma SE | | 43 | | | 3,296 | |
| | PVH Corp | | 145 | | | 15,247 | |
| | Ralph Lauren Corp | | 98 | | | 11,488 | |
| | Swatch Group AG | | 5 | | | 1,395 | |
| | Tapestry Inc | | 452 | | | 12,190 | |
| | |
See Notes to Schedule of Investments and Other Information and Notes to Financial Statements. |
| |
20 | DECEMBER 31, 2019 |
Janus Henderson Adaptive Global Allocation Fund
Schedule of Investments (unaudited)
December 31, 2019
| | | | | | | | | |
Shares/Principal/
Contract Amounts | | | Value | |
Common Stocks – (continued) | | | |
Textiles, Apparel & Luxury Goods – (continued) | | | |
| | Under Armour Inc* | | 454 | | | $9,806 | |
| | | 1,469,244 | |
Tobacco – 0.1% | | | |
| | Altria Group Inc | | 147 | | | 7,337 | |
| | British American Tobacco PLC | | 6 | | | 257 | |
| | Imperial Brands PLC | | 207 | | | 5,124 | |
| | Japan Tobacco Inc | | 1,100 | | | 24,630 | |
| | Philip Morris International Inc | | 386 | | | 32,845 | |
| | Swedish Match AB | | 124 | | | 6,394 | |
| | | 76,587 | |
Trading Companies & Distributors – 0% | | | |
| | Brenntag AG | | 18 | | | 979 | |
| | Bunzl PLC | | 128 | | | 3,501 | |
| | Sumitomo Corp | | 100 | | | 1,495 | |
| | Toyota Tsusho Corp | | 100 | | | 3,553 | |
| | WW Grainger Inc | | 51 | | | 17,265 | |
| | | 26,793 | |
Transportation Infrastructure – 0% | | | |
| | Aena SME SA (144A) | | 21 | | | 4,016 | |
| | Aeroports de Paris | | 15 | | | 2,963 | |
| | Getlink SE | | 555 | | | 9,655 | |
| | Sydney Airport | | 589 | | | 3,579 | |
| | Transurban Group | | 448 | | | 4,686 | |
| | | 24,899 | |
Water Utilities – 0% | | | |
| | American Water Works Co Inc | | 22 | | | 2,703 | |
| | United Utilities Group PLC | | 419 | | | 5,235 | |
| | | 7,938 | |
Wireless Telecommunication Services – 0.1% | | | |
| | 1&1 Drillisch AG | | 71 | | | 1,822 | |
| | KDDI Corp | | 100 | | | 2,994 | |
| | NTT DOCOMO Inc | | 200 | | | 5,593 | |
| | Rogers Communications Inc | | 239 | | | 11,869 | |
| | Tele2 AB | | 87 | | | 1,262 | |
| | T-Mobile US Inc* | | 897 | | | 70,343 | |
| | Vodafone Group PLC | | 687 | | | 1,335 | |
| | | 95,218 | |
Total Common Stocks (cost $13,544,849) | | 14,294,478 | |
Preferred Stocks – 0% | | | |
Automobiles – 0% | | | |
| | Porsche Automobil Holding SE | | 25 | | | 1,869 | |
| | Volkswagen AG | | 20 | | | 3,953 | |
| | | 5,822 | |
Chemicals – 0% | | | |
| | Fuchs Petrolub SE | | 160 | | | 7,925 | |
Total Preferred Stocks (cost $11,945) | | 13,747 | |
Investment Companies – 74.9% | | | |
Exchange-Traded Funds (ETFs) – 74.9% | | | |
| | Invesco QQQ Trust Series 1 | | 15,909 | | | 3,382,412 | |
| | iShares 20+ Year Treasury Bond | | 10,526 | | | 1,426,062 | |
| | iShares 7-10 Year Treasury Bond | | 1,968 | | | 216,913 | |
| | iShares Agency Bond | | 1,482 | | | 171,290 | |
| | iShares FTSE/Xinhua China 25 Index Fund | | 36,387 | | | 1,587,565 | |
| | iShares iBoxx $ High Yield Corporate Bond | | 9,674 | | | 850,732 | |
| | iShares iBoxx $ Investment Grade Corporate Bond | | 4,175 | | | 534,233 | |
| | iShares MSCI Canada | | 29,294 | | | 875,598 | |
| | iShares MSCI Spain Index Fund# | | 12,223 | | | 353,489 | |
| | Nomura - TOPIX | | 72,409 | | | 1,188,377 | |
| | |
See Notes to Schedule of Investments and Other Information and Notes to Financial Statements. |
| |
Janus Investment Fund | 21 |
Janus Henderson Adaptive Global Allocation Fund
Schedule of Investments (unaudited)
December 31, 2019
| | | | | | | | | | |
Shares/Principal/
Contract Amounts | | | Value | |
Investment Companies – (continued) | | | |
Exchange-Traded Funds (ETFs) – (continued) | | | |
| | Vanguard Australian Shares Index | | 989 | | | $59,292 | |
| | Vanguard FTSE All-World ex-US | | 168,806 | | | 9,073,307 | |
| | Vanguard FTSE Emerging Markets | | 91,718 | | | 4,078,699 | |
| | Vanguard FTSE Europe | | 79,853 | | | 4,679,386 | |
| | Vanguard FTSE Pacific | | 59,997 | | | 4,174,591 | |
| | Vanguard Growth | | 1,226 | | | 223,340 | |
| | Vanguard High Dividend Yield | | 18,999 | | | 1,780,396 | |
| | Vanguard International High Dividend Yield | | 40,822 | | | 2,608,118 | |
| | Vanguard Long-Term Corporate Bond | | 7,627 | | | 773,073 | |
| | Vanguard Mid-Cap | | 11,466 | | | 2,043,012 | |
| | Vanguard Mortgage-Backed Securities | | 2,434 | | | 129,416 | |
| | Vanguard S&P 500 | | 14,695 | | | 4,346,781 | |
| | Vanguard Small-Cap | | 884 | | | 146,426 | |
| | Vanguard Total International Bond | | 41,359 | | | 2,340,092 | |
| | Vanguard Value | | 16,908 | | | 2,026,424 | |
Total Investment Companies (cost $44,609,904) | | 49,069,024 | |
U.S. Government Agency Notes – 2.8% | | | |
Federal Home Loan Bank Discount Notes: | | | |
| | 0%, 1/2/20◊ (cost $1,799,900) | | $1,800,000 | | | 1,800,000 | |
Investments Purchased with Cash Collateral from Securities Lending – 0.4% | | | |
Investment Companies – 0.3% | | | |
| | Janus Henderson Cash Collateral Fund LLC, 1.4338%ºº,£ | | 219,082 | | | 219,082 | |
Time Deposits – 0.1% | | | |
| | Canadian Imperial Bank of Commerce, 1.6000%, 1/2/20 | | $54,770 | | | 54,770 | |
Total Investments Purchased with Cash Collateral from Securities Lending (cost $273,852) | | 273,852 | |
OTC Purchased Options – Calls – 0.1% | | | |
Counterparty/Reference Asset | | | |
Bank of America: | | | | | | |
| | CBOE Volatility Index (VIX), | | | | | | |
| | Notional amount $439,582, premiums paid $68,730, unrealized depreciation $(40,994), exercise price $17.00, expires 1/22/20* (premiums paid $68,730) | | 319 | | | 27,736 | |
OTC Purchased Options – Puts – 0% | | | |
Counterparty/Reference Asset | | | |
Bank of America: | | | | | | |
| | Standard & Poors 500 Index, | | | | | | |
| | Notional amount $3,553,858, premiums paid $52,217, unrealized depreciation $(46,359), exercise price $3,070.00, expires 1/17/20* (premiums paid $52,217) | | 11 | | | 5,858 | |
Total Investments (total cost $60,361,397) – 100.0% | | 65,484,695 | |
Cash, Receivables and Other Assets, net of Liabilities – 0% | | 24,911 | |
Net Assets – 100% | | $65,509,606 | |
| | |
See Notes to Schedule of Investments and Other Information and Notes to Financial Statements. |
| |
22 | DECEMBER 31, 2019 |
Janus Henderson Adaptive Global Allocation Fund
Schedule of Investments (unaudited)
December 31, 2019
| | | | | | |
Summary of Investments by Country - (Long Positions) (unaudited) |
| |
| | | | | % of | |
| | | | | Investment | |
Country | | Value | | Securities | |
United States | | $58,732,867 | | 89.7 | % |
Japan | | 1,610,606 | | 2.5 | |
China | | 1,587,565 | | 2.4 | |
Canada | | 1,192,723 | | 1.8 | |
United Kingdom | | 321,819 | | 0.5 | |
Australia | | 318,963 | | 0.5 | |
France | | 291,205 | | 0.4 | |
Switzerland | | 243,864 | | 0.4 | |
Germany | | 218,392 | | 0.3 | |
Hong Kong | | 212,439 | | 0.3 | |
Spain | | 151,022 | | 0.2 | |
Finland | | 122,348 | | 0.2 | |
Italy | | 114,288 | | 0.2 | |
Sweden | | 81,099 | | 0.1 | |
Norway | | 72,163 | | 0.1 | |
Netherlands | | 61,150 | | 0.1 | |
Singapore | | 60,456 | | 0.1 | |
Austria | | 45,044 | | 0.1 | |
Belgium | | 34,286 | | 0.1 | |
Ireland | | 12,396 | | 0.0 | |
Schedules of Affiliated Investments – (% of Net Assets)
| | | | | | | | | | | |
| | Dividend Income | Realized Gain/(Loss) | Change in Unrealized Appreciation/ Depreciation | Value at 12/31/19 |
Investments Purchased with Cash Collateral from Securities Lending - 0.3% |
Investment Companies - 0.3% |
| | Janus Henderson Cash Collateral Fund LLC, 1.4338%ºº | $ | 17,819∆ | $ | - | $ | - | $ | 219,082 |
| |
| | | | | | | | | | | |
| | Share Balance at 6/30/19 | Purchases | Sales | Share Balance at 12/31/19 |
Investments Purchased with Cash Collateral from Securities Lending - 0.3% |
Investment Companies - 0.3% |
| | Janus Henderson Cash Collateral Fund LLC, 1.4338%ºº | | 3,527,475 | | 44,557,494 | | (47,865,887) | | 219,082 |
| | |
See Notes to Schedule of Investments and Other Information and Notes to Financial Statements. |
| |
Janus Investment Fund | 23 |
Janus Henderson Adaptive Global Allocation Fund
Schedule of Investments (unaudited)
December 31, 2019
| | | | | | | |
Schedule of Forward Foreign Currency Exchange Contracts, Open | | | | | | |
| | | | | | | | | |
Counterparty/ Foreign Currency | Settlement Date | Foreign Currency Amount (Sold)/ Purchased | | USD Currency Amount (Sold)/ Purchased | | Market Value and Unrealized Appreciation/ (Depreciation) | |
HSBC Securities (USA), Inc.: | | | | | | | |
Australian Dollar | 2/27/20 | (1,240,910) | $ | 848,234 | $ | (23,588) | |
Canadian Dollar | 2/27/20 | (2,273,000) | | 1,724,477 | | (26,584) | |
Euro | 2/27/20 | (2,516,663) | | 2,806,396 | | (26,013) | |
Total | | | | | $ | (76,185) | |
Schedule of Futures
| | | | | | | | | | | | | | |
Description | | Number of Contracts | | Expiration Date | | Value and Notional Amount | | Unrealized Appreciation/ (Depreciation) | | Variation Margin Asset/(Liability) | |
Futures Purchased: | | | | | | | | | | | |
10-Year US Treasury Note | | 63 | | 3/20/20 | $ | 8,090,578 | $ | (75,797) | $ | (6,891) | |
| | | | | | | | | | | | | | | | | | | | | | | | | | | | | | |
Schedule of OTC Written Options |
Counterparty/ Reference Asset | Number of Contracts | Exercise Price | | | Expiration Date | | Notional Amount | | Premiums Received | | Unrealized Appreciation/ (Depreciation) | | Options Written, at Value |
| | | | | | | | | | | | | | | |
Written Call Options:
Bank of America:
| | | | | | | | | | | | | | |
CBOE Volatility Index (VIX) | 319 | 24.00 | USD | | 1/22/20 | $ | (439,582) | $ | 28,739 | $ | 19,224 | $ | (9,515) |
Written Put Options:
Bank of America:
| | | | | | | | | | | | | | |
Standard & Poors 500 Index | 11 | 2,850.00 | USD | | 1/17/20 | | 3,553,858 | | 15,587 | | 14,751 | | (836) |
Total OTC Written Options | | | $ | 44,326 | $ | 33,975 | $ | (10,351) |
| | |
See Notes to Schedule of Investments and Other Information and Notes to Financial Statements. |
| |
24 | DECEMBER 31, 2019 |
Janus Henderson Adaptive Global Allocation Fund
Schedule of Investments (unaudited)
December 31, 2019
The following table, grouped by derivative type, provides information about the fair value and location of derivatives within the Statement of Assets and Liabilities as of December 31, 2019.
| | | | | | | | | | | | |
Fair Value of Derivative Instruments (not accounted for as hedging instruments) as of December 31, 2019 |
| | | | | | | | | | | | |
| | | | | Currency
Contracts | | Equity
Contracts | | Interest Rate
Contracts | | Total |
Asset Derivatives: | | | | | | | | | |
Purchased options, at value | | | $ - | | $ 33,594 | | $ - | | $33,594 |
| | | | | | | | | | |
| | | | | | | | | |
Liability Derivatives: | | | | | | | | | |
Forward foreign currency exchange contracts | | | $ 76,185 | | $ - | | $ - | | $76,185 |
Options written, at value | | | - | | 10,351 | | - | | 10,351 |
Variation margin payable | | | - | | - | | 6,891 | | 6,891 |
| | | | | | | | | | |
Total Liability Derivatives | | | $ 76,185 | | $ 10,351 | | $ 6,891 | | $93,427 |
The following tables provide information about the effect of derivatives and hedging activities on the Fund’s Statement of Operations for the period ended December 31, 2019.
| | | | | | | | | | | |
The effect of Derivative Instruments (not accounted for as hedging instruments) on the Statement of Operations for the period ended December 31, 2019 |
| | | | | | | | | | | |
Amount of Realized Gain/(Loss) Recognized on Derivatives |
Derivative | | Currency
Contracts | | Equity
Contracts | | Interest Rate
Contracts | | Total |
Futures contracts | | $ - | | $(301,551) | | $ 50,712 | | $(250,839) |
Forward foreign currency exchange contracts | | (8,225) | | - | | - | | (8,225) |
Purchased options contracts | | - | | (46,829) | | - | | (46,829) |
Written options contracts | | - | | 60,865 | | - | | 60,865 |
| | | | | | | | | | | |
Total | | $ (8,225) | | $(287,515) | | $ 50,712 | | $(245,028) |
| | | | | | | | | | | |
| | | | | | | | | | | |
Amount of Change in Unrealized Appreciation/Depreciation Recognized on Derivatives |
Derivative | | Currency
Contracts | | Equity
Contracts | | Interest Rate
Contracts | | Total |
Futures contracts | | $ - | | $ 24,700 | | $ (75,797) | | $ (51,097) |
Forward foreign currency exchange contracts | | (59,110) | | - | | - | | (59,110) |
Purchased options contracts | | - | | (87,353) | | - | | (87,353) |
Written options contracts | | - | | 31,106 | | - | | 31,106 |
| | | | | | | | | | | |
Total | | $(59,110) | | $ (31,547) | | $ (75,797) | | $(166,454) |
Please see the "Net Realized Gain/(Loss) on Investments" and "Change in Unrealized Net Appreciation/Depreciation" sections of the Fund’s Statement of Operations.
| | |
See Notes to Schedule of Investments and Other Information and Notes to Financial Statements. |
| |
Janus Investment Fund | 25 |
Janus Henderson Adaptive Global Allocation Fund
Schedule of Investments (unaudited)
December 31, 2019
| | |
Average Ending Monthly Market Value of Derivative Instruments During the Period Ended December 31, 2019 |
| | |
| Market Value(a) |
Forward foreign currency exchange contracts, sold | $ 3,505,056 |
Futures contracts, purchased | 12,481,156 |
Futures contracts, sold | 10,195,757 |
Purchased options contracts, call | 18,590 |
Purchased options contracts, put | 5,801 |
Written options contracts, call | 3,464 |
Written options contracts, put | 1,425 |
| | |
(a) Forward foreign currency exchange contracts are reported as the average ending monthly currency amount sold. |
| | |
See Notes to Schedule of Investments and Other Information and Notes to Financial Statements. |
| |
26 | DECEMBER 31, 2019 |
Janus Henderson Adaptive Global Allocation Fund
Notes to Schedule of Investments and Other Information (unaudited)
| | |
Adaptive Global Allocation 60/40 Index (Hedged) | Adaptive Global Allocation 60/40 Index (Hedged) is an internally-calculated, hypothetical combination of total returns from the MSCI All Country World IndexSM (60%) and the Bloomberg Barclays Global Aggregate Bond Index (USD Hedged) (40%). |
Bloomberg Barclays Global Aggregate Bond Index (USD Hedged) | Bloomberg Barclays Global Aggregate Bond Index (USD Hedged) is a broad-based measure of the global investment grade fixed-rate debt markets. |
MSCI All Country World IndexSM | MSCI All Country World IndexSM reflects the equity market performance of global developed and emerging markets. |
| | |
ADR | American Depositary Receipt |
CDI | Clearing House Electronic Subregister System Depositary Interest |
LLC | Limited Liability Company |
OTC | Over-the-Counter |
PLC | Public Limited Company |
REG | Registered |
| | |
144A | Securities sold under Rule 144A of the Securities Act of 1933, as amended, are subject to legal and/or contractual restrictions on resale and may not be publicly sold without registration under the 1933 Act. Unless otherwise noted, these securities have been determined to be liquid under guidelines established by the Board of Trustees. The total value of 144A securities as of the period ended December 31, 2019 is $32,976, which represents 0.1% of net assets. |
| | |
* | Non-income producing security. |
| | |
ºº | Rate shown is the 7-day yield as of December 31, 2019. |
| | |
# | Loaned security; a portion of the security is on loan at December 31, 2019. |
| | |
£ | The Fund may invest in certain securities that are considered affiliated companies. As defined by the Investment Company Act of 1940, as amended, an affiliated company is one in which the Fund owns 5% or more of the outstanding voting securities, or a company which is under common ownership or control. |
| | |
∆ | Net of income paid to the securities lending agent and rebates paid to the borrowing counterparties. |
Janus Henderson Adaptive Global Allocation Fund
Notes to Schedule of Investments and Other Information (unaudited)
| | | | | | | | | | | | | | |
The following is a summary of the inputs that were used to value the Fund’s investments in securities and other financial instruments as of December 31, 2019. See Notes to Financial Statements for more information. |
| |
Valuation Inputs Summary |
| | | | | | | |
| | | | | Level 2 - | | Level 3 - |
| | | Level 1 - | | Other Significant | | Significant |
| | | Quoted Prices | | Observable Inputs | | Unobservable Inputs |
| | | | | | | |
Assets | | | | | | |
Investments In Securities: | | | | | | |
Common Stocks | $ | 14,294,478 | $ | - | $ | - |
Preferred Stocks | | - | | 13,747 | | - |
Investment Companies | | 49,069,024 | | - | | - |
U.S. Government Agency Notes | | - | | 1,800,000 | | - |
Investments Purchased with Cash Collateral from Securities Lending | | - | | 273,852 | | - |
OTC Purchased Options – Calls | | - | | 27,736 | | - |
OTC Purchased Options – Puts | | - | | 5,858 | | - |
Total Assets | $ | 63,363,502 | $ | 2,121,193 | $ | - |
Liabilities | | | | | | |
Other Financial Instruments(a): | | | | | | |
Forward Foreign Currency Exchange Contracts | $ | - | $ | 76,185 | $ | - |
Options Written, at Value | | - | | 10,351 | | - |
Variation Margin Payable | | 6,891 | | - | | - |
Total Liabilities | $ | 6,891 | $ | 86,536 | $ | - |
| | | | | | | |
(a) | Other financial instruments include forward foreign currency exchange, futures, written options, written swaptions, and swap contracts. Forward foreign currency exchange contracts are reported at their unrealized appreciation/(depreciation) at measurement date, which represents the change in the contract's value from trade date. Futures, certain written options on futures, and centrally cleared swap contracts are reported at their variation margin at measurement date, which represents the amount due to/from the Fund at that date. Written options, written swaptions, and other swap contracts are reported at their market value at measurement date. |
Janus Henderson Adaptive Global Allocation Fund
Statement of Assets and Liabilities (unaudited)
December 31, 2019
| |
See footnotes at the end of the Statement. |
| | | | | | | |
| | | | | | |
Assets: | | | | |
| | Unaffiliated investments, at value(1)(2) | | $ | 65,232,019 | |
| | Affiliated investments, at value(3) | | | 219,082 | |
| | Purchased options, at value(4) | | | 33,594 | |
| | Cash | | | 1,859,096 | |
| | Deposits with brokers for futures | | | 620,000 | |
| | Non-interested Trustees' deferred compensation | | | 1,683 | |
| | Receivables: | | | | |
| | | Fund shares sold | | | 6,961,849 | |
| | | Dividends | | | 24,646 | |
| | | Foreign tax reclaims | | | 5,482 | |
| | Other assets | | | 5,419 | |
Total Assets | | | 74,962,870 | |
Liabilities: | | | | |
| | Collateral for securities loaned (Note 3) | | | 273,852 | |
| | Forward foreign currency exchange contracts | | | 76,185 | |
| | Options written, at value(5) | | | 10,351 | |
| | Closed foreign currency contracts | | | 17,043 | |
| | Variation margin payable | | | 6,891 | |
| | Payables: | | | — | |
| | | Fund shares repurchased | | | 7,093,942 | |
| | | Investments purchased | | | 1,806,806 | |
| | | Professional fees | | | 38,080 | |
| | | Advisory fees | | | 22,077 | |
| | | Custodian fees | | | 8,852 | |
| | | Transfer agent fees and expenses | | | 3,602 | |
| | | 12b-1 Distribution and shareholder servicing fees | | | 1,954 | |
| | | Non-interested Trustees' deferred compensation fees | | | 1,683 | |
| | | Affiliated fund administration fees payable | | | 144 | |
| | | Non-interested Trustees' fees and expenses | | | 86 | |
| | | Accrued expenses and other payables | | | 91,716 | |
Total Liabilities | | | 9,453,264 | |
Net Assets | | $ | 65,509,606 | |
| | |
See Notes to Financial Statements. |
| |
Janus Investment Fund | 29 |
Janus Henderson Adaptive Global Allocation Fund
Statement of Assets and Liabilities (unaudited)
December 31, 2019
| | | | | | | |
| | | | | | |
| | | | | | | |
Net Assets Consist of: | | | | |
| | Capital (par value and paid-in surplus) | | $ | 61,769,839 | |
| | Total distributable earnings (loss) | | | 3,739,767 | |
Total Net Assets | | $ | 65,509,606 | |
Net Assets - Class A Shares | | $ | 864,245 | |
| | Shares Outstanding, $0.01 Par Value (unlimited shares authorized) | | | 82,479 | |
Net Asset Value Per Share(6) | | $ | 10.48 | |
Maximum Offering Price Per Share(7) | | $ | 11.12 | |
Net Assets - Class C Shares | | $ | 1,710,117 | |
| | Shares Outstanding, $0.01 Par Value (unlimited shares authorized) | | | 163,113 | |
Net Asset Value Per Share(6) | | $ | 10.48 | |
Net Assets - Class D Shares | | $ | 2,919,018 | |
| | Shares Outstanding, $0.01 Par Value (unlimited shares authorized) | | | 277,714 | |
Net Asset Value Per Share | | $ | 10.51 | |
Net Assets - Class I Shares | | $ | 10,043,569 | |
| | Shares Outstanding, $0.01 Par Value (unlimited shares authorized) | | | 955,345 | |
Net Asset Value Per Share | | $ | 10.51 | |
Net Assets - Class N Shares | | $ | 47,254,357 | |
| | Shares Outstanding, $0.01 Par Value (unlimited shares authorized) | | | 4,488,750 | |
Net Asset Value Per Share | | $ | 10.53 | |
Net Assets - Class S Shares | | $ | 1,354,174 | |
| | Shares Outstanding, $0.01 Par Value (unlimited shares authorized) | | | 128,687 | |
Net Asset Value Per Share | | $ | 10.52 | |
Net Assets - Class T Shares | | $ | 1,364,126 | |
| | Shares Outstanding, $0.01 Par Value (unlimited shares authorized) | | | 129,895 | |
Net Asset Value Per Share | | $ | 10.50 | |
| |
(1) Includes cost of $60,021,368. (2) Includes $266,396 of securities on loan. See Note 3 in Notes to Financial Statements. (3) Includes cost of $219,082. (4) Premiums paid of $120,947. (5) Premiums received $44,326. (6) Redemption price per share may be reduced for any applicable contingent deferred sales charge. (7) Maximum offering price is computed at 100/94.25 of net asset value. |
| | |
See Notes to Financial Statements. |
| |
30 | DECEMBER 31, 2019 |
Janus Henderson Adaptive Global Allocation Fund
Statement of Operations (unaudited)
For the period ended December 31, 2019
| | | | | | |
| | | | | |
Investment Income: | | | |
| Dividends | $ | 941,678 | |
| | Interest | | 22,056 | |
| | Affiliated securities lending income, net | | 17,819 | |
| | Other income | | 3,763 | |
| | Foreign tax withheld | | (5,665) | |
Total Investment Income | | 979,651 | |
Expenses: | | | |
| | Advisory fees | | 258,660 | |
| | 12b-1 Distribution and shareholder servicing fees: | | | |
| | | Class A Shares | | 1,728 | |
| | | Class C Shares | | 2,164 | |
| | | Class S Shares | | 36 | |
| | Transfer agent administrative fees and expenses: | | | |
| | | Class D Shares | | 1,671 | |
| | | Class S Shares | | 1,639 | |
| | | Class T Shares | | 1,656 | |
| | Transfer agent networking and omnibus fees: | | | |
| | | Class A Shares | | 1,005 | |
| | | Class C Shares | | 127 | |
| | | Class I Shares | | 4,329 | |
| | Other transfer agent fees and expenses: | | | |
| | | Class A Shares | | 81 | |
| | | Class C Shares | | 63 | |
| | | Class D Shares | | 189 | |
| | | Class I Shares | | 331 | |
| | | Class N Shares | | 679 | |
| | | Class S Shares | | 11 | |
| | | Class T Shares | | 13 | |
| | Non-affiliated fund administration fees | | 46,631 | |
| | Registration fees | | 30,217 | |
| | Professional fees | | 27,651 | |
| | Custodian fees | | 5,190 | |
| | Shareholder reports expense | | 1,105 | |
| | Affiliated fund administration fees | | 863 | |
| | Non-interested Trustees’ fees and expenses | | 830 | |
| | Other expenses | | 907 | |
Total Expenses | | 387,776 | |
Less: Excess Expense Reimbursement and Waivers | | (132,084) | |
Net Expenses | | 255,692 | |
Net Investment Income/(Loss) | | 723,959 | |
| | | | | | |
| | |
See Notes to Financial Statements. |
| |
Janus Investment Fund | 31 |
Janus Henderson Adaptive Global Allocation Fund
Statement of Operations (unaudited)
For the period ended December 31, 2019
| | | | | | |
| | | | | |
Net Realized Gain/(Loss) on Investments: | | | |
| | Investments and foreign currency transactions | $ | 349,178 | |
| | Purchased options contracts | | (46,829) | |
| | Forward foreign currency exchange contracts | | (8,225) | |
| | Futures contracts | | (250,839) | |
| | Written options contracts | | 60,865 | |
Total Net Realized Gain/(Loss) on Investments | | 104,150 | |
Change in Unrealized Net Appreciation/Depreciation: | | | |
| | Investments, foreign currency translations and non-interested Trustees’ deferred compensation | | 1,815,185 | |
| | Purchased options contracts | | (87,353) | |
| | Forward foreign currency exchange contracts | | (59,110) | |
| | Futures contracts | | (51,097) | |
| | Written options contracts | | 31,106 | |
Total Change in Unrealized Net Appreciation/Depreciation | | 1,648,731 | |
Net Increase/(Decrease) in Net Assets Resulting from Operations | $ | 2,476,840 | |
| | | | | | |
| | |
See Notes to Financial Statements. |
| |
32 | DECEMBER 31, 2019 |
Janus Henderson Adaptive Global Allocation Fund
Statements of Changes in Net Assets
| | | | | | | | | |
| | | | | | | | | |
| | | Period ended
December 31, 2019 (unaudited) | | Year ended
June 30, 2019 | |
| | | | | | | | | |
Operations: | | | | | | |
| | Net investment income/(loss) | $ | 723,959 | | $ | 1,551,971 | |
| | Net realized gain/(loss) on investments | | 104,150 | | | (571,150) | |
| | Change in unrealized net appreciation/depreciation | | 1,648,731 | | | 2,220,426 | |
Net Increase/(Decrease) in Net Assets Resulting from Operations | | 2,476,840 | | | 3,201,247 | |
Dividends and Distributions to Shareholders | | | | | | |
| | | Class A Shares | | (18,590) | | | (120,007) | |
| | | Class C Shares | | (34,187) | | | (69,592) | |
| | | Class D Shares | | (61,068) | | | (118,346) | |
| | | Class I Shares | | (239,483) | | | (756,351) | |
| | | Class N Shares | | (1,058,964) | | | (2,436,252) | |
| | | Class S Shares | | (28,724) | | | (56,970) | |
| | | Class T Shares | | (29,914) | | | (116,855) | |
Net Decrease from Dividends and Distributions to Shareholders | | (1,470,930) | | | (3,674,373) | |
Capital Share Transactions: | | | | | | |
| | | Class A Shares | | (1,673,609) | | | 1,850,471 | |
| | | Class C Shares | | (93,424) | | | 169,585 | |
| | | Class D Shares | | 58,171 | | | 331,054 | |
| | | Class I Shares | | (5,134,216) | | | 5,124,748 | |
| | | Class N Shares | | 420,017 | | | (5,503,928) | |
| | | Class S Shares | | 28,764 | | | 50,241 | |
| | | Class T Shares | | 16,083 | | | (1,209,569) | |
Net Increase/(Decrease) from Capital Share Transactions | | (6,378,214) | | | 812,602 | |
Net Increase/(Decrease) in Net Assets | | (5,372,304) | | | 339,476 | |
Net Assets: | | | | | | |
| | Beginning of period | | 70,881,910 | | | 70,542,434 | |
| End of period | $ | 65,509,606 | | $ | 70,881,910 | |
| | | | | | | | | |
| | |
See Notes to Financial Statements. |
| |
Janus Investment Fund | 33 |
Janus Henderson Adaptive Global Allocation Fund
Financial Highlights
| | | | | | | | | | | | | | | | | | | | | | |
Class A Shares | | | | | | | | | | | | | | | | | | |
For a share outstanding during the period ended December 31, 2019 (unaudited) and the year or period ended June 30 | 2019 | | | 2019 | | | 2018 | | | 2017 | | | 2016 | | | 2015(1) | |
| | Net Asset Value, Beginning of Period | | $10.32 | | | $10.43 | | | $10.55 | | | $9.49 | | | $9.69 | | | $10.00 | |
| | Income/(Loss) from Investment Operations: | | | | | | | | | | | | | | | | | | |
| | | Net investment income/(loss)(2) | | 0.08 | | | 0.22 | | | 0.13 | | | 0.09 | | | 0.05 | | | 0.01 | |
| | | Net realized and unrealized gain/(loss) | | 0.31 | | | 0.17 | | | 0.55 | | | 1.06 | | | (0.23) | | | (0.32) | |
| | Total from Investment Operations | | 0.39 | | | 0.39 | | | 0.68 | | | 1.15 | | | (0.18) | | | (0.31) | |
| | Less Dividends and Distributions: | | | | | | | | | | | | | | | | | | |
| | | Dividends (from net investment income) | | (0.22) | | | (0.09) | | | (0.18) | | | (0.09) | | | (0.02) | | | — | |
| | | Distributions (from capital gains) | | (0.01) | | | (0.41) | | | (0.62) | | | — | | | — | | | — | |
| | Total Dividends and Distributions | | (0.23) | | | (0.50) | | | (0.80) | | | (0.09) | | | (0.02) | | | — | |
| | Net Asset Value, End of Period | | $10.48 | | | $10.32 | | | $10.43 | | | $10.55 | | | $9.49 | | | $9.69 | |
| | Total Return* | | 3.79% | | | 4.22% | | | 6.27% | | | 12.17% | | | (1.85)% | | | (3.10)% | |
| | Net Assets, End of Period (in thousands) | | $864 | | | $2,567 | | | $766 | | | $743 | | | $571 | | | $485 | |
| | Average Net Assets for the Period (in thousands) | | $1,722 | | | $2,179 | | | $777 | | | $609 | | | $530 | | | $496 | |
| | Ratios to Average Net Assets**: | | | | | | | | | | | | | | | | | | |
| | | Ratio of Gross Expenses | | 1.58% | | | 1.69% | | | 1.63% | | | 1.52% | | | 1.54% | | | 13.45% | |
| | | Ratio of Net Expenses (After Waivers and Expense Offsets) | | 1.02% | | | 0.96% | | | 1.01% | | | 1.07% | | | 1.09% | | | 1.07% | |
| | | Ratio of Net Investment Income/(Loss) | | 1.62% | | | 2.14% | | | 1.24% | | | 0.86% | | | 0.55% | | | 5.04% | |
| | Portfolio Turnover Rate | | 92% | | | 268% | | | 440% | | | 302%(3) | | | 122% | | | 10% | |
| | | | | | | | | | | | | | | | | | | | | | |
| | | | | | | | | | | | | | | | | | | | | | |
Class C Shares | | | | | | | | | | | | | | | | | | |
For a share outstanding during the period ended December 31, 2019 (unaudited) and the year or period ended June 30 | 2019 | | | 2019 | | | 2018 | | | 2017 | | | 2016 | | | 2015(1) | |
| | Net Asset Value, Beginning of Period | | $10.30 | | | $10.35 | | | $10.48 | | | $9.44 | | | $9.69 | | | $10.00 | |
| | Income/(Loss) from Investment Operations: | | | | | | | | | | | | | | | | | | |
| | | Net investment income/(loss)(2) | | 0.10 | | | 0.17 | | | 0.06 | | | 0.01 | | | (0.01) | | | 0.01 | |
| | | Net realized and unrealized gain/(loss) | | 0.30 | | | 0.20 | | | 0.54 | | | 1.05 | | | (0.23) | | | (0.32) | |
| | Total from Investment Operations | | 0.40 | | | 0.37 | | | 0.60 | | | 1.06 | | | (0.24) | | | (0.31) | |
| | Less Dividends and Distributions: | | | | | | | | | | | | | | | | | | |
| | | Dividends (from net investment income) | | (0.21) | | | (0.01) | | | (0.11) | | | (0.02) | | | (0.01) | | | — | |
| | | Distributions (from capital gains) | | (0.01) | | | (0.41) | | | (0.62) | | | — | | | — | | | — | |
| | Total Dividends and Distributions | | (0.22) | | | (0.42) | | | (0.73) | | | (0.02) | | | (0.01) | | | — | |
| | Net Asset Value, End of Period | | $10.48 | | | $10.30 | | | $10.35 | | | $10.48 | | | $9.44 | | | $9.69 | |
| | Total Return* | | 3.83% | | | 3.96% | | | 5.58% | | | 11.21% | | | (2.52)% | | | (3.10)% | |
| | Net Assets, End of Period (in thousands) | | $1,710 | | | $1,778 | | | $1,603 | | | $1,225 | | | $1,046 | | | $24 | |
| | Average Net Assets for the Period (in thousands) | | $1,661 | | | $1,695 | | | $1,448 | | | $1,112 | | | $827 | | | $25 | |
| | Ratios to Average Net Assets**: | | | | | | | | | | | | | | | | | | |
| | | Ratio of Gross Expenses | | 1.52% | | | 1.88% | | | 2.34% | | | 2.27% | | | 2.29% | | | 14.19% | |
| | | Ratio of Net Expenses (After Waivers and Expense Offsets) | | 0.99% | | | 1.14% | | | 1.75% | | | 1.83% | | | 1.84% | | | 1.82% | |
| | | Ratio of Net Investment Income/(Loss) | | 1.93% | | | 1.71% | | | 0.54% | | | 0.05% | | | (0.06)% | | | 4.29% | |
| | Portfolio Turnover Rate | | 92% | | | 268% | | | 440% | | | 302%(3) | | | 122% | | | 10% | |
| | | | | | | | | | | | | | | | | | | | | | |
| |
* Total return includes adjustments in accordance with generally accepted accounting principles required at the year or period end and are not annualized for periods of less than one full year. ** Annualized for periods of less than one full year. (1) Period from June 23, 2015 (inception date) through June 30, 2015. (2) Per share amounts are calculated based on average shares outstanding during the year or period. (3) The increase in the portfolio turnover rate was due to a restructuring of the Fund’s portfolio as a result of a change in its principal investment strategies. |
| | |
See Notes to Financial Statements. |
| |
34 | DECEMBER 31, 2019 |
Janus Henderson Adaptive Global Allocation Fund
Financial Highlights
| | | | | | | | | | | | | | | | | | | | | | |
Class D Shares | | | | | | | | | | | | | | | | | | |
For a share outstanding during the period ended December 31, 2019 (unaudited) and the year or period ended June 30 | 2019 | | | 2019 | | | 2018 | | | 2017 | | | 2016 | | | 2015(1) | |
| | Net Asset Value, Beginning of Period | | $10.33 | | | $10.43 | | | $10.54 | | | $9.49 | | | $9.70 | | | $10.00 | |
| | Income/(Loss) from Investment Operations: | | | | | | | | | | | | | | | | | | |
| | | Net investment income/(loss)(2) | | 0.11 | | | 0.20 | | | 0.15 | | | 0.09 | | | 0.06 | | | 0.01 | |
| | | Net realized and unrealized gain/(loss) | | 0.30 | | | 0.20 | | | 0.55 | | | 1.05 | | | (0.25) | | | (0.31) | |
| | Total from Investment Operations | | 0.41 | | | 0.40 | | | 0.70 | | | 1.14 | | | (0.19) | | | (0.30) | |
| | Less Dividends and Distributions: | | | | | | | | | | | | | | | | | | |
| | | Dividends (from net investment income) | | (0.22) | | | (0.09) | | | (0.19) | | | (0.09) | | | (0.02) | | | — | |
| | | Distributions (from capital gains) | | (0.01) | | | (0.41) | | | (0.62) | | | — | | | — | | | — | |
| | Total Dividends and Distributions | | (0.23) | | | (0.50) | | | (0.81) | | | (0.09) | | | (0.02) | | | — | |
| | Net Asset Value, End of Period | | $10.51 | | | $10.33 | | | $10.43 | | | $10.54 | | | $9.49 | | | $9.70 | |
| | Total Return* | | 3.93% | | | 4.31% | | | 6.51% | | | 12.13% | | | (1.93)% | | | (3.00)% | |
| | Net Assets, End of Period (in thousands) | | $2,919 | | | $2,813 | | | $2,480 | | | $1,619 | | | $1,285 | | | $102 | |
| | Average Net Assets for the Period (in thousands) | | $2,779 | | | $2,564 | | | $2,139 | | | $1,435 | | | $973 | | | $64 | |
| | Ratios to Average Net Assets**: | | | | | | | | | | | | | | | | | | |
| | | Ratio of Gross Expenses | | 1.33% | | | 1.43% | | | 1.84% | | | 2.01% | | | 2.59% | | | 20.64% | |
| | | Ratio of Net Expenses (After Waivers and Expense Offsets) | | 0.84% | | | 0.85% | | | 0.86% | | | 0.96% | | | 1.10% | | | 0.98% | |
| | | Ratio of Net Investment Income/(Loss) | | 2.10% | | | 1.97% | | | 1.39% | | | 0.94% | | | 0.69% | | | 5.03% | |
| | Portfolio Turnover Rate | | 92% | | | 268% | | | 440% | | | 302%(3) | | | 122% | | | 10% | |
| | | | | | | | | | | | | | | | | | | | | | |
| | | | | | | | | | | | | | | | | | | | | | |
Class I Shares | | | | | | | | | | | | | | | | | | |
For a share outstanding during the period ended December 31, 2019 (unaudited) and the year or period ended June 30 | 2019 | | | 2019 | | | 2018 | | | 2017 | | | 2016 | | | 2015(1) | |
| | Net Asset Value, Beginning of Period | | $10.35 | | | $10.46 | | | $10.57 | | | $9.51 | | | $9.69 | | | $10.00 | |
| | Income/(Loss) from Investment Operations: | | | | | | | | | | | | | | | | | | |
| | | Net investment income/(loss)(2) | | 0.10 | | | 0.21 | | | 0.19 | | | 0.17 | | | 0.09 | | | 0.01 | |
| | | Net realized and unrealized gain/(loss) | | 0.31 | | | 0.19 | | | 0.52 | | | 1.00 | | | (0.24) | | | (0.32) | |
| | Total from Investment Operations | | 0.41 | | | 0.40 | | | 0.71 | | | 1.17 | | | (0.15) | | | (0.31) | |
| | Less Dividends and Distributions: | | | | | | | | | | | | | | | | | | |
| | | Dividends (from net investment income) | | (0.24) | | | (0.10) | | | (0.20) | | | (0.11) | | | (0.03) | | | — | |
| | | Distributions (from capital gains) | | (0.01) | | | (0.41) | | | (0.62) | | | — | | | — | | | — | |
| | Total Dividends and Distributions | | (0.25) | | | (0.51) | | | (0.82) | | | (0.11) | | | (0.03) | | | — | |
| | Net Asset Value, End of Period | | $10.51 | | | $10.35 | | | $10.46 | | | $10.57 | | | $9.51 | | | $9.69 | |
| | Total Return* | | 3.94% | | | 4.33% | | | 6.57% | | | 12.42% | | | (1.55)% | | | (3.10)% | |
| | Net Assets, End of Period (in thousands) | | $10,044 | | | $15,008 | | | $9,959 | | | $4,596 | | | $1,090 | | | $48 | |
| | Average Net Assets for the Period (in thousands) | | $13,526 | | | $14,537 | | | $4,830 | | | $1,802 | | | $854 | | | $50 | |
| | Ratios to Average Net Assets**: | | | | | | | | | | | | | | | | | | |
| | | Ratio of Gross Expenses | | 1.14% | | | 1.35% | | | 1.38% | | | 1.40% | | | 1.28% | | | 13.19% | |
| | | Ratio of Net Expenses (After Waivers and Expense Offsets) | | 0.77% | | | 0.77% | | | 0.79% | | | 0.80% | | | 0.83% | | | 0.82% | |
| | | Ratio of Net Investment Income/(Loss) | | 1.84% | | | 2.12% | | | 1.75% | | | 1.69% | | | 0.94% | | | 5.29% | |
| | Portfolio Turnover Rate | | 92% | | | 268% | | | 440% | | | 302%(3) | | | 122% | | | 10% | |
| | | | | | | | | | | | | | | | | | | | | | |
| |
* Total return includes adjustments in accordance with generally accepted accounting principles required at the year or period end and are not annualized for periods of less than one full year. ** Annualized for periods of less than one full year. (1) Period from June 23, 2015 (inception date) through June 30, 2015. (2) Per share amounts are calculated based on average shares outstanding during the year or period. (3) The increase in the portfolio turnover rate was due to a restructuring of the Fund’s portfolio as a result of a change in its principal investment strategies. |
| | |
See Notes to Financial Statements. |
| |
Janus Investment Fund | 35 |
Janus Henderson Adaptive Global Allocation Fund
Financial Highlights
| | | | | | | | | | | | | | | | | | | | | | |
Class N Shares | | | | | | | | | | | | | | | | | | |
For a share outstanding during the period ended December 31, 2019 (unaudited) and the year or period ended June 30 | 2019 | | | 2019 | | | 2018 | | | 2017 | | | 2016 | | | 2015(1) | |
| | Net Asset Value, Beginning of Period | | $10.35 | | | $10.46 | | | $10.56 | | | $9.51 | | | $9.70 | | | $10.00 | |
| | Income/(Loss) from Investment Operations: | | | | | | | | | | | | | | | | | | |
| | | Net investment income/(loss)(2) | | 0.11 | | | 0.21 | | | 0.16 | | | 0.10 | | | 0.07 | | | 0.01 | |
| | | Net realized and unrealized gain/(loss) | | 0.31 | | | 0.20 | | | 0.56 | | | 1.06 | | | (0.23) | | | (0.31) | |
| | Total from Investment Operations | | 0.42 | | | 0.41 | | | 0.72 | | | 1.16 | | | (0.16) | | | (0.30) | |
| | Less Dividends and Distributions: | | | | | | | | | | | | | | | | | | |
| | | Dividends (from net investment income) | | (0.23) | | | (0.11) | | | (0.20) | | | (0.11) | | | (0.03) | | | — | |
| | | Distributions (from capital gains) | | (0.01) | | | (0.41) | | | (0.62) | | | — | | | — | | | — | |
| | Total Dividends and Distributions | | (0.24) | | | (0.52) | | | (0.82) | | | (0.11) | | | (0.03) | | | — | |
| | Net Asset Value, End of Period | | $10.53 | | | $10.35 | | | $10.46 | | | $10.56 | | | $9.51 | | | $9.70 | |
| | Total Return* | | 4.08% | | | 4.36% | | | 6.72% | | | 12.43% | | | (1.65)% | | | (3.00)% | |
| | Net Assets, End of Period (in thousands) | | $47,254 | | | $46,087 | | | $51,921 | | | $48,806 | | | $48,423 | | | $53,702 | |
| | Average Net Assets for the Period (in thousands) | | $45,951 | | | $49,849 | | | $52,068 | | | $48,134 | | | $49,786 | | | $9,234 | |
| | Ratios to Average Net Assets**: | | | | | | | | | | | | | | | | | | |
| | | Ratio of Gross Expenses | | 1.06% | | | 1.26% | | | 1.27% | | | 1.24% | | | 1.27% | | | 67.74% | |
| | | Ratio of Net Expenses (After Waivers and Expense Offsets) | | 0.71% | | | 0.70% | | | 0.73% | | | 0.81% | | | 0.83% | | | 0.82% | |
| | | Ratio of Net Investment Income/(Loss) | | 2.22% | | | 2.10% | | | 1.52% | | | 1.03% | | | 0.73% | | | 6.84% | |
| | Portfolio Turnover Rate | | 92% | | | 268% | | | 440% | | | 302%(3) | | | 122% | | | 10% | |
| | | | | | | | | | | | | | | | | | | | | | |
| | | | | | | | | | | | | | | | | | | | | | |
Class S Shares | | | | | | | | | | | | | | | | | | |
For a share outstanding during the period ended December 31, 2019 (unaudited) and the year or period ended June 30 | 2019 | | | 2019 | | | 2018 | | | 2017 | | | 2016 | | | 2015(1) | |
| | Net Asset Value, Beginning of Period | | $10.35 | | | $10.42 | | | $10.53 | | | $9.48 | | | $9.69 | | | $10.00 | |
| | Income/(Loss) from Investment Operations: | | | | | | | | | | | | | | | | | | |
| | | Net investment income/(loss)(2) | | 0.11 | | | 0.20 | | | 0.12 | | | 0.07 | | | 0.05 | | | 0.01 | |
| | | Net realized and unrealized gain/(loss) | | 0.29 | | | 0.20 | | | 0.55 | | | 1.06 | | | (0.24) | | | (0.32) | |
| | Total from Investment Operations | | 0.40 | | | 0.40 | | | 0.67 | | | 1.13 | | | (0.19) | | | (0.31) | |
| | Less Dividends and Distributions: | | | | | | | | | | | | | | | | | | |
| | | Dividends (from net investment income) | | (0.22) | | | (0.06) | | | (0.16) | | | (0.08) | | | (0.02) | | | — | |
| | | Distributions (from capital gains) | | (0.01) | | | (0.41) | | | (0.62) | | | — | | | — | | | — | |
| | Total Dividends and Distributions | | (0.23) | | | (0.47) | | | (0.78) | | | (0.08) | | | (0.02) | | | — | |
| | Net Asset Value, End of Period | | $10.52 | | | $10.35 | | | $10.42 | | | $10.53 | | | $9.48 | | | $9.69 | |
| | Total Return* | | 3.86% | | | 4.33% | | | 6.24% | | | 11.95% | | | (1.99)% | | | (3.10)% | |
| | Net Assets, End of Period (in thousands) | | $1,354 | | | $1,303 | | | $1,256 | | | $1,183 | | | $1,057 | | | $24 | |
| | Average Net Assets for the Period (in thousands) | | $1,296 | | | $1,258 | | | $1,267 | | | $1,110 | | | $831 | | | $25 | |
| | Ratios to Average Net Assets**: | | | | | | | | | | | | | | | | | | |
| | | Ratio of Gross Expenses | | 1.54% | | | 1.79% | | | 1.83% | | | 1.75% | | | 1.78% | | | 13.69% | |
| | | Ratio of Net Expenses (After Waivers and Expense Offsets) | | 0.84% | | | 0.89% | | | 1.11% | | | 1.17% | | | 1.24% | | | 1.32% | |
| | | Ratio of Net Investment Income/(Loss) | | 2.10% | | | 1.92% | | | 1.14% | | | 0.70% | | | 0.53% | | | 4.79% | |
| | Portfolio Turnover Rate | | 92% | | | 268% | | | 440% | | | 302%(3) | | | 122% | | | 10% | |
| | | | | | | | | | | | | | | | | | | | | | |
| |
* Total return includes adjustments in accordance with generally accepted accounting principles required at the year or period end and are not annualized for periods of less than one full year. ** Annualized for periods of less than one full year. (1) Period from June 23, 2015 (inception date) through June 30, 2015. (2) Per share amounts are calculated based on average shares outstanding during the year or period. (3) The increase in the portfolio turnover rate was due to a restructuring of the Fund’s portfolio as a result of a change in its principal investment strategies. |
| | |
See Notes to Financial Statements. |
| |
36 | DECEMBER 31, 2019 |
Janus Henderson Adaptive Global Allocation Fund
Financial Highlights
| | | | | | | | | | | | | | | | | | | | | | |
Class T Shares | | | | | | | | | | | | | | | | | | |
For a share outstanding during the period ended December 31, 2019 (unaudited) and the year or period ended June 30 | 2019 | | | 2019 | | | 2018 | | | 2017 | | | 2016 | | | 2015(1) | |
| | Net Asset Value, Beginning of Period | | $10.33 | | | $10.43 | | | $10.55 | | | $9.50 | | | $9.69 | | | $10.00 | |
| | Income/(Loss) from Investment Operations: | | | | | | | | | | | | | | | | | | |
| | | Net investment income/(loss)(2) | | 0.11 | | | 0.19 | | | 0.14 | | | 0.09 | | | 0.07 | | | 0.01 | |
| | | Net realized and unrealized gain/(loss) | | 0.30 | | | 0.20 | | | 0.55 | | | 1.06 | | | (0.24) | | | (0.32) | |
| | Total from Investment Operations | | 0.41 | | | 0.39 | | | 0.69 | | | 1.15 | | | (0.17) | | | (0.31) | |
| | Less Dividends and Distributions: | | | | | | | | | | | | | | | | | | |
| | | Dividends (from net investment income) | | (0.23) | | | (0.08) | | | (0.19) | | | (0.10) | | | (0.02) | | | — | |
| | | Distributions (from capital gains) | | (0.01) | | | (0.41) | | | (0.62) | | | — | | | — | | | — | |
| | Total Dividends and Distributions | | (0.24) | | | (0.49) | | | (0.81) | | | (0.10) | | | (0.02) | | | — | |
| | Net Asset Value, End of Period | | $10.50 | | | $10.33 | | | $10.43 | | | $10.55 | | | $9.50 | | | $9.69 | |
| | Total Return* | | 3.93% | | | 4.23% | | | 6.40% | | | 12.17% | | | (1.72)% | | | (3.10)% | |
| | Net Assets, End of Period (in thousands) | | $1,364 | | | $1,327 | | | $2,557 | | | $2,291 | | | $1,085 | | | $48 | |
| | Average Net Assets for the Period (in thousands) | | $1,310 | | | $2,521 | | | $2,635 | | | $1,204 | | | $856 | | | $50 | |
| | Ratios to Average Net Assets**: | | | | | | | | | | | | | | | | | | |
| | | Ratio of Gross Expenses | | 1.53% | | | 1.62% | | | 1.54% | | | 1.51% | | | 1.53% | | | 13.44% | |
| | | Ratio of Net Expenses (After Waivers and Expense Offsets) | | 0.89% | | | 0.90% | | | 0.92% | | | 0.94% | | | 1.00% | | | 1.07% | |
| | | Ratio of Net Investment Income/(Loss) | | 2.05% | | | 1.90% | | | 1.30% | | | 0.95% | | | 0.77% | | | 5.04% | |
| | Portfolio Turnover Rate | | 92% | | | 268% | | | 440% | | | 302%(3) | | | 122% | | | 10% | |
| | | | | | | | | | | | | | | | | | | | | | |
| |
* Total return includes adjustments in accordance with generally accepted accounting principles required at the year or period end and are not annualized for periods of less than one full year. ** Annualized for periods of less than one full year. (1) Period from June 23, 2015 (inception date) through June 30, 2015. (2) Per share amounts are calculated based on average shares outstanding during the year or period. (3) The increase in the portfolio turnover rate was due to a restructuring of the Fund’s portfolio as a result of a change in its principal investment strategies. |
| | |
See Notes to Financial Statements. |
| |
Janus Investment Fund | 37 |
Janus Henderson Adaptive Global Allocation Fund
Notes to Financial Statements (unaudited)
1. Organization and Significant Accounting Policies
Janus Henderson Adaptive Global Allocation Fund (the “Fund”) is a series of Janus Investment Fund (the “Trust”), which is organized as a Massachusetts business trust and is registered under the Investment Company Act of 1940, as amended (the “1940 Act”), as an open-end management investment company, and therefore has applied the specialized accounting and reporting guidance in Financial Accounting Standards Board (“FASB”) Accounting Standards Codification (“ASC”) Topic 946. The Trust offers 47 funds, each of which offers multiple share classes, with differing investment objectives and policies. The Fund seeks total return through growth of capital and income. The Fund is classified as nondiversified, as defined in the 1940 Act.
The Fund offers multiple classes of shares in order to meet the needs of various types of investors. Each class represents an interest in the same portfolio of investments. Certain financial intermediaries may not offer all classes of shares. Class D Shares are closed to certain new investors.
Class A Shares are offered through financial intermediary platforms including, but not limited to, traditional brokerage platforms, mutual fund wrap fee programs, bank trust platforms, and retirement platforms.
Class C Shares are offered through financial intermediary platforms including, but not limited to, traditional brokerage platforms, mutual fund wrap fee programs, and bank trust platforms.
Class C Shares are closed to investments by new employer-sponsored retirement plans and existing employer-sponsored retirement plans are no longer able to make additional purchases or exchanges into Class C Shares.
The Funds have adopted an auto-conversion policy pursuant to which Class C Shares that have been held for ten years will be automatically converted to Class A Shares without the imposition of any sales charge, fee or other charge. The conversion will generally occur no later than ten business days in the month following the month of the tenth anniversary of the date of purchase. Class C Shares purchased through the reinvestment of dividends and other distributions on Class C Shares will convert to Class A Shares at the same time as the Class C Shares with respect to which they were purchased. For Class C Shares held in omnibus accounts on intermediary platforms, the Fund will rely on these intermediaries to implement this conversion feature. Your financial intermediary may have separate policies and procedures as to when and how Class C Shares may be converted to Class A Shares. Please contact your financial intermediary for additional information.
Class D Shares are generally no longer being made available to new investors who do not already have a direct account with the Janus Henderson funds. Class D Shares are available only to investors who hold accounts directly with the Janus Henderson funds, to immediate family members or members of the same household of an eligible individual investor, and to existing beneficial owners of sole proprietorships or partnerships that hold accounts directly with the Janus Henderson funds.
Class I Shares are available through certain financial intermediary platforms including, but not limited to, mutual fund wrap fee programs, managed account programs, asset allocation programs, bank trust platforms, as well as certain retirement platforms. Class I Shares are also available to certain direct institutional investors including, but not limited to, corporations, certain retirement plans, public plans, and foundations/endowments, who established Class I Share accounts before August 4, 2017.
Class N Shares are generally available only to financial intermediaries purchasing on behalf of: 1) certain adviser-assisted, employer-sponsored retirement plans, including 401(k) plans, 457 plans, 403(b) plans, Taft-Hartley multi-employer plans, profit-sharing and money purchase pension plans, defined benefit plans and certain welfare benefit plans, such as health savings accounts, and nonqualified deferred compensation plans; and 2) retail investors purchasing in qualified or nonqualified accounts, whose accounts are held through an omnibus account at their financial intermediary, and where the financial intermediary requires no payment or reimbursement from the Fund, Janus Capital Management LLC (“Janus Capital”), or its affiliates. Class N Shares are also available to Janus Henderson proprietary products and to certain direct institutional investors approved by Janus Distributors LLC dba Janus Henderson Distributors (“Janus Henderson Distributors”) including, but not limited to, corporations, certain retirement plans, public plans, and foundations and endowments, subject to minimum investment requirements.
Class S Shares are offered through financial intermediary platforms including, but not limited to, retirement platforms and asset allocation, mutual fund wrap, or other discretionary or nondiscretionary fee-based investment advisory
Janus Henderson Adaptive Global Allocation Fund
Notes to Financial Statements (unaudited)
programs. In addition, Class S Shares may be available through certain financial intermediaries who have an agreement with Janus Capital or its affiliates to offer Class S Shares on their supermarket platforms.
Class T Shares are available through certain financial intermediary platforms including, but not limited to, mutual fund wrap fee programs, managed account programs, asset allocation programs, bank trust platforms, as well as certain retirement platforms. In addition, Class T Shares may be available through certain financial intermediaries who have an agreement with Janus Capital or its affiliates to offer Class T Shares on their supermarket platforms.
The following accounting policies have been followed by the Fund and are in conformity with accounting principles generally accepted in the United States of America.
Investment Valuation
Securities held by the Fund are valued in accordance with policies and procedures established by and under the supervision of the Trustees (the “Valuation Procedures”). Equity securities traded on a domestic securities exchange are generally valued at the closing prices on the primary market or exchange on which they trade. If such price is lacking for the trading period immediately preceding the time of determination, such securities are valued at their current bid price. Equity securities that are traded on a foreign exchange are generally valued at the closing prices on such markets. In the event that there is no current trading volume on a particular security in such foreign exchange, the bid price from the primary exchange is generally used to value the security. Securities that are traded on the over-the-counter (“OTC”) markets are generally valued at their closing or latest bid prices as available. Foreign securities and currencies are converted to U.S. dollars using the applicable exchange rate in effect at the close of the New York Stock Exchange (“NYSE”). The Fund will determine the market value of individual securities held by it by using prices provided by one or more approved professional pricing services or, as needed, by obtaining market quotations from independent broker-dealers. Most debt securities are valued in accordance with the evaluated bid price supplied by the pricing service that is intended to reflect market value. The evaluated bid price supplied by the pricing service is an evaluation that may consider factors such as security prices, yields, maturities and ratings. Certain short-term securities maturing within 60 days or less may be evaluated and valued on an amortized cost basis provided that the amortized cost determined approximates market value. Securities for which market quotations or evaluated prices are not readily available or deemed unreliable are valued at fair value determined in good faith under the Valuation Procedures. Circumstances in which fair value pricing may be utilized include, but are not limited to: (i) a significant event that may affect the securities of a single issuer, such as a merger, bankruptcy, or significant issuer-specific development; (ii) an event that may affect an entire market, such as a natural disaster or significant governmental action; (iii) a nonsignificant event such as a market closing early or not opening, or a security trading halt; and (iv) pricing of a nonvalued security and a restricted or nonpublic security. Special valuation considerations may apply with respect to “odd-lot” fixed-income transactions which, due to their small size, may receive evaluated prices by pricing services which reflect a large block trade and not what actually could be obtained for the odd-lot position. The Fund uses systematic fair valuation models provided by independent third parties to value international equity securities in order to adjust for stale pricing, which may occur between the close of certain foreign exchanges and the close of the NYSE.
Valuation Inputs Summary
FASB ASC 820, Fair Value Measurements and Disclosures (“ASC 820”), defines fair value, establishes a framework for measuring fair value, and expands disclosure requirements regarding fair value measurements. This standard emphasizes that fair value is a market-based measurement that should be determined based on the assumptions that market participants would use in pricing an asset or liability and establishes a hierarchy that prioritizes inputs to valuation techniques used to measure fair value. These inputs are summarized into three broad levels:
Level 1 – Unadjusted quoted prices in active markets the Fund has the ability to access for identical assets or liabilities.
Level 2 – Observable inputs other than unadjusted quoted prices included in Level 1 that are observable for the asset or liability either directly or indirectly. These inputs may include quoted prices for the identical instrument on an inactive market, prices for similar instruments, interest rates, prepayment speeds, credit risk, yield curves, default rates and similar data.
Assets or liabilities categorized as Level 2 in the hierarchy generally include: debt securities fair valued in accordance with the evaluated bid or ask prices supplied by a pricing service; securities traded on OTC markets and listed securities for which no sales are reported that are fair valued at the latest bid price (or yield equivalent thereof) obtained from one or more dealers transacting in a market for such securities or by a pricing service
Janus Henderson Adaptive Global Allocation Fund
Notes to Financial Statements (unaudited)
approved by the Fund’s Trustees; certain short-term debt securities with maturities of 60 days or less that are fair valued at amortized cost; and equity securities of foreign issuers whose fair value is determined by using systematic fair valuation models provided by independent third parties in order to adjust for stale pricing which may occur between the close of certain foreign exchanges and the close of the NYSE. Other securities that may be categorized as Level 2 in the hierarchy include, but are not limited to, preferred stocks, bank loans, swaps, investments in unregistered investment companies, options, and forward contracts.
Level 3 – Unobservable inputs for the asset or liability to the extent that relevant observable inputs are not available, representing the Fund’s own assumptions about the assumptions that a market participant would use in valuing the asset or liability, and that would be based on the best information available.
There have been no significant changes in valuation techniques used in valuing any such positions held by the Fund since the beginning of the fiscal year.
The inputs or methodology used for fair valuing securities are not necessarily an indication of the risk associated with investing in those securities. The summary of inputs used as of December 31, 2019 to fair value the Fund’s investments in securities and other financial instruments is included in the “Valuation Inputs Summary” in the Notes to Schedule of Investments and Other Information.
Investment Transactions and Investment Income
Investment transactions are accounted for as of the date purchased or sold (trade date). Dividend income is recorded on the ex-dividend date. Certain dividends from foreign securities will be recorded as soon as the Fund is informed of the dividend, if such information is obtained subsequent to the ex-dividend date. Dividends from foreign securities may be subject to withholding taxes in foreign jurisdictions. Interest income is recorded daily on the accrual basis and includes amortization of premiums and accretion of discounts. The Fund classifies gains and losses on prepayments received as an adjustment to interest income. Debt securities may be placed in non-accrual status and related interest income may be reduced by stopping current accruals and writing off interest receivables when collection of all or a portion of interest has become doubtful. Gains and losses are determined on the identified cost basis, which is the same basis used for federal income tax purposes. Income, as well as gains and losses, both realized and unrealized, are allocated daily to each class of shares based upon the ratio of net assets represented by each class as a percentage of total net assets.
Expenses
The Fund bears expenses incurred specifically on its behalf. Each class of shares bears a portion of general expenses, which are allocated daily to each class of shares based upon the ratio of net assets represented by each class as a percentage of total net assets. Expenses directly attributable to a specific class of shares are charged against the operations of such class.
Estimates
The preparation of financial statements in conformity with accounting principles generally accepted in the United States of America requires management to make estimates and assumptions that affect the reported amount of assets and liabilities and disclosure of contingent assets and liabilities at the date of the financial statements, and the reported amounts of income and expenses during the reporting period. Actual results could differ from those estimates.
Indemnifications
In the normal course of business, the Fund may enter into contracts that contain provisions for indemnification of other parties against certain potential liabilities. The Fund’s maximum exposure under these arrangements is unknown, and would involve future claims that may be made against the Fund that have not yet occurred. Currently, the risk of material loss from such claims is considered remote.
Foreign Currency Translations
The Fund does not isolate that portion of the results of operations resulting from the effect of changes in foreign exchange rates on investments from the fluctuations arising from changes in market prices of securities held at the date of the financial statements. Net unrealized appreciation or depreciation of investments and foreign currency translations arise from changes in the value of assets and liabilities, including investments in securities held at the date of the financial statements, resulting from changes in the exchange rates and changes in market prices of securities held.
Janus Henderson Adaptive Global Allocation Fund
Notes to Financial Statements (unaudited)
Currency gains and losses are also calculated on payables and receivables that are denominated in foreign currencies. The payables and receivables are generally related to foreign security transactions and income translations.
Foreign currency-denominated assets and forward currency contracts may involve more risks than domestic transactions, including currency risk, counterparty risk, political and economic risk, regulatory risk and equity risk. Risks may arise from unanticipated movements in the value of foreign currencies relative to the U.S. dollar.
Dividends and Distributions
The Fund generally declares and distributes dividends of net investment income and realized capital gains (if any) annually. The Fund may treat a portion of the amount paid to redeem shares as a distribution of investment company taxable income and realized capital gains that are reflected in the net asset value. This practice, commonly referred to as “equalization,” has no effect on the redeeming shareholder or the Fund’s total return, but may reduce the amounts that would otherwise be required to be paid as taxable dividends to the remaining shareholders. It is possible that the Internal Revenue Service (IRS) could challenge the Fund's equalization methodology or calculations, and any such challenge could result in additional tax, interest, or penalties to be paid by the Fund.
The Fund may make certain investments in real estate investment trusts (“REITs”) which pay dividends to their shareholders based upon funds available from operations. It is quite common for these dividends to exceed the REITs’ taxable earnings and profits, resulting in the excess portion of such dividends being designated as a return of capital. If the Fund distributes such amounts, such distributions could constitute a return of capital to shareholders for federal income tax purposes.
Federal Income Taxes
The Fund intends to continue to qualify as a regulated investment company and distribute all of its taxable income in accordance with the requirements of Subchapter M of the Internal Revenue Code. Management has analyzed the Fund’s tax positions taken for all open federal income tax years, generally a three-year period, and has concluded that no provision for federal income tax is required in the Fund’s financial statements. The Fund is not aware of any tax positions for which it is reasonably possible that the total amounts of unrecognized tax benefits will significantly change in the next twelve months.
2. Derivative Instruments
The Fund may invest in various types of derivatives, which may at times result in significant derivative exposure. A derivative is a financial instrument whose performance is derived from the performance of another asset. The Fund may invest in derivative instruments including, but not limited to: futures contracts, put options, call options, options on future contracts, options on foreign currencies, options on recovery locks, options on security and commodity indices, swaps, forward contracts, structured investments, and other equity-linked derivatives. Each derivative instrument that was held by the Fund during the period ended December 31, 2019 is discussed in further detail below. A summary of derivative activity by the Fund is reflected in the tables at the end of the Schedule of Investments.
The Fund may use derivative instruments for hedging purposes (to offset risks associated with an investment, currency exposure, or market conditions), to adjust currency exposure relative to a benchmark index, or for speculative purposes (to earn income and seek to enhance returns). When the Fund invests in a derivative for speculative purposes, the Fund will be fully exposed to the risks of loss of that derivative, which may sometimes be greater than the derivative’s cost. The Fund may not use any derivative to gain exposure to an asset or class of assets that it would be prohibited by its investment restrictions from purchasing directly. The Fund’s ability to use derivative instruments may also be limited by tax considerations.
Investments in derivatives in general are subject to market risks that may cause their prices to fluctuate over time. Investments in derivatives may not directly correlate with the price movements of the underlying instrument. As a result, the use of derivatives may expose the Fund to additional risks that it would not be subject to if it invested directly in the securities underlying those derivatives. The use of derivatives may result in larger losses or smaller gains than otherwise would be the case. Derivatives can be volatile and may involve significant risks.
In pursuit of its investment objective, the Fund may seek to use derivatives to increase or decrease exposure to the following market risk factors:
· Commodity Risk – the risk related to the change in value of commodities or commodity-linked investments due to changes in the overall market movements, volatility of the underlying benchmark, changes in interest rates, or
Janus Henderson Adaptive Global Allocation Fund
Notes to Financial Statements (unaudited)
other factors affecting a particular industry or commodity such as drought, floods, weather, livestock disease, embargoes, tariffs, and international economic, political, and regulatory developments.
· Counterparty Risk – the risk that the counterparty (the party on the other side of the transaction) on a derivative transaction will be unable to honor its financial obligation to the Fund.
· Credit Risk – the risk an issuer will be unable to make principal and interest payments when due, or will default on its obligations.
· Currency Risk – the risk that changes in the exchange rate between currencies will adversely affect the value (in U.S. dollar terms) of an investment.
· Equity Risk – the risk related to the change in value of equity securities as they relate to increases or decreases in the general market.
· Index Risk – if the derivative is linked to the performance of an index, it will be subject to the risks associated with changes in that index. If the index changes, the Fund could receive lower interest payments or experience a reduction in the value of the derivative to below what the Fund paid. Certain indexed securities, including inverse securities (which move in an opposite direction to the index), may create leverage, to the extent that they increase or decrease in value at a rate that is a multiple of the changes in the applicable index.
· Interest Rate Risk – the risk that the value of fixed-income securities will generally decline as prevailing interest rates rise, which may cause the Fund’s NAV to likewise decrease.
· Leverage Risk – the risk associated with certain types of leveraged investments or trading strategies pursuant to which relatively small market movements may result in large changes in the value of an investment. The Fund creates leverage by investing in instruments, including derivatives, where the investment loss can exceed the original amount invested. Certain investments or trading strategies, such as short sales, that involve leverage can result in losses that greatly exceed the amount originally invested.
· Liquidity Risk – the risk that certain securities may be difficult or impossible to sell at the time that the seller would like or at the price that the seller believes the security is currently worth.
Derivatives may generally be traded OTC or on an exchange. Derivatives traded OTC are agreements that are individually negotiated between parties and can be tailored to meet a purchaser’s needs. OTC derivatives are not guaranteed by a clearing agency and may be subject to increased credit risk.
In an effort to mitigate credit risk associated with derivatives traded OTC, the Fund may enter into collateral agreements with certain counterparties whereby, subject to certain minimum exposure requirements, the Fund may require the counterparty to post collateral if the Fund has a net aggregate unrealized gain on all OTC derivative contracts with a particular counterparty. Additionally, the Fund may deposit cash and/or treasuries as collateral with the counterparty and/or custodian daily (based on the daily valuation of the financial asset) if the Fund has a net aggregate unrealized loss on OTC derivative contracts with a particular counterparty. All liquid securities and restricted cash are considered to cover in an amount at all times equal to or greater than the Fund’s commitment with respect to certain exchange-traded derivatives, centrally cleared derivatives, forward foreign currency exchange contracts, short sales, and/or securities with extended settlement dates. There is no guarantee that counterparty exposure is reduced and these arrangements are dependent on Janus Capital's ability to establish and maintain appropriate systems and trading.
Forward Foreign Currency Exchange Contracts
A forward foreign currency exchange contract (“forward currency contract”) is an obligation to buy or sell a specified currency at a future date at a negotiated rate (which may be U.S. dollars or a foreign currency). The Fund may enter into forward currency contracts for hedging purposes, including, but not limited to, reducing exposure to changes in foreign currency exchange rates on foreign portfolio holdings and locking in the U.S. dollar cost of firm purchase and sale commitments for securities denominated in or exposed to foreign currencies. The Fund may also invest in forward currency contracts for non-hedging purposes such as seeking to enhance returns. The Fund is subject to currency risk and counterparty risk in the normal course of pursuing its investment objective through its investments in forward currency contracts.
Forward currency contracts are valued by converting the foreign value to U.S. dollars by using the current spot U.S. dollar exchange rate and/or forward rate for that currency. Exchange and forward rates as of the close of the NYSE
Janus Henderson Adaptive Global Allocation Fund
Notes to Financial Statements (unaudited)
shall be used to value the forward currency contracts. The unrealized appreciation/(depreciation) for forward currency contracts is reported in the Statement of Assets and Liabilities as a receivable or payable and in the Statement of Operations for the change in unrealized net appreciation/depreciation (if applicable). The gain or loss arising from the difference between the U.S. dollar cost of the original contract and the value of the foreign currency in U.S. dollars upon closing a forward currency contract is reported on the Statement of Operations (if applicable).
During the period, the Fund entered into forward currency contracts with the obligation to sell foreign currencies in the future at an agreed upon rate in order to take a negative outlook on the related currency. These forward contracts seek to increase exposure to currency risk.
During the period, the Fund entered into forward currency contracts with the obligation to sell foreign currencies in the future at an agreed upon rate in order to decrease exposure to currency risk associated with foreign currency denominated securities held by the Fund.
Futures Contracts
A futures contract is an exchange-traded agreement to take or make delivery of an underlying asset at a specific time in the future for a specific predetermined negotiated price. The Fund may enter into futures contracts to gain exposure to the stock market or other markets pending investment of cash balances or to meet liquidity needs. The Fund is subject to interest rate risk, equity risk, and currency risk in the normal course of pursuing its investment objective through its investments in futures contracts. The Fund may also use such derivative instruments to hedge or protect from adverse movements in securities prices, currency rates or interest rates. The use of futures contracts may involve risks such as the possibility of illiquid markets or imperfect correlation between the values of the contracts and the underlying securities, or that the counterparty will fail to perform its obligations.
Futures contracts on commodities are valued at the settlement price on valuation date on the commodities exchange as reported by an approved vendor. Mini contracts, as defined in the description of the contract, shall be valued using the Actual Settlement Price or “ASET” price type as reported by an approved vendor. In the event that foreign futures trade when the foreign equity markets are closed, the last foreign futures trade price shall be used.
Futures contracts are marked-to-market daily, and the daily variation margin is recorded as a receivable or payable on the Statement of Assets and Liabilities (if applicable). The change in unrealized net appreciation/depreciation is reported on the Statement of Operations (if applicable). When a contract is closed, a realized gain or loss is reported on the Statement of Operations (if applicable), equal to the difference between the opening and closing value of the contract.
Securities held by the Fund that are designated as collateral for market value on futures contracts are noted on the Schedule of Investments (if applicable). Such collateral is in the possession of the Fund’s futures commission merchant.
With futures, there is minimal counterparty credit risk to the Fund since futures are exchange-traded and the exchange’s clearinghouse, as counterparty to all exchange-traded futures, guarantees the futures against default.
During the period, the Fund purchased interest rate futures to increase exposure to interest rate risk.
During the period, the Fund sold interest rate futures to decrease exposure to interest rate risk.
During the period, the Fund purchased futures on equity indices to increase exposure to equity risk.
During the period, the Fund sold futures on equity indices to decrease exposure to equity risk.
Options Contracts
An options contract provides the purchaser with the right, but not the obligation, to buy (call option) or sell (put option) a financial instrument at an agreed upon price on or before a specified date. The purchaser pays a premium to the seller for this right. The seller has the corresponding obligation to sell or buy a financial instrument if the purchaser (owner) "exercises" the option. When an option is exercised, the proceeds on sales for a written call option, the purchase cost for a written put option, or the cost of the security for a purchased put or call option are adjusted by the amount of premium received or paid. Upon expiration, or closing of the option transaction, a realized gain or loss is reported on the Statement of Operations (if applicable). The difference between the premium paid/received and the market value of the option is recorded as unrealized appreciation or depreciation. The net change in unrealized appreciation or depreciation is reported on the Statement of Operations (if applicable). Option contracts are typically valued using an approved vendor’s option valuation model. To the extent reliable market quotations are available, option contracts are valued using
Janus Henderson Adaptive Global Allocation Fund
Notes to Financial Statements (unaudited)
market quotations. In cases when an approved vendor cannot provide coverage for an option and there is no reliable market quotation, a broker quotation or an internal valuation using the Black-Scholes model, the Cox-Rubinstein Binomial Option Pricing Model, or other appropriate option pricing model is used. Certain options contracts are marked-to-market daily, and the daily variation margin is recorded as a receivable or payable on the Statement of Assets and Liabilities as “Variation margin receivable” or “Variation margin payable” (if applicable).
The Fund may use options contracts to hedge against changes in interest rates, the values of equities, or foreign currencies. The Fund generally invests in options to hedge against adverse movements in the value of portfolio holdings. The use of such instruments may involve certain additional risks as a result of unanticipated movements in the market. A lack of correlation between the value of an instrument underlying an option and the asset being hedged, or unexpected adverse price movements, could render the Fund’s hedging strategy unsuccessful. In addition, there can be no assurance that a liquid secondary market will exist for any option purchased or sold. The Fund may be subject to counterparty risk, interest rate risk, liquidity risk, equity risk, commodity risk, and currency risk in the normal course of pursuing its investment objective through its investments in options contracts.
Options traded on an exchange are regulated and the terms of the options are standardized. Options traded OTC expose the Fund to counterparty risk in the event that the counterparty does not perform. This risk is mitigated by having a netting arrangement between the Fund and the counterparty and by having the counterparty post collateral to cover the Fund’s exposure to the counterparty.
The Fund may purchase put options to hedge against a decline in the value of its portfolio. By using put options in this way, the Fund will reduce any profit it might otherwise have realized in the underlying security by the amount of the premium paid for the put option and by transaction costs. The Fund may purchase call options to hedge against an increase in the price of securities that it may buy in the future. The premium paid for the call option plus any transaction costs will reduce the benefit, if any, realized by the Fund upon exercise of the option, and, unless the price of the underlying security rises sufficiently, the option may expire worthless to the Fund. The risk in buying options is that the Fund pays a premium whether or not the options are exercised. Options purchased are reported in the Schedule of Investments (if applicable).
During the period, the Fund purchased call options on various equity indices for the purpose of increasing exposure to broad equity risk.
During the period, the Fund purchased put options on various equity indices for the purpose of decreasing exposure to broad equity risk.
In writing an option, the Fund bears the risk of an unfavorable change in the price of the security underlying the written option. When an option is written, the Fund receives a premium and becomes obligated to sell or purchase the underlying security at a fixed price, upon exercise of the option. Options written are reported as a liability on the Statement of Assets and Liabilities as “Options written, at value” (if applicable). The risk in writing call options is that the Fund gives up the opportunity for profit if the market price of the security increases and the options are exercised. The risk in writing put options is that the Fund may incur a loss if the market price of the security decreases and the options are exercised. The risk in buying options is that the Fund pays a premium whether or not the options are exercised. Exercise of an option written by the Fund could result in the Fund buying or selling a security at a price different from the current market value.
During the period, the Fund wrote call options on various equity indices for the purpose of decreasing exposure to broad equity risk.
During the period, the Fund wrote put options on various equity indices for the purpose of increasing exposure to broad equity risk.
3. Other Investments and Strategies
Additional Investment Risk
In the aftermath of the 2007-2008 financial crisis, the financial sector experienced reduced liquidity in credit and other fixed-income markets, and an unusually high degree of volatility, both domestically and internationally. In response to the crisis, the United States and certain foreign governments, along with the U.S. Federal Reserve and certain foreign central banks, took steps to support the financial markets. For example, the enactment of the Dodd-Frank Act in 2010 provided for widespread regulation of financial institutions, consumer financial products and services, broker-dealers,
Janus Henderson Adaptive Global Allocation Fund
Notes to Financial Statements (unaudited)
over-the-counter derivatives, investment advisers, credit rating agencies, and mortgage lending, which expanded federal oversight in the financial sector, including the investment management industry. The withdrawal of this support, a failure of measures put in place to respond to the crisis, or investor perception that such efforts were not sufficient could each negatively affect financial markets generally, and the value and liquidity of specific securities. In addition, policy and legislative changes in the United States and in other countries continue to impact many aspects of financial regulation.
A number of countries in the European Union (“EU”) have experienced, and may continue to experience, severe economic and financial difficulties. In particular, many EU nations are susceptible to economic risks associated with high levels of debt. Many non-governmental issuers, and even certain governments, have defaulted on, or been forced to restructure, their debts. Many other issuers have faced difficulties obtaining credit or refinancing existing obligations. Financial institutions have in many cases required government or central bank support, have needed to raise capital, and/or have been impaired in their ability to extend credit. As a result, financial markets in the EU experienced extreme volatility and declines in asset values and liquidity. Responses to these financial problems by European governments, central banks, and others, including austerity measures and reforms, may not work, may result in social unrest, and may limit future growth and economic recovery or have other unintended consequences. The risk of investing in securities in the European markets may also be heightened due to the referendum in which the United Kingdom voted to exit the EU (commonly known as “Brexit”). There is considerable uncertainty about how Brexit will be conducted, how negotiations of necessary treaties and trade agreements will conclude, or how financial markets will react.
Certain areas of the world have historically been prone to and economically sensitive to environmental events such as, but not limited to, hurricanes, earthquakes, typhoons, flooding, tidal waves, tsunamis, erupting volcanoes, wildfires or droughts, tornadoes, mudslides, or other weather-related phenomena. Such disasters, and the resulting physical or economic damage, could have a severe and negative impact on the Fund’s investment portfolio and, in the longer term, could impair the ability of issuers in which the Fund invests to conduct their businesses as they would under normal conditions. Adverse weather conditions may also have a particularly significant negative effect on issuers in the agricultural sector and on insurance companies that insure against the impact of natural disasters.
Counterparties
Fund transactions involving a counterparty are subject to the risk that the counterparty or a third party will not fulfill its obligation to the Fund (“counterparty risk”). Counterparty risk may arise because of the counterparty’s financial condition (i.e., financial difficulties, bankruptcy, or insolvency), market activities and developments, or other reasons, whether foreseen or not. A counterparty’s inability to fulfill its obligation may result in significant financial loss to the Fund. The Fund may be unable to recover its investment from the counterparty or may obtain a limited recovery, and/or recovery may be delayed. The extent of the Fund’s exposure to counterparty risk with respect to financial assets and liabilities approximates its carrying value. See the "Offsetting Assets and Liabilities" section of this Note for further details.
The Fund may be exposed to counterparty risk through participation in various programs, including, but not limited to, lending its securities to third parties, cash sweep arrangements whereby the Fund’s cash balance is invested in one or more types of cash management vehicles, as well as investments in, but not limited to, repurchase agreements, debt securities, and derivatives, including various types of swaps, futures and options. The Fund intends to enter into financial transactions with counterparties that Janus Capital believes to be creditworthy at the time of the transaction. There is always the risk that Janus Capital’s analysis of a counterparty’s creditworthiness is incorrect or may change due to market conditions. To the extent that the Fund focuses its transactions with a limited number of counterparties, it will have greater exposure to the risks associated with one or more counterparties.
Exchange-Traded and Mutual Funds
The Fund may invest in exchange-traded funds (“ETFs”) and mutual funds to gain exposure to a particular portion of the market. ETFs are typically open-end investment companies, which may seek to track the performance of a specific index or be actively managed. ETFs are traded on a national securities exchange at market prices that may vary from the net asset value of their underlying investments. Accordingly, there may be times when an ETF trades at a premium or discount. When the Fund invests in an ETF or mutual fund, in addition to directly bearing the expenses associated with its own operations, it will bear a pro rata portion of the ETF's or mutual fund’s expenses. As a result, the cost of investing in the Fund may be higher than the cost of investing directly in ETFs or mutual funds and may be higher than other mutual funds that invest directly in stocks and bonds. ETFs also involve the risk that an active trading market for an ETF's shares may not develop or be maintained. Similarly, because the value of ETF shares depends on the demand in the market, the Fund may not be able to purchase or sell an ETF at the most optimal time, which could adversely affect the Fund’s performance. In addition, ETFs that track particular indices may be unable to match the performance
Janus Henderson Adaptive Global Allocation Fund
Notes to Financial Statements (unaudited)
of such underlying indices due to the temporary unavailability of certain index securities in the secondary market or other factors, such as discrepancies with respect to the weighting of securities. Because the Fund may invest in a broad range of ETFs and mutual funds, such risks may include, but are not limited to, leverage risk, foreign exposure risk, interest rate risk, emerging markets risk, fixed-income risk, and commodity-linked investments risk. The Fund is also subject to the risks associated with the securities in which the ETF or mutual fund invests.
Offsetting Assets and Liabilities
The Fund presents gross and net information about transactions that are either offset in the financial statements or subject to an enforceable master netting arrangement or similar agreement with a designated counterparty, regardless of whether the transactions are actually offset in the Statement of Assets and Liabilities.
In order to better define its contractual rights and to secure rights that will help the Fund mitigate its counterparty risk, the Fund has entered into an International Swaps and Derivatives Association, Inc. Master Agreement (“ISDA Master Agreement”) or similar agreement with its derivative contract counterparties. An ISDA Master Agreement is a bilateral agreement between the Fund and a counterparty that governs OTC derivatives and forward foreign currency exchange contracts and typically contains, among other things, collateral posting terms and netting provisions in the event of a default and/or termination event. Under an ISDA Master Agreement, in the event of a default and/or termination event, the Fund may offset with each counterparty certain derivative financial instruments’ payables and/or receivables with collateral held and/or posted and create one single net payment.
The following tables present gross amounts of recognized assets and/or liabilities and the net amounts after deducting collateral that has been pledged by counterparties or has been pledged to counterparties (if applicable). For corresponding information grouped by type of instrument, see the “Fair Value of Derivative Instruments (not accounted for as hedging instruments) as of December 31, 2019” table located in the Fund’s Schedule of Investments.
| | | | | | | | | | |
Offsetting of Financial Assets and Derivative Assets |
| |
| | | Gross Amounts | | | | | | |
| | | of Recognized | | Offsetting Asset | | Collateral | | |
Counterparty | | Assets | | or Liability(a) | | Pledged(b) | | Net Amount |
| | | | | | | | | |
Bank of America | $ | 33,594 | $ | (10,351) | $ | — | $ | 23,243 |
JPMorgan Chase Bank, National Association | | 266,396 | | — | | (266,396) | | — |
| | | | | | | | | |
Total | $ | 299,990 | $ | (10,351) | $ | (266,396) | $ | 23,243 |
Offsetting of Financial Liabilities and Derivative Liabilities |
| |
| | | Gross Amounts | | | | | | |
| | | of Recognized | | Offsetting Asset | | Collateral | | |
Counterparty | | Liabilities | | or Liability(a) | | Pledged(b) | | Net Amount |
| | | | | | | | | |
Bank of America | $ | 10,351 | $ | (10,351) | $ | — | $ | — |
HSBC Securities (USA), Inc. | | 76,185 | | — | | — | | 76,185 |
| | | | | | | | | |
Total | $ | 86,536 | $ | (10,351) | $ | — | $ | 76,185 |
(a) | Represents the amount of assets or liabilities that could be offset with the same counterparty under master netting or similar agreements that management elects not to offset on the Statement of Assets and Liabilities. |
(b) | Collateral pledged is limited to the net outstanding amount due to/from an individual counterparty. The actual collateral amounts pledged may exceed these amounts and may fluctuate in value. |
JPMorgan Chase Bank, National Association acts as securities lending agent and a limited purpose custodian or subcustodian to receive and disburse cash balances and cash collateral, hold short-term investments, hold collateral, and perform other custodian functions in accordance with the Non-Custodial Securities Lending Agreement. For
Janus Henderson Adaptive Global Allocation Fund
Notes to Financial Statements (unaudited)
financial reporting purposes, the Fund does not offset financial instruments’ payables and receivables and related collateral on the Statement of Assets and Liabilities. Securities on loan will be continuously secured by collateral which may consist of cash, U.S. Government securities, domestic and foreign short-term debt instruments, letters of credit, time deposits, repurchase agreements, money market mutual funds or other money market accounts, or such other collateral as permitted by the SEC. See “Securities Lending” in the “Notes to Financial Statements” for additional information.
The Fund generally does not exchange collateral on its forward foreign currency contracts with its counterparties; however, all liquid securities and restricted cash are considered to cover in an amount at all times equal to or greater than the Fund’s commitment with respect to these contracts. Certain securities may be segregated at the Fund’s custodian. These segregated securities are denoted on the accompanying Schedule of Investments and are evaluated daily to ensure their cover and/or market value equals or exceeds the Fund’s corresponding forward foreign currency exchange contract's obligation value.
The Fund may require the counterparty to pledge securities as collateral daily (based on the daily valuation of the financial asset) if the Fund has a net aggregate unrealized gain on OTC derivative contracts with a particular counterparty. The Fund may deposit cash as collateral with the counterparty and/or custodian daily (based on the daily valuation of the financial asset) if the Fund has a net aggregate unrealized loss on OTC derivative contracts with a particular counterparty. The collateral amounts are subject to minimum exposure requirements and initial margin requirements. Collateral amounts are monitored and subsequently adjusted up or down as valuations fluctuate by at least the minimum exposure requirement. Collateral may reduce the risk of loss.
Real Estate Investing
The Fund may invest in equity and debt securities of real estate-related companies. Such companies may include those in the real estate industry or real estate-related industries. These securities may include common stocks, corporate bonds, preferred stocks, and other equity securities, including, but not limited to, mortgage-backed securities, real estate-backed securities, securities of REITs and similar REIT-like entities. A REIT is a trust that invests in real estate-related projects, such as properties, mortgage loans, and construction loans. REITs are generally categorized as equity, mortgage, or hybrid REITs. A REIT may be listed on an exchange or traded OTC.
Securities Lending
Under procedures adopted by the Trustees, the Fund may seek to earn additional income by lending securities to certain qualified broker-dealers and institutions. Effective December 16, 2019, JPMorgan Chase Bank, National Association replaced Deutsche Bank AG as securities lending agent for the Fund. JPMorgan Chase Bank, National Association acts as securities lending agent and a limited purpose custodian or subcustodian to receive and disburse cash balances and cash collateral, hold short-term investments, hold collateral, and perform other custodian functions in accordance with the Non-Custodial Securities Lending Agreement. The Fund may lend fund securities in an amount equal to up to 1/3 of its total assets as determined at the time of the loan origination. There is the risk of delay in recovering a loaned security or the risk of loss in collateral rights if the borrower fails financially. In addition, Janus Capital makes efforts to balance the benefits and risks from granting such loans. All loans will be continuously secured by collateral which may consist of cash, U.S. Government securities, domestic and foreign short-term debt instruments, letters of credit, time deposits, repurchase agreements, money market mutual funds or other money market accounts, or such other collateral as permitted by the SEC. If the Fund is unable to recover a security on loan, the Fund may use the collateral to purchase replacement securities in the market. There is a risk that the value of the collateral could decrease below the cost of the replacement security by the time the replacement investment is made, resulting in a loss to the Fund. In certain circumstances individual loan transactions could yield negative returns.
Upon receipt of cash collateral, Janus Capital may invest it in affiliated or non-affiliated cash management vehicles, whether registered or unregistered entities, as permitted by the 1940 Act and rules promulgated thereunder. Janus Capital currently intends to primarily invest the cash collateral in a cash management vehicle for which Janus Capital serves as investment adviser, Janus Henderson Cash Collateral Fund LLC. An investment in Janus Henderson Cash Collateral Fund LLC is generally subject to the same risks that shareholders experience when investing in similarly structured vehicles, such as the potential for significant fluctuations in assets as a result of the purchase and redemption activity of the securities lending program, a decline in the value of the collateral, and possible liquidity issues. Such risks may delay the return of the cash collateral and cause the Fund to violate its agreement to return the cash collateral to a borrower in a timely manner. As adviser to the Fund and Janus Henderson Cash Collateral Fund LLC, Janus Capital has an inherent conflict of interest as a result of its fiduciary duties to both the Fund and Janus
Janus Henderson Adaptive Global Allocation Fund
Notes to Financial Statements (unaudited)
Henderson Cash Collateral Fund LLC. Additionally, Janus Capital receives an investment advisory fee of 0.05% for managing Janus Henderson Cash Collateral Fund LLC, but it may not receive a fee for managing certain other affiliated cash management vehicles in which the Fund may invest, and therefore may have an incentive to allocate preferred investment opportunities to investment vehicles for which it is receiving a fee.
The value of the collateral must be at least 102% of the market value of the loaned securities that are denominated in U.S. dollars and 105% of the market value of the loaned securities that are not denominated in U.S. dollars. Loaned securities and related collateral are marked-to-market each business day based upon the market value of the loaned securities at the close of business, employing the most recent available pricing information. Collateral levels are then adjusted based on this mark-to-market evaluation.
The cash collateral invested by Janus Capital is disclosed in the Schedule of Investments (if applicable).
Income earned from the investment of the cash collateral, net of rebates paid to, or fees paid by, borrowers and less the fees paid to the lending agent are included as “Affiliated securities lending income, net” on the Statement of Operations. As of December 31, 2019, securities lending transactions accounted for as secured borrowings with an overnight and continuous contractual maturity are $266,396. Gross amounts of recognized liabilities for securities lending (collateral received) as of December 31, 2019 is $273,852, resulting in the net amount due to the counterparty of $7,456.
Sovereign Debt
The Fund may invest in U.S. and non-U.S. government debt securities (“sovereign debt”). Some investments in sovereign debt, such as U.S. sovereign debt, are considered low risk. However, investments in sovereign debt, especially the debt of less developed countries, can involve a high degree of risk, including the risk that the governmental entity that controls the repayment of sovereign debt may not be willing or able to repay the principal and/or to pay the interest on its sovereign debt in a timely manner. A sovereign debtor’s willingness or ability to satisfy its debt obligation may be affected by various factors including, but not limited to, its cash flow situation, the extent of its foreign currency reserves, the availability of foreign exchange when a payment is due, the relative size of its debt position in relation to its economy as a whole, the sovereign debtor’s policy toward international lenders, and local political constraints to which the governmental entity may be subject. Sovereign debtors may also be dependent on expected disbursements from foreign governments, multilateral agencies, and other entities. The failure of a sovereign debtor to implement economic reforms, achieve specified levels of economic performance, or repay principal or interest when due may result in the cancellation of third party commitments to lend funds to the sovereign debtor, which may further impair such debtor’s ability or willingness to timely service its debts. The Fund may be requested to participate in the rescheduling of such sovereign debt and to extend further loans to governmental entities, which may adversely affect the Fund’s holdings. In the event of default, there may be limited or no legal remedies for collecting sovereign debt and there may be no bankruptcy proceedings through which the Fund may collect all or part of the sovereign debt that a governmental entity has not repaid. In addition, to the extent the Fund invests in non-U.S. sovereign debt, it may be subject to currency risk.
4. Investment Advisory Agreements and Other Transactions with Affiliates
The Fund pays Janus Capital Management LLC's (“Janus Capital”) an investment advisory fee which is calculated daily and paid monthly. The following table reflects the Fund’s contractual investment advisory fee rate (expressed as an annual rate).
| | |
Average Daily Net Assets of the Fund | Contractual Investment Advisory Fee (%) |
First $2 Billion | 0.75 |
Next $2 Billion | 0.72 |
Over $4 Billion | 0.70 |
The Fund’s actual investment advisory fee rate for the reporting period was 0.75% of average annual net assets before any applicable waivers.
Janus Capital has contractually agreed to waive the advisory fee payable by the Fund or reimburse expenses in an amount equal to the amount, if any, that the Fund’s total annual fund operating expenses, including the investment advisory fee, but excluding the fees payable pursuant to a Rule 12b-1 plan, shareholder servicing fees, such as transfer agency fees (including out-of-pocket costs), administrative services fees and any networking/omnibus/administrative fees payable by any share class, brokerage commissions, interest, dividends, taxes, acquired fund fees and expenses,
Janus Henderson Adaptive Global Allocation Fund
Notes to Financial Statements (unaudited)
and extraordinary expenses, exceed the annual rate of 0.71% of the Fund’s average daily net assets. In addition, Janus Capital shall additionally reimburse or waive acquired fund fees and expenses to the extent they exceed 0.10%. Janus Capital has agreed to continue the waivers until at least October 28, 2020. If applicable, amounts waived and/or reimbursed to the Fund by Janus Capital are disclosed as “Excess Expense Reimbursement and Waivers” on the Statement of Operations.
Janus Services LLC (“Janus Services”), a wholly-owned subsidiary of Janus Capital, is the Fund’s transfer agent. In addition, Janus Services provides or arranges for the provision of certain other administrative services including, but not limited to, recordkeeping, accounting, order processing, and other shareholder services for the Fund. Janus Services is not compensated for its services related to the shares, except for out-of-pocket costs. These amounts are disclosed as “Other transfer agent fees and expenses” on the Statement of Operations.
Certain, but not all, intermediaries may charge administrative fees (such as networking and omnibus) to investors in Class A Shares, Class C Shares, and Class I Shares for administrative services provided on behalf of such investors. These administrative fees are paid by the Class A Shares, Class C Shares, and Class I Shares of the Fund to Janus Services, which uses such fees to reimburse intermediaries. Consistent with the Transfer Agency Agreement between Janus Services and the Fund, Janus Services may negotiate the level, structure, and/or terms of the administrative fees with intermediaries requiring such fees on behalf of the Fund. Janus Capital and its affiliates benefit from an increase in assets that may result from such relationships. The Funds’ Trustees have set limits on fees that the Funds may incur with respect to administrative fees paid for omnibus or networked accounts. Such limits are subject to change by the Trustees in the future. These amounts are disclosed as “Transfer agent networking and omnibus fees” on the Statement of Operations.
Effective July 1, 2019, the Board of Trustees of Janus Investment Fund approved a new administrative fee rate for Class D Shares detailed in the table below.
| | |
Average Daily Net Assets of Class D Shares of the Janus Henderson funds | Administrative Services Fee |
Under $40 billion | 0.12% |
$40 billion – $49.9 billion | 0.10% |
Over $49.9 billion | 0.08% |
The Fund’s actual Class D administrative fee rate was 0.12% for the reporting period.
Prior to July 1, 2019, the Fund’s Class D Shares paid an administrative services fee at an annual rate of 0.12% of the average daily net assets of Class D Shares for shareholder services provided by Janus Services. Janus Services provides or arranges for the provision of shareholder services including, but not limited to, recordkeeping, accounting, answering inquiries regarding accounts, transaction processing, transaction confirmations, and the mailing of prospectuses and shareholder reports. These amounts are disclosed as “Transfer agent administrative fees and expenses” on the Statement of Operations.
Janus Services receives an administrative services fee at an annual rate of up to 0.25% of the average daily net assets of the Fund’s Class S Shares and Class T Shares for providing or procuring administrative services to investors in Class S Shares and Class T Shares of the Fund. Janus Services expects to use all or a significant portion of this fee to compensate retirement plan service providers, broker-dealers, bank trust departments, financial advisors, and other financial intermediaries for providing these services. Janus Services or its affiliates may also pay fees for services provided by intermediaries to the extent the fees charged by intermediaries exceed the 0.25% of net assets charged to Class S Shares and Class T Shares of the Fund. Janus Services may keep certain amounts retained for reimbursement of out-of-pocket costs incurred for servicing clients of Class S Shares and Class T Shares. These amounts are disclosed as “Transfer agent administrative fees and expenses” on the Statement of Operations.
Services provided by these financial intermediaries may include, but are not limited to, recordkeeping, subaccounting, order processing, providing order confirmations, periodic statements, forwarding prospectuses, shareholder reports, and other materials to existing customers, answering inquiries regarding accounts, and other administrative services. Order processing includes the submission of transactions through the National Securities Clearing Corporation (“NSCC”) or similar systems, or those processed on a manual basis with Janus Capital. For all share classes, Janus Services also seeks reimbursement for costs it incurs as transfer agent and for providing servicing.
Janus Henderson Adaptive Global Allocation Fund
Notes to Financial Statements (unaudited)
Janus Services is compensated for its services related to the Fund’s Class D Shares. These amounts are disclosed as “Other transfer agent fees and expenses” on the Statement of Operations.
Under a distribution and shareholder servicing plan (the “Plan”) adopted in accordance with Rule 12b-1 under the 1940 Act, the Fund pays the Trust’s distributor, Janus Henderson Distributors, a wholly-owned subsidiary of Janus Capital, a fee for the sale and distribution and/or shareholder servicing of the Shares at an annual rate of up to 0.25% of the Class A Shares’ average daily net assets, of up to 1.00% of the Class C Shares’ average daily net assets, and of up to 0.25% of the Class S Shares’ average daily net assets. Under the terms of the Plan, the Trust is authorized to make payments to Janus Henderson Distributors for remittance to retirement plan service providers, broker-dealers, bank trust departments, financial advisors, and other financial intermediaries, as compensation for distribution and/or shareholder services performed by such entities for their customers who are investors in the Fund. These amounts are disclosed as “12b-1 Distribution and shareholder servicing fees” on the Statement of Operations. Payments under the Plan are not tied exclusively to actual 12b-1 distribution and shareholder service expenses, and the payments may exceed 12b-1 distribution and shareholder service expenses actually incurred. If any of the Fund’s actual 12b-1 distribution and shareholder service expenses incurred during a calendar year are less than the payments made during a calendar year, the Fund will be refunded the difference. Refunds, if any, are included in “12b-1 Distribution and shareholder servicing fees” in the Statement of Operations.
Janus Capital serves as administrator to the Fund pursuant to an administration agreement between Janus Capital and the Trust. Under the administration agreement, Janus Capital is obligated to provide or arrange for the provision of certain administration, compliance, and accounting services to the Fund, including providing office space for the Fund, and is reimbursed by the Fund for certain of its costs in providing these services (to the extent Janus Capital seeks reimbursement and such costs are not otherwise waived). In addition, employees of Janus Capital and/or its affiliates may serve as officers of the Trust. The Fund pays for some or all of the salaries, fees, and expenses of Janus Capital employees and Fund officers, with respect to certain specified administration functions they perform on behalf of the Fund. The Fund pays these costs based on out-of-pocket expenses incurred by Janus Capital, and these costs are separate and apart from advisory fees and other expenses paid in connection with the investment advisory services Janus Capital (or any subadvisor, as applicable) provides to the Fund. These amounts are disclosed as “Affiliated fund administration fees” on the Statement of Operations. In addition, some expenses related to compensation payable to the Fund’s Chief Compliance Officer and certain compliance staff, all of whom are employees of Janus Capital and/or its affiliates, are shared with the Fund. Total compensation of $230,755 was paid to the Chief Compliance Officer and certain compliance staff by the Trust during the period ended December 31, 2019. The Fund's portion is reported as part of “Other expenses” on the Statement of Operations.
The Board of Trustees has adopted a deferred compensation plan (the “Deferred Plan”) for independent Trustees to elect to defer receipt of all or a portion of the annual compensation they are entitled to receive from the Fund. All deferred fees are credited to an account established in the name of the Trustees. The amounts credited to the account then increase or decrease, as the case may be, in accordance with the performance of one or more of the Janus Henderson funds that are selected by the Trustees. The account balance continues to fluctuate in accordance with the performance of the selected fund or funds until final payment of all amounts are credited to the account. The fluctuation of the account balance is recorded by the Fund as unrealized appreciation/(depreciation) and is included as of December 31, 2019 on the Statement of Assets and Liabilities in the asset, “Non-interested Trustees’ deferred compensation,” and liability, “Non-interested Trustees’ deferred compensation fees.” Additionally, the recorded unrealized appreciation/(depreciation) is included in “Total distributable earnings (loss)” on the Statement of Assets and Liabilities. Deferred compensation expenses for the period ended December 31, 2019 are included in “Non-interested Trustees’ fees and expenses” on the Statement of Operations. Trustees are allowed to change their designation of mutual funds from time to time. Amounts will be deferred until distributed in accordance with the Deferred Plan. Deferred fees of $236,725 were paid by the Trust to the Trustees under the Deferred Plan during the period ended December 31, 2019.
Any purchases and sales, realized gains/losses and recorded dividends from affiliated investments during the period ended December 31, 2019 can be found in the “Schedules of Affiliated Investments” located in the Schedule of Investments.
Class A Shares include a 5.75% upfront sales charge of the offering price of the Fund. The sales charge is allocated between Janus Henderson Distributors and financial intermediaries. There were no upfront sales charges retained by Janus Henderson Distributors during the period ended December 31, 2019.
Janus Henderson Adaptive Global Allocation Fund
Notes to Financial Statements (unaudited)
A contingent deferred sales charge (“CDSC”) of 1.00% will be deducted with respect to Class A Shares purchased without a sales load and redeemed within 12 months of purchase, unless waived. Any applicable CDSC will be 1.00% of the lesser of the original purchase price or the value of the redemption of the Class A Shares redeemed. There were no CDSCs paid by redeeming shareholders of Class A Shares to Janus Henderson Distributors during the period ended December 31, 2019.
A CDSC of 1.00% will be deducted with respect to Class C Shares redeemed within 12 months of purchase, unless waived. Any applicable CDSC will be 1.00% of the lesser of the original purchase price or the value of the redemption of the Class C Shares redeemed. There were no CDSCs paid by redeeming shareholders of Class C Shares during the period ended December 31, 2019.
As of December 31, 2019, shares of the Fund were owned by affiliates of Janus Henderson Investors, and/or other funds advised by Janus Henderson, as indicated in the table below:
| | | | | | |
Class | % of Class Owned | | % of Fund Owned | | |
Class A Shares | - | % | - | % | |
Class C Shares | 78 | | 2 | | |
Class D Shares | 48 | | 2 | | |
Class I Shares | - | | - | | |
Class N Shares | 96 | | 69 | | |
Class S Shares | 100 | | 2 | | |
Class T Shares | - | | - | | |
| | | | | | |
In addition, other shareholders, including other funds, individuals, accounts, as well as the Fund’s portfolio manager(s) and/or investment personnel, may from time to time own (beneficially or of record) a significant percentage of the Fund’s Shares and can be considered to “control” the Fund when that ownership exceeds 25% of the Fund’s assets (and which may differ from control as determined in accordance with accounting principles generally accepted in the United States of America).
5. Federal Income Tax
Income and capital gains distributions are determined in accordance with income tax regulations that may differ from accounting principles generally accepted in the United States of America. These differences are due to differing treatments for items such as net short-term gains, deferral of wash sale losses, foreign currency transactions, net investment losses, and capital loss carryovers.
The Fund has elected to treat gains and losses on forward foreign currency contracts as capital gains and losses, if applicable. Other foreign currency gains and losses on debt instruments are treated as ordinary income for federal income tax purposes pursuant to Section 988 of the Internal Revenue Code.
Janus Henderson Adaptive Global Allocation Fund
Notes to Financial Statements (unaudited)
The aggregate cost of investments and the composition of unrealized appreciation and depreciation of investment securities for federal income tax purposes as of December 31, 2019 are noted below. The primary differences between book and tax appreciation or depreciation of investments are wash sale loss deferrals, investments in partnerships, and investments in passive foreign investment companies.
| | | | |
Federal Tax Cost | Unrealized
Appreciation | Unrealized
(Depreciation) | Net Tax Appreciation/
(Depreciation) |
$ 62,213,060 | $ 3,608,729 | $ (337,094) | $ 3,271,635 |
| | | | |
Information on the tax components of derivatives as of December 31, 2019 is as follows:
| | | | |
Federal Tax Cost | Unrealized
Appreciation | Unrealized
(Depreciation) | Net Tax Appreciation/
(Depreciation) |
$ 44,326 | $ 33,975 | $ (151,982) | $ (118,007) |
| | | | |
Tax cost of investments and unrealized appreciation/(depreciation) may also include timing differences that do not constitute adjustments to tax basis.
Janus Henderson Adaptive Global Allocation Fund
Notes to Financial Statements (unaudited)
6. Capital Share Transactions
| | | | | | | |
| | | | | | | |
| | | Period ended December 31, 2019 | | Year ended June 30, 2019 |
| | | Shares | Amount | | Shares | Amount |
| | | | | | | |
Class A Shares: | | | | | |
Shares sold | 15,390 | $ 157,106 | | 263,945 | $ 2,762,794 |
Reinvested dividends and distributions | 1,782 | 18,590 | | 12,794 | 120,007 |
Shares repurchased | (183,451) | (1,849,305) | | (101,438) | (1,032,330) |
Net Increase/(Decrease) | (166,279) | $(1,673,609) | | 175,301 | $ 1,850,471 |
Class C Shares: | | | | | |
Shares sold | - | $ 51 | | 40,783 | $ 399,274 |
Reinvested dividends and distributions | 3,278 | 34,187 | | 7,443 | 69,592 |
Shares repurchased | (12,728) | (127,662) | | (30,545) | (299,281) |
Net Increase/(Decrease) | (9,450) | $ (93,424) | | 17,681 | $ 169,585 |
Class D Shares: | | | | | |
Shares sold | 9,000 | $ 92,351 | | 56,428 | $ 562,998 |
Reinvested dividends and distributions | 5,838 | 61,068 | | 12,469 | 116,956 |
Shares repurchased | (9,441) | (95,248) | | (34,379) | (348,900) |
Net Increase/(Decrease) | 5,397 | $ 58,171 | | 34,518 | $ 331,054 |
Class I Shares: | | | | | |
Shares sold | 35,354 | $ 366,206 | | 875,906 | $ 9,044,162 |
Reinvested dividends and distributions | 22,895 | 239,483 | | 80,463 | 756,351 |
Shares repurchased | (552,753) | (5,739,905) | | (459,039) | (4,675,765) |
Net Increase/(Decrease) | (494,504) | $(5,134,216) | | 497,330 | $ 5,124,748 |
Class N Shares: | | | | | |
Shares sold | 490,143 | $ 5,092,278 | | 159,160 | $ 1,615,734 |
Reinvested dividends and distributions | 101,143 | 1,058,964 | | 259,176 | 2,436,252 |
Shares repurchased | (553,248) | (5,731,225) | | (933,484) | (9,555,914) |
Net Increase/(Decrease) | 38,038 | $ 420,017 | | (515,148) | $(5,503,928) |
Class S Shares: | | | | | |
Shares sold | 1 | $ 40 | | - | $ - |
Reinvested dividends and distributions | 2,743 | 28,724 | | 6,067 | 56,970 |
Shares repurchased | - | - | | (678) | (6,729) |
Net Increase/(Decrease) | 2,744 | $ 28,764 | | 5,389 | $ 50,241 |
Class T Shares: | | | | | |
Shares sold | 411 | $ 4,240 | | 20,015 | $ 203,731 |
Reinvested dividends and distributions | 2,863 | 29,914 | | 12,445 | 116,855 |
Shares repurchased | (1,775) | (18,071) | | (149,172) | (1,530,155) |
Net Increase/(Decrease) | 1,499 | $ 16,083 | | (116,712) | $(1,209,569) |
7. Purchases and Sales of Investment Securities
For the period ended December 31, 2019, the aggregate cost of purchases and proceeds from sales of investment securities (excluding any short-term securities, short-term options contracts, TBAs, and in-kind transactions, as applicable) was as follows:
| | | | |
Purchases of
Securities | Proceeds from Sales
of Securities | Purchases of Long-
Term U.S. Government
Obligations | Proceeds from Sales
of Long-Term U.S.
Government Obligations |
$60,968,186 | $ 69,412,100 | $ - | $ - |
8. Recent Accounting Pronouncements
The FASB issued Accounting Standards Update 2018-13, Fair Value Measurement (Topic 820) in August 2018. The new guidance removes, modifies and enhances the disclosures to Topic 820. For public entities, the amendments are
Janus Henderson Adaptive Global Allocation Fund
Notes to Financial Statements (unaudited)
effective for financial statements issued for fiscal years beginning after December 15, 2019, and interim periods within those fiscal years. An entity is permitted, and Management has decided, to early adopt the removed and modified disclosures in these financial statements.
9. Subsequent Event
Management has evaluated whether any events or transactions occurred subsequent to December 31, 2019 and through the date of issuance of the Fund’s financial statements and determined that there were no material events or transactions that would require recognition or disclosure in the Fund’s financial statements.
Janus Henderson Adaptive Global Allocation Fund
Additional Information (unaudited)
Proxy Voting Policies and Voting Record
A description of the policies and procedures that the Fund uses to determine how to vote proxies relating to its portfolio securities is available without charge: (i) upon request, by calling 1-800-525-1093; (ii) on the Fund’s website at janushenderson.com/proxyvoting; and (iii) on the SEC’s website at http://www.sec.gov. Additionally, information regarding the Fund’s proxy voting record for the most recent twelve-month period ended June 30 is also available, free of charge, through janushenderson.com/proxyvoting and from the SEC’s website at http://www.sec.gov.
Full Holdings
The Fund is required to disclose its complete holdings as an exhibit to Form N-PORT within 60 days of the end of the first and third fiscal quarters, and in the annual report and semiannual report to Fund shareholders. Historically, the Fund filed its complete portfolio holdings (schedule of investments) with the SEC for the first and third quarters each fiscal year on Form N-Q. The Fund’s Form N-PORT and Form N-Q filings: (i) are available on the SEC’s website at http://www.sec.gov; (ii) may be reviewed and copied at the SEC’s Public Reference Room in Washington, D.C. (information on the Public Reference Room may be obtained by calling 1-800-SEC-0330); and (iii) are available without charge, upon request, by calling a Janus Henderson representative at 1-877-335-2687 (toll free) (or 1-800-525-3713 if you hold Class D shares). Portfolio holdings consisting of at least the names of the holdings are generally available on a monthly basis with a 30-day lag. Holdings are generally posted approximately two business days thereafter under Full Holdings for the Fund at janushenderson.com/info (or janushenderson.com/reports if you hold Class D Shares).
APPROVAL OF ADVISORY AGREEMENTS DURING THE PERIOD
The Trustees of Janus Aspen Series, each of whom serves as an “independent” Trustee (the “Trustees”), oversee the management of each Portfolio of Janus Aspen Series (each, a “VIT Portfolio,” and collectively, the “VIT Portfolios”), as well as each Fund of Janus Investment Fund (together with the VIT Portfolios, the “Janus Henderson Funds,” and each, a “Janus Henderson Fund”). As required by law, the Trustees determine annually whether to continue the investment advisory agreement for each Janus Henderson Fund and the subadvisory agreements for the Janus Henderson Funds that utilize subadvisers.
In connection with their most recent consideration of those agreements for each Janus Henderson Fund, the Trustees received and reviewed information provided by Janus Capital and the respective subadvisers in response to requests of the Trustees and their independent legal counsel. They also received and reviewed information and analysis provided by, and in response to requests of, their independent fee consultant. Throughout their consideration of the agreements, the Trustees were advised by their independent legal counsel. The Trustees met with management to consider the agreements, and also met separately in executive session with their independent legal counsel and their independent fee consultant.
At a meeting held on December 5, 2019, based on the Trustees’ evaluation of the information provided by Janus Capital, the subadvisers, and the independent fee consultant, as well as other information, the Trustees determined that the overall arrangements between each Janus Henderson Fund and Janus Capital and each subadviser, as applicable, were fair and reasonable in light of the nature, extent and quality of the services provided by Janus Capital, its affiliates and the subadvisers, the fees charged for those services, and other matters that the Trustees considered relevant in the exercise of their business judgment. At that meeting, the Trustees unanimously approved the continuation of the investment advisory agreement for each Janus Henderson Fund, and the subadvisory agreement for each subadvised Janus Henderson Fund, for the period from February 1, 2020 through February 1, 2021, subject to earlier termination as provided for in each agreement.
In considering the continuation of those agreements, the Trustees reviewed and analyzed various factors that they determined were relevant, including the factors described below, none of which by itself was considered dispositive. However, the material factors and conclusions that formed the basis for the Trustees’ determination to approve the continuation of the agreements are discussed separately below. Also included is a summary of the independent fee consultant’s conclusions and opinions that arose during, and were included as part of, the Trustees’ consideration of the agreements. “Management fees,” as used herein, reflect actual annual advisory fees and, for the purpose of peer comparisons any administration fees (excluding out of pocket costs), net of any waivers, paid by a fund as a percentage of average net assets.
Janus Henderson Adaptive Global Allocation Fund
Additional Information (unaudited)
Nature, Extent and Quality of Services
The Trustees reviewed the nature, extent and quality of the services provided by Janus Capital and the subadvisers to the Janus Henderson Funds, taking into account the investment objective, strategies and policies of each Janus Henderson Fund, and the knowledge the Trustees gained from their regular meetings with management on at least a quarterly basis and their ongoing review of information related to the Janus Henderson Funds. In addition, the Trustees reviewed the resources and key personnel of Janus Capital and each subadviser, particularly noting those employees who provide investment and risk management services to the Janus Henderson Funds. The Trustees also considered other services provided to the Janus Henderson Funds by Janus Capital or the subadvisers, such as managing the execution of portfolio transactions and the selection of broker-dealers for those transactions. The Trustees considered Janus Capital’s role as administrator to the Janus Henderson Funds, noting that Janus Capital generally, does not receive a fee for its services but is reimbursed for its out-of-pocket costs. The Trustees considered the role of Janus Capital in monitoring adherence to the Janus Henderson Funds’ investment restrictions, providing support services for the Trustees and Trustee committees, and overseeing communications with shareholders and the activities of other service providers, including monitoring compliance with various policies and procedures of the Janus Henderson Funds and with applicable securities laws and regulations.
In this regard, the independent fee consultant noted that Janus Capital provides a number of different services for the Janus Henderson Funds and fund shareholders, ranging from investment management services to various other servicing functions, and that, in its view, Janus Capital is a capable provider of those services. The independent fee consultant also provided its belief that Janus Capital has developed a number of institutional competitive advantages that should enable it to provide superior investment and service performance over the long term.
The Trustees concluded that the nature, extent and quality of the services provided by Janus Capital or the subadviser to each Janus Henderson Fund were appropriate and consistent with the terms of the respective advisory and subadvisory agreements, and that, taking into account steps taken to address those Janus Henderson Funds whose performance lagged that of their peers for certain periods, the Janus Henderson Funds were likely to benefit from the continued provision of those services. They also concluded that Janus Capital and each subadviser had sufficient personnel, with the appropriate education and experience, to serve the Janus Henderson Funds effectively and had demonstrated its ability to attract well-qualified personnel.
Performance of the Funds
The Trustees considered the performance results of each Janus Henderson Fund over various time periods. They noted that they considered Janus Henderson Fund performance data throughout the year, including periodic meetings with each Janus Henderson Fund’s portfolio manager(s), and also reviewed information comparing each Janus Henderson Fund’s performance with the performance of comparable funds and peer groups identified by Broadridge Financial Solutions, Inc. (“Broadridge”), an independent data provider, and with the Janus Henderson Fund’s benchmark index. In this regard, the independent fee consultant found that the overall Janus Henderson Funds’ performance has been reasonable: for the 36 months ended September 30, 2019, approximately 69% of the Janus Henderson Funds were in the top two quartiles of performance, as reported by Morningstar, and for the 12 months ended September 30, 2019, approximately 71% of the Janus Henderson Funds were in the top two quartiles of performance, as reported by Morningstar.
The Trustees considered the performance of each Fund, noting that performance may vary by share class, and noted the following:
Alternative Fund
· For Janus Henderson Diversified Alternatives Fund, the Trustees noted that the Fund’s performance was in the third Broadridge quartile for the 36 months ended May 31, 2019 and the bottom Broadridge quartile for the 12 months ended May 31, 2019. The Trustees noted the reasons for the Fund’s underperformance, the steps Janus Capital had taken or was taking to improve performance.
Asset Allocation Funds
· For Janus Henderson Global Allocation Fund – Conservative, the Trustees noted that the Fund’s performance was in the third Broadridge quartile for the 36 months ended May 31, 2019 and the bottom Broadridge quartile for the 12 months ended May 31, 2019. The Trustees noted the reasons for the Fund’s underperformance, the steps Janus Capital had taken or was taking to improve performance.
Janus Henderson Adaptive Global Allocation Fund
Additional Information (unaudited)
· For Janus Henderson Global Allocation Fund – Growth, the Trustees noted that the Fund’s performance was in the third Broadridge quartile for the 36 months ended May 31, 2019 and the bottom Broadridge quartile for the 12 months ended May 31, 2019. The Trustees noted the reasons for the Fund’s underperformance, the steps Janus Capital had taken or was taking to improve performance.
· For Janus Henderson Global Allocation Fund – Moderate, the Trustees noted that the Fund’s performance was in the third Broadridge quartile for the 36 months ended May 31, 2019 and the bottom Broadridge quartile for the 12 months ended May 31, 2019. The Trustees noted the reasons for the Fund’s underperformance, the steps Janus Capital had taken or was taking to improve performance.
Fixed-Income Funds
· For Janus Henderson Absolute Return Income Opportunities Fund, the Trustees noted that the Fund’s performance was in the bottom Broadridge quartile for the 36 months ended May 31, 2019 and the third Broadridge quartile for the 12 months ended May 31, 2019. The Trustees noted the reasons for the Fund’s underperformance and the steps Janus Capital had taken or was taking to improve performance.
· For Janus Henderson Developed World Bond Fund, the Trustees noted the Fund’s performance was in the second Broadridge quartile for the 36 months ended May 31, 2019 and the first quartile for the 12 months ended May 31, 2019.
· For Janus Henderson Flexible Bond Fund, the Trustees noted that the Fund’s performance was in the bottom Broadridge quartile for the 36 months ended May 31, 2019 and the bottom Broadridge quartile for the 12 months ended May 31, 2019. The Trustees noted the reasons for the Fund’s underperformance and the steps Janus Capital had taken or was taking to improve performance.
· For Janus Henderson Global Bond Fund, the Trustees noted that the Fund’s performance was in the bottom Broadridge quartile for the 36 months ended May 31, 2019 and the bottom Broadridge quartile for the 12 months ended May 31, 2019. The Trustees noted the reasons for the Fund’s underperformance, the steps Janus Capital had taken or was taking to improve performance.
· For Janus Henderson High-Yield Fund, the Trustees noted that the Fund’s performance was in the second Broadridge quartile for the 36 months ended May 31, 2019 and the second Broadridge quartile for the 12 months ended May 31, 2019.
· For Janus Henderson Multi-Sector Income Fund, the Trustees noted that the Fund’s performance was in the first Broadridge quartile for the 36 months ended May 31, 2019 and the first Broadridge quartile for the 12 months ended May 31, 2019.
· For Janus Henderson Short-Term Bond Fund, the Trustees noted that the Fund’s performance was in the bottom Broadridge quartile for the 36 months ended May 31, 2019 and the third Broadridge quartile for the 12 months ended May 31, 2019. The Trustees noted the reasons for the Fund’s underperformance and the steps Janus Capital had taken or was taking to improve performance.
Global and International Equity Funds
· For Janus Henderson Asia Equity Fund, the Trustees noted that the Fund’s performance was in the first Broadridge quartile for the 36 months ended May 31, 2019 and the second Broadridge quartile for the 12 months ended May 31, 2019.
· For Janus Henderson Emerging Markets Fund, the Trustees noted that the Fund’s performance was in the bottom Broadridge quartile for the 36 months ended May 31, 2019 and the second Broadridge quartile for the 12 months ended May 31, 2019. The Trustees noted the reasons for the Fund’s underperformance and the steps Janus Capital had taken or was taking to improve performance, and that the performance trend was improving
· For Janus Henderson European Focus Fund, the Trustees noted that the Fund’s performance was in the bottom Broadridge quartile for the 36 months ended May 31, 2019 and the bottom Broadridge quartile for the 12 months ended May 31, 2019. The Trustees noted the reasons for the Fund’s underperformance and the steps Janus Capital had taken or was taking to improve performance.
· For Janus Henderson Global Equity Income Fund, the Trustees noted that the Fund’s performance was in the bottom Broadridge quartile for the 36 months ended May 31, 2019 and the bottom Broadridge quartile for the 12
Janus Henderson Adaptive Global Allocation Fund
Additional Information (unaudited)
months ended May 31, 2019. The Trustees noted the reasons for the Fund’s underperformance and the steps Janus Capital had taken or was taking to improve performance.
· For Janus Henderson Global Life Sciences Fund, the Trustees noted that the Fund’s performance was in the first Broadridge quartile for the 36 months ended May 31, 2019 and the second Broadridge quartile for the 12 months ended May 31, 2019.
· For Janus Henderson Global Real Estate Fund, the Trustees noted that the Fund’s performance was in the first Broadridge quartile for the 36 months ended May 31, 2019 and the first Broadridge quartile for the 12 months ended May 31, 2019.
· For Janus Henderson Global Research Fund, the Trustees noted that the Fund’s performance was in the third Broadridge quartile for the 36 months ended May 31, 2019 and the third Broadridge quartile for the 12 months ended May 31, 2019. The Trustees noted the reasons for the Fund’s underperformance, while also noting that the Fund has a performance fee structure that results in lower management fees during periods of underperformance, and the steps Janus Capital had taken or was taking to improve performance.
· For Janus Henderson Global Select Fund, the Trustees noted that the Fund’s performance was in the first Broadridge quartile for the 36 months ended May 31, 2019 and the bottom Broadridge quartile for the 12 months ended May 31, 2019.
· For Janus Henderson Global Technology Fund, the Trustees noted that the Fund’s performance was in the second Broadridge quartile for the 36 months ended May 31, 2019 and the first Broadridge quartile for the 12 months ended May 31, 2019.
· For Janus Henderson Global Value Fund, the Trustees noted that the Fund’s performance was in the second Broadridge quartile for the 36 months ended May 31, 2019 and the first Broadridge quartile for the 12 months ended May 31, 2019.
· For Janus Henderson International Opportunities Fund, the Trustees noted that the Fund’s performance was in the bottom Broadridge quartile for the 36 months ended May 31, 2019 and the bottom Broadridge quartile for the 12 months ended May 31, 2019. The Trustees noted the reasons for the Fund’s underperformance and the steps Janus Capital had taken or was taking to improve performance.
· For Janus Henderson International Small Cap Fund, the Trustees noted that the Fund’s performance was in the bottom Broadridge quartile for the 12 months ended May 31, 2019. The Trustees noted the reasons for the Fund’s underperformance, the steps Janus Capital had taken or was taking to improve performance, and its limited performance history.
· For Janus Henderson International Value Fund, the Trustees noted that the Fund’s performance was in the bottom Broadridge quartile for the 36 months ended May 31, 2019 and the second Broadridge quartile for the 12 months ended May 31, 2019. The Trustees noted the reasons for the Fund’s underperformance and the steps Janus Capital and Perkins had taken or were taking to improve performance, and that the performance trend was improving
· For Janus Henderson Overseas Fund, the Trustees noted that the Fund’s performance was in the second Broadridge quartile for the 36 months ended May 31, 2019 and the bottom Broadridge quartile for the 12 months ended May 31, 2019.
Money Market Funds
· For Janus Henderson Government Money Market Fund, the Trustees noted that the Fund’s performance was in the second Broadridge quartile for the 36 months ended May 31, 2019 and the third Broadridge quartile for the 12 months ended May 31, 2019.
· For Janus Henderson Money Market Fund, the Trustees noted that the Fund’s performance was in the third Broadridge quartile for the 36 months ended May 31, 2019 and the third Broadridge quartile for the 12 months ended May 31, 2019. The Trustees noted the reasons for the Fund’s underperformance and the steps Janus Capital had taken or was taking to improve performance.
Janus Henderson Adaptive Global Allocation Fund
Additional Information (unaudited)
Multi-Asset Funds
· For Janus Henderson Adaptive Global Allocation Fund, the Trustees noted that the Fund’s performance was in third quartile for the 36 months ended May 31, 2019 and the third Broadridge quartile for the 12 months ended May 31, 2019. The Trustees noted the reasons for the Fund’s underperformance and the steps Janus Capital had taken or was taking to improve performance.
· For Janus Henderson Dividend & Income Builder Fund, the Trustees noted that the Fund’s performance was in the third Broadridge quartile for the 36 months ended May 31, 2019 and the third Broadridge quartile for the 12 months ended May 31, 2019. The Trustees noted the reasons for the Fund’s underperformance and the steps Janus Capital had taken or was taking to improve performance.
· For Janus Henderson Value Plus Income Fund, the Trustees noted that the Fund’s performance was in the first Broadridge quartile for the 36 months ended May 31, 2019 and the first Broadridge quartile for the 12 months ended May 31, 2019.
Multi-Asset U.S. Equity Funds
· For Janus Henderson Balanced Fund, the Trustees noted that the Fund’s performance was in the first Broadridge quartile for the 36 months ended May 31, 2019 and the first Broadridge quartile for the 12 months ended May 31, 2019.
· For Janus Henderson Contrarian Fund, the Trustees noted that the Fund’s performance was in the second Broadridge quartile for the 36 months ended May 31, 2019 and the first Broadridge quartile for the 12 months ended May 31, 2019.
· For Janus Henderson Enterprise Fund, the Trustees noted that the Fund’s performance was in the first Broadridge quartile for the 36 months ended May 31, 2019 and the first Broadridge quartile for the 12 months ended May 31, 2019.
· For Janus Henderson Forty Fund, the Trustees noted that the Fund’s performance was in the second Broadridge quartile for the 36 months ended May 31, 2019 and the first Broadridge quartile for the 12 months ended May 31, 2019.
· For Janus Henderson Growth and Income Fund, the Trustees noted that the Fund’s performance was in the first Broadridge quartile for the 36 months ended May 31, 2019 and the second Broadridge quartile for the 12 months ended May 31, 2019.
· For Janus Henderson Research Fund, the Trustees noted that the Fund’s performance was in the third Broadridge quartile for the 36 months ended May 31, 2019 and the second Broadridge quartile for the 12 months ended May 31, 2019. The Trustees noted the reasons for the Fund’s underperformance, while also noting that the Fund has a performance fee structure that results in lower management fees during periods of underperformance, and the steps Janus Capital had taken or was taking to improve performance, and that the performance trend was improving.
· For Janus Henderson Triton Fund, the Trustees noted that the Fund’s performance was in the third Broadridge quartile for the 36 months ended May 31, 2019 and the second Broadridge quartile for the 12 months ended May 31, 2019. The Trustees noted the reasons for the Fund’s underperformance, and the steps Janus Capital had taken or was taking to improve performance, and that the performance trend was improving.
· For Janus Henderson U.S. Growth Opportunities Fund, the Trustees noted that the Fund’s performance was in the third Broadridge quartile for the 36 months ended May 31, 2019 and the first Broadridge quartile for the 12 months ended May 31, 2019. The Trustees noted the reasons for the Fund’s underperformance, and the steps Janus Capital and Geneva had taken or were taking to improve performance, and that the performance trend was improving.
· For Janus Henderson Venture Fund, the Trustees noted that the Fund’s performance was in the third Broadridge quartile for the 36 months ended May 31, 2019 and the second Broadridge quartile for the 12 months ended May 31, 2019. The Trustees noted the reasons for the Fund’s underperformance, and the steps Janus Capital had taken or was taking to improve performance, and that the performance trend was improving.
Janus Henderson Adaptive Global Allocation Fund
Additional Information (unaudited)
Quantitative Equity Funds
· For Janus Henderson Emerging Markets Managed Volatility Fund, the Trustees noted that the Fund’s performance was in the second Broadridge quartile for the 36 months ended May 31, 2019 and the first Broadridge quartile for the 12 months ended May 31, 2019.
· For Janus Henderson Global Income Managed Volatility Fund, the Trustees noted that the Fund’s performance was in the second Broadridge quartile for the 36 months ended May 31, 2019 and the first Broadridge quartile for the 12 months ended May 31, 2019.
· For Janus Henderson International Managed Volatility Fund, the Trustees noted that the Fund’s performance was in the third Broadridge quartile for the 36 months ended May 31, 2019 and the second Broadridge quartile for the 12 months ended May 31, 2019. The Trustees noted the reasons for the Fund’s underperformance, the steps Janus Capital and Intech had taken or were taking to improve performance, and that the performance trend was improving.
· For Janus Henderson U.S. Managed Volatility Fund, the Trustees noted that the Fund’s performance was in the second Broadridge quartile for the 36 months ended May 31, 2019 and the second Broadridge quartile for the 12 months ended May 31, 2019.
U.S. Equity Funds
· For Janus Henderson Large Cap Value Fund, the Trustees noted that the Fund’s performance was in the second Broadridge quartile for the 36 months ended May 31, 2019 and the first Broadridge quartile for the 12 months ended May 31, 2019.
· For Janus Henderson Mid Cap Value Fund, the Trustees noted that the Fund’s performance was in the second Broadridge quartile for the 36 months ended May 31, 2019 and the second Broadridge quartile for the 12 months ended May 31, 2019.
· For Janus Henderson Small Cap Value Fund, the Trustees noted that the Fund’s performance was in the second Broadridge quartile for the 36 months ended May 31, 2019 and the first Broadridge quartile for the 12 months ended May 31, 2019.
· For Janus Henderson Small-Mid Cap Value Fund, the Trustees noted that the Fund’s performance was in the third Broadridge quartile for the 36 months ended May 31, 2019 and the second Broadridge quartile for the 12 months ended May 31, 2019. The Trustees noted the reasons for the Fund’s underperformance, while also noting that the Fund has a performance fee structure that results in lower management fees during periods of underperformance, and the steps Janus Capital and Perkins had taken or were taking to improve performance, and that the performance trend was improving.
In consideration of each Janus Henderson Fund’s performance, the Trustees concluded that, taking into account the factors relevant to performance, as well as other considerations, including steps taken to improve performance, the Janus Henderson Fund’s performance warranted continuation of such Janus Henderson Fund’s investment advisory and subadvisory agreement(s).
Costs of Services Provided
The Trustees examined information regarding the fees and expenses of each Janus Henderson Fund in comparison to similar information for other comparable funds as provided by Broadridge, an independent data provider. They also reviewed an analysis of that information provided by their independent fee consultant and noted that the rate of management fees (investment advisory and any administration but excluding out-of-pocket costs) for many of the Janus Henderson Funds, after applicable waivers, was below the average management fee rate of the respective peer group of funds selected by an independent data provider. The Trustees also examined information regarding the subadvisory fees charged for subadvisory services, as applicable, noting that all such fees were paid by Janus Capital out of its management fees collected from such Janus Henderson Fund.
The independent fee consultant provided its belief that the management fees charged by Janus Capital to each of the Janus Henderson Funds under the current investment advisory and administration agreements are reasonable in relation to the services provided by Janus Capital. The independent fee consultant found: (1) the total expenses and management fees of the Janus Henderson Funds to be reasonable relative to other mutual funds; (2) the total expenses, on average, were 10% under the average total expenses of their respective Broadridge Expense Group
Janus Henderson Adaptive Global Allocation Fund
Additional Information (unaudited)
peers; and (3) and the management fees for the Janus Henderson Funds, on average, were 7% under the average management fees for their Expense Groups. The Trustees also considered the total expenses for each share class of each Janus Henderson Fund compared to the average total expenses for its Broadridge Expense Group peers and to average total expenses for its Broadridge Expense Universe.
For certain Janus Henderson Funds, the independent fee consultant also performed a systematic “focus list” analysis of expenses which assessed fund fees in the context of fund performance being delivered. Based on this analysis, the independent fee consultant found that the combination of service quality/performance and expenses on these individual Janus Henderson Funds was reasonable in light of performance trends, performance histories, and existence of performance fees, breakpoints, and/or expense waivers on such Janus Henderson Funds.
The Trustees considered the methodology used by Janus Capital and each subadviser in determining compensation payable to portfolio managers, the competitive environment for investment management talent, and the competitive market for mutual funds in different distribution channels.
The Trustees also reviewed management fees charged by Janus Capital and each subadviser to comparable separate account clients and to comparable non-affiliated funds subadvised by Janus Capital or by a subadviser (for which Janus Capital or the subadviser provides only or primarily portfolio management services). Although in most instances subadvisory and separate account fee rates for various investment strategies were lower than management fee rates for Janus Henderson Funds having a similar strategy, the Trustees considered that Janus Capital noted that, under the terms of the management agreements with the Janus Henderson Funds, Janus Capital performs significant additional services for the Janus Henderson Funds that it does not provide to those other clients, including administration services, oversight of the Janus Henderson Funds’ other service providers, trustee support, regulatory compliance and numerous other services, and that, in serving the Janus Henderson Funds, Janus Capital assumes many legal risks and other costs that it does not assume in servicing its other clients. Moreover, they noted that the independent fee consultant found that: (1) the management fees Janus Capital charges to the Janus Henderson Funds are reasonable in relation to the management fees Janus Capital charges to funds subadvised by Janus Capital and to the fees Janus Capital charges to its institutional separate account clients; (2) these subadvised and institutional separate accounts have different service and infrastructure needs; and (3) Janus Henderson mutual fund investors enjoy reasonable fees relative to the fees charged to Janus Henderson subadvised fund and separate account investors; (4) 11 of 12 Janus Henderson Funds have lower management fees than similar funds subadvised by Janus Capital; and (5) six of nine Janus Henderson Funds have lower management fees than similar separate accounts managed by Janus Capital.
The Trustees considered the fees for each Fund for its fiscal year ended in 2018, and noted the following with regard to each Fund’s total expenses, net of applicable fee waivers (the Fund’s “total expenses”):
Alternative Fund
· For Janus Henderson Diversified Alternatives Fund, the Trustees noted that, although the Fund’s total expenses exceeded the peer group average for certain share classes, overall the Fund’s total expenses were reasonable. The Trustees also noted that Janus Capital has contractually agreed to limit the Fund’s expenses.
Asset Allocation Funds
· For Janus Henderson Global Allocation Fund – Conservative, the Trustees noted that, although the Fund’s total expenses exceeded the peer group average for certain share classes, overall the Fund’s total expenses were reasonable. The Trustees also noted that Janus Capital has contractually agreed to limit the Fund’s expenses.
· For Janus Henderson Global Allocation Fund – Growth, the Trustees noted that, although the Fund’s total expenses exceeded the peer group average for certain share classes, overall the Fund’s total expenses were reasonable. The Trustees also noted that Janus Capital has contractually agreed to limit the Fund’s expenses.
· For Janus Henderson Global Allocation Fund – Moderate, the Trustees noted that, although the Fund’s total expenses exceeded the peer group average for certain share classes, overall the Fund’s total expenses were reasonable. The Trustees also noted that Janus Capital has contractually agreed to limit the Fund’s expenses.
Janus Henderson Adaptive Global Allocation Fund
Additional Information (unaudited)
Fixed-Income Funds
· For Janus Henderson Absolute Return Income Opportunities Fund, the Trustees noted that, although the Fund’s total expenses exceeded the peer group average for certain share classes, overall the Fund’s total expenses were reasonable. The Trustees also noted that Janus Capital has contractually agreed to limit the Fund’s expenses.
· For Janus Henderson Developed World Bond Fund, the Trustees noted that, although the Fund’s total expenses exceeded the peer group average for certain share classes, overall the Fund’s total expenses were reasonable. The Trustees also noted that Janus Capital has contractually agreed to limit the Fund’s expenses.
· For Janus Henderson Flexible Bond Fund, the Trustees noted that, although the Fund’s total expenses exceeded the peer group average for certain share classes, overall the Fund’s total expenses were reasonable. The Trustees also noted that Janus Capital has contractually agreed to limit the Fund’s expenses.
· For Janus Henderson Global Bond Fund, the Trustees noted that, although the Fund’s total expenses exceeded the peer group average for certain share classes, overall the Fund’s total expenses were reasonable. The Trustees also noted that Janus Capital has contractually agreed to limit the Fund’s expenses.
· For Janus Henderson High-Yield Fund, the Trustees noted that, although the Fund’s total expenses exceeded the peer group average for certain share classes, overall the Fund’s total expenses were reasonable. The Trustees also noted that Janus Capital has contractually agreed to limit the Fund’s expenses.
· For Janus Henderson Multi-Sector Income Fund, the Trustees noted that, although the Fund’s total expenses exceeded the peer group average for certain share classes, overall the Fund’s total expenses were reasonable. The Trustees also noted that Janus Capital has contractually agreed to limit the Fund’s expenses.
· For Janus Henderson Short-Term Bond Fund, the Trustees noted that, although the Fund’s total expenses exceeded the peer group average for all share classes, overall the Fund’s total expenses were reasonable. The Trustees also noted that Janus Capital has contractually agreed to limit the Fund’s expenses.
Global and International Equity Funds
· For Janus Henderson Asia Equity Fund, the Trustees noted that, although the Fund’s total expenses exceeded the peer group average for certain share classes, overall the Fund’s total expenses were reasonable. The Trustees also noted that Janus Capital has contractually agreed to limit the Fund’s expenses.
· For Janus Henderson Emerging Markets Fund, the Trustees noted that, although the Fund’s total expenses exceeded the peer group average for one share class, overall the Fund’s total expenses were reasonable. The Trustees also noted that Janus Capital has contractually agreed to limit the Fund’s expenses.
· For Janus Henderson European Focus Fund, the Trustees noted that, although the Fund’s total expenses exceeded the peer group average for certain share classes, overall the Fund’s total expenses were reasonable. The Trustees also noted that Janus Capital has contractually agreed to limit the Fund’s expenses.
· For Janus Henderson Global Equity Income Fund, the Trustees noted that the Fund’s total expenses were below the peer group average for all share classes.
· For Janus Henderson Global Life Sciences Fund, the Trustees noted that the Fund’s total expenses were below the peer group average for all share classes.
· For Janus Henderson Global Real Estate Fund, the Trustees noted although the Fund’s total expenses exceeded the peer group average for one share class, overall the Fund’s total expenses were reasonable. The Trustees also noted that Janus Capital has contractually agreed to limit the Fund’s expenses.
· For Janus Henderson Global Research Fund, the Trustees noted that the Fund’s total expenses were below the peer group average for all share classes.
· For Janus Henderson Global Select Fund, the Trustees noted that, although the Fund’s total expenses exceeded the peer group average for one share class, overall the Fund’s total expenses were reasonable. The Trustees also noted that Janus Capital has contractually agreed to limit the Fund’s expenses.
· For Janus Henderson Global Technology Fund, the Trustees noted that the Fund’s total expenses were below the peer group average for all share classes.
Janus Henderson Adaptive Global Allocation Fund
Additional Information (unaudited)
· For Janus Henderson Global Value Fund, the Trustees noted that although the Fund’s total expenses exceeded the peer group average for one share class, overall the Fund’s total expenses were reasonable.
· For Janus Henderson International Opportunities Fund, the Trustees noted that, although the Fund’s total expenses exceeded the peer group average for certain share classes, overall the Fund’s total expenses were reasonable. The Trustees also noted that Janus Capital has contractually agreed to limit the Fund’s expenses.
· For Janus Henderson International Small Cap Fund, the Trustees noted that the Fund’s total expenses were below the peer group average for all share classes.
· For Janus Henderson International Value Fund, the Trustees noted that, although the Fund’s total expenses exceeded the peer group average for certain share classes, overall the Fund’s total expenses were reasonable. The Trustees also noted that Janus Capital has contractually agreed to limit the Fund’s expenses.
· For Janus Henderson Overseas Fund, the Trustees noted that the Fund’s total expenses were below the peer group average for all share classes.
Money Market Funds
· For Janus Henderson Government Money Market Fund, the Trustees noted that the Fund’s total expenses were below the peer group average for both share classes.
· For Janus Henderson Money Market Fund, the Trustees noted that, although the Fund’s total expenses exceeded the peer group average for one share class, overall the Fund’s total expenses were reasonable.
Multi-Asset Funds
· For Janus Henderson Adaptive Global Allocation Fund, the Trustees noted that, although the Fund’s total expenses exceeded the peer group average for one share class, overall the Fund’s total expenses were reasonable. The Trustees also noted that Janus Capital has contractually agreed to limit the Fund’s expenses.
· For Janus Henderson Dividend & Income Builder Fund, the Trustees noted that the Fund’s total expenses were below the peer group average for all share classes.
· For Janus Henderson Value Plus Income Fund, the Trustees noted that the Fund’s total expenses were below the peer group average for all share classes.
Multi-Asset U.S. Equity Funds
· For Janus Henderson Balanced Fund, the Trustees noted that, although the Fund’s total expenses exceeded the peer group average for certain share classes, overall the Fund’s total expenses were reasonable. The Trustees also noted that Janus Capital has contractually agreed to limit the Fund’s expenses, although this limit did not apply because the Fund’s total expenses were already below the applicable fee limit.
· For Janus Henderson Contrarian Fund, the Trustees noted that the Fund’s total expenses exceeded the peer group average for one share class, overall the Fund’s total expenses were reasonable. The Trustees also noted that Janus Capital had contractually agreed to limit the Fund’s expenses.
· For Janus Henderson Enterprise Fund, the Trustees noted that the Fund’s total expenses were below the peer group average for all share classes.
· For Janus Henderson Forty Fund, the Trustees noted that, although the Fund’s total expenses exceeded the peer group average for certain share classes, overall the Fund’s total expenses were reasonable. The Trustees also noted that Janus Capital has contractually agreed to limit the Fund’s expenses, although this limit did not apply because the Fund’s total expenses were already below the applicable fee limit.
· For Janus Henderson Growth and Income Fund, the Trustees noted that, although the Fund’s total expenses exceeded the peer group average for certain share classes, overall the Fund’s total expenses were reasonable. The Trustees also noted that Janus Capital has contractually agreed to limit the Fund’s expenses, although this limit did not apply because the Fund’s total expenses were already below the applicable fee limit.
· For Janus Henderson Research Fund, the Trustees noted that the Fund’s total expenses were below the peer group average for all share classes.
Janus Henderson Adaptive Global Allocation Fund
Additional Information (unaudited)
· For Janus Henderson Triton Fund, the Trustees noted that, although the Fund’s expenses exceeded the peer group average for one share class, overall the Fund’s total expenses were reasonable. The Trustees also noted that Janus Capital had contractually agreed to limit the Fund’s expenses, although this limit did not apply because the Fund’s total expenses were already below the applicable fee limit.
· For Janus Henderson U.S. Growth Opportunities Fund, that Trustees noted that the Fund’s total expenses were below the peer group average for all share classes.
· For Janus Henderson Venture Fund, the Trustees noted that, although the Fund’s expenses exceeded the peer group average for one share class, overall the Fund’s total expenses were reasonable. The Trustees also noted that Janus Capital had contractually agreed to limit the Fund’s expenses, although this limit did not apply because the Fund’s total expenses were already below the applicable fee limit.
Quantitative Equity Funds
· For Janus Henderson Emerging Markets Managed Volatility Fund, the Trustees noted that, although the Fund’s total expenses exceeded the peer group average for certain share classes, overall the Fund’s total expenses were reasonable. The Trustees also noted that Janus Capital has contractually agreed to limit the Fund’s expenses.
· For Janus Henderson Global Income Managed Volatility Fund, the Trustees noted that the Fund’s total expenses were below the peer group average for all share classes.
· For Janus Henderson International Managed Volatility Fund, the Trustees noted that, although the Fund’s total expenses exceeded the peer group average for certain share classes, overall the Fund’s total expenses were reasonable. The Trustees also noted that Janus Capital has contractually agreed to limit the Fund’s expenses.
· For Janus Henderson U.S. Managed Volatility Fund, the Trustees noted that the Fund’s total expenses were below the peer group average for all share classes.
U.S. Equity Funds
· For Janus Henderson Large Cap Value Fund, the Trustees noted that the Fund’s total expenses were below the peer group average for all share classes.
· For Janus Henderson Mid Cap Value Fund, the Trustees noted that, although the Fund’s expenses exceeded the peer group average for certain share classes, overall the Fund’s total expenses were reasonable. The Trustees also noted that Janus Capital had contractually agreed to limit the Fund’s expenses, although this limit did not apply because the Fund’s total expenses were already below the applicable fee limit.
· For Janus Henderson Small Cap Value Fund, the Trustees noted that, although the Fund’s total expenses exceeded the peer group average for certain share classes, overall the Fund’s total expenses were reasonable. The Trustees also noted that Janus Capital has contractually agreed to limit the Fund’s expenses, although this limit did not apply because the Fund’s total expenses were already below the applicable fee limit.
· For Janus Henderson Small-Mid Cap Value Fund, the Trustees noted that, although the Fund’s total expenses exceeded the peer group average for certain share classes, overall the Fund’s total expenses were reasonable. The Trustees also noted that Janus Capital has contractually agreed to limit the Fund’s expenses.
The Trustees reviewed information on the overall profitability to Janus Capital and its affiliates of their relationship with the Janus Henderson Funds, and considered profitability data of other publicly traded mutual fund advisers. The Trustees recognized that profitability comparisons among fund managers are difficult because of the variation in the type of comparative information that is publicly available, and the profitability of any fund manager is affected by numerous factors, including the organizational structure of the particular fund manager, differences in complex size, difference in product mix, difference in types of business (mutual fund, institutional and other), differences in the types of funds and other accounts it manages, possible other lines of business, the methodology for allocating expenses, and the fund manager’s capital structure and cost of capital.
Additionally, the Trustees considered the estimated profitability to Janus Capital from the investment management services it provided to each Janus Henderson Fund. In their review, the Trustees considered whether Janus Capital and each subadviser receive adequate incentives and resources to manage the Janus Henderson Funds effectively. In reviewing profitability, the Trustees noted that the estimated profitability for an individual Janus Henderson Fund is
Janus Henderson Adaptive Global Allocation Fund
Additional Information (unaudited)
necessarily a product of the allocation methodology utilized by Janus Capital to allocate its expenses as part of the estimated profitability calculation. In this regard, the Trustees noted that the independent fee consultant found that (1) the expense allocation methodology and rationales utilized by Janus Capital were reasonable and (2) no clear correlation between expense allocations and operating margins. The Trustees also considered that the estimated profitability for an individual Janus Henderson Fund was influenced by a number of factors, including not only the allocation methodology selected, but also the presence of fee waivers and expense caps, and whether the Janus Henderson Fund’s investment management agreement contained breakpoints or a performance fee component. The Trustees determined, after taking into account these factors, among others, that Janus Capital’s estimated profitability with respect to each Janus Henderson Fund was not unreasonable in relation to the services provided, and that the variation in the range of such estimated profitability among the Janus Henderson Funds was not a material factor in the Board’s approval of the reasonableness of any Janus Henderson Fund’s investment management fees.
The Trustees concluded that the management fees payable by each Janus Henderson Fund to Janus Capital and its affiliates, as well as the fees paid by Janus Capital to the subadvisers of subadvised Janus Henderson Funds, were reasonable in relation to the nature, extent, and quality of the services provided, taking into account the fees charged by other advisers for managing comparable mutual funds with similar strategies, the fees Janus Capital and the subadvisers charge to other clients, and, as applicable, the impact of fund performance on management fees payable by the Janus Henderson Funds. The Trustees also concluded that each Janus Henderson Fund’s total expenses were reasonable, taking into account the size of the Janus Henderson Fund, the quality of services provided by Janus Capital and any subadviser, the investment performance of the Janus Henderson Fund, and any expense limitations agreed to or provided by Janus Capital.
Economies of Scale
The Trustees considered information about the potential for Janus Capital to realize economies of scale as the assets of the Janus Henderson Funds increase. They noted that their independent fee consultant published a report to the Trustees in November 2019 which provided its research and analysis into economies of scale. They also noted that, although many Janus Henderson Funds pay advisory fees at a base fixed rate as a percentage of net assets, without any breakpoints or performance fees, their independent fee consultant concluded that 64% of these Janus Henderson Funds’ share classes have contractual management fees (gross of waivers) below their Broadridge expense group averages. They also noted the following: (1) that for those Janus Henderson Funds whose expenses are being reduced by the contractual expense limitations of Janus Capital, Janus Capital is subsidizing certain of these Janus Henderson Funds because they have not reached adequate scale; (2) as the assets of some of the Janus Henderson Funds have declined in the past few years, certain Janus Henderson Funds have benefited from having advisory fee rates that have remained constant rather than increasing as assets declined; (3) performance fee structures have been implemented for various Janus Henderson Funds that have caused the effective rate of advisory fees payable by such a Janus Henderson Fund to vary depending on the investment performance of the Janus Henderson Fund relative to its benchmark index over the measurement period; and (4) a few Janus Henderson Funds have fee schedules with breakpoints and reduced fee rates above certain asset levels. The Trustees also noted that the Janus Henderson Funds share directly in economies of scale through the lower charges of third-party service providers that are based in part on the combined scale of all of the Janus Henderson Funds.
The Trustees also considered the independent fee consultant’s conclusion that, given the limitations of various analytical approaches to economies of scale and their conflicting results, it is difficult to analytically confirm or deny the existence of economies of scale in the Janus Henderson complex. In this regard, the independent consultant concluded that (1) to the extent there were economies of scale at Janus Capital, Janus Capital’s general strategy of setting fixed management fees below peers appeared to share any such economies with investors even on smaller Janus Henderson Funds which have not yet achieved those economies and (2) by setting lower fixed fees from the start on these Janus Henderson Funds, Janus Capital appeared to be investing to increase the likelihood that these Janus Henderson Funds will grow to a level to achieve any scale economies that may exist. Further, the independent fee consultant provided its belief that Janus Henderson Fund investors are well-served by the fee levels and performance fee structures in place on the Janus Henderson Funds in light of any economies of scale that may be present at Janus Capital.
Based on all of the information reviewed, including the recent and past research and analysis conducted by the Trustees’ independent fee consultant, the Trustees concluded that the current fee structure of each Janus Henderson Fund was reasonable and that the current rates of fees do reflect a sharing between Janus Capital and the Janus
Janus Henderson Adaptive Global Allocation Fund
Additional Information (unaudited)
Henderson Fund of any economies of scale that may be present at the current asset level of the Janus Henderson Fund.
Other Benefits to Janus Capital
The Trustees also considered benefits that accrue to Janus Capital and its affiliates and subadvisers to the Janus Henderson Funds from their relationships with the Janus Henderson Funds. They recognized that two affiliates of Janus Capital separately serve the Janus Henderson Funds as transfer agent and distributor, respectively, and the transfer agent receives compensation directly from the non-money market funds for services provided, and that such compensation contributes to the overall profitability of Janus Capital and its affiliates that results from their relationship with the Janus Henderson Funds. The Trustees also considered Janus Capital’s past and proposed use of commissions paid by the Janus Henderson Funds on portfolio brokerage transactions to obtain proprietary and third-party research products and services benefiting the Janus Henderson Fund and/or other clients of Janus Capital and/or Janus Capital, and/or a subadviser to a Janus Henderson Fund. The Trustees concluded that Janus Capital’s and the subadvisers’ use of these types of client commission arrangements to obtain proprietary and third-party research products and services was consistent with regulatory requirements and guidelines and was likely to benefit each Janus Henderson Fund. The Trustees also concluded that, other than the services provided by Janus Capital and its affiliates and subadvisers pursuant to the agreements and the fees to be paid by each Janus Henderson Fund therefor, the Janus Henderson Funds and Janus Capital and the subadvisers may potentially benefit from their relationship with each other in other ways. They concluded that Janus Capital and its affiliates share directly in economies of scale through the lower charges of third-party service providers that are based in part on the combined scale of the Janus Henderson Funds and other clients serviced by Janus Capital and its affiliates. They also concluded that Janus Capital and/or the subadvisers benefit from the receipt of research products and services acquired through commissions paid on portfolio transactions of the Janus Henderson Funds and that the Janus Henderson Funds benefit from Janus Capital’s and/or the subadvisers’ receipt of those products and services as well as research products and services acquired through commissions paid by other clients of Janus Capital and/or other clients of the subadvisers. They further concluded that the success of any Janus Henderson Fund could attract other business to Janus Capital, the subadvisers or other Janus Henderson funds, and that the success of Janus Capital and the subadvisers could enhance Janus Capital’s and the subadvisers’ ability to serve the Janus Henderson Funds.
Approval of an Amended and Restated Investment Advisory Agreement for Janus Henderson Small-Mid Cap Value Fund (formerly, Janus Henderson Select Value Fund)
Janus Capital Management LLC (“Janus Capital”) met with the Trustees, each of whom serves as an “independent” Trustee (the “Trustees”), on December 5, 2018 and March 14, 2019, to discuss the Amended and Restated Investment Advisory Agreement (the “Amended Advisory Agreement”) for Janus Henderson Small-Mid Cap Value Fund (formerly, Janus Henderson Select Value Fund) (“Small-Mid Cap Value Fund”) and other matters related to investment strategy changes to shift the market capitalization focus of Small-Mid Cap Value Fund (the “Strategy Change”). At these meetings, the Trustees discussed the Amended Advisory Agreement and the Strategy Change with their independent counsel, separately from management. During the course of the meetings, the Trustees requested and considered such information as they deemed relevant to their deliberations. At the meeting held on March 14, 2019, the Trustees, upon the recommendation of Janus Capital, voted unanimously to approve the Amended Advisory Agreement for Small-Mid Cap Value Fund, and recommended that the Amended Advisory Agreement be submitted to shareholders for approval. The Trustees also approved matters related to the Strategy Change, effective upon approval of the Amended Advisory Agreement by the Fund’s shareholders.
In determining whether to approve the Amended Advisory Agreement, the Trustees noted their most recent consideration of Small-Mid Cap Value Fund’s current advisory agreement (the “Current Advisory Agreement”) as part of the Trustees’ annual review and consideration of whether to continue the investment advisory agreement and sub-advisory agreement, as applicable, for each Janus Henderson fund, including Small-Mid Cap Value Fund (the “Annual Review”). The Trustees noted that in connection with the Annual Review: (i) the Trustees received and reviewed information provided by Janus Capital and each sub-adviser, including Perkins Investment Management LLC (“Perkins”), in response to requests of the Trustees and their independent legal counsel, and also received and reviewed information and analysis provided by, and in response to requests of, their independent fee consultant; and (ii) throughout the Annual Review, the Trustees were advised by their independent legal counsel. The Trustees also noted that based on the Trustees’ evaluation of the information provided by Janus Capital, Perkins, and the independent fee consultant, as well as other information, the Trustees determined that the overall arrangements between Small-Mid Cap
Janus Henderson Adaptive Global Allocation Fund
Additional Information (unaudited)
Value Fund and Janus Capital and Perkins were fair and reasonable in light of the nature, extent and quality of the services provided by Janus Capital, its affiliates and Perkins, the fees charged for those services, and other matters that the Trustees considered relevant in the exercise of their business judgment, and the Trustees unanimously approved the continuation of the Current Advisory Agreement for another year.
In considering the Amended Advisory Agreement, the Trustees reviewed and analyzed various factors that they determined were relevant, including the factors described below, none of which by itself was considered dispositive. However, the material factors and conclusions that formed the basis for the Trustees’ determination to approve the Amended Advisory Agreement are discussed separately below.
· The Trustees determined that the terms of the Amended Advisory Agreement are substantially similar to those of the Current Advisory Agreement, which the Trustees recently reviewed as part of the Annual Review, and the material changes made to the Amended Advisory Agreement address the proposed change to the benchmark index and the description of the period used for calculating the performance fee in order to allow for continuity of the fee based on Small-Mid Cap Value Fund’s historical performance over a 36-month measurement period.
· As part of the Strategy Change, Small-Mid Cap Value Fund will focus its investments on common stocks of companies that are small- and mid-capitalization stocks. The Trustees determined that the proposed benchmark index, the Russell 2500TM Value Index, is more closely aligned with a small- and mid-cap stock focus than Small-Mid Cap Value Fund’s current benchmark index, the Russell 3000® Value Index.
· Under the Amended Advisory Agreement, the structure of the performance fee was not changing, other than to utilize a different benchmark and performance calculation period to implement the new benchmark over time, and that this structure had been implemented initially for Small-Mid Cap Value Fund based on analysis provided by the independent fee consultant. The Trustees considered the information provided by Janus Capital in this regard, and noted Janus Capital’s belief that this performance fee structure remained reasonable and appropriate for Small-Mid Cap Value Fund. The Trustees concluded that this performance fee structure was reasonable for Small-Mid Cap Value Fund as proposed, and also determined to seek further analysis from their independent fee consultant with respect to this matter. In this regard, Janus Capital agreed to consider further revisions to the proposed performance fee structure should that be needed based on the additional analysis provided.
· As part of the Strategy Change, Perkins will continue to provide sub-advisory services to Small-Mid Cap Value Fund, but will utilize new portfolio managers to implement Small-Mid Cap Value Fund’s focus on common stocks of companies that are small- and mid-capitalization stocks. In this regard, the Trustees noted the information provided by Janus Capital with respect to the qualifications and experience of the new portfolio managers implementing investment strategies similar to the one to be utilized by Small-Mid Cap Value Fund, and also noted that Perkins and the new portfolio managers provide sub-advisory services to other Janus Henderson funds the Trustees oversee.
· The information provided by Janus Capital with respect to (i) the impact of the Amended Advisory Agreement on the potential advisory fees to be paid by Small-Mid Cap Value Fund going forward; and (ii) the potential transaction costs and capital gains to be incurred by Small-Mid Cap Value Fund as part of the efforts to reposition Small-Mid Cap Value Fund’s portfolio to focus its investments on common stocks of companies that are small- and mid-capitalization stocks. In this regard, the Trustees noted that Small-Mid Cap Value Fund’s operating costs were not expected otherwise to materially change under the Amended Advisory Agreement.
· Janus Capital’s reasons for seeking to implement the Strategy Change, including Janus Capital’s belief that current marketplace demands for a small and mid-cap strategy, combined with Perkins’ experience in managing small- and mid-cap stocks, will provide greater opportunity for Small-Mid Cap Value Fund to grow over the long-term, and that the Strategy Change is designed to create asset growth through increased sales for Small-Mid Cap Value Fund, potentially resulting in increased operational efficiencies for Small-Mid Cap Value Fund.
· Janus Capital will pay the fees and expenses related to seeking shareholder approval of the Amended Advisory Agreement, including the costs related to the preparation and distribution of proxy materials, and all other costs incurred in connection with the solicitation of proxies.
After discussion, the Trustees determined that the overall arrangements between Small-Mid Cap Value Fund, Janus Capital, and Perkins under the Amended Advisory Agreement would continue to be fair and reasonable in light of the
Janus Henderson Adaptive Global Allocation Fund
Additional Information (unaudited)
nature, extent, and quality of the services expected to be provided by Janus Capital, its affiliates, and Perkins following the Strategy Change.
Janus Henderson Adaptive Global Allocation Fund
Useful Information About Your Fund Report (unaudited)
Management Commentary
The Management Commentary in this report includes valuable insight as well as statistical information to help you understand how your Fund’s performance and characteristics stack up against those of comparable indices.
If the Fund invests in foreign securities, this report may include information about country exposure. Country exposure is based primarily on the country of risk. A company may be allocated to a country based on other factors such as location of the company’s principal office, the location of the principal trading market for the company’s securities, or the country where a majority of the company’s revenues are derived.
Please keep in mind that the opinions expressed in the Management Commentary are just that: opinions. They are a reflection based on best judgment at the time this report was compiled, which was December 31, 2019. As the investing environment changes, so could opinions. These views are unique and are not necessarily shared by fellow employees or by Janus Henderson in general.
Performance Overviews
Performance overview graphs compare the performance of a hypothetical $10,000 investment in the Fund with one or more widely used market indices. When comparing the performance of the Fund with an index, keep in mind that market indices are not available for investment and do not reflect deduction of expenses.
Average annual total returns are quoted for a Fund with more than one year of performance history. Average annual total return is calculated by taking the growth or decline in value of an investment over a period of time, including reinvestment of dividends and distributions, then calculating the annual compounded percentage rate that would have produced the same result had the rate of growth been constant throughout the period. Average annual total return does not reflect the deduction of taxes that a shareholder would pay on Fund distributions or redemptions of Fund shares.
Cumulative total returns are quoted for a Fund with less than one year of performance history. Cumulative total return is the growth or decline in value of an investment over time, independent of the period of time involved. Cumulative total return does not reflect the deduction of taxes that a shareholder would pay on Fund distributions or redemptions of Fund shares.
Pursuant to federal securities rules, expense ratios shown in the performance chart reflect subsidized (if applicable) and unsubsidized ratios. The total annual fund operating expenses ratio is gross of any fee waivers, reflecting the Fund’s unsubsidized expense ratio. The net annual fund operating expenses ratio (if applicable) includes contractual waivers of Janus Capital and reflects the Fund’s subsidized expense ratio. Ratios may be higher or lower than those shown in the “Financial Highlights” in this report.
Schedule of Investments
Following the performance overview section is the Fund’s Schedule of Investments. This schedule reports the types of securities held in the Fund on the last day of the reporting period. Securities are usually listed by type (common stock, corporate bonds, U.S. Government obligations, etc.) and by industry classification (banking, communications, insurance, etc.). Holdings are subject to change without notice.
The value of each security is quoted as of the last day of the reporting period. The value of securities denominated in foreign currencies is converted into U.S. dollars.
If the Fund invests in foreign securities, it will also provide a summary of investments by country. This summary reports the Fund exposure to different countries by providing the percentage of securities invested in each country. The country of each security represents the country of risk. The Fund’s Schedule of Investments relies upon the industry group and country classifications published by Barclays and/or MSCI Inc.
Tables listing details of individual forward currency contracts, futures, written options, swaptions, and swaps follow the Fund’s Schedule of Investments (if applicable).
Statement of Assets and Liabilities
This statement is often referred to as the “balance sheet.” It lists the assets and liabilities of the Fund on the last day of the reporting period.
Janus Henderson Adaptive Global Allocation Fund
Useful Information About Your Fund Report (unaudited)
The Fund’s assets are calculated by adding the value of the securities owned, the receivable for securities sold but not yet settled, the receivable for dividends declared but not yet received on securities owned, and the receivable for Fund shares sold to investors but not yet settled. The Fund’s liabilities include payables for securities purchased but not yet settled, Fund shares redeemed but not yet paid, and expenses owed but not yet paid. Additionally, there may be other assets and liabilities such as unrealized gain or loss on forward currency contracts.
The section entitled “Net Assets Consist of” breaks down the components of the Fund’s net assets. Because the Fund must distribute substantially all earnings, you will notice that a significant portion of net assets is shareholder capital.
The last section of this statement reports the net asset value (“NAV”) per share on the last day of the reporting period. The NAV is calculated by dividing the Fund’s net assets for each share class (assets minus liabilities) by the number of shares outstanding.
Statement of Operations
This statement details the Fund’s income, expenses, realized gains and losses on securities and currency transactions, and changes in unrealized appreciation or depreciation of Fund holdings.
The first section in this statement, entitled “Investment Income,” reports the dividends earned from securities and interest earned from interest-bearing securities in the Fund.
The next section reports the expenses incurred by the Fund, including the advisory fee paid to the investment adviser, transfer agent fees and expenses, and printing and postage for mailing statements, financial reports and prospectuses. Expense offsets and expense reimbursements, if any, are also shown.
The last section lists the amounts of realized gains or losses from investment and foreign currency transactions, and changes in unrealized appreciation or depreciation of investments and foreign currency-denominated assets and liabilities. The Fund will realize a gain (or loss) when it sells its position in a particular security. A change in unrealized gain (or loss) refers to the change in net appreciation or depreciation of the Fund during the reporting period. “Net Realized and Unrealized Gain/(Loss) on Investments” is affected both by changes in the market value of Fund holdings and by gains (or losses) realized during the reporting period.
Statements of Changes in Net Assets
These statements report the increase or decrease in the Fund’s net assets during the reporting period. Changes in the Fund’s net assets are attributable to investment operations, dividends and distributions to investors, and capital share transactions. This is important to investors because it shows exactly what caused the Fund’s net asset size to change during the period.
The first section summarizes the information from the Statement of Operations regarding changes in net assets due to the Fund’s investment operations. The Fund’s net assets may also change as a result of dividend and capital gains distributions to investors. If investors receive their dividends and/or distributions in cash, money is taken out of the Fund to pay the dividend and/or distribution. If investors reinvest their dividends and/or distributions, the Fund’s net assets will not be affected. If you compare the Fund’s “Net Decrease from Dividends and Distributions” to “Reinvested Dividends and Distributions,” you will notice that dividends and distributions have little effect on the Fund’s net assets. This is because the majority of the Fund’s investors reinvest their dividends and/or distributions.
The reinvestment of dividends and distributions is included under “Capital Share Transactions.” “Capital Shares” refers to the money investors contribute to the Fund through purchases or withdrawals via redemptions. The Fund’s net assets will increase and decrease in value as investors purchase and redeem shares from the Fund.
Financial Highlights
This schedule provides a per-share breakdown of the components that affect the Fund’s NAV for current and past reporting periods as well as total return, asset size, ratios, and portfolio turnover rate.
The first line in the table reflects the NAV per share at the beginning of the reporting period. The next line reports the net investment income/(loss) per share. Following is the per share total of net gains/(losses), realized and unrealized. Per share dividends and distributions to investors are then subtracted to arrive at the NAV per share at the end of the period. The next line reflects the total return for the period. The total return may include adjustments in accordance with generally accepted accounting principles required at the period end for financial reporting purposes. As a result, the
Janus Henderson Adaptive Global Allocation Fund
Useful Information About Your Fund Report (unaudited)
total return may differ from the total return reflected for individual shareholder transactions. Also included are ratios of expenses and net investment income to average net assets.
The Fund’s expenses may be reduced through expense offsets and expense reimbursements. The ratios shown reflect expenses before and after any such offsets and reimbursements.
The ratio of net investment income/(loss) summarizes the income earned less expenses, divided by the average net assets of the Fund during the reporting period. Do not confuse this ratio with the Fund’s yield. The net investment income ratio is not a true measure of the Fund’s yield because it does not take into account the dividends distributed to the Fund’s investors.
The next figure is the portfolio turnover rate, which measures the buying and selling activity in the Fund. Portfolio turnover is affected by market conditions, changes in the asset size of the Fund, fluctuating volume of shareholder purchase and redemption orders, the nature of the Fund’s investments, and the investment style and/or outlook of the portfolio manager(s) and/or investment personnel. A 100% rate implies that an amount equal to the value of the entire portfolio was replaced once during the fiscal year; a 50% rate means that an amount equal to the value of half the portfolio is traded in a year; and a 200% rate means that an amount equal to the value of the entire portfolio is traded every six months.
Janus Henderson Adaptive Global Allocation Fund
Notes
NotesPage1
Janus Henderson Adaptive Global Allocation Fund
Notes
NotesPage2
Knowledge. Shared
At Janus Henderson, we believe in the sharing of expert insight for better investment and business decisions. We call this ethos Knowledge. Shared.
Learn more by visiting janushenderson.com.
| | | | | | | | | |
| | | | | |

| | | | |
This report is submitted for the general information of shareholders of the Fund. It is not an offer or solicitation for the Fund and is not authorized for distribution to prospective investors unless preceded or accompanied by an effective prospectus. |
Janus Henderson, Janus, Henderson, Perkins, Intech and Knowledge. Shared are trademarks of Janus Henderson Group plc or one of its subsidiaries. © Janus Henderson Group plc. Janus Henderson Distributors |
| | | | | 125-24-93059 02-20 |
| | | |
| | | |
| | | SEMIANNUAL REPORT December 31, 2019 |
| | |
| | Janus Henderson Developed World Bond Fund |
| | |
| | Janus Investment Fund |
Beginning on January 1, 2021, as permitted by regulations adopted by the Securities and Exchange Commission, paper copies of the Fund’s shareholder reports will no longer be sent by mail, unless you specifically request paper copies of the reports from the Fund or your plan sponsor, broker-dealer, or financial intermediary, or if you invest directly with the Fund, by contacting a Janus Henderson representative. Instead, the reports will be made available on a website, and you will be notified by mail each time a report is posted and provided with a website link to access the report. If you already elected to receive shareholder reports electronically, you will not be affected by this change and you need not take any action. You may elect to receive shareholder reports and other communications from the Fund electronically by contacting your plan sponsor, broker-dealer, or financial intermediary, or if you invest directly with the Fund, by visiting janushenderson.com/edelivery. You may elect to receive all future reports in paper free of charge. If you do not invest directly with the Fund, you should contact your plan sponsor, broker-dealer, or financial intermediary, to request to continue receiving paper copies of your shareholder reports. If you invest directly with the Fund, you can call 1-800-525-3713 to let the Fund know that you wish to continue receiving paper copies of your shareholder reports. Your election to receive reports in paper will apply to all Janus Henderson mutual funds where held (i.e., all Janus Henderson mutual funds held in your account if you invest through your financial intermediary or all Janus Henderson mutual funds held with the fund complex if you invest directly with a fund). |
| | | |
| | | HIGHLIGHTS · Portfolio management perspective · Investment strategy behind your fund · Fund performance, characteristics
and holdings |
| | | |
| | | 
|
Table of Contents
Janus Henderson Developed World Bond Fund
Janus Henderson Developed World Bond Fund (unaudited)
| | | | | | |
FUND SNAPSHOT The Janus Henderson Developed World Bond Fund is a developed market fixed income fund seeking total return through current income and capital appreciation. The Fund makes strategic asset allocation decisions between countries, fixed income asset classes, sectors and credit ratings. We believe that outside of the bond’s coupon, asset allocation is the primary driver of returns. Specifically, we actively manage the Fund’s duration position and credit exposure based on where we believe we are in the economic cycle. The Fund’s flexibility allows it to source return from a wide range of global fixed income securities. In addition, by style, we favor sensible income from large, non-cyclical businesses that are likely to continue paying their coupons in the years to come. | | | | 
John Pattullo co-portfolio manager | 
Jenna Barnard co-portfolio manager |
| | | |
PERFORMANCE
The Janus Henderson Developed World Bond Fund’s Class I Shares returned 2.24% over the six-month period ending December 31, 2019. The Fund’s primary benchmark, the Bloomberg Barclays Global Aggregate Credit Index (USD Hedged), returned 3.35%.
INVESTMENT ENVIRONMENT
The six-month period under review was very interesting, with significant gyrations and rotations in asset classes. Broadly speaking, the first half of the period was more defensive and disinflationary, while the second half, especially December, was reflationary and experienced significant risk-on in equity markets. These movements all relate to the markets’ interpretation of economic data emerging from evolving central bank policy. We have long held the view that the U.S. Federal Reserve (Fed) over-tightened monetary policy in response to their misplaced fear that inflation would rise and the output gap would close.
In July, the European Central Bank hinted that rates would be lowered in Europe and a quantitative easing (QE) bond program would be implemented. It also signaled that the central bank is unhappy with the inflation picture and wants to reinterpret its inflation mandate as symmetrical, such that it will try to get inflation above 2%. Rates eventually were cut in September, and a new open-ended QE program (including corporate bonds) was announced that would continue until inflation converged at or around 2%.
Also in July, the Fed cut rates by 0.25%, which failed to impress markets. The reference to a "mid-cycle adjustment" (i.e., a modest one-off rate cut) was a policy error and caused a substantial tightening in financial conditions: equities fell, the yield curve flattened dramatically and the U.S. dollar rose higher. This led to a panic in sovereign bond markets during August that the Fed had over-tightened and subsequent interest rate cuts had not been aggressive enough. 10-year Treasury yields fell, inflation expectations slumped and activity waned globally. Many other countries around the world, including Australia, also cut interest rates, somewhat following the Fed’s lead. The trade wars, tariff escalation, Middle East and Hong Kong tensions and Brexit only worsened an already poor situation. The economic growth numbers were worrying, most pertinently in Asia and Europe, and were focused on trade and manufacturing activity.
Unfortunately, Fed Chairman Jerome Powell achieved a similar result with the subsequent 0.25% September rate cut, where some participants were calling for a 0.5% cut. Another cut in October, however, did help improve sentiment. This, coupled with the lagged response to interest rate cuts in the U.S., began to support the economic data, which generally became less bad and appeared to have bottomed. Equity markets leapt on this reflation sentiment and rallied strongly, especially in some of the more cyclical sectors. Bond yields drifted higher from the lows of late summer on what we believe to be a medium-term cyclical bounce rather than a structural breakout of growth and inflation. Yield curves are steeper, the U.S. dollar is a little weaker and commodities are stronger – all classic reflation trades.
PERFORMANCE DISCUSSION
Over the period, fixed income markets experienced two notably different environments: the first three months
Janus Henderson Developed World Bond Fund (unaudited)
were deflationary and the second, reflationary. The Fund performed well during the deflationary months and then gave back some performance in the reflationary months. In the latter, reflationary period, the Fund lacked high-beta credit exposure and had too much exposure in defensive sovereign bonds and quality investment-grade credit.
The interest rate overlay added value but faded a little into period end. In hindsight, we would have expected bond yields to have risen more into year-end given the strength of equities and risk markets in general. A long interest-rate position detracted in October, while a modest short position detracted in November as the bond market fluctuated on geopolitical uncertainty.
Over the entire period, both high-yield and investment-grade bonds performed well, while sovereigns lagged a little, though with significant gyrations amid the choppy market environment. December was a strong month for risk, with the S&P 500® Index up nearly 5%. High yield had a very strong seasonal rally while sovereigns continued to lag. The Fund took profit on some of our Australian and European bonds over the period, thereby reducing its interest rate sensitivity. This did change materially over the period, from very long in August to much lower at period end.
DERIVATIVES USAGE
The Fund makes use of derivatives because they generally are the most efficient and liquid way to gain our desired exposures. The Fund uses credit default swaps to manage exposure to a given issuer or sector by either selling protection to increase exposure (i.e., leverage), buying protection to reduce exposure or to effectively take a “short” position. The Fund uses futures as a liquid and straightforward way of either reducing or increasing the Fund’s duration (interest rate sensitivity). Currency forwards are used to hedge the Fund’s foreign currency back to the U.S. dollar. Additional forwards may be used to hedge underlying currency risk if exposure is significant. In aggregate, these positions contributed to performance during the period.
Please see the Derivative Instruments section in the “Notes to Financial Statements” for a discussion of derivatives used by the Fund.
OUTLOOK
The duration of the Fund was meaningfully reduced during the course of the fourth quarter. We continued to add to investment-grade credit exposure and more recently select high-yield bonds. Thus the Fund moved to a more cyclically positive positioning that we expect to play out over the course of 2020. We remain structural bulls on core bond markets but have always been pragmatic on the cyclical management of duration, viewed through the prism of the rate of change in the data. The current period of phase transition and bottoming in the manufacturing cycle will be choppy and potentially lengthy but we are increasingly confident that the worst of the downturn is behind us. Given the significant uplift in capital values it is important to hold patience and perspective with respect to potential bond returns from here. The summer may well present an opportunity to lengthen duration, once we determine the sustainability of the current reflation. We will remain flexible in our thinking.
Janus Henderson Developed World Bond Fund (unaudited)
Fund At A Glance
December 31, 2019
| | | |
Fund Profile | | |
30-day Current Yield* | Without
Reimbursement | With
Reimbursement |
Class A Shares NAV | 0.99% | 0.99% |
Class A Shares MOP | 0.95% | 0.95% |
Class C Shares** | 0.29% | 0.29% |
Class D Shares | 1.19% | 1.19% |
Class I Shares | 1.26% | 1.26% |
Class N Shares | 1.33% | 1.33% |
Class S Shares | -0.49% | 0.77% |
Class T Shares | 1.10% | 1.10% |
Weighted Average Maturity | 6.6 Years |
Average Effective Duration*** | 4.5 Years |
* Yield will fluctuate. | | |
** Does not include the 1.00% contingent deferred sales charge. |
*** A theoretical measure of price volatility. | |
| | |
Ratings† Summary - (% of Total Investments) | |
AAA | 8.5% |
AA | 16.2% |
A | 21.0% |
BBB | 21.9% |
BB | 7.3% |
B | 3.4% |
Not Rated | 17.1% |
Other | 4.6% |
† Credit ratings provided by Standard & Poor's (S&P), an independent credit rating agency. Credit ratings range from AAA (highest) to D (lowest) based on S&P's measures. Further information on S&P's rating methodology may be found at www.standardandpoors.com. Other rating agencies may rate the same securities differently. Ratings are relative and subjective and are not absolute standards of quality. Credit quality does not remove market risk and is subject to change. "Not Rated" securities are not rated by S&P, but may be rated by other rating agencies and do not necessarily indicate low quality. "Other" includes cash equivalents, equity securities, and certain derivative instruments. |
Significant Areas of Investment - (% of Net Assets)
| | | | | | |
Asset Allocation - (% of Net Assets) |
Corporate Bonds | | 65.7% |
Foreign Government Bonds | | 23.4% |
Investment Companies | | 5.5% |
United States Treasury Notes/Bonds | | 4.5% |
Bank Loans and Mezzanine Loans | | 0.6% |
Asset-Backed/Commercial Mortgage-Backed Securities | | 0.3% |
Other | | 0.0% |
| | | 100.0% |
Janus Henderson Developed World Bond Fund (unaudited)
Performance
| |
See important disclosures on the next page. |
| | | | | | | | | | | | |
| | | | | | | | | | | |
| | | | | | | | | | | |
Average Annual Total Return - for the periods ended December 31, 2019 | | | Expense Ratios |
| | Fiscal
Year-to-Date | One
Year | Five
Year | Ten
Year | Since
Inception* | | | Total Annual Fund
Operating Expenses‡ | Net Annual Fund
Operating Expenses‡ |
Class A Shares at NAV | | 2.11% | 9.50% | 4.61% | 5.59% | 5.18% | | | 1.00% | 0.99% |
Class A Shares at MOP | | -2.71% | 4.34% | 3.60% | 5.08% | 4.86% | | | | |
Class C Shares at NAV | | 1.66% | 8.56% | 3.83% | 4.79% | 4.37% | | | 1.74% | 1.73% |
Class C Shares at CDSC | | 0.67% | 7.56% | 3.83% | 4.79% | 4.37% | | | | |
Class D Shares(1) | | 2.10% | 9.58% | 4.69% | 5.63% | 5.20% | | | 0.87% | 0.80% |
Class I Shares | | 2.24% | 9.68% | 4.87% | 5.81% | 5.31% | | | 0.75% | 0.73% |
Class N Shares | | 2.17% | 9.74% | 4.86% | 5.72% | 5.26% | | | 0.72% | 0.65% |
Class S Shares | | 1.97% | 9.34% | 4.48% | 5.50% | 5.12% | | | 3.29% | 1.16% |
Class T Shares | | 2.16% | 9.50% | 4.65% | 5.61% | 5.19% | | | 0.92% | 0.90% |
Bloomberg Barclays Global Aggregate Credit Index (USD Hedged) | | 3.35% | 11.85% | 4.36% | 5.08% | 4.79% | | | | |
Morningstar Quartile - Class A Shares | | - | 2nd | 1st | 1st | 1st | | | | |
Morningstar Ranking - based on total returns for World Bond - USD Hedged Funds | | - | 33/102 | 7/72 | 9/51 | 15/48 | | | | |
Returns quoted are past performance and do not guarantee future results; current performance may be lower or higher. Investment returns and principal value will vary; there may be a gain or loss when shares are sold. For the most recent month-end performance call 800.668.0434 (or 800.525.3713 if you hold shares directly with Janus Henderson) or visit janushenderson.com/performance (or janushenderson.com/allfunds if you hold shares directly with Janus Henderson).
Maximum Offering Price (MOP) returns include the maximum sales charge of 4.75%. Net Asset Value (NAV) returns exclude this charge, which would have reduced returns.
CDSC returns include a 1% contingent deferred sales charge (CDSC) on Shares redeemed within 12 months of purchase. Net Asset Value (NAV) returns exclude this charge, which would have reduced returns.
Net expense ratios reflect the expense waiver, if any, contractually agreed to through October 28, 2020.
Performance may be affected by risks that include those associated with non-diversification, portfolio turnover, short sales, potential conflicts of interest,
Janus Henderson Developed World Bond Fund (unaudited)
Performance
foreign and emerging markets, initial public offerings (IPOs), high-yield and high-risk securities, undervalued, overlooked and smaller capitalization companies, real estate related securities including Real Estate Investment Trusts (REITs), derivatives, and commodity-linked investments. Each product has different risks. Please see the prospectus for more information about risks, holdings and other details.
The Fund will normally invest at least 80% of its net assets, measured at the time of purchase, in the type of securities described by its name.
Returns include reinvestment of all dividends and distributions and do not reflect the deduction of taxes that a shareholder would pay on Fund distributions or redemptions of Fund shares. The returns do not include adjustments in accordance with generally accepted accounting principles required at the period end for financial reporting purposes.
Returns of the Fund shown prior to June 5, 2017, are those for Henderson Strategic Income Fund (the “Predecessor Fund”), which merged into the Fund after the close of business on June 2, 2017. The Predecessor Fund was advised by Henderson Global Investors (North America) Inc. and subadvised by Henderson Investment Management Limited. Class A Shares, Class C Shares, Class I Shares, and Class R6 Shares of the Predecessor Fund were reorganized into Class A Shares, Class C Shares, Class I Shares, and Class N Shares, respectively, of the Fund. In connection with this reorganization, certain shareholders of the Predecessor Fund who held shares directly with the Predecessor Fund and not through an intermediary had the Class A Shares, Class C Shares, Class I Shares, and Class N Shares of the Fund received in the reorganization automatically exchanged for Class D Shares of the Fund following the reorganization. Class A Shares and Class C Shares of the Predecessor Fund commenced operations with the Predecessor Fund’s inception on September 30, 2003. Class I Shares and Class R6 Shares of the Predecessor Fund commenced operations on April 29, 2011 and November 30, 2015, respectively. Class D Shares, Class S Shares, and Class T Shares commenced operations on June 5, 2017.
Performance of Class A Shares shown for periods prior to June 5, 2017, reflects the performance of Class A Shares of the Predecessor Fund, calculated using the fees and expenses of Class A Shares of the Predecessor Fund, in effect during the periods shown, net of any applicable fee and expense limitations or waivers.
Performance of Class C Shares shown for periods prior to June 5, 2017, reflects the performance of Class C Shares of the Predecessor Fund, calculated using the fees and expenses of Class C Shares of the Predecessor Fund, in effect during the periods shown, net of any applicable fee and expense limitations or waivers.
Performance of Class D Shares shown for periods prior to June 5, 2017, reflects the performance of Class A Shares of the Predecessor Fund, calculated using the fees and expenses of Class A Shares of the Predecessor Fund (without sales charges), net of any applicable fee and expense limitations or waivers.
Performance of Class I Shares shown for periods prior to June 5, 2017, reflects the performance of Class I Shares of the Predecessor Fund, calculated using the fees and expenses of Class I Shares of the Predecessor Fund, in effect during the periods shown, net of any applicable fee and expense limitations or waivers, except that for periods prior to April 29, 2011, performance for Class I Shares reflects the performance of Class A Shares of the Predecessor Fund, calculated using the fees and expenses of Class A Shares of the Predecessor Fund (without sales charges), net of any applicable fee and expense limitations or waivers.
Performance of Class N Shares shown for periods prior to June 5, 2017, reflects the performance of Class R6 Shares of the Predecessor Fund, calculated using the fees and expenses of Class R6 Shares of the Predecessor Fund, in effect during the periods shown, net of any applicable fee and expense limitations or waivers, except that for periods prior to November 30, 2015, performance for Class N Shares reflects the performance of Class A Shares of the Predecessor Fund, calculated using the fees and expenses of Class A Shares of the Predecessor Fund (without sales charges), net of any applicable fee and expense limitations or waivers.
Performance of Class S Shares shown for periods prior to June 5, 2017, reflects the performance of Class A Shares of the Predecessor Fund, calculated using the fees and expenses of Class A Shares of the Predecessor Fund (without sales charges), net of any applicable fee and expense limitations or waivers.
Performance of Class T Shares shown for periods prior to June 5, 2017, reflects the performance of Class A Shares of the Predecessor Fund, calculated using the fees and expenses of Class A Shares of the Predecessor Fund (without sales charges), net of any applicable fee and expense limitations or waivers.
If each share class of the Fund had been available during periods prior to its commencement, the performance shown may have been different. The performance shown for periods following the Fund’s commencement of each share class reflects the fees and expenses of each respective share class, net of any applicable fee and expense limitations or waivers. Please refer to the Fund’s prospectuses for further details concerning historical performance.
Ranking is for the share class shown only; other classes may have different performance characteristics. When an expense waiver is in effect, it may have a material effect on the total return, and therefore the ranking for the period.
Janus Henderson Developed World Bond Fund (unaudited)
Performance
© 2019 Morningstar, Inc. All Rights Reserved.
There is no assurance that the investment process will consistently lead to successful investing.
See Notes to Schedule of Investments and Other Information for index definitions.
Index performance does not reflect the expenses of managing a portfolio as an index is unmanaged and not available for direct investment.
See “Useful Information About Your Fund Report.”
*The Predecessor Fund’s inception date – September 30, 2003
‡ As stated in the prospectus. See Financial Highlights for actual expense ratios during the reporting period.
(1) Closed to certain new investors.
Janus Henderson Developed World Bond Fund (unaudited)
Expense Examples
As a shareholder of the Fund, you incur two types of costs: (1) transaction costs, such as sales charges (loads) on purchase payments (applicable to Class A Shares only); and (2) ongoing costs, including management fees; 12b-1 distribution and shareholder servicing fees; transfer agent fees and expenses payable pursuant to the Transfer Agency Agreement; and other Fund expenses. This example is intended to help you understand your ongoing costs (in dollars) of investing in the Fund and to compare these costs with the ongoing costs of investing in other mutual funds. To do so, compare this 5% hypothetical example with the 5% hypothetical examples that appear in the shareholder reports of the other funds. The example is based upon an investment of $1,000 invested at the beginning of the period and held for the six-months indicated, unless noted otherwise in the table and footnotes below.
Actual Expenses
The information in the table under the heading “Actual” provides information about actual account values and actual expenses. You may use the information in these columns, together with the amount you invested, to estimate the expenses that you paid over the period. Simply divide your account value by $1,000 (for example, an $8,600 account value divided by $1,000 = 8.6), then multiply the result by the number in the appropriate column for your share class under the heading entitled “Expenses Paid During Period” to estimate the expenses you paid on your account during the period.
Hypothetical Example for Comparison Purposes
The information in the table under the heading “Hypothetical (5% return before expenses)” provides information about hypothetical account values and hypothetical expenses based upon the Fund’s actual expense ratio and an assumed rate of return of 5% per year before expenses, which is not the Fund’s actual return. The hypothetical account values and expenses may not be used to estimate the actual ending account balance or expenses you paid for the period. You may use this information to compare the ongoing costs of investing in the Fund and other funds. To do so, compare this 5% hypothetical example with the 5% hypothetical examples that appear in the shareholder reports of the other funds. Additionally, for an analysis of the fees associated with an investment in any share class or other similar funds, please visit www.finra.org/fundanalyzer.
Please note that the expenses shown in the table are meant to highlight your ongoing costs only and do not reflect any transaction costs. These fees are fully described in the Fund’s prospectuses. Therefore, the hypothetical examples are useful in comparing ongoing costs only, and will not help you determine the relative total costs of owning different funds. In addition, if these transaction costs were included, your costs would have been higher.
| | | | | | | | | | | |
| | | | | | | | | |
| | | | Actual | | Hypothetical
(5% return before expenses) | |
| Beginning
Account
Value
(7/1/19) | Ending
Account
Value
(12/31/19) | Expenses
Paid During
Period
(7/1/19 - 12/31/19)† | | Beginning
Account
Value
(7/1/19) | Ending
Account
Value
(12/31/19) | Expenses
Paid During
Period
(7/1/19 - 12/31/19)† | Net Annualized
Expense Ratio
(7/1/19 - 12/31/19) |
Class A Shares | $1,000.00 | $1,021.10 | $4.67 | | $1,000.00 | $1,020.51 | $4.67 | 0.92% |
Class C Shares | $1,000.00 | $1,016.60 | $8.26 | | $1,000.00 | $1,016.94 | $8.26 | 1.63% |
Class D Shares | $1,000.00 | $1,021.00 | $3.76 | | $1,000.00 | $1,021.42 | $3.76 | 0.74% |
Class I Shares | $1,000.00 | $1,022.40 | $3.41 | | $1,000.00 | $1,021.77 | $3.41 | 0.67% |
Class N Shares | $1,000.00 | $1,021.70 | $3.10 | | $1,000.00 | $1,022.07 | $3.10 | 0.61% |
Class S Shares | $1,000.00 | $1,019.70 | $5.33 | | $1,000.00 | $1,019.86 | $5.33 | 1.05% |
Class T Shares | $1,000.00 | $1,021.60 | $4.22 | | $1,000.00 | $1,020.96 | $4.22 | 0.83% |
† | Expenses Paid During Period are equal to the Net Annualized Expense Ratio multiplied by the average account value over the period, multiplied by 184/366 (to reflect the one-half year period). Expenses in the examples include the effect of applicable fee waivers and/or expense reimbursements, if any. Had such waivers and/or reimbursements not been in effect, your expenses would have been higher. Please refer to the Notes to Financial Statements or the Fund’s prospectuses for more information regarding waivers and/or reimbursements. |
Janus Henderson Developed World Bond Fund
Schedule of Investments (unaudited)
December 31, 2019
| | | | | | | | |
Shares or
Principal Amounts | | | Value | |
Asset-Backed/Commercial Mortgage-Backed Securities – 0.3% | | | |
| | Ardagh Packaging Finance PLC / Ardagh Holdings USA Inc, 2.7500%, 3/15/24 | | 3,840,000 | EUR | | $4,384,055 | |
| | Tesco Property Finance 3 PLC, 5.7440%, 4/13/40 | | 338,175 | GBP | | 580,699 | |
Total Asset-Backed/Commercial Mortgage-Backed Securities (cost $4,917,477) | | 4,964,754 | |
Bank Loans and Mezzanine Loans – 0.6% | | | |
Consumer Non-Cyclical – 0.2% | | | |
| | Froneri International Ltd, | | | | | | |
| | ICE LIBOR USD 6 Month + 2.7500%, 3.5051%, 1/31/25‡ | | 2,244,543 | GBP | | 2,971,747 | |
Software – 0% | | | |
| | SS&C European Holdings Sarl, | | | | | | |
| | ICE LIBOR USD 3 Month + 2.2500%, 4.6500%, 4/16/25‡ | | $7,442 | | | 7,490 | |
Technology – 0.4% | | | |
| | McAfee LLC, | | | | | | |
| | Euro Interbank Offered Rate 3 Month + 3.5000%, 3.5000%, 9/30/24‡ | | 980,100 | EUR | | 1,102,945 | |
| | McAfee LLC, ICE LIBOR USD 1 Month + 3.7500%, 5.5548%, 9/30/24‡ | | 2,126,726 | | | 2,140,064 | |
| | Refinitiv US Holdings Inc, | | | | | | |
| | ICE LIBOR USD 1 Month + 3.2500%, 5.0494%, 10/1/25ƒ,‡ | | 3,113,000 | | | 3,139,460 | |
| | SS&C Technologies Inc, ICE LIBOR USD 3 Month + 2.2500%, 4.6520%, 4/16/25‡ | | 10,952 | | | 11,023 | |
| | | 6,393,492 | |
Total Bank Loans and Mezzanine Loans (cost $9,526,965) | | 9,372,729 | |
Corporate Bonds – 65.7% | | | |
Banking – 5.3% | | | |
| | Bank of America Corp, 3.3000%, 8/5/21 | | 5,870,000 | AUD | | 4,235,519 | |
| | Bank of America Corp, | | | | | | |
| | Canada Bankers Acceptances 3 Month + 1.2020%, 3.4070%, 9/20/25‡ | | 2,500,000 | CAD | | 1,983,403 | |
| | Barclays Bank PLC, ICE LIBOR USD 3 Month + 1.5500%, 6.2780%‡,µ | | 4,600,000 | | | 5,300,442 | |
| | Citibank, National Association, 3.7500%, 5/4/21 | | 7,216,000 | AUD | | 5,222,552 | |
| | Credit Suisse AG/Sydney, 3.5000%, 4/29/20 | | 4,830,000 | AUD | | 3,410,726 | |
| | Goldman Sachs Group Inc, 4.0000%, 5/2/24 | | 5,270,000 | AUD | | 3,953,085 | |
| | HBOS Sterling Finance Jersey LP, | | | | | | |
| | UK Govt Bonds 5 Year Note Generic Bid Yield + 4.4000%, 7.8810%‡,µ | | 909,000 | GBP | | 1,876,480 | |
| | JPMorgan Chase & Co, 4.5000%, 1/30/26 | | 6,950,000 | AUD | | 5,463,439 | |
| | Lloyds Banking Group PLC, 4.0000%, 3/7/25 | | 4,400,000 | AUD | | 3,295,423 | |
| | Lloyds Banking Group PLC, 4.2500%, 11/22/27 | | 2,190,000 | AUD | | 1,670,983 | |
| | Lloyds Banking Group PLC, 4.3750%, 3/22/28 | | 3,000,000 | | | 3,304,246 | |
| | Lloyds Banking Group PLC, | | | | | | |
| | ICE LIBOR USD 3 Month + 1.2700%, 6.6570% (144A)‡,µ | | 5,486,000 | | | 6,536,240 | |
| | Nationwide Building Society, 4.0000%, 9/14/26 (144A) | | 7,500,000 | | | 7,886,901 | |
| | RBS Capital Trust II, ICE LIBOR USD 3 Month + 1.9425%, 6.4250%‡,µ | | 1,514,000 | | | 2,127,170 | |
| | Royal Bank of Scotland Group PLC, 6.0000%, 12/19/23 | | 3,500,000 | | | 3,889,905 | |
| | Royal Bank of Scotland Group PLC, 5.1250%, 5/28/24 | | 2,600,000 | | | 2,814,897 | |
| | Royal Bank of Scotland Group PLC, | | | | | | |
| | ICE LIBOR USD 3 Month + 2.5000%, 7.6480%‡,µ | | 971,000 | | | 1,393,472 | |
| | Wells Fargo & Co, 3.0000%, 1/22/21 | | 3,500,000 | | | 3,540,807 | |
| | Wells Fargo & Co, 3.7000%, 7/27/26 | | 6,000,000 | AUD | | 4,533,224 | |
| | Wells Fargo & Co, 4.0000%, 4/27/27 | | 11,000,000 | AUD | | 8,479,734 | |
| | | 80,918,648 | |
Basic Industry – 1.8% | | | |
| | Air Liquide Finance SA, 0.6250%, 6/20/30 | | 10,700,000 | EUR | | 12,306,985 | |
| | Argentum Netherlands BV for Givaudan SA, 2.0000%, 9/17/30 | | 3,600,000 | EUR | | 4,557,760 | |
| | International Flavors & Fragrances Inc, 1.8000%, 9/25/26 | | 390,000 | EUR | | 457,857 | |
| | International Flavors & Fragrances Inc, 4.4500%, 9/26/28 | | 194,000 | | | 211,907 | |
| | Smurfit Kappa Treasury ULC, 1.5000%, 9/15/27 | | 6,800,000 | EUR | | 7,731,780 | |
| | WEPA Hygieneprodukte GmbH, 2.8750%, 12/15/27 (144A) | | 2,260,000 | EUR | | 2,620,883 | |
| | | 27,887,172 | |
Capital Goods – 0.5% | | | |
| | Ardagh Packaging Finance PLC / Ardagh Holdings USA Inc, | | | | | | |
| | 6.0000%, 2/15/25 (144A) | | 860,000 | | | 901,925 | |
| | |
See Notes to Schedule of Investments and Other Information and Notes to Financial Statements. |
| |
8 | DECEMBER 31, 2019 |
Janus Henderson Developed World Bond Fund
Schedule of Investments (unaudited)
December 31, 2019
| | | | | | | | |
Shares or
Principal Amounts | | | Value | |
Corporate Bonds – (continued) | | | |
Capital Goods – (continued) | | | |
| | Ardagh Packaging Finance PLC / Ardagh Holdings USA Inc, | | | | | | |
| | 5.2500%, 8/15/27 (144A) | | $6,800,000 | | | $7,157,136 | |
| | | 8,059,061 | |
Communications – 12.0% | | | |
| | American Tower Corp, 3.3750%, 5/15/24 | | 2,856,000 | | | 2,963,784 | |
| | American Tower Corp, 3.6000%, 1/15/28 | | 7,580,000 | | | 7,955,776 | |
| | American Tower Corp, 3.8000%, 8/15/29 | | 4,140,000 | | | 4,419,963 | |
| | Arqiva Broadcast Finance PLC, 6.7500%, 9/30/23 | | 1,600,000 | GBP | | 2,252,531 | |
| | AT&T Inc, 2.4500%, 6/30/20 | | 3,500,000 | | | 3,511,865 | |
| | CCO Holdings LLC / CCO Holdings Capital Corp, 5.1250%, 5/1/23 (144A) | | 1,300,000 | | | 1,326,819 | |
| | CCO Holdings LLC / CCO Holdings Capital Corp, 5.8750%, 5/1/27 (144A) | | 418,000 | | | 442,035 | |
| | CCO Holdings LLC / CCO Holdings Capital Corp, 5.3750%, 6/1/29 (144A) | | 4,268,000 | | | 4,556,090 | |
| | | | | | | | |
| | Charter Communications Operating LLC / Charter Communications Operating Capital, 4.2000%, 3/15/28 | | 13,160,000 | | | 14,012,479 | |
| | Comcast Corp, 3.3750%, 8/15/25 | | 2,342,000 | | | 2,483,324 | |
| | Comcast Corp, 3.9500%, 10/15/25 | | 4,088,000 | | | 4,458,265 | |
| | Comcast Corp, 4.1500%, 10/15/28 | | 5,708,000 | | | 6,420,848 | |
| | Crown Castle International Corp, 3.4000%, 2/15/21 | | 1,600,000 | | | 1,621,504 | |
| | Crown Castle International Corp, 3.2000%, 9/1/24 | | 2,276,000 | | | 2,352,740 | |
| | Crown Castle International Corp, 3.6500%, 9/1/27 | | 2,810,000 | | | 2,970,344 | |
| | Crown Castle International Corp, 3.8000%, 2/15/28 | | 1,990,000 | | | 2,118,746 | |
| | Crown Castle International Corp, 3.1000%, 11/15/29 | | 5,601,000 | | | 5,663,846 | |
| | Deutsche Telekom AG, 1.3750%, 7/5/34 | | 7,300,000 | EUR | | 8,274,517 | |
| | Deutsche Telekom International Finance BV, 2.2250%, 1/17/20 (144A) | | 2,820,000 | | | 2,820,156 | |
| | Deutsche Telekom International Finance BV, 1.5000%, 4/3/28 | | 2,800,000 | EUR | | 3,361,960 | |
| | Diamond Sports Group LLC / Diamond Sports Finance Co, | | | | | | |
| | 5.3750%, 8/15/26 (144A) | | 3,443,000 | | | 3,482,774 | |
| | Entertainment One Ltd, 4.6250%, 7/15/26 (144A) | | 1,930,000 | GBP | | 2,760,217 | |
| | Moody's Corp, 0.9500%, 2/25/30 | | 4,350,000 | EUR | | 4,907,716 | |
| | Orange SA, 1.0000%, 5/12/25 | | 4,100,000 | EUR | | 4,770,620 | |
| | Orange SA, 2.0000%, 1/15/29 | | 3,300,000 | EUR | | 4,126,814 | |
| | Orange SA, 1.3750%, 1/16/30 | | 5,500,000 | EUR | | 6,562,469 | |
| | Orange SA, 3.2500%, 1/15/32 | | 2,900,000 | GBP | | 4,254,212 | |
| | RELX Finance BV, 1.5000%, 5/13/27 | | 500,000 | EUR | | 595,695 | |
| | Sirius XM Radio Inc, 5.3750%, 4/15/25 (144A) | | 2,315,000 | | | 2,392,043 | |
| | Sirius XM Radio Inc, 5.5000%, 7/1/29 (144A) | | 5,100,000 | | | 5,514,324 | |
| | Sky Ltd, 2.5000%, 9/15/26 | | 1,015,000 | EUR | | 1,295,078 | |
| | T-Mobile USA Inc, 6.0000%, 3/1/23 | | 2,100,000 | | | 2,137,800 | |
| | T-Mobile USA Inc, 6.5000%, 1/15/26 | | 2,320,000 | | | 2,487,527 | |
| | T-Mobile USA Inc, 4.5000%, 2/1/26 | | 596,000 | | | 610,900 | |
| | T-Mobile USA Inc, 4.7500%, 2/1/28 | | 933,000 | | | 977,607 | |
| | TWDC Enterprises 18 Corp, 2.7580%, 10/7/24 | | 7,402,000 | CAD | | 5,816,362 | |
| | TWDC Enterprises 18 Corp, 1.8500%, 7/30/26 | | 6,474,000 | | | 6,355,606 | |
| | Verizon Communications Inc, 3.5000%, 2/17/23 | | 2,120,000 | AUD | | 1,560,295 | |
| | Verizon Communications Inc, 4.5000%, 8/17/27 | | 12,840,000 | AUD | | 10,219,517 | |
| | Verizon Communications Inc, 4.0160%, 12/3/29 | | 3,420,000 | | | 3,820,125 | |
| | Verizon Communications Inc, 2.6500%, 5/6/30 | | 10,200,000 | AUD | | 6,985,989 | |
| | Virgin Media Secured Finance PLC, 6.2500%, 3/28/29 | | 2,746,800 | GBP | | 3,874,172 | |
| | Vodafone Group PLC, 3.2500%, 12/13/22 | | 3,600,000 | AUD | | 2,627,681 | |
| | Vodafone Group PLC, 4.3750%, 5/30/28 | | 3,000,000 | | | 3,322,068 | |
| | Walt Disney Co, 2.0000%, 9/1/29 | | 8,408,000 | | | 8,150,089 | |
| | | 183,595,292 | |
Consumer Cyclical – 11.8% | | | |
| | Amazon.com Inc, 3.1500%, 8/22/27 | | 17,248,000 | | | 18,237,199 | |
| | Booking Holdings Inc, 1.8000%, 3/3/27 | | 6,010,000 | EUR | | 7,317,661 | |
| | Compass Group PLC, 2.0000%, 7/3/29 | | 5,100,000 | GBP | | 7,061,892 | |
| | Co-operative Group Holdings 2011 Ltd, 6.8750%, 7/8/20Ç | | 2,509,000 | GBP | | 3,415,624 | |
| | Co-operative Group Holdings 2011 Ltd, 7.5000%, 7/8/26Ç | | 2,800,000 | GBP | | 4,236,169 | |
| | |
See Notes to Schedule of Investments and Other Information and Notes to Financial Statements. |
| |
Janus Investment Fund | 9 |
Janus Henderson Developed World Bond Fund
Schedule of Investments (unaudited)
December 31, 2019
| | | | | | | | |
Shares or
Principal Amounts | | | Value | |
Corporate Bonds – (continued) | | | |
Consumer Cyclical – (continued) | | | |
| | Co-Operative Group Ltd, 5.1250%, 5/17/24 | | 5,900,000 | GBP | | $8,360,144 | |
| | CPUK Finance Ltd, 4.2500%, 8/28/22 | | 1,700,000 | GBP | | 2,286,848 | |
| | CPUK Finance Ltd, 4.2500%, 8/28/22 (144A) | | 700,000 | GBP | | 941,643 | |
| | CPUK Finance Ltd, 4.8750%, 8/28/25 | | 6,300,000 | GBP | | 8,598,272 | |
| | CPUK Finance Ltd, 4.8750%, 8/28/25 (144A) | | 400,000 | GBP | | 545,922 | |
| | Experian Finance PLC, 4.2500%, 2/1/29 (144A) | | $5,270,000 | | | 5,791,625 | |
| | Experian Finance PLC, 2.7500%, 3/8/30 (144A) | | 6,163,000 | | | 6,062,436 | |
| | IHS Markit Ltd, 5.0000%, 11/1/22 (144A) | | 1,400,000 | | | 1,491,616 | |
| | Live Nation Entertainment Inc, 4.7500%, 10/15/27 (144A) | | 7,294,000 | | | 7,549,290 | |
| | Mastercard Inc, 2.1000%, 12/1/27 | | 11,960,000 | EUR | | 15,301,792 | |
| | McDonald's Corp, 3.1250%, 3/4/25 | | 10,380,000 | CAD | | 8,197,274 | |
| | McDonald's Corp, 3.4500%, 9/8/26 | | 9,200,000 | AUD | | 6,902,533 | |
| | McDonald's Corp, 2.6250%, 6/11/29 | | 3,900,000 | EUR | | 5,137,783 | |
| | McDonald's Corp, 1.6000%, 3/15/31 | | 3,000,000 | EUR | | 3,636,239 | |
| | Motion Bondco DAC, 4.5000%, 11/15/27 (144A) | | 750,000 | EUR | | 882,843 | |
| | Motion Bondco DAC, 6.6250%, 11/15/27 (144A)‡ | | 6,135,000 | | | 6,487,762 | |
| | Service Corp International/US, 4.6250%, 12/15/27 | | 6,882,000 | | | 7,174,485 | |
| | Service Corp International/US, 5.1250%, 6/1/29 | | 1,994,000 | | | 2,118,625 | |
| | Sodexo SA, 0.7500%, 4/14/27 | | 380,000 | EUR | | 440,271 | |
| | Sodexo SA, 1.7500%, 6/26/28 | | 6,400,000 | GBP | | 8,716,802 | |
| | Visa Inc, 3.1500%, 12/14/25 | | 7,580,000 | | | 8,005,373 | |
| | Visa Inc, 2.7500%, 9/15/27 | | 11,990,000 | | | 12,504,369 | |
| | Walmart Inc, 2.5500%, 4/8/26 | | 4,000,000 | EUR | | 5,187,487 | |
| | Walmart Inc, 3.7000%, 6/26/28 | | 6,620,000 | | | 7,294,264 | |
| | | 179,884,243 | |
Consumer Non-Cyclical – 19.1% | | | |
| | Abbott Ireland Financing DAC, 1.5000%, 9/27/26 | | 12,780,000 | EUR | | 15,504,411 | |
| | Abbott Laboratories, 2.9500%, 3/15/25 | | 4,570,000 | | | 4,752,499 | |
| | Anheuser-Busch InBev Finance Inc, 2.6000%, 5/15/24 | | 9,000,000 | CAD | | 6,931,123 | |
| | Anheuser-Busch InBev SA/NV, 2.7500%, 3/17/36 | | 3,706,000 | EUR | | 5,057,315 | |
| | Anheuser-Busch InBev Worldwide Inc, 4.1000%, 9/6/27 | | 2,840,000 | AUD | | 2,218,962 | |
| | Aramark Services Inc, 5.1250%, 1/15/24 | | 681,000 | | | 698,842 | |
| | Aramark Services Inc, 5.0000%, 4/1/25 (144A) | | 445,000 | | | 463,913 | |
| | Aramark Services Inc, 4.7500%, 6/1/26 | | 2,419,000 | | | 2,515,760 | |
| | Aramark Services Inc, 5.0000%, 2/1/28 (144A) | | 3,000,000 | | | 3,161,250 | |
| | Bacardi Ltd, 4.4500%, 5/15/25 (144A) | | 4,736,000 | | | 5,102,795 | |
| | Bacardi Ltd, 4.7000%, 5/15/28 (144A) | | 3,770,000 | | | 4,104,647 | |
| | Becton Dickinson and Co, 3.3630%, 6/6/24 | | 4,570,000 | | | 4,757,592 | |
| | Becton Dickinson and Co, 3.7000%, 6/6/27 | | 5,310,000 | | | 5,652,757 | |
| | Boston Scientific Corp, 3.4500%, 3/1/24 | | 5,730,000 | | | 5,990,855 | |
| | Boston Scientific Corp, 4.0000%, 3/1/29 | | 893,000 | | | 986,983 | |
| | Catalent Pharma Solutions Inc, 4.8750%, 1/15/26 (144A) | | 2,739,000 | | | 2,834,865 | |
| | Coca-Cola Co, 0.7500%, 3/9/23 | | 2,000,000 | EUR | | 2,293,928 | |
| | Coca-Cola Co, 3.2500%, 6/11/24 | | 4,990,000 | AUD | | 3,739,936 | |
| | Coca-Cola Co, 2.1250%, 9/6/29 | | 5,330,000 | | | 5,187,996 | |
| | Coca-Cola Co, 1.2500%, 3/8/31 | | 6,820,000 | EUR | | 8,192,980 | |
| | Coca-Cola Co, 1.6250%, 3/9/35 | | 1,610,000 | EUR | | 2,006,568 | |
| | Constellation Brands Inc, 4.7500%, 11/15/24 | | 1,605,000 | | | 1,777,757 | |
| | Constellation Brands Inc, 3.5000%, 5/9/27 | | 4,000,000 | | | 4,174,103 | |
| | Cott Holdings Inc, 5.5000%, 4/1/25 (144A) | | 1,336,000 | | | 1,396,120 | |
| | Danone SA, 1.2080%, 11/3/28 | | 1,300,000 | EUR | | 1,578,567 | |
| | DH Europe Finance II Sarl, 0.4500%, 3/18/28 | | 4,580,000 | EUR | | 5,074,010 | |
| | DH Europe Finance II Sarl, 2.6000%, 11/15/29 | | 1,378,000 | | | 1,370,887 | |
| | DH Europe Finance II Sarl, 0.7500%, 9/18/31 | | 4,140,000 | EUR | | 4,529,585 | |
| | Diageo Finance PLC, 1.7500%, 10/12/26 | | 6,600,000 | GBP | | 8,956,336 | |
| | Elanco Animal Health Inc, 4.9000%, 8/28/28 | | 2,670,000 | | | 2,901,968 | |
| | Estee Lauder Cos Inc, 3.1500%, 3/15/27 | | 4,430,000 | | | 4,688,994 | |
| | FBG Finance Pty Ltd, 3.2500%, 9/6/22 | | 2,330,000 | AUD | | 1,696,182 | |
| | FBG Finance Pty Ltd, 3.7500%, 9/6/24 | | 11,110,000 | AUD | | 8,408,480 | |
| | |
See Notes to Schedule of Investments and Other Information and Notes to Financial Statements. |
| |
10 | DECEMBER 31, 2019 |
Janus Henderson Developed World Bond Fund
Schedule of Investments (unaudited)
December 31, 2019
| | | | | | | | |
Shares or
Principal Amounts | | | Value | |
Corporate Bonds – (continued) | | | |
Consumer Non-Cyclical – (continued) | | | |
| | HCA Inc, 5.0000%, 3/15/24 | | $67,000 | | | $73,184 | |
| | HCA Inc, 5.2500%, 6/15/26 | | 2,390,000 | | | 2,675,133 | |
| | HCA Inc, 5.8750%, 2/1/29 | | 737,000 | | | 852,156 | |
| | HCA Inc, 4.1250%, 6/15/29 | | 9,349,000 | | | 9,906,479 | |
| | Heineken NV, 3.5000%, 1/29/28 (144A) | | 2,320,000 | | | 2,455,978 | |
| | Heineken NV, 1.5000%, 10/3/29 | | 3,800,000 | EUR | | 4,634,621 | |
| | Heineken NV, 2.0200%, 5/12/32 | | 2,800,000 | EUR | | 3,578,541 | |
| | IQVIA Inc, 5.0000%, 5/15/27 (144A) | | 4,000,000 | | | 4,231,420 | |
| | Johnson & Johnson, 2.4500%, 3/1/26 | | 2,460,000 | | | 2,498,307 | |
| | Keurig Dr Pepper Inc, 4.5970%, 5/25/28 | | 7,180,000 | | | 8,052,875 | |
| | Lamb Weston Holdings Inc, 4.8750%, 11/1/26 (144A) | | 4,060,000 | | | 4,303,600 | |
| | LVMH Moet Hennessy Louis Vuitton SE, 0.7500%, 5/26/24 | | 5,000,000 | EUR | | 5,790,254 | |
| | Mars Inc, 2.7000%, 4/1/25 (144A) | | 3,703,000 | | | 3,785,701 | |
| | Mars Inc, 3.2000%, 4/1/30 (144A) | | 10,045,000 | | | 10,623,679 | |
| | McCormick & Co Inc/MD, 3.1500%, 8/15/24 | | 3,780,000 | | | 3,922,007 | |
| | McCormick & Co Inc/MD, 3.4000%, 8/15/27 | | 1,762,000 | | | 1,835,603 | |
| | Nestle Finance International Ltd, 2.2500%, 11/30/23 | | 6,600,000 | GBP | | 9,201,470 | |
| | Novartis Finance SA, 1.3750%, 8/14/30 | | 4,480,000 | EUR | | 5,439,948 | |
| | Novartis Finance SA, 1.7000%, 8/14/38 | | 2,330,000 | EUR | | 2,938,503 | |
| | PepsiCo Inc, 2.1500%, 5/6/24 | | 7,800,000 | CAD | | 5,977,357 | |
| | PepsiCo Inc, 2.6250%, 7/29/29 | | 2,695,000 | | | 2,747,980 | |
| | PepsiCo Inc, 1.1250%, 3/18/31 | | 2,000,000 | EUR | | 2,376,890 | |
| | PepsiCo Inc, 3.3750%, 7/29/49 | | 4,090,000 | | | 4,275,304 | |
| | Procter & Gamble Co, 1.2000%, 10/30/28 | | 3,080,000 | EUR | | 3,732,204 | |
| | Stryker Corp, 1.0000%, 12/3/31 | | 5,280,000 | EUR | | 5,875,618 | |
| | Sysco Corp, 1.2500%, 6/23/23 | | 4,200,000 | EUR | | 4,862,970 | |
| | Sysco Corp, 3.5500%, 3/15/25 | | 3,088,000 | | | 3,285,246 | |
| | Tesco PLC, 6.1250%, 2/24/22 | | 1,550,000 | GBP | | 2,251,653 | |
| | Tesco PLC, 5.5000%, 1/13/33 | | 3,691,000 | GBP | | 6,085,951 | |
| | Tesco PLC, 6.1500%, 11/15/37 (144A) | | 8,080,000 | | | 9,431,003 | |
| | Unilever Capital Corp, 2.1250%, 9/6/29 | | 8,000,000 | | | 7,759,542 | |
| | Unilever PLC, 1.5000%, 7/22/26 | | 3,700,000 | GBP | | 4,939,142 | |
| | Wm Morrison Supermarkets PLC, 3.5000%, 7/27/26 | | 1,997,000 | GBP | | 2,909,147 | |
| | Zoetis Inc, 3.9000%, 8/20/28 | | 730,000 | | | 791,138 | |
| | | 292,809,570 | |
Government Sponsored – 1.7% | | | |
| | Deutsche Bahn Finance GMBH, 1.6250%, 8/16/33 | | 5,990,000 | EUR | | 7,536,645 | |
| | Kreditanstalt fuer Wiederaufbau, 3.2000%, 9/11/26 | | 10,000,000 | AUD | | 7,704,464 | |
| | Kreditanstalt fuer Wiederaufbau, 3.2000%, 3/15/28 | | 13,660,000 | AUD | | 10,644,097 | |
| | | 25,885,206 | |
Industrial – 0.3% | | | |
| | Cintas Corp No 2, 2.9000%, 4/1/22 | | 2,000,000 | | | 2,039,401 | |
| | Cintas Corp No 2, 3.7000%, 4/1/27 | | 2,000,000 | | | 2,167,408 | |
| | | 4,206,809 | |
Insurance – 0.8% | | | |
| | BUPA Finance PLC, | | | | | | |
| | UK Govt Bonds 5 Year Note Generic Bid Yield + 2.6000%, 6.1250%‡,µ | | 1,414,000 | GBP | | 1,928,880 | |
| | Phoenix Group Holdings PLC, 4.1250%, 7/20/22 | | 1,600,000 | GBP | | 2,217,729 | |
| | Phoenix Group Holdings PLC, 6.6250%, 12/18/25 | | 2,412,000 | GBP | | 3,716,849 | |
| | Scottish Widows Ltd, 5.5000%, 6/16/23 | | 2,500,000 | GBP | | 3,681,962 | |
| | Scottish Widows Ltd, 7.0000%, 6/16/43 | | 612,000 | GBP | | 1,113,259 | |
| | | 12,658,679 | |
Non-Agency Commercial Mortgage-Backed Securities – 0.1% | | | |
| | Nationwide Building Society, 10.2500%‡,µ | | 850,000 | GBP | | 1,870,876 | |
Owned No Guarantee – 0.3% | | | |
| | TenneT Holding BV, 1.7500%, 6/4/27 | | 3,000,000 | EUR | | 3,715,117 | |
Real Estate Investment Trusts (REITs) – 0.9% | | | |
| | CyrusOne LP / CyrusOne Finance Corp, 2.9000%, 11/15/24 | | 5,008,000 | | | 5,027,231 | |
| | Digital Realty Trust LP, 4.7500%, 10/1/25 | | 1,900,000 | | | 2,109,501 | |
| | |
See Notes to Schedule of Investments and Other Information and Notes to Financial Statements. |
| |
Janus Investment Fund | 11 |
Janus Henderson Developed World Bond Fund
Schedule of Investments (unaudited)
December 31, 2019
| | | | | | | | |
Shares or
Principal Amounts | | | Value | |
Corporate Bonds – (continued) | | | |
Real Estate Investment Trusts (REITs) – (continued) | | | |
| | Public Storage, 3.3850%, 5/1/29 | | $6,240,000 | | | $6,620,741 | |
| | | 13,757,473 | |
Supranational – 0.7% | | | |
| | European Investment Bank, 2.7000%, 1/12/23 | | 10,000,000 | AUD | | 7,308,026 | |
| | European Investment Bank, 3.1000%, 8/17/26 | | 4,520,000 | AUD | | 3,461,439 | |
| | | 10,769,465 | |
Technology – 10.4% | | | |
| | Adobe Inc, 3.2500%, 2/1/25 | | 8,429,000 | | | 8,896,600 | |
| | Alphabet Inc, 1.9980%, 8/15/26 | | 28,696,000 | | | 28,522,044 | |
| | Amadeus IT Group SA, 1.5000%, 9/18/26 | | 6,100,000 | EUR | | 7,334,770 | |
| | Apple Inc, 3.7000%, 8/28/22 | | 20,060,000 | AUD | | 14,883,394 | |
| | Apple Inc, 1.3750%, 5/24/29 | | 4,480,000 | EUR | | 5,489,701 | |
| | Dell International LLC / EMC Corp, 5.4500%, 6/15/23 (144A) | | 14,135,000 | | | 15,323,170 | |
| | Equinix Inc, 2.8750%, 10/1/25 | | 2,100,000 | EUR | | 2,428,565 | |
| | Equinix Inc, 2.8750%, 2/1/26 | | 2,200,000 | EUR | | 2,560,062 | |
| | Equinix Inc, 3.2000%, 11/18/29 | | 9,789,000 | | | 9,825,415 | |
| | Fidelity National Information Services Inc, 3.0000%, 8/15/26 | | 5,140,000 | | | 5,313,392 | |
| | Fiserv Inc, 2.7500%, 7/1/24 | | 4,540,000 | | | 4,616,685 | |
| | Fiserv Inc, 3.5000%, 7/1/29 | | 4,520,000 | | | 4,744,189 | |
| | Fiserv Inc, 1.6250%, 7/1/30 | | 3,470,000 | EUR | | 4,063,726 | |
| | Microsoft Corp, 3.3000%, 2/6/27 | | 14,980,000 | | | 15,999,077 | |
| | Microsoft Corp, 3.1250%, 12/6/28 | | 8,000,000 | EUR | | 11,268,967 | |
| | Microsoft Corp, 3.4500%, 8/8/36 | | 1,325,000 | | | 1,448,553 | |
| | salesforce.com Inc, 3.7000%, 4/11/28 | | 14,072,000 | | | 15,418,914 | |
| | VMware Inc, 3.9000%, 8/21/27 | | 1,135,000 | | | 1,186,788 | |
| | | 159,324,012 | |
Total Corporate Bonds (cost $979,734,046) | | 1,005,341,623 | |
Foreign Government Bonds – 23.4% | | | |
| | Australia Government Bond, 2.0000%, 12/21/21 | | 49,600,000 | AUD | | 35,525,104 | |
| | Australia Government Bond, 2.2500%, 11/21/22 | | 19,400,000 | AUD | | 14,125,845 | |
| | Australia Government Bond, 2.7500%, 4/21/24 | | 29,129,000 | AUD | | 21,942,571 | |
| | Australia Government Bond, 3.2500%, 4/21/29 | | 27,000,000 | AUD | | 22,046,047 | |
| | Canadian Government Bond, 0.5000%, 3/1/22 | | 13,250,000 | CAD | | 9,947,909 | |
| | Canadian Government Bond, 1.7500%, 3/1/23 | | 52,500,000 | CAD | | 40,516,463 | |
| | European Investment Bank, 3.2500%, 1/29/24 | | 17,000,000 | | | 17,998,083 | |
| | New Zealand Government Bond, 2.7500%, 4/15/25 | | 66,000,000 | NZD | | 47,362,156 | |
| | Sweden Government Bond, 0.7500%, 5/12/28 | | 322,000,000 | SEK | | 36,440,658 | |
| | Sweden Government Bond, 3.5000%, 3/30/39 | | 65,000,000 | SEK | | 10,688,628 | |
| | United Kingdom Gilt, 4.0000%, 3/7/22 | | 40,000,000 | GBP | | 56,929,897 | |
| | United Kingdom Gilt, 0.5000%, 7/22/22 | | 33,000,000 | GBP | | 43,664,678 | |
Total Foreign Government Bonds (cost $350,866,785) | | 357,188,039 | |
United States Treasury Notes/Bonds – 4.5% | | | |
| | 2.0000%, 1/31/20 | | 10,000,000 | | | 10,002,645 | |
| | 2.6250%, 8/31/20 | | 35,000,000 | | | 35,223,519 | |
| | 2.7500%, 11/15/23 | | 23,000,000 | | | 23,920,547 | |
Total United States Treasury Notes/Bonds (cost $67,935,224) | | 69,146,711 | |
Investment Companies – 5.5% | | | |
Money Markets – 5.5% | | | |
| | Fidelity Investments Money Market Treasury Portfolio, 1.2500%ºº (cost $83,505,093) | | 83,505,093 | | | 83,505,093 | |
Total Investments (total cost $1,496,485,590) – 100.0% | | 1,529,518,949 | |
Cash, Receivables and Other Assets, net of Liabilities – 0% | | 593,651 | |
Net Assets – 100% | | $1,530,112,600 | |
| | |
See Notes to Schedule of Investments and Other Information and Notes to Financial Statements. |
| |
12 | DECEMBER 31, 2019 |
Janus Henderson Developed World Bond Fund
Schedule of Investments (unaudited)
December 31, 2019
| | | | | | |
Summary of Investments by Country - (Long Positions) (unaudited) |
| |
| | | | | % of | |
| | | | | Investment | |
Country | | Value | | Securities | |
United States | | $795,784,219 | | 52.0 | % |
United Kingdom | | 269,743,914 | | 17.6 | |
Australia | | 93,639,567 | | 6.1 | |
Canada | | 54,620,709 | | 3.6 | |
France | | 48,546,994 | | 3.2 | |
New Zealand | | 47,362,156 | | 3.1 | |
Sweden | | 47,129,286 | | 3.1 | |
Germany | | 42,962,722 | | 2.8 | |
Luxembourg | | 28,767,548 | | 1.9 | |
Switzerland | | 25,548,407 | | 1.7 | |
Belgium | | 24,312,062 | | 1.6 | |
Ireland | | 20,174,896 | | 1.3 | |
Netherlands | | 14,384,257 | | 0.9 | |
Bermuda | | 9,207,442 | | 0.6 | |
Spain | | 7,334,770 | | 0.5 | |
| | | | | | |
| | | | | | |
Total | | $1,529,518,949 | | 100.0 | % |
| | | | | | | |
Schedule of Forward Foreign Currency Exchange Contracts, Open | | | | | | |
| | | | | | | | | |
Counterparty/ Foreign Currency | Settlement Date | Foreign Currency Amount (Sold)/ Purchased | | USD Currency Amount (Sold)/ Purchased | | Market Value and Unrealized Appreciation/ (Depreciation) | |
BNP Paribas: | | | | | | | |
Australian Dollar | 1/29/20 | 8,709,366 | $ | (5,965,769) | $ | 149,000 | |
Australian Dollar | 1/29/20 | (326,541,707) | | 223,873,806 | | (5,388,244) | |
British Pound | 1/29/20 | 19,722,179 | | (26,035,892) | | 104,055 | |
British Pound | 1/29/20 | (185,107,497) | | 243,150,288 | | (2,192,790) | |
Canadian Dollar | 1/29/20 | (98,078,376) | | 74,486,888 | | (1,065,035) | |
Euro | 1/29/20 | 1,166,643 | | (1,299,589) | | 11,216 | |
Euro | 1/29/20 | (211,478,894) | | 235,759,045 | | (1,852,353) | |
New Zealand Dollar | 1/29/20 | (71,305,682) | | 47,026,335 | | (982,323) | |
Swedish Krona | 1/29/20 | (436,530,794) | | 46,215,572 | | (473,926) | |
| | | | | | | | |
| | | | | | | (11,690,400) | |
JPMorgan Chase Bank, National Association: | | | | | | | |
Australian Dollar | 1/17/20 | (16,718,410) | | 11,496,821 | | (237,249) | |
Japanese Yen | 1/17/20 | 1,260,593,685 | | (11,680,306) | | (68,241) | |
| | | | | | | | |
| | | | | | | (305,490) | |
Total | | | | | $ | (11,995,890) | |
| | |
See Notes to Schedule of Investments and Other Information and Notes to Financial Statements. |
| |
Janus Investment Fund | 13 |
Janus Henderson Developed World Bond Fund
Schedule of Investments (unaudited)
December 31, 2019
Schedule of Futures
| | | | | | | | | | | | | | |
Description | | Number of Contracts | | Expiration Date | | Value and Notional Amount | | Unrealized Appreciation/ (Depreciation) | | Variation Margin Asset/(Liability) | |
Futures Sold: | | | | | | | | | | | |
10-Year US Treasury Note | | 766 | | 3/20/20 | $ | (98,371,156) | $ | 484,734 | $ | (23,938) | |
Euro-Bund | | 347 | | 3/6/20 | | (66,354,147) | | 671,075 | | 377,535 | |
Total | | | | | | | $ | 1,155,809 | $ | 353,597 | |
| | | | | | | | | | |
Schedule of OTC Credit Default Swaps - Buy Protection |
Counterparty/ Reference Asset | Maturity Date | Notional Amount | | | Premiums Paid/(Received) | | Unrealized Appreciation/ (Depreciation) | | Swap Contracts, at Value Asset/(Liability) |
Barclays Capital, Inc.:
| | | | | | | | | | |
Renault SA, Fixed Rate 1.00%, Paid quarterly | 12/20/21 | 3,000,000 | EUR | $ | 10,704 | $ | (52,751) | $ | (42,047) |
Citibank, National Association:
| | | | | | | | | | |
Arrow Electronics Inc, Fixed Rate 1.00%, Paid quarterly | 12/20/23 | 8,100,000 | USD | | (7,354) | | (171,764) | | (179,118) |
Avenet Inc, Fixed Rate 1.00%, Paid quarterly | 12/20/23 | 4,050,000 | USD | | - | | (67,431) | | (67,431) |
Commonwealth Bank of Australia, Fixed Rate 1.00%, Paid quarterly | 6/20/23 | 2,205,000 | USD | | (25,915) | | (39,281) | | (65,196) |
Commonwealth Bank of Australia, Fixed Rate 1.00%, Paid quarterly | 6/20/23 | 2,205,000 | USD | | (28,624) | | (36,572) | | (65,196) |
National Australia Bank, Fixed Rate 1.00%, Paid quarterly | 6/20/23 | 4,410,000 | USD | | (53,845) | | (68,516) | | (122,361) |
Westpac Banking Corp, Fixed Rate 1.00%, Paid quarterly | 6/20/23 | 2,205,000 | USD | | (26,922) | | (31,789) | | (58,711) |
Westpac Banking Corp, Fixed Rate 1.00%, Paid quarterly | 6/20/23 | 2,205,000 | USD | | (29,127) | | (29,584) | | (58,711) |
| | | | | | (171,787) | | (444,937) | | (616,724) |
JPMorgan Chase & Co.:
| | | | | | | | | | |
Host Hotels & Resorts LP, Fixed Rate 1.00%, Paid quarterly | 12/20/20 | 1,250,000 | USD | | 20,186 | | (32,037) | | (11,851) |
Host Hotels & Resorts LP, Fixed Rate 1.00%, Paid quarterly | 12/20/20 | 1,250,000 | USD | | 20,186 | | (32,037) | | (11,851) |
| | | | | | 40,372 | | (64,074) | | (23,702) |
Total | | | | $ | (120,711) | $ | (561,762) | $ | (682,473) |
| | |
See Notes to Schedule of Investments and Other Information and Notes to Financial Statements. |
| |
14 | DECEMBER 31, 2019 |
Janus Henderson Developed World Bond Fund
Schedule of Investments (unaudited)
December 31, 2019
The following table, grouped by derivative type, provides information about the fair value and location of derivatives within the Statement of Assets and Liabilities as of December 31, 2019.
| | | | | | | | | | | | |
Fair Value of Derivative Instruments (not accounted for as hedging instruments) as of December 31, 2019 |
| | | | | | | | | | | | |
| | | | | Credit
Contracts | | Currency
Contracts | | Interest Rate
Contracts | | Total |
Asset Derivatives: | | | | | | | | | |
Forward foreign currency exchange contracts | | | $ - | | $ 264,271 | | $ - | | $ 264,271 |
Variation margin receivable | | | - | | - | | 377,535 | | 377,535 |
| | | | | | | | | | |
Total Asset Derivatives | | | $ - | | $ 264,271 | | $ 377,535 | | $ 641,806 |
| | | | | | | | | |
Liability Derivatives: | | | | | | | | | |
Forward foreign currency exchange contracts | | | $ - | | $12,260,161 | | $ - | | $12,260,161 |
Outstanding swap contracts, at value | | | 682,473 | | - | | - | | 682,473 |
Variation margin payable | | | - | | - | | 23,938 | | 23,938 |
| | | | | | | | | | |
Total Liability Derivatives | | | $682,473 | | $12,260,161 | | $ 23,938 | | $12,966,572 |
The following tables provide information about the effect of derivatives and hedging activities on the Fund’s Statement of Operations for the period ended December 31, 2019.
| | | | | | | | | | | |
The effect of Derivative Instruments (not accounted for as hedging instruments) on the Statement of Operations for the period ended December 31, 2019 |
| | | | | | | | | | | |
Amount of Realized Gain/(Loss) Recognized on Derivatives |
Derivative | | Credit
Contracts | | Currency
Contracts | | Interest Rate
Contracts | | Total |
Futures contracts | | $ - | | $ - | | $ 2,536,265 | | $ 2,536,265 |
Forward foreign currency exchange contracts | | - | | (7,153,248) | | - | | (7,153,248) |
Swap contracts | | (158,687) | | - | | - | | (158,687) |
| | | | | | | | | | | |
Total | | $(158,687) | | $(7,153,248) | | $ 2,536,265 | | $(4,775,670) |
| | | | | | | | | | | |
| | | | | | | | | | | |
Amount of Change in Unrealized Appreciation/Depreciation Recognized on Derivatives |
Derivative | | Credit
Contracts | | Currency
Contracts | | Interest Rate
Contracts | | Total |
Futures contracts | | $ - | | $ - | | $ 257,315 | | $ 257,315 |
Forward foreign currency exchange contracts | | - | | (647,459) | | - | | (647,459) |
Swap contracts | | (97,540) | | - | | - | | (97,540) |
| | | | | | | | | | | |
Total | | $ (97,540) | | $ (647,459) | | $ 257,315 | | $ (487,684) |
Please see the "Net Realized Gain/(Loss) on Investments" and "Change in Unrealized Net Appreciation/Depreciation" sections of the Fund’s Statement of Operations.
| | |
See Notes to Schedule of Investments and Other Information and Notes to Financial Statements. |
| |
Janus Investment Fund | 15 |
Janus Henderson Developed World Bond Fund
Schedule of Investments (unaudited)
December 31, 2019
| | |
Average Ending Monthly Market Value of Derivative Instruments During the Period Ended December 31, 2019 |
| | |
| Market Value(a) |
Credit default swaps, buy protection | $ (625,550) |
Forward foreign currency exchange contracts, purchased | 37,909,806 |
Forward foreign currency exchange contracts, sold | 825,390,496 |
Futures contracts, purchased | 146,823,884 |
Futures contracts, sold | 40,285,622 |
| | |
(a) Forward foreign currency exchange contracts are reported as the average ending monthly currency amount purchased or sold. |
| | |
See Notes to Schedule of Investments and Other Information and Notes to Financial Statements. |
| |
16 | DECEMBER 31, 2019 |
Janus Henderson Developed World Bond Fund
Notes to Schedule of Investments and Other Information (unaudited)
| | |
Bloomberg Barclays Global Aggregate Credit Index (USD Hedged) | Bloomberg Barclays Global Aggregate Credit Index (USD Hedged) measures the credit sector of the global investment grade fixed-rate bond market, including corporate, government and agency securities. |
| | |
ICE | Intercontinental Exchange |
LIBOR | London Interbank Offered Rate |
LLC | Limited Liability Company |
LP | Limited Partnership |
PLC | Public Limited Company |
| | |
144A | Securities sold under Rule 144A of the Securities Act of 1933, as amended, are subject to legal and/or contractual restrictions on resale and may not be publicly sold without registration under the 1933 Act. Unless otherwise noted, these securities have been determined to be liquid under guidelines established by the Board of Trustees. The total value of 144A securities as of the period ended December 31, 2019 is $145,368,821, which represents 9.5% of net assets. |
| | |
ƒ | All or a portion of this position is not funded, or has been purchased on a delayed delivery or when-issued basis. If applicable, interest rates will be determined and interest will begin to accrue at a future date. See Notes to Financial Statements. |
| | |
‡ | Variable or floating rate security. Rate shown is the current rate as of December 31, 2019. Certain variable rate securities are not based on a published reference rate and spread; they are determined by the issuer or agent and current market conditions. Reference rate is as of reset date and may vary by security, which may not indicate a reference rate and/or spread in their description. |
| | |
ºº | Rate shown is the 7-day yield as of December 31, 2019. |
| | |
µ | Perpetual security. Perpetual securities have no stated maturity date, but they may be called/redeemed by the issuer. The date indicated, if any, represents the next call date. |
| | |
Ç | Step bond. The coupon rate will increase or decrease periodically based upon a predetermined schedule. The rate shown reflects the current rate. |
Janus Henderson Developed World Bond Fund
Notes to Schedule of Investments and Other Information (unaudited)
| | | | | | | | | | | | | | |
The following is a summary of the inputs that were used to value the Fund’s investments in securities and other financial instruments as of December 31, 2019. See Notes to Financial Statements for more information. |
| |
Valuation Inputs Summary |
| | | | | | | |
| | | | | Level 2 - | | Level 3 - |
| | | Level 1 - | | Other Significant | | Significant |
| | | Quoted Prices | | Observable Inputs | | Unobservable Inputs |
| | | | | | | |
Assets | | | | | | |
Investments In Securities: | | | | | | |
Asset-Backed/Commercial Mortgage-Backed Securities | $ | - | $ | 4,964,754 | $ | - |
Bank Loans and Mezzanine Loans | | - | | 9,372,729 | | - |
Corporate Bonds | | - | | 1,005,341,623 | | - |
Foreign Government Bonds | | - | | 357,188,039 | | - |
United States Treasury Notes/Bonds | | - | | 69,146,711 | | - |
Investment Companies | | 83,505,093 | | - | | - |
Total Investments in Securities | $ | 83,505,093 | $ | 1,446,013,856 | $ | - |
Other Financial Instruments(a): | | | | | | |
Forward Foreign Currency Exchange Contracts | | - | | 264,271 | | - |
Variation Margin Receivable | | 377,535 | | - | | - |
Total Assets | $ | 83,882,628 | $ | 1,446,278,127 | $ | - |
Liabilities | | | | | | |
Other Financial Instruments(a): | | | | | | |
Forward Foreign Currency Exchange Contracts | $ | - | $ | 12,260,161 | $ | - |
Outstanding Swap Contracts, at Value | | - | | 682,473 | | - |
Variation Margin Payable | | 23,938 | | - | | - |
Total Liabilities | $ | 23,938 | $ | 12,942,634 | $ | - |
| | | | | | | |
(a) | Other financial instruments include forward foreign currency exchange, futures, written options, written swaptions, and swap contracts. Forward foreign currency exchange contracts are reported at their unrealized appreciation/(depreciation) at measurement date, which represents the change in the contract's value from trade date. Futures, certain written options on futures, and centrally cleared swap contracts are reported at their variation margin at measurement date, which represents the amount due to/from the Fund at that date. Written options, written swaptions, and other swap contracts are reported at their market value at measurement date. |
Janus Henderson Developed World Bond Fund
Statement of Assets and Liabilities (unaudited)
December 31, 2019
| |
See footnotes at the end of the Statement. |
| | | | | | | |
| | | | | | |
Assets: | | | | |
| | Investments, at value(1) | | $ | 1,529,518,949 | |
| | Deposits with brokers for futures | | | 1,790,974 | |
| | Deposits with brokers for OTC derivatives | | | 880,000 | |
| | Forward foreign currency exchange contracts | | | 264,271 | |
| | Variation margin receivable | | | 377,535 | |
| | Non-interested Trustees' deferred compensation | | | 39,242 | |
| | Receivables: | | | | |
| | | Interest | | | 11,625,076 | |
| | | Fund shares sold | | | 5,348,533 | |
| | | Foreign tax reclaims | | | 880 | |
| | Other assets | | | 378,502 | |
Total Assets | | | 1,550,223,962 | |
Liabilities: | | | | |
| | Due to custodian | | | 5,386 | |
| | Foreign cash due to custodian | | | 8,837 | |
| | Forward foreign currency exchange contracts | | | 12,260,161 | |
| | Outstanding swap contracts, at value(2) | | | 682,473 | |
| | Variation margin payable | �� | | 23,938 | |
| | Payables: | | | — | |
| | | Investments purchased | | | 3,143,466 | |
| | | Fund shares repurchased | | | 2,713,219 | |
| | | Advisory fees | | | 702,562 | |
| | | Transfer agent fees and expenses | | | 210,676 | |
| | | Dividends | | | 135,754 | |
| | | 12b-1 Distribution and shareholder servicing fees | | | 46,364 | |
| | | Non-interested Trustees' deferred compensation fees | | | 39,242 | |
| | | Professional fees | | | 30,973 | |
| | | Custodian fees | | | 27,524 | |
| | | Affiliated fund administration fees payable | | | 3,298 | |
| | | Non-interested Trustees' fees and expenses | | | 605 | |
| | | Accrued expenses and other payables | | | 76,884 | |
Total Liabilities | | | 20,111,362 | |
Net Assets | | $ | 1,530,112,600 | |
| | |
See Notes to Financial Statements. |
| |
Janus Investment Fund | 19 |
Janus Henderson Developed World Bond Fund
Statement of Assets and Liabilities (unaudited)
December 31, 2019
| | | | | | | |
| | | | | | |
| | | | | | | |
Net Assets Consist of: | | | | |
| | Capital (par value and paid-in surplus) | | $ | 1,516,052,775 | |
| | Total distributable earnings (loss) | | | 14,059,825 | |
Total Net Assets | | $ | 1,530,112,600 | |
Net Assets - Class A Shares | | $ | 61,176,349 | |
| | Shares Outstanding, $0.01 Par Value (unlimited shares authorized) | | | 6,350,027 | |
Net Asset Value Per Share(3) | | $ | 9.63 | |
Maximum Offering Price Per Share(4) | | $ | 10.11 | |
Net Assets - Class C Shares | | $ | 37,606,319 | |
| | Shares Outstanding, $0.01 Par Value (unlimited shares authorized) | | | 3,932,636 | |
Net Asset Value Per Share(3) | | $ | 9.56 | |
Net Assets - Class D Shares | | $ | 20,780,277 | |
| | Shares Outstanding, $0.01 Par Value (unlimited shares authorized) | | | 2,155,704 | |
Net Asset Value Per Share | | $ | 9.64 | |
Net Assets - Class I Shares | | $ | 1,262,798,999 | |
| | Shares Outstanding, $0.01 Par Value (unlimited shares authorized) | | | 131,472,932 | |
Net Asset Value Per Share | | $ | 9.61 | |
Net Assets - Class N Shares | | $ | 17,818,649 | |
| | Shares Outstanding, $0.01 Par Value (unlimited shares authorized) | | | 1,853,377 | |
Net Asset Value Per Share | | $ | 9.61 | |
Net Assets - Class S Shares | | $ | 219,835 | |
| | Shares Outstanding, $0.01 Par Value (unlimited shares authorized) | | | 22,841 | |
Net Asset Value Per Share | | $ | 9.62 | |
Net Assets - Class T Shares | | $ | 129,712,172 | |
| | Shares Outstanding, $0.01 Par Value (unlimited shares authorized) | | | 13,472,261 | |
Net Asset Value Per Share | | $ | 9.63 | |
| |
(1) Includes cost of $1,496,485,590. (2) Net premiums received $120,711. (3) Redemption price per share may be reduced for any applicable contingent deferred sales charge. (4) Maximum offering price is computed at 100/95.25 of net asset value. |
| | |
See Notes to Financial Statements. |
| |
20 | DECEMBER 31, 2019 |
Janus Henderson Developed World Bond Fund
Statement of Operations (unaudited)
For the period ended December 31, 2019
| | | | | | |
| | | | | |
Investment Income: | | | |
| Interest | $ | 17,369,675 | |
| | Other income | | 36,287 | |
Total Investment Income | | 17,405,962 | |
Expenses: | | | |
| | Advisory fees | | 3,675,806 | |
| | 12b-1 Distribution and shareholder servicing fees: | | | |
| | | Class A Shares | | 76,192 | |
| | | Class C Shares | | 182,721 | |
| | | Class S Shares | | 163 | |
| | Transfer agent administrative fees and expenses: | | | |
| | | Class D Shares | | 11,814 | |
| | | Class S Shares | | 231 | |
| | | Class T Shares | | 119,122 | |
| | Transfer agent networking and omnibus fees: | | | |
| | | Class A Shares | | 23,936 | |
| | | Class C Shares | | 12,135 | |
| | | Class I Shares | | 482,875 | |
| | Other transfer agent fees and expenses: | | | |
| | | Class A Shares | | 2,197 | |
| | | Class C Shares | | 1,268 | |
| | | Class D Shares | | 1,429 | |
| | | Class I Shares | | 23,294 | |
| | | Class N Shares | | 183 | |
| | | Class S Shares | | 6 | |
| | | Class T Shares | | 517 | |
| | Registration fees | | 67,541 | |
| | Custodian fees | | 50,245 | |
| | Shareholder reports expense | | 43,958 | |
| | Professional fees | | 31,693 | |
| | Non-interested Trustees’ fees and expenses | | 18,868 | |
| | Affiliated fund administration fees | | 17,118 | |
| | Other expenses | | 72,638 | |
Total Expenses | | 4,915,950 | |
Less: Excess Expense Reimbursement and Waivers | | (5,482) | |
Net Expenses | | 4,910,468 | |
Net Investment Income/(Loss) | | 12,495,494 | |
| | | | | | |
| | |
See Notes to Financial Statements. |
| |
Janus Investment Fund | 21 |
Janus Henderson Developed World Bond Fund
Statement of Operations (unaudited)
For the period ended December 31, 2019
| | | | | | |
| | | | | |
Net Realized Gain/(Loss) on Investments: | | | |
| | Investments and foreign currency transactions | $ | 12,285,847 | |
| | Forward foreign currency exchange contracts | | (7,153,248) | |
| | Futures contracts | | 2,536,265 | |
| | Swap contracts | | (158,687) | |
Total Net Realized Gain/(Loss) on Investments | | 7,510,177 | |
Change in Unrealized Net Appreciation/Depreciation: | | | |
| | Investments, foreign currency translations and non-interested Trustees’ deferred compensation | | 5,519,384 | |
| | Forward foreign currency exchange contracts | | (647,459) | |
| | Futures contracts | | 257,315 | |
| | Swap contracts | | (97,540) | |
Total Change in Unrealized Net Appreciation/Depreciation | | 5,031,700 | |
Net Increase/(Decrease) in Net Assets Resulting from Operations | $ | 25,037,371 | |
| | | | | | |
| | |
See Notes to Financial Statements. |
| |
22 | DECEMBER 31, 2019 |
Janus Henderson Developed World Bond Fund
Statements of Changes in Net Assets
| | | | | | | | | |
| | | | | | | | | |
| | | Period ended
December 31, 2019 (unaudited) | | Year ended
June 30, 2019 | |
| | | | | | | | | |
Operations: | | | | | | |
| | Net investment income/(loss) | $ | 12,495,494 | | $ | 18,923,584 | |
| | Net realized gain/(loss) on investments | | 7,510,177 | | | 25,276,893 | |
| | Change in unrealized net appreciation/depreciation | | 5,031,700 | | | 34,865,553 | |
Net Increase/(Decrease) in Net Assets Resulting from Operations | | 25,037,371 | | | 79,066,030 | |
Dividends and Distributions to Shareholders | | | | | | |
| | | Class A Shares | | (1,588,749) | | | (1,973,457) | |
| | | Class C Shares | | (851,471) | | | (1,372,098) | |
| | | Class D Shares | | (556,210) | | | (432,828) | |
| | | Class I Shares | | (33,303,325) | | | (33,555,493) | |
| | | Class N Shares | | (454,553) | | | (249,474) | |
| | | Class S Shares | | (5,437) | | | (6,438) | |
| | | Class T Shares | | (3,211,842) | | | (2,015,076) | |
Net Decrease from Dividends and Distributions to Shareholders | | (39,971,587) | | | (39,604,864) | |
Capital Share Transactions: | | | | | | |
| | | Class A Shares | | 10,217,090 | | | 9,037,750 | |
| | | Class C Shares | | 720,037 | | | (4,156,963) | |
| | | Class D Shares | | 4,920,673 | | | 6,636,916 | |
| | | Class I Shares | | 326,004,995 | | | 256,127,011 | |
| | | Class N Shares | | 12,352,742 | | | 1,398,559 | |
| | | Class S Shares | | 64,328 | | | 31,444 | |
| | | Class T Shares | | 60,962,075 | | | 38,211,023 | |
Net Increase/(Decrease) from Capital Share Transactions | | 415,241,940 | | | 307,285,740 | |
Net Increase/(Decrease) in Net Assets | | 400,307,724 | | | 346,746,906 | |
Net Assets: | | | | | | |
| | Beginning of period | | 1,129,804,876 | | | 783,057,970 | |
| End of period | $ | 1,530,112,600 | | $ | 1,129,804,876 | |
| | | | | | | | | |
| | |
See Notes to Financial Statements. |
| |
Janus Investment Fund | 23 |
Janus Henderson Developed World Bond Fund
Financial Highlights
| | | | | | | | | | | | | | | | |
Class A Shares | | | | | | | | | | | | |
For a share outstanding during the period end December 31, 2019 (unaudited) and the year or period ended June 30 | 2019 | | | 2019 | | | 2018 | | | 2017(1) | |
| | Net Asset Value, Beginning of Period | | $9.69 | | | $9.35 | | | $9.46 | | | $9.34 | |
| | Income/(Loss) from Investment Operations: | | | | | | | | | | | | |
| | | Net investment income/(loss)(2) | | 0.08 | | | 0.18 | | | 0.21 | | | 0.26 | |
| | | Net realized and unrealized gain/(loss) | | 0.12 | | | 0.58 | | | (0.12) | | | 0.11 | |
| | Total from Investment Operations | | 0.20 | | | 0.76 | | | 0.09 | | | 0.37 | |
| | Less Dividends and Distributions: | | | | | | | | | | | | |
| | | Dividends (from net investment income) | | (0.23) | | | (0.42) | | | (0.20) | | | (0.12) | |
| | | Distributions (from capital gains) | | (0.03) | | | — | | | — | | | — | |
| | | Return of capital | | — | | | — | | | — | | | (0.13) | |
| | Total Dividends and Distributions | | (0.26) | | | (0.42) | | | (0.20) | | | (0.25) | |
| | Net Asset Value, End of Period | | $9.63 | | | $9.69 | | | $9.35 | | | $9.46 | |
| | Total Return* | | 2.00% | | | 8.48% | | | 0.99% | | | 3.99% | |
| | Net Assets, End of Period (in thousands) | | $61,176 | | | $51,463 | | | $40,600 | | | $43,047 | |
| | Average Net Assets for the Period (in thousands) | | $60,290 | | | $43,495 | | | $43,700 | | | $60,131 | |
| | Ratios to Average Net Assets**: | | | | | | | | | | | | |
| | | Ratio of Gross Expenses | | 0.92% | | | 0.99% | | | 0.98% | | | 1.01% | |
| | | Ratio of Net Expenses (After Waivers and Expense Offsets) | | 0.92% | | | 0.99% | | | 0.98% | | | 1.01% | |
| | | Ratio of Net Investment Income/(Loss) | | 1.63% | | | 1.98% | | | 2.23% | | | 2.99% | |
| | Portfolio Turnover Rate | | 30% | | | 42% | | | 125% | | | 112% | |
| | | | | | | | | | | | | | | | |
| | | | | | | | | | | | | | | | |
Class C Shares | | | | | | | | | | | | |
For a share outstanding during the period end December 31, 2019 (unaudited) and the year or period ended June 30 | 2019 | | | 2019 | | | 2018 | | | 2017(1) | |
| | Net Asset Value, Beginning of Period | | $9.63 | | | $9.30 | | | $9.41 | | | $9.29 | |
| | Income/(Loss) from Investment Operations: | | | | | | | | | | | | |
| | | Net investment income/(loss)(2) | | 0.05 | | | 0.12 | | | 0.14 | | | 0.19 | |
| | | Net realized and unrealized gain/(loss) | | 0.10 | | | 0.57 | | | (0.12) | | | 0.11 | |
| | Total from Investment Operations | | 0.15 | | | 0.69 | | | 0.02 | | | 0.30 | |
| | Less Dividends and Distributions: | | | | | | | | | | | | |
| | | Dividends (from net investment income) | | (0.19) | | | (0.36) | | | (0.13) | | | (0.08) | |
| | | Distributions (from capital gains) | | (0.03) | | | — | | | — | | | — | |
| | | Return of capital | | — | | | — | | | — | | | (0.10) | |
| | Total Dividends and Distributions | | (0.22) | | | (0.36) | | | (0.13) | | | (0.18) | |
| | Net Asset Value, End of Period | | $9.56 | | | $9.63 | | | $9.30 | | | $9.41 | |
| | Total Return* | | 1.56% | | | 7.67% | | | 0.25% | | | 3.31% | |
| | Net Assets, End of Period (in thousands) | | $37,606 | | | $37,165 | | | $40,085 | | | $39,923 | |
| | Average Net Assets for the Period (in thousands) | | $37,404 | | | $36,574 | | | $39,996 | | | $46,079 | |
| | Ratios to Average Net Assets**: | | | | | | | | | | | | |
| | | Ratio of Gross Expenses | | 1.63% | | | 1.72% | | | 1.72% | | | 1.77% | |
| | | Ratio of Net Expenses (After Waivers and Expense Offsets) | | 1.63% | | | 1.72% | | | 1.72% | | | 1.77% | |
| | | Ratio of Net Investment Income/(Loss) | | 0.92% | | | 1.27% | | | 1.48% | | | 2.22% | |
| | Portfolio Turnover Rate | | 30% | | | 42% | | | 125% | | | 112% | |
| | | | | | | | | | | | | | | | |
| |
* Total return includes adjustments in accordance with generally accepted accounting principles required at the year or period end and are not annualized for periods of less than one full year. ** Annualized for periods of less than one full year. (1) Period from August 1, 2016 through June 30, 2017. The Fund changed its fiscal year end from July 31 to June 30. (2) Per share amounts are calculated based on average shares outstanding during the year or period. |
| | |
See Notes to Financial Statements. |
| |
24 | DECEMBER 31, 2019 |
Janus Henderson Developed World Bond Fund
Financial Highlights
| | | | | | | | | | | | | |
Class A Shares | | | | | | | | | |
For a share outstanding during the year or period ended July 31 | | 2016 | | | 2015 | | | 2014 | |
| | Net Asset Value, Beginning of Period | | $9.09 | | | $9.13 | | | $8.93 | |
| | Income/(Loss) from Investment Operations: | | | | | | | | | |
| | | Net investment income/(loss)(1) | | 0.25 | | | 0.32 | | | 0.46 | |
| | | Net realized and unrealized gain/(loss) | | 0.24 | | | 0.01 | | | 0.20 | |
| | Total from Investment Operations | | 0.49 | | | 0.33 | | | 0.66 | |
| | Less Dividends and Distributions: | | | | | | | | | |
| | | Dividends (from net investment income) | | (0.24) | | | (0.37) | | | (0.46) | |
| | Total Dividends and Distributions | | (0.24) | | | (0.37) | | | (0.46) | |
| | Net Asset Value, End of Period | | $9.34 | | | $9.09 | | | $9.13 | |
| | Total Return* | | 5.46% | | | 3.71% | | | 7.56% | |
| | Net Assets, End of Period (in thousands) | | $66,863 | | | $28,200 | | | $11,522 | |
| | Average Net Assets for the Period (in thousands) | | $47,477 | | | $20,111 | | | $12,645 | |
| | Ratios to Average Net Assets**: | | | | | | | | | |
| | | Ratio of Gross Expenses | | 1.04%(2) | | | 1.15% | | | 1.36% | |
| | | Ratio of Net Expenses (After Waivers and Expense Offsets) | | 1.04%(2) | | | 1.09% | | | 1.10% | |
| | | Ratio of Net Investment Income/(Loss) | | 2.72%(3) | | | 3.52% | | | 5.02% | |
| | Portfolio Turnover Rate | | 110% | | | 54% | | | 84% | |
| | | | | | | | | | | | | |
| | | | | | | | | | | | | |
Class C Shares | | | | | | | | | |
For a share outstanding during the year or period ended July 31 | | 2016 | | | 2015 | | | 2014 | |
| | Net Asset Value, Beginning of Period | | $9.04 | | | $9.09 | | | $8.89 | |
| | Income/(Loss) from Investment Operations: | | | | | | | | | |
| | | Net investment income/(loss)(1) | | 0.18 | | | 0.26 | | | 0.39 | |
| | | Net realized and unrealized gain/(loss) | | 0.24 | | | —(4) | | | 0.20 | |
| | Total from Investment Operations | | 0.42 | | | 0.26 | | | 0.59 | |
| | Less Dividends and Distributions: | | | | | | | | | |
| | | Dividends (from net investment income) | | (0.17) | | | (0.31) | | | (0.39) | |
| | Total Dividends and Distributions | | (0.17) | | | (0.31) | | | (0.39) | |
| | Net Asset Value, End of Period | | $9.29 | | | $9.04 | | | $9.09 | |
| | Total Return* | | 4.70% | | | 2.84% | | | 6.78% | |
| | Net Assets, End of Period (in thousands) | | $50,531 | | | $30,034 | | | $17,744 | |
| | Average Net Assets for the Period (in thousands) | | $40,443 | | | $25,216 | | | $17,512 | |
| | Ratios to Average Net Assets**: | | | | | | | | | |
| | | Ratio of Gross Expenses | | 1.80%(2) | | | 1.92% | | | 2.12% | |
| | | Ratio of Net Expenses (After Waivers and Expense Offsets) | | 1.80%(2) | | | 1.85% | | | 1.85% | |
| | | Ratio of Net Investment Income/(Loss) | | 1.98%(3) | | | 2.84% | | | 4.27% | |
| | Portfolio Turnover Rate | | 110% | | | 54% | | | 84% | |
| | | | | | | | | | | | | |
| |
* Total return not annualized for periods of less than one full year. ** Annualized for periods of less than one full year. (1) Per share amounts are calculated based on average shares outstanding during the year or period. (2) The Ratio of Gross Expenses and Ratio of Net Expenses (After Waivers and Expense Offsets) include a reimbursement of prior period custodian out-of-pocket expenses. The Ratio of Gross Expenses and Ratio of Net Expenses (After Waivers and Expense Offsets) would have been 0.01% higher had the custodian not reimbursed the Fund. (3) The Ratio of Net Investment Income/(Loss) include a reimbursement of prior period custodian out-of-pocket expenses. The Ratio of Net Investment Income/(Loss) would have been 0.01% lower had the custodian not reimbursed the Fund. (4) Less than $0.005 on a per share basis. |
| | |
See Notes to Financial Statements. |
| |
Janus Investment Fund | 25 |
Janus Henderson Developed World Bond Fund
Financial Highlights
| | | | | | | | | | | | | | | | |
Class D Shares | | | | | | | | | | | | |
For a share outstanding during the period ended December 31, 2019 (unaudited) and the year or period ended June 30 | 2019 | | | 2019 | | | 2018 | | | 2017(1) | |
| | Net Asset Value, Beginning of Period | | $9.69 | | | $9.34 | | | $9.45 | | | $9.49 | |
| | Income/(Loss) from Investment Operations: | | | | | | | | | | | | |
| | | Net investment income/(loss)(2) | | 0.09 | | | 0.20 | | | 0.22 | | | 0.02 | |
| | | Net realized and unrealized gain/(loss) | | 0.12 | | | 0.59 | | | (0.11) | | | (0.03) | |
| | Total from Investment Operations | | 0.21 | | | 0.79 | | | 0.11 | | | (0.01) | |
| | Less Dividends and Distributions: | | | | | | | | | | | | |
| | | Dividends (from net investment income) | | (0.23) | | | (0.44) | | | (0.22) | | | (0.01) | |
| | | Distributions (from capital gains) | | (0.03) | | | — | | | — | | | — | |
| | | Return of capital | | — | | | — | | | — | | | (0.02) | |
| | Total Dividends and Distributions | | (0.26) | | | (0.44) | | | (0.22) | | | (0.03) | |
| | Net Asset Value, End of Period | | $9.64 | | | $9.69 | | | $9.34 | | | $9.45 | |
| | Total Return* | | 2.21% | | | 8.78% | | | 1.17% | | | (0.09)% | |
| | Net Assets, End of Period (in thousands) | | $20,780 | | | $16,056 | | | $8,848 | | | $450 | |
| | Average Net Assets for the Period (in thousands) | | $19,651 | | | $10,281 | | | $6,302 | | | $270 | |
| | Ratios to Average Net Assets**: | | | | | | | | | | | | |
| | | Ratio of Gross Expenses | | 0.74% | | | 0.86% | | | 0.79% | | | 0.90% | |
| | | Ratio of Net Expenses (After Waivers and Expense Offsets) | | 0.74% | | | 0.81% | | | 0.79% | | | 0.89% | |
| | | Ratio of Net Investment Income/(Loss) | | 1.81% | | | 2.13% | | | 2.39% | | | 3.54% | |
| | Portfolio Turnover Rate | | 30% | | | 42% | | | 125% | | | 112% | |
| | | | | | | | | | | | | | | | |
| | | | | | | | | | | | | | | | |
Class I Shares | | | | | | | | | | | | |
For a share outstanding during the period end December 31, 2019 (unaudited) and the year or period ended June 30 | 2019 | | | 2019 | | | 2018 | | | 2017(3) | |
| | Net Asset Value, Beginning of Period | | $9.66 | | | $9.32 | | | $9.43 | | | $9.31 | |
| | Income/(Loss) from Investment Operations: | | | | | | | | | | | | |
| | | Net investment income/(loss)(2) | | 0.09 | | | 0.21 | | | 0.23 | | | 0.27 | |
| | | Net realized and unrealized gain/(loss) | | 0.13 | | | 0.58 | | | (0.11) | | | 0.12 | |
| | Total from Investment Operations | | 0.22 | | | 0.79 | | | 0.12 | | | 0.39 | |
| | Less Dividends and Distributions: | | | | | | | | | | | | |
| | | Dividends (from net investment income) | | (0.24) | | | (0.45) | | | (0.23) | | | (0.12) | |
| | | Distributions (from capital gains) | | (0.03) | | | — | | | — | | | — | |
| | | Return of capital | | — | | | — | | | — | | | (0.15) | |
| | Total Dividends and Distributions | | (0.27) | | | (0.45) | | | (0.23) | | | (0.27) | |
| | Net Asset Value, End of Period | | $9.61 | | | $9.66 | | | $9.32 | | | $9.43 | |
| | Total Return* | | 2.24% | | | 8.77% | | | 1.25% | | | 4.26% | |
| | Net Assets, End of Period (in thousands) | | $1,262,799 | | | $948,619 | | | $659,214 | | | $333,853 | |
| | Average Net Assets for the Period (in thousands) | | $1,129,087 | | | $732,591 | | | $496,179 | | | $326,067 | |
| | Ratios to Average Net Assets**: | | | | | | | | | | | | |
| | | Ratio of Gross Expenses | | 0.67% | | | 0.74% | | | 0.72% | | | 0.76% | |
| | | Ratio of Net Expenses (After Waivers and Expense Offsets) | | 0.67% | | | 0.74% | | | 0.72% | | | 0.76% | |
| | | Ratio of Net Investment Income/(Loss) | | 1.89% | | | 2.23% | | | 2.47% | | | 3.21% | |
| | Portfolio Turnover Rate | | 30% | | | 42% | | | 125% | | | 112% | |
| | | | | | | | | | | | | | | | |
| |
* Total return includes adjustments in accordance with generally accepted accounting principles required at the year or period end and are not annualized for periods of less than one full year. ** Annualized for periods of less than one full year. (1) Period from June 5, 2017 (inception date) through June 30, 2017. (2) Per share amounts are calculated based on average shares outstanding during the year or period. (3) Period from August 1, 2016 through June 30, 2017. The Fund changed its fiscal year end from July 31 to June 30. |
| | |
See Notes to Financial Statements. |
| |
26 | DECEMBER 31, 2019 |
Janus Henderson Developed World Bond Fund
Financial Highlights
| | | | | | | | | | | | | |
Class I Shares | | | | | | | | | |
For a share outstanding during the year or period ended July 31 | | 2016 | | | 2015 | | | 2014 | |
| | Net Asset Value, Beginning of Period | | $9.06 | | | $9.11 | | | $8.91 | |
| | Income/(Loss) from Investment Operations: | | | | | | | | | |
| | | Net investment income/(loss)(1) | | 0.27 | | | 0.34 | | | 0.48 | |
| | | Net realized and unrealized gain/(loss) | | 0.23 | | | 0.01 | | | 0.21 | |
| | Total from Investment Operations | | 0.50 | | | 0.35 | | | 0.69 | |
| | Less Dividends and Distributions: | | | | | | | | | |
| | | Dividends (from net investment income) | | (0.25) | | | (0.40) | | | (0.49) | |
| | Total Dividends and Distributions | | (0.25) | | | (0.40) | | | (0.49) | |
| | Net Asset Value, End of Period | | $9.31 | | | $9.06 | | | $9.11 | |
| | Total Return* | | 5.70% | | | 3.86% | | | 7.88% | |
| | Net Assets, End of Period (in thousands) | | $323,462 | | | $106,544 | | | $18,271 | |
| | Average Net Assets for the Period (in thousands) | | $227,875 | | | $65,902 | | | $7,395 | |
| | Ratios to Average Net Assets**: | | | | | | | | | |
| | | Ratio of Gross Expenses | | 0.79%(2) | | | 0.92% | | | 1.08% | |
| | | Ratio of Net Expenses (After Waivers and Expense Offsets) | | 0.79%(2) | | | 0.84% | | | 0.85% | |
| | | Ratio of Net Investment Income/(Loss) | | 2.96%(3) | | | 3.73% | | | 5.29% | |
| | Portfolio Turnover Rate | | 110% | | | 54% | | | 84% | |
| | | | | | | | | | | | | |
| |
* Total return not annualized for periods of less than one full year. ** Annualized for periods of less than one full year. (1) Per share amounts are calculated based on average shares outstanding during the year or period. (2) The Ratio of Gross Expenses and Ratio of Net Expenses (After Waivers and Expense Offsets) include a reimbursement of prior period custodian out-of-pocket expenses. The Ratio of Gross Expenses and Ratio of Net Expenses (After Waivers and Expense Offsets) would have been 0.01% higher had the custodian not reimbursed the Fund. (3) The Ratio of Net Investment Income/(Loss) include a reimbursement of prior period custodian out-of-pocket expenses. The Ratio of Net Investment Income/(Loss) would have been 0.01% lower had the custodian not reimbursed the Fund. |
| | |
See Notes to Financial Statements. |
| |
Janus Investment Fund | 27 |
Janus Henderson Developed World Bond Fund
Financial Highlights
| | | | | | | | | | | | | | | | |
Class N Shares | | | | | | | | | | | | |
For a share outstanding during the period ended December 31, 2019 (unaudited) and the year or period ended June 30 | 2019 | | | 2019 | | | 2018 | | | 2017(1) | |
| | Net Asset Value, Beginning of Period | | $9.67 | | | $9.32 | | | $9.44 | | | $9.32 | |
| | Income/(Loss) from Investment Operations: | | | | | | | | | | | | |
| | | Net investment income/(loss)(2) | | 0.10 | | | 0.21 | | | 0.23 | | | 0.28 | |
| | | Net realized and unrealized gain/(loss) | | 0.11 | | | 0.59 | | | (0.12) | | | 0.11 | |
| | Total from Investment Operations | | 0.21 | | | 0.80 | | | 0.11 | | | 0.39 | |
| | Less Dividends and Distributions: | | | | | | | | | | | | |
| | | Dividends (from net investment income) | | (0.24) | | | (0.45) | | | (0.23) | | | (0.12) | |
| | | Distributions (from capital gains) | | (0.03) | | | — | | | — | | | — | |
| | | Return of capital | | — | | | — | | | — | | | (0.15) | |
| | Total Dividends and Distributions | | (0.27) | | | (0.45) | | | (0.23) | | | (0.27) | |
| | Net Asset Value, End of Period | | $9.61 | | | $9.67 | | | $9.32 | | | $9.44 | |
| | Total Return* | | 2.17% | | | 8.94% | | | 1.19% | | | 4.31% | |
| | Net Assets, End of Period (in thousands) | | $17,819 | | | $5,789 | | | $4,168 | | | $1,340 | |
| | Average Net Assets for the Period (in thousands) | | $12,997 | | | $5,062 | | | $2,007 | | | $1,434 | |
| | Ratios to Average Net Assets**: | | | | | | | | | | | | |
| | | Ratio of Gross Expenses | | 0.61% | | | 0.71% | | | 0.67% | | | 0.70% | |
| | | Ratio of Net Expenses (After Waivers and Expense Offsets) | | 0.61% | | | 0.67% | | | 0.67% | | | 0.70% | |
| | | Ratio of Net Investment Income/(Loss) | | 1.96% | | | 2.31% | | | 2.51% | | | 3.25% | |
| | Portfolio Turnover Rate | | 30% | | | 42% | | | 125% | | | 112% | |
| | | | | | | | | | | | | | | | |
| | | | | | | | | | | | | | | | |
Class S Shares | | | | | | | | | | | | |
For a share outstanding during the period ended December 31, 2019 (unaudited) and the year or period ended June 30 | 2019 | | | 2019 | | | 2018 | | | 2017(3) | |
| | Net Asset Value, Beginning of Period | | $9.69 | | | $9.34 | | | $9.45 | | | $9.49 | |
| | Income/(Loss) from Investment Operations: | | | | | | | | | | | | |
| | | Net investment income/(loss)(2) | | 0.07 | | | 0.18 | | | 0.20 | | | —(4) | |
| | | Net realized and unrealized gain/(loss) | | 0.11 | | | 0.59 | | | (0.12) | | | (0.01) | |
| | Total from Investment Operations | | 0.18 | | | 0.77 | | | 0.08 | | | (0.01) | |
| | Less Dividends and Distributions: | | | | | | | | | | | | |
| | | Dividends (from net investment income) | | (0.22) | | | (0.42) | | | (0.19) | | | (0.01) | |
| | | Distributions (from capital gains) | | (0.03) | | | — | | | — | | | — | |
| | | Return of capital | | — | | | — | | | — | | | (0.02) | |
| | Total Dividends and Distributions | | (0.25) | | | (0.42) | | | (0.19) | | | (0.03) | |
| | Net Asset Value, End of Period | | $9.62 | | | $9.69 | | | $9.34 | | | $9.45 | |
| | Total Return* | | 1.86% | | | 8.51% | | | 0.85% | | | (0.11)% | |
| | Net Assets, End of Period (in thousands) | | $220 | | | $158 | | | $121 | | | $50 | |
| | Average Net Assets for the Period (in thousands) | | $183 | | | $141 | | | $70 | | | $50 | |
| | Ratios to Average Net Assets**: | | | | | | | | | | | | |
| | | Ratio of Gross Expenses | | 2.67% | | | 3.21% | | | 2.19% | | | 1.22% | |
| | | Ratio of Net Expenses (After Waivers and Expense Offsets) | | 1.05% | | | 1.06% | | | 1.05% | | | 1.22% | |
| | | Ratio of Net Investment Income/(Loss) | | 1.52% | | | 1.91% | | | 2.12% | | | (0.55)% | |
| | Portfolio Turnover Rate | | 30% | | | 42% | | | 125% | | | 112% | |
| | | | | | | | | | | | | | | | |
| |
* Total return includes adjustments in accordance with generally accepted accounting principles required at the year or period end and are not annualized for periods of less than one full year. ** Annualized for periods of less than one full year. (1) Period from August 1, 2016 through June 30, 2017. The Fund changed its fiscal year end from July 31 to June 30. (2) Per share amounts are calculated based on average shares outstanding during the year or period. (3) Period from June 5, 2017 (inception date) through June 30, 2017. (4) Less than $0.005 on a per share basis. |
| | |
See Notes to Financial Statements. |
| |
28 | DECEMBER 31, 2019 |
Janus Henderson Developed World Bond Fund
Financial Highlights
| | | | | | | |
Class N Shares | | | |
For a share outstanding during the period ended July 31 | | 2016(1) | |
| | Net Asset Value, Beginning of Period | | $8.99 | |
| | Income/(Loss) from Investment Operations: | | | |
| | | Net investment income/(loss)(2) | | 0.17 | |
| | | Net realized and unrealized gain/(loss) | | 0.32 | |
| | Total from Investment Operations | | 0.49 | |
| | Less Dividends and Distributions: | | | |
| | | Dividends (from net investment income) | | (0.16) | |
| | Total Dividends and Distributions | | (0.16) | |
| | Net Asset Value, End of Period | | $9.32 | |
| | Total Return* | | 5.57% | |
| | Net Assets, End of Period (in thousands) | | $1,528 | |
| | Average Net Assets for the Period (in thousands) | | $1,413 | |
| | Ratios to Average Net Assets**: | | | |
| | | Ratio of Gross Expenses | | 0.73%(3) | |
| | | Ratio of Net Expenses (After Waivers and Expense Offsets) | | 0.73%(3) | |
| | | Ratio of Net Investment Income/(Loss) | | 2.77%(4) | |
| | Portfolio Turnover Rate | | 110% | |
| | | | | | | |
| |
* Total return not annualized for periods of less than one full year. ** Annualized for periods of less than one full year. (1) Period from November 30, 2015 (inception date) through July 31, 2016. (2) Per share amounts are calculated based on average shares outstanding during the year or period. (3) The Ratio of Gross Expenses and Ratio of Net Expenses (After Waivers and Expense Offsets) include a reimbursement of prior period custodian out-of-pocket expenses. The Ratio of Gross Expenses and Ratio of Net Expenses (After Waivers and Expense Offsets) would have been 0.01% higher had the custodian not reimbursed the Fund. (4) The Ratio of Net Investment Income/(Loss) include a reimbursement of prior period custodian out-of-pocket expenses. The Ratio of Net Investment Income/(Loss) would have been 0.01% lower had the custodian not reimbursed the Fund. |
| | |
See Notes to Financial Statements. |
| |
Janus Investment Fund | 29 |
Janus Henderson Developed World Bond Fund
Financial Highlights
| | | | | | | | | | | | | | | | |
Class T Shares | | | | | | | | | | | | |
For a share outstanding during the period ended December 31, 2019 (unaudited) and the year or period ended June 30 | 2019 | | | 2019 | | | 2018 | | | 2017(1) | |
| | Net Asset Value, Beginning of Period | | $9.68 | | | $9.34 | | | $9.45 | | | $9.49 | |
| | Income/(Loss) from Investment Operations: | | | | | | | | | | | | |
| | | Net investment income/(loss)(2) | | 0.08 | | | 0.19 | | | 0.21 | | | —(3) | |
| | | Net realized and unrealized gain/(loss) | | 0.13 | | | 0.58 | | | (0.10) | | | (0.01) | |
| | Total from Investment Operations | | 0.21 | | | 0.77 | | | 0.11 | | | (0.01) | |
| | Less Dividends and Distributions: | | | | | | | | | | | | |
| | | Dividends (from net investment income) | | (0.23) | | | (0.43) | | | (0.22) | | | (0.01) | |
| | | Distributions (from capital gains) | | (0.03) | | | — | | | — | | | — | |
| | | Return of capital | | — | | | — | | | — | | | (0.02) | |
| | Total Dividends and Distributions | | (0.26) | | | (0.43) | | | (0.22) | | | (0.03) | |
| | Net Asset Value, End of Period | | $9.63 | | | $9.68 | | | $9.34 | | | $9.45 | |
| | Total Return* | | 2.16% | | | 8.59% | | | 1.11% | | | (0.10)% | |
| | Net Assets, End of Period (in thousands) | | $129,712 | | | $70,554 | | | $30,023 | | | $55 | |
| | Average Net Assets for the Period (in thousands) | | $94,072 | | | $45,901 | | | $19,756 | | | $53 | |
| | Ratios to Average Net Assets**: | | | | | | | | | | | | |
| | | Ratio of Gross Expenses | | 0.84% | | | 0.91% | | | 0.89% | | | 0.95% | |
| | | Ratio of Net Expenses (After Waivers and Expense Offsets) | | 0.83% | | | 0.90% | | | 0.88% | | | 0.95% | |
| | | Ratio of Net Investment Income/(Loss) | | 1.73% | | | 2.05% | | | 2.31% | | | (0.01)% | |
| | Portfolio Turnover Rate | | 30% | | | 42% | | | 125% | | | 112% | |
| | | | | | | | | | | | | | | | |
| |
* Total return includes adjustments in accordance with generally accepted accounting principles required at the year or period end and are not annualized for periods of less than one full year. ** Annualized for periods of less than one full year. (1) Period from June 5, 2017 (inception date) through June 30, 2017. (2) Per share amounts are calculated based on average shares outstanding during the year or period. (3) Less than $0.005 on a per share basis. |
| | |
See Notes to Financial Statements. |
| |
30 | DECEMBER 31, 2019 |
Janus Henderson Developed World Bond Fund
Notes to Financial Statements (unaudited)
1. Organization and Significant Accounting Policies
Janus Henderson Developed World Bond Fund (formerly Janus Henderson Strategic Income Fund) (the “Fund”) is a series of Janus Investment Fund (the “Trust”), which is organized as a Massachusetts business trust and is registered under the Investment Company Act of 1940, as amended (the “1940 Act”), as an open-end management investment company, and therefore has applied the specialized accounting and reporting guidance in Financial Accounting Standards Board (“FASB”) Accounting Standards Codification (“ASC”) Topic 946. The Trust offers 47 funds, each of which offers multiple share classes, with differing investment objectives and policies. The Fund seeks total return through current income and capital appreciation. The Fund is classified as diversified, as defined in the 1940 Act.
Pursuant to the Agreement and Plan of Reorganization, the Fund acquired all the assets and liabilities of the Henderson Strategic Income Fund (the “Predecessor Fund”), a series of Henderson Global Funds, in exchange for Class A, Class C, Class I and Class N Fund shares having an aggregate net asset value equal to the value of the aggregate net assets of the same share class of the Predecessor Fund (except that Class R6 Predecessor Fund shares were exchanged for Class N Fund shares) (the “Reorganization”). The Reorganization occurred at the close of business on June 2, 2017.
The Predecessor Fund and the Fund had identical investment objectives and substantially similar investment policies and principal risks. For financial reporting purposes, the Predecessor Fund’s financial and performance history prior to the Reorganization is carried forward and reflected in the Fund’s financial highlights.
The last fiscal year end of the Predecessor Fund was July 31, 2016. Subsequent to July 31, 2016, the Fund changed its fiscal year end to June 30, 2017, to reflect the fiscal year end of certain funds of the Trust.
The Fund offers multiple classes of shares in order to meet the needs of various types of investors. Each class represents an interest in the same portfolio of investments. Certain financial intermediaries may not offer all classes of shares. Class D Shares are closed to certain new investors.
Class A Shares are offered through financial intermediary platforms including, but not limited to, traditional brokerage platforms, mutual fund wrap fee programs, bank trust platforms, and retirement platforms.
Class C Shares are offered through financial intermediary platforms including, but not limited to, traditional brokerage platforms, mutual fund wrap fee programs, and bank trust platforms.
Class C Shares are closed to investments by new employer-sponsored retirement plans and existing employer-sponsored retirement plans are no longer able to make additional purchases or exchanges into Class C Shares.
The Funds have adopted an auto-conversion policy pursuant to which Class C Shares that have been held for ten years will be automatically converted to Class A Shares without the imposition of any sales charge, fee or other charge. The conversion will generally occur no later than ten business days in the month following the month of the tenth anniversary of the date of purchase. Class C Shares purchased through the reinvestment of dividends and other distributions on Class C Shares will convert to Class A Shares at the same time as the Class C Shares with respect to which they were purchased. For Class C Shares held in omnibus accounts on intermediary platforms, the Fund will rely on these intermediaries to implement this conversion feature. Your financial intermediary may have separate policies and procedures as to when and how Class C Shares may be converted to Class A Shares. Please contact your financial intermediary for additional information.
Class D Shares are generally no longer being made available to new investors who do not already have a direct account with the Janus Henderson funds. Class D Shares are available only to investors who hold accounts directly with the Janus Henderson funds, to immediate family members or members of the same household of an eligible individual investor, and to existing beneficial owners of sole proprietorships or partnerships that hold accounts directly with the Janus Henderson funds.
Class I Shares are available through certain financial intermediary platforms including, but not limited to, mutual fund wrap fee programs, managed account programs, asset allocation programs, bank trust platforms, as well as certain retirement platforms. Class I Shares are also available to certain direct institutional investors including, but not limited to, corporations, certain retirement plans, public plans, and foundations/endowments, who established Class I Share accounts before August 4, 2017.
Class N Shares are generally available only to financial intermediaries purchasing on behalf of: 1) certain adviser-assisted, employer-sponsored retirement plans, including 401(k) plans, 457 plans, 403(b) plans, Taft-Hartley multi-
Janus Henderson Developed World Bond Fund
Notes to Financial Statements (unaudited)
employer plans, profit-sharing and money purchase pension plans, defined benefit plans and certain welfare benefit plans, such as health savings accounts, and nonqualified deferred compensation plans; and 2) retail investors purchasing in qualified or nonqualified accounts, whose accounts are held through an omnibus account at their financial intermediary, and where the financial intermediary requires no payment or reimbursement from the Fund, Janus Capital Management LLC (“Janus Capital”), or its affiliates. Class N Shares are also available to Janus Henderson proprietary products and to certain direct institutional investors approved by Janus Distributors LLC dba Janus Henderson Distributors (“Janus Henderson Distributors”) including, but not limited to, corporations, certain retirement plans, public plans, and foundations and endowments, subject to minimum investment requirements.
Class S Shares are offered through financial intermediary platforms including, but not limited to, retirement platforms and asset allocation, mutual fund wrap, or other discretionary or nondiscretionary fee-based investment advisory programs. In addition, Class S Shares may be available through certain financial intermediaries who have an agreement with Janus Capital or its affiliates to offer Class S Shares on their supermarket platforms.
Class T Shares are available through certain financial intermediary platforms including, but not limited to, mutual fund wrap fee programs, managed account programs, asset allocation programs, bank trust platforms, as well as certain retirement platforms. In addition, Class T Shares may be available through certain financial intermediaries who have an agreement with Janus Capital or its affiliates to offer Class T Shares on their supermarket platforms.
The following accounting policies have been followed by the Fund and are in conformity with accounting principles generally accepted in the United States of America.
Investment Valuation
Securities held by the Fund are valued in accordance with policies and procedures established by and under the supervision of the Trustees (the “Valuation Procedures”). Equity securities traded on a domestic securities exchange are generally valued at the closing prices on the primary market or exchange on which they trade. If such price is lacking for the trading period immediately preceding the time of determination, such securities are valued at their current bid price. Equity securities that are traded on a foreign exchange are generally valued at the closing prices on such markets. In the event that there is no current trading volume on a particular security in such foreign exchange, the bid price from the primary exchange is generally used to value the security. Securities that are traded on the over-the-counter (“OTC”) markets are generally valued at their closing or latest bid prices as available. Foreign securities and currencies are converted to U.S. dollars using the applicable exchange rate in effect at the close of the New York Stock Exchange (“NYSE”). The Fund will determine the market value of individual securities held by it by using prices provided by one or more approved professional pricing services or, as needed, by obtaining market quotations from independent broker-dealers. Most debt securities are valued in accordance with the evaluated bid price supplied by the pricing service that is intended to reflect market value. The evaluated bid price supplied by the pricing service is an evaluation that may consider factors such as security prices, yields, maturities and ratings. Certain short-term securities maturing within 60 days or less may be evaluated and valued on an amortized cost basis provided that the amortized cost determined approximates market value. Securities for which market quotations or evaluated prices are not readily available or deemed unreliable are valued at fair value determined in good faith under the Valuation Procedures. Circumstances in which fair value pricing may be utilized include, but are not limited to: (i) a significant event that may affect the securities of a single issuer, such as a merger, bankruptcy, or significant issuer-specific development; (ii) an event that may affect an entire market, such as a natural disaster or significant governmental action; (iii) a nonsignificant event such as a market closing early or not opening, or a security trading halt; and (iv) pricing of a nonvalued security and a restricted or nonpublic security. Special valuation considerations may apply with respect to “odd-lot” fixed-income transactions which, due to their small size, may receive evaluated prices by pricing services which reflect a large block trade and not what actually could be obtained for the odd-lot position. The Fund uses systematic fair valuation models provided by independent third parties to value international equity securities in order to adjust for stale pricing, which may occur between the close of certain foreign exchanges and the close of the NYSE.
Valuation Inputs Summary
FASB ASC 820, Fair Value Measurements and Disclosures (“ASC 820”), defines fair value, establishes a framework for measuring fair value, and expands disclosure requirements regarding fair value measurements. This standard emphasizes that fair value is a market-based measurement that should be determined based on the assumptions that market participants would use in pricing an asset or liability and establishes a hierarchy that prioritizes inputs to valuation techniques used to measure fair value. These inputs are summarized into three broad levels:
Janus Henderson Developed World Bond Fund
Notes to Financial Statements (unaudited)
Level 1 – Unadjusted quoted prices in active markets the Fund has the ability to access for identical assets or liabilities.
Level 2 – Observable inputs other than unadjusted quoted prices included in Level 1 that are observable for the asset or liability either directly or indirectly. These inputs may include quoted prices for the identical instrument on an inactive market, prices for similar instruments, interest rates, prepayment speeds, credit risk, yield curves, default rates and similar data.
Assets or liabilities categorized as Level 2 in the hierarchy generally include: debt securities fair valued in accordance with the evaluated bid or ask prices supplied by a pricing service; securities traded on OTC markets and listed securities for which no sales are reported that are fair valued at the latest bid price (or yield equivalent thereof) obtained from one or more dealers transacting in a market for such securities or by a pricing service approved by the Fund’s Trustees; certain short-term debt securities with maturities of 60 days or less that are fair valued at amortized cost; and equity securities of foreign issuers whose fair value is determined by using systematic fair valuation models provided by independent third parties in order to adjust for stale pricing which may occur between the close of certain foreign exchanges and the close of the NYSE. Other securities that may be categorized as Level 2 in the hierarchy include, but are not limited to, preferred stocks, bank loans, swaps, investments in unregistered investment companies, options, and forward contracts.
Level 3 – Unobservable inputs for the asset or liability to the extent that relevant observable inputs are not available, representing the Fund’s own assumptions about the assumptions that a market participant would use in valuing the asset or liability, and that would be based on the best information available.
There have been no significant changes in valuation techniques used in valuing any such positions held by the Fund since the beginning of the fiscal year.
The inputs or methodology used for fair valuing securities are not necessarily an indication of the risk associated with investing in those securities. The summary of inputs used as of December 31, 2019 to fair value the Fund’s investments in securities and other financial instruments is included in the “Valuation Inputs Summary” in the Notes to Schedule of Investments and Other Information.
Investment Transactions and Investment Income
Investment transactions are accounted for as of the date purchased or sold (trade date). Dividend income is recorded on the ex-dividend date. Certain dividends from foreign securities will be recorded as soon as the Fund is informed of the dividend, if such information is obtained subsequent to the ex-dividend date. Dividends from foreign securities may be subject to withholding taxes in foreign jurisdictions. Interest income is recorded daily on the accrual basis and includes amortization of premiums and accretion of discounts. The Fund classifies gains and losses on prepayments received as an adjustment to interest income. Debt securities may be placed in non-accrual status and related interest income may be reduced by stopping current accruals and writing off interest receivables when collection of all or a portion of interest has become doubtful. Gains and losses are determined on the identified cost basis, which is the same basis used for federal income tax purposes. Income, as well as gains and losses, both realized and unrealized, are allocated daily to each class of shares based upon the ratio of net assets represented by each class as a percentage of total net assets.
Expenses
The Fund bears expenses incurred specifically on its behalf. Each class of shares bears a portion of general expenses, which are allocated daily to each class of shares based upon the ratio of net assets represented by each class as a percentage of total net assets. Expenses directly attributable to a specific class of shares are charged against the operations of such class.
Estimates
The preparation of financial statements in conformity with accounting principles generally accepted in the United States of America requires management to make estimates and assumptions that affect the reported amount of assets and liabilities and disclosure of contingent assets and liabilities at the date of the financial statements, and the reported amounts of income and expenses during the reporting period. Actual results could differ from those estimates.
Indemnifications
In the normal course of business, the Fund may enter into contracts that contain provisions for indemnification of other parties against certain potential liabilities. The Fund’s maximum exposure under these arrangements is unknown, and
Janus Henderson Developed World Bond Fund
Notes to Financial Statements (unaudited)
would involve future claims that may be made against the Fund that have not yet occurred. Currently, the risk of material loss from such claims is considered remote.
Foreign Currency Translations
The Fund does not isolate that portion of the results of operations resulting from the effect of changes in foreign exchange rates on investments from the fluctuations arising from changes in market prices of securities held at the date of the financial statements. Net unrealized appreciation or depreciation of investments and foreign currency translations arise from changes in the value of assets and liabilities, including investments in securities held at the date of the financial statements, resulting from changes in the exchange rates and changes in market prices of securities held.
Currency gains and losses are also calculated on payables and receivables that are denominated in foreign currencies. The payables and receivables are generally related to foreign security transactions and income translations.
Foreign currency-denominated assets and forward currency contracts may involve more risks than domestic transactions, including currency risk, counterparty risk, political and economic risk, regulatory risk and equity risk. Risks may arise from unanticipated movements in the value of foreign currencies relative to the U.S. dollar.
Dividends and Distributions
Dividends are declared and distributed monthly for the Fund. Realized capital gains, if any, are declared and distributed in December. The Fund may treat a portion of the amount paid to redeem shares as a distribution of investment company taxable income and realized capital gains that are reflected in the net asset value. This practice, commonly referred to as “equalization,” has no effect on the redeeming shareholder or the Fund’s total return, but may reduce the amounts that would otherwise be required to be paid as taxable dividends to the remaining shareholders. It is possible that the Internal Revenue Service (IRS) could challenge the Fund's equalization methodology or calculations, and any such challenge could result in additional tax, interest, or penalties to be paid by the Fund.
The Fund may make certain investments in real estate investment trusts (“REITs”) which pay dividends to their shareholders based upon funds available from operations. It is quite common for these dividends to exceed the REITs’ taxable earnings and profits, resulting in the excess portion of such dividends being designated as a return of capital. If the Fund distributes such amounts, such distributions could constitute a return of capital to shareholders for federal income tax purposes.
Federal Income Taxes
The Fund intends to continue to qualify as a regulated investment company and distribute all of its taxable income in accordance with the requirements of Subchapter M of the Internal Revenue Code. Management has analyzed the Fund’s tax positions taken for all open federal income tax years, generally a three-year period, and has concluded that no provision for federal income tax is required in the Fund’s financial statements. The Fund is not aware of any tax positions for which it is reasonably possible that the total amounts of unrecognized tax benefits will significantly change in the next twelve months.
2. Derivative Instruments
The Fund may invest in various types of derivatives, which may at times result in significant derivative exposure. A derivative is a financial instrument whose performance is derived from the performance of another asset. The Fund may invest in derivative instruments including, but not limited to: futures contracts, put options, call options, options on future contracts, options on foreign currencies, options on recovery locks, options on security and commodity indices, swaps, forward contracts, structured investments, and other equity-linked derivatives. Each derivative instrument that was held by the Fund during the period ended December 31, 2019 is discussed in further detail below. A summary of derivative activity by the Fund is reflected in the tables at the end of the Schedule of Investments.
The Fund may use derivative instruments for hedging purposes (to offset risks associated with an investment, currency exposure, or market conditions), to adjust currency exposure relative to a benchmark index, or for speculative purposes (to earn income and seek to enhance returns). When the Fund invests in a derivative for speculative purposes, the Fund will be fully exposed to the risks of loss of that derivative, which may sometimes be greater than the derivative’s cost. The Fund may not use any derivative to gain exposure to an asset or class of assets that it would be prohibited by its investment restrictions from purchasing directly. The Fund’s ability to use derivative instruments may also be limited by tax considerations.
Janus Henderson Developed World Bond Fund
Notes to Financial Statements (unaudited)
Investments in derivatives in general are subject to market risks that may cause their prices to fluctuate over time. Investments in derivatives may not directly correlate with the price movements of the underlying instrument. As a result, the use of derivatives may expose the Fund to additional risks that it would not be subject to if it invested directly in the securities underlying those derivatives. The use of derivatives may result in larger losses or smaller gains than otherwise would be the case. Derivatives can be volatile and may involve significant risks.
In pursuit of its investment objective, the Fund may seek to use derivatives to increase or decrease exposure to the following market risk factors:
· Commodity Risk – the risk related to the change in value of commodities or commodity-linked investments due to changes in the overall market movements, volatility of the underlying benchmark, changes in interest rates, or other factors affecting a particular industry or commodity such as drought, floods, weather, livestock disease, embargoes, tariffs, and international economic, political, and regulatory developments.
· Counterparty Risk – the risk that the counterparty (the party on the other side of the transaction) on a derivative transaction will be unable to honor its financial obligation to the Fund.
· Credit Risk – the risk an issuer will be unable to make principal and interest payments when due, or will default on its obligations.
· Currency Risk – the risk that changes in the exchange rate between currencies will adversely affect the value (in U.S. dollar terms) of an investment.
· Equity Risk – the risk related to the change in value of equity securities as they relate to increases or decreases in the general market.
· Index Risk – if the derivative is linked to the performance of an index, it will be subject to the risks associated with changes in that index. If the index changes, the Fund could receive lower interest payments or experience a reduction in the value of the derivative to below what the Fund paid. Certain indexed securities, including inverse securities (which move in an opposite direction to the index), may create leverage, to the extent that they increase or decrease in value at a rate that is a multiple of the changes in the applicable index.
· Interest Rate Risk – the risk that the value of fixed-income securities will generally decline as prevailing interest rates rise, which may cause the Fund’s NAV to likewise decrease.
· Leverage Risk – the risk associated with certain types of leveraged investments or trading strategies pursuant to which relatively small market movements may result in large changes in the value of an investment. The Fund creates leverage by investing in instruments, including derivatives, where the investment loss can exceed the original amount invested. Certain investments or trading strategies, such as short sales, that involve leverage can result in losses that greatly exceed the amount originally invested.
· Liquidity Risk – the risk that certain securities may be difficult or impossible to sell at the time that the seller would like or at the price that the seller believes the security is currently worth.
Derivatives may generally be traded OTC or on an exchange. Derivatives traded OTC are agreements that are individually negotiated between parties and can be tailored to meet a purchaser’s needs. OTC derivatives are not guaranteed by a clearing agency and may be subject to increased credit risk.
In an effort to mitigate credit risk associated with derivatives traded OTC, the Fund may enter into collateral agreements with certain counterparties whereby, subject to certain minimum exposure requirements, the Fund may require the counterparty to post collateral if the Fund has a net aggregate unrealized gain on all OTC derivative contracts with a particular counterparty. Additionally, the Fund may deposit cash and/or treasuries as collateral with the counterparty and/or custodian daily (based on the daily valuation of the financial asset) if the Fund has a net aggregate unrealized loss on OTC derivative contracts with a particular counterparty. All liquid securities and restricted cash are considered to cover in an amount at all times equal to or greater than the Fund’s commitment with respect to certain exchange-traded derivatives, centrally cleared derivatives, forward foreign currency exchange contracts, short sales, and/or securities with extended settlement dates. There is no guarantee that counterparty exposure is reduced and these arrangements are dependent on Janus Capital's ability to establish and maintain appropriate systems and trading.
Janus Henderson Developed World Bond Fund
Notes to Financial Statements (unaudited)
Forward Foreign Currency Exchange Contracts
A forward foreign currency exchange contract (“forward currency contract”) is an obligation to buy or sell a specified currency at a future date at a negotiated rate (which may be U.S. dollars or a foreign currency). The Fund may enter into forward currency contracts for hedging purposes, including, but not limited to, reducing exposure to changes in foreign currency exchange rates on foreign portfolio holdings and locking in the U.S. dollar cost of firm purchase and sale commitments for securities denominated in or exposed to foreign currencies. The Fund may also invest in forward currency contracts for non-hedging purposes such as seeking to enhance returns. The Fund is subject to currency risk and counterparty risk in the normal course of pursuing its investment objective through its investments in forward currency contracts.
Forward currency contracts are valued by converting the foreign value to U.S. dollars by using the current spot U.S. dollar exchange rate and/or forward rate for that currency. Exchange and forward rates as of the close of the NYSE shall be used to value the forward currency contracts. The unrealized appreciation/(depreciation) for forward currency contracts is reported in the Statement of Assets and Liabilities as a receivable or payable and in the Statement of Operations for the change in unrealized net appreciation/depreciation (if applicable). The gain or loss arising from the difference between the U.S. dollar cost of the original contract and the value of the foreign currency in U.S. dollars upon closing a forward currency contract is reported on the Statement of Operations (if applicable).
During the period, the Fund entered into forward currency contracts with the obligation to purchase foreign currencies in the future at an agreed upon rate in order to take a positive outlook on the related currency. These forward contracts seek to increase exposure to currency risk.
During the period, the Fund entered into forward currency contracts with the obligation to sell foreign currencies in the future at an agreed upon rate in order to take a negative outlook on the related currency. These forward contracts seek to increase exposure to currency risk.
During the period, the Fund entered into forward currency contracts with the obligation to sell foreign currencies in the future at an agreed upon rate in order to decrease exposure to currency risk associated with foreign currency denominated securities held by the Fund.
Futures Contracts
A futures contract is an exchange-traded agreement to take or make delivery of an underlying asset at a specific time in the future for a specific predetermined negotiated price. The Fund may enter into futures contracts to gain exposure to the stock market or other markets pending investment of cash balances or to meet liquidity needs. The Fund is subject to interest rate risk, equity risk, and currency risk in the normal course of pursuing its investment objective through its investments in futures contracts. The Fund may also use such derivative instruments to hedge or protect from adverse movements in securities prices, currency rates or interest rates. The use of futures contracts may involve risks such as the possibility of illiquid markets or imperfect correlation between the values of the contracts and the underlying securities, or that the counterparty will fail to perform its obligations.
Futures contracts on commodities are valued at the settlement price on valuation date on the commodities exchange as reported by an approved vendor. Mini contracts, as defined in the description of the contract, shall be valued using the Actual Settlement Price or “ASET” price type as reported by an approved vendor. In the event that foreign futures trade when the foreign equity markets are closed, the last foreign futures trade price shall be used. Futures contracts are marked-to-market daily, and the daily variation margin is recorded as a receivable or payable on the Statement of Assets and Liabilities (if applicable). The change in unrealized net appreciation/depreciation is reported on the Statement of Operations (if applicable). When a contract is closed, a realized gain or loss is reported on the Statement of Operations (if applicable), equal to the difference between the opening and closing value of the contract. Securities held by the Fund that are designated as collateral for market value on futures contracts are noted on the Schedule of Investments (if applicable). Such collateral is in the possession of the Fund’s futures commission merchant.
With futures, there is minimal counterparty credit risk to the Fund since futures are exchange-traded and the exchange’s clearinghouse, as counterparty to all exchange-traded futures, guarantees the futures against default.
During the period, the Fund purchased interest rate futures to increase exposure to interest rate risk.
During the period, the Fund sold interest rate futures to decrease exposure to interest rate risk.
Janus Henderson Developed World Bond Fund
Notes to Financial Statements (unaudited)
Swaps
Swap agreements are two-party contracts entered into primarily by institutional investors for periods ranging from a day to more than one year to exchange one set of cash flows for another. The most significant factor in the performance of swap agreements is the change in value of the specific index, security, or currency, or other factors that determine the amounts of payments due to and from the Fund. The use of swaps is a highly specialized activity which involves investment techniques and risks different from those associated with ordinary portfolio securities transactions. Swap transactions may in some instances involve the delivery of securities or other underlying assets by the Fund or its counterparty to collateralize obligations under the swap. If the other party to a swap that is not collateralized defaults, the Fund would risk the loss of the net amount of the payments that it contractually is entitled to receive. Swap agreements entail the risk that a party will default on its payment obligations to the Fund. If the other party to a swap defaults, the Fund would risk the loss of the net amount of the payments that it contractually is entitled to receive. If the Fund utilizes a swap at the wrong time or judges market conditions incorrectly, the swap may result in a loss to the Fund and reduce the Fund’s total return.
Swap agreements also bear the risk that the Fund will not be able to meet its obligation to the counterparty. Swap agreements are typically privately negotiated and entered into in the OTC market. However, certain swap agreements are required to be cleared through a clearinghouse and traded on an exchange or swap execution facility. Swaps that are required to be cleared are required to post initial and variation margins in accordance with the exchange requirements. Regulations enacted require the Fund to centrally clear certain interest rate and credit default index swaps through a clearinghouse or central counterparty (“CCP”). To clear a swap with a CCP, the Fund will submit the swap to, and post collateral with, a futures clearing merchant (“FCM”) that is a clearinghouse member. Alternatively, the Fund may enter into a swap with a financial institution other than the FCM (the “Executing Dealer”) and arrange for the swap to be transferred to the FCM for clearing. The Fund may also enter into a swap with the FCM itself. The CCP, the FCM, and the Executing Dealer are all subject to regulatory oversight by the U.S. Commodity Futures Trading Commission (“CFTC”). A default or failure by a CCP or an FCM, or the failure of a swap to be transferred from an Executing Dealer to the FCM for clearing, may expose the Fund to losses, increase its costs, or prevent the Fund from entering or exiting swap positions, accessing collateral, or fully implementing its investment strategies. The regulatory requirement to clear certain swaps could, either temporarily or permanently, reduce the liquidity of cleared swaps or increase the costs of entering into those swaps.
Index swaps, interest rate swaps, and credit default swaps are valued using an approved vendor supplied price. Basket swaps are valued using a broker supplied price. Equity swaps that consist of a single underlying equity are valued either at the closing price, the latest bid price, or the last sale price on the primary market or exchange it trades. The market value of swap contracts are aggregated by positive and negative values and are disclosed separately as an asset or liability on the Fund’s Statement of Assets and Liabilities (if applicable). Realized gains and losses are reported on the Fund’s Statement of Operations (if applicable). The change in unrealized net appreciation or depreciation during the period is included in the Statement of Operations (if applicable).
The Fund’s maximum risk of loss from counterparty risk or credit risk is the discounted value of the payments to be received from/paid to the counterparty over the contract’s remaining life, to the extent that the amount is positive. The risk is mitigated by having a netting arrangement between the Fund and the counterparty and by the posting of collateral by the counterparty to cover the Fund’s exposure to the counterparty.
The Fund may enter into various types of credit default swap agreements, including OTC credit default swap agreements and index credit default swaps (“CDX”), for investment purposes and to add leverage to its portfolio. Credit default swaps are a specific kind of counterparty agreement that allow the transfer of third party credit risk from one party to the other. One party in the swap is a lender and faces credit risk from a third party, and the counterparty in the credit default swap agrees to insure this risk in exchange for regular periodic payments. Credit default swaps could result in losses if the Fund does not correctly evaluate the creditworthiness of the company or companies on which the credit default swap is based. Credit default swap agreements may involve greater risks than if the Fund had invested in the reference obligation directly since, in addition to risks relating to the reference obligation, credit default swaps are subject to liquidity risk, counterparty risk, and credit risk. The Fund will generally incur a greater degree of risk when it sells a credit default swap than when it purchases a credit default swap. As a buyer of a credit default swap, the Fund may lose its investment and recover nothing should no credit event occur and the swap is held to its termination date. As seller of a credit default swap, if a credit event were to occur, the value of any deliverable obligation received by the
Janus Henderson Developed World Bond Fund
Notes to Financial Statements (unaudited)
Fund, coupled with the upfront or periodic payments previously received, may be less than what it pays to the buyer, resulting in a loss of value to the Fund.
As a buyer of credit protection, the Fund is entitled to receive the par (or other agreed-upon) value of a referenced debt obligation from the counterparty to the contract in the event of a default or other credit event by a third party, such as a U.S. or foreign issuer, on the debt obligation. In return, the Fund as buyer would pay to the counterparty a periodic stream of payments over the term of the contract provided that no credit event has occurred. If no credit event occurs, the Fund would have spent the stream of payments and potentially received no benefit from the contract.
If the Fund is the seller of credit protection against a particular security, the Fund would receive an up-front or periodic payment to compensate against potential credit events. As the seller in a credit default swap contract, the Fund would be required to pay the par value (the “notional value”) (or other agreed-upon value) of a referenced debt obligation to the counterparty in the event of a default by a third party, such as a U.S. or foreign corporate issuer, on the debt obligation. In return, the Fund would receive from the counterparty a periodic stream of payments over the term of the contract provided that no event of default has occurred. If no default occurs, the Fund would keep the stream of payments and would have no payment obligations. As the seller, the Fund would effectively add leverage to its portfolio because, in addition to its total net assets, the Fund would be subject to investment exposure on the notional value of the swap. The maximum potential amount of future payments (undiscounted) that the Fund as a seller could be required to make in a credit default transaction would be the notional amount of the agreement.
The Fund may invest in single-name credit default swaps (“CDS”) to buy or sell credit protection to hedge its credit exposure, gain issuer exposure without owning the underlying security, or increase the Fund’s total return. Single-name CDS enable the Fund to buy or sell protection against a credit event of a specific issuer. When the Fund buys a single-name CDS, the Fund will receive a return on its investment only in the event of a credit event, such as default by the issuer of the underlying obligation (as opposed to a credit downgrade or other indication of financial difficulty). If a single-name CDS transaction is particularly large, or if the relevant market is illiquid, it may not be possible for the Fund to initiate a single-name CDS transaction or to liquidate its position at an advantageous time or price, which may result in significant losses. Moreover, the Fund bears the risk of loss of the amount expected to be received under a single-name CDS in the event of the default or bankruptcy of the counterparty. The risks associated with cleared single-name CDS may be lower than that for uncleared single-name CDS because for cleared single-name CDS, the counterparty is a clearinghouse (to the extent such a trading market is available). However, there can be no assurance that a clearinghouse or its members will satisfy their obligations to the Fund.
During the period, the Fund purchased protection via the credit default swap market in order to reduce credit risk exposure to individual corporates, countries and/or credit indices where reducing this exposure via the cash bond market was less attractive.
3. Other Investments and Strategies
Additional Investment Risk
The Fund may be invested in lower-rated debt securities that have a higher risk of default or loss of value since these securities may be sensitive to economic changes, political changes, or adverse developments specific to the issuer.
In the aftermath of the 2007-2008 financial crisis, the financial sector experienced reduced liquidity in credit and other fixed-income markets, and an unusually high degree of volatility, both domestically and internationally. In response to the crisis, the United States and certain foreign governments, along with the U.S. Federal Reserve and certain foreign central banks, took steps to support the financial markets. For example, the enactment of the Dodd-Frank Act in 2010 provided for widespread regulation of financial institutions, consumer financial products and services, broker-dealers, over-the-counter derivatives, investment advisers, credit rating agencies, and mortgage lending, which expanded federal oversight in the financial sector, including the investment management industry. The withdrawal of this support, a failure of measures put in place to respond to the crisis, or investor perception that such efforts were not sufficient could each negatively affect financial markets generally, and the value and liquidity of specific securities. In addition, policy and legislative changes in the United States and in other countries continue to impact many aspects of financial regulation.
A number of countries in the European Union (“EU”) have experienced, and may continue to experience, severe economic and financial difficulties. In particular, many EU nations are susceptible to economic risks associated with high levels of debt. Many non-governmental issuers, and even certain governments, have defaulted on, or been forced to restructure, their debts. Many other issuers have faced difficulties obtaining credit or refinancing existing obligations.
Janus Henderson Developed World Bond Fund
Notes to Financial Statements (unaudited)
Financial institutions have in many cases required government or central bank support, have needed to raise capital, and/or have been impaired in their ability to extend credit. As a result, financial markets in the EU experienced extreme volatility and declines in asset values and liquidity. Responses to these financial problems by European governments, central banks, and others, including austerity measures and reforms, may not work, may result in social unrest, and may limit future growth and economic recovery or have other unintended consequences. The risk of investing in securities in the European markets may also be heightened due to the referendum in which the United Kingdom voted to exit the EU (commonly known as “Brexit”). There is considerable uncertainty about how Brexit will be conducted, how negotiations of necessary treaties and trade agreements will conclude, or how financial markets will react.
Certain areas of the world have historically been prone to and economically sensitive to environmental events such as, but not limited to, hurricanes, earthquakes, typhoons, flooding, tidal waves, tsunamis, erupting volcanoes, wildfires or droughts, tornadoes, mudslides, or other weather-related phenomena. Such disasters, and the resulting physical or economic damage, could have a severe and negative impact on the Fund’s investment portfolio and, in the longer term, could impair the ability of issuers in which the Fund invests to conduct their businesses as they would under normal conditions. Adverse weather conditions may also have a particularly significant negative effect on issuers in the agricultural sector and on insurance companies that insure against the impact of natural disasters.
Counterparties
Fund transactions involving a counterparty are subject to the risk that the counterparty or a third party will not fulfill its obligation to the Fund (“counterparty risk”). Counterparty risk may arise because of the counterparty’s financial condition (i.e., financial difficulties, bankruptcy, or insolvency), market activities and developments, or other reasons, whether foreseen or not. A counterparty’s inability to fulfill its obligation may result in significant financial loss to the Fund. The Fund may be unable to recover its investment from the counterparty or may obtain a limited recovery, and/or recovery may be delayed. The extent of the Fund’s exposure to counterparty risk with respect to financial assets and liabilities approximates its carrying value. See the "Offsetting Assets and Liabilities" section of this Note for further details.
The Fund may be exposed to counterparty risk through participation in various programs, including, but not limited to, lending its securities to third parties, cash sweep arrangements whereby the Fund’s cash balance is invested in one or more types of cash management vehicles, as well as investments in, but not limited to, repurchase agreements, debt securities, and derivatives, including various types of swaps, futures and options. The Fund intends to enter into financial transactions with counterparties that Janus Capital believes to be creditworthy at the time of the transaction. There is always the risk that Janus Capital’s analysis of a counterparty’s creditworthiness is incorrect or may change due to market conditions. To the extent that the Fund focuses its transactions with a limited number of counterparties, it will have greater exposure to the risks associated with one or more counterparties.
Loans
The Fund may invest in various commercial loans, including bank loans, bridge loans, debtor-in-possession (“DIP”) loans, mezzanine loans, and other fixed and floating rate loans. These loans may be acquired through loan participations and assignments or on a when-issued basis. Commercial loans will comprise no more than 20% of the Fund’s total assets. Below are descriptions of the types of loans held by the Fund as of December 31, 2019.
· Bank Loans - Bank loans are obligations of companies or other entities entered into in connection with recapitalizations, acquisitions, and refinancings. The Fund’s investments in bank loans are generally acquired as a participation interest in, or assignment of, loans originated by a lender or other financial institution. These investments may include institutionally-traded floating and fixed-rate debt securities.
· Floating Rate Loans – Floating rate loans are debt securities that have floating interest rates, that adjust periodically, and are tied to a benchmark lending rate, such as London Interbank Offered Rate (“LIBOR”). In other cases, the lending rate could be tied to the prime rate offered by one or more major U.S. banks or the rate paid on large certificates of deposit traded in the secondary markets. If the benchmark lending rate changes, the rate payable to lenders under the loan will change at the next scheduled adjustment date specified in the loan agreement. Floating rate loans are typically issued to companies (‘‘borrowers’’) in connection with recapitalizations, acquisitions, and refinancings. Floating rate loan investments are generally below investment grade. Senior floating rate loans are secured by specific collateral of a borrower and are senior in the borrower’s capital structure. The senior position in the borrower’s capital structure generally gives holders of senior loans a claim on certain of the borrower’s assets that is senior to subordinated debt and preferred and common stock in the case of a borrower’s default. Floating rate loan investments may involve
Janus Henderson Developed World Bond Fund
Notes to Financial Statements (unaudited)
foreign borrowers, and investments may be denominated in foreign currencies. Floating rate loans often involve borrowers whose financial condition is troubled or uncertain and companies that are highly leveraged. The Fund may invest in obligations of borrowers who are in bankruptcy proceedings. While the Fund generally expects to invest in fully funded term loans, certain of the loans in which the Fund may invest include revolving loans, bridge loans, and delayed draw term loans.
Purchasers of floating rate loans may pay and/or receive certain fees. The Fund may receive fees such as covenant waiver fees or prepayment penalty fees. The Fund may pay fees such as facility fees. Such fees may affect the Fund’s return.
· Mezzanine Loans - Mezzanine loans are secured by the stock of the company that owns the assets. Mezzanine loans are a hybrid of debt and equity financing that is typically used to fund the expansion of existing companies. A mezzanine loan is composed of debt capital that gives the lender the right to convert to an ownership or equity interest in the company if the loan is not paid back in time and in full. Mezzanine loans typically are the most subordinated debt obligation in an issuer’s capital structure.
Mortgage- and Asset-Backed Securities
Mortgage- and asset-backed securities represent interests in “pools” of commercial or residential mortgages or other assets, including consumer loans or receivables. The Fund may purchase fixed or variable rate commercial or residential mortgage-backed securities issued by the Government National Mortgage Association (“Ginnie Mae”), the Federal National Mortgage Association (“Fannie Mae”), the Federal Home Loan Mortgage Corporation (“Freddie Mac”), or other governmental or government-related entities. Ginnie Mae’s guarantees are backed by the full faith and credit of the U.S. Government, which means that the U.S. Government guarantees that the interest and principal will be paid when due. Fannie Mae and Freddie Mac securities are not backed by the full faith and credit of the U.S. Government. In September 2008, the Federal Housing Finance Agency (“FHFA”), an agency of the U.S. Government, placed Fannie Mae and Freddie Mac under conservatorship. Since that time, Fannie Mae and Freddie Mac have received capital support through U.S. Treasury preferred stock purchases, and Treasury and Federal Reserve purchases of their mortgage-backed securities. The FHFA and the U.S. Treasury have imposed strict limits on the size of these entities’ mortgage portfolios. The FHFA has the power to cancel any contract entered into by Fannie Mae and Freddie Mac prior to FHFA’s appointment as conservator or receiver, including the guarantee obligations of Fannie Mae and Freddie Mac.
The Fund may also purchase other mortgage- and asset-backed securities through single- and multi-seller conduits, collateralized debt obligations, structured investment vehicles, and other similar securities. Asset-backed securities may be backed by various consumer obligations, including automobile loans, equipment leases, credit card receivables, or other collateral. In the event the underlying loans are not paid, the securities’ issuer could be forced to sell the assets and recognize losses on such assets, which could impact your return. Unlike traditional debt instruments, payments on these securities include both interest and a partial payment of principal. Mortgage- and asset-backed securities are subject to both extension risk, where borrowers pay off their debt obligations more slowly in times of rising interest rates, and prepayment risk, where borrowers pay off their debt obligations sooner than expected in times of declining interest rates. These risks may reduce the Fund’s returns. In addition, investments in mortgage- and asset-backed securities, including those comprised of subprime mortgages, may be subject to a higher degree of credit risk, valuation risk, and liquidity risk than various other types of fixed-income securities. Additionally, although mortgage-backed securities are generally supported by some form of government or private guarantee and/or insurance, there is no assurance that guarantors or insurers will meet their obligations.
Offsetting Assets and Liabilities
The Fund presents gross and net information about transactions that are either offset in the financial statements or subject to an enforceable master netting arrangement or similar agreement with a designated counterparty, regardless of whether the transactions are actually offset in the Statement of Assets and Liabilities.
In order to better define its contractual rights and to secure rights that will help the Fund mitigate its counterparty risk, the Fund has entered into an International Swaps and Derivatives Association, Inc. Master Agreement (“ISDA Master Agreement”) or similar agreement with its derivative contract counterparties. An ISDA Master Agreement is a bilateral agreement between the Fund and a counterparty that governs OTC derivatives and forward foreign currency exchange contracts and typically contains, among other things, collateral posting terms and netting provisions in the event of a default and/or termination event. Under an ISDA Master Agreement, in the event of a default and/or termination event,
Janus Henderson Developed World Bond Fund
Notes to Financial Statements (unaudited)
the Fund may offset with each counterparty certain derivative financial instruments’ payables and/or receivables with collateral held and/or posted and create one single net payment.
The following tables present gross amounts of recognized assets and/or liabilities and the net amounts after deducting collateral that has been pledged by counterparties or has been pledged to counterparties (if applicable). For corresponding information grouped by type of instrument, see the “Fair Value of Derivative Instruments (not accounted for as hedging instruments) as of December 31, 2019” table located in the Fund’s Schedule of Investments.
| | | | | | | | | | |
Offsetting of Financial Assets and Derivative Assets |
| |
| | | Gross Amounts | | | | | | |
| | | of Recognized | | Offsetting Asset | | Collateral | | |
Counterparty | | Assets | | or Liability(a) | | Pledged(b) | | Net Amount |
| | | | | | | | | |
BNP Paribas | $ | 264,271 | $ | (264,271) | $ | — | $ | — |
| | | | | | | | | |
Offsetting of Financial Liabilities and Derivative Liabilities |
| |
| | | Gross Amounts | | | | | | |
| | | of Recognized | | Offsetting Asset | | Collateral | | |
Counterparty | | Liabilities | | or Liability(a) | | Pledged(b) | | Net Amount |
| | | | | | | | | |
Barclays Capital, Inc. | $ | 42,047 | $ | — | $ | — | $ | 42,047 |
BNP Paribas | | 11,954,671 | | (264,271) | | — | | 11,690,400 |
Citibank, National Association | | 616,724 | | — | | — | | 616,724 |
JPMorgan Chase & Co. | | 23,702 | | — | | — | | 23,702 |
JPMorgan Chase Bank, National Association | | 305,490 | | — | | — | | 305,490 |
| | | | | | | | | |
Total | $ | 12,942,634 | $ | (264,271) | $ | — | $ | 12,678,363 |
(a) | Represents the amount of assets or liabilities that could be offset with the same counterparty under master netting or similar agreements that management elects not to offset on the Statement of Assets and Liabilities. |
(b) | Collateral pledged is limited to the net outstanding amount due to/from an individual counterparty. The actual collateral amounts pledged may exceed these amounts and may fluctuate in value. |
The Fund generally does not exchange collateral on its forward foreign currency contracts with its counterparties; however, all liquid securities and restricted cash are considered to cover in an amount at all times equal to or greater than the Fund’s commitment with respect to these contracts. Certain securities may be segregated at the Fund’s custodian. These segregated securities are denoted on the accompanying Schedule of Investments and are evaluated daily to ensure their cover and/or market value equals or exceeds the Fund’s corresponding forward foreign currency exchange contract's obligation value.
The Fund may require the counterparty to pledge securities as collateral daily (based on the daily valuation of the financial asset) if the Fund has a net aggregate unrealized gain on OTC derivative contracts with a particular counterparty. The Fund may deposit cash as collateral with the counterparty and/or custodian daily (based on the daily valuation of the financial asset) if the Fund has a net aggregate unrealized loss on OTC derivative contracts with a particular counterparty. The collateral amounts are subject to minimum exposure requirements and initial margin requirements. Collateral amounts are monitored and subsequently adjusted up or down as valuations fluctuate by at least the minimum exposure requirement. Collateral may reduce the risk of loss.
Janus Henderson Developed World Bond Fund
Notes to Financial Statements (unaudited)
Real Estate Investing
The Fund may invest in equity and debt securities of real estate-related companies. Such companies may include those in the real estate industry or real estate-related industries. These securities may include common stocks, corporate bonds, preferred stocks, and other equity securities, including, but not limited to, mortgage-backed securities, real estate-backed securities, securities of REITs and similar REIT-like entities. A REIT is a trust that invests in real estate-related projects, such as properties, mortgage loans, and construction loans. REITs are generally categorized as equity, mortgage, or hybrid REITs. A REIT may be listed on an exchange or traded OTC.
Sovereign Debt
The Fund may invest in U.S. and non-U.S. government debt securities (“sovereign debt”). Some investments in sovereign debt, such as U.S. sovereign debt, are considered low risk. However, investments in sovereign debt, especially the debt of less developed countries, can involve a high degree of risk, including the risk that the governmental entity that controls the repayment of sovereign debt may not be willing or able to repay the principal and/or to pay the interest on its sovereign debt in a timely manner. A sovereign debtor’s willingness or ability to satisfy its debt obligation may be affected by various factors including, but not limited to, its cash flow situation, the extent of its foreign currency reserves, the availability of foreign exchange when a payment is due, the relative size of its debt position in relation to its economy as a whole, the sovereign debtor’s policy toward international lenders, and local political constraints to which the governmental entity may be subject. Sovereign debtors may also be dependent on expected disbursements from foreign governments, multilateral agencies, and other entities. The failure of a sovereign debtor to implement economic reforms, achieve specified levels of economic performance, or repay principal or interest when due may result in the cancellation of third party commitments to lend funds to the sovereign debtor, which may further impair such debtor’s ability or willingness to timely service its debts. The Fund may be requested to participate in the rescheduling of such sovereign debt and to extend further loans to governmental entities, which may adversely affect the Fund’s holdings. In the event of default, there may be limited or no legal remedies for collecting sovereign debt and there may be no bankruptcy proceedings through which the Fund may collect all or part of the sovereign debt that a governmental entity has not repaid. In addition, to the extent the Fund invests in non-U.S. sovereign debt, it may be subject to currency risk.
When-Issued, Delayed Delivery and Forward Commitment Transactions
The Fund may purchase or sell securities on a when-issued, delayed delivery, or forward commitment basis. When purchasing a security on a when-issued, delayed delivery, or forward commitment basis, the Fund assumes the rights and risks of ownership of the security, including the risk of price and yield fluctuations, and takes such fluctuations into account when determining its net asset value. Typically, no income accrues on securities the Fund has committed to purchase prior to the time delivery of the securities is made. Because the Fund is not required to pay for the security until the delivery date, these risks are in addition to the risks associated with the Fund’s other investments. If the other party to a transaction fails to deliver the securities, the Fund could miss a favorable price or yield opportunity. If the Fund remains substantially fully invested at a time when when-issued, delayed delivery, or forward commitment purchases are outstanding, the purchases may result in a form of leverage.
When the Fund has sold a security on a when-issued, delayed delivery, or forward commitment basis, the Fund does not participate in future gains or losses with respect to the security. If the other party to a transaction fails to pay for the securities, the Fund could suffer a loss. Additionally, when selling a security on a when-issued, delayed delivery, or forward commitment basis without owning the security, the Fund will incur a loss if the security’s price appreciates in value such that the security’s price is above the agreed upon price on the settlement date. The Fund may dispose of or renegotiate a transaction after it is entered into, and may purchase or sell when-issued, delayed delivery or forward commitment securities before the settlement date, which may result in a gain or loss.
Janus Henderson Developed World Bond Fund
Notes to Financial Statements (unaudited)
4. Investment Advisory Agreements and Other Transactions with Affiliates
The Fund pays Janus Capital Management LLC's (“Janus Capital”) an investment advisory fee which is calculated daily and paid monthly. The following table reflects the Fund’s contractual investment advisory fee rate (expressed as an annual rate).
| | |
Average Daily Net Assets of the Fund | Contractual Investment Advisory Fee (%) |
First $1 Billion | 0.55 |
Next $500 Million | 0.50 |
Above $1.5 Billion | 0.45 |
The Fund’s actual investment advisory fee rate for the reporting period was 0.54% of average annual net assets before any applicable waivers.
Janus Capital has entered into a personnel-sharing arrangement with its foreign (non-U.S.) affiliates, Henderson Global Investors Limited, Henderson Global Investors (Japan) Ltd., and Henderson Global Investors (Singapore) Ltd. (collectively, “HGIL”), pursuant to which HGIL and certain employees of HGIL serve as “associated persons” of Janus Capital. In this capacity, such employees of HGIL are subject to the oversight and supervision of Janus Capital and may provide portfolio management, research, and related services to the Fund on behalf of Janus Capital.
Janus Capital has contractually agreed to waive the advisory fee payable by the Fund or reimburse expenses in an amount equal to the amount, if any, that the Fund’s total annual fund operating expenses, including the investment advisory fee, but excluding the fees payable pursuant to a Rule 12b-1 plan, shareholder servicing fees, such as transfer agency fees (including out-of-pocket costs), administrative services fees and any networking/omnibus/administrative fees payable by any share class, brokerage commissions, interest, dividends, taxes, acquired fund fees and expenses, and extraordinary expenses, exceed the annual rate of 0.64% of the Fund’s average daily net assets. Janus Capital has agreed to continue the waivers until at least October 28, 2020. If applicable, amounts waived and/or reimbursed to the Fund by Janus Capital are disclosed as “Excess Expense Reimbursement and Waivers” on the Statement of Operations.
Janus Services LLC (“Janus Services”), a wholly-owned subsidiary of Janus Capital, is the Fund’s transfer agent. In addition, Janus Services provides or arranges for the provision of certain other administrative services including, but not limited to, recordkeeping, accounting, order processing, and other shareholder services for the Fund. Janus Services is not compensated for its services related to the shares, except for out-of-pocket costs. These amounts are disclosed as “Other transfer agent fees and expenses” on the Statement of Operations.
Certain, but not all, intermediaries may charge administrative fees (such as networking and omnibus) to investors in Class A Shares, Class C Shares, and Class I Shares for administrative services provided on behalf of such investors. These administrative fees are paid by the Class A Shares, Class C Shares, and Class I Shares of the Fund to Janus Services, which uses such fees to reimburse intermediaries. Consistent with the Transfer Agency Agreement between Janus Services and the Fund, Janus Services may negotiate the level, structure, and/or terms of the administrative fees with intermediaries requiring such fees on behalf of the Fund. Janus Capital and its affiliates benefit from an increase in assets that may result from such relationships. The Funds’ Trustees have set limits on fees that the Funds may incur with respect to administrative fees paid for omnibus or networked accounts. Such limits are subject to change by the Trustees in the future. These amounts are disclosed as “Transfer agent networking and omnibus fees” on the Statement of Operations.
Effective July 1, 2019, the Board of Trustees of Janus Investment Fund approved a new administrative fee rate for Class D Shares detailed in the table below.
| | |
Average Daily Net Assets of Class D Shares of the Janus Henderson funds | Administrative Services Fee |
Under $40 billion | 0.12% |
$40 billion – $49.9 billion | 0.10% |
Over $49.9 billion | 0.08% |
The Fund’s actual Class D administrative fee rate was 0.12% for the reporting period.
Janus Henderson Developed World Bond Fund
Notes to Financial Statements (unaudited)
Prior to July 1, 2019, the Fund’s Class D Shares paid an administrative services fee at an annual rate of 0.12% of the average daily net assets of Class D Shares for shareholder services provided by Janus Services. Janus Services provides or arranges for the provision of shareholder services including, but not limited to, recordkeeping, accounting, answering inquiries regarding accounts, transaction processing, transaction confirmations, and the mailing of prospectuses and shareholder reports. These amounts are disclosed as “Transfer agent administrative fees and expenses” on the Statement of Operations.
Janus Services receives an administrative services fee at an annual rate of up to 0.25% of the average daily net assets of the Fund’s Class S Shares and Class T Shares for providing or procuring administrative services to investors in Class S Shares and Class T Shares of the Fund. Janus Services expects to use all or a significant portion of this fee to compensate retirement plan service providers, broker-dealers, bank trust departments, financial advisors, and other financial intermediaries for providing these services. Janus Services or its affiliates may also pay fees for services provided by intermediaries to the extent the fees charged by intermediaries exceed the 0.25% of net assets charged to Class S Shares and Class T Shares of the Fund. Janus Services may keep certain amounts retained for reimbursement of out-of-pocket costs incurred for servicing clients of Class S Shares and Class T Shares. These amounts are disclosed as “Transfer agent administrative fees and expenses” on the Statement of Operations.
Services provided by these financial intermediaries may include, but are not limited to, recordkeeping, subaccounting, order processing, providing order confirmations, periodic statements, forwarding prospectuses, shareholder reports, and other materials to existing customers, answering inquiries regarding accounts, and other administrative services. Order processing includes the submission of transactions through the National Securities Clearing Corporation (“NSCC”) or similar systems, or those processed on a manual basis with Janus Capital. For all share classes, Janus Services also seeks reimbursement for costs it incurs as transfer agent and for providing servicing.
Janus Services is compensated for its services related to the Fund’s Class D Shares. These amounts are disclosed as “Other transfer agent fees and expenses” on the Statement of Operations.
Under a distribution and shareholder servicing plan (the “Plan”) adopted in accordance with Rule 12b-1 under the 1940 Act, the Fund pays the Trust’s distributor, Janus Henderson Distributors, a wholly-owned subsidiary of Janus Capital, a fee for the sale and distribution and/or shareholder servicing of the Shares at an annual rate of up to 0.25% of the Class A Shares’ average daily net assets, of up to 1.00% of the Class C Shares’ average daily net assets and of up to 0.25% of the Class S Shares’ average daily net assets. Under the terms of the Plan, the Trust is authorized to make payments to Janus Henderson Distributors for remittance to retirement plan service providers, broker-dealers, bank trust departments, financial advisors, and other financial intermediaries, as compensation for distribution and/or shareholder services performed by such entities for their customers who are investors in the Fund. These amounts are disclosed as “12b-1 Distribution and shareholder servicing fees” on the Statement of Operations. Payments under the Plan are not tied exclusively to actual 12b-1 distribution and shareholder service expenses, and the payments may exceed 12b-1 distribution and shareholder service expenses actually incurred. If any of the Fund’s actual 12b-1 distribution and shareholder service expenses incurred during a calendar year are less than the payments made during a calendar year, the Fund will be refunded the difference. Refunds, if any, are included in “12b-1 Distribution and shareholder servicing fees” in the Statement of Operations.
Janus Capital serves as administrator to the Fund pursuant to an administration agreement between Janus Capital and the Trust. Under the administration agreement, Janus Capital is obligated to provide or arrange for the provision of certain administration, compliance, and accounting services to the Fund, including providing office space for the Fund, and is reimbursed by the Fund for certain of its costs in providing these services (to the extent Janus Capital seeks reimbursement and such costs are not otherwise waived). In addition, employees of Janus Capital and/or its affiliates may serve as officers of the Trust. The Fund pays for some or all of the salaries, fees, and expenses of Janus Capital employees and Fund officers, with respect to certain specified administration functions they perform on behalf of the Fund. The Fund pays these costs based on out-of-pocket expenses incurred by Janus Capital, and these costs are separate and apart from advisory fees and other expenses paid in connection with the investment advisory services Janus Capital (or any subadvisor, as applicable) provides to the Fund. These amounts are disclosed as “Affiliated fund administration fees” on the Statement of Operations. In addition, some expenses related to compensation payable to the Fund’s Chief Compliance Officer and certain compliance staff, all of whom are employees of Janus Capital and/or its affiliates, are shared with the Fund. Total compensation of $230,755 was paid to the Chief Compliance Officer and certain compliance staff by the Trust during the period ended December 31, 2019. The Fund's portion is reported as part of “Other expenses” on the Statement of Operations.
Janus Henderson Developed World Bond Fund
Notes to Financial Statements (unaudited)
The Board of Trustees has adopted a deferred compensation plan (the “Deferred Plan”) for independent Trustees to elect to defer receipt of all or a portion of the annual compensation they are entitled to receive from the Fund. All deferred fees are credited to an account established in the name of the Trustees. The amounts credited to the account then increase or decrease, as the case may be, in accordance with the performance of one or more of the Janus Henderson funds that are selected by the Trustees. The account balance continues to fluctuate in accordance with the performance of the selected fund or funds until final payment of all amounts are credited to the account. The fluctuation of the account balance is recorded by the Fund as unrealized appreciation/(depreciation) and is included as of December 31, 2019 on the Statement of Assets and Liabilities in the asset, “Non-interested Trustees’ deferred compensation,” and liability, “Non-interested Trustees’ deferred compensation fees.” Additionally, the recorded unrealized appreciation/(depreciation) is included in “Total distributable earnings (loss)” on the Statement of Assets and Liabilities. Deferred compensation expenses for the period ended December 31, 2019 are included in “Non-interested Trustees’ fees and expenses” on the Statement of Operations. Trustees are allowed to change their designation of mutual funds from time to time. Amounts will be deferred until distributed in accordance with the Deferred Plan. Deferred fees of $236,725 were paid by the Trust to the Trustees under the Deferred Plan during the period ended December 31, 2019.
Class A Shares include a 4.75% upfront sales charge of the offering price of the Fund. The sales charge is allocated between Janus Henderson Distributors and financial intermediaries. During the period ended December 31, 2019, Janus Henderson Distributors retained upfront sales charges of $4,822..
A contingent deferred sales charge (“CDSC”) of 1.00% will be deducted with respect to Class A Shares purchased without a sales load and redeemed within 12 months of purchase, unless waived. Any applicable CDSC will be 1.00% of the lesser of the original purchase price or the value of the redemption of the Class A Shares redeemed. There were no CDSCs paid by redeeming shareholders of Class A Shares to Janus Henderson Distributors during the period ended December 31, 2019.
A CDSC of 1.00% will be deducted with respect to Class C Shares redeemed within 12 months of purchase, unless waived. Any applicable CDSC will be 1.00% of the lesser of the original purchase price or the value of the redemption of the Class C Shares redeemed. During the period ended December 31, 2019, redeeming shareholders of Class C Shares paid CDSCs of $1,984.
As of December 31, 2019, shares of the Fund were owned by affiliates of Janus Henderson Investors, and/or other funds advised by Janus Henderson, as indicated in the table below:
| | | | | | | |
Class | % of Class Owned | | % of Fund Owned | | |
Class A Shares | -* | % | -* | % | |
Class C Shares | -* | | -* | | |
Class D Shares | -* | | -* | | |
Class I Shares | -* | | -* | | |
Class N Shares | -* | | -* | | |
Class S Shares | 25 | | -* | | |
Class T Shares | -* | | -* | | |
| | | | | | |
* | Less than 0.50% | | | | | |
In addition, other shareholders, including other funds, individuals, accounts, as well as the Fund’s portfolio manager(s) and/or investment personnel, may from time to time own (beneficially or of record) a significant percentage of the Fund’s Shares and can be considered to “control” the Fund when that ownership exceeds 25% of the Fund’s assets (and which may differ from control as determined in accordance with accounting principles generally accepted in the United States of America).
5. Federal Income Tax
Income and capital gains distributions are determined in accordance with income tax regulations that may differ from accounting principles generally accepted in the United States of America. These differences are due to differing treatments for items such as net short-term gains, deferral of wash sale losses, foreign currency transactions, net investment losses, and capital loss carryovers.
Janus Henderson Developed World Bond Fund
Notes to Financial Statements (unaudited)
The Fund has elected to treat gains and losses on forward foreign currency contracts as capital gains and losses, if applicable. Other foreign currency gains and losses on debt instruments are treated as ordinary income for federal income tax purposes pursuant to Section 988 of the Internal Revenue Code.
The aggregate cost of investments and the composition of unrealized appreciation and depreciation of investment securities for federal income tax purposes as of December 31, 2019 are noted below. The primary difference between book and tax appreciation or depreciation of investments is wash sale loss deferrals.
| | | | |
Federal Tax Cost | Unrealized
Appreciation | Unrealized
(Depreciation) | Net Tax Appreciation/
(Depreciation) |
$ 1,506,281,837 | $30,093,297 | $ (6,856,185) | $ 23,237,112 |
| | | | |
Information on the tax components of derivatives as of December 31, 2019 is as follows:
| | | | |
Federal Tax Cost | Unrealized
Appreciation | Unrealized
(Depreciation) | Net Tax Appreciation/
(Depreciation) |
$ (120,711) | $ 1,420,080 | $(12,821,923) | $ (11,401,843) |
| | | | |
Tax cost of investments and unrealized appreciation/(depreciation) may also include timing differences that do not constitute adjustments to tax basis.
Janus Henderson Developed World Bond Fund
Notes to Financial Statements (unaudited)
6. Capital Share Transactions
| | | | | | | |
| | | | | | | |
| | | Period ended December 31, 2019 | | Year ended June 30, 2019 |
| | | Shares | Amount | | Shares | Amount |
| | | | | | | |
Class A Shares: | | | | | |
Shares sold | 2,054,214 | $ 20,210,165 | | 2,714,859 | $ 25,387,242 |
Reinvested dividends and distributions | 148,746 | 1,442,696 | | 191,151 | 1,761,837 |
Shares repurchased | (1,162,062) | (11,435,771) | | (1,939,609) | (18,111,329) |
Net Increase/(Decrease) | 1,040,898 | $ 10,217,090 | | 966,401 | $ 9,037,750 |
Class C Shares: | | | | | |
Shares sold | 642,300 | $ 6,288,724 | | 1,394,794 | $ 12,946,996 |
Reinvested dividends and distributions | 79,603 | 764,509 | | 138,504 | 1,265,431 |
Shares repurchased | (647,975) | (6,333,196) | | (1,986,228) | (18,369,390) |
Net Increase/(Decrease) | 73,928 | $ 720,037 | | (452,930) | $ (4,156,963) |
Class D Shares: | | | | | |
Shares sold | 953,045 | $ 9,403,222 | | 1,093,219 | $ 10,214,052 |
Reinvested dividends and distributions | 55,853 | 541,431 | | 46,230 | 427,186 |
Shares repurchased | (510,168) | (5,023,980) | | (429,537) | (4,004,322) |
Net Increase/(Decrease) | 498,730 | $ 4,920,673 | | 709,912 | $ 6,636,916 |
Class I Shares: | | | | | |
Shares sold | 46,466,437 | $455,938,888 | | 53,728,431 | $500,759,655 |
Reinvested dividends and distributions | 3,012,052 | 29,132,147 | | 3,206,723 | 29,510,107 |
Shares repurchased | (16,176,607) | (159,066,040) | | (29,498,177) | (274,142,751) |
Net Increase/(Decrease) | 33,301,882 | $326,004,995 | | 27,436,977 | $256,127,011 |
Class N Shares: | | | | | |
Shares sold | 1,341,922 | $ 13,217,206 | | 411,227 | $ 3,834,769 |
Reinvested dividends and distributions | 41,964 | 405,678 | | 26,313 | 241,984 |
Shares repurchased | (129,304) | (1,270,142) | | (285,813) | (2,678,194) |
Net Increase/(Decrease) | 1,254,582 | $ 12,352,742 | | 151,727 | $ 1,398,559 |
Class S Shares: | | | | | |
Shares sold | 5,963 | $ 58,891 | | 2,902 | $ 26,903 |
Reinvested dividends and distributions | 562 | 5,437 | | 699 | 6,438 |
Shares repurchased | - | - | | (202) | (1,897) |
Net Increase/(Decrease) | 6,525 | $ 64,328 | | 3,399 | $ 31,444 |
Class T Shares: | | | | | |
Shares sold | 8,455,428 | $ 83,107,547 | | 6,290,721 | $ 58,863,242 |
Reinvested dividends and distributions | 329,968 | 3,193,805 | | 217,967 | 2,010,991 |
Shares repurchased | (2,599,944) | (25,339,277) | | (2,435,553) | (22,663,210) |
Net Increase/(Decrease) | 6,185,452 | $ 60,962,075 | | 4,073,135 | $ 38,211,023 |
7. Purchases and Sales of Investment Securities
For the period ended December 31, 2019, the aggregate cost of purchases and proceeds from sales of investment securities (excluding any short-term securities, short-term options contracts, TBAs, and in-kind transactions, as applicable) was as follows:
| | | | |
Purchases of
Securities | Proceeds from Sales
of Securities | Purchases of Long-
Term U.S. Government
Obligations | Proceeds from Sales
of Long-Term U.S.
Government Obligations |
$706,947,254 | $ 347,048,328 | $ 36,044,866 | $ 43,771,487 |
8. Recent Accounting Pronouncements
The FASB issued Accounting Standards Update No. 2017-08, Receivables – Nonrefundable Fees and Other Costs (Subtopic 310-20), Premium Amortization on Purchased Callable Debt Securities ("ASU 2017-08") to amend the
Janus Henderson Developed World Bond Fund
Notes to Financial Statements (unaudited)
amortization period for certain purchased callable debt securities held at a premium. The guidance requires certain premiums on callable debt securities to be amortized to the earliest call date. The amortization period for callable debt securities purchased at a discount will not be impacted. The amendments are effective for fiscal years and interim periods within those fiscal years, beginning after December 15, 2018. Management has adopted the amendments as of the beginning of this fiscal period.
The FASB issued Accounting Standards Update 2018-13, Fair Value Measurement (Topic 820) in August 2018. The new guidance removes, modifies and enhances the disclosures to Topic 820. For public entities, the amendments are effective for financial statements issued for fiscal years beginning after December 15, 2019, and interim periods within those fiscal years. An entity is permitted, and Management has decided, to early adopt the removed and modified disclosures in these financial statements.
9. Subsequent Event
Management has evaluated whether any events or transactions occurred subsequent to December 31, 2019 and through the date of issuance of the Fund’s financial statements and determined that there were no material events or transactions that would require recognition or disclosure in the Fund’s financial statements.
Janus Henderson Developed World Bond Fund
Additional Information (unaudited)
Proxy Voting Policies and Voting Record
A description of the policies and procedures that the Fund uses to determine how to vote proxies relating to its portfolio securities is available without charge: (i) upon request, by calling 1-800-525-1093; (ii) on the Fund’s website at janushenderson.com/proxyvoting; and (iii) on the SEC’s website at http://www.sec.gov. Additionally, information regarding the Fund’s proxy voting record for the most recent twelve-month period ended June 30 is also available, free of charge, through janushenderson.com/proxyvoting and from the SEC’s website at http://www.sec.gov.
Full Holdings
The Fund is required to disclose its complete holdings as an exhibit to Form N-PORT within 60 days of the end of the first and third fiscal quarters, and in the annual report and semiannual report to Fund shareholders. Historically, the Fund filed its complete portfolio holdings (schedule of investments) with the SEC for the first and third quarters each fiscal year on Form N-Q. The Fund’s Form N-PORT and Form N-Q filings: (i) are available on the SEC’s website at http://www.sec.gov; (ii) may be reviewed and copied at the SEC’s Public Reference Room in Washington, D.C. (information on the Public Reference Room may be obtained by calling 1-800-SEC-0330); and (iii) are available without charge, upon request, by calling a Janus Henderson representative at 1-877-335-2687 (toll free) (or 1-800-525-3713 if you hold Class D shares). Portfolio holdings consisting of at least the names of the holdings are generally available on a monthly basis with a 30-day lag. Holdings are generally posted approximately two business days thereafter under Full Holdings for the Fund at janushenderson.com/info (or janushenderson.com/reports if you hold Class D Shares).
APPROVAL OF ADVISORY AGREEMENTS DURING THE PERIOD
The Trustees of Janus Aspen Series, each of whom serves as an “independent” Trustee (the “Trustees”), oversee the management of each Portfolio of Janus Aspen Series (each, a “VIT Portfolio,” and collectively, the “VIT Portfolios”), as well as each Fund of Janus Investment Fund (together with the VIT Portfolios, the “Janus Henderson Funds,” and each, a “Janus Henderson Fund”). As required by law, the Trustees determine annually whether to continue the investment advisory agreement for each Janus Henderson Fund and the subadvisory agreements for the Janus Henderson Funds that utilize subadvisers.
In connection with their most recent consideration of those agreements for each Janus Henderson Fund, the Trustees received and reviewed information provided by Janus Capital and the respective subadvisers in response to requests of the Trustees and their independent legal counsel. They also received and reviewed information and analysis provided by, and in response to requests of, their independent fee consultant. Throughout their consideration of the agreements, the Trustees were advised by their independent legal counsel. The Trustees met with management to consider the agreements, and also met separately in executive session with their independent legal counsel and their independent fee consultant.
At a meeting held on December 5, 2019, based on the Trustees’ evaluation of the information provided by Janus Capital, the subadvisers, and the independent fee consultant, as well as other information, the Trustees determined that the overall arrangements between each Janus Henderson Fund and Janus Capital and each subadviser, as applicable, were fair and reasonable in light of the nature, extent and quality of the services provided by Janus Capital, its affiliates and the subadvisers, the fees charged for those services, and other matters that the Trustees considered relevant in the exercise of their business judgment. At that meeting, the Trustees unanimously approved the continuation of the investment advisory agreement for each Janus Henderson Fund, and the subadvisory agreement for each subadvised Janus Henderson Fund, for the period from February 1, 2020 through February 1, 2021, subject to earlier termination as provided for in each agreement.
In considering the continuation of those agreements, the Trustees reviewed and analyzed various factors that they determined were relevant, including the factors described below, none of which by itself was considered dispositive. However, the material factors and conclusions that formed the basis for the Trustees’ determination to approve the continuation of the agreements are discussed separately below. Also included is a summary of the independent fee consultant’s conclusions and opinions that arose during, and were included as part of, the Trustees’ consideration of the agreements. “Management fees,” as used herein, reflect actual annual advisory fees and, for the purpose of peer comparisons any administration fees (excluding out of pocket costs), net of any waivers, paid by a fund as a percentage of average net assets.
Janus Henderson Developed World Bond Fund
Additional Information (unaudited)
Nature, Extent and Quality of Services
The Trustees reviewed the nature, extent and quality of the services provided by Janus Capital and the subadvisers to the Janus Henderson Funds, taking into account the investment objective, strategies and policies of each Janus Henderson Fund, and the knowledge the Trustees gained from their regular meetings with management on at least a quarterly basis and their ongoing review of information related to the Janus Henderson Funds. In addition, the Trustees reviewed the resources and key personnel of Janus Capital and each subadviser, particularly noting those employees who provide investment and risk management services to the Janus Henderson Funds. The Trustees also considered other services provided to the Janus Henderson Funds by Janus Capital or the subadvisers, such as managing the execution of portfolio transactions and the selection of broker-dealers for those transactions. The Trustees considered Janus Capital’s role as administrator to the Janus Henderson Funds, noting that Janus Capital generally, does not receive a fee for its services but is reimbursed for its out-of-pocket costs. The Trustees considered the role of Janus Capital in monitoring adherence to the Janus Henderson Funds’ investment restrictions, providing support services for the Trustees and Trustee committees, and overseeing communications with shareholders and the activities of other service providers, including monitoring compliance with various policies and procedures of the Janus Henderson Funds and with applicable securities laws and regulations.
In this regard, the independent fee consultant noted that Janus Capital provides a number of different services for the Janus Henderson Funds and fund shareholders, ranging from investment management services to various other servicing functions, and that, in its view, Janus Capital is a capable provider of those services. The independent fee consultant also provided its belief that Janus Capital has developed a number of institutional competitive advantages that should enable it to provide superior investment and service performance over the long term.
The Trustees concluded that the nature, extent and quality of the services provided by Janus Capital or the subadviser to each Janus Henderson Fund were appropriate and consistent with the terms of the respective advisory and subadvisory agreements, and that, taking into account steps taken to address those Janus Henderson Funds whose performance lagged that of their peers for certain periods, the Janus Henderson Funds were likely to benefit from the continued provision of those services. They also concluded that Janus Capital and each subadviser had sufficient personnel, with the appropriate education and experience, to serve the Janus Henderson Funds effectively and had demonstrated its ability to attract well-qualified personnel.
Performance of the Funds
The Trustees considered the performance results of each Janus Henderson Fund over various time periods. They noted that they considered Janus Henderson Fund performance data throughout the year, including periodic meetings with each Janus Henderson Fund’s portfolio manager(s), and also reviewed information comparing each Janus Henderson Fund’s performance with the performance of comparable funds and peer groups identified by Broadridge Financial Solutions, Inc. (“Broadridge”), an independent data provider, and with the Janus Henderson Fund’s benchmark index. In this regard, the independent fee consultant found that the overall Janus Henderson Funds’ performance has been reasonable: for the 36 months ended September 30, 2019, approximately 69% of the Janus Henderson Funds were in the top two quartiles of performance, as reported by Morningstar, and for the 12 months ended September 30, 2019, approximately 71% of the Janus Henderson Funds were in the top two quartiles of performance, as reported by Morningstar.
The Trustees considered the performance of each Fund, noting that performance may vary by share class, and noted the following:
Alternative Fund
· For Janus Henderson Diversified Alternatives Fund, the Trustees noted that the Fund’s performance was in the third Broadridge quartile for the 36 months ended May 31, 2019 and the bottom Broadridge quartile for the 12 months ended May 31, 2019. The Trustees noted the reasons for the Fund’s underperformance, the steps Janus Capital had taken or was taking to improve performance.
Asset Allocation Funds
· For Janus Henderson Global Allocation Fund – Conservative, the Trustees noted that the Fund’s performance was in the third Broadridge quartile for the 36 months ended May 31, 2019 and the bottom Broadridge quartile for the 12 months ended May 31, 2019. The Trustees noted the reasons for the Fund’s underperformance, the steps Janus Capital had taken or was taking to improve performance.
Janus Henderson Developed World Bond Fund
Additional Information (unaudited)
· For Janus Henderson Global Allocation Fund – Growth, the Trustees noted that the Fund’s performance was in the third Broadridge quartile for the 36 months ended May 31, 2019 and the bottom Broadridge quartile for the 12 months ended May 31, 2019. The Trustees noted the reasons for the Fund’s underperformance, the steps Janus Capital had taken or was taking to improve performance.
· For Janus Henderson Global Allocation Fund – Moderate, the Trustees noted that the Fund’s performance was in the third Broadridge quartile for the 36 months ended May 31, 2019 and the bottom Broadridge quartile for the 12 months ended May 31, 2019. The Trustees noted the reasons for the Fund’s underperformance, the steps Janus Capital had taken or was taking to improve performance.
Fixed-Income Funds
· For Janus Henderson Absolute Return Income Opportunities Fund, the Trustees noted that the Fund’s performance was in the bottom Broadridge quartile for the 36 months ended May 31, 2019 and the third Broadridge quartile for the 12 months ended May 31, 2019. The Trustees noted the reasons for the Fund’s underperformance and the steps Janus Capital had taken or was taking to improve performance.
· For Janus Henderson Developed World Bond Fund, the Trustees noted the Fund’s performance was in the second Broadridge quartile for the 36 months ended May 31, 2019 and the first quartile for the 12 months ended May 31, 2019.
· For Janus Henderson Flexible Bond Fund, the Trustees noted that the Fund’s performance was in the bottom Broadridge quartile for the 36 months ended May 31, 2019 and the bottom Broadridge quartile for the 12 months ended May 31, 2019. The Trustees noted the reasons for the Fund’s underperformance and the steps Janus Capital had taken or was taking to improve performance.
· For Janus Henderson Global Bond Fund, the Trustees noted that the Fund’s performance was in the bottom Broadridge quartile for the 36 months ended May 31, 2019 and the bottom Broadridge quartile for the 12 months ended May 31, 2019. The Trustees noted the reasons for the Fund’s underperformance, the steps Janus Capital had taken or was taking to improve performance.
· For Janus Henderson High-Yield Fund, the Trustees noted that the Fund’s performance was in the second Broadridge quartile for the 36 months ended May 31, 2019 and the second Broadridge quartile for the 12 months ended May 31, 2019.
· For Janus Henderson Multi-Sector Income Fund, the Trustees noted that the Fund’s performance was in the first Broadridge quartile for the 36 months ended May 31, 2019 and the first Broadridge quartile for the 12 months ended May 31, 2019.
· For Janus Henderson Short-Term Bond Fund, the Trustees noted that the Fund’s performance was in the bottom Broadridge quartile for the 36 months ended May 31, 2019 and the third Broadridge quartile for the 12 months ended May 31, 2019. The Trustees noted the reasons for the Fund’s underperformance and the steps Janus Capital had taken or was taking to improve performance.
Global and International Equity Funds
· For Janus Henderson Asia Equity Fund, the Trustees noted that the Fund’s performance was in the first Broadridge quartile for the 36 months ended May 31, 2019 and the second Broadridge quartile for the 12 months ended May 31, 2019.
· For Janus Henderson Emerging Markets Fund, the Trustees noted that the Fund’s performance was in the bottom Broadridge quartile for the 36 months ended May 31, 2019 and the second Broadridge quartile for the 12 months ended May 31, 2019. The Trustees noted the reasons for the Fund’s underperformance and the steps Janus Capital had taken or was taking to improve performance, and that the performance trend was improving
· For Janus Henderson European Focus Fund, the Trustees noted that the Fund’s performance was in the bottom Broadridge quartile for the 36 months ended May 31, 2019 and the bottom Broadridge quartile for the 12 months ended May 31, 2019. The Trustees noted the reasons for the Fund’s underperformance and the steps Janus Capital had taken or was taking to improve performance.
· For Janus Henderson Global Equity Income Fund, the Trustees noted that the Fund’s performance was in the bottom Broadridge quartile for the 36 months ended May 31, 2019 and the bottom Broadridge quartile for the 12
Janus Henderson Developed World Bond Fund
Additional Information (unaudited)
months ended May 31, 2019. The Trustees noted the reasons for the Fund’s underperformance and the steps Janus Capital had taken or was taking to improve performance.
· For Janus Henderson Global Life Sciences Fund, the Trustees noted that the Fund’s performance was in the first Broadridge quartile for the 36 months ended May 31, 2019 and the second Broadridge quartile for the 12 months ended May 31, 2019.
· For Janus Henderson Global Real Estate Fund, the Trustees noted that the Fund’s performance was in the first Broadridge quartile for the 36 months ended May 31, 2019 and the first Broadridge quartile for the 12 months ended May 31, 2019.
· For Janus Henderson Global Research Fund, the Trustees noted that the Fund’s performance was in the third Broadridge quartile for the 36 months ended May 31, 2019 and the third Broadridge quartile for the 12 months ended May 31, 2019. The Trustees noted the reasons for the Fund’s underperformance, while also noting that the Fund has a performance fee structure that results in lower management fees during periods of underperformance, and the steps Janus Capital had taken or was taking to improve performance.
· For Janus Henderson Global Select Fund, the Trustees noted that the Fund’s performance was in the first Broadridge quartile for the 36 months ended May 31, 2019 and the bottom Broadridge quartile for the 12 months ended May 31, 2019.
· For Janus Henderson Global Technology Fund, the Trustees noted that the Fund’s performance was in the second Broadridge quartile for the 36 months ended May 31, 2019 and the first Broadridge quartile for the 12 months ended May 31, 2019.
· For Janus Henderson Global Value Fund, the Trustees noted that the Fund’s performance was in the second Broadridge quartile for the 36 months ended May 31, 2019 and the first Broadridge quartile for the 12 months ended May 31, 2019.
· For Janus Henderson International Opportunities Fund, the Trustees noted that the Fund’s performance was in the bottom Broadridge quartile for the 36 months ended May 31, 2019 and the bottom Broadridge quartile for the 12 months ended May 31, 2019. The Trustees noted the reasons for the Fund’s underperformance and the steps Janus Capital had taken or was taking to improve performance.
· For Janus Henderson International Small Cap Fund, the Trustees noted that the Fund’s performance was in the bottom Broadridge quartile for the 12 months ended May 31, 2019. The Trustees noted the reasons for the Fund’s underperformance, the steps Janus Capital had taken or was taking to improve performance, and its limited performance history.
· For Janus Henderson International Value Fund, the Trustees noted that the Fund’s performance was in the bottom Broadridge quartile for the 36 months ended May 31, 2019 and the second Broadridge quartile for the 12 months ended May 31, 2019. The Trustees noted the reasons for the Fund’s underperformance and the steps Janus Capital and Perkins had taken or were taking to improve performance, and that the performance trend was improving
· For Janus Henderson Overseas Fund, the Trustees noted that the Fund’s performance was in the second Broadridge quartile for the 36 months ended May 31, 2019 and the bottom Broadridge quartile for the 12 months ended May 31, 2019.
Money Market Funds
· For Janus Henderson Government Money Market Fund, the Trustees noted that the Fund’s performance was in the second Broadridge quartile for the 36 months ended May 31, 2019 and the third Broadridge quartile for the 12 months ended May 31, 2019.
· For Janus Henderson Money Market Fund, the Trustees noted that the Fund’s performance was in the third Broadridge quartile for the 36 months ended May 31, 2019 and the third Broadridge quartile for the 12 months ended May 31, 2019. The Trustees noted the reasons for the Fund’s underperformance and the steps Janus Capital had taken or was taking to improve performance.
Janus Henderson Developed World Bond Fund
Additional Information (unaudited)
Multi-Asset Funds
· For Janus Henderson Adaptive Global Allocation Fund, the Trustees noted that the Fund’s performance was in third quartile for the 36 months ended May 31, 2019 and the third Broadridge quartile for the 12 months ended May 31, 2019. The Trustees noted the reasons for the Fund’s underperformance and the steps Janus Capital had taken or was taking to improve performance.
· For Janus Henderson Dividend & Income Builder Fund, the Trustees noted that the Fund’s performance was in the third Broadridge quartile for the 36 months ended May 31, 2019 and the third Broadridge quartile for the 12 months ended May 31, 2019. The Trustees noted the reasons for the Fund’s underperformance and the steps Janus Capital had taken or was taking to improve performance.
· For Janus Henderson Value Plus Income Fund, the Trustees noted that the Fund’s performance was in the first Broadridge quartile for the 36 months ended May 31, 2019 and the first Broadridge quartile for the 12 months ended May 31, 2019.
Multi-Asset U.S. Equity Funds
· For Janus Henderson Balanced Fund, the Trustees noted that the Fund’s performance was in the first Broadridge quartile for the 36 months ended May 31, 2019 and the first Broadridge quartile for the 12 months ended May 31, 2019.
· For Janus Henderson Contrarian Fund, the Trustees noted that the Fund’s performance was in the second Broadridge quartile for the 36 months ended May 31, 2019 and the first Broadridge quartile for the 12 months ended May 31, 2019.
· For Janus Henderson Enterprise Fund, the Trustees noted that the Fund’s performance was in the first Broadridge quartile for the 36 months ended May 31, 2019 and the first Broadridge quartile for the 12 months ended May 31, 2019.
· For Janus Henderson Forty Fund, the Trustees noted that the Fund’s performance was in the second Broadridge quartile for the 36 months ended May 31, 2019 and the first Broadridge quartile for the 12 months ended May 31, 2019.
· For Janus Henderson Growth and Income Fund, the Trustees noted that the Fund’s performance was in the first Broadridge quartile for the 36 months ended May 31, 2019 and the second Broadridge quartile for the 12 months ended May 31, 2019.
· For Janus Henderson Research Fund, the Trustees noted that the Fund’s performance was in the third Broadridge quartile for the 36 months ended May 31, 2019 and the second Broadridge quartile for the 12 months ended May 31, 2019. The Trustees noted the reasons for the Fund’s underperformance, while also noting that the Fund has a performance fee structure that results in lower management fees during periods of underperformance, and the steps Janus Capital had taken or was taking to improve performance, and that the performance trend was improving.
· For Janus Henderson Triton Fund, the Trustees noted that the Fund’s performance was in the third Broadridge quartile for the 36 months ended May 31, 2019 and the second Broadridge quartile for the 12 months ended May 31, 2019. The Trustees noted the reasons for the Fund’s underperformance, and the steps Janus Capital had taken or was taking to improve performance, and that the performance trend was improving.
· For Janus Henderson U.S. Growth Opportunities Fund, the Trustees noted that the Fund’s performance was in the third Broadridge quartile for the 36 months ended May 31, 2019 and the first Broadridge quartile for the 12 months ended May 31, 2019. The Trustees noted the reasons for the Fund’s underperformance, and the steps Janus Capital and Geneva had taken or were taking to improve performance, and that the performance trend was improving.
· For Janus Henderson Venture Fund, the Trustees noted that the Fund’s performance was in the third Broadridge quartile for the 36 months ended May 31, 2019 and the second Broadridge quartile for the 12 months ended May 31, 2019. The Trustees noted the reasons for the Fund’s underperformance, and the steps Janus Capital had taken or was taking to improve performance, and that the performance trend was improving.
Janus Henderson Developed World Bond Fund
Additional Information (unaudited)
Quantitative Equity Funds
· For Janus Henderson Emerging Markets Managed Volatility Fund, the Trustees noted that the Fund’s performance was in the second Broadridge quartile for the 36 months ended May 31, 2019 and the first Broadridge quartile for the 12 months ended May 31, 2019.
· For Janus Henderson Global Income Managed Volatility Fund, the Trustees noted that the Fund’s performance was in the second Broadridge quartile for the 36 months ended May 31, 2019 and the first Broadridge quartile for the 12 months ended May 31, 2019.
· For Janus Henderson International Managed Volatility Fund, the Trustees noted that the Fund’s performance was in the third Broadridge quartile for the 36 months ended May 31, 2019 and the second Broadridge quartile for the 12 months ended May 31, 2019. The Trustees noted the reasons for the Fund’s underperformance, the steps Janus Capital and Intech had taken or were taking to improve performance, and that the performance trend was improving.
· For Janus Henderson U.S. Managed Volatility Fund, the Trustees noted that the Fund’s performance was in the second Broadridge quartile for the 36 months ended May 31, 2019 and the second Broadridge quartile for the 12 months ended May 31, 2019.
U.S. Equity Funds
· For Janus Henderson Large Cap Value Fund, the Trustees noted that the Fund’s performance was in the second Broadridge quartile for the 36 months ended May 31, 2019 and the first Broadridge quartile for the 12 months ended May 31, 2019.
· For Janus Henderson Mid Cap Value Fund, the Trustees noted that the Fund’s performance was in the second Broadridge quartile for the 36 months ended May 31, 2019 and the second Broadridge quartile for the 12 months ended May 31, 2019.
· For Janus Henderson Small Cap Value Fund, the Trustees noted that the Fund’s performance was in the second Broadridge quartile for the 36 months ended May 31, 2019 and the first Broadridge quartile for the 12 months ended May 31, 2019.
· For Janus Henderson Small-Mid Cap Value Fund, the Trustees noted that the Fund’s performance was in the third Broadridge quartile for the 36 months ended May 31, 2019 and the second Broadridge quartile for the 12 months ended May 31, 2019. The Trustees noted the reasons for the Fund’s underperformance, while also noting that the Fund has a performance fee structure that results in lower management fees during periods of underperformance, and the steps Janus Capital and Perkins had taken or were taking to improve performance, and that the performance trend was improving.
In consideration of each Janus Henderson Fund’s performance, the Trustees concluded that, taking into account the factors relevant to performance, as well as other considerations, including steps taken to improve performance, the Janus Henderson Fund’s performance warranted continuation of such Janus Henderson Fund’s investment advisory and subadvisory agreement(s).
Costs of Services Provided
The Trustees examined information regarding the fees and expenses of each Janus Henderson Fund in comparison to similar information for other comparable funds as provided by Broadridge, an independent data provider. They also reviewed an analysis of that information provided by their independent fee consultant and noted that the rate of management fees (investment advisory and any administration but excluding out-of-pocket costs) for many of the Janus Henderson Funds, after applicable waivers, was below the average management fee rate of the respective peer group of funds selected by an independent data provider. The Trustees also examined information regarding the subadvisory fees charged for subadvisory services, as applicable, noting that all such fees were paid by Janus Capital out of its management fees collected from such Janus Henderson Fund.
The independent fee consultant provided its belief that the management fees charged by Janus Capital to each of the Janus Henderson Funds under the current investment advisory and administration agreements are reasonable in relation to the services provided by Janus Capital. The independent fee consultant found: (1) the total expenses and management fees of the Janus Henderson Funds to be reasonable relative to other mutual funds; (2) the total expenses, on average, were 10% under the average total expenses of their respective Broadridge Expense Group
Janus Henderson Developed World Bond Fund
Additional Information (unaudited)
peers; and (3) and the management fees for the Janus Henderson Funds, on average, were 7% under the average management fees for their Expense Groups. The Trustees also considered the total expenses for each share class of each Janus Henderson Fund compared to the average total expenses for its Broadridge Expense Group peers and to average total expenses for its Broadridge Expense Universe.
For certain Janus Henderson Funds, the independent fee consultant also performed a systematic “focus list” analysis of expenses which assessed fund fees in the context of fund performance being delivered. Based on this analysis, the independent fee consultant found that the combination of service quality/performance and expenses on these individual Janus Henderson Funds was reasonable in light of performance trends, performance histories, and existence of performance fees, breakpoints, and/or expense waivers on such Janus Henderson Funds.
The Trustees considered the methodology used by Janus Capital and each subadviser in determining compensation payable to portfolio managers, the competitive environment for investment management talent, and the competitive market for mutual funds in different distribution channels.
The Trustees also reviewed management fees charged by Janus Capital and each subadviser to comparable separate account clients and to comparable non-affiliated funds subadvised by Janus Capital or by a subadviser (for which Janus Capital or the subadviser provides only or primarily portfolio management services). Although in most instances subadvisory and separate account fee rates for various investment strategies were lower than management fee rates for Janus Henderson Funds having a similar strategy, the Trustees considered that Janus Capital noted that, under the terms of the management agreements with the Janus Henderson Funds, Janus Capital performs significant additional services for the Janus Henderson Funds that it does not provide to those other clients, including administration services, oversight of the Janus Henderson Funds’ other service providers, trustee support, regulatory compliance and numerous other services, and that, in serving the Janus Henderson Funds, Janus Capital assumes many legal risks and other costs that it does not assume in servicing its other clients. Moreover, they noted that the independent fee consultant found that: (1) the management fees Janus Capital charges to the Janus Henderson Funds are reasonable in relation to the management fees Janus Capital charges to funds subadvised by Janus Capital and to the fees Janus Capital charges to its institutional separate account clients; (2) these subadvised and institutional separate accounts have different service and infrastructure needs; and (3) Janus Henderson mutual fund investors enjoy reasonable fees relative to the fees charged to Janus Henderson subadvised fund and separate account investors; (4) 11 of 12 Janus Henderson Funds have lower management fees than similar funds subadvised by Janus Capital; and (5) six of nine Janus Henderson Funds have lower management fees than similar separate accounts managed by Janus Capital.
The Trustees considered the fees for each Fund for its fiscal year ended in 2018, and noted the following with regard to each Fund’s total expenses, net of applicable fee waivers (the Fund’s “total expenses”):
Alternative Fund
· For Janus Henderson Diversified Alternatives Fund, the Trustees noted that, although the Fund’s total expenses exceeded the peer group average for certain share classes, overall the Fund’s total expenses were reasonable. The Trustees also noted that Janus Capital has contractually agreed to limit the Fund’s expenses.
Asset Allocation Funds
· For Janus Henderson Global Allocation Fund – Conservative, the Trustees noted that, although the Fund’s total expenses exceeded the peer group average for certain share classes, overall the Fund’s total expenses were reasonable. The Trustees also noted that Janus Capital has contractually agreed to limit the Fund’s expenses.
· For Janus Henderson Global Allocation Fund – Growth, the Trustees noted that, although the Fund’s total expenses exceeded the peer group average for certain share classes, overall the Fund’s total expenses were reasonable. The Trustees also noted that Janus Capital has contractually agreed to limit the Fund’s expenses.
· For Janus Henderson Global Allocation Fund – Moderate, the Trustees noted that, although the Fund’s total expenses exceeded the peer group average for certain share classes, overall the Fund’s total expenses were reasonable. The Trustees also noted that Janus Capital has contractually agreed to limit the Fund’s expenses.
Janus Henderson Developed World Bond Fund
Additional Information (unaudited)
Fixed-Income Funds
· For Janus Henderson Absolute Return Income Opportunities Fund, the Trustees noted that, although the Fund’s total expenses exceeded the peer group average for certain share classes, overall the Fund’s total expenses were reasonable. The Trustees also noted that Janus Capital has contractually agreed to limit the Fund’s expenses.
· For Janus Henderson Developed World Bond Fund, the Trustees noted that, although the Fund’s total expenses exceeded the peer group average for certain share classes, overall the Fund’s total expenses were reasonable. The Trustees also noted that Janus Capital has contractually agreed to limit the Fund’s expenses.
· For Janus Henderson Flexible Bond Fund, the Trustees noted that, although the Fund’s total expenses exceeded the peer group average for certain share classes, overall the Fund’s total expenses were reasonable. The Trustees also noted that Janus Capital has contractually agreed to limit the Fund’s expenses.
· For Janus Henderson Global Bond Fund, the Trustees noted that, although the Fund’s total expenses exceeded the peer group average for certain share classes, overall the Fund’s total expenses were reasonable. The Trustees also noted that Janus Capital has contractually agreed to limit the Fund’s expenses.
· For Janus Henderson High-Yield Fund, the Trustees noted that, although the Fund’s total expenses exceeded the peer group average for certain share classes, overall the Fund’s total expenses were reasonable. The Trustees also noted that Janus Capital has contractually agreed to limit the Fund’s expenses.
· For Janus Henderson Multi-Sector Income Fund, the Trustees noted that, although the Fund’s total expenses exceeded the peer group average for certain share classes, overall the Fund’s total expenses were reasonable. The Trustees also noted that Janus Capital has contractually agreed to limit the Fund’s expenses.
· For Janus Henderson Short-Term Bond Fund, the Trustees noted that, although the Fund’s total expenses exceeded the peer group average for all share classes, overall the Fund’s total expenses were reasonable. The Trustees also noted that Janus Capital has contractually agreed to limit the Fund’s expenses.
Global and International Equity Funds
· For Janus Henderson Asia Equity Fund, the Trustees noted that, although the Fund’s total expenses exceeded the peer group average for certain share classes, overall the Fund’s total expenses were reasonable. The Trustees also noted that Janus Capital has contractually agreed to limit the Fund’s expenses.
· For Janus Henderson Emerging Markets Fund, the Trustees noted that, although the Fund’s total expenses exceeded the peer group average for one share class, overall the Fund’s total expenses were reasonable. The Trustees also noted that Janus Capital has contractually agreed to limit the Fund’s expenses.
· For Janus Henderson European Focus Fund, the Trustees noted that, although the Fund’s total expenses exceeded the peer group average for certain share classes, overall the Fund’s total expenses were reasonable. The Trustees also noted that Janus Capital has contractually agreed to limit the Fund’s expenses.
· For Janus Henderson Global Equity Income Fund, the Trustees noted that the Fund’s total expenses were below the peer group average for all share classes.
· For Janus Henderson Global Life Sciences Fund, the Trustees noted that the Fund’s total expenses were below the peer group average for all share classes.
· For Janus Henderson Global Real Estate Fund, the Trustees noted although the Fund’s total expenses exceeded the peer group average for one share class, overall the Fund’s total expenses were reasonable. The Trustees also noted that Janus Capital has contractually agreed to limit the Fund’s expenses.
· For Janus Henderson Global Research Fund, the Trustees noted that the Fund’s total expenses were below the peer group average for all share classes.
· For Janus Henderson Global Select Fund, the Trustees noted that, although the Fund’s total expenses exceeded the peer group average for one share class, overall the Fund’s total expenses were reasonable. The Trustees also noted that Janus Capital has contractually agreed to limit the Fund’s expenses.
· For Janus Henderson Global Technology Fund, the Trustees noted that the Fund’s total expenses were below the peer group average for all share classes.
Janus Henderson Developed World Bond Fund
Additional Information (unaudited)
· For Janus Henderson Global Value Fund, the Trustees noted that although the Fund’s total expenses exceeded the peer group average for one share class, overall the Fund’s total expenses were reasonable.
· For Janus Henderson International Opportunities Fund, the Trustees noted that, although the Fund’s total expenses exceeded the peer group average for certain share classes, overall the Fund’s total expenses were reasonable. The Trustees also noted that Janus Capital has contractually agreed to limit the Fund’s expenses.
· For Janus Henderson International Small Cap Fund, the Trustees noted that the Fund’s total expenses were below the peer group average for all share classes.
· For Janus Henderson International Value Fund, the Trustees noted that, although the Fund’s total expenses exceeded the peer group average for certain share classes, overall the Fund’s total expenses were reasonable. The Trustees also noted that Janus Capital has contractually agreed to limit the Fund’s expenses.
· For Janus Henderson Overseas Fund, the Trustees noted that the Fund’s total expenses were below the peer group average for all share classes.
Money Market Funds
· For Janus Henderson Government Money Market Fund, the Trustees noted that the Fund’s total expenses were below the peer group average for both share classes.
· For Janus Henderson Money Market Fund, the Trustees noted that, although the Fund’s total expenses exceeded the peer group average for one share class, overall the Fund’s total expenses were reasonable.
Multi-Asset Funds
· For Janus Henderson Adaptive Global Allocation Fund, the Trustees noted that, although the Fund’s total expenses exceeded the peer group average for one share class, overall the Fund’s total expenses were reasonable. The Trustees also noted that Janus Capital has contractually agreed to limit the Fund’s expenses.
· For Janus Henderson Dividend & Income Builder Fund, the Trustees noted that the Fund’s total expenses were below the peer group average for all share classes.
· For Janus Henderson Value Plus Income Fund, the Trustees noted that the Fund’s total expenses were below the peer group average for all share classes.
Multi-Asset U.S. Equity Funds
· For Janus Henderson Balanced Fund, the Trustees noted that, although the Fund’s total expenses exceeded the peer group average for certain share classes, overall the Fund’s total expenses were reasonable. The Trustees also noted that Janus Capital has contractually agreed to limit the Fund’s expenses, although this limit did not apply because the Fund’s total expenses were already below the applicable fee limit.
· For Janus Henderson Contrarian Fund, the Trustees noted that the Fund’s total expenses exceeded the peer group average for one share class, overall the Fund’s total expenses were reasonable. The Trustees also noted that Janus Capital had contractually agreed to limit the Fund’s expenses.
· For Janus Henderson Enterprise Fund, the Trustees noted that the Fund’s total expenses were below the peer group average for all share classes.
· For Janus Henderson Forty Fund, the Trustees noted that, although the Fund’s total expenses exceeded the peer group average for certain share classes, overall the Fund’s total expenses were reasonable. The Trustees also noted that Janus Capital has contractually agreed to limit the Fund’s expenses, although this limit did not apply because the Fund’s total expenses were already below the applicable fee limit.
· For Janus Henderson Growth and Income Fund, the Trustees noted that, although the Fund’s total expenses exceeded the peer group average for certain share classes, overall the Fund’s total expenses were reasonable. The Trustees also noted that Janus Capital has contractually agreed to limit the Fund’s expenses, although this limit did not apply because the Fund’s total expenses were already below the applicable fee limit.
· For Janus Henderson Research Fund, the Trustees noted that the Fund’s total expenses were below the peer group average for all share classes.
Janus Henderson Developed World Bond Fund
Additional Information (unaudited)
· For Janus Henderson Triton Fund, the Trustees noted that, although the Fund’s expenses exceeded the peer group average for one share class, overall the Fund’s total expenses were reasonable. The Trustees also noted that Janus Capital had contractually agreed to limit the Fund’s expenses, although this limit did not apply because the Fund’s total expenses were already below the applicable fee limit.
· For Janus Henderson U.S. Growth Opportunities Fund, that Trustees noted that the Fund’s total expenses were below the peer group average for all share classes.
· For Janus Henderson Venture Fund, the Trustees noted that, although the Fund’s expenses exceeded the peer group average for one share class, overall the Fund’s total expenses were reasonable. The Trustees also noted that Janus Capital had contractually agreed to limit the Fund’s expenses, although this limit did not apply because the Fund’s total expenses were already below the applicable fee limit.
Quantitative Equity Funds
· For Janus Henderson Emerging Markets Managed Volatility Fund, the Trustees noted that, although the Fund’s total expenses exceeded the peer group average for certain share classes, overall the Fund’s total expenses were reasonable. The Trustees also noted that Janus Capital has contractually agreed to limit the Fund’s expenses.
· For Janus Henderson Global Income Managed Volatility Fund, the Trustees noted that the Fund’s total expenses were below the peer group average for all share classes.
· For Janus Henderson International Managed Volatility Fund, the Trustees noted that, although the Fund’s total expenses exceeded the peer group average for certain share classes, overall the Fund’s total expenses were reasonable. The Trustees also noted that Janus Capital has contractually agreed to limit the Fund’s expenses.
· For Janus Henderson U.S. Managed Volatility Fund, the Trustees noted that the Fund’s total expenses were below the peer group average for all share classes.
U.S. Equity Funds
· For Janus Henderson Large Cap Value Fund, the Trustees noted that the Fund’s total expenses were below the peer group average for all share classes.
· For Janus Henderson Mid Cap Value Fund, the Trustees noted that, although the Fund’s expenses exceeded the peer group average for certain share classes, overall the Fund’s total expenses were reasonable. The Trustees also noted that Janus Capital had contractually agreed to limit the Fund’s expenses, although this limit did not apply because the Fund’s total expenses were already below the applicable fee limit.
· For Janus Henderson Small Cap Value Fund, the Trustees noted that, although the Fund’s total expenses exceeded the peer group average for certain share classes, overall the Fund’s total expenses were reasonable. The Trustees also noted that Janus Capital has contractually agreed to limit the Fund’s expenses, although this limit did not apply because the Fund’s total expenses were already below the applicable fee limit.
· For Janus Henderson Small-Mid Cap Value Fund, the Trustees noted that, although the Fund’s total expenses exceeded the peer group average for certain share classes, overall the Fund’s total expenses were reasonable. The Trustees also noted that Janus Capital has contractually agreed to limit the Fund’s expenses.
The Trustees reviewed information on the overall profitability to Janus Capital and its affiliates of their relationship with the Janus Henderson Funds, and considered profitability data of other publicly traded mutual fund advisers. The Trustees recognized that profitability comparisons among fund managers are difficult because of the variation in the type of comparative information that is publicly available, and the profitability of any fund manager is affected by numerous factors, including the organizational structure of the particular fund manager, differences in complex size, difference in product mix, difference in types of business (mutual fund, institutional and other), differences in the types of funds and other accounts it manages, possible other lines of business, the methodology for allocating expenses, and the fund manager’s capital structure and cost of capital.
Additionally, the Trustees considered the estimated profitability to Janus Capital from the investment management services it provided to each Janus Henderson Fund. In their review, the Trustees considered whether Janus Capital and each subadviser receive adequate incentives and resources to manage the Janus Henderson Funds effectively. In reviewing profitability, the Trustees noted that the estimated profitability for an individual Janus Henderson Fund is
Janus Henderson Developed World Bond Fund
Additional Information (unaudited)
necessarily a product of the allocation methodology utilized by Janus Capital to allocate its expenses as part of the estimated profitability calculation. In this regard, the Trustees noted that the independent fee consultant found that (1) the expense allocation methodology and rationales utilized by Janus Capital were reasonable and (2) no clear correlation between expense allocations and operating margins. The Trustees also considered that the estimated profitability for an individual Janus Henderson Fund was influenced by a number of factors, including not only the allocation methodology selected, but also the presence of fee waivers and expense caps, and whether the Janus Henderson Fund’s investment management agreement contained breakpoints or a performance fee component. The Trustees determined, after taking into account these factors, among others, that Janus Capital’s estimated profitability with respect to each Janus Henderson Fund was not unreasonable in relation to the services provided, and that the variation in the range of such estimated profitability among the Janus Henderson Funds was not a material factor in the Board’s approval of the reasonableness of any Janus Henderson Fund’s investment management fees.
The Trustees concluded that the management fees payable by each Janus Henderson Fund to Janus Capital and its affiliates, as well as the fees paid by Janus Capital to the subadvisers of subadvised Janus Henderson Funds, were reasonable in relation to the nature, extent, and quality of the services provided, taking into account the fees charged by other advisers for managing comparable mutual funds with similar strategies, the fees Janus Capital and the subadvisers charge to other clients, and, as applicable, the impact of fund performance on management fees payable by the Janus Henderson Funds. The Trustees also concluded that each Janus Henderson Fund’s total expenses were reasonable, taking into account the size of the Janus Henderson Fund, the quality of services provided by Janus Capital and any subadviser, the investment performance of the Janus Henderson Fund, and any expense limitations agreed to or provided by Janus Capital.
Economies of Scale
The Trustees considered information about the potential for Janus Capital to realize economies of scale as the assets of the Janus Henderson Funds increase. They noted that their independent fee consultant published a report to the Trustees in November 2019 which provided its research and analysis into economies of scale. They also noted that, although many Janus Henderson Funds pay advisory fees at a base fixed rate as a percentage of net assets, without any breakpoints or performance fees, their independent fee consultant concluded that 64% of these Janus Henderson Funds’ share classes have contractual management fees (gross of waivers) below their Broadridge expense group averages. They also noted the following: (1) that for those Janus Henderson Funds whose expenses are being reduced by the contractual expense limitations of Janus Capital, Janus Capital is subsidizing certain of these Janus Henderson Funds because they have not reached adequate scale; (2) as the assets of some of the Janus Henderson Funds have declined in the past few years, certain Janus Henderson Funds have benefited from having advisory fee rates that have remained constant rather than increasing as assets declined; (3) performance fee structures have been implemented for various Janus Henderson Funds that have caused the effective rate of advisory fees payable by such a Janus Henderson Fund to vary depending on the investment performance of the Janus Henderson Fund relative to its benchmark index over the measurement period; and (4) a few Janus Henderson Funds have fee schedules with breakpoints and reduced fee rates above certain asset levels. The Trustees also noted that the Janus Henderson Funds share directly in economies of scale through the lower charges of third-party service providers that are based in part on the combined scale of all of the Janus Henderson Funds.
The Trustees also considered the independent fee consultant’s conclusion that, given the limitations of various analytical approaches to economies of scale and their conflicting results, it is difficult to analytically confirm or deny the existence of economies of scale in the Janus Henderson complex. In this regard, the independent consultant concluded that (1) to the extent there were economies of scale at Janus Capital, Janus Capital’s general strategy of setting fixed management fees below peers appeared to share any such economies with investors even on smaller Janus Henderson Funds which have not yet achieved those economies and (2) by setting lower fixed fees from the start on these Janus Henderson Funds, Janus Capital appeared to be investing to increase the likelihood that these Janus Henderson Funds will grow to a level to achieve any scale economies that may exist. Further, the independent fee consultant provided its belief that Janus Henderson Fund investors are well-served by the fee levels and performance fee structures in place on the Janus Henderson Funds in light of any economies of scale that may be present at Janus Capital.
Based on all of the information reviewed, including the recent and past research and analysis conducted by the Trustees’ independent fee consultant, the Trustees concluded that the current fee structure of each Janus Henderson Fund was reasonable and that the current rates of fees do reflect a sharing between Janus Capital and the Janus
Janus Henderson Developed World Bond Fund
Additional Information (unaudited)
Henderson Fund of any economies of scale that may be present at the current asset level of the Janus Henderson Fund.
Other Benefits to Janus Capital
The Trustees also considered benefits that accrue to Janus Capital and its affiliates and subadvisers to the Janus Henderson Funds from their relationships with the Janus Henderson Funds. They recognized that two affiliates of Janus Capital separately serve the Janus Henderson Funds as transfer agent and distributor, respectively, and the transfer agent receives compensation directly from the non-money market funds for services provided, and that such compensation contributes to the overall profitability of Janus Capital and its affiliates that results from their relationship with the Janus Henderson Funds. The Trustees also considered Janus Capital’s past and proposed use of commissions paid by the Janus Henderson Funds on portfolio brokerage transactions to obtain proprietary and third-party research products and services benefiting the Janus Henderson Fund and/or other clients of Janus Capital and/or Janus Capital, and/or a subadviser to a Janus Henderson Fund. The Trustees concluded that Janus Capital’s and the subadvisers’ use of these types of client commission arrangements to obtain proprietary and third-party research products and services was consistent with regulatory requirements and guidelines and was likely to benefit each Janus Henderson Fund. The Trustees also concluded that, other than the services provided by Janus Capital and its affiliates and subadvisers pursuant to the agreements and the fees to be paid by each Janus Henderson Fund therefor, the Janus Henderson Funds and Janus Capital and the subadvisers may potentially benefit from their relationship with each other in other ways. They concluded that Janus Capital and its affiliates share directly in economies of scale through the lower charges of third-party service providers that are based in part on the combined scale of the Janus Henderson Funds and other clients serviced by Janus Capital and its affiliates. They also concluded that Janus Capital and/or the subadvisers benefit from the receipt of research products and services acquired through commissions paid on portfolio transactions of the Janus Henderson Funds and that the Janus Henderson Funds benefit from Janus Capital’s and/or the subadvisers’ receipt of those products and services as well as research products and services acquired through commissions paid by other clients of Janus Capital and/or other clients of the subadvisers. They further concluded that the success of any Janus Henderson Fund could attract other business to Janus Capital, the subadvisers or other Janus Henderson funds, and that the success of Janus Capital and the subadvisers could enhance Janus Capital’s and the subadvisers’ ability to serve the Janus Henderson Funds.
Approval of an Amended and Restated Investment Advisory Agreement for Janus Henderson Small-Mid Cap Value Fund (formerly, Janus Henderson Select Value Fund)
Janus Capital Management LLC (“Janus Capital”) met with the Trustees, each of whom serves as an “independent” Trustee (the “Trustees”), on December 5, 2018 and March 14, 2019, to discuss the Amended and Restated Investment Advisory Agreement (the “Amended Advisory Agreement”) for Janus Henderson Small-Mid Cap Value Fund (formerly, Janus Henderson Select Value Fund) (“Small-Mid Cap Value Fund”) and other matters related to investment strategy changes to shift the market capitalization focus of Small-Mid Cap Value Fund (the “Strategy Change”). At these meetings, the Trustees discussed the Amended Advisory Agreement and the Strategy Change with their independent counsel, separately from management. During the course of the meetings, the Trustees requested and considered such information as they deemed relevant to their deliberations. At the meeting held on March 14, 2019, the Trustees, upon the recommendation of Janus Capital, voted unanimously to approve the Amended Advisory Agreement for Small-Mid Cap Value Fund, and recommended that the Amended Advisory Agreement be submitted to shareholders for approval. The Trustees also approved matters related to the Strategy Change, effective upon approval of the Amended Advisory Agreement by the Fund’s shareholders.
In determining whether to approve the Amended Advisory Agreement, the Trustees noted their most recent consideration of Small-Mid Cap Value Fund’s current advisory agreement (the “Current Advisory Agreement”) as part of the Trustees’ annual review and consideration of whether to continue the investment advisory agreement and sub-advisory agreement, as applicable, for each Janus Henderson fund, including Small-Mid Cap Value Fund (the “Annual Review”). The Trustees noted that in connection with the Annual Review: (i) the Trustees received and reviewed information provided by Janus Capital and each sub-adviser, including Perkins Investment Management LLC (“Perkins”), in response to requests of the Trustees and their independent legal counsel, and also received and reviewed information and analysis provided by, and in response to requests of, their independent fee consultant; and (ii) throughout the Annual Review, the Trustees were advised by their independent legal counsel. The Trustees also noted that based on the Trustees’ evaluation of the information provided by Janus Capital, Perkins, and the independent fee consultant, as well as other information, the Trustees determined that the overall arrangements between Small-Mid Cap
Janus Henderson Developed World Bond Fund
Additional Information (unaudited)
Value Fund and Janus Capital and Perkins were fair and reasonable in light of the nature, extent and quality of the services provided by Janus Capital, its affiliates and Perkins, the fees charged for those services, and other matters that the Trustees considered relevant in the exercise of their business judgment, and the Trustees unanimously approved the continuation of the Current Advisory Agreement for another year.
In considering the Amended Advisory Agreement, the Trustees reviewed and analyzed various factors that they determined were relevant, including the factors described below, none of which by itself was considered dispositive. However, the material factors and conclusions that formed the basis for the Trustees’ determination to approve the Amended Advisory Agreement are discussed separately below.
· The Trustees determined that the terms of the Amended Advisory Agreement are substantially similar to those of the Current Advisory Agreement, which the Trustees recently reviewed as part of the Annual Review, and the material changes made to the Amended Advisory Agreement address the proposed change to the benchmark index and the description of the period used for calculating the performance fee in order to allow for continuity of the fee based on Small-Mid Cap Value Fund’s historical performance over a 36-month measurement period.
· As part of the Strategy Change, Small-Mid Cap Value Fund will focus its investments on common stocks of companies that are small- and mid-capitalization stocks. The Trustees determined that the proposed benchmark index, the Russell 2500TM Value Index, is more closely aligned with a small- and mid-cap stock focus than Small-Mid Cap Value Fund’s current benchmark index, the Russell 3000® Value Index.
· Under the Amended Advisory Agreement, the structure of the performance fee was not changing, other than to utilize a different benchmark and performance calculation period to implement the new benchmark over time, and that this structure had been implemented initially for Small-Mid Cap Value Fund based on analysis provided by the independent fee consultant. The Trustees considered the information provided by Janus Capital in this regard, and noted Janus Capital’s belief that this performance fee structure remained reasonable and appropriate for Small-Mid Cap Value Fund. The Trustees concluded that this performance fee structure was reasonable for Small-Mid Cap Value Fund as proposed, and also determined to seek further analysis from their independent fee consultant with respect to this matter. In this regard, Janus Capital agreed to consider further revisions to the proposed performance fee structure should that be needed based on the additional analysis provided.
· As part of the Strategy Change, Perkins will continue to provide sub-advisory services to Small-Mid Cap Value Fund, but will utilize new portfolio managers to implement Small-Mid Cap Value Fund’s focus on common stocks of companies that are small- and mid-capitalization stocks. In this regard, the Trustees noted the information provided by Janus Capital with respect to the qualifications and experience of the new portfolio managers implementing investment strategies similar to the one to be utilized by Small-Mid Cap Value Fund, and also noted that Perkins and the new portfolio managers provide sub-advisory services to other Janus Henderson funds the Trustees oversee.
· The information provided by Janus Capital with respect to (i) the impact of the Amended Advisory Agreement on the potential advisory fees to be paid by Small-Mid Cap Value Fund going forward; and (ii) the potential transaction costs and capital gains to be incurred by Small-Mid Cap Value Fund as part of the efforts to reposition Small-Mid Cap Value Fund’s portfolio to focus its investments on common stocks of companies that are small- and mid-capitalization stocks. In this regard, the Trustees noted that Small-Mid Cap Value Fund’s operating costs were not expected otherwise to materially change under the Amended Advisory Agreement.
· Janus Capital’s reasons for seeking to implement the Strategy Change, including Janus Capital’s belief that current marketplace demands for a small and mid-cap strategy, combined with Perkins’ experience in managing small- and mid-cap stocks, will provide greater opportunity for Small-Mid Cap Value Fund to grow over the long-term, and that the Strategy Change is designed to create asset growth through increased sales for Small-Mid Cap Value Fund, potentially resulting in increased operational efficiencies for Small-Mid Cap Value Fund.
· Janus Capital will pay the fees and expenses related to seeking shareholder approval of the Amended Advisory Agreement, including the costs related to the preparation and distribution of proxy materials, and all other costs incurred in connection with the solicitation of proxies.
After discussion, the Trustees determined that the overall arrangements between Small-Mid Cap Value Fund, Janus Capital, and Perkins under the Amended Advisory Agreement would continue to be fair and reasonable in light of the
Janus Henderson Developed World Bond Fund
Additional Information (unaudited)
nature, extent, and quality of the services expected to be provided by Janus Capital, its affiliates, and Perkins following the Strategy Change.
Janus Henderson Developed World Bond Fund
Useful Information About Your Fund Report (unaudited)
Management Commentary
The Management Commentary in this report includes valuable insight as well as statistical information to help you understand how your Fund’s performance and characteristics stack up against those of comparable indices.
If the Fund invests in foreign securities, this report may include information about country exposure. Country exposure is based primarily on the country of risk. A company may be allocated to a country based on other factors such as location of the company’s principal office, the location of the principal trading market for the company’s securities, or the country where a majority of the company’s revenues are derived.
Please keep in mind that the opinions expressed in the Management Commentary are just that: opinions. They are a reflection based on best judgment at the time this report was compiled, which was December 31, 2019. As the investing environment changes, so could opinions. These views are unique and are not necessarily shared by fellow employees or by Janus Henderson in general.
Performance Overviews
Performance overview graphs compare the performance of a hypothetical $10,000 investment in the Fund with one or more widely used market indices. When comparing the performance of the Fund with an index, keep in mind that market indices are not available for investment and do not reflect deduction of expenses.
Average annual total returns are quoted for a Fund with more than one year of performance history. Average annual total return is calculated by taking the growth or decline in value of an investment over a period of time, including reinvestment of dividends and distributions, then calculating the annual compounded percentage rate that would have produced the same result had the rate of growth been constant throughout the period. Average annual total return does not reflect the deduction of taxes that a shareholder would pay on Fund distributions or redemptions of Fund shares.
Cumulative total returns are quoted for a Fund with less than one year of performance history. Cumulative total return is the growth or decline in value of an investment over time, independent of the period of time involved. Cumulative total return does not reflect the deduction of taxes that a shareholder would pay on Fund distributions or redemptions of Fund shares.
Pursuant to federal securities rules, expense ratios shown in the performance chart reflect subsidized (if applicable) and unsubsidized ratios. The total annual fund operating expenses ratio is gross of any fee waivers, reflecting the Fund’s unsubsidized expense ratio. The net annual fund operating expenses ratio (if applicable) includes contractual waivers of Janus Capital and reflects the Fund’s subsidized expense ratio. Ratios may be higher or lower than those shown in the “Financial Highlights” in this report.
Schedule of Investments
Following the performance overview section is the Fund’s Schedule of Investments. This schedule reports the types of securities held in the Fund on the last day of the reporting period. Securities are usually listed by type (common stock, corporate bonds, U.S. Government obligations, etc.) and by industry classification (banking, communications, insurance, etc.). Holdings are subject to change without notice.
The value of each security is quoted as of the last day of the reporting period. The value of securities denominated in foreign currencies is converted into U.S. dollars.
If the Fund invests in foreign securities, it will also provide a summary of investments by country. This summary reports the Fund exposure to different countries by providing the percentage of securities invested in each country. The country of each security represents the country of risk. The Fund’s Schedule of Investments relies upon the industry group and country classifications published by Barclays and/or MSCI Inc.
Tables listing details of individual forward currency contracts, futures, written options, swaptions, and swaps follow the Fund’s Schedule of Investments (if applicable).
Statement of Assets and Liabilities
This statement is often referred to as the “balance sheet.” It lists the assets and liabilities of the Fund on the last day of the reporting period.
Janus Henderson Developed World Bond Fund
Useful Information About Your Fund Report (unaudited)
The Fund’s assets are calculated by adding the value of the securities owned, the receivable for securities sold but not yet settled, the receivable for dividends declared but not yet received on securities owned, and the receivable for Fund shares sold to investors but not yet settled. The Fund’s liabilities include payables for securities purchased but not yet settled, Fund shares redeemed but not yet paid, and expenses owed but not yet paid. Additionally, there may be other assets and liabilities such as unrealized gain or loss on forward currency contracts.
The section entitled “Net Assets Consist of” breaks down the components of the Fund’s net assets. Because the Fund must distribute substantially all earnings, you will notice that a significant portion of net assets is shareholder capital.
The last section of this statement reports the net asset value (“NAV”) per share on the last day of the reporting period. The NAV is calculated by dividing the Fund’s net assets for each share class (assets minus liabilities) by the number of shares outstanding.
Statement of Operations
This statement details the Fund’s income, expenses, realized gains and losses on securities and currency transactions, and changes in unrealized appreciation or depreciation of Fund holdings.
The first section in this statement, entitled “Investment Income,” reports the dividends earned from securities and interest earned from interest-bearing securities in the Fund.
The next section reports the expenses incurred by the Fund, including the advisory fee paid to the investment adviser, transfer agent fees and expenses, and printing and postage for mailing statements, financial reports and prospectuses. Expense offsets and expense reimbursements, if any, are also shown.
The last section lists the amounts of realized gains or losses from investment and foreign currency transactions, and changes in unrealized appreciation or depreciation of investments and foreign currency-denominated assets and liabilities. The Fund will realize a gain (or loss) when it sells its position in a particular security. A change in unrealized gain (or loss) refers to the change in net appreciation or depreciation of the Fund during the reporting period. “Net Realized and Unrealized Gain/(Loss) on Investments” is affected both by changes in the market value of Fund holdings and by gains (or losses) realized during the reporting period.
Statements of Changes in Net Assets
These statements report the increase or decrease in the Fund’s net assets during the reporting period. Changes in the Fund’s net assets are attributable to investment operations, dividends and distributions to investors, and capital share transactions. This is important to investors because it shows exactly what caused the Fund’s net asset size to change during the period.
The first section summarizes the information from the Statement of Operations regarding changes in net assets due to the Fund’s investment operations. The Fund’s net assets may also change as a result of dividend and capital gains distributions to investors. If investors receive their dividends and/or distributions in cash, money is taken out of the Fund to pay the dividend and/or distribution. If investors reinvest their dividends and/or distributions, the Fund’s net assets will not be affected. If you compare the Fund’s “Net Decrease from Dividends and Distributions” to “Reinvested Dividends and Distributions,” you will notice that dividends and distributions have little effect on the Fund’s net assets. This is because the majority of the Fund’s investors reinvest their dividends and/or distributions.
The reinvestment of dividends and distributions is included under “Capital Share Transactions.” “Capital Shares” refers to the money investors contribute to the Fund through purchases or withdrawals via redemptions. The Fund’s net assets will increase and decrease in value as investors purchase and redeem shares from the Fund.
Financial Highlights
This schedule provides a per-share breakdown of the components that affect the Fund’s NAV for current and past reporting periods as well as total return, asset size, ratios, and portfolio turnover rate.
The first line in the table reflects the NAV per share at the beginning of the reporting period. The next line reports the net investment income/(loss) per share. Following is the per share total of net gains/(losses), realized and unrealized. Per share dividends and distributions to investors are then subtracted to arrive at the NAV per share at the end of the period. The next line reflects the total return for the period. The total return may include adjustments in accordance with generally accepted accounting principles required at the period end for financial reporting purposes. As a result, the
Janus Henderson Developed World Bond Fund
Useful Information About Your Fund Report (unaudited)
total return may differ from the total return reflected for individual shareholder transactions. Also included are ratios of expenses and net investment income to average net assets.
The Fund’s expenses may be reduced through expense offsets and expense reimbursements. The ratios shown reflect expenses before and after any such offsets and reimbursements.
The ratio of net investment income/(loss) summarizes the income earned less expenses, divided by the average net assets of the Fund during the reporting period. Do not confuse this ratio with the Fund’s yield. The net investment income ratio is not a true measure of the Fund’s yield because it does not take into account the dividends distributed to the Fund’s investors.
The next figure is the portfolio turnover rate, which measures the buying and selling activity in the Fund. Portfolio turnover is affected by market conditions, changes in the asset size of the Fund, fluctuating volume of shareholder purchase and redemption orders, the nature of the Fund’s investments, and the investment style and/or outlook of the portfolio manager(s) and/or investment personnel. A 100% rate implies that an amount equal to the value of the entire portfolio was replaced once during the fiscal year; a 50% rate means that an amount equal to the value of half the portfolio is traded in a year; and a 200% rate means that an amount equal to the value of the entire portfolio is traded every six months.
Knowledge. Shared
At Janus Henderson, we believe in the sharing of expert insight for better investment and business decisions. We call this ethos Knowledge. Shared.
Learn more by visiting janushenderson.com.
| | | | | | | | | |
| | | | | |

| | | | |
This report is submitted for the general information of shareholders of the Fund. It is not an offer or solicitation for the Fund and is not authorized for distribution to prospective investors unless preceded or accompanied by an effective prospectus. |
Janus Henderson, Janus, Henderson, Perkins, Intech and Knowledge. Shared are trademarks of Janus Henderson Group plc or one of its subsidiaries. © Janus Henderson Group plc. Janus Henderson Distributors |
| | | | | 125-24-93077 02-20 |
| | | |
| | | |
| | | SEMIANNUAL REPORT December 31, 2019 |
| | |
| | Janus Henderson Diversified Alternatives Fund |
| | |
| | Janus Investment Fund |
Beginning on January 1, 2021, as permitted by regulations adopted by the Securities and Exchange Commission, paper copies of the Fund’s shareholder reports will no longer be sent by mail, unless you specifically request paper copies of the reports from the Fund or your plan sponsor, broker-dealer, or financial intermediary, or if you invest directly with the Fund, by contacting a Janus Henderson representative. Instead, the reports will be made available on a website, and you will be notified by mail each time a report is posted and provided with a website link to access the report. If you already elected to receive shareholder reports electronically, you will not be affected by this change and you need not take any action. You may elect to receive shareholder reports and other communications from the Fund electronically by contacting your plan sponsor, broker-dealer, or financial intermediary, or if you invest directly with the Fund, by visiting janushenderson.com/edelivery. You may elect to receive all future reports in paper free of charge. If you do not invest directly with the Fund, you should contact your plan sponsor, broker-dealer, or financial intermediary, to request to continue receiving paper copies of your shareholder reports. If you invest directly with the Fund, you can call 1-800-525-3713 to let the Fund know that you wish to continue receiving paper copies of your shareholder reports. Your election to receive reports in paper will apply to all Janus Henderson mutual funds where held (i.e., all Janus Henderson mutual funds held in your account if you invest through your financial intermediary or all Janus Henderson mutual funds held with the fund complex if you invest directly with a fund). |
| | | |
| | | HIGHLIGHTS · Portfolio management perspective · Investment strategy behind your fund · Fund performance, characteristics
and holdings |
| | | |
| | | 
|
Table of Contents
Janus Henderson Diversified Alternatives Fund
Janus Henderson Diversified Alternatives Fund (unaudited)
| | | | | | |
FUND SNAPSHOT We invest in a portfolio of traditional and nontraditional investable risk factors distilled from traditional asset classes, each a type of risk premium. We combine these independent risk premia into a liquid portfolio that seeks to deliver consistent, absolute returns with low correlation to stocks and bonds. | | | | 
Aneet Chachra co-portfolio manager | 
John Fujiwara co-portfolio manager |
| | | |
PERFORMANCE OVERVIEW
For the six-month period ended December 31, 2019, Janus Henderson Diversified Alternatives Fund’s Class I Shares returned -1.29%, compared with a return of 2.45% for its primary benchmark, the Bloomberg Barclays U.S. Aggregate Bond Index, and 2.64% for its secondary benchmark, the London Interbank Offered Rate (LIBOR) + 3%.
MARKET ENVIRONMENT
Global financial markets generated positive returns during the period, with riskier assets outperforming safer government bonds as optimism brewed that heretofore slowing global growth may reaccelerate. Two developments fueling investor optimism were stabilizing global purchasing managers indices and headway in U.S.-China trade negotiations. Although yields across the U.S. Treasuries curve were down for the period, the curve between 2-year and 10-year maturities steepened as the former was anchored to a succession of rate cuts by the Federal Reserve (Fed) and the latter proved more susceptible to a potential uptick in global growth. Investment-grade credit marginally outperformed high-yield issuers due in part to falling interest rates. Yet for both categories, spreads between their yields and those of their risk-free benchmarks narrowed considerably. Equities rallied, with some U.S. benchmarks achieving new record closes by the end of the period, but international stocks also moved upward on improving growth prospects. This occurred after an extended period of underperformance by international stocks.
PERFORMANCE DISCUSSION
The Fund underperformed its primary and secondary benchmarks during the six-month period. Over time, the Fund seeks to provide positive absolute returns and offer true diversification with low correlation to stocks and bonds by investing in a portfolio of risk premia strategies.
Implicit in risk premia strategies is investors commanding a premium for securities that they deem riskier than those in other pockets of the market. When investors concentrate their exposure on a narrow segment of the market, as they are doing now with regard to larger-cap and growth stocks and longer-duration bonds, the tendencies underpinning risk premia are less powerful. Evidence of this is seen in the performance of the individual premia over the past six months.
We consider this environment a “beta trade”: riskier assets largely moving in unison, with the only difference being a matter of magnitude. The market’s concentration, in our view, is the manifestation of lingering investor caution; their outlook is largely constructive mainly due to accommodative central bank policy, but they remain hesitant to reallocate from secular growth stories toward beaten-down segments, such as value, small-cap and emerging markets that would typically benefit from a noticeable uptick in economic growth. While each of these categories showed signs of stabilization in recent months, we have yet to see the wholesale rotation that many believed was imminent during the autumn. The equity-size risk premium was a top detractor for the period, as small-cap stocks continued to underperform their large-cap peers. Equity value, however, generated modestly positive returns, helped by an uptick in the performance of value stocks relative to growth during the autumn.
Idiosyncratic developments were behind the fixed income price pressure risk premium underperforming. This is a risk premium recently added to the strategy that aims to provide liquidity around issuance in global bond markets. With Treasury yields low, we would expect bond auction participants to demand larger price concessions. Yet during the period, policy rhetoric unconducive for growth emerged around auctions, causing Treasury yields to fall rather than deliver the spike necessary for this risk premium to generate gains.
Janus Henderson Diversified Alternatives Fund (unaudited)
The currency momentum risk premium also detracted from results. With the Fed not committing to either raising or lowering rates, the trajectory of the U.S. dollar is largely left to the whims of investment flows and its role as a “safe haven” currency. Sporadic appetite for riskier international assets interspersed with bouts of caution inhibited the establishment of the prolonged trend necessary for this strategy to generate positive returns.
Perhaps the best illustration of investors’ herd mentality was the equity momentum risk premium and rates momentum risk premium delivering the period’s strongest results. With the Fed implying it would do what’s necessary to maintain economic growth, investors continued to pile into U.S. stocks while Treasuries rallied on the back of Fed action, namely the period’s succession of interest rate cuts.
DERIVATIVES
The Fund makes extensive use of derivatives because they are generally the most efficient and liquid way to gain our desired exposures. Swaps are used to gain exposure to equity, fixed income and commodity indices. Futures are used to gain exposure to commodities, currencies and long-end fixed income markets. Forwards are employed to take exposures in foreign currencies, generally one week in length. In aggregate, these positions detracted from performance during the period.
Please see the Derivative Instruments section in the “Notes to Consolidated Financial Statements” for a discussion of derivatives used by the Fund.
OUTLOOK
Investors’ crowded positioning is understandable in the sense that the policy environment is conducive to growth, but there is scant evidence of a catalyst for underperforming market segments to break out. Even with the Fed pausing rate cuts, policy is becoming more accommodative as the central bank wades deeper into short-term lending markets, increasing the size of its balance sheet in the process.
We believe investors’ abandonment of diversification may ultimately haunt them. With trades this crowded, any upsetting of the apple cart would likely result in a mismatch in buyers and sellers and a plunge in prices before opportunistic buyers step in.
While the autumn of 2019 saw a stabilization in small-cap, value and emerging market stocks, investors have thus far only been willing to dip their toe in the water of these out-of-favor pockets. To a degree, the caution is merited. The U.S. faces a pivotal election, continued progress on trade is far from guaranteed and much of the rest of the world still faces daunting secular challenges, which have resulted in negative yields on much of their government debt.
When seeking to identify what catalyst may reignite a rotation, we have our eye on a meaningful uptick in inflation. Whether spurred by economic growth, costs associated with more complex trade linkages or tight U.S. labor markets pushing up wages, we believe this lopsided market is poorly positioned for rising inflation. Value stocks, driven by their large slug of banks, could outperform as the steeper yield curve that would accompany inflation would benefit lenders’ profitability. An additional spurt of U.S. growth would benefit small-cap companies, and improving trade may allow emerging markets to build on recent gains. Conversely, investors holding longer-dated bonds would likely incur capital losses as the long end of yield curves price in higher inflation.
Thank you for investing in the Janus Henderson Diversified Alternatives Fund.
Janus Henderson Diversified Alternatives Fund (unaudited)
Fund At A Glance
December 31, 2019
| | |
Asset Allocation | |
Commodity | 35.0% |
Equity | 23.9% |
Currency | 19.8% |
Fixed Income | 19.6% |
Cash & Cash Equivalents | 1.7% |
| | 100.0% |
| | |
The allocations shown reflect absolute notional exposures to various asset classes. The allocations are calculated net of cash segregated for future obligations. |
| | |
| | |
| | |
| | |
| | |
| | |
| | |
| | |
| | |
| | |
| | |
| | |
| | |
Janus Henderson Diversified Alternatives Fund (unaudited)
Performance
| |
See important disclosures on the next page. |
| | | | | | | | | | | |
| | | | | | | | | | |
| | | | | | | | | | |
Average Annual Total Return - for the periods ended December 31, 2019 | | | Expense Ratios |
| | Fiscal
Year-to-Date | One
Year | Five
Year | Since
Inception* | | | Total Annual Fund
Operating Expenses‡ | Net Annual Fund
Operating Expenses‡ |
Class A Shares at NAV | | -1.30% | -0.07% | 0.35% | 0.48% | | | 1.90% | 1.36% |
Class A Shares at MOP | | -6.96% | -5.77% | -0.82% | -0.37% | | | | |
Class C Shares at NAV | | -1.01% | 0.47% | -0.15% | -0.01% | | | 2.67% | 2.07% |
Class C Shares at CDSC | | -2.00% | -0.53% | -0.15% | -0.01% | | | | |
Class D Shares(1) | | -1.29% | 0.04% | 0.46% | 0.58% | | | 2.19% | 1.19% |
Class I Shares | | -1.29% | 0.04% | 0.55% | 0.68% | | | 1.62% | 1.15% |
Class N Shares | | -1.19% | 0.14% | 0.61% | 0.74% | | | 1.50% | 1.03% |
Class S Shares | | -1.31% | 0.14% | 0.34% | 0.41% | | | 2.21% | 1.53% |
Class T Shares | | -1.30% | 0.14% | 0.47% | 0.58% | | | 1.77% | 1.29% |
Bloomberg Barclays U.S. Aggregate Bond Index | | 2.45% | 8.72% | 3.05% | 2.70% | | | | |
London Interbank Offered Rate (LIBOR) + 3% Index | | 2.64% | 6.39% | 4.55% | 4.32%** | | | | |
Morningstar Quartile - Class I Shares | | - | 4th | 4th | 4th | | | | |
Morningstar Ranking - based on total returns for Multialternative Funds | | - | 279/312 | 173/225 | 141/155 | | | | |
Returns quoted are past performance and do not guarantee future results; current performance may be lower or higher. Investment returns and principal value will vary; there may be a gain or loss when shares are sold. For the most recent month-end performance call 800.668.0434 (or 800.525.3713 if you hold shares directly with Janus Henderson) or visit janushenderson.com/performance (or janushenderson.com/allfunds if you hold shares directly with Janus Henderson).
Maximum Offering Price (MOP) returns include the maximum sales charge of 5.75%. Net Asset Value (NAV) returns exclude this charge, which would have reduced returns.
CDSC returns include a 1% contingent deferred sales charge (CDSC) on Shares redeemed within 12 months of purchase. Net Asset Value (NAV) returns exclude this charge, which would have reduced returns.
Net expense ratios reflect the expense waiver, if any, contractually agreed to through October 28, 2020.
Janus Henderson Diversified Alternatives Fund (unaudited)
Performance
Performance may be affected by risks that include those associated with non-diversification, portfolio turnover, short sales, potential conflicts of interest, foreign and emerging markets, initial public offerings (IPOs), high-yield and high-risk securities, undervalued, overlooked and smaller capitalization companies, real estate related securities including Real Estate Investment Trusts (REITs), derivatives, and commodity-linked investments. Each product has different risks. Please see the prospectus for more information about risks, holdings and other details.
There is a risk that the Fund’s investments will correlate with stocks and bonds to a greater degree than anticipated, and the investment process may not achieve the desired results. The Fund may underperform during up markets and be negatively affected in down markets. Diversification does not assure a profit or eliminate the risk of loss.
Returns include reinvestment of all dividends and distributions and do not reflect the deduction of taxes that a shareholder would pay on Fund distributions or redemptions of Fund shares. The returns do not include adjustments in accordance with generally accepted accounting principles required at the period end for financial reporting purposes.
Ranking is for the share class shown only; other classes may have different performance characteristics. When an expense waiver is in effect, it may have a material effect on the total return, and therefore the ranking for the period.
© 2019 Morningstar, Inc. All Rights Reserved.
There is no assurance that the investment process will consistently lead to successful investing.
See Notes to Consolidated Schedule of Investments and Other Information for index definitions.
Index performance does not reflect the expenses of managing a portfolio as an index is unmanaged and not available for direct investment.
See “Useful Information About Your Fund Report.”
Effective October 28, 2019, Aneet Chachra and John Fujiwara are Co-Portfolio Managers of the Fund.
Effective January 13, 2020, the Fund’s primary benchmark changed from the Bloomberg Barclays U.S. Aggregate Bond Index to the FTSE 3-Month US Treasury Bill Index and the Fund’s secondary benchmark will change from LIBOR +3% to the FTSE 3-Month US Treasury Bill Index +3%. Janus Capital believes that the FTSE 3-Month US Treasury Bill Index is a more appropriate benchmark in light of the Fund’s principal investment strategy.
*The Fund’s inception date – December 28, 2012
‡ As stated in the prospectus. See Consolidated Financial Highlights for actual expense ratios during the reporting period.
** The London Interbank Offered Rate (LIBOR) + 3% since inception returns are calculated from December 31, 2012.
(1) Closed to certain new investors.
Janus Henderson Diversified Alternatives Fund (unaudited)
Expense Examples
As a shareholder of the Fund, you incur two types of costs: (1) transaction costs, such as sales charges (loads) on purchase payments (applicable to Class A Shares only); and (2) ongoing costs, including management fees; 12b-1 distribution and shareholder servicing fees; transfer agent fees and expenses payable pursuant to the Transfer Agency Agreement; and other Fund expenses. This example is intended to help you understand your ongoing costs (in dollars) of investing in the Fund and to compare these costs with the ongoing costs of investing in other mutual funds. To do so, compare this 5% hypothetical example with the 5% hypothetical examples that appear in the shareholder reports of the other funds. The example is based upon an investment of $1,000 invested at the beginning of the period and held for the six-months indicated, unless noted otherwise in the table and footnotes below.
Actual Expenses
The information in the table under the heading “Actual” provides information about actual account values and actual expenses. You may use the information in these columns, together with the amount you invested, to estimate the expenses that you paid over the period. Simply divide your account value by $1,000 (for example, an $8,600 account value divided by $1,000 = 8.6), then multiply the result by the number in the appropriate column for your share class under the heading entitled “Expenses Paid During Period” to estimate the expenses you paid on your account during the period.
Hypothetical Example for Comparison Purposes
The information in the table under the heading “Hypothetical (5% return before expenses)” provides information about hypothetical account values and hypothetical expenses based upon the Fund’s actual expense ratio and an assumed rate of return of 5% per year before expenses, which is not the Fund’s actual return. The hypothetical account values and expenses may not be used to estimate the actual ending account balance or expenses you paid for the period. You may use this information to compare the ongoing costs of investing in the Fund and other funds. To do so, compare this 5% hypothetical example with the 5% hypothetical examples that appear in the shareholder reports of the other funds. Additionally, for an analysis of the fees associated with an investment in any share class or other similar funds, please visit www.finra.org/fundanalyzer.
Please note that the expenses shown in the table are meant to highlight your ongoing costs only and do not reflect any transaction costs. These fees are fully described in the Fund’s prospectuses. Therefore, the hypothetical examples are useful in comparing ongoing costs only, and will not help you determine the relative total costs of owning different funds. In addition, if these transaction costs were included, your costs would have been higher.
| | | | | | | | | | | |
| | | | | | | | | |
| | | | Actual | | Hypothetical
(5% return before expenses) | |
| Beginning
Account
Value
(7/1/19) | Ending
Account
Value
(12/31/19) | Expenses
Paid During
Period
(7/1/19 - 12/31/19)† | | Beginning
Account
Value
(7/1/19) | Ending
Account
Value
(12/31/19) | Expenses
Paid During
Period
(7/1/19 - 12/31/19)† | Net Annualized
Expense Ratio
(7/1/19 - 12/31/19) |
Class A Shares | $1,000.00 | $987.00 | $6.89 | | $1,000.00 | $1,018.20 | $7.00 | 1.38% |
Class C Shares | $1,000.00 | $989.90 | $3.20 | | $1,000.00 | $1,021.92 | $3.25 | 0.64% |
Class D Shares | $1,000.00 | $987.10 | $6.24 | | $1,000.00 | $1,018.85 | $6.34 | 1.25% |
Class I Shares | $1,000.00 | $987.10 | $6.09 | | $1,000.00 | $1,019.00 | $6.19 | 1.22% |
Class N Shares | $1,000.00 | $988.10 | $5.45 | | $1,000.00 | $1,019.66 | $5.53 | 1.09% |
Class S Shares | $1,000.00 | $986.90 | $6.04 | | $1,000.00 | $1,019.05 | $6.14 | 1.21% |
Class T Shares | $1,000.00 | $987.00 | $5.94 | | $1,000.00 | $1,019.15 | $6.04 | 1.19% |
† | Expenses Paid During Period are equal to the Net Annualized Expense Ratio multiplied by the average account value over the period, multiplied by 184/366 (to reflect the one-half year period). Expenses in the examples include the effect of applicable fee waivers and/or expense reimbursements, if any. Had such waivers and/or reimbursements not been in effect, your expenses would have been higher. Please refer to the Notes to Consolidated Financial Statements or the Fund’s prospectuses for more information regarding waivers and/or reimbursements. |
Janus Henderson Diversified Alternatives Fund
Consolidated Schedule of Investments (unaudited)
December 31, 2019
| | | | | | | | |
Shares or
Principal Amounts | | | Value | |
Investment Companies – 5.5% | | | |
Money Markets – 5.5% | | | |
| | Janus Henderson Cash Liquidity Fund LLC, 1.7210%©,ºº,£ (cost $4,089,124) | | 4,089,012 | | | $4,089,012 | |
U.S. Government Agency Notes – 87.6% | | | |
United States Treasury Bill: | | | |
| | 0%, 1/9/20†,◊ | | $6,300,000 | | | 6,298,277 | |
| | 0%, 2/6/20◊ | | 10,500,000 | | | 10,484,790 | |
| | 0%, 3/12/20†,◊ | | 13,900,000 | | | 13,859,391 | |
| | 0%, 4/9/20◊ | | 17,000,000 | | | 16,932,518 | |
| | 0%, 5/7/20◊ | | 9,600,000 | | | 9,548,802 | |
| | 0%, 6/4/20◊ | | 7,400,000 | | | 7,351,361 | |
Total U.S. Government Agency Notes (cost $64,450,262) | | 64,475,139 | |
Total Investments (total cost $68,539,386) – 93.1% | | 68,564,151 | |
Cash, Receivables and Other Assets, net of Liabilities – 6.9% | | 5,069,381 | |
Net Assets – 100% | | $73,633,532 | |
Schedules of Affiliated Investments – (% of Net Assets)
| | | | | | | | | | | |
| | Dividend Income | Realized Gain/(Loss) | Change in Unrealized Appreciation/ Depreciation | Value at 12/31/19 |
Investment Companies - 5.5% |
Money Markets - 5.5% |
| | Janus Henderson Cash Liquidity Fund LLC, 1.7210%©,ºº | $ | 53,714 | $ | (75) | $ | (112) | $ | 4,089,012 |
| |
| | | | | | | | | | | |
| | Share Balance at 6/30/19 | Purchases | Sales | Share Balance at 12/31/19 |
Investment Companies - 5.5% |
Money Markets - 5.5% |
| | Janus Henderson Cash Liquidity Fund LLC, 1.7210%©,ºº | | 2,119,458 | | 46,551,497 | | (44,581,943) | | 4,089,012 |
| | | | | | | |
Schedule of Forward Foreign Currency Exchange Contracts, Open | | | | | | |
| | | | | | | | | |
Counterparty/ Foreign Currency | Settlement Date | Foreign Currency Amount (Sold)/ Purchased | | USD Currency Amount (Sold)/ Purchased | | Market Value and Unrealized Appreciation/ (Depreciation) | |
HSBC Securities (USA), Inc.: | | | | | | | |
Australian Dollar | 1/10/20 | (1,850,000) | $ | 1,280,955 | $ | (17,252) | |
British Pound | 1/10/20 | 922,000 | | (1,193,923) | | 27,423 | |
Canadian Dollar | 1/10/20 | 1,981,000 | | (1,507,324) | | 18,477 | |
Euro | 1/10/20 | (5,943,000) | | 6,601,384 | | (67,453) | |
| | | | | | | | |
| | |
See Notes to Consolidated Schedule of Investments and Other Information and Notes to Consolidated Financial Statements. |
| |
Janus Investment Fund | 7 |
Janus Henderson Diversified Alternatives Fund
Consolidated Schedule of Investments (unaudited)
December 31, 2019
| | | | | | | | | |
Counterparty/ Foreign Currency | Settlement Date | Foreign Currency Amount (Sold)/ Purchased | | USD Currency Amount (Sold)/ Purchased | | Market Value and Unrealized Appreciation/ (Depreciation) | |
Japanese Yen | 1/10/20 | (297,400,000) | $ | 2,722,543 | $ | (15,551) | |
New Zealand Dollar | 1/10/20 | 6,051,000 | | (4,017,761) | | 55,025 | |
Norwegian Krone | 1/10/20 | 27,830,000 | | (3,107,951) | | 63,294 | |
Swedish Krona | 1/10/20 | (18,170,000) | | 1,927,978 | | (13,324) | |
Swiss Franc | 1/10/20 | (3,931,000) | | 4,009,923 | | (54,178) | |
Total | | | | | $ | (3,539) | |
Schedule of Futures
| | | | | | | | | | | | | | |
Description | | Number of Contracts | | Expiration Date | | Value and Notional Amount | | Unrealized Appreciation/ (Depreciation) | | Variation Margin Asset/(Liability) | |
Futures Purchased: | | | | | | | | | | | |
AUST-Bond | | 75 | | 3/16/20 | $ | 7,522,476 | $ | (138,832) | $ | (39,457) | |
Brent Crude© | | 25 | | 1/31/20 | | 1,650,000 | | 68,239 | | (18,094) | |
Copper© | | 24 | | 5/27/20 | | 1,684,500 | | 23,475 | | (23,080) | |
Gold© | | 11 | | 4/28/20 | | 1,682,230 | | 64,717 | | 5,170 | |
Live Cattle© | | 35 | | 6/30/20 | | 1,664,600 | | 19,801 | | (1,486) | |
S&P 500 E-mini | | 66 | | 3/20/20 | | 10,662,300 | | (24,269) | | 13,500 | |
Wheat© | | 61 | | 7/14/20 | | 1,724,775 | | - | | - | |
WTI Crude© | | 28 | | 4/21/20 | | 1,679,160 | | 59,173 | | (20,705) | |
Total - Futures Purchased | | | | | | | | 72,304 | | (84,152) | |
Futures Sold: | | | | | | | | | | | |
10-Year US Treasury Note | | (105) | | 3/20/20 | | (13,484,297) | | 22,336 | | 14,984 | |
CAN-Bond | | (71) | | 3/20/20 | | (7,517,776) | | 135,566 | | 31,169 | |
Coffee 'C'© | | (35) | | 5/18/20 | | (1,731,188) | | (18,127) | | 33,072 | |
Corn© | | (85) | | 5/14/20 | | (1,677,688) | | (54,036) | | 2,214 | |
Cotton #2© | | (66) | | 5/6/20 | | (2,315,940) | | (124,327) | | 19,656 | |
Euro-Bund | | (66) | | 3/6/20 | | (12,620,673) | | 130,694 | | - | |
JAP-Bond | | (5) | | 3/13/20 | | (7,003,406) | | 4,120 | | 460 | |
Silver© | | (19) | | 5/27/20 | | (1,710,855) | | (121,612) | | 10,262 | |
Soybean© | | (48) | | 5/14/20 | | (2,325,000) | | (120,326) | | (6,740) | |
Sugar© | | (110) | | 6/30/20 | | (1,682,912) | | (94) | | (12,599) | |
US Dollar Index | | (310) | | 3/16/20 | | (29,777,980) | | 269,902 | | 96,582 | |
Total - Futures Sold | | | | | | | | 124,096 | | 189,060 | |
Total | | | | | | | $ | 196,400 | $ | 104,908 | |
| | |
See Notes to Consolidated Schedule of Investments and Other Information and Notes to Consolidated Financial Statements. |
| |
8 | DECEMBER 31, 2019 |
Janus Henderson Diversified Alternatives Fund
Consolidated Schedule of Investments (unaudited)
December 31, 2019
| | | | | | | | | | | | |
Schedule of Total Return Swaps |
Counterparty/ Return Paid by the Fund | | Return Received by the Fund | | Payment Frequency | | Termination Date | | Notional Amount | | | Value and Unrealized Appreciation/ (Depreciation) |
BNP Paribas:
| | | | | | | | | | | | |
20 Basis Points | | A long/short basket of equity indices(1) | | Monthly | | 2/4/20 | | 11,300,000 | USD | $ | (8) |
-5 Basis Points | | A long/short basket of equity indices(2) | | Monthly | | 2/4/20 | | 17,800,000 | USD | | (44) |
| | | | | | | | | | | | (52) |
Goldman Sachs International:
| | | | | | | | | | | | |
MSCI Daily Total Return Gross World USD | | 1 Month USD LIBOR Plus 11 Basis Points | | Monthly | | 2/5/20 | | (14,402,460) | USD | | (141,039) |
1 Month USD LIBOR Plus 68 Basis Points | | MSCI Daily Total Return Net Emerging Markets | | Monthly | | 2/5/20 | | 14,407,667 | USD | | 385,747 |
| | | | | | | | | | | | 244,708 |
JPMorgan Chase & Co:
| | | | | | | | | | | | |
11.75 basis points© | | A long/short basket of commodity indices(3) | | Monthly | | 1/31/20 | | 64,000,000 | USD | | - |
| | | | | | | | | | | | - |
Total | | | | | | | | | | $ | 244,656 |
(1) Long Index – Russell 2000 Total Return Index, Short Index – Russell 1000 Total Return index
(2) Long Index – S&P 500 Pure Value TR Index, Short Index – S&P 500 Pure Growth TR Index
(3) Long Index – Bloomberg Commodity Index 2-4-6 Forward Blend, Short Index – Bloomberg Commodity Index
The following table, grouped by derivative type, provides information about the fair value and location of derivatives within the Consolidated Statement of Assets and Liabilities as of December 31, 2019.
| | | | | | | | | | | | | |
Fair Value of Derivative Instruments (not accounted for as hedging instruments) as of December 31, 2019 |
| | | | | | | | | | | | | |
| | | | Commodity
Contracts | | Currency
Contracts | | Equity
Contracts | | Interest Rate
Contracts | | Total |
Asset Derivatives: | | | | | | | | | | |
Forward foreign currency exchange contracts | | $ - | | $164,219 | | $ - | | $ - | | $164,219 |
Outstanding swap contracts, at value | | - | | - | | 385,747 | | - | | 385,747 |
Variation margin receivable | | 70,374 | | 96,582 | | 13,500 | | 46,613 | | 227,069 |
| | | | | | | | | | | |
Total Asset Derivatives | | $ 70,374 | | $260,801 | | $399,247 | | $ 46,613 | | $777,035 |
| | | | | | | | | | |
Liability Derivatives: | | | | | | | | | | |
Forward foreign currency exchange contracts | | $ - | | $167,758 | | $ - | | $ - | | $167,758 |
Outstanding swap contracts, at value | | - | | - | | 141,091 | | - | | 141,091 |
Variation margin payable | | 82,704 | | - | | - | | 39,457 | | 122,161 |
| | | | | | | | | | | |
Total Liability Derivatives | | $ 82,704 | | $167,758 | | $141,091 | | $ 39,457 | | $431,010 |
| | |
See Notes to Consolidated Schedule of Investments and Other Information and Notes to Consolidated Financial Statements. |
| |
Janus Investment Fund | 9 |
Janus Henderson Diversified Alternatives Fund
Consolidated Schedule of Investments (unaudited)
December 31, 2019
The following tables provide information about the effect of derivatives and hedging activities on the Fund’s Consolidated Statement of Operations for the period ended December 31, 2019.
| | | | | | | | | | | | |
The effect of Derivative Instruments (not accounted for as hedging instruments) on the Consolidated Statement of Operations for the period ended December 31, 2019 |
| | | | | | | | | | | | |
Amount of Realized Gain/(Loss) Recognized on Derivatives |
Derivative | Commodity
Contracts | | Currency
Contracts | | Equity
Contracts | | Interest Rate
Contracts | | Total |
Futures contracts | $ 118,964 | | $(798,699) | | $1,184,632 | | $ (210,566) | | $ 294,331 |
Forward foreign currency exchange contracts | - | | (126,569) | | - | | - | | (126,569) |
Swap contracts | (176,332) | | - | | (965,965) | | - | | (1,142,297) |
| | | | | | | | | | | | |
Total | $ (57,368) | | $(925,268) | | $ 218,667 | | $ (210,566) | | $ (974,535) |
| | | | | | | | | | | | |
| | | | | | | | | | | | |
Amount of Change in Unrealized Appreciation/Depreciation Recognized on Derivatives |
Derivative | Commodity
Contracts | | Currency
Contracts | | Equity
Contracts | | Interest Rate
Contracts | | Total |
Futures contracts | $ (182,334) | | $ 228,813 | | $ (128,530) | | $ (597,598) | | $ (679,649) |
Forward foreign currency exchange contracts | - | | 22,750 | | - | | - | | 22,750 |
Swap contracts | - | | - | | 244,211 | | - | | 244,211 |
| | | | | | | | | | | | |
Total | $ (182,334) | | $ 251,563 | | $ 115,681 | | $ (597,598) | | $ (412,688) |
Please see the “Net Realized Gain/(Loss) on Investments” and “Change in Unrealized Net Appreciation/Depreciation” sections of the Fund’s Consolidated Statement of Operations.
| | |
Average Ending Monthly Market Value of Derivative Instruments During the Period Ended December 31, 2019 |
| | |
| Market Value(a) |
Forward foreign currency exchange contracts, purchased | $ 8,480,160 |
Forward foreign currency exchange contracts, sold | 14,912,051 |
Futures contracts, purchased | 72,228,120 |
Futures contracts, sold | 47,577,349 |
Total return swaps | 125,775 |
| | |
(a) Forward foreign currency exchange contracts are reported as the average ending monthly currency amount purchased or sold. |
| | |
See Notes to Consolidated Schedule of Investments and Other Information and Notes to Consolidated Financial Statements. |
| |
10 | DECEMBER 31, 2019 |
Janus Henderson Diversified Alternatives Fund
Notes to Consolidated Schedule of Investments and Other Information (unaudited)
| | |
Bloomberg Barclays U.S. Aggregate Bond Index | Bloomberg Barclays U.S. Aggregate Bond Index is a broad-based measure of the investment grade, US dollar-denominated, fixed-rate taxable bond market. |
London Interbank Offered Rate (LIBOR) | LIBOR (London Interbank Offered Rate) is a short-term interest rate that banks offer one another and generally represents current cash rates. |
| | |
LLC | Limited Liability Company |
| | |
© | All or a portion of this security is owned by Janus Diversified Alternatives Subsidiary, Ltd. See Note 1 in Notes to Consolidated Financial Statements. |
| | |
† | All or a portion of this security has been segregated at the Fund’s custodian or counterparty to cover forward foreign currency exchange contracts, exchange-traded derivatives, centrally cleared derivatives, short sales, and/or securities with extended settlement dates. Assets segregated at the Fund’s custodian or counterparty are evaluated daily to ensure their cover and/or market value equals or exceeds the current market value of the Fund’s corresponding obligation value. |
| | |
ºº | Rate shown is the 7-day yield as of December 31, 2019. |
| | |
£ | The Fund may invest in certain securities that are considered affiliated companies. As defined by the Investment Company Act of 1940, as amended, an affiliated company is one in which the Fund owns 5% or more of the outstanding voting securities, or a company which is under common ownership or control. |
Janus Henderson Diversified Alternatives Fund
Notes to Consolidated Schedule of Investments and Other Information (unaudited)
| | | | | | | | | | | | | | |
The following is a summary of the inputs that were used to value the Fund’s investments in securities and other financial instruments as of December 31, 2019. See Notes to Consolidated Financial Statements for more information. |
| |
Valuation Inputs Summary |
| | | | | | | |
| | | | | Level 2 - | | Level 3 - |
| | | Level 1 - | | Other Significant | | Significant |
| | | Quoted Prices | | Observable Inputs | | Unobservable Inputs |
| | | | | | | |
Assets | | | | | | |
Investments In Securities: | | | | | | |
Investment Companies | $ | - | $ | 4,089,012 | $ | - |
U.S. Government Agency Notes | | - | | 64,475,139 | | - |
Total Investments in Securities | $ | - | $ | 68,564,151 | $ | - |
Other Financial Instruments(a): | | | | | | |
Forward Foreign Currency Exchange Contracts | | - | | 164,219 | | - |
Outstanding Swap Contracts, at Value | | - | | 385,747 | | - |
Variation Margin Receivable | | 227,069 | | - | | - |
Total Assets | $ | 227,069 | $ | 69,114,117 | $ | - |
Liabilities | | | | | | |
Other Financial Instruments(a): | | | | | | |
Forward Foreign Currency Exchange Contracts | $ | - | $ | 167,758 | $ | - |
Outstanding Swap Contracts, at Value | | - | | 141,091 | | - |
Variation Margin Payable | | 122,161 | | - | | - |
Total Liabilities | $ | 122,161 | $ | 308,849 | $ | - |
| | | | | | | |
(a) | Other financial instruments include forward foreign currency exchange, futures, written options, written swaptions, and swap contracts. Forward foreign currency exchange contracts are reported at their unrealized appreciation/(depreciation) at measurement date, which represents the change in the contract's value from trade date. Futures, certain written options on futures, and centrally cleared swap contracts are reported at their variation margin at measurement date, which represents the amount due to/from the Fund at that date. Written options, written swaptions, and other swap contracts are reported at their market value at measurement date. |
Janus Henderson Diversified Alternatives Fund
Consolidated Statement of Assets and Liabilities (unaudited)
December 31, 2019
| |
See footnotes at the end of the Consolidated Statement. |
| | | | | | | |
| | | | | | |
Assets: | | | | |
| | Unaffiliated investments, at value(1) | | $ | 64,475,139 | |
| | Affiliated investments, at value(2) | | | 4,089,012 | |
| | Cash | | | 130,548 | |
| | Deposits with brokers for futures | | | 2,610,000 | |
| | Deposits with brokers for OTC derivatives | | | 2,014,000 | |
| | Forward foreign currency exchange contracts | | | 164,219 | |
| | Outstanding swap contracts, at value | | | 385,747 | |
| | Variation margin receivable | | | 227,069 | |
| | Non-interested Trustees' deferred compensation | | | 1,894 | |
| | Receivables: | | | | |
| | | Investments sold | | | 259,640 | |
| | | Dividends from affiliates | | | 5,915 | |
| | | Fund shares sold | | | 3,666 | |
| | | Dividends and interest on swap contracts | | | 3,277 | |
| | Other assets | | | 877 | |
Total Assets | | | 74,371,003 | |
Liabilities: | | | | |
| | Forward foreign currency exchange contracts | | | 167,758 | |
| | Outstanding swap contracts, at value | | | 141,091 | |
| | Variation margin payable | | | 122,161 | |
| | Payables: | | | — | |
| | | Fund shares repurchased | | | 85,070 | |
| | | Registration fees | | | 56,137 | |
| | | Professional fees | | | 41,035 | |
| | | Non-affiliated fund administration fees payable | | | 38,665 | |
| | | Printing fees | | | 31,127 | |
| | | Dividends and interest on swap contracts | | | 13,400 | |
| | | Advisory fees | | | 12,862 | |
| | | Transfer agent fees and expenses | | | 4,513 | |
| | | Custodian fees | | | 3,621 | |
| | | Non-interested Trustees' fees and expenses | | | 2,663 | |
| | | Non-interested Trustees' deferred compensation fees | | | 1,894 | |
| | | 12b-1 Distribution and shareholder servicing fees | | | 1,328 | |
| | | Affiliated fund administration fees payable | | | 163 | |
| | | Accrued expenses and other payables | | | 13,983 | |
Total Liabilities | | | 737,471 | |
Net Assets | | $ | 73,633,532 | |
| | |
See Notes to Consolidated Financial Statements. |
| |
Janus Investment Fund | 13 |
Janus Henderson Diversified Alternatives Fund
Consolidated Statement of Assets and Liabilities (unaudited)
December 31, 2019
| | | | | | | |
| | | | | | |
| | | | | | | |
Net Assets Consist of: | | | | |
| | Capital (par value and paid-in surplus) | | $ | 77,956,911 | |
| | Total distributable earnings (loss) | | | (4,323,379) | |
Total Net Assets | | $ | 73,633,532 | |
Net Assets - Class A Shares | | $ | 2,569,768 | |
| | Shares Outstanding, $0.01 Par Value (unlimited shares authorized) | | | 268,612 | |
Net Asset Value Per Share(3) | | $ | 9.57 | |
Maximum Offering Price Per Share(4) | | $ | 10.15 | |
Net Assets - Class C Shares | | $ | 506,764 | |
| | Shares Outstanding, $0.01 Par Value (unlimited shares authorized) | | | 53,706 | |
Net Asset Value Per Share(3) | | $ | 9.44 | |
Net Assets - Class D Shares | | $ | 2,904,280 | |
| | Shares Outstanding, $0.01 Par Value (unlimited shares authorized) | | | 301,940 | |
Net Asset Value Per Share | | $ | 9.62 | |
Net Assets - Class I Shares | | $ | 6,344,622 | |
| | Shares Outstanding, $0.01 Par Value (unlimited shares authorized) | | | 658,346 | |
Net Asset Value Per Share | | $ | 9.64 | |
Net Assets - Class N Shares | | $ | 58,766,404 | |
| | Shares Outstanding, $0.01 Par Value (unlimited shares authorized) | | | 6,069,831 | |
Net Asset Value Per Share | | $ | 9.68 | |
Net Assets - Class S Shares | | $ | 1,411,633 | |
| | Shares Outstanding, $0.01 Par Value (unlimited shares authorized) | | | 148,097 | |
Net Asset Value Per Share | | $ | 9.53 | |
Net Assets - Class T Shares | | $ | 1,130,061 | |
| | Shares Outstanding, $0.01 Par Value (unlimited shares authorized) | | | 117,985 | |
Net Asset Value Per Share | | $ | 9.58 | |
| |
(1) Includes cost of $64,450,262. (2) Includes cost of $4,089,124. (3) Redemption price per share may be reduced for any applicable contingent deferred sales charge. (4) Maximum offering price is computed at 100/94.25 of net asset value. |
| | |
See Notes to Consolidated Financial Statements. |
| |
14 | DECEMBER 31, 2019 |
Janus Henderson Diversified Alternatives Fund
Consolidated Statement of Operations (unaudited)
For the period ended December 31, 2019
| | | | | | |
| | | | | |
Investment Income: | | | |
| Interest | $ | 764,916 | |
| | Dividends from affiliates | | 53,714 | |
| | Other income | | 17,418 | |
Total Investment Income | | 836,048 | |
Expenses: | | | |
| | Advisory fees | | 441,253 | |
| | 12b-1 Distribution and shareholder servicing fees: | | | |
| | | Class A Shares | | 2,551 | |
| | | Class C Shares | | — | |
| | | Class S Shares | | 10 | |
| | Transfer agent administrative fees and expenses: | | | |
| | | Class D Shares | | 1,987 | |
| | | Class S Shares | | 1,779 | |
| | | Class T Shares | | 1,587 | |
| | Transfer agent networking and omnibus fees: | | | |
| | | Class A Shares | | 1,334 | |
| | | Class C Shares | | 259 | |
| | | Class I Shares | | 7,363 | |
| | Other transfer agent fees and expenses: | | | |
| | | Class A Shares | | 103 | |
| | | Class C Shares | | 21 | |
| | | Class D Shares | | 708 | |
| | | Class I Shares | | 293 | |
| | | Class N Shares | | 811 | |
| | | Class S Shares | | 9 | |
| | | Class T Shares | | 13 | |
| | Registration fees | | 75,937 | |
| | Non-affiliated fund administration fees | | 55,783 | |
| | Professional fees | | 29,186 | |
| | Shareholder reports expense | | 24,923 | |
| | Custodian fees | | 6,918 | |
| | Non-interested Trustees’ fees and expenses | | 1,023 | |
| | Affiliated fund administration fees | | 1,022 | |
| | Other expenses | | 5,428 | |
Total Expenses | | 660,301 | |
Less: Excess Expense Reimbursement and Waivers | | (203,088) | |
Net Expenses | | 457,213 | |
Net Investment Income/(Loss) | | 378,835 | |
Net Realized Gain/(Loss) on Investments: | | | |
| | Investments and foreign currency transactions | | (12,419) | |
| | Investments in affiliates | | (75) | |
| | Forward foreign currency exchange contracts | | (126,569) | |
| | Futures contracts | | 294,331 | |
| | Swap contracts | | (1,142,297) | |
Total Net Realized Gain/(Loss) on Investments | | (987,029) | |
Change in Unrealized Net Appreciation/Depreciation: | | | |
| | Investments, foreign currency translations and non-interested Trustees’ deferred compensation | | (51,807) | |
| | Investments in affiliates | | (112) | |
| | Forward foreign currency exchange contracts | | 22,750 | |
| | Futures contracts | | (679,649) | |
| | Swap contracts | | 244,211 | |
Total Change in Unrealized Net Appreciation/Depreciation | | (464,607) | |
Net Increase/(Decrease) in Net Assets Resulting from Operations | $ | (1,072,801) | |
| | | | | | |
| | |
See Notes to Consolidated Financial Statements. |
| |
Janus Investment Fund | 15 |
Janus Henderson Diversified Alternatives Fund
Consolidated Statements of Changes in Net Assets
| | | | | | | | | |
| | | | | | | | | |
| | | Period ended
December 31, 2019 (unaudited) | | Year ended
June 30, 2019 | |
| | | | | | | | | |
Operations: | | | | | | |
| | Net investment income/(loss) | $ | 378,835 | | $ | 1,061,035 | |
| | Net realized gain/(loss) on investments | | (987,029) | | | (4,950,302) | |
| | Change in unrealized net appreciation/depreciation | | (464,607) | | | 613,347 | |
Net Increase/(Decrease) in Net Assets Resulting from Operations | | (1,072,801) | | | (3,275,920) | |
Dividends and Distributions to Shareholders | | | | | | |
| | | Class A Shares | | (1,004) | | | (20,991) | |
| | | Class C Shares | | (207) | | | (3,697) | |
| | | Class D Shares | | (1,129) | | | (26,367) | |
| | | Class I Shares | | (2,528) | | | (109,709) | |
| | | Class N Shares | | (22,763) | | | (473,861) | |
| | | Class S Shares | | (554) | | | (8,529) | |
| | | Class T Shares | | (443) | | | (35,660) | |
Net Decrease from Dividends and Distributions to Shareholders | | (28,628) | | | (678,814) | |
Capital Share Transactions: | | | | | | |
| | | Class A Shares | | (115,063) | | | (1,079,657) | |
| | | Class C Shares | | (80,147) | | | (1,517,872) | |
| | | Class D Shares | | (766,121) | | | (1,277,966) | |
| | | Class I Shares | | (8,507,371) | | | (3,886,718) | |
| | | Class N Shares | | (4,891,029) | | | (8,683,930) | |
| | | Class S Shares | | 554 | | | 7,540 | |
| | | Class T Shares | | (509,352) | | | (4,446,920) | |
Net Increase/(Decrease) from Capital Share Transactions | | (14,868,529) | | | (20,885,523) | |
Net Increase/(Decrease) in Net Assets | | (15,969,958) | | | (24,840,257) | |
Net Assets: | | | | | | |
| | Beginning of period | | 89,603,490 | | | 114,443,747 | |
| End of period | $ | 73,633,532 | | $ | 89,603,490 | |
| | | | | | | | | |
| | |
See Notes to Consolidated Financial Statements. |
| |
16 | DECEMBER 31, 2019 |
Janus Henderson Diversified Alternatives Fund
Consolidated Financial Highlights
| | | | | | | | | | | | | | | | | | | | | | |
Class A Shares | | | | | | | | | | | | | | | | | | |
For a share outstanding during the period ended December 31, 2019 (unaudited) and the year ended June 30 | 2019 | | | 2019 | | | 2018 | | | 2017 | | | 2016 | | | 2015 | |
| | Net Asset Value, Beginning of Period | | $9.69 | | | $10.05 | | | $10.16 | | | $9.92 | | | $9.98 | | | $9.84 | |
| | Income/(Loss) from Investment Operations: | | | | | | | | | | | | | | | | | | |
| | | Net investment income/(loss)(1) | | 0.03 | | | 0.08 | | | (0.02) | | | (0.11) | | | (0.14) | | | (0.15) | |
| | | Net realized and unrealized gain/(loss) | | (0.15) | | | (0.39) | | | 0.18 | | | 0.63 | | | 0.18 | | | 0.37 | |
| | Total from Investment Operations | | (0.12) | | | (0.31) | | | 0.16 | | | 0.52 | | | 0.04 | | | 0.22 | |
| | Less Dividends and Distributions: | | | | | | | | | | | | | | | | | | |
| | | Dividends (from net investment income) | | — | | | (0.05) | | | (0.13) | | | (0.28) | | | — | | | — | |
| | | Distributions (from capital gains) | | —(2) | | | — | | | (0.14) | | | — | | | (0.10) | | | (0.08) | |
| | Total Dividends and Distributions | | — | | | (0.05) | | | (0.27) | | | (0.28) | | | (0.10) | | | (0.08) | |
| | Net Asset Value, End of Period | | $9.57 | | | $9.69 | | | $10.05 | | | $10.16 | | | $9.92 | | | $9.98 | |
| | Total Return* | | (1.20)% | | | (3.03)% | | | 1.46% | | | 5.29% | | | 0.42% | | | 2.22% | |
| | Net Assets, End of Period (in thousands) | | $2,570 | | | $2,722 | | | $3,941 | | | $2,297 | | | $2,882 | | | $2,740 | |
| | Average Net Assets for the Period (in thousands) | | $2,701 | | | $3,786 | | | $3,110 | | | $2,737 | | | $2,730 | | | $2,048 | |
| | Ratios to Average Net Assets**: | | | | | | | | | | | | | | | | | | |
| | | Ratio of Gross Expenses | | 1.95% | | | 1.84% | | | 1.68% | | | 1.83% | | | 1.89% | | | 1.84% | |
| | | Ratio of Net Expenses (After Waivers and Expense Offsets) | | 1.38% | | | 1.38% | | | 1.44% | | | 1.54% | | | 1.53% | | | 1.52% | |
| | | Ratio of Net Investment Income/(Loss) | | 0.67% | | | 0.81% | | | (0.23)% | | | (1.13)% | | | (1.42)% | | | (1.51)% | |
| | Portfolio Turnover Rate | | 0% | | | 0% | | | 0% | | | 16% | | | 0% | | | 0% | |
| | | | | | | | | | | | | | | | | | | | | | |
| | | | | | | | | | | | | | | | | | | | | | |
Class C Shares | | | | | | | | | | | | | | | | | | |
For a share outstanding during the period ended December 31, 2019 (unaudited) and the year ended June 30 | 2019 | | | 2019 | | | 2018 | | | 2017 | | | 2016 | | | 2015 | |
| | Net Asset Value, Beginning of Period | | $9.53 | | | $9.86 | | | $9.94 | | | $9.72 | | | $9.84 | | | $9.79 | |
| | Income/(Loss) from Investment Operations: | | | | | | | | | | | | | | | | | | |
| | | Net investment income/(loss)(1) | | 0.07 | | | 0.05 | | | (0.14) | | | (0.18) | | | (0.21) | | | (0.23) | |
| | | Net realized and unrealized gain/(loss) | | (0.16) | | | (0.36) | | | 0.22 | | | 0.61 | | | 0.19 | | | 0.36 | |
| | Total from Investment Operations | | (0.09) | | | (0.31) | | | 0.08 | | | 0.43 | | | (0.02) | | | 0.13 | |
| | Less Dividends and Distributions: | | | | | | | | | | | | | | | | | | |
| | | Dividends (from net investment income) | | — | | | (0.02) | | | (0.02) | | | (0.21) | | | — | | | — | |
| | | Distributions (from capital gains) | | —(2) | | | — | | | (0.14) | | | — | | | (0.10) | | | (0.08) | |
| | Total Dividends and Distributions | | — | | | (0.02) | | | (0.16) | | | (0.21) | | | (0.10) | | | (0.08) | |
| | Net Asset Value, End of Period | | $9.44 | | | $9.53 | | | $9.86 | | | $9.94 | | | $9.72 | | | $9.84 | |
| | Total Return* | | (0.90)% | | | (3.17)% | | | 0.71% | | | 4.48% | | | (0.19)% | | | 1.31% | |
| | Net Assets, End of Period (in thousands) | | $507 | | | $592 | | | $2,188 | | | $2,071 | | | $1,749 | | | $1,709 | |
| | Average Net Assets for the Period (in thousands) | | $538 | | | $2,055 | | | $2,162 | | | $1,885 | | | $1,685 | | | $1,752 | |
| | Ratios to Average Net Assets**: | | | | | | | | | | | | | | | | | | |
| | | Ratio of Gross Expenses | | 2.21% | | | 2.11% | | | 2.44% | | | 2.56% | | | 2.63% | | | 2.59% | |
| | | Ratio of Net Expenses (After Waivers and Expense Offsets) | | 0.64% | | | 1.60% | | | 2.18% | | | 2.29% | | | 2.27% | | | 2.26% | |
| | | Ratio of Net Investment Income/(Loss) | | 1.42% | | | 0.57% | | | (1.42)% | | | (1.85)% | | | (2.15)% | | | (2.26)% | |
| | Portfolio Turnover Rate | | 0% | | | 0% | | | 0% | | | 16% | | | 0% | | | 0% | |
| | | | | | | | | | | | | | | | | | | | | | |
| |
* Total return includes adjustments in accordance with generally accepted accounting principles required at the year or period end and are not annualized for periods of less than one full year. ** Annualized for periods of less than one full year. (1) Per share amounts are calculated based on average shares outstanding during the year or period. (2) Less than $0.005 on a per share basis. |
| | |
See Notes to Consolidated Financial Statements. |
| |
Janus Investment Fund | 17 |
Janus Henderson Diversified Alternatives Fund
Consolidated Financial Highlights
| | | | | | | | | | | | | | | | | | | | | | |
Class D Shares | | | | | | | | | | | | | | | | | | |
For a share outstanding during the period ended December 31, 2019 (unaudited) and the year ended June 30 | 2019 | | | 2019 | | | 2018 | | | 2017 | | | 2016 | | | 2015 | |
| | Net Asset Value, Beginning of Period | | $9.74 | | | $10.10 | | | $10.20 | | | $9.96 | | | $10.00 | | | $9.85 | |
| | Income/(Loss) from Investment Operations: | | | | | | | | | | | | | | | | | | |
| | | Net investment income/(loss)(1) | | 0.04 | | | 0.09 | | | (0.06) | | | (0.10) | | | (0.13) | | | (0.14) | |
| | | Net realized and unrealized gain/(loss) | | (0.16) | | | (0.39) | | | 0.24 | | | 0.63 | | | 0.19 | | | 0.37 | |
| | Total from Investment Operations | | (0.12) | | | (0.30) | | | 0.18 | | | 0.53 | | | 0.06 | | | 0.23 | |
| | Less Dividends and Distributions: | | | | | | | | | | | | | | | | | | |
| | | Dividends (from net investment income) | | — | | | (0.06) | | | (0.14) | | | (0.29) | | | — | | | — | |
| | | Distributions (from capital gains) | | —(2) | | | — | | | (0.14) | | | — | | | (0.10) | | | (0.08) | |
| | Total Dividends and Distributions | | — | | | (0.06) | | | (0.28) | | | (0.29) | | | (0.10) | | | (0.08) | |
| | Net Asset Value, End of Period | | $9.62 | | | $9.74 | | | $10.10 | | | $10.20 | | | $9.96 | | | $10.00 | |
| | Total Return* | | (1.19)% | | | (2.96)% | | | 1.66% | | | 5.38% | | | 0.62% | | | 2.32% | |
| | Net Assets, End of Period (in thousands) | | $2,904 | | | $3,720 | | | $5,169 | | | $4,857 | | | $4,758 | | | $3,060 | |
| | Average Net Assets for the Period (in thousands) | | $3,307 | | | $4,266 | | | $5,034 | | | $4,638 | | | $3,829 | | | $3,281 | |
| | Ratios to Average Net Assets**: | | | | | | | | | | | | | | | | | | |
| | | Ratio of Gross Expenses | | 2.08% | | | 2.19% | | | 1.75% | | | 1.87% | | | 2.05% | | | 1.96% | |
| | | Ratio of Net Expenses (After Waivers and Expense Offsets) | | 1.25% | | | 1.28% | | | 1.30% | | | 1.41% | | | 1.42% | | | 1.43% | |
| | | Ratio of Net Investment Income/(Loss) | | 0.82% | | | 0.96% | | | (0.60)% | | | (0.97)% | | | (1.30)% | | | (1.42)% | |
| | Portfolio Turnover Rate | | 0% | | | 0% | | | 0% | | | 16% | | | 0% | | | 0% | |
| | | | | | | | | | | | | | | | | | | | | | |
| | | | | | | | | | | | | | | | | | | | | | |
Class I Shares | | | | | | | | | | | | | | | | | | |
For a share outstanding during the period ended December 31, 2019 (unaudited) and the year ended June 30 | 2019 | | | 2019 | | | 2018 | | | 2017 | | | 2016 | | | 2015 | |
| | Net Asset Value, Beginning of Period | | $9.76 | | | $10.11 | | | $10.24 | | | $10.00 | | | $10.02 | | | $9.87 | |
| | Income/(Loss) from Investment Operations: | | | | | | | | | | | | | | | | | | |
| | | Net investment income/(loss)(1) | | 0.04 | | | 0.09 | | | 0.02 | | | (0.08) | | | (0.11) | | | (0.13) | |
| | | Net realized and unrealized gain/(loss) | | (0.16) | | | (0.38) | | | 0.15 | | | 0.63 | | | 0.19 | | | 0.36 | |
| | Total from Investment Operations | | (0.12) | | | (0.29) | | | 0.17 | | | 0.55 | | | 0.08 | | | 0.23 | |
| | Less Dividends and Distributions: | | | | | | | | | | | | | | | | | | |
| | | Dividends (from net investment income) | | — | | | (0.06) | | | (0.16) | | | (0.31) | | | — | | | — | |
| | | Distributions (from capital gains) | | —(2) | | | — | | | (0.14) | | | — | | | (0.10) | | | (0.08) | |
| | Total Dividends and Distributions | | — | | | (0.06) | | | (0.30) | | | (0.31) | | | (0.10) | | | (0.08) | |
| | Net Asset Value, End of Period | | $9.64 | | | $9.76 | | | $10.11 | | | $10.24 | | | $10.00 | | | $10.02 | |
| | Total Return* | | (1.19)% | | | (2.82)% | | | 1.64% | | | 5.51% | | | 0.82% | | | 2.32% | |
| | Net Assets, End of Period (in thousands) | | $6,345 | | | $15,071 | | | $19,707 | | | $6,713 | | | $2,383 | | | $2,265 | |
| | Average Net Assets for the Period (in thousands) | | $11,537 | | | $17,278 | | | $12,386 | | | $4,396 | | | $2,318 | | | $2,586 | |
| | Ratios to Average Net Assets**: | | | | | | | | | | | | | | | | | | |
| | | Ratio of Gross Expenses | | 1.68% | | | 1.62% | | | 1.45% | | | 1.55% | | | 1.63% | | | 1.59% | |
| | | Ratio of Net Expenses (After Waivers and Expense Offsets) | | 1.22% | | | 1.22% | | | 1.22% | | | 1.31% | | | 1.27% | | | 1.26% | |
| | | Ratio of Net Investment Income/(Loss) | | 0.86% | | | 0.92% | | | 0.24% | | | (0.81)% | | | (1.16)% | | | (1.26)% | |
| | Portfolio Turnover Rate | | 0% | | | 0% | | | 0% | | | 16% | | | 0% | | | 0% | |
| | | | | | | | | | | | | | | | | | | | | | |
| |
* Total return includes adjustments in accordance with generally accepted accounting principles required at the year or period end and are not annualized for periods of less than one full year. ** Annualized for periods of less than one full year. (1) Per share amounts are calculated based on average shares outstanding during the year or period. (2) Less than $0.005 on a per share basis. |
| | |
See Notes to Consolidated Financial Statements. |
| |
18 | DECEMBER 31, 2019 |
Janus Henderson Diversified Alternatives Fund
Consolidated Financial Highlights
| | | | | | | | | | | | | | | | | | | | | | |
Class N Shares | | | | | | | | | | | | | | | | | | |
For a share outstanding during the period ended December 31, 2019 (unaudited) and the year ended June 30 | 2019 | | | 2019 | | | 2018 | | | 2017 | | | 2016 | | | 2015 | |
| | Net Asset Value, Beginning of Period | | $9.80 | | | $10.15 | | | $10.26 | | | $10.01 | | | $10.04 | | | $9.87 | |
| | Income/(Loss) from Investment Operations: | | | | | | | | | | | | | | | | | | |
| | | Net investment income/(loss)(1) | | 0.05 | | | 0.11 | | | 0.02 | | | (0.08) | | | (0.11) | | | (0.13) | |
| | | Net realized and unrealized gain/(loss) | | (0.17) | | | (0.39) | | | 0.17 | | | 0.63 | | | 0.18 | | | 0.38 | |
| | Total from Investment Operations | | (0.12) | | | (0.28) | | | 0.19 | | | 0.55 | | | 0.07 | | | 0.25 | |
| | Less Dividends and Distributions: | | | | | | | | | | | | | | | | | | |
| | | Dividends (from net investment income) | | — | | | (0.07) | | | (0.16) | | | (0.30) | | | — | | | — | |
| | | Distributions (from capital gains) | | —(2) | | | — | | | (0.14) | | | — | | | (0.10) | | | (0.08) | |
| | Total Dividends and Distributions | | — | | | (0.07) | | | (0.30) | | | (0.30) | | | (0.10) | | | (0.08) | |
| | Net Asset Value, End of Period | | $9.68 | | | $9.80 | | | $10.15 | | | $10.26 | | | $10.01 | | | $10.04 | |
| | Total Return* | | (1.19)% | | | (2.77)% | | | 1.83% | | | 5.58% | | | 0.72% | | | 2.52% | |
| | Net Assets, End of Period (in thousands) | | $58,766 | | | $64,410 | | | $75,615 | | | $50,421 | | | $47,367 | | | $52,478 | |
| | Average Net Assets for the Period (in thousands) | | $60,104 | | | $69,348 | | | $68,132 | | | $47,482 | | | $48,364 | | | $54,416 | |
| | Ratios to Average Net Assets**: | | | | | | | | | | | | | | | | | | |
| | | Ratio of Gross Expenses | | 1.55% | | | 1.50% | | | 1.36% | | | 1.53% | | | 1.62% | | | 1.60% | |
| | | Ratio of Net Expenses (After Waivers and Expense Offsets) | | 1.09% | | | 1.12% | | | 1.14% | | | 1.26% | | | 1.25% | | | 1.25% | |
| | | Ratio of Net Investment Income/(Loss) | | 0.96% | | | 1.08% | | | 0.17% | | | (0.83)% | | | (1.14)% | | | (1.24)% | |
| | Portfolio Turnover Rate | | 0% | | | 0% | | | 0% | | | 16% | | | 0% | | | 0% | |
| | | | | | | | | | | | | | | | | | | | | | |
| | | | | | | | | | | | | | | | | | | | | | |
Class S Shares | | | | | | | | | | | | | | | | | | |
For a share outstanding during the period ended December 31, 2019 (unaudited) and the year ended June 30 | 2019 | | | 2019 | | | 2018 | | | 2017 | | | 2016 | | | 2015 | |
| | Net Asset Value, Beginning of Period | | $9.65 | | | $10.00 | | | $10.10 | | | $9.89 | | | $9.92 | | | $9.82 | |
| | Income/(Loss) from Investment Operations: | | | | | | | | | | | | | | | | | | |
| | | Net investment income/(loss)(1) | | 0.04 | | | 0.09 | | | (0.08) | | | (0.12) | | | (0.12) | | | (0.18) | |
| | | Net realized and unrealized gain/(loss) | | (0.16) | | | (0.38) | | | 0.22 | | | 0.63 | | | 0.19 | | | 0.36 | |
| | Total from Investment Operations | | (0.12) | | | (0.29) | | | 0.14 | | | 0.51 | | | 0.07 | | | 0.18 | |
| | Less Dividends and Distributions: | | | | | | | | | | | | | | | | | | |
| | | Dividends (from net investment income) | | — | | | (0.06) | | | (0.10) | | | (0.30) | | | — | | | — | |
| | | Distributions (from capital gains) | | —(2) | | | — | | | (0.14) | | | — | | | (0.10) | | | (0.08) | |
| | Total Dividends and Distributions | | — | | | (0.06) | | | (0.24) | | | (0.30) | | | (0.10) | | | (0.08) | |
| | Net Asset Value, End of Period | | $9.53 | | | $9.65 | | | $10.00 | | | $10.10 | | | $9.89 | | | $9.92 | |
| | Total Return* | | (1.20)% | | | (2.91)% | | | 1.29% | | | 5.17% | | | 0.72% | | | 1.82% | |
| | Net Assets, End of Period (in thousands) | | $1,412 | | | $1,429 | | | $1,473 | | | $1,453 | | | $1,381 | | | $1,371 | |
| | Average Net Assets for the Period (in thousands) | | $1,408 | | | $1,436 | | | $1,480 | | | $1,425 | | | $1,340 | | | $1,578 | |
| | Ratios to Average Net Assets**: | | | | | | | | | | | | | | | | | | |
| | | Ratio of Gross Expenses | | 2.01% | | | 2.00% | | | 1.92% | | | 2.04% | | | 2.12% | | | 2.07% | |
| | | Ratio of Net Expenses (After Waivers and Expense Offsets) | | 1.21% | | | 1.30% | | | 1.53% | | | 1.64% | | | 1.33% | | | 1.75% | |
| | | Ratio of Net Investment Income/(Loss) | | 0.84% | | | 0.90% | | | (0.79)% | | | (1.21)% | | | (1.22)% | | | (1.74)% | |
| | Portfolio Turnover Rate | | 0% | | | 0% | | | 0% | | | 16% | | | 0% | | | 0% | |
| | | | | | | | | | | | | | | | | | | | | | |
| |
* Total return includes adjustments in accordance with generally accepted accounting principles required at the year or period end and are not annualized for periods of less than one full year. ** Annualized for periods of less than one full year. (1) Per share amounts are calculated based on average shares outstanding during the year or period. (2) Less than $0.005 on a per share basis. |
| | |
See Notes to Consolidated Financial Statements. |
| |
Janus Investment Fund | 19 |
Janus Henderson Diversified Alternatives Fund
Consolidated Financial Highlights
| | | | | | | | | | | | | | | | | | | | | | |
Class T Shares | | | | | | | | | | | | | | | | | | |
For a share outstanding during the period ended December 31, 2019 (unaudited) and the year ended June 30 | 2019 | | | 2019 | | | 2018 | | | 2017 | | | 2016 | | | 2015 | |
| | Net Asset Value, Beginning of Period | | $9.70 | | | $10.05 | | | $10.17 | | | $9.95 | | | $9.98 | | | $9.85 | |
| | Income/(Loss) from Investment Operations: | | | | | | | | | | | | | | | | | | |
| | | Net investment income/(loss)(1) | | 0.04 | | | 0.10 | | | —(2) | | | (0.10) | | | (0.10) | | | (0.15) | |
| | | Net realized and unrealized gain/(loss) | | (0.16) | | | (0.39) | | | 0.17 | | | 0.63 | | | 0.17 | | | 0.36 | |
| | Total from Investment Operations | | (0.12) | | | (0.29) | | | 0.17 | | | 0.53 | | | 0.07 | | | 0.21 | |
| | Less Dividends and Distributions: | | | | | | | | | | | | | | | | | | |
| | | Dividends (from net investment income) | | — | | | (0.06) | | | (0.15) | | | (0.31) | | | — | | | — | |
| | | Distributions (from capital gains) | | —(2) | | | — | | | (0.14) | | | — | | | (0.10) | | | (0.08) | |
| | Total Dividends and Distributions | | — | | | (0.06) | | | (0.29) | | | (0.31) | | | (0.10) | | | (0.08) | |
| | Net Asset Value, End of Period | | $9.58 | | | $9.70 | | | $10.05 | | | $10.17 | | | $9.95 | | | $9.98 | |
| | Total Return* | | (1.20)% | | | (2.86)% | | | 1.59% | | | 5.39% | | | 0.72% | | | 2.12% | |
| | Net Assets, End of Period (in thousands) | | $1,130 | | | $1,659 | | | $6,350 | | | $3,708 | | | $1,579 | | | $2,517 | |
| | Average Net Assets for the Period (in thousands) | | $1,257 | | | $5,496 | | | $5,110 | | | $2,556 | | | $1,689 | | | $2,162 | |
| | Ratios to Average Net Assets**: | | | | | | | | | | | | | | | | | | |
| | | Ratio of Gross Expenses | | 2.03% | | | 1.77% | | | 1.62% | | | 1.77% | | | 1.87% | | | 1.83% | |
| | | Ratio of Net Expenses (After Waivers and Expense Offsets) | | 1.19% | | | 1.29% | | | 1.33% | | | 1.45% | | | 1.18% | | | 1.51% | |
| | | Ratio of Net Investment Income/(Loss) | | 0.87% | | | 0.99% | | | (0.03)% | | | (0.97)% | | | (1.08)% | | | (1.50)% | |
| | Portfolio Turnover Rate | | 0% | | | 0% | | | 0% | | | 16% | | | 0% | | | 0% | |
| | | | | | | | | | | | | | | | | | | | | | |
| |
* Total return includes adjustments in accordance with generally accepted accounting principles required at the year or period end and are not annualized for periods of less than one full year. ** Annualized for periods of less than one full year. (1) Per share amounts are calculated based on average shares outstanding during the year or period. (2) Less than $0.005 on a per share basis. |
| | |
See Notes to Consolidated Financial Statements. |
| |
20 | DECEMBER 31, 2019 |
Janus Henderson Diversified Alternatives Fund
Notes to Consolidated Financial Statements (unaudited)
1. Organization and Significant Accounting Policies
Janus Henderson Diversified Alternatives Fund (the “Fund”) is a series of Janus Investment Fund (the “Trust”), which is organized as a Massachusetts business trust and is registered under the Investment Company Act of 1940, as amended (the “1940 Act”), as an open-end management investment company, and therefore has applied the specialized accounting and reporting guidance in Financial Accounting Standards Board (“FASB”) Accounting Standards Codification (“ASC”) Topic 946. The Trust offers 47 funds which include multiple series of shares, with differing investment objectives and policies. The Fund seeks absolute return with low correlation to stocks and bonds. The Fund is classified as diversified, as defined in the 1940 Act.
The Fund offers multiple classes of shares in order to meet the needs of various types of investors. Each class represents an interest in the same portfolio of investments. Certain financial intermediaries may not offer all classes of shares. Class D Shares are closed to certain new investors.
Class A Shares are offered through financial intermediary platforms including, but not limited to, traditional brokerage platforms, mutual fund wrap fee programs, bank trust platforms, and retirement platforms.
Class C Shares are offered through financial intermediary platforms including, but not limited to, traditional brokerage platforms, mutual fund wrap fee programs, and bank trust platforms.
Class C Shares are closed to investments by new employer-sponsored retirement plans and existing employer-sponsored retirement plans are no longer able to make additional purchases or exchanges into Class C Shares.
The Funds have adopted an auto-conversion policy pursuant to which Class C Shares that have been held for ten years will be automatically converted to Class A Shares without the imposition of any sales charge, fee or other charge. The conversion will generally occur no later than ten business days in the month following the month of the tenth anniversary of the date of purchase. Class C Shares purchased through the reinvestment of dividends and other distributions on Class C Shares will convert to Class A Shares at the same time as the Class C Shares with respect to which they were purchased. For Class C Shares held in omnibus accounts on intermediary platforms, the Fund will rely on these intermediaries to implement this conversion feature. Your financial intermediary may have separate policies and procedures as to when and how Class C Shares may be converted to Class A Shares. Please contact your financial intermediary for additional information.
Class D Shares are generally no longer being made available to new investors who do not already have a direct account with the Janus Henderson funds. Class D Shares are available only to investors who hold accounts directly with the Janus Henderson funds, to immediate family members or members of the same household of an eligible individual investor, and to existing beneficial owners of sole proprietorships or partnerships that hold accounts directly with the Janus Henderson funds.
Class I Shares are available through certain financial intermediary platforms including, but not limited to, mutual fund wrap fee programs, managed account programs, asset allocation programs, bank trust platforms, as well as certain retirement platforms. Class I Shares are also available to certain direct institutional investors including, but not limited to, corporations, certain retirement plans, public plans, and foundations/endowments, who established Class I Share accounts before August 4, 2017.
Class N Shares are generally available only to financial intermediaries purchasing on behalf of: 1) certain adviser-assisted, employer-sponsored retirement plans, including 401(k) plans, 457 plans, 403(b) plans, Taft-Hartley multi-employer plans, profit-sharing and money purchase pension plans, defined benefit plans and certain welfare benefit plans, such as health savings accounts, and nonqualified deferred compensation plans; and 2) retail investors purchasing in qualified or nonqualified accounts, whose accounts are held through an omnibus account at their financial intermediary, and where the financial intermediary requires no payment or reimbursement from the Fund, Janus Capital Management LLC (“Janus Capital”), or its affiliates. Class N Shares are also available to Janus Henderson proprietary products and to certain direct institutional investors approved by Janus Distributors LLC dba Janus Henderson Distributors (“Janus Henderson Distributors”) including, but not limited to, corporations, certain retirement plans, public plans, and foundations and endowments, subject to minimum investment requirements.
Class S Shares are offered through financial intermediary platforms including, but not limited to, retirement platforms and asset allocation, mutual fund wrap, or other discretionary or nondiscretionary fee-based investment advisory
Janus Henderson Diversified Alternatives Fund
Notes to Consolidated Financial Statements (unaudited)
programs. In addition, Class S Shares may be available through certain financial intermediaries who have an agreement with Janus Capital or its affiliates to offer Class S Shares on their supermarket platforms.
Class T Shares are available through certain financial intermediary platforms including, but not limited to, mutual fund wrap fee programs, managed account programs, asset allocation programs, bank trust platforms, as well as certain retirement platforms. In addition, Class T Shares may be available through certain financial intermediaries who have an agreement with Janus Capital or its affiliates to offer Class T Shares on their supermarket platforms.
Investment in Subsidiary
To qualify as a regulated investment company under the Internal Revenue Code of 1986, as amended (the “Code”), 90% of the Fund’s income must be from certain qualified sources. Direct investment in many commodities-related investments generates income that is not from a qualifying source for purposes of meeting this 90% test. The Fund will seek to gain exposure to the commodity markets, in whole or in part, through investments in the Janus Diversified Alternatives Subsidiary, Ltd., a wholly-owned subsidiary of the Fund (”Subsidiary”) organized under the laws of the Cayman Islands, which is generally subject to the same investment policies and restrictions as the Fund. The Subsidiary may invest without limitation in commodity index-linked swaps, commodity futures, commodity swaps, commodity-linked notes, and other commodity-linked derivative instruments. The Subsidiary may also invest in fixed-income securities and other investments which may serve as margin or collateral for the Subsidiary’s derivatives positions. The Fund may invest 25% or less of its total assets in the Subsidiary. Income or net capital gains from the Fund’s investment in the Subsidiary would be treated as ordinary income to the Fund. Janus Capital is the adviser to the Subsidiary. The Subsidiary will not be subject to U.S. laws (including securities laws) and their protections. The Subsidiary is subject to the laws of a foreign jurisdiction, which can be affected by developments in that jurisdiction.
By investing in the Subsidiary, the Fund will be indirectly exposed to the risks associated with the Subsidiary’s investments, which are generally similar to those that are permitted to be held by the Fund. The Subsidiary is not registered under the 1940 Act, and is not subject to all of the provisions of the 1940 Act. The IRS has previously issued a number of private letter rulings to mutual funds (but not the Fund) in which it ruled that income from a fund’s investment in a wholly-owned foreign subsidiary that invests in commodity-linked derivatives, such as the Subsidiary, constitutes qualifying income. The IRS has suspended issuance of any further private letter rulings pending a review of its position. A change in the IRS’ position or changes in the laws of the United States and/or the Cayman Islands could result in the inability of the Fund and/or the Subsidiary to operate and could adversely affect the Fund. In particular, unfavorable treatment of the income derived from the Fund’s investment in the Subsidiary could jeopardize the Fund’s status as a regulated investment company under the Code, which in turn may subject the Fund to higher tax rates and/or penalties. Additionally, the Commodity Futures Trading Commission (“CFTC”) adopted changes to Rule 4.5 under the Commodity Exchange Act in 2012 that required Janus Capital to register with the CFTC, and operation of the Fund and Subsidiary is subject to certain CFTC rules and regulations. Existing or new CFTC regulation may increase the costs of implementing the Fund’s strategies, which could negatively affect the Fund’s returns.
The Subsidiary was incorporated on December 28, 2012 as a wholly-owned subsidiary of Janus Diversified Alternatives Fund. As of December 31, 2019, the Fund owns 735,660 shares of the Subsidiary, with a market value of $6,311,998. This represents 9% of the Fund’s net assets. The Fund’s Consolidated Schedule of Investments, Consolidated Statement of Assets and Liabilities, Consolidated Statement of Operations, Consolidated Statements of Changes in Net Assets, and Consolidated Financial Highlights include the accounts of both the Fund and the Subsidiary. All inter-company transactions and balances have been eliminated in consolidation.
As of December 31, 2019, Subsidiary information included in the Consolidated Financial Statements is as follows:
| | |
Net assets | $ 6,311,998 |
Market value of investments | 1,508,116 |
Net income/(loss) | 32,967 |
Net realized gain/(loss) | (57,365) |
Net change in unrealized appreciation/depreciation | (182,337) |
The following accounting policies have been followed by the Fund and are in conformity with accounting principles generally accepted in the United States of America.
Janus Henderson Diversified Alternatives Fund
Notes to Consolidated Financial Statements (unaudited)
Investment Valuation
Securities held by the Fund are valued in accordance with policies and procedures established by and under the supervision of the Trustees (the “Valuation Procedures”). Equity securities traded on a domestic securities exchange are generally valued at the closing prices on the primary market or exchange on which they trade. If such price is lacking for the trading period immediately preceding the time of determination, such securities are valued at their current bid price. Equity securities that are traded on a foreign exchange are generally valued at the closing prices on such markets. In the event that there is no current trading volume on a particular security in such foreign exchange, the bid price from the primary exchange is generally used to value the security. Securities that are traded on the over-the-counter (“OTC”) markets are generally valued at their closing or latest bid prices as available. Foreign securities and currencies are converted to U.S. dollars using the applicable exchange rate in effect at the close of the New York Stock Exchange (“NYSE”). The Fund will determine the market value of individual securities held by it by using prices provided by one or more approved professional pricing services or, as needed, by obtaining market quotations from independent broker-dealers. Most debt securities are valued in accordance with the evaluated bid price supplied by the pricing service that is intended to reflect market value. The evaluated bid price supplied by the pricing service is an evaluation that may consider factors such as security prices, yields, maturities and ratings. Certain short-term securities maturing within 60 days or less may be evaluated and valued on an amortized cost basis provided that the amortized cost determined approximates market value. Securities for which market quotations or evaluated prices are not readily available or deemed unreliable are valued at fair value determined in good faith under the Valuation Procedures. Circumstances in which fair value pricing may be utilized include, but are not limited to: (i) a significant event that may affect the securities of a single issuer, such as a merger, bankruptcy, or significant issuer-specific development; (ii) an event that may affect an entire market, such as a natural disaster or significant governmental action; (iii) a nonsignificant event such as a market closing early or not opening, or a security trading halt; and (iv) pricing of a nonvalued security and a restricted or nonpublic security. Special valuation considerations may apply with respect to “odd-lot” fixed-income transactions which, due to their small size, may receive evaluated prices by pricing services which reflect a large block trade and not what actually could be obtained for the odd-lot position. The Fund uses systematic fair valuation models provided by independent third parties to value international equity securities in order to adjust for stale pricing, which may occur between the close of certain foreign exchanges and the close of the NYSE.
Information on the valuation of certain derivatives is contained in Note 2 below.
Valuation Inputs Summary
FASB ASC 820, Fair Value Measurements and Disclosures (“ASC 820”), defines fair value, establishes a framework for measuring fair value, and expands disclosure requirements regarding fair value measurements. This standard emphasizes that fair value is a market-based measurement that should be determined based on the assumptions that market participants would use in pricing an asset or liability and establishes a hierarchy that prioritizes inputs to valuation techniques used to measure fair value. These inputs are summarized into three broad levels:
Level 1 – Unadjusted quoted prices in active markets the Fund has the ability to access for identical assets or liabilities.
Level 2 – Observable inputs other than unadjusted quoted prices included in Level 1 that are observable for the asset or liability either directly or indirectly. These inputs may include quoted prices for the identical instrument on an inactive market, prices for similar instruments, interest rates, prepayment speeds, credit risk, yield curves, default rates and similar data.
Assets or liabilities categorized as Level 2 in the hierarchy generally include: debt securities fair valued in accordance with the evaluated bid or ask prices supplied by a pricing service; securities traded on OTC markets and listed securities for which no sales are reported that are fair valued at the latest bid price (or yield equivalent thereof) obtained from one or more dealers transacting in a market for such securities or by a pricing service approved by the Fund’s Trustees; certain short-term debt securities with maturities of 60 days or less that are fair valued at amortized cost; and equity securities of foreign issuers whose fair value is determined by using systematic fair valuation models provided by independent third parties in order to adjust for stale pricing which may occur between the close of certain foreign exchanges and the close of the NYSE. Other securities that may be categorized as Level 2 in the hierarchy include, but are not limited to, preferred stocks, bank loans, swaps, investments in unregistered investment companies, options, and forward contracts.
Janus Henderson Diversified Alternatives Fund
Notes to Consolidated Financial Statements (unaudited)
Level 3 – Unobservable inputs for the asset or liability to the extent that relevant observable inputs are not available, representing the Fund’s own assumptions about the assumptions that a market participant would use in valuing the asset or liability, and that would be based on the best information available.
There have been no significant changes in valuation techniques used in valuing any such positions held by the Fund since the beginning of the fiscal year.
The inputs or methodology used for fair valuing securities are not necessarily an indication of the risk associated with investing in those securities. The summary of inputs used as of December 31, 2019 to fair value the Fund’s investments in securities and other financial instruments is included in the “Valuation Inputs Summary” in the Notes to Consolidated Schedule of Investments and Other Information.
Investment Transactions and Investment Income
Investment transactions are accounted for as of the date purchased or sold (trade date). Dividend income is recorded on the ex-dividend date. Certain dividends from foreign securities will be recorded as soon as the Fund is informed of the dividend, if such information is obtained subsequent to the ex-dividend date. Dividends from foreign securities may be subject to withholding taxes in foreign jurisdictions. Interest income is recorded daily on the accrual basis and includes amortization of premiums and accretion of discounts. The Fund classifies gains and losses on prepayments received as an adjustment to interest income. Debt securities may be placed in non-accrual status and related interest income may be reduced by stopping current accruals and writing off interest receivables when collection of all or a portion of interest has become doubtful. Gains and losses are determined on the identified cost basis, which is the same basis used for federal income tax purposes. Income, as well as gains and losses, both realized and unrealized, are allocated daily to each class of shares based upon the ratio of net assets represented by each class as a percentage of total net assets.
Expenses
The Fund bears expenses incurred specifically on its behalf. Each class of shares bears a portion of general expenses, which are allocated daily to each class of shares based upon the ratio of net assets represented by each class as a percentage of total net assets. Expenses directly attributable to a specific class of shares are charged against the operations of such class. Additionally, the Fund, as a shareholder in the Subsidiary, will also indirectly bear its pro rata share of the expenses incurred by the Subsidiary.
Estimates
The preparation of consolidated financial statements in conformity with accounting principles generally accepted in the United States of America requires management to make estimates and assumptions that affect the reported amount of assets and liabilities and disclosure of contingent assets and liabilities at the date of the consolidated financial statements, and the reported amounts of income and expenses during the reporting period. Actual results could differ from those estimates.
Indemnifications
In the normal course of business, the Fund may enter into contracts that contain provisions for indemnification of other parties against certain potential liabilities. The Fund’s maximum exposure under these arrangements is unknown, and would involve future claims that may be made against the Fund that have not yet occurred. Currently, the risk of material loss from such claims is considered remote.
Foreign Currency Translations
The Fund does not isolate that portion of the results of operations resulting from the effect of changes in foreign exchange rates on investments from the fluctuations arising from changes in market prices of securities held at the date of the consolidated financial statements. Net unrealized appreciation or depreciation of investments and foreign currency translations arise from changes in the value of assets and liabilities, including investments in securities held at the date of the consolidated financial statements, resulting from changes in the exchange rates and changes in market prices of securities held.
Currency gains and losses are also calculated on payables and receivables that are denominated in foreign currencies. The payables and receivables are generally related to foreign security transactions and income translations.
Foreign currency-denominated assets and forward currency contracts may involve more risks than domestic transactions, including currency risk, counterparty risk, political and economic risk, regulatory risk and equity risk. Risks may arise from unanticipated movements in the value of foreign currencies relative to the U.S. dollar.
Janus Henderson Diversified Alternatives Fund
Notes to Consolidated Financial Statements (unaudited)
Dividends and Distributions
The Fund generally declares and distributes dividends of net investment income and realized capital gains (if any) annually. The Fund may treat a portion of the amount paid to redeem shares as a distribution of investment company taxable income and realized capital gains that are reflected in the net asset value. This practice, commonly referred to as “equalization,” has no effect on the redeeming shareholder or the Fund’s total return, but may reduce the amounts that would otherwise be required to be paid as taxable dividends to the remaining shareholders. It is possible that the Internal Revenue Service (IRS) could challenge the Fund's equalization methodology or calculations, and any such challenge could result in additional tax, interest, or penalties to be paid by the Fund.
Federal Income Taxes
The Fund intends to continue to qualify as a regulated investment company and distribute all of its taxable income in accordance with the requirements of Subchapter M of the Internal Revenue Code. Management has analyzed the Fund’s tax positions taken for all open federal income tax years, generally a three-year period, and has concluded that no provision for federal income tax is required in the Fund’s consolidated financial statements. The Fund is not aware of any tax positions for which it is reasonably possible that the total amounts of unrecognized tax benefits will significantly change in the next twelve months.
2. Derivative Instruments
The Fund may invest in various types of derivatives, which may at times result in significant derivative exposure. A derivative is a financial instrument whose performance is derived from the performance of another asset. The Fund may invest in derivative instruments including, but not limited to: futures contracts, put options, call options, options on future contracts, options on foreign currencies, options on recovery locks, options on security and commodity indices, swaps, forward contracts, structured investments, and other equity-linked derivatives. Each derivative instrument that was held by the Fund during the period ended December 31, 2019 is discussed in further detail below. A summary of derivative activity by the Fund is reflected in the tables at the end of the Consolidated Statement of Investments.
The Fund may use derivative instruments for hedging purposes (to offset risks associated with an investment, currency exposure, or market conditions), to adjust currency exposure relative to a benchmark index, or for speculative purposes (to earn income and seek to enhance returns). When the Fund invests in a derivative for speculative purposes, the Fund will be fully exposed to the risks of loss of that derivative, which may sometimes be greater than the derivative’s cost. The Fund may not use any derivative to gain exposure to an asset or class of assets that it would be prohibited by its investment restrictions from purchasing directly. The Fund’s ability to use derivative instruments may also be limited by tax considerations.
Investments in derivatives in general are subject to market risks that may cause their prices to fluctuate over time. Investments in derivatives may not directly correlate with the price movements of the underlying instrument. As a result, the use of derivatives may expose the Fund to additional risks that it would not be subject to if it invested directly in the securities underlying those derivatives. The use of derivatives may result in larger losses or smaller gains than otherwise would be the case. Derivatives can be volatile and may involve significant risks.
In pursuit of its investment objective, the Fund may seek to use derivatives to increase or decrease exposure to the following market risk factors:
· Commodity Risk – the risk related to the change in value of commodities or commodity-linked investments due to changes in the overall market movements, volatility of the underlying benchmark, changes in interest rates, or other factors affecting a particular industry or commodity such as drought, floods, weather, livestock disease, embargoes, tariffs, and international economic, political, and regulatory developments.
· Counterparty Risk – the risk that the counterparty (the party on the other side of the transaction) on a derivative transaction will be unable to honor its financial obligation to the Fund.
· Credit Risk – the risk an issuer will be unable to make principal and interest payments when due, or will default on its obligations.
· Currency Risk – the risk that changes in the exchange rate between currencies will adversely affect the value (in U.S. dollar terms) of an investment.
· Equity Risk – the risk related to the change in value of equity securities as they relate to increases or decreases in the general market.
Janus Henderson Diversified Alternatives Fund
Notes to Consolidated Financial Statements (unaudited)
· Index Risk – if the derivative is linked to the performance of an index, it will be subject to the risks associated with changes in that index. If the index changes, the Fund could receive lower interest payments or experience a reduction in the value of the derivative to below what the Fund paid. Certain indexed securities, including inverse securities (which move in an opposite direction to the index), may create leverage, to the extent that they increase or decrease in value at a rate that is a multiple of the changes in the applicable index.
· Interest Rate Risk – the risk that the value of fixed-income securities will generally decline as prevailing interest rates rise, which may cause the Fund’s NAV to likewise decrease.
· Leverage Risk – the risk associated with certain types of leveraged investments or trading strategies pursuant to which relatively small market movements may result in large changes in the value of an investment. The Fund creates leverage by investing in instruments, including derivatives, where the investment loss can exceed the original amount invested. Certain investments or trading strategies, such as short sales, that involve leverage can result in losses that greatly exceed the amount originally invested.
· Liquidity Risk – the risk that certain securities may be difficult or impossible to sell at the time that the seller would like or at the price that the seller believes the security is currently worth.
Derivatives may generally be traded OTC or on an exchange. Derivatives traded OTC are agreements that are individually negotiated between parties and can be tailored to meet a purchaser’s needs. OTC derivatives are not guaranteed by a clearing agency and may be subject to increased credit risk.
In an effort to mitigate credit risk associated with derivatives traded OTC, the Fund may enter into collateral agreements with certain counterparties whereby, subject to certain minimum exposure requirements, the Fund may require the counterparty to post collateral if the Fund has a net aggregate unrealized gain on all OTC derivative contracts with a particular counterparty. Additionally, the Fund may deposit cash and/or treasuries as collateral with the counterparty and/or custodian daily (based on the daily valuation of the financial asset) if the Fund has a net aggregate unrealized loss on OTC derivative contracts with a particular counterparty. All liquid securities and restricted cash are considered to cover in an amount at all times equal to or greater than the Fund’s commitment with respect to certain exchange-traded derivatives, centrally cleared derivatives, forward foreign currency exchange contracts, short sales, and/or securities with extended settlement dates. There is no guarantee that counterparty exposure is reduced and these arrangements are dependent on Janus Capital Management LLC's (“Janus Capital”) ability to establish and maintain appropriate systems and trading.
Commodity-Linked Investments
The Fund may invest in commodity index-linked swap agreements, commodity options and futures, and options on futures that provide exposure to the investment returns of the commodities markets. The Fund may also invest in other commodity-linked derivative instruments, such as commodity-linked notes (“structured notes”). The Fund will seek to gain exposure to the commodity markets, in whole or in part, through investments in the Subsidiary which is generally subject to the same investment policies and restrictions as the Fund. The Subsidiary invests in commodity-linked investments and other investments which may serve as margin or collateral for the Subsidiary’s derivative positions. Such exposure may subject the Fund to greater volatility than investments in traditional securities. The value of a given commodity-linked derivative investment typically is based upon the price movements of a physical commodity (such as heating oil, livestock, or agricultural products), a commodity futures contract or commodity index, or some other readily measurable economic variable. The value of commodity-linked derivative instruments may therefore be affected by changes in overall market movements, volatility of the underlying benchmark, changes in interest rates, or other factors affecting a particular industry or commodity such as drought, floods, weather, livestock disease, embargoes, tariffs, and international economic, political, and regulatory developments.
Forward Foreign Currency Exchange Contracts
A forward foreign currency exchange contract (“forward currency contract”) is an obligation to buy or sell a specified currency at a future date at a negotiated rate (which may be U.S. dollars or a foreign currency). The Fund may enter into forward currency contracts for hedging purposes, including, but not limited to, reducing exposure to changes in foreign currency exchange rates on foreign portfolio holdings and locking in the U.S. dollar cost of firm purchase and sale commitments for securities denominated in or exposed to foreign currencies. The Fund may also invest in forward currency contracts for non-hedging purposes such as seeking to enhance returns. The Fund is subject to currency risk and counterparty risk in the normal course of pursuing its investment objective through its investments in forward currency contracts.
Janus Henderson Diversified Alternatives Fund
Notes to Consolidated Financial Statements (unaudited)
Forward currency contracts are valued by converting the foreign value to U.S. dollars by using the current spot U.S. dollar exchange rate and/or forward rate for that currency. Exchange and forward rates as of the close of the NYSE shall be used to value the forward currency contracts. The unrealized appreciation/(depreciation) for forward currency contracts is reported in the Consolidated Statement of Assets and Liabilities as a receivable or payable and in the Consolidated Statement of Operations for the change in unrealized net appreciation/depreciation (if applicable). The gain or loss arising from the difference between the U.S. dollar cost of the original contract and the value of the foreign currency in U.S. dollars upon closing a forward currency contract is reported on the Consolidated Statement of Operations (if applicable).
During the period, the Fund entered into forward currency contracts with the obligation to purchase foreign currencies in the future at an agreed upon rate in order to take a positive outlook on the related currency. These forward contracts seek to increase exposure to currency risk.
During the period, the Fund entered into forward currency contracts with the obligation to sell foreign currencies in the future at an agreed upon rate in order to take a negative outlook on the related currency. These forward contracts seek to increase exposure to currency risk.
Futures Contracts
A futures contract is an exchange-traded agreement to take or make delivery of an underlying asset at a specific time in the future for a specific predetermined negotiated price. The Fund may enter into futures contracts to gain exposure to the stock market or other markets pending investment of cash balances or to meet liquidity needs. The Fund is subject to interest rate risk, equity risk, and currency risk in the normal course of pursuing its investment objective through its investments in futures contracts. The Fund may also use such derivative instruments to hedge or protect from adverse movements in securities prices, currency rates or interest rates. The use of futures contracts may involve risks such as the possibility of illiquid markets or imperfect correlation between the values of the contracts and the underlying securities, or that the counterparty will fail to perform its obligations.
Futures contracts on commodities are valued at the settlement price on valuation date on the commodities exchange as reported by an approved vendor. Mini contracts, as defined in the description of the contract, shall be valued using the Actual Settlement Price or “ASET” price type as reported by an approved vendor. In the event that foreign futures trade when the foreign equity markets are closed, the last foreign futures trade price shall be used. Futures contracts are marked-to-market daily, and the daily variation margin is recorded as a receivable or payable on the Consolidated Statement of Assets and Liabilities (if applicable). The change in unrealized net appreciation/depreciation is reported on the Consolidated Statement of Operations (if applicable). When a contract is closed, a realized gain or loss is reported on the Consolidated Statement of Operations (if applicable), equal to the difference between the opening and closing value of the contract. Securities held by the Fund that are designated as collateral for market value on futures contracts are noted on the Consolidated Schedule of Investments (if applicable). Such collateral is in the possession of the Fund’s futures commission merchant.
With futures, there is minimal counterparty credit risk to the Fund since futures are exchange-traded and the exchange’s clearinghouse, as counterparty to all exchange-traded futures, guarantees the futures against default.
During the period, the Fund purchased interest rate futures to increase exposure to interest rate risk.
During the period, the Fund sold interest rate futures to decrease exposure to interest rate risk.
During the period, the Fund purchased commodity futures to increase exposure to commodity risk.
During the period, the Fund sold commodity futures to decrease exposure to commodity risk.
During the period, the Fund purchased futures on equity indices to increase exposure to equity risk.
During the period, the Fund purchased futures on currency indices to increase exposure to currency risk.
During the period, the Fund sold futures on currency indices to decrease exposure to currency risk.
Swaps
Swap agreements are two-party contracts entered into primarily by institutional investors for periods ranging from a day to more than one year to exchange one set of cash flows for another. The most significant factor in the performance of swap agreements is the change in value of the specific index, security, or currency, or other factors that determine the
Janus Henderson Diversified Alternatives Fund
Notes to Consolidated Financial Statements (unaudited)
amounts of payments due to and from the Fund. The use of swaps is a highly specialized activity which involves investment techniques and risks different from those associated with ordinary portfolio securities transactions. Swap transactions may in some instances involve the delivery of securities or other underlying assets by the Fund or its counterparty to collateralize obligations under the swap. If the other party to a swap that is not collateralized defaults, the Fund would risk the loss of the net amount of the payments that it contractually is entitled to receive. Swap agreements entail the risk that a party will default on its payment obligations to the Fund. If the other party to a swap defaults, the Fund would risk the loss of the net amount of the payments that it contractually is entitled to receive. If the Fund utilizes a swap at the wrong time or judges market conditions incorrectly, the swap may result in a loss to the Fund and reduce the Fund’s total return.
Swap agreements also bear the risk that the Fund will not be able to meet its obligation to the counterparty. Swap agreements are typically privately negotiated and entered into in the OTC market. However, certain swap agreements are required to be cleared through a clearinghouse and traded on an exchange or swap execution facility. Swaps that are required to be cleared are required to post initial and variation margins in accordance with the exchange requirements. Regulations enacted require the Fund to centrally clear certain interest rate and credit default index swaps through a clearinghouse or central counterparty (“CCP”). To clear a swap with a CCP, the Fund will submit the swap to, and post collateral with, a futures clearing merchant (“FCM”) that is a clearinghouse member. Alternatively, the Fund may enter into a swap with a financial institution other than the FCM (the “Executing Dealer”) and arrange for the swap to be transferred to the FCM for clearing. The Fund may also enter into a swap with the FCM itself. The CCP, the FCM, and the Executing Dealer are all subject to regulatory oversight by the U.S. Commodity Futures Trading Commission (“CFTC”). A default or failure by a CCP or an FCM, or the failure of a swap to be transferred from an Executing Dealer to the FCM for clearing, may expose the Fund to losses, increase its costs, or prevent the Fund from entering or exiting swap positions, accessing collateral, or fully implementing its investment strategies. The regulatory requirement to clear certain swaps could, either temporarily or permanently, reduce the liquidity of cleared swaps or increase the costs of entering into those swaps.
Index swaps, interest rate swaps, and credit default swaps are valued using an approved vendor supplied price. Basket swaps are valued using a broker supplied price. Equity swaps that consist of a single underlying equity are valued either at the closing price, the latest bid price, or the last sale price on the primary market or exchange it trades. The market value of swap contracts are aggregated by positive and negative values and are disclosed separately as an asset or liability on the Fund’s Consolidated Statement of Assets and Liabilities (if applicable). Realized gains and losses are reported on the Fund’s Consolidated Statement of Operations (if applicable). The change in unrealized net appreciation or depreciation during the period is included in the Consolidated Statement of Operations (if applicable).
The Fund’s maximum risk of loss from counterparty risk or credit risk is the discounted value of the payments to be received from/paid to the counterparty over the contract’s remaining life, to the extent that the amount is positive. The risk is mitigated by having a netting arrangement between the Fund and the counterparty and by the posting of collateral by the counterparty to cover the Fund’s exposure to the counterparty.
Total return swaps involve an exchange by two parties in which one party makes payments based on a set rate, either fixed or variable, while the other party makes payments based on the return of an underlying asset, which includes both the income it generates and any capital gains over the payment period. A fixed-income total return swap may be written on many different kinds of underlying reference assets, and may include different indices for various kinds of debt securities (e.g., U.S. investment grade bonds, high-yield bonds, or emerging market bonds).
During the period, the Fund entered into total return swaps on equity indices or custom baskets of equity indices to increase exposure to equity risk. These total return swaps require the Fund to pay a floating reference interest rate, and an amount equal to the negative price movement of securities or an index multiplied by the notional amount of the contract. The Fund will receive payments equal to the positive price movement of the same securities or index multiplied by the notional amount of the contract and, in some cases, dividends paid on the securities.
During the period, the Fund entered into total return swaps on equity indices to decrease exposure to equity risk. These total return swaps require the Fund to pay an amount equal to the positive price movement of securities or an index multiplied by the notional amount of the contract and, in some cases, dividends paid on the securities. The Fund will receive payments of a floating reference interest rate and an amount equal to the negative price movement of the same securities or index multiplied by the notional amount of the contract.
Janus Henderson Diversified Alternatives Fund
Notes to Consolidated Financial Statements (unaudited)
During the period, the Fund entered into total return swaps on a basket of commodity indices to increase exposure to commodity risk. These total return swaps require the Fund to pay a fixed or a floating reference interest rate, and an amount equal to the negative price movement of an index multiplied by the notional amount of the contract. The Fund will receive payments equal to the positive price movement of the same index multiplied by the notional amount of the contract.
3. Other Investments and Strategies
Additional Investment Risk
In the aftermath of the 2007-2008 financial crisis, the financial sector experienced reduced liquidity in credit and other fixed-income markets, and an unusually high degree of volatility, both domestically and internationally. In response to the crisis, the United States and certain foreign governments, along with the U.S. Federal Reserve and certain foreign central banks, took steps to support the financial markets. For example, the enactment of the Dodd-Frank Act in 2010 provided for widespread regulation of financial institutions, consumer financial products and services, broker-dealers, over-the-counter derivatives, investment advisers, credit rating agencies, and mortgage lending, which expanded federal oversight in the financial sector, including the investment management industry. The withdrawal of this support, a failure of measures put in place to respond to the crisis, or investor perception that such efforts were not sufficient could each negatively affect financial markets generally, and the value and liquidity of specific securities. In addition, policy and legislative changes in the United States and in other countries continue to impact many aspects of financial regulation.
A number of countries in the European Union (“EU”) have experienced, and may continue to experience, severe economic and financial difficulties. In particular, many EU nations are susceptible to economic risks associated with high levels of debt. Many non-governmental issuers, and even certain governments, have defaulted on, or been forced to restructure, their debts. Many other issuers have faced difficulties obtaining credit or refinancing existing obligations. Financial institutions have in many cases required government or central bank support, have needed to raise capital, and/or have been impaired in their ability to extend credit. As a result, financial markets in the EU experienced extreme volatility and declines in asset values and liquidity. Responses to these financial problems by European governments, central banks, and others, including austerity measures and reforms, may not work, may result in social unrest, and may limit future growth and economic recovery or have other unintended consequences. The risk of investing in securities in the European markets may also be heightened due to the referendum in which the United Kingdom voted to exit the EU (commonly known as “Brexit”). There is considerable uncertainty about how Brexit will be conducted, how negotiations of necessary treaties and trade agreements will conclude, or how financial markets will react.
Certain areas of the world have historically been prone to and economically sensitive to environmental events such as, but not limited to, hurricanes, earthquakes, typhoons, flooding, tidal waves, tsunamis, erupting volcanoes, wildfires or droughts, tornadoes, mudslides, or other weather-related phenomena. Such disasters, and the resulting physical or economic damage, could have a severe and negative impact on the Fund’s investment portfolio and, in the longer term, could impair the ability of issuers in which the Fund invests to conduct their businesses as they would under normal conditions. Adverse weather conditions may also have a particularly significant negative effect on issuers in the agricultural sector and on insurance companies that insure against the impact of natural disasters.
Counterparties
Fund transactions involving a counterparty are subject to the risk that the counterparty or a third party will not fulfill its obligation to the Fund (“counterparty risk”). Counterparty risk may arise because of the counterparty’s financial condition (i.e., financial difficulties, bankruptcy, or insolvency), market activities and developments, or other reasons, whether foreseen or not. A counterparty’s inability to fulfill its obligation may result in significant financial loss to the Fund. The Fund may be unable to recover its investment from the counterparty or may obtain a limited recovery, and/or recovery may be delayed. The extent of the Fund’s exposure to counterparty risk with respect to financial assets and liabilities approximates its carrying value. See the "Offsetting Assets and Liabilities" section of this Note for further details.
The Fund may be exposed to counterparty risk through participation in various programs, including, but not limited to, lending its securities to third parties, cash sweep arrangements whereby the Fund’s cash balance is invested in one or more types of cash management vehicles, as well as investments in, but not limited to, repurchase agreements, debt securities, and derivatives, including various types of swaps, futures and options. The Fund intends to enter into financial transactions with counterparties that Janus Capital believes to be creditworthy at the time of the transaction. There is always the risk that Janus Capital’s analysis of a counterparty’s creditworthiness is incorrect or may change due to
Janus Henderson Diversified Alternatives Fund
Notes to Consolidated Financial Statements (unaudited)
market conditions. To the extent that the Fund focuses its transactions with a limited number of counterparties, it will have greater exposure to the risks associated with one or more counterparties.
Offsetting Assets and Liabilities
The Fund presents gross and net information about transactions that are either offset in the consolidated financial statements or subject to an enforceable master netting arrangement or similar agreement with a designated counterparty, regardless of whether the transactions are actually offset in the Consolidated Statement of Assets and Liabilities.
In order to better define its contractual rights and to secure rights that will help the Fund mitigate its counterparty risk, the Fund has entered into an International Swaps and Derivatives Association, Inc. Master Agreement (“ISDA Master Agreement”) or similar agreement with its derivative contract counterparties. An ISDA Master Agreement is a bilateral agreement between the Fund and a counterparty that governs OTC derivatives and forward foreign currency exchange contracts and typically contains, among other things, collateral posting terms and netting provisions in the event of a default and/or termination event. Under an ISDA Master Agreement, in the event of a default and/or termination event, the Fund may offset with each counterparty certain derivative financial instruments’ payables and/or receivables with collateral held and/or posted and create one single net payment.
The following table present gross amounts of recognized assets and/or liabilities and the net amounts after deducting collateral that has been pledged by counterparties or has been pledged to counterparties (if applicable). For corresponding information grouped by type of instrument, see the “Fair Value of Derivative Instruments (not accounted for as hedging instruments) as of December 31, 2019” table located in the Fund’s Consolidated Schedule of Investments.
| | | | | | | | | | |
Offsetting of Financial Assets and Derivative Assets |
| |
| | | Gross Amounts | | | | | | |
| | | of Recognized | | Offsetting Asset | | Collateral | | |
Counterparty | | Assets | | or Liability(a) | | Pledged(b) | | Net Amount |
| | | | | | | | | |
Goldman Sachs International | $ | 385,747 | $ | (141,039) | $ | — | $ | 244,708 |
HSBC Securities (USA), Inc. | | 164,219 | | (164,219) | | — | | — |
| | | | | | | | | |
Total | $ | 549,966 | $ | (305,258) | $ | — | $ | 244,708 |
Offsetting of Financial Liabilities and Derivative Liabilities |
| |
| | | Gross Amounts | | | | | | |
| | | of Recognized | | Offsetting Asset | | Collateral | | |
Counterparty | | Liabilities | | or Liability(a) | | Pledged(b) | | Net Amount |
| | | | | | | | | |
BNP Paribas | $ | 52 | $ | — | $ | — | $ | 52 |
Goldman Sachs International | | 141,039 | | (141,039) | | — | | — |
HSBC Securities (USA), Inc. | | 167,758 | | (164,219) | | — | | 3,539 |
| | | | | | | | | |
Total | $ | 308,849 | $ | (305,258) | $ | — | $ | 3,591 |
(a) | Represents the amount of assets or liabilities that could be offset with the same counterparty under master netting or similar agreements that management elects not to offset on the Statement of Assets and Liabilities. |
(b) | Collateral pledged is limited to the net outstanding amount due to/from an individual counterparty. The actual collateral amounts pledged may exceed these amounts and may fluctuate in value. |
The Fund generally does not exchange collateral on its forward foreign currency contracts with its counterparties; however, all liquid securities and restricted cash are considered to cover in an amount at all times equal to or greater
Janus Henderson Diversified Alternatives Fund
Notes to Consolidated Financial Statements (unaudited)
than the Fund’s commitment with respect to these contracts. Certain securities may be segregated at the Fund’s custodian. These segregated securities are denoted on the accompanying Consolidated Schedule of Investments and are evaluated daily to ensure their cover and/or market value equals or exceeds the Fund’s corresponding forward foreign currency exchange contract's obligation value.
The Fund may require the counterparty to pledge securities as collateral daily (based on the daily valuation of the financial asset) if the Fund has a net aggregate unrealized gain on OTC derivative contracts with a particular counterparty. The Fund may deposit cash as collateral with the counterparty and/or custodian daily (based on the daily valuation of the financial asset) if the Fund has a net aggregate unrealized loss on OTC derivative contracts with a particular counterparty. The collateral amounts are subject to minimum exposure requirements and initial margin requirements. Collateral amounts are monitored and subsequently adjusted up or down as valuations fluctuate by at least the minimum exposure requirement. Collateral may reduce the risk of loss.
Sovereign Debt
The Fund may invest in U.S. and non-U.S. government debt securities (“sovereign debt”). Some investments in sovereign debt, such as U.S. sovereign debt, are considered low risk. However, investments in sovereign debt, especially the debt of less developed countries, can involve a high degree of risk, including the risk that the governmental entity that controls the repayment of sovereign debt may not be willing or able to repay the principal and/or to pay the interest on its sovereign debt in a timely manner. A sovereign debtor’s willingness or ability to satisfy its debt obligation may be affected by various factors including, but not limited to, its cash flow situation, the extent of its foreign currency reserves, the availability of foreign exchange when a payment is due, the relative size of its debt position in relation to its economy as a whole, the sovereign debtor’s policy toward international lenders, and local political constraints to which the governmental entity may be subject. Sovereign debtors may also be dependent on expected disbursements from foreign governments, multilateral agencies, and other entities. The failure of a sovereign debtor to implement economic reforms, achieve specified levels of economic performance, or repay principal or interest when due may result in the cancellation of third party commitments to lend funds to the sovereign debtor, which may further impair such debtor’s ability or willingness to timely service its debts. The Fund may be requested to participate in the rescheduling of such sovereign debt and to extend further loans to governmental entities, which may adversely affect the Fund’s holdings. In the event of default, there may be limited or no legal remedies for collecting sovereign debt and there may be no bankruptcy proceedings through which the Fund may collect all or part of the sovereign debt that a governmental entity has not repaid. In addition, to the extent the Fund invests in non-U.S. sovereign debt, it may be subject to currency risk.
4. Investment Advisory Agreements and Other Transactions with Affiliates
The Fund and the Subsidiary each pay Janus Capital an investment advisory fee which is calculated daily and paid monthly. The following table reflects the Fund’s and the Subsidiary's contractual investment advisory fee rate (expressed as an annual rate).
| | |
Average Daily Net Assets of the Fund | Contractual Investment Advisory Fee (%) |
First $1 Billion | 1.00 |
Over $1 Billion | 0.95 |
The Fund’s actual investment advisory fee rate for the reporting period was 1.09% of average annual net assets before applicable waivers (excluding the fees paid to Janus Capital by the Subsidiary).
Janus Capital has contractually agreed to waive a portion of the Fund’s management fee in an amount equal to the management fee paid to Janus Capital by the Subsidiary. The management fee waiver arrangement related to the Subsidiary may not be discontinued by Janus Capital as long as its contract with the Subsidiary is in place.
Janus Capital has contractually agreed to waive the advisory fee payable by the Fund or reimburse expenses in an amount equal to the amount, if any, that the Fund’s total annual fund operating expenses, which include the other expenses of the Subsidiary, including the investment advisory fee, but excluding the fees payable pursuant to a Rule 12b-1 plan, shareholder servicing fees, such as transfer agency fees (including out-of-pocket costs), administrative services fees and any networking/omnibus/administrative fees payable by any share class, brokerage commissions, interest, dividends, taxes, acquired fund fees and expenses, and extraordinary expenses, exceed the annual rate of 1.03% of the Fund’s average daily net assets. Janus Capital has agreed to continue the waivers until at least October 28, 2020. The previous expense limit (until November 1, 2019) was 1.09%. If applicable, amounts waived and/or
Janus Henderson Diversified Alternatives Fund
Notes to Consolidated Financial Statements (unaudited)
reimbursed to the Fund by Janus Capital are disclosed as “Excess Expense Reimbursement and Waivers” on the Consolidated Statement of Operations.
Janus Services LLC (“Janus Services”), a wholly-owned subsidiary of Janus Capital, is the Fund’s and the Subsidiary's transfer agent. In addition, Janus Services provides or arranges for the provision of certain other administrative services including, but not limited to, recordkeeping, accounting, order processing, and other shareholder services for the Fund. Janus Services is not compensated for its services related to the shares, except for out-of-pocket costs. These amounts are disclosed as “Other transfer agent fees and expenses” on the Consolidated Statement of Operations.
Certain, but not all, intermediaries may charge administrative fees (such as networking and omnibus) to investors in Class A Shares, Class C Shares, and Class I Shares for administrative services provided on behalf of such investors. These administrative fees are paid by the Class A Shares, Class C Shares, and Class I Shares of the Fund to Janus Services, which uses such fees to reimburse intermediaries. Consistent with the Transfer Agency Agreement between Janus Services and the Fund, Janus Services may negotiate the level, structure, and/or terms of the administrative fees with intermediaries requiring such fees on behalf of the Fund. Janus Capital and its affiliates benefit from an increase in assets that may result from such relationships. The Funds’ Trustees have set limits on fees that the Funds may incur with respect to administrative fees paid for omnibus or networked accounts. Such limits are subject to change by the Trustees in the future. These amounts are disclosed as “Transfer agent networking and omnibus fees” on the Consolidated Statement of Operations.
Effective July 1, 2019, the Board of Trustees of Janus Investment Fund approved a new administrative fee rate for Class D Shares detailed in the table below.
| | |
Average Daily Net Assets of Class D Shares of the Janus Henderson funds | Administrative Services Fee |
Under $40 billion | 0.12% |
$40 billion – $49.9 billion | 0.10% |
Over $49.9 billion | 0.08% |
The Fund’s actual Class D administrative fee rate was 0.12% for the reporting period.
Prior to July 1, 2019, the Fund’s Class D Shares paid an administrative services fee at an annual rate of 0.12% of the average daily net assets of Class D Shares for shareholder services provided by Janus Services. Janus Services provides or arranges for the provision of shareholder services including, but not limited to, recordkeeping, accounting, answering inquiries regarding accounts, transaction processing, transaction confirmations, and the mailing of prospectuses and shareholder reports. These amounts are disclosed as “Transfer agent administrative fees and expenses” on the Consolidated Statement of Operations.
Janus Services receives an administrative services fee at an annual rate of up to 0.25% of the average daily net assets of the Fund’s Class S Shares and Class T Shares for providing or procuring administrative services to investors in Class S Shares and Class T Shares of the Fund. Janus Services expects to use all or a significant portion of this fee to compensate retirement plan service providers, broker-dealers, bank trust departments, financial advisors, and other financial intermediaries for providing these services. Janus Services or its affiliates may also pay fees for services provided by intermediaries to the extent the fees charged by intermediaries exceed the 0.25% of net assets charged to Class S Shares and Class T Shares of the Fund. Janus Services may keep certain amounts retained for reimbursement of out-of-pocket costs incurred for servicing clients of Class S Shares and Class T Shares. These amounts are disclosed as “Transfer agent administrative fees and expenses” on the Consolidated Statement of Operations.
Services provided by these financial intermediaries may include, but are not limited to, recordkeeping, subaccounting, order processing, providing order confirmations, periodic statements, forwarding prospectuses, shareholder reports, and other materials to existing customers, answering inquiries regarding accounts, and other administrative services. Order processing includes the submission of transactions through the National Securities Clearing Corporation (“NSCC”) or similar systems, or those processed on a manual basis with Janus Capital. For all share classes, Janus Services also seeks reimbursement for costs it incurs as transfer agent and for providing servicing.
Janus Services is compensated for its services related to the Fund’s Class D Shares. These amounts are disclosed as “Other transfer agent fees and expenses” on the Consolidated Statement of Operations.
Janus Henderson Diversified Alternatives Fund
Notes to Consolidated Financial Statements (unaudited)
Under a distribution and shareholder servicing plan (the “Plan”) adopted in accordance with Rule 12b-1 under the 1940 Act, the Fund pays the Trust’s distributor, Janus Henderson Distributors, a wholly-owned subsidiary of Janus Capital, a fee for the sale and distribution and/or shareholder servicing of the Shares at an annual rate of up to 0.25% of the Class A Shares’ average daily net assets, of up to 1.00% of the Class C Shares’ average daily net assets, and of up to 0.25% of the Class S Shares’ average daily net assets. Under the terms of the Plan, the Trust is authorized to make payments to Janus Henderson Distributors for remittance to retirement plan service providers, broker-dealers, bank trust departments, financial advisors, and other financial intermediaries, as compensation for distribution and/or shareholder services performed by such entities for their customers who are investors in the Fund. These amounts are disclosed as “12b-1 Distribution and shareholder servicing fees” on the Consolidated Statement of Operations. Payments under the Plan are not tied exclusively to actual 12b-1 distribution and shareholder service expenses, and the payments may exceed 12b-1 distribution and shareholder service expenses actually incurred. If any of the Fund’s actual 12b-1 distribution and shareholder service expenses incurred during a calendar year are less than the payments made during a calendar year, the Fund will be refunded the difference. Refunds, if any, are included in “12b-1 Distribution and shareholder servicing fees” in the Consolidated Statement of Operations.
Janus Capital serves as administrator to the Fund pursuant to an administration agreement between Janus Capital and the Trust. Under the administration agreement, Janus Capital is obligated to provide or arrange for the provision of certain administration, compliance, and accounting services to the Fund, including providing office space for the Fund, and is reimbursed by the Fund for certain of its costs in providing these services (to the extent Janus Capital seeks reimbursement and such costs are not otherwise waived). In addition, employees of Janus Capital and/or its affiliates may serve as officers of the Trust. The Fund pays for some or all of the salaries, fees, and expenses of Janus Capital employees and Fund officers, with respect to certain specified administration functions they perform on behalf of the Fund. The Fund pays these costs based on out-of-pocket expenses incurred by Janus Capital, and these costs are separate and apart from advisory fees and other expenses paid in connection with the investment advisory services Janus Capital (or any subadvisor, as applicable) provides to the Fund. These amounts are disclosed as “Affiliated fund administration fees” on the Consolidated Statement of Operations. In addition, some expenses related to compensation payable to the Fund’s Chief Compliance Officer and certain compliance staff, all of whom are employees of Janus Capital and/or its affiliates, are shared with the Fund. Total compensation of $230,755 was paid to the Chief Compliance Officer and certain compliance staff by the Trust during the period ended December 31, 2019. The Fund's portion is reported as part of “Other expenses” on the Consolidated Statement of Operations.
The Board of Trustees has adopted a deferred compensation plan (the “Deferred Plan”) for independent Trustees to elect to defer receipt of all or a portion of the annual compensation they are entitled to receive from the Fund. All deferred fees are credited to an account established in the name of the Trustees. The amounts credited to the account then increase or decrease, as the case may be, in accordance with the performance of one or more of the Janus Henderson funds that are selected by the Trustees. The account balance continues to fluctuate in accordance with the performance of the selected fund or funds until final payment of all amounts are credited to the account. The fluctuation of the account balance is recorded by the Fund as unrealized appreciation/(depreciation) and is included as of December 31, 2019 on the Consolidated Statement of Assets and Liabilities in the asset, “Non-interested Trustees’ deferred compensation,” and liability, “Non-interested Trustees’ deferred compensation fees.” Additionally, the recorded unrealized appreciation/(depreciation) is included in “Total distributable earnings (loss)” on the Consolidated Statement of Assets and Liabilities. Deferred compensation expenses for the period ended December 31, 2019 are included in “Non-interested Trustees’ fees and expenses” on the Consolidated Statement of Operations. Trustees are allowed to change their designation of mutual funds from time to time. Amounts will be deferred until distributed in accordance with the Deferred Plan. Deferred fees of $236,725 were paid by the Trust to the Trustees under the Deferred Plan during the period ended December 31, 2019.
Pursuant to the provisions of the 1940 Act and related rules, the Fund may participate in an affiliated or non-affiliated cash sweep program. In the cash sweep program, uninvested cash balances of the Fund may be used to purchase shares of affiliated or non-affiliated money market funds or cash management pooled investment vehicles that operate as money market funds. The Fund is eligible to participate in the cash sweep program (the “Investing Funds”). As adviser, Janus Capital has an inherent conflict of interest because of its fiduciary duties to the affiliated money market funds or cash management pooled investment vehicles and the Investing Funds. Janus Henderson Cash Liquidity Fund LLC (the “Sweep Vehicle”) is an affiliated unregistered cash management pooled investment vehicle that invests primarily in highly-rated short-term fixed-income securities. The Sweep Vehicle operates pursuant to the provisions of the 1940 Act that govern the operation of money market funds and prices its shares at NAV reflecting market-based
Janus Henderson Diversified Alternatives Fund
Notes to Consolidated Financial Statements (unaudited)
values of its portfolio securities (i.e., a “floating” NAV) rounded to the fourth decimal place (e.g., $1.0000). The Sweep Vehicle is permitted to impose a liquidity fee (of up to 2%) on redemptions from the Sweep Vehicle or a redemption gate that temporarily suspends redemptions from the Sweep Vehicle for up to 10 business days during a 90 day period. There are no restrictions on the Fund's ability to withdraw investments from the Sweep Vehicle at will, and there are no unfunded capital commitments due from the Fund to the Sweep Vehicle. The Sweep Vehicle does not charge any management fee, sales charge or service fee.
Any purchases and sales, realized gains/losses and recorded dividends from affiliated investments during the period ended December 31, 2019 can be found in the “Schedules of Affiliated Investments” located in the Consolidated Schedule of Investments.
Class A Shares include a 5.75% upfront sales charge of the offering price of the Fund. The sales charge is allocated between Janus Henderson Distributors and financial intermediaries. During the period ended December 31, 2019, Janus Henderson Distributors retained upfront sales charges of $17.
A contingent deferred sales charge (“CDSC”) of 1.00% will be deducted with respect to Class A Shares purchased without a sales load and redeemed within 12 months of purchase, unless waived. Any applicable CDSC will be 1.00% of the lesser of the original purchase price or the value of the redemption of the Class A Shares redeemed. There were no CDSCs paid by redeeming shareholders of Class A Shares to Janus Henderson Distributors during the period ended December 31, 2019.
A CDSC of 1.00% will be deducted with respect to Class C Shares redeemed within 12 months of purchase, unless waived. Any applicable CDSC will be 1.00% of the lesser of the original purchase price or the value of the redemption of the Class C Shares redeemed. There were no CDSCs paid by redeeming shareholders of Class C Shares during the period ended December 31, 2019.
As of December 31, 2019, shares of the Fund were owned by affiliates of Janus Henderson Investors, and/or other funds advised by Janus Henderson, as indicated in the table below:
| | | | | | |
Class | % of Class Owned | | % of Fund Owned | | |
Class A Shares | - | % | - | % | |
Class C Shares | - | | - | | |
Class D Shares | - | | - | | |
Class I Shares | - | | - | | |
Class N Shares | 98 | | 78 | | |
Class S Shares | 100 | | 2 | | |
Class T Shares | - | | - | | |
| | | | | | |
In addition, other shareholders, including other funds, individuals, accounts, as well as the Fund’s portfolio manager(s) and/or investment personnel, may from time to time own (beneficially or of record) a significant percentage of the Fund’s Shares and can be considered to “control” the Fund when that ownership exceeds 25% of the Fund’s assets (and which may differ from control as determined in accordance with accounting principles generally accepted in the United States of America).
5. Federal Income Tax
Income and capital gains distributions are determined in accordance with income tax regulations that may differ from accounting principles generally accepted in the United States of America. These differences are due to differing treatments for items such as net short-term gains, deferral of wash sale losses, foreign currency transactions, net investment losses, and capital loss carryovers.
The Fund has elected to treat gains and losses on forward foreign currency contracts as capital gains and losses, if applicable. Other foreign currency gains and losses on debt instruments are treated as ordinary income for federal income tax purposes pursuant to Section 988 of the Internal Revenue Code.
Janus Henderson Diversified Alternatives Fund
Notes to Consolidated Financial Statements (unaudited)
The aggregate cost of investments and the composition of unrealized appreciation and depreciation of investment securities for federal income tax purposes as of December 31, 2019 are noted below. The primary differences between book and tax appreciation or depreciation of investments are wash sale loss deferrals, and investments in partnerships.
| | | | |
Federal Tax Cost | Unrealized
Appreciation | Unrealized
(Depreciation) | Net Tax Appreciation/
(Depreciation) |
$ 65,235,097 | $ 3,329,293 | $ (239) | $ 3,329,054 |
| | | | |
Information on the tax components of derivatives as of December 31, 2019 is as follows:
| | | | |
Federal Tax Cost | Unrealized
Appreciation | Unrealized
(Depreciation) | Net Tax Appreciation/
(Depreciation) |
$ - | $ 1,347,989 | $ (910,472) | $ 437,517 |
| | | | |
Tax cost of investments and unrealized appreciation/(depreciation) may also include timing differences that do not constitute adjustments to tax basis.
Janus Henderson Diversified Alternatives Fund
Notes to Consolidated Financial Statements (unaudited)
6. Capital Share Transactions
| | | | | | | |
| | | | | | | |
| | | Period ended December 31, 2019 | | Year ended June 30, 2019 |
| | | Shares | Amount | | Shares | Amount |
| | | | | | | |
Class A Shares: | | | | | |
Shares sold | 9,115 | $ 87,471 | | 49,447 | $ 479,509 |
Reinvested dividends and distributions | 105 | 1,004 | | 2,200 | 20,991 |
Shares repurchased | (21,379) | (203,538) | | (162,924) | (1,580,157) |
Net Increase/(Decrease) | (12,159) | $ (115,063) | | (111,277) | $ (1,079,657) |
Class C Shares: | | | | | |
Shares sold | 1,680 | $ 15,792 | | 1,529 | $ 15,000 |
Reinvested dividends and distributions | 22 | 207 | | 395 | 3,697 |
Shares repurchased | (10,186) | (96,146) | | (161,709) | (1,536,569) |
Net Increase/(Decrease) | (8,484) | $ (80,147) | | (159,785) | $ (1,517,872) |
Class D Shares: | | | | | |
Shares sold | 9,970 | $ 95,790 | | 50,753 | $ 499,176 |
Reinvested dividends and distributions | 114 | 1,096 | | 2,712 | 25,985 |
Shares repurchased | (89,985) | (863,007) | | (183,564) | (1,803,127) |
Net Increase/(Decrease) | (79,901) | $ (766,121) | | (130,099) | $ (1,277,966) |
Class I Shares: | | | | | |
Shares sold | 62,519 | $ 605,040 | | 1,010,005 | $10,022,581 |
Reinvested dividends and distributions | 263 | 2,528 | | 11,428 | 109,709 |
Shares repurchased | (948,786) | (9,114,939) | | (1,425,720) | (14,019,008) |
Net Increase/(Decrease) | (886,004) | $(8,507,371) | | (404,287) | $ (3,886,718) |
Class N Shares: | | | | | |
Shares sold | 194,214 | $ 1,885,045 | | 150,122 | $ 1,484,236 |
Reinvested dividends and distributions | 2,359 | 22,763 | | 49,207 | 473,861 |
Shares repurchased | (701,029) | (6,798,837) | | (1,077,625) | (10,642,027) |
Net Increase/(Decrease) | (504,456) | $(4,891,029) | | (878,296) | $ (8,683,930) |
Class S Shares: | | | | | |
Shares sold | - | $ - | | - | $ - |
Reinvested dividends and distributions | 59 | 554 | | 899 | 8,529 |
Shares repurchased | - | - | | (98) | (989) |
Net Increase/(Decrease) | 59 | $ 554 | | 801 | $ 7,540 |
Class T Shares: | | | | | |
Shares sold | 7,133 | $ 68,742 | | 52,789 | $ 518,140 |
Reinvested dividends and distributions | 46 | 443 | | 3,742 | 35,660 |
Shares repurchased | (60,353) | (578,537) | | (517,308) | (5,000,720) |
Net Increase/(Decrease) | (53,174) | $ (509,352) | | (460,777) | $ (4,446,920) |
7. Purchases and Sales of Investment Securities
For the period ended December 31, 2019, the aggregate cost of purchases and proceeds from sales of investment securities (excluding any short-term securities, short-term options contracts, TBAs, and in-kind transactions, as applicable) was as follows:
| | | | |
Purchases of
Securities | Proceeds from Sales
of Securities | Purchases of Long-
Term U.S. Government
Obligations | Proceeds from Sales
of Long-Term U.S.
Government Obligations |
$ - | $ - | $ - | $ - |
8. Recent Accounting Pronouncements
The FASB issued Accounting Standards Update 2018-13, Fair Value Measurement (Topic 820) in August 2018. The new guidance removes, modifies and enhances the disclosures to Topic 820. For public entities, the amendments are
Janus Henderson Diversified Alternatives Fund
Notes to Consolidated Financial Statements (unaudited)
effective for financial statements issued for fiscal years beginning after December 15, 2019, and interim periods within those fiscal years. An entity is permitted, and Management has decided, to early adopt the removed and modified disclosures in these financial statements.
9. Subsequent Event
Management has evaluated whether any events or transactions occurred subsequent to December 31, 2019 and through the date of issuance of the Fund’s consolidated financial statements and determined that there were no material events or transactions that would require recognition or disclosure in the Fund’s consolidated financial statements.
Janus Henderson Diversified Alternatives Fund
Additional Information (unaudited)
Proxy Voting Policies and Voting Record
A description of the policies and procedures that the Fund uses to determine how to vote proxies relating to its portfolio securities is available without charge: (i) upon request, by calling 1-800-525-1093; (ii) on the Fund’s website at janushenderson.com/proxyvoting; and (iii) on the SEC’s website at http://www.sec.gov. Additionally, information regarding the Fund’s proxy voting record for the most recent twelve-month period ended June 30 is also available, free of charge, through janushenderson.com/proxyvoting and from the SEC’s website at http://www.sec.gov.
Full Holdings
The Fund is required to disclose its complete holdings as an exhibit to Form N-PORT within 60 days of the end of the first and third fiscal quarters, and in the annual report and semiannual report to Fund shareholders. Historically, the Fund filed its complete portfolio holdings (schedule of investments) with the SEC for the first and third quarters each fiscal year on Form N-Q. The Fund’s Form N-PORT and Form N-Q filings: (i) are available on the SEC’s website at http://www.sec.gov; (ii) may be reviewed and copied at the SEC’s Public Reference Room in Washington, D.C. (information on the Public Reference Room may be obtained by calling 1-800-SEC-0330); and (iii) are available without charge, upon request, by calling a Janus Henderson representative at 1-877-335-2687 (toll free) (or 1-800-525-3713 if you hold Class D shares). Portfolio holdings consisting of at least the names of the holdings are generally available on a monthly basis with a 30-day lag. Holdings are generally posted approximately two business days thereafter under Full Holdings for the Fund at janushenderson.com/info (or janushenderson.com/reports if you hold Class D Shares).
APPROVAL OF ADVISORY AGREEMENTS DURING THE PERIOD
The Trustees of Janus Aspen Series, each of whom serves as an “independent” Trustee (the “Trustees”), oversee the management of each Portfolio of Janus Aspen Series (each, a “VIT Portfolio,” and collectively, the “VIT Portfolios”), as well as each Fund of Janus Investment Fund (together with the VIT Portfolios, the “Janus Henderson Funds,” and each, a “Janus Henderson Fund”). As required by law, the Trustees determine annually whether to continue the investment advisory agreement for each Janus Henderson Fund and the subadvisory agreements for the Janus Henderson Funds that utilize subadvisers.
In connection with their most recent consideration of those agreements for each Janus Henderson Fund, the Trustees received and reviewed information provided by Janus Capital and the respective subadvisers in response to requests of the Trustees and their independent legal counsel. They also received and reviewed information and analysis provided by, and in response to requests of, their independent fee consultant. Throughout their consideration of the agreements, the Trustees were advised by their independent legal counsel. The Trustees met with management to consider the agreements, and also met separately in executive session with their independent legal counsel and their independent fee consultant.
At a meeting held on December 5, 2019, based on the Trustees’ evaluation of the information provided by Janus Capital, the subadvisers, and the independent fee consultant, as well as other information, the Trustees determined that the overall arrangements between each Janus Henderson Fund and Janus Capital and each subadviser, as applicable, were fair and reasonable in light of the nature, extent and quality of the services provided by Janus Capital, its affiliates and the subadvisers, the fees charged for those services, and other matters that the Trustees considered relevant in the exercise of their business judgment. At that meeting, the Trustees unanimously approved the continuation of the investment advisory agreement for each Janus Henderson Fund, and the subadvisory agreement for each subadvised Janus Henderson Fund, for the period from February 1, 2020 through February 1, 2021, subject to earlier termination as provided for in each agreement.
In considering the continuation of those agreements, the Trustees reviewed and analyzed various factors that they determined were relevant, including the factors described below, none of which by itself was considered dispositive. However, the material factors and conclusions that formed the basis for the Trustees’ determination to approve the continuation of the agreements are discussed separately below. Also included is a summary of the independent fee consultant’s conclusions and opinions that arose during, and were included as part of, the Trustees’ consideration of the agreements. “Management fees,” as used herein, reflect actual annual advisory fees and, for the purpose of peer comparisons any administration fees (excluding out of pocket costs), net of any waivers, paid by a fund as a percentage of average net assets.
Janus Henderson Diversified Alternatives Fund
Additional Information (unaudited)
Nature, Extent and Quality of Services
The Trustees reviewed the nature, extent and quality of the services provided by Janus Capital and the subadvisers to the Janus Henderson Funds, taking into account the investment objective, strategies and policies of each Janus Henderson Fund, and the knowledge the Trustees gained from their regular meetings with management on at least a quarterly basis and their ongoing review of information related to the Janus Henderson Funds. In addition, the Trustees reviewed the resources and key personnel of Janus Capital and each subadviser, particularly noting those employees who provide investment and risk management services to the Janus Henderson Funds. The Trustees also considered other services provided to the Janus Henderson Funds by Janus Capital or the subadvisers, such as managing the execution of portfolio transactions and the selection of broker-dealers for those transactions. The Trustees considered Janus Capital’s role as administrator to the Janus Henderson Funds, noting that Janus Capital generally, does not receive a fee for its services but is reimbursed for its out-of-pocket costs. The Trustees considered the role of Janus Capital in monitoring adherence to the Janus Henderson Funds’ investment restrictions, providing support services for the Trustees and Trustee committees, and overseeing communications with shareholders and the activities of other service providers, including monitoring compliance with various policies and procedures of the Janus Henderson Funds and with applicable securities laws and regulations.
In this regard, the independent fee consultant noted that Janus Capital provides a number of different services for the Janus Henderson Funds and fund shareholders, ranging from investment management services to various other servicing functions, and that, in its view, Janus Capital is a capable provider of those services. The independent fee consultant also provided its belief that Janus Capital has developed a number of institutional competitive advantages that should enable it to provide superior investment and service performance over the long term.
The Trustees concluded that the nature, extent and quality of the services provided by Janus Capital or the subadviser to each Janus Henderson Fund were appropriate and consistent with the terms of the respective advisory and subadvisory agreements, and that, taking into account steps taken to address those Janus Henderson Funds whose performance lagged that of their peers for certain periods, the Janus Henderson Funds were likely to benefit from the continued provision of those services. They also concluded that Janus Capital and each subadviser had sufficient personnel, with the appropriate education and experience, to serve the Janus Henderson Funds effectively and had demonstrated its ability to attract well-qualified personnel.
Performance of the Funds
The Trustees considered the performance results of each Janus Henderson Fund over various time periods. They noted that they considered Janus Henderson Fund performance data throughout the year, including periodic meetings with each Janus Henderson Fund’s portfolio manager(s), and also reviewed information comparing each Janus Henderson Fund’s performance with the performance of comparable funds and peer groups identified by Broadridge Financial Solutions, Inc. (“Broadridge”), an independent data provider, and with the Janus Henderson Fund’s benchmark index. In this regard, the independent fee consultant found that the overall Janus Henderson Funds’ performance has been reasonable: for the 36 months ended September 30, 2019, approximately 69% of the Janus Henderson Funds were in the top two quartiles of performance, as reported by Morningstar, and for the 12 months ended September 30, 2019, approximately 71% of the Janus Henderson Funds were in the top two quartiles of performance, as reported by Morningstar.
The Trustees considered the performance of each Fund, noting that performance may vary by share class, and noted the following:
Alternative Fund
· For Janus Henderson Diversified Alternatives Fund, the Trustees noted that the Fund’s performance was in the third Broadridge quartile for the 36 months ended May 31, 2019 and the bottom Broadridge quartile for the 12 months ended May 31, 2019. The Trustees noted the reasons for the Fund’s underperformance, the steps Janus Capital had taken or was taking to improve performance.
Asset Allocation Funds
· For Janus Henderson Global Allocation Fund – Conservative, the Trustees noted that the Fund’s performance was in the third Broadridge quartile for the 36 months ended May 31, 2019 and the bottom Broadridge quartile for the 12 months ended May 31, 2019. The Trustees noted the reasons for the Fund’s underperformance, the steps Janus Capital had taken or was taking to improve performance.
Janus Henderson Diversified Alternatives Fund
Additional Information (unaudited)
· For Janus Henderson Global Allocation Fund – Growth, the Trustees noted that the Fund’s performance was in the third Broadridge quartile for the 36 months ended May 31, 2019 and the bottom Broadridge quartile for the 12 months ended May 31, 2019. The Trustees noted the reasons for the Fund’s underperformance, the steps Janus Capital had taken or was taking to improve performance.
· For Janus Henderson Global Allocation Fund – Moderate, the Trustees noted that the Fund’s performance was in the third Broadridge quartile for the 36 months ended May 31, 2019 and the bottom Broadridge quartile for the 12 months ended May 31, 2019. The Trustees noted the reasons for the Fund’s underperformance, the steps Janus Capital had taken or was taking to improve performance.
Fixed-Income Funds
· For Janus Henderson Absolute Return Income Opportunities Fund, the Trustees noted that the Fund’s performance was in the bottom Broadridge quartile for the 36 months ended May 31, 2019 and the third Broadridge quartile for the 12 months ended May 31, 2019. The Trustees noted the reasons for the Fund’s underperformance and the steps Janus Capital had taken or was taking to improve performance.
· For Janus Henderson Developed World Bond Fund, the Trustees noted the Fund’s performance was in the second Broadridge quartile for the 36 months ended May 31, 2019 and the first quartile for the 12 months ended May 31, 2019.
· For Janus Henderson Flexible Bond Fund, the Trustees noted that the Fund’s performance was in the bottom Broadridge quartile for the 36 months ended May 31, 2019 and the bottom Broadridge quartile for the 12 months ended May 31, 2019. The Trustees noted the reasons for the Fund’s underperformance and the steps Janus Capital had taken or was taking to improve performance.
· For Janus Henderson Global Bond Fund, the Trustees noted that the Fund’s performance was in the bottom Broadridge quartile for the 36 months ended May 31, 2019 and the bottom Broadridge quartile for the 12 months ended May 31, 2019. The Trustees noted the reasons for the Fund’s underperformance, the steps Janus Capital had taken or was taking to improve performance.
· For Janus Henderson High-Yield Fund, the Trustees noted that the Fund’s performance was in the second Broadridge quartile for the 36 months ended May 31, 2019 and the second Broadridge quartile for the 12 months ended May 31, 2019.
· For Janus Henderson Multi-Sector Income Fund, the Trustees noted that the Fund’s performance was in the first Broadridge quartile for the 36 months ended May 31, 2019 and the first Broadridge quartile for the 12 months ended May 31, 2019.
· For Janus Henderson Short-Term Bond Fund, the Trustees noted that the Fund’s performance was in the bottom Broadridge quartile for the 36 months ended May 31, 2019 and the third Broadridge quartile for the 12 months ended May 31, 2019. The Trustees noted the reasons for the Fund’s underperformance and the steps Janus Capital had taken or was taking to improve performance.
Global and International Equity Funds
· For Janus Henderson Asia Equity Fund, the Trustees noted that the Fund’s performance was in the first Broadridge quartile for the 36 months ended May 31, 2019 and the second Broadridge quartile for the 12 months ended May 31, 2019.
· For Janus Henderson Emerging Markets Fund, the Trustees noted that the Fund’s performance was in the bottom Broadridge quartile for the 36 months ended May 31, 2019 and the second Broadridge quartile for the 12 months ended May 31, 2019. The Trustees noted the reasons for the Fund’s underperformance and the steps Janus Capital had taken or was taking to improve performance, and that the performance trend was improving
· For Janus Henderson European Focus Fund, the Trustees noted that the Fund’s performance was in the bottom Broadridge quartile for the 36 months ended May 31, 2019 and the bottom Broadridge quartile for the 12 months ended May 31, 2019. The Trustees noted the reasons for the Fund’s underperformance and the steps Janus Capital had taken or was taking to improve performance.
· For Janus Henderson Global Equity Income Fund, the Trustees noted that the Fund’s performance was in the bottom Broadridge quartile for the 36 months ended May 31, 2019 and the bottom Broadridge quartile for the 12
Janus Henderson Diversified Alternatives Fund
Additional Information (unaudited)
months ended May 31, 2019. The Trustees noted the reasons for the Fund’s underperformance and the steps Janus Capital had taken or was taking to improve performance.
· For Janus Henderson Global Life Sciences Fund, the Trustees noted that the Fund’s performance was in the first Broadridge quartile for the 36 months ended May 31, 2019 and the second Broadridge quartile for the 12 months ended May 31, 2019.
· For Janus Henderson Global Real Estate Fund, the Trustees noted that the Fund’s performance was in the first Broadridge quartile for the 36 months ended May 31, 2019 and the first Broadridge quartile for the 12 months ended May 31, 2019.
· For Janus Henderson Global Research Fund, the Trustees noted that the Fund’s performance was in the third Broadridge quartile for the 36 months ended May 31, 2019 and the third Broadridge quartile for the 12 months ended May 31, 2019. The Trustees noted the reasons for the Fund’s underperformance, while also noting that the Fund has a performance fee structure that results in lower management fees during periods of underperformance, and the steps Janus Capital had taken or was taking to improve performance.
· For Janus Henderson Global Select Fund, the Trustees noted that the Fund’s performance was in the first Broadridge quartile for the 36 months ended May 31, 2019 and the bottom Broadridge quartile for the 12 months ended May 31, 2019.
· For Janus Henderson Global Technology Fund, the Trustees noted that the Fund’s performance was in the second Broadridge quartile for the 36 months ended May 31, 2019 and the first Broadridge quartile for the 12 months ended May 31, 2019.
· For Janus Henderson Global Value Fund, the Trustees noted that the Fund’s performance was in the second Broadridge quartile for the 36 months ended May 31, 2019 and the first Broadridge quartile for the 12 months ended May 31, 2019.
· For Janus Henderson International Opportunities Fund, the Trustees noted that the Fund’s performance was in the bottom Broadridge quartile for the 36 months ended May 31, 2019 and the bottom Broadridge quartile for the 12 months ended May 31, 2019. The Trustees noted the reasons for the Fund’s underperformance and the steps Janus Capital had taken or was taking to improve performance.
· For Janus Henderson International Small Cap Fund, the Trustees noted that the Fund’s performance was in the bottom Broadridge quartile for the 12 months ended May 31, 2019. The Trustees noted the reasons for the Fund’s underperformance, the steps Janus Capital had taken or was taking to improve performance, and its limited performance history.
· For Janus Henderson International Value Fund, the Trustees noted that the Fund’s performance was in the bottom Broadridge quartile for the 36 months ended May 31, 2019 and the second Broadridge quartile for the 12 months ended May 31, 2019. The Trustees noted the reasons for the Fund’s underperformance and the steps Janus Capital and Perkins had taken or were taking to improve performance, and that the performance trend was improving
· For Janus Henderson Overseas Fund, the Trustees noted that the Fund’s performance was in the second Broadridge quartile for the 36 months ended May 31, 2019 and the bottom Broadridge quartile for the 12 months ended May 31, 2019.
Money Market Funds
· For Janus Henderson Government Money Market Fund, the Trustees noted that the Fund’s performance was in the second Broadridge quartile for the 36 months ended May 31, 2019 and the third Broadridge quartile for the 12 months ended May 31, 2019.
· For Janus Henderson Money Market Fund, the Trustees noted that the Fund’s performance was in the third Broadridge quartile for the 36 months ended May 31, 2019 and the third Broadridge quartile for the 12 months ended May 31, 2019. The Trustees noted the reasons for the Fund’s underperformance and the steps Janus Capital had taken or was taking to improve performance.