| | | |
| | OMB APPROVAL | |
| | OMB Number: 3235-0570 | |
| | Expires: January 31, 2014 | |
| | Estimated average burden hours per response: 20.6 | |
| |
UNITED STATES
SECURITIES AND EXCHANGE COMMISSION
Washington, D.C. 20549
FORM N-CSR
CERTIFIED SHAREHOLDER REPORT OF REGISTERED MANAGEMENT INVESTMENT COMPANIES
Investment Company Act file number 811-1879
Janus Investment Fund
(Exact name of registrant as specified in charter)
151 Detroit Street, Denver, Colorado 80206
(Address of principal executive offices) (Zip code)
Stephanie Grauerholz-Lofton, 151 Detroit Street, Denver, Colorado 80206
(Name and address of agent for service)
Registrant’s telephone number, including area code: 303-333-3863
Date of fiscal year end: 6/30
Date of reporting period: 12/31/11
Item 1 — Reports to Shareholders
SEMIANNUAL REPORT
December 31, 2011
Janus Alternative Fund
Janus Real Return Allocation Fund
HIGHLIGHTS
| |
| • | Portfolio management perspective |
| • | Investment strategy behind your fund |
| • | Fund performance, characteristics and holdings |
Table of Contents
Janus Alternative Fund
| | | |
| | 1 |
| | 3 |
| | |
| | 5 |
| | 21 |
| | 23 |
| | 24 |
| | 25 |
| | 28 |
| | 30 |
| | 50 |
| | 51 |
Please consider the charges, risks, expenses and investment objectives carefully before investing. For a prospectus or, if available, a summary prospectus containing this and other information, please call Janus at 877.33JANUS(52687) (or 800.525.3713 if you hold Shares directly with Janus); or download the file from janus.com/info (or janus.com/reports if you hold Shares directly with Janus). Read it carefully before you invest or send money.
Co-Chief Investment Officers’ Market Perspective (unaudited)
Jonathan Coleman
Co-Chief Investment
Officer
Gibson Smith
Co-Chief Investment
Officer
Euphoria & Despair
We would like to take this opportunity to thank you for investing with Janus.
If there’s a lesson to be learned from the tumult of 2011, it’s that there are lies, damn lies and strategist reports. Few of the talking heads predicted that Europe’s debt crisis would precipitate a global crisis of confidence. Even fewer predicted that emerging markets would plunge and long-dated Treasuries would beat nearly every other asset class. We take no joy in the folly of such fortunetelling. Our point is that it is very difficult to accurately predict macro outcomes. While the macro has had tremendous influence on the markets, we continue to believe that focusing on individual company analysis is the key to long term success.
Does this mean we ignore the macro? Not at all. At the forefront of our concerns is Europe’s debt crisis. Long-term, Europe will be more competitive if it succeeds in strengthening its monetary union and implements some fiscal unity. Yet measures the EU has agreed upon will be slow, painful and potentially destabilizing. We expect to see volatility as this messy process evolves, and we expect a euro-zone recession in 2012, slowing global growth.
The U.S. has its own political circus, of course, and uncertainty over fiscal policy is not helping confidence. Yet we believe the U.S. is in a fairly stable, low growth environment. Leading economic indicators have picked up and consumer confidence has rebounded to the highest levels since April 2011. Unfortunately, the sustainability of U.S. growth is subject to external shocks (i.e. Europe) and remains a major risk factor.
Equities: Corporate Dynamism Prevails
Corporate earnings growth has generally been strong, yet valuations reflect fears that it may not last. A major concern is that profit margins are near record levels and will likely revert to the historical mean. Based on our research and observations, however, many businesses appear highly attuned to protecting margins. Equity valuations look compelling, moreover, when paired with companies that are well positioned strategically.
In terms of investing themes, our analysts are finding opportunities across sectors. In energy, we see attractive potential in oil-field services and equipment companies, which are benefiting from rising levels of exploration and production. In health care, our analysts are focusing on companies with innovative drugs that address unmet medical needs. Our consumer team, meanwhile, sees opportunity in retailers that are leveraging technology to extend their global brand and gain market share.
Overall, we think this is an opportune time to own equities. Entry points look attractive based on recent multiples and projected growth rates. We think the odds are stacked in favor of equities, especially if they have growing free cash and competitive advantages that can enable them to gain share.
Fixed Income: Lower Rates for Longer
If there’s a fixed income theme for 2012 it’s that investors should get used to low rates. The Federal Reserve (Fed) has stressed that its zero-rate policy will continue through 2013. The real questions now are around QE3 (a third round of quantitative easing). We think the Fed isn’t ready to shoot this bullet yet, but will respond if it sees economic weakness. An additional theme for 2012 will be that central banks around the globe will continue to engage in loose monetary policies as the threat of slower growth remains high.
Against this backdrop, we continue to believe that corporate credit offers some of the best risk-adjusted returns. Profit margins are high and companies are accumulating cash on balance sheets. Moreover, management teams are being more careful with balance sheets. We think this conservatism will continue through 2012, fueling more free cash flow, liquidity in the system and, ultimately, support for investment grade and high yield bonds.
In other areas, we are balancing our “risk positions” with Treasuries, which we believe offer an insurance policy against extreme events and market volatility. With the markets remaining volatile, we think this allocation to Treasuries needs to be actively managed, and we expect to reduce our allocation to take advantage of opportunities as the market presents them.
Janus Alternative Fund | 1
Continued
Conclusion: Corporate Playbooks Can Still Create Value
Despite the difficult environment, we continue to identify companies that look well positioned to grow. Multiples are undemanding historically, and many businesses have proven they can maintain earnings and margins even in a weak demand environment. Maintaining balance in a portfolio is critical in this environment, however. As long term investors, we are always attuned to protecting on the downside, while attempting to find opportunities in the marketplace with the most attractive risk/reward. Long term, we think this offers the best way to achieve strong results.
Sincerely,
Jonathan Coleman
Co-Chief Investment Officer
Gibson Smith
Co-Chief Investment Officer
The opinions are those of the authors as of 12-2011 and are subject to change at any time due to changes in market or economic conditions. The comments should not be construed as a recommendation of individual holdings or market sectors, but as an illustration of broader themes.
There is no assurance that the investment process will consistently lead to successful investing.
Investing involves market risk. Investment return and value will fluctuate and it is possible to lose money by investing.
Foreign securities have additional risks including exchange rate changes, political and economic upheaval, the relative lack of information, relatively low market liquidity and the potential lack of strict financial and accounting controls and standards. These risks are magnified in emerging markets. The prices of foreign securities held by the fund, and therefore a fund’s performance, may decline in response to such risks.
U.S. Treasury securities are direct debt obligations issued by the U.S. Government. With government bonds, the investor is a creditor of the government. Treasury Bills and U.S. Government Bonds are guaranteed by the full faith and credit of the United States government, are generally considered to be free of credit risk and typically carry lower yields than other securities. Bonds in a portfolio are typically intended to provide income and/or diversification. In general, the bond market is volatile. Bond prices rise when interest rates fall and vice versa. This effect is usually pronounced for longer-term securities. Any fixed income security sold or redeemed prior to maturity may be subject to a substantial gain or loss.
Statements in this piece that reflect projections or expectations of future financial or economic performance of a mutual fund or strategy and of the markets in general and statements of a fund’s plans and objectives for future operations are forward-looking statements. Actual results or events may differ materially from those projected, estimated, assumed or anticipated in any such forward-looking statements. Important factors that could result in such differences, in addition to the other factors noted with such forward-looking statements, include general economic conditions such as inflation, recession and interest rates.
2 | DECEMBER 31, 2011
Useful Information About Your Fund Report (unaudited)
Management Commentary
The Management Commentary in this report includes valuable insight from the Fund’s managers as well as statistical information to help you understand how your Fund’s performance and characteristics stack up against those of comparable indices.
If the Fund invests in foreign securities, this report may include information about country exposure. Country exposure is based primarily on the country of domicile. However, the Fund’s managers may allocate a company to a country based on other factors such as location of the company’s principal office, the location of the principal trading market for the company’s securities, or the country where a majority of the company’s revenues are derived.
Please keep in mind that the opinions expressed by the Fund’s managers in the Management Commentary are just that: opinions. They are a reflection of the managers’ best judgment at the time this report was compiled, which was December 31, 2011. As the investing environment changes, so could the managers’ opinions. These views are unique to each manager and aren’t necessarily shared by fellow employees or by Janus in general.
Fund Expenses
We believe it’s important for our shareholders to have a clear understanding of Fund expenses and the impact they have on investment return.
The following is important information regarding the Fund’s Expense Example, which appears in the Fund’s Management Commentary within this Semiannual Report. Please refer to this information when reviewing the Expense Example for the Fund.
Example
As a shareholder of the Fund, you incur two types of costs: (1) transaction costs, including sales charges (loads) on purchase payments (applicable to Class A Shares only); redemption fees, where applicable (and any related exchange fees); and (2) ongoing costs, including management fees; distribution and shareholder servicing (12b-1) fees (applicable to Class A Shares, Class C Shares and Class S Shares only); administrative services fees payable pursuant to the Transfer Agency Agreement; administrative fees (applicable to Class A Shares, Class C Shares, and Class I Shares only); and other Fund expenses. The example is intended to help you understand your ongoing costs (in dollars) of investing in the Fund and to compare these costs with the ongoing costs of investing in other mutual funds. To do so, compare this 5% hypothetical example with the 5% hypothetical examples that appear in the shareholder reports of the other funds. The example is based upon an investment of $1,000 invested at the beginning of the period and held for the six-month period from July 1, 2011 to December 31, 2011.
Actual Expenses
The first line of the table in each example provides information about actual account values and actual expenses. You may use the information in this line, together with the amount you invested, to estimate the expenses that you paid over the period. Simply divide your account value by $1,000 (for example, an $8,600 account value divided by $1,000 = 8.6), then multiply the result by the number in the first line under the heading entitled “Expenses Paid During Period” to estimate the expenses you paid on your account during the period.
Hypothetical Example for Comparison Purposes
The second line of the table in each example provides information about hypothetical account values and hypothetical expenses based upon the Fund’s actual expense ratio and an assumed rate of return of 5% per year before expenses, which is not the Fund’s actual return. The hypothetical account values and expenses may not be used to estimate the actual ending account balance or expenses you paid for the period. You may use this information to compare the ongoing costs of investing in the Fund and other funds. To do so, compare this 5% hypothetical example with the 5% hypothetical examples that appear in the shareholder reports of the other funds.
Janus Capital Management LLC (“Janus Capital”) has contractually agreed to waive the Fund’s total annual fund operating expenses, which include the expenses of the Subsidiary, excluding any class-specific distribution and shareholder servicing (12b-1) fees (applicable to Class A Shares, Class C Shares, and Class S Shares only), administrative services fees payable pursuant to the Transfer Agency Agreement (except for networking and omnibus fees), brokerage commissions, interest, dividends, taxes, acquired fund fees and expenses, and extraordinary expenses, to certain limits until at least November 1, 2012. Expenses in the examples reflect application of these waivers. Had the waivers not been in effect, your expenses would have been higher. More information regarding the waivers is available in the Fund’s prospectuses.
Please note that the expenses shown in the tables are meant to highlight your ongoing costs only and do not
Janus Alternative Fund | 3
reflect any transaction costs, such as redemption fees (where applicable) and any related exchange fees. These fees are fully described in the Fund’s prospectuses. Therefore, the second line of each table is useful in comparing ongoing costs only, and will not help you determine the relative total costs of owning different funds. In addition, if these transaction costs were included, your costs would have been higher.
4 | DECEMBER 31, 2011
Janus Real Return Allocation Fund (unaudited)
| | | | | | | |
Fund Snapshot
We believe that strategically allocating among diversified asset classes that exhibit positive correlations to inflation can protect against the loss of purchasing power caused by higher inflation. We allocate among six actively managed strategies to seek higher returns than core U.S. inflation.
| | | | 
John Brynjolfsson
co-portfolio manager | | 
Gibson Smith
co-portfolio manager |
Performance Overview
For the six-month period ended December 31, 2011, Janus Real Return Allocation Fund’s Class I Shares returned –4.38%. This compares to a return of 7.32% for its benchmark, the Barclays Capital U.S. TIPS Index.
Market Environment
The third quarter began with mounting concerns that the U.S. economy was at greater risk of faltering into a double-dip recession, given below-expectation GDP growth, manufacturing slowdowns and persistently bleak employment, housing and consumer spending figures. Worries about high government debt levels, both domestically and in Europe, only heightened this negative market sentiment. In addition, the bitter Washington politics that played out during the U.S. debt ceiling debate in late July/early August compounded investor dismay. The subsequent U.S. credit rating downgrade by Standard & Poor’s ironically sparked a near stampede into U.S. Treasuries, as investors scrambled for a market safe haven and confirmed that U.S. debt remained the investment of choice during uncertain times, new S&P AA rating notwithstanding.
After the U.S. budget debacle, all eyes were swiftly back on Europe, as the financial contagion in the so-called PIIGS (Portugal, Italy, Ireland, Greece, Spain) countries threatened to spiral out of control. Portugal and Ireland remained on life support, and Greece appeared to be heading to inevitable default. Even the European Central Bank’s (ECB) August announcement that it would buy Italian and Spanish government bonds did little to appease market discord around European Union (EU) sustainability. The situation was further complicated as fiscally strong countries such as Germany and France began to suffer from the global economic malaise, and the viability of continued bailouts of their less financially sound neighbors became more questionable. Amidst this sea of macroeconomic uncertainty, investors steadily abandoned perceived-riskier assets.
During the fourth quarter, global markets held out hope for conferences that the European Union and the European Central Bank (“ECB”) held to address the region’s sovereign debt crisis. Invariably, these led to grand announcements with little substance behind them. However, the ECB’s latest liquidity offer to banks called the Long Term Refinancing Operation (LTRO), which provides banks three-year loans at a discount, could be a game changer. The facility, which was absorbed by European banks in a significant way (489 billion euros), does not solve the disconnect between social spending and lax tax compliance, but it provides liquidity from the ECB to the market for the next three years in a substantial size. Secondly, the facility suggests, in our view, that the ECB, which had been very reluctant and cautious in offering assistance, is now committed to being a part of the solution. Therefore, at a minimum, the ECB will continue with its current level of support and possibly give more support, in our view. We do not believe the ECB’s actions will necessarily cure the European crisis, but it may decrease the credit risk associated with it while increasing inflation and monetary concerns.
In Asia, China began to reverse its tightening policies, which were implemented last year to cool its overheating economy particularly in the real estate sector, by reducing reserve requirements for banks. We think the Chinese will be able to engineer a soft landing (rate of economic growth high enough to avoid recession, but slow enough to avoid high inflation), although authorities must be cognizant that land prices can behave erratically and there are many provincial government guarantees in place that may exceed the provinces’ ability to pay. China’s central government may need to bail out some of the provinces and developers, which would lead to losses for certain classes of investments, such as equities. However, the centrally-planned nature of the economy should enable authorities to engineer a soft landing, in our view. Key to that process is rotating their construction, which has already begun, from high-end luxury condos and offices to low income housing, where there is strong demand. We
Janus Alternative Fund | 5
Janus Real Return Allocation Fund (unaudited)
think this change should pay social dividends for decades to come.
Meanwhile, the U.S. economy surprised with stronger-than-expected growth, some of which we feel was temporary in nature. In particular, retail spending was firm, but we think that spending came from a decreased savings rate rather than from income. We’re also concerned about the significant amount of fiscal stimulus that started in 2009 and continues through February 2012. The combination of increased spending and relatively low tax receipts from weak economic growth and temporary tax cuts is not sustainable. The fourth quarter was also temporarily boosted by rebuilding auto inventories that were reduced earlier in the year due to the Japanese earthquake and tsunami and flooding in Thailand, which disrupted the auto supply chain.
Performance Discussion
The Fund is structured to seek a significant amount of inflation protection, which generally involves hedging the interest rate risk within the Fund. It is designed to profit from a rising rate environment as would be the case when inflation is rising. Therefore, the falling interest rate environment during the six-month period acted as a significant headwind to our returns. The Fund’s exposure to risk assets, namely emerging market and global real estate equities, also weighed on our absolute performance. Additionally, commodities and emerging market debt performed poorly during the period. Contributors to absolute performance included our holdings in global inflation-linked bonds and short duration credit.
The Fund’s allocation among the sleeves was largely unchanged during the period with a 52% allocation in global inflation-linked bonds as of period end. Our emerging market debt sleeve represented approximately 5% of the Fund, while our exposures to emerging market equities, global real estate and short duration credit and commodities remained at approximately 10% each. The balance of the Fund included interest rate swaps (a financial derivative instrument in which two parties agree to exchange interest rate cash flows, based on a specified notional amount from a fixed rate to a floating rate) and cash.
Underperformance has been driven by the fact that five out of the six sleeves underperformed their respective benchmarks. The global inflation-linked bond sleeve was the biggest detractor from relative performance. As the sleeve with the largest allocation, approximately 52% at year end, the global inflation-linked bond sleeve was the biggest driver of the overall return of the Fund. It underperformed its benchmark, the Barclays Capital U.S. TIPS Index, by approximately 5.5% since inception. The global real estate, emerging market equity and emerging market debt sleeves all underperformed their respective benchmarks greater than 2.5% but had less of an impact due to their smaller allocations. The short duration credit sleeve moderately underperformed its benchmark since inception but was not a material driver of underperformance
Positioning and Asset Class Overviews
We feel the global inflation-linked bond sleeve’s structure of using interest rate swaps, a short position in 30-year Treasuries and tactical trades employing 10-year Treasury futures continued to provide three hedges: 1) a “risk-on” hedge that should result in the sleeve performing well in a strengthening economy that drives up rates; 2) a “reflation/inflation” hedge, which should do well in case of monetary debasement by the Federal Reserve; and 3) a debt crisis hedge, which we believe would result in a dramatic increase in longer term U.S. yields. We also feel this sleeve should do well in less dramatic environments as well, as the carry and structure of the positions are designed to accrue substantial capital over time as yields normalize to more typical levels associated with an even modestly growing, over indebted issuer.
In global real estate, we continue to believe the prospects for listed real estate are decent, even against a daunting macro outlook. Slow growth accompanied by modest inflation and no, or only very gradual, rate increases is actually a good environment for commercial real estate (as the landlord to the global economy, commercial real estate would benefit from improving fundamentals, higher asset prices and still attractive borrowing costs).
In the emerging market debt sleeve, we reduced our regional exposure to Eastern Europe and China and sector exposure to mining and minerals and maintained exposure in food and energy sectors that have benefited from high food and energy prices. We think increased marginal production should more than offset any potential drop in commodity prices.
We believe once the global economy stabilizes and capital flows ease, emerging markets will again be appreciated by investors for their growth characteristics and strong financial positions. The caveat is that emerging markets may still be dependent on Europe getting its act together. At the equity sector level, we added to names, for example in consumer discretionary, which have had the most selling
6 | DECEMBER 31, 2011
(unaudited)
pressure, while capturing gains in other areas, such as consumer staples, which have outperformed.
While we have a neutral view on commodities, we feel there is opportunity in crude oil, which was priced for a significant decline as of period end, in our view. Gold and silver look increasingly attractive as well given increasing chances for monetary easing and the recent price decline in both metals. We also continue to like corn-soy spreads and corn-wheat spreads.
In our short-duration credit sleeve, we continue to be overweight corporate credit, which we believe offers some of the best risk-adjusted returns across the fixed-income market. The past year was highly volatile for credit, especially financials, primarily because of investor unease over headline risk. Yet underlying fundamentals in credit continue to improve. Profit margins are high and companies are accumulating cash.
Derivatives
The Fund held futures, swaps, options and forward currency contracts, which in aggregate detracted from performance. We used currency derivatives to hedge existing currency exposures and swaps to access markets in which we were not trading locally either due to our risk policies or an inability to trade locally. We executed sales and purchases of puts and calls to hedge existing equity exposures and sold puts on non-existing positions to hedge other similar securities. In an effort to capitalize on the volatility in the certain sectors, we periodically sold short-duration, out-of-the-money put and call options in liquid, well-understood names. The rationale behind this strategy was to generate additional income for shareholders while limiting risks to potentially having to buy or sell shares at what we viewed as attractive entry/exit prices. Please see the Derivative Instruments section in the “Notes to Financial Statements” for a discussion of derivatives used by the Portfolio.
Outlook
We remain pessimistic on European growth and inflation. We think recent actions have removed some of the deflationary threats to a mild disinflation headwind for economic growth and milder credit problems, but the problems in Europe are still onerous. In China, we think authorities will be able to manage a soft economic landing, as it removes tightening measures from last year. We also believe recent economic growth in the U.S. is temporary, and we are concerned about its growth prospects in the first quarter. While inflation moved from a high of 3.9% during 2011 to approximately 2%, our current U.S. interest rates are more consistent with a 0% to 1% inflation rate. So, interest rates are still too low relative to the inflation rate. The current slow economic growth rate we expect will likely result in rates remaining low, while there is obviously potential for risk to the upside (higher rates). As the market environment continues to evolve, the asset allocation committee will monitor and proactively take advantage of market dislocations by moving assets among the underlying sleeves.
Thank you for investing in Janus Real Return Allocation Fund.
Janus Alternative Fund | 7
Janus Real Return Allocation Fund (unaudited)
Janus Real Return Allocation Fund At A Glance
5 Top Performers – Holdings
| | | | | |
| | | Contribution |
| |
S&P 500 E-Mini Index — Put expired October 2011 exercise price $1,150.00 | | | 0.93% | |
S&P 500 E-Mini Index — Put expired August 2011 exercise price $1,225.00 | | | 0.47% | |
| Sun Art Retail Group, Ltd. | | | 0.14% | |
| Karoon Gas Australia, Ltd. | | | 0.07% | |
| Samsung Electronics Co., Ltd. | | | 0.07% | |
5 Bottom Performers – Holdings
| | | | | |
| | | Contribution |
| |
| OTC EUR versus USD — Put expired December 2011 exercise price $1,300.00 | | | –0.25% | |
| Hang Lung Properties, Ltd. | | | –0.19% | |
| CapitaLand, Ltd. | | | –0.18% | |
| BOCI-Prudential — W.I.S.E. — CSI China Tracker Fund (ETF) | | | –0.17% | |
| Gold 100 OZ FTR — Call expires January 2012 exercise price $1,900.00 | | | –0.16% | |
5 Top Performers – Sectors*
| | | | | | | | | | | | | |
| | | | | Fund Weighting
| | |
| | | Fund Contribution | | (Average % of Equity) | | |
| |
| Options** | | | 2.38% | | | | 0.73% | | | | | |
| Consumer Staples | | | 0.00% | | | | 1.14% | | | | | |
| Real Estate | | | –0.04% | | | | 0.65% | | | | | |
| Utilities | | | –0.06% | | | | 0.57% | | | | | |
| Information Technology | | | –0.07% | | | | 3.68% | | | | | |
5 Bottom Performers – Sectors*
| | | | | | | | | | | | | |
| | | | | Fund Weighting
| | |
| | | Fund Contribution | | (Average % of Equity) | | |
| |
| Financials | | | –10.89% | | | | 55.30% | | | | | |
| Materials | | | –2.05% | | | | 5.57% | | | | | |
| Industrials | | | –1.88% | | | | 4.02% | | | | | |
| Energy | | | –1.53% | | | | 6.81% | | | | | |
| Consumer Discretionary | | | –0.99% | | | | 7.65% | | | | | |
| | | |
| | | Security contribution to performance is measured by using an algorithm that multiplies the daily performance of each security with the previous day’s ending weight in the portfolio and is gross of advisory fees. Fixed income securities and certain equity securities, such as private placements and some share classes of equity securities, are excluded. |
| * | | Based on sector classification according to the Global Industry Classification Standard (“GICS”) codes, which are the exclusive property and a service mark of MSCI Inc. and Standard & Poor’s. |
| ** | | Not a GICS classified sector. |
8 | DECEMBER 31, 2011
(unaudited)
5 Largest Equity Holdings – (% of Net Assets)
As of December 31, 2011
| | | |
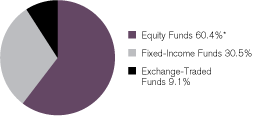
Vanguard MSCI Emerging Markets (ETF)
Exchange-Traded Funds | | 0.6% |
| BOCI — Prudential — W.I.S.E. — CSI China Tracker Fund (ETF) Exchange-Traded Funds | | 0.5% |
| Taiwan Semiconductor Manufacturing Co., Ltd. (ADR) Semiconductor Components/Integrated Circuits | | 0.4% |
Hang Lung Properties, Ltd.
Real Estate Operating/Development | | 0.3% |
Brookfield Asset Management, Inc. — Class A
Real Estate Operating/Development | | 0.3% |
| | | |
| | | 2.1% |
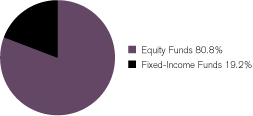
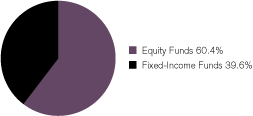
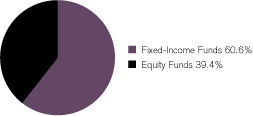
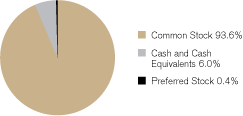
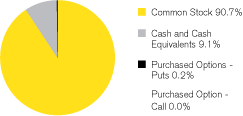
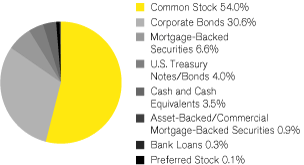
Asset Allocation – (% of Net Assets)
As of December 31, 2011
Emerging markets comprised 8.2% of total net assets.
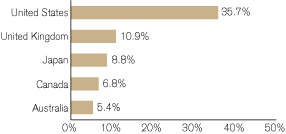
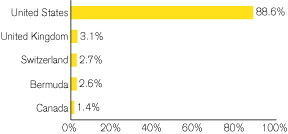
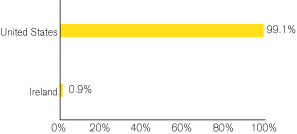
Top Country Allocations – Long Positions (% of Investment Securities)
As of December 31, 2011
Janus Alternative Fund | 9
Janus Real Return Allocation Fund (unaudited)
| | | | | | | | | | |
| Cumulative Total Return – for the periods ended December 31, 2011 | | | | | Expense Ratios – per the October 28, 2011 prospectuses |
| | | Fiscal
| | Since
| | | Total Annual Fund
| | Net Annual Fund
|
| | | Year-to-Date | | Inception* | | | Operating Expenses | | Operating Expenses |
| | | | | | | | | | |
| Janus Real Return Allocation Fund — Class A Shares | | | | | | | 2.17% | | 1.27% |
| NAV | | –4.51% | | –4.99% | | | | | |
| MOP | | –10.03% | | –10.45% | | | | | |
| | | | | | | | | | |
| Janus Real Return Allocation Fund — Class C Shares | | | | | | | 2.94% | | 2.02% |
| NAV | | –4.92% | | –5.49% | | | | | |
| CDSC | | –5.86% | | –6.43% | | | | | |
| | | | | | | | | | |
| Janus Real Return Allocation Fund — Class D Shares(1) | | –4.54% | | –5.02% | | | 1.98% | | 1.15% |
| | | | | | | | | | |
| Janus Real Return Allocation Fund — Class I Shares | | –4.38% | | –4.86% | | | 1.83% | | 1.02% |
| | | | | | | | | | |
| Janus Real Return Allocation Fund — Class S Shares | | –4.75% | | –5.22% | | | 2.31% | | 1.52% |
| | | | | | | | | | |
| Janus Real Return Allocation Fund — Class T Shares | | –4.51% | | –4.99% | | | 2.06% | | 1.27% |
| | | | | | | | | | |
| Barclays Capital U.S. TIPS Index | | 7.32% | | 8.85% | | | | | |
| | | | | | | | | | |
| Visit janus.com/advisor/mutual-funds (or janus.com/allfunds if you hold Shares directly with Janus Capital) to view current performance and characteristic information | | | | | | | |
| | | | | | | | | | |
Data presented represents past performance, which is no guarantee of future results. Investment results and principal value will fluctuate so that shares, when redeemed, may be worth more or less than their original cost. Due to market volatility, current performance may be higher or lower than the performance shown. Call 877.33JANUS(52687) (or 800.525.3713 if you hold shares directly with Janus Capital) or visit janus.com/advisor/mutual-funds (or janus.com/ allfunds if you hold shares directly with Janus Capital) for performance current to the most recent month-end.
Performance shown for Class A Shares at Maximum Offering Price (MOP) includes the Fund’s maximum sales charge of 5.75%. Performance shown at Net Asset Value (NAV) does not include this charge and would have been lower had this charge been taken into account.
Performance shown for Class C Shares includes a 1% contingent deferred sales charge (CDSC) on periods of less than 12 months. Performance shown at Net Asset Value (NAV) does not include this sales charge and would have been lower had this sales charge been taken into account.
See important disclosures on the next page.
10 | DECEMBER 31, 2011
(unaudited)
Janus Capital has contractually agreed to waive the Fund’s total annual fund operating expenses, which include the expenses of the Subsidiary, allocated to any class (excluding the distribution and shareholder servicing fees (applicable to Class A Shares, Class C Shares and Class S Shares), administrative services fees payable pursuant to the Transfer Agency Agreement (except for networking and omnibus fees), brokerage commissions, interest, dividends, taxes, acquired fund fees and expenses, and extraordinary expenses) to certain limits until at least November 1, 2012. The contractual waiver may be terminated or modified prior to this date only at the discretion of the Board of Trustees. Returns shown include fee waivers, if any, and without such waivers, returns would have been lower.
The expense information shown reflects estimated annualized expenses that the share classes of the Fund expect to incur during their initial fiscal year. The effect of contractual waivers agreed to by Janus Capital, when applicable, are reflected under “Net Annual Fund Operating Expenses.” (All expenses are shown without the effect of expense offset arrangements. Pursuant to such arrangements, credits realized as a result of uninvested cash balances are used to reduce custodian and transfer agent expenses.)
The Fund’s performance may be affected by risks that include those associated with nondiversification, non-investment grade debt securities, high-yield/high-risk securities, investments in specific industries or countries and potential conflicts of interest with the Janus “funds of funds.” Additional risks to the Fund may also include, but are not limited to, those associated with investing in foreign securities, emerging markets, initial public offerings (“IPOs”), real estate investment trusts (“REITs”), and derivatives. Please see a Janus prospectus or janus.com/info (or janus.com/reports if you hold shares directly with Janus Capital) for more information about risks, portfolio holdings and other details.
Inflation-linked bonds typically have lower yields than conventional fixed-rate bonds due to their inflation adjustment feature and normally decline in price when interest rates rise.
The Fund invests in REITs which may be subject to a higher degree of market risk because of concentration in a specific industry, sector or geographic region. REITs may be subject to risks including, but not limited to: legal, political, liquidity, and interest rate risks, a decline in the value of real estate, risks related to general and economic conditions, changes in the value of the underlying property owned by the trust and defaults by borrowers. To the extent the Fund invests in foreign REITs, the Fund may be subject to fluctuations in currency rates or political or economic conditions in a particular country.
The Fund invests in derivatives which can be highly volatile and involve additional risks than if the underlying securities were held directly by the Fund. Such risks include gains or losses which, as a result of leverage, can be substantially greater than the derivatives’ original cost. There is also a possibility that derivatives may not perform as intended which can reduce opportunity for gains or result in losses by offsetting positive returns in other securities the Fund owns.
The Fund may have significant exposure to emerging markets. In general, emerging market investments have historically been subject to significant gains and/or losses. As such, the Fund’s returns and NAV may be subject to volatility.
Funds that invest in bonds have the same interest rate, inflation, and credit risks that are associated with the underlying bonds owned by the Fund. Unlike owning individual bonds, there are ongoing fees and expenses associated with owning shares of bonds funds. The return of principal is not guaranteed due to net asset value fluctuation that is caused by changes in the price of specific bonds held in the Fund and selling of bonds within the Fund by the portfolio managers.
High-yield/high-risk bonds, also known as “junk” bonds, involve a greater risk of default and price volatility than investment grade bonds. High-yield/high-risk bonds can experience sudden and sharp price swings which will affect net asset value.
For a period of three years subsequent to the Fund’s commencement of operations or until the Fund’s assets exceed the first breakpoint in the investment advisory fee schedule, whichever occurs first, Janus Capital may recover from the Fund fees and expenses previously waived or reimbursed, which could then be considered a deferral, if the Fund’s expense ratio, including recovered expenses, falls below the expense limit.
The Fund’s performance for very short time periods may not be indicative of future performance.
Due to certain investment strategies, the Fund may have an increased position in cash.
Returns include reinvestment of dividends from net investment income and distributions from capital gains. The returns shown do not reflect the deduction of taxes that a shareholder would pay on Fund distributions or the redemption of Fund shares. The returns do not include adjustments in accordance with generally accepted accounting principles required at the period end for financial reporting purposes.
Lipper does not rank this Fund as it is less than one year old.
There is no assurance that the investment process will consistently lead to successful investing.
See Notes to Consolidated Schedules of Investments for index definitions.
The Fund’s portfolio may differ significantly from the securities held in the indices. The indices are unmanaged and are not available for direct investment; therefore, their performance does not reflect the expenses associated with the active management of an actual portfolio.
See “Explanations of Charts, Tables and Financial Statements.”
| | | |
| * | | The Fund’s inception date — May 13, 2011 |
| (1) | | Closed to new investors. |
Janus Alternative Fund | 11
Janus Real Return Allocation Fund (unaudited)
The examples below show you the ongoing costs (in dollars) of investing in your Fund and allow you to compare these costs with those of other mutual funds. Please refer to the section Useful Information About Your Fund Report for a detailed explanation of the information presented in these charts.
| | | | | | | | | | | | | | | |
| | | Beginning Account Value
| | Ending Account Value
| | Expenses Paid During Period
| | |
| Expense Example – Class A Shares | | (7/1/11) | | (12/31/11) | | (7/1/11 - 12/31/11)† | | |
| |
| |
| Actual | | $ | 1,000.00 | | | $ | 954.90 | | | $ | 6.24 | | | |
| |
| |
Hypothetical
(5% return before expenses) | | $ | 1,000.00 | | | $ | 1,018.75 | | | $ | 6.44 | | | |
| |
| |
| | | | | | | | | | | | | | | |
| | | | | | | | | | | | | | | |
| | | Beginning Account Value
| | Ending Account Value
| | Expenses Paid During Period
| | |
| Expense Example – Class C Shares | | (7/1/11) | | (12/31/11) | | (7/1/11 - 12/31/11)† | | |
| |
| |
| Actual | | $ | 1,000.00 | | | $ | 950.80 | | | $ | 9.91 | | | |
| |
| |
Hypothetical
(5% return before expenses) | | $ | 1,000.00 | | | $ | 1,014.98 | | | $ | 10.23 | | | |
| |
| |
| | | | | | | | | | | | | | | |
| | | | | | | | | | | | | | | |
| | | Beginning Account Value
| | Ending Account Value
| | Expenses Paid During Period
| | |
| Expense Example – Class D Shares | | (7/1/11) | | (12/31/11) | | (7/1/11 - 12/31/11)† | | |
| |
| |
| Actual | | $ | 1,000.00 | | | $ | 954.60 | | | $ | 6.09 | | | |
| |
| |
Hypothetical
(5% return before expenses) | | $ | 1,000.00 | | | $ | 1,018.90 | | | $ | 6.29 | | | |
| |
| |
| | | | | | | | | | | | | | | |
| | | | | | | | | | | | | | | |
| | | Beginning Account Value
| | Ending Account Value
| | Expenses Paid During Period
| | |
| Expense Example – Class I Shares | | (7/1/11) | | (12/31/11) | | (7/1/11 - 12/31/11)† | | |
| |
| |
| Actual | | $ | 1,000.00 | | | $ | 956.20 | | | $ | 5.02 | | | |
| |
| |
Hypothetical
(5% return before expenses) | | $ | 1,000.00 | | | $ | 1,020.01 | | | $ | 5.18 | | | |
| |
| |
| | | | | | | | | | | | | | | |
| | | | | | | | | | | | | | | |
| | | Beginning Account Value
| | Ending Account Value
| | Expenses Paid During Period
| | |
| Expense Example – Class S Shares | | (7/1/11) | | (12/31/11) | | (7/1/11 - 12/31/11)† | | |
| |
| |
| Actual | | $ | 1,000.00 | | | $ | 952.50 | | | $ | 7.46 | | | |
| |
| |
Hypothetical
(5% return before expenses) | | $ | 1,000.00 | | | $ | 1,017.50 | | | $ | 7.71 | | | |
| |
| |
| | | | | | | | | | | | | | | |
| | | | | | | | | | | | | | | |
| | | Beginning Account Value
| | Ending Account Value
| | Expenses Paid During Period
| | |
| Expense Example – Class T Shares | | (7/1/11) | | (12/31/11) | | (7/1/11 - 12/31/11)† | | |
| |
| |
| Actual | | $ | 1,000.00 | | | $ | 954.90 | | | $ | 6.24 | | | |
| |
| |
Hypothetical
(5% return before expenses) | | $ | 1,000.00 | | | $ | 1,018.75 | | | $ | 6.44 | | | |
| |
| |
| | | |
| † | | Expenses are equal to the annualized expense ratio of 1.27% for Class A Shares, 2.02% for Class C Shares, 1.24% for Class D Shares, 1.02% for Class I Shares, 1.52% for Class S Shares and 1.27% for Class T Shares multiplied by the average account value over the period, multiplied by 184/366 (to reflect the one-half year period). Expenses include effect of contractual waivers by Janus Capital. |
12 | DECEMBER 31, 2011
Janus Real Return Allocation Fund
Consolidated Schedule of Investments (unaudited)
As of December 31, 2011
| | | | | | | | | | | |
| Shares/Principal/Contract Amounts | | Value | | | |
| |
| Common Stock – 17.9% | | | | | | |
| Apparel Manufacturers – 0.1% | | | | | | |
| | 14,000 | | | China Lilang, Ltd. | | $ | 12,239 | | | |
| | 78,000 | | | Sitoy Group Holdings, Ltd. (144A)* | | | 29,627 | | | |
| | | | | | | | 41,866 | | | |
| Automotive – Truck Parts and Equipment – Original – 0.1% | | | | | | |
| | 167 | | | Hyundai Mobis* | | | 42,330 | | | |
| Automotive – Cars and Light Trucks – 0.1% | | | | | | |
| | 14,149 | | | Dongfeng Motor Group Co., Ltd. | | | 24,266 | | | |
| Brewery – 0.1% | | | | | | |
| | 6,300 | | | East African Breweries, Ltd. | | | 12,733 | | | |
| | 103,000 | | | Thai Beverage PCL | | | 19,456 | | | |
| | | | | | | | 32,189 | | | |
| Building and Construction – Miscellaneous – 0% | | | | | | |
| | 500 | | | Multiplan Empreendimentos Imobiliarios S.A. | | | 10,259 | | | |
| Building – Residential and Commercial – 0.3% | | | | | | |
| | 800 | | | Hajime Construction Co., Ltd. | | | 16,443 | | | |
| | 16,500 | | | MRV Engenharia e Participacoes S.A. | | | 94,652 | | | |
| | | | | | | | 111,095 | | | |
| Casino Hotels – 0.1% | | | | | | |
| | 3,847 | | | Crown, Ltd. | | | 31,832 | | | |
| Cellular Telecommunications – 0.4% | | | | | | |
| | 2,390 | | | America Movil S.A.B. de C.V. – Series L (ADR) | | | 54,014 | | | |
| | 4,500 | | | China Mobile, Ltd. | | | 43,977 | | | |
| | 2,613 | | | MTN Group, Ltd. | | | 46,524 | | | |
| | | | | | | | 144,515 | | | |
| Coal – 0.3% | | | | | | |
| | 35,000 | | | China Coal Energy Co., Ltd. | | | 37,764 | | | |
| | 6,000 | | | China Shenhua Energy Co., Ltd. | | | 26,035 | | | |
| | 33,000 | | | Sakari Resources, Ltd. | | | 46,814 | | | |
| | | | | | | | 110,613 | | | |
| Commercial Banks – 1.4% | | | | | | |
| | 12,940 | | | Banco Bilbao Vizcaya Argentaria S.A. (ADR) | | | 110,896 | | | |
| | 6,675 | | | Banco do Brasil S.A. (ADR) | | | 84,105 | | | |
| | 145,000 | | | Bank of China, Ltd. | | | 53,395 | | | |
| | 2,428 | | | Erste Group Bank A.G | | | 42,690 | | | |
| | 9,458 | | | First Gulf Bank PJSC | | | 39,782 | | | |
| | 1,080 | | | ICICI Bank, Ltd. (ADR) | | | 28,545 | | | |
| | 1,515 | | | Itau Unibanco Holding S.A. (ADR) | | | 28,118 | | | |
| | 10,015 | | | Sberbank of Russia (ADR)* | | | 99,492 | | | |
| | 352 | | | State Bank of India | | | 10,732 | | | |
| | 1,854 | | | The Commercial Bank of Qatar QSC | | | 42,768 | | | |
| | | | | | | | 540,523 | | | |
| Consumer Products – Miscellaneous – 0.1% | | | | | | |
| | 129,000 | | | Goodbaby International Holdings, Ltd. | | | 35,212 | | | |
| Distribution/Wholesale – 0.1% | | | | | | |
| | 9,645 | | | Adani Enterprises, Ltd. | | | 53,324 | | | |
| Diversified Financial Services – 0.1% | | | | | | |
| | 778 | | | Shinhan Financial Group Co., Ltd.* | | | 26,845 | | | |
| Diversified Minerals – 0.1% | | | | | | |
| | 214 | | | Anglo American PLC | | | 7,847 | | | |
| | 95,000 | | | Borneo Lumbung Energi & Metal Tbk PT* | | | 8,696 | | | |
| | 2,659 | | | Xstrata PLC | | | 40,385 | | | |
| | | | | | | | 56,928 | | | |
| Diversified Operations – Commercial Services – 0.2% | | | | | | |
| | 26,000 | | | Melco International Development, Ltd.* | | | 19,316 | | | |
| | 1,296 | | | Orascom Development Holding A.G.* | | | 19,799 | | | |
| | 8,000 | | | Shanghai Industrial Holdings, Ltd. | | | 22,198 | | | |
| | 8,000 | | | Wharf Holdings, Ltd. | | | 36,155 | | | |
| | | | | | | | 97,468 | | | |
| Educational Software – 0% | | | | | | |
| | 3,075 | | | Educomp Solutions, Ltd. | | | 11,112 | | | |
| Electric – Distribution – 0.1% | | | | | | |
| | 31,156 | | | Spark Infrastructure Group (144A) | | | 43,816 | | | |
| Electronic Components – Semiconductors – 0.3% | | | | | | |
| | 128 | | | Samsung Electronics Co., Ltd. | | | 117,556 | | | |
| Electronic Parts Distributors – 0.1% | | | | | | |
| | 29,070 | | | WPG Holdings, Ltd. | | | 33,506 | | | |
| | 8,000 | | | WT Microelectronics Co., Ltd. | | | 10,331 | | | |
| | | | | | | | 43,837 | | | |
| Energy – Alternate Sources – 0.1% | | | | | | |
| | 740 | | | First Solar, Inc.* | | | 24,982 | | | |
| | 41,326 | | | Indiabulls Infrastructure and Power, Ltd.oo | | | 0 | | | |
| | | | | | | | 24,982 | | | |
| Entertainment Software – 0% | | | | | | |
| | 700 | | | Nexon Co., Ltd.* | | | 10,068 | | | |
| Food – Miscellaneous/Diversified – 0.1% | | | | | | |
| | 31,000 | | | China Yurun Food Group, Ltd. | | | 40,713 | | | |
| Food – Retail – 0.1% | | | | | | |
| | 1,217 | | | X5 Retail Group N.V. (GDR)* | | | 27,796 | | | |
| Food – Wholesale/Distribution – 0.1% | | | | | | |
| | 15,863 | | | Olam International, Ltd. | | | 26,050 | | | |
| Forestry – 0% | | | | | | |
| | 64 | | | Deltic Timber Corp. | | | 3,865 | | | |
| | 1,100 | | | Sino-Forest Corp.*,ß,oo | | | 0 | | | |
| | | | | | | | 3,865 | | | |
| Hotels and Motels – 0.3% | | | | | | |
| | 24,000 | | | Overseas Union Enterprise, Ltd. | | | 38,857 | | | |
| | 20,000 | | | Shangri-La Asia, Ltd. | | | 34,507 | | | |
| | 1,947 | | | Whitbread PLC | | | 47,291 | | | |
| | | | | | | | 120,655 | | | |
| Industrial Automation and Robotics – 0.1% | | | | | | |
| | 300 | | | Fanuc Corp. | | | 45,914 | | | |
| Insurance Brokers – 0.1% | | | | | | |
| | 7,740 | | | Cninsure, Inc. (ADR)* | | | 53,561 | | | |
| Internet Content – Entertainment – 0% | | | | | | |
| | 840 | | | Youku.com, Inc. (ADR)* | | | 13,163 | | | |
| Life and Health Insurance – 0% | | | | | | |
| | 2,005 | | | Discovery Holdings, Ltd. | | | 10,804 | | | |
| Medical – Generic Drugs – 0.1% | | | | | | |
| | 7,379 | | | Aurobindo Pharma, Ltd. | | | 11,831 | | | |
| | 2,248 | | | Pharmstandard OJSC (GDR)* | | | 31,697 | | | |
| | | | | | | | 43,528 | | | |
| Metal – Aluminum – 0% | | | | | | |
| | 2,555 | | | Aluminium Bahrain BSC (GDR) | | | 17,872 | | | |
| Metal – Copper – 0.1% | | | | | | |
| | 9,482 | | | Copper Mountain Mining Corp.* | | | 52,401 | | | |
See Notes to Consolidated Schedule of Investments and Financial Statements.
Janus Alternative Fund | 13
Janus Real Return Allocation Fund
Consolidated Schedule of Investments (unaudited)
As of December 31, 2011
| | | | | | | | | | | |
| Shares/Principal/Contract Amounts | | Value | | | |
| |
| Metal – Diversified – 0.1% | | | | | | |
| | 3,235 | | | Ivanhoe Mines, Ltd. (U.S. Shares)* | | $ | 57,444 | | | |
| Metal – Iron – 0.4% | | | | | | |
| | 244 | | | Kumba Iron Ore, Ltd. | | | 15,113 | | | |
| | 8,463 | | | London Mining PLC* | | | 38,969 | | | |
| | 949 | | | Rio Tinto PLC | | | 46,056 | | | |
| | 3,655 | | | Vale S.A. (ADR) | | | 78,400 | | | |
| | | | | | | | 178,538 | | | |
| Oil Companies – Exploration and Production – 0.7% | | | | | | |
| | 13,000 | | | CGX Energy, Inc.* | | | 13,399 | | | |
| | 305 | | | CNOOC, Ltd. (ADR) | | | 53,277 | | | |
| | 1,770 | | | Cobalt International Energy, Inc.* | | | 27,470 | | | |
| | 28 | | | HRT Participacoes em Petroleo S.A.* | | | 8,526 | | | |
| | 14,620 | | | Karoon Gas Australia, Ltd.* | | | 67,440 | | | |
| | 836 | | | Niko Resources, Ltd. | | | 39,578 | | | |
| | 6,696 | | | OGX Petroleo e Gas Participacoes S.A. (ADR)* | | | 48,814 | | | |
| | 5,755 | | | Rockhopper Exploration PLC* | | | 24,154 | | | |
| | | | | | | | 282,658 | | | |
| Oil Companies – Integrated – 0.5% | | | | | | |
| | 265 | | | Ecopetrol S.A. (ADR) | | | 11,798 | | | |
| | 2,296 | | | Pacific Rubiales Energy Corp. | | | 42,212 | | | |
| | 5,175 | | | Petroleo Brasileiro S.A. (ADR) | | | 128,599 | | | |
| | | | | | | | 182,609 | | | |
| Oil Refining and Marketing – 0% | | | | | | |
| | 527 | | | Reliance Industries, Ltd. (GDR) (144A) | | | 14,018 | | | |
| Property and Casualty Insurance – 0.1% | | | | | | |
| | 224 | | | Samsung Fire & Marine Insurance Co., Ltd. | | | 41,028 | | | |
| Property Trust – 0.1% | | | | | | |
| | 1,010 | | | Sovran Self Storage, Inc. | | | 43,097 | | | |
| Real Estate Management/Services – 1.3% | | | | | | |
| | 49,600 | | | AIMS AMP Capital Industrial | | | 36,137 | | | |
| | 14,403 | | | Atrium European Real Estate, Ltd. | | | 64,908 | | | |
| | 3,800 | | | BR Malls Participacoes S.A. | | | 36,915 | | | |
| | 611 | | | Castellum A.B | | | 7,573 | | | |
| | 1,440 | | | CB Richard Ellis Group, Inc. – Class A* | | | 21,917 | | | |
| | 3,251 | | | First Capital Realty, Inc. | | | 55,207 | | | |
| | 5,115 | | | Gazit-Globe, Ltd. | | | 48,235 | | | |
| | 500 | | | Jones Lang LaSalle, Inc. | | | 30,630 | | | |
| | 8,454 | | | Kennedy-Wilson Holdings, Inc. | | | 89,443 | | | |
| | 1,800 | | | LPS Brasil Consultoria de Imoveis S.A. | | | 25,091 | | | |
| | 5,000 | | | Mitsubishi Estate Co., Ltd. | | | 74,705 | | | |
| | 14,491 | | | Songbird Estates PLC* | | | 25,880 | | | |
| | | | | | | | 516,641 | | | |
| Real Estate Operating/Development – 2.9% | | | | | | |
| | 6,900 | | | BR Properties S.A. | | | 68,436 | | | |
| | 4,860 | | | Brookfield Asset Management, Inc. – Class A | | | 133,553 | | | |
| | 75,000 | | | CapitaLand, Ltd. | | | 127,790 | | | |
| | 9,400 | | | Cyrela Commercial Properties S.A. Empreendimentos e Participacoes | | | 81,893 | | | |
| | 56,181 | | | Emaar Properties PJSC | | | 39,308 | | | |
| | 2,900 | | | First Juken Co., Ltd. | | | 22,870 | | | |
| | 463 | | | GAGFAH S.A. | | | 2,381 | | | |
| | 32,070 | | | Global Logistic Properties, Ltd.* | | | 43,393 | | | |
| | 48,000 | | | Hang Lung Properties, Ltd. | | | 136,585 | | | |
| | 17,500 | | | Hopewell Holdings, Ltd. | | | 44,749 | | | |
| | 1,101 | | | Hysan Development Co., Ltd. | | | 3,615 | | | |
| | 21,904 | | | Indiabulls Real Estate, Ltd. | | | 19,283 | | | |
| | 2,000 | | | Mitsui Fudosan Co., Ltd. | | | 29,154 | | | |
| | 8,000 | | | PDG Realty S.A. Empreendimentos e Participacoes | | | 25,305 | | | |
| | 5,175 | | | PDG Realty S.A. Empreendimentos e Participacoes (ADR) | | | 34,155 | | | |
| | 13,300 | | | Phoenix Mills, Ltd. | | | 41,662 | | | |
| | 572,000 | | | Renhe Commercial Holdings Co., Ltd. | | | 65,547 | | | |
| | 137,000 | | | Shui On Land, Ltd. | | | 41,630 | | | |
| | 96,000 | | | Shun Tak Holdings, Ltd. | | | 35,846 | | | |
| | 188,995 | | | Sorouh Real Estate Co.* | | | 43,735 | | | |
| | 3,190 | | | St Joe Co.* | | | 46,765 | | | |
| | 4,000 | | | Sun Hung Kai Properties, Ltd. | | | 50,138 | | | |
| | | | | | | | 1,137,793 | | | |
| REIT – Apartments – 0.2% | | | | | | |
| | 880 | | | American Campus Communities, Inc. | | | 36,925 | | | |
| | 1,915 | | | Associated Estates Realty Corp. | | | 30,544 | | | |
| | 1,770 | | | Education Realty Trust, Inc. | | | 18,107 | | | |
| | | | | | | | 85,576 | | | |
| REIT – Diversified – 2.0% | | | | | | |
| | 3,557 | | | American Assets Trust, Inc. | | | 72,954 | | | |
| | 26,680 | | | Charter Hall Group | | | 54,304 | | | |
| | 3,090 | | | Coresite Realty Corp. | | | 55,064 | | | |
| | 880 | | | Digital Realty Trust, Inc. | | | 58,669 | | | |
| | 829 | | | Dundee Real Estate Investment Trust | | | 26,585 | | | |
| | 1,685 | | | DuPont Fabros Technology, Inc. | | | 40,811 | | | |
| | 670 | | | Entertainment Properties Trust | | | 29,286 | | | |
| | 1,053 | | | Eurocommercial Properties N.V. | | | 33,431 | | | |
| | 24,400 | | | Fibra Uno Administracion S.A. de C.V. | | | 41,615 | | | |
| | 4,737 | | | Land Securities Group PLC | | | 46,751 | | | |
| | 14,350 | | | Lexington Realty Trust | | | 107,481 | | | |
| | 109,000 | | | Mapletree Logistics Trust | | | 71,011 | | | |
| | 2,300 | | | Morguard Real Estate Investment Trust | | | 36,123 | | | |
| | 1,370 | | | Plum Creek Timber Co., Inc. | | | 50,087 | | | |
| | 7,079 | | | Segro PLC | | | 22,922 | | | |
| | 1,821 | | | Shaftesbury PLC | | | 13,212 | | | |
| | 257 | | | Unibail-Rodamco S.E | | | 46,201 | | | |
| | 805 | | | Winthrop Realty Trust | | | 8,187 | | | |
| | | | | | | | 814,694 | | | |
| REIT – Health Care – 0.3% | | | | | | |
| | 1,135 | | | Health Care, Inc. | | | 61,892 | | | |
| | 848 | | | LTC Properties, Inc. | | | 26,169 | | | |
| | 355 | | | Ventas, Inc. | | | 19,571 | | | |
| | | | | | | | 107,632 | | | |
| REIT – Hotels – 0.4% | | | | | | |
| | 28,000 | | | Ascott Residence Trust | | | 21,372 | | | |
| | 7,085 | | | Chatham Lodging Trust | | | 76,376 | | | |
| | 2,925 | | | Pebblebrook Hotel Trust | | | 56,101 | | | |
| | | | | | | | 153,849 | | | |
| REIT – Mortgage – 0.2% | | | | | | |
| | 4,155 | | | Colony Financial, Inc. | | | 65,275 | | | |
| REIT – Office Property – 0.7% | | | | | | |
| | 1,325 | | | Alexandria Real Estate Equities, Inc. | | | 91,385 | | | |
| | 220 | | | Boston Properties, Inc. | | | 21,912 | | | |
| | 8,635 | | | Charter Hall Office | | | 31,000 | | | |
| | 5,519 | | | Great Portland Estates PLC | | | 27,684 | | | |
| | 2,420 | | | Kilroy Realty Corp. | | | 92,129 | | | |
See Notes to Consolidated Schedule of Investments and Financial Statements.
14 | DECEMBER 31, 2011
Consolidated Schedule of Investments (unaudited)
As of December 31, 2011
| | | | | | | | | | | |
| Shares/Principal/Contract Amounts | | Value | | | |
| |
| REIT – Office Property – (continued) | | | | | | |
| | | | | | | | | | | |
| | 1 | | | Tokyu, Inc. | | $ | 5,022 | | | |
| | | | | | | | 269,132 | | | |
| REIT – Regional Malls – 0.3% | | | | | | |
| | 2,246 | | | Macerich Co. | | | 113,648 | | | |
| REIT – Shopping Centers – 0.5% | | | | | | |
| | 2,715 | | | Acadia Realty Trust | | | 54,680 | | | |
| | 12,275 | | | Kite Realty Group Trust | | | 55,360 | | | |
| | 12,166 | | | Westfield Group | | | 97,183 | | | |
| | | | | | | | 207,223 | | | |
| REIT – Warehouse/Industrial – 0.3% | | | | | | |
| | 3,090 | | | First Potomac Realty Trust | | | 40,325 | | | |
| | 3,051 | | | Prologis, Inc. | | | 87,228 | | | |
| | | | | | | | 127,553 | | | |
| Resorts and Theme Parks – 0.2% | | | | | | |
| | 1,820 | | | Vail Resorts, Inc. | | | 77,095 | | | |
| Retail – Apparel and Shoe – 0.2% | | | | | | |
| | 39,000 | | | Anta Sports Products, Ltd. | | | 46,348 | | | |
| | 17,500 | | | Ports Design, Ltd. | | | 26,453 | | | |
| | | | | | | | 72,801 | | | |
| Retail – Automobile – 0.1% | | | | | | |
| | 26,500 | | | Baoxin Auto Group, Ltd. (144A)* | | | 25,727 | | | |
| Rubber/Plastic Products – 0.1% | | | | | | |
| | 2,712 | | | Jain Irrigation Systems, Ltd. | | | 4,420 | | | |
| | 28,426 | | | Jain Irrigation Systems, Ltd. (EDR) | | | 23,281 | | | |
| | | | | | | | 27,701 | | | |
| Semiconductor Components/Integrated Circuits – 0.4% | | | | | | |
| | 13,000 | | | Advanced Semiconductor Engineering, Inc. | | | 11,120 | | | |
| | 11,070 | | | Taiwan Semiconductor Manufacturing Co., Ltd. (ADR) | | | 142,914 | | | |
| | | | | | | | 154,034 | | | |
| Shipbuilding – 0.1% | | | | | | |
| | 19,851 | | | Pipavav Defence & Offshore Engineering Co., Ltd.* | | | 24,746 | | | |
| | 2,150 | | | SembCorp Marine, Ltd. | | | 6,332 | | | |
| | | | | | | | 31,078 | | | |
| Steel – Producers – 0.3% | | | | | | |
| | 2,720 | | | ArcelorMittal | | | 49,477 | | | |
| | 9,680 | | | Mechel (ADR) | | | 33,880 | | | |
| | 72 | | | POSCO | | | 23,750 | | | |
| | | | | | | | 107,107 | | | |
| Telecommunication Services – 0.2% | | | | | | |
| | 365 | | | China Telecom Corp., Ltd. (ADR) | | | 20,852 | | | |
| | 115,000 | | | Tower Bersama Infrastructure Tbk PT | | | 30,121 | | | |
| | 4,180 | | | VimpelCom, Ltd. (ADR) | | | 39,585 | | | |
| | | | | | | | 90,558 | | | |
| Transportation – Marine – 0% | | | | | | |
| | 220 | | | Alexander & Baldwin, Inc. | | | 8,980 | | | |
| Wharehousing and Harbor Transportation Services – 0.1% | | | | | | |
| | 11,423 | | | Mundra Port and Special Economic Zone, Ltd. | | | 25,823 | | | |
| Wireless Equipment – 0.1% | | | | | | |
| | 495 | | | Crown Castle International Corp.* | | | 22,176 | | | |
| |
| |
| Total Common Stock (cost $8,047,457) | | | 7,108,446 | | | |
| |
| |
| Corporate Bonds – 11.7% | | | | | | |
| Aerospace and Defense – Equipment – 0.1% | | | | | | |
| | $34,000 | | | Exelis, Inc.
4.2500%, 10/1/16 (144A) | | | 34,306 | | | |
| Agricultural Operations – 1.1% | | | | | | |
| | 500,000 | | | Ceagro Agricola, Ltd.
10.7500%, 5/16/16 (144A) | | | 460,625 | | | |
| Airlines – 0.1% | | | | | | |
| | 30,000 | | | Southwest Airlines Co.
5.2500%, 10/1/14 | | | 32,017 | | | |
| Beverages – Non – Alcoholic – 0% | | | | | | |
| | 15,000 | | | PepsiCo, Inc.
0.8000%, 8/25/14 | | | 14,987 | | | |
| Brewery – 0.2% | | | | | | |
| | 65,000 | | | Anheuser-Busch InBev Worldwide, Inc.
3.0000%, 10/15/12 | | | 66,017 | | | |
| | 14,000 | | | Anheuser-Busch InBev Worldwide, Inc.
1.5000%, 7/14/14 | | | 14,100 | | | |
| | | | | | | | 80,117 | | | |
| Building Products – Cement and Aggregate – 0.5% | | | | | | |
| | 250,000 | | | Cemex S.A.B. de C.V.
9.0000%, 1/11/18 (144A) | | | 199,375 | | | |
| Chemicals – Diversified – 0.2% | | | | | | |
| | 30,000 | | | Dow Chemical Co.
4.8500%, 8/15/12 | | | 30,692 | | | |
| | 34,000 | | | Lyondell Chemical Co.
8.0000%, 11/1/17 | | | 37,145 | | | |
| | | | | | | | 67,837 | | | |
| Chemicals – Specialty – 0.1% | | | | | | |
| | 6,000 | | | Ashland, Inc.
9.1250%, 6/1/17 | | | 6,690 | | | |
| | 21,000 | | | Ecolab Inc.
2.3750%, 12/8/14 | | | 21,408 | | | |
| | | | | | | | 28,098 | | | |
| Coatings and Paint Products – 0.1% | | | | | | |
| | 19,000 | | | RPM International, Inc.
6.2500%, 12/15/13 | | | 20,263 | | | |
| Commercial Banks – 0.8% | | | | | | |
| | 14,000 | | | Abbey National Treasury Services PLC
2.0022%, 4/25/14‡ | | | 12,745 | | | |
| | 20,000 | | | Abbey National Treasury Services PLC
2.8750%, 4/25/14 | | | 18,645 | | | |
| | 45,000 | | | BB&T Corp.
2.0500%, 4/28/14 | | | 45,441 | | | |
| | 45,000 | | | CIT Group, Inc.
5.2500%, 4/1/14 (144A) | | | 44,831 | | | |
| | 100,000 | | | HSBC Bank PLC
1.6250%, 8/12/13 (144A) | | | 98,505 | | | |
| | 20,000 | | | Mercantile Bankshares Corp. – Series B
4.6250%, 4/15/13 | | | 20,841 | | | |
| | 100,000 | | | Nordea Bank A.B.
1.7500%, 10/4/13 (144A) | | | 97,714 | | | |
| | | | | | | | 338,722 | | | |
| Computers – Memory Devices – 0.1% | | | | | | |
| | 30,000 | | | Seagate Technology
10.0000%, 5/1/14 (144A) | | | 33,937 | | | |
See Notes to Consolidated Schedule of Investments and Financial Statements.
Janus Alternative Fund | 15
Janus Real Return Allocation Fund
Consolidated Schedule of Investments (unaudited)
As of December 31, 2011
| | | | | | | | | | | |
| Shares/Principal/Contract Amounts | | Value | | | |
| |
| Data Processing and Management – 0% | | | | | | |
| | $13,000 | | | Fiserv, Inc.
3.1250%, 10/1/15 | | $ | 13,317 | | | |
| Diversified Banking Institutions – 1.4% | | | | | | |
| | 40,000 | | | Citigroup, Inc.
5.6250%, 8/27/12 | | | 40,604 | | | |
| | 45,000 | | | Citigroup, Inc.
1.3072%, 2/15/13‡ | | | 44,161 | | | |
| | 32,000 | | | Citigroup, Inc.
4.8750%, 5/7/15 | | | 31,607 | | | |
| | 30,000 | | | Goldman Sachs Group, Inc.
4.7500%, 7/15/13 | | | 30,397 | | | |
| | 20,000 | | | Goldman Sachs Group, Inc.
3.6250%, 2/7/16 | | | 19,325 | | | |
| | 18,000 | | | JPMorgan Chase & Co.
5.7500%, 1/2/13 | | | 18,672 | | | |
| | 17,000 | | | JPMorgan Chase & Co.
4.8750%, 3/15/14 | | | 17,742 | | | |
| | 100,000 | | | Morgan Stanley
1.4081%, 4/29/13‡ | | | 94,238 | | | |
| | 12,000 | | | Morgan Stanley
2.8750%, 7/28/14 | | | 11,301 | | | |
| | 308,598 | | | Morgan Stanley
5.4000%, 5/15/15 (144A) | | | 159,242 | | | |
| | 100,000 | | | Royal Bank of Scotland PLC
4.8750%, 8/25/14 (144A) | | | 97,848 | | | |
| | | | | | | | 565,137 | | | |
| Diversified Financial Services – 0.1% | | | | | | |
| | 40,000 | | | General Electric Capital Corp.
5.4500%, 1/15/13 | | | 41,851 | | | |
| | 20,000 | | | General Electric Capital Corp.
5.9000%, 5/13/14 | | | 21,903 | | | |
| | | | | | | | 63,754 | | | |
| Diversified Minerals – 0.1% | | | | | | |
| | 25,000 | | | Teck Resources, Ltd.
10.2500%, 5/15/16 | | | 28,750 | | | |
| Diversified Operations – 0.1% | | | | | | |
| | 30,000 | | | Tyco Electronics Group S.A.
6.0000%, 10/1/12 | | | 31,053 | | | |
| Diversified Operations – Commercial Services – 0.2% | | | | | | |
| | 65,000 | | | ARAMARK Corp.
8.5000%, 2/1/15 | | | 66,625 | | | |
| Electric – Generation – 0% | | | | | | |
| | 4,000 | | | AES Corp.
7.7500%, 10/15/15 | | | 4,350 | | | |
| Electric – Integrated – 0.2% | | | | | | |
| | 45,000 | | | CMS Energy Corp.
2.7500%, 5/15/14 | | | 44,444 | | | |
| | 20,000 | | | Oncor Electric Delivery Co.
5.9500%, 9/1/13 | | | 21,400 | | | |
| | 11,000 | | | PPL WEM Holdings PLC
3.9000%, 5/1/16 (144A) | | | 11,026 | | | |
| | | | | | | | 76,870 | | | |
| Electronic Components – Semiconductors – 0.1% | | | | | | |
| | 5,000 | | | Texas Instruments, Inc.
0.8750%, 5/15/13 | | | 5,013 | | | |
| | 17,000 | | | Texas Instruments, Inc.
1.3750%, 5/15/14 | | | 17,212 | | | |
| | 11,000 | | | Texas Instruments, Inc.
2.3750%, 5/16/16 | | | 11,458 | | | |
| | | | | | | | 33,683 | | | |
| Electronic Measuring Instruments – 0% | | | | | | |
| | 15,000 | | | FLIR Systems, Inc.
3.7500%, 9/1/16 | | | 14,943 | | | |
| Electronics – Military – 0.2% | | | | | | |
| | 100,000 | | | L-3 Communications Corp. – Series B
6.3750%, 10/15/15 | | | 102,500 | | | |
| Finance – Consumer Loans – 0.1% | | | | | | |
| | 20,000 | | | SLM Corp. – Series A
5.0000%, 10/1/13 (MTN) | | | 20,000 | | | |
| Finance – Credit Card – 0.1% | | | | | | |
| | 30,000 | | | American Express Credit Co.
5.8750%, 5/2/13 (MTN) | | | 31,535 | | | |
| Finance – Investment Bankers/Brokers – 0.4% | | | | | | |
| | 35,000 | | | Jefferies Group, Inc.
3.8750%, 11/9/15 | | | 30,975 | | | |
| | 70,000 | | | Merrill Lynch & Co., Inc.
5.4500%, 7/15/14 (MTN) | | | 69,410 | | | |
| | 20,000 | | | Raymond James Financial, Inc.
4.2500%, 4/15/16 | | | 20,432 | | | |
| | 20,000 | | | TD Ameritrade Holding Corp.
2.9500%, 12/1/12 | | | 20,250 | | | |
| | 20,000 | | | TD Ameritrade Holding Corp.
4.1500%, 12/1/14 | | | 21,138 | | | |
| | | | | | | | 162,205 | | | |
| Finance – Other Services – 0% | | | | | | |
| | 4,000 | | | National Rural Utilities Cooperative Finance Corp.
5.5000%, 7/1/13 | | | 4,278 | | | |
| Food – Miscellaneous/Diversified – 0.1% | | | | | | |
| | 12,000 | | | General Mills, Inc.
1.5500%, 5/16/14 | | | 12,081 | | | |
| | 4,000 | | | Kellogg Co.
5.1250%, 12/3/12 | | | 4,157 | | | |
| | 45,000 | | | Kraft Foods, Inc.
2.6250%, 5/8/13 | | | 45,973 | | | |
| | | | | | | | 62,211 | | | |
| Industrial Gases – 0.1% | | | | | | |
| | 25,600 | | | Praxair, Inc.
4.6250%, 3/30/15 | | | 28,258 | | | |
| Life and Health Insurance – 0.2% | | | | | | |
| | 65,000 | | | Prudential Financial, Inc.
3.6250%, 9/17/12 (MTN) | | | 66,008 | | | |
| Medical Products – 0.1% | | | | | | |
| | 20,000 | | | CareFusion Corp.
4.1250%, 8/1/12 | | | 20,304 | | | |
See Notes to Consolidated Schedule of Investments and Financial Statements.
16 | DECEMBER 31, 2011
Consolidated Schedule of Investments (unaudited)
As of December 31, 2011
| | | | | | | | | | | |
| Shares/Principal/Contract Amounts | | Value | | | |
| |
| Medical – Biomedical and Genetic – 0.1% | | | | | | |
| | $25,000 | | | Amgen, Inc.
2.3000%, 6/15/16 | | $ | 25,171 | | | |
| | 15,000 | | | Gilead Sciences, Inc.
2.4000%, 12/1/14 | | | 15,270 | | | |
| | | | | | | | 40,441 | | | |
| Medical – Drugs – 0% | | | | | | |
| | 16,000 | | | Johnson & Johnson
1.2000%, 5/15/14 | | | 16,247 | | | |
| Metal – Diversified – 1.0% | | | | | | |
| | 500,000 | | | Vedanta Resources PLC
8.2500%, 6/7/21 (144A) | | | 387,500 | | | |
| Multimedia – 0.1% | | | | | | |
| | 35,000 | | | NBCUniversal Media LLC
2.1000%, 4/1/14 | | | 35,577 | | | |
| Multi-Line Insurance – 0.3% | | | | | | |
| | 20,000 | | | American International Group, Inc.
3.6500%, 1/15/14 | | | 19,424 | | | |
| | 40,000 | | | American International Group, Inc.
4.2500%, 9/15/14 | | | 38,845 | | | |
| | 50,000 | | | MetLife, Inc.
5.3750%, 12/15/12 | | | 52,035 | | | |
| | | | | | | | 110,304 | | | |
| Office Automation and Equipment – 0.1% | | | | | | |
| | 19,000 | | | Xerox Corp.
5.6500%, 5/15/13 | | | 19,946 | | | |
| Oil Companies – Exploration and Production – 0.1% | | | | | | |
| | 22,000 | | | Canadian Natural Resources, Ltd.
1.4500%, 11/14/14 | | | 22,128 | | | |
| | 28,000 | | | Petrohawk Energy Corp.
7.8750%, 6/1/15 | | | 29,820 | | | |
| | | | | | | | 51,948 | | | |
| Oil Companies – Integrated – 0.5% | | | | | | |
| | 36,000 | | | BP Capital Markets PLC
5.2500%, 11/7/13 | | | 38,612 | | | |
| | 14,000 | | | BP Capital Markets PLC
2.2480%, 11/1/16 | | | 14,089 | | | |
| | 5,000 | | | ConocoPhillips Australia Funding Co.
5.5000%, 4/15/13 | | | 5,296 | | | |
| | 200,000 | | | Petroleos de Venezuela S.A.
8.5000%, 11/2/17 (144A) | | | 150,800 | | | |
| | | | | | | | 208,797 | | | |
| Oil Refining and Marketing – 0.1% | | | | | | |
| | 20,000 | | | Valero Energy Corp.
6.8750%, 4/15/12 | | | 20,325 | | | |
| Oil – Field Services – 0.1% | | | | | | |
| | 21,000 | | | Schlumberger, Ltd
1.9500%, 9/14/16 (144A) | | | 21,247 | | | |
| Pharmacy Services – 0.1% | | | | | | |
| | 42,000 | | | Aristotle Holding, Inc.
2.7500%, 11/21/14 (144A) | | | 42,509 | | | |
| Pipelines – 0.4% | | | | | | |
| | 20,000 | | | Energy Transfer Partners L.P.
5.6500%, 8/1/12 | | | 20,433 | | | |
| | 22,000 | | | Energy Transfer Partners L.P.
6.0000%, 7/1/13 | | | 23,160 | | | |
| | 38,000 | | | Enterprise Products Operating LLC
4.6000%, 8/1/12 | | | 38,559 | | | |
| | 77,000 | | | Plains All American Pipeline L.P.
4.2500%, 9/1/12 | | | 78,545 | | | |
| | | | | | | | 160,697 | | | |
| Property Trust – 0.1% | | | | | | |
| | 30,000 | | | WEA Finance LLC / WCI Finance LLC
5.4000%, 10/1/12 (144A) | | | 30,737 | | | |
| | 12,000 | | | WT Finance Aust Pty, Ltd. / Westfield Capital / WEA Finance LLC
5.1250%, 11/15/14 (144A) | | | 12,573 | | | |
| | | | | | | | 43,310 | | | |
| Real Estate Management/Services – 0% | | | | | | |
| | 6,000 | | | ProLogis L.P.
7.6250%, 8/15/14 | | | 6,572 | | | |
| Real Estate Operating/Development – 0.8% | | | | | | |
| | 13,000 | | | Brookfield Asset Management, Inc.
7.1250%, 6/15/12 | | | 13,313 | | | |
| | 320,000 | | | Dar Al-Arkan International Sukuk Co.
10.7500%, 2/18/15 (REGS) | | | 296,000 | | | |
| | | | | | | | 309,313 | | | |
| REIT – Health Care – 0.2% | | | | | | |
| | 40,000 | | | HCP, Inc.
5.6500%, 12/15/13 | | | 42,066 | | | |
| | 25,000 | | | Senior Housing Properties Trust
8.6250%, 1/15/12 | | | 25,044 | | | |
| | 4,000 | | | Ventas Realty L.P. / Ventas Capital Corp.
6.5000%, 6/1/16 | | | 4,124 | | | |
| | | | | | | | 71,234 | | | |
| REIT – Hotels – 0.1% | | | | | | |
| | 55,000 | | | Host Hotels & Resorts L.P. – Series R
6.8750%, 11/1/14 | | | 56,100 | | | |
| REIT – Office Property – 0% | | | | | | |
| | 18,000 | | | Reckson Operating Partnership L.P.
6.0000%, 3/31/16 | | | 18,676 | | | |
| REIT – Regional Malls – 0.3% | | | | | | |
| | 65,000 | | | Rouse Co. L.P.
7.2000%, 9/15/12 | | | 66,056 | | | |
| | 40,000 | | | Rouse Co. L.P. / TRC Co-Issuer, Inc.
6.7500%, 5/1/13 (144A) | | | 40,350 | | | |
| | | | | | | | 106,406 | | | |
| Retail – Drug Store – 0% | | | | | | |
| | 2,000 | | | Walgreen Co.
4.8750%, 8/1/13 | | | 2,134 | | | |
| Retail – Restaurants – 0.1% | | | | | | |
| | 20,000 | | | Brinker International
5.7500%, 6/1/14 | | | 21,095 | | | |
See Notes to Consolidated Schedule of Investments and Financial Statements.
Janus Alternative Fund | 17
Janus Real Return Allocation Fund
Consolidated Schedule of Investments (unaudited)
As of December 31, 2011
| | | | | | | | | | | |
| Shares/Principal/Contract Amounts | | Value | | | |
| |
| Super – Regional Banks – US – 0.1% | | | | | | |
| | $14,000 | | | SunTrust Banks, Inc.
3.5000%, 1/20/17 | | $ | 14,072 | | | |
| | 13,000 | | | US Bancorp
2.2000%, 11/15/16 (MTN) | | | 13,125 | | | |
| | | | | | | | 27,197 | | | |
| Telecommunication Services – 0.1% | | | | | | |
| | 40,000 | | | Qwest Corp.
7.5000%, 10/1/14 | | | 44,057 | | | |
| Telephone – Integrated – 0% | | | | | | |
| | 18,000 | | | Qwest Communications International, Inc.
7.5000%, 2/15/14 | | | 18,068 | | | |
| Transportation – Railroad – 0.1% | | | | | | |
| | 60,000 | | | Kansas City Southern Railway
8.0000%, 6/1/15 | | | 63,675 | | | |
| Transportation – Services – 0.1% | | | | | | |
| | 36,000 | | | Asciano Finance, Ltd.
3.1250%, 9/23/15 (144A) | | | 34,814 | | | |
| |
| |
| Total Corporate Bonds (cost $4,947,957) | | | 4,644,254 | | | |
| |
| |
| Exchange-Traded Funds – 1.5% | | | | | | |
| | 54,200 | | | BOCI-Prudential – W.I.S.E. – CSI China Tracker Fund (ETF)* | | | 192,958 | | | |
| | 923 | | | iShares JPMorgan USD Emerging Markets Bond Fund (ETF) | | | 101,299 | | | |
| | 3,825 | | | iShares MSCI Taiwan Index Fund (ETF) | | | 44,791 | | | |
| | 6,223 | | | Vanguard MSCI Emerging Markets (ETF) | | | 237,781 | | | |
| |
| |
| Total Exchange-Traded Funds (cost $619,675) | | | 576,829 | | | |
| |
| |
| Preferred Stock – 0% | | | | | | |
| REIT – Regional Malls – 0% | | | | | | |
| | 750 | | | CBL & Associates Properties, Inc. – Series D,
7.3750% (cost $18,272) | | | 17,760 | | | |
| |
| |
| Purchased Options – Calls – 0.1% | | | | | | |
| | 1 | | | BOVESPA Index
expires January 2012
exercise price $63,063.00 | | | 90 | | | |
| | 620 | | | Chaoda Modern Agriculture
expires January 2012
exercise price
3.70 HKD | | | 0 | | | |
| | 130,000 | | | Chaoda Modern Agriculture
expires March 2012
exercise price
1.98 HKD | | | 0 | | | |
| | 7 | | | S&P 500 E-Mini Index
expires January 2012
exercise price $1,200.00 | | | 21,700 | | | |
| |
| |
| Total Purchased Options – Calls (premiums paid $23,624) | | | 21,790 | | | |
| |
| |
| Purchased Options – Puts – 0.1% | | | | | | |
| | 7 | | | OTC EUR versus USD
expires March 2012
exercise price $1,300.00 | | | 29,925 | | | |
| | 10 | | | S&P 500 E-Mini Index
expires January 2012
exercise price $1,200.00 | | | 4,750 | | | |
| |
| |
| Total Purchased Options – Puts (premiums paid $32,924) | | | 34,675 | | | |
| |
| |
| U.S. Treasury Notes/Bonds – 51.5% | | | | | | |
| | | | | U.S. Treasury Notes/Bonds: | | | | | | |
| | 2,500,000 | | | 0.0000%, 2/23/12** | | | 2,499,948 | | | |
| | 124,000 | | | 0.6250%, 6/30/12** | | | 124,344 | | | |
| | 32,000 | | | 0.6250%, 12/31/12** | | | 32,150 | | | |
| | 120,000 | | | 0.6250%, 2/28/13** | | | 120,623 | | | |
| | 78,000 | | | 1.7500%, 4/15/13** | | | 79,548 | | | |
| | 15,000 | | | 1.1250%, 6/15/13** | | | 15,197 | | | |
| | 24,000 | | | 0.1250%, 9/30/13** | | | 23,952 | | | |
| | 65,000 | | | 1.2500%, 2/15/14** | | | 66,336 | | | |
| | 20,000 | | | 1.2500%, 3/15/14** | | | 20,423 | | | |
| | 2,000 | | | 0.5000%, 8/15/14** | | | 2,009 | | | |
| | 41,000 | | | 1.0000%, 8/31/16** | | | 41,448 | | | |
| | 100,000 | | | 1.0000%, 10/31/16** | | | 100,969 | | | |
| | 40,000 | | | 0.8750%, 11/30/16** | | | 40,122 | | | |
| | 15,525,450 | | | 1.1250%, 1/15/21**çç | | | 17,314,510 | | | |
| |
| |
| Total U.S. Treasury Notes/Bonds (cost $19,186,279) | | | 20,481,579 | | | |
| |
| |
| Money Market – 22.5% | | | | | | |
| | 8,954,042 | | | Janus Cash Liquidity Fund LLC, 0% (cost $8,954,042)** | | | 8,954,042 | | | |
| |
| |
| Total Investments (cost $41,830,230) – 105.3% | | | 41,839,375 | | | |
| |
| |
| Cash, Receivables and Other Assets, net of Liabilities – (5.3)% | | | (2,093,442) | | | |
| |
| |
| Net Assets – 100% | | $ | 39,745,933 | | | |
| |
| |
See Notes to Consolidated Schedule of Investments and Financial Statements.
18 | DECEMBER 31, 2011
Consolidated Schedule of Investments (unaudited)
As of December 31, 2011
Summary of Investments by Country – (Long Positions)
| | | | | | | | | |
| | | | | | % of Investment
| |
| Country | | Value | | | Securities | |
| |
| |
| Australia | | $ | 372,962 | | | | 0.9% | |
| Austria | | | 42,690 | | | | 0.1% | |
| Bahrain | | | 17,872 | | | | 0.0% | |
| Brazil | | | 1,213,893 | | | | 2.9% | |
| Canada | | | 520,693 | | | | 1.2% | |
| Cayman Islands | | | 436,246 | | | | 1.0% | |
| China | | | 483,005 | | | | 1.2% | |
| Colombia | | | 11,798 | | | | 0.0% | |
| France | | | 46,201 | | | | 0.1% | |
| Hong Kong | | | 676,124 | | | | 1.6% | |
| India | | | 268,777 | | | | 0.6% | |
| Indonesia | | | 38,817 | | | | 0.1% | |
| Israel | | | 48,235 | | | | 0.1% | |
| Japan | | | 204,176 | | | | 0.5% | |
| Jersey | | | 64,908 | | | | 0.2% | |
| Kenya | | | 12,733 | | | | 0.0% | |
| Luxembourg | | | 104,158 | | | | 0.3% | |
| Mexico | | | 295,004 | | | | 0.7% | |
| Netherlands | | | 33,431 | | | | 0.1% | |
| Qatar | | | 42,768 | | | | 0.1% | |
| Russia | | | 192,865 | | | | 0.5% | |
| Singapore | | | 417,756 | | | | 1.0% | |
| South Africa | | | 72,441 | | | | 0.2% | |
| South Korea | | | 251,509 | | | | 0.6% | |
| Spain | | | 110,896 | | | | 0.3% | |
| Sweden | | | 105,287 | | | | 0.3% | |
| Switzerland | | | 60,184 | | | | 0.1% | |
| Taiwan | | | 197,871 | | | | 0.5% | |
| Thailand | | | 19,456 | | | | 0.0% | |
| United Arab Emirates | | | 122,825 | | | | 0.3% | |
| United Kingdom | | | 979,736 | | | | 2.3% | |
| United States†† | | | 34,223,258 | | | | 81.8% | |
| Venezuela | | | 150,800 | | | | 0.4% | |
| |
| |
| Total | | $ | 41,839,375 | | | | 100.0% | |
| | | |
| †† | | Includes Cash Equivalents (60.4% excluding Cash Equivalents). |
Forward Currency Contracts, Open
| | | | | | | | | | | | | |
| | | Currency
| | | | | | Unrealized
| |
| | | Units Sold/
| | | Currency
| | | Appreciation/
| |
| Counterparty/Currency Sold/(Purchased) and Settlement Date | | (Purchased) | | | Value U.S.$ | | | (Depreciation) | |
| |
| |
| Credit Suisse Securities (USA) LLC: | | | | | | | | | | | | |
| Australian Dollar 1/19/12 | | | 4,000 | | | $ | 4,084 | | | $ | 134 | |
| Australian Dollar 1/19/12 | | | 3,500 | | | | 3,574 | | | | 94 | |
| Australian Dollar 1/19/12 | | | 4,000 | | | | 4,084 | | | | 56 | |
| Australian Dollar 1/19/12 | | | (2,000) | | | | 2,042 | | | | (3) | |
| Australian Dollar 1/19/12 | | | (69,000) | | | | 70,453 | | | | (142) | |
| Australian Dollar 1/19/12 | | | (6,000) | | | | 6,126 | | | | (52) | |
| |
| |
| Total | | | | | | $ | 90,363 | | | $ | 87 | |
| | | | | | | |
| |
| |
| Financial Futures – Long |
| 13 Contracts | | Natural Gas Futures
expires March 2012, principal amount
$449,226, value $392,080,
cumulative depreciation | | $ | (57,146) | |
| 3 Contracts | | Platinum Futures
expires April 2012, principal amount
$215,156, value $210,735,
cumulative depreciation | | | (4,421) | |
| 112 Contracts | | U.S. Treasury Note 10 year
expires March 2012, principal amount
$14,515,956, value $14,686,000,
cumulative appreciation | | | 170,044 | |
| |
| |
| Total Financial Futures – Long | | $ | 108,477 | |
| |
| |
| Financial Futures – Short |
| 2 Contracts | | Brent Crude Futures
expires February 2012, principal amount
$217,634, value $214,760,
cumulative appreciation | | $ | 2,874 | |
| 33 Contracts | | Euro Futures
expires March 2012, principal amount
$5,380,360, value $5,349,300,
cumulative appreciation | | | 31,060 | |
| 2 Contracts | | Light Sweet Crude Oil Futures
expires February 2012, principal amount
$196,593, value $197,660,
cumulative depreciation | | | (1,067) | |
| 10 Contracts | | U.S. Treasury Bond Ultra Long
expires March 2012, principal amount
$1,578,257, value $1,601,875,
cumulative depreciation | | | (23,618) | |
| |
| |
| Total Financial Futures – Short | | $ | 9,249 | |
| |
| |
| | | | | |
| Schedule of Written Options – Puts | | Value | |
| | |
Avalonbay Communities, Inc.
expires January 2012
8 contracts
exercise price $95.00 | | $ | (2) | |
Simon Property Group, Inc.
expires January 2012
12 contracts
exercise price $90.00 | | | (77) | |
| |
| |
Total Written Options – Puts
(premiums received $2,940) | | $ | (79) | |
| |
| |
See Notes to Consolidated Schedule of Investments and Financial Statements.
Janus Alternative Fund | 19
Janus Real Return Allocation Fund
Consolidated Schedule of Investments (unaudited)
As of December 31, 2011
Credit Default Swaps outstanding as of December 31, 2011
| | | | | | | | | | | | | | | | | | | | | | | | | | | | | |
| | | | | | | | | | | | | | | | | | | | | Credit Rating
| |
Counterparty and
| | | | | | | | | | | Upfront
| | | | | | Unrealized
| | | of Referenced
| |
Reference
| | Fixed Deal (Pay)
| | | Notional
| | | Market
| | | Premium (Paid)
| | | Termination
| | | Appreciation/
| | | Obligation†
| |
| Entity | | Receive Rate | | | Amount | | | Value | | | Received | | | Date | | | (Depreciation) | | | (unaudited) | |
| | |
| |
| UBS A.G. Federal Republic of Germany | | | (0.25) | | | $ | 700,000 | | | $ | 24,664 | | | $ | 22,787 | | | | 12/20/16 | | | $ | 1,877 | | | | Aaa | |
| UBS A.G. French Republic | | | (0.25) | | | | 1,000,000 | | | | 76,158 | | | | 20,857 | | | | 6/20/16 | | | | 55,301 | | | | Aaa | |
| UBS A.G. Russian Federation | | | 1.00 | | | | 1,000,000 | | | | (69,057) | | | | (15,520) | | | | 6/20/16 | | | | (53,537) | | | | Baa1 | |
| |
| |
| Total | | | | | | | | | | $ | 31,765 | | | $ | 28,124 | | | | | | | $ | 3,641 | | | | | |
| |
| |
| | | |
| † | | Credit Rating as issued by Moody’s. |
Interest Rate Swaps outstanding at December 31, 2011
| | | | | | | | | | | | | | | | |
| | | Notional
| | | Return Paid
| | Return Received
| | | | Unrealized
|
| Counterparty | | Amount | | | by the Fund | | by the Fund | | Termination Date | | Depreciation |
| |
| UBS A.G. | | $ | 13,000,000 | | | | 3.10 | | | 3-Month Libor | | 6/17/21 | | $ | (1,286,618) |
| |
| |
Total Return Swaps outstanding at December 31, 2011
| | | | | | | | | | | | | | | | |
| | | | | | | | | | | | Unrealized
|
| | | Notional
| | | Return Paid
| | Return Received
| | | | Appreciation/
|
| Counterparty | | Amount | | | by the Fund | | by the Fund | | Termination Date | | (Depreciation) |
| |
| Credit Suisse | | $ | 46,470 | | | | 1-Month LIBOR plus 75
basis points | | | Samba Financial Group | | 6/19/12 | | $ | 402 |
| Morgan Stanley & Co. International plc | | | 60,205 | | | | FED Funds Effective
plus 185 basis points | | | Baoshan Iron & Steel
Co., Ltd. | | 5/16/13 | | | (12,689) |
| Morgan Stanley & Co. International plc | | | 79,058 | | | | FED Funds Effective
plus 185 basis points | | | China Construction
Bank Corp. | | 5/16/13 | | | (6,015) |
| Morgan Stanley & Co. International plc | | | 39,361 | | | | FED Funds Effective
plus 100 basis points | | | India Blue Chip | | 8/27/13 | | | (7,402) |
| Morgan Stanley & Co. International plc | | | 41,748 | | | | FED Funds Effective
plus 50 basis points | | | Korea Blue Chip | | 8/27/13 | | | 1,012 |
| UBS A.G. | | | 2,890,739 | | | | Dow Jones-UBS
Commodity Index
plus 15 basis points | | | Dow Jones-UBS
Commodity Index | | 1/17/12 | | | 90,739 |
| |
| |
| Total | | | | | | | | | | | | | | $ | 66,047 |
| |
| |
Zero Coupon Swap outstanding at December 31, 2011
| | | | | | | | | | | | | | | | | | | | | | | | | |
| | | Notional
| | | Floating Rate
| | | Pay/Receivable
| | | | | | Premium Paid
| | | Unrealized
| |
| Counterparty | | Amount | | | Index | | | Floating Rate | | | Termination Date | | | (Received) | | | Depreciation | |
| | |
| UBS A.G. | | $ | 20,000,000 | | | | Consumer Price Index | | | | Receive | | | | 5/18/15 | | | | – | | | $ | (445,282 | ) |
| |
| |
See Notes to Consolidated Schedule of Investments and Financial Statements.
20 | DECEMBER 31, 2011
Consolidated Statement of Assets and Liabilities
| | | | | |
As of December 31, 2011 (unaudited)
| | Janus Real Return
|
| (all numbers in thousands except net asset value per share) | | Allocation Fund |
|
| |
| Assets: | | | | |
| Investments at cost | | $ | 41,830 | |
| Unaffiliated investments at value | | $ | 32,885 | |
| Affiliated investments at value | | | 8,954 | |
| Cash | | | 12 | |
| Cash denominated in foreign currency(1) | | | 16 | |
| Restricted cash (Note 1) | | | 183 | |
| Receivables: | | | | |
| Fund shares sold | | | 10 | |
| Dividends | | | 18 | |
| Foreign dividend tax reclaim | | | – | |
| Interest | | | 152 | |
| Outstanding swap contracts at value | | | 193 | |
| Dividends and interest on swap contracts | | | – | |
| Non-interested Trustees’ deferred compensation | | | 1 | |
| Variation margin | | | 22 | |
| Forward currency contracts | | | – | |
| Total Assets | | | 42,446 | |
| Liabilities: | | | | |
| Payables: | | | | |
| Options written, at value(2) | | | – | |
| Outstanding swap contracts at value | | | 1,827 | |
| Investments purchased | | | 104 | |
| Fund shares repurchased | | | 12 | |
| Dividends and interest on swap contracts | | | 11 | |
| Advisory fees | | | 207 | |
| Due to adviser | | | 107 | |
| Administrative services fees | | | 3 | |
| Distribution fees and shareholder servicing fees | | | 8 | |
| Administrative, networking and omnibus fees | | | – | |
| Non-interested Trustees’ fees and expenses | | | 10 | |
| Non-interested Trustees’ deferred compensation fees | | | 1 | |
| Foreign tax liability | | | 1 | |
| Accrued expenses and other payables | | | 409 | |
| Forward currency contracts | | | – | |
| Total Liabilities | | | 2,700 | |
| Net Assets | | $ | 39,746 | |
See footnotes at the end of the Statement.
See Notes to Financial Statements.
Janus Alternative Fund | 21
| | | | | |
As of December 31, 2011 (unaudited)
| | Janus Real Return
|
| (all numbers in thousands except net asset value per share) | | Allocation Fund |
|
| |
| Net Assets Consist of: | | | | |
| Capital (par value and paid-in surplus)* | | $ | 42,279 | |
| Undistributed net investment income* | | | 104 | |
| Undistributed net realized loss from investments and foreign currency transactions* | | | (1,103) | |
| Unrealized depreciation of investments, foreign currency translations and non-interested Trustees’ deferred compensation | | | (1,534) | |
| Total Net Assets | | $ | 39,746 | |
| Net Assets — Class A Shares | | $ | 6,682 | |
| Shares Outstanding, $0.01 Par Value (unlimited shares authorized) | | | 710 | |
Net Asset Value Per Share(3) | | $ | 9.41 | |
Maximum Offering Price Per Share(4) | | $ | 9.98 | |
| Net Assets — Class C Shares | | $ | 6,305 | |
| Shares Outstanding, $0.01 Par Value (unlimited shares authorized) | | | 673 | |
Net Asset Value Per Share(3) | | $ | 9.37 | |
| Net Assets — Class D Shares | | $ | 7,398 | |
| Shares Outstanding, $0.01 Par Value (unlimited shares authorized) | | | 786 | |
| Net Asset Value Per Share | | $ | 9.41 | |
| Net Assets — Class I Shares | | $ | 6,583 | |
| Shares Outstanding, $0.01 Par Value (unlimited shares authorized) | | | 699 | |
| Net Asset Value Per Share | | $ | 9.42 | |
| Net Assets — Class S Shares | | $ | 6,321 | |
| Shares Outstanding, $0.01 Par Value (unlimited shares authorized) | | | 673 | |
| Net Asset Value Per Share | | $ | 9.39 | |
| Net Assets — Class T Shares | | $ | 6,457 | |
| Shares Outstanding, $0.01 Par Value (unlimited shares authorized) | | | 686 | |
| Net Asset Value Per Share | | $ | 9.41 | |
| | | |
| * | | See Note 6 in Notes to Financial Statements. |
| (1) | | Includes cost of $16,989. |
| (2) | | Includes premiums of $2,940 on written options. |
| (3) | | Redemption price per share may be reduced for any applicable contingent deferred sales charge. |
| (4) | | Maximum offering price is computed at 100/94.25 of net asset value. |
See Notes to Financial Statements.
22 | DECEMBER 31, 2011
Consolidated Statement of Operations
| | | | | |
For the six-month period ended
| | |
December 31, 2011 (unaudited)
| | Janus Real Return
|
| (all numbers in thousands) | | Allocation Fund |
|
| |
| Investment Income: | | | | |
| Interest | | $ | 305 | |
| Dividends | | | 114 | |
| Dividends from affiliate | | | 4 | |
| Foreign tax withheld | | | (8) | |
| Total Investment Income | | | 415 | |
| Expenses: | | | | |
| Advisory fees | | | 153 | |
| Shareholder reports expenses | | | 23 | |
| Transfer agent fees and expenses | | | 12 | |
| Registration fees | | | 150 | |
| Custodian fees | | | 20 | |
| Professional fees | | | 170 | |
| Non-interested Trustees’ fees and expenses | | | 8 | |
| Administrative services fees - Class D Shares | | | 4 | |
| Administrative services fees - Class S Shares | | | 8 | |
| Administrative services fees - Class T Shares | | | 8 | |
| Distribution fees and shareholder servicing fees - Class A Shares | | | 9 | |
| Distribution fees and shareholder servicing fees - Class C Shares | | | 32 | |
| Distribution fees and shareholder servicing fees - Class S Shares | | | 8 | |
| Administrative, networking and omnibus fees - Class A Shares | | | – | |
| Administrative, networking and omnibus fees - Class C Shares | | | – | |
| Administrative, networking and omnibus fees - Class I Shares | | | – | |
| Other expenses | | | 134 | |
| Total Expenses | | | 739 | |
| Expense and Fee Offset | | | – | |
| Net Expenses | | | 739 | |
| Less: Excess Expense Reimbursement | | | (458) | |
| Net Expenses after Expense Reimbursement | | | 281 | |
| Net Investment Income | | | 134 | |
| Net Realized and Unrealized Gain/(Loss) on Investments: | | | | |
| Net realized loss from investment and foreign currency transactions | | | (184) | |
| Net realized gain from futures contracts | | | 591 | |
| Net realized loss from swap contracts | | | (916) | |
| Net realized loss from written options contracts | | | (6) | |
| Change in unrealized net appreciation/(depreciation) of investments, foreign currency translations and non-interested Trustees’ deferred compensation | | | 71 | |
| Change in unrealized net appreciation/(depreciation) of futures contracts | | | 114 | |
| Change in unrealized net appreciation/(depreciation) of swap contracts | | | (1,780) | |
| Change in unrealized net appreciation/(depreciation) of written option contacts | | | 30 | |
| Net Loss on Investments | | | (2,080) | |
| Net Decrease in Net Assets Resulting from Operations | | $ | (1,946) | |
See Notes to Financial Statements.
Janus Alternative Fund | 23
Consolidated Statement of Changes in Net Assets
| | | | | | | | | |
For the six-month period ended December 31, 2011 (unaudited) and
| | | | |
the fiscal period ended June 30, 2011
| | Janus Real Return Allocation Fund |
| (all numbers in thousands) | | 2011 | | 2011(1) |
|
| |
| Operations: | | | | | | | | |
| Net investment income | | $ | 134 | | | $ | 166 | |
Net realized loss from investment and foreign currency transactions(2) | | | (515) | | | | (400) | |
| Change in unrealized net appreciation/(depreciation) of investments, foreign currency translations and non-interested Trustees’ deferred compensation | | | (1,565) | | | | 31 | |
| Net Decrease in Net Assets Resulting from Operations | | | (1,946) | | | | (203) | |
| Dividends and Distributions to Shareholders: | | | | | | | | |
| Net investment income | | | | | | | | |
| Class A Shares | | | (29) | | | | – | |
| Class C Shares | | | (21) | | | | – | |
| Class D Shares | | | (30) | | | | – | |
| Class I Shares | | | (31) | | | | – | |
| Class S Shares | | | (25) | | | | – | |
| Class T Shares | | | (28) | | | | – | |
| Net realized gain/(loss) from investment transactions | | | | | | | | |
| Class A Shares | | | (35) | | | | – | |
| Class C Shares | | | (33) | | | | – | |
| Class D Shares | | | (39) | | | | – | |
| Class I Shares | | | (34) | | | | – | |
| Class S Shares | | | (33) | | | | – | |
| Class T Shares | | | (34) | | | | – | |
| Net Decrease from Dividends and Distributions | | | (372) | | | | – | |
| Capital Share Transactions: | | | | | | | | |
| Shares Sold | | | | | | | | |
| Class A Shares | | | 1,196 | | | | 6,693 | |
| Class C Shares | | | 17 | | | | 6,667 | |
| Class D Shares | | | 983 | | | | 6,987 | |
| Class I Shares | | | 97 | | | | 6,826 | |
| Class S Shares | | | 1 | | | | 6,667 | |
| Class T Shares | | | 127 | | | | 6,674 | |
| Reinvested Dividends and Distributions | | | | | | | | |
| Class A Shares | | | 64 | | | | – | |
| Class C Shares | | | 54 | | | | – | |
| Class D Shares | | | 69 | | | | – | |
| Class I Shares | | | 65 | | | | – | |
| Class S Shares | | | 58 | | | | – | |
| Class T Shares | | | 62 | | | | – | |
| Shares Repurchased | | | | | | | | |
| Class A Shares | | | (831) | | | | – | |
| Class C Shares | | | (11) | | | | – | |
| Class D Shares | | | (193) | | | | – | |
| Class I Shares | | | (4) | | | | – | |
| Class S Shares | | | – | | | | – | |
| Class T Shares | | | (1) | | | | – | |
| Net Increase from Capital Share Transactions | | | 1,753 | | | | 40,514 | |
| Net Increase/Decrease in Net Assets | | | (565) | | | | 40,311 | |
| Net Assets: | | | | | | | | |
| Beginning of period | | | 40,311 | | | | – | |
| End of period | | $ | 39,746 | | | $ | 40,311 | |
| Undistributed Net Investment Income* | | $ | 104 | | | $ | 134 | |
| | | |
| * | | See Note 6 in Notes to Financial Statements. |
| (1) | | Period from May 13, 2011 (inception date) through June 30, 2011. |
| (2) | | Certain prior year amounts have been reclassified to conform with current year presentation. |
See Notes to Financial Statements.
24 | DECEMBER 31, 2011
Financial Highlights
Class A Shares
| | | | | | | | | | | |
For a share outstanding during the six-month period ended December 31, 2011
| | Janus Real Return Allocation Fund | | |
| (unaudited) and the fiscal period ended June 30, 2011 | | 2011 | | 2011(1) | | |
| |
| Net Asset Value, Beginning of Period | | | $9.95 | | | | $10.00 | | | |
| Income from Investment Operations: | | | | | | | | | | |
| Net investment income | | | .03 | | | | .04 | | | |
| Net loss on investments (both realized and unrealized) | | | (.48) | | | | (.09) | | | |
| Total from Investment Operations | | | (.45) | | | | (.05) | | | |
| Less Distributions: | | | | | | | | | | |
| Dividends (from net investment income)* | | | (.04) | | | | – | | | |
| Distributions (from capital gains)* | | | (.05) | | | | – | | | |
| Total Distributions | | | (.09) | | | | – | | | |
| Net Asset Value, End of Period | | | $9.41 | | | | $9.95 | | | |
| Total Return** | | | (4.51)% | | | | (.50)% | | | |
| Net Assets, End of Period (in thousands) | | | $6,682 | | | | $6,660 | | | |
| Average Net Assets for the Period (in thousands) | | | $7,011 | | | | $6,635 | | | |
Ratio of Gross Expenses to Average Net Assets***(2) | | | 1.27% | | | | 1.27% | | | |
Ratio of Net Expenses to Average Net Assets***(2) | | | 1.27% | | | | 1.27% | | | |
| Ratio of Net Investment Income to Average Net Assets*** | | | 0.77% | | | | 3.21% | | | |
| Portfolio Turnover Rate*** | | | 45% | | | | 43% | | | |
Class C Shares
| | | | | | | | | | | |
For a share outstanding during the six-month period ended December 31, 2011
| | Janus Real Return Allocation Fund | | |
| (unaudited) and the fiscal period ended June 30, 2011 | | 2011 | | 2011(1) | | |
| |
| Net Asset Value, Beginning of Period | | | $9.94 | | | | $10.00 | | | |
| Income from Investment Operations: | | | | | | | | | | |
| Net investment income | | | .02 | | | | .03 | | | |
| Net loss on investments (both realized and unrealized) | | | (.51) | | | | (.09) | | | |
| Total from Investment Operations | | | (.49) | | | | (.06) | | | |
| Less Distributions: | | | | | | | | | | |
| Dividends (from net investment income)* | | | (.03) | | | | – | | | |
| Distributions (from capital gains)* | | | (.05) | | | | – | | | |
| Total Distributions | | | (.08) | | | | – | | | |
| Net Asset Value, End of Period | | | $9.37 | | | | $9.94 | | | |
| Total Return** | | | (4.92)% | | | | (.60)% | | | |
| Net Assets, End of Period (in thousands) | | | $6,305 | | | | $6,627 | | | |
| Average Net Assets for the Period (in thousands) | | | $6,447 | | | | $6,616 | | | |
Ratio of Gross Expenses to Average Net Assets***(2) | | | 2.02% | | | | 2.02% | | | |
Ratio of Net Expenses to Average Net Assets***(2) | | | 2.02% | | | | 2.02% | | | |
| Ratio of Net Investment Income to Average Net Assets*** | | | 0.03% | | | | 2.46% | | | |
| Portfolio Turnover Rate*** | | | 45% | | | | 43% | | | |
| | | |
| * | | See Note 6 in Notes to Financial Statements. |
| ** | | Total return not annualized for periods of less than one full year. |
| *** | | Annualized for periods of less than one full year. |
| (1) | | Period from May 13, 2011 (inception date) through June 30, 2011. |
| (2) | | See Note 7 in Notes to Financial Statements. |
See Notes to Financial Statements.
Janus Alternative Fund | 25
Financial Highlights (continued)
Class D Shares
| | | | | | | | | | | |
For a share outstanding during the six-month period ended December 31, 2011
| | Janus Real Return Allocation Fund | | |
| (unaudited) and the fiscal period ended June 30, 2011 | | 2011 | | 2011(1) | | |
| |
| Net Asset Value, Beginning of Period | | | $9.95 | | | | $10.00 | | | |
| Income from Investment Operations: | | | | | | | | | | |
| Net investment income | | | .03 | | | | .04 | | | |
| Net loss on investments (both realized and unrealized) | | | (.48) | | | | (.09) | | | |
| Total from Investment Operations | | | (.45) | | | | (.05) | | | |
| Less Distributions: | | | | | | | | | | |
| Dividends (from net investment income)* | | | (.04) | | | | – | | | |
| Distributions (from capital gains)* | | | (.05) | | | | – | | | |
| Total Distributions | | | (.09) | | | | – | | | |
| Net Asset Value, End of Period | | | $9.41 | | | | $9.95 | | | |
| Total Return** | | | (4.54)% | | | | (.50)% | | | |
| Net Assets, End of Period (in thousands) | | | $7,398 | | | | $6,954 | | | |
| Average Net Assets for the Period (in thousands) | | | $7,300 | | | | $6,832 | | | |
Ratio of Gross Expenses to Average Net Assets***(2) | | | 1.24% | | | | 1.25% | | | |
Ratio of Net Expenses to Average Net Assets***(2) | | | 1.24% | | | | 1.25% | | | |
| Ratio of Net Investment Income to Average Net Assets*** | | | 0.79% | | | | 3.24% | | | |
| Portfolio Turnover Rate*** | | | 45% | | | | 43% | | | |
Class I Shares
| | | | | | | | | | | |
For a share outstanding during the six-month period ended December 31, 2011
| | Janus Real Return Allocation Fund | | |
| (unaudited) and the fiscal period ended June 30, 2011 | | 2011 | | 2011(1) | | |
| |
| Net Asset Value, Beginning of Period | | | $9.95 | | | | $10.00 | | | |
| Income from Investment Operations: | | | | | | | | | | |
| Net investment income | | | .03 | | | | .05 | | | |
| Net loss on investments (both realized and unrealized) | | | (.47) | | | | (.10) | | | |
| Total from Investment Operations | | | (.44) | | | | (.05) | | | |
| Less Distributions: | | | | | | | | | | |
| Dividends (from net investment income)* | | | (.04) | | | | – | | | |
| Distributions (from capital gains)* | | | (.05) | | | | – | | | |
| Total Distributions | | | (.09) | | | | – | | | |
| Net Asset Value, End of Period | | | $9.42 | | | | $9.95 | | | |
| Total Return** | | | (4.38)% | | | | (.50)% | | | |
| Net Assets, End of Period (in thousands) | | | $6,583 | | | | $6,797 | | | |
| Average Net Assets for the Period (in thousands) | | | $6,683 | | | | $6,658 | | | |
Ratio of Gross Expenses to Average Net Assets***(2) | | | 1.02% | | | | 1.02% | | | |
Ratio of Net Expenses to Average Net Assets***(2) | | | 1.02% | | | | 1.02% | | | |
| Ratio of Net Investment Income to Average Net Assets*** | | | 1.03% | | | | 3.47% | | | |
| Portfolio Turnover Rate*** | | | 45% | | | | 43% | | | |
| | | |
| * | | See Note 6 in Notes to Financial Statements. |
| ** | | Total return not annualized for periods of less than one full year. |
| *** | | Annualized for periods of less than one full year. |
| (1) | | Period from May 13, 2011 (inception date) through June 30, 2011. |
| (2) | | See Note 7 in Notes to Financial Statements. |
See Notes to Financial Statements.
26 | DECEMBER 31, 2011
Class S Shares
| | | | | | | | | | | |
For a share outstanding during the six-month period ended December 31, 2011
| | Janus Real Return Allocation Fund | | |
| (unaudited) and the fiscal period ended June 30, 2011 | | 2011 | | 2011(1) | | |
| |
| Net Asset Value, Beginning of Period | | | $9.95 | | | | $10.00 | | | |
| Income from Investment Operations: | | | | | | | | | | |
| Net investment income | | | .03 | | | | .04 | | | |
| Net loss on investments (both realized and unrealized) | | | (.50) | | | | (.09) | | | |
| Total from Investment Operations | | | (.47) | | | | (.05) | | | |
| Less Distributions: | | | | | | | | | | |
| Dividends (from net investment income)* | | | (.04) | | | | – | | | |
| Distributions (from capital gains)* | | | (.05) | | | | – | | | |
| Total Distributions | | | (.09) | | | | – | | | |
| Net Asset Value, End of Period | | | $9.39 | | | | $9.95 | | | |
| Total Return** | | | (4.75)% | | | | (.50)% | | | |
| Net Assets, End of Period (in thousands) | | | $6,321 | | | | $6,632 | | | |
| Average Net Assets for the Period (in thousands) | | | $6,450 | | | | $6,618 | | | |
Ratio of Gross Expenses to Average Net Assets***(2) | | | 1.52% | | | | 1.52% | | | |
Ratio of Net Expenses to Average Net Assets***(2) | | | 1.52% | | | | 1.52% | | | |
| Ratio of Net Investment Income to Average Net Assets*** | | | 0.53% | | | | 2.96% | | | |
| Portfolio Turnover Rate*** | | | 45% | | | | 43% | | | |
Class T Shares
| | | | | | | | | | | |
For a share outstanding during the six-month period ended December 31, 2011
| | Janus Real Return Allocation Fund | | |
| (unaudited) and the fiscal period ended June 30, 2011 | | 2011 | | 2011(1) | | |
| |
| Net Asset Value, Beginning of Period | | | $9.95 | | | | $10.00 | | | |
| Income from Investment Operations: | | | | | | | | | | |
| Net investment income | | | .03 | | | | .04 | | | |
| Net loss on investments (both realized and unrealized) | | | (.48) | | | | (.09) | | | |
| Total from Investment Operations | | | (.45) | | | | (.05) | | | |
| Less Distributions: | | | | | | | | | | |
| Dividends (from net investment income)* | | | (.04) | | | | – | | | |
| Distributions (from capital gains)* | | | (.05) | | | | – | | | |
| Total Distributions | | | (.09) | | | | – | | | |
| Net Asset Value, End of Period | | | $9.41 | | | | $9.95 | | | |
| Total Return** | | | (4.51)% | | | | (.50)% | | | |
| Net Assets, End of Period (in thousands) | | | $6,457 | | | | $6,641 | | | |
| Average Net Assets for the Period (in thousands) | | | $6,565 | | | | $6,623 | | | |
Ratio of Gross Expenses to Average Net Assets***(2) | | | 1.27% | | | | 1.27% | | | |
Ratio of Net Expenses to Average Net Assets***(2) | | | 1.27% | | | | 1.27% | | | |
| Ratio of Net Investment Income to Average Net Assets*** | | | 0.78% | | | | 3.21% | | | |
| Portfolio Turnover Rate*** | | | 45% | | | | 43% | | | |
| | | |
| * | | See Note 6 in Notes to Financial Statements. |
| ** | | Total return not annualized for periods of less than one full year. |
| *** | | Annualized for periods of less than one full year. |
| (1) | | Period from May 13, 2011 (inception date) through June 30, 2011. |
| (2) | | See Note 7 in Notes to Financial Statements. |
See Notes to Financial Statements.
Janus Alternative Fund | 27
Notes to Consolidated
Schedule of Investments (unaudited)
| | |
| Barclays Capital U.S. TIPS Index | | The Barclays U.S. Government Inflation-Linked Bond Index also known as the Barclays Capital U.S. TIPS Index measures the performance of the U.S. Treasury Inflation-Protected Securities (“TIPS”) market. The index includes TIPS with one or more years remaining maturity with total outstanding issue size of $500M or more. |
| |
| ADR | | American Depositary Receipt |
| |
| EDR | | European Depositary Receipt |
| |
| ETF | | Exchange-Traded Fund |
| |
| GDR | | Global Depositary Receipt |
| |
| MTN | | Medium-Term Note |
| |
| PCL | | Public Company Limited |
| |
| PLC | | Public Limited Company |
| |
| REGS | | Registered Shares |
| |
| REIT | | Real Estate Investment Trust |
| |
| U.S. Shares | | Securities of foreign companies trading on an American Stock Exchange. |
| | | |
| * | | Non-income producing security. |
| ** | | A portion of this security has been segregated by the custodian to cover margin or segregation requirements on open futures contracts, forward currency contracts, options contracts and/or swap agreements. |
| ‡ | | Rate is subject to change. Rate shown reflects current rate. |
| ß | | Security is illiquid. |
| ÇÇ | | Security is a U.S. Treasury Inflation-Protected Security (TIPS). |
°° Schedule of Fair Valued Securities (as of December 31, 2011)
| | | | | | | | |
| | | | | Value as a %
| | |
| | | Value | | of Net Assets | | |
| |
| |
Janus Real Return Allocation Fund | | | | | | | |
| Sino-Forest Corp. | | $ | – | | 0.0% | | |
| Indiabulls Infrastructure and Power, Ltd. | | | – | | 0.0% | | |
| |
| |
Securities are valued at “fair value” pursuant to procedures adopted by the Fund’s Trustees. The Schedule of Fair Valued Securities does not include international equity securities fair valued pursuant to a systematic fair valuation model.
| |
| 144A | Securities sold under Rule 144A of the Securities Act of 1933, as amended, are subject to legal and/or contractual restrictions on resale and may not be publicly sold without registration under the 1933 Act. These securities have been determined to be liquid under guidelines established by the Board of Trustees. The total value of 144A securities as of the period ended December 31, 2011 is indicated in the table below: |
| | | | | | | | | |
| | | | | Value as a %
| | |
| Fund | | Value | | of Market Value | | |
| |
| Janus Real Return Allocation Fund | | $ | 2,071,127 | | | 5.0% | | |
| |
| |
The following is a summary of the inputs that were used to value the Fund’s investment in securities and other financial instruments as of December 31, 2011. See Notes to Financial Statements for more information.
Valuation Inputs Summary (as of December 31, 2011)
| | | | | | | | | | | | |
| | | | | Level 2 – Other Significant
| | Level 3 – Significant
| | |
| | | Level 1 – Quoted Prices | | Observable Inputs(a) | | Unobservable Inputs | | |
| |
Investments in Securities: | | | | | | | | | | | |
| Janus Real Return Allocation Fund | | | | | | | | | | | |
Common Stock | | | | | | | | | | | |
| Cellular Telecommunications | | $ | 90,501 | | $ | 54,014 | | $ | – | | |
| Commercial Banks | | | 189,367 | | | 351,156 | | | – | | |
| Energy — Alternate Sources | | | 24,982 | | | – | | | – | | |
| Food — Retail | | | – | | | 27,796 | | | – | | |
| Forestry | | | 3,865 | | | – | | | – | | |
| Insurance Brokers | | | – | | | 53,561 | | | – | | |
| Internet Content — Entertainment | | | – | | | 13,163 | | | – | | |
| Medical — Generic Drugs | | | 11,831 | | | 31,697 | | | – | | |
| Metal — Aluminum | | | – | | | 17,872 | | | – | | |
28 | DECEMBER 31, 2011
| | | | | | | | | | | | |
| | | | | Level 2 – Other Significant
| | Level 3 – Significant
| | |
| | | Level 1 – Quoted Prices | | Observable Inputs(a) | | Unobservable Inputs | | |
| |
| Metal — Iron | | $ | 100,138 | | $ | 78,400 | | $ | – | | |
| Oil Companies — Exploration and Production | | | 180,567 | | | 102,091 | | | – | | |
| Oil Companies — Integrated | | | 42,212 | | | 140,397 | | | – | | |
| Oil Refining and Marketing | | | – | | | 14,018 | | | – | | |
| Real Estate Operating/Development | | | 1,103,638 | | | 34,155 | | | – | | |
| Rubber/Plastic Products | | | 4,420 | | | 23,281 | | | – | | |
| Semiconductor Components/Integrated Circuits | | | 11,120 | | | 142,914 | | | – | | |
| Steel — Producers | | | 73,227 | | | 33,880 | | | – | | |
| Telecommunication Services | | | 30,121 | | | 60,437 | | | – | | |
| All Other | | | 4,063,625 | | | – | | | – | | |
| | | | | | | | | | | | |
Corporate Bonds | | | – | | | 4,644,254 | | | – | | |
| | | | | | | | | | | | |
Exchange-Traded Funds | | | 576,829 | | | – | | | – | | |
| | | | | | | | | | | | |
Preferred Stock | | | 17,760 | | | – | | | – | | |
| | | | | | | | | | | | |
U.S. Treasury Notes/Bonds | | | – | | | 20,481,579 | | | – | | |
| | | | | | | | | | | | |
Money Market | | | – | | | 8,954,042 | | | – | | |
| |
| |
| Total Investments in Securities | | $ | 6,524,203 | | $ | 35,258,707 | | $ | – | | |
| |
| |
Investments in Purchased Options: | | | | | | | | | | | |
| Janus Real Return Allocation Fund | | $ | – | | $ | 56,465 | | $ | – | | |
| |
| |
Other Financial Instruments(b): | | | | | | | | | | | |
| Janus Real Return Allocation Fund | | $ | 21,790 | | $ | (1,662,204) | | $ | – | | |
| |
| |
| | | |
| (a) | | Includes fair value factors. |
| (b) | | Other financial instruments include futures, forward currency, written options, and swap contracts. Forward currency contracts and swap contracts are reported at their unrealized appreciation/(depreciation) at measurement date, which represents the change in the contract’s value from trade date. Futures are reported at their variation margin at measurement date, which represents the amount due to/from the Fund at that date. Options are reported at their market value at measurement date. |
Level 3 Valuation Reconciliation of Assets (for the six-month period ended December 31, 2011)
| | | | | | | | | | | | | | | | | | | | | | | | | | | |
| | | | | | | | | Change in
| | | | | | | | | | |
| | | | | Accrued
| | Realized
| | Unrealized
| | | | | | Transfers In
| | | | |
| | | Balance as of
| | Discounts/
| | Gain
| | Appreciation/
| | Gross
| | Gross
| | and/or Out
| | Balance as of
| | |
| | | June 30, 2011 | | Premiums | | (Loss)(a) | | (Depreciation)(b) | | Purchases | | Sales | | of Level 3 | | December 31, 2011 | | |
| |
Investments in Securities: | | | | | | | | | | | | | | | | | | | | | | | | | | |
| Janus Real Return Allocation Fund | | | | | | | | | | | | | | | | | | | | | | | | | | |
Common Stock | | | | | | | | | | | | | | | | | | | | | | | | | | |
| Energy — Alternative Sources | | $ | – | | $ | – | | $ | – | | $ | – | | $ | – | | $ | – | | $ | – | | $ | – | | |
| Forestry | | | – | | | – | | | (59) | | | (17,096) | | | 19,597 | | | (2,442) | | | – | | | – | | |
| Transactional Software | | | 1,801 | | | – | | | (22,606) | | | 21,883 | | | – | | | (1,078) | | | – | | | – | | |
| |
| |
| | | |
| (a) | | Included in “Net realized gain/(loss) from investment and foreign and foreign currency transactions” on the Consolidated Statement of Operations. |
| (b) | | Included in “Change in unrealized net appreciation/(depreciation) of investments, foreign currency translations and non-interested Trustees’ deferred compensation” on the Consolidated Statement of Operations. |
Aggregate collateral segregated to cover margin or segregation requirements on open futures contracts, forward currency contracts, options contracts and/or swap agreements as of December 31, 2011 is noted below.
| | | | | | | |
| Fund | | Aggregate Value | | | |
| |
| |
| Janus Real Return Allocation Fund | | $ | 29,534,385 | | | |
| |
| |
Janus Alternative Fund | 29
Notes to Financial Statements (unaudited)
The following section describes the organization and significant accounting policies and provides more detailed information about the schedules and tables that appear throughout this report. In addition, the Notes to Financial Statements explain the methods used in preparing and presenting this report.
| |
| 1. | Organization and Significant Accounting Policies |
Janus Real Return Allocation Fund (the “Fund”) is a series fund. The Fund is part of Janus Investment Fund (the “Trust”), which is organized as a Massachusetts business trust and is registered under the Investment Company Act of 1940, as amended (the “1940 Act”), as an open-end management investment company. Janus Real Return Subsidiary, Ltd. is a wholly-owned subsidiary of the Fund organized under the laws of the Cayman Islands as an exempted company (the “Subsidiary”). The Fund’s Consolidated Schedule of Investments, Consolidated Statement of Assets and Liabilities, Consolidated Statement of Operations, and Consolidated Statement of Changes in Net Assets include the accounts of both Janus Real Return Allocation Fund and the Subsidiary. The consolidated financial statements include information for the period from June 30, 2011 through December 31, 2011. The Trust offers forty-five funds which include multiple series of shares, with differing investment objectives and policies. The Fund is classified as nondiversified, as defined in the 1940 Act.
The Fund offers multiple classes of shares in order to meet the needs of various types of investors. Each class represents an interest in the same portfolio of investments. Certain financial intermediaries may not offer all classes of shares.
Class A Shares and Class C Shares are generally offered through financial intermediary platforms including, but not limited to, traditional brokerage platforms, mutual fund wrap fee programs, bank trust platforms, and retirement platforms. The maximum purchase in Class C Shares is $500,000 for any single purchase.
Class D Shares are generally no longer being made available to new investors. The Shares are available only to investors who hold accounts directly with the Janus funds and to immediate family members or members of the same household of an eligible individual investor. The Shares are not offered through financial intermediaries.
Class I Shares are available through certain financial intermediary platforms including, but not limited to, mutual fund wrap fee programs, managed account programs, asset allocation programs, and bank trust platforms, as well as certain retirement platforms. Class I Shares are also available to certain institutional investors including, but not limited to, corporations, certain retirement plans, public plans, and foundations/endowments.
Class S Shares are offered through financial intermediary platforms including, but not limited to, retirement platforms and asset allocation, mutual fund wrap, or other discretionary or nondiscretionary fee-based investment advisory programs. In addition, Class S Shares may be available through certain financial intermediaries who have an agreement with Janus Capital Management LLC (“Janus Capital”) or its affiliates to offer Class S Shares on their supermarket platforms.
Class T Shares are available through certain financial intermediary platforms including, but not limited to, mutual fund wrap fee programs, managed account programs, asset allocation programs, bank trust platforms, as well as certain retirement platforms. In addition, Class T Shares may be available through certain financial intermediaries who have an agreement with Janus Capital or its affiliates to offer Class T Shares on their supermarket platforms.
The following accounting policies have been followed by the Fund and are in conformity with accounting principles generally accepted in the United States of America within the investment management industry.
Investment Valuation
Securities are valued at the last sales price or the official closing price for securities traded on a principal securities exchange (U.S. or foreign) and on the NASDAQ National Market. Securities traded on over-the-counter (“OTC”) markets and listed securities for which no sales are reported are valued at the latest bid price (or yield equivalent thereof) obtained from one or more dealers transacting in a market for such securities or by a pricing service approved by the Fund’s Trustees. Short-term securities with maturities of 60 days or less may be valued at amortized cost, which approximates market value. Debt securities with a remaining maturity of greater than 60 days are valued in accordance with the evaluated bid price supplied by the pricing service. The evaluated bid price supplied by the pricing service is an evaluation that reflects such factors as security prices, yields, maturities and ratings. Short positions shall be valued in accordance with the same methodologies, except that in the event that a last sale price is not available, the latest ask price shall be used instead of a bid price. Foreign securities and currencies are converted to U.S. dollars using the applicable exchange rate in effect as of the daily close of the New York Stock Exchange (“NYSE”). When market quotations are not readily available or deemed unreliable, or events or circumstances that may affect the value of portfolio securities held by the Fund are identified between the closing of their principal markets and the time the net asset value (“NAV”) is determined, securities
30 | DECEMBER 31, 2011
may be valued at fair value as determined in good faith under procedures established by and under the supervision of the Fund’s Trustees. Circumstances in which fair value pricing may be utilized include, but are not limited to: (i) a significant event that may affect the securities of a single issuer, such as a merger, bankruptcy, or significant issuer specific development; (ii) an event that may affect an entire market, such as a natural disaster or significant governmental action; (iii) a nonsignificant event such as a market closing early or not opening, or a security trading halt; and (iv) pricing of a non-valued security and a restricted or non-public security. The Fund may use systematic fair valuation models provided by independent third parties to value international equity securities in order to adjust for stale pricing, which may occur between the close of certain foreign exchanges and the close of the NYSE. Restricted and illiquid securities are valued in accordance with procedures established by the Fund’s Trustees.
Investment Transactions and Investment Income
Investment transactions are accounted for as of the date purchased or sold (trade date). Dividend income is recorded on the ex-dividend date. Certain dividends from foreign securities will be recorded as soon as the Trust is informed of the dividend, if such information is obtained subsequent to the ex-dividend date. Dividends from foreign securities may be subject to withholding taxes in foreign jurisdictions. Interest income is recorded on the accrual basis and includes amortization of premiums and accretion of discounts. Gains and losses are determined on the identified cost basis, which is the same basis used for federal income tax purposes. Income, as well as gains and losses, both realized and unrealized, are allocated daily to each class of shares based upon the ratio of net assets represented by each class as a percentage of total net assets.
Expenses
The Fund bears expenses incurred specifically on its behalf, as well as a portion of general expenses, which may be allocated pro rata to the Fund. Each class of shares bears expenses incurred specifically on its behalf and, in addition, each class bears a portion of general expenses, which are allocated daily to each class of shares based upon the ratio of net assets represented by each class as a percentage of total net assets. Expenses directly attributable to a specific class of shares are charged against the operations of such class. In addition, the Subsidiary, and in turn the Fund indirectly, will bear fees and expenses incurred in connection with the custody, transfer agency, and audit services that the Subsidiary receives.
Estimates
The preparation of financial statements in conformity with accounting principles generally accepted in the United States of America requires management to make estimates and assumptions that affect the reported amount of assets and liabilities and disclosure of contingent assets and liabilities at the date of the consolidated financial statements, and the reported amounts of income and expenses during the reporting period. Actual results could differ from those estimates.
Foreign Currency Translations
The Fund does not isolate that portion of the results of operations resulting from the effect of changes in foreign exchange rates on investments from the fluctuations arising from changes in market prices of securities held at the date of the financial statements. Net unrealized appreciation or depreciation of investments and foreign currency translations arise from changes in the value of assets and liabilities, including investments in securities held at the date of the financial statements, resulting from changes in the exchange rates and changes in market prices of securities held.
Currency gains and losses are also calculated on payables and receivables that are denominated in foreign currencies. The payables and receivables are generally related to foreign security transactions and income translations.
Foreign currency-denominated assets and forward currency contracts may involve more risks than domestic transactions, including currency risk, political and economic risk, regulatory risk and equity risk. Risks may arise from the potential inability of a counterparty to meet the terms of a contract and from unanticipated movements in the value of foreign currencies relative to the U.S. dollar.
Dividend Distributions
The Fund generally declares and distributes dividends of net investment income and realized capital gains (if any) annually. The majority of dividends and capital gains distributions from the Fund may be automatically reinvested into additional shares of that Fund, based on the discretion of the shareholder.
The Fund may make certain investments in real estate investment trusts (“REITs”) which pay dividends to their shareholders based upon funds available from operations. It is quite common for these dividends to exceed the REITs’ taxable earnings and profits, resulting in the excess portion of such dividends being designated as a return of capital. If the Fund distributes such amounts, such distributions could constitute a return of capital to shareholders for federal income tax purposes.
Janus Alternative Fund | 31
Notes to Financial Statements (unaudited) (continued)
Federal Income Taxes
No provision for income taxes is included in the accompanying financial statements as the Fund intends to distribute to shareholders all taxable investment income and realized gains and otherwise comply with Subchapter M of the Internal Revenue Code applicable to regulated investment companies.
In accordance with the Financial Accounting Standards Board (“FASB”) guidance, the Fund adopted the provisions of “Income Taxes.” These provisions require an evaluation of tax positions taken (or expected to be taken) in the course of preparing the Fund’s tax return to determine whether these positions meet a “more-likely-than-not” standard that, based on the technical merits, have a more than fifty percent likelihood of being sustained by a taxing authority upon examination. A tax position that meets the “more-likely-than-not” recognition threshold is measured to determine the amount of benefit to recognize in the financial statements. The Fund recognizes interest and penalties, if any, related to unrecognized tax benefits in income tax expense on the Consolidated Statement of Operations.
These provisions require management of the Fund to analyze all open tax years, as defined by the Statute of Limitations, for all major jurisdictions, including federal tax authorities and certain state tax authorities. As of and during the period ended December 31, 2011, the Fund did not have a liability for any unrecognized tax benefits. The Fund has no examinations in progress and is not aware of any tax positions for which it is reasonably possible that the total amounts of unrecognized tax benefits will significantly change in the next twelve months.
On December 22, 2010, the Regulated Investment Company Modernization Act of 2010 (the “Modernization Act”) was signed by the President. The Modernization Act is the first major piece of legislation affecting Regulated Investment Companies (“RICs”) since 1986 and it modernizes several of the federal income and excise tax provisions related to RICs. Some of the enacted provisions include:
New capital losses may now be carried forward indefinitely, and retain the character of the original loss. Under pre-enactment law, capital losses could be carried forward for eight years, and carried forward as short-term capital, irrespective of the character of the original loss.
The Modernization Act contains simplification provisions, which are aimed at preventing disqualification of a RIC for “inadvertent” failures of the asset diversification and/or qualifying income tests. Additionally, the Modernization Act exempts RICs from the preferential dividend rule, and repeals the 60-day designation requirement for certain types of pay-through income and gains.
Finally, the Modernization Act contains several provisions aimed at preserving the character of distributions made by a fiscal year RIC during the portion of its taxable year ending after October 31 or December 31, reducing the circumstances under which a RIC might be required to file amended Forms 1099 to restate previously reported distributions.
Except for the simplification provisions related to RIC qualification, the Modernization Act is effective for taxable years beginning after December 22, 2010. The provisions related to RIC qualification are effective for taxable years for which the extended due date of the tax return is after December 22, 2010.
Restricted Cash
As of December 31, 2011, Janus Real Return Allocation Fund had restricted cash in the amount of $183,000. The restricted cash represents collateral received in relation to options contracts invested in by the Fund at December 31, 2011. The restricted cash is held at the Fund’s custodian, State Street Bank and Trust Company. The carrying value of the restricted cash approximates fair value.
Valuation Inputs Summary
In accordance with FASB guidance, the Fund utilizes the “Fair Value Measurements” to define fair value, establish a framework for measuring fair value, and expand disclosure requirements regarding fair value measurements. The Fair Value Measurement Standard does not require new fair value measurements, but is applied to the extent that other accounting pronouncements require or permit fair value measurements. This standard emphasizes that fair value is a market-based measurement that should be determined based on the assumptions that market participants would use in pricing an asset or liability. Various inputs are used in determining the value of the Fund’s investments defined pursuant to this standard. These inputs are summarized into three broad levels:
Level 1 — Quoted prices in active markets for identical securities.
Level 2 — Prices determined using other significant observable inputs. Observable inputs are inputs that reflect the assumptions market participants would use in pricing a security and are developed based on market data obtained from sources independent of the reporting entity. These may include quoted prices for similar securities, interest rates, prepayment speeds, credit risk, and others.
32 | DECEMBER 31, 2011
Debt securities are valued in accordance with the evaluated bid price supplied by the pricing service and generally categorized as Level 2 in the hierarchy. Securities traded on OTC markets and listed securities for which no sales are reported are valued at the latest bid price (or yield equivalent thereof) obtained from one or more dealers transacting in a market for such securities or by a pricing service approved by the Fund’s Trustees and are categorized as Level 2 in the hierarchy. Short-term securities with maturities of 60 days or less are valued at amortized cost, which approximates market value and are categorized as Level 2 in the hierarchy. Periodic review and monitoring of the valuation of short-term securities is performed in an effort to ensure that amortized cost approximates market value. Other securities that are categorized as Level 2 in the hierarchy include, but are not limited to, preferred stocks, bank loans, American Depositary Receipts (ADRs), Global Depositary Receipts (GDRs), warrants, swaps, investments in mutual funds, OTC options, and forward contracts. The Fund may use systematic fair valuation models provided by independent third parties to value international equity securities in order to adjust for stale pricing, which may occur between the close of certain foreign exchanges and the close of the NYSE. These are generally categorized as Level 2 in the hierarchy.
Level 3 — Prices determined using significant unobservable inputs. In situations where quoted prices or observable inputs are unavailable or deemed less relevant (for example, when there is little or no market activity for an investment at the end of the period), unobservable inputs may be used. Unobservable inputs are inputs that reflect the reporting entity’s own assumptions about the factors market participants would use in pricing the security and would be based on the best information available under the circumstances.
For restricted equity securities and private placements where observable inputs are limited, assumptions about market activity and risk are used in employing valuation techniques such as the market approach, the income approach, or the cost approach, as defined under the FASB Guidance. These are categorized as Level 3 in the hierarchy.
There have been no significant changes in valuation techniques used in valuing any such positions held by the Fund since the beginning of the period.
The inputs or methodology used for valuing securities are not necessarily an indication of the risk associated with investing in those securities. The summary of inputs used as of December 31, 2011 to value the Fund’s investments in securities and other financial instruments is included in the “Valuation Inputs Summary” and “Level 3 Valuation Reconciliation of Assets” (if applicable) in the Notes to Consolidated Schedule of Investments.
The Fund adopted FASB Accounting Standards Update “Fair Value Measurements and Disclosures” (the “Update”). This Update applies to the Fund’s disclosures about transfers in and out of Level 1 and Level 2 of the fair value hierarchy and the reasons for the transfers. Disclosures about the valuation techniques and inputs used to measure fair value for investments that fall in either Level 2 or Level 3 fair value hierarchy are summarized under the Level 2 and Level 3 categories listed above.
The following table shows transfers between Level 1 and Level 2 of the fair value Hierarchy during the period ended December 31,2011.
| | | | | | | | | |
| | | Transfers In
| | Transfers Out
| | |
| | | Level 1
| | of Level 2 to
| | |
| Fund | | to Level 2 | | Level 1 | | |
| |
| |
| Janus Real Return Allocation Fund | | $ | – | | $ | 2,762,170 | | |
| |
| |
Financial assets were transferred from Level 2 to Level 1 since certain foreign equity prices were applied a fair valuation adjustment factor at the beginning of the fiscal year and no factor was applied at the end of the period.
The Fund recognizes transfers between the levels as of the beginning of the period.
| |
| 2. | Derivative Instruments |
The Fund may invest in various types of derivatives, which may at times result in significant derivative exposure. A derivative is a financial instrument whose performance is derived from the performance of another asset. The Fund may invest in derivative instruments including, but not limited to: futures contracts, put options, call options, options on swap contracts, options on future contracts, options on foreign currencies, swaps, forward contracts, structured investments, commodities-linked derivative instruments, and inflation index swaps. Each derivative instrument that was held by the Fund during the period ended December 31, 2011 is discussed in further detail below. A summary of derivative activity is reflected in the tables at the end of this section.
The Fund may use derivative instruments for hedging (to offset risks associated with an investment, currency exposure, or market conditions) or for speculative (to seek to enhance returns) purposes. When the Fund invests in a derivative for speculative purposes, the Fund will be fully exposed to the risks of loss of that derivative, which may sometimes be greater than the cost of the derivative. The
Janus Alternative Fund | 33
Notes to Financial Statements (unaudited) (continued)
Fund may not use any derivative to gain exposure to an asset or class of assets prohibited by its investment restrictions from purchasing directly. The Fund’s ability to use derivative instruments may also be limited by tax considerations.
Investments in derivatives are generally subject to market risks that may cause their prices to fluctuate over time. Investments in derivatives may not directly correlate with the price movements of the underlying instrument. As a result, the use of derivatives may expose the Fund to additional risks that it would not be subject to if it invested directly in the securities underlying those derivatives. The use of derivatives may result in larger losses or smaller gains than otherwise would be the case. Derivatives can be volatile and may involve significant risks, including, but not limited to, counterparty risk, credit risk, currency risk, equity risk, index risk, interest rate risk, leverage risk, and liquidity risk.
Derivatives may generally be traded OTC or on an exchange. Derivatives traded OTC, such as options and structured notes, are agreements that are individually negotiated between parties and can be tailored to meet a purchaser’s needs.
OTC derivatives are not guaranteed by a clearing agency and may be subject to increased credit risk. In an effort to mitigate credit risk associated with derivatives traded OTC, the Fund may enter into collateral agreements with certain counterparties whereby, subject to certain minimum exposure requirements, the Fund may require the counterparty to post collateral if the Fund has a net aggregate unrealized gain on all OTC derivative contracts with a particular counterparty. There is no guarantee that counterparty exposure is reduced and these arrangements are dependent on Janus Capital’s ability to establish and maintain appropriate systems and trading.
In pursuit of its investment objective, the Fund may seek to use derivatives to increase or decrease exposure to the following market risk factors:
| |
| • | Counterparty Risk — Counterparty risk is the risk that the counterparty (the party on the other side of the transaction) on a derivative transaction will be unable to honor its financial obligation to the Fund. |
| |
| • | Credit Risk — Credit risk is the risk an issuer will be unable to make principal and interest payments when due, or will default on its obligations. |
| |
| • | Currency Risk — Currency risk is the risk that changes in the exchange rate between currencies will adversely affect the value (in U.S. dollar terms) of an investment. |
| |
| • | Equity Risk — Equity risk relates to the change in value of equity securities as they relate to increases or decreases in the general market. |
| |
| • | Index Risk — If the derivative is linked to the performance of an index, it will be subject to the risks associated with changes in that index. If the index changes, the Fund could receive lower interest payments or experience a reduction in the value of the derivative to below what the Fund paid. Certain indexed securities, including inverse securities (which move in an opposite direction to the index), may create leverage, to the extent that they increase or decrease in value at a rate that is a multiple of the changes in the applicable index. |
| |
| • | Interest Rate Risk — Interest rate risk is the risk that the value of fixed-income securities will generally decline as prevailing interest rates rise, which may cause the Fund’s NAV to likewise decrease, and vice versa. |
| |
| • | Leverage Risk — Leverage risk is the risk associated with certain types of leveraged investments or trading strategies pursuant to which relatively small market movements may result in large changes in the value of an investment. The Fund creates leverage by using borrowed capital to increase the amount invested, or investing in instruments, including derivatives, where the investment loss can exceed the original amount invested. Certain investments or trading strategies that involve leverage can result in losses that greatly exceed the amount originally invested. |
| |
| • | Liquidity Risk — Liquidity risk is the risk that certain securities may be difficult or impossible to sell at the time that the seller would like or at the price that the seller believes the security is currently worth. |
Commodity-Linked Investments
The Fund may invest in commodity index-linked swap agreements, commodity options and futures, and options on futures that provide exposure to the investment returns of the commodities markets. The Fund may also invest in other commodity-linked derivative instruments, such as commodity-linked notes (“structured notes”). The Fund will seek to gain exposure to the commodity markets, in whole or in part, through investments in Janus Real Return Subsidiary, Ltd., a wholly-owned subsidiary of the Fund organized under the laws of the Cayman Islands as an exempted company (the “Subsidiary”) which is generally subject to the same investment policies and restrictions of the Fund. The Subsidiary invests in commodity-linked investments and other investments which may serve as margin or collateral for the Subsidiary’s derivative positions. Such exposure may subject the Fund to greater volatility than investments in traditional securities. The
34 | DECEMBER 31, 2011
value of a given commodity-linked derivative investment typically is based upon the price movements of a physical commodity (such as heating oil, livestock, or agricultural products), a commodity futures contract or commodity index, or some other readily measurable economic variable. The value of commodity-linked derivative instruments may therefore be affected by changes in overall market movements, volatility of the underlying benchmark, changes in interest rates, or other factors affecting a particular industry or commodity such as drought, floods, weather, livestock disease, embargoes, tariffs, and international economic, political, and regulatory developments.
Forward Foreign Currency Exchange Contracts
A forward foreign currency exchange contract (“forward currency contract”) is a commitment to purchase or sell a foreign currency at a future date at a negotiated rate. The Fund may enter into forward currency contracts for hedging purposes, including, but not limited to, reducing exposure to changes in foreign currency exchange rates on foreign portfolio holdings and locking in the U.S. dollar cost of firm purchase and sale commitments for securities denominated in or exposed to foreign currencies. The Fund may also invest in forward currency contracts for nonhedging purposes such as seeking to enhance returns. The Fund is subject to currency risk in the normal course of pursuing its investment objective through its investments in forward currency contracts.
The gain or loss arising from the difference between the U.S. dollar cost of the original contract and the value of the foreign currency in U.S. dollars upon closing a contract is included in “Net realized gain/(loss) from investment and foreign currency transactions” on the Consolidated Statement of Operations (if applicable).
Forward currency contracts held by the Fund are fully collateralized by other securities, which are denoted on the accompanying Consolidated Schedule of Investments (if applicable). The collateral is evaluated daily to ensure its market value equals or exceeds the current market value of the corresponding forward currency contracts. Such collateral is in the possession of the Fund’s custodian.
Futures Contracts
A futures contract is an exchange-traded agreement to take or make delivery of an underlying asset at a specific time in the future for a specific predetermined negotiated price. The Fund may enter into futures contracts to gain exposure to the stock market pending investment of cash balances or to meet liquidity needs. The Fund is subject to interest rate risk, equity risk, and currency risk in the normal course of pursuing its investment objective through its investments in futures contracts. The Fund may also use such derivative instruments to hedge or protect from adverse movements in securities prices, currency rates or interest rates. The use of futures contracts may involve risks such as the possibility of illiquid markets or imperfect correlation between the values of the contracts and the underlying securities, or that the counterparty will fail to perform its obligations.
Futures contracts are marked-to-market daily, and the daily variation margin is recorded as a receivable or payable on the Consolidated Statement of Assets and Liabilities (if applicable). When a contract is closed, a realized gain or loss is recorded as “Net realized gain/ (loss) from futures contracts” on the Consolidated Statement of Operations (if applicable), equal to the difference between the opening and closing value of the contract. Generally, futures contracts are marked-to-market (i.e., treated as realized and subject to distribution) for federal income tax purposes at fiscal year-end. Securities held by the Fund that are designated as collateral for market value on futures contracts are noted on the Consolidated Schedule of Investments (if applicable). Such collateral is in the possession of the Fund’s custodian or with the counterparty broker.
With futures, there is minimal counterparty credit risk to the Fund since futures are exchange-traded and the exchange’s clearinghouse, as counterparty to all exchange-traded futures, guarantees the futures against default.
Inflation-Linked Securities
Inflation-linked bonds are fixed-income securities which have a principal value that is periodically adjusted according to the rate of inflation. If an index measuring inflation falls, the principal value of inflation-indexed bonds will typically be adjusted downward, and consequently the interest payable on these securities (calculated with respect to a smaller principal amount) will be reduced. In the case of Treasury Inflation-Protected Securities, also known as TIPS, repayment of original bond principal upon maturity (as adjusted for inflation) is guaranteed by the U.S. Treasury. For inflation-linked bonds that do not provide a similar guarantee, the adjusted principal value of the inflation-linked bond repaid at maturity may be less than the original principal.
Such bonds may also be issued by or related to sovereign governments of developed countries, by countries deemed to be emerging markets, and inflation-linked bonds issued by or related to companies or other entities not affiliated with governments.
Because of the inflation-linked adjustment feature, inflation-linked bonds typically have lower yields than conventional fixed-rate bonds. Inflation-linked bonds also
Janus Alternative Fund | 35
Notes to Financial Statements (unaudited) (continued)
normally decline in price when real interest rates rise. In the event of deflation, in which prices decline over time, the principal and income of inflation-protected bonds would likely decline in price, resulting in losses to the Fund.
Options Contracts
An options contract provides the purchaser with the right, but not the obligation, to buy (call option) or sell (put option) a financial instrument at an agreed upon price. The Fund may purchase or write covered and uncovered put and call options on swap contracts (“swaptions”), futures contracts, and on portfolio securities for hedging purposes or as a substitute for an investment. The Fund is subject to interest rate risk, liquidity risk, equity risk, and currency risk in the normal course of pursuing its investment objective through its investments in options contracts. The Fund may use options contracts to hedge against changes in interest rates, the values of equities, or foreign currencies. The Fund may utilize American-style and European-style options. An American-style option is an option contract that can be exercised at any time between the time of purchase and the option’s expiration date. A European-style option is an option contract that can only be exercised on the option’s expiration date. The Fund may also purchase or write put and call options on foreign currencies in a manner similar to that in which futures or forward contracts on foreign currencies will be utilized. The Fund may also invest in long-term equity anticipation securities, which are long-term options contracts that can be maintained for a period of up to three years. The Fund may also enter into a swaption contract which grants the purchaser the right, but not the obligation, to enter into a swap transaction at preset terms detailed in the underlying agreement within a specified period of time. Entering into a swaption contract involves, to varying degrees, the elements of credit, market and interest rate risk, associated with both option contracts and swap contracts. The Fund generally invests in options to hedge against adverse movements in the value of portfolio holdings.
When an option is written, the Fund receives a premium and becomes obligated to sell or purchase the underlying security at a fixed price, upon exercise of the option. In writing an option, the Fund bears the risk of an unfavorable change in the price of the security underlying the written option. Exercise of an option written by the Fund could result in the Fund buying or selling a security at a price different from the current market value.
When an option is exercised, the proceeds on sales for a written call option, the purchase cost for a written put option, or the cost of the security for a purchased put or call option are adjusted by the amount of premium received or paid.
The Fund may also purchase and write exchange-listed and OTC put and call options on domestic securities indices, and on foreign securities indices listed on domestic and foreign securities exchanges. Options on securities indices are similar to options on securities except that (1) the expiration cycles of securities index options are monthly, while those of securities options are currently quarterly, and (2) the delivery requirements are different. Instead of giving the right to take or make delivery of securities at a specified price, an option on a securities index gives the holder the right to receive a cash “exercise settlement amount” equal to (a) the amount, if any, by which the fixed exercise price of the option exceeds (in the case of a put) or is less than (in the case of a call) the closing value of the underlying index on the date of exercise, multiplied by (b) a fixed “index multiplier.” Receipt of this cash amount will depend upon the closing level of the securities index upon which the option is based being greater than, in the case of a call, or less than, in the case of a put, the exercise price of the index and the exercise price of the option times a specified multiple. The writer of the option is obligated, in return for the premium received, to make delivery of this amount.
Options traded on an exchange are regulated and the terms of the options are standardized. Options traded OTC expose the Fund to counterparty risk in the event that the counterparty does not perform. This risk is mitigated by having a netting arrangement between the Fund and the counterparty and by having the counterparty post collateral to cover the Fund’s exposure to the counterparty.
Holdings of the Fund designated to cover outstanding written options are noted on the Consolidated Schedule of Investments (if applicable). Options written are reported as a liability on the Consolidated Statement of Assets and Liabilities as “Options written at value” (if applicable).
Realized gains and losses are reported as “Net realized gain/(loss) from options contracts” on the Consolidated Statement of Operations (if applicable).
The risk in writing call options is that the Fund gives up the opportunity for profit if the market price of the security increases and the options are exercised. The risk in writing put options is that the Fund may incur a loss if the market price of the security decreases and the options are exercised. The risk in buying options is that the Fund pays a premium whether or not the options are exercised. The use of such instruments may involve certain additional risks as a result of unanticipated movements in the market. A lack of correlation between the value of an instrument underlying an option and the asset being
36 | DECEMBER 31, 2011
hedged, or unexpected adverse price movements, could render the Fund’s hedging strategy unsuccessful. In addition, there can be no assurance that a liquid secondary market will exist for any option purchased or sold. There is no limit to the loss the Fund may recognize due to written call options.
Written option activity for the period ended December 31, 2011 is indicated in the table below:
| | | | | | | | | |
| | | Number of
| | Premiums
| | |
| Call Options | | Contracts | | Received | | |
| |
| |
| Options outstanding at June 30, 2011 | | | 2 | | $ | 494 | | |
| Options written | | | 347 | | | 3,324 | | |
| Options closed | | | (349) | | | (3,818) | | |
| Options expired | | | – | | | – | | |
| Options exercised | | | – | | | – | | |
| |
| |
| Options outstanding at December 31, 2011 | | | – | | $ | – | | |
| |
| |
| | | | | | | | | |
| | | Number of
| | Premiums
| | |
| Put Options | | Contracts | | Received | | |
| |
| |
| Options outstanding at June 30, 2011 | | | 473 | | $ | 8,237 | | |
| Options written | | | 307 | | | 26,295 | | |
| Options closed | | | (492) | | | (11,612) | | |
| Options expired | | | (268) | | | (19,980) | | |
| Options exercised | | | – | | | – | | |
| |
| |
| Options outstanding at December 31, 2011 | | | 20 | | $ | 2,940 | | |
| |
| |
Swaps
A swap is an agreement that obligates two parties to exchange a series of cash flows at specified intervals based upon or calculated by reference to changes in specified prices or rates for a specified amount of an underlying asset. The Fund may utilize swap agreements as a means to gain exposure to a commodity index, commodity markets, or certain common or preferred stocks and/or to “hedge” or protect its portfolio from adverse movements in securities prices or interest rates. The Fund is subject to equity risk and interest rate risk in the normal course of pursuing its investment objective through investments in swap contracts. Swap agreements entail the risk that a party will default on its payment obligation to the Fund. If the other party to a swap defaults, the Fund would risk the loss of the net amount of the payments that it contractually is entitled to receive.
If the Fund utilizes a swap at the wrong time or judges market conditions incorrectly, the swap may result in a loss to the Fund and reduce the Fund’s total return. Swap contracts of the Fund are reported as an asset or liability on the Consolidated Statement of Assets and Liabilities (if applicable). Realized gains and losses of the Fund are reported in “Net realized gain/(loss) from swap contracts” on the Consolidated Statement of Operations (if applicable).
Various types of swaps such as credit default (funded and unfunded), inflation index, interest rate, total return, and zero coupon swaps are described below.
Credit default swaps are a specific kind of counterparty agreement that allows the transfer of third-party credit risk from one party to the other. The Fund is subject to credit risk in the normal course of pursuing its investment objective through its investments in credit default swap contracts. The Fund may enter into credit default swaps to manage its exposure to the market or certain sectors of the market, to reduce its risk exposure to defaults of corporate and sovereign issuers, or to create exposure to corporate or sovereign issuers to which it is not otherwise exposed. With a credit default swap, one party in the swap is a lender and faces credit risk from a third party, and the counterparty in the credit default swap agrees to insure this risk in exchange for regular periodic payments. The Fund’s maximum risk of loss from counterparty risk, either as a protection seller or as a protection buyer (undiscounted), is the notional value of the agreement. The risk is mitigated by having a netting arrangement between the Fund and the counterparty and by posting of collateral by the counterparty to the Fund to cover the Fund’s exposure to the counterparty.
Funded (notional value of contract paid up front) or unfunded (notional value only paid in case of default) credit default swaps are based on an index of credit default swaps (“CDXs”) or other similarly structured products. CDXs are designed to track segments of the credit default swap market and provide investors with exposure to specific reference baskets of issuers of bonds or loans. These instruments have the potential to allow an investor to obtain the same investment exposure as an investor who invests in an individual credit default swap, but with the potential added benefit of diversification. The CDX reference baskets are normally priced daily and rebalanced every six months in conjunction with leading market makers in the credit industry. The liquidity of the market for CDXs is normally subject to liquidity in the secured loan and credit derivatives markets. A fund investing in CDXs is normally only permitted to take long positions in these instruments.
Inflation index swaps are used to hedge against unexpected changes in the rate of inflation as measured by an inflation index such as the Consumer Price Index. Inflation index swaps are also subject to inflation risk, where such a swap held long by the Fund can potentially lose value if the rate of inflation over the life of the swap is less than the fixed rate that the Fund agrees to pay at the initiation of the swap.
Interest rate swaps involve the exchange by two parties of their respective commitments to pay or receive interest
Janus Alternative Fund | 37
Notes to Financial Statements (unaudited) (continued)
(e.g., an exchange of floating rate payments for fixed rate payments).
Total return swaps involve an exchange by two parties in which one party makes payments based on a set rate, either fixed or variable, while the other party makes payments based on the return of an underlying asset, which includes both the income it generates and any capital gains over the payment period.
The Fund’s maximum risk of loss for credit default swaps, inflation index swaps, interest rate swaps, total return swaps, and zero coupon swaps from counterparty risk or credit risk is the discounted value of the payments to be received from/paid to the counterparty over the contract’s remaining life, to the extent that the amount is positive.
The risk is mitigated by having a netting arrangement between the Fund and the counterparty and by the posting of collateral to the Fund to cover the Fund’s exposure to the counterparty.
In accordance with FASB guidance, the Fund adopted the provisions for “Derivatives and Hedging,” which require qualitative disclosures about objectives and strategies for using derivatives, quantitative disclosures about fair value amounts of and gains and losses on derivative instruments, and disclosures about credit-risk-related contingent features in derivative agreements.
The following table, grouped by derivative type, provides information about the fair value and location of derivatives within the Consolidated Statement of Assets and Liabilities as of December 31, 2011.
Fair Value of Derivative Instruments as of December 31, 2011
| | | | | | | | | | | | | |
| | | Asset Derivatives | | | Liability Derivatives | |
Derivatives not accounted for
| | Consolidated Statement of Assets
| | | | | Consolidated Statement of Assets
| | | |
| as hedging instruments | | and Liabilities Location | | Fair Value | | | and Liabilities Location | | Fair Value | |
| |
| |
| Credit Contracts | | Outstanding swap contracts, at value | | $ | 100,822 | | | Outstanding swap contracts, at value | | $ | 69,057 | |
| |
| |
| Currency Contracts | | Unaffiliated investments at value | | | 29,925 | | | | | | | |
| |
| |
| Equity Contracts | | Unaffiliated investments at value | | | 26,540 | | | Options written, at value | | | 79 | |
| |
| |
| Equity Contracts | | Outstanding swap contracts, at value | | | 92,153 | | | Outstanding swap contracts, at value | | | 26,106 | |
| |
| |
| Foreign Exchange Contracts | | Foreign currency contracts | | | 284 | | | Foreign currency contracts | | | 197 | |
| |
| |
| Futures Contracts | | Variation margin | | | 21,790 | | | | | | | |
| |
| |
| Interest Rate Contracts | | | | | | | | Outstanding swap contracts, at value | | | 1,731,900 | |
| |
| |
| Total | | | | $ | 271,514 | | | | | $ | 1,827,339 | |
| |
| |
The following tables provide information about the effect of derivatives and hedging activities on the Fund’s Consolidated Statement of Operations for the period ended December 31, 2011.
The effect of Derivative Instruments on the Consolidated Statement of Operations for the period ended December 31, 2011
| | | | | | | | | | | | | | | | | | |
| Amount of Realized Gain/(Loss) on Derivatives Recognized in Income |
| | | | | | | | | Forward Currency
| | | | |
| Derivatives not accounted for as hedging instruments | | Futures | | Swaps | | Options | | Contracts | | Total | | |
| |
| |
| Commodity-Linked Contracts | | $ | 119,215 | | $ | – | | $ | (64,244) | | $ | – | | $ | 54,971 | | |
| |
| |
| Credit Contracts | | | – | | | 27,226 | | | – | | | – | | | 27,226 | | |
| |
| |
| Currency Contracts | | | 114,103 | | | – | | | (81,153) | | | – | | | 32,950 | | |
| |
| |
| Equity Contracts | | | 11,002 | | | (535,925) | | | 319,302 | | | – | | | (205,621) | | |
| |
| |
| Foreign Exchange Contracts | | | – | | | – | | | – | | | 10,477 | | | 10,477 | | |
| |
| |
| Interest Rate Contracts | | | 346,913 | | | (406,911) | | | 144,888 | | | – | | | 84,890 | | |
| |
| |
| Total | | $ | 591,233 | | $ | (915,610) | | $ | 318,793 | | $ | 10,477 | | $ | 4,893 | | |
| |
| |
38 | DECEMBER 31, 2011
| | | | | | | | | | | | | | | | | | |
| Change in Unrealized Appreciation/(Depreciation) on Derivatives Recognized in Income |
| | | | | | | | | Forward Currency
| | | | |
| Derivatives not accounted for as hedging instruments | | Futures | | Swaps | | Options | | Contracts | | Total | | |
| |
| |
| Commodity-Linked Contracts | | $ | (59,760) | | $ | – | | $ | – | | $ | – | | $ | (59,760) | | |
| |
| |
| Credit Contracts | | | – | | | 4,317 | | | – | | | – | | | 4,317 | | |
| |
| |
| Currency Contracts | | | 31,060 | | | – | | | 12,401 | | | – | | | 43,461 | | |
| |
| |
| Equity Contracts | | | – | | | 111,091 | | | 44,176 | | | – | | | 155,267 | | |
| |
| |
| Foreign Exchange Contracts | | | – | | | – | | | – | | | 2,149 | | | 2,149 | | |
| |
| |
| Interest Rate Contracts | | | 143,433 | | | (1,895,510) | | | – | | | – | | | (1,752,077) | | |
| |
| |
| Total | | $ | 114,733 | | $ | (1,780,102) | | $ | 56,577 | | $ | 2,149 | | $ | (1,606,643) | | |
| |
| |
Please see the Fund’s Consolidated Statement of Operations for the Fund’s “Net Realized and Unrealized Gain/(Loss) on Investments.”
The value of derivative instruments at period end and the effect of derivatives on the Consolidated Statement of Assets and Liabilities, Consolidated Statement of Operations, and the Consolidated Statement of Investments are indicative of the Fund’s volume throughout the period.
| |
| 3. | Other Investments and Strategies |
Additional Investment Risk
The Fund may be invested in lower-rated debt securities that have a higher risk of default or loss of value since these securities may be sensitive to economic changes, political changes or adverse developments specific to the issuer.
It is important to note that events in both domestic and international equity and fixed-income markets have resulted, and may continue to result, in an unusually high degree of volatility in the markets, with issuers that have exposure to the real estate, mortgage, and credit markets particularly affected. These events and the resulting market upheavals may have an adverse effect on the Fund, such as a decline in the value and liquidity of many securities held by the Fund, unusually high and unanticipated levels of redemptions, an increase in portfolio turnover, a decrease in NAV, and an increase in Fund expenses. Because the situation is unprecedented and widespread, it may also be unusually difficult to identify both investment risks and opportunities, which could limit or preclude the Fund’s ability to achieve its investment objective. It is impossible to predict whether or for how long these conditions will continue. Therefore, it is important to understand that the value of your investment may fall, sometimes sharply, and you could lose money.
Further, the instability experienced in the financial markets has resulted in the U.S. Government and various other governmental and regulatory entities taking actions to address the financial crisis. These actions include, but are not limited to, the enactment of the Dodd-Frank Wall Street Reform and Consumer Protection Act (the “Dodd- Frank Act”) in July 2010 which is expected to dramatically change the way in which the U.S. financial system is supervised and regulated. More specifically, the Dodd-Frank Act provides for widespread regulation of financial institutions, consumer financial products and services, broker-dealers, over-the-counter derivatives, investment advisers, credit rating agencies, and mortgage lending, which expands federal oversight in the financial sector and may affect the investment management industry as a whole. Given the broad scope, sweeping nature, and the fact that many provisions of the Dodd-Frank Act must be implemented through future rulemaking, the ultimate impact of the Dodd-Frank Act, and any resulting regulation, is not yet certain. As a result, there can be no assurance that these government and regulatory measures will not have an adverse effect on the value or marketability of securities held by the Fund, including potentially limiting or completely restricting the ability of the Fund to use a particular investment instrument as part of its investment strategy, increasing the costs of using these instruments, or possibly making them less effective in general. Furthermore, no assurance can be made that the U.S. Government or any U.S. regulatory entity (or other authority or regulatory entity) will not continue to take further legislative or regulatory action in response to the economic crisis or otherwise, and the effect of such actions, if taken, cannot be known.
Certain areas of the world have historically been prone to and economically sensitive to environmental events such as, but not limited to, hurricanes, earthquakes, typhoons, flooding, tidal waves, tsunamis, erupting volcanoes, wildfires or droughts, tornadoes, mudslides, or other weather-related phenomena. Such disasters, and the resulting physical or economic damage, could have a severe and negative impact on the Fund’s investment portfolio and, in the longer term, could impair the ability of issuers in which the Fund invests to conduct their businesses as they would under normal conditions. Adverse weather conditions may also have a particularly
Janus Alternative Fund | 39
Notes to Financial Statements (unaudited) (continued)
significant negative effect on issuers in the agricultural sector and on insurance companies that insure against the impact of natural disasters.
Counterparties
Fund transactions involving a counterparty are subject to the risk that the counterparty or a third party will not fulfill its obligation to the Fund (“counterparty risk”). Counterparty risk may arise because of the counterparty’s financial condition (i.e., financial difficulties, bankruptcy, or insolvency), market activities and developments, or other reasons, whether foreseen or not. A counterparty’s inability to fulfill its obligation may result in significant financial loss to the Fund. The Fund may be unable to recover its investment from the counterparty or may obtain a limited recovery, and/or recovery may be delayed. The extent of the Fund’s exposure to counterparty risk in respect to financial assets approximates its carrying value as recorded on the Fund’s Consolidated Statement of Assets and Liabilities.
The Fund may be exposed to counterparty risk through participation in various programs including, but not limited to, lending its securities to third parties, cash sweep arrangements whereby the Fund’s cash balance is invested in one or more types of cash management vehicles, as well as investments in, but not limited to, repurchase agreements, debt securities, and derivatives, including various types of swaps, futures and options. The Fund intends to enter into financial transactions with counterparties that Janus Capital believes to be creditworthy at the time of the transaction. There is always the risk that Janus Capital’s analysis of a counterparty’s creditworthiness is incorrect or may change due to market conditions. To the extent that the Fund focuses its transactions with a limited number of counterparties, it will have greater exposure to the risks associated with one or more counterparties.
Emerging Market Investing
Investing in emerging markets may involve certain risks and considerations not typically associated with investing in the United States and imposes risks greater than, or in addition to, the risks associated with investing in securities of more developed foreign countries. Emerging markets securities are exposed to a number of additional risks, which may result from less government supervision and regulation of business and industry practices (including the potential lack of strict finance and accounting controls and standards), stock exchanges, brokers, and listed companies, making these investments potentially more volatile in price and less liquid than investments in developed securities markets, resulting in greater risk to investors. In addition, the Fund’s investments may be denominated in foreign currencies and therefore, changes in the value of a country’s currency compared to the U.S. dollar may affect the value of the Fund’s investments. To the extent that the Fund invests a significant portion of its assets in the securities of issuers in or companies of a single country or region, it is more likely to be impacted by events or conditions affecting that country or region, which could have a negative impact on the Fund’s performance.
Exchange-Traded Funds
The Fund may invest in exchange-traded funds, which generally are index-based investment companies that hold substantially all of their assets in securities representing their specific index. As a shareholder of another investment company, the Fund would bear its pro rata portion of the other investment company’s expenses, including advisory fees, in addition to the expenses the Fund bears directly in connection with its own operations.
Exchange-Traded Notes
The Fund may invest directly in exchange-traded notes (“ETNs”), which are senior, unsecured, unsubordinated debt securities whose returns are linked to a particular index and provide exposure to the total returns of various market indices, including indices linked to stocks, bonds, commodities and currencies. This type of debt security differs from other types of bonds and notes. ETN returns are based upon the performance of a market index minus applicable fees; no periodic coupon payments are distributed and no principal protections exist. ETNs do not pay cash distributions. Instead, the value of dividends, interest, and investment gains are captured in the Fund’s total return. The Fund may invest in these securities when desiring exposure to debt securities or commodities. When evaluating ETNs for investment, Janus Capital will consider the potential risks involved, expected tax efficiency, rate of return, and credit risk. When the Fund invests in ETNs, it will bear its proportionate share of any fees and expenses borne by the ETN. There may be restrictions on the Fund’s right to redeem its investment in an ETN, which is meant to be held until maturity. The Fund’s decision to sell its ETN holdings may be limited by the availability of a secondary market.
Initial Public Offerings
The Fund may invest in initial public offerings (“IPOs”). IPOs and other investment techniques may have a magnified performance impact on a Fund with a small asset base. The Fund may not experience similar performance as its assets grow.
Interfund Lending
As permitted by the Securities and Exchange Commission (“SEC”), or the 1940 Act and rules promulgated thereunder, the Fund may be party to interfund lending
40 | DECEMBER 31, 2011
agreements between the Fund and other Janus Capital sponsored mutual funds and certain pooled investment vehicles, which permit them to borrow or lend cash at a rate beneficial to both the borrowing and lending funds. Outstanding borrowings from all sources totaling 10% or more of the borrowing Fund’s total assets must be collateralized at 102% of the outstanding principal value of the loan; loans of less than 10% may be unsecured.
Investment in Subsidiary
To qualify as a regulated investment company under the Internal Revenue Code (“IRC”), 90% of the Fund’s income must be from certain qualified sources. Direct investment in many commodities-related investments generates income that is not from a qualifying source for purposes of meeting this 90% test. The Fund will seek to gain exposure to the commodity markets, in whole or in part, through investments in the Subsidiary, and which is generally subject to the same investment policies and restrictions of the Fund. The Subsidiary may invest without limitation in commodity index-linked swaps, commodity futures, commodity-linked notes, and other commodity-linked derivative instruments. The Subsidiary may also invest in fixed-income securities and other investments which may serve as margin or collateral for the Subsidiary’s derivatives positions. The Fund may invest up to 25% of its total assets in the Subsidiary. Income or net capital gains from the Fund’s investment in the Subsidiary would be treated as ordinary income to the Fund. Janus Capital is the adviser to the Subsidiary and Armored Wolf is the Subsidiary’s subadviser. The Subsidiary will not be subject to U.S. laws (including securities laws) and their protections. The Subsidiary is subject to the laws of a foreign jurisdiction, which can be affected by developments in that jurisdiction. The Fund has applied for a private letter ruling confirming that income produced by the Fund’s investment in the Subsidiary and that income from certain commodity-related investments constitutes qualifying income to the Fund. There is no guarantee that a favorable private letter ruling will be obtained.
Changes in the laws of the United States and/or the Cayman Islands could result in the inability of the Fund and/or the Subsidiary to operate as described in the Prospectus and the SAI and could adversely affect the Fund. In particular, unfavorable treatment of the income derived from the Fund’s investment in the Subsidiary could jeopardize the Fund’s status as a regulated investment company under the IRC, which in turn may subject the Fund to higher tax rates and/or penalties. Additionally, the Commodity Futures Trading Commission (“CFTC”) recently proposed changes to Rule 4.5 under the Commodity Exchange Act which, if adopted, could require the Fund and the Subsidiary to register with the CFTC and be subject to CFTC rules and regulations. Such changes could potentially limit or restrict the ability of the Fund to pursue its investment strategies and/or increase the costs of implementing its strategies.
By investing in the Subsidiary, the Fund will be indirectly exposed to the risks associated with the Subsidiary’s investments, which are generally similar to those that are permitted to be held by the Fund. The Subsidiary is not registered under the 1940 Act, and is not subject to all of the provisions of the 1940 Act.
Mortgage- and Asset-Backed Securities
The Fund may purchase fixed or variable rate mortgage-backed securities issued by the Government National Mortgage Association (“Ginnie Mae”), the Federal National Mortgage Association (“Fannie Mae”), the Federal Home Loan Mortgage Corporation (“Freddie Mac”), or other governmental or government-related entities. Historically, Fannie Maes and Freddie Macs were not backed by the full faith and credit of the U.S. Government, and may not be in the future. In September 2008, the Federal Housing Finance Agency (“FHFA”), an agency of the U.S. Government, placed Fannie Mae and Freddie Mac under conservatorship to provide stability in the financial markets, mortgage availability and taxpayer protection by preserving Fannie Mae’s and Freddie Mac’s assets, and placing them in a sound and solvent condition. Under the conservatorship, the management of Fannie Mae and Freddie Mac was replaced. The effect that the FHFA’s conservatorship will have on Fannie Mae’s and Freddie Mac’s debt and equities is unclear. The Fund may purchase other mortgage- and asset-backed securities through single- and multi-seller conduits, collateralized debt obligations, structured investment vehicles, and other similar securities. Asset-backed securities may be backed by automobile loans, equipment leases, credit card receivables, or other collateral. In the event the underlying securities fail to perform, these investment vehicles could be forced to sell the assets and recognize losses on such assets, which could impact the Fund’s yield and the Fund’s return.
Unlike traditional debt instruments, payments on these securities include both interest and a partial payment of principal. Prepayment risk, which results from prepayments of the principal of underlying loans at a faster pace than expected, may shorten the effective maturities of these securities and may result in the Fund having to reinvest proceeds at a lower interest rate. In addition to prepayment risk, investments in mortgage-backed securities, including those comprised of subprime mortgages, and investments in other asset-backed securities comprised of under-performing assets may be subject to a higher degree of credit risk, valuation risk, and liquidity risk. Additionally, although mortgages and
Janus Alternative Fund | 41
Notes to Financial Statements (unaudited) (continued)
mortgage-related securities are generally supported by some form of government or private guarantee and/or insurance, there is no assurance that private guarantors or insurers will meet their obligations.
Mortgage- and asset-backed securities are also subject to extension risk, which is the risk that rising interest rates could cause mortgages or other obligations underlying these securities to be paid more slowly than expected, increasing the Fund’s sensitivity to interest rate changes and causing its price to decline.
Real Estate Investing
The Fund may invest in equity and debt securities of U.S. and non-U.S. real estate-related companies. Such companies may include those in the real estate industry or real estate-related industries. These securities may include common stocks, preferred stocks, and other equity securities, including, but not limited to, REITs and similar REIT-like entities such as foreign entities that have REIT characteristics.
Repurchase and Reverse Repurchase Agreements
The Fund may invest in repurchase and reverse repurchase agreements. In a repurchase agreement, the Fund purchases a security and simultaneously commits to resell that security to the seller at an agreed upon price on an agreed upon date within a number of days (usually not more than seven) from the date of purchase. The resale price consists of the purchase price plus an agreed upon incremental amount that is unrelated to the coupon rate or maturity of the purchased security. A repurchase agreement involves the obligation of the seller to pay the agreed upon price, which obligation is in effect secured by the value (at least equal to the amount of the agreed upon resale price and marked-to-market daily) of the underlying security or “collateral.”
Reverse repurchase agreements are transactions in which the Fund sells a security and simultaneously commits to repurchase that security from the buyer, such as a bank or broker-dealer, at an agreed upon price on an agreed upon future date. Reverse repurchase agreements involve the risk that the value of securities that the Fund is obligated to repurchase under the agreement may decline below the repurchase price. Additionally, such transactions are only advantageous if the interest cost to the Fund of the reverse repurchase transaction is less than the cost of obtaining the cash otherwise. Interest costs on the proceeds received in a reverse repurchase agreement may exceed the return received on the investments made by the Fund with those proceeds, resulting in reduced returns to shareholders. When the Fund enters into a reverse repurchase agreement, it is subject to the risk that the buyer (counterparty) may default on its obligations to the Fund. In the event of such a default, the Fund may experience delays, costs, and loss, all of which may reduce returns to shareholders. Investing reverse repurchase proceeds may also have a leveraging effect on the Fund’s portfolio. The Fund’s use of leverage can magnify the effect of any gains or losses, causing the Fund to be more volatile than if it had not been leveraged. There is no assurance that any leveraging strategy used by the Fund will be successful.
Restricted Security Transactions
Restricted securities held by the Fund may not be sold except in exempt transactions or in a public offering registered under the Securities Act of 1933, as amended. The risk of investing in such securities is generally greater than the risk of investing in the securities of widely held, publicly traded companies. Lack of a secondary market and resale restrictions may result in the inability of the Fund to sell a security at a fair price and may substantially delay the sale of the security. In addition, these securities may exhibit greater price volatility than securities for which secondary markets exist.
Securities Lending
Under procedures adopted by the Trustees, the Fund may seek to earn additional income through lending its securities to certain qualified broker-dealers and institutions on a short-term or long-term basis. The Fund may lend portfolio securities on a short-term or long-term basis, in an amount equal to up to 1/3 of its total assets as determined at the time of the loan origination. When the Fund lends its securities, it receives collateral (including cash collateral), at least equal to the value of securities loaned. The Fund may earn income by investing this collateral in one or more affiliated or nonaffiliated cash management vehicles. It is also possible that, due to a decline in the value of a cash management vehicle, the Fund may lose money. There is also the risk that when portfolio securities are lent, the securities may not be returned on a timely basis, and the Fund may experience delays and costs in recovering the security or gaining access to the collateral provided to the Fund to collateralize the loan. If the Fund is unable to recover a security on loan, the Fund may use the collateral to purchase replacement securities in the market. There is a risk that the value of the collateral could decrease below the cost of the replacement security by the time the replacement investment is made, resulting in a loss to the Fund. Janus Capital intends to manage the cash collateral in an affiliated cash management vehicle and will receive an investment advisory fee for managing such assets.
The borrower pays fees at the Fund’s direction to Deutsche Bank AG (the “Lending Agent”). The Lending Agent may retain a portion of the interest earned on the
42 | DECEMBER 31, 2011
cash collateral invested. The cash collateral invested by the Lending Agent is disclosed on the Consolidated Schedule of Investments (if applicable). The lending fees and the Fund’s portion of the interest income earned on cash collateral are included on the Consolidated Statement of Operations (if applicable).
The Fund did not have any securities on loan during the period ended December 31, 2011.
Short Sales
The Fund may engage in “short sales against the box.” Short sales against the box involve either selling short a security that the Fund owns or selling short a security that the Fund has the right to obtain, for delivery at a specified date in the future. The Fund may enter into short sales against the box to hedge against anticipated declines in the market price of portfolio securities. The Fund does not deliver from its portfolio the securities sold short and do not immediately receive the proceeds of the short sale. The Fund borrows the securities sold short and receives proceeds from the short sale only when it delivers the securities to the lender. If the value of the securities sold short increases prior to the scheduled delivery date, the Fund loses the opportunity to participate in the gain.
The Fund may also engage in other short sales. The Fund may engage in short sales when the portfolio managers anticipate that a security’s market purchase price will be less than its borrowing price. To complete the transaction, the Fund must borrow the security to deliver it to the purchaser and buy that same security in the market to return it to the lender. Although the potential for gain as a result of a short sale is limited to the price at which the Fund sold the security short less the cost of borrowing the security, the potential for loss is theoretically unlimited because there is no limit to the cost of replacing the borrowed security. There is no assurance the Fund will be able to close out a short position at a particular time or at an acceptable price. A gain or a loss will be recognized upon termination of a short sale. Short sales held by the Fund are fully collateralized by restricted cash or other securities, which are denoted on the accompanying Consolidated Schedule of Investments (if applicable). The Fund is also required to pay the lender of the security any dividends or interest that accrue on a borrowed security during the period of the loan. Depending on the arrangements made with the broker or custodian, the Fund may or may not receive any payments (including interest) on collateral it has deposited with the broker. The Fund pays stock loan fees, disclosed on the Consolidated Statement of Operations (if applicable), on assets borrowed from the security broker.
The Fund may also enter into short positions through derivative instruments, such as options contracts, futures contracts, and swap agreements, which may expose the Fund to similar risks. To the extent that the Fund enters into short derivative positions, the Fund may be exposed to risks similar to those associated with short sales, including the risk that the Fund’s losses are theoretically unlimited.
Sovereign Debt
Investments in foreign government debt securities (“sovereign debt”) can involve a high degree of risk including the risk that the governmental entity that controls the repayment of sovereign debt may not be willing or able to repay the principal and/or to pay the interest on its sovereign debt in a timely manner. A sovereign debtor’s willingness or ability to satisfy its debt obligation may be affected by various factors including its cash flow situation, the extent of its foreign currency reserves, the availability of foreign exchange when a payment is due, the relative size of its debt position in relation to its economy as a whole, the sovereign debtor’s policy toward international lenders, and local political constraints to which the governmental entity may be subject. Sovereign debtors may also be dependent on expected disbursements from foreign governments, multilateral agencies, and other entities. The failure of a sovereign debtor to implement economic reforms, achieve specified levels of economic performance, or repay principal or interest when due may result in the cancellation of third party commitments to lend funds to the sovereign debtor, which may further impair such debtor’s ability or willingness to timely service its debts. The Fund may be requested to participate in the rescheduling of such sovereign debt and to extend further loans to governmental entities which may adversely affect the Fund’s holdings. In the event of default, there may be limited or no legal remedies for collecting sovereign debt and there may be no bankruptcy proceedings through which the Fund may collect all or part of the sovereign debt that a governmental entity has not repaid.
When-Issued Securities
The Fund may purchase or sell securities on a when-issued or forward commitment basis. The price of the underlying securities and date when the securities will be delivered and paid for are fixed at the time the transaction is negotiated. Losses may arise due to changes in the market value of the securities or from the inability of counterparties to meet the terms of the contract. In connection with such purchases, the Fund may hold liquid assets as collateral with the Fund’s custodian sufficient to cover the purchase price.
Janus Alternative Fund | 43
Notes to Financial Statements (unaudited) (continued)
| |
| 4. | Basis for Consolidation for Janus Real Return Allocation Fund |
The Subsidiary was incorporated on April 19, 2011 as a wholly owned subsidiary of Janus Real Return Allocation Fund. The Fund will seek to gain exposure to the commodity markets, in whole or in part, through investments by the Subsidiary and which is generally subject to the same investment policies and restrictions of the Fund. As of December 31, 2011, net assets of the Fund were $39,745,933, of which $3,947,230, or approximately 10%, represented the Fund’s ownership of the shares of the Subsidiary. Janus Real Return Allocation Fund’s Consolidated Schedule of Investments, Consolidated Statement of Assets and Liabilities, Consolidated Statement of Operations, and Consolidated Statement of Changes in Net Assets include the accounts of both Janus Real Return Allocation Fund and the Subsidiary. All inter-company transactions and balances have been eliminated in consolidation.
| |
| 5. | Investment Advisory Agreements and Other Transactions with Affiliates |
The Fund and the Subsidiary each pay Janus Capital an investment advisory fee which is calculated daily and paid monthly. The following table reflects the Fund’s contractual investment advisory fee rate (expressed as an annual rate). The investment advisory fee rate is aggregated to include all investment advisory and subadvisory fees paid by the Fund.
The rate shown is a fixed rate based on the Fund’s average daily net assets.
| | | | | | | | | |
| | | | | Contractual
| | |
| | | Average Daily
| | Investment
| | |
| | | Net Assets
| | Advisory Fee
| | |
| Fund | | of the Fund | | (%) (annual rate) | | |
| |
| |
| Janus Real Return Allocation Fund | | First $ | 3 Billion | | | 0.75 | | |
| | | Over $ | 3 Billion | | | 0.72 | | |
| |
| |
Janus Capital has contractually agreed to waive a portion of the Fund’s management fee in an amount equal to the management fee paid to Janus Capital by the Subsidiary. The management fee waiver arrangement related to the Subsidiary may not be discontinued by Janus Capital as long as its contract with the Subsidiary is in place.
Armored Wolf, LLC (“Armored Wolf”) serves as a subadviser to the Fund and to the Subsidiary, and provides advisory services to the Fund related to inflation-linked securities, emerging market debt, commodity-linked investments and participates in overall investment category allocation determinations. Armored Wolf has been in the investment management business since 2008 and provides day-to-day management of certain portions of the Fund, as well as other mutual funds and other accounts.
Janus Capital has contractually agreed to waive the Fund’s total annual fund operating expenses, which include the expenses of the Subsidiary (excluding the distribution and shareholder servicing fees applicable to Class A Shares, Class C Shares, and Class S Shares, administrative services fees payable pursuant to the Transfer Agency Agreement (except for networking and omnibus fees), brokerage commissions, interest, dividends, taxes, acquired fund fees and expenses, and extraordinary expenses) to 1.00% until at least November 1, 2012. The contractual waiver may be terminated or modified prior to this date only at the discretion of the Board of Trustees.
For a period of three years subsequent to the Fund’s commencement of operations or until the Fund’s assets exceed the first breakpoint in the investment advisory fee schedule, whichever occurs first, Janus Capital may recover from the Fund fees and expenses previously waived or reimbursed, which could then be considered a deferral, if the Fund’s expense ratio, including recovered expenses, falls below the expense limit. This recoupment of such reimbursements expires May 13, 2014. For the period ended December 31, 2011, total reimbursement by Janus Capital was $458,203 for the Fund. As of December 31, 2011, the aggregate amount of recoupment that may be potentially made to Janus Capital is $697,538.
State Street Bank and Trust Company (“State Street”) provides certain accounting services to the Fund and the Subsidiary as part of the custodial and fund accounting arrangement, including calculating the daily NAV of each share class and certain compliance-related functions. State Street also provides certain administration services to the Fund, including services related to the Fund’s audit, tax, and reporting obligations, pursuant to an Agreement with the Trust, on behalf of the Fund. As compensation for such services, the Fund pays State Street a flat fee. Janus Capital serves as administrator to the Fund. With respect to other administration services, such as recordkeeping, and state monitoring and registration functions, Janus Capital does not receive any compensation for these services but may be reimbursed for out-of-pocket expenses by the Fund. Additionally, the Subsidiary has entered into separate agreements with State Street related to custodian, accounting, and transfer agency services related to the Subsidiary. Compensation to State Street for such services is indirectly borne by the Fund.
Janus Services LLC (“Janus Services”), a wholly-owned subsidiary of Janus Capital, is the Fund’s transfer agent. In addition, Janus Services provides or arranges for the provision of certain other administrative services including,
44 | DECEMBER 31, 2011
but not limited to, recordkeeping, accounting, order processing, and other shareholder services for the Fund.
Certain, but not all, intermediaries may charge administrative fees to investors in Class A Shares, Class C Shares, and Class I Shares for administrative services provided on behalf of such investors. These administrative fees are paid by the Class A Shares, Class C Shares, and Class I Shares of the Fund to Janus Services, which uses such fees to reimburse intermediaries. Consistent with the Transfer Agency Agreement between Janus Services and the Fund, Janus Services may negotiate the level, structure, and/or terms of the administrative fees with intermediaries requiring such fees on behalf of the Fund. Janus Capital and its affiliates benefit from an increase in assets that may result from such relationships.
Class D Shares of the Fund pays an annual administrative services fee of 0.12% of net assets. These administrative services fees are paid by the Shares of the Fund for shareholder services provided by Janus Services.
Janus Services receives an administrative services fee at an annual rate of 0.25% of the average daily net assets of Class S Shares and Class T Shares of the Fund for providing or procuring administrative services to investors in Class Shares and Class T Shares of the Fund. Janus Services expects to use all or a significant portion of this fee to compensate retirement plan service providers, broker-dealers, bank trust departments, financial advisors, and other financial intermediaries for providing these services. Janus Services or its affiliates may also pay fees for services provided by intermediaries to the extent the fees charged by intermediaries exceed the 0.25% of net assets charged to Class S Shares and Class T Shares of the Fund.
Services provided by these financial intermediaries may include, but are not limited to, recordkeeping, subaccounting, order processing, providing periodic statements, forwarding prospectuses, shareholder reports, and other materials to existing customers and other administrative services. Order processing includes the submission of transactions through the National Securities Clearing Corporation (“NSCC”) or similar systems, or those processed on a manual basis with Janus Capital.
Janus Distributors LLC (“Janus Distributors”), a wholly-owned subsidiary of Janus Capital, is the distributor of the Fund. The Fund has adopted a Distribution and Shareholder Servicing Plan (the “Plan”) pursuant to Rule 12b-1 under the 1940 Act. The Plan authorizes payments by the Fund at an annual rate, as determined from time to time by the Board of Trustees, of up to 0.25% of the Class A Shares average daily net assets, of up to 1.00% of the Class C Shares average daily net assets, and of up to 0.25% of the Class S Shares average daily net assets. Payments under the Plan are not tied exclusively to actual distribution and shareholder service expenses, and the payments may exceed distribution and shareholder service expenses actually incurred by the Fund. If any of the Fund’s actual distribution and shareholder service expenses incurred during a calendar year are less than the payments made during a calendar year, the Fund will be refunded the difference. Refunds, if any, are included in “Distribution fees and shareholder servicing fees” in the Consolidated Statement of Operations.
The Board of Trustees has adopted a deferred compensation plan (the “Deferred Plan”) for independent Trustees to elect to defer receipt of all or a portion of the annual compensation they are entitled to receive from the Fund. All deferred fees are credited to an account established in the name of the Trustees. The amounts credited to the account then increase or decrease, as the case may be, in accordance with the performance of one or more of the Janus funds that are selected by the Trustees. The account balance continues to fluctuate in accordance with the performance of the selected fund or funds until final payment of all amounts are credited to the account. The fluctuation of the account balance is recorded by the Fund as unrealized appreciation/ (depreciation) and is shown as of December 31, 2011 on the Consolidated Statement of Assets and Liabilities as an asset, “Non-interested Trustees’ deferred compensation,” and a liability, “Non-interested Trustees’ deferred compensation fees.” Additionally, the recorded unrealized appreciation/(depreciation) is included in “Unrealized net appreciation/(depreciation) of investments, foreign currency translations and non-interested Trustees’ deferred compensation” on the Consolidated Statement of Assets and Liabilities. Deferred compensation expenses for the period ended December 31, 2011 are included in “Non-interested Trustees’ fees and expenses” on the Consolidated Statement of Operations. Trustees are allowed to change their designation of mutual funds from time to time. Amounts will be deferred until distributed in accordance with the Deferred Plan. No deferred fees were distributed to any Trustee under the Deferred Plan during the period ended December 31, 2011.
Certain officers of the Fund may also be officers and/or directors of Janus Capital. Such officers receive no compensation from the Fund, except for the Fund’s Chief Compliance Officer. The Fund reimburses Janus Capital for a portion of the compensation paid to the Chief Compliance Officer and certain compliance staff of the Trust. Total compensation of $286,615 was paid by the Trust during the period ended December 31, 2011. The Fund’s portion is reported as part of “Other Expenses” on the Consolidated Statement of Operations.
Janus Alternative Fund | 45
Notes to Financial Statements (unaudited) (continued)
Class A Shares include a 5.75% upfront sales charge of the offering price of the Fund. The sales charge is allocated between Janus Distributors and financial intermediaries. During the period ended December 31, 2011, Janus Distributors retained $15 of upfront sales charges for Class A Shares.
A contingent deferred sales charge of 1.00% will be deducted with respect to Class A Shares purchased without a sales load and redeemed within 12 months of purchase, unless waived, as discussed in the Prospectus. Any applicable CDSC will be 1.00% of the lesser of the original purchase price or the value of the redemption of the Class A Shares redeemed. There were no contingent deferred sales charges paid by redeeming shareholders of Class A Shares to Janus Distributors during the period ended December 31, 2011.
Class C Shares include a 1.00% contingent deferred sales charge paid by redeeming shareholders to Janus Distributors. The contingent deferred sales charge applies to shares redeemed within 12 months of purchase. The redemption price may differ from the net asset value per share. During the period ended December 31, 2011, there were contingent deferred sales charges for Class C Shares of $108.
The Fund’s expenses may be reduced by expense offsets from an unaffiliated custodian and/or transfer agent. Such credits or offsets are included in “Expense and Fee Offset” on the Consolidated Statement of Operations (if applicable). The transfer agent fee offsets received during the period reduce “Transfer agent fees and expenses” on the Consolidated Statement of Operations (if applicable). Custodian offsets received reduce “Custodian fees” on the Consolidated Statement of Operations (if applicable). The Fund could have employed the assets used by the custodian and/or transfer agent to produce income if it had not entered into an expense offset arrangement.
Pursuant to the terms and conditions of an SEC exemptive order and the provisions of the 1940 Act, the Fund may participate in an affiliated or nonaffiliated cash sweep program. In the cash sweep program, uninvested cash balances of the Fund may be used to purchase shares of affiliated or nonaffiliated money market funds or cash management pooled investment vehicles. The Fund is eligible to participate in the cash sweep program (the “Investing Fund”). Janus Cash Liquidity Fund LLC is an affiliated unregistered cash management pooled investment vehicle that invests primarily in highly-rated short-term fixed- income securities. Janus Cash Liquidity Fund LLC currently maintains a NAV of $1.00 per share and distributes income daily in a manner consistent with a registered 2a-7 product. There are no restrictions on the Fund’s ability to withdraw investments from Janus Cash Liquidity Fund LLC at will, and there are no unfunded capital commitments due from the Fund to Janus Cash Liquidity Fund LLC. As adviser, Janus Capital has an inherent conflict of interest because of its fiduciary duties to the affiliated cash management pooled investment vehicles and the Investing Fund.
During the period ended December 31, 2011, the Fund recorded distributions from affiliated investment companies as affiliated dividend income, and had the following affiliated purchases and sales:
| | | | | | | | | | | | | | | |
| | | Purchases
| | Sales
| | Dividend
| | Value
| | |
| | | Shares/Cost | | Shares/Cost | | Income | | at 12/31/11 | | |
| |
Janus Real Return Allocation Fund | | | | | | | | | | | | | | |
| Janus Cash Liquidity Fund LLC | | $ | 23,147,994 | | $ | (21,638,980) | | $ | 4,076 | | $ | 8,954,042 | | |
| |
| |
Janus Capital or an affiliate invested and/or redeemed initial seed capital during the period ended December 31, 2011 as indicated in the following table.
| | | | | | | | | | | | | | | | | | | |
| | | Seed Capital at
| | | | Date of
| | | | Date of
| | Seed Capital
|
| | | 6/30/11 | | Purchases | | Purchases | | Redemptions | | Redemptions | | at 12/31/11 |
| |
| Janus Real Return Allocation Fund – Class A Shares | | $ | 6,666,666 | | $ | – | | | – | | $ | – | | | – | | $ | 6,666,666 |
| Janus Real Return Allocation Fund – Class C Shares | | | 6,666,666 | | | – | | | – | | | – | | | – | | $ | 6,666,666 |
| Janus Real Return Allocation Fund – Class D Shares | | | 6,666,667 | | | – | | | – | | | – | | | – | | $ | 6,666,667 |
| Janus Real Return Allocation Fund – Class I Shares | | | 6,666,667 | | | – | | | – | | | – | | | – | | $ | 6,666,667 |
| Janus Real Return Allocation Fund – Class S Shares | | | 6,666,667 | | | – | | | – | | | – | | | – | | $ | 6,666,667 |
| Janus Real Return Allocation Fund – Class T Shares | | | 6,666,667 | | | – | | | – | | | – | | | – | | $ | 6,666,667 |
| |
| |
Income and capital gains distributions are determined in accordance with income tax regulations that may differ from accounting principles generally accepted in the United States of America. These differences are due to differing treatments for items such as net short-term gains, deferral of wash sale losses, foreign currency transactions, net investment losses and capital loss carryovers.
46 | DECEMBER 31, 2011
The Fund has elected to treat gains and losses on forward foreign currency contracts as capital gains and losses, if applicable. Other foreign currency gains and losses on debt instruments are treated as ordinary income for federal income tax purposes pursuant to Section 988 of the Internal Revenue Code.
The aggregate cost of investments and the composition of unrealized appreciation and depreciation of investment securities for federal income tax purposes as of December 31, 2011 are noted below.
Unrealized appreciation and unrealized depreciation in the table below exclude appreciation/(depreciation) on foreign currency translations. The primary differences between book and tax appreciation or depreciation of investments are wash sale loss deferrals, options, forward foreign currency and futures contracts, and passive foreign investment companies.
| | | | | | | | | | | | | | | |
| | | Federal Tax
| | Unrealized
| | Unrealized
| | Net
| | |
| Fund | | Cost | | Appreciation | | (Depreciation) | | (Depreciation) | | |
| |
| Janus Real Return Allocation Fund | | $ | 42,442,577 | | $ | 870,068 | | $ | (1,473,270) | | $ | (603,202) | | |
| |
| |
The expense ratios listed in the Financial Highlights reflect expenses prior to any expense offsets (gross expense ratio) and after expense offsets (net expense ratio). Both expense ratios reflect expenses after waivers (reimbursement). Listed below are the gross expense ratios for the Fund that would have been in effect, absent the waiver of certain fees and offsets.
| | | | | | |
| For the six-month period ended December 31, 2011 | | | | |
| |
| Class A Shares | | | | | |
| 2011 | | | 3.52% | | |
2011(1) | | | 5.68% | | |
| |
| |
| Class C Shares | | | | | |
| 2011 | | | 4.23% | | |
2011(1) | | | 6.43% | | |
| |
| |
| Class D Shares | | | | | |
| 2011 | | | 3.67% | | |
2011(1) | | | 5.96% | | |
| |
| |
| Class I Shares | | | | | |
| 2011 | | | 3.22% | | |
2011(1) | | | 5.43% | | |
| |
| |
| Class S Shares | | | | | |
| 2011 | | | 3.73% | | |
2011(1) | | | 5.93% | | |
| |
| |
| Class T Shares | | | | | |
| 2011 | | | 3.47% | | |
2011(1) | | | 5.68% | | |
| |
| |
| | | |
| (1) | | Period from May 13, 2011 (inception date) through June 30, 2011. |
Janus Alternative Fund | 47
Notes to Financial Statements (unaudited) (continued)
| |
| 8. | Capital Share Transactions |
| | | | | | | | | | | |
| | | Janus
| | | |
For the six-month period ended December 31, 2011
| | Real Return
| | | |
and the fiscal period ended June 30
| | Allocation Fund | | | |
| (all numbers in thousands) | | 2011 | | | 2011(1) | | | |
| |
| Transactions in Fund Shares — Class A Shares: | | | | | | | | | | |
| Shares Sold | | | 120 | | | | 669 | | | |
| Reinvested dividends and distributions | | | 7 | | | | – | | | |
| Shares repurchased | | | (86) | | | | – | | | |
| Net Increase/(Decrease) in Fund Shares | | | 41 | | | | 669 | | | |
| Shares Outstanding, Beginning of Period | | | 669 | | | | – | | | |
| Shares Outstanding, End of Period | | | 710 | | | | 669 | | | |
| Transactions in Fund Shares — Class C Shares: | | | | | | | | | | |
| Shares Sold | | | 1 | | | | 667 | | | |
| Reinvested dividends and distributions | | | 6 | | | | – | | | |
| Shares repurchased | | | (1) | | | | – | | | |
| Net Increase/(Decrease) in Fund Shares | | | 6 | | | | 667 | | | |
| Shares Outstanding, Beginning of Period | | | 667 | | | | – | | | |
| Shares Outstanding, End of Period | | | 673 | | | | 667 | | | |
| Transactions in Fund Shares — Class D Shares: | | | | | | | | | | |
| Shares Sold | | | 100 | | | | 699 | | | |
| Reinvested dividends and distributions | | | 7 | | | | – | | | |
| Shares repurchased | | | (20) | | | | – | | | |
| Net Increase/(Decrease) in Fund Shares | | | 87 | | | | 699 | | | |
| Shares Outstanding, Beginning of Period | | | 699 | | | | – | | | |
| Shares Outstanding, End of Period | | | 786 | | | | 699 | | | |
| Transactions in Fund Shares — Class I Shares: | | | | | | | | | | |
| Shares Sold | | | 10 | | | | 683 | | | |
| Reinvested dividends and distributions | | | 7 | | | | – | | | |
| Shares repurchased | | | (1) | | | | – | | | |
| Net Increase/(Decrease) in Fund Shares | | | 16 | | | | 683 | | | |
| Shares Outstanding, Beginning of Period | | | 683 | | | | – | | | |
| Shares Outstanding, End of Period | | | 699 | | | | 683 | | | |
| Transactions in Fund Shares — Class S Shares: | | | | | | | | | | |
| Shares Sold | | | – | | | | 667 | | | |
| Reinvested dividends and distributions | | | 6 | | | | – | | | |
| Shares repurchased | | | – | | | | – | | | |
| Net Increase/(Decrease) in Fund Shares | | | 6 | | | | 667 | | | |
| Shares Outstanding, Beginning of Period | | | 667 | | | | – | | | |
| Shares Outstanding, End of Period | | | 673 | | | | 667 | | | |
| Transactions in Fund Shares — Class T Shares: | | | | | | | | | | |
| Shares Sold | | | 12 | | | | 667 | | | |
| Reinvested dividends and distributions | | | 7 | | | | – | | | |
| Shares repurchased | | | – | | | | – | | | |
| Net Increase/(Decrease) in Fund Shares | | | 19 | | | | 667 | | | |
| Shares Outstanding, Beginning of Period | | | 667 | | | | – | | | |
| Shares Outstanding, End of Period | | | 686 | | | | 667 | | | |
| | | |
| (1) | | Period from May 13, 2011 (inception date) through June 30, 2011. |
48 | DECEMBER 31, 2011
| |
| 9. | Purchases and Sales of Investment Securities |
For the period ended December 31, 2011, the aggregate cost of purchases and proceeds from sales of investment securities (excluding short-term securities and options contracts) was as follows:
| | | | | | | | | | | | | | | | |
| | | | | | | Purchase of Long-
| | Proceeds from Sales
| | |
| | | Purchases of
| | Proceeds from Sales
| | Term U.S. Government
| | of Long-Term U.S.
| | |
| Fund | | Securities | | of Securities | | Obligations | | Government Obligations | | |
| |
| |
| Janus Real Return Allocation Fund | | $ | 8,154,166 | | $ | 5,865,875 | | $ | 684,358 | | $ | 767,064 | | | |
| |
| |
| |
| 10. | New Accounting Pronouncements |
In May 2011, the FASB issued Accounting Standards Update, “Amendments to Achieve Common Fair Value Measurement and Disclosure Requirements.” The Accounting Standards Update requires disclosures about amounts and reasons for all transfers in and out of Level 1 and Level 2 fair value measurements. In addition, the Accounting Standards Update will require reporting entities to disclose the following information for fair value measurements categorized with Level 3 of the fair value hierarchy: quantitative information about the unobservable inputs used in the fair value measurement, the valuation processes used by the reporting entity, and a narrative description of the sensitivity of the fair value measurement to changes in unobservable inputs and the interrelationships between those unobservable inputs. This disclosure is effective for fiscal years beginning after December 15, 2011, and for interim periods within those fiscal years. Management is currently evaluating the impact these amendments may have on the Fund’s financial statements.
Management has evaluated whether any other events or transactions occurred subsequent to December 31, 2011 and through the date of issuance of the Fund’s financial statements and determined that there were no other material events or transactions that would require recognition or disclosure in the Fund’s financial statements.
Janus Alternative Fund | 49
Additional Information (unaudited)
Proxy Voting Policies and Voting Record
A description of the policies and procedures that the Fund uses to determine how to vote proxies relating to its portfolio securities is available without charge: (i) upon request, by calling 1-800-525-0020 (toll free); (ii) on the Fund’s website at janus.com/proxyvoting; and (iii) on the SEC’s website at http://www.sec.gov. Additionally, information regarding the Fund’s proxy voting record for the most recent twelve-month period ended June 30 is also available, free of charge, through janus.com/proxyvoting and from the SEC’s website at http://www.sec.gov.
Quarterly Portfolio Holdings
The Fund files its complete portfolio holdings (consolidated schedule of investments) with the SEC for the first and third quarters of each fiscal year on Form N-Q within 60 days of the end of such fiscal quarter. The Fund’s Form N-Q: (i) is available on the SEC’s website at http://www.sec.gov; (ii) may be reviewed and copied at the SEC’s Public Reference Room in Washington, D.C. (information on the Public Reference Room may be obtained by calling 1-800-SEC-0330); and (iii) is available without charge, upon request, by calling Janus at 1-800-525-0020 (toll free).
50 | DECEMBER 31, 2011
Explanations of Charts, Tables and
Financial Statements (unaudited)
Performance overview graphs compare the performance of a hypothetical $10,000 investment in the Fund (from inception) with one or more widely used market indices. The hypothetical example does not represent the returns of any particular investment.
When comparing the performance of the Fund with an index, keep in mind that market indices do not include brokerage commissions that would be incurred if you purchased the individual securities in the index. They also do not include taxes payable on dividends and interest or operating expenses incurred if you maintained the Fund invested in the index.
Average annual total returns are also quoted for the Fund. Average annual total return is calculated by taking the growth or decline in value of an investment over a period of time, including reinvestment of dividends and distributions, then calculating the annual compounded percentage rate that would have produced the same result had the rate of growth been constant throughout the period. Average annual total return does not reflect the deduction of taxes that a shareholder would pay on Fund distributions or redemptions of Fund shares.
Pursuant to federal securities rules, expense ratios shown in the performance chart reflect subsidized and unsubsidized ratios for the past fiscal year. The total annual fund operating expenses ratio is gross of any fee waivers, reflecting the Fund’s unsubsidized expense ratio. The net annual fund operating expenses ratio (if applicable) includes contractual waivers of Janus Capital and/or Janus Services and reflects the Fund’s subsidized expense ratio. Both the total annual fund operating expenses ratio and net annual fund operating expenses ratio are estimated for the fiscal year. The ratios also include expenses indirectly incurred by the Fund as a result of investing in other investment companies or pooled investments, which are not reflected in the “Financial Highlights” of this report. As a result, these ratios may be higher or lower than those shown in the “Financial Highlights” in this report. All expenses are shown without the effect of expense offset arrangements. Pursuant to such arrangements, credits realized as a result of uninvested cash balances are used to reduce custodian and transfer agent expenses.
| |
| 2. | Consolidated Schedule of Investments |
Following the performance overview section is the Fund’s Consolidated Schedule of Investments. This schedule reports the industry concentrations and types of securities held in the Fund on the last day of the reporting period. Securities are usually listed by type (common stock, corporate bonds, U.S. Government obligations, etc.) and by industry classification (banking, communications, insurance, etc.). Holdings are subject to change without notice.
The value of each security is quoted as of the last day of the reporting period. The value of securities denominated in foreign currencies is converted into U.S. dollars.
If the Fund invests in foreign securities, it will also provide a summary of investments by country. This summary reports the Fund’s exposure to different countries by providing the percentage of securities invested in each country. The country of each security represents the country in which the company is incorporated. The Fund’s Consolidated Schedule of Investments relies upon the industry group and country classifications published by Bloomberg L.P.
| |
| 2a. | Forward Currency Contracts |
A table listing forward currency contracts follows the Fund’s Consolidated Schedule of Investments (if applicable). Forward currency contracts are agreements to deliver or receive a preset amount of currency at a future date. Forward currency contracts are used to hedge against foreign currency risk in the Fund’s long-term holdings.
The table provides the name of the foreign currency, the settlement date of the contract, the amount of the contract, the value of the currency in U.S. dollars and the amount of unrealized gain or loss. The amount of unrealized gain or loss reflects the change in currency exchange rates from the time the contract was opened to the last day of the reporting period.
A table listing futures contracts follows the Fund’s Consolidated Schedule of Investments (if applicable). Futures contracts are contracts that obligate the buyer to receive and the seller to deliver an instrument or money at a specified price on a specified date. Futures are used to hedge against adverse movements in securities prices, currency risk or interest rates.
The table provides the name of the contract, number of contracts held, the expiration date, the principal amount, value and the amount of unrealized gain or loss. The amount of unrealized gain or loss reflects the marked-to-market amount for the last day of the reporting period.
A table listing written options contracts follows the Fund’s Consolidated Schedule of Investments (if applicable).
Janus Alternative Fund | 51
Explanations of Charts, Tables and
Financial Statements (unaudited) (continued)
Written options contracts are contracts that obligate the Fund to sell or purchase an underlying security at a fixed price, upon exercise of the option. Options are used to hedge against adverse movements in securities prices, currency risk or interest rates.
The table provides the name of the contract, number of contracts held, the expiration date, exercise price, value and premiums received.
| |
| 3. | Consolidated Statement of Assets and Liabilities |
This statement is often referred to as the “balance sheet.” It lists the assets and liabilities of the Fund on the last day of the reporting period.
The Fund’s assets are calculated by adding the value of the securities owned, the receivable for securities sold but not yet settled, the receivable for dividends declared but not yet received on stocks owned and the receivable for Fund shares sold to investors but not yet settled. The Fund’s liabilities include payables for securities purchased but not yet settled, Fund shares redeemed but not yet paid and expenses owed but not yet paid. Additionally, there may be other assets and liabilities such as unrealized gain or loss on forward currency contracts.
The section entitled “Net Assets Consist of” breaks down the components of the Fund’s net assets. Because the Fund must distribute substantially all earnings, you will notice that a significant portion of net assets is shareholder capital.
The last section of this statement reports the net asset value (“NAV”) per share on the last day of the reporting period. The NAV is calculated by dividing the Fund’s net assets (assets minus liabilities) by the number of shares outstanding.
| |
| 4. | Consolidated Statement of Operations |
This statement details the Fund’s income, expenses, gains and losses on securities and currency transactions, and appreciation or depreciation of current Fund holdings.
The first section in this statement, entitled “Investment Income,” reports the dividends earned from stocks and interest earned from interest-bearing securities in the Fund.
The next section reports the expenses incurred by the Fund, including the advisory fee paid to the investment adviser, transfer agent fees and expenses, and printing and postage for mailing statements, financial reports and prospectuses. Expense offsets and expense reimbursements, if any, are also shown.
The last section lists the increase or decrease in the value of securities held in the Fund. The Fund will realize a gain (or loss) when it sells its position in a particular security. An unrealized gain (or loss) refers to the change in net appreciation or depreciation of the Fund during the reporting period. “Net Realized and Unrealized Gain/(Loss) on Investments” is affected both by changes in the market value of Fund holdings and by gains (or losses) realized during the reporting period.
| |
| 5. | Consolidated Statements of Changes in Net Assets |
These statements report the increase or decrease in the Fund’s net assets during the reporting period. Changes in the Fund’s net assets are attributable to investment operations, dividends, distributions and capital share transactions. This is important to investors because it shows exactly what caused the Fund’s net asset size to change during the period.
The first section summarizes the information from the Consolidated Statement of Operations regarding changes in net assets due to the Fund’s investment performance. The Fund’s net assets may also change as a result of dividend and capital gains distributions to investors. If investors receive their dividends in cash, money is taken out of the Fund to pay the distribution. If investors reinvest their dividends, the Fund’s net assets will not be affected. If you compare the Fund’s “Net Decrease from Dividends and Distributions” to the “Reinvested dividends and distributions,” you will notice that dividend distributions had little effect on the Fund’s net assets. This is because the majority of Janus investors reinvest their distributions.
The reinvestment of dividends is included under “Capital Share Transactions.” “Capital Shares” refers to the money investors contribute to the Fund through purchases or withdrawals via redemptions. “Redemption Fees” (if applicable) refers to the fee paid to the Fund for shares held for 90 days or less by a shareholder. The Fund’s net assets will increase and decrease in value as investors purchase and redeem shares from the Fund.
This schedule provides a per-share breakdown of the components that affect the Fund’s NAV for current and past reporting periods. Not only does this table provide you with total return, it also reports total distributions, asset size, expense ratios and portfolio turnover rate.
The first line in the table reflects the NAV per share at the beginning of the reporting period. The next line reports the net investment income per share, which comprises dividends and interest income earned on securities held
52 | DECEMBER 31, 2011
by the Fund. Following is the total of gains/(losses), realized and unrealized. Dividends and distributions are then subtracted to arrive at the NAV per share at the end of the period. The next line reflects the average annual total return reported the last day of the period. The total return may include adjustments in accordance with generally accepted accounting principles. As a result, the total return may differ from the total return reflected for shareholder transactions.
Also included are the expense ratios, or the percentage of average net assets that were used to cover operating expenses during the period. Expense ratios vary across Funds within the Trust for a number of reasons, including the differences in management fees, the frequency of dividend payments and the extent of foreign investments, which entail greater transaction costs.
The Fund’s expenses may be reduced through expense-reduction arrangements. These arrangements may include the use of balance credits or transfer agent fee offsets. The Consolidated Statement of Operations reflects total expenses before any such offset, the amount of the offset and the net expenses. The expense ratios listed in the Financial Highlights reflect total expenses prior to any expense offset (gross expense ratio) and after the expense offsets (net expense ratio). Both expense ratios reflect expenses after waivers (reimbursements), if applicable.
The ratio of net investment income/(loss) summarizes the income earned less expenses, divided by the average net assets of the Fund during the reporting period. Don’t confuse this ratio with the Fund’s yield. The net investment income ratio is not a true measure of the Fund’s yield because it doesn’t take into account the dividends distributed to the Fund’s investors.
The next figure is the portfolio turnover rate, which measures the buying and selling activity in the Fund. Portfolio turnover is affected by market conditions, changes in the asset size of the Fund, fluctuating volume of shareholder purchase and redemption orders, the nature of the Fund’s investments and the investment style and/or outlook of the portfolio managers. A 100% rate implies that an amount equal to the value of the entire portfolio was replaced once during the fiscal year; a 50% rate means that an amount equal to the value of half the portfolio is traded in a year; and a 200% rate means that an amount equal to the value of the entire portfolio is traded every six months.
Janus Alternative Fund | 53
Janus provides access to a wide range of investment disciplines.
Alternative
Janus alternative funds seek to deliver strong risk-adjusted returns over a full market cycle with lower correlation to equity markets than traditional investments.
Asset Allocation
Janus’ asset allocation funds utilize our fundamental, bottom-up research to balance risk over the long term. From fund options that meet investors’ risk tolerance and objectives to a method that incorporates non-traditional investment choices to seek non-correlated sources of risk and return, Janus’ asset allocation funds aim to allocate risk more effectively.
Fixed Income
Janus fixed income funds attempt to provide less risk relative to equities while seeking to deliver a competitive total return through high current income and appreciation. Janus money market funds seek capital preservation and liquidity with current income as a secondary objective.
Global & International
Janus global and international funds seek to leverage Janus’ research capabilities by taking advantage of inefficiencies in foreign markets, where accurate information and analytical insight are often at a premium.
Growth & Core
Janus growth funds focus on companies believed to be the leaders in their respective industries, with solid management teams, expanding market share, margins and efficiencies. Janus core funds seek investments in more stable and predictable companies. Our core funds look for a strategic combination of steady growth and, for certain funds, some degree of income.
Mathematical
Our mathematical funds seek to outperform their respective indices while maintaining a risk profile equal to or lower than the index itself. Managed by INTECH (a Janus subsidiary), these funds use a mathematical process in an attempt to build a more “efficient” portfolio than the index.
Value
Our value funds, managed by Perkins (a Janus subsidiary), seek to identify companies with favorable reward to risk characteristics by conducting rigorous downside analysis before determining upside potential.
For more information about our funds, contact your investment professional or go to janus.com/advisor/mutual-funds (or janus.com/allfunds if you hold Shares directly with Janus).
Please consider the charges, risks, expenses and investment objectives carefully before investing. For a prospectus or, if available, a summary prospectus containing this and other information, please call Janus at 877.33JANUS (52687) (or 800.525.3713 if you hold Shares directly with Janus); or download the file from janus.com/info (or janus.com/reports if you hold Shares directly with Janus). Read it carefully before you invest or send money.
Funds distributed by Janus Distributors LLC (02/12)
Investment products offered are: NOT FDIC-INSURED MAY LOSE VALUE NO BANK GUARANTEE
| |
| C-0112-127 | 125-24-93009 02-12 |
SEMIANNUAL REPORT
December 31, 2011
Janus Asset Allocation Fund
Janus World Allocation Fund(formerly named Janus Dynamic Allocation Fund)
HIGHLIGHTS
| |
| • | Portfolio management perspective |
| • | Investment strategy behind your fund |
| • | Fund performance, characteristics and holdings |
Table of Contents
Janus Asset Allocation Fund
| | | |
| | 1 |
| | 3 |
| | |
| | 4 |
| | 12 |
| | 14 |
| | 15 |
| | 16 |
| | 19 |
| | 20 |
| | 43 |
| | 46 |
Please consider the charges, risks, expenses and investment objectives carefully before investing. For a prospectus containing this and other information, please call Janus at 877.33JANUS(52687); or download the file from janus.com/info. Read it carefully before you invest or send money.
Co-Chief Investment Officers’ Market Perspective (unaudited)
Jonathan Coleman
Co-Chief Investment
Officer
Gibson Smith
Co-Chief Investment
Officer
Euphoria & Despair
We would like to take this opportunity to thank you for investing with Janus.
If there’s a lesson to be learned from the tumult of 2011, it’s that there are lies, damn lies and strategist reports. Few of the talking heads predicted that Europe’s debt crisis would precipitate a global crisis of confidence. Even fewer predicted that emerging markets would plunge and long-dated Treasuries would beat nearly every other asset class. We take no joy in the folly of such fortunetelling. Our point is that it is very difficult to accurately predict macro outcomes. While the macro has had tremendous influence on the markets, we continue to believe that focusing on individual company analysis is the key to long term success.
Does this mean we ignore the macro? Not at all. At the forefront of our concerns is Europe’s debt crisis. Long-term, Europe will be more competitive if it succeeds in strengthening its monetary union and implements some fiscal unity. Yet measures the EU has agreed upon will be slow, painful and potentially destabilizing. We expect to see volatility as this messy process evolves, and we expect a euro-zone recession in 2012, slowing global growth.
The U.S. has its own political circus, of course, and uncertainty over fiscal policy is not helping confidence. Yet we believe the U.S. is in a fairly stable, low growth environment. Leading economic indicators have picked up and consumer confidence has rebounded to the highest levels since April 2011. Unfortunately, the sustainability of U.S. growth is subject to external shocks (i.e. Europe) and remains a major risk factor.
Equities: Corporate Dynamism Prevails
Corporate earnings growth has generally been strong, yet valuations reflect fears that it may not last. A major concern is that profit margins are near record levels and will likely revert to the historical mean. Based on our research and observations, however, many businesses appear highly attuned to protecting margins. Equity valuations look compelling, moreover, when paired with companies that are well positioned strategically.
In terms of investing themes, our analysts are finding opportunities across sectors. In energy, we see attractive potential in oil-field services and equipment companies, which are benefiting from rising levels of exploration and production. In health care, our analysts are focusing on companies with innovative drugs that address unmet medical needs. Our consumer team, meanwhile, sees opportunity in retailers that are leveraging technology to extend their global brand and gain market share.
Overall, we think this is an opportune time to own equities. Entry points look attractive based on recent multiples and projected growth rates. We think the odds are stacked in favor of equities, especially if they have growing free cash and competitive advantages that can enable them to gain share.
Fixed Income: Lower Rates for Longer
If there’s a fixed income theme for 2012 it’s that investors should get used to low rates. The Federal Reserve (Fed) has stressed that its zero-rate policy will continue through 2013. The real questions now are around QE3 (a third round of quantitative easing). We think the Fed isn’t ready to shoot this bullet yet, but will respond if it sees economic weakness. An additional theme for 2012 will be that central banks around the globe will continue to engage in loose monetary policies as the threat of slower growth remains high.
Against this backdrop, we continue to believe that corporate credit offers some of the best risk-adjusted returns. Profit margins are high and companies are accumulating cash on balance sheets. Moreover, management teams are being more careful with balance sheets. We think this conservatism will continue through 2012, fueling more free cash flow, liquidity in the system and, ultimately, support for investment grade and high yield bonds.
In other areas, we are balancing our “risk positions” with Treasuries, which we believe offer an insurance policy against extreme events and market volatility. With the markets remaining volatile, we think this allocation to Treasuries needs to be actively managed, and we expect
Janus Asset Allocation Fund | 1
(Continued) (unaudited)
to reduce our allocation to take advantage of opportunities as the market presents them.
Conclusion: Corporate Playbooks Can Still Create Value
Despite the difficult environment, we continue to identify companies that look well positioned to grow. Multiples are undemanding historically, and many businesses have proven they can maintain earnings and margins even in a weak demand environment. Maintaining balance in a portfolio is critical in this environment, however. As long term investors, we are always attuned to protecting on the downside, while attempting to find opportunities in the marketplace with the most attractive risk/reward. Long term, we think this offers the best way to achieve strong results.
Sincerely,
Jonathan Coleman
Co-Chief Investment Officer
Gibson Smith
Co-Chief Investment Officer
The opinions are those of the authors as of 12-2011 and are subject to change at any time due to changes in market or economic conditions. The comments should not be construed as a recommendation of individual holdings or market sectors, but as an illustration of broader themes.
There is no assurance that the investment process will consistently lead to successful investing.
Investing involves market risk. Investment return and value will fluctuate and it is possible to lose money by investing.
Foreign securities have additional risks including exchange rate changes, political and economic upheaval, the relative lack of information, relatively low market liquidity and the potential lack of strict financial and accounting controls and standards. These risks are magnified in emerging markets. The prices of foreign securities held by the fund, and therefore a fund’s performance, may decline in response to such risks.
U.S. Treasury securities are direct debt obligations issued by the U.S. Government. With government bonds, the investor is a creditor of the government. Treasury Bills and U.S. Government Bonds are guaranteed by the full faith and credit of the United States government, are generally considered to be free of credit risk and typically carry lower yields than other securities. Bonds in a portfolio are typically intended to provide income and/or diversification. In general, the bond market is volatile. Bond prices rise when interest rates fall and vice versa. This effect is usually pronounced for longer-term securities. Any fixed income security sold or redeemed prior to maturity may be subject to a substantial gain or loss.
Statements in this piece that reflect projections or expectations of future financial or economic performance of a mutual fund or strategy and of the markets in general and statements of a fund’s plans and objectives for future operations are forward-looking statements. Actual results or events may differ materially from those projected, estimated, assumed or anticipated in any such forward-looking statements. Important factors that could result in such differences, in addition to the other factors noted with such forward-looking statements, include general economic conditions such as inflation, recession and interest rates.
2 | DECEMBER 31, 2011
Useful Information About Your Fund Report (unaudited)
Management Commentary
The Management Commentary in this report includes valuable insight from the Fund’s manager as well as statistical information to help you understand how your Fund’s performance and characteristics stack up against those of comparable indices.
Please keep in mind that the opinions expressed by the Fund’s manager in the Management Commentary are just that: opinions. They are a reflection of the manager’s best judgment at the time this report was compiled, which was December 31, 2011. As the investing environment changes, so could the manager’s opinions. These views are unique to the manager and aren’t necessarily shared by fellow employees or by Janus in general.
Fund Expenses
We believe it’s important for our shareholders to have a clear understanding of Fund expenses and the impact they have on investment return.
The following is important information regarding the Fund’s Expense Example, which appears in the Fund’s Management Commentary within this Semiannual Report. Please refer to this information when reviewing the Expense Example for the Fund.
Example
As a shareholder of the Fund, you incur two types of costs: (1) transaction costs, including sales charges (loads) on purchase payments (applicable to Class A Shares only); redemption fees, where applicable (and any related exchange fees); and (2) ongoing costs, including management fees; distribution and shareholder servicing (12b-1) fees (applicable to Class A Shares, Class C Shares, and Class S Shares only); administrative services fees payable pursuant to the Transfer Agency Agreement; and other Fund expenses. The example is intended to help you understand your ongoing costs (in dollars) of investing in the Fund and to compare these costs with the ongoing costs of investing in other mutual funds. To do so, compare this 5% hypothetical example with the 5% hypothetical examples that appear in the shareholder reports of the other funds. The example is based upon an investment of $1,000 invested at the beginning of the period and held for the six-month period from July 1, 2011 to December 31, 2011.
Actual Expenses
The first line of the table in each example provides information about actual account values and actual expenses. You may use the information in this line, together with the amount you invested, to estimate the expenses that you paid over the period. Simply divide your account value by $1,000 (for example, an $8,600 account value divided by $1,000 = 8.6), then multiply the result by the number in the first line under the heading entitled “Expenses Paid During Period” to estimate the expenses you paid on your account during the period.
Hypothetical Example for Comparison Purposes
The second line of the table in each example provides information about hypothetical account values and hypothetical expenses based upon the Fund’s actual expense ratio and an assumed rate of return of 5% per year before expenses, which is not the Fund’s actual return. The hypothetical account values and expenses may not be used to estimate the actual ending account balance or expenses you paid for the period. You may use this information to compare the ongoing costs of investing in the Fund and other funds. To do so, compare this 5% hypothetical example with the 5% hypothetical examples that appear in the shareholder reports of the other funds.
Janus Capital Management LLC (“Janus Capital”) has contractually agreed to waive the Fund’s total annual fund operating expenses, excluding any expenses of an underlying fund (acquired fund fees and expenses), class-specific distribution and shareholder servicing (12b-1) fees (applicable to Class A Shares, Class C Shares, and Class S Shares only), administrative services fees payable pursuant to the Transfer Agency Agreement (except for networking and omnibus fees), brokerage commissions, interest, dividends, taxes, and extraordinary expenses, to certain limits until at least November 1, 2012. Expenses in the examples reflect application of these waivers. Had the waivers not been in effect, your expenses would have been higher. More information regarding the waivers is available in the Fund’s prospectuses.
Please note that the expenses shown in the tables are meant to highlight your ongoing costs only and do not reflect any transaction costs, such as underlying funds’ redemption fees (where applicable) and any related exchange fees. These fees are fully described in certain underlying funds’ prospectuses. Therefore, the second line of each table is useful in comparing ongoing costs only, and will not help you determine the relative total costs of owning different funds. In addition, if these transaction costs were included, your costs would have been higher.
Janus Asset Allocation Fund | 3
Janus World Allocation Fund (unaudited)
| | | | | | | |
Fund Snapshot
We believe that active asset allocation among investments with distinct risk/return profiles can provide long-term growth of capital and outperform peers over time. We determine asset allocation by isolating the drivers of risk and return; then allocate using a dynamic approach that seeks to take advantage of market movements to enhance returns during rallies and protect principal during declines.
| | | | | | 
Dan Scherman
portfolio manager |
Performance Overview
Janus World Allocation Fund’s Class I Shares returned -9.42% for the six-month period ended December 31, 2011. This compares to a return of -11.49% for the MSCI All Country World Index, the Fund’s primary benchmark, during the same period. These results compare to a -6.99% return by its secondary benchmark, the World Allocation Index, a hypothetical combination of unmanaged indices that combines total returns from the MSCI All Country World Index (65%) and the Barclays Capital Global Aggregate Bond Index (35%).
Market Review
Global stocks sold off significantly during the third quarter following a first-ever downgrade of U.S. government debt, rising concerns over global economic growth and worries that the European sovereign debt saga could worsen. The increasing probability of a default by Greece and investor disquiet over the U.S. Federal Reserve’s (Fed) downbeat economic outlook contributed to further declines. The Fed indicated it would maintain its near zero-interest rate policy through mid-2013 and announced it would increase its share of long-term Treasuries in an attempt to make credit cheaper and spur spending and investment. The Fed acknowledged “significant” downside risks to the economy and noted “strains” in the global financial markets. A weak reading on manufacturing in China added to the bearish environment. Equities rebounded somewhat in the fourth quarter on hopes European leaders were taking steps to resolve the region’s debt crisis. Improving economic data in the U.S. also aided sentiment. Following a period of spiking European government bond yields, particularly in Italy and Spain, and changes in governments in Greece, Italy and Spain, central banks announced a coordinated plan to make dollar funding cheaper for European banks. China also said the reserve requirement ratio for its banks would be lowered in an effort to boost liquidity after having raised the ratio six times during the year. Meanwhile, in the U.S., employment, manufacturing and housing data showed improvement.
Volatility and headline risk were central themes for fixed-income investors in the second half of 2011. A rally in U.S. Treasuries became especially pronounced from late July through September, as worry mounted that the U.S. economy might slip into a double-dip recession. Investors were troubled by below-expectation U.S. gross domestic product (GDP) growth, a manufacturing slowdown and persistently weak employment, housing and consumer spending figures. Concern about high government debt levels, both in the U.S. and Europe, only heightened this negative market sentiment. A high-stakes political standoff in Congress in July and August over raising the U.S. debt ceiling did nothing to improve the situation. Credit rating agency Standard & Poor’s subsequently lowered the U.S.’s sovereign credit rating to AA+ from AAA. The downgrade was followed, ironically, by a near stampede into U.S. Treasury securities, as the darkening global economic picture made Treasuries appear to be the safest haven available.
All eyes returned to Europe in the fall, as fiscal problems in the so-called PIIGS (Portugal, Italy, Ireland, Greece and Spain) countries threatened to spiral out of control. By October, it appeared that European Union (EU) leaders would manage to contain euro-zone problems, and relieved investors briefly ventured out of Treasuries in search of higher yields. But uncertainty flooded back in November, as governments in Greece and then Italy fell amid market pressure to implement fiscal reforms. The late-November failure of the U.S. Congressional “super committee” to reach a deal to cut $1.2 trillion from the U.S. deficit added to the general malaise. In December, some headway was made in Europe, as EU leaders announced a plan in which most members would agree to stricter fiscal rules and the European Central Bank (ECB) served up a larger-than-expected $641 billion in 3-year loans. This injected some calm into the markets as volume wound down for the holidays, although investors remained concerned that credit ratings would be downgraded on one or more of the 17 euro zone countries. Meanwhile,
4 | DECEMBER 31, 2011
(unaudited)
U.S. macroeconomic data continued to reflect a strengthening domestic economy.
From an asset class perspective, correlations spiked and remained high, meaning there were few places to hide from the volatility.
Investment Process
Janus World Allocation Fund is structured as a proprietary fund-of-funds, which means we have the ability to select from Janus, INTECH and Perkins funds currently available to shareholders. When we want exposure to an asset class not represented by any of these managers, we are free to invest outside our corporate umbrella, as we have done this period in the case of our commodities and foreign currency strategy investments.
Our choice of investments is driven not only by an evaluation of the quality and sustainability of fund performance, but also by our characterization of each underlying strategy as CORE, ALPHA or ALTS (Alternatives). While we employ very specific quantitative and qualitative criteria for inclusion in each of these “modules,” they can be simplified this way:
| |
| • | CORE strategies are stock and bond portfolios – both international and domestic – that seek to provide market-like exposure to the segments of the market in which each manager specializes. |
| |
| • | ALPHA strategies are those that seek market-beating performance more or less independent of investment style or asset class. |
| |
| • | ALTS strategies march to their own beat and seek to diversify some of the risks assumed by investing in CORE and ALPHA strategies. |
Once we’ve defined our investable universe and parsed it into these three categories, we then employ techniques such as mean-variance optimization (as well as a measured dose of qualitative judgment) to assemble each module independently. For example, in the CORE module, we mix and match the eligible CORE funds into a portfolio that best mimics what we believe represents “the market” to a modern investor. Next, we look across the roster of available ALPHA strategies to assemble a portfolio that gives us what we believe will be the greatest return in exchange for the least amount of risk. Finally, we assemble a portfolio of ALTS assets that we believe will have the lowest possible correlation with the first two modules in an effort to diversify away some of the risks inherent in investing in the other two.
Once the three individual modules are built, we attempt to combine them in a way designed to take advantage of both the benefits of asset class diversification and the current market environment. We do this not by allocating tactically among the modules, or by investing a set percentage of Fund assets in each asset class and then periodically rebalancing back toward those targets, but instead by allocating assets on the basis of how much risk we believe shareholders can bear. When we think risky assets are performing well, we systematically allocate more to the ALPHA module; when we think they are performing poorly, we systematically allocate a greater percentage to CORE.
Performance Review
The Fund outperformed its primary index due to its allocation to fixed income, which generated gains as compared to the significant losses for equities. The Fund underperformed its secondary benchmark, the World Allocation Index, due largely to weak performance among funds within the all-equity ALPHA sleeve. Our underweight in fixed income (26.4% average weight vs. 35%) also weighed on relative performance, although this was somewhat offset by our 12% average weight in ALTS, which had only a fractional loss.
Unsurprisingly, the Fund’s most aggressive strategies, Janus Overseas Fund and Janus Global Select Fund, based on their willingness to take on volatility, detracted the most from absolute performance. Both funds, as well as the third worst performer, Janus International Equity Fund, were negatively impacted by the poor performance of international equities relative to domestic stocks during the period. Janus Overseas Fund and Janus Global Select Fund are in the ALPHA sleeve, which we incrementally changed throughout the period in response to its performance.
We reduced the allocation to ALPHA in favor of the less aggressive CORE sleeve amid the volatility and in keeping with the standard rebalancing model. We also made incremental changes to the underlying fund allocations mostly by adding Perkins Global Value Fund, a conservatively positioned investment relative to Janus Overseas Fund and Janus Global Select Fund, which were both trimmed somewhat. We also reduced our allocations to Janus Forty Fund and Janus Contrarian Fund within the sleeve. While we feel the changes reduced the sleeve’s overall volatility, we think it is still aggressive enough to allow the Fund to fully participate in a market recovery.
We felt the ALTS sleeve did its job by providing a much needed ballast during the third quarter sell-off. It
Janus Asset Allocation Fund | 5
Janus World Allocation Fund (unaudited)
outperformed both the all-equity ALPHA and allocated/blended CORE sleeves for the six-month period. The most notable change within the ALTS sleeve was adding exposure to gold through the SPDR Gold Trust (ETF) and trimming our commodities investment, the iShares S&P GSCI Commodity – Indexed Trust (ETF). We have long been skeptical of gold amid its historic run-up, but have been increasingly drawn to its relatively low correlation to equities (which is extremely valuable in this highly correlated market) as well as its potential role as an inflation hedge. Meanwhile, traditional commodities have shown an increased propensity to trade in line with stocks. This made swapping some of our traditional commodity exposure for gold exposure more palatable. Nonetheless, gold retreated sharply during the latter half of the year. Near-term correlation to equities has also been unnaturally high, but we continue to believe in the long-term diversification benefits the metal can provide and increased our target allocation to it toward the end of the period. Meanwhile, the WisdomTree Dreyfus Chinese Yuan Fund (ETF) performed relatively well as the Fund’s third largest absolute contributor. Although we still believe the currency is an ideal ALTS asset with naturally low correlation to bonds and stocks as well as an asymmetric risk/return profile, we reduced our exposure. We feel the upside for the currency is more limited today than it was when we initiated the position given the currency’s recent appreciation.
The CORE sleeve also performed satisfactorily since it outperformed the World Allocation Index. Unsurprisingly, fixed income funds, Janus Flexible Bond Fund and Janus Global Bond Fund, were the largest absolute contributors for the sleeve and the Fund overall. The most significant change within the sleeve was increasing our exposure to Janus Global Bond Fund from Janus Flexible Bond Fund, which reflects the Fund’s global mandate adopted during the period. We believe investors are better served by a global mandate, since national borders are less relevant in our view than ever for investors and country constraints can prevent managers from taking advantage of opportunities.
Outlook
Looking forward, we are satisfied with the Fund’s current positioning, but we are looking for evidence that the environment has stabilized which could lead us to re-position more aggressively for growth.
Thank you for investing in Janus World Allocation Fund.
6 | DECEMBER 31, 2011
(unaudited)
Janus World Allocation Fund (% of Net Assets)
| | | | | |
Core | | | | |
INTECH International Fund(1) – Class I Shares | | | 2.1% | |
INTECH U.S. Growth Fund(2) – Class I Shares | | | 2.4% | |
INTECH U.S. Value Fund(3) – Class I Shares | | | 2.5% | |
| Janus Global Bond Fund – Class I Shares | | | 17.0% | |
| Janus Flexible Bond Fund – Class I Shares | | | 6.8% | |
| Janus Global Technology Fund – Class I Shares | | | 4.3% | |
| Janus Growth and Income Fund – Class I Shares | | | 0.0% | |
| Janus High-Yield Fund – Class I Shares | | | 3.4% | |
| Janus International Equity Fund – Class I Shares | | | 7.0% | |
| Janus Research Fund – Class I Shares | | | 0.7% | |
| Janus Short-Term Bond Fund – Class I Shares | | | 3.3% | |
| Janus Triton Fund – Class I Shares | | | 3.4% | |
| Perkins Global Value Fund – Class I Shares | | | 5.9% | |
| Perkins Large Cap Value Fund – Class I Shares | | | 1.0% | |
| Perkins Mid Cap Value Fund – Class I Shares | | | 2.4% | |
| Perkins Small Cap Value Fund – Class I Shares | | | 1.9% | |
Alpha | | | | |
| Janus Contrarian Fund – Class I Shares | | | 0.9% | |
| Janus Forty Fund – Class I Shares | | | 1.7% | |
| Janus Global Life Sciences Fund – Class I Shares | | | 5.1% | |
| Janus Global Select Fund – Class I Shares | | | 8.3% | |
| Janus Overseas Fund – Class I Shares | | | 8.1% | |
Alternative | | | | |
| iShares S&P GSCI Commodity – Indexed Trust (ETF) | | | 3.0% | |
Janus Global Market Neutral Fund(4) – Class I Shares | | | 1.3% | |
| Janus Global Real Estate Fund – Class I Shares | | | 1.8% | |
| SPDR Gold Trust (ETF) | | | 2.6% | |
| WisdomTree Dreyfus Chinese Yuan Fund (ETF) | | | 3.5% | |
| |
| |
| | | |
| (1) | | Formerly named INTECH Risk-Managed International Fund. |
| (2) | | Formerly named INTECH Risk-Managed Growth Fund. |
| (3) | | Formerly named INTECH Risk-Managed Value Fund. |
| (4) | | Formerly named Janus Long/Short Fund. |
Janus World Allocation Fund At A Glance
Asset Allocation – (% of Net Assets)
As of December 31, 2011
*Includes Cash and Cash Equivalents of (0.4)%.
Janus Asset Allocation Fund | 7
Janus World Allocation Fund (unaudited)
| | | | | | | | | | | | |
| Average Annual Total Return – for the periods ended December 31, 2011 | | | Expense Ratios – per the October 28, 2011 prospectuses |
| | | Fiscal
| | One
| | Since
| | | Total Annual Fund
| | Net Annual Fund
|
| | | Year-to-Date | | Year | | Inception* | | | Operating Expenses | | Operating Expenses |
| | | | | | | | | | | | |
| Janus World Allocation Fund – Class A Shares | | | | | | | | | | | |
| | | | | | | | | | | | |
| NAV | | –9.47% | | –7.97% | | –0.02% | | | 2.22% | | 1.39% |
| | | | | | | | | | | | |
| MOP | | –14.66% | | –13.24% | | –1.79% | | | | | |
| | | | | | | | | | | | |
| Janus World Allocation Fund – Class C Shares | | | | | | | | | | | |
| | | | | | | | | | | | |
| NAV | | –9.68% | | –8.61% | | –0.62% | | | 3.09% | | 2.14% |
| | | | | | | | | | | | |
| CDSC | | –10.52% | | –9.46% | | –0.62% | | | | | |
| | | | | | | | | | | | |
| Janus World Allocation Fund – Class I Shares | | –9.42% | | –8.00% | | 0.06% | | | 2.07% | | 1.14% |
| | | | | | | | | | | | |
| Janus World Allocation Fund – Class S Shares | | –9.41% | | –8.07% | | –0.19% | | | 2.45% | | 1.64% |
| | | | | | | | | | | | |
| Janus World Allocation Fund – Class T Shares | | –9.38% | | –7.87% | | 0.03% | | | 2.05% | | 1.39% |
| | | | | | | | | | | | |
| Morgan Stanley Capital International All Country World IndexSM | | –11.49% | | –7.35% | | –0.71% | | | | | |
| | | | | | | | | | | | |
| World Allocation Index | | –6.99% | | –2.72% | | 2.25% | | | | | |
| | | | | | | | | | | | |
| Lipper Quartile – Class I Shares | | – | | 3rd | | 3rd | | | | | |
| | | | | | | | | | | | |
| Lipper Ranking – based on total returns for Global Flexible Portfolio Funds | | – | | 179/253 | | 90/140 | | | | | |
| | | | | | | | | | | | |
| Visit janus.com/advisor/mutual-funds to view current performance and characteristic information | | | | | |
| | | | | | | | | | | | |
Data presented represents past performance, which is no guarantee of future results. Investment results and principal value will fluctuate so that shares, when redeemed, may be worth more or less than their original cost. Due to market volatility, current performance may be higher or lower than the performance shown. Call 877.33JANUS(52687) or visit janus.com/advisor/mutual-funds for performance current to the most recent month-end.
Performance shown for Class A Shares at Maximum Offering Price (MOP) includes the Fund’s maximum sales charge of 5.75%. Performance shown at Net Asset Value (NAV) does not include this charge and would have been lower had this charge been taken into account.
Performance shown for Class C Shares includes a 1% contingent deferred sales charge (CDSC) on periods of less than 12 months. Performance shown at Net Asset Value (NAV) does not include this sales charge and would have been lower had this sales charge been taken into account.
See important disclosures on the next page.
8 | DECEMBER 31, 2011
(unaudited)
A Fund which redeems or exchanges certain underlying funds’ shares held for 90 days or less may be subject to an underlying fund’s 2.00% redemption fee, if any.
Janus Capital has contractually agreed to waive the Fund’s total annual fund operating expenses allocated to any class (excluding any expenses of an underlying fund (acquired fund fees and expenses), the distribution and shareholder servicing fees (applicable to Class A Shares, Class C Shares, and Class S Shares), administrative services fees payable pursuant to the Transfer Agency Agreement (except for networking and omnibus fees), brokerage commissions, interest, dividends, taxes, and extraordinary expenses) to certain limits until at least November 1, 2012. The contractual waiver may be terminated or modified prior to this date only at the discretion of the Board of Trustees. Returns shown include fee waivers, if any, and without such waivers, returns would have been lower.
The expense information shown was determined based on net assets as of the fiscal period ended June 30, 2011. The effect of contractual waivers agreed to by Janus Capital, when applicable, are reflected under “Net Annual Fund Operating Expenses.” (All expenses are shown without the effect of expense offset arrangements. Pursuant to such arrangements, credits realized as a result of uninvested cash balances are used to reduce custodian and transfer agent expenses.)
The Fund’s and an underlying fund’s performance may be affected by risks that include those associated with nondiversification, non-investment grade debt securities, undervalued or overlooked companies, investments in specific industries or countries and potential conflicts of interest with the underlying funds. Additional risks to a Fund may also include, but are not limited to, those associated with investing in foreign securities, emerging markets, initial public offerings (“IPOs”), real estate investment trusts (“REITs”), derivatives and companies with relatively small market capitalizations. Each underlying fund has different risks. Please see a Janus prospectus or janus.com/info for more information about risks, portfolio holdings and other details.
Because Janus Capital is the adviser to the Fund and to the underlying funds held within the Fund, it is subject to certain potential conflicts of interest when allocating the assets of the Fund among underlying Janus funds. Performance of the Fund depends on that of the underlying funds, which are subject to the volatility of the financial markets.
Returns include reinvestment of dividends from net investment income and distributions from capital gains. The returns shown do not reflect the deduction of taxes that a shareholder would pay on Fund distributions or the redemption of Fund shares. The returns do not include adjustments in accordance with generally accepted accounting principles required at the period end for financial reporting purposes.
Class A Shares, Class C Shares, Class I Shares, Class S Shares, and Class T Shares of the Fund commenced operations on July 6, 2009. The historical performance shown for periods prior to July 6, 2009 was calculated using the performance and the fees and expenses of one or more other share classes of a predecessor fund(s), accounting for, when applicable and permitted, any fee and expense limitations and waivers. If each respective share class of the Fund had been available during periods prior to July 6, 2009, the performance shown may have been different. Please refer to the Fund’s prospectus for further details concerning historical performance.
Lipper, a wholly-owned subsidiary of Thomson Reuters, provides independent insight on global collective investments including mutual funds, retirement funds, hedge funds, fund fees and expenses to the asset management and media communities. Lipper ranks the performance of mutual funds within a classification of funds that have similar investment objectives. Rankings are historical with capital gains and dividends reinvested and do not include the effect of loads.
Ranking is for Class I Shares only; other classes may have different performance characteristics. When an expense waiver is in effect, it may have a material effect on the total return, and therefore the ranking for the period.
August 31, 2008 is the date used to calculate the since-inception Lipper ranking, which is slightly different from when the Fund began operations since Lipper provides fund rankings as of the last day of the month or the first Thursday after fund inception.
There is no assurance that the investment process will consistently lead to successful investing.
See Notes to Schedule of Investments for index definitions.
The Fund’s portfolio may differ significantly from the securities held in the indices. The indices are unmanaged and are not available for direct investment; therefore, their performance does not reflect the expenses associated with the active management of an actual portfolio.
See “Explanations of Charts, Tables and Financial Statements.”
Effective September 30, 2011, Janus Dynamic Allocation Fund changed its name to Janus World Allocation Fund, its primary benchmark from Russell 3000 Index to MSCI All Country World Index and its secondary benchmark from Dynamic Allocation Composite Index to World Allocation Index.
| | | |
| * | | The predecessor Fund’s inception date – September 3, 2008 |
Janus Asset Allocation Fund | 9
Janus World Allocation Fund (unaudited)
The examples below show you the ongoing costs (in dollars) of investing in your Fund and allow you to compare these costs with those of other mutual funds. Please refer to the section Useful Information About Your Fund Report for a detailed explanation of the information presented in these charts.
| | | | | | | | | | | | | | | |
| | | Beginning Account Value
| | Ending Account Value
| | Expenses Paid During Period
| | |
| Expense Example – Class A Shares | | (7/1/11) | | (12/31/11) | | (7/1/11 - 12/31/11)† | | |
| |
| |
| Actual | | $ | 1,000.00 | | | $ | 906.30 | | | $ | 2.30* | | | |
| |
| |
Hypothetical
(5% return before expenses) | | $ | 1,000.00 | | | $ | 1,022.72 | | | $ | 2.44 | | | |
| |
| |
| | | | | | | | | | | | | | | |
| | | | | | | | | | | | | | | |
| | | Beginning Account Value
| | Ending Account Value
| | Expenses Paid During Period
| | |
| Expense Example – Class C Shares | | (7/1/11) | | (12/31/11) | | (7/1/11 - 12/31/11)† | | |
| |
| |
| Actual | | $ | 1,000.00 | | | $ | 903.20 | | | $ | 5.60* | | | |
| |
| |
Hypothetical
(5% return before expenses) | | $ | 1,000.00 | | | $ | 1,019.25 | | | $ | 5.94 | | | |
| |
| |
| | | | | | | | | | | | | | | |
| | | | | | | | | | | | | | | |
| | | Beginning Account Value
| | Ending Account Value
| | Expenses Paid During Period
| | |
| Expense Example – Class I Shares | | (7/1/11) | | (12/31/11) | | (7/1/11 - 12/31/11)† | | |
| |
| |
| Actual | | $ | 1,000.00 | | | $ | 905.80 | | | $ | 2.30 | | | |
| |
| |
Hypothetical
(5% return before expenses) | | $ | 1,000.00 | | | $ | 1,022.72 | | | $ | 2.44 | | | |
| |
| |
| | | | | | | | | | | | | | | |
| | | | | | | | | | | | | | | |
| | | Beginning Account Value
| | Ending Account Value
| | Expenses Paid During Period
| | |
| Expense Example – Class S Shares | | (7/1/11) | | (12/31/11) | | (7/1/11 - 12/31/11)† | | |
| |
| |
| Actual | | $ | 1,000.00 | | | $ | 905.10 | | | $ | 3.06* | | | |
| |
| |
Hypothetical
(5% return before expenses) | | $ | 1,000.00 | | | $ | 1,021.92 | | | $ | 3.25 | | | |
| |
| |
| | | | | | | | | | | | | | | |
| | | | | | | | | | | | | | | |
| | | Beginning Account Value
| | Ending Account Value
| | Expenses Paid During Period
| | |
| Expense Example – Class T Shares | | (7/1/11) | | (12/31/11) | | (7/1/11 - 12/31/11)† | | |
| |
| |
| Actual | | $ | 1,000.00 | | | $ | 906.10 | | | $ | 2.06* | | | |
| |
| |
Hypothetical
(5% return before expenses) | | $ | 1,000.00 | | | $ | 1,022.98 | | | $ | 2.19 | | | |
| |
| |
| | | |
| † | | Expenses are equal to the annualized expense ratio of 0.48% for Class A Shares, 1.17% for Class C Shares, 0.48% for Class I Shares, 0.64% for Class S Shares and 0.43% for Class T Shares multiplied by the average account value over the period, multiplied by 184/366 (to reflect the one-half year period). Expenses include effect of contractual waivers by Janus Capital. |
| * | | Pursuant to a contractual agreement, Janus waived certain fees and expenses during the six-month period for Class A Shares, Class C Shares, Class S Shares and Class T Shares. Without these waivers, the expenses paid during the period would have been $3.50 for Class A Shares, $7.08 for Class C Shares, $4.69 for Class S Shares and $3.50 for Class T Shares. |
10 | DECEMBER 31, 2011
Janus World Allocation Fund
Schedule of Investments (unaudited)
As of December 31, 2011
| | | | | | | | | | | |
| Shares | | Value | | | |
| |
| Exchange – Traded Funds – 9.1% | | | | | | |
| Commodity – 5.6% | | | | | | |
| | 6,100 | | | iShares S&P GSCI Commodity – Indexed Trust (ETF) | | $ | 201,178 | | | |
| | 1,130 | | | SPDR Gold Trust (ETF)* | | | 171,749 | | | |
| Currency – 3.5% | | | | | | |
| | 9,470 | | | WisdomTree Dreyfus Chinese Yuan Fund (ETF) | | | 238,549 | | | |
| |
| |
| Total Exchange – Traded Funds (cost $596,064) | | | 611,476 | | | |
| |
| |
Mutual Funds(1) – 91.3% | | | | | | |
| Equity Funds – 60.8% | | | | | | |
| | 21,068 | | | INTECH International Fund(2) – Class I Shares | | | 138,630 | | | |
| | 12,348 | | | INTECH U.S. Growth Fund(3) – Class I Shares | | | 160,523 | | | |
| | 17,840 | | | INTECH U.S. Value Fund(4) – Class I Shares | | | 169,475 | | | |
| | 5,092 | | | Janus Contrarian Fund – Class I Shares | | | 62,731 | | | |
| | 3,577 | | | Janus Forty Fund – Class I Shares | | | 112,140 | | | |
| | 13,806 | | | Janus Global Life Sciences Fund – Class I Shares | | | 343,496 | | | |
| | 9,612 | | | Janus Global Market Neutral Fund(5) – Class I Shares | | | 86,318 | | | |
| | 15,035 | | | Janus Global Real Estate Fund – Class I Shares | | | 119,977 | | | |
| | 57,611 | | | Janus Global Select Fund – Class I Shares | | | 555,948 | | | |
| | 18,120 | | | Janus Global Technology Fund – Class I Shares | | | 288,653 | | | |
| | 5 | | | Janus Growth and Income Fund – Class I Shares | | | 151 | | | |
| | 48,328 | | | Janus International Equity Fund – Class I Shares | | | 466,853 | | | |
| | 17,277 | | | Janus Overseas Fund – Class I Shares | | | 544,409 | | | |
| | 1,762 | | | Janus Research Fund – Class I Shares | | | 49,474 | | | |
| | 13,862 | | | Janus Triton Fund – Class I Shares | | | 226,368 | | | |
| | 34,327 | | | Perkins Global Value Fund – Class I Shares | | | 395,789 | | | |
| | 5,140 | | | Perkins Large Cap Value Fund – Class I Shares | | | 64,660 | | | |
| | 7,974 | | | Perkins Mid Cap Value Fund – Class I Shares | | | 160,908 | | | |
| | 6,079 | | | Perkins Small Cap Value Fund – Class I Shares | | | 124,003 | | | |
| | | | | | | | 4,070,506 | | | |
| Fixed Income Funds – 30.5% | | | | | | |
| | 43,147 | | | Janus Flexible Bond Fund – Class I Shares | | | 454,766 | | | |
| | 110,709 | | | Janus Global Bond Fund – Class I Shares | | | 1,136,983 | | | |
| | 25,919 | | | Janus High-Yield Fund – Class I Shares | | | 226,532 | | | |
| | 73,725 | | | Janus Short-Term Bond Fund – Class I Shares | | | 224,861 | | | |
| | | | | | | | 2,043,142 | | | |
| |
| |
| Total Mutual Funds (cost $5,957,366) | | | 6,113,648 | | | |
| |
| |
| Money Market – 0.1% | | | | | | |
| | 4,000 | | | Janus Cash Liquidity Fund LLC, 0% (cost $4,000) | | | 4,000 | | | |
| |
| |
| Total Investments (total cost $6,557,430) – 100.5% | | | 6,729,124 | | | |
| |
| |
| Liabilities, net of Cash, Receivables and Other Assets– (0.5)% | | | (34,890) | | | |
| |
| |
| Net Assets – 100% | | $ | 6,694,234 | | | |
| |
| |
| | | |
| (1) | | The Fund invests in mutual funds within the Janus family of funds and they may be deemed to be under common control because they share the same Board of Trustees. |
| (2) | | Formerly named INTECH Risk-Managed International Fund. |
| (3) | | Formerly named INTECH Risk-Managed Growth Fund. |
| (4) | | Formerly named INTECH Risk-Managed Value Fund. |
| (5) | | Formerly named Janus Long/Short Fund. |
See Notes to Schedule of Investments and Financial Statements.
Janus Asset Allocation Fund | 11
Statement of Assets and Liabilities
| | | | | |
As of December 31, 2011 (unaudited)
| | Janus World
|
| (all numbers in thousands except net asset value per share) | | Allocation Fund(1) |
|
| |
| Assets: | | | | |
| Investments at cost | | $ | 6,557 | |
| Unaffiliated investments at value | | $ | 611 | |
| Affiliated investments at value | | | 6,118 | |
| Receivables: | | | | |
| Investments sold | | | 110 | |
| Fund shares sold | | | 1 | |
| Dividends | | | 6 | |
| Due from adviser | | | 17 | |
| Non-interested Trustees’ deferred compensation | | | – | |
| Other assets | | | 2 | |
| Total Assets | | | 6,865 | |
| Liabilities: | | | | |
| Payables: | | | | |
| Due to custodian | | | 76 | |
| Investments purchased | | | 41 | |
| Dividends | | | – | |
| Advisory fees | | | – | |
| Fund administration fees | | | – | |
| Administrative services fees | | | 1 | |
| Distribution fees and shareholder servicing fees | | | 3 | |
| Administrative, networking and omnibus fees | | | 2 | |
| Non-interested Trustees’ fees and expenses | | | – | |
| Non-interested Trustees’ deferred compensation fees | | | – | |
| Accrued expenses and other payables | | | 48 | |
| Total Liabilities | | | 171 | |
| Net Assets | | $ | 6,694 | |
See footnotes at the end of the Statement.
See Notes to Financial Statements.
12 | DECEMBER 31, 2011
| | | | | |
As of December 31, 2011 (unaudited)
| | Janus World
|
| (all numbers in thousands except net asset value per share) | | Allocation Fund(1) |
|
| |
| Net Assets Consist of: | | | | |
| Capital (par value and paid-in surplus)* | | $ | 6,591 | |
| Undistributed net investment income* | | | 21 | |
| Undistributed net realized loss from investment and foreign currency transactions* | | | (90) | |
| Unrealized net appreciation of investments, foreign currency translations and non-interested Trustees’ deferred compensation | | | 172 | |
| Total Net Assets | | $ | 6,694 | |
| Net Assets - Class A Shares | | $ | 2,650 | |
| Shares Outstanding, $0.01 Par Value (unlimited shares authorized) | | | 302 | |
Net Asset Value Per Share(2) | | $ | 8.77 | |
Maximum Offering Price Per Share(3) | | $ | 9.31 | |
| Net Assets - Class C Shares | | $ | 2,278 | |
| Shares Outstanding, $0.01 Par Value (unlimited shares authorized) | | | 264 | |
Net Asset Value Per Share(2) | | $ | 8.63 | |
| Net Assets - Class I Shares | | $ | 834 | |
| Shares Outstanding, $0.01 Par Value (unlimited shares authorized) | | | 95 | |
| Net Asset Value Per Share | | $ | 8.79 | |
| Net Assets - Class S Shares | | $ | 231 | |
| Shares Outstanding, $0.01 Par Value (unlimited shares authorized) | | | 26 | |
| Net Asset Value Per Share | | $ | 8.73 | |
| Net Assets - Class T Shares | | $ | 701 | |
| Shares Outstanding, $0.01 Par Value (unlimited shares authorized) | | | 80 | |
| Net Asset Value Per Share | | $ | 8.76 | |
| | | |
| * | | See Note 5 in Notes to Financial Statements. |
| (1) | | Formerly named Janus Dynamic Allocation Fund. |
| (2) | | Redemption price per share may be reduced for any applicable contingent deferred sales charge. |
| (3) | | Maximum offering price is computed at 100/94.25 of net asset value. |
See Notes to Financial Statements.
Janus Asset Allocation Fund | 13
Statement of Operations
| | | | | |
For the six-month period ended December 31, 2011 (unaudited)
| | Janus World
|
| (all numbers in thousands) | | Allocation Fund(1) |
|
| |
| Investment Income: | | | | |
| Interest | | $ | – | |
| Dividends from affiliates | | | 100 | |
| Total Investment Income | | | 100 | |
| Expenses: | | | | |
| Advisory fees | | | 3 | |
| Shareholder reports expense | | | 26 | |
| Transfer agent fees and expenses | | | 1 | |
| Custodian fees | | | 1 | |
| Professional fees | | | 24 | |
| Non-interested Trustees’ fees and expenses | | | – | |
| Fund administration fees | | | – | |
| Administrative services fees - Class S Shares | | | – | |
| Administrative services fees - Class T Shares | | | 1 | |
| Distribution fees and shareholder servicing fees - Class A Shares | | | 4 | |
| Distribution fees and shareholder servicing fees - Class C Shares | | | 13 | |
| Distribution fees and shareholder servicing fees - Class S Shares | | | – | |
| Administrative, networking and omnibus fees - Class A Shares | | | 1 | |
| Administrative, networking and omnibus fees - Class C Shares | | | 2 | |
| Administrative, networking and omnibus fees - Class I Shares | | | 1 | |
| Other expenses | | | 1 | |
| Total Expenses | | | 78 | |
| Expense and Fee Offset | | | – | |
| Net Expenses | | | 78 | |
| Less: Excess Expense Reimbursement | | | (51) | |
| Net Expenses after Expense Reimbursement | | | 27 | |
| Net Investment Income | | | 73 | |
| Net Realized and Unrealized Gain/(Loss) on Investments: | | | | |
| Net realized loss from investment and foreign currency transactions(2) | | | (49) | |
| Capital gain distributions from Underlying Funds | | | 95 | |
| Change in unrealized net appreciation/(depreciation) of investments, foreign currency translations and non-interested Trustees’ deferred compensation | | | (955) | |
| Net Loss on Investments | | | (909) | |
| Net Decrease in Net Assets Resulting from Operations | | $ | (836) | |
| | | |
| (1) | | Formerly named Janus Dynamic Allocation Fund. |
| (2) | | Includes realized gain/(loss) from affiliated investment companies. See Note 4 in Notes to Financial Statements. |
See Notes to Financial Statements.
14 | DECEMBER 31, 2011
Statements of Changes in Net Assets
| | | | | | | | | |
For the six-month period ended December 31, 2011 (unaudited) and the fiscal year ended June 30, 2011
| | Janus World Allocation Fund(1) |
| (all numbers in thousands) | | 2011 | | 2011 |
|
| |
| Operations: | | | | | | | | |
| Net investment income | | $ | 73 | | | $ | 111 | |
Net realized gain/(loss) from investment and foreign currency transactions(2) | | | (49) | | | | 418 | |
| Capital gain distribution from Underlying Funds | | | 95 | | | | 3 | |
| Change in unrealized net appreciation/(depreciation) of investments, foreign currency translations and non-interested Trustees’ deferred compensation | | | (955) | | | | 723 | |
| Net Increase/(Decrease) in Net Assets Resulting from Operations | | | (836) | | | | 1,255 | |
| Dividends and Distributions to Shareholders: | | | | | | | | |
| Net Investment Income* | | | | | | | | |
| Class A Shares | | | (34) | | | | (49) | |
| Class C Shares | | | (30) | | | | (23) | |
| Class I Shares | | | (10) | | | | (20) | |
| Class S Shares | | | (3) | | | | (4) | |
| Class T Shares | | | (9) | | | | (3) | |
| Net Realized Gain/(Loss) from Investment Transactions* | | | | | | | | |
| Class A Shares | | | (142) | | | | (83) | |
| Class C Shares | | | (125) | | | | (73) | |
| Class I Shares | | | (45) | | | | (33) | |
| Class S Shares | | | (12) | | | | (8) | |
| Class T Shares | | | (38) | | | | (5) | |
| Net Decrease from Dividends and Distributions | | | (448) | | | | (301) | |
| Capital Share Transactions: | | | | | | | | |
| Shares Sold | | | | | | | | |
| Class A Shares | | | 154 | | | | 593 | |
| Class C Shares | | | 87 | | | | 788 | |
| Class I Shares | | | 44 | | | | 625 | |
| Class S Shares | | | 1 | | | | 24 | |
| Class T Shares | | | 82 | | | | 3,187 | |
| Reinvested Dividends and Distributions | | | | | | | | |
| Class A Shares | | | 172 | | | | 129 | |
| Class C Shares | | | 145 | | | | 88 | |
| Class I Shares | | | 55 | | | | 53 | |
| Class S Shares | | | 15 | | | | 12 | |
| Class T Shares | | | 47 | | | | 8 | |
| Shares Repurchased | | | | | | | | |
| Class A Shares | | | (817) | | | | (516) | |
| Class C Shares | | | (442) | | | | (677) | |
| Class I Shares | | | (368) | | | | (943) | |
| Class S Shares | | | (1) | | | | (112) | |
| Class T Shares | | | (257) | | | | (2,342) | |
| Net Increase/(Decrease) from Capital Share Transactions | | | (1,083) | | | | 917 | |
| Net Increase/(Decrease) in Net Assets | | | (2,367) | | | | 1,871 | |
| Net Assets: | | | | | | | | |
| Beginning of period | | | 9,061 | | | | 7,190 | |
| End of period | | $ | 6,694 | | | $ | 9,061 | |
| | | | | | | | | |
| Undistributed Net Investment Income* | | $ | 21 | | | $ | 34 | |
| | | |
| * | | See Note 5 in Notes to Financial Statements. |
| (1) | | Formerly named Janus Dynamic Allocation Fund. |
| (2) | | Includes realized gain/(loss) from affiliated investment companies. See affiliates table in Notes to Schedules of Investments. |
See Notes to Financial Statements.
Janus Asset Allocation Fund | 15
Financial Highlights
Class A Shares
| | | | | | | | | | | | | | | | | | | |
For a share outstanding during the six-month period ended December 31, 2011
| | | | | | | | | | |
(unaudited), the fiscal year ended June 30, 2011, the eleven-month fiscal period ended
| | Janus World Allocation Fund(1) | | |
| June 30, 2010 and the fiscal period ended July 31, 2009 | | 2011 | | 2011 | | 2010(2) | | 2009(3) | | |
| |
| Net Asset Value, Beginning of Period | | | $10.37 | | | | $9.20 | | | | $8.76 | | | | $10.00 | | | |
| Income from Investment Operations: | | | | | | | | | | | | | | | | | | |
| Net investment income | | | .12 | | | | .17 | | | | .07 | | | | .15 | | | |
| Net gain/(loss) on investments (both realized and unrealized) | | | (1.10) | | | | 1.41 | | | | .49 | | | | (1.31) | | | |
| Total from Investment Operations | | | (.98) | | | | 1.58 | | | | .56 | | | | (1.16) | | | |
| Less Distributions: | | | | | | | | | | | | | | | | | | |
| Dividends (from net investment income)* | | | (.12) | | | | (.15) | | | | (.10) | | | | (.08) | | | |
| Distributions (from capital gains)* | | | (.50) | | | | (.26) | | | | (.02) | | | | – | | | |
| Total Distributions | | | (.62) | | | | (.41) | | | | (.12) | | | | (.08) | | | |
| Net Asset Value, End of Period | | | $8.77 | | | | $10.37 | | | | $9.20 | | | | $8.76 | | | |
| Total Return** | | | (9.37)% | | | | 17.21% | | | | 6.27% | | | | (11.38)% | | | |
| Net Assets, End of Period (in thousands) | | | $2,650 | | | | $3,651 | | | | $3,059 | | | | $1,734 | | | |
| Average Net Assets for the Period (in thousands) | | | $3,176 | | | | $3,482 | | | | $2,956 | | | | $488 | | | |
Ratio of Gross Expenses to Average Net Assets***(4)(5) | | | 0.48%(6) | | | | 0.46% | | | | 0.45% | | | | 0.62% | | | |
Ratio of Net Expenses to Average Net Assets***(4)(5) | | | 0.48%(6) | | | | 0.46% | | | | 0.45% | | | | 0.61% | | | |
| Ratio of Net Investment Income to Average Net Assets*** | | | 2.03% | | | | 1.62% | | | | 1.13% | | | | 3.35% | | | |
| Portfolio Turnover Rate*** | | | 46% | | | | 71% | | | | 51% | | | | 78% | | | |
Class C Shares
| | | | | | | | | | | | | | | | | | | |
For a share outstanding during the six-month period ended December 31, 2011
| | | | | | | | | | |
(unaudited), the fiscal year ended June 30, 2011, the eleven-month fiscal period ended
| | Janus World Allocation Fund(1) | | |
| June 30, 2010 and the fiscal period ended July 31, 2009 | | 2011 | | 2011 | | 2010(2) | | 2009(3) | | |
| |
| Net Asset Value, Beginning of Period | | | $10.25 | | | | $9.11 | | | | $8.74 | | | | $10.00 | | | |
| Income from Investment Operations: | | | | | | | | | | | | | | | | | | |
| Net investment income/(loss) | | | .08 | | | | .08 | | | | (.01) | | | | .19 | | | |
| Net gain/(loss) on investments (both realized and unrealized) | | | (1.08) | | | | 1.40 | | | | .50 | | | | (1.37) | | | |
| Total from Investment Operations | | | (1.00) | | | | 1.48 | | | | .49 | | | | (1.18) | | | |
| Less Distributions: | | | | | | | | | | | | | | | | | | |
| Dividends (from net investment income)* | | | (.12) | | | | (.08) | | | | (.10) | | | | (.08) | | | |
| Distributions (from capital gains)* | | | (.50) | | | | (.26) | | | | (.02) | | | | – | | | |
| Total Distributions | | | (.62) | | | | (.34) | | | | (.12) | | | | (.08) | | | |
| Net Asset Value, End of Period | | | $8.63 | | | | $10.25 | | | | $9.11 | | | | $8.74 | | | |
| Total Return** | | | (9.68)% | | | | 16.27% | | | | 5.47% | | | | (11.58)% | | | |
| Net Assets, End of Period (in thousands) | | | $2,278 | | | | $2,922 | | | | $2,429 | | | | $1,288 | | | |
| Average Net Assets for the Period (in thousands) | | | $2,536 | | | | $2,776 | | | | $2,168 | | | | $684 | | | |
Ratio of Gross Expenses to Average Net Assets***(4)(5) | | | 1.17%(7) | | | | 1.26% | | | | 1.22% | | | | 0.48%(7) | | | |
Ratio of Net Expenses to Average Net Assets***(4)(5) | | | 1.17%(7) | | | | 1.26% | | | | 1.21% | | | | 0.48%(7) | | | |
| Ratio of Net Investment Income to Average Net Assets*** | | | 1.46% | | | | 0.81% | | | | 0.34% | | | | 3.37% | | | |
| Portfolio Turnover Rate*** | | | 46% | | | | 71% | | | | 51% | | | | 78% | | | |
| | | |
| * | | See Note 5 in Notes to Financial Statements. |
| ** | | Total return not annualized for periods of less than one full year. |
| *** | | Annualized for periods of less than one full year. |
| (1) | | Formerly named Janus Dynamic Allocation Fund. |
| (2) | | Period from August 1, 2009 through June 30, 2010. The Fund changed its fiscal year end from July 31 to June 30. |
| (3) | | Period from September 3, 2008 (inception date) through July 31, 2009. |
| (4) | | See Note 6 in Notes to Financial Statements. |
| (5) | | Ratios do not include expenses of the underlying funds and/or investment companies in which the Fund invests. |
| (6) | | Pursuant to a contractual agreement, Janus waived certain fees and expenses during the period. The Ratio of Gross Expenses to Average Net Assets and Ratio of Net Expenses to Average Net Assets would be 0.73% and 0.73%, respectively, without the waiver of these fees and expenses. |
| (7) | | Pursuant to a contractual agreement, Janus waived certain fees and expenses during the period. The Ratio of Gross Expenses to Average Net Assets and Ratio of Net Expenses to Average Net Assets would be 1.48% and 1.48%, respectively, in the six-month period ended December 31, 2011 and 1.46% and 1.45%, respectively, in 2009 without the waiver of these fees and expenses. |
See Notes to Financial Statements.
16 | DECEMBER 31, 2011
Class I Shares
| | | | | | | | | | | | | | | | | | | |
For a share outstanding during the six-month period ended December 31, 2011
| | | | | | | | | | |
(unaudited), the fiscal year ended June 30, 2011, the eleven-month fiscal period ended
| | Janus World Allocation Fund(1) | | |
| June 30, 2010 and the fiscal period ended July 31, 2009 | | 2011 | | 2011 | | 2010(2) | | 2009(3) | | |
| |
| Net Asset Value, Beginning of Period | | | $10.39 | | | | $9.22 | | | | $8.79 | | | | $10.00 | | | |
| Income from Investment Operations: | | | | | | | | | | | | | | | | | | |
| Net investment income | | | .15 | | | | .18 | | | | .05 | | | | .19 | | | |
| Net gain/(loss) on investments (both realized and unrealized) | | | (1.14) | | | | 1.40 | | | | .50 | | | | (1.32) | | | |
| Total from Investment Operations | | | (.99) | | | | 1.58 | | | | .55 | | | | (1.13) | | | |
| Less Distributions: | | | | | | | | | | | | | | | | | | |
| Dividends (from net investment income)* | | | (.11) | | | | (.15) | | | | (.10) | | | | (.08) | | | |
| Distributions (from capital gains)* | | | (.50) | | | | (.26) | | | | (.02) | | | | – | | | |
| Total Distributions | | | (.61) | | | | (.41) | | | | (.12) | | | | (.08) | | | |
| Net Asset Value, End of Period | | | $8.79 | | | | $10.39 | | | | $9.22 | | | | $8.79 | | | |
| Total Return** | | | (9.42)% | | | | 17.22% | | | | 6.13% | | | | (11.08)% | | | |
| Net Assets, End of Period (in thousands) | | | $834 | | | | $1,276 | | | | $1,371 | | | | $782 | | | |
| Average Net Assets for the Period (in thousands) | | | $1,042 | | | | $1,367 | | | | $1,332 | | | | $382 | | | |
Ratio of Gross Expenses to Average Net Assets***(4)(5) | | | 0.48% | | | | 0.48% | | | | 0.46% | | | | 0.46% | | | |
Ratio of Net Expenses to Average Net Assets***(4)(5) | | | 0.48% | | | | 0.48% | | | | 0.45% | | | | 0.45% | | | |
| Ratio of Net Investment Income to Average Net Assets*** | | | 2.09% | | | | 1.62% | | | | 1.12% | | | | 3.57% | | | |
| Portfolio Turnover Rate*** | | | 46% | | | | 71% | | | | 51% | | | | 78% | | | |
Class S Shares
| | | | | | | | | | | | | | | | | | | |
For a share outstanding during the six-month period ended December 31, 2011
| | | | | | | | | | |
(unaudited), the fiscal year ended June 30, 2011, the eleven-month fiscal period ended
| | Janus World Allocation Fund(1) | | |
| June 30, 2010 and the fiscal period ended July 31, 2009 | | 2011 | | 2011 | | 2010(2) | | 2009(3) | | |
| |
| Net Asset Value, Beginning of Period | | | $10.34 | | | | $9.17 | | | | $8.75 | | | | $10.00 | | | |
| Income from Investment Operations: | | | | | | | | | | | | | | | | | | |
| Net investment income | | | .09 | | | | .19 | | | | .15 | | | | .19 | | | |
| Net gain/(loss) on investments (both realized and unrealized) | | | (1.08) | | | | 1.36 | | | | .39 | | | | (1.36) | | | |
| Total from Investment Operations | | | (.99) | | | | 1.55 | | | | .54 | | | | (1.17) | | | |
| Less Distributions: | | | | | | | | | | | | | | | | | | |
| Dividends (from net investment income)* | | | (.12) | | | | (.12) | | | | (.10) | | | | (.08) | | | |
| Distributions (from capital gains)* | | | (.50) | | | | (.26) | | | | (.02) | | | | – | | | |
| Total Distributions | | | (.62) | | | | (.38) | | | | (.12) | | | | (.08) | | | |
| Net Asset Value, End of Period | | | $8.73 | | | | $10.34 | | | | $9.17 | | | | $8.75 | | | |
| Total Return** | | | (9.49)% | | | | 16.95% | | | | 6.04% | | | | (11.48)% | | | |
| Net Assets, End of Period (in thousands) | | | $231 | | | | $255 | | | | $292 | | | | $458 | | | |
| Average Net Assets for the Period (in thousands) | | | $235 | | | | $326 | | | | $355 | | | | $274 | | | |
Ratio of Gross Expenses to Average Net Assets***(4)(5) | | | 0.64%(6) | | | | 0.77% | | | | 0.75% | | | | 0.72% | | | |
Ratio of Net Expenses to Average Net Assets***(4)(5) | | | 0.64%(6) | | | | 0.77% | | | | 0.74% | | | | 0.71% | | | |
| Ratio of Net Investment Income to Average Net Assets*** | | | 2.14% | | | | 1.37% | | | | 0.79% | | | | 3.09% | | | |
| Portfolio Turnover Rate*** | | | 46% | | | | 71% | | | | 51% | | | | 78% | | | |
| | | |
| * | | See Note 5 in Notes to Financial Statements. |
| ** | | Total return not annualized for periods of less than one full year. |
| *** | | Annualized for periods of less than one full year. |
| (1) | | Formerly named Janus Dynamic Allocation Fund. |
| (2) | | Period from August 1, 2009 through June 30, 2010. The Fund changed its fiscal year end from July 31 to June 30. |
| (3) | | Period from September 3, 2008 (inception date) through July 31, 2009. |
| (4) | | See Note 6 in Notes to Financial Statements. |
| (5) | | Ratios do not include expenses of the underlying funds and/or investment companies in which the Fund invests. |
| (6) | | Pursuant to a contractual agreement, Janus waived certain fees and expenses during the period. The Ratio of Gross Expenses to Average Net Assets and Ratio of Net Expenses to Average Net Assets would be 0.98% and 0.98%, respectively, without the waiver of these fees and expenses. |
See Notes to Financial Statements.
Janus Asset Allocation Fund | 17
Financial Highlights (continued)
Class T Shares
| | | | | | | | | | | | | | | | | | | |
For a share outstanding during the six-month period ended December 31, 2011
| | | | | | | | | | |
(unaudited), the fiscal year ended June 30, 2011, the eleven-month fiscal period ended
| | Janus World Allocation Fund(1) | | |
| June 30, 2010 and the fiscal period ended July 31, 2009 | | 2011 | | 2011 | | 2010(2) | | 2009(3) | | |
| |
| Net Asset Value, Beginning of Period | | | $10.36 | | | | $9.21 | | | | $8.78 | | | | $8.25 | | | |
| Income from Investment Operations: | | | | | | | | | | | | | | | | | | |
| Net investment income | | | .12 | | | | .18 | | | | .09 | | | | .01 | | | |
| Net gain/(loss) on investments (both realized and unrealized) | | | (1.10) | | | | 1.39 | | | | .46 | | | | .52 | | | |
| Total from Investment Operations | | | (.98) | | | | 1.57 | | | | .55 | | | | .53 | | | |
| Less Distributions: | | | | | | | | | | | | | | | | | | |
| Dividends (from net investment income)* | | | (.12) | | | | (.16) | | | | (.10) | | | | – | | | |
| Distributions (from capital gains)* | | | (.50) | | | | (.26) | | | | (.02) | | | | – | | | |
| Total Distributions | | | (.62) | | | | (.42) | | | | (.12) | | | | – | | | |
| Net Asset Value, End of Period | | | $8.76 | | | | $10.36 | | | | $9.21 | | | | $8.78 | | | |
| Total Return** | | | (9.39)% | | | | 17.04% | | | | 6.14% | | | | 6.42% | | | |
| Net Assets, End of Period (in thousands) | | | $701 | | | | $957 | | | | $39 | | | | $1 | | | |
| Average Net Assets for the Period (in thousands) | | | $737 | | | | $1,044 | | | | $27 | | | | $1 | | | |
Ratio of Gross Expenses to Average Net Assets***(4)(5) | | | 0.43%(6) | | | | 0.51% | | | | 0.47% | | | | 0.76% | | | |
Ratio of Net Expenses to Average Net Assets***(4)(5) | | | 0.43%(6) | | | | 0.51% | | | | 0.46% | | | | 0.70% | | | |
| Ratio of Net Investment Income to Average Net Assets*** | | | 2.24% | | | | 0.54% | | | | 0.97% | | | | 1.56% | | | |
| Portfolio Turnover Rate*** | | | 46% | | | | 71% | | | | 51% | | | | 78% | | | |
| | | |
| * | | See Note 5 in Notes to Financial Statements. |
| ** | | Total return not annualized for periods of less than one full year. |
| *** | | Annualized for periods of less than one full year. |
| (1) | | Formerly named Janus Dynamic Allocation Fund. |
| (2) | | Period from August 1, 2009 through June 30, 2010. The Fund changed its fiscal year end from July 31 to June 30. |
| (3) | | Period from July 6, 2009 (inception date) through July 31, 2009. |
| (4) | | See Note 6 in Notes to Financial Statements. |
| (5) | | Ratios do not include expenses of the underlying funds and/or investment companies in which the Fund invests. |
| (6) | | Pursuant to a contractual agreement, Janus waived certain fees and expenses during the period. The Ratio of Gross Expenses to Average Net Assets and Ratio of Net Expenses to Average Net Assets would be 0.73% and 0.73%, respectively, without the waiver of these fees and expenses. |
See Notes to Financial Statements.
18 | DECEMBER 31, 2011
Notes to Schedule of Investments (unaudited)
| | |
| Barclays Capital Global Aggregate Bond Index | | Provides a broad-based measure of the global investment grade fixed-rate debt markets. It is comprised of the U.S. Aggregate, Pan-European Aggregate, and the Asian-Pacific Aggregate Indexes. It also includes a wide range of standard and customized subindices by liquidity constraint, sector, quality and maturity. |
| |
| Lipper Global Flexible Portfolio Funds | | Funds that allocate their investments across various asset classes, including both domestic and foreign stocks, bonds, and money market instruments, with a focus on total return. At least 25% of their portfolio is invested in securities traded outside of the United States. |
| |
| Morgan Stanley Capital International All Country World IndexSM | | An unmanaged, free float-adjusted market capitalization weighted index composed of stocks of companies located in countries throughout the world. It is designed to measure equity market performance in global developed and emerging markets. The index includes reinvestment of dividends, net of foreign withholding taxes. |
| |
| World Allocation Index | | A hypothetical combination of unmanaged indices. This internally-calculated index combines the total returns from the Morgan Stanley Capital International All Country World IndexSM (65%) and the Barclays Capital Global Aggregate Bond Index (35%). |
| |
| ETF | | Exchange-Traded Fund |
| |
| SPDR | | Standard & Poor’s Depositary Receipt |
| | | |
| * | | Non-income producing security. |
The following is a summary of the inputs that were used to value the Fund’s investments in securities and other financial instruments as of December 31, 2011. See Notes to Financial Statements for more information.
Valuation Inputs Summary (as of December 31, 2011)
| | | | | | | | | | | | |
| | | | | Level 2 – Other Significant
| | Level 3 – Significant
| | |
| | | Level 1 – Quoted Prices | | Observable Inputs | | Unobservable Inputs | | |
| |
Investments in Securities: | | | | | | | | | | | |
Janus World Allocation Fund(1) | | | | | | | | | | | |
Exchange-Traded Funds | | $ | 611,476 | | $ | – | | $ | – | | |
Mutual Funds | | | | | | | | | | | |
| Equity Funds | | | – | | | 4,070,506 | | | – | | |
| Fixed Income Funds | | | – | | | 2,043,142 | | | – | | |
Money Market | | | – | | | 4,000 | | | – | | |
| Total Investments in Securities | | $ | 611,476 | | $ | 6,117,648 | | $ | – | | |
| |
| |
| | | |
| (1) | | Formerly named Janus Dynamic Allocation Fund. |
Janus Asset Allocation Fund | 19
Notes to Financial Statements (unaudited)
The following section describes the organization and significant accounting policies and provides more detailed information about the schedules and tables that appear throughout this report. In addition, the Notes to Financial Statements explain the methods used in preparing and presenting this report.
| |
| 1. | Organization and Significant Accounting Policies |
Janus World Allocation Fund (formerly named Janus Dynamic Allocation Fund) (the “Fund”) is a series fund. The Fund operates as a “fund of funds,” meaning substantially all of the Fund’s assets will be invested in other Janus funds (the “underlying funds”) with approximately 90% of its assets allocated to Janus-managed mutual funds and approximately 10% allocated to unqualified pooled investment vehicles (e.g., ETFs) and derivatives. The Fund is part of Janus Investment Fund (the “Trust”), which is organized as a Massachusetts business trust and is registered under the Investment Company Act of 1940, as amended (the “1940 Act”), as an open-end management investment company. The financial statements include information for the period ended December 31, 2011. The Trust offers forty-five funds which include multiple series of shares, with differing investment objectives and policies. The Fund in this report is classified as diversified, as defined in the 1940 Act.
The Fund in this report offers multiple classes of shares in order to meet the needs of various types of investors. Each class represents an interest in the same portfolio of investments. Certain financial intermediaries may not offer all classes of shares. The share classes in this report are not offered directly to individual investors.
Class A Shares and Class C Shares are generally offered through financial intermediary platforms including, but not limited to, traditional brokerage platforms, mutual fund wrap fee programs, bank trust platforms, and retirement platforms. The maximum purchase in Class C Shares is $500,000 for any single purchase.
Class I Shares are available through certain financial intermediary platforms including, but not limited to, mutual fund wrap fee programs, managed account programs, asset allocation programs, and bank trust platforms, as well as certain retirement platforms. Class I Shares are also available to certain institutional investors including, but not limited to, corporations, certain retirement plans, public plans, and foundations/endowments.
Class S Shares are offered through financial intermediary platforms including, but not limited to, retirement platforms and asset allocation, mutual fund wrap, or other discretionary or nondiscretionary fee-based investment advisory programs. In addition, Class S Shares may be available through certain financial intermediaries who have an agreement with Janus Capital Management LLC (“Janus Capital”) or its affiliates to offer Class S Shares on their supermarket platforms.
Class T Shares are available through certain financial intermediary platforms including, but not limited to, mutual fund wrap fee programs, managed account programs, asset allocation programs, bank trust platforms, as well as certain retirement platforms. In addition, Class T Shares may be available through certain financial intermediaries who have an agreement with Janus Capital or its affiliates to offer Class T Shares on their supermarket platforms.
Underlying Funds
The Fund invests in a variety of underlying funds to pursue a target allocation of stocks and bonds, and may also invest in money market instruments or cash/cash equivalents. The Fund has a target allocation, which is how the Fund’s investments generally will be allocated among the major asset classes over the long term, as well as normal ranges within which the Fund’s asset class allocations generally will vary over short-term periods. The expected asset allocation ranges are as follows: 30%-80% equity investments, 20%-60% fixed income investments, and 0%-20% alternative investments for the Fund. The following information provides a brief description of the investment objectives and strategies of each of the underlying funds that are available within the various asset classes. Additional details are available in the underlying funds’ prospectuses. The Trustees of the underlying Janus funds may change the investment objectives or strategy of the underlying funds at any time without prior notice to Fund shareholders.
POTENTIAL UNDERLYING FUNDS INCLUDED IN THE EQUITY SECURITIES ASSET CATEGORY
INTECH GLOBAL DIVIDEND FUND seeks long-term growth of capital and income. The fund invests, under normal circumstances, at least 80% of its net assets in dividend-paying securities. The fund invests primarily in common stocks from the universe of the Morgan Stanley Capital International (“MSCI”) World High Dividend Yield Index, utilizing INTECH’s mathematical investment process. The MSCI World High Dividend Yield Index is designed to reflect the performance of the high dividend yield securities contained within the broader MSCI World IndexSM. The fund may also invest in foreign equity and debt securities.
INTECH INTERNATIONAL FUND (formerly named INTECH RISK-MANAGED INTERNATIONAL FUND) seeks long-term growth of capital. The fund invests primarily in common stocks from the universe of the MSCI EAFE® (Europe, Australasia, Far East) Index, utilizing INTECH’s
20 | DECEMBER 31, 2011
mathematical investment process. The MSCI EAFE® Index is an MSCI index that is designed to measure the performance of the developed markets of Europe, Australasia, and the Far East. The fund may also invest in foreign equity and debt securities.
INTECH U.S. CORE FUND (formerly named INTECH RISK-MANAGED CORE FUND) seeks long-term growth of capital. The fund invests, under normal circumstances, at least 80% of its net assets in U.S. common stocks from the universe of the S&P 500® Index, utilizing INTECH’s mathematical investment process. The S&P 500® Index is an unmanaged index of 500 stocks that is generally representative of the performance of larger companies in the United States.
INTECH U.S. GROWTH FUND (formerly named INTECH RISK-MANAGED GROWTH FUND) seeks long-term growth of capital. The fund invests, under normal circumstances, at least 80% of its net assets in U.S. common stocks from the universe of the Russell 1000® Growth Index, utilizing INTECH’s mathematical investment process. The Russell 1000® Growth Index is an unmanaged index that measures the performance of those Russell 1000 companies with higher price-to-book ratios and higher forecasted growth values.
INTECH U.S. VALUE FUND (formerly named INTECH RISK-MANAGED VALUE FUND) seeks long-term growth of capital. The fund invests, under normal circumstances, at least 80% of its net assets in U.S. common stocks from the universe of the Russell 1000® Value Index, utilizing INTECH’s mathematical investment process. The Russell 1000® Value Index is an unmanaged index that measures the performance of those Russell 1000 companies with lower price-to-book ratios and lower forecasted growth values.
JANUS ASIA EQUITY FUND seeks long-term growth of capital. The fund pursues its investment objective by investing, under normal circumstances, at least 80% of its net assets in equity securities of Asian issuers (excluding Japanese issuers). An Asian issuer is generally considered to be any company that is (i) incorporated or has its principal business activities in an Asian country; (ii) primarily listed on the trading market of an Asian country; or (iii) derives 50% or more of its revenue from, or has 50% or more of its assets in, an Asian country. The fund considers “Asian countries” to include, but not be limited to, Hong Kong, China, South Korea, Taiwan, Singapore, Malaysia, Thailand, Indonesia, Philippines, India, Vietnam, Pakistan, Russia, and Sri Lanka. Some of these countries may represent developing or emerging markets. The fund generally invests in equity securities, which consist primarily of common stocks, preferred stocks, depositary receipts, and convertible securities, but may also include other types of instruments, such as equitylinked securities and real estate investment trusts issued by Asian real estate companies. The fund may invest in companies of any market capitalization. While the fund intends to diversify its investments across a number of different countries, including emerging market countries, it may, under unusual circumstances, invest all or a significant portion of its assets in a single Asian country. To a more limited degree, the fund may also invest in U.S. and foreign debt securities.
JANUS BALANCED FUND seeks long-term capital growth, consistent with preservation of capital and balanced by current income. The fund pursues its investment objective by normally investing 35-65% of its assets in equity securities and the remaining assets in fixed-income securities and cash equivalents. The fund normally invests at least 25% of its assets in fixed-income senior securities. Fixed-income securities may include corporate debt securities, U.S. Government obligations, mortgage-backed securities and other mortgage-related products, and short-term securities. The fund may also invest in foreign equity and debt securities, which may include investments in emerging markets.
JANUS CONTRARIAN FUND seeks long-term growth of capital. The fund pursues its investment objective by investing, under normal circumstances, at least 80% of its net assets in equity securities with the potential for long-term growth of capital. The portfolio manager emphasizes investments in companies with attractive price/free cash flow, which is the relationship between the price of a stock and the company’s available cash from operations minus capital expenditures. The portfolio manager will typically seek attractively valued companies that are improving their free cash flow and returns on invested capital. Such companies may also include special situations companies that are experiencing management changes and/or are currently out of favor. The fund may also invest in foreign equity and debt securities, which may include investments in emerging markets.
JANUS EMERGING MARKETS FUND seeks long-term growth of capital. The fund invests, under normal circumstances, at least 80% of its net assets in securities of issuers in emerging market countries. The fund normally invests in securities of issuers that (i) are primarily listed on the trading market of an emerging market country; (ii) are incorporated or have their principal business activities in an emerging market country; or (iii) derive 50% or more of their revenues from, or have 50% or more of their assets in, an emerging market country. An emerging market country is any country that has been determined by an international organization, such as the World Bank, to have a low to middle income economy and/or any country that is not included in the
Janus Asset Allocation Fund | 21
Notes to Financial Statements (unaudited) (continued)
MSCI World IndexSM, which measures the equity market performance of developed markets. The fund generally invests in equity securities, which consist primarily of common stocks, preferred stocks and convertible securities, but may also invest in other types of instruments, such as equity-linked securities and exchange-traded funds (“ETFs”). The fund may invest in companies of any market capitalization.
JANUS ENTERPRISE FUND seeks long-term growth of capital. The fund pursues its investment objective by investing primarily in common stocks selected for their growth potential and normally invests at least 50% of its equity assets in medium-sized companies. Medium-sized companies are those whose market capitalization falls within the range of companies in the Russell Midcap® Growth Index. The fund may also invest in foreign equity and debt securities, which may include investments in emerging markets.
JANUS FORTY FUND seeks long-term growth of capital. The fund pursues its investment objective by normally investing primarily in a core group of 20-40 common stocks selected for their growth potential. The fund may invest in companies of any size, from larger, well-established companies to smaller, emerging growth companies. The fund may also invest in foreign equity and debt securities, which may include investments in emerging markets.
JANUS FUND seeks long-term growth of capital. The fund pursues its investment objective by investing primarily in common stocks selected for their growth potential. Although the fund may invest in companies of any size, it generally invests in larger, more established companies. The fund may also invest in foreign equity and debt securities, which may include investments in emerging markets.
JANUS GLOBAL LIFE SCIENCES FUND seeks long-term growth of capital. The fund invests, under normal circumstances, at least 80% of its net assets in securities of companies that the portfolio manager believes have a life science orientation. Generally speaking, the “life sciences” relate to maintaining or improving quality of life. The fund implements this policy by investing primarily in equity securities of U.S. and foreign companies selected for their growth potential. The fund normally invests in issuers from several different countries, which may include the United States. The fund may, under unusual circumstances, invest in a single country. The fund may have significant exposure to emerging markets. The fund may also invest in U.S. and foreign debt securities. As a fundamental policy, the fund normally invests at least 25% of its total assets in the “life sciences” sector, which may include companies in the following industry groups: health care; pharmaceuticals; agriculture; cosmetics/personal care; and biotechnology.
JANUS GLOBAL MARKET NEUTRAL FUND (formerly named JANUS LONG/SHORT FUND) seeks long-term capital appreciation independent of stock market direction. The fund’s market neutral strategy attempts to create a portfolio that limits stock market risk and delivers absolute returns. Under normal circumstances, the fund generally pursues its investment objective by taking both long and short positions in domestic and foreign equity securities, including those in emerging markets, and ETFs in an effort to insulate the fund’s performance from general stock market movements. The fund seeks a combination of long and short positions that may provide positive returns regardless of market direction, through a complete market cycle. The fund will generally buy long securities that the portfolio manager believes will go up in price and will sell short ETFs and other equity securities the portfolio manager believes will go down in price. The fund may also take long and short positions in derivative instruments that provide exposure to the equity markets, including swaps, options, futures, and other index-based instruments. The fund’s investments may include holdings across different industries, sectors, and regions. The fund normally invests in issuers from several different countries, including the United States. The fund may, under unusual circumstances, invest in a single country. The fund may also have significant exposure to emerging markets.
JANUS GLOBAL REAL ESTATE FUND seeks total return through a combination of capital appreciation and current income. The fund invests, under normal circumstances, at least 80% of its net assets plus the amount of any borrowings for investment purposes in equity and debt securities of real estate-related companies. Such companies may include those in the real estate industry or real estate-related industries. These securities may include common stocks, preferred stocks, and other equity securities, including, but not limited to, real estate investment trusts (“REITs”) and similar REIT-like entities. As a fundamental policy, the fund will concentrate 25% or more of its net assets in securities of issuers in real estate or real estate-related industries. The fund’s investment in companies engaged in businesses outside the real estate industry which possess significant real estate holdings will be deemed to be in the real estate industry for purposes of the fund’s investment objective and its policy on industry concentration. The fund expects under normal market conditions to maintain investments in issuers from several different developed countries, including the United States. Under unusual circumstances, the fund may invest all of its assets in a single country. The fund may invest in emerging markets but will normally limit such investments
22 | DECEMBER 31, 2011
to 15% of its net assets, measured at the time of purchase.
JANUS GLOBAL RESEARCH FUND seeks long-term growth of capital. The fund pursues its investment objective by investing primarily in common stocks selected for their growth potential. The fund may invest in companies of any size, located anywhere in the world, from larger, well-established companies to smaller, emerging growth companies. The fund normally invests at least 40% of its net assets in securities of issuers from different countries located throughout the world, excluding the United States. The fund may have significant exposure to emerging markets. The fund may also invest in foreign equity and debt securities.
JANUS GLOBAL SELECT FUND seeks long-term growth of capital. The fund pursues its investment objective by normally investing primarily in a core group of 30-50 domestic and foreign common stocks selected for their growth potential and normally investing at least 40% of its net assets in securities of issuers from different countries located throughout the world, excluding the United States. The fund may invest in companies of any size, located anywhere in the world, from larger, well-established companies to smaller, emerging growth companies. The fund may also invest in U.S. and foreign debt securities. The fund may have significant exposure to emerging markets.
JANUS GLOBAL TECHNOLOGY FUND seeks long-term growth of capital. The fund pursues its investment objective by investing, under normal circumstances, at least 80% of its net assets in securities of companies that the portfolio manager believes will benefit significantly from advances or improvements in technology. These companies generally fall into two categories: (i) companies that the portfolio manager believes have or will develop products, processes, or services that will provide significant technological advancements or improvements and (ii) companies that the portfolio manager believes rely extensively on technology in connection with their operations or services. The fund implements this policy by investing primarily in equity securities of U.S. and foreign companies selected for their growth potential. The fund normally invests in issuers from several different countries, which may include the United States. The fund may, under unusual circumstances, invest in a single country. The fund may have significant exposure to emerging markets. The fund may also invest in U.S. and foreign debt securities.
JANUS GROWTH AND INCOME FUND seeks long-term capital growth and current income. The fund pursues its investment objective by normally emphasizing investments in common stocks. The fund will normally invest up to 75% of its assets in equity securities selected primarily for their growth potential and at least 25% of its assets in securities the portfolio manager believes have income potential. Eligible equity securities in which the fund may invest include: (i) domestic and foreign common stocks; (ii) preferred stocks; (iii) securities convertible into common stocks or preferred stocks, such as convertible preferred stocks, bonds, and debentures; and (iv) other securities with equity characteristics.
JANUS INTERNATIONAL EQUITY FUND seeks long-term growth of capital. The fund invests, under normal circumstances, at least 80% of its net assets in equity securities. The fund normally invests in a core group of 60-100 equity securities of issuers from different countries located throughout the world, excluding the United States. The fund may, under unusual circumstances, invest all of its assets in a single country. The fund may invest in emerging markets but will normally limit such investments to 20% of its net assets, measured at the time of purchase. The fund may also invest in foreign debt securities.
JANUS OVERSEAS FUND seeks long-term growth of capital. The fund invests, under normal circumstances, at least 80% of its net assets in securities of issuers from countries outside of the United States. The fund normally invests in securities of issuers from several different countries, excluding the United States. Although the fund typically invests 80% or more of its assets in issuers located outside the United States, it also may normally invest up to 20% of its assets, measured at the time of purchase, in U.S. issuers, and it may, under unusual circumstances, invest all or substantially all of its assets in a single country. The fund may have significant exposure to emerging markets. The fund may also invest in U.S. and foreign debt securities.
JANUS PROTECTED SERIES – GLOBAL seeks long-term growth of capital and capital preservation. The fund seeks growth of capital to the extent consistent with maintaining protection against significant downside movement of the net asset value (“NAV”) per share of each share class of the fund. Specifically, the portfolio manager manages the fund’s assets in an effort to ensure that the NAV for any share class will not fall below 80% of the highest NAV attained separately by each share class during the life of the fund, reduced for dividends, distributions, any extraordinary expenses, and certain extraordinary items (for each share class, the “Protected NAV”). In order to minimize the effect of equity market volatility on the NAV per share for a share class, the fund allocates its portfolio assets between two investment components. Through its first component, the “Equity Component,” the fund seeks to achieve growth of capital by investing primarily in common stocks selected for their growth potential. The fund may invest in companies of any size located
Janus Asset Allocation Fund | 23
Notes to Financial Statements (unaudited) (continued)
anywhere in the world, from larger, well-established companies to smaller, emerging growth companies. The fund normally invests at least 40% of its net assets in securities of issuers or companies from different countries located throughout the world, excluding the United States. The fund may have significant exposure to emerging markets. As part of the Equity Component, the fund may also invest in foreign equity and debt securities. The Equity Component may also consist of derivatives such as swaps, futures, and options. Through its second component, the “Protection Component,” the fund seeks to limit downside risk by investing in cash and other investments including, but not limited to, money market instruments, U.S. Treasuries, and other equity market risk reducing instruments, such as short index futures. Due to equity market conditions and the fund’s overall risk profile, the amount of fund assets allocated to the Protection Component may, at times, be significant. The fund’s allocation between the Equity Component and the Protection Component will vary over time. Up to 100% of assets may be allocated to either component.
JANUS PROTECTED SERIES – GROWTH seeks long-term growth of capital and capital preservation. The fund seeks growth of capital to the extent consistent with maintaining protection against significant downside movement of the NAV per share of each share class of the fund. Specifically, the portfolio manager manages the fund’s assets in an effort to ensure that the NAV for each share class will not fall below 80% of the highest NAV attained separately by each share class during the life of the fund, reduced for dividends, distributions, any extraordinary expenses, and certain extraordinary items (for each share class, the “Protected NAV”). In order to minimize the effect of equity market volatility on the NAV per share for a share class, the fund allocates its portfolio assets between two investment components. Through its first component, the “Equity Component,” the fund seeks to achieve growth of capital by investing primarily in common stocks selected for their growth potential. Although the fund may invest in companies of any size, it generally invests in larger, more established companies. The Equity Component may also consist of derivatives such as swaps, futures, and options. Through its second component, the “Protection Component,” the fund seeks to limit downside risk by investing in cash and other investments including, but not limited to, money market instruments, U.S. Treasuries, and other equity market risk reducing instruments, such as short index futures. Due to equity market conditions and the fund’s overall risk profile, the amount of fund assets allocated to the Protection Component may, at times, be significant. The fund’s allocation between the Equity Component and the Protection Component will vary over time. Up to 100% of assets may be allocated to either component.
JANUS REAL RETURN ALLOCATION FUND seeks real return consistent with preservation of capital. Under normal market conditions, the fund seeks to allocate its assets among the following inflation-related investment categories: global inflation-linked securities, commodity-linked investments, emerging market debt, emerging market equity, global real estate, and short-duration debt. Inflation-related investment categories are those which may provide what is known as “real return,” or a rate of return above the rate of inflation over a market cycle. The fund has wide flexibility to allocate assets across categories and may, at times, allocate assets to less than all categories. The fund’s Allocation Committee utilizes a “top down” analysis of macroeconomic factors to determine the overall allocation to each of the fund’s investment categories. Individual portfolio managers generally utilize a “bottom up” approach in choosing investments where the portfolio managers look at companies one at a time to determine if an investment is an attractive investment opportunity and if it is consistent with the fund’s investment policies, but may also consider macroeconomic factors.
JANUS RESEARCH FUND seeks long-term growth of capital. The fund pursues its investment objective by investing primarily in common stocks selected for their growth potential. The fund may invest in companies of any size, from larger, well-established companies to smaller, emerging growth companies. The fund may also invest in foreign equity and debt securities, which may include investments in emerging markets.
JANUS TRITON FUND seeks long-term growth of capital. The fund pursues its investment objective by investing primarily in common stocks selected for their growth potential. In pursuing that objective, the fund invests in equity securities of small- and medium-sized companies. Generally, small- and medium-sized companies have a market capitalization of less than $10 billion.
JANUS TWENTY FUND seeks long-term growth of capital. The fund pursues its investment objective by normally investing primarily in a core group of 20-30 common stocks selected for their growth potential.
JANUS VENTURE FUND seeks capital appreciation. The fund pursues its investment objective by investing at least 50% of its equity assets in small-sized companies. The fund may also invest in larger companies with strong growth potential or relatively well-known and large companies with potential for capital appreciation. Small-sized companies are defined by the portfolio managers as those companies whose market capitalization falls within the range of companies in the Russell 2000® Growth Index. Companies whose capitalization or revenues fall
24 | DECEMBER 31, 2011
outside these ranges after the fund’s initial purchase continue to be considered small-sized.
JANUS WORLDWIDE FUND seeks long-term growth of capital. The fund pursues its investment objective by investing primarily in equity securities, which include, but are not limited to, common stocks, preferred stocks, and depositary receipts of companies of any size located throughout the world. The fund normally invests in issuers from several different countries, including the United States. The fund may, under unusual circumstances, invest in a single country. The fund may have significant exposure to emerging markets. The fund may also invest in foreign equity and debt securities.
PERKINS GLOBAL VALUE FUND seeks capital appreciation. The fund pursues its investment objective by investing primarily in common stocks of companies of any size located throughout the world, including emerging markets. The fund normally invests in issuers from several different countries, which may include the United States. The fund may, under unusual circumstances, invest in a single country. The fund may have significant exposure to emerging markets. The fund may also invest in U.S. and foreign equity and debt securities.
PERKINS LARGE CAP VALUE FUND seeks capital appreciation. The fund pursues its investment objective by investing primarily in common stocks selected for their capital appreciation potential. The fund primarily invests in the common stocks of large-sized companies whose stock prices the portfolio managers believe to be undervalued. The fund invests, under normal circumstances, at least 80% of its net assets in equity securities of companies having, at the time of purchase, market capitalizations equal to or greater than the median market capitalization of companies included in the Russell 1000® Value Index. The fund may also invest in foreign equity and debt securities, which may include investments in emerging markets. The fund may invest, under normal circumstances, up to 20% of its assets in securities of companies having market capitalizations outside of the aforementioned market capitalization ranges or in cash or cash equivalents.
PERKINS MID CAP VALUE FUND seeks capital appreciation. The fund pursues its investment objective by investing primarily in common stocks selected for their capital appreciation potential. The fund primarily invests in the common stocks of mid-sized companies whose stock prices the portfolio managers believe to be undervalued. The fund invests, under normal circumstances, at least 80% of its net assets in equity securities of companies whose market capitalization falls, at the time of purchase, within the 12-month average of the capitalization range of the Russell Midcap® Value Index. The fund may also invest in foreign equity and debt securities, which may include investments in emerging markets. This average is updated monthly. The fund may invest, under normal circumstances, up to 20% of its assets in securities of companies having market capitalizations outside of the aforementioned market capitalization ranges or in cash or cash equivalents.
PERKINS SELECT VALUE FUND seeks capital appreciation. The fund pursues its investment objective by investing primarily in common stocks selected for their capital appreciation potential. The fund primarily invests in the common stocks of companies of any size whose stock prices the portfolio managers believe to be undervalued. The fund may also invest in foreign equity and debt securities, which may include investments in emerging markets.
PERKINS SMALL CAP VALUE FUND seeks capital appreciation. The fund pursues its investment objective by investing primarily in the common stocks of small companies whose stock prices are believed to be undervalued by the fund’s portfolio managers. The fund invests, under normal circumstances, at least 80% of its net assets in equity securities of small companies whose market capitalization, at the time of initial purchase, is less than the 12-month average of the maximum market capitalization for companies included in the Russell 2000® Value Index. This average is updated monthly. The fund may also invest in foreign equity and debt securities, which may include investments in emerging markets. The fund may invest, under normal circumstances, up to 20% of its assets in securities of companies having market capitalizations outside of the aforementioned market capitalization ranges or in cash or cash equivalents.
PERKINS VALUE PLUS INCOME FUND seeks capital appreciation and current income. The fund pursues its investment objective by normally investing 40-60% of its assets in equity securities selected primarily for capital appreciation and investing the remainder in fixed-income securities and cash equivalents. The fund’s equity investments generate total return from a combination of capital appreciation and, to a lesser degree, current income. Such equity investments may include companies of any size, but the fund will invest primarily in large- and mid-sized companies whose stock prices the portfolio managers believe to be undervalued or have the potential for high relative dividend yields, or both. The fund’s fixed-income investments generate total return from a combination of current income and capital appreciation, but income is usually the dominant portion. The fund normally invests the portion of its assets allocated to fixed-income investments in debt securities (including, but not limited to, government bonds, corporate bonds, mortgage-backed securities, and zero-coupon bonds),
Janus Asset Allocation Fund | 25
Notes to Financial Statements (unaudited) (continued)
convertible securities, and short-term securities. The fund invests at least 50% of the fixed-income portion of its assets in investment grade debt securities. The fund will limit its investment in high-yield/high-risk bonds, also known as “junk” bonds, to 50% or less of the fixed-income portion of its net assets.
POTENTIAL UNDERLYING FUNDS INCLUDED IN THE FIXED-INCOME SECURITIES ASSET CATEGORY
JANUS FLEXIBLE BOND FUND seeks to obtain maximum total return, consistent with preservation of capital. The fund pursues its investment objective by primarily investing, under normal circumstances, at least 80% of its net assets in bonds. Bonds include, but are not limited to, government bonds, corporate bonds, convertible bonds, mortgage-backed securities, and zero-coupon bonds. The fund will invest at least 65% of its assets in investment grade debt securities. The fund will limit its investment in high-yield/high-risk bonds, also known as “junk bonds,” to 35% or less of its net assets. The fund generates total return from a combination of current income and capital appreciation, but income is usually the dominant portion.
JANUS GLOBAL BOND FUND seeks total return, consistent with preservation of capital. The fund pursues its investment objective by investing, under normal circumstances, at least 80% of its net assets in bonds. Bonds include, but are not limited to, corporate bonds, government bonds, convertible bonds, mortgage-backed securities, and zero-coupon bonds. The fund invests in securities of issuers located in developed and emerging market countries. The fund may invest across all fixed-income sectors, including U.S. and non-U.S. government securities. The fund’s investments may be denominated in local currency or U.S. dollar-denominated. The fund may invest in debt securities with a range of maturities from short- to long-term. The fund may invest up to 35% of its net assets in high-yield/high-risk debt securities. The fund may also invest in preferred and common stock, money market instruments, municipal bonds, commercial and residential mortgage-backed securities, asset-backed securities, other securitized and structured debt products, private placements, and other investment companies, including ETFs. The fund may also invest in floating rate loans, buy backs or dollar rolls, and reverse repurchase agreements.
JANUS HIGH-YIELD FUND seeks to obtain high current income. Capital appreciation is a secondary investment objective when consistent with its primary objective. The fund pursues its investment objectives by investing, under normal circumstances, at least 80% of its net assets in high-yield/high-risk securities rated below investment grade. Securities rated below investment grade may include their unrated equivalents or other high-yielding securities the portfolio managers believe offer attractive risk/return characteristics. The fund may at times invest all of its assets in such securities.
JANUS SHORT-TERM BOND FUND seeks as high a level of current income as is consistent with preservation of capital. The fund invests, under normal circumstances, at least 80% of its net assets in short- and intermediate-term securities such as corporate bonds or notes or government securities, including agency securities. The fund may invest up to 35% of its net assets in high-yield/high-risk bonds, also known as “junk bonds.” The fund expects to maintain an average-weighted effective maturity of three years or less under normal circumstances.
The following accounting policies have been followed by the Fund and are in conformity with accounting principles generally accepted in the United States of America within the investment management industry.
Investment Valuation
The Fund’s NAV is partially calculated based upon the NAV of each of the underlying funds in which the Fund invests on the day of valuation. The NAV for each class of an underlying fund is computed by dividing the total value of securities and other assets allocated to the class, less liabilities allocated to that class, by the total number of shares outstanding for the class.
Securities held by the Fund and the underlying funds are valued at the last sales price or the official closing price for securities traded on a principal securities exchange (U.S. or foreign) and on the NASDAQ National Market. Securities held by the Fund and the underlying funds traded on over-the-counter (“OTC”) markets and listed securities for which no sales are reported are valued at the latest bid price (or yield equivalent thereof) obtained from one or more dealers transacting in a market for such securities or by a pricing service approved by the Fund’s and the underlying funds’ Trustees. Short-term securities held by the Fund and the underlying funds with maturities of 60 days or less may be valued at amortized cost, which approximates market value. Debt securities held by the Fund and the underlying funds with a remaining maturity of greater than 60 days are valued in accordance with the evaluated bid price supplied by the pricing service. The evaluated bid price supplied by the pricing service is an evaluation that reflects such factors as security prices, yields, maturities and ratings. Short positions shall be valued in accordance with the same methodologies, except that in the event that a last sale price is not available, the latest ask price shall be used instead of a bid price. Foreign securities and currencies held by the Fund and the underlying funds are converted to
26 | DECEMBER 31, 2011
U.S. dollars using the applicable exchange rate in effect as of the daily close of the New York Stock Exchange (“NYSE”). When market quotations are not readily available or deemed unreliable, or events or circumstances that may affect the value of portfolio securities held by the Fund and the underlying funds are identified between the closing of their principal markets and the time the NAV is determined, securities may be valued at fair value as determined in good faith under procedures established by and under the supervision of the Fund’s and the underlying funds’ Trustees. Circumstances in which fair value pricing may be utilized include, but are not limited to: (i) a significant event that may affect the securities of a single issuer, such as a merger, bankruptcy, or significant issuer specific development; (ii) an event that may affect an entire market, such as a natural disaster or significant governmental action; (iii) a nonsignificant event such as a market closing early or not opening, or a security trading halt; and (iv) pricing of a non-valued security and a restricted or non-public security. The Fund and underlying funds may use systematic fair valuation models provided by independent third parties to value international equity securities in order to adjust for stale pricing, which may occur between the close of certain foreign exchanges and the close of the NYSE. Restricted and illiquid securities are valued in accordance with procedures established by the Fund’s and the underlying funds’ Trustees.
Investment Transactions and Investment Income
Investment transactions are accounted for as of the date purchased or sold (trade date). Dividend income is recorded on the ex-dividend date. Certain dividends from foreign securities held by the Fund and the underlying funds will be recorded as soon as the Trust is informed of the dividend, if such information is obtained subsequent to the ex-dividend date. Dividends from foreign securities may be subject to withholding taxes in foreign jurisdictions. Interest income of the Fund and the underlying funds is recorded on the accrual basis and includes amortization of premiums and accretion of discounts. Gains and losses are determined on the identified cost basis, which is the same basis used for federal income tax purposes. Income, as well as gains and losses, both realized and unrealized, are allocated daily to each class of shares based upon the ratio of net assets represented by each class as a percentage of total net assets.
Expenses
The Fund bears expenses incurred specifically on its behalf, as well as a portion of general expenses, which may be allocated pro rata to the Fund. Additionally, the Fund, as a shareholder in the underlying funds, will also indirectly bear its pro rata share of the expenses incurred by the underlying funds. Each class of shares bears expenses incurred specifically on its behalf and, in addition, each class bears a portion of general expenses, which are allocated daily to each class of shares based upon the ratio of net assets represented by each class as a percentage of total net assets. Expenses directly attributable to a specific class of shares are charged against the operations of such class.
Estimates
The preparation of financial statements in conformity with accounting principles generally accepted in the United States of America requires management to make estimates and assumptions that affect the reported amount of assets and liabilities and disclosure of contingent assets and liabilities at the date of the financial statements, and the reported amounts of income and expenses during the reporting period. Actual results could differ from those estimates.
Foreign Currency Translations
The underlying funds do not isolate that portion of the results of operations resulting from the effect of changes in foreign exchange rates on investments from the fluctuations arising from changes in market prices of securities held at the date of the financial statements. Net unrealized appreciation or depreciation of investments and foreign currency translations arise from changes in the value of assets and liabilities, including investments in securities held at the date of the financial statements, resulting from changes in the exchange rates and changes in market prices of securities held.
Currency gains and losses of the underlying funds are also calculated on payables and receivables that are denominated in foreign currencies. The payables and receivables are generally related to foreign security transactions and income translations.
Foreign currency-denominated assets and forward currency contracts of the underlying funds may involve more risks than domestic transactions, including currency risk, political and economic risk, regulatory risk and equity risk. Risks may arise from the potential inability of a counterparty to meet the terms of a contract and from unanticipated movements in the value of foreign currencies relative to the U.S. dollar.
Dividend Distributions
The Fund generally declares and distributes dividends of net investment income and realized capital gains (if any) annually. The majority of dividends and capital gains distributions from the Fund may be automatically reinvested into additional shares of the Fund, based on the discretion of the shareholder.
Janus Asset Allocation Fund | 27
Notes to Financial Statements (unaudited) (continued)
The underlying funds may make certain investments in REITs which pay dividends to their shareholders based upon funds available from operations. It is quite common for these dividends to exceed the REITs’ taxable earnings and profits, resulting in the excess portion of such dividends being designated as a return of capital. If the underlying funds distribute such amounts, such distributions could constitute a return of capital to shareholders for federal income tax purposes.
Federal Income Taxes
No provision for income taxes is included in the accompanying financial statements as the Fund intends to distribute to shareholders all taxable investment income and realized gains and otherwise comply with Subchapter M of the Internal Revenue Code applicable to regulated investment companies.
In accordance with the Financial Accounting Standards Board (“FASB”) guidance, the Fund adopted the provisions of “Income Taxes.” These provisions require an evaluation of tax positions taken (or expected to be taken) in the course of preparing the Fund’s tax return to determine whether these positions meet a “more-likely-than-not” standard that, based on the technical merits, have a more than fifty percent likelihood of being sustained by a taxing authority upon examination. A tax position that meets the “more-likely-than-not” recognition threshold is measured to determine the amount of benefit to recognize in the financial statements. The Fund recognizes interest and penalties, if any, related to unrecognized tax benefits in income tax expense on the Statement of Operations.
These provisions require management of the Fund to analyze all open tax years, as defined by the Statute of Limitations, for all major jurisdictions, including federal tax authorities and certain state tax authorities. As of and during the period ended December 31, 2011, the Fund did not have a liability for any unrecognized tax benefits. The Fund has no examinations in progress and is not aware of any tax positions for which it is reasonably possible that the total amounts of unrecognized tax benefits will significantly change in the next twelve months.
On December 22, 2010, the Regulated Investment Company Modernization Act of 2010 (the “Modernization Act”) was signed by the President. The Modernization Act is the first major piece of legislation affecting Regulated Investment Companies (“RICs”) since 1986 and it modernizes several of the federal income and excise tax provisions related to RICs. Some of the enacted provisions include:
New capital losses may now be carried forward indefinitely, and retain the character of the original loss. Under pre-enactment law, capital losses could be carried forward for eight years, and carried forward as short-term capital, irrespective of the character of the original loss.
The Modernization Act contains simplification provisions, which are aimed at preventing disqualification of a RIC for “inadvertent” failures of the asset diversification and/or qualifying income tests. Additionally, the Modernization Act exempts RICs from the preferential dividend rule, and repeals the 60-day designation requirement for certain types of pay-through income and gains.
Finally, the Modernization Act contains several provisions aimed at preserving the character of distributions made by a fiscal year RIC during the portion of its taxable year ending after October 31 or December 31, reducing the circumstances under which a RIC might be required to file amended Forms 1099 to restate previously reported distributions.
Except for the simplification provisions related to RIC qualification, the Modernization Act is effective for taxable years beginning after December 22, 2010. The provisions related to RIC qualification are effective for taxable years for which the extended due date of the tax return is after December 22, 2010.
Valuation Inputs Summary
In accordance with FASB guidance, the Fund utilizes the “Fair Value Measurements” to define fair value, establish a framework for measuring fair value, and expand disclosure requirements regarding fair value measurements. The Fair Value Measurement Standard does not require new fair value measurements, but is applied to the extent that other accounting pronouncements require or permit fair value measurements. This standard emphasizes that fair value is a market-based measurement that should be determined based on the assumptions that market participants would use in pricing an asset or liability. Various inputs are used in determining the value of the Fund’s investments defined pursuant to this standard. These inputs are summarized into three broad levels:
Level 1 – Quoted prices in active markets for identical securities.
Level 2 – Prices determined using other significant observable inputs. Observable inputs are inputs that reflect the assumptions market participants would use in pricing a security and are developed based on market data obtained from sources independent of the reporting entity. These may include quoted prices for similar securities, interest rates, prepayment speeds, credit risk, and others.
Debt securities are valued in accordance with the evaluated bid price supplied by the pricing service
28 | DECEMBER 31, 2011
and generally categorized as Level 2 in the hierarchy. Securities traded on OTC markets and listed securities for which no sales are reported are valued at the latest bid price (or yield equivalent thereof) obtained from one or more dealers transacting in a market for such securities or by a pricing service approved by the Fund’s Trustees and are categorized as Level 2 in the hierarchy. Short-term securities with maturities of 60 days or less are valued at amortized cost, which approximates market value and are categorized as Level 2 in the hierarchy. Other securities that are categorized as Level 2 in the hierarchy include, but are not limited to, preferred stocks, bank loans, American Depositary Receipts (ADRs), Global Depositary Receipts (GDRs), warrants, swaps, investments in mutual funds, OTC options, and forward contracts. The Fund may use systematic fair valuation models provided by independent third parties to value international equity securities in order to adjust for stale pricing, which may occur between the close of certain foreign exchanges and the close of the NYSE. These are generally categorized as Level 2 in the hierarchy.
Level 3 – Prices determined using significant unobservable inputs. In situations where quoted prices or observable inputs are unavailable or deemed less relevant (for example, when there is little or no market activity for an investment at the end of the period), unobservable inputs may be used. Unobservable inputs are inputs that reflect the reporting entity’s own assumptions about the factors market participants would use in pricing the security and would be based on the best information available under the circumstances.
For restricted equity securities and private placements where observable inputs are limited, assumptions about market activity and risk are used in employing valuation techniques such as the market approach, the income approach, or the cost approach, as defined under the FASB Guidance. These are categorized as Level 3 in the hierarchy.
There have been no significant changes in valuation techniques used in valuing any such positions held by the Fund since the beginning of the fiscal period.
The inputs or methodology used for valuing securities are not necessarily an indication of the risk associated with investing in those securities. The summary of inputs used as of December 31, 2011 to value the Fund’s investments in securities and other financial instruments is included in the “Valuation Inputs Summary” and “Level 3 Valuation Reconciliation of Assets” (if applicable) in the Notes to Schedule of Investments.
The Fund adopted FASB Accounting Standards Update “Fair Value Measurements and Disclosures” (the “Update”). This Update applies to the Fund’s disclosures about transfers in and out of Level 1 and Level 2 of the fair value hierarchy and the reasons for the transfers. Disclosures about the valuation techniques and inputs used to measure fair value for investments that fall in either Level 2 or Level 3 fair value hierarchy are summarized under the Level 2 and Level 3 categories listed above. There were no transfers between Level 1 and Level 2 of the fair value hierarchy during the fiscal year.
There were no Level 3 securities during the fiscal period.
The Fund recognizes transfers between the levels as of the beginning of the fiscal period.
| |
| 2. | Derivative Instruments |
The Fund and underlying funds may invest in various types of derivatives, which may at times result in significant derivative exposure. A derivative is a financial instrument whose performance is derived from the performance of another asset. The Fund and underlying funds may invest in derivative instruments including, but not limited to: futures contracts, put options, call options, options on swap contracts, options on future contracts, options on foreign currencies, swaps, forward contracts, structured investments, and other equity-linked derivatives.
The Fund and underlying funds may use derivative instruments for hedging (to offset risks associated with an investment, currency exposure, or market conditions) or for speculative (to seek to enhance returns) purposes. When the Fund and underlying funds invest in a derivative for speculative purposes, the Fund or underlying funds will be fully exposed to the risks of loss of that derivative, which may sometimes be greater than the cost of the derivative. The Fund and underlying funds may not use any derivative to gain exposure to an asset or class of assets prohibited by their investment restrictions from purchasing directly. The Fund’s or an underlying fund’s ability to use derivative instruments may also be limited by tax considerations.
Investments in derivatives are generally subject to market risks that may cause their prices to fluctuate over time. Investments in derivatives may not directly correlate with the price movements of the underlying instrument. As a result, the use of derivatives may expose the Fund and underlying funds to additional risks that they would not be subject to if they invested directly in the securities underlying those derivatives. The use of derivatives may result in larger losses or smaller gains than otherwise would be the case. Derivatives can be volatile and may involve significant risks, including, but not limited to,
Janus Asset Allocation Fund | 29
Notes to Financial Statements (unaudited) (continued)
counterparty risk, credit risk, currency risk, equity risk, index risk, interest rate risk, leverage risk, and liquidity risk.
Derivatives may generally be traded OTC or on an exchange. Derivatives traded OTC, such as options and structured notes, are agreements that are individually negotiated between parties and can be tailored to meet a purchaser’s needs.
OTC derivatives are not guaranteed by a clearing agency and may be subject to increased credit risk. In an effort to mitigate credit risk associated with derivatives traded OTC, the Fund and certain underlying funds may enter into collateral agreements with certain counterparties whereby, subject to certain minimum exposure requirements, the Fund and certain underlying funds may require the counterparty to post collateral if the Fund or underlying funds have a net aggregate unrealized gain on all OTC derivative contracts with a particular counterparty. There is no guarantee that counterparty exposure is reduced and these arrangements are dependent on Janus Capital’s ability to establish and maintain appropriate systems and trading.
In pursuit of their investment objectives, the Fund and underlying funds may seek to use derivatives to increase or decrease exposure to the following market risk factors:
| | |
| | • | Counterparty Risk – Counterparty risk is the risk that the counterparty (the party on the other side of the transaction) on a derivative transaction will be unable to honor its financial obligation to the Fund and underlying funds. |
| |
| | • | Credit Risk – Credit risk is the risk an issuer will be unable to make principal and interest payments when due, or will default on its obligations. |
| |
| | • | Currency Risk – Currency risk is the risk that changes in the exchange rate between currencies will adversely affect the value (in U.S. dollar terms) of an investment. |
| |
| | • | Equity Risk – Equity risk relates to the change in value of equity securities as they relate to increases or decreases in the general market. |
| |
| | • | Index Risk – If the derivative is linked to the performance of an index, it will be subject to the risks associated with changes in that index. If the index changes, the Fund and underlying funds could receive lower interest payments or experience a reduction in the value of the derivative to below what the Fund and underlying funds paid. Certain indexed securities, including inverse securities (which move in an opposite direction to the index), may create leverage, to the extent that they increase or decrease in value at a rate that is a multiple of the changes in the applicable index. |
| |
| | • | Interest Rate Risk – Interest rate risk is the risk that the value of fixed-income securities will generally decline as prevailing interest rates rise, which may cause the Fund’s and underlying fund’s NAV to likewise decrease, and vice versa. |
| |
| | • | Leverage Risk – Leverage risk is the risk associated with certain types of leveraged investments or trading strategies pursuant to which relatively small market movements may result in large changes in the value of an investment. The Fund or underlying funds create leverage by using borrowed capital to increase the amount invested, or investing in instruments, including derivatives, where the investment loss can exceed the original amount invested. Certain investments or trading strategies that involve leverage can result in losses that greatly exceed the amount originally invested. |
| |
| | • | Liquidity Risk – Liquidity risk is the risk that certain securities may be difficult or impossible to sell at the time that the seller would like or at the price that the seller believes the security is currently worth. |
In accordance with FASB guidance, the Fund adopted the provisions for “Derivatives and Hedging,” which require qualitative disclosures about objectives and strategies for using derivatives, quantitative disclosures about fair value amounts of and gains and losses on derivative instruments, and disclosures about credit-risk-related contingent features in derivative agreements.
There were no derivatives held by the Fund during the period ended December 31, 2011.
| |
| 3. | Other Investments and Strategies |
Additional Investment Risk
The underlying funds, particularly Janus Flexible Bond Fund, Janus Global Bond Fund, Janus High-Yield Fund and Janus Short-Term Bond Fund, may be invested in lower-rated debt securities that have a higher risk of default or loss of value since these securities may be sensitive to economic changes, political changes or adverse developments specific to the issuer. INTECH International Fund, INTECH U.S. Core Fund, INTECH U.S. Growth Fund, and INTECH U.S. Value Fund (the “Mathematical funds”) do not intend to invest in high-yield/high-risk bonds.
It is important to note that events in both domestic and international equity and fixed-income markets have resulted, and may continue to result, in an unusually high
30 | DECEMBER 31, 2011
degree of volatility in the markets, with issuers that have exposure to the real estate, mortgage, and credit markets particularly affected. These events and the resulting market upheavals may have an adverse effect on an underlying fund, such as a decline in the value and liquidity of many securities held by the underlying fund, unusually high and unanticipated levels of redemptions, an increase in portfolio turnover, a decrease in NAV, and an increase in underlying fund expenses. Because the situation is unprecedented and widespread, it may also be unusually difficult to identify both investment risks and opportunities, which could limit or preclude an underlying fund’s ability to achieve its investment objective. It is impossible to predict whether or for how long these conditions will continue. Therefore, it is important to understand that the value of your investment may fall, sometimes sharply, and you could lose money.
Further, the instability experienced in the financial markets has resulted in the U.S. Government and various other governmental and regulatory entities taking actions to address the financial crisis. These actions include, but are not limited to, the enactment of the Dodd-Frank Wall Street Reform and Consumer Protection Act (the “Dodd-Frank Act”) in July 2010 which is expected to dramatically change the way in which the U.S. financial system is supervised and regulated. More specifically, the Dodd-Frank Act provides for widespread regulation of financial institutions, consumer financial products and services, broker-dealers, over-the-counter derivatives, investment advisers, credit rating agencies, and mortgage lending, which expands federal oversight in the financial sector and may affect the investment management industry as a whole. Given the broad scope, sweeping nature, and the fact that many provisions of the Dodd-Frank Act must be implemented through future rulemaking, the ultimate impact of the Dodd-Frank Act, and any resulting regulation, is not yet certain. As a result, there can be no assurance that these government and regulatory measures will not have an adverse effect on the value or marketability of securities held by an underlying fund including potentially limiting or completely restricting the ability of the underlying fund to use a particular investment instrument as part of its investment strategy, increasing the costs of using these instruments, or possibly making them less effective in general. Furthermore, no assurance can be made that the U.S. Government or any U.S. regulatory entity (or other authority or regulatory entity) will not continue to take further legislative or regulatory action in response to the economic crisis or otherwise, and the effect of such actions, if taken, cannot be known.
Certain areas of the world have historically been prone to and economically sensitive to environmental events such as, but not limited to, hurricanes, earthquakes, typhoons, flooding, tidal waves, tsunamis, erupting volcanoes, wildfires or droughts, tornadoes, mudslides, or other weather-related phenomena. Such disasters, and the resulting physical or economic damage, could have a severe and negative impact on the Fund’s or an underlying fund’s investment portfolio and, in the longer term, could impair the ability of issuers in which the Fund or the underlying fund invests to conduct their businesses as they would under normal conditions. Adverse weather conditions may also have a particularly significant negative effect on issuers in the agricultural sector and on insurance companies that insure against the impact of natural disasters.
Bank Loans
Certain underlying funds, particularly Janus Balanced Fund, Janus Flexible Bond Fund, Janus Global Bond Fund, Janus Global Market Neutral Fund, Janus Global Technology Fund, Janus High-Yield Fund, Janus Short-Term Bond Fund, and Perkins Value Plus Income Fund, may invest in bank loans, which include institutionally traded floating rate securities generally acquired as an assignment from another holder of, or participation interest in, loans originated by a bank or financial institution (the “Lender”) that acts as agent for all holders. The agent administers the terms of the loan, as specified in the loan agreement. When investing in a loan participation, the underlying funds have the right to receive payments of principal, interest and any fees to which they are entitled only from the Lender selling the loan agreement and only upon receipt by the Lender of payments from the borrower. The underlying funds generally have no right to enforce compliance with the terms of the loan agreement with the borrower. Assignments and participations involve credit, interest rate, and liquidity risk. Interest rates on floating rate securities adjust with general interest rate changes and/or issuer credit quality. The interest rates paid on a floating rate security in which the underlying funds invest generally are readjusted periodically to an increment over a designated benchmark rate, such as the one-month, three-month, six-month, or one-year London Interbank Offered Rate (“LIBOR”). LIBOR is a short-term interest rate that banks charge one another and is generally representative of the most competitive and current cash rates.
The underlying funds may have difficulty trading assignments and participations to third parties. There may be restrictions on transfer and only limited opportunities may exist to sell such securities in secondary markets. As a result, the underlying funds may be unable to sell assignments or participations at the desired time or may be able to sell only at a price less than fair market value.
Janus Asset Allocation Fund | 31
Notes to Financial Statements (unaudited) (continued)
The underlying funds utilize an independent third party to value individual bank loans on a daily basis.
Borrowing
The underlying Janus Global Market Neutral Fund may borrow money from banks for investment purposes to the extent permitted by the 1940 Act. This practice is known as leverage. Currently, under the 1940 Act, Janus Global Market Neutral Fund may borrow from banks up to one-third of its total assets (including the amount borrowed) provided that it maintains continuous asset coverage of 300% with respect to such borrowings and sells (within three days) sufficient portfolio holdings to restore such coverage if it should decline to less than 300% due to market fluctuations or otherwise, even if disadvantageous from an investment standpoint. Janus Global Market Neutral Fund may also borrow money to meet redemptions in order to avoid forced, unplanned sales of portfolio securities or for other temporary or emergency purposes. This allows Janus Global Market Neutral Fund greater flexibility to buy and sell portfolio securities for investment or tax considerations, rather than for cash flow considerations.
The use of borrowing by Janus Global Market Neutral Fund involves special risk considerations that may not be associated with other funds that may only borrow for temporary or emergency purposes. Because substantially all of Janus Global Market Neutral Fund’s assets fluctuate in value, whereas the interest obligation resulting from a borrowing will be fixed by the terms of Janus Global Market Neutral Fund’s agreement with its lender, the NAV per share of Janus Global Market Neutral Fund will tend to increase more when its portfolio securities increase in value and decrease more when its portfolio securities decrease in value than would otherwise be the case if Janus Global Market Neutral Fund did not borrow funds. In addition, interest costs on borrowings may fluctuate with changing market rates of interest and may partially offset or exceed the return earned on borrowed funds. Under adverse market conditions, Janus Global Market Neutral Fund might have to sell portfolio securities to meet interest or principal payments at a time when fundamental investment considerations would not favor such sales. The interest that Janus Global Market Neutral Fund must pay on borrowed money, together with any additional fees to maintain a line of credit or any minimum average balances required to be maintained, are additional costs that will reduce or eliminate any net investment income and may also offset any potential capital gains. Unless the appreciation and income, if any, on assets acquired with borrowed funds exceed the costs of borrowing, the use of leverage will diminish the investment performance of Janus Global Market Neutral Fund compared with what it would have been without leverage.
Counterparties
Fund or underlying fund transactions involving a counterparty are subject to the risk that the counterparty or a third party will not fulfill its obligation to the Fund or underlying funds (“counterparty risk”). Counterparty risk may arise because of the counterparty’s financial condition (i.e., financial difficulties, bankruptcy, or insolvency), market activities and developments, or other reasons, whether foreseen or not. A counterparty’s inability to fulfill its obligation may result in significant financial loss to the Fund or underlying funds. The Fund or underlying funds may be unable to recover their investments from the counterparty or may obtain a limited recovery, and/or recovery may be delayed. The extent of the Fund’s or underlying funds’ exposure to counterparty risk in respect to financial assets approximates their carrying value as recorded on the Fund’s Statement of Assets and Liabilities, if applicable.
The Fund or underlying funds may be exposed to counterparty risk through participation in various programs including, but not limited to, lending their securities to third parties, cash sweep arrangements whereby the Fund’s or underlying funds’ cash balances are invested in one or more types of cash management vehicles, as well as investments in, but not limited to, repurchase agreements, debt securities, and derivatives, including various types of swaps, futures and options. The Fund or underlying funds intend to enter into financial transactions with counterparties that Janus Capital believes to be creditworthy at the time of the transaction. There is always the risk that Janus Capital’s analysis of a counterparty’s creditworthiness is incorrect or may change due to market conditions. To the extent that the Fund or underlying funds focus their transactions with a limited number of counterparties, they will have greater exposure to the risks associated with one or more counterparties.
Emerging Market Investing
Within the parameters of its specific investment policies, an underlying fund may invest in securities of issuers or companies from or with exposure to one or more “developing countries” or “emerging markets.” Investing in emerging markets may involve certain risks and considerations not typically associated with investing in the United States and imposes risks greater than, or in addition to, the risks associated with investing in securities of more developed foreign countries. Emerging markets securities are exposed to a number of additional risks, which may result from less government supervision and regulation of business and industry practices (including the potential lack of strict finance and accounting controls and standards), stock exchanges, brokers, and listed companies, making these investments potentially more volatile in price and less liquid than investments in
32 | DECEMBER 31, 2011
developed securities markets, resulting in greater risk to investors. In addition, the underlying fund’s investments may be denominated in foreign currencies and therefore, changes in the value of a country’s currency compared to the U.S. dollar may affect the value of the underlying fund’s investments. To the extent that an underlying fund invests a significant portion of its assets in the securities of issuers in or companies of a single country or region, it is more likely to be impacted by events or conditions affecting that country or region, which could have a negative impact on the underlying fund’s performance.
Exchange-Traded Funds
The Fund or underlying funds may invest in exchange-traded funds, which generally are index-based investment companies that hold substantially all of their assets in securities representing their specific index. As a shareholder of another investment company, the Fund or underlying funds would bear their pro rata portion of the other investment company’s expenses, including advisory fees, in addition to the expenses the Fund or underlying funds bear directly in connection with their own operations.
Exchange-Traded Notes
The Fund or underlying funds may invest directly in exchange-traded notes (“ETNs”), which are senior, unsecured, unsubordinated debt securities whose returns are linked to a particular index and provide exposure to the total returns of various market indices, including indices linked to stocks, bonds, commodities and currencies. This type of debt security differs from other types of bonds and notes. ETN returns are based upon the performance of a market index minus applicable fees; no periodic coupon payments are distributed and no principal protections exist. ETNs do not pay cash distributions. Instead, the value of dividends, interest, and investment gains are captured in the Fund’s or underlying funds’ total returns. The Fund or underlying funds may invest in these securities when desiring exposure to debt securities or commodities. When evaluating ETNs for investment, Janus Capital will consider the potential risks involved, expected tax efficiency, rate of return, and credit risk. When the Fund or underlying funds invest in ETNs, they will bear their proportionate share of any fees and expenses borne by the ETN. There may be restrictions on the Fund’s or underlying funds’ right to redeem their investment in an ETN, which is meant to be held until maturity. The Fund’s decision to sell its ETN holdings may be limited by the availability of a secondary market.
Floating Rate Loans
Certain underlying funds, particularly Janus Balanced Fund, Janus Flexible Bond Fund, Janus Global Bond Fund, Janus Global Market Neutral Fund, Janus High-Yield Fund, Janus Short-Term Bond Fund, and Perkins Value Plus Income Fund, may invest in floating rate loans. Floating rate loans are debt securities that have floating interest rates, which adjust periodically, and are tied to a benchmark lending rate, such as LIBOR. In other cases, the lending rate could be tied to the prime rate offered by one or more major U.S. banks or the rate paid on large certificates of deposit traded in the secondary markets. If the benchmark lending rate changes, the rate payable to lenders under the loan will change at the next scheduled adjustment date specified in the loan agreement. Floating rate loans are typically issued to companies (“borrowers”) in connection with recapitalizations, acquisitions, and refinancings. Floating rate loan investments are generally below investment grade. Senior floating rate loans are secured by specific collateral of a borrower and are senior in the borrower’s capital structure. The senior position in the borrower’s capital structure generally gives holders of senior loans a claim on certain of the borrower’s assets that is senior to subordinated debt and preferred and common stock in the case of a borrower’s default. Floating rate loan investments may involve foreign borrowers, and investments may be denominated in foreign currencies. Floating rate loans often involve borrowers whose financial condition is troubled or uncertain and companies that are highly leveraged. The underlying funds may invest in obligations of borrowers who are in bankruptcy proceedings. Floating rate loans may include fully funded term loans or revolving lines of credit.
Purchasers of floating rate loans may pay and/or receive certain fees. The underlying funds may receive fees such as covenant waiver fees or prepayment penalty fees. The underlying funds may pay fees such as facility fees. Such fees may affect the underlying funds’ returns.
Initial Public Offerings
The underlying funds may invest in initial public offerings (“IPOs”). IPOs and other investment techniques may have a magnified performance impact on an underlying fund with a small asset base. An underlying fund may not experience similar performance as its assets grow.
Interfund Lending
As permitted by the Securities and Exchange Commission (“SEC”), or the 1940 Act and rules promulgated thereunder, the underlying funds may be party to interfund lending agreements between the underlying funds and other Janus Capital sponsored mutual funds and certain pooled investment vehicles, which permit them to borrow or lend cash at a rate beneficial to both the borrowing and lending funds. Outstanding borrowings from all sources totaling 10% or more of a borrowing underlying fund’s
Janus Asset Allocation Fund | 33
Notes to Financial Statements (unaudited) (continued)
total assets must be collateralized at 102% of the outstanding principal value of the loan; loans of less than 10% may be unsecured.
Mortgage- and Asset-Backed Securities
The underlying funds may purchase fixed or variable rate mortgage-backed securities issued by the Government National Mortgage Association (“Ginnie Mae”), the Federal National Mortgage Association (“Fannie Mae”), the Federal Home Loan Mortgage Corporation (“Freddie Mac”), or other governmental or government-related entities. Historically, Fannie Maes and Freddie Macs were not backed by the full faith and credit of the U.S. Government, and may not be in the future. In September 2008, the Federal Housing Finance Agency (“FHFA”), an agency of the U.S. Government, placed Fannie Mae and Freddie Mac under conservatorship to provide stability in the financial markets, mortgage availability and taxpayer protection by preserving Fannie Mae’s and Freddie Mac’s assets, and placing them in a sound and solvent condition. Under the conservatorship, the management of Fannie Mae and Freddie Mac was replaced. The effect that the FHFA’s conservatorship will have on Fannie Mae’s and Freddie Mac’s debt and equities is unclear. The underlying funds may purchase other mortgage- and asset-backed securities through single- and multi-seller conduits, collateralized debt obligations, structured investment vehicles, and other similar securities. Asset-backed securities may be backed by automobile loans, equipment leases, credit card receivables, or other collateral. In the event the underlying securities fail to perform, these investment vehicles could be forced to sell the assets and recognize losses on such assets, which could impact the underlying funds’ yield and the underlying funds’ return.
Unlike traditional debt instruments, payments on these securities include both interest and a partial payment of principal. Prepayment risk, which results from prepayments of the principal of underlying loans at a faster pace than expected, may shorten the effective maturities of these securities and may result in an underlying fund having to reinvest proceeds at a lower interest rate. In addition to prepayment risk, investments in mortgage-backed securities, including those comprised of subprime mortgages, and investments in other asset-backed securities comprised of under-performing assets may be subject to a higher degree of credit risk, valuation risk, and liquidity risk. Additionally, although mortgages and mortgage-related securities are generally supported by some form of government or private guarantee and/or insurance, there is no assurance that private guarantors or insurers will meet their obligations.
Mortgage- and asset-backed securities are also subject to extension risk, which is the risk that rising interest rates could cause mortgages or other obligations underlying these securities to be paid more slowly than expected, increasing an underlying fund’s sensitivity to interest changes and causing its price to decline.
Mortgage Dollar Rolls
Certain underlying funds, particularly Janus Flexible Bond Fund, Janus Global Bond Fund, Janus Global Market Neutral Fund, Janus Global Real Estate Fund, Janus High-Yield Fund and Janus Short-Term Bond Fund, may enter into “mortgage dollar rolls.” In a “mortgage dollar roll” transaction, the underlying funds sell a mortgage-related security (such as a Ginnie Mae security) to a dealer and simultaneously agree to repurchase a similar security (but not the same security) in the future at a predetermined price. The underlying funds will not be entitled to receive interest and principal payments while the dealer holds the security. The difference between the sale price and the future purchase price is recorded as an adjustment to investment income of the underlying funds.
The underlying funds’ obligations under a dollar roll agreement must be covered by cash, U.S. Government securities or other liquid high-grade debt obligations equal in value to the securities subject to repurchase by the underlying funds, maintained in a segregated account. To the extent that the underlying funds collateralize their obligations under a dollar roll agreement, the asset coverage requirements of the 1940 Act will not apply to such transactions. Furthermore, under certain circumstances, an underlying mortgage-backed security that is part of a dollar roll transaction may be considered illiquid.
Successful use of mortgage dollar rolls depends on the portfolio managers’ ability to predict interest rates and mortgage payments. Dollar roll transactions involve the risk that the market value of the securities the underlying funds are required to purchase may decline below the agreed upon repurchase price.
Real Estate Investing
The underlying funds may invest in equity and debt securities of U.S. and non-U.S. real estate-related companies. Such companies may include those in the real estate industry or real estate-related industries. These securities may include common stocks, preferred stocks, and other equity securities, including, but not limited to, REITs and similar REIT-like entities such as foreign entities that have REIT characteristics.
Restricted Security Transactions
Restricted securities held by the underlying funds may not be sold except in exempt transactions or in a public offering registered under the Securities Act of 1933, as
34 | DECEMBER 31, 2011
amended. The risk of investing in such securities is generally greater than the risk of investing in the securities of widely held, publicly traded companies. Lack of a secondary market and resale restrictions may result in the inability of the underlying funds to sell a security at a fair price and may substantially delay the sale of the security. In addition, these securities may exhibit greater price volatility than securities for which secondary markets exist.
Securities Lending
Under procedures adopted by the Trustees, the underlying funds may seek to earn additional income through lending their securities to certain qualified broker-dealers and institutions on a short-term or long-term basis. The underlying funds may lend portfolio securities on a short-term or long-term basis, in an amount equal to up to 1/3 of their total assets as determined at the time of the loan origination. When an underlying fund lends its securities, it receives collateral (including cash collateral), at least equal to the value of securities loaned. The underlying funds may earn income by investing this collateral in one or more affiliated or nonaffiliated cash management vehicles. It is also possible that, due to a decline in the value of a cash management vehicle, the underlying funds may lose money. There is also the risk that when portfolio securities are lent, the securities may not be returned on a timely basis, and the underlying funds may experience delays and costs in recovering the security or gaining access to the collateral provided to the underlying funds to collateralize the loan. If the underlying funds are unable to recover a security on loan, the underlying funds may use the collateral to purchase replacement securities in the market. There is a risk that the value of the collateral could decrease below the cost of the replacement security by the time the replacement investment is made, resulting in a loss to the underlying funds. Janus Capital intends to manage the cash collateral in an affiliated cash management vehicle and will receive an investment advisory fee for managing such assets.
The borrower pays fees at the underlying funds’ direction to Deutsche Bank AG (the “Lending Agent”). The Lending Agent may retain a portion of the interest earned on the cash collateral invested. The cash collateral invested by the Lending Agent is disclosed on the underlying funds’ Schedules of Investments in their most recent annual or semiannual reports (if applicable). The lending fees and an underlying fund’s portion of the interest income earned on cash collateral are included on the underlying fund’s Statement of Operations in its most recent annual or semiannual reports (if applicable).
Securities Traded on a To-Be-Announced Basis
Certain underlying funds, particularly Janus Flexible Bond Fund, Janus Global Bond Fund, Janus Global Market Neutral Fund, Janus Global Real Estate Fund, Janus High-Yield Fund and Janus Short-Term Bond Fund, may trade securities on a to-be-announced (“TBA”) basis. In a TBA transaction, the underlying funds commit to purchasing or selling securities for which specific information is not yet known at the time of the trade, particularly the face amount and maturity date in Ginnie Mae, Fannie Mae and/or Freddie Mac transactions.
Securities purchased on a TBA basis are not settled until they are delivered to the underlying funds, normally 15 to 45 days later. Beginning on the date the underlying funds enter into a TBA transaction, cash, U.S. Government securities or other liquid high-grade debt obligations are segregated in an amount equal in value to the purchase price of the TBA security. These transactions are subject to market fluctuations and their current value is determined in the same manner as for other securities.
Short Sales
The underlying funds, except the Mathematical funds, may engage in “short sales against the box.” Short sales against the box involve either selling short a security that the underlying funds own or selling short a security that the underlying funds have the right to obtain, for delivery at a specified date in the future. The underlying funds may enter into short sales against the box to hedge against anticipated declines in the market price of portfolio securities. The underlying funds do not deliver from their portfolios the securities sold short and do not immediately receive the proceeds of the short sale. The underlying funds borrow the securities sold short and receive proceeds from the short sale only when they deliver the securities to the lender. If the value of the securities sold short increases prior to the scheduled delivery date, the underlying funds lose the opportunity to participate in the gain.
The underlying funds, except the Mathematical funds, may also engage in other short sales. The underlying funds may engage in short sales when the portfolio managers and/or investment personnel anticipate that a security’s market purchase price will be less than its borrowing price. To complete the transaction, the underlying funds must borrow the security to deliver it to the purchaser and buy that same security in the market to return it to the lender. No more than 10% of the underlying funds’ net assets may be invested in short positions (through short sales of stocks, structured products, futures, swaps, and uncovered written calls). The underlying funds may engage in short sales “against the box” and options for hedging purposes that are not subject to this 10% limit.
Janus Asset Allocation Fund | 35
Notes to Financial Statements (unaudited) (continued)
The underlying Janus Global Market Neutral Fund is not subject to any such limit. Although the potential for gain as a result of a short sale is limited to the price at which an underlying fund sold the security short less the cost of borrowing the security, the potential for loss is theoretically unlimited because there is no limit to the cost of replacing the borrowed security. There is no assurance that the underlying funds will be able to close out a short position at a particular time or at an acceptable price. A gain or a loss will be recognized upon termination of a short sale. Short sales held by the underlying funds are fully collateralized by restricted cash or other securities, which are denoted on the underlying funds’ Schedules of Investments in their most recent annual or semiannual reports (if applicable). The underlying funds are also required to pay the lender of the security any dividends or interest that accrues on a borrowed security during the period of the loan. Depending on the arrangements made with the broker or custodian, an underlying fund may or may not receive any payments (including interest) on collateral it has deposited with the broker. The underlying funds pay stock loan fees, disclosed on their Statements of Operations (if applicable), on assets borrowed from the security broker.
The underlying funds may also enter into short positions through derivative instruments, such as options contracts, futures contracts, and swap agreements, which may expose the underlying funds to similar risks. To the extent that the underlying funds enter into short derivative positions, the underlying funds may be exposed to risks similar to those associated with short sales, including the risk that the underlying funds’ losses are theoretically unlimited.
When-Issued Securities
The underlying funds may purchase or sell securities on a when-issued or forward commitment basis. The price of the underlying securities and date when the securities will be delivered and paid for are fixed at the time the transaction is negotiated. Losses may arise due to changes in the market value of the securities or from the inability of counterparties to meet the terms of the contract. In connection with such purchases, the underlying funds may hold liquid assets as collateral with the underlying funds’ custodian sufficient to cover the purchase price.
| |
| 4. | Investment Advisory Agreements and Other Transactions with Affiliates |
The Fund pays Janus Capital an investment advisory fee which is calculated daily and paid monthly. The following table reflects the Fund’s contractual investment advisory fee rate (expressed as an annual rate).
| | | | | | | | | |
| | | | | Contractual
| | |
| | | Average
| | Investment
| | |
| | | Daily Net
| | Advisory
| | |
| | | Assets
| | Fee (%)
| | |
| Fund | | of the Fund | | (annual rate) | | |
| |
| |
Janus World Allocation Fund(1) | | | All Asset Levels | | | 0.07 | | |
| |
| |
| | | |
| (1) | | Formerly named Janus Dynamic Allocation Fund. |
Janus Services LLC (“Janus Services”), a wholly-owned subsidiary of Janus Capital, is the Fund’s and the underlying funds’ transfer agent. In addition, Janus Services provides or arranges for the provision of certain other administrative services including, but not limited to, recordkeeping, accounting, order processing, and other shareholder services for the Fund.
Certain, but not all, intermediaries may charge administrative fees to investors in Class A Shares, Class C Shares, and Class I Shares for administrative services provided on behalf of such investors. These administrative fees are paid by the Class A Shares, Class C Shares, and Class I Shares of the Fund to Janus Services, which uses such fees to reimburse intermediaries. Consistent with the Transfer Agency Agreement between Janus Services and the Funds, Janus Services may negotiate the level, structure, and/or terms of the administrative fees with intermediaries requiring such fees on behalf of the Fund. Janus Capital and its affiliates benefit from an increase in assets that may result from such relationships.
Janus Services receives an administrative services fee at an annual rate of 0.25% of the average daily net assets of Class S Shares and Class T Shares of the Fund for providing or procuring administrative services to investors in Class S Shares and Class T Shares of the Fund. Janus Services expects to use all or a significant portion of this fee to compensate retirement plan service providers, broker-dealers, bank trust departments, financial advisors, and other financial intermediaries for providing these services. Janus Services or its affiliates may also pay fees for services provided by intermediaries to the extent the fees charged by intermediaries exceed the 0.25% of net assets charged to Class S Shares and Class T Shares of the Fund.
Services provided by these financial intermediaries may include, but are not limited to, recordkeeping, subaccounting, order processing, providing periodic statements, forwarding prospectuses, shareholder reports, and other materials to existing customers and other administrative services. Order processing includes the submission of transactions through the National Securities Clearing Corporation (“NSCC”) or similar systems, or those processed on a manual basis with Janus Capital.
Janus Distributors LLC (“Janus Distributors”), a wholly-owned subsidiary of Janus Capital, is the distributor of the
36 | DECEMBER 31, 2011
Fund. The Fund has adopted a Distribution and Shareholder Servicing Plan (the “Plan”) pursuant to Rule 12b-1 under the 1940 Act. The Plan authorizes payments by the Fund at an annual rate, as determined from time to time by the Board of Trustees, of up to 0.25% of the Class A Shares average daily net assets, of up to 1.00% of the Class C Shares average daily net assets, and of up to 0.25% of the Class S Shares average daily net assets. Payments under the Plan are not tied exclusively to actual distribution and shareholder service expenses, and the payments may exceed distribution and shareholder service expenses actually incurred by the Fund. If any of a Fund’s actual distribution and shareholder service expenses incurred during a calendar year are less than the payments made during a calendar year, the Fund will be refunded the difference. Refunds, if any, are included in “Distribution fees and shareholder servicing fees” in the Statement of Operations.
Janus Capital has agreed to reimburse the Fund until at least November 1, 2012 by the amount, if any, that such Fund’s normal operating expenses in any fiscal year, including the investment advisory fee, but excluding any expenses of an underlying fund (acquired fund fees and expenses), class-specific distribution and shareholder servicing fees applicable to Class A Shares, Class C Shares, and Class S Shares, the administrative services fees payable pursuant to the Transfer Agency Agreement (except for networking and omnibus fees), brokerage commissions, interest, dividends, taxes and extraordinary expenses, exceed the annual rate noted below. If applicable, amounts reimbursed to the Fund by Janus Capital are disclosed as “Excess Expense Reimbursement” on the Statement of Operations.
| | | | | | |
| | | Expense
| | |
| Fund | | Limit (%) | | |
| |
| |
Janus World Allocation Fund(1) | | | 0.45 | | |
| |
| |
| | | |
| (1) | | Formerly named Janus Dynamic Allocation Fund. |
For a period of three years subsequent to the Fund’s commencement of operations or until the Fund’s assets exceed the first breakpoint in the investment advisory fee schedule, whichever occurs first, Janus Capital may recover from the Fund fees and expenses previously waived or reimbursed, which could be then considered a deferral, if the Fund’s expense ratio, including recovered expenses, falls below the expense limit. The recoupment of such reimbursements expires September 3, 2011. At the period ended December 31, 2011, there was no recoupment.
The Board of Trustees has adopted a deferred compensation plan (the “Deferred Plan”) for independent Trustees to elect to defer receipt of all or a portion of the annual compensation they are entitled to receive from the Fund. All deferred fees are credited to an account established in the name of the Trustees. The amounts credited to the account then increase or decrease, as the case may be, in accordance with the performance of one or more of the Janus funds that are selected by the Trustees. The account balance continues to fluctuate in accordance with the performance of the selected fund or funds until final payment of all amounts are credited to the account. The fluctuation of the account balance is recorded by the Fund as unrealized appreciation/(depreciation) and is shown as of December 31, 2011 on the Statements of Assets and Liabilities as an asset, “Non-interested Trustees’ deferred compensation,” and a liability, “Non-interested Trustees’ deferred compensation fees.” Additionally, the recorded unrealized appreciation/(depreciation) is included in “Unrealized net appreciation/(depreciation) of investments, foreign currency translations and non-interested Trustees’ deferred compensation” on the Statements of Assets and Liabilities. Deferred compensation expenses for the period ended December 31, 2011 are included in “Non-interested Trustees’ fees and expenses” on the Statement of Operations. Trustees are allowed to change their designation of mutual funds from time to time. Amounts will be deferred until distributed in accordance with the Deferred Plan. No deferred fees were distributed to any Trustee under the Deferred Plan during the period ended December 31, 2011.
Certain officers of the Fund may also be officers and/or directors of Janus Capital. Such officers receive no compensation from the Fund, except for the Fund’s Chief Compliance Officer. The Fund reimburses Janus Capital for a portion of the compensation paid to the Chief Compliance Officer and certain compliance staff of the Trust. Total compensation of $286,615 was paid by the Trust during the period ended December 31, 2011. The Fund’s portion is reported as part of “Other Expenses” on the Statement of Operations.
Class A Shares include a 5.75% upfront sales charge of the offering price of the Fund. The sales charge is allocated between Janus Distributors and financial intermediaries. During the period ended December 31, 2011, Janus Distributors retained the following upfront sales charge:
| | | | | | |
| | | Upfront
| | |
| Fund (Class A Shares) | | Sales Charge | | |
| |
| |
Janus World Allocation Fund(1) | | $ | 585 | | |
| |
| |
| | | |
| (1) | | Formerly named Janus Dynamic Allocation Fund. |
A contingent deferred sales charge of 1.00% will be deducted with respect to Class A Shares purchased without a sales load and redeemed within 12 months of purchase, unless waived, as discussed in the Prospectus. Any applicable CDSC will be 1.00% of the lesser of the original purchase price or the value of the redemption of
Janus Asset Allocation Fund | 37
Notes to Financial Statements (unaudited) (continued)
the Class A Shares redeemed. There were no contingent deferred sales charges paid by redeeming shareholders of Class A Shares to Janus Distributors during the period ended December 31, 2011.
Class C Shares include a 1.00% contingent deferred sales charge paid by redeeming shareholders to Janus Distributors. The contingent deferred sales charge applies to shares redeemed within 12 months of purchase. The redemption price may differ from the net asset value per share. During the period ended December 31, 2011, redeeming shareholders of Class C Shares paid the following contingent deferred sales charge:
| | | | | | |
| | | Contingent Deferred
| | |
| Fund (Class C Shares) | | Sales Charge | | |
| |
| |
Janus World Allocation Fund(1) | | $ | 238 | | |
| |
| |
| | | |
| (1) | | Formerly named Janus Dynamic Allocation Fund. |
The Fund’s expenses may be reduced by expense offsets from an unaffiliated custodian and/or transfer agent. Such credits or offsets are included in “Expense and Fee Offset” on the Statement of Operations (if applicable). The transfer agent fee offsets received during the period reduce “Transfer agent fees and expenses” on the Statement of Operations (if applicable). Custodian offsets received reduce “Custodian fees” on the Statement of Operations (if applicable). The Fund could have employed the assets used by the custodian and/or transfer agent to produce income if it had not entered into an expense offset arrangement.
Pursuant to the terms and conditions of an SEC exemptive order and the provisions of the 1940 Act, the Fund and the underlying funds may participate in an affiliated or nonaffiliated cash sweep program. In the cash sweep program, uninvested cash balances of the Fund may be used to purchase shares of affiliated or non-affiliated money market funds or cash management pooled investment vehicles. The Fund is eligible to participate in the cash sweep program (the “Investing Fund”). Janus Cash Liquidity Fund LLC is an affiliated unregistered cash management pooled investment vehicle that invests primarily in highly-rated short-term fixed-income securities. Janus Cash Liquidity Fund LLC currently maintains a NAV of $1.00 per share and distributes income daily in a manner consistent with a registered 2a-7 product. There are no restrictions on the Fund’s ability to withdraw investments from Janus Cash Liquidity Fund LLC at will, and there are no unfunded capital commitments due from the Fund to Janus Cash Liquidity Fund LLC. As adviser, Janus Capital has an inherent conflict of interest because of its fiduciary duties to the affiliated cash management pooled investment vehicles and the Investing Fund.
During the period ended December 31, 2011, the Fund recorded distributions from affiliated investment companies as affiliated dividend income, and had the following affiliated purchases and sales:
| | | | | | | | | | | | | | | | | | | | | | |
| | | Purchases | | Sales | | Realized
| | Dividend
| | Value
| | |
| | | Shares | | Cost | | Shares | | Cost | | Gain/(Loss) | | Income | | at 12/31/11 | | |
| |
Janus World Allocation Fund(1) | | | | | | | | | | | | | | | | | | | | | |
INTECH International Fund(2) – Class I Shares | | 835 | | $ | 5,833 | | (5,586) | | $ | (43,060) | | $ | (4,563) | | $ | 1,344 | | $ | 138,630 | | |
INTECH U.S. Growth Fund(3) – Class I Shares | | 460 | | | 6,069 | | (4,131) | | | (50,218) | | | 3,468 | | | 1,559 | | | 160,523 | | |
INTECH U.S. Value Fund(4) – Class I Shares | | 818 | | | 7,777 | | (5,839) | | | (56,056) | | | (1,313) | | | 3,166 | | | 169,475 | | |
| Janus Cash Liquidity Fund LLC | | 187,064 | | | 187,061 | | (330,194) | | | (330,194) | | | – | | | 48 | | | 4,000 | | |
| Janus Contrarian Fund – Class I Shares | | 377 | | | 4,823 | | (13,958) | | | (163,446) | | | 4,382 | | | 2 | | | 62,731 | | |
| Janus Flexible Bond Fund – Class I Shares | | 4,083 | | | 43,354 | | (77,180) | | | (753,756) | | | 67,041 | | | 16,664 | | | 454,766 | | |
| Janus Forty Fund – Class I Shares | | 280 | | | 9,144 | | (10,675) | | | (327,870) | | | 7,438 | | | 1,519 | | | 112,140 | | |
| Janus Global Bond Fund – Class I Shares | | 100,420 | | | 1,040,402 | | (17,837) | | | (184,835) | | | 68 | | | 18,192 | | | 1,136,983 | | |
| Janus Global Life Sciences Fund – Class I Shares | | 426 | | | 10,525 | | (4,060) | | | (97,411) | | | 1,505 | | | 643 | | | 343,496 | | |
Janus Global Market Neutral Fund(5) – Class I Shares | | 1,268 | | | 11,597 | | (2,712) | | | (28,572) | | | (2,207) | | | 8,522 | | | 86,318 | | |
| Janus Global Real Estate Fund – Class I Shares | | 806 | | | 6,787 | | (4,184) | | | (39,315) | | | (4,160) | | | 2,687 | | | 119,977 | | |
| Janus Global Select Fund – Class I Shares | | 2,389 | | | 24,370 | | (17,865) | | | (217,438) | | | (38,434) | | | 6,236 | | | 555,948 | | |
| Janus Global Technology Fund – Class I Shares | | 552 | | | 9,256 | | (4,896) | | | (87,847) | | | (8,107) | | | – | | | 288,653 | | |
| Janus Growth and Income Fund – Class I Shares | | – | | | 1 | | – | | | – | | | – | | | 1 | | | 151 | | |
| Janus High-Yield Fund – Class I Shares | | 1,768 | | | 15,511 | | (6,020) | | | (55,491) | | | (2,759) | | | 9,200 | | | 226,532 | | |
| Janus International Equity Fund – Class I Shares | | 4,845 | | | 48,308 | | (12,909) | | | (150,229) | | | (17,261) | | | 7,831 | | | 466,853 | | |
| Janus Overseas Fund – Class I Shares | | 2,190 | | | 74,049 | | (4,327) | | | (207,911) | | | (43,343) | | | – | | | 544,409 | | |
| Janus Research Fund – Class I Shares | | 41 | | | 1,176 | | (1,311) | | | (37,164) | | | (1,059) | | | 407 | | | 49,474 | | |
| Janus Short-Term Bond Fund – Class I Shares | | 3,104 | | | 9,514 | | (17,213) | | | (52,887) | | | (155) | | | 2,931 | | | 224,861 | | |
| Janus Triton Fund – Class I Shares | | 865 | | | 14,289 | | (3,200) | | | (51,909) | | | 823 | | | 635 | | | 226,368 | | |
| Perkins Global Value Fund – Class I Shares | | 17,408 | | | 202,115 | | (6,658) | | | (84,226) | | | (4,504) | | | 9,444 | | | 395,789 | | |
| Perkins Large Cap Value Fund – Class I Shares | | 1,551 | | | 19,681 | | (986) | | | (13,246) | | | (340) | | | 1,454 | | | 64,660 | | |
| Perkins Mid Cap Value Fund – Class I Shares | | 892 | | | 18,504 | | (1,945) | | | (44,754) | | | (2,404) | | | 2,588 | | | 160,908 | | |
| Perkins Small Cap Value Fund – Class I Shares | | 912 | | | 19,228 | | (1,448) | | | (36,083) | | | (3,075) | | | 5,152 | | | 124,003 | | |
| |
| |
| | | | | $ | 1,789,374 | | | | $ | (3,113,918) | | $ | (48,959) | | $ | 100,225 | | $ | 6,117,648 | | |
| |
| |
| | | |
| (1) | | Formerly named Janus Dynamic Allocation Fund. |
| (2) | | Formerly named INTECH Risk-Managed International Fund. |
| (3) | | Formerly named INTECH Risk-Managed Growth Fund. |
| (4) | | Formerly named INTECH Risk-Managed Value Fund. |
| (5) | | Formerly named Janus Long/Short Fund. |
38 | DECEMBER 31, 2011
Janus Capital or an affiliate invested and/or redeemed initial seed capital during the period ended December 31, 2011, as indicated in the following table.
| | | | | | | | | | | | | | | | | | | | | |
| | | Seed
| | | | | | | | | | Seed
| | |
| | | Capital at
| | | | Date of
| | | | Date of
| | Capital at
| | |
| Fund | | 6/30/11 | | Purchases | | Purchases | | Redemptions | | Redemption | | 12/31/11 | | |
| |
| |
Janus World Allocation Fund(1) - Class S Shares | | $ | 211,089 | | $ | – | | | – | | $ | – | | | – | | $ | 211,089 | | |
| |
| |
| | | |
| (1) | | Formerly named Janus Dynamic Allocation Fund. |
Income and capital gains distributions are determined in accordance with income tax regulations that may differ from accounting principles generally accepted in the United States of America. These differences are due to differing treatments for items such as net short-term gains, deferral of wash sale losses, foreign currency transactions, net investment losses and capital loss carryovers.
The Fund has elected to treat gains and losses on forward foreign currency contracts as capital gains and losses, if applicable. Other foreign currency gains and losses on debt instruments are treated as ordinary income for federal income tax purposes pursuant to Section 988 of the Internal Revenue Code.
The aggregate cost of investments and the composition of unrealized appreciation and depreciation of investment securities for federal income tax purposes as of December 31, 2011 are noted below.
Unrealized appreciation and unrealized depreciation in the table below exclude appreciation/(depreciation) on foreign currency translations. The primary difference between book and tax appreciation or depreciation of investments is wash sale loss deferrals.
| | | | | | | | | | | | | | | |
| | | Federal Tax
| | Unrealized
| | Unrealized
| | | | |
| Fund | | Cost | | Appreciation | | (Depreciation) | | Net Tax Appreciation | | |
| |
| |
Janus World Allocation Fund(1) | | $ | 6,723,731 | | $ | 260,982 | | $ | (255,589) | | $ | 5,393 | | |
| |
| |
| | | |
| (1) | | Formerly named Janus Dynamic Allocation Fund. |
The expense ratios listed in the Financial Highlights reflect expenses prior to any expense offsets (gross expense ratio) and after expense offsets (net expense ratio). Both expense ratios reflect expenses after waivers (reimbursement). Listed below are the gross expense ratios for the Fund that would have been in effect, absent the waiver of certain fees and offsets and do not include expenses of the underlying funds and/or investment companies in which the Fund invests.
For the six-month period ended December 31, 2011 (unaudited), the fiscal year ended June 30, 2011, the eleven-month fiscal period ended June 30, 2010 and the fiscal period ended July 31, 2009
| | | | | |
| | | Janus
|
| | | World Allocation Fund(1) |
| |
| |
| Class A Shares |
| 2011 | | | 1.76% | |
| 2011 | | | 1.55% | |
2010(2) | | | 1.57% | |
2009(3) | | | 13.34% | |
| |
| |
| Class C Shares |
| 2011 | | | 2.59% | |
| 2011 | | | 2.42% | |
2010(2) | | | 2.28% | |
2009(3) | | | 13.46% | |
Janus Asset Allocation Fund | 39
Notes to Financial Statements (unaudited) (continued)
| | | | | |
| | | Janus
|
| | | World Allocation Fund(1) |
| |
| |
| Class I Shares |
| 2011 | | | 1.60% | |
| 2011 | | | 1.40% | |
2010(2) | | | 1.35% | |
2009(3) | | | 13.47% | |
| |
| |
| Class S Shares |
| 2011 | | | 1.97% | |
| 2011 | | | 1.78% | |
2010(2) | | | 1.91% | |
2009(3) | | | 16.43% | |
| |
| |
| Class T Shares |
| 2011 | | | 1.71% | |
| 2011 | | | 1.38% | |
2010(2) | | | 1.12% | |
2009(4) | | | 7.61% | |
| |
| |
| | | |
(1)
| | Formerly named Janus Dynamic Allocation Fund. |
| (2) | | Period from August 1, 2009 through June 30, 2010. The Fund changed its fiscal year end from July 31 to June 30. |
| (3) | | Period from September 3, 2008 (inception date) through July 31, 2009. |
| (4) | | Period from July 6, 2009 (inception date) through July 31, 2009. |
40 | DECEMBER 31, 2011
| |
| 7. | Capital Share Transactions |
| | | | | | | | | | | |
| | | Janus World
| | | |
For the six-month period ended December 31, 2011 (unaudited)
| | Allocation Fund(1) | | | |
| and the fiscal year ended June 30, 2011 (all numbers are in thousands) | | 2011 | | | 2011 | | | |
| |
| Transactions in Fund Shares – Class A Shares: | | | | | | | | | | |
| Shares sold | | | 16 | | | | 57 | | | |
| Reinvested dividends and distributions | | | 20 | | | | 12 | | | |
| Shares repurchased | | | (86) | | | | (50) | | | |
| Net Increase/(Decrease) in Fund Shares | | | (50) | | | | 19 | | | |
| Shares Outstanding, Beginning of Period | | | 352 | | | | 333 | | | |
| Shares Outstanding, End of Period | | | 302 | | | | 352 | | | |
| Transactions in Fund Shares – Class C Shares: | | | | | | | | | | |
| Shares sold | | | 9 | | | | 77 | | | |
| Reinvested dividends and distributions | | | 17 | | | | 8 | | | |
| Shares repurchased | | | (47) | | | | (67) | | | |
| Net Increase/(Decrease) in Fund Shares | | | (21) | | | | 18 | | | |
| Shares Outstanding, Beginning of Period | | | 285 | | | | 267 | | | |
| Shares Outstanding, End of Period | | | 264 | | | | 285 | | | |
| Transactions in Fund Shares – Class I Shares: | | | | | | | | | | |
| Shares sold | | | 5 | | | | 61 | | | |
| Reinvested dividends and distributions | | | 6 | | | | 5 | | | |
| Shares repurchased | | | (39) | | | | (92) | | | |
| Net Increase/(Decrease) in Fund Shares | | | (28) | | | | (26) | | | |
| Shares Outstanding, Beginning of Period | | | 123 | | | | 149 | | | |
| Shares Outstanding, End of Period | | | 95 | | | | 123 | | | |
| Transactions in Fund Shares – Class S Shares: | | | | | | | | | | |
| Shares sold | | | – | | | | 3 | | | |
| Reinvested dividends and distributions | | | 2 | | | | 1 | | | |
| Shares repurchased | | | (1) | | | | (11) | | | |
| Net Increase/(Decrease) in Fund Shares | | | 1 | | | | (7) | | | |
| Shares Outstanding, Beginning of Period | | | 25 | | | | 32 | | | |
| Shares Outstanding, End of Period | | | 26 | | | | 25 | | | |
| Transactions in Fund Shares – Class T Shares: | | | | | | | | | | |
| Shares sold | | | 9 | | | | 306 | | | |
| Reinvested dividends and distributions | | | 5 | | | | 1 | | | |
| Shares repurchased | | | (26) | | | | (219) | | | |
| Net Increase/(Decrease) in Fund Shares | | | (12) | | | | 88 | | | |
| Shares Outstanding, Beginning of Period | | | 92 | | | | 4 | | | |
| Shares Outstanding, End of Period | | | 80 | | | | 92 | | | |
| | | |
| (1) | | Formerly named Janus Dynamic Allocation Fund. |
Janus Asset Allocation Fund | 41
Notes to Financial Statements (unaudited) (continued)
| |
| 8. | Purchases and Sales of Investment Securities |
For the period ended December 31, 2011, the aggregate cost of purchases and proceeds from sales of investment securities (excluding any short-term securities, short-term options contracts, and in-kind transactions) was as follows:
| | | | | | | | | | | | | | | |
| | | | | | | | | Proceeds from
| | |
| | | | | | | Purchases of
| | Sales of
| | |
| | | | | | | Long-Term
| | Long-Term
| | |
| | | Purchases of
| | Proceeds from Sales
| | U.S. Government
| | U.S. Government
| | |
| Fund | | Securities | | of Securities | | Obligations | | Obligations | | |
| |
Janus World Allocation Fund(1) | | $ | 1,792,930 | | $ | 3,002,541 | | $ | – | | $ | – | | |
| |
| |
| | | |
| (1) | | Formerly named Janus Dynamic Allocation Fund. |
| |
| 9. | New Accounting Pronouncements |
In May 2011, the FASB issued Accounting Standards Update, “Amendments to Achieve Common Fair Value Measurement and Disclosure Requirements.” The Accounting Standards Update requires disclosures about amounts and reasons for all transfers in and out of Level 1 and Level 2 fair value measurements. In addition, the Accounting Standards Update will require reporting entities to disclose the following information for fair value measurements categorized with Level 3 of the fair value hierarchy: quantitative information about the unobservable inputs used in the fair value measurement, the valuation processes used by the reporting entity, and a narrative description of the sensitivity of the fair value measurement to changes in unobservable inputs and the interrelationships between those unobservable inputs. This disclosure is effective for fiscal years beginning after December 15, 2011, and for interim periods within those fiscal years. Management is currently evaluating the impact these amendments may have on the Fund’s financial statements.
Management has evaluated whether any other events or transactions occurred subsequent to December 31, 2011 and through the date of issuance of the Fund’s financial statements and determined that there were no material events or transactions that would require recognition or disclosure in the Fund’s financial statements.
42 | DECEMBER 31, 2011
Additional Information (unaudited)
Proxy Voting Policies and Voting Record
A description of the policies and procedures that the Fund uses to determine how to vote proxies relating to its portfolio securities is available without charge: (i) upon request, by calling 1-800-525-0020 (toll free); (ii) on the Fund’s website at janus.com/proxyvoting; and (iii) on the SEC’s website at http://www.sec.gov. Additionally, information regarding the Fund’s proxy voting record for the most recent twelve-month period ended June 30 is also available, free of charge, through janus.com/proxyvoting and from the SEC’s website at http://www.sec.gov.
Quarterly Portfolio Holdings
The Fund files its complete portfolio holdings (schedule of investments) with the SEC for the first and third quarters of each fiscal year on Form N-Q within 60 days of the end of such fiscal quarter. The Fund’s Form N-Q: (i) is available on the SEC’s website at http://www.sec.gov; (ii) may be reviewed and copied at the SEC’s Public Reference Room in Washington, D.C. (information on the Public Reference Room may be obtained by calling 1-800-SEC-0330); and (iii) is available without charge, upon request, by calling Janus at 1-800-525-0020 (toll free).
APPROVAL OF ADVISORY AGREEMENTS DURING THE PERIOD
The Trustees of Janus Investment Fund, none of whom has ever been affiliated with Janus Capital and each of whom serves as an “independent” Trustee (the “Trustees”), oversee the management of each Fund and, as required by law, determine annually whether to continue the investment advisory agreement for each Fund and the subadvisory agreements for the nine Funds that utilize subadvisers.
In connection with their most recent consideration of those agreements for each Fund, the Trustees received and reviewed a substantial amount of information provided by Janus Capital and the respective subadvisers in response to requests of the Trustees and their independent legal counsel. They also received and reviewed a considerable amount of information and analysis provided by, and at the request of, their independent fee consultant. Throughout their consideration of the agreements, the Trustees were advised by their independent legal counsel. The Trustees met with management to consider the agreements, and also met separately in executive session with their independent legal counsel and their independent fee consultant.
At a meeting held on December 8, 2011, based on the Trustees’ evaluation of the information provided by Janus Capital, the subadvisers and the independent fee consultant, as well as other information, the Trustees determined that the overall arrangements between each Fund and Janus Capital and each subadviser, as applicable, were fair and reasonable in light of the nature, extent and quality of the services provided by Janus Capital, its affiliates and the subadvisers, the fees charged for those services, and other matters that the Trustees considered relevant in the exercise of their business judgment. At that meeting, the Trustees unanimously approved the continuation of the investment advisory agreement for each Fund, and the subadvisory agreement for each subadvised Fund, for the period from February 1, 2012 through February 1, 2013, subject to earlier termination as provided for in each agreement.
In considering the continuation of those agreements, the Trustees reviewed and analyzed various factors that they determined were relevant, including the factors described below, none of which by itself was considered dispositive. However, the material factors and conclusions that formed the basis for the Trustees’ determination to approve the continuation of the agreements are discussed separately below.
Nature, Extent and Quality of Services
The Trustees reviewed the nature, extent and quality of the services provided by Janus Capital and the subadvisers to the Funds, taking into account the investment objective and strategy of each Fund and the knowledge the Trustees gained from their regular meetings with management on at least a quarterly basis and their ongoing review of information related to the Funds. In addition, the Trustees reviewed the resources and key personnel of Janus Capital and each subadviser, particularly noting those employees who provide investment and risk management services to the Funds. The Trustees also considered other services provided to the Funds by Janus Capital or the subadvisers, such as managing the execution of portfolio transactions and the selection of broker-dealers for those transactions. The Trustees considered Janus Capital’s role as administrator to the Funds, noting that Janus Capital does not receive a fee for its services but is reimbursed for its out-of-pocket costs. The Trustees considered the role of Janus Capital in monitoring adherence to the Funds’ investment restrictions, providing support services for the Trustees and Trustee committees, communicating with shareholders and overseeing the activities of other service providers, including monitoring compliance with various policies and procedures of the Funds and with applicable securities laws and regulations.
Janus Asset Allocation Fund | 43
Additional Information (unaudited) (continued)
The Trustees concluded that the nature, extent and quality of the services provided by Janus Capital or the subadviser to each Fund were appropriate and consistent with the terms of the respective advisory and subadvisory agreements, and that, taking into account steps taken to address those Funds whose performance lagged that of their peers for certain periods, the quality of those services had been consistent with or superior to quality norms in the industry and the Funds were likely to benefit from the continued provision of those services. They also concluded that Janus Capital and each subadviser had sufficient personnel, with the appropriate education and experience, to serve the Funds effectively and had demonstrated its continuing ability to attract well-qualified personnel.
Performance of the Funds
The Trustees considered the performance results of each Fund over various time periods. They reviewed information comparing each Fund’s performance with the performance of comparable funds and peer groups identified by Lipper, and with the Fund’s benchmark index. They concluded that the performance of various Funds was good to very good under current market conditions. Although the performance of other Funds lagged that of their peers for certain periods, the Trustees also concluded that Janus Capital had taken or was taking appropriate steps to address those instances of under-performance.
Costs of Services Provided
The Trustees examined information regarding the fees and expenses of each Fund in comparison to similar information for other comparable funds as provided by Lipper. They also reviewed an analysis of that information provided by their independent fee consultant and noted that the rate of management (investment advisory and any administration) fees for most of the Funds, after applicable contractual expense limitations, was below the mean management fee rate of the respective peer group of funds selected by Lipper.
The Trustees considered the methodology used by Janus Capital and each subadviser in determining compensation payable to portfolio managers, the competitive environment for investment management talent and the competitive market for mutual funds in different distribution channels. They concluded that the compensation methodology provided a good alignment of the interests of the portfolio managers with the interests of Fund shareholders.
The Trustees also reviewed management fees charged by Janus Capital and each subadviser to their separate account clients and to non-affiliated funds subadvised by Janus Capital or by a subadviser (for which Janus Capital provides only portfolio management services). Although in most instances subadvisory and separate account fee rates for various investment strategies were lower than management fee rates for Funds having a similar strategy, the Trustees noted that, under the terms of the management agreements with the Funds, Janus Capital performs significant additional services for the Funds that it does not provide to those other clients, including administration services, oversight of the Funds’ other service providers, trustee support, regulatory compliance and numerous other services, and that, in serving the Funds, Janus Capital assumes many legal risks that it does not assume in servicing its other clients. Moreover, they noted that the spread between the average fee rates charged to the Funds and the fee rates that Janus Capital charged to its separate account clients was smaller than the average spread for such fee rates of other advisers, based on publicly available data and research conducted by the Trustees’ independent fee consultant.
The Trustees reviewed information on the profitability to Janus Capital and its affiliates of their relationships with each Fund, as well as an explanation of the methodology utilized in allocating various expenses of Janus Capital and its affiliates among the Funds and other clients. The Trustees also reviewed the financial statements and corporate structure of Janus Capital’s parent company. In their review, the Trustees considered whether Janus Capital and each subadviser receive adequate incentives to manage the Funds effectively. The Trustees recognized that profitability comparisons among fund managers are difficult because very little comparative information is publicly available and the profitability of any fund manager is affected by numerous factors, including the organizational structure of the particular fund manager, the types of funds and other accounts it manages, possible other lines of business, the methodology for allocating expenses and the fund manager’s capital structure and cost of capital. However, taking into account those factors and the analysis provided by the Trustees’ independent fee consultant, and based on the information available, the Trustees concluded that Janus Capital’s profitability with respect to each Fund in relation to the services rendered was not unreasonable.
The Trustees concluded that the management fees and other compensation payable by each Fund to Janus Capital and its affiliates, as well as the fees paid by Janus Capital to the subadvisers of subadvised Funds, were reasonable in relation to the nature, extent and quality of the services provided, taking into account the fees charged by other advisers for managing comparable mutual funds with similar strategies, the fees Janus Capital and the subadvisers charge to other clients, and, as applicable, the impact of fund performance on fees
44 | DECEMBER 31, 2011
payable by the Funds. The Trustees also concluded that the overall expense ratio of each Fund was reasonable, taking into account the size of the Fund, the quality of services provided by Janus Capital and any subadviser, the investment performance of the Fund and any expense limitations agreed to by Janus Capital.
Economies of Scale
The Trustees considered information about the potential for Janus Capital to realize economies of scale as the assets of the Funds increase. They noted that, although many Funds pay advisory fees at a fixed rate as a percentage of net assets, without any breakpoints, the actual management fee rate paid by most of the Funds, after any contractual expense limitations, was below the mean management fee rate of the Fund’s peer group identified by Lipper; and, for those Funds whose expenses are being reduced by the contractual expense limitations of Janus Capital, Janus Capital is subsidizing the Funds because they have not reached adequate scale. Moreover, as the assets of many of the Funds have declined in the past few years, certain Funds have benefited from having advisory fee rates that have remained constant rather than increasing as assets declined. In addition, performance fee structures have been implemented for various Funds that have caused or will cause the effective rate of advisory fees payable by such a Fund to vary depending on the investment performance of the Fund relative to its benchmark index over the measurement period; and a few Funds have fee schedules with breakpoints and reduced fee rates above certain asset levels. The Trustees also noted that the Funds share directly in economies of scale through the lower charges of third-party service providers that are based in part on the combined scale of all of the Funds. Based on all of the information they reviewed, including research and analysis conducted by the Trustees’ independent fee consultant, the Trustees concluded that the current fee structure of each Fund was reasonable and that the current rates of fees do reflect a sharing between Janus Capital and the Fund of economies of scale at the current asset level of the Fund.
Other Benefits to Janus Capital
The Trustees also considered benefits that accrue to Janus Capital and its affiliates from their relationships with the Funds. They recognized that two affiliates of Janus Capital separately serve the Funds as transfer agent and distributor, respectively, and the transfer agent receives compensation directly from the non-money market funds for services provided. The Trustees also considered Janus Capital’s past and proposed use of commissions paid by the Funds on their portfolio brokerage transactions to obtain proprietary and third-party research products and services benefiting the Fund and/or other clients of Janus Capital. The Trustees concluded that Janus Capital’s use of these types of client commission arrangements to obtain proprietary and third-party research products and services was consistent with regulatory requirements and guidelines and was likely to benefit each Fund. The Trustees also concluded that, other than the services provided by Janus Capital and its affiliates pursuant to the agreements and the fees to be paid by each Fund therefor, the Funds and Janus Capital may potentially benefit from their relationship with each other in other ways. They concluded that Janus Capital benefits from the receipt of research products and services acquired through commissions paid on portfolio transactions of the Funds and that the Funds benefit from Janus Capital’s receipt of those products and services as well as research products and services acquired through commissions paid by other clients of Janus Capital. They further concluded that success of any Fund could attract other business to Janus Capital or other Janus funds, and that the success of Janus Capital could enhance Janus Capital’s ability to serve the Funds.
After full consideration of the above factors, as well as other factors, the Trustees, each of whom is an independent Trustee, concluded at their December 8, 2011 meeting that the proposed continuation of the investment advisory agreement and, if applicable, the subadvisory agreement for each Fund for another year was in the best interest of the respective Funds and their shareholders.
Janus Asset Allocation Fund | 45
Explanations of Charts, Tables and
Financial Statements (unaudited)
Performance overview graphs compare the performance of a hypothetical $10,000 investment in the Fund (from inception) with one or more widely used market indices. The hypothetical example does not represent the returns of any particular investment.
When comparing the performance of the Fund with an index, keep in mind that market indices do not include brokerage commissions that would be incurred if you purchased the individual securities in the index. They also do not include taxes payable on dividends and interest or operating expenses incurred if you maintained the Fund invested in the index.
Average annual total returns are also quoted for the Fund. Average annual total return is calculated by taking the growth or decline in value of an investment over a period of time, including reinvestment of dividends and distributions, then calculating the annual compounded percentage rate that would have produced the same result had the rate of growth been constant throughout the period. Average annual total return does not reflect the deduction of taxes that a shareholder would pay on Fund distributions or redemptions of Fund shares.
Pursuant to federal securities rules, expense ratios shown in the performance chart reflect subsidized and unsubsidized ratios for the prior fiscal year. The total annual fund operating expenses ratio is gross of any fee waivers, reflecting the Fund’s unsubsidized expense ratio. The net annual fund operating expenses ratio (if applicable) includes contractual waivers of Janus Capital and reflects the Fund’s subsidized expense ratio. Both the total annual fund operating expenses ratio and net annual fund operating expenses ratio are based on average net assets as of the fiscal period ended June 30, 2011. The ratios also include expenses indirectly incurred by the Fund as a result of investing in other investment companies or pooled investments, which are not reflected in the “Financial Highlights” of this report. As a result, these ratios may be higher or lower than those shown in the “Financial Highlights” in this report. All expenses are shown without the effect of expense offset arrangements. Pursuant to such arrangements, credits realized as a result of uninvested cash balances are used to reduce custodian and transfer agent expenses.
| |
| 2. | Schedule of Investments |
Following the performance overview section is the Fund’s Schedule of Investments. This schedule reports the industry concentrations and types of securities held in the Fund on the last day of the reporting period. Securities are usually listed by type (common stock, corporate bonds, U.S. Government obligations, etc.) and by industry classification (banking, communications, insurance, etc.). Holdings are subject to change without notice.
The value of each security is quoted as of the last day of the reporting period. The value of securities denominated in foreign currencies is converted into U.S. dollars.
If the Fund invests in foreign securities, it will also provide a summary of investments by country. This summary reports the Fund’s exposure to different countries by providing the percentage of securities invested in each country. The country of each security represents the country in which the company is incorporated. The Fund’s Schedule of Investments relies upon the industry group and country classifications published by Bloomberg L.P.
| |
| 3. | Statement of Assets and Liabilities |
This statement is often referred to as the “balance sheet.” It lists the assets and liabilities of the Fund on the last day of the reporting period.
The Fund’s assets are calculated by adding the value of the securities owned, the receivable for securities sold but not yet settled, the receivable for dividends declared but not yet received on stocks owned and the receivable for Fund shares sold to investors but not yet settled. The Fund’s liabilities include payables for securities purchased but not yet settled, Fund shares redeemed but not yet paid and expenses owed but not yet paid. Additionally, there may be other assets and liabilities such as unrealized gain or loss on forward currency contracts.
The section entitled “Net Assets Consist of” breaks down the components of the Fund’s net assets. Because the Fund must distribute substantially all earnings, you will notice that a significant portion of net assets is shareholder capital.
The last section of this statement reports the net asset value (“NAV”) per share on the last day of the reporting period. The NAV is calculated by dividing the Fund’s net assets (assets minus liabilities) by the number of shares outstanding.
| |
| 4. | Statement of Operations |
This statement details the Fund’s income, expenses, gains and losses on securities and currency transactions, and appreciation or depreciation of current Fund holdings.
The first section in this statement, entitled “Investment Income,” reports the dividends earned from stocks and interest earned from interest-bearing securities in the Fund.
The next section reports the expenses incurred by the Fund, including the advisory fee paid to the investment
46 | DECEMBER 31, 2011
adviser, transfer agent fees and expenses, and printing and postage for mailing statements, financial reports and prospectuses. Expense offsets and expense reimbursements, if any, are also shown.
The last section lists the increase or decrease in the value of securities held in the Fund. The Fund will realize a gain (or loss) when it sells its position in a particular security. An unrealized gain (or loss) refers to the change in net appreciation or depreciation of the Fund during the reporting period. “Net Realized and Unrealized Gain/(Loss) on Investments” is affected both by changes in the market value of Fund holdings and by gains (or losses) realized during the reporting period.
| |
| 5. | Statements of Changes in Net Assets |
These statements report the increase or decrease in the Fund’s net assets during the reporting period. Changes in the Fund’s net assets are attributable to investment operations, dividends, distributions and capital share transactions. This is important to investors because it shows exactly what caused the Fund’s net asset size to change during the period.
The first section summarizes the information from the Statement of Operations regarding changes in net assets due to the Fund’s investment performance. The Fund’s net assets may also change as a result of dividend and capital gains distributions to investors. If investors receive their dividends in cash, money is taken out of the Fund to pay the distribution. If investors reinvest their dividends, the Fund’s net assets will not be affected. If you compare the Fund’s “Net Decrease from Dividends and Distributions” to the “Reinvested dividends and distributions,” you will notice that dividend distributions had little effect on the Fund’s net assets. This is because the majority of Janus investors reinvest their distributions.
The reinvestment of dividends is included under “Capital Share Transactions.” “Capital Shares” refers to the money investors contribute to the Fund through purchases or withdrawals via redemptions. The Fund’s net assets will increase and decrease in value as investors purchase and redeem shares from the Fund.
This schedule provides a per-share breakdown of the components that affect the Fund’s NAV for current and past reporting periods. Not only does this table provide you with total return, it also reports total distributions, asset size, expense ratios and portfolio turnover rate.
The first line in the table reflects the NAV per share at the beginning of the reporting period. The next line reports the net investment income per share, which comprises dividends and interest income earned on securities held by the Fund. Following is the total of gains/(losses), realized and unrealized. Dividends and distributions are then subtracted to arrive at the NAV per share at the end of the period. The next line reflects the average annual total return reported the last day of the period. The total return may include adjustments in accordance with generally accepted accounting principles. As a result, the total return may differ from the total return reflected for shareholder transactions.
Also included are the expense ratios, or the percentage of average net assets that were used to cover operating expenses during the period. Expense ratios vary across Funds within the Trust for a number of reasons, including the differences in management fees, the frequency of dividend payments and the extent of foreign investments, which entail greater transaction costs.
The Fund’s expenses may be reduced through expense-reduction arrangements. These arrangements may include the use of balance credits or transfer agent fee offsets. The Statement of Operations reflects total expenses before any such offset, the amount of the offset and the net expenses. The expense ratios listed in the Financial Highlights reflect total expenses prior to any expense offset (gross expense ratio) and after the expense offsets (net expense ratio). Both expense ratios reflect expenses after waivers (reimbursements), if applicable.
The ratio of net investment income/(loss) summarizes the income earned less expenses, divided by the average net assets of the Fund during the reporting period. Don’t confuse this ratio with the Fund’s yield. The net investment income ratio is not a true measure of the Fund’s yield because it doesn’t take into account the dividends distributed to the Fund’s investors.
The next figure is the portfolio turnover rate, which measures the buying and selling activity in the Fund. Portfolio turnover is affected by market conditions, changes in the asset size of the Fund, fluctuating volume of shareholder purchase and redemption orders, the nature of the Fund’s investments and the investment style and/or outlook of the portfolio manager. A 100% rate implies that an amount equal to the value of the entire portfolio was replaced once during the fiscal year; a 50% rate means that an amount equal to the value of half the portfolio is traded in a year; and a 200% rate means that an amount equal to the value of the entire portfolio is traded every six months.
Janus Asset Allocation Fund | 47
Notes
48 | DECEMBER 31, 2011
Notes
Janus Asset Allocation Fund | 49
Janus provides access to a wide range of investment disciplines.
Alternative
Janus alternative funds seek to deliver strong risk-adjusted returns over a full market cycle with lower correlation to equity markets than traditional investments.
Asset Allocation
Janus’ asset allocation funds utilize our fundamental, bottom-up research to balance risk over the long term. From fund options that meet investors’ risk tolerance and objectives to a method that incorporates non-traditional investment choices to seek non-correlated sources of risk and return, Janus’ asset allocation funds aim to allocate risk more effectively.
Fixed Income
Janus fixed income funds attempt to provide less risk relative to equities while seeking to deliver a competitive total return through high current income and appreciation. Janus money market funds seek capital preservation and liquidity with current income as a secondary objective.
Global & International
Janus global and international funds seek to leverage Janus’ research capabilities by taking advantage of inefficiencies in foreign markets, where accurate information and analytical insight are often at a premium.
Growth & Core
Janus growth funds focus on companies believed to be the leaders in their respective industries, with solid management teams, expanding market share, margins and efficiencies. Janus core funds seek investments in more stable and predictable companies. Our core funds look for a strategic combination of steady growth and, for certain funds, some degree of income.
Mathematical
Our mathematical funds seek to outperform their respective indices while maintaining a risk profile equal to or lower than the index itself. Managed by INTECH (a Janus subsidiary), these funds use a mathematical process in an attempt to build a more “efficient” portfolio than the index.
Value
Our value funds, managed by Perkins (a Janus subsidiary), seek to identify companies with favorable reward to risk characteristics by conducting rigorous downside analysis before determining upside potential.
For more information about our funds, contact your investment professional or go to janus.com/advisor/mutual-funds (or janus.com/allfunds if you hold Shares directly with Janus).
Please consider the charges, risks, expenses and investment objectives carefully before investing. For a prospectus containing this and other information, please call Janus at 877.33JANUS (52687) (or 800.525.3713 if you hold Shares directly with Janus); or download the file from janus.com/info (or janus.com/reports if you hold Shares directly with Janus). Read it carefully before you invest or send money.
Funds distributed by Janus Distributors LLC (02/12)
Investment products offered are: NOT FDIC-INSURED MAY LOSE VALUE NO BANK GUARANTEE
| |
| C-0112-127 | 125-24-93008 02-12 |
SEMIANNUAL REPORT
December 31, 2011
Janus Asset Allocation Funds
Janus Growth Allocation FundJanus Moderate Allocation Fund
Janus Conservative Allocation Fund
HIGHLIGHTS
| |
| • | Portfolio management perspective |
| • | Investment strategy behind your fund |
| • | Fund performance, characteristics and holdings |
Table of Contents
Janus Asset Allocation Funds
| | | |
| | 1 |
| | 3 |
| | |
| | 4 |
| | 11 |
| | 18 |
| | 25 |
| | 26 |
| | 28 |
| | 32 |
| | 44 |
| | 46 |
| | 69 |
| | 72 |
Please consider the charges, risks, expenses and investment objectives carefully before investing. For a prospectus or, if available, a summary prospectus containing this and other information, please call Janus at 877.33JANUS(52687) (or 800.525.3713 if you hold Shares directly with Janus); or download the file from janus.com/info (or janus.com/reports if you hold Shares directly with Janus). Read it carefully before you invest or send money.
Co-Chief Investment Officers’ Market Perspective (unaudited)
Jonathan Coleman
Co-Chief Investment
Officer
Gibson Smith
Co-Chief Investment
Officer
Euphoria & Despair
We would like to take this opportunity to thank you for investing with Janus.
If there’s a lesson to be learned from the tumult of 2011, it’s that there are lies, damn lies and strategist reports. Few of the talking heads predicted that Europe’s debt crisis would precipitate a global crisis of confidence. Even fewer predicted that emerging markets would plunge and long-dated Treasuries would beat nearly every other asset class. We take no joy in the folly of such fortunetelling. Our point is that it is very difficult to accurately predict macro outcomes. While the macro has had tremendous influence on the markets, we continue to believe that focusing on individual company analysis is the key to long term success.
Does this mean we ignore the macro? Not at all. At the forefront of our concerns is Europe’s debt crisis. Long-term, Europe will be more competitive if it succeeds in strengthening its monetary union and implements some fiscal unity. Yet measures the EU has agreed upon will be slow, painful and potentially destabilizing. We expect to see volatility as this messy process evolves, and we expect a euro-zone recession in 2012, slowing global growth.
The U.S. has its own political circus, of course, and uncertainty over fiscal policy is not helping confidence. Yet we believe the U.S. is in a fairly stable, low growth environment. Leading economic indicators have picked up and consumer confidence has rebounded to the highest levels since April 2011. Unfortunately, the sustainability of U.S. growth is subject to external shocks (i.e. Europe) and remains a major risk factor.
Equities: Corporate Dynamism Prevails
Corporate earnings growth has generally been strong, yet valuations reflect fears that it may not last. A major concern is that profit margins are near record levels and will likely revert to the historical mean. Based on our research and observations, however, many businesses appear highly attuned to protecting margins. Equity valuations look compelling, moreover, when paired with companies that are well positioned strategically.
In terms of investing themes, our analysts are finding opportunities across sectors. In energy, we see attractive potential in oil-field services and equipment companies, which are benefiting from rising levels of exploration and production. In health care, our analysts are focusing on companies with innovative drugs that address unmet medical needs. Our consumer team, meanwhile, sees opportunity in retailers that are leveraging technology to extend their global brand and gain market share.
Overall, we think this is an opportune time to own equities. Entry points look attractive based on recent multiples and projected growth rates. We think the odds are stacked in favor of equities, especially if they have growing free cash and competitive advantages that can enable them to gain share.
Fixed Income: Lower Rates for Longer
If there’s a fixed income theme for 2012 it’s that investors should get used to low rates. The Federal Reserve (Fed) has stressed that its zero-rate policy will continue through 2013. The real questions now are around QE3 (a third round of quantitative easing). We think the Fed isn’t ready to shoot this bullet yet, but will respond if it sees economic weakness. An additional theme for 2012 will be that central banks around the globe will continue to engage in loose monetary policies as the threat of slower growth remains high.
Against this backdrop, we continue to believe that corporate credit offers some of the best risk-adjusted returns. Profit margins are high and companies are accumulating cash on balance sheets. Moreover, management teams are being more careful with balance sheets. We think this conservatism will continue through 2012, fueling more free cash flow, liquidity in the system and, ultimately, support for investment grade and high yield bonds.
In other areas, we are balancing our “risk positions” with Treasuries, which we believe offer an insurance policy against extreme events and market volatility. With the markets remaining volatile, we think this allocation to Treasuries needs to be actively managed, and we expect
Janus Asset Allocation Funds | 1
(Continued) (unaudited)
to reduce our allocation to take advantage of opportunities as the market presents them.
Conclusion: Corporate Playbooks Can Still Create Value
Despite the difficult environment, we continue to identify companies that look well positioned to grow. Multiples are undemanding historically, and many businesses have proven they can maintain earnings and margins even in a weak demand environment. Maintaining balance in a portfolio is critical in this environment, however. As long term investors, we are always attuned to protecting on the downside, while attempting to find opportunities in the marketplace with the most attractive risk/reward. Long term, we think this offers the best way to achieve strong results.
Sincerely,
Jonathan Coleman
Co-Chief Investment Officer
Gibson Smith
Co-Chief Investment Officer
The opinions are those of the authors as of 12-2011 and are subject to change at any time due to changes in market or economic conditions. The comments should not be construed as a recommendation of individual holdings or market sectors, but as an illustration of broader themes.
There is no assurance that the investment process will consistently lead to successful investing.
Investing involves market risk. Investment return and value will fluctuate and it is possible to lose money by investing.
Foreign securities have additional risks including exchange rate changes, political and economic upheaval, the relative lack of information, relatively low market liquidity and the potential lack of strict financial and accounting controls and standards. These risks are magnified in emerging markets. The prices of foreign securities held by the fund, and therefore a fund’s performance, may decline in response to such risks.
U.S. Treasury securities are direct debt obligations issued by the U.S. Government. With government bonds, the investor is a creditor of the government. Treasury Bills and U.S. Government Bonds are guaranteed by the full faith and credit of the United States government, are generally considered to be free of credit risk and typically carry lower yields than other securities. Bonds in a portfolio are typically intended to provide income and/or diversification. In general, the bond market is volatile. Bond prices rise when interest rates fall and vice versa. This effect is usually pronounced for longer-term securities. Any fixed income security sold or redeemed prior to maturity may be subject to a substantial gain or loss.
Statements in this piece that reflect projections or expectations of future financial or economic performance of a mutual fund or strategy and of the markets in general and statements of a fund’s plans and objectives for future operations are forward-looking statements. Actual results or events may differ materially from those projected, estimated, assumed or anticipated in any such forward-looking statements. Important factors that could result in such differences, in addition to the other factors noted with such forward-looking statements, include general economic conditions such as inflation, recession and interest rates.
2 | DECEMBER 31, 2011
Useful Information About Your Fund Report (unaudited)
Management Commentaries
The Management Commentaries in this report include valuable insight from each of the Funds’ manager as well as statistical information to help you understand how your Fund’s performance and characteristics stack up against those of comparable indices.
Please keep in mind that the opinions expressed by the Funds’ manager in the Management Commentaries are just that: opinions. They are a reflection of the manager’s best judgment at the time this report was compiled, which was December 31, 2011. As the investing environment changes, so could the manager’s opinions. These views are unique to the manager and aren’t necessarily shared by fellow employees or by Janus in general.
Fund Expenses
We believe it’s important for our shareholders to have a clear understanding of Fund expenses and the impact they have on investment return.
The following is important information regarding each Fund’s Expense Example, which appears in each Fund’s Management Commentary within this Semiannual Report. Please refer to this information when reviewing the Expense Example for each Fund.
Example
As a shareholder of a Fund, you incur two types of costs: (1) transaction costs, including sales charges (loads) on purchase payments (applicable to Class A Shares only); redemption fees, where applicable (and any related exchange fees); and (2) ongoing costs, including management fees; distribution and shareholder servicing (12b-1) fees (applicable to Class A Shares, Class C Shares, and Class S Shares only); administrative services fees payable pursuant to the Transfer Agency Agreement; and other Fund expenses. The example is intended to help you understand your ongoing costs (in dollars) of investing in the Fund and to compare these costs with the ongoing costs of investing in other mutual funds. To do so, compare this 5% hypothetical example with the 5% hypothetical examples that appear in the shareholder reports of the other funds. The example is based upon an investment of $1,000 invested at the beginning of the period and held for the six-month period from July 1, 2011 to December 31, 2011.
Actual Expenses
The first line of the table in each example provides information about actual account values and actual expenses. You may use the information in this line, together with the amount you invested, to estimate the expenses that you paid over the period. Simply divide your account value by $1,000 (for example, an $8,600 account value divided by $1,000 = 8.6), then multiply the result by the number in the first line under the heading entitled “Expenses Paid During Period” to estimate the expenses you paid on your account during the period.
Hypothetical Example for Comparison Purposes
The second line of the table in each example provides information about hypothetical account values and hypothetical expenses based upon each Fund’s actual expense ratio and an assumed rate of return of 5% per year before expenses, which is not the Fund’s actual return. The hypothetical account values and expenses may not be used to estimate the actual ending account balance or expenses you paid for the period. You may use this information to compare the ongoing costs of investing in each Fund and other funds. To do so, compare this 5% hypothetical example with the 5% hypothetical examples that appear in the shareholder reports of the other funds.
Janus Capital Management LLC (“Janus Capital”) has contractually agreed to waive each Fund’s total annual fund operating expenses, excluding any expenses of an underlying fund (acquired fund fees and expenses), class-specific distribution and shareholder servicing (12b-1) fees (applicable to Class A Shares, Class C Shares, and Class S Shares only), administrative services fees payable pursuant to the Transfer Agency Agreement (except for networking and omnibus fees), brokerage commissions, interest, dividends, taxes, and extraordinary expenses, to certain limits until at least November 1, 2012. Expenses in the examples reflect application of these waivers. Had the waivers not been in effect, your expenses would have been higher. More information regarding the waivers is available in the Funds’ prospectuses.
Please note that the expenses shown in the tables are meant to highlight your ongoing costs only and do not reflect any transaction costs, such as underlying funds’ redemption fees (where applicable) and any related exchange fees. These fees are fully described in certain underlying funds’ prospectuses. Therefore, the second line of each table is useful in comparing ongoing costs only, and will not help you determine the relative total costs of owning different funds. In addition, if these transaction costs were included, your costs would have been higher.
Janus Asset Allocation Funds | 3
Janus Growth Allocation Fund (unaudited)
| | | | | | | |
Fund Snapshot
We believe a fund of funds asset allocation portfolio, diversified among investment managers and optimized to a fixed asset mix, can provide attractive long-term returns. Using an institutional-quality asset allocation model, we combine three distinct investment managers into a series of portfolios, defined by specific risk targets, seeking to provide a core solution for long-term investors.
| | | | | |
Dan Scherman
portfolio manager |
Performance Overview
Janus Growth Allocation Fund’s Class T Shares returned -9.17% during the six-month period ended December 31, 2011. This compares to a return of -3.69% for the S&P 500 Index, the Fund’s primary benchmark, and a return of -6.59% by its secondary benchmark, the Growth Allocation Index, an internally calculated, hypothetical combination of unmanaged indices that combines the total returns from the Dow Jones Wilshire 5000 Index (50%), the MSCI EAFE Index (25%), the Barclays Capital U.S. Aggregate Bond Index (20%), and the MSCI Emerging Markets Index (5%).
Market Review
Global stocks sold off significantly during the third quarter following a first-ever downgrade of U.S. government debt, rising concerns over global economic growth and worries that the European sovereign debt saga could worsen. The increasing probability of a default by Greece and investor disquiet over the U.S. Federal Reserve’s (Fed) downbeat economic outlook contributed to further declines. The Fed indicated it would maintain its near zero-interest rate policy through mid-2013 and announced it would increase its share of long-term Treasuries in an attempt to make credit cheaper and spur spending and investment. The Fed acknowledged “significant” downside risks to the economy and noted “strains” in the global financial markets. A weak reading on manufacturing in China added to the bearish environment. Equities rebounded somewhat in the fourth quarter on hopes European leaders were taking steps to resolve the region’s debt crisis. Improving economic data in the U.S. also aided sentiment. Following a period of spiking European government bond yields, particularly in Italy and Spain, and changes in governments in Greece, Italy and Spain, central banks announced a coordinated plan to make dollar funding cheaper for European banks. China also said the reserve requirement ratio for its banks would be lowered in an effort to boost liquidity after having raised the ratio six times during the year. Meanwhile, in the U.S., employment, manufacturing and housing data showed improvement.
Volatility and headline risk were central themes for fixed-income investors in the second half of 2011. A rally in U.S. Treasuries became especially pronounced from late July through September, as worry mounted that the U.S. economy might slip into a double-dip recession. Investors were troubled by below-expectation U.S. gross domestic product (GDP) growth, a manufacturing slowdown and persistently weak employment, housing and consumer spending figures. Concern about high government debt levels, both in the U.S. and Europe, only heightened this negative market sentiment. A high-stakes political standoff in Congress in July and August over raising the U.S. debt ceiling did nothing to improve the situation. Credit rating agency Standard & Poor’s subsequently lowered the U.S.’s sovereign credit rating to AA+ from AAA. The downgrade was followed, ironically, by a near stampede into U.S. Treasury securities, as the darkening global economic picture made Treasuries appear to be the safest haven available.
All eyes returned to Europe in the fall, as fiscal problems in the so-called PIIGS (Portugal, Italy, Ireland, Greece and Spain) countries threatened to spiral out of control. By October, it appeared that European Union (EU) leaders would manage to contain euro-zone problems, and relieved investors briefly ventured out of Treasuries in search of higher yields. But uncertainty flooded back in November, as governments in Greece and then Italy fell amid market pressure to implement fiscal reforms. The late-November failure of the U.S. Congressional “super committee” to reach a deal to cut $1.2 trillion from the U.S. deficit added to the general malaise. In December, some headway was made in Europe, as EU leaders announced a plan in which most members would agree to stricter fiscal rules and the European Central Bank (ECB) served up a larger-than-expected $641 billion in 3-year loans. This injected some calm into the markets as volume wound down for the holidays, although investors remained concerned that credit ratings would be downgraded on one or more of the 17 euro zone countries. Meanwhile,
4 | DECEMBER 31, 2011
(unaudited)
U.S. macroeconomic data continued to reflect a strengthening domestic economy.
Investment Process
Janus Growth Allocation Fund is structured as a “fund of funds” portfolio that provides investors with broad, diversified exposure to various types of investments with an emphasis on managing investment risk. The Fund is also designed to blend the three core competencies that Janus practices as an organization: mathematically-driven strategies and fundamentally-driven, growth and value-oriented investments. We believe that combining these very different approaches in a single investment can potentially produce a portfolio with a unique and powerful performance profile.
The investment process involves setting return expectations for a broad range of Janus mutual funds that we believe best represent the full opportunity set available to today’s investor. Then, acting in conjunction with an outside consultant, we establish an ideal “model” portfolio based upon the specific risk/return objective of Janus Growth Allocation Fund. The Janus Asset Allocation Committee also provides input on the overall allocation. Finally, we select the appropriate Janus, Perkins and INTECH funds that replicate our desired exposure. The allocations assigned to each selected underlying fund are consistent with our view of current market conditions and the long-term trade-off between risk and reward potential that each of these investment types represent. However, as a result of changing market conditions, both the mix of underlying funds and the allocations to these funds will change from time to time. Any portfolio risk management process we’ve discussed includes an effort to monitor and manage risk and should not be confused with nor does it imply low risk or the ability to control risk.
Portfolio Review
The Fund underperformed both of its benchmarks due largely to our non-U.S. equity investments. International markets generally underperformed the U.S. due to fears over Europe and worries of stalling global growth. Individually, Janus Overseas Fund was the largest absolute detractor followed by Janus International Equity Fund and INTECH International Fund, reflecting their relative aggressiveness with Janus Overseas Fund as the most active. Unsurprisingly, the Fund’s fixed income holdings led by Janus Flexible Bond Fund, Janus Global Bond Fund and Janus Short-Term Bond Fund, respectively, were the largest absolute contributors, reflecting fixed income’s stronger performance relative to equities. We are hopeful that a return to more normal market conditions will allow the Fund to recover quickly given its relatively aggressive investments.
During the period, we increased our allocation to INTECH International Fund after we added it earlier in the year. We feel the mathematical strategy’s characteristics will help moderate the volatility of our non-U.S. equity allocation. We also traded a 1% position in Janus Flexible Bond Fund to Janus Global Bond Fund in recognition of the growing importance of non-U.S. fixed income markets and to more closely mirror the investable universe. Finally, we added to Janus Global Real Estate Fund to better diversify our equity exposure.
Outlook and Positioning
Correlations within and across asset classes remain elevated as the market has moved from one crisis to the next. However, we think the crisis mentality appears to be easing as reflected by modest declines in correlations. If that trend continues, asset class diversification should reward investors.
We remain generally pleased with how the portfolio is positioned and expect only minor changes (if any) in the coming months. We have deliberately allowed a more aggressive mix of underlying funds given what we believe is a greater tolerance for volatility in Janus Growth Allocation Fund relative to the other allocation funds. It cost us this period, but we look at the Fund’s outperformance amid a fairly steep rally in October as hope that we will participate in any market recovery that might be forthcoming.
Thank you for investing in Janus Growth Allocation Fund.
Janus Asset Allocation Funds | 5
Janus Growth Allocation Fund (unaudited)
Janus Growth Allocation Fund (% of Net Assets)
| | | | | |
| Janus International Equity Fund – Class I Shares | | | 12.4% | |
| Janus Flexible Bond Fund – Class I Shares | | | 12.3% | |
INTECH U.S. Value Fund(1) – Class I Shares | | | 11.5% | |
| Perkins Large Cap Value Fund – Class I Shares | | | 9.8% | |
INTECH U.S. Growth Fund(2) – Class I Shares | | | 9.4% | |
INTECH International Fund(3) – Class I Shares | | | 7.6% | |
| Janus Overseas Fund – Class I Shares | | | 7.4% | |
| Janus Research Fund – Class I Shares | | | 5.4% | |
| Janus Global Bond Fund – Class I Shares | | | 4.5% | |
| Janus Twenty Fund – Class D Shares | | | 4.0% | |
| Janus Global Real Estate Fund – Class I Shares | | | 3.5% | |
| Janus Fund – Class I Shares | | | 3.0% | |
| Perkins Mid Cap Value Fund – Class I Shares | | | 2.1% | |
| Perkins Small Cap Value Fund – Class I Shares | | | 2.0% | |
| Janus Short-Term Bond Fund – Class I Shares | | | 1.8% | |
| Janus Triton Fund – Class I Shares | | | 1.7% | |
| Janus High-Yield Fund – Class I Shares | | | 0.6% | |
| Janus Contrarian Fund – Class I Shares | | | 0.5% | |
| Janus Global Select Fund – Class I Shares | | | 0.5% | |
| |
| |
| | | |
| (1) | | Formerly named INTECH Risk-Managed Value Fund. |
| (2) | | Formerly named INTECH Risk-Managed Growth Fund. |
| (3) | | Formerly named INTECH Risk-Managed International Fund. |
Janus Growth Allocation Fund At A Glance
Asset Allocation – (% of Net Assets)
As of December 31, 2011
6 | DECEMBER 31, 2011
(unaudited)
| | | | | | | | | | | | | | |
| Average Annual Total Return – for the periods ended December 31, 2011 | | | Expense Ratios – per the October 28, 2011 prospectuses |
| | | Fiscal
| | One
| | Five
| | Since
| | | Total Annual Fund
| | Net Annual Fund
|
| | | Year-to-Date | | Year | | Year | | Inception* | | | Operating Expenses | | Operating Expenses |
| | | | | | | | | | | | | | |
| Janus Growth Allocation Fund – Class A Shares | | | | | | | | | | | | | |
| | | | | | | | | | | | | | |
| NAV | | –9.25% | | –6.56% | | 1.50% | | 4.12% | | | 1.12% | | 1.12% |
| | | | | | | | | | | | | | |
| MOP | | –14.46% | | –11.93% | | 0.30% | | 3.10% | | | | | |
| | | | | | | | | | | | | | |
| Janus Growth Allocation Fund – Class C Shares | | | | | | | | | | | | | |
| | | | | | | | | | | | | | |
| NAV | | –9.57% | | –7.25% | | 0.75% | | 3.35% | | | 1.89% | | 1.89% |
| | | | | | | | | | | | | | |
| CDSC | | –10.47% | | –8.17% | | 0.75% | | 3.35% | | | | | |
| | | | | | | | | | | | | | |
| Janus Growth Allocation Fund – Class D Shares(1) | | –9.13% | | –6.44% | | 1.67% | | 4.30% | | | 0.96% | | 0.96% |
| | | | | | | | | | | | | | |
| Janus Growth Allocation Fund – Class I Shares | | –9.14% | | –6.38% | | 1.64% | | 4.27% | | | 0.93% | | 0.93% |
| | | | | | | | | | | | | | |
| Janus Growth Allocation Fund – Class S Shares | | –9.33% | | –6.79% | | 1.27% | | 3.88% | | | 1.35% | | 1.35% |
| | | | | | | | | | | | | | |
| Janus Growth Allocation Fund – Class T Shares | | –9.17% | | –6.49% | | 1.64% | | 4.27% | | | 1.03% | | 1.03% |
| | | | | | | | | | | | | | |
| S&P 500® Index | | –3.69% | | 2.11% | | –0.25% | | 2.26% | | | | | |
| | | | | | | | | | | | | | |
| Growth Allocation Index | | –6.59% | | –2.07% | | 0.80% | | 3.31% | | | | | |
| | | | | | | | | | | | | | |
| Lipper Quartile – Class T Shares | | – | | 4th | | 1st | | 1st | | | | | |
| | | | | | | | | | | | | | |
| Lipper Ranking – based on total returns for Mixed-Asset Target Allocation Growth Funds | | – | | 510/539 | | 109/436 | | 46/413 | | | | | |
| | | | | | | | | | | | | | |
| Visit janus.com/advisor/mutual-funds (or janus.com/allfunds if you hold Shares directly with Janus Capital) to view current performance and characteristic information | | | | | |
| | | | | | | | | | | | | | |
Data presented represents past performance, which is no guarantee of future results. Investment results and principal value will fluctuate so that shares, when redeemed, may be worth more or less than their original cost. Due to market volatility, current performance may be higher or lower than the performance shown. Call 877.33JANUS(52687) (or 800.525.3713 if you hold shares directly with Janus Capital) or visit janus.com/advisor/mutual-funds (or janus.com/allfunds if you hold shares directly with Janus Capital) for performance current to the most recent month-end.
Performance shown for Class A Shares at Maximum Offering Price (MOP) includes the Fund’s maximum sales charge of 5.75%. Performance shown at Net Asset Value (NAV) does not include this charge and would have been lower had this charge been taken into account.
Performance shown for Class C Shares includes a 1% contingent deferred sales charge (CDSC) on periods of less than 12 months. Performance shown at Net Asset Value (NAV) does not include this sales charge and would have been lower had this sales charge been taken into account.
See important disclosures on the next page.
Janus Asset Allocation Funds | 7
Janus Growth Allocation Fund (unaudited)
A Fund which redeems or exchanges certain underlying funds’ shares held for 90 days or less may be subject to an underlying fund’s 2.00% redemption fee, if any.
Janus Capital has contractually agreed to waive the Fund’s total annual fund operating expenses allocated to any class (excluding any expenses of an underlying fund (acquired fund fees and expenses), the distribution and shareholder servicing fees (applicable to Class A Shares, Class C Shares, and Class S Shares), administrative services fees payable pursuant to the Transfer Agency Agreement (except for networking and omnibus fees), brokerage commissions, interest, dividends, taxes, and extraordinary expenses) to certain limits until at least November 1, 2012. The contractual waiver may be terminated or modified prior to this date only at the discretion of the Board of Trustees. Returns shown include fee waivers, if any, and without such waivers, returns would have been lower.
The expense information shown was determined based on net assets as of the fiscal period ended June 30, 2011. The effect of contractual waivers agreed to by Janus Capital, when applicable, are reflected under “Net Annual Fund Operating Expenses.” (All expenses are shown without the effect of expense offset arrangements. Pursuant to such arrangements, credits realized as a result of uninvested cash balances are used to reduce custodian and transfer agent expenses.)
An underlying fund’s performance may be affected by risks that include those associated with nondiversification, non-investment grade debt securities, undervalued or overlooked companies, investments in specific industries or countries and potential conflicts of interest with the Janus “funds of funds.” Additional risks to a Fund may also include, but are not limited to, those associated with investing in foreign securities, emerging markets, initial public offerings (“IPOs”), real estate investment trusts (“REITs”), derivatives and companies with relatively small market capitalizations. Each underlying fund has different risks. Please see a Janus prospectus or janus.com/info (or janus.com/reports if you hold shares directly with Janus Capital) for more information about risks, portfolio holdings and other details.
Because Janus Capital is the adviser to the Fund and to the underlying funds held within the Fund, it is subject to certain potential conflicts of interest when allocating the assets of the Funds among underlying Janus funds. Performance of the Fund depends on that of the underlying funds, which are subject to the volatility of the financial markets.
Returns include reinvestment of dividends from net investment income and distributions from capital gains. The returns shown do not reflect the deduction of taxes that a shareholder would pay on Fund distributions or the redemption of Fund shares. The returns do not include adjustments in accordance with generally accepted accounting principles required at the period end for financial reporting purposes.
Class A Shares, Class C Shares, and Class S Shares of the Fund commenced operations on July 6, 2009. The historical performance shown for periods prior to July 6, 2009 reflects the performance of one or more other share classes of the Fund, calculated using the fees and expenses of each respective share class without the effect of any fee and expense limitations and waivers. If each share class of the Fund had been available during periods prior to July 6, 2009, the performance shown may have been different. Please refer to the Fund’s prospectus for further details concerning historical performance.
Class D Shares of the Fund commenced operations on February 16, 2010, as a result of the restructuring of Class J Shares, the predecessor share class. The performance shown for Class D Shares for periods prior to February 16, 2010, reflects the performance of the Fund’s former Class J Shares. If Class D Shares of the Fund had been available during periods prior to February 16, 2010, the performance shown may have been different. The performance shown for periods following the Fund’s commencement of Class D Shares reflects the fees and expenses of Class D Shares, net of any fee and expense limitations or waivers.
Class I Shares commenced operations on July 6, 2009. Performance shown for Class I Shares for periods prior to July 6, 2009, reflects the performance of the Fund’s Class J Shares, the initial share class, calculated using the fees and expenses of Class J Shares, without the effect of any fee and expense limitations or waivers. If Class I Shares of the Fund had been available during periods prior to July 6, 2009, the performance shown may have been different. The performance shown for periods following the Fund’s commencement of Class I Shares reflects the fees and expenses of Class I Shares, net of any fee and expense limitations or waivers.
Lipper, a wholly-owned subsidiary of Thomson Reuters, provides independent insight on global collective investments including mutual funds, retirement funds, hedge funds, fund fees and expenses to the asset management and media communities. Lipper ranks the performance of mutual funds within a classification of funds that have similar investment objectives. Rankings are historical with capital gains and dividends reinvested and do not include the effect of loads.
Ranking is for Class T Shares only; other classes may have different performance characteristics. When an expense waiver is in effect, it may have a material effect on the total return, and therefore the ranking for the period.
There is no assurance that the investment process will consistently lead to successful investing.
See Notes to Schedules of Investments for index definitions.
The Fund’s portfolio may differ significantly from the securities held in the indices. The indices are unmanaged and are not available for direct investment; therefore, their performance does not reflect the expenses associated with the active management of an actual portfolio.
See “Explanations of Charts, Tables and Financial Statements.”
| | | |
| * | | The Fund’s inception date – December 30, 2005 |
| (1) | | Closed to new investors. |
8 | DECEMBER 31, 2011
(unaudited)
The examples below show you the ongoing costs (in dollars) of investing in your Fund and allow you to compare these costs with those of other mutual funds. Please refer to the section Useful Information About Your Fund Report for a detailed explanation of the information presented in these charts.
| | | | | | | | | | | | | | | |
| | | Beginning Account Value
| | Ending Account Value
| | Expenses Paid During Period
| | |
| Expense Example – Class A Shares | | (7/1/11) | | (12/31/11) | | (7/1/11 - 12/31/11)† | | |
| |
| |
| Actual | | $ | 1,000.00 | | | $ | 907.50 | | | $ | 2.11 | | | |
| |
| |
Hypothetical
(5% return before expenses) | | $ | 1,000.00 | | | $ | 1,022.92 | | | $ | 2.24 | | | |
| |
| |
| | | | | | | | | | | | | | | |
| | | | | | | | | | | | | | | |
| | | Beginning Account Value
| | Ending Account Value
| | Expenses Paid During Period
| | |
| Expense Example – Class C Shares | | (7/1/11) | | (12/31/11) | | (7/1/11 - 12/31/11)† | | |
| |
| |
| Actual | | $ | 1,000.00 | | | $ | 905.00 | | | $ | 5.75 | | | |
| |
| |
Hypothetical
(5% return before expenses) | | $ | 1,000.00 | | | $ | 1,019.10 | | | $ | 6.09 | | | |
| |
| |
| | | | | | | | | | | | | | | |
| | | | | | | | | | | | | | | |
| | | Beginning Account Value
| | Ending Account Value
| | Expenses Paid During Period
| | |
| Expense Example – Class D Shares | | (7/1/11) | | (12/31/11) | | (7/1/11 - 12/31/11)† | | |
| |
| |
| Actual | | $ | 1,000.00 | | | $ | 908.70 | | | $ | 1.39 | | | |
| |
| |
Hypothetical
(5% return before expenses) | | $ | 1,000.00 | | | $ | 1,023.68 | | | $ | 1.48 | | | |
| |
| |
| | | | | | | | | | | | | | | |
| | | | | | | | | | | | | | | |
| | | Beginning Account Value
| | Ending Account Value
| | Expenses Paid During Period
| | |
| Expense Example – Class I Shares | | (7/1/11) | | (12/31/11) | | (7/1/11 - 12/31/11)† | | |
| |
| |
| Actual | | $ | 1,000.00 | | | $ | 909.30 | | | $ | 1.30 | | | |
| |
| |
Hypothetical
(5% return before expenses) | | $ | 1,000.00 | | | $ | 1,023.78 | | | $ | 1.37 | | | |
| |
| |
| | | | | | | | | | | | | | | |
| | | | | | | | | | | | | | | |
| | | Beginning Account Value
| | Ending Account Value
| | Expenses Paid During Period
| | |
| Expense Example – Class S Shares | | (7/1/11) | | (12/31/11) | | (7/1/11 - 12/31/11)† | | |
| |
| |
| Actual | | $ | 1,000.00 | | | $ | 907.50 | | | $ | 3.12 | | | |
| |
| |
Hypothetical
(5% return before expenses) | | $ | 1,000.00 | | | $ | 1,021.87 | | | $ | 3.30 | | | |
| |
| |
| | | | | | | | | | | | | | | |
| | | | | | | | | | | | | | | |
| | | Beginning Account Value
| | Ending Account Value
| | Expenses Paid During Period
| | |
| Expense Example – Class T Shares | | (7/1/11) | | (12/31/11) | | (7/1/11 - 12/31/11)† | | |
| |
| |
| Actual | | $ | 1,000.00 | | | $ | 908.30 | | | $ | 1.92 | | | |
| |
| |
Hypothetical
(5% return before expenses) | | $ | 1,000.00 | | | $ | 1,023.13 | | | $ | 2.03 | | | |
| |
| |
| | | |
| † | | Expenses are equal to the annualized expense ratio of 0.44% for Class A Shares, 1.20% for Class C Shares, 0.29% for Class D Shares, 0.27% for Class I Shares, 0.65% for Class S Shares and 0.40% for Class T Shares multiplied by the average account value over the period, multiplied by 184/366 (to reflect the one-half year period). Expenses include effect of contractual waivers by Janus Capital. |
Janus Asset Allocation Funds | 9
Janus Growth Allocation Fund
Schedule of Investments (unaudited)
As of December 31, 2011
| | | | | | | | | | | |
| Shares | | Value | | | |
| |
Mutual Funds(1) – 100.0% | | | | | | |
| Equity Funds – 80.8% | | | | | | |
| | 2,529,734 | | | INTECH International Fund(2) – Class I Shares | | $ | 16,645,653 | | | |
| | 1,593,325 | | | INTECH U.S. Growth Fund(3) – Class I Shares | | | 20,713,218 | | | |
| | 2,662,141 | | | INTECH U.S. Value Fund(4) – Class I Shares | | | 25,290,343 | | | |
| | 94,633 | | | Janus Contrarian Fund – Class I Shares | | | 1,165,872 | | | |
| | 241,654 | | | Janus Fund – Class I Shares | | | 6,592,323 | | | |
| | 959,806 | | | Janus Global Real Estate Fund – Class I Shares | | | 7,659,250 | | | |
| | 108,809 | | | Janus Global Select Fund – Class I Shares | | | 1,050,003 | | | |
| | 2,811,274 | | | Janus International Equity Fund – Class I Shares | | | 27,156,912 | | | |
| | 515,772 | | | Janus Overseas Fund – Class I Shares | | | 16,251,973 | | | |
| | 426,014 | | | Janus Research Fund – Class I Shares | | | 11,962,471 | | | |
| | 222,303 | | | Janus Triton Fund – Class I Shares | | | 3,630,209 | | | |
| | 173,742 | | | Janus Twenty Fund – Class D Shares | | | 8,879,949 | | | |
| | 1,718,712 | | | Perkins Large Cap Value Fund – Class I Shares | | | 21,621,394 | | | |
| | 228,362 | | | Perkins Mid Cap Value Fund – Class I Shares | | | 4,608,350 | | | |
| | 217,299 | | | Perkins Small Cap Value Fund – Class I Shares | | | 4,432,907 | | | |
| | | | | | | | 177,660,827 | | | |
| Fixed Income Funds – 19.2% | | | | | | |
| | 2,573,195 | | | Janus Flexible Bond Fund – Class I Shares | | | 27,121,478 | | | |
| | 955,764 | | | Janus Global Bond Fund – Class I Shares | | | 9,815,694 | | | |
| | 151,502 | | | Janus High-Yield Fund – Class I Shares | | | 1,324,129 | | | |
| | 1,282,520 | | | Janus Short-Term Bond Fund – Class I Shares | | | 3,911,685 | | | |
| | | | | | | | 42,172,986 | | | |
| |
| |
| Total Investments (total cost $210,105,076) – 100.0% | | | 219,833,813 | | | |
| |
| |
| Liabilities, net of Cash, Receivables and Other Assets– (0.0)% | | | (91,231) | | | |
| |
| |
| Net Assets – 100% | | $ | 219,742,582 | | | |
| |
| |
| | | |
| (1) | | The Fund invests in mutual funds within the Janus family of funds and they may be deemed to be under common control because they share the same Board of Trustees. |
| (2) | | Formerly named INTECH Risk-Managed International Fund. |
| (3) | | Formerly named INTECH Risk-Managed Growth Fund. |
| (4) | | Formerly named INTECH Risk-Managed Value Fund. |
See Notes to Schedules of Investments and Financial Statements.
10 | DECEMBER 31, 2011
Janus Moderate Allocation Fund (unaudited)
| | | | | | | |
Fund Snapshot
We believe a fund of funds asset allocation portfolio, diversified among investment managers and optimized to a fixed asset mix, can provide attractive long-term returns. Using an institutional-quality asset allocation model, we combine three distinct investment managers into a series of portfolios, defined by specific risk targets, seeking to provide a core solution for long-term investors.
| | | | | |
Dan Scherman
portfolio manager |
Performance Overview
Janus Moderate Allocation Fund’s Class T Shares returned -5.62% during the six-month period ended December 31, 2011. This compares to a return of -3.69% for the S&P 500 Index, the Fund’s primary benchmark, and a return of -3.30% by its secondary benchmark, the Moderate Allocation Index, an internally calculated, hypothetical combination of unmanaged indices that combines the total returns from the Dow Jones Wilshire 5000 Index (40%), the Barclays Capital U.S. Aggregate Bond Index (40%), the MSCI EAFE Index (18%) and the MSCI Emerging Markets Index (2%).
Market Review
Global stocks sold off significantly during the third quarter following a first-ever downgrade of U.S. government debt, rising concerns over global economic growth and worries that the European sovereign debt saga could worsen. The increasing probability of a default by Greece and investor disquiet over the U.S. Federal Reserve’s (Fed) downbeat economic outlook contributed to further declines. The Fed indicated it would maintain its near zero-interest rate policy through mid-2013 and announced it would increase its share of long-term Treasuries in an attempt to make credit cheaper and spur spending and investment. The Fed acknowledged “significant” downside risks to the economy and noted “strains” in the global financial markets. A weak reading on manufacturing in China added to the bearish environment. Equities rebounded somewhat in the fourth quarter on hopes European leaders were taking steps to resolve the region’s debt crisis. Improving economic data in the U.S. also aided sentiment. Following a period of spiking European government bond yields, particularly in Italy and Spain, and changes in governments in Greece, Italy and Spain, central banks announced a coordinated plan to make dollar funding cheaper for European banks. China also said the reserve requirement ratio for its banks would be lowered in an effort to boost liquidity after having raised the ratio six times during the year. Meanwhile, in the U.S., employment, manufacturing and housing data showed improvement.
Volatility and headline risk were central themes for fixed-income investors in the second half of 2011. A rally in U.S. Treasuries became especially pronounced from late July through September, as worry mounted that the U.S. economy might slip into a double-dip recession. Investors were troubled by below-expectation U.S. gross domestic product (GDP) growth, a manufacturing slowdown and persistently weak employment, housing and consumer spending figures. Concern about high government debt levels, both in the U.S. and Europe, only heightened this negative market sentiment. A high-stakes political standoff in Congress in July and August over raising the U.S. debt ceiling did nothing to improve the situation. Credit rating agency Standard & Poor’s subsequently lowered the U.S.’s sovereign credit rating to AA+ from AAA. The downgrade was followed, ironically, by a near stampede into U.S. Treasury securities, as the darkening global economic picture made Treasuries appear to be the safest haven available.
All eyes returned to Europe in the fall, as fiscal problems in the so-called PIIGS (Portugal, Italy, Ireland, Greece and Spain) countries threatened to spiral out of control. By October, it appeared that European Union (EU) leaders would manage to contain euro-zone problems, and relieved investors briefly ventured out of Treasuries in search of higher yields. But uncertainty flooded back in November, as governments in Greece and then Italy fell amid market pressure to implement fiscal reforms. The late-November failure of the U.S. Congressional “super committee” to reach a deal to cut $1.2 trillion from the U.S. deficit added to the general malaise. In December, some headway was made in Europe, as EU leaders announced a plan in which most members would agree to stricter fiscal rules and the European Central Bank (ECB) served up a larger-than-expected $641 billion in 3-year loans. This injected some calm into the markets as volume wound down for the holidays, although investors remained concerned that credit ratings would be downgraded on one or more of the 17 euro zone countries. Meanwhile,
Janus Asset Allocation Funds | 11
Janus Moderate Allocation Fund (unaudited)
U.S. macroeconomic data continued to reflect a strengthening domestic economy.
Investment Process
Janus Moderate Allocation Fund is structured as a “fund of funds” portfolio that provides investors with broad, diversified exposure to various types of investments with an emphasis on managing investment risk. The Fund is also designed to blend the three core competencies that Janus practices as an organization: mathematically-driven strategies and fundamentally-driven, growth and value-oriented investments. We believe that combining these very different approaches in a single investment can potentially produce a portfolio with a unique and powerful performance profile.
The investment process involves setting return expectations for a broad range of Janus mutual funds that we believe best represent the full opportunity set available to today’s investor. Then, acting in conjunction with an outside consultant, we establish an ideal “model” portfolio based upon the specific risk/return objective of Janus Moderate Allocation Fund. The Janus Asset Allocation Committee also provides input on the overall allocation. Finally, we select the appropriate Janus, Perkins and INTECH funds that replicate our desired exposure. The allocations assigned to each selected underlying fund are consistent with our view of current market conditions and the long-term trade-off between risk and reward potential that each of these investment types represent. However, as a result of changing market conditions, both the mix of underlying funds and the allocations to these funds will change from time to time. Any portfolio risk management process we’ve discussed includes an effort to monitor and manage risk and should not be confused with nor does it imply low risk or the ability to control risk.
Portfolio Review
The Fund underperformed both its benchmarks during the period, as the insulation provided by our fixed income holdings was not enough to offset losses among our equity holdings. Given the market environment in which international stocks generally underperformed domestic equities it wasn’t surprising that the three largest absolute detractors were our non-U.S. focused investments, Janus International Equity Fund, Janus Overseas Fund and INTECH International Fund. We trimmed Janus Overseas Fund earlier in the year in favor of the less volatile INTECH International Fund, but it remains a significant portion of the overall international equity allocation. We think Overseas could perform well if the recent signs of market stability eventually grow into a full recovery. Given the outperformance of fixed income over equities during the period, it was equally unsurprising that our three largest absolute contributors were Janus Flexible Bond Fund, Janus Short-Term Bond Fund and Janus High-Yield Fund, respectively.
Among changes to the Fund during the period, we increased the allocation to U.S. equities, specifically through Perkins Large Cap Value Fund, in recognition of an increase in non-U.S. holdings in some of the domestic-focused underlying funds. We lowered our international allocation as a consequence of this move. We also added to Janus Global Real Estate Fund based on its potential diversification benefits relative to other equities.
Outlook and Positioning
Correlations within and across asset classes remain elevated as the market has moved from one crisis to the next. However, we think the crisis mentality appears to be easing as reflected by modest declines in correlations. If that trend continues, asset class diversification should reward investors.
We remain generally pleased with how the portfolio is positioned and expect only minor changes (if any) in the coming months. We have considered becoming more tactical with our approach – particularly amid the significant market moves early in the period – but are reluctant to succumb to that temptation. We believe the Fund adds value in two ways: 1) through the ability of the managers of the underlying funds to identify individual investments, and 2) by being disciplined and well-informed in how we blend those underlying strategies together. We believe the underlying mix of funds gives us a slightly more aggressive profile in hopes the Fund can make up lost ground when market volatility normalizes.
Thank you for investing in Janus Moderate Allocation Fund.
12 | DECEMBER 31, 2011
(unaudited)
Janus Moderate Allocation Fund (% of Net Assets)
| | | | | |
| Janus Flexible Bond Fund – Class I Shares | | | 33.9% | |
INTECH U.S. Value Fund(1) – Class I Shares | | | 10.7% | |
| Perkins Large Cap Value Fund – Class I Shares | | | 9.6% | |
| Janus International Equity Fund – Class I Shares | | | 8.8% | |
INTECH U.S. Growth Fund(2) – Class I Shares | | | 6.8% | |
| Janus Short-Term Bond Fund – Class I Shares | | | 5.1% | |
INTECH International Fund(3) – Class I Shares | | | 4.6% | |
| Janus Overseas Fund – Class I Shares | | | 4.5% | |
| Janus Research Fund – Class I Shares | | | 4.5% | |
| Perkins Small Cap Value Fund – Class I Shares | | | 2.3% | |
| Janus Fund – Class I Shares | | | 2.3% | |
| Janus Global Real Estate Fund – Class I Shares | | | 2.2% | |
| Janus Twenty Fund – Class D Shares | | | 1.9% | |
| Janus Triton Fund – Class I Shares | | | 1.8% | |
| Janus High-Yield Fund – Class I Shares | | | 0.6% | |
| Janus Global Select Fund – Class I Shares | | | 0.4% | |
| Janus Growth and Income Fund – Class I Shares | | | 0.0% | |
| |
| |
| | | |
| (1) | | Formerly named INTECH Risk-Managed Value Fund. |
| (2) | | Formerly named INTECH Risk-Managed Growth Fund. |
| (3) | | Formerly named INTECH Risk-Managed International Fund. |
Janus Moderate Allocation Fund At A Glance
Asset Allocation – (% of Net Assets)
As of December 31, 2011
Janus Asset Allocation Funds | 13
Janus Moderate Allocation Fund (unaudited)
| | | | | | | | | | | | | | |
| Average Annual Total Return – for the periods ended December 31, 2011 | | | Expense Ratios – per the October 28, 2011 prospectuses |
| | | Fiscal
| | One
| | Five
| | Since
| | | Total Annual Fund
| | Net Annual Fund
|
| | | Year-to-Date | | Year | | Year | | Inception* | | | Operating Expenses | | Operating Expenses |
| | | | | | | | | | | | | | |
| Janus Moderate Allocation Fund – Class A Shares | | | | | | | | | | | | | |
| | | | | | | | | | | | | | |
| NAV | | –5.71% | | –2.69% | | 3.55% | | 5.23% | | | 1.13% | | 1.13% |
| | | | | | | | | | | | | | |
| MOP | | –11.15% | | –8.26% | | 2.33% | | 4.19% | | | | | |
| | | | | | | | | | | | | | |
| Janus Moderate Allocation Fund – Class C Shares | | | | | | | | | | | | | |
| | | | | | | | | | | | | | |
| NAV | | –6.04% | | –3.40% | | 2.80% | | 4.46% | | | 1.79% | | 1.79% |
| | | | | | | | | | | | | | |
| CDSC | | –6.95% | | –4.34% | | 2.80% | | 4.46% | | | | | |
| | | | | | | | | | | | | | |
| Janus Moderate Allocation Fund – Class D Shares(1) | | –5.63% | | –2.55% | | 3.74% | | 5.42% | | | 0.88% | | 0.88% |
| | | | | | | | | | | | | | |
| Janus Moderate Allocation Fund – Class I Shares | | –5.57% | | –2.47% | | 3.70% | | 5.39% | | | 0.80% | | 0.80% |
| | | | | | | | | | | | | | |
| Janus Moderate Allocation Fund – Class S Shares | | –5.80% | | –2.93% | | 3.30% | | 4.97% | | | 1.27% | | 1.27% |
| | | | | | | | | | | | | | |
| Janus Moderate Allocation Fund – Class T Shares | | –5.62% | | –2.61% | | 3.70% | | 5.39% | | | 0.98% | | 0.98% |
| | | | | | | | | | | | | | |
| S&P 500® Index | | –3.69% | | 2.11% | | –0.25% | | 2.26% | | | | | |
| | | | | | | | | | | | | | |
| Moderate Allocation Index | | –3.30% | | 0.96% | | 2.43% | | 4.16% | | | | | |
| | | | | | | | | | | | | | |
| Lipper Quartile – Class T Shares | | – | | 4th | | 1st | | 1st | | | | | |
| | | | | | | | | | | | | | |
| Lipper Ranking – based on total returns for Mixed-Asset Target Allocation Moderate Funds | | – | | 396/483 | | 19/398 | | 16/361 | | | | | |
| | | | | | | | | | | | | | |
| Visit janus.com/advisor/mutual-funds (or janus.com/allfunds if you hold Shares directly with Janus Capital) to view current performance and characteristic information | | | | | |
| | | | | | | | | | | | | | |
Data presented represents past performance, which is no guarantee of future results. Investment results and principal value will fluctuate so that shares, when redeemed, may be worth more or less than their original cost. Due to market volatility, current performance may be higher or lower than the performance shown. Call 877.33JANUS(52687) (or 800.525.3713 if you hold shares directly with Janus Capital) or visit janus.com/advisor/mutual-funds (or janus.com/allfunds if you hold shares directly with Janus Capital) for performance current to the most recent month-end.
Performance shown for Class A Shares at Maximum Offering Price (MOP) includes the Fund’s maximum sales charge of 5.75%. Performance shown at Net Asset Value (NAV) does not include this charge and would have been lower had this charge been taken into account.
Performance shown for Class C Shares includes a 1% contingent deferred sales charge (CDSC) on periods of less than 12 months. Performance shown at Net Asset Value (NAV) does not include this sales charge and would have been lower had this sales charge been taken into account.
See important disclosures on the next page.
14 | DECEMBER 31, 2011
(unaudited)
A Fund which redeems or exchanges certain underlying funds’ shares held for 90 days or less may be subject to an underlying fund’s 2.00% redemption fee, if any.
Janus Capital has contractually agreed to waive the Fund’s total annual fund operating expenses allocated to any class (excluding any expenses of an underlying fund (acquired fund fees and expenses), the distribution and shareholder servicing fees (applicable to Class A Shares, Class C Shares, and Class S Shares), administrative services fees payable pursuant to the Transfer Agency Agreement (except for networking and omnibus fees), brokerage commissions, interest, dividends, taxes, and extraordinary expenses) to certain limits until at least November 1, 2012. The contractual waiver may be terminated or modified prior to this date only at the discretion of the Board of Trustees. Returns shown include fee waivers, if any, and without such waivers, returns would have been lower.
The expense information shown was determined based on net assets as of the fiscal period ended June 30, 2011. The effect of contractual waivers agreed to by Janus Capital, when applicable, are reflected under “Net Annual Fund Operating Expenses.” (All expenses are shown without the effect of expense offset arrangements. Pursuant to such arrangements, credits realized as a result of uninvested cash balances are used to reduce custodian and transfer agent expenses.)
An underlying fund’s performance may be affected by risks that include those associated with nondiversification, non-investment grade debt securities, undervalued or overlooked companies, investments in specific industries or countries and potential conflicts of interest with the Janus “funds of funds.” Additional risks to a Fund may also include, but are not limited to, those associated with investing in foreign securities, emerging markets, initial public offerings (“IPOs”), real estate investment trusts (“REITs”), derivatives and companies with relatively small market capitalizations. Each underlying fund has different risks. Please see a Janus prospectus or janus.com/info (or janus.com/reports if you hold shares directly with Janus Capital) for more information about risks, portfolio holdings and other details.
Because Janus Capital is the adviser to the Fund and to the underlying funds held within the Fund, it is subject to certain potential conflicts of interest when allocating the assets of the Funds among underlying Janus funds. Performance of the Fund depends on that of the underlying funds, which are subject to the volatility of the financial markets.
Returns include reinvestment of dividends from net investment income and distributions from capital gains. The returns shown do not reflect the deduction of taxes that a shareholder would pay on Fund distributions or the redemption of Fund shares. The returns do not include adjustments in accordance with generally accepted accounting principles required at the period end for financial reporting purposes.
Class A Shares, Class C Shares, and Class S Shares of the Fund commenced operations on July 6, 2009. The historical performance shown for periods prior to July 6, 2009 reflects the performance of one or more other share classes of the Fund, calculated using the fees and expenses of each respective share class without the effect of any fee and expense limitations and waivers. If each share class of the Fund had been available during periods prior to July 6, 2009, the performance shown may have been different. Please refer to the Fund’s prospectus for further details concerning historical performance.
Class D Shares of the Fund commenced operations on February 16, 2010, as a result of the restructuring of Class J Shares, the predecessor share class. The performance shown for Class D Shares for periods prior to February 16, 2010, reflects the performance of the Fund’s former Class J Shares. If Class D Shares of the Fund had been available during periods prior to February 16, 2010, the performance shown may have been different. The performance shown for periods following the Fund’s commencement of Class D Shares reflects the fees and expenses of Class D Shares, net of any fee and expense limitations or waivers.
Class I Shares commenced operations on July 6, 2009. Performance shown for Class I Shares for periods prior to July 6, 2009, reflects the performance of the Fund’s Class J Shares, the initial share class, calculated using the fees and expenses of Class J Shares, without the effect of any fee and expense limitations or waivers. If Class I Shares of the Fund had been available during periods prior to July 6, 2009, the performance shown may have been different. The performance shown for periods following the Fund’s commencement of Class I Shares reflects the fees and expenses of Class I Shares, net of any fee and expense limitations or waivers.
Lipper, a wholly-owned subsidiary of Thomson Reuters, provides independent insight on global collective investments including mutual funds, retirement funds, hedge funds, fund fees and expenses to the asset management and media communities. Lipper ranks the performance of mutual funds within a classification of funds that have similar investment objectives. Rankings are historical with capital gains and dividends reinvested and do not include the effect of loads.
Ranking is for Class T Shares only; other classes may have different performance characteristics. When an expense waiver is in effect, it may have a material effect on the total return, and therefore the ranking for the period.
There is no assurance that the investment process will consistently lead to successful investing.
See Notes to Schedules of Investments for index definitions.
The Fund’s portfolio may differ significantly from the securities held in the indices. The indices are unmanaged and are not available for direct investment; therefore, their performance does not reflect the expenses associated with the active management of an actual portfolio.
See “Explanations of Charts, Tables and Financial Statements.”
| | | |
| * | | The Fund’s inception date – December 30, 2005 |
| (1) | | Closed to new investors. |
Janus Asset Allocation Funds | 15
Janus Moderate Allocation Fund (unaudited)
The examples below show you the ongoing costs (in dollars) of investing in your Fund and allow you to compare these costs with those of other mutual funds. Please refer to the section Useful Information About Your Fund Report for a detailed explanation of the information presented in these charts.
| | | | | | | | | | | | | | | |
| | | Beginning Account Value
| | Ending Account Value
| | Expenses Paid During Period
| | |
| Expense Example – Class A Shares | | (7/1/11) | | (12/31/11) | | (7/1/11 - 12/31/11)† | | |
| |
| |
| Actual | | $ | 1,000.00 | | | $ | 943.70 | | | $ | 2.30 | | | |
| |
| |
Hypothetical
(5% return before expenses) | | $ | 1,000.00 | | | $ | 1,022.77 | | | $ | 2.39 | | | |
| |
| |
| | | | | | | | | | | | | | | |
| | | | | | | | | | | | | | | |
| | | Beginning Account Value
| | Ending Account Value
| | Expenses Paid During Period
| | |
| Expense Example – Class C Shares | | (7/1/11) | | (12/31/11) | | (7/1/11 - 12/31/11)† | | |
| |
| |
| Actual | | $ | 1,000.00 | | | $ | 939.60 | | | $ | 5.70 | | | |
| |
| |
Hypothetical
(5% return before expenses) | | $ | 1,000.00 | | | $ | 1,019.25 | | | $ | 5.94 | | | |
| |
| |
| | | | | | | | | | | | | | | |
| | | | | | | | | | | | | | | |
| | | Beginning Account Value
| | Ending Account Value
| | Expenses Paid During Period
| | |
| Expense Example – Class D Shares | | (7/1/11) | | (12/31/11) | | (7/1/11 - 12/31/11)† | | |
| |
| |
| Actual | | $ | 1,000.00 | | | $ | 944.50 | | | $ | 1.22 | | | |
| |
| |
Hypothetical
(5% return before expenses) | | $ | 1,000.00 | | | $ | 1,023.88 | | | $ | 1.27 | | | |
| |
| |
| | | | | | | | | | | | | | | |
| | | | | | | | | | | | | | | |
| | | Beginning Account Value
| | Ending Account Value
| | Expenses Paid During Period
| | |
| Expense Example – Class I Shares | | (7/1/11) | | (12/31/11) | | (7/1/11 - 12/31/11)† | | |
| |
| |
| Actual | | $ | 1,000.00 | | | $ | 945.10 | | | $ | 0.83 | | | |
| |
| |
Hypothetical
(5% return before expenses) | | $ | 1,000.00 | | | $ | 1,024.28 | | | $ | 0.87 | | | |
| |
| |
| | | | | | | | | | | | | | | |
| | | | | | | | | | | | | | | |
| | | Beginning Account Value
| | Ending Account Value
| | Expenses Paid During Period
| | |
| Expense Example – Class S Shares | | (7/1/11) | | (12/31/11) | | (7/1/11 - 12/31/11)† | | |
| |
| |
| Actual | | $ | 1,000.00 | | | $ | 942.80 | | | $ | 3.03 | | | |
| |
| |
Hypothetical
(5% return before expenses) | | $ | 1,000.00 | | | $ | 1,022.02 | | | $ | 3.15 | | | |
| |
| |
| | | | | | | | | | | | | | | |
| | | | | | | | | | | | | | | |
| | | Beginning Account Value
| | Ending Account Value
| | Expenses Paid During Period
| | |
| Expense Example – Class T Shares | | (7/1/11) | | (12/31/11) | | (7/1/11 - 12/31/11)† | | |
| |
| |
| Actual | | $ | 1,000.00 | | | $ | 943.80 | | | $ | 1.81 | | | |
| |
| |
Hypothetical
(5% return before expenses) | | $ | 1,000.00 | | | $ | 1,023.28 | | | $ | 1.88 | | | |
| |
| |
| | | |
| † | | Expenses are equal to the annualized expense ratio of 0.47% for Class A Shares, 1.17% for Class C Shares, 0.25% for Class D Shares, 0.17% for Class I Shares, 0.62% for Class S Shares and 0.37% for Class T Shares multiplied by the average account value over the period, multiplied by 184/366 (to reflect the one-half year period). Expenses include effect of contractual waivers by Janus Capital. |
16 | DECEMBER 31, 2011
Janus Moderate Allocation Fund
Schedule of Investments (unaudited)
As of December 31, 2011
| | | | | | | | | | | |
| Shares | | Value | | | |
| |
Mutual Funds(1) – 100.0% | | | | | | |
| Equity Funds – 60.4% | | | | | | |
| | 1,769,167 | | | INTECH International Fund(2) – Class I Shares | | $ | 11,641,122 | | | |
| | 1,344,143 | | | INTECH U.S. Growth Fund(3) – Class I Shares | | | 17,473,858 | | | |
| | 2,876,307 | | | INTECH U.S. Value Fund(4) – Class I Shares | | | 27,324,920 | | | |
| | 213,305 | | | Janus Fund – Class I Shares | | | 5,818,958 | | | |
| | 710,696 | | | Janus Global Real Estate Fund – Class I Shares | | | 5,671,350 | | | |
| | 110,090 | | | Janus Global Select Fund – Class I Shares | | | 1,062,371 | | | |
| | 10 | | | Janus Growth and Income Fund – Class I Shares | | | 307 | | | |
| | 2,333,460 | | | Janus International Equity Fund – Class I Shares | | | 22,541,224 | | | |
| | 365,848 | | | Janus Overseas Fund – Class I Shares | | | 11,527,855 | | | |
| | 412,152 | | | Janus Research Fund – Class I Shares | | | 11,573,229 | | | |
| | 286,402 | | | Janus Triton Fund – Class I Shares | | | 4,676,937 | | | |
| | 97,137 | | | Janus Twenty Fund – Class D Shares | | | 4,964,686 | | | |
| | 1,949,828 | | | Perkins Large Cap Value Fund – Class I Shares | | | 24,528,836 | | | |
| | 292,949 | | | Perkins Small Cap Value Fund – Class I Shares | | | 5,976,155 | | | |
| | | | | | | | 154,781,808 | | | |
| Fixed Income Funds – 39.6% | | | | | | |
| | 8,255,048 | | | Janus Flexible Bond Fund – Class I Shares | | | 87,008,205 | | | |
| | 181,566 | | | Janus High-Yield Fund – Class I Shares | | | 1,586,890 | | | |
| | 4,271,428 | | | Janus Short-Term Bond Fund – Class I Shares | | | 13,027,856 | | | |
| | | | | | | | 101,622,951 | | | |
| |
| |
| Total Investments (total cost $243,892,558) – 100.0% | | | 256,404,759 | | | |
| |
| |
| Liabilities, net of Cash, Receivables and Other Assets– (0.0)% | | | (46,021) | | | |
| |
| |
| Net Assets – 100% | | $ | 256,358,738 | | | |
| |
| |
| | | |
| (1) | | The Fund invests in mutual funds within the Janus family of funds and they may be deemed to be under common control because they share the same Board of Trustees. |
| (2) | | Formerly named INTECH Risk-Managed International Fund. |
| (3) | | Formerly named INTECH Risk-Managed Growth Fund. |
| (4) | | Formerly named INTECH Risk-Managed Value Fund. |
See Notes to Schedules of Investments and Financial Statements.
Janus Asset Allocation Funds | 17
Janus Conservative Allocation Fund (unaudited)
| | | | | | | |
Fund Snapshot
We believe a fund of funds asset allocation portfolio, diversified among investment managers and optimized to a fixed asset mix, can provide attractive long-term returns. Using an institutional-quality asset allocation model, we combine three distinct investment managers into a series of portfolios, defined by specific risk targets, seeking to provide a core solution for long-term investors.
| | | | | |
Dan Scherman
portfolio manager |
Performance Overview
Janus Conservative Allocation Fund’s Class T Shares returned -2.20% during the six-month period ended December 31, 2011. This compares to a return of -3.69% for the S&P 500 Index, the Fund’s primary benchmark, and a -0.30% return by its secondary benchmark, the Conservative Allocation Index, an internally-calculated, hypothetical combination of unmanaged indices that combines the total returns from the Barclays Capital U.S. Aggregate Bond Index (60%), the Dow Jones Wilshire 5000 Index (28%) and the MSCI EAFE Index (12%).
Market Review
Global stocks sold off significantly during the third quarter following a first-ever downgrade of U.S. government debt, rising concerns over global economic growth and worries that the European sovereign debt saga could worsen. The increasing probability of a default by Greece and investor disquiet over the U.S. Federal Reserve’s (Fed) downbeat economic outlook contributed to further declines. The Fed indicated it would maintain its near zero-interest rate policy through mid-2013 and announced it would increase its share of long-term Treasuries in an attempt to make credit cheaper and spur spending and investment. The Fed acknowledged “significant” downside risks to the economy and noted “strains” in the global financial markets. A weak reading on manufacturing in China added to the bearish environment. Equities rebounded somewhat in the fourth quarter on hopes European leaders were taking steps to resolve the region’s debt crisis. Improving economic data in the U.S. also aided sentiment. Following a period of spiking European government bond yields, particularly in Italy and Spain, and changes in governments in Greece, Italy and Spain, central banks announced a coordinated plan to make dollar funding cheaper for European banks. China also said the reserve requirement ratio for its banks would be lowered in an effort to boost liquidity after having raised the ratio six times during the year. Meanwhile, in the U.S., employment, manufacturing and housing data showed improvement.
Volatility and headline risk were central themes for fixed-income investors in the second half of 2011. A rally in U.S. Treasuries became especially pronounced from late July through September, as worry mounted that the U.S. economy might slip into a double-dip recession. Investors were troubled by below-expectation U.S. gross domestic product (GDP) growth, a manufacturing slowdown and persistently weak employment, housing and consumer spending figures. Concern about high government debt levels, both in the U.S. and Europe, only heightened this negative market sentiment. A high-stakes political standoff in Congress in July and August over raising the U.S. debt ceiling did nothing to improve the situation. Credit rating agency Standard & Poor’s subsequently lowered the U.S.’s sovereign credit rating to AA+ from AAA. The downgrade was followed, ironically, by a near stampede into U.S. Treasury securities, as the darkening global economic picture made Treasuries appear to be the safest haven available.
All eyes returned to Europe in the fall, as fiscal problems in the so-called PIIGS (Portugal, Italy, Ireland, Greece and Spain) countries threatened to spiral out of control. By October, it appeared that European Union (EU) leaders would manage to contain euro-zone problems, and relieved investors briefly ventured out of Treasuries in search of higher yields. But uncertainty flooded back in November, as governments in Greece and then Italy fell amid market pressure to implement fiscal reforms. The late-November failure of the U.S. Congressional “super committee” to reach a deal to cut $1.2 trillion from the U.S. deficit added to the general malaise. In December, some headway was made in Europe, as EU leaders announced a plan in which most members would agree to stricter fiscal rules and the European Central Bank (ECB) served up a larger-than-expected $641 billion in 3-year loans. This injected some calm into the markets as volume wound down for the holidays, although investors remained concerned that credit ratings would be downgraded on one or more of the 17 euro zone countries. Meanwhile,
18 | DECEMBER 31, 2011
(unaudited)
U.S. macroeconomic data continued to reflect a strengthening domestic economy.
Investment Process
Janus Conservative Allocation Fund is structured as a “fund of funds” portfolio that provides investors with broad, diversified exposure to various types of investments with an emphasis on managing investment risk. The Fund is also designed to blend the three core competencies that Janus practices as an organization: mathematically-driven strategies and fundamentally-driven, growth and value-oriented investments. We believe that combining these very different approaches in a single investment can potentially produce a portfolio with a unique and powerful performance profile.
The investment process involves setting return expectations for a broad range of Janus mutual funds that we believe best represent the full opportunity set available to today’s investor. Then, acting in conjunction with an outside consultant, we establish an ideal “model” portfolio based upon the specific risk/return objective of Janus Conservative Allocation Fund. The Janus Asset Allocation Committee also provides input on the overall allocation. Finally, we select the appropriate Janus, Perkins and INTECH funds that replicate our desired exposure. The allocations assigned to each selected underlying fund are consistent with our view of current market conditions and the long-term trade-off between risk and reward potential that each of these investment types represent. However, as a result of changing market conditions, both the mix of underlying funds and the allocations to these funds will change from time to time. Any portfolio risk management process we’ve discussed includes an effort to monitor and manage risk and should not be confused with nor does it imply low risk or the ability to control risk.
Portfolio Review
Given the positive fixed income market performance during the period, the Fund’s outperformance relative to its all-equity primary benchmark was largely driven by the Fund’s significant fixed income weighting. The Fund underperformed its secondary benchmark due largely to losses among the Fund’s more aggressive equity positions during the sharp downturn in the first three months of the period. Notably, our two largest absolute detractors, Janus International Equity Fund and Janus Overseas Fund, have exposure to non-U.S. equity markets, which generally underperformed the U.S. equity market due to fears over Europe and worries of stalling global growth. Our decision in May 2011 to more broadly diversify our non-U.S. equity holdings by adding INTECH International Fund helped dampen the Fund’s volatility during the period. Unsurprisingly, given the environment, three of the top five absolute contributors were fixed income holdings led by Janus Flexible Bond Fund and Janus High-Yield Fund. There were very few changes made to the Fund during the period.
Outlook and Positioning
Correlations within and across asset classes remain elevated as the market has moved from one crisis to the next. However, we think the crisis mentality appears to be easing as reflected by modest declines in correlations. If that trend continues, asset class diversification should reward investors.
We remain generally pleased with how the portfolio is positioned and expect only minor changes (if any) in the coming months. We have considered becoming more tactical with our approach – particularly amid the significant market moves early in the period – but are reluctant to succumb to that temptation. We believe the Fund adds value in two ways: 1) through the ability of the managers of the underlying funds to identify individual investments, and 2) by being disciplined and well-informed in how we blend those underlying strategies together. An overly tactical approach, especially in a conservative portfolio like this one, would be inappropriate.
Thank you for investing in Janus Conservative Allocation Fund.
Janus Asset Allocation Funds | 19
Janus Conservative Allocation Fund (unaudited)
Janus Conservative Allocation Fund (% of Net Assets)
| | | | | |
| Janus Flexible Bond Fund – Class I Shares | | | 53.3% | |
INTECH U.S. Value Fund(1) – Class I Shares | | | 8.4% | |
| Perkins Large Cap Value Fund – Class I Shares | | | 7.1% | |
| Janus Short-Term Bond Fund – Class I Shares | | | 6.8% | |
INTECH U.S. Growth Fund(2) – Class I Shares | | | 5.8% | |
| Janus International Equity Fund – Class I Shares | | | 4.9% | |
| Janus Research Fund – Class I Shares | | | 3.9% | |
INTECH International Fund(3) – Class I Shares | | | 1.8% | |
| Janus Overseas Fund – Class I Shares | | | 1.8% | |
| Janus Triton Fund – Class I Shares | | | 1.8% | |
| Janus Fund – Class I Shares | | | 1.7% | |
| Janus Global Real Estate Fund – Class I Shares | | | 0.8% | |
| Perkins Small Cap Value Fund – Class I Shares | | | 0.8% | |
| Janus High-Yield Fund – Class I Shares | | | 0.5% | |
| Janus Growth and Income Fund – Class I Shares | | | 0.4% | |
| Janus Global Select Fund – Class I Shares | | | 0.2% | |
| Janus Contrarian Fund – Class I Shares | | | 0.0% | |
| |
| |
| | | |
| (1) | | Formerly named INTECH Risk-Managed Value Fund. |
| (2) | | Formerly named INTECH Risk-Managed Growth Fund. |
| (3) | | Formerly named INTECH Risk-Managed International Fund. |
Janus Conservative Allocation Fund At A Glance
Asset Allocation – (% of Net Assets)
As of December 31, 2011
20 | DECEMBER 31, 2011
(unaudited)
| | | | | | | | | | | | | | |
| Average Annual Total Return – for the periods ended December 31, 2011 | | | Expense Ratios – per the October 28, 2011 prospectuses |
| | | Fiscal
| | One
| | Five
| | Since
| | | Total Annual Fund
| | Net Annual Fund
|
| | | Year-to-Date | | Year | | Year | | Inception* | | | Operating Expenses | | Operating Expenses |
| | | | | | | | | | | | | | |
| Janus Conservative Allocation Fund – Class A Shares | | | | | | | | | | | | | |
| | | | | | | | | | | | | | |
| NAV | | –2.17% | | 1.44% | | 4.91% | | 5.87% | | | 0.97% | | 0.97% |
| | | | | | | | | | | | | | |
| MOP | | –7.82% | | –4.40% | | 3.68% | | 4.83% | | | | | |
| | | | | | | | | | | | | | |
| Janus Conservative Allocation Fund – Class C Shares | | | | | | | | | | | | | |
| | | | | | | | | | | | | | |
| NAV | | –2.50% | | 0.70% | | 4.15% | | 5.10% | | | 1.73% | | 1.73% |
| | | | | | | | | | | | | | |
| CDSC | | –3.45% | | –0.28% | | 4.15% | | 5.10% | | | | | |
| | | | | | | | | | | | | | |
| Janus Conservative Allocation Fund – Class D Shares(1) | | –2.17% | | 1.51% | | 5.11% | | 6.08% | | | 0.84% | | 0.84% |
| | | | | | | | | | | | | | |
| Janus Conservative Allocation Fund – Class I Shares | | –2.09% | | 1.59% | | 5.07% | | 6.04% | | | 0.77% | | 0.77% |
| | | | | | | | | | | | | | |
| Janus Conservative Allocation Fund – Class S Shares | | –2.31% | | 1.13% | | 4.63% | | 5.59% | | | 1.21% | | 1.21% |
| | | | | | | | | | | | | | |
| Janus Conservative Allocation Fund – Class T Shares | | –2.20% | | 1.39% | | 5.07% | | 6.04% | | | 0.95% | | 0.95% |
| | | | | | | | | | | | | | |
| S&P 500® Index | | –3.69% | | 2.11% | | –0.25% | | 2.26% | | | | | |
| | | | | | | | | | | | | | |
| Conservative Allocation Index | | –0.30% | | 3.61% | | 3.89% | | 4.89% | | | | | |
| | | | | | | | | | | | | | |
| Lipper Quartile – Class T Shares | | – | | 3rd | | 1st | | 1st | | | | | |
| | | | | | | | | | | | | | |
| Lipper Ranking – based on total returns for Mixed-Asset Target Allocation Conservative Funds | | – | | 289/438 | | 16/320 | | 10/274 | | | | | |
| | | | | | | | | | | | | | |
| Visit janus.com/advisor/mutual-funds (or janus.com/allfunds if you hold Shares directly with Janus Capital) to view current performance and characteristic information | | | | | |
| | | | | | | | | | | | | | |
Data presented represents past performance, which is no guarantee of future results. Investment results and principal value will fluctuate so that shares, when redeemed, may be worth more or less than their original cost. Due to market volatility, current performance may be higher or lower than the performance shown. Call 877.33JANUS(52687) (or 800.525.3713 if you hold shares directly with Janus Capital) or visit janus.com/advisor/mutual-funds (or janus.com/allfunds if you hold shares directly with Janus Capital) for performance current to the most recent month-end.
Performance shown for Class A Shares at Maximum Offering Price (MOP) includes the Fund’s maximum sales charge of 5.75%. Performance shown at Net Asset Value (NAV) does not include this charge and would have been lower had this charge been taken into account.
Performance shown for Class C Shares includes a 1% contingent deferred sales charge (CDSC) on periods of less than 12 months. Performance shown at Net Asset Value (NAV) does not include this sales charge and would have been lower had this sales charge been taken into account.
See important disclosures on the next page.
Janus Asset Allocation Funds | 21
Janus Conservative Allocation Fund (unaudited)
A Fund which redeems or exchanges certain underlying funds’ shares held for 90 days or less may be subject to an underlying fund’s 2.00% redemption fee, if any.
Janus Capital has contractually agreed to waive the Fund’s total annual fund operating expenses allocated to any class (excluding any expenses of an underlying fund (acquired fund fees and expenses), the distribution and shareholder servicing fees (applicable to Class A Shares, Class C Shares, and Class S Shares), administrative services fees payable pursuant to the Transfer Agency Agreement (except for networking and omnibus fees), brokerage commissions, interest, dividends, taxes, and extraordinary expenses) to certain limits until at least November 1, 2012. The contractual waiver may be terminated or modified prior to this date only at the discretion of the Board of Trustees. Returns shown include fee waivers, if any, and without such waivers, returns would have been lower.
The expense information shown was determined based on net assets as of the fiscal period ended June 30, 2011. The effect of contractual waivers agreed to by Janus Capital, when applicable, are reflected under “Net Annual Fund Operating Expenses.” (All expenses are shown without the effect of expense offset arrangements. Pursuant to such arrangements, credits realized as a result of uninvested cash balances are used to reduce custodian and transfer agent expenses.)
An underlying fund’s performance may be affected by risks that include those associated with nondiversification, non-investment grade debt securities, undervalued or overlooked companies, investments in specific industries or countries and potential conflicts of interest with the Janus “funds of funds.” Additional risks to a Fund may also include, but are not limited to, those associated with investing in foreign securities, emerging markets, initial public offerings (“IPOs”), real estate investment trusts (“REITs”), derivatives and companies with relatively small market capitalizations. Each underlying fund has different risks. Please see a Janus prospectus or janus.com/info (or janus.com/reports if you hold shares directly with Janus Capital) for more information about risks, portfolio holdings and other details.
Because Janus Capital is the adviser to the Fund and to the underlying funds held within the Fund, it is subject to certain potential conflicts of interest when allocating the assets of the Funds among underlying Janus funds. Performance of the Fund depends on that of the underlying funds, which are subject to the volatility of the financial markets.
Returns include reinvestment of dividends from net investment income and distributions from capital gains. The returns shown do not reflect the deduction of taxes that a shareholder would pay on Fund distributions or the redemption of Fund shares. The returns do not include adjustments in accordance with generally accepted accounting principles required at the period end for financial reporting purposes.
Class A Shares, Class C Shares, Class I Shares, and Class S Shares of the Fund commenced operations on July 6, 2009. The historical performance shown for periods prior to July 6, 2009 reflects the performance of one or more other share classes of the Fund, calculated using the fees and expenses of each respective share class without the effect of any fee and expense limitations and waivers. If each share class of the Fund had been available during periods prior to July 6, 2009, the performance shown may have been different. Please refer to the Fund’s prospectus for further details concerning historical performance.
Class D Shares of the Fund commenced operations on February 16, 2010, as a result of the restructuring of Class J Shares, the predecessor share class. The performance shown for Class D Shares for periods prior to February 16, 2010, reflects the performance of the Fund’s former Class J Shares. If Class D Shares of the Fund had been available during periods prior to February 16, 2010, the performance shown may have been different. The performance shown for periods following the Fund’s commencement of Class D Shares reflects the fees and expenses of Class D Shares, net of any fee and expense limitations or waivers.
Lipper, a wholly-owned subsidiary of Thomson Reuters, provides independent insight on global collective investments including mutual funds, retirement funds, hedge funds, fund fees and expenses to the asset management and media communities. Lipper ranks the performance of mutual funds within a classification of funds that have similar investment objectives. Rankings are historical with capital gains and dividends reinvested and do not include the effect of loads.
Ranking is for Class T Shares only; other classes may have different performance characteristics. When an expense waiver is in effect, it may have a material effect on the total return, and therefore the ranking for the period.
There is no assurance that the investment process will consistently lead to successful investing.
See Notes to Schedules of Investments for index definitions.
The Fund’s portfolio may differ significantly from the securities held in the indices. The indices are unmanaged and are not available for direct investment; therefore, their performance does not reflect the expenses associated with the active management of an actual portfolio.
See “Explanations of Charts, Tables and Financial Statements.”
| | | |
| * | | The Fund’s inception date – December 30, 2005 |
| (1) | | Closed to new investors. |
22 | DECEMBER 31, 2011
(unaudited)
The examples below show you the ongoing costs (in dollars) of investing in your Fund and allow you to compare these costs with those of other mutual funds. Please refer to the section Useful Information About Your Fund Report for a detailed explanation of the information presented in these charts.
| | | | | | | | | | | | | | | |
| | | Beginning Account Value
| | Ending Account Value
| | Expenses Paid During Period
| | |
| Expense Example – Class A Shares | | (7/1/11) | | (12/31/11) | | (7/1/11 - 12/31/11)† | | |
| |
| |
| Actual | | $ | 1,000.00 | | | $ | 978.30 | | | $ | 1.99 | | | |
| |
| |
Hypothetical
(5% return before expenses) | | $ | 1,000.00 | | | $ | 1,023.13 | | | $ | 2.03 | | | |
| |
| |
| | | | | | | | | | | | | | | |
| | | | | | | | | | | | | | | |
| | | Beginning Account Value
| | Ending Account Value
| | Expenses Paid During Period
| | |
| Expense Example – Class C Shares | | (7/1/11) | | (12/31/11) | | (7/1/11 - 12/31/11)† | | |
| |
| |
| Actual | | $ | 1,000.00 | | | $ | 975.00 | | | $ | 5.76 | | | |
| |
| |
Hypothetical
(5% return before expenses) | | $ | 1,000.00 | | | $ | 1,019.31 | | | $ | 5.89 | | | |
| |
| |
| | | | | | | | | | | | | | | |
| | | | | | | | | | | | | | | |
| | | Beginning Account Value
| | Ending Account Value
| | Expenses Paid During Period
| | |
| Expense Example – Class D Shares | | (7/1/11) | | (12/31/11) | | (7/1/11 - 12/31/11)† | | |
| |
| |
| Actual | | $ | 1,000.00 | | | $ | 979.10 | | | $ | 1.14 | | | |
| |
| |
Hypothetical
(5% return before expenses) | | $ | 1,000.00 | | | $ | 1,023.98 | | | $ | 1.17 | | | |
| |
| |
| | | | | | | | | | | | | | | |
| | | | | | | | | | | | | | | |
| | | Beginning Account Value
| | Ending Account Value
| | Expenses Paid During Period
| | |
| Expense Example – Class I Shares | | (7/1/11) | | (12/31/11) | | (7/1/11 - 12/31/11)† | | |
| |
| |
| Actual | | $ | 1,000.00 | | | $ | 979.10 | | | $ | 0.90 | | | |
| |
| |
Hypothetical
(5% return before expenses) | | $ | 1,000.00 | | | $ | 1,024.23 | | | $ | 0.92 | | | |
| |
| |
| | | | | | | | | | | | | | | |
| | | | | | | | | | | | | | | |
| | | Beginning Account Value
| | Ending Account Value
| | Expenses Paid During Period
| | |
| Expense Example – Class S Shares | | (7/1/11) | | (12/31/11) | | (7/1/11 - 12/31/11)† | | |
| |
| |
| Actual | | $ | 1,000.00 | | | $ | 976.90 | | | $ | 2.98 | | | |
| |
| |
Hypothetical
(5% return before expenses) | | $ | 1,000.00 | | | $ | 1,022.12 | | | $ | 3.05 | | | |
| |
| |
| | | | | | | | | | | | | | | |
| | | | | | | | | | | | | | | |
| | | Beginning Account Value
| | Ending Account Value
| | Expenses Paid During Period
| | |
| Expense Example – Class T Shares | | (7/1/11) | | (12/31/11) | | (7/1/11 - 12/31/11)† | | |
| |
| |
| Actual | | $ | 1,000.00 | | | $ | 978.00 | | | $ | 1.74 | | | |
| |
| |
Hypothetical
(5% return before expenses) | | $ | 1,000.00 | | | $ | 1,023.38 | | | $ | 1.78 | | | |
| |
| |
| | | |
| † | | Expenses are equal to the annualized expense ratio of 0.40% for Class A Shares, 1.16% for Class C Shares, 0.23% for Class D Shares, 0.18% for Class I Shares, 0.60% for Class S Shares and 0.35% for Class T Shares multiplied by the average account value over the period, multiplied by 184/366 (to reflect the one-half year period). Expenses include effect of contractual waivers by Janus Capital. |
Janus Asset Allocation Funds | 23
Janus Conservative Allocation Fund
Schedule of Investments (unaudited)
As of December 31, 2011
| | | | | | | | | | | |
| Shares | | Value | | | |
| |
Mutual Funds(1) – 100.0% | | | | | | |
| Equity Funds – 39.4% | | | | | | |
| | 594,343 | | | INTECH International Fund(2) – Class I Shares | | $ | 3,910,774 | | | |
| | 978,228 | | | INTECH U.S. Growth Fund(3) – Class I Shares | | | 12,716,960 | | | |
| | 1,931,035 | | | INTECH U.S. Value Fund(4) – Class I Shares | | | 18,344,833 | | | |
| | 582 | | | Janus Contrarian Fund – Class I Shares | | | 7,166 | | | |
| | 137,828 | | | Janus Fund – Class I Shares | | | 3,759,945 | | | |
| | 223,819 | | | Janus Global Real Estate Fund – Class I Shares | | | 1,786,075 | | | |
| | 35,786 | | | Janus Global Select Fund – Class I Shares | | | 345,338 | | | |
| | 32,728 | | | Janus Growth and Income Fund – Class I Shares | | | 974,299 | | | |
| | 1,103,601 | | | Janus International Equity Fund – Class I Shares | | | 10,660,782 | | | |
| | 127,460 | | | Janus Overseas Fund – Class I Shares | | | 4,016,281 | | | |
| | 300,926 | | | Janus Research Fund – Class I Shares | | | 8,450,011 | | | |
| | 239,934 | | | Janus Triton Fund – Class I Shares | | | 3,918,129 | | | |
| | 1,234,298 | | | Perkins Large Cap Value Fund – Class I Shares | | | 15,527,473 | | | |
| | 85,631 | | | Perkins Small Cap Value Fund – Class I Shares | | | 1,746,881 | | | |
| | | | | | | | 86,164,947 | | | |
| Fixed Income Funds – 60.6% | | | | | | |
| | 11,053,603 | | | Janus Flexible Bond Fund – Class I Shares | | | 116,504,970 | | | |
| | 116,657 | | | Janus High-Yield Fund – Class I Shares | | | 1,019,584 | | | |
| | 4,857,886 | | | Janus Short-Term Bond Fund – Class I Shares | | | 14,816,553 | | | |
| | | | | | | | 132,341,107 | | | |
| |
| |
| Total Investments (total cost $208,872,026) – 100.0% | | | 218,506,054 | | | |
| |
| |
| Liabilities, net of Cash, Receivables and Other Assets– (0.0)% | | | (31,636) | | | |
| |
| |
| Net Assets – 100% | | $ | 218,474,418 | | | |
| |
| |
| | | |
| (1) | | The Fund invests in mutual funds within the Janus family of funds and they may be deemed to be under common control because they share the same Board of Trustees. |
| (2) | | Formerly named INTECH Risk-Managed International Fund. |
| (3) | | Formerly named INTECH Risk-Managed Growth Fund. |
| (4) | | Formerly named INTECH Risk-Managed Value Fund. |
See Notes to Schedules of Investments and Financial Statements.
24 | DECEMBER 31, 2011
Statements of Assets and Liabilities
| | | | | | | | | | | | | |
As of December 31, 2011 (unaudited)
| | Janus Growth
| | Janus Moderate
| | Janus Conservative
|
| (all numbers in thousands except net asset value per share) | | Allocation Fund | | Allocation Fund | | Allocation Fund |
|
| |
| Assets: | | | | | | | | | | | | |
| Investments at cost | | $ | 210,105 | | | $ | 243,893 | | | $ | 208,872 | |
| Affiliated investments at value | | | 219,834 | | | | 256,405 | | | | 218,506 | |
| Receivables: | | | | | | | | | | | | |
| Investments sold | | | 199 | | | | – | | | | 200 | |
| Fund shares sold | | | 345 | | | | 1,070 | | | | 504 | |
| Dividends | | | 138 | | | | 321 | | | | 415 | |
| Non-interested Trustees’ deferred compensation | | | 6 | | | | 8 | | | | 6 | |
| Other assets | | | 4 | | | | 4 | | | | 4 | |
| Total Assets | | | 220,526 | | | | 257,808 | | | | 219,635 | |
| Liabilities: | | | | | | | | | | | | |
| Payables: | | | | | | | | | | | | |
| Investments purchased | | | 137 | | | | 1,169 | | | | 415 | |
| Fund shares repurchased | | | 508 | | | | 174 | | | | 661 | |
| Dividends | | | – | | | | – | | | | – | |
| Advisory fees | | | 9 | | | | 11 | | | | 9 | |
| Administrative services fees | | | 23 | | | | 26 | | | | 22 | |
| Distribution fees and shareholder servicing fees | | | 4 | | | | 8 | | | | 11 | |
| Administrative, networking and omnibus fees | | | – | | | | 1 | | | | – | |
| Non-interested Trustees’ fees and expenses | | | 3 | | | | 2 | | | | 2 | |
| Non-interested Trustees’ deferred compensation fees | | | 6 | | | | 8 | | | | 6 | |
| Accrued expenses and other payables | | | 93 | | | | 50 | | | | 35 | |
| Total Liabilities | | | 783 | | | | 1,449 | | | | 1,161 | |
| Net Assets | | $ | 219,743 | | | $ | 256,359 | | | $ | 218,474 | |
| Net Assets Consist of: | | | | | | | | | | | | |
| Capital (par value and paid-in surplus)* | | $ | 228,526 | | | $ | 251,901 | | | $ | 211,585 | |
| Undistributed net investment income* | | | 53 | | | | 113 | | | | 131 | |
| Undistributed net realized loss from investment and foreign currency transactions* | | | (18,564) | | | | (8,167) | | | | (2,876) | |
| Unrealized net appreciation of investments, foreign currency translations and non-interested Trustees’ deferred compensation | | | 9,728 | | | | 12,512 | | | | 9,634 | |
| Total Net Assets | | $ | 219,743 | | | $ | 256,359 | | | $ | 218,474 | |
| Net Assets - Class A Shares | | $ | 2,569 | | | $ | 5,558 | | | $ | 6,695 | |
| Shares Outstanding, $0.01 Par Value (unlimited shares authorized) | | | 231 | | | | 480 | | | | 569 | |
| Net Asset Value Per Share(1) | | $ | 11.14 | | | $ | 11.57 | | | $ | 11.76 | |
| Maximum Offering Price Per Share(2) | | $ | 11.82 | | | $ | 12.28 | | | $ | 12.48 | |
| Net Assets - Class C Shares | | $ | 3,179 | | | $ | 7,940 | | | $ | 11,017 | |
| Shares Outstanding, $0.01 Par Value (unlimited shares authorized) | | | 288 | | | | 694 | | | | 947 | |
| Net Asset Value Per Share(1) | | $ | 11.03 | | | $ | 11.44 | | | $ | 11.63 | |
| Net Assets - Class D Shares | | $ | 198,671 | | | $ | 216,651 | | | $ | 179,914 | |
| Shares Outstanding, $0.01 Par Value (unlimited shares authorized) | | | 17,746 | | | | 18,651 | | | | 15,237 | |
| Net Asset Value Per Share | | $ | 11.19 | | | $ | 11.62 | | | $ | 11.81 | |
| Net Assets - Class I Shares | | $ | 2,040 | | | $ | 4,980 | | | $ | 2,229 | |
| Shares Outstanding, $0.01 Par Value (unlimited shares authorized) | | | 182 | | | | 429 | | | | 189 | |
| Net Asset Value Per Share | | $ | 11.19 | | | $ | 11.61 | | | $ | 11.80 | |
| Net Assets - Class S Shares | | $ | 1,106 | | | $ | 1,130 | | | $ | 1,031 | |
| Shares Outstanding, $0.01 Par Value (unlimited shares authorized) | | | 100 | | | | 98 | | | | 88 | |
| Net Asset Value Per Share | | $ | 11.11 | | | $ | 11.52 | | | $ | 11.74 | |
| Net Assets - Class T Shares | | $ | 12,178 | | | $ | 20,100 | | | $ | 17,588 | |
| Shares Outstanding, $0.01 Par Value (unlimited shares authorized) | | | 1,088 | | | | 1,732 | | | | 1,491 | |
| Net Asset Value Per Share | | $ | 11.19 | | | $ | 11.60 | | | $ | 11.79 | |
| | | |
| * | | See Note 5 in Notes to Financial Statements. |
| (1) | | Redemption price per share may be reduced for any applicable contingent deferred sales charge. |
| (2) | | Maximum offering price is computed at 100/94.25 of net asset value. |
See Notes to Financial Statements.
Janus Asset Allocation Funds | 25
Statements of Operations
| | | | | | | | | | | | | |
For the six-month period ended December 31, 2011 (unaudited)
| | Janus Growth
| | Janus Moderate
| | Janus Conservative
|
| (all numbers in thousands) | | Allocation Fund | | Allocation Fund | | Allocation Fund |
|
| |
| Investment Income: | | | | | | | | | | | | |
| Dividends from affiliates | | $ | 3,422 | | | $ | 4,500 | | | $ | 4,023 | |
| Total Investment Income | | | 3,422 | | | | 4,500 | | | | 4,023 | |
| Expenses: | | | | | | | | | | | | |
| Advisory fees | | | 57 | | | | 64 | | | | 53 | |
| Shareholder reports expense | | | 63 | | | | 42 | | | | 27 | |
| Transfer agent fees and expenses | | | 40 | | | | 29 | | | | 18 | |
| Professional fees | | | 15 | | | | 15 | | | | 15 | |
| Non-interested Trustees’ fees and expenses | | | 4 | | | | 4 | | | | 3 | |
| Administrative services fees - Class D Shares | | | 124 | | | | 132 | | | | 107 | |
| Administrative services fees - Class S Shares | | | 1 | | | | 1 | | | | 1 | |
| Administrative services fees - Class T Shares | | | 15 | | | | 25 | | | | 22 | |
| Distribution fees and shareholder servicing fees - Class A Shares | | | 3 | | | | 6 | | | | 7 | |
| Distribution fees and shareholder servicing fees - Class C Shares | | | 15 | | | | 38 | | | | 47 | |
| Distribution fees and shareholder servicing fees - Class S Shares | | | 1 | | | | 1 | | | | 1 | |
| Administrative, networking and omnibus fees - Class A Shares | | | 1 | | | | 3 | | | | 1 | |
| Administrative, networking and omnibus fees - Class C Shares | | | 1 | | | | 2 | | | | 2 | |
| Administrative, networking and omnibus fees - Class I Shares | | | 1 | | | | 1 | | | | 1 | |
| Other expenses | | | 13 | | | | 14 | | | | 3 | |
| Total Expenses | | | 354 | | | | 377 | | | | 308 | |
| Expense and Fee Offset | | | (1) | | | | (1) | | | | (1) | |
| Net Expenses | | | 353 | | | | 376 | | | | 307 | |
| Net Investment Income | | | 3,069 | | | | 4,124 | | | | 3,716 | |
| Net Realized and Unrealized Gain/(Loss) on Investments: | | | | | | | | | | | | |
| Net realized loss from investment and foreign currency transactions(1) | | | (1,462) | | | | (1,246) | | | | (464) | |
| Capital gain distributions from Underlying Funds | | | 4,609 | | | | 4,150 | | | | 2,458 | |
| Change in unrealized net appreciation/(depreciation) of investments, foreign currency translations and non-interested Trustees’ deferred compensation | | | (28,905) | | | | (22,596) | | | | (10,062) | |
| Net Loss on Investments | | | (25,758) | | | | (19,692) | | | | (8,068) | |
| Net Decrease in Net Assets Resulting from Operations | | $ | (22,689) | | | $ | (15,568) | | | $ | (4,352) | |
| | | |
| (1) | | Includes realized gain/(loss) from affiliated investment companies. See Note 4 in Notes to Financial Statements. |
See Notes to Financial Statements.
26 | DECEMBER 31, 2011
[This page intentionally left blank.]
Janus Asset Allocation Funds | 27
Statements of Changes in Net Assets
| | | | | | | | | | | | | | | | | | | | | | | | | |
For the six-month period ended December 31, 2011 (unaudited) and
| | Janus Growth
| | Janus Moderate
| | Janus Conservative
|
the fiscal year ended June 30, 2011
| | Allocation Fund | | Allocation Fund | | Allocation Fund |
| (all numbers in thousands) | | 2011 | | 2011 | | 2011 | | 2011 | | 2011 | | 2011 |
|
| |
| Operations: | | | | | | | | | | | | | | | | | | | | | | | | |
| Net investment income | | $ | 3,069 | | | $ | 3,989 | | | $ | 4,124 | | | $ | 6,880 | | | $ | 3,716 | | | $ | 7,217 | |
Net realized gain/(loss) from investment and foreign currency transactions(1) | | | (1,462) | | | | (936) | | | | (1,246) | | | | 1,392 | | | | (464) | | | | 2,632 | |
| Capital gain distribution from Underlying Funds | | | 4,609 | | | | 343 | | | | 4,150 | | | | 404 | | | | 2,458 | | | | 165 | |
| Change in unrealized net appreciation/(depreciation) of investments, foreign currency translations and non-interested Trustees’ deferred compensation | | | (28,905) | | | | 39,171 | | | | (22,596) | | | | 28,159 | | | | (10,062) | | | | 12,466 | |
| Net Increase/(Decrease) in Net Assets Resulting from Operations | | | (22,689) | | | | 42,567 | | | | (15,568) | | | | 36,835 | | | | (4,352) | | | | 22,480 | |
| Dividends and Distributions to Shareholders: | | | | | | | | | | | | | | | | | | | | | | | | |
| Net Investment Income* | | | | | | | | | | | | | | | | | | | | | | | | |
| Class A Shares | | | (43) | | | | (33) | | | | (133) | | | | (109) | | | | (183) | | | | (98) | |
| Class C Shares | | | (46) | | | | (14) | | | | (174) | | | | (101) | | | | (298) | | | | (117) | |
| Class D Shares | | | (3,561) | | | | (3,582) | | | | (5,406) | | | | (5,283) | | | | (5,317) | | | | (5,454) | |
| Class I Shares | | | (35) | | | | (38) | | | | (118) | | | | (63) | | | | (66) | | | | (43) | |
| Class S Shares | | | (18) | | | | (11) | | | | (27) | | | | (11) | | | | (28) | | | | (12) | |
| Class T Shares | | | (212) | | | | (176) | | | | (477) | | | | (425) | | | | (524) | | | | (395) | |
| Net Realized Gain/(Loss) from Investment Transactions* | | | | | | | | | | | | | | | | | | | | | | | | |
| Class A Shares | | | – | | | | – | | | | – | | | | – | | | | – | | | | – | |
| Class C Shares | | | – | | | | – | | | | – | | | | – | | | | – | | | | – | |
| Class D Shares | | | – | | | | – | | | | – | | | | – | | | | – | | | | – | |
| Class I Shares | | | – | | | | – | | | | – | | | | – | | | | – | | | | – | |
| Class S Shares | | | – | | | | – | | | | – | | | | – | | | | – | | | | – | |
| Class T Shares | | | – | | | | – | | | | – | | | | – | | | | – | | | | – | |
| Net Decrease from Dividends and Distributions | | | (3,915) | | | | (3,854) | | | | (6,335) | | | | (5,992) | | | | (6,416) | | | | (6,119) | |
See footnotes at the end of the Statements.
See Notes to Financial Statements.
28 | DECEMBER 31, 2011
This page intentionally left blank. The content of this page is part of a ‘Double Page Spread’ table and appears on the previous page.
29
Statements of Changes in Net Assets (continued)
| | | | | | | | | | | | | | | | | | | | | | | | | |
For the six-month period ended December 31, 2011 (unaudited) and
| | Janus Growth
| | Janus Moderate
| | Janus Conservative
|
the fiscal year ended June 30, 2011
| | Allocation Fund | | Allocation Fund | | Allocation Fund |
| (all numbers in thousands) | | 2011 | | 2011 | | 2011 | | 2011 | | 2011 | | 2011 |
|
| |
| Capital Share Transactions: | | | | | | | | | | | | | | | | | | | | | | | | |
| Shares Sold | | | | | | | | | | | | | | | | | | | | | | | | |
| Class A Shares | | | 562 | | | | 2,555 | | | | 1,458 | | | | 4,264 | | | | 3,804 | | | | 4,529 | |
| Class C Shares | | | 966 | | | | 1,945 | | | | 1,671 | | | | 5,450 | | | | 4,740 | | | | 6,614 | |
| Class D Shares | | | 13,377 | | | | 44,297 | | | | 18,316 | | | | 65,374 | | | | 34,082 | | | | 64,235 | |
| Class I Shares | | | 203 | | | | 894 | | | | 1,760 | | | | 4,559 | | | | 367 | | | | 2,155 | |
| Class S Shares | | | 630 | | | | 704 | | | | 956 | | | | 491 | | | | 678 | | | | 390 | |
| Class T Shares | | | 2,851 | | | | 4,536 | | | | 4,035 | | | | 15,083 | | | | 7,071 | | | | 10,977 | |
| Reinvested Dividends and Distributions | | | | | | | | | | | | | | | | | | | | | | | | |
| Class A Shares | | | 43 | | | | 33 | | | | 124 | | | | 97 | | | | 166 | | | | 82 | |
| Class C Shares | | | 44 | | | | 13 | | | | 158 | | | | 92 | | | | 252 | | | | 84 | |
| Class D Shares | | | 3,532 | | | | 3,549 | | | | 5,361 | | | | 5,232 | | | | 5,284 | | | | 5,412 | |
| Class I Shares | | | 33 | | | | 37 | | | | 116 | | | | 62 | | | | 61 | | | | 42 | |
| Class S Shares | | | 18 | | | | 11 | | | | 27 | | | | 11 | | | | 27 | | | | 12 | |
| Class T Shares | | | 207 | | | | 167 | | | | 468 | | | | 420 | | | | 480 | | | | 348 | |
| Shares Repurchased | | | | | | | | | | | | | | | | | | | | | | | | |
| Class A Shares | | | (499) | | | | (609) | | | | (1,087) | | | | (1,056) | | | | (1,833) | | | | (1,160) | |
| Class C Shares | | | (238) | | | | (79) | | | | (827) | | | | (962) | | | | (1,308) | | | | (802) | |
| Class D Shares | | | (21,251) | | | | (43,805) | | | | (26,289) | | | | (40,738) | | | | (27,469) | | | | (40,362) | |
| Class I Shares | | | (265) | | | | (918) | | | | (1,033) | | | | (2,072) | | | | (584) | | | | (332) | |
| Class S Shares | | | (174) | | | | (63) | | | | (219) | | | | (184) | | | | (159) | | | | (32) | |
| Class T Shares | | | (1,895) | | | | (4,666) | | | | (3,013) | | | | (7,251) | | | | (5,734) | | | | (5,782) | |
| Net Increase/(Decrease) from Capital Share Transactions | | | (1,856) | | | | 8,601 | | | | 1,982 | | | | 48,872 | | | | 19,925 | | | | 46,410 | |
| Net Increase/(Decrease) in Net Assets | | | (28,460) | | | | 47,314 | | | | (19,921) | | | | 79,715 | | | | 9,157 | | | | 62,771 | |
| Net Assets: | | | | | | | | | | | | | | | | | | | | | | | | |
| Beginning of period | | | 248,203 | | | | 200,889 | | | | 276,280 | | | | 196,565 | | | | 209,317 | | | | 146,546 | |
| End of period | | $ | 219,743 | | | $ | 248,203 | | | $ | 256,359 | | | $ | 276,280 | | | $ | 218,474 | | | $ | 209,317 | |
| | | | | | | | | | | | | | | | | | | | | | | | | |
| Undistributed Net Investment Income* | | $ | 53 | | | $ | 900 | | | $ | 113 | | | $ | 2,324 | | | $ | 131 | | | $ | 2,832 | |
| | | |
| * | | See Note 5 in Notes to Financial Statements. |
| (1) | | Includes realized gain/(loss) from affiliated investment companies. See affiliates table in Notes to Schedules of Investments. |
| | | |
| | | |
See Notes to Financial Statements.
30 | DECEMBER 31, 2011
This page intentionally left blank. The content of this page is part of a ‘Double Page Spread’ table and appears on the previous page.
31
Financial Highlights
Class A Shares
| | | | | | | | | | | | | | | | | | | |
For a share outstanding during the six-month period ended December 31, 2011
| | | | | | | | | | |
(unaudited), the fiscal year ended June 30, 2011, the eight-month fiscal period ended
| | Janus Growth Allocation Fund | | |
| June 30, 2010 and the fiscal period ended October 31, 2009 | | 2011 | | 2011 | | 2010(1) | | 2009(2) | | |
| |
| Net Asset Value, Beginning of Period | | | $12.49 | | | | $10.47 | | | | $10.35 | | | | $9.16 | | | |
| Income from Investment Operations: | | | | | | | | | | | | | | | | | | |
| Net investment income | | | .15 | | | | .19 | | | | .17 | | | | .01 | | | |
| Net gain/(loss) on investments (both realized and unrealized) | | | (1.31) | | | | 2.04 | | | | .14 | | | | 1.18 | | | |
| Total from Investment Operations | | | (1.16) | | | | 2.23 | | | | .31 | | | | 1.19 | | | |
| Less Distributions: | | | | | | | | | | | | | | | | | | |
| Dividends (from net investment income)* | | | (.19) | | | | (.21) | | | | (.19) | | | | – | | | |
| Distributions (from capital gains)* | | | – | | | | – | | | | – | | | | – | | | |
| Total Distributions | | | (.19) | | | | (.21) | | | | (.19) | | | | – | | | |
| Net Asset Value, End of Period | | | $11.14 | | | | $12.49 | | | | $10.47 | | | | $10.35 | | | |
| Total Return** | | | (9.25)% | | | | 21.38% | | | | 2.96% | | | | 12.99% | | | |
| Net Assets, End of Period (in thousands) | | | $2,569 | | | | $2,768 | | | | $628 | | | | $149 | | | |
| Average Net Assets for the Period (in thousands) | | | $2,570 | | | | $1,640 | | | | $343 | | | | $99 | | | |
Ratio of Gross Expenses to Average Net Assets***(3)(4) | | | 0.44% | | | | 0.44% | | | | 0.37% | | | | 0.50% | | | |
Ratio of Net Expenses to Average Net Assets***(3)(4) | | | 0.44% | | | | 0.44% | | | | 0.37% | | | | 0.47% | | | |
| Ratio of Net Investment Income to Average Net Assets*** | | | 2.66% | | | | 1.61% | | | | 0.92% | | | | 0.56% | | | |
| Portfolio Turnover Rate*** | | | 21% | | | | 26% | | | | 20% | | | | 23% | | | |
Class A Shares
| | | | | | | | | | | | | | | | | | | |
For a share outstanding during the six-month period ended December 31, 2011
| | | | | | | | | | |
(unaudited), the fiscal year ended June 30, 2011, the eight-month fiscal period ended
| | Janus Moderate Allocation Fund | | |
| June 30, 2010 and the fiscal period ended October 31, 2009 | | 2011 | | 2011 | | 2010(1) | | 2009(2) | | |
| |
| Net Asset Value, Beginning of Period | | | $12.57 | | | | $10.95 | | | | $10.80 | | | | $9.68 | | | |
| Income from Investment Operations: | | | | | | | | | | | | | | | | | | |
| Net investment income | | | .19 | | | | .34 | | | | .18 | | | | .02 | | | |
| Net gain/(loss) on investments (both realized and unrealized) | | | (.90) | | | | 1.58 | | | | .24 | | | | 1.10 | | | |
| Total from Investment Operations | | | (.71) | | | | 1.92 | | | | .42 | | | | 1.12 | | | |
| Less Distributions: | | | | | | | | | | | | | | | | | | |
| Dividends (from net investment income)* | | | (.29) | | | | (.30) | | | | (.27) | | | | – | | | |
| Distributions (from capital gains)* | | | – | | | | – | | | | – | | | | – | | | |
| Total Distributions | | | (.29) | | | | (.30) | | | | (.27) | | | | – | | | |
| Net Asset Value, End of Period | | | $11.57 | | | | $12.57 | | | | $10.95 | | | | $10.80 | | | |
| Total Return** | | | (5.63)% | | | | 17.59% | | | | 3.81% | | | | 11.57% | | | |
| Net Assets, End of Period (in thousands) | | | $5,558 | | | | $5,498 | | | | $1,844 | | | | $1,145 | | | |
| Average Net Assets for the Period (in thousands) | | | $5,086 | | | | $3,818 | | | | $1,676 | | | | $424 | | | |
Ratio of Gross Expenses to Average Net Assets***(3)(4) | | | 0.47% | | | | 0.50% | | | | 0.40% | | | | 0.48% | | | |
Ratio of Net Expenses to Average Net Assets***(3)(4) | | | 0.47% | | | | 0.50% | | | | 0.40% | | | | 0.44% | | | |
| Ratio of Net Investment Income to Average Net Assets*** | | | 3.19% | | | | 2.88% | | | | 1.82% | | | | 1.43% | | | |
| Portfolio Turnover Rate*** | | | 21% | | | | 15% | | | | 17% | | | | 19% | | | |
| | | |
| * | | See Note 5 in Notes to Financial Statements. |
| ** | | Total return not annualized for periods of less than one full year. |
| *** | | Annualized for periods of less than one full year. |
| (1) | | Period from November 1, 2009 through June 30, 2010. The Fund changed its fiscal year end from October 31 to June 30. |
| (2) | | Period from July 6, 2009 (inception date) through October 31, 2009. |
| (3) | | See Note 6 in Notes to Financial Statements. |
| (4) | | Ratios do not include expenses of the underlying funds and/or investment companies in which the Fund invests. |
See Notes to Financial Statements.
32 | DECEMBER 31, 2011
Class A Shares
| | | | | | | | | | | | | | | | | | | |
For a share outstanding during the six-month period ended December 31, 2011
| | | | | | | | | | |
(unaudited), the fiscal year ended June 30, 2011, the eight-month fiscal period ended
| | Janus Conservative Allocation Fund | | |
| June 30, 2010 and the fiscal period ended October 31, 2009 | | 2011 | | 2011 | | 2010(1) | | 2009(2) | | |
| |
| Net Asset Value, Beginning of Period | | | $12.38 | | | | $11.24 | | | | $11.08 | | | | $10.13 | | | |
| Income from Investment Operations: | | | | | | | | | | | | | | | | | | |
| Net investment income | | | .19 | | | | .47 | | | | .33 | | | | .02 | | | |
| Net gain/(loss) on investments (both realized and unrealized) | | | (.46) | | | | 1.10 | | | | .20 | | | | .93 | | | |
| Total from Investment Operations | | | (.27) | | | | 1.57 | | | | .53 | | | | .95 | | | |
| Less Distributions: | | | | | | | | | | | | | | | | | | |
| Dividends (from net investment income)* | | | (.35) | | | | (.43) | | | | (.37) | | | | – | | | |
| Distributions (from capital gains)* | | | – | | | | – | | | | – | | | | – | | | |
| Total Distributions | | | (.35) | | | | (.43) | | | | (.37) | | | | – | | | |
| Net Asset Value, End of Period | | | $11.76 | | | | $12.38 | | | | $11.24 | | | | $11.08 | | | |
| Total Return** | | | (2.17)% | | | | 14.08% | | | | 4.75% | | | | 9.38% | | | |
| Net Assets, End of Period (in thousands) | | | $6,695 | | | | $4,804 | | | | $1,173 | | | | $235 | | | |
| Average Net Assets for the Period (in thousands) | | | $5,356 | | | | $2,950 | | | | $710 | | | | $41 | | | |
Ratio of Gross Expenses to Average Net Assets***(3)(4) | | | 0.40% | | | | 0.38% | | | | 0.39% | | | | 0.45% | | | |
Ratio of Net Expenses to Average Net Assets***(3)(4) | | | 0.40% | | | | 0.38% | | | | 0.39% | | | | 0.37% | | | |
| Ratio of Net Investment Income to Average Net Assets*** | | | 3.59% | | | | 3.79% | | | | 2.67% | | | | 2.70% | | | |
| Portfolio Turnover Rate*** | | | 10% | | | | 12% | | | | 18% | | | | 21% | | | |
| | | |
| * | | See Note 5 in Notes to Financial Statements. |
| ** | | Total return not annualized for periods of less than one full year. |
| *** | | Annualized for periods of less than one full year. |
| (1) | | Period from November 1, 2009 through June 30, 2010. The Fund changed its fiscal year end from October 31 to June 30. |
| (2) | | Period from July 6, 2009 (inception date) through October 31, 2009. |
| (3) | | See Note 6 in Notes to Financial Statements. |
| (4) | | Ratios do not include expenses of the underlying funds and/or investment companies in which the Fund invests. |
See Notes to Financial Statements.
Janus Asset Allocation Funds | 33
Financial Highlights (continued)
Class C Shares
| | | | | | | | | | | | | | | | | | | |
For a share outstanding during the six-month period ended December 31, 2011
| | | | | | | | | | |
(unaudited), the fiscal year ended June 30, 2011, the eight-month fiscal period ended
| | Janus Growth Allocation Fund | | |
| June 30, 2010 and the fiscal period ended October 31, 2009 | | 2011 | | 2011 | | 2010(1) | | 2009(2) | | |
| |
| Net Asset Value, Beginning of Period | | | $12.37 | | | | $10.40 | | | | $10.33 | | | | $9.16 | | | |
| Income from Investment Operations: | | | | | | | | | | | | | | | | | | |
| Net investment income | | | .12 | | | | .16 | | | | .13 | | | | – | | | |
| Net gain/(loss) on investments (both realized and unrealized) | | | (1.30) | | | | 1.96 | | | | .13 | | | | 1.17 | | | |
| Total from Investment Operations | | | (1.18) | | | | 2.12 | | | | .26 | | | | 1.17 | | | |
| Less Distributions: | | | | | | | | | | | | | | | | | | |
| Dividends (from net investment income)* | | | (.16) | | | | (.15) | | | | (.19) | | | | – | | | |
| Distributions (from capital gains)* | | | – | | | | – | | | | – | | | | – | | | |
| Total Distributions | | | (.16) | | | | (.15) | | | | (.19) | | | | – | | | |
| Net Asset Value, End of Period | | | $11.03 | | | | $12.37 | | | | $10.40 | | | | $10.33 | | | |
| Total Return** | | | (9.50)% | | | | 20.39% | | | | 2.41% | | | | 12.77% | | | |
| Net Assets, End of Period (in thousands) | | | $3,179 | | | | $2,736 | | | | $706 | | | | $110 | | | |
| Average Net Assets for the Period (in thousands) | | | $3,047 | | | | $1,446 | | | | $398 | | | | $20 | | | |
Ratio of Gross Expenses to Average Net Assets***(3)(4) | | | 1.20% | | | | 1.21% | | | | 1.13% | | | | 1.37% | | | |
Ratio of Net Expenses to Average Net Assets***(3)(4) | | | 1.20% | | | | 1.21% | | | | 1.13% | | | | 1.26% | | | |
| Ratio of Net Investment Income/(Loss) to Average Net Assets*** | | | 1.98% | | | | 0.51% | | | | 0.27% | | | | (0.18)% | | | |
| Portfolio Turnover Rate*** | | | 21% | | | | 26% | | | | 20% | | | | 23% | | | |
Class C Shares
| | | | | | | | | | | | | | | | | | | |
For a share outstanding during the six-month period ended December 31, 2011
| | | | | | | | | | |
(unaudited), the fiscal year ended June 30, 2011, the eight-month fiscal period ended
| | Janus Moderate Allocation Fund | | |
| June 30, 2010 and the fiscal period ended October 31, 2009 | | 2011 | | 2011 | | 2010(1) | | 2009(2) | | |
| |
| Net Asset Value, Beginning of Period | | | $12.46 | | | | $10.88 | | | | $10.77 | | | | $9.68 | | | |
| Income from Investment Operations: | | | | | | | | | | | | | | | | | | |
| Net investment income | | | .15 | | | | .26 | | | | .21 | | | | .01 | | | |
| Net gain/(loss) on investments (both realized and unrealized) | | | (.90) | | | | 1.57 | | | | .15 | | | | 1.08 | | | |
| Total from Investment Operations | | | (.75) | | | | 1.83 | | | | .36 | | | | 1.09 | | | |
| Less Distributions: | | | | | | | | | | | | | | | | | | |
| Dividends (from net investment income)* | | | (.27) | | | | (.25) | | | | (.25) | | | | – | | | |
| Distributions (from capital gains)* | | | – | | | | – | | | | – | | | | – | | | |
| Total Distributions | | | (.27) | | | | (.25) | | | | (.25) | | | | – | | | |
| Net Asset Value, End of Period | | | $11.44 | | | | $12.46 | | | | $10.88 | | | | $10.77 | | | |
| Total Return** | | | (6.04)% | | | | 16.86% | | | | 3.33% | | | | 11.26% | | | |
| Net Assets, End of Period (in thousands) | | | $7,940 | | | | $7,572 | | | | $2,509 | | | | $406 | | | |
| Average Net Assets for the Period (in thousands) | | | $7,560 | | | | $5,021 | | | | $1,469 | | | | $113 | | | |
Ratio of Gross Expenses to Average Net Assets***(3)(4) | | | 1.17% | | | | 1.16% | | | | 1.16% | | | | 1.26% | | | |
Ratio of Net Expenses to Average Net Assets***(3)(4) | | | 1.17% | | | | 1.16% | | | | 1.16% | | | | 1.20% | | | |
| Ratio of Net Investment Income/(Loss) to Average Net Assets*** | | | 2.36% | | | | 1.85% | | | | 0.87% | | | | 0.71% | | | |
| Portfolio Turnover Rate*** | | | 21% | | | | 15% | | | | 17% | | | | 19% | | | |
| | | |
| * | | See Note 5 in Notes to Financial Statements. |
| ** | | Total return not annualized for periods of less than one full year. |
| *** | | Annualized for periods of less than one full year. |
| (1) | | Period from November 1, 2009 through June 30, 2010. The Fund changed its fiscal year end from October 31 to June 30. |
| (2) | | Period from July 6, 2009 (inception date) through October 31, 2009. |
| (3) | | See Note 6 in Notes to Financial Statements. |
| (4) | | Ratios do not include expenses of the underlying funds and/or investment companies in which the Fund invests. |
See Notes to Financial Statements.
34 | DECEMBER 31, 2011
Class C Shares
| | | | | | | | | | | | | | | | | | | |
For a share outstanding during the six-month period ended December 31, 2011
| | | | | | | | | | |
(unaudited), the fiscal year ended June 30, 2011, the eight-month fiscal period ended
| | Janus Conservative Allocation Fund | | |
| June 30, 2010 and the fiscal period ended October 31, 2009 | | 2011 | | 2011 | | 2010(1) | | 2009(2) | | |
| |
| Net Asset Value, Beginning of Period | | | $12.26 | | | | $11.17 | | | | $11.06 | | | | $10.13 | | | |
| Income from Investment Operations: | | | | | | | | | | | | | | | | | | |
| Net investment income | | | .15 | | | | .40 | | | | .32 | | | | .01 | | | |
| Net gain/(loss) on investments (both realized and unrealized) | | | (.46) | | | | 1.07 | | | | .14 | | | | .92 | | | |
| Total from Investment Operations | | | (.31) | | | | 1.47 | | | | .46 | | | | .93 | | | |
| Less Distributions: | | | | | | | | | | | | | | | | | | |
| Dividends (from net investment income)* | | | (.32) | | | | (.38) | | | | (.35) | | | | – | | | |
| Distributions (from capital gains)* | | | – | | | | – | | | | – | | | | – | | | |
| Total Distributions | | | (.32) | | | | (.38) | | | | (.35) | | | | – | | | |
| Net Asset Value, End of Period | | | $11.63 | | | | $12.26 | | | | $11.17 | | | | $11.06 | | | |
| Total Return** | | | (2.50)% | | | | 13.25% | | | | 4.17% | | | | 9.18% | | | |
| Net Assets, End of Period (in thousands) | | | $11,017 | | | | $7,808 | | | | $1,648 | | | | $253 | | | |
| Average Net Assets for the Period (in thousands) | | | $9,350 | | | | $4,096 | | | | $953 | | | | $54 | | | |
Ratio of Gross Expenses to Average Net Assets***(3)(4) | | | 1.16% | | | | 1.14% | | | | 1.14% | | | | 1.20% | | | |
Ratio of Net Expenses to Average Net Assets***(3)(4) | | | 1.16% | | | | 1.14% | | | | 1.14% | | | | 1.13% | | | |
| Ratio of Net Investment Income to Average Net Assets*** | | | 2.87% | | | | 2.98% | | | | 1.81% | | | | 1.87% | | | |
| Portfolio Turnover Rate*** | | | 10% | | | | 12% | | | | 18% | | | | 21% | | | |
| | | |
| * | | See Note 5 in Notes to Financial Statements. |
| ** | | Total return not annualized for periods of less than one full year. |
| *** | | Annualized for periods of less than one full year. |
| (1) | | Period from November 1, 2009 through June 30, 2010. The Fund changed its fiscal year end from October 31 to June 30. |
| (2) | | Period from July 6, 2009 (inception date) through October 31, 2009. |
| (3) | | See Note 6 in Notes to Financial Statements. |
| (4) | | Ratios do not include expenses of the underlying funds and/or investment companies in which the Fund invests. |
See Notes to Financial Statements.
Janus Asset Allocation Funds | 35
Financial Highlights (continued)
Class D Shares
| | | | | | | | | | | | | | | |
For a share outstanding during the six-month period ended December 31, 2011 (unaudited),
| | Janus Growth Allocation Fund | | |
| the fiscal year ended June 30, 2011 and the fiscal period ended June 30, 2010 | | 2011 | | 2011 | | 2010(1) | | |
| |
| Net Asset Value, Beginning of Period | | | $12.54 | | | | $10.49 | | | | $10.66 | | | |
| Income from Investment Operations: | | | | | | | | | | | | | | |
| Net investment income | | | .16 | | | | .21 | | | | .03 | | | |
| Net gain/(loss) on investments (both realized and unrealized) | | | (1.31) | | | | 2.05 | | | | (.20) | | | |
| Total from Investment Operations | | | (1.15) | | | | 2.26 | | | | (.17) | | | |
| Less Distributions: | | | | | | | | | | | | | | |
| Dividends (from net investment income)* | | | (.20) | | | | (.21) | | | | – | | | |
| Distributions (from capital gains)* | | | – | | | | – | | | | – | | | |
| Total Distributions | | | (.20) | | | | (.21) | | | | – | | | |
| Net Asset Value, End of Period | | | $11.19 | | | | $12.54 | | | | $10.49 | | | |
| Total Return** | | | (9.13)% | | | | 21.56% | | | | (1.59)% | | | |
| Net Assets, End of Period (in thousands) | | | $198,671 | | | | $227,179 | | | | $187,128 | | | |
| Average Net Assets for the Period (in thousands) | | | $204,989 | | | | $214,398 | | | | $199,596 | | | |
Ratio of Gross Expenses to Average Net Assets***(2)(3) | | | 0.29% | | | | 0.28% | | | | 0.27% | | | |
Ratio of Net Expenses to Average Net Assets***(2)(3) | | | 0.29% | | | | 0.28% | | | | 0.27% | | | |
| Ratio of Net Investment Income to Average Net Assets*** | | | 2.71% | | | | 1.74% | | | | 0.71% | | | |
| Portfolio Turnover Rate*** | | | 21% | | | | 26% | | | | 20% | | | |
Class D Shares
| | | | | | | | | | | | | | | |
For a share outstanding during the six-month period ended December 31, 2011 (unaudited),
| | Janus Moderate Allocation Fund | | |
| the fiscal year ended June 30, 2011 and the fiscal period ended June 30, 2010 | | 2011 | | 2011 | | 2010(1) | | |
| |
| Net Asset Value, Beginning of Period | | | $12.62 | | | | $10.96 | | | | $10.98 | | | |
| Income from Investment Operations: | | | | | | | | | | | | | | |
| Net investment income | | | .20 | | | | .34 | | | | .06 | | | |
| Net gain/(loss) on investments (both realized and unrealized) | | | (.90) | | | | 1.62 | | | | (.08) | | | |
| Total from Investment Operations | | | (.70) | | | | 1.96 | | | | (.02) | | | |
| Less Distributions: | | | | | | | | | | | | | | |
| Dividends (from net investment income)* | | | (.30) | | | | (.30) | | | | – | | | |
| Distributions (from capital gains)* | | | – | | | | – | | | | – | | | |
| Total Distributions | | | (.30) | | | | (.30) | | | | – | | | |
| Net Asset Value, End of Period | | | $11.62 | | | | $12.62 | | | | $10.96 | | | |
| Total Return** | | | (5.55)% | | | | 18.00% | | | | (0.18)% | | | |
| Net Assets, End of Period (in thousands) | | | $216,651 | | | | $238,030 | | | | $180,261 | | | |
| Average Net Assets for the Period (in thousands) | | | $218,785 | | | | $216,280 | | | | $184,405 | | | |
Ratio of Gross Expenses to Average Net Assets***(2)(3) | | | 0.25% | | | | 0.25% | | | | 0.27% | | | |
Ratio of Net Expenses to Average Net Assets***(2)(3) | | | 0.25% | | | | 0.25% | | | | 0.27% | | | |
| Ratio of Net Investment Income to Average Net Assets*** | | | 3.23% | | | | 2.83% | | | | 1.43% | | | |
| Portfolio Turnover Rate*** | | | 21% | | | | 15% | | | | 17% | | | |
| | | |
| * | | See Note 5 in Notes to Financial Statements. |
| ** | | Total return not annualized for periods of less than one full year. |
| *** | | Annualized for periods of less than one full year. |
| (1) | | Period from February 16, 2010 (inception date) through June 30, 2010. |
| (2) | | See Note 6 in Notes to Financial Statements. |
| (3) | | Ratios do not include expenses of the underlying funds and/or investment companies in which the Fund invests. |
See Notes to Financial Statements.
36 | DECEMBER 31, 2011
Class D Shares
| | | | | | | | | | | | | | | |
For a share outstanding during the six-month period ended December 31, 2011 (unaudited),
| | Janus Conservative Allocation Fund | | |
| the fiscal year ended June 30, 2011 and the fiscal period ended June 30, 2010 | | 2011 | | 2011 | | 2010(1) | | |
| |
| Net Asset Value, Beginning of Period | | | $12.43 | | | | $11.26 | | | | $11.13 | | | |
| Income from Investment Operations: | | | | | | | | | | | | | | |
| Net investment income | | | .21 | | | | .48 | | | | .10 | | | |
| Net gain/(loss) on investments (both realized and unrealized) | | | (.47) | | | | 1.12 | | | | .03 | | | |
| Total from Investment Operations | | | (.26) | | | | 1.60 | | | | .13 | | | |
| Less Distributions: | | | | | | | | | | | | | | |
| Dividends (from net investment income)* | | | (.36) | | | | (.43) | | | | – | | | |
| Distributions (from capital gains)* | | | – | | | | – | | | | – | | | |
| Total Distributions | | | (.36) | | | | (.43) | | | | – | | | |
| Net Asset Value, End of Period | | | $11.81 | | | | $12.43 | | | | $11.26 | | | |
| Total Return** | | | (2.09)% | | | | 14.34% | | | | 1.17% | | | |
| Net Assets, End of Period (in thousands) | | | $179,914 | | | | $177,032 | | | | $133,056 | | | |
| Average Net Assets for the Period (in thousands) | | | $176,757 | | | | $158,291 | | | | $130,396 | | | |
Ratio of Gross Expenses to Average Net Assets***(2)(3) | | | 0.23% | | | | 0.25% | | | | 0.24% | | | |
Ratio of Net Expenses to Average Net Assets***(2)(3) | | | 0.23% | | | | 0.25% | | | | 0.24% | | | |
| Ratio of Net Investment Income to Average Net Assets*** | | | 3.52% | | | | 4.07% | | | | 2.40% | | | |
| Portfolio Turnover Rate*** | | | 10% | | | | 12% | | | | 18% | | | |
| | | |
| * | | See Note 5 in Notes to Financial Statements. |
| ** | | Total return not annualized for periods of less than one full year. |
| *** | | Annualized for periods of less than one full year. |
| (1) | | Period from February 16, 2010 (inception date) through June 30, 2010. |
| (2) | | See Note 6 in Notes to Financial Statements. |
| (3) | | Ratios do not include expenses of the underlying funds and/or investment companies in which the Fund invests. |
See Notes to Financial Statements.
Janus Asset Allocation Funds | 37
Financial Highlights (continued)
Class I Shares
| | | | | | | | | | | | | | | | | | | |
For a share outstanding during the six-month period ended December 31, 2011
| | | | | | | | | | |
(unaudited), the fiscal year ended June 30, 2011, the eight-month fiscal period ended
| | Janus Growth Allocation Fund | | |
| June 30, 2010 and the fiscal period ended October 31, 2009 | | 2011 | | 2011 | | 2010(1) | | 2009(2) | | |
| |
| Net Asset Value, Beginning of Period | | | $12.53 | | | | $10.49 | | | | $10.37 | | | | $9.16 | | | |
| Income from Investment Operations: | | | | | | | | | | | | | | | | | | |
| Net investment income | | | .18 | | | | .22 | | | | .23 | | | | – | | | |
| Net gain/(loss) on investments (both realized and unrealized) | | | (1.32) | | | | 2.04 | | | | .09 | | | | 1.21 | | | |
| Total from Investment Operations | | | (1.14) | | | | 2.26 | | | | .32 | | | | 1.21 | | | |
| Less Distributions: | | | | | | | | | | | | | | | | | | |
| Dividends (from net investment income)* | | | (.20) | | | | (.22) | | | | (.20) | | | | – | | | |
| Distributions (from capital gains)* | | | – | | | | – | | | | – | | | | – | | | |
| Total Distributions | | | (.20) | | | | (.22) | | | | (.20) | | | | – | | | |
| Net Asset Value, End of Period | | | $11.19 | | | | $12.53 | | | | $10.49 | | | | $10.37 | | | |
| Total Return** | | | (9.07)% | | | | 21.58% | | | | 3.03% | | | | 13.21% | | | |
| Net Assets, End of Period (in thousands) | | | $2,040 | | | | $2,316 | | | | $1,938 | | | | $11 | | | |
| Average Net Assets for the Period (in thousands) | | | $2,109 | | | | $2,178 | | | | $1,065 | | | | $1 | | | |
Ratio of Gross Expenses to Average Net Assets***(3)(4) | | | 0.27% | | | | 0.25% | | | | 0.14% | | | | 0.49% | | | |
Ratio of Net Expenses to Average Net Assets***(3)(4) | | | 0.27% | | | | 0.25% | | | | 0.13% | | | | 0.29% | | | |
| Ratio of Net Investment Income to Average Net Assets*** | | | 2.87% | | | | 1.72% | | | | 0.86% | | | | 1.04% | | | |
| Portfolio Turnover Rate*** | | | 21% | | | | 26% | | | | 20% | | | | 23% | | | |
Class I Shares
| | | | | | | | | | | | | | | | | | | |
For a share outstanding during the six-month period ended December 31, 2011
| | | | | | | | | | |
(unaudited), the fiscal year ended June 30, 2011, the eight-month fiscal period ended
| | Janus Moderate Allocation Fund | | |
| June 30, 2010 and the fiscal period ended October 31, 2009 | | 2011 | | 2011 | | 2010(1) | | 2009(2) | | |
| |
| Net Asset Value, Beginning of Period | | | $12.60 | | | | $10.96 | | | | $10.80 | | | | $9.68 | | | |
| Income from Investment Operations: | | | | | | | | | | | | | | | | | | |
| Net investment income | | | .20 | | | | .34 | | | | .26 | | | | .05 | | | |
| Net gain/(loss) on investments (both realized and unrealized) | | | (.89) | | | | 1.61 | | | | .17 | | | | 1.07 | | | |
| Total from Investment Operations | | | (.69) | | | | 1.95 | | | | .43 | | | | 1.12 | | | |
| Less Distributions: | | | | | | | | | | | | | | | | | | |
| Dividends (from net investment income)* | | | (.30) | | | | (.31) | | | | (.27) | | | | – | | | |
| Distributions (from capital gains)* | | | – | | | | – | | | | – | | | | – | | | |
| Total Distributions | | | (.30) | | | | (.31) | | | | (.27) | | | | – | | | |
| Net Asset Value, End of Period | | | $11.61 | | | | $12.60 | | | | $10.96 | | | | $10.80 | | | |
| Total Return** | | | (5.49)% | | | | 17.91% | | | | 3.96% | | | | 11.57% | | | |
| Net Assets, End of Period (in thousands) | | | $4,980 | | | | $4,510 | | | | $1,625 | | | | $36 | | | |
| Average Net Assets for the Period (in thousands) | | | $4,601 | | | | $3,130 | | | | $757 | | | | $29 | | | |
Ratio of Gross Expenses to Average Net Assets***(3)(4) | | | 0.17% | | | | 0.17% | | | | 0.16% | | | | 0.19% | | | |
Ratio of Net Expenses to Average Net Assets***(3)(4) | | | 0.17% | | | | 0.17% | | | | 0.16% | | | | 0.18% | | | |
| Ratio of Net Investment Income to Average Net Assets*** | | | 3.42% | | | | 2.56% | | | | 1.70% | | | | 1.72% | | | |
| Portfolio Turnover Rate*** | | | 21% | | | | 15% | | | | 17% | | | | 19% | | | |
| | | |
| * | | See Note 5 in Notes to Financial Statements. |
| ** | | Total return not annualized for periods of less than one full year. |
| *** | | Annualized for periods of less than one full year. |
| (1) | | Period from November 1, 2009 through June 30, 2010. The Fund changed its fiscal year end from October 31 to June 30. |
| (2) | | Period from July 6, 2009 (inception date) through October 31, 2009. |
| (3) | | See Note 6 in Notes to Financial Statements. |
| (4) | | Ratios do not include expenses of the underlying funds and/or investment companies in which the Fund invests. |
See Notes to Financial Statements.
38 | DECEMBER 31, 2011
Class I Shares
| | | | | | | | | | | | | | | | | | | |
For a share outstanding during the six-month period ended December 31, 2011
| | | | | | | | | | |
(unaudited), the fiscal year ended June 30, 2011, the eight-month fiscal period ended
| | Janus Conservative Allocation Fund | | |
| June 30, 2010 and the fiscal period ended October 31, 2009 | | 2011 | | 2011 | | 2010(1) | | 2009(2) | | |
| |
| Net Asset Value, Beginning of Period | | | $12.42 | | | | $11.26 | | | | $11.10 | | | | $10.13 | | | |
| Income from Investment Operations: | | | | | | | | | | | | | | | | | | |
| Net investment income | | | .23 | | | | .43 | | | | .43 | | | | .02 | | | |
| Net gain/(loss) on investments (both realized and unrealized) | | | (.49) | | | | 1.17 | | | | .10 | | | | .95 | | | |
| Total from Investment Operations | | | (.26) | | | | 1.60 | | | | .53 | | | | .97 | | | |
| Less Distributions: | | | | | | | | | | | | | | | | | | |
| Dividends (from net investment income)* | | | (.36) | | | | (.44) | | | | (.37) | | | | – | | | |
| Distributions (from capital gains)* | | | – | | | | – | | | | – | | | | – | | | |
| Total Distributions | | | (.36) | | | | (.44) | | | | (.37) | | | | – | | | |
| Net Asset Value, End of Period | | | $11.80 | | | | $12.42 | | | | $11.26 | | | | $11.10 | | | |
| Total Return** | | | (2.09)% | | | | 14.34% | | | | 4.78% | | | | 9.58% | | | |
| Net Assets, End of Period (in thousands) | | | $2,229 | | | | $2,505 | | | | $545 | | | | $11 | | | |
| Average Net Assets for the Period (in thousands) | | | $2,243 | | | | $1,411 | | | | $265 | | | | $2 | | | |
Ratio of Gross Expenses to Average Net Assets***(3)(4) | | | 0.18% | | | | 0.18% | | | | 0.15% | | | | 0.20% | | | |
Ratio of Net Expenses to Average Net Assets***(3)(4) | | | 0.18% | | | | 0.18% | | | | 0.14% | | | | 0.13% | | | |
| Ratio of Net Investment Income to Average Net Assets*** | | | 3.54% | | | | 3.84% | | | | 2.53% | | | | 2.98% | | | |
| Portfolio Turnover Rate*** | | | 10% | | | | 12% | | | | 18% | | | | 21% | | | |
| | | |
| * | | See Note 5 in Notes to Financial Statements. |
| ** | | Total return not annualized for periods of less than one full year. |
| *** | | Annualized for periods of less than one full year. |
| (1) | | Period from November 1, 2009 through June 30, 2010. The Fund changed its fiscal year end from October 31 to June 30. |
| (2) | | Period from July 6, 2009 (inception date) through October 31, 2009. |
| (3) | | See Note 6 in Notes to Financial Statements. |
| (4) | | Ratios do not include expenses of the underlying funds and/or investment companies in which the Fund invests. |
See Notes to Financial Statements.
Janus Asset Allocation Funds | 39
Financial Highlights (continued)
Class S Shares
| | | | | | | | | | | | | | | | | | | |
For a share outstanding during the six-month period ended December 31, 2011
| | | | | | | | | | |
(unaudited), the fiscal year ended June 30, 2011, the eight-month fiscal period ended
| | Janus Growth Allocation Fund | | |
| June 30, 2010 and the fiscal period ended October 31, 2009 | | 2011 | | 2011 | | 2010(1) | | 2009(2) | | |
| |
| Net Asset Value, Beginning of Period | | | $12.45 | | | | $10.45 | | | | $10.35 | | | | $9.16 | | | |
| Income from Investment Operations: | | | | | | | | | | | | | | | | | | |
| Net investment income | | | .15 | | | | .21 | | | | .15 | | | | – | | | |
| Net gain/(loss) on investments (both realized and unrealized) | | | (1.30) | | | | 2.00 | | | | .14 | | | | 1.19 | | | |
| Total from Investment Operations | | | (1.15) | | | | 2.21 | | | | .29 | | | | 1.19 | | | |
| Less Distributions: | | | | | | | | | | | | | | | | | | |
| Dividends (from net investment income)* | | | (.19) | | | | (.21) | | | | (.19) | | | | – | | | |
| Distributions (from capital gains)* | | | – | | | | – | | | | – | | | | – | | | |
| Total Distributions | | | (.19) | | | | (.21) | | | | (.19) | | | | – | | | |
| Net Asset Value, End of Period | | | $11.11 | | | | $12.45 | | | | $10.45 | | | | $10.35 | | | |
| Total Return** | | | (9.25)% | | | | 21.15% | | | | 2.73% | | | | 12.99% | | | |
| Net Assets, End of Period (in thousands) | | | $1,106 | | | | $753 | | | | $30 | | | | $11 | | | |
| Average Net Assets for the Period (in thousands) | | | $1,025 | | | | $558 | | | | $19 | | | | $1 | | | |
Ratio of Gross Expenses to Average Net Assets***(3)(4) | | | 0.65% | | | | 0.67% | | | | 0.65% | | | | 0.87% | | | |
Ratio of Net Expenses to Average Net Assets***(3)(4) | | | 0.65% | | | | 0.67% | | | | 0.65% | | | | 0.67% | | | |
| Ratio of Net Investment Income to Average Net Assets*** | | | 2.64% | | | | 1.61% | | | | 0.68% | | | | 0.66% | | | |
| Portfolio Turnover Rate*** | | | 21% | | | | 26% | | | | 20% | | | | 23% | | | |
Class S Shares
| | | | | | | | | | | | | | | | | | | |
For a share outstanding during the six-month period ended December 31, 2011
| | | | | | | | | | |
(unaudited), the fiscal year ended June 30, 2011, the eight-month fiscal period ended
| | Janus Moderate Allocation Fund | | |
| June 30, 2010 and the fiscal period ended October 31, 2009 | | 2011 | | 2011 | | 2010(1) | | 2009(2) | | |
| |
| Net Asset Value, Beginning of Period | | | $12.52 | | | | $10.91 | | | | $10.78 | | | | $9.68 | | | |
| Income from Investment Operations: | | | | | | | | | | | | | | | | | | |
| Net investment income | | | .17 | | | | .29 | | | | .25 | | | | .01 | | | |
| Net gain/(loss) on investments (both realized and unrealized) | | | (.89) | | | | 1.62 | | | | .14 | | | | 1.09 | | | |
| Total from Investment Operations | | | (.72) | | | | 1.91 | | | | .39 | | | | 1.10 | | | |
| Less Distributions: | | | | | | | | | | | | | | | | | | |
| Dividends (from net investment income)* | | | (.28) | | | | (.30) | | | | (.26) | | | | – | | | |
| Distributions (from capital gains)* | | | – | | | | – | | | | – | | | | – | | | |
| Total Distributions | | | (.28) | | | | (.30) | | | | (.26) | | | | – | | | |
| Net Asset Value, End of Period | | | $11.52 | | | | $12.52 | | | | $10.91 | | | | $10.78 | | | |
| Total Return** | | | (5.72)% | | | | 17.56% | | | | 3.57% | | | | 11.36% | | | |
| Net Assets, End of Period (in thousands) | | | $1,130 | | | | $416 | | | | $58 | | | | $11 | | | |
| Average Net Assets for the Period (in thousands) | | | $853 | | | | $374 | | | | $26 | | | | $1 | | | |
Ratio of Gross Expenses to Average Net Assets***(3)(4) | | | 0.62% | | | | 0.64% | | | | 0.66% | | | | 0.92% | | | |
Ratio of Net Expenses to Average Net Assets***(3)(4) | | | 0.62% | | | | 0.64% | | | | 0.66% | | | | 0.77% | | | |
| Ratio of Net Investment Income to Average Net Assets*** | | | 3.56% | | | | 2.92% | | | | 1.35% | | | | 1.59% | | | |
| Portfolio Turnover Rate*** | | | 21% | | | | 15% | | | | 17% | | | | 19% | | | |
| | | |
| * | | See Note 5 in Notes to Financial Statements. |
| ** | | Total return not annualized for periods of less than one full year. |
| *** | | Annualized for periods of less than one full year. |
| (1) | | Period from November 1, 2009 through June 30, 2010. The Fund changed its fiscal year end from October 31 to June 30. |
| (2) | | Period from July 6, 2009 (inception date) through October 31, 2009. |
| (3) | | See Note 6 in Notes to Financial Statements. |
| (4) | | Ratios do not include expenses of the underlying funds and/or investment companies in which the Fund invests. |
See Notes to Financial Statements.
40 | DECEMBER 31, 2011
Class S Shares
| | | | | | | | | | | | | | | | | | | |
For a share outstanding during the six-month period ended December 31, 2011
| | | | | | | | | | |
(unaudited), the fiscal year ended June 30, 2011, the eight-month fiscal period ended
| | Janus Conservative Allocation Fund | | |
| June 30, 2010 and the fiscal period ended October 31, 2009 | | 2011 | | 2011 | | 2010(1) | | 2009(2) | | |
| |
| Net Asset Value, Beginning of Period | | | $12.37 | | | | $11.24 | | | | $11.07 | | | | $10.13 | | | |
| Income from Investment Operations: | | | | | | | | | | | | | | | | | | |
| Net investment income | | | .16 | | | | .41 | | | | .30 | | | | .06 | | | |
| Net gain/(loss) on investments (both realized and unrealized) | | | (.45) | | | | 1.13 | | | | .20 | | | | .88 | | | |
| Total from Investment Operations | | | (.29) | | | | 1.54 | | | | .50 | | | | .94 | | | |
| Less Distributions: | | | | | | | | | | | | | | | | | | |
| Dividends (from net investment income)* | | | (.34) | | | | (.41) | | | | (.33) | | | | – | | | |
| Distributions (from capital gains)* | | | – | | | | – | | | | – | | | | – | | | |
| Total Distributions | | | (.34) | | | | (.41) | | | | (.33) | | | | – | | | |
| Net Asset Value, End of Period | | | $11.74 | | | | $12.37 | | | | $11.24 | | | | $11.07 | | | |
| Total Return** | | | (2.31)% | | | | 13.82% | | | | 4.48% | | | | 9.28% | | | |
| Net Assets, End of Period (in thousands) | | | $1,031 | | | | $520 | | | | $125 | | | | $164 | | | |
| Average Net Assets for the Period (in thousands) | | | $798 | | | | $336 | | | | $126 | | | | $127 | | | |
Ratio of Gross Expenses to Average Net Assets***(3)(4) | | | 0.61% | | | | 0.62% | | | | 0.64% | | | | 0.67% | | | |
Ratio of Net Expenses to Average Net Assets***(3)(4) | | | 0.60% | | | | 0.62% | | | | 0.64% | | | | 0.65% | | | |
| Ratio of Net Investment Income to Average Net Assets*** | | | 3.53% | | | | 3.84% | | | | 2.47% | | | | 2.22% | | | |
| Portfolio Turnover Rate*** | | | 10% | | | | 12% | | | | 18% | | | | 21% | | | |
| | | |
| * | | See Note 5 in Notes to Financial Statements. |
| ** | | Total return not annualized for periods of less than one full year. |
| *** | | Annualized for periods of less than one full year. |
| (1) | | Period from November 1, 2009 through June 30, 2010. The Fund changed its fiscal year end from October 31 to June 30. |
| (2) | | Period from July 6, 2009 (inception date) through October 31, 2009. |
| (3) | | See Note 6 in Notes to Financial Statements. |
| (4) | | Ratios do not include expenses of the underlying funds and/or investment companies in which the Fund invests. |
See Notes to Financial Statements.
Janus Asset Allocation Funds | 41
Financial Highlights (continued)
Class T Shares
| | | | | | | | | | | | | | | | | | | | | | | | | | | | | | | |
For a share outstanding during the six-month period ended
| | | | | | | | | | | | | | | | |
December 31, 2011 (unaudited), the fiscal year ended
| | | | | | | | | | | | | | | | |
June 30, 2011, the eight-month fiscal period ended
| | | | | | | | | | | | | | | | |
June 30, 2010 and each fiscal year or period ended
| | Janus Growth Allocation Fund | | |
| October 31 | | 2011 | | 2011 | | 2010(1) | | 2009 | | 2008 | | 2007 | | 2006(2) | | |
| |
| Net Asset Value, Beginning of Period | | | $12.54 | | | | $10.48 | | | | $10.36 | | | | $8.62 | | | | $13.95 | | | | $11.34 | | | | $10.00 | | | |
| Income from Investment Operations: | | | | | | | | | | | | | | | | | | | | | | | | | | | | | | |
| Net investment income | | | .13 | | | | .21 | | | | .29 | | | | .26 | | | | .24 | | | | .16 | | | | .05 | | | |
| Net gain/(loss) on investments (both realized and unrealized) | | | (1.28) | | | | 2.04 | | | | .01 | | | | 1.69 | | | | (4.93) | | | | 2.62 | | | | 1.29 | | | |
| Total from Investment Operations | | | (1.15) | | | | 2.25 | | | | .30 | | | | 1.95 | | | | (4.69) | | | | 2.78 | | | | 1.34 | | | |
| Less Distributions: | | | | | | | | | | | | | | | | | | | | | | | | | | | | | | |
| Dividends (from net investment income)* | | | (.20) | | | | (.19) | | | | (.18) | | | | (.21) | | | | (.24) | | | | (.13) | | | | – | | | |
| Distributions (from capital gains)* | | | – | | | | – | | | | – | | | | – | | | | (.40) | | | | (.04) | | | | – | | | |
| Total Distributions | | | (.20) | | | | (.19) | | | | (.18) | | | | (.21) | | | | (.64) | | | | (.17) | | | | – | | | |
| Net Asset Value, End of Period | | | $11.19 | | | | $12.54 | | | | $10.48 | | | | $10.36 | | | | $8.62 | | | | $13.95 | | | | $11.34 | | | |
| Total Return** | | | (9.17)% | | | | 21.55% | | | | 2.86% | | | | 23.32% | | | | (35.15)% | | | | 24.81% | | | | 13.40% | | | |
| Net Assets, End of Period (in thousands) | | | $12,178 | | | | $12,451 | | | | $10,459 | | | | $190,737 | | | | $143,425 | | | | $176,461 | | | | $66,794 | | | |
| Average Net Assets for the Period (in thousands) | | | $12,283 | | | | $11,585 | | | | $96,998 | | | | $154,899 | | | | $183,091 | | | | $124,708 | | | | $34,131 | | | |
Ratio of Gross Expenses to Average Net Assets***(3)(4) | | | 0.40% | | | | 0.35% | | | | 0.33% | | | | 0.37% | | | | 0.25% | | | | 0.25% | | | | 0.25% | | | |
Ratio of Net Expenses to Average Net Assets***(3)(4) | | | 0.40% | | | | 0.35% | | | | 0.33% | | | | 0.36% | | | | 0.24% | | | | 0.24% | | | | 0.24% | | | |
| Ratio of Net Investment Income to Average Net Assets*** | | | 2.65% | | | | 1.62% | | | | 1.84% | | | | 2.90% | | | | 1.95% | | | | 1.32% | | | | 0.98% | | | |
| Portfolio Turnover Rate*** | | | 21% | | | | 26% | | | | 20% | | | | 23% | | | | 55% | | | | 19% | | | | 28% | | | |
Class T Shares
| | | | | | | | | | | | | | | | | | | | | | | | | | | | | | | |
For a share outstanding during the six-month period ended
| | | | | | | | | | | | | | | | |
December 31, 2011 (unaudited), the fiscal year ended
| | | | | | | | | | | | | | | | |
June 30, 2011, the eight-month fiscal period ended
| | | | | | | | | | | | | | | | |
June 30, 2010 and each fiscal year or period ended
| | Janus Moderate Allocation Fund | | |
| October 31 | | 2011 | | 2011 | | 2010(1) | | 2009 | | 2008 | | 2007 | | 2006(2) | | |
| |
| Net Asset Value, Beginning of Period | | | $12.60 | | | | $10.95 | | | | $10.79 | | | | $9.05 | | | | $12.95 | | | | $11.04 | | | | $10.00 | | | |
| Income from Investment Operations: | | | | | | | | | | | | | | | | | | | | | | | | | | | | | | |
| Net investment income | | | .17 | | | | .11 | | | | .56 | | | | .32 | | | | .31 | | | | .23 | | | | .09 | | | |
| Net gain/(loss) on investments (both realized and unrealized) | | | (.88) | | | | 1.84 | | | | (.14) | | | | 1.71 | | | | (3.64) | | | | 1.86 | | | | .95 | | | |
| Total from Investment Operations | | | (.71) | | | | 1.95 | | | | .42 | | | | 2.03 | | | | (3.33) | | | | 2.09 | | | | 1.04 | | | |
| Less Distributions: | | | | | | | | | | | | | | | | | | | | | | | | | | | | | | |
| Dividends (from net investment income)* | | | (.29) | | | | (.30) | | | | (.26) | | | | (.29) | | | | (.29) | | | | (.16) | | | | – | | | |
| Distributions (from capital gains)* | | | – | | | | – | | | | – | | | | – | | | | (.28) | | | | (.02) | | | | – | | | |
| Total Distributions | | | (.29) | | | | (.30) | | | | (.26) | | | | (.29) | | | | (.57) | | | | (.18) | | | | – | | | |
| Net Asset Value, End of Period | | | $11.60 | | | | $12.60 | | | | $10.95 | | | | $10.79 | | | | $9.05 | | | | $12.95 | | | | $11.04 | | | |
| Total Return** | | | (5.62)% | | | | 17.89% | | | | 3.80% | | | | 23.19% | | | | (26.77)% | | | | 19.16% | | | | 10.40% | | | |
| Net Assets, End of Period (in thousands) | | | $20,100 | | | | $20,254 | | | | $10,268 | | | | $160,742 | | | | $110,756 | | | | $123,007 | | | | $51,266 | | | |
| Average Net Assets for the Period (in thousands) | | | $19,618 | | | | $16,051 | | | | $83,813 | | | | $124,910 | | | | $132,650 | | | | $87,462 | | | | $25,078 | | | |
Ratio of Gross Expenses to Average Net Assets***(3)(4) | | | 0.37% | | | | 0.35% | | | | 0.30% | | | | 0.33% | | | | 0.21% | | | | 0.21% | | | | 0.21% | | | |
Ratio of Net Expenses to Average Net Assets***(3)(4) | | | 0.37% | | | | 0.35% | | | | 0.30% | | | | 0.32% | | | | 0.20% | | | | 0.20% | | | | 0.20% | | | |
| Ratio of Net Investment Income to Average Net Assets*** | | | 3.13% | | | | 2.88% | | | | 2.63% | | | | 3.48% | | | | 2.63% | | | | 2.24% | | | | 1.97% | | | |
| Portfolio Turnover Rate*** | | | 21% | | | | 15% | | | | 17% | | | | 19% | | | | 71% | | | | 15% | | | | 16% | | | |
| | | |
| * | | See Note 5 in Notes to Financial Statements. |
| ** | | Total return not annualized for periods of less than one full year. |
| *** | | Annualized for periods of less than one full year. |
| (1) | | Period from November 1, 2009 through June 30, 2010. The Fund changed its fiscal year end from October 31 to June 30. |
| (2) | | Period from December 30, 2005 (inception date) through October 31, 2006. |
| (3) | | See Note 6 in Notes to Financial Statements. |
| (4) | | Ratios do not include expenses of the underlying funds and/or investment companies in which the Fund invests. |
See Notes to Financial Statements.
42 | DECEMBER 31, 2011
Class T Shares
| | | | | | | | | | | | | | | | | | | | | | | | | | | | | | | |
For a share outstanding during the six-month period ended
| | | | | | | | | | | | | | | | |
December 31, 2011 (unaudited), the fiscal year ended
| | | | | | | | | | | | | | | | |
June 30, 2011, the eight-month fiscal period ended June 30,
| | Janus Conservative Allocation Fund | | |
| 2010 and each fiscal year or period ended October 31 | | 2011 | | 2011 | | 2010(1) | | 2009 | | 2008 | | 2007 | | 2006(2) | | |
| |
| Net Asset Value, Beginning of Period | | | $12.42 | | | | $11.26 | | | | $11.09 | | | | $9.52 | | | | $12.09 | | | | $10.82 | | | | $10.00 | | | |
| Income from Investment Operations: | | | | | | | | | | | | | | | | | | | | | | | | | | | | | | |
| Net investment income | | | .15 | | | | .26 | | | | .72 | | | | .38 | | | | .33 | | | | .26 | | | | .13 | | | |
| Net gain/(loss) on investments (both realized and unrealized) | | | (.42) | | | | 1.32 | | | | (.20) | | | | 1.52 | | | | (2.46) | | | | 1.23 | | | | .69 | | | |
| Total from Investment Operations | | | (.27) | | | | 1.58 | | | | .52 | | | | 1.90 | | | | (2.13) | | | | 1.49 | | | | .82 | | | |
| Less Distributions: | | | | | | | | | | | | | | | | | | | | | | | | | | | | | | |
| Dividends (from net investment income)* | | | (.36) | | | | (.42) | | | | (.35) | | | | (.33) | | | | (.29) | | | | (.20) | | | | – | | | |
| Distributions (from capital gains)* | | | – | | | | – | | | | – | | | | – | | | | (.15) | | | | (.02) | | | | – | | | |
| Total Distributions | | | (.36) | | | | (.42) | | | | (.35) | | | | (.33) | | | | (.44) | | | | (.22) | | | | – | | | |
| Net Asset Value, End of Period | | | $11.79 | | | | $12.42 | | | | $11.26 | | | | $11.09 | | | | $9.52 | | | | $12.09 | | | | $10.82 | | | |
| Total Return** | | | (2.20)% | | | | 14.15% | | | | 4.70% | | | | 20.71% | | | | (18.26)% | | | | 13.98% | | | | 8.20% | | | |
| Net Assets, End of Period (in thousands) | | | $17,588 | | | | $16,648 | | | | $9,999 | | | | $114,544 | | | | $83,219 | | | | $68,704 | | | | $19,489 | | | |
| Average Net Assets for the Period (in thousands) | | | $17,346 | | | | $12,762 | | | | $60,927 | | | | $90,262 | | | | $88,345 | | | | $41,512 | | | | $9,992 | | | |
Ratio of Gross Expenses to Average Net Assets***(3)(4) | | | 0.35% | | | | 0.36% | | | | 0.31% | | | | 0.31% | | | | 0.17% | | | | 0.18% | | | | 0.18% | | | |
Ratio of Net Expenses to Average Net Assets***(3)(4) | | | 0.35% | | | | 0.36% | | | | 0.31% | | | | 0.30% | | | | 0.17% | | | | 0.17% | | | | 0.17% | | | |
| Ratio of Net Investment Income to Average Net Assets*** | | | 3.42% | | | | 3.77% | | | | 3.62% | | | | 4.14% | | | | 3.16% | | | | 3.04% | | | | 2.78% | | | |
| Portfolio Turnover Rate*** | | | 10% | | | | 12% | | | | 18% | | | | 21% | | | | 90% | | | | 16% | | | | 20% | | | |
| | | |
| * | | See Note 5 in Notes to Financial Statements. |
| ** | | Total return not annualized for periods of less than one full year. |
| *** | | Annualized for periods of less than one full year. |
| (1) | | Period from November 1, 2009 through June 30, 2010. The Fund changed its fiscal year end from October 31 to June 30. |
| (2) | | Period from December 30, 2005 (inception date) through October 31, 2006. |
| (3) | | See Note 6 in Notes to Financial Statements. |
| (4) | | Ratios do not include expenses of the underlying funds and/or investment companies in which the Fund invests. |
See Notes to Financial Statements.
Janus Asset Allocation Funds | 43
Notes to Schedules of Investments (unaudited)
| | |
| Barclays Capital U.S. Aggregate Bond Index | | Made up of the Barclays Capital U.S. Government/Corporate Bond Index, Mortgage-Backed Securities Index, and Asset-Backed Securities Index, including securities that are of investment grade quality or better, have at least one year to maturity, and have an outstanding par value of at least $100 million. |
| |
| Conservative Allocation Index | | An internally calculated, hypothetical combination of unmanaged indices that combines the total returns from the Barclays Capital U.S. Aggregate Bond Index (60%), the Dow Jones Wilshire 5000 Index (28%) and the MSCI EAFE® Index (12%). |
| |
| Dow Jones Wilshire 5000 Index | | Measures the performance of all U.S. headquartered equity securities with readily available price data. Over 5,000 capitalization-weighted security returns are used and the Dow Jones Wilshire 5000 Index is considered one of the premier measures of the entire U.S. stock market. |
| |
| Growth Allocation Index | | An internally calculated, hypothetical combination of unmanaged indices that combines the total returns from the Dow Jones Wilshire 5000 Index (50%), the MSCI EAFE® Index (25%), the Barclays Capital U.S. Aggregate Bond Index (20%) and the MSCI Emerging Markets IndexSM (5%). |
| |
| Lipper Mixed-Asset Target Allocation Conservative Funds | | Funds that, by portfolio practice, maintain a mix between 20%-40% equity securities, with the remainder invested in bonds, cash and cash equivalents. |
| |
| Lipper Mixed-Asset Target Allocation Growth Funds | | Funds that, by portfolio practice, maintain a mix between 60%-80% equity securities, with the remainder invested in bonds, cash and cash equivalents. |
| |
| Lipper Mixed-Asset Target Allocation Moderate Funds | | Funds that, by portfolio practice, maintain a mix of between 40%-60% equity securities, with the remainder invested in bonds, cash and cash equivalents. |
| |
| Moderate Allocation Index | | An internally calculated, hypothetical combination of unmanaged indices that combines the total returns from the Dow Jones Wilshire 5000 Index (40%), the Barclays Capital U.S. Aggregate Bond Index (40%), the MSCI EAFE® Index (18%) and the MSCI Emerging Markets IndexSM (2%). |
| |
| Morgan Stanley Capital International EAFE® Index | | A free float-adjusted market capitalization weighted index designed to measure developed market equity performance. The MSCI EAFE® Index is composed of companies representative of the market structure of developed market countries. The index includes reinvestment of dividends, net of foreign withholding taxes. |
| |
| Morgan Stanley Capital International Emerging Markets IndexSM | | A free float-adjusted market capitalization index that is designed to measure equity market performance in the global emerging markets. |
| |
| S&P 500® Index | | A commonly recognized, market-capitalization weighted index of 500 widely held equity securities, designed to measure broad U.S. equity performance. |
44 | DECEMBER 31, 2011
The following is a summary of the inputs that were used to value the Funds’ investments in securities and other financial instruments as of December 31, 2011. See Notes to Financial Statements for more information.
Valuation Inputs Summary (as of December 31, 2011)
| | | | | | | | | | | | |
| | | | | Level 2 – Other Significant
| | Level 3 – Significant
| | |
| | | Level 1 – Quoted Prices | | Observable Inputs | | Unobservable Inputs | | |
| |
Investments in Securities: | | | | | | | | | | | |
| Janus Growth Allocation Fund | | | | | | | | | | | |
| Mutual Funds | | | | | | | | | | | |
Equity Funds | | $ | – | | $ | 177,660,827 | | $ | – | | |
Fixed-Income Funds | | | – | | | 42,172,986 | | | – | | |
| Total Investments in Securities | | $ | – | | $ | 219,833,813 | | $ | – | | |
| |
| |
Investments in Securities: | | | | | | | | | | | |
| Janus Moderate Allocation Fund | | | | | | | | | | | |
| Mutual Funds | | | | | | | | | | | |
Equity Funds | | $ | – | | $ | 154,781,808 | | $ | – | | |
Fixed-Income Funds | | | – | | | 101,622,951 | | | – | | |
| Total Investments in Securities | | $ | – | | $ | 256,404,759 | | $ | – | | |
| |
| |
Investments in Securities: | | | | | | | | | | | |
| Janus Conservative Allocation Fund | | | | | | | | | | | |
| Mutual Funds | | | | | | | | | | | |
Equity Funds | | $ | – | | $ | 86,164,947 | | $ | – | | |
Fixed-Income Funds | | | – | | | 132,341,107 | | | – | | |
| Total Investments in Securities | | $ | – | | $ | 218,506,054 | | $ | – | | |
| |
| |
Janus Asset Allocation Funds | 45
Notes to Financial Statements (unaudited)
The following section describes the organization and significant accounting policies and provides more detailed information about the schedules and tables that appear throughout this report. In addition, the Notes to Financial Statements explain the methods used in preparing and presenting this report.
| |
| 1. | Organization and Significant Accounting Policies |
Janus Growth Allocation Fund, Janus Moderate Allocation Fund, and Janus Conservative Allocation Fund (individually, a “Fund” and collectively, the “Funds”) are series funds. The Funds each operate as a “fund of funds,” meaning substantially all of the Funds’ assets will be invested in other Janus funds (the “underlying funds”). The Funds are part of Janus Investment Fund (the “Trust”), which is organized as a Massachusetts business trust and is registered under the Investment Company Act of 1940, as amended (the “1940 Act”), as an open-end management investment company. The financial statements include information for the period ended December 31, 2011. The Trust offers forty-five funds which include multiple series of shares, with differing investment objectives and policies. Each Fund in this report is classified as diversified, as defined in the 1940 Act.
Each Fund in this report offers multiple classes of shares in order to meet the needs of various types of investors. Each class represents an interest in the same portfolio of investments. Certain financial intermediaries may not offer all classes of shares.
Class A Shares and Class C Shares are generally offered through financial intermediary platforms including, but not limited to, traditional brokerage platforms, mutual fund wrap fee programs, bank trust platforms, and retirement platforms. The maximum purchase in Class C Shares is $500,000 for any single purchase.
Class D Shares are generally no longer being made available to new investors. The Shares are available only to investors who hold accounts directly with the Janus funds and to immediate family members or members of the same household of an eligible individual investor. The Shares are not offered through financial intermediaries.
Class I Shares are available through certain financial intermediary platforms including, but not limited to, mutual fund wrap fee programs, managed account programs, asset allocation programs, and bank trust platforms, as well as certain retirement platforms. Class I Shares are also available to certain institutional investors including, but not limited to, corporations, certain retirement plans, public plans, and foundations/endowments.
Class S Shares are offered through financial intermediary platforms including, but not limited to, retirement platforms and asset allocation, mutual fund wrap, or other discretionary or nondiscretionary fee-based investment advisory programs. In addition, Class S Shares may be available through certain financial intermediaries who have an agreement with Janus Capital Management LLC (“Janus Capital”) or its affiliates to offer Class S Shares on their supermarket platforms.
Class T Shares are available through certain financial intermediary platforms including, but not limited to, mutual fund wrap fee programs, managed account programs, asset allocation programs, bank trust platforms, as well as certain retirement platforms. In addition, Class T Shares may be available through certain financial intermediaries who have an agreement with Janus Capital or its affiliates to offer Class T Shares on their supermarket platforms.
Underlying Funds
Each Fund invests in a variety of underlying funds to pursue a target allocation of stocks and bonds, and may also invest in money market instruments or cash/cash equivalents. Each Fund has a target allocation, which is how each Fund’s investments generally will be allocated among the major asset classes over the long term, as well as normal ranges within which each Fund’s asset class allocations generally will vary over short-term periods. The normal asset allocation ranges are as follows: (1) 75%-85% stocks and 15%-25% bonds and money market instruments for Janus Growth Allocation Fund; (2) 55%-65% stocks and 35%-45% bonds and money market instruments for Janus Moderate Allocation Fund; and (3) 35%-45% stocks and 55%-65% bonds and money market instruments for Janus Conservative Allocation Fund. The following information provides a brief description of the investment objectives and strategies of each of the underlying funds that are available within the various asset classes. Additional details are available in the underlying funds’ prospectuses. The Trustees of the underlying Janus funds may change the investment objectives or strategy of the underlying funds at any time without prior notice to Fund shareholders.
POTENTIAL UNDERLYING FUNDS INCLUDED IN THE EQUITY SECURITIES ASSET CATEGORY
INTECH GLOBAL DIVIDEND FUND seeks long-term growth of capital and income. The fund invests, under normal circumstances, at least 80% of its net assets in dividend-paying securities. The fund invests primarily in common stocks from the universe of the Morgan Stanley Capital International (“MSCI”) World High Dividend Yield Index, utilizing INTECH’s mathematical investment process. The MSCI World High Dividend Yield Index is designed to reflect the performance of the high dividend
46 | DECEMBER 31, 2011
yield securities contained within the broader MSCI World IndexSM. The fund may also invest in foreign equity and debt securities.
INTECH INTERNATIONAL FUND (formerly named INTECH RISK-MANAGED INTERNATIONAL FUND) seeks long-term growth of capital. The fund invests primarily in common stocks from the universe of the MSCI EAFE® (Europe, Australasia, Far East) Index, utilizing INTECH’s mathematical investment process. The MSCI EAFE® Index is an MSCI index that is designed to measure the performance of the developed markets of Europe, Australasia, and the Far East. The fund may also invest in foreign equity and debt securities.
INTECH U.S. CORE FUND (formerly named INTECH RISK-MANAGED CORE FUND) seeks long-term growth of capital. The fund invests, under normal circumstances, at least 80% of its net assets in U.S. common stocks from the universe of the S&P 500® Index, utilizing INTECH’s mathematical investment process. The S&P 500® Index is an unmanaged index of 500 stocks that is generally representative of the performance of larger companies in the United States.
INTECH U.S. GROWTH FUND (formerly named INTECH RISK-MANAGED GROWTH FUND) seeks long-term growth of capital. The fund invests under normal circumstances, at least 80% of its net assets in U.S. common stocks from the universe of the Russell 1000® Growth Index, utilizing INTECH’s mathematical investment process. The Russell 1000® Growth Index is an unmanaged index that measures the performance of those Russell 1000 companies with higher price-to-book ratios and higher forecasted growth values.
INTECH U.S. VALUE FUND (formerly named INTECH RISK-MANAGED VALUE FUND) seeks long-term growth of capital. The fund invests, under normal circumstances, at least 80% of its net assets in U.S. common stocks from the universe of the Russell 1000® Value Index, utilizing INTECH’s mathematical investment process. The Russell 1000® Value Index is an unmanaged index that measures the performance of those Russell 1000 companies with lower price-to-book ratios and lower forecasted growth values.
JANUS ASIA EQUITY FUND seeks long-term growth of capital. The fund pursues its investment objective by investing, under normal circumstances, at least 80% of its net assets in equity securities of Asian issuers (excluding Japanese issuers). An Asian issuer is generally considered to be any company that (i) is incorporated or has its principal business activities in one or more Asian countries; (ii) is primarily listed on the trading market of an Asian country; or (iii) derives 50% or more of its revenue from, or has 50% or more of its assets in, an Asian country. The fund considers “Asian countries” to include, but not be limited to, Hong Kong, China, South Korea, Taiwan, Singapore, Malaysia, Thailand, Indonesia, Philippines, India, Vietnam, Pakistan, Russia, and Sri Lanka. Some of these countries may represent developing or emerging markets. The fund generally invests in equity securities, which consist primarily of common stocks, preferred stocks, depositary receipts, and convertible securities, but may also include other types of instruments, such as equity-linked securities and real estate investment trusts issued by Asian real estate companies. The fund may invest in companies of any market capitalization. While the fund intends to diversify its investments across a number of different countries, including emerging market countries, it may, under unusual circumstances, invest all or a significant portion of its assets in a single Asian country. To a more limited degree, the fund may also invest in U.S. and foreign debt securities.
JANUS BALANCED FUND seeks long-term capital growth, consistent with preservation of capital and balanced by current income. The fund pursues its investment objective by normally investing 35-65% of its assets in equity securities and the remaining assets in fixed-income securities and cash equivalents. The fund normally invests at least 25% of its assets in fixed-income senior securities. Fixed-income securities may include corporate debt securities, U.S. Government obligations, mortgage-backed securities and other mortgage-related products, and short-term securities. The fund may also invest in foreign equity and debt securities, which may include investments in emerging markets.
JANUS CONTRARIAN FUND seeks long-term growth of capital. The fund pursues its investment objective by investing, under normal circumstances, at least 80% of its net assets in equity securities with the potential for long-term growth of capital. The portfolio manager emphasizes investments in companies with attractive price/free cash flow, which is the relationship between the price of a stock and the company’s available cash from operations minus capital expenditures. The portfolio manager will typically seek attractively valued companies that are improving their free cash flow and returns on invested capital. Such companies may also include special situations companies that are experiencing management changes and/or are currently out of favor. The fund may also invest in foreign equity and debt securities, which may include investments in emerging markets.
JANUS EMERGING MARKETS FUND seeks long-term growth of capital. The fund invests, under normal circumstances, at least 80% of its net assets in securities of issuers in emerging market countries. The fund normally invests in securities of issuers that (i) are primarily listed on the trading market of an emerging
Janus Asset Allocation Funds | 47
Notes to Financial Statements (unaudited) (continued)
market country; (ii) are incorporated or have their principal business activities in an emerging market country; or (iii) derive 50% or more of their revenues from, or have 50% or more of their assets in, an emerging market country. An emerging market country is any country that has been determined by an international organization, such as the World Bank, to have a low to middle income economy and/or any country that is not included in the MSCI World IndexSM, which measures the equity market performance of developed markets. The fund generally invests in equity securities, which consist primarily of common stocks, preferred stocks and convertible securities, but may also invest in other types of instruments, such as equity-linked securities and exchange-traded funds (“ETFs”). The fund may invest in companies of any market capitalization.
JANUS ENTERPRISE FUND seeks long-term growth of capital. The fund pursues its investment objective by investing primarily in common stocks selected for their growth potential and normally invests at least 50% of its equity assets in medium-sized companies. Medium-sized companies are those whose market capitalization falls within the range of companies in the Russell Midcap® Growth Index. The fund may also invest in foreign equity and debt securities, which may include investments in emerging markets.
JANUS FORTY FUND seeks long-term growth of capital. The fund pursues its investment objective by normally investing primarily in a core group of 20-40 common stocks selected for their growth potential. The fund may invest in companies of any size, from larger, well-established companies to smaller, emerging growth companies. The fund may also invest in foreign equity and debt securities, which may include investments in emerging markets.
JANUS FUND seeks long-term growth of capital. The fund pursues its investment objective by investing primarily in common stocks selected for their growth potential. Although the fund may invest in companies of any size, it generally invests in larger, more established companies. The fund may also invest in foreign equity and debt securities, which may include investments in emerging markets.
JANUS GLOBAL LIFE SCIENCES FUND seeks long-term growth of capital. The fund invests, under normal circumstances, at least 80% of its net assets in securities of companies that the portfolio manager believes have a life science orientation. Generally speaking, the “life sciences” relate to maintaining or improving quality of life. The fund implements this policy by investing primarily in equity securities of U.S. and foreign companies selected for their growth potential. The fund normally invests in issuers from several different countries, which may include the United States. The fund may, under unusual circumstances, invest in a single country. The fund may have significant exposure to emerging markets. The fund may also invest in U.S. and foreign debt securities. As a fundamental policy, the fund normally invests at least 25% of its total assets in the “life sciences” sector, which may include companies in the following industry groups: health care; pharmaceuticals; agriculture; cosmetics/personal care; and biotechnology.
JANUS GLOBAL MARKET NEUTRAL FUND (formerly named JANUS LONG/SHORT FUND) seeks long-term capital appreciation independent of stock market direction. The fund’s market neutral strategy attempts to create a portfolio that limits stock market risk and delivers absolute returns. Under normal circumstances, the fund generally pursues its investment objective by taking both long and short positions in domestic and foreign equity securities, including those in emerging markets, and ETFs in an effort to insulate the fund’s performance from general stock market movements. The fund seeks a combination of long and short positions that may provide positive returns regardless of market direction, through a complete market cycle. The fund will generally buy long securities that the portfolio manager believes will go up in price and will sell short ETFs and other equity securities the portfolio manager believes will go down in price. The fund may also take long and short positions in derivative instruments that provide exposure to the equity markets, including swaps, options, futures, and other index-based instruments. The fund’s investments may include holdings across different industries, sectors, and regions. The fund normally invests in issuers from several different countries, including the United States. The fund may, under unusual circumstances, invest in a single country. The fund may also have significant exposure to emerging markets.
JANUS GLOBAL REAL ESTATE FUND seeks total return through a combination of capital appreciation and current income. The fund invests, under normal circumstances, at least 80% of its net assets plus the amount of any borrowings for investment purposes in equity and debt securities of real estate-related companies. Such companies may include those in the real estate industry or real estate-related industries. These securities may include common stocks, preferred stocks, and other equity securities, including, but not limited to, real estate investment trusts (“REITs”) and similar REIT-like entities. As a fundamental policy, the fund will concentrate 25% or more of its net assets in securities of issuers in real estate or real estate-related industries. The fund’s investment in companies engaged in businesses outside the real estate industry which possess significant real estate holdings will be deemed to be in the real estate industry for purposes
48 | DECEMBER 31, 2011
of the fund’s investment objective and its policy on industry concentration. The fund expects under normal market conditions to maintain investments in issuers from several different developed countries, including the United States. Under unusual circumstances, the fund may invest all of its assets in a single country. The fund may invest in emerging markets but will normally limit such investments to 15% of its net assets, measured at the time of purchase.
JANUS GLOBAL RESEARCH FUND seeks long-term growth of capital. The fund pursues its investment objective by investing primarily in common stocks selected for their growth potential. The fund may invest in companies of any size located anywhere in the world, from larger, well-established companies to smaller, emerging growth companies. The fund normally invests at least 40% of its net assets in securities of issuers from different countries located throughout the world, excluding the United States. The fund may have significant exposure to emerging markets. The fund may also invest in foreign equity and debt securities.
JANUS GLOBAL SELECT FUND seeks long-term growth of capital. The fund pursues its investment objective by normally investing primarily in a core group of 30-50 domestic and foreign common stocks selected for their growth potential and normally investing at least 40% of its net assets in securities of issuers from different countries located throughout the world, excluding the United States. The fund may invest in companies of any size, located anywhere in the world, from larger, well-established companies to smaller, emerging growth companies. The fund may also invest in U.S. and foreign debt securities. The fund may have significant exposure to emerging markets.
JANUS GLOBAL TECHNOLOGY FUND seeks long-term growth of capital. The fund pursues its investment objective by investing, under normal circumstances, at least 80% of its net assets in securities of companies that the portfolio manager believes will benefit significantly from advances or improvements in technology. These companies generally fall into two categories: (i) companies that the portfolio manager believes have or will develop products, processes, or services that will provide significant technological advancements or improvements and (ii) companies that the portfolio manager believes rely extensively on technology in connection with their operations or services. The fund implements this policy by investing primarily in equity securities of U.S. and foreign companies selected for their growth potential. The fund normally invests in issuers from several different countries, which may include the United States. The fund may, under unusual circumstances, invest in a single country. The fund may have significant exposure to emerging markets. The fund may also invest in U.S. and foreign debt securities.
JANUS GROWTH AND INCOME FUND seeks long-term capital growth and current income. The fund pursues its investment objective by normally emphasizing investments in common stocks. The fund will normally invest up to 75% of its assets in equity securities selected primarily for their growth potential and at least 25% of its assets in securities the portfolio manager believes have income potential. Eligible equity securities in which the fund may invest include: (i) domestic and foreign common stocks; (ii) preferred stocks; (iii) securities convertible into common stocks or preferred stocks, such as convertible preferred stocks, bonds, and debentures; and (iv) other securities with equity characteristics.
JANUS INTERNATIONAL EQUITY FUND seeks long-term growth of capital. The fund invests, under normal circumstances, at least 80% of its net assets in equity securities. The fund normally invests in a core group of 60-100 equity securities of issuers from different countries located throughout the world, excluding the United States. The fund may, under unusual circumstances, invest all of its assets in a single country. The fund may invest in emerging markets but will normally limit such investments to 20% of its net assets, measured at the time of purchase. The fund may also invest in foreign debt securities.
JANUS OVERSEAS FUND seeks long-term growth of capital. The fund invests, under normal circumstances, at least 80% of its net assets in securities of issuers from countries outside of the United States. The fund normally invests in securities of issuers from several different countries, excluding the United States. Although the fund typically invests 80% or more of its assets in issuers located outside the United States, it also may normally invest up to 20 of its assets, measured at the time of purchase, in U.S. issuers, and it may, under unusual circumstances, invest all or substantially all of its assets in a single country. The fund may have significant exposure to emerging markets. The fund may also invest in U.S. and foreign debt securities.
JANUS PROTECTED SERIES – GLOBAL seeks long-term growth of capital and capital preservation. The fund seeks growth of capital to the extent consistent with maintaining protection against significant downside movement of the net asset value (“NAV”) per share of each share class of the fund. Specifically, the portfolio manager manages the fund’s assets in an effort to ensure that the NAV for any share class will not fall below 80% of the highest NAV attained separately by each share class during the life of the fund, reduced for dividends, distributions, any extraordinary expenses, and certain extraordinary items
Janus Asset Allocation Funds | 49
Notes to Financial Statements (unaudited) (continued)
(for each share class, the “Protected NAV”). In order to minimize the effect of equity market volatility on the NAV per share for a share class, the fund allocates its portfolio assets between two investment components. Through its first component, the “Equity Component,” the fund seeks to achieve growth of capital by investing primarily in common stocks selected for their growth potential. The fund may invest in companies of any size located anywhere in the world, from larger, well-established companies to smaller, emerging growth companies. The fund normally invests at least 40% of its net assets in securities of issuers or companies from different countries located throughout the world, excluding the United States. The fund may have significant exposure to emerging markets. As part of the Equity Component, the fund may also invest in foreign equity and debt securities. The Equity Component may also consist of derivatives such as swaps, futures, and options. Through its second component, the “Protection Component,” the fund seeks to limit downside risk by investing in cash and other investments including, but not limited to, money market instruments, U.S. Treasuries, and other equity market risk reducing instruments, such as short index futures. Due to equity market conditions and the fund’s overall risk profile, the amount of fund assets allocated to the Protection Component may, at times, be significant. The fund’s allocation between the Equity Component and the Protection Component will vary over time. Up to 100% of assets may be allocated to either component.
JANUS PROTECTED SERIES – GROWTH seeks long-term growth of capital and capital preservation. The fund seeks growth of capital to the extent consistent with maintaining protection against significant downside movement of the NAV per share of each share class of the fund. Specifically, the portfolio manager manages the fund’s assets in an effort to ensure that the NAV for any share class will not fall below 80% of the highest NAV attained separately by each share class during the life of the fund, reduced for dividends, distributions, any extraordinary expenses, and certain extraordinary items (for each share class, the “Protected NAV”). In order to minimize the effect of equity market volatility on the NAV per share for a share class, the fund allocates its portfolio assets between two investment components. Through its first component, the “Equity Component,” the fund seeks to achieve growth of capital by investing primarily in common stocks selected for their growth potential. Although the fund may invest in companies of any size, it generally invests in larger, more established companies. The Equity Component may also consist of derivatives such as swaps, futures, and options. Through its second component, the “Protection Component,” the fund seeks to limit downside risk by investing in cash and other investments including, but not limited to, money market instruments, U.S. Treasuries, and other equity market risk reducing instruments, such as short index futures. Due to equity market conditions and the fund’s overall risk profile, the amount of fund assets allocated to the Protection Component may, at times, be significant. The fund’s allocation between the Equity Component and the Protection Component will vary over time. Up to 100% of assets may be allocated to either component.
JANUS REAL RETURN ALLOCATION FUND seeks real return consistent with preservation of capital. Under normal market conditions, the fund seeks to allocate its assets among the following inflation-related investment categories: global inflation-linked securities, commodity-linked investments, emerging market debt, emerging market equity, global real estate, and short-duration debt. Inflation-related investment categories are those which may provide what is known as “real return,” or a rate of return above the rate of inflation over a market cycle. The fund has wide flexibility to allocate assets across categories, and may at times, allocate assets to less than all categories. The fund’s Allocation Committee utilizes a “top down” analysis of macroeconomic factors to determine the overall allocation to each of the fund’s investment categories. Individual portfolio managers generally utilize a “bottom up” approach in choosing investments where the portfolio managers look at companies one at a time to determine if an investment is an attractive investment opportunity and if it is consistent with the fund’s investment policies, but may also consider macroeconomic factors.
JANUS RESEARCH FUND seeks long-term growth of capital. The fund pursues its investment objective by investing primarily in common stocks selected for their growth potential. The fund may invest in companies of any size, from larger, well-established companies to smaller, emerging growth companies.
JANUS TRITON FUND seeks long-term growth of capital. The fund pursues its investment objective by investing primarily in common stocks selected for their growth potential. In pursuing that objective, the fund invests in equity securities of small- and medium-sized companies. Generally, small- and medium-sized companies have a market capitalization of less than $10 billion.
JANUS TWENTY FUND seeks long-term growth of capital. The fund pursues its investment objective by normally investing primarily in a core group of 20-30 common stocks selected for their growth potential.
JANUS VENTURE FUND seeks capital appreciation. The fund pursues its investment objective by investing at least 50% of its equity assets in small-sized companies. The fund may also invest in larger companies with strong growth potential or relatively well-known and large
50 | DECEMBER 31, 2011
companies with potential for capital appreciation. Small-sized companies are defined by the portfolio managers as those companies whose market capitalization falls within the range of companies in the Russell 2000® Growth Index. Companies whose capitalization or revenues fall outside these ranges after the fund’s initial purchase continue to be considered small-sized.
JANUS WORLDWIDE FUND seeks long-term growth of capital. The fund pursues its investment objective by investing primarily in equity securities, which include, but are not limited to, common stocks, preferred stocks, and depositary receipts of companies of any size located throughout the world. The fund normally invests in issuers from several different countries, including the United States. The fund may, under unusual circumstances, invest in a single country. The fund may have significant exposure to emerging markets. The fund may also invest in foreign equity and debt securities.
PERKINS GLOBAL VALUE FUND seeks capital appreciation. The fund pursues its investment objective by investing primarily in common stocks of companies of any size located throughout the world, including emerging markets. The fund normally invests in issuers from several different countries, which may include the United States. The fund may, under unusual circumstances, invest in a single country. The fund may have significant exposure to emerging markets. The fund may also invest in U.S. and foreign equity and debt securities.
PERKINS LARGE CAP VALUE FUND seeks capital appreciation. The fund pursues its investment objective by investing primarily in common stocks selected for their capital appreciation potential. The fund primarily invests in the common stocks of large-sized companies whose stock prices the portfolio managers believe to be undervalued. The fund invests, under normal circumstances, at least 80% of its net assets in equity securities of companies having, at the time of purchase, market capitalizations equal to or greater than the median market capitalization of companies included in the Russell 1000® Value Index. The fund may also invest in foreign equity and debt securities, which may include investments in emerging markets. The fund may invest, under normal circumstances, up to 20% of its assets in securities of companies having market capitalizations outside of the aforementioned market capitalization ranges or in cash or cash equivalents.
PERKINS MID CAP VALUE FUND seeks capital appreciation. The fund pursues its investment objective by investing primarily in common stocks selected for their capital appreciation potential. The fund primarily invests in the common stocks of mid-sized companies whose stock prices the portfolio managers believe to be undervalued. The fund invests, under normal circumstances, at least 80% of its net assets in equity securities of companies whose market capitalization falls, at the time of purchase, within the 12-month average of the capitalization range of the Russell Midcap® Value Index. The fund may also invest in foreign equity and debt securities, which may include investments in emerging markets. The fund may invest, under normal circumstances, up to 20% of its assets in securities of companies having market capitalizations outside of the aforementioned market capitalization ranges or in cash or cash equivalents.
PERKINS SELECT VALUE FUND seeks capital appreciation. The fund pursues its investment objective by investing primarily in common stocks selected for their capital appreciation potential. The fund primarily invests in the common stocks of companies of any size whose stock prices the portfolio managers believe to be undervalued. The fund may also invest in foreign equity and debt securities, which may include investments in emerging markets.
PERKINS SMALL CAP VALUE FUND seeks capital appreciation. The fund pursues its investment objective by investing primarily in the common stocks of small companies whose stock prices are believed to be undervalued by the fund’s portfolio managers. The fund invests, under normal circumstances, at least 80% of its net assets in equity securities of small companies whose market capitalization, at the time of initial purchase, is less than the 12-month average of the maximum market capitalization for companies included in the Russell 2000® Value Index. The fund may also invest in foreign equity and debt securities, which may include investments in emerging markets. The fund may invest, under normal circumstances, up to 20% of its assets in securities of companies having market capitalizations outside of the aforementioned market capitalization ranges or in cash or cash equivalents.
PERKINS VALUE PLUS INCOME FUND seeks capital appreciation and current income. The fund pursues its investment objective by normally investing 40-60% of its assets in equity securities selected primarily for capital appreciation and investing the remainder in fixed-income securities and cash equivalents. The fund’s equity investments generate total return from a combination of capital appreciation and, to a lesser degree, current income. Such equity investments may include companies of any size, but the fund will invest primarily in large- and mid-sized companies whose stock prices the portfolio managers believe to be undervalued or have the potential for high relative dividend yields, or both. The fund’s fixed-income investments generate total return from a combination of current income and capital appreciation, but income is usually the dominant portion. The fund
Janus Asset Allocation Funds | 51
Notes to Financial Statements (unaudited) (continued)
normally invests the portion of its assets allocated to fixed-income investments in debt securities (including, but not limited to, government bonds, corporate bonds, mortgage-backed securities, and zero-coupon bonds), convertible securities, and short-term securities. The fund invests at least 50% of the fixed-income portion of its assets in investment grade debt securities. The fund will limit its investment in high-yield/high-risk bonds, also known as “junk” bonds, to 50% or less of the fixed-income portion of its net assets.
POTENTIAL UNDERLYING FUNDS INCLUDED IN THE FIXED-INCOME SECURITIES ASSET CATEGORY
JANUS FLEXIBLE BOND FUND seeks to obtain maximum total return, consistent with preservation of capital. The fund pursues its investment objective by primarily investing, under normal circumstances, at least 80% of its net assets in bonds. Bonds include, but are not limited to, government bonds, corporate bonds, convertible bonds, mortgage-backed securities, and zero-coupon bonds. The fund will invest at least 65% of its assets in investment grade debt securities. The fund will limit its investment in high-yield/high-risk bonds, also known as “junk bonds,” to 35% or less of its net assets. The fund generates total return from a combination of current income and capital appreciation, but income is usually the dominant portion.
JANUS GLOBAL BOND FUND seeks total return, consistent with preservation of capital. The fund pursues its investment objective by investing, under normal circumstances, at least 80% of its net assets in bonds. Bonds include, but are not limited to, corporate bonds, government bonds, convertible bonds, mortgage-backed securities, and zero-coupon bonds. The fund invests in securities of issuers located in developed and emerging market countries. The fund may invest across all fixed-income sectors, including U.S. and non-U.S. government securities. The fund’s investments may be denominated in local currency or U.S. dollar-denominated. The fund may invest in debt securities with a range of maturities from short- to long-term. The fund may invest up to 35% of its net assets in high-yield/high-risk debt securities. The fund may also invest in preferred and common stock, money market instruments, municipal bonds, commercial and residential mortgage-backed securities, asset-backed securities, other securitized and structured debt products, private placements, and other investment companies, including ETFs. The fund may also invest in floating rate loans, buy backs or dollar rolls, and reverse repurchase agreements.
JANUS HIGH-YIELD FUND seeks to obtain high current income. Capital appreciation is a secondary investment objective when consistent with its primary objective. The fund pursues its investment objectives by investing, under normal circumstances, at least 80% of its net assets in high-yield/high-risk securities rated below investment grade. Securities rated below investment grade may include their unrated equivalents or other high-yielding securities the portfolio managers believe offer attractive risk/return characteristics. The fund may at times invest all of its assets in such securities.
JANUS SHORT-TERM BOND FUND seeks as high a level of current income as is consistent with preservation of capital. The fund invests, under normal circumstances, at least 80% of its net assets in short- and intermediate-term securities such as corporate bonds or notes or government securities, including agency securities. The fund may invest up to 35% of its net assets in high-yield/high-risk bonds, also known as “junk bonds.” The fund expects to maintain an average-weighted effective maturity of three years or less under normal circumstances.
The following accounting policies have been followed by the Funds and are in conformity with accounting principles generally accepted in the United States of America within the investment management industry.
Investment Valuation
A Fund’s NAV is partially calculated based upon the NAV of each of the underlying funds in which the Fund invests on the day of valuation. The NAV for each class of an underlying fund is computed by dividing the total value of securities and other assets allocated to the class, less liabilities allocated to that class, by the total number of shares outstanding for the class.
Securities held by the underlying funds are valued at the last sales price or the official closing price for securities traded on a principal securities exchange (U.S. or foreign) and on the NASDAQ National Market. Securities held by the underlying funds traded on over-the-counter (“OTC”) markets and listed securities for which no sales are reported are valued at the latest bid price (or yield equivalent thereof) obtained from one or more dealers transacting in a market for such securities or by a pricing service approved by the underlying funds’ Trustees. Short-term securities held by the underlying funds with maturities of 60 days or less may be valued at amortized cost, which approximates market value. Debt securities held by the underlying funds with a remaining maturity of greater than 60 days are valued in accordance with the evaluated bid price supplied by the pricing service. The evaluated bid price supplied by the pricing service is an evaluation that reflects such factors as security prices, yields, maturities and ratings. Short positions shall be valued in accordance with the same methodologies, except that in the event that a last sale price is not
52 | DECEMBER 31, 2011
available, the latest ask price shall be used instead of a bid price. Foreign securities and currencies held by the underlying funds are converted to U.S. dollars using the applicable exchange rate in effect as of the daily close of the New York Stock Exchange (“NYSE”). When market quotations are not readily available or deemed unreliable, or events or circumstances that may affect the value of portfolio securities held by the underlying funds are identified between the closing of their principal markets and the time the NAV is determined, securities may be valued at fair value as determined in good faith under procedures established by and under the supervision of the underlying funds’ Trustees. Circumstances in which fair value pricing may be utilized include, but are not limited to: (i) a significant event that may affect the securities of a single issuer, such as a merger, bankruptcy, or significant issuer specific development; (ii) an event that may affect an entire market, such as a natural disaster or significant governmental action; (iii) a nonsignificant event such as a market closing early or not opening, or a security trading halt; and (iv) pricing of a non-valued security and a restricted or non-public security. The underlying funds may use systematic fair valuation models provided by independent third parties to value international equity securities in order to adjust for stale pricing, which may occur between the close of certain foreign exchanges and the close of the NYSE. Restricted and illiquid securities are valued in accordance with procedures established by the underlying funds’ Trustees.
Investment Transactions and Investment Income
Investment transactions are accounted for as of the date purchased or sold (trade date). Dividend income is recorded on the ex-dividend date. Certain dividends from foreign securities held by the underlying funds will be recorded as soon as the Trust is informed of the dividend, if such information is obtained subsequent to the ex-dividend date. Dividends from foreign securities may be subject to withholding taxes in foreign jurisdictions. Interest income of the underlying funds is recorded on the accrual basis and includes amortization of premiums and accretion of discounts. Gains and losses are determined on the identified cost basis, which is the same basis used for federal income tax purposes. Income, as well as gains and losses, both realized and unrealized, are allocated daily to each class of shares based upon the ratio of net assets represented by each class as a percentage of total net assets.
Expenses
Each Fund bears expenses incurred specifically on its behalf, as well as a portion of general expenses, which may be allocated pro rata to each of the Funds in the Trust. Additionally, each Fund, as a shareholder in the underlying funds, will also indirectly bear its pro rata share of the expenses incurred by the underlying funds. Each class of shares bears expenses incurred specifically on its behalf and, in addition, each class bears a portion of general expenses, which are allocated daily to each class of shares based upon the ratio of net assets represented by each class as a percentage of total net assets. Expenses directly attributable to a specific class of shares are charged against the operations of such class.
Estimates
The preparation of financial statements in conformity with accounting principles generally accepted in the United States of America requires management to make estimates and assumptions that affect the reported amount of assets and liabilities and disclosure of contingent assets and liabilities at the date of the financial statements, and the reported amounts of income and expenses during the reporting period. Actual results could differ from those estimates.
Foreign Currency Translations
The underlying funds do not isolate that portion of the results of operations resulting from the effect of changes in foreign exchange rates on investments from the fluctuations arising from changes in market prices of securities held at the date of the financial statements. Net unrealized appreciation or depreciation of investments and foreign currency translations arise from changes in the value of assets and liabilities, including investments in securities held at the date of the financial statements, resulting from changes in the exchange rates and changes in market prices of securities held.
Currency gains and losses of the underlying funds are also calculated on payables and receivables that are denominated in foreign currencies. The payables and receivables are generally related to foreign security transactions and income translations.
Foreign currency-denominated assets and forward currency contracts of the underlying funds may involve more risks than domestic transactions, including currency risk, political and economic risk, regulatory risk and equity risk. Risks may arise from the potential inability of a counterparty to meet the terms of a contract and from unanticipated movements in the value of foreign currencies relative to the U.S. dollar.
Dividend Distributions
The Funds generally declare and distribute dividends of net investment income and realized capital gains (if any) annually. The majority of dividends and capital gains distributions from a Fund may be automatically reinvested
Janus Asset Allocation Funds | 53
Notes to Financial Statements (unaudited) (continued)
into additional shares of that Fund, based on the discretion of the shareholder.
The underlying funds may make certain investments in REITs which pay dividends to their shareholders based upon funds available from operations. It is quite common for these dividends to exceed the REITs’ taxable earnings and profits, resulting in the excess portion of such dividends being designated as a return of capital. If the underlying funds distribute such amounts, such distributions could constitute a return of capital to shareholders for federal income tax purposes.
Federal Income Taxes
No provision for income taxes is included in the accompanying financial statements as the Funds intend to distribute to shareholders all taxable investment income and realized gains and otherwise comply with Subchapter M of the Internal Revenue Code applicable to regulated investment companies.
In accordance with the Financial Accounting Standards Board (“FASB”) guidance, the Funds adopted the provisions of “Income Taxes.” These provisions require an evaluation of tax positions taken (or expected to be taken) in the course of preparing a Fund’s tax return to determine whether these positions meet a “more-likely-than-not” standard that, based on the technical merits, have a more than fifty percent likelihood of being sustained by a taxing authority upon examination. A tax position that meets the “more-likely-than-not” recognition threshold is measured to determine the amount of benefit to recognize in the financial statements. The Funds recognize interest and penalties, if any, related to unrecognized tax benefits in income tax expense on the Statements of Operations.
These provisions require management of the Funds to analyze all open tax years, as defined by the Statute of Limitations, for all major jurisdictions, including federal tax authorities and certain state tax authorities. As of and during the period ended December 31, 2011, the Funds did not have a liability for any unrecognized tax benefits. The Funds have no examinations in progress and are not aware of any tax positions for which it is reasonably possible that the total amounts of unrecognized tax benefits will significantly change in the next twelve months.
On December 22, 2010, the Regulated Investment Company Modernization Act of 2010 (the “Modernization Act”) was signed by the President. The Modernization Act is the first major piece of legislation affecting Regulated Investment Companies (“RICs”) since 1986 and it modernizes several of the federal income and excise tax provisions related to RICs. Some of the enacted provisions include:
New capital losses may now be carried forward indefinitely, and retain the character of the original loss. Under pre-enactment law, capital losses could be carried forward for eight years, and carried forward as short-term capital, irrespective of the character of the original loss.
The Modernization Act contains simplification provisions, which are aimed at preventing disqualification of a RIC for “inadvertent” failures of the asset diversification and/or qualifying income tests. Additionally, the Modernization Act exempts RICs from the preferential dividend rule, and repeals the 60-day designation requirement for certain types of pay-through income and gains.
Finally, the Modernization Act contains several provisions aimed at preserving the character of distributions made by a fiscal year RIC during the portion of its taxable year ending after October 31 or December 31, reducing the circumstances under which a RIC might be required to file amended Forms 1099 to restate previously reported distributions.
Except for the simplification provisions related to RIC qualification, the Modernization Act is effective for taxable years beginning after December 22, 2010. The provisions related to RIC qualification are effective for taxable years for which the extended due date of the tax return is after December 22, 2010.
Valuation Inputs Summary
In accordance with FASB guidance, the Funds utilize the “Fair Value Measurements” to define fair value, establish a framework for measuring fair value, and expand disclosure requirements regarding fair value measurements. The Fair Value Measurement Standard does not require new fair value measurements, but is applied to the extent that other accounting pronouncements require or permit fair value measurements. This standard emphasizes that fair value is a market-based measurement that should be determined based on the assumptions that market participants would use in pricing an asset or liability. Various inputs are used in determining the value of the Funds’ investments defined pursuant to this standard. These inputs are summarized into three broad levels:
Level 1 – Quoted prices in active markets for identical securities.
Level 2 – Prices determined using other significant observable inputs. Observable inputs are inputs that reflect the assumptions market participants would use in pricing a security and are developed based on market data obtained from sources independent of the reporting entity. These may include quoted prices
54 | DECEMBER 31, 2011
for similar securities, interest rates, prepayment speeds, credit risk, and others.
Debt securities are valued in accordance with the evaluated bid price supplied by the pricing service and generally categorized as Level 2 in the hierarchy. Securities traded on OTC markets and listed securities for which no sales are reported are valued at the latest bid price (or yield equivalent thereof) obtained from one or more dealers transacting in a market for such securities or by a pricing service approved by the Funds’ Trustees and are categorized as Level 2 in the hierarchy. Short-term securities with maturities of 60 days or less are valued at amortized cost, which approximates market value and are categorized as Level 2 in the hierarchy. Other securities that are categorized as Level 2 in the hierarchy include, but are not limited to, preferred stocks, bank loans, American Depositary Receipts (ADRs), Global Depositary Receipts (GDRs), warrants, swaps, investments in mutual funds, OTC options, and forward contracts. The Funds may use systematic fair valuation models provided by independent third parties to value international equity securities in order to adjust for stale pricing, which may occur between the close of certain foreign exchanges and the close of the NYSE. These are generally categorized as Level 2 in the hierarchy.
Level 3 – Prices determined using significant unobservable inputs. In situations where quoted prices or observable inputs are unavailable or deemed less relevant (for example, when there is little or no market activity for an investment at the end of the period), unobservable inputs may be used. Unobservable inputs are inputs that reflect the reporting entity’s own assumptions about the factors market participants would use in pricing the security and would be based on the best information available under the circumstances.
For restricted equity securities and private placements where observable inputs are limited, assumptions about market activity and risk are used in employing valuation techniques such as the market approach, the income approach, or the cost approach, as defined under the FASB Guidance. These are categorized as Level 3 in the hierarchy.
There have been no significant changes in valuation techniques used in valuing any such positions held by the Funds since the beginning of the period.
The inputs or methodology used for valuing securities are not necessarily an indication of the risk associated with investing in those securities. The summary of inputs used as of December 31, 2011 to value the Funds’ investments in securities and other financial instruments is included in the “Valuation Inputs Summary” and “Level 3 Valuation Reconciliation of Assets” (if applicable) in the Notes to Schedules of Investments.
The Funds adopted FASB Accounting Standards Update “Fair Value Measurements and Disclosures” (the “Update”). This Update applies to a Fund’s disclosures about transfers in and out of Level 1 and Level 2 of the fair value hierarchy and the reasons for the transfers. Disclosures about the valuation techniques and inputs used to measure fair value for investments that fall in either Level 2 or Level 3 fair value hierarchy are summarized under the Level 2 and Level 3 categories listed above. There were no transfers between Level 1 and Level 2 of the fair value hierarchy during the period.
There were no Level 3 securities during the period.
The Funds recognize transfers between the levels as of the beginning of the period.
| |
| 2. | Derivative Instruments |
The underlying funds may invest in various types of derivatives, which may at times result in significant derivative exposure. A derivative is a financial instrument whose performance is derived from the performance of another asset. The underlying funds may invest in derivative instruments including, but not limited to: futures contracts, put options, call options, options on swap contracts, options on future contracts, options on foreign currencies, swaps, forward contracts, structured investments, and other equity-linked derivatives.
The underlying funds may use derivative instruments for hedging (to offset risks associated with an investment, currency exposure, or market conditions) or for speculative (to seek to enhance returns) purposes. When the underlying funds invest in a derivative for speculative purposes, the underlying funds will be fully exposed to the risks of loss of that derivative, which may sometimes be greater than the cost of the derivative. The underlying funds may not use any derivative to gain exposure to an asset or class of assets prohibited by their investment restrictions from purchasing directly. An underlying fund’s ability to use derivative instruments may also be limited by tax considerations.
Investments in derivatives are generally subject to market risks that may cause their prices to fluctuate over time. Investments in derivatives may not directly correlate with the price movements of the underlying instrument. As a result, the use of derivatives may expose the underlying funds to additional risks that they would not be subject to if they invested directly in the securities underlying those derivatives. The use of derivatives may result in larger
Janus Asset Allocation Funds | 55
Notes to Financial Statements (unaudited) (continued)
losses or smaller gains than otherwise would be the case. Derivatives can be volatile and may involve significant risks, including, but not limited to, counterparty risk, credit risk, currency risk, equity risk, index risk, interest rate risk, leverage risk, and liquidity risk.
Derivatives may generally be traded OTC or on an exchange. Derivatives traded OTC, such as options and structured notes, are agreements that are individually negotiated between parties and can be tailored to meet a purchaser’s needs.
OTC derivatives are not guaranteed by a clearing agency and may be subject to increased credit risk. In an effort to mitigate credit risk associated with derivatives traded OTC, certain underlying funds may enter into collateral agreements with certain counterparties whereby, subject to certain minimum exposure requirements, certain underlying funds may require the counterparty to post collateral if an underlying fund has a net aggregate unrealized gain on all OTC derivative contracts with a particular counterparty. There is no guarantee that counterparty exposure is reduced and these arrangements are dependent on Janus Capital’s ability to establish and maintain appropriate systems and trading.
In pursuit of their investment objectives, each underlying fund may seek to use derivatives to increase or decrease exposure to the following market risk factors:
| | |
| | • | Counterparty Risk – Counterparty risk is the risk that the counterparty (the party on the other side of the transaction) on a derivative transaction will be unable to honor its financial obligation to an underlying fund. |
| |
| | • | Credit Risk – Credit risk is the risk an issuer will be unable to make principal and interest payments when due, or will default on its obligations. |
| |
| | • | Currency Risk – Currency risk is the risk that changes in the exchange rate between currencies will adversely affect the value (in U.S. dollar terms) of an investment. |
| |
| | • | Equity Risk – Equity risk relates to the change in value of equity securities as they relate to increases or decreases in the general market. |
| |
| | • | Index Risk – If the derivative is linked to the performance of an index, it will be subject to the risks associated with changes in that index. If the index changes, an underlying fund could receive lower interest payments or experience a reduction in the value of the derivative to below what the underlying fund paid. Certain indexed securities, including inverse securities (which move in an opposite direction to the index), may create leverage, to the extent that they increase or decrease in value at a rate that is a multiple of the changes in the applicable index. |
| |
| | • | Interest Rate Risk – Interest rate risk is the risk that the value of fixed-income securities will generally decline as prevailing interest rates rise, which may cause an underlying fund’s NAV to likewise decrease, and vice versa. |
| |
| | • | Leverage Risk – Leverage risk is the risk associated with certain types of leveraged investments or trading strategies pursuant to which relatively small market movements may result in large changes in the value of an investment. An underlying fund creates leverage by using borrowed capital to increase the amount invested, or investing in instruments, including derivatives, where the investment loss can exceed the original amount invested. Certain investments or trading strategies that involve leverage can result in losses that greatly exceed the amount originally invested. |
| |
| | • | Liquidity Risk – Liquidity risk is the risk that certain securities may be difficult or impossible to sell at the time that the seller would like or at the price that the seller believes the security is currently worth. |
In accordance with FASB guidance, the Funds adopted the provisions for “Derivatives and Hedging,” which require qualitative disclosures about objectives and strategies for using derivatives, quantitative disclosures about fair value amounts of and gains and losses on derivative instruments, and disclosures about credit-risk-related contingent features in derivative agreements.
There were no derivatives held by the Funds during the period ended December 31, 2011.
| |
| 3. | Other Investments and Strategies |
Additional Investment Risk
The underlying funds, particularly Janus Flexible Bond Fund, Janus Global Bond Fund, Janus High-Yield Fund and Janus Short-Term Bond Fund, may be invested in lower-rated debt securities that have a higher risk of default or loss of value since these securities may be sensitive to economic changes, political changes or adverse developments specific to the issuer. INTECH International Fund, INTECH U.S. Core Fund, INTECH U.S. Growth Fund, and INTECH U.S. Value Fund (the “Mathematical funds”) do not intend to invest in high-yield/high-risk bonds.
56 | DECEMBER 31, 2011
It is important to note that events in both domestic and international equity and fixed-income markets have resulted, and may continue to result, in an unusually high degree of volatility in the markets, with issuers that have exposure to the real estate, mortgage, and credit markets particularly affected. These events and the resulting market upheavals may have an adverse effect on an underlying fund, such as a decline in the value and liquidity of many securities held by the underlying fund, unusually high and unanticipated levels of redemptions, an increase in portfolio turnover, a decrease in NAV, and an increase in underlying fund expenses. Because the situation is unprecedented and widespread, it may also be unusually difficult to identify both investment risks and opportunities, which could limit or preclude an underlying fund’s ability to achieve its investment objective. It is impossible to predict whether or for how long these conditions will continue. Therefore, it is important to understand that the value of your investment may fall, sometimes sharply, and you could lose money.
Further, the instability experienced in the financial markets has resulted in the U.S. Government and various other governmental and regulatory entities taking actions to address the financial crisis. These actions include, but are not limited to, the enactment of the Dodd-Frank Wall Street Reform and Consumer Protection Act (the “Dodd-Frank Act”) in July 2010 which is expected to dramatically change the way in which the U.S. financial system is supervised and regulated. More specifically, the Dodd-Frank Act provides for widespread regulation of financial institutions, consumer financial products and services, broker-dealers, over-the-counter derivatives, investment advisers, credit rating agencies, and mortgage lending, which expands federal oversight in the financial sector and may affect the investment management industry as a whole. Given the broad scope, sweeping nature, and the fact that many provisions of the Dodd-Frank Act must be implemented through future rulemaking, the ultimate impact of the Dodd-Frank Act, and any resulting regulation, is not yet certain. As a result, there can be no assurance that these government and regulatory measures will not have an adverse effect on the value or marketability of securities held by an underlying fund including potentially limiting or completely restricting the ability of the underlying fund to use a particular investment instrument as part of its investment strategy, increasing the costs of using these instruments, or possibly making them less effective in general. Furthermore, no assurance can be made that the U.S. Government or any U.S. regulatory entity (or other authority or regulatory entity) will not continue to take further legislative or regulatory action in response to the economic crisis or otherwise, and the effect of such actions, if taken, cannot be known.
Certain areas of the world have historically been prone to and economically sensitive to environmental events such as, but not limited to, hurricanes, earthquakes, typhoons, flooding, tidal waves, tsunamis, erupting volcanoes, wildfires or droughts, tornadoes, mudslides, or other weather-related phenomena. Such disasters, and the resulting physical or economic damage, could have a severe and negative impact on a Fund’s or an underlying fund’s investment portfolio and, in the longer term, could impair the ability of issuers in which the Fund or the underlying fund invests to conduct their businesses as they would under normal conditions. Adverse weather conditions may also have a particularly significant negative effect on issuers in the agricultural sector and on insurance companies that insure against the impact of natural disasters.
Bank Loans
Certain underlying funds, particularly Janus Balanced Fund, Janus Flexible Bond Fund, Janus Global Bond Fund, Janus Global Market Neutral Fund, Janus Global Technology Fund, Janus High-Yield Fund, Janus Short-Term Bond Fund, and Perkins Value Plus Income Fund, may invest in bank loans, which include institutionally traded floating rate securities generally acquired as an assignment from another holder of, or participation interest in, loans originated by a bank or financial institution (the “Lender”) that acts as agent for all holders. The agent administers the terms of the loan, as specified in the loan agreement. When investing in a loan participation, the underlying funds have the right to receive payments of principal, interest and any fees to which they are entitled only from the Lender selling the loan agreement and only upon receipt by the Lender of payments from the borrower. The underlying funds generally have no right to enforce compliance with the terms of the loan agreement with the borrower. Assignments and participations involve credit, interest rate, and liquidity risk. Interest rates on floating rate securities adjust with general interest rate changes and/or issuer credit quality. The interest rates paid on a floating rate security in which the underlying funds invest generally are readjusted periodically to an increment over a designated benchmark rate, such as the one-month, three-month, six-month, or one-year London Interbank Offered Rate (“LIBOR”). LIBOR is a short-term interest rate that banks charge one another and is generally representative of the most competitive and current cash rates.
The underlying funds may have difficulty trading assignments and participations to third parties. There may be restrictions on transfer and only limited opportunities may exist to sell such securities in secondary markets. As a result, the underlying funds may be unable to sell assignments or participations at the desired time or may
Janus Asset Allocation Funds | 57
Notes to Financial Statements (unaudited) (continued)
be able to sell only at a price less than fair market value. The underlying funds utilize an independent third party to value individual bank loans on a daily basis.
Borrowing
The underlying Janus Global Market Neutral Fund may borrow money from banks for investment purposes to the extent permitted by the 1940 Act. This practice is known as leverage. Currently, under the 1940 Act, Janus Global Market Neutral Fund may borrow from banks up to one-third of its total assets (including the amount borrowed) provided that it maintains continuous asset coverage of 300% with respect to such borrowings and sells (within three days) sufficient portfolio holdings to restore such coverage if it should decline to less than 300% due to market fluctuations or otherwise, even if disadvantageous from an investment standpoint. Janus Global Market Neutral Fund may also borrow money to meet redemptions in order to avoid forced, unplanned sales of portfolio securities or for other temporary or emergency purposes. This allows Janus Global Market Neutral Fund greater flexibility to buy and sell portfolio securities for investment or tax considerations, rather than for cash flow considerations.
The use of borrowing by Janus Global Market Neutral Fund involves special risk considerations that may not be associated with other funds that may only borrow for temporary or emergency purposes. Because substantially all of Janus Global Market Neutral Fund’s assets fluctuate in value, whereas the interest obligation resulting from a borrowing will be fixed by the terms of Janus Global Market Neutral Fund’s agreement with its lender, the NAV per share of Janus Global Market Neutral Fund will tend to increase more when its portfolio securities increase in value and decrease more when its portfolio securities decrease in value than would otherwise be the case if Janus Global Market Neutral Fund did not borrow funds. In addition, interest costs on borrowings may fluctuate with changing market rates of interest and may partially offset or exceed the return earned on borrowed funds. Under adverse market conditions, Janus Global Market Neutral Fund might have to sell portfolio securities to meet interest or principal payments at a time when fundamental investment considerations would not favor such sales. The interest that Janus Global Market Neutral Fund must pay on borrowed money, together with any additional fees to maintain a line of credit or any minimum average balances required to be maintained, are additional costs that will reduce or eliminate any net investment income and may also offset any potential capital gains. Unless the appreciation and income, if any, on assets acquired with borrowed funds exceed the costs of borrowing, the use of leverage will diminish the investment performance of Janus Global Market Neutral Fund compared with what it would have been without leverage.
Counterparties
Fund or underlying fund transactions involving a counterparty are subject to the risk that the counterparty or a third party will not fulfill its obligation to the Funds or underlying funds (“counterparty risk”). Counterparty risk may arise because of the counterparty’s financial condition (i.e., financial difficulties, bankruptcy, or insolvency), market activities and developments, or other reasons, whether foreseen or not. A counterparty’s inability to fulfill its obligation may result in significant financial loss to a Fund or underlying fund. A Fund or underlying fund may be unable to recover its investment from the counterparty or may obtain a limited recovery, and/or recovery may be delayed. The extent of the Fund’s or underlying fund’s exposure to counterparty risk in respect to financial assets approximates its carrying value as recorded on each respective Statement of Assets and Liabilities, if applicable.
A Fund or underlying fund may be exposed to counterparty risk through participation in various programs including, but not limited to, lending its securities to third parties, cash sweep arrangements whereby a Fund’s or underlying fund’s cash balance is invested in one or more types of cash management vehicles, as well as investments in, but not limited to, repurchase agreements, debt securities, and derivatives, including various types of swaps, futures and options. A Fund or underlying fund intends to enter into financial transactions with counterparties that Janus Capital believes to be creditworthy at the time of the transaction. There is always the risk that Janus Capital’s analysis of a counterparty’s creditworthiness is incorrect or may change due to market conditions. To the extent that a Fund or underlying fund focuses its transactions with a limited number of counterparties, it will have greater exposure to the risks associated with one or more counterparties.
Emerging Market Investing
Within the parameters of its specific investment policies, an underlying fund may invest in securities of issuers or companies from or with exposure to one or more “developing countries” or “emerging markets.” Investing in emerging markets may involve certain risks and considerations not typically associated with investing in the United States and imposes risks greater than, or in addition to, the risks associated with investing in securities of more developed foreign countries. Emerging markets securities are exposed to a number of additional risks, which may result from less government supervision and regulation of business and industry practices (including the potential lack of strict finance and accounting controls
58 | DECEMBER 31, 2011
and standards), stock exchanges, brokers, and listed companies, making these investments potentially more volatile in price and less liquid than investments in developed securities markets, resulting in greater risk to investors. In addition, the underlying fund’s investments may be denominated in foreign currencies and therefore, changes in the value of a country’s currency compared to the U.S. dollar may affect the value of the underlying fund’s investments. To the extent that an underlying fund invests a significant portion of its assets in the securities of issuers in or companies of a single country or region, it is more likely to be impacted by events or conditions affecting that country or region, which could have a negative impact on the underlying fund’s performance.
Exchange-Traded Funds
The underlying funds may invest in exchange-traded funds, which generally are index-based investment companies that hold substantially all of their assets in securities representing their specific index. As a shareholder of another investment company, the underlying funds would bear their pro rata portion of the other investment company’s expenses, including advisory fees, in addition to the expenses the underlying funds bear directly in connection with their own operations.
Exchange-Traded Notes
The underlying funds may invest directly in exchange-traded notes (“ETNs”), which are senior, unsecured, unsubordinated debt securities whose returns are linked to a particular index and provide exposure to the total returns of various market indices, including indices linked to stocks, bonds, commodities and currencies. This type of debt security differs from other types of bonds and notes. ETN returns are based upon the performance of a market index minus applicable fees; no periodic coupon payments are distributed and no principal protections exist. ETNs do not pay cash distributions. Instead, the value of dividends, interest, and investment gains are captured in the underlying funds’ total returns. The underlying funds may invest in these securities when desiring exposure to debt securities or commodities. When evaluating ETNs for investment, Janus Capital will consider the potential risks involved, expected tax efficiency, rate of return, and credit risk. When the underlying funds invest in ETNs, they will bear their proportionate share of any fees and expenses borne by the ETN. There may be restrictions on the underlying funds’ right to redeem their investment in an ETN, which is meant to be held until maturity. The underlying funds’ decision to sell their ETN holdings may be limited by the availability of a secondary market.
Floating Rate Loans
Certain underlying funds, particularly Janus Balanced Fund, Janus Flexible Bond Fund, Janus Global Bond Fund, Janus Global Market Neutral Fund, Janus High-Yield Fund, Janus Short-Term Bond Fund, and Perkins Value Plus Income Fund, may invest in floating rate loans. Floating rate loans are debt securities that have floating interest rates, which adjust periodically, and are tied to a benchmark lending rate, such as LIBOR. In other cases, the lending rate could be tied to the prime rate offered by one or more major U.S. banks or the rate paid on large certificates of deposit traded in the secondary markets. If the benchmark lending rate changes, the rate payable to lenders under the loan will change at the next scheduled adjustment date specified in the loan agreement. Floating rate loans are typically issued to companies (“borrowers”) in connection with recapitalizations, acquisitions, and refinancings. Floating rate loan investments are generally below investment grade. Senior floating rate loans are secured by specific collateral of a borrower and are senior in the borrower’s capital structure. The senior position in the borrower’s capital structure generally gives holders of senior loans a claim on certain of the borrower’s assets that is senior to subordinated debt and preferred and common stock in the case of a borrower’s default. Floating rate loan investments may involve foreign borrowers, and investments may be denominated in foreign currencies. Floating rate loans often involve borrowers whose financial condition is troubled or uncertain and companies that are highly leveraged. The underlying funds may invest in obligations of borrowers who are in bankruptcy proceedings. Floating rate loans may include fully funded term loans or revolving lines of credit.
Purchasers of floating rate loans may pay and/or receive certain fees. The underlying funds may receive fees such as covenant waiver fees or prepayment penalty fees. The underlying funds may pay fees such as facility fees. Such fees may affect the underlying funds’ returns.
Initial Public Offerings
The underlying funds may invest in initial public offerings (“IPOs”). IPOs and other investment techniques may have a magnified performance impact on an underlying fund with a small asset base. An underlying fund may not experience similar performance as its assets grow.
Interfund Lending
As permitted by the Securities and Exchange Commission (“SEC”), or the 1940 Act and rules promulgated thereunder, the underlying funds may be party to interfund lending agreements between the underlying funds and other Janus Capital sponsored mutual funds and certain pooled investment vehicles, which permit them to borrow
Janus Asset Allocation Funds | 59
Notes to Financial Statements (unaudited) (continued)
or lend cash at a rate beneficial to both the borrowing and lending funds. Outstanding borrowings from all sources totaling 10% or more of a borrowing underlying fund’s total assets must be collateralized at 102% of the outstanding principal value of the loan; loans of less than 10% may be unsecured.
Mortgage- and Asset-Backed Securities
The underlying funds may purchase fixed or variable rate mortgage-backed securities issued by the Government National Mortgage Association (“Ginnie Mae”), the Federal National Mortgage Association (“Fannie Mae”), the Federal Home Loan Mortgage Corporation (“Freddie Mac”), or other governmental or government-related entities. Historically, Fannie Maes and Freddie Macs were not backed by the full faith and credit of the U.S. Government, and may not be in the future. In September 2008, the Federal Housing Finance Agency (“FHFA”), an agency of the U.S. Government, placed Fannie Mae and Freddie Mac under conservatorship to provide stability in the financial markets, mortgage availability and taxpayer protection by preserving Fannie Mae’s and Freddie Mac’s assets, and placing them in a sound and solvent condition. Under the conservatorship, the management of Fannie Mae and Freddie Mac was replaced. The effect that the FHFA’s conservatorship will have on Fannie Mae’s and Freddie Mac’s debt and equities is unclear. The underlying funds may purchase other mortgage- and asset-backed securities through single- and multi-seller conduits, collateralized debt obligations, structured investment vehicles, and other similar securities. Asset-backed securities may be backed by automobile loans, equipment leases, credit card receivables, or other collateral. In the event the underlying securities fail to perform, these investment vehicles could be forced to sell the assets and recognize losses on such assets, which could impact the underlying funds’ yield and the underlying funds’ return.
Unlike traditional debt instruments, payments on these securities include both interest and a partial payment of principal. Prepayment risk, which results from prepayments of the principal of underlying loans at a faster pace than expected, may shorten the effective maturities of these securities and may result in an underlying fund having to reinvest proceeds at a lower interest rate. In addition to prepayment risk, investments in mortgage-backed securities, including those comprised of subprime mortgages, and investments in other asset-backed securities comprised of under-performing assets may be subject to a higher degree of credit risk, valuation risk, and liquidity risk. Additionally, although mortgages and mortgage-related securities are generally supported by some form of government or private guarantee and/or insurance, there is no assurance that private guarantors or insurers will meet their obligations.
Mortgage- and asset-backed securities are also subject to extension risk, which is the risk that rising interest rates could cause mortgages or other obligations underlying these securities to be paid more slowly than expected, increasing an underlying fund’s sensitivity to interest changes and causing its price to decline.
Mortgage Dollar Rolls
Certain underlying funds, particularly Janus Flexible Bond Fund, Janus Global Bond Fund, Janus Global Market Neutral Fund, Janus Global Real Estate Fund, Janus High-Yield Fund and Janus Short-Term Bond Fund, may enter into “mortgage dollar rolls.” In a “mortgage dollar roll” transaction, the underlying funds sell a mortgage-related security (such as a Ginnie Mae security) to a dealer and simultaneously agree to repurchase a similar security (but not the same security) in the future at a predetermined price. The underlying funds will not be entitled to receive interest and principal payments while the dealer holds the security. The difference between the sale price and the future purchase price is recorded as an adjustment to investment income of the underlying funds.
The underlying funds’ obligations under a dollar roll agreement must be covered by cash, U.S. Government securities or other liquid high-grade debt obligations equal in value to the securities subject to repurchase by the underlying funds, maintained in a segregated account. To the extent that the underlying funds collateralize their obligations under a dollar roll agreement, the asset coverage requirements of the 1940 Act will not apply to such transactions. Furthermore, under certain circumstances, an underlying mortgage-backed security that is part of a dollar roll transaction may be considered illiquid.
Successful use of mortgage dollar rolls depends on the portfolio managers’ ability to predict interest rates and mortgage payments. Dollar roll transactions involve the risk that the market value of the securities the underlying funds are required to purchase may decline below the agreed upon repurchase price.
Real Estate Investing
The underlying funds may invest in equity and debt securities of U.S. and non-U.S. real estate-related companies. Such companies may include those in the real estate industry or real estate-related industries. These securities may include common stocks, preferred stocks, and other equity securities, including, but not limited to, REITs and similar REIT-like entities such as foreign entities that have REIT characteristics.
60 | DECEMBER 31, 2011
Restricted Security Transactions
Restricted securities held by the underlying funds may not be sold except in exempt transactions or in a public offering registered under the Securities Act of 1933, as amended. The risk of investing in such securities is generally greater than the risk of investing in the securities of widely held, publicly traded companies. Lack of a secondary market and resale restrictions may result in the inability of the underlying funds to sell a security at a fair price and may substantially delay the sale of the security. In addition, these securities may exhibit greater price volatility than securities for which secondary markets exist.
Securities Lending
Under procedures adopted by the Trustees, the underlying funds may seek to earn additional income through lending their securities to certain qualified broker-dealers and institutions on a short-term or long-term basis. The underlying funds may lend portfolio securities on a short-term or long-term basis, in an amount equal to up to 1/3 of their total assets as determined at the time of the loan origination. When an underlying fund lends its securities, it receives collateral (including cash collateral), at least equal to the value of securities loaned. The underlying funds may earn income by investing this collateral in one or more affiliated or nonaffiliated cash management vehicles. It is also possible that, due to a decline in the value of a cash management vehicle, the underlying funds may lose money. There is also the risk that when portfolio securities are lent, the securities may not be returned on a timely basis, and the underlying funds may experience delays and costs in recovering the security or gaining access to the collateral provided to the underlying funds to collateralize the loan. If the underlying funds are unable to recover a security on loan, the underlying funds may use the collateral to purchase replacement securities in the market. There is a risk that the value of the collateral could decrease below the cost of the replacement security by the time the replacement investment is made, resulting in a loss to the underlying funds. Janus Capital intends to manage the cash collateral in an affiliated cash management vehicle and will receive an investment advisory fee for managing such assets.
The borrower pays fees at the underlying funds’ direction to Deutsche Bank AG (the “Lending Agent”). The Lending Agent may retain a portion of the interest earned on the cash collateral invested. The cash collateral invested by the Lending Agent is disclosed on the underlying funds’ Schedules of Investments in their most recent annual or semiannual reports (if applicable). The lending fees and the underlying funds’ portion of the interest income earned on cash collateral are included on the underlying funds’ Statements of Operations in their most recent annual or semiannual reports (if applicable).
Securities Traded on a To-Be-Announced Basis
Certain underlying funds, particularly Janus Flexible Bond Fund, Janus Global Bond Fund, Janus Global Market Neutral Fund, Janus Global Real Estate Fund, Janus High-Yield Fund and Janus Short-Term Bond Fund, may trade securities on a to-be-announced (“TBA”) basis. In a TBA transaction, the underlying funds commit to purchasing or selling securities for which specific information is not yet known at the time of the trade, particularly the face amount and maturity date in Ginnie Mae, Fannie Mae and/or Freddie Mac transactions.
Securities purchased on a TBA basis are not settled until they are delivered to the underlying funds, normally 15 to 45 days later. Beginning on the date the underlying funds enter into a TBA transaction, cash, U.S. Government securities or other liquid high-grade debt obligations are segregated in an amount equal in value to the purchase price of the TBA security. These transactions are subject to market fluctuations and their current value is determined in the same manner as for other securities.
Short Sales
The underlying funds, except the Mathematical funds, may engage in “short sales against the box.” Short sales against the box involve either selling short a security that the underlying funds own or selling short a security that the underlying funds have the right to obtain, for delivery at a specified date in the future. The underlying funds may enter into short sales against the box to hedge against anticipated declines in the market price of portfolio securities. The underlying funds do not deliver from their portfolios the securities sold short and do not immediately receive the proceeds of the short sale. The underlying funds borrow the securities sold short and receive proceeds from the short sale only when they deliver the securities to the lender. If the value of the securities sold short increases prior to the scheduled delivery date, the underlying funds lose the opportunity to participate in the gain.
The underlying funds, except the Mathematical funds, may also engage in other short sales. The underlying funds may engage in short sales when the portfolio managers and/or investment personnel anticipate that a security’s market purchase price will be less than its borrowing price. To complete the transaction, the underlying funds must borrow the security to deliver it to the purchaser and buy that same security in the market to return it to the lender. No more than 10% of the underlying funds’ net assets may be invested in short positions (through short sales of stocks, structured products, futures, swaps, and
Janus Asset Allocation Funds | 61
Notes to Financial Statements (unaudited) (continued)
uncovered written calls). The underlying funds may engage in short sales “against the box” and options for hedging purposes that are not subject to this 10% limit. The underlying Janus Global Market Neutral Fund is not subject to any such limit. Although the potential for gain as a result of a short sale is limited to the price at which an underlying fund sold the security short less the cost of borrowing the security, the potential for loss is theoretically unlimited because there is no limit to the cost of replacing the borrowed security. There is no assurance that the underlying funds will be able to close out a short position at a particular time or at an acceptable price. A gain or a loss will be recognized upon termination of a short sale. Short sales held by the underlying funds are fully collateralized by restricted cash or other securities, which are denoted on the underlying funds’ Schedules of Investments in their most recent annual or semiannual reports (if applicable). The underlying funds are also required to pay the lender of the security any dividends or interest that accrues on a borrowed security during the period of the loan. Depending on the arrangements made with the broker or custodian, an underlying fund may or may not receive any payments (including interest) on collateral it has deposited with the broker. The underlying funds pay stock loan fees, disclosed on their Statements of Operations (if applicable), on assets borrowed from the security broker.
The underlying funds may also enter into short positions through derivative instruments, such as options contracts, futures contracts, and swap agreements, which may expose the underlying funds to similar risks. To the extent that the underlying funds enter into short derivative positions, the underlying funds may be exposed to risks similar to those associated with short sales, including the risk that the underlying funds’ losses are theoretically unlimited.
When-Issued Securities
The underlying funds may purchase or sell securities on a when-issued or forward commitment basis. The price of the underlying securities and date when the securities will be delivered and paid for are fixed at the time the transaction is negotiated. Losses may arise due to changes in the market value of the securities or from the inability of counterparties to meet the terms of the contract. In connection with such purchases, the underlying funds may hold liquid assets as collateral with the underlying funds’ custodian sufficient to cover the purchase price.
| |
| 4. | Investment Advisory Agreements and Other Transactions with Affiliates |
Each Fund pays Janus Capital an investment advisory fee which is calculated daily and paid monthly. The following table reflects each Fund’s contractual investment advisory fee rate (expressed as an annual rate).
| | | | | | | | | |
| | | | | Contractual
| | |
| | | Average
| | Investment
| | |
| | | Daily Net
| | Advisory
| | |
| | | Assets
| | Fee (%)
| | |
| Fund | | of the Fund | | (annual rate) | | |
| |
| |
| Janus Growth Allocation Fund | | | All Asset Levels | | | 0.05 | | |
| Janus Moderate Allocation Fund | | | All Asset Levels | | | 0.05 | | |
| Janus Conservative Allocation Fund | | | All Asset Levels | | | 0.05 | | |
| |
| |
Janus Services LLC (“Janus Services”), a wholly-owned subsidiary of Janus Capital, is the Funds’ and the underlying funds’ transfer agent. In addition, Janus Services provides or arranges for the provision of certain other administrative services including, but not limited to, recordkeeping, accounting, order processing, and other shareholder services for the Funds.
Certain, but not all, intermediaries may charge administrative fees to investors in Class A Shares, Class C Shares, and Class I Shares for administrative services provided on behalf of such investors. These administrative fees are paid by the Class A Shares, Class C Shares, and Class I Shares of the Funds to Janus Services, which uses such fees to reimburse intermediaries. Consistent with the Transfer Agency Agreement between Janus Services and the Funds, Janus Services may negotiate the level, structure, and/or terms of the administrative fees with intermediaries requiring such fees on behalf of the Funds. Janus Capital and its affiliates benefit from an increase in assets that may result from such relationships.
Class D Shares pay an annual administrative services fee of 0.12% of net assets. These administrative services fees are paid by the Shares of a Fund for shareholder services provided by Janus Services.
Janus Services receives an administrative services fee at an annual rate of 0.25% of the average daily net assets of Class S Shares and Class T Shares of each Fund for providing or procuring administrative services to investors in Class S Shares and Class T Shares of the Funds. Janus Services expects to use all or a significant portion of this fee to compensate retirement plan service providers, broker-dealers, bank trust departments, financial advisors, and other financial intermediaries for providing these services. Janus Services or its affiliates may also pay fees for services provided by intermediaries to the extent the fees charged by intermediaries exceed the 0.25% of net assets charged to Class S Shares and Class T Shares of each Fund.
62 | DECEMBER 31, 2011
Services provided by these financial intermediaries may include, but are not limited to, recordkeeping, subaccounting, order processing, providing periodic statements, forwarding prospectuses, shareholder reports, and other materials to existing customers and other administrative services. Order processing includes the submission of transactions through the National Securities Clearing Corporation (“NSCC”) or similar systems, or those processed on a manual basis with Janus Capital.
Janus Distributors LLC (“Janus Distributors”), a wholly-owned subsidiary of Janus Capital, is the distributor of the Funds. The Funds have adopted a Distribution and Shareholder Servicing Plan (the “Plan”) pursuant to Rule 12b-1 under the 1940 Act. The Plan authorizes payments by the Funds at an annual rate, as determined from time to time by the Board of Trustees, of up to 0.25% of the Class A Shares average daily net assets, of up to 1.00% of the Class C Shares average daily net assets, and of up to 0.25% of the Class S Shares average daily net assets. Payments under the Plan are not tied exclusively to actual distribution and shareholder service expenses, and the payments may exceed distribution and shareholder service expenses actually incurred by the Funds. If any of a Fund’s actual distribution and shareholder service expenses incurred during a calendar year are less than the payments made during a calendar year, the Fund will be refunded the difference. Refunds, if any, are included in “Distribution fees and shareholder servicing fees” in the Statements of Operations.
Janus Capital has agreed to reimburse the Funds until at least November 1, 2012 by the amount, if any, that such Fund’s normal operating expenses in any fiscal year, including the investment advisory fee, but excluding any expenses of an underlying fund (acquired fund fees and expenses), class-specific distribution and shareholder servicing fees applicable to Class A Shares, Class C Shares, and Class S Shares, the administrative services fees payable pursuant to the Transfer Agency Agreement (except for networking and omnibus fees), brokerage commissions, interest, dividends, taxes and extraordinary expenses, exceed the annual rates noted below. If applicable, amounts reimbursed to the Funds by Janus Capital are disclosed as “Excess Expense Reimbursement” on the Statements of Operations.
| | | | | | |
| | | Expense
| | |
| Fund | | Limit (%) | | |
| |
| |
| Janus Growth Allocation Fund | | | 0.45 | | |
| Janus Moderate Allocation Fund | | | 0.39 | | |
| Janus Conservative Allocation Fund | | | 0.40 | | |
| |
| |
Janus Capital has entered into an agreement with Wilshire Associates Inc. (“Wilshire”), a global investment technology, investment consulting, and investment management firm, to act as a consultant to Janus Capital. Wilshire provides research and advice regarding asset allocation methodologies, which Janus Capital may use when determining asset class allocations for the Funds. For its consulting services, Janus Capital pays Wilshire an annual fee, payable monthly, that is comprised of a combination of an initial program establishment fee, fixed fee, and an asset-based fee.
The Board of Trustees has adopted a deferred compensation plan (the “Deferred Plan”) for independent Trustees to elect to defer receipt of all or a portion of the annual compensation they are entitled to receive from the Funds. All deferred fees are credited to an account established in the name of the Trustees. The amounts credited to the account then increase or decrease, as the case may be, in accordance with the performance of one or more of the Janus funds that are selected by the Trustees. The account balance continues to fluctuate in accordance with the performance of the selected fund or funds until final payment of all amounts are credited to the account. The fluctuation of the account balance is recorded by the Funds as unrealized appreciation/(depreciation) and is shown as of December 31, 2011 on the Statements of Assets and Liabilities as an asset, “Non-interested Trustees’ deferred compensation,” and a liability, “Non-interested Trustees’ deferred compensation fees.” Additionally, the recorded unrealized appreciation/(depreciation) is included in “Unrealized net appreciation/(depreciation) of investments, foreign currency translations and non-interested Trustees’ deferred compensation” on the Statements of Assets and Liabilities. Deferred compensation expenses for the period ended December 31, 2011 are included in “Non-interested Trustees’ fees and expenses” on the Statements of Operations. Trustees are allowed to change their designation of mutual funds from time to time. Amounts will be deferred until distributed in accordance with the Deferred Plan. No deferred fees were distributed to any Trustee under the Deferred Plan during the period ended December 31, 2011.
Certain officers of the Funds may also be officers and/or directors of Janus Capital. Such officers receive no compensation from the Funds, except for the Funds’ Chief Compliance Officer. The Funds reimburse Janus Capital for a portion of the compensation paid to the Chief Compliance Officer and certain compliance staff of the Trust. Total compensation of $286,615 was paid by the Trust during the period ended December 31, 2011. Each Fund’s portion is reported as part of “Other Expenses” on the Statements of Operations.
Class A Shares include a 5.75% upfront sales charge of the offering price of the Funds. The sales charge is allocated between Janus Distributors and financial intermediaries. During the period ended December 31,
Janus Asset Allocation Funds | 63
Notes to Financial Statements (unaudited) (continued)
2011, Janus Distributors retained the following upfront sales charges:
| | | | | | |
| | | Upfront
| | |
| Fund (Class A Shares) | | Sales Charge | | |
| |
| |
| Janus Growth Allocation Fund | | $ | 2,192 | | |
| Janus Moderate Allocation Fund | | | 3,369 | | |
| Janus Conservative Allocation Fund | | | 14,929 | | |
| |
| |
A contingent deferred sales charge of 1.00% will be deducted with respect to Class A Shares purchased without a sales load and redeemed within 12 months of purchase, unless waived, as discussed in the Prospectus. Any applicable CDSC will be 1.00% of the lesser of the original purchase price or the value of the redemption of the Class A Shares redeemed. There were no contingent deferred sales charges paid by redeeming shareholders of Class A Shares to Janus Distributors during the period ended December 31, 2011.
Class C Shares include a 1.00% contingent deferred sales charge paid by redeeming shareholders to Janus Distributors. The contingent deferred sales charge applies to shares redeemed within 12 months of purchase. The redemption price may differ from the net asset value per share. During the period ended December 31, 2011, redeeming shareholders of Class C Shares paid the following contingent deferred sales charge:
| | | | | | |
| | | Contingent Deferred
| | |
| Fund (Class C Shares) | | Sales Charge | | |
| |
| |
| Janus Growth Allocation Fund | | $ | 127 | | |
| Janus Moderate Allocation Fund | | | 990 | | |
| Janus Conservative Allocation Fund | | | 1,162 | | |
| |
| |
The Funds’ expenses may be reduced by expense offsets from an unaffiliated custodian and/or transfer agent. Such credits or offsets are included in “Expense and Fee Offset” on the Statements of Operations (if applicable). The transfer agent fee offsets received during the period reduce “Transfer agent fees and expenses” on the Statements of Operations (if applicable). Custodian offsets received reduce “Custodian fees” on the Statements of Operations (if applicable). The Funds could have employed the assets used by the custodian and/or transfer agent to produce income if they had not entered into an expense offset arrangement.
Pursuant to the terms and conditions of an SEC exemptive order and the provisions of the 1940 Act, the Funds and the underlying funds may participate in an affiliated or nonaffiliated cash sweep program. In the cash sweep program, uninvested cash balances of the Funds and underlying funds may be used to purchase shares of affiliated or nonaffiliated money market funds or cash management pooled investment vehicles. The Funds and underlying funds are eligible to participate in the cash sweep program (the “Investing Funds”). Janus Cash Liquidity Fund LLC is an affiliated unregistered cash management pooled investment vehicle that invests primarily in highly-rated short-term fixed-income securities. Janus Cash Liquidity Fund LLC currently maintains a NAV of $1.00 per share and distributes income daily in a manner consistent with a registered 2a-7 product. There are no restrictions on the Funds’ ability to withdraw investments from Janus Cash Liquidity Fund LLC at will, and there are no unfunded capital commitments due from the Funds to Janus Cash Liquidity Fund LLC. As adviser, Janus Capital has an inherent conflict of interest because of its fiduciary duties to the affiliated cash management pooled investment vehicles and the Investing Funds.
During the period ended December 31, 2011, the Funds recorded distributions from affiliated investment companies as affiliated dividend income, and had the following affiliated purchases and sales:
| | | | | | | | | | | | | | | | | | | | | | |
| | | Purchases | | Sales | | Realized
| | Dividend
| | Value
| | |
| | | Shares | | Cost | | Shares | | Cost | | Gain/(Loss) | | Income | | at 12/31/11 | | |
| |
Janus Growth Allocation Fund | | | | | | | | | | | | | | | | | | | | | |
INTECH International Fund(1) – Class I Shares | | 1,395,637 | | $ | 9,224,102 | | (138,833) | | $ | (1,110,711) | | $ | (144,625) | | $ | 146,725 | | $ | 16,645,653 | | |
INTECH U.S. Growth Fund(2) – Class I Shares | | 60,195 | | | 785,225 | | (131,949) | | | (1,830,217) | | | (126,049) | | | 188,504 | | | 20,713,218 | | |
INTECH U.S. Value Fund(3) – Class I Shares | | 116,028 | | | 1,090,649 | | (144,004) | | | (1,438,130) | | | (109,763) | | | 434,256 | | | 25,290,343 | | |
| Janus Contrarian Fund – Class I Shares | | 2 | | | 20 | | (149,700) | | | (1,921,358) | | | (171,358) | | | 20 | | | 1,165,872 | | |
| Janus Flexible Bond Fund – Class I Shares | | 170,259 | | | 1,803,695 | | (645,523) | | | (6,597,510) | | | 215,502 | | | 681,355 | | | 27,121,478 | | |
| Janus Fund – Class I Shares | | 8,036 | | | 224,355 | | (13,136) | | | (389,451) | | | (27,169) | | | 45,339 | | | 6,592,323 | | |
| Janus Global Bond Fund – Class I Shares | | 140,022 | | | 1,438,056 | | (46,845) | | | (488,624) | | | 1,295 | | | 191,429 | | | 9,815,694 | | |
| Janus Global Real Estate Fund – Class I Shares | | 285,370 | | | 2,306,201 | | (43,580) | | | (414,790) | | | (45,631) | | | 127,185 | | | 7,659,250 | | |
| Janus Global Select Fund – Class I Shares | | 1,183 | | | 11,139 | | – | | | – | | | – | | | 11,139 | | | 1,050,003 | | |
| Janus High-Yield Fund – Class I Shares | | 6,950 | | | 60,761 | | (76,023) | | | (650,376) | | | (376) | | | 60,761 | | | 1,324,129 | | |
| Janus International Equity Fund – Class I Shares | | 117,082 | | | 1,192,494 | | (362,560) | | | (4,172,652) | | | (523,524) | | | 476,429 | | | 27,156,912 | | |
| Janus Overseas Fund – Class I Shares | | 51,705 | | | 1,752,657 | | (25,221) | | | (1,271,629) | | | (305,543) | | | – | | | 16,251,973 | | |
| Janus Research Fund – Class I Shares | | 15,994 | | | 456,424 | | (25,700) | | | (770,997) | | | (46,433) | | | 98,391 | | | 11,962,471 | | |
| Janus Short-Term Bond Fund – Class I Shares | | 56,612 | | | 173,559 | | (78,690) | | | (243,940) | | | (2,418) | | | 46,671 | | | 3,911,685 | | |
| Janus Triton Fund – Class I Shares | | 15,186 | | | 249,162 | | (14,808) | | | (250,769) | | | (9,248) | | | 10,134 | | | 3,630,209 | | |
| Janus Twenty Fund – Class D Shares | | 32,276 | | | 1,682,058 | | (43,075) | | | (2,496,705) | | | (17,101) | | | 17,164 | | | 8,879,949 | | |
| Perkins Large Cap Value Fund – Class I Shares | | 215,180 | | | 2,724,054 | | (92,910) | | | (1,314,879) | | | (107,272) | | | 628,773 | | | 21,621,394 | | |
| Perkins Mid Cap Value Fund – Class I Shares | | 24,600 | | | 506,599 | | (11,167) | | | (260,673) | | | (19,152) | | | 74,056 | | | 4,608,350 | | |
| Perkins Small Cap Value Fund – Class I Shares | | 31,853 | | | 667,192 | | (10,683) | | | (264,523) | | | (23,001) | | | 184,065 | | | 4,432,907 | | |
| |
| |
| | | | | $ | 26,348,402 | | | | $ | (25,887,934) | | $ | (1,461,866) | | $ | 3,422,396 | | $ | 219,833,813 | | |
| |
| |
64 | DECEMBER 31, 2011
| | | | | | | | | | | | | | | | | | | | | | |
| | | Purchases | | Sales | | Realized
| | Dividend
| | Value
| | |
| | | Shares | | Cost | | Shares | | Cost | | Gain/(Loss) | | Income | | at 12/31/11 | | |
| |
Janus Moderate Allocation Fund | | | | | | | | | | | | | | | | | | | | | |
INTECH International Fund(1) – Class I Shares | | 1,030,144 | | $ | 6,809,733 | | (106,425) | | $ | (851,109) | | $ | (111,815) | | $ | 106,840 | | $ | 11,641,122 | | |
INTECH U.S. Growth Fund(2) – Class I Shares | | 111,240 | | | 1,452,686 | | (82,077) | | | (1,126,131) | | | (91,120) | | | 148,637 | | | 17,473,858 | | |
INTECH U.S. Value Fund(3) – Class I Shares | | 156,509 | | | 1,471,022 | | (191,994) | | | (1,896,693) | | | (168,105) | | | 465,238 | | | 27,324,920 | | |
| Janus Flexible Bond Fund – Class I Shares | | 601,522 | | | 6,376,848 | | (1,178,656) | | | (12,674,424) | | | (147,224) | | | 1,958,770 | | | 87,008,205 | | |
| Janus Fund – Class I Shares | | 8,689 | | | 240,867 | | (29,536) | | | (858,955) | | | (63,238) | | | 39,710 | | | 5,818,958 | | |
| Janus Global Real Estate Fund – Class I Shares | | 223,341 | | | 1,804,990 | | (35,030) | | | (336,174) | | | (40,456) | | | 92,383 | | | 5,671,350 | | |
| Janus Global Select Fund – Class I Shares | | 1,196 | | | 11,270 | | (88,449) | | | (685,459) | | | 164,541 | | | 11,270 | | | 1,062,371 | | |
| Janus Growth and Income Fund – Class I Shares | | 2 | | | 52 | | (19,438) | | | (546,689) | | | (3,833) | | | 52 | | | 307 | | |
| Janus High-Yield Fund – Class I Shares | | 7,252 | | | 63,358 | | (29,240) | | | (267,452) | | | (17,452) | | | 63,358 | | | 1,586,890 | | |
| Janus International Equity Fund – Class I Shares | | 188,932 | | | 1,886,975 | | (128,937) | | | (1,487,272) | | | (156,543) | | | 381,770 | | | 22,541,224 | | |
| Janus Overseas Fund – Class I Shares | | 42,289 | | | 1,444,602 | | (42,795) | | | (1,807,106) | | | (202,970) | | | – | | | 11,527,855 | | |
| Janus Research Fund – Class I Shares | | 20,931 | | | 595,645 | | (69,203) | | | (2,055,576) | | | (116,282) | | | 104,203 | | | 11,573,229 | | |
| Janus Short-Term Bond Fund – Class I Shares | | 222,153 | | | 680,249 | | (240,447) | | | (747,387) | | | (8,093) | | | 152,465 | | | 13,027,856 | | |
| Janus Triton Fund – Class I Shares | | 22,365 | | | 366,823 | | (18,504) | | | (323,103) | | | (27,385) | | | 12,932 | | | 4,676,937 | | |
| Janus Twenty Fund – Class D Shares | | 18,277 | | | 959,434 | | (4,924) | | | (329,664) | | | (33,947) | | | 9,017 | | | 4,964,686 | | |
| Perkins Large Cap Value Fund – Class I Shares | | 464,773 | | | 5,843,542 | | (106,272) | | | (1,505,352) | | | (141,606) | | | 706,762 | | | 24,528,836 | | |
| Perkins Small Cap Value Fund – Class I Shares | | 44,581 | | | 933,708 | | (31,653) | | | (776,581) | | | (80,864) | | | 246,121 | | | 5,976,155 | | |
| |
| |
| | | | | $ | 30,941,804 | | | | $ | (28,275,127) | | $ | (1,246,392) | | $ | 4,499,528 | | $ | 256,404,759 | | |
| |
| |
| | | | | | | | | | | | | | | | | | | | | | |
| | | Purchases | | Sales | | Realized
| | Dividend
| | Value
| | |
| | | Shares | | Cost | | Shares | | Cost | | (Loss) | | Income | | at 12/31/11 | | |
| |
Janus Conservative Allocation Fund | | | | | | | | | | | | | | | | | | | | | |
INTECH International Fund(1) – Class I Shares | | 328,774 | | $ | 2,189,069 | | (20,053) | | $ | (160,628) | | $ | (21,420) | | $ | 35,320 | | $ | 3,910,774 | | |
INTECH U.S. Growth Fund(2) – Class I Shares | | 109,943 | | | 1,422,995 | | (32,415) | | | (456,707) | | | (39,085) | | | 111,746 | | | 12,716,960 | | |
INTECH U.S. Value Fund(3) – Class I Shares | | 207,482 | | | 1,928,911 | | (60,190) | | | (611,633) | | | (54,802) | | | 313,912 | | | 18,344,833 | | |
| Janus Contrarian Fund – Class I Shares | | – | | | – | | – | | | – | | | – | | | – | | | 7,166 | | |
| Janus Flexible Bond Fund – Class I Shares | | 1,365,969 | | | 14,531,176 | | (724,050) | | | (7,803,552) | | | (114,549) | | | 2,506,963 | | | 116,504,970 | | |
| Janus Fund – Class I Shares | | 15,489 | | | 429,484 | | (5,033) | | | (154,168) | | | (14,960) | | | 25,734 | | | 3,759,945 | | |
| Janus Global Real Estate Fund – Class I Shares | | 28,580 | | | 241,695 | | (8,275) | | | (81,158) | | | (11,554) | | | 39,820 | | | 1,786,075 | | |
| Janus Global Select Fund – Class I Shares | | 389 | | | 3,663 | | – | | | – | | | – | | | 3,663 | | | 345,338 | | |
| Janus Growth and Income Fund – Class I Shares | | 215 | | | 6,050 | | – | | | – | | | – | | | 6,050 | | | 974,299 | | |
| Janus High-Yield Fund – Class I Shares | | 4,332 | | | 37,835 | | – | | | – | | | – | | | 37,835 | | | 1,019,584 | | |
| Janus International Equity Fund – Class I Shares | | 136,091 | | | 1,392,042 | | (33,691) | | | (392,536) | | | (44,517) | | | 182,668 | | | 10,660,782 | | |
| Janus Overseas Fund – Class I Shares | | 20,125 | | | 717,307 | | (3,660) | | | (190,778) | | | (51,570) | | | – | | | 4,016,281 | | |
| Janus Research Fund – Class I Shares | | 40,049 | | | 1,126,635 | | (9,834) | | | (308,140) | | | (29,725) | | | 69,136 | | | 8,450,011 | | |
| Janus Short-Term Bond Fund – Class I Shares | | 525,223 | | | 1,611,437 | | (158,941) | | | (492,865) | | | (5,638) | | | 169,853 | | | 14,816,553 | | |
| Janus Triton Fund – Class I Shares | | 33,178 | | | 543,058 | | (8,518) | | | (155,022) | | | (15,814) | | | 10,875 | | | 3,918,129 | | |
| Perkins Large Cap Value Fund – Class I Shares | | 320,409 | | | 4,070,235 | | (37,455) | | | (538,614) | | | (51,387) | | | 436,935 | | | 15,527,473 | | |
| Perkins Small Cap Value Fund – Class I Shares | | 19,336 | | | 417,015 | | (3,085) | | | (78,680) | | | (9,076) | | | 72,282 | | | 1,746,881 | | |
| |
| |
| | | | | $ | 30,668,607 | | | | $ | (11,424,481) | | $ | (464,097) | | $ | 4,022,792 | | $ | 218,506,054 | | |
| |
| |
| | | |
| (1) | | Formerly named INTECH Risk-Managed International Fund. |
| (2) | | Formerly named INTECH Risk-Managed Growth Fund. |
| (3) | | Formerly named INTECH Risk-Managed Value Fund. |
Income and capital gains distributions are determined in accordance with income tax regulations that may differ from accounting principles generally accepted in the United States of America. These differences are due to differing treatments for items such as net short-term gains, deferral of wash sale losses, foreign currency transactions, net investment losses and capital loss carryovers.
The Funds have elected to treat gains and losses on forward foreign currency contracts as capital gains and losses, if applicable. Other foreign currency gains and losses on debt instruments are treated as ordinary income for federal income tax purposes pursuant to Section 988 of the Internal Revenue Code.
Janus Asset Allocation Funds | 65
Notes to Financial Statements (unaudited) (continued)
The aggregate cost of investments and the composition of unrealized appreciation and depreciation of investment securities for federal income tax purposes as of December 31, 2011 are noted below.
Unrealized appreciation and unrealized depreciation in the table below exclude appreciation/(depreciation) on foreign currency translations. The primary difference between book and tax appreciation or depreciation of investments is wash sale loss deferrals.
| | | | | | | | | | | | | | | |
| | | Federal Tax
| | Unrealized
| | Unrealized
| | Net Tax
| | |
| Fund | | Cost | | Appreciation | | (Depreciation) | | Appreciation | | |
| |
| |
| Janus Growth Allocation Fund | | $ | 216,905,634 | | $ | 10,415,097 | | $ | (7,486,918) | | $ | 2,928,179 | | |
| Janus Moderate Allocation Fund | | | 250,114,578 | | | 10,565,274 | | | (4,275,093) | | | 6,290,181 | | |
| Janus Conservative Allocation Fund | | | 212,896,768 | | | 7,396,734 | | | (1,787,448) | | | 5,609,286 | | |
| |
| |
Net capital loss carryovers as of June 30, 2011 are indicated in the table below. These losses may be available to offset future realized capital gains and thereby reduce future taxable gains distributions. The following table shows the expiration dates of the carryovers.
Capital Loss Carryover Expiration Schedule
For the fiscal year ended June 30, 2011
| | | | | | | | | | | | | | | | | | |
| | | | | | | | | | | Accumulated
| | |
| Fund | | June 30, 2016 | | June 30, 2017 | | June 30, 2018 | | June 30, 2019 | | Capital Losses | | |
| |
| |
| Janus Growth Allocation Fund | | $ | (3,343,688) | | $ | (5,645,021) | | $ | (5,995,828) | | $ | (146,103) | | $ | (15,130,640) | | |
| Janus Moderate Allocation Fund | | | – | | | (1,023,048) | | | (4,161,852) | | | – | | | (5,184,900) | | |
| Janus Conservative Allocation Fund | | | – | | | – | | | (1,288,854) | | | – | | | (1,288,854) | | |
| |
| |
The expense ratios listed in the Financial Highlights reflect expenses prior to any expense offsets (gross expense ratio) and after expense offsets (net expense ratio). Both expense ratios reflect expenses after waivers (reimbursement). Listed below are the gross expense ratios for the Funds that would have been in effect, absent the waiver of certain fees and offsets and do not include expenses of the underlying funds and/or investment companies in which the Funds invest.
For the six-month period ended December 31, 2011 (unaudited), the fiscal year ended June 30, 2011, the eight-month fiscal period ended June 30, 2010, and each fiscal year or period ended October 31
| | | | | | | | | | | | | |
| | | Janus Growth
| | Janus Moderate
| | Janus Conservative
|
| | | Allocation Fund | | Allocation Fund | | Allocation Fund |
| |
| |
| Class A Shares |
| 2011 | | | 0.44% | | | | 0.47% | | | | 0.40% | |
| 2011 | | | 0.44% | | | | 0.50% | | | | 0.38% | |
2010(1) | | | 0.39% | | | | 0.40% | | | | 0.39% | |
2009(2) | | | 0.50% | | | | 0.48% | | | | 0.45% | |
| |
| |
| Class C Shares |
| 2011 | | | 1.20% | | | | 1.17% | | | | 1.16% | |
| 2011 | | | 1.21% | | | | 1.16% | | | | 1.14% | |
2010(1) | | | 1.14% | | | | 1.16% | | | | 1.14% | |
2009(2) | | | 1.37% | | | | 1.26% | | | | 1.20% | |
| |
| |
| Class D Shares |
| 2011 | | | 0.29% | | | | 0.25% | | | | 0.23% | |
| 2011 | | | 0.28% | | | | 0.25% | | | | 0.25% | |
2010(3) | | | 0.27% | | | | 0.27% | | | | 0.24% | |
66 | DECEMBER 31, 2011
| | | | | | | | | | | | | |
| | | Janus Growth
| | Janus Moderate
| | Janus Conservative
|
| | | Allocation Fund | | Allocation Fund | | Allocation Fund |
| |
| |
| Class I Shares |
| 2011 | | | 0.27% | | | | 0.17% | | | | 0.18% | |
| 2011 | | | 0.25% | | | | 0.17% | | | | 0.18% | |
2010(1) | | | 0.14% | | | | 0.16% | | | | 0.15% | |
2009(2) | | | 0.49% | | | | 0.19% | | | | 0.20% | |
| |
| |
| Class S Shares |
| 2011 | | | 0.65% | | | | 0.62% | | | | 0.61% | |
| 2011 | | | 0.67% | | | | 0.64% | | | | 0.62% | |
2010(1) | | | 0.65% | | | | 0.66% | | | | 0.64% | |
2009(2) | | | 0.91% | | | | 0.92% | | | | 0.67% | |
| |
| |
| Class T Shares |
| 2011 | | | 0.40% | | | | 0.37% | | | | 0.35% | |
| 2011 | | | 0.35% | | | | 0.35% | | | | 0.36% | |
2010(1) | | | 0.33% | | | | 0.30% | | | | 0.31% | |
| 2009 | | | 0.37% | | | | 0.33% | | | | 0.33% | |
| 2008 | | | 0.26% | | | | 0.24% | | | | 0.25% | |
| 2007 | | | 0.28% | | | | 0.27% | | | | 0.36% | |
2006(4) | | | 0.39% | | | | 0.42% | | | | 0.69% | |
| |
| |
| | | |
(1)
| | Period from November 1, 2009 through June 30, 2010. The Fund changed its fiscal year end from October 31 to June 30. |
| (2) | | Period from July 6, 2009 (inception date) through October 31, 2009. |
| (3) | | Period from February 16, 2010 (inception date) through June 30, 2010. |
| (4) | | Period from December 30, 2005 (inception date) through October 31, 2006. |
| |
| 7. | Capital Share Transactions |
| | | | | | | | | | | | | | | | | | | | | | | | | | | |
For the six-month period ended December 31, 2011
| | Janus Growth
| | Janus Moderate
| | Janus Conservative
| | |
(unaudited) and the fiscal year ended June 30, 2011
| | Allocation Fund | | Allocation Fund | | Allocation Fund | | |
| (all numbers are in thousands) | | 2011 | | 2011 | | 2011 | | 2011 | | 2011 | | 2011 | | |
| |
| Transactions in Fund Shares – Class A Shares: | | | | | | | | | | | | | | | | | | | | | | | | | | |
| Shares sold | | | 48 | | | | 209 | | | | 123 | | | | 346 | | | | 318 | | | | 372 | | | |
| Reinvested dividends and distributions | | | 4 | | | | 3 | | | | 11 | | | | 8 | | | | 14 | | | | 7 | | | |
| Shares repurchased | | | (43) | | | | (50) | | | | (91) | | | | (85) | | | | (151) | | | | (95) | | | |
| Net Increase/(Decrease) in Fund Shares | | | 9 | | | | 162 | | | | 43 | | | | 269 | | | | 181 | | | | 284 | | | |
| Shares Outstanding, Beginning of Period | | | 222 | | | | 60 | | | | 437 | | | | 168 | | | | 388 | | | | 104 | | | |
| Shares Outstanding, End of Period | | | 231 | | | | 222 | | | | 480 | | | | 437 | | | | 569 | | | | 388 | | | |
| Transactions in Fund Shares – Class C Shares: | | | | | | | | | | | | | | | | | | | | | | | | | | |
| Shares sold | | | 84 | | | | 158 | | | | 143 | | | | 448 | | | | 398 | | | | 548 | | | |
| Reinvested dividends and distributions | | | 4 | | | | 1 | | | | 14 | | | | 8 | | | | 22 | | | | 7 | | | |
| Shares repurchased | | | (21) | | | | (6) | | | | (71) | | | | (79) | | | | (110) | | | | (66) | | | |
| Net Increase/(Decrease) in Fund Shares | | | 67 | | | | 153 | | | | 86 | | | | 377 | | | | 310 | | | | 489 | | | |
| Shares Outstanding, Beginning of Period | | | 221 | | | | 68 | | | | 608 | | | | 231 | | | | 637 | | | | 148 | | | |
| Shares Outstanding, End of Period | | | 288 | | | | 221 | | | | 694 | | | | 608 | | | | 947 | | | | 637 | | | |
| Transactions in Fund Shares – Class D Shares: | | | | | | | | | | | | | | | | | | | | | | | | | | |
| Shares sold | | | 1,161 | | | | 3,623 | | | | 1,528 | | | | 5,326 | | | | 2,818 | | | | 5,302 | | | |
| Reinvested dividends and distributions | | | 318 | | | | 291 | | | | 464 | | | | 428 | | | | 450 | | | | 452 | | | |
| Shares repurchased | | | (1,844) | | | | (3,643) | | | | (2,208) | | | | (3,333) | | | | (2,277) | | | | (3,320) | | | |
| Net Increase/(Decrease) in Fund Shares | | | (365) | | | | 271 | | | | (216) | | | | 2,421 | | | | 991 | | | | 2,434 | | | |
| Shares Outstanding, Beginning of Period | | | 18,111 | | | | 17,840 | | | | 18,867 | | | | 16,446 | | | | 14,246 | | | | 11,812 | | | |
| Shares Outstanding, End of Period | | | 17,746 | | | | 18,111 | | | | 18,651 | | | | 18,867 | | | | 15,237 | | | | 14,246 | | | |
| Transactions in Fund Shares – Class I Shares: | | | | | | | | | | | | | | | | | | | | | | | | | | |
| Shares sold | | | 17 | | | | 73 | | | | 148 | | | | 373 | | | | 31 | | | | 177 | | | |
| Reinvested dividends and distributions | | | 3 | | | | 3 | | | | 10 | | | | 5 | | | | 5 | | | | 4 | | | |
| Shares repurchased | | | (23) | | | | (76) | | | | (87) | | | | (168) | | | | (49) | | | | (27) | | | |
| Net Increase/(Decrease) in Fund Shares | | | (3) | | | | – | | | | 71 | | | | 210 | | | | (13) | | | | 154 | | | |
| Shares Outstanding, Beginning of Period | | | 185 | | | | 185 | | | | 358 | | | | 148 | | | | 202 | | | | 48 | | | |
| Shares Outstanding, End of Period | | | 182 | | | | 185 | | | | 429 | | | | 358 | | | | 189 | | | | 202 | | | |
Janus Asset Allocation Funds | 67
Notes to Financial Statements (unaudited) (continued)
| | | | | | | | | | | | | | | | | | | | | | | | | | | |
For the six-month period ended December 31, 2011
| | Janus Growth
| | Janus Moderate
| | Janus Conservative
| | |
(unaudited) and the fiscal year ended June 30, 2011
| | Allocation Fund | | Allocation Fund | | Allocation Fund | | |
| (all numbers are in thousands) | | 2011 | | 2011 | | 2011 | | 2011 | | 2011 | | 2011 | | |
| |
| Transactions in Fund Shares – Class S Shares: | | | | | | | | | | | | | | | | | | | | | | | | | | |
| Shares sold | | | 53 | | | | 61 | | | | 81 | | | | 42 | | | | 57 | | | | 33 | | | |
| Reinvested dividends and distributions | | | 2 | | | | 1 | | | | 2 | | | | 1 | | | | 2 | | | | 1 | | | |
| Shares repurchased | | | (15) | | | | (5) | | | | (18) | | | | (15) | | | | (13) | | | | (3) | | | |
| Net Increase/(Decrease) in Fund Shares | | | 40 | | | | 57 | | | | 65 | | | | 28 | | | | 46 | | | | 31 | | | |
| Shares Outstanding, Beginning of Period | | | 60 | | | | 3 | | | | 33 | | | | 5 | | | | 42 | | | | 11 | | | |
| Shares Outstanding, End of Period | | | 100 | | | | 60 | | | | 98 | | | | 33 | | | | 88 | | | | 42 | | | |
| Transactions in Fund Shares – Class T Shares: | | | | | | | | | | | | | | | | | | | | | | | | | | |
| Shares sold | | | 239 | | | | 370 | | | | 339 | | | | 1,230 | | | | 585 | | | | 899 | | | |
| Reinvested dividends and distributions | | | 19 | | | | 14 | | | | 41 | | | | 34 | | | | 41 | | | | 29 | | | |
| Shares repurchased | | | (163) | | | | (389) | | | | (255) | | | | (595) | | | | (476) | | | | (475) | | | |
| Net Increase/(Decrease) in Fund Shares | | | 95 | | | | (5) | | | | 125 | | | | 669 | | | | 150 | | | | 453 | | | |
| Shares Outstanding, Beginning of Period | | | 993 | | | | 998 | | | | 1,607 | | | | 938 | | | | 1,341 | | | | 888 | | | |
| Shares Outstanding, End of Period | | | 1,088 | | | | 993 | | | | 1,732 | | | | 1,607 | | | | 1,491 | | | | 1,341 | | | |
| |
| 8. | Purchases and Sales of Investment Securities |
For the period ended December 31, 2011, the aggregate cost of purchases and proceeds from sales of investment securities (excluding any short-term securities, short-term options contracts, and in-kind transactions) was as follows:
| | | | | | | | | | | | | | | |
| | | | | | | | | Proceeds from
| | |
| | | | | | | Purchases of
| | Sales of
| | |
| | | | | | | Long-Term
| | Long-Term
| | |
| | | Purchases of
| | Proceeds from Sales
| | U.S. Government
| | U.S. Government
| | |
| Fund | | Securities | | of Securities | | Obligations | | Obligations | | |
| |
| Janus Growth Allocation Fund | | $ | 26,348,403 | | $ | 24,426,069 | | $ | – | | $ | – | | |
| Janus Moderate Allocation Fund | | | 30,941,804 | | | 27,028,738 | | | – | | | – | | |
| Janus Conservative Allocation Fund | | | 30,668,609 | | | 10,960,383 | | | – | | | – | | |
| |
| |
| |
| 9. | New Accounting Pronouncements |
In May 2011, the FASB issued Accounting Standards Update, “Amendments to Achieve Common Fair Value Measurement and Disclosure Requirements.” The Accounting Standards Update requires disclosures about amounts and reasons for all transfers in and out of Level 1 and Level 2 fair value measurements. In addition, the Accounting Standards Update will require reporting entities to disclose the following information for fair value measurements categorized with Level 3 of the fair value hierarchy: quantitative information about the unobservable inputs used in the fair value measurement, the valuation processes used by the reporting entity, and a narrative description of the sensitivity of the fair value measurement to changes in unobservable inputs and the interrelationships between those unobservable inputs. This disclosure is effective for fiscal years beginning after December 15, 2011, and for interim periods within those fiscal years. Management is currently evaluating the impact these amendments may have on the Funds’ financial statements.
Management has evaluated whether any other events or transactions occurred subsequent to December 31, 2011 and through the date of issuance of the Funds’ financial statements and determined that there were no material events or transactions that would require recognition or disclosure in the Funds’ financial statements.
68 | DECEMBER 31, 2011
Additional Information (unaudited)
Proxy Voting Policies and Voting Record
A description of the policies and procedures that the Funds use to determine how to vote proxies relating to their portfolio securities is available without charge: (i) upon request, by calling 1-800-525-0020 (toll free); (ii) on the Funds’ website at janus.com/proxyvoting; and (iii) on the SEC’s website at http://www.sec.gov. Additionally, information regarding each Fund’s proxy voting record for the most recent twelve-month period ended June 30 is also available, free of charge, through janus.com/proxyvoting and from the SEC’s website at http://www.sec.gov.
Quarterly Portfolio Holdings
The Funds file their complete portfolio holdings (schedule of investments) with the SEC for the first and third quarters of each fiscal year on Form N-Q within 60 days of the end of such fiscal quarter. The Funds’ Form N-Q: (i) is available on the SEC’s website at http://www.sec.gov; (ii) may be reviewed and copied at the SEC’s Public Reference Room in Washington, D.C. (information on the Public Reference Room may be obtained by calling 1-800-SEC-0330); and (iii) is available without charge, upon request, by calling Janus at 1-800-525-0020 (toll free).
APPROVAL OF ADVISORY AGREEMENTS DURING THE PERIOD
The Trustees of Janus Investment Fund, none of whom has ever been affiliated with Janus Capital and each of whom serves as an “independent” Trustee (the “Trustees”), oversee the management of each Fund and, as required by law, determine annually whether to continue the investment advisory agreement for each Fund and the subadvisory agreements for the nine Funds that utilize subadvisers.
In connection with their most recent consideration of those agreements for each Fund, the Trustees received and reviewed a substantial amount of information provided by Janus Capital and the respective subadvisers in response to requests of the Trustees and their independent legal counsel. They also received and reviewed a considerable amount of information and analysis provided by, and at the request of, their independent fee consultant. Throughout their consideration of the agreements, the Trustees were advised by their independent legal counsel. The Trustees met with management to consider the agreements, and also met separately in executive session with their independent legal counsel and their independent fee consultant.
At a meeting held on December 8, 2011, based on the Trustees’ evaluation of the information provided by Janus Capital, the subadvisers and the independent fee consultant, as well as other information, the Trustees determined that the overall arrangements between each Fund and Janus Capital and each subadviser, as applicable, were fair and reasonable in light of the nature, extent and quality of the services provided by Janus Capital, its affiliates and the subadvisers, the fees charged for those services, and other matters that the Trustees considered relevant in the exercise of their business judgment. At that meeting, the Trustees unanimously approved the continuation of the investment advisory agreement for each Fund, and the subadvisory agreement for each subadvised Fund, for the period from February 1, 2012 through February 1, 2013, subject to earlier termination as provided for in each agreement.
In considering the continuation of those agreements, the Trustees reviewed and analyzed various factors that they determined were relevant, including the factors described below, none of which by itself was considered dispositive. However, the material factors and conclusions that formed the basis for the Trustees’ determination to approve the continuation of the agreements are discussed separately below.
Nature, Extent and Quality of Services
The Trustees reviewed the nature, extent and quality of the services provided by Janus Capital and the subadvisers to the Funds, taking into account the investment objective and strategy of each Fund and the knowledge the Trustees gained from their regular meetings with management on at least a quarterly basis and their ongoing review of information related to the Funds. In addition, the Trustees reviewed the resources and key personnel of Janus Capital and each subadviser, particularly noting those employees who provide investment and risk management services to the Funds. The Trustees also considered other services provided to the Funds by Janus Capital or the subadvisers, such as managing the execution of portfolio transactions and the selection of broker-dealers for those transactions. The Trustees considered Janus Capital’s role as administrator to the Funds, noting that Janus Capital does not receive a fee for its services but is reimbursed for its out-of-pocket costs. The Trustees considered the role of Janus Capital in monitoring adherence to the Funds’ investment restrictions, providing support services for the Trustees and Trustee committees, communicating with shareholders and overseeing the activities of other service providers, including monitoring compliance with various policies and procedures of the Funds and with applicable securities laws and regulations.
Janus Asset Allocation Funds | 69
Additional Information (unaudited) (continued)
The Trustees concluded that the nature, extent and quality of the services provided by Janus Capital or the subadviser to each Fund were appropriate and consistent with the terms of the respective advisory and subadvisory agreements, and that, taking into account steps taken to address those Funds whose performance lagged that of their peers for certain periods, the quality of those services had been consistent with or superior to quality norms in the industry and the Funds were likely to benefit from the continued provision of those services. They also concluded that Janus Capital and each subadviser had sufficient personnel, with the appropriate education and experience, to serve the Funds effectively and had demonstrated its continuing ability to attract well-qualified personnel.
Performance of the Funds
The Trustees considered the performance results of each Fund over various time periods. They reviewed information comparing each Fund’s performance with the performance of comparable funds and peer groups identified by Lipper, and with the Fund’s benchmark index. They concluded that the performance of various Funds was good to very good under current market conditions. Although the performance of other Funds lagged that of their peers for certain periods, the Trustees also concluded that Janus Capital had taken or was taking appropriate steps to address those instances of under-performance.
Costs of Services Provided
The Trustees examined information regarding the fees and expenses of each Fund in comparison to similar information for other comparable funds as provided by Lipper. They also reviewed an analysis of that information provided by their independent fee consultant and noted that the rate of management (investment advisory and any administration) fees for most of the Funds, after applicable contractual expense limitations, was below the mean management fee rate of the respective peer group of funds selected by Lipper.
The Trustees considered the methodology used by Janus Capital and each subadviser in determining compensation payable to portfolio managers, the competitive environment for investment management talent and the competitive market for mutual funds in different distribution channels. They concluded that the compensation methodology provided a good alignment of the interests of the portfolio managers with the interests of Fund shareholders.
The Trustees also reviewed management fees charged by Janus Capital and each subadviser to their separate account clients and to non-affiliated funds subadvised by Janus Capital or by a subadviser (for which Janus Capital provides only portfolio management services). Although in most instances subadvisory and separate account fee rates for various investment strategies were lower than management fee rates for Funds having a similar strategy, the Trustees noted that, under the terms of the management agreements with the Funds, Janus Capital performs significant additional services for the Funds that it does not provide to those other clients, including administration services, oversight of the Funds’ other service providers, trustee support, regulatory compliance and numerous other services, and that, in serving the Funds, Janus Capital assumes many legal risks that it does not assume in servicing its other clients. Moreover, they noted that the spread between the average fee rates charged to the Funds and the fee rates that Janus Capital charged to its separate account clients was smaller than the average spread for such fee rates of other advisers, based on publicly available data and research conducted by the Trustees’ independent fee consultant.
The Trustees reviewed information on the profitability to Janus Capital and its affiliates of their relationships with each Fund, as well as an explanation of the methodology utilized in allocating various expenses of Janus Capital and its affiliates among the Funds and other clients. The Trustees also reviewed the financial statements and corporate structure of Janus Capital’s parent company. In their review, the Trustees considered whether Janus Capital and each subadviser receive adequate incentives to manage the Funds effectively. The Trustees recognized that profitability comparisons among fund managers are difficult because very little comparative information is publicly available and the profitability of any fund manager is affected by numerous factors, including the organizational structure of the particular fund manager, the types of funds and other accounts it manages, possible other lines of business, the methodology for allocating expenses and the fund manager’s capital structure and cost of capital. However, taking into account those factors and the analysis provided by the Trustees’ independent fee consultant, and based on the information available, the Trustees concluded that Janus Capital’s profitability with respect to each Fund in relation to the services rendered was not unreasonable.
The Trustees concluded that the management fees and other compensation payable by each Fund to Janus Capital and its affiliates, as well as the fees paid by Janus Capital to the subadvisers of subadvised Funds, were reasonable in relation to the nature, extent and quality of the services provided, taking into account the fees charged by other advisers for managing comparable mutual funds with similar strategies, the fees Janus Capital and the subadvisers charge to other clients, and, as applicable, the impact of fund performance on fees
70 | DECEMBER 31, 2011
payable by the Funds. The Trustees also concluded that the overall expense ratio of each Fund was reasonable, taking into account the size of the Fund, the quality of services provided by Janus Capital and any subadviser, the investment performance of the Fund and any expense limitations agreed to by Janus Capital.
Economies of Scale
The Trustees considered information about the potential for Janus Capital to realize economies of scale as the assets of the Funds increase. They noted that, although many Funds pay advisory fees at a fixed rate as a percentage of net assets, without any breakpoints, the actual management fee rate paid by most of the Funds, after any contractual expense limitations, was below the mean management fee rate of the Fund’s peer group identified by Lipper; and, for those Funds whose expenses are being reduced by the contractual expense limitations of Janus Capital, Janus Capital is subsidizing the Funds because they have not reached adequate scale. Moreover, as the assets of many of the Funds have declined in the past few years, certain Funds have benefited from having advisory fee rates that have remained constant rather than increasing as assets declined. In addition, performance fee structures have been implemented for various Funds that have caused or will cause the effective rate of advisory fees payable by such a Fund to vary depending on the investment performance of the Fund relative to its benchmark index over the measurement period; and a few Funds have fee schedules with breakpoints and reduced fee rates above certain asset levels. The Trustees also noted that the Funds share directly in economies of scale through the lower charges of third-party service providers that are based in part on the combined scale of all of the Funds. Based on all of the information they reviewed, including research and analysis conducted by the Trustees’ independent fee consultant, the Trustees concluded that the current fee structure of each Fund was reasonable and that the current rates of fees do reflect a sharing between Janus Capital and the Fund of economies of scale at the current asset level of the Fund.
Other Benefits to Janus Capital
The Trustees also considered benefits that accrue to Janus Capital and its affiliates from their relationships with the Funds. They recognized that two affiliates of Janus Capital separately serve the Funds as transfer agent and distributor, respectively, and the transfer agent receives compensation directly from the non-money market funds for services provided. The Trustees also considered Janus Capital’s past and proposed use of commissions paid by the Funds on their portfolio brokerage transactions to obtain proprietary and third-party research products and services benefiting the Fund and/or other clients of Janus Capital. The Trustees concluded that Janus Capital’s use of these types of client commission arrangements to obtain proprietary and third-party research products and services was consistent with regulatory requirements and guidelines and was likely to benefit each Fund. The Trustees also concluded that, other than the services provided by Janus Capital and its affiliates pursuant to the agreements and the fees to be paid by each Fund therefor, the Funds and Janus Capital may potentially benefit from their relationship with each other in other ways. They concluded that Janus Capital benefits from the receipt of research products and services acquired through commissions paid on portfolio transactions of the Funds and that the Funds benefit from Janus Capital’s receipt of those products and services as well as research products and services acquired through commissions paid by other clients of Janus Capital. They further concluded that success of any Fund could attract other business to Janus Capital or other Janus funds, and that the success of Janus Capital could enhance Janus Capital’s ability to serve the Funds.
After full consideration of the above factors, as well as other factors, the Trustees, each of whom is an independent Trustee, concluded at their December 8, 2011 meeting that the proposed continuation of the investment advisory agreement and, if applicable, the subadvisory agreement for each Fund for another year was in the best interest of the respective Funds and their shareholders.
Janus Asset Allocation Funds | 71
Explanations of Charts, Tables and
Financial Statements (unaudited)
Performance overview graphs compare the performance of a hypothetical $10,000 investment in each Fund (from inception) with one or more widely used market indices. The hypothetical example does not represent the returns of any particular investment.
When comparing the performance of a Fund with an index, keep in mind that market indices do not include brokerage commissions that would be incurred if you purchased the individual securities in the index. They also do not include taxes payable on dividends and interest or operating expenses incurred if you maintained a Fund invested in the index.
Average annual total returns are also quoted for each Fund. Average annual total return is calculated by taking the growth or decline in value of an investment over a period of time, including reinvestment of dividends and distributions, then calculating the annual compounded percentage rate that would have produced the same result had the rate of growth been constant throughout the period. Average annual total return does not reflect the deduction of taxes that a shareholder would pay on Fund distributions or redemptions of Fund shares.
Pursuant to federal securities rules, expense ratios shown in the performance chart reflect subsidized and unsubsidized ratios for the prior fiscal year. The total annual fund operating expenses ratio is gross of any fee waivers, reflecting a Fund’s unsubsidized expense ratio. The net annual fund operating expenses ratio (if applicable) includes contractual waivers of Janus Capital and reflects a Fund’s subsidized expense ratio. Both the total annual fund operating expenses ratio and net annual fund operating expenses ratio are based on average net assets as of the fiscal period ended June 30, 2011. The ratios also include expenses indirectly incurred by a Fund as a result of investing in other investment companies or pooled investments, which are not reflected in the “Financial Highlights” of this report. As a result, these ratios may be higher or lower than those shown in the “Financial Highlights” in this report. All expenses are shown without the effect of expense offset arrangements. Pursuant to such arrangements, credits realized as a result of uninvested cash balances are used to reduce custodian and transfer agent expenses.
| |
| 2. | Schedules of Investments |
Following the performance overview section is each Fund’s Schedule of Investments. This schedule reports the types of securities held in each Fund on the last day of the reporting period. Holdings are subject to change without notice.
The value of each security is quoted as of the last day of the reporting period.
| |
| 3. | Statements of Assets and Liabilities |
These statements are often referred to as the “balance sheets.” It lists the assets and liabilities of the Funds on the last day of the reporting period.
The Funds’ assets are calculated by adding the value of the securities owned, the receivable for securities sold but not yet settled, the receivable for dividends declared but not yet received on underlying fund shares owned and the receivable for Fund shares sold to investors but not yet settled. The Funds’ liabilities include payables for securities purchased but not yet settled, Fund shares redeemed but not yet paid and expenses owed but not yet paid. Additionally, there may be other assets and liabilities.
The section entitled “Net Assets Consist of” breaks down the components of the Funds’ net assets. Because the Funds must distribute substantially all earnings, you will notice that a significant portion of net assets is shareholder capital.
The last section of this statement reports the net asset value (“NAV”) per share on the last day of the reporting period. The NAV is calculated by dividing the Funds’ net assets (assets minus liabilities) by the number of shares outstanding.
| |
| 4. | Statements of Operations |
These statements detail the Funds’ income, expenses, gains and losses on securities and currency transactions, and appreciation or depreciation of current Fund holdings.
The first section in this statement, entitled “Investment Income,” reports the dividends earned from underlying fund shares and interest earned from interest-bearing securities in the Funds.
The next section reports the expenses incurred by the Funds, including the advisory fee paid to the investment adviser, transfer agent fees and expenses, and printing and postage for mailing statements, financial reports and prospectuses. Expense offsets and expense reimbursements, if any, are also shown.
The last section lists the increase or decrease in the value of securities held in the Funds. The Funds will realize a gain (or loss) when they sell their position in a particular security. An unrealized gain (or loss) refers to the change in net appreciation or depreciation of the Funds during the reporting period. “Net Realized and Unrealized Gain/(Loss) on Investments” is affected both by changes in the market value of Fund holdings and by gains (or losses) realized during the reporting period.
72 | DECEMBER 31, 2011
| |
| 5. | Statements of Changes in Net Assets |
These statements report the increase or decrease in the Funds’ net assets during the reporting period. Changes in the Funds’ net assets are attributable to investment operations, dividends, distributions and capital share transactions. This is important to investors because it shows exactly what caused the Funds’ net asset size to change during the period.
The first section summarizes the information from the Statements of Operations regarding changes in net assets due to the Funds’ investment performance. The Funds’ net assets may also change as a result of dividend and capital gains distributions to investors. If investors receive their dividends in cash, money is taken out of the Funds to pay the distribution. If investors reinvest their dividends, the Funds’ net assets will not be affected. If you compare each Fund’s “Net Decrease from Dividends and Distributions” to the “Reinvested dividends and distributions,” you will notice that dividend distributions had little effect on each Fund’s net assets. This is because the majority of Janus investors reinvest their distributions.
The reinvestment of dividends is included under “Capital Share Transactions.” “Capital Shares” refers to the money investors contribute to the Funds through purchases or withdrawals via redemptions. The Funds’ net assets will increase and decrease in value as investors purchase and redeem shares from the Funds.
This schedule provides a per-share breakdown of the components that affect each Fund’s NAV for current and past reporting periods. Not only does this table provide you with total return, it also reports total distributions, asset size, expense ratios and portfolio turnover rate.
The first line in the table reflects the NAV per share at the beginning of the reporting period. The next line reports the net investment income per share, which comprises dividends and interest income earned on securities held by the Funds. Following is the total of gains/(losses), realized and unrealized. Dividends and distributions are then subtracted to arrive at the NAV per share at the end of the period. The next line reflects the average annual total return reported the last day of the period. The total return may include adjustments in accordance with generally accepted accounting principles. As a result, the total return may differ from the total return reflected for shareholder transactions.
Also included are the expense ratios, or the percentage of average net assets that were used to cover operating expenses during the period. Expense ratios vary across the Funds within the Trust for a number of reasons, including the differences in management fees, the frequency of dividend payments and the extent of foreign investments, which entail greater transaction costs.
The Funds’ expenses may be reduced through expense-reduction arrangements. These arrangements may include the use of balance credits or transfer agent fee offsets. The Statements of Operations reflect total expenses before any such offset, the amount of the offset and the net expenses. The expense ratios listed in the Financial Highlights reflect total expenses prior to any expense offset (gross expense ratio) and after the expense offsets (net expense ratio). Both expense ratios reflect expenses after waivers (reimbursements), if applicable.
The ratio of net investment income/(loss) summarizes the income earned less expenses, divided by the average net assets of a Fund during the reporting period. Don’t confuse this ratio with a Fund’s yield. The net investment income ratio is not a true measure of a Fund’s yield because it doesn’t take into account the dividends distributed to the Fund’s investors.
The next figure is the portfolio turnover rate, which measures the buying and selling activity in a Fund. Portfolio turnover is affected by market conditions, changes in the asset size of a Fund, fluctuating volume of shareholder purchase and redemption orders, the nature of the Fund’s investments, changes in the target allocation and the investment style and/or outlook of the portfolio manager. A 100% rate implies that an amount equal to the value of the entire portfolio was replaced once during the fiscal year; a 50% rate means that an amount equal to the value of half the portfolio is traded in a year; and a 200% rate means that an amount equal to the value of the entire portfolio is traded every six months.
Janus Asset Allocation Funds | 73
Janus provides access to a wide range of investment disciplines.
Alternative
Janus alternative funds seek to deliver strong risk-adjusted returns over a full market cycle with lower correlation to equity markets than traditional investments.
Asset Allocation
Janus’ asset allocation funds utilize our fundamental, bottom-up research to balance risk over the long term. From fund options that meet investors’ risk tolerance and objectives to a method that incorporates non-traditional investment choices to seek non-correlated sources of risk and return, Janus’ asset allocation funds aim to allocate risk more effectively.
Fixed Income
Janus fixed income funds attempt to provide less risk relative to equities while seeking to deliver a competitive total return through high current income and appreciation. Janus money market funds seek capital preservation and liquidity with current income as a secondary objective.
Global & International
Janus global and international funds seek to leverage Janus’ research capabilities by taking advantage of inefficiencies in foreign markets, where accurate information and analytical insight are often at a premium.
Growth & Core
Janus growth funds focus on companies believed to be the leaders in their respective industries, with solid management teams, expanding market share, margins and efficiencies. Janus core funds seek investments in more stable and predictable companies. Our core funds look for a strategic combination of steady growth and, for certain funds, some degree of income.
Mathematical
Our mathematical funds seek to outperform their respective indices while maintaining a risk profile equal to or lower than the index itself. Managed by INTECH (a Janus subsidiary), these funds use a mathematical process in an attempt to build a more “efficient” portfolio than the index.
Value
Our value funds, managed by Perkins (a Janus subsidiary), seek to identify companies with favorable reward to risk characteristics by conducting rigorous downside analysis before determining upside potential.
For more information about our funds, contact your investment professional or go to janus.com/advisor/mutual-funds (or janus.com/allfunds if you hold Shares directly with Janus).
Please consider the charges, risks, expenses and investment objectives carefully before investing. For a prospectus containing this and other information, please call Janus at 877.33JANUS (52687) (or 800.525.3713 if you hold Shares directly with Janus); or download the file from janus.com/info (or janus.com/reports if you hold Shares directly with Janus). Read it carefully before you invest or send money.
Funds distributed by Janus Distributors LLC (02/12)
Investment products offered are: NOT FDIC-INSURED MAY LOSE VALUE NO BANK GUARANTEE
| |
| C-0112-127 | 125-24-93005 02-12 |
SEMIANNUAL REPORT
December 31, 2011
Janus Mathematical Funds
INTECH Global Dividend FundINTECH International Fund
(formerly named INTECH Risk-Managed International Fund)
INTECH U.S. Core Fund
(formerly named INTECH Risk-Managed Core Fund)
INTECH U.S. Growth Fund
(formerly named INTECH Risk-Managed Growth Fund)
INTECH U.S. Value Fund
(formerly named INTECH Risk-Managed Value Fund)
HIGHLIGHTS
| |
| • | Portfolio management perspective |
| • | Investment strategy behind your fund |
| • | Fund performance, characteristics and holdings |
Table of Contents
Janus Mathematical Funds
| | | |
| | 1 |
| | |
| | 3 |
| | 13 |
| | 26 |
| | 36 |
| | 47 |
| | 60 |
| | 64 |
| | 66 |
| | 70 |
| | 86 |
| | 88 |
| | 105 |
| | 109 |
Please consider the charges, risks, expenses and investment objectives carefully before investing. For a prospectus or, if available, a summary prospectus containing this and other information, please call Janus at 877.33JANUS(52687) (or 800.525.3713 if you hold Shares directly with Janus); or download the file from janus.com/info (or janus.com/reports if you hold Shares directly with Janus). Read it carefully before you invest or send money.
Useful Information About Your Fund Report (unaudited)
Management Commentaries
The Management Commentaries in this report include valuable insight from each of the Funds’ investment personnel as well as statistical information to help you understand how your Fund’s performance and characteristics stack up against those of comparable indices.
If a Fund invests in foreign securities, this report may include information about country exposure. Country exposure is based primarily on the country of domicile. However, the Funds’ investment personnel may allocate a company to a country based on other factors such as location of the company’s principal office, the location of the principal trading market for the company’s securities, or the country where a majority of the company’s revenues are derived.
Please keep in mind that the opinions expressed by the Funds’ investment personnel in the Management Commentaries are just that: opinions. They are a reflection of the investment personnel’s best judgment at the time this report was compiled, which was December 31, 2011. As the investing environment changes, so could the investment personnel’s opinions. These views are unique to the investment personnel and aren’t necessarily shared by fellow employees or by Janus in general.
Fund Expenses
We believe it’s important for our shareholders to have a clear understanding of Fund expenses and the impact they have on investment return.
The following is important information regarding each Fund’s Expense Example, which appears in each Fund’s Management Commentary within this Semiannual Report. Please refer to this information when reviewing the Expense Example for each Fund.
Example
As a shareholder of a Fund, you incur two types of costs: (1) transaction costs, including sales charges (loads) on purchase payments (applicable to Class A Shares only); redemption fees, where applicable (and any related exchange fees); and (2) ongoing costs, including management fees; distribution and shareholder servicing (12b-1) fees (applicable to Class A Shares, Class C Shares, and Class S Shares only); administrative services fees payable pursuant to the Transfer Agency Agreement; administrative, networking or omnibus fees (applicable to Class A Shares, Class C Shares, and Class I Shares only); and other Fund expenses. The example is intended to help you understand your ongoing costs (in dollars) of investing in the Fund and to compare these costs with the ongoing costs of investing in other mutual funds. To do so, compare this 5% hypothetical example with the 5% hypothetical examples that appear in the shareholder reports of the other funds. The example is based upon an investment of $1,000 invested at the beginning of the period and held for the six-month period from July 1, 2011 to December 31, 2011.
Actual Expenses
The first line of the table in each example provides information about actual account values and actual expenses. You may use the information in this line, together with the amount you invested, to estimate the expenses that you paid over the period. Simply divide your account value by $1,000 (for example, an $8,600 account value divided by $1,000 = 8.6), then multiply the result by the number in the first line under the heading entitled “Expenses Paid During Period” to estimate the expenses you paid on your account during the period.
Hypothetical Example for Comparison Purposes
The second line of the table in each example provides information about hypothetical account values and hypothetical expenses based upon each Fund’s actual expense ratio and an assumed rate of return of 5% per year before expenses, which is not the Fund’s actual return. The hypothetical account values and expenses may not be used to estimate the actual ending account balance or expenses you paid for the period. You may use this information to compare the ongoing costs of investing in each Fund and other funds. To do so, compare this 5% hypothetical example with the 5% hypothetical examples that appear in the shareholder reports of the other funds.
Janus Capital Management LLC (“Janus Capital”) has contractually agreed to waive each Fund’s total annual fund operating expenses, excluding any performance adjustments to management fees, if applicable, class-specific distribution and shareholder servicing (12b-1) fees (applicable to Class A Shares, Class C Shares, and Class S Shares only), administrative services fees payable pursuant to the Transfer Agency Agreement (except for networking and omnibus fees), brokerage commissions, interest, dividends, taxes, acquired fund fees and expenses, and extraordinary expenses, to certain limits until at least November 1, 2012 (until at least November 1, 2013 for INTECH Global Dividend Fund). Expenses in the examples reflect application of these waivers. Had the waivers not been in effect, your expenses would have been higher. More information
Janus Mathematical Funds | 1
(Continued) (unaudited)
regarding the waivers is available in the Funds’ prospectuses.
Please note that the expenses shown in the tables are meant to highlight your ongoing costs only and do not reflect any transaction costs, such as redemption fees (where applicable) and any related exchange fees. These fees are fully described in the Funds’ prospectuses. Therefore, the second line of each table is useful in comparing ongoing costs only, and will not help you determine the relative total costs of owning different funds. In addition, if these transaction costs were included, your costs would have been higher.
2 | DECEMBER 31, 2011
INTECH Global Dividend Fund (unaudited)
| | | | | | | |
Fund Snapshot
INTECH’s active approach focuses on adding value by selecting stocks with unique volatility characteristics and low correlations to one another.
| | | | | | Managed by
INTECH Investment Management LLC |
Performance Overview
Since inception on December 15, 2011, through December 31, 2011, INTECH Global Dividend Fund’s Class I Shares returned 3.11%. This compares to the 3.54% return posted by the MSCI World Index, the Fund’s primary benchmark, and a 3.84% return for its secondary benchmark, the MSCI World High Dividend Yield Index.
Investment Strategy
INTECH’s mathematical investing process seeks to build a more efficient portfolio than its benchmark. The process seeks to minimize tracking error for a target level of excess return. In doing so, the process does not attempt to predict the direction of the market, nor does it have a view of any particular company in the portfolio. Instead, it employs a proprietary optimization process to build portfolios with the potential to outperform the index by capturing stocks’ natural volatility.
Within specific risk controls, INTECH’s disciplined mathematical process establishes target proportional weightings for stocks in the portfolio as a result of an optimization routine. Once the weights are determined and the portfolio is constructed, it is rebalanced and re-optimized on a periodic basis. By limiting the distance any one stock position can deviate from its benchmark weight, INTECH’s process attempts to control the relative risk of the portfolio. We believe that instituting an investment process aimed at providing consistent, positive excess returns at benchmark-like risk, will allow us to meet our investors’ objectives while minimizing the risk of significant underperformance relative to the benchmark.
Outlook
Going forward, we will continue building portfolios in a disciplined and deliberate manner, with risk management remaining the hallmark of our investment process. While we may experience short periods of underperformance, we expect to exceed the benchmark over a three- to five-year time horizon. As INTECH’s ongoing research efforts yield modest improvements, we will continue implementing changes that we believe are likely to improve the long-term results for our clients.
Thank you for your investment in INTECH Global Dividend Fund.
Janus Mathematical Funds | 3
INTECH Global Dividend Fund (unaudited)
INTECH Global Dividend Fund At A Glance
5 Largest Equity Holdings – (% of Net Assets)
As of December 31, 2011
| | | | | |
Lorillard, Inc.
Tobacco | | | 2.1% | |
SSE PLC
Electric – Integrated | | | 2.0% | |
British American Tobacco PLC
Tobacco | | | 1.9% | |
Philip Morris International, Inc.
Tobacco | | | 1.9% | |
Reynolds American, Inc.
Tobacco | | | 1.8% | |
| | | | | |
| | | | 9.7% | |
Asset Allocation – (% of Net Assets)
As of December 31, 2011
Top Country Allocations – Long Positions (% of Investment Securities)
As of December 31, 2011
4 | DECEMBER 31, 2011
(unaudited)
| | | | | | | | |
| Cumulative Total Return – for the periods ended December 31, 2011 | | | Expense Ratios – estimated for the fiscal year |
| | | Since
| | | Total Annual Fund
| | Net Annual Fund
|
| | | Inception* | | | Operating Expenses | | Operating Expenses |
| | | | | | | | |
| INTECH Global Dividend Fund – Class A Shares | | | | | | | |
| | | | | | | | |
| NAV | | 3.11% | | | 1.68% | | 1.27% |
| | | | | | | | |
| MOP | | –2.81% | | | | | |
| | | | | | | | |
| INTECH Global Dividend Fund- Class C Shares | | | | | | | |
| | | | | | | | |
| NAV | | 3.11% | | | 2.45% | | 2.02% |
| | | | | | | | |
| CDSC | | 2.08% | | | | | |
| | | | | | | | |
| INTECH Global Dividend Fund – Class D Shares(1) | | 3.11% | | | 1.49% | | 1.16% |
| | | | | | | | |
| INTECH Global Dividend Fund – Class I Shares | | 3.11% | | | 1.40% | | 1.02% |
| | | | | | | | |
| INTECH Global Dividend Fund – Class S Shares | | 3.11% | | | 1.83% | | 1.52% |
| | | | | | | | |
| INTECH Global Dividend Fund – Class T Shares | | 3.11% | | | 1.58% | | 1.27% |
| | | | | | | | |
| Morgan Stanley Capital International World IndexSM | | 3.54% | | | | | |
| | | | | | | | |
| Morgan Stanley Capital International World High Dividend Yield Index | | 3.84% | | | | | |
| | | | | | | | |
| | | | | | | | |
| Visit janus.com/advisor/mutual-funds (or janus.com/allfunds if you hold Shares directly with Janus Capital) to view current performance and characteristic information | | | | | |
| | | | | | | | |
Data presented represents past performance, which is no guarantee of future results. Investment results and principal value will fluctuate so that shares, when redeemed, may be worth more or less than their original cost. Due to market volatility, current performance may be higher or lower than the performance shown. Call 877.33JANUS(52687) (or 800.525.3713 if you hold shares directly with Janus Capital) or visit janus.com/advisor/mutual-funds (or janus.com/allfunds if you hold shares directly with Janus Capital) for performance current to the most recent month-end.
Performance shown for Class A Shares at Maximum Offering Price (MOP) includes the Fund’s maximum sales charge of 5.75%. Performance shown at Net Asset Value (NAV) does not include this charge and would have been lower had this charge been taken into account.
Performance shown for Class C Shares includes a 1% contingent deferred sales charge (CDSC) on periods of less than 12 months. Performance shown at Net Asset Value (NAV) does not include this sales charge and would have been lower had this sales charge been taken into account.
See important disclosures on the next page.
Janus Mathematical Funds | 5
INTECH Global Dividend Fund (unaudited)
Janus Capital has contractually agreed to waive the Fund’s total annual fund operating expenses allocated to any class (excluding the distribution and shareholder servicing fees (applicable to Class A Shares, Class C Shares, and Class S Shares), administrative services fees payable pursuant to the Transfer Agency Agreement (except for networking and omnibus fees), brokerage commissions, interest, dividends, taxes, acquired fund fees and expenses, and extraordinary expenses) to certain limits until at least November 1, 2013. The contractual waiver may be terminated or modified prior to this date only at the discretion of the Board of Trustees. Returns shown include fee waivers, if any, and without such waivers, returns would have been lower.
The expense information shown reflects estimated annualized expenses that the share classes of the Fund expect to incur during their initial fiscal year. The effect of contractual waivers agreed to by Janus Capital, when applicable, are reflected under “Net Annual Fund Operating Expenses.” (All expenses are shown without the effect of expense offset arrangements. Pursuant to such arrangements, credits realized as a result of uninvested cash balances are used to reduce custodian and transfer agent expenses.)
The proprietary mathematical process used by INTECH Investment Management LLC (“INTECH”) may not achieve the desired results. The rebalancing techniques used by the Fund may result in a higher portfolio turnover rate, higher expenses and potentially higher net taxable gains or losses compared to a “buy and hold” or index fund strategy.
The Fund’s performance may be affected by risks that include those associated with investments in specific industries or countries and potential conflicts of interest with the Janus “funds of funds.” Additional risks to the Fund may include those associated with investing in foreign securities, initial public offerings (“IPOs”), real estate investment trusts (“REITs”), and derivatives. Please see a Janus prospectus or janus.com/info (or janus.com/reports if you hold shares directly with Janus Capital) for more information about risks, portfolio holdings and other details.
The Fund invests in REITs, which may be subject to a higher degree of market risk because of concentration in a specific industry, sector or geographic region. REITs may be subject to risks including, but not limited to: legal, political, liquidity, and interest rate risks, a decline in the value of real estate, risks related to general and economic conditions, changes in the value of the underlying property owned by the trust and defaults by borrowers. To the extent the Fund invests in foreign REITs, the Fund may be subject to fluctuations in currency rates or political or economic conditions in a particular country.
Foreign securities have additional risks including exchange rate changes, political and economic upheaval, the relative lack of information, relatively low market liquidity and the potential lack of strict financial and accounting controls and standards. These risks are magnified in emerging markets. The prices of foreign securities held by the Fund, and therefore the Fund’s performance, may decline in response to such risks.
For a period of three years subsequent to the effective date, Janus Capital may recover from the Fund fees and expenses previously waived or reimbursed, which could then be considered a deferral, if the Fund’s expense ratio, including recovered expenses, falls below the expense limit.
The Fund will normally invest at least 80% of its net assets, measured at the time of purchase, in the type of securities described by its name.
The Fund’s performance for very short time periods may not be indicative of future performance.
Returns include reinvestment of dividends from net investment income and distributions from capital gains. The returns shown do not reflect the deduction of taxes that a shareholder would pay on Fund distributions or the redemption of Fund shares. The returns do not include adjustments in accordance with generally accepted accounting principles required at the period end for financial reporting purposes.
Net dividends reinvested are the dividends that remain to be reinvested after foreign tax obligations have been met. Such obligations vary from country to country.
Lipper does not rank this Fund as it is less than one year old.
There is no assurance that the investment process will consistently lead to successful investing.
See Notes to Schedules of Investments for index definitions.
The weighting of securities within the portfolio may differ significantly from the weightings within the indices. The indices are unmanaged and are not available for direct investment; therefore, their performance does not reflect the expenses associated with the active management of an actual portfolio.
See “Explanations of Charts, Tables and Financial Statements.”
| | | |
| * | | The Fund’s inception date – December 15, 2011 |
| (1) | | Closed to new investors. |
6 | DECEMBER 31, 2011
(unaudited)
The examples below show you the ongoing costs (in dollars) of investing in your Fund and allow you to compare these costs with those of other mutual funds. Please refer to the section Useful Information About Your Fund Report for a detailed explanation of the information presented in these charts.
| | | | | | | | | | | | | | | |
| | | Beginning Account Value
| | Ending Account Value
| | Expenses Paid During Period
| | |
| Expense Example – Class A Shares | | (12/15/11) | | (12/31/11) | | (12/15/11 - 12/31/11)† | | |
| |
| |
| Actual | | $ | 1,000.00 | | | $ | 1,031.10 | | | $ | 0.49 | | | |
| |
| |
Hypothetical
(5% return before expenses) | | $ | 1,000.00 | | | $ | 1,019.96 | | | $ | 5.23 | | | |
| |
| |
| | | | | | | | | | | | | | | |
| | | | | | | | | | | | | | | |
| | | Beginning Account Value
| | Ending Account Value
| | Expenses Paid During Period
| | |
| Expense Example – Class C Shares | | (12/15/11) | | (12/31/11) | | (12/15/11 - 12/31/11)† | | |
| |
| |
| Actual | | $ | 1,000.00 | | | $ | 1,031.10 | | | $ | 0.57* | | | |
| |
| |
Hypothetical
(5% return before expenses) | | $ | 1,000.00 | | | $ | 1,019.10 | | | $ | 6.09 | | | |
| |
| |
| | | | | | | | | | | | | | | |
| | | | | | | | | | | | | | | |
| | | Beginning Account Value
| | Ending Account Value
| | Expenses Paid During Period
| | |
| Expense Example – Class D Shares | | (12/15/11) | | (12/31/11) | | (12/15/11 - 12/31/11)† | | |
| |
| |
| Actual | | $ | 1,000.00 | | | $ | 1,031.10 | | | $ | 0.47 | | | |
| |
| |
Hypothetical
(5% return before expenses) | | $ | 1,000.00 | | | $ | 1,020.11 | | | $ | 5.08 | | | |
| |
| |
| | | | | | | | | | | | | | | |
| | | | | | | | | | | | | | | |
| | | Beginning Account Value
| | Ending Account Value
| | Expenses Paid During Period
| | |
| Expense Example – Class I Shares | | (12/15/11) | | (12/31/11) | | (12/15/11 - 12/31/11)† | | |
| |
| |
| Actual | | $ | 1,000.00 | | | $ | 1,031.10 | | | $ | 0.46 | | | |
| |
| |
Hypothetical
(5% return before expenses) | | $ | 1,000.00 | | | $ | 1,020.26 | | | $ | 4.93 | | | |
| |
| |
| | | | | | | | | | | | | | | |
| | | | | | | | | | | | | | | |
| | | Beginning Account Value
| | Ending Account Value
| | Expenses Paid During Period
| | |
| Expense Example – Class S Shares | | (12/15/11) | | (12/31/11) | | (12/15/11 - 12/31/11)† | | |
| |
| |
| Actual | | $ | 1,000.00 | | | $ | 1,031.10 | | | $ | 0.51* | | | |
| |
| |
Hypothetical
(5% return before expenses) | | $ | 1,000.00 | | | $ | 1,019.66 | | | $ | 5.53 | | | |
| |
| |
| | | | | | | | | | | | | | | |
| | | | | | | | | | | | | | | |
| | | Beginning Account Value
| | Ending Account Value
| | Expenses Paid During Period
| | |
| Expense Example – Class T Shares | | (12/15/11) | | (12/31/11) | | (12/15/11 - 12/31/11)† | | |
| |
| |
| Actual | | $ | 1,000.00 | | | $ | 1,031.10 | | | $ | 0.49 | | | |
| |
| |
Hypothetical
(5% return before expenses) | | $ | 1,000.00 | | | $ | 1,019.96 | | | $ | 5.23 | | | |
| |
| |
| | | |
| † | | Actual expenses paid reflect only the inception period (December 15, 2011 to December 31, 2011). Therefore actual expenses shown are lower than would be expected for a six-month period. Actual expenses are equal to the annualized expense ratio of 1.03% for Class A Shares, 1.20% for Class C Shares, 1.00% for Class D Shares, 0.97% for Class I Shares, 1.09% for Class S Shares and 1.03% for Class T Shares multiplied by the average account value over the period, multiplied by 17/366 (to reflect the period). Expenses include effect of contractual waivers by Janus Capital. |
| * | | Pursuant to a contractual agreement, Janus waived certain fees and expenses during the inception period for Class C Shares and Class S Shares. Without these waivers, the expenses paid during the period would have been $10.06 for Class C Shares and $7.51 for Class S Shares. |
Janus Mathematical Funds | 7
INTECH Global Dividend Fund
Schedule of Investments (unaudited)
As of December 31, 2011
| | | | | | | | | | | |
| Shares | | Value | | | |
| |
| Common Stock – 93.6% | | | | | | |
| Aerospace and Defense – 0.7% | | | | | | |
| | 2,323 | | | BAE Systems PLC | | $ | 10,283 | | | |
| | 2,128 | | | Finmeccanica SpA | | | 7,871 | | | |
| | 100 | | | Lockheed Martin Corp. | | | 8,090 | | | |
| | 100 | | | Northrop Grumman Corp. | | | 5,848 | | | |
| | 100 | | | Raytheon Co. | | | 4,838 | | | |
| | | | | | | | 36,930 | | | |
| Airlines – 0.2% | | | | | | |
| | 5,000 | | | Cathay Pacific Airways, Ltd. | | | 8,576 | | | |
| Appliances – 0.2% | | | | | | |
| | 439 | | | Electrolux A.B. | | | 7,002 | | | |
| | 100 | | | Whirlpool Corp. | | | 4,745 | | | |
| | | | | | | | 11,747 | | | |
| Athletic Footwear – 0.1% | | | | | | |
| | 2,000 | | | Yue Yuen Industrial Holdings, Ltd. | | | 6,322 | | | |
| Beverages – Non-Alcoholic – 0.4% | | | | | | |
| | 1,385 | | | Coca-Cola Amatil, Ltd. | | | 16,301 | | | |
| | 326 | | | Coca-Cola Hellenic Bottling Co. S.A. | | | 5,590 | | | |
| | | | | | | | 21,891 | | | |
| Beverages – Wine and Spirits – 0.3% | | | | | | |
| | 806 | | | Diageo PLC | | | 17,602 | | | |
| Building – Heavy Construction – 0.8% | | | | | | |
| | 154 | | | Acciona S.A. | | | 13,299 | | | |
| | 361 | | | ACS Actividades de Construccion y Servicios S.A. | | | 10,698 | | | |
| | 417 | | | Aker Kvaerner A.S.A. | | | 4,391 | | | |
| | 466 | | | Skanska A.B. – Class B | | | 7,724 | | | |
| | 173 | | | Vinci S.A. | | | 7,558 | | | |
| | | | | | | | 43,670 | | | |
| Building and Construction – Miscellaneous – 1.0% | | | | | | |
| | 1,959 | | | Balfour Beatty PLC | | | 8,054 | | | |
| | 249 | | | Bouygues S.A. | | | 7,845 | | | |
| | 2,427 | | | Cintra Concesiones de Infraestructuras de Transporte S.A. | | | 29,288 | | | |
| | 219 | | | Eiffage S.A. | | | 5,301 | | | |
| | 186 | | | Koninklijke Boskalis Westminster N.V. | | | 6,834 | | | |
| | | | | | | | 57,322 | | | |
| Building and Construction Products – Miscellaneous – 0.4% | | | | | | |
| | 123 | | | Cie de Saint-Gobain | | | 4,722 | | | |
| | 82 | | | Geberit A.G. | | | 15,806 | | | |
| | | | | | | | 20,528 | | | |
| Building Products – Cement and Aggregate – 0.5% | | | | | | |
| | 2,039 | | | Cimpor-Cimentos de Portugal | | | 14,030 | | | |
| | 768 | | | CRH PLC | | | 15,266 | | | |
| | | | | | | | 29,296 | | | |
| Building Products – Doors and Windows – 0.2% | | | | | | |
| | 1,000 | | | Asahi Glass Co., Ltd. | | | 8,395 | | | |
| Cable/Satellite Television – 0.4% | | | | | | |
| | 400 | | | Cablevision Systems New York Group – Class A | | | 5,688 | | | |
| | 700 | | | Shaw Communications, Inc. – Class B | | | 13,918 | | | |
| | | | | | | | 19,606 | | | |
| Casino Hotels – 0.2% | | | | | | |
| | 3,690 | | | Sky City Entertainment Group, Ltd. | | | 9,877 | | | |
| Casino Services – 0.5% | | | | | | |
| | 500 | | | Sankyo Co., Ltd. | | | 25,309 | | | |
| Cellular Telecommunications – 1.2% | | | | | | |
| | 669 | | | Cellcom Israel, Ltd. | | | 11,231 | | | |
| | 284 | | | Mobistar S.A. | | | 14,881 | | | |
| | 4 | | | NTT DoCoMo, Inc. | | | 7,355 | | | |
| | 1,047 | | | Partner Communications Co., Ltd. | | | 9,290 | | | |
| | 200 | | | Rogers Communications, Inc. | | | 7,707 | | | |
| | 4,722 | | | Vodafone Group PLC | | | 13,117 | | | |
| | | | | | | | 63,581 | | | |
| Chemicals – Diversified – 0.8% | | | | | | |
| | 109 | | | Akzo Nobel N.V. | | | 5,270 | | | |
| | 103 | | | BASF S.E. | | | 7,183 | | | |
| | 100 | | | E.I. du Pont de Nemours & Co. | | | 4,578 | | | |
| | 1,088 | | | Israel Chemicals, Ltd. | | | 11,343 | | | |
| | 1,000 | | | Kaneka Corp. | | | 5,328 | | | |
| | 118 | | | Koninklijke DSM N.V. | | | 5,475 | | | |
| | 47 | | | Wacker Chemie A.G. | | | 3,780 | | | |
| | | | | | | | 42,957 | | | |
| Chemicals – Specialty – 0.1% | | | | | | |
| | 99 | | | Lonza Group A.G. | | | 5,851 | | | |
| Commercial Banks – 4.1% | | | | | | |
| | 1,000 | | | Aozora Bank, Ltd. | | | 2,755 | | | |
| | 1,227 | | | Banco Bilbao Vizcaya Argentaria S.A. | | | 10,607 | | | |
| | 3,041 | | | Banco de Sabadell S.A. | | | 11,546 | | | |
| | 1,858 | | | Banco Santander Central Hispano S.A. | | | 14,114 | | | |
| | 200 | | | Bank of Montreal | | | 10,973 | | | |
| | 100 | | | Bank of Nova Scotia | | | 4,991 | | | |
| | 1,953 | | | Bendigo and Adelaide Bank, Ltd. | | | 16,037 | | | |
| | 4,000 | | | BOC Hong Kong Holdings, Ltd. | | | 9,477 | | | |
| | 2,652 | | | CaixaBank | | | 13,024 | | | |
| | 100 | | | Canadian Imperial Bank of Commerce | | | 7,245 | | | |
| | 218 | | | Commonwealth Bank of Australia | | | 10,972 | | | |
| | 1,000 | | | DBS Group Holdings, Ltd. | | | 8,884 | | | |
| | 278 | | | Erste Group Bank A.G. | | | 4,897 | | | |
| | 700 | | | Hang Seng Bank, Ltd. | | | 8,306 | | | |
| | 100 | | | M&T Bank Corp. | | | 7,634 | | | |
| | 200 | | | National Bank of Canada | | | 14,166 | | | |
| | 1,000 | | | Oversea-Chinese Banking Corp., Ltd. | | | 6,038 | | | |
| | 2,000 | | | Resona Holdings, Inc. | | | 8,811 | | | |
| | 100 | | | Royal Bank of Canada | | | 5,104 | | | |
| | 2,900 | | | Seven Bank, Ltd. | | | 5,691 | | | |
| | 300 | | | Sumitomo Mitsui Financial Group, Inc. | | | 8,359 | | | |
| | 271 | | | Svenska Handelsbanken A.B. – Class A | | | 7,131 | | | |
| | 100 | | | Toronto-Dominion Bank | | | 7,490 | | | |
| | 1,000 | | | United Overseas Bank, Ltd. | | | 11,776 | | | |
| | 568 | | | Westpac Banking Corp. | | | 11,617 | | | |
| | | | | | | | 227,645 | | | |
| Commercial Services – Finance – 0.5% | | | | | | |
| | 1,200 | | | H&R Block, Inc. | | | 19,596 | | | |
| | 200 | | | Paychex, Inc. | | | 6,022 | | | |
| | | | | | | | 25,618 | | | |
| Computer Services – 0.1% | | | | | | |
| | 640 | | | Indra Sistemas S.A. | | | 8,147 | | | |
| Consumer Products – Miscellaneous – 0.5% | | | | | | |
| | 100 | | | Clorox Co. | | | 6,656 | | | |
| | 300 | | | Kimberly-Clark Corp. | | | 22,068 | | | |
| | | | | | | | 28,724 | | | |
| Cosmetics and Toiletries – 0.2% | | | | | | |
| | 500 | | | Avon Products, Inc. | | | 8,735 | | | |
See Notes to Schedules of Investments and Financial Statements.
8 | DECEMBER 31, 2011
Schedule of Investments (unaudited)
As of December 31, 2011
| | | | | | | | | | | |
| Shares | | Value | | | |
| |
| Distribution/Wholesale – 0.1% | | | | | | |
| | 100 | | | Genuine Parts Co. | | $ | 6,120 | | | |
| Diversified Financial Services – 0.1% | | | | | | |
| | 1,346 | | | Investec PLC | | | 7,085 | | | |
| Diversified Operations – 1.3% | | | | | | |
| | 100 | | | Eaton Corp. | | | 4,353 | | | |
| | 96 | | | Groupe Bruxelles Lambert S.A. | | | 6,399 | | | |
| | 1,000 | | | Keppel Corp., Ltd. | | | 7,172 | | | |
| | 400 | | | Leggett & Platt, Inc. | | | 9,216 | | | |
| | 7,000 | | | NWS Holdings, Ltd. | | | 10,311 | | | |
| | 1,241 | | | Orkla A.S.A. | | | 9,269 | | | |
| | 1,000 | | | Swire Pacific, Ltd. – Class A | | | 12,072 | | | |
| | 512 | | | Wartsila Oyj – Class B | | | 14,789 | | | |
| | | | | | | | 73,581 | | | |
| Diversified Operations – Commercial Services – 0.3% | | | | | | |
| | 1,906 | | | Brambles, Ltd. | | | 13,955 | | | |
| Electric – Distribution – 0.1% | | | | | | |
| | 492 | | | AGL Energy, Ltd. | | | 7,210 | | | |
| Electric – Generation – 0.3% | | | | | | |
| | 600 | | | Electric Power Development Co., Ltd. | | | 15,961 | | | |
| Electric – Integrated – 15.4% | | | | | | |
| | 200 | | | Alliant Energy Corp. | | | 8,822 | | | |
| | 300 | | | American Electric Power Co., Inc. | | | 12,393 | | | |
| | 1,700 | | | Chubu Electric Power Co., Inc. | | | 31,747 | | | |
| | 2,000 | | | CLP Holdings, Ltd. | | | 17,009 | | | |
| | 500 | | | Consolidated Edison, Inc. | | | 31,015 | | | |
| | 900 | | | Dominion Resources, Inc. | | | 47,772 | | | |
| | 500 | | | DTE Energy Co. | | | 27,225 | | | |
| | 1,100 | | | Duke Energy Corp. | | | 24,200 | | | |
| | 521 | | | E.ON A.G. | | | 11,239 | | | |
| | 300 | | | Edison International | | | 12,420 | | | |
| | 3,630 | | | Energias de Portugal S.A. | | | 11,232 | | | |
| | 100 | | | Entergy Corp. | | | 7,305 | | | |
| | 500 | | | Exelon Corp. | | | 21,685 | | | |
| | 400 | | | FirstEnergy Corp. | | | 17,720 | | | |
| | 200 | | | Fortis, Inc. | | | 6,553 | | | |
| | 401 | | | Fortum Oyj | | | 8,557 | | | |
| | 100 | | | FPL Group, Inc. | | | 6,088 | | | |
| | 437 | | | GDF Suez | | | 11,944 | | | |
| | 600 | | | Hokuriku Electric Power Co. | | | 11,205 | | | |
| | 8,000 | | | HongKong Electric Holdings | | | 59,179 | | | |
| | 1,652 | | | Iberdrola S.A. | | | 10,345 | | | |
| | 300 | | | Integrys Energy Group, Inc. | | | 16,254 | | | |
| | 4,735 | | | International Power PLC | | | 24,791 | | | |
| | 400 | | | Kansai Electric Power Co., Inc. | | | 6,139 | | | |
| | 200 | | | Northeast Utilities | | | 7,214 | | | |
| | 200 | | | NSTAR | | | 9,392 | | | |
| | 1,100 | | | Pepco Holdings, Inc. | | | 22,330 | | | |
| | 200 | | | PG&E Corp. | | | 8,244 | | | |
| | 400 | | | Pinnacle West Capital Corp. | | | 19,272 | | | |
| | 1,200 | | | PPL Corp. | | | 35,304 | | | |
| | 700 | | | Progress Energy, Inc. | | | 39,214 | | | |
| | 900 | | | Public Service Enterprise Group, Inc. | | | 29,709 | | | |
| | 374 | | | RWE A.G. | | | 13,140 | | | |
| | 300 | | | SCANA Corp. | | | 13,518 | | | |
| | 700 | | | Southern Co. | | | 32,403 | | | |
| | 5,621 | | | SSE PLC | | | 112,675 | | | |
| | 1,000 | | | TransAlta Corp. | | | 20,638 | | | |
| | 600 | | | Wisconsin Energy Corp. | | | 20,976 | | | |
| | 700 | | | Xcel Energy, Inc. | | | 19,348 | | | |
| | | | | | | | 846,216 | | | |
| Electric – Transmission – 0.4% | | | | | | |
| | 195 | | | Red Electrica Corp. S.A. | | | 8,344 | | | |
| | 3,585 | | | Terna Rete Elettrica Nazionale SpA | | | 12,081 | | | |
| | | | | | | | 20,425 | | | |
| Electronic Components – Miscellaneous – 0.2% | | | | | | |
| | 300 | | | Garmin, Ltd. | | | 11,943 | | | |
| Electronic Components – Semiconductors – 0.5% | | | | | | |
| | 500 | | | Microchip Technology, Inc. | | | 18,315 | | | |
| | 1,443 | | | STMicroelectronics N.V. | | | 8,573 | | | |
| | | | | | | | 26,888 | | | |
| Engineering – Research and Development Services – 0.2% | | | | | | |
| | 2,000 | | | SembCorp Industries, Ltd. | | | 6,247 | | | |
| | 205 | | | WorleyParsons, Ltd. | | | 5,381 | | | |
| | | | | | | | 11,628 | | | |
| Enterprise Software/Services – 0.4% | | | | | | |
| | 1,000 | | | Nomura Research Institute, Ltd. | | | 22,612 | | | |
| Finance – Credit Card – 0.3% | | | | | | |
| | 1,000 | | | Aeon Credit Service Co., Ltd. | | | 15,802 | | | |
| Finance – Investment Bankers/Brokers – 0.3% | | | | | | |
| | 1,338 | | | ICAP PLC | | | 7,207 | | | |
| | 392 | | | Macquarie Bank, Ltd. | | | 9,536 | | | |
| | | | | | | | 16,743 | | | |
| Finance – Other Services – 0.8% | | | | | | |
| | 315 | | | ASX, Ltd. | | | 9,850 | | | |
| | 127 | | | Deutsche Boerse A.G.* | | | 6,658 | | | |
| | 395 | | | London Stock Exchange Group PLC | | | 4,876 | | | |
| | 300 | | | NYSE Euronext | | | 7,830 | | | |
| | 1,000 | | | Singapore Exchange, Ltd. | | | 4,727 | | | |
| | 300 | | | TMX Group, Inc. | | | 12,280 | | | |
| | | | | | | | 46,221 | | | |
| Food – Miscellaneous/Diversified – 3.2% | | | | | | |
| | 200 | | | Campbell Soup Co. | | | 6,648 | | | |
| | 1,200 | | | ConAgra Foods, Inc. | | | 31,680 | | | |
| | 100 | | | General Mills, Inc. | | | 4,041 | | | |
| | 200 | | | H.J. Heinz Co. | | | 10,808 | | | |
| | 100 | | | Kellogg Co. | | | 5,057 | | | |
| | 800 | | | Kraft Foods, Inc. – Class A | | | 29,888 | | | |
| | 1,235 | | | Nestle S.A. | | | 71,023 | | | |
| | 217 | | | Unilever N.V. | | | 7,461 | | | |
| | 301 | | | Unilever PLC | | | 10,109 | | | |
| | | | | | | | 176,715 | | | |
| Food – Retail – 0.7% | | | | | | |
| | 79 | | | Casino Guichard Perrachon S.A. | | | 6,653 | | | |
| | 117 | | | Delhaize Group | | | 6,572 | | | |
| | 1,726 | | | J Sainsbury PLC | | | 8,118 | | | |
| | 1,049 | | | Tesco PLC | | | 6,571 | | | |
| | 311 | | | Woolworths, Ltd. | | | 7,983 | | | |
| | | | | | | | 35,897 | | | |
See Notes to Schedules of Investments and Financial Statements.
Janus Mathematical Funds | 9
INTECH Global Dividend Fund
Schedule of Investments (unaudited)
As of December 31, 2011
| | | | | | | | | | | |
| Shares | | Value | | | |
| |
| Food – Wholesale/Distribution – 0.4% | | | | | | |
| | 4,237 | | | Metcash, Ltd. | | $ | 17,504 | | | |
| | 200 | | | Sysco Corp. | | | 5,866 | | | |
| | | | | | | | 23,370 | | | |
| Gas – Transportation – 4.6% | | | | | | |
| | 2,900 | | | CenterPoint Energy, Inc. | | | 58,261 | | | |
| | 1,806 | | | Centrica PLC | | | 8,112 | | | |
| | 560 | | | Enagas | | | 10,356 | | | |
| | 2,644 | | | Gas Natural SDG S.A. | | | 45,387 | | | |
| | 3,539 | | | National Grid PLC | | | 34,344 | | | |
| | 2,200 | | | NiSource, Inc. | | | 52,382 | | | |
| | 200 | | | Sempra Energy | | | 11,000 | | | |
| | 6,965 | | | Snam Rete Gas SpA | | | 30,700 | | | |
| | | | | | | | 250,542 | | | |
| Import/Export – 1.3% | | | | | | |
| | 1,400 | | | Itochu Corp. | | | 14,227 | | | |
| | 2,000 | | | Marubeni Corp. | | | 12,190 | | | |
| | 600 | | | Mitsubishi Corp. | | | 12,125 | | | |
| | 1,000 | | | Mitsui & Co., Ltd. | | | 15,556 | | | |
| | 1,200 | | | Sumitomo Corp. | | | 16,249 | | | |
| | | | | | | | 70,347 | | | |
| Insurance Brokers – 0.3% | | | | | | |
| | 200 | | | Marsh & McLennan Cos., Inc. | | | 6,324 | | | |
| | 300 | | | Willis Group Holdings, Ltd. | | | 11,640 | | | |
| | | | | | | | 17,964 | | | |
| Investment Companies – 1.2% | | | | | | |
| | 4,000 | | | Cheung Kong Infrastructure Holdings, Ltd. | | | 23,434 | | | |
| | 406 | | | Investor A.B. – Class B | | | 7,579 | | | |
| | 78 | | | Pargesa Holding S.A. | | | 5,109 | | | |
| | 608 | | | Ratos A.B. | | | 7,138 | | | |
| | 5,597 | | | Resolution, Ltd. | | | 21,848 | | | |
| | | | | | | | 65,108 | | | |
| Investment Management and Advisory Services – 0.5% | | | | | | |
| | 400 | | | CI Financial Corp. | | | 8,287 | | | |
| | 200 | | | IGM Financial, Inc. | | | 8,685 | | | |
| | 6,600 | | | Man Group PLC | | | 12,882 | | | |
| | | | | | | | 29,854 | | | |
| Life and Health Insurance – 1.3% | | | | | | |
| | 500 | | | Great-West Lifeco, Inc. | | | 10,015 | | | |
| | 1,000 | | | Manulife Financial Corp. | | | 10,653 | | | |
| | 400 | | | Power Corp. of Canada | | | 9,355 | | | |
| | 300 | | | Power Financial Corp. | | | 7,523 | | | |
| | 644 | | | Prudential PLC | | | 6,385 | | | |
| | 3,664 | | | Standard Life PLC | | | 11,736 | | | |
| | 500 | | | Sun Life Financial, Inc. | | | 9,278 | | | |
| | 75 | | | Swiss Life Holdings | | | 6,901 | | | |
| | | | | | | | 71,846 | | | |
| Lottery Services – 0.3% | | | | | | |
| | 7,053 | | | Tatts Group, Ltd. | | | 17,598 | | | |
| Machinery – General Industrial – 0.2% | | | | | | |
| | 620 | | | Zardoya Otis S.A. | | | 8,505 | | | |
| Medical – Drugs – 8.9% | | | | | | |
| | 600 | | | Abbott Laboratories | | | 33,738 | | | |
| | 200 | | | Astellas Pharma, Inc. | | | 8,135 | | | |
| | 216 | | | AstraZeneca PLC | | | 9,978 | | | |
| | 1,200 | | | Bristol-Myers Squibb Co. | | | 42,288 | | | |
| | 800 | | | Eisai Co., Ltd. | | | 33,112 | | | |
| | 400 | | | Eli Lilly & Co. | | | 16,624 | | | |
| | 1,717 | | | GlaxoSmithKline PLC | | | 39,230 | | | |
| | 100 | | | Johnson & Johnson | | | 6,558 | | | |
| | 205 | | | Novartis A.G. | | | 11,724 | | | |
| | 600 | | | ONO Pharmaceutical Co., Ltd. | | | 33,684 | | | |
| | 650 | | | Orion Oyj – Class B | | | 12,660 | | | |
| | 2,600 | | | Pfizer, Inc. | | | 56,264 | | | |
| | 585 | | | Roche Holding A.G. | | | 99,182 | | | |
| | 558 | | | Sanofi | | | 40,980 | | | |
| | 500 | | | Shionogi & Co., Ltd. | | | 6,426 | | | |
| | 200 | | | Takeda Pharmaceutical Co., Ltd. | | | 8,785 | | | |
| | 737 | | | UCB S.A. | | | 31,006 | | | |
| | | | | | | | 490,374 | | | |
| Medical Products – 0.1% | | | | | | |
| | 113 | | | Cochlear, Ltd. | | | 7,164 | | | |
| Metal – Diversified – 0.1% | | | | | | |
| | 475 | | | Boliden A.B. | | | 6,940 | | | |
| Mining Services – 0.1% | | | | | | |
| | 244 | | | Orica, Ltd. | | | 6,048 | | | |
| MRI and Medical Diagnostic Imaging Center – 0.2% | | | | | | |
| | 764 | | | Sonic Healthcare, Ltd. | | | 8,813 | | | |
| Multi-Line Insurance – 1.3% | | | | | | |
| | 74 | | | Allianz S.E. | | | 7,078 | | | |
| | 122 | | | Baloise Holding A.G. | | | 8,367 | | | |
| | 300 | | | Cincinnati Financial Corp. | | | 9,138 | | | |
| | 729 | | | CNP Assurances | | | 9,036 | | | |
| | 42 | | | Gjensidige Forsikring A.S.A. | | | 487 | | | |
| | 4,805 | | | Mapfre S.A. | | | 15,265 | | | |
| | 339 | | | Sampo Oyj – Class A | | | 8,410 | | | |
| | 50 | | | Zurich Financial Services A.G. | | | 11,315 | | | |
| | | | | | | | 69,096 | | | |
| Multimedia – 0.7% | | | | | | |
| | 317 | | | Lagardere S.C.A. | | | 8,368 | | | |
| | 995 | | | Nikon Corp. | | | 11,415 | | | |
| | 712 | | | Pearson PLC | | | 13,377 | | | |
| | 200 | | | Thomson Reuters Corp. | | | 5,347 | | | |
| | | | | | | | 38,507 | | | |
| Non-Hazardous Waste Disposal – 0.1% | | | | | | |
| | 200 | | | Waste Management, Inc. | | | 6,542 | | | |
| Office Automation and Equipment – 0.4% | | | | | | |
| | 600 | | | Pitney Bowes, Inc. | | | 11,124 | | | |
| | 1,000 | | | Ricoh Co., Ltd. | | | 8,720 | | | |
| | | | | | | | 19,844 | | | |
| Oil – Field Services – 0.1% | | | | | | |
| | 78 | | | Fugro N.V. | | | 4,532 | | | |
| Oil and Gas Drilling – 0.5% | | | | | | |
| | 855 | | | Seadrill, Ltd. | | | 28,604 | | | |
| Oil Companies – Exploration and Production – 0.3% | | | | | | |
| | 500 | | | EnCana Corp. | | | 9,274 | | | |
| | 200 | | | Vermilion Energy, Inc. | | | 8,909 | | | |
| | | | | | | | 18,183 | | | |
| Oil Companies – Integrated – 3.5% | | | | | | |
| | 700 | | | Chevron Corp. | | | 74,480 | | | |
| | 500 | | | ConocoPhillips | | | 36,435 | | | |
| | 300 | | | Husky Energy, Inc. | | | 7,231 | | | |
See Notes to Schedules of Investments and Financial Statements.
10 | DECEMBER 31, 2011
Schedule of Investments (unaudited)
As of December 31, 2011
| | | | | | | | | | | |
| Shares | | Value | | | |
| |
| Oil Companies – Integrated – (continued) | | | | | | |
| | | | | | | | | | | |
| | 191 | | | OMV A.G. | | $ | 5,803 | | | |
| | 274 | | | Repsol YPF S.A. | | | 8,416 | | | |
| | 223 | | | Royal Dutch Shell PLC – Class A | | | 8,210 | | | |
| | 677 | | | Royal Dutch Shell PLC – Class B | | | 25,796 | | | |
| | 666 | | | StatoilHydro A.S.A. | | | 17,101 | | | |
| | 209 | | | Total S.A. | | | 10,683 | | | |
| | | | | | | | 194,155 | | | |
| Oil Refining and Marketing – 0.4% | | | | | | |
| | 2,000 | | | Cosmo Oil Co. | | | 5,588 | | | |
| | 1,000 | | | JX Holdings, Inc. | | | 6,043 | | | |
| | 1,000 | | | TonenGeneral Sekiyu K.K. | | | 10,929 | | | |
| | | | | | | | 22,560 | | | |
| Paper and Related Products – 0.2% | | | | | | |
| | 200 | | | MeadWestvaco Corp. | | | 5,990 | | | |
| | 456 | | | Svenska Cellulosa | | | 6,762 | | | |
| | | | | | | | 12,752 | | | |
| Pipelines – 1.2% | | | | | | |
| | 500 | | | Spectra Energy Corp. | | | 15,375 | | | |
| | 1,200 | | | TransCanada Corp. | | | 52,465 | | | |
| | | | | | | | 67,840 | | | |
| Printing – Commercial – 0.3% | | | | | | |
| | 700 | | | R.R. Donnelley & Sons Co. | | | 10,101 | | | |
| | 1,000 | | | Toppan Printing Co., Ltd. | | | 7,355 | | | |
| | | | | | | | 17,456 | | | |
| Property and Casualty Insurance – 0.4% | | | | | | |
| | 706 | | | Admiral Group PLC | | | 9,340 | | | |
| | 1,038 | | | QBE Insurance Group, Ltd. | | | 13,746 | | | |
| | | | | | | | 23,086 | | | |
| Public Thoroughfares – 0.5% | | | | | | |
| | 977 | | | Abertis Infraestucturas S.A. | | | 15,602 | | | |
| | 616 | | | Atlantia SpA | | | 9,861 | | | |
| | | | | | | | 25,463 | | | |
| Publishing – Books – 0.1% | | | | | | |
| | 847 | | | Reed Elsevier PLC | | | 6,826 | | | |
| Publishing – Newspapers – 0.2% | | | | | | |
| | 4,000 | | | Singapore Press Holdings, Ltd. | | | 11,383 | | | |
| Publishing – Periodicals – 0.3% | | | | | | |
| | 164 | | | Axel Springer A.G. | | | 7,047 | | | |
| | 403 | | | Wolters Kluwer N.V. | | | 6,965 | | | |
| | | | | | | | 14,012 | | | |
| Real Estate Operating/Development – 1.6% | | | | | | |
| | 400 | | | Brookfield Properties Corp. | | | 6,272 | | | |
| | 600 | | | Daito Trust Construction Co., Ltd. | | | 51,462 | | | |
| | 4,500 | | | Hopewell Holdings, Ltd. | | | 11,507 | | | |
| | 12,000 | | | New World Development, Ltd. | | | 9,673 | | | |
| | 6,000 | | | Sino Land Co., Ltd. | | | 8,545 | | | |
| | | | | | | | 87,459 | | | |
| Reinsurance – 0.5% | | | | | | |
| | 217 | | | Hannover Rueckversicherung A.G. | | | 10,762 | | | |
| | 76 | | | Muenchener Rueckversicherungs A.G. | | | 9,322 | | | |
| | 393 | | | SCOR S.E. | | | 9,185 | | | |
| | | | | | | | 29,269 | | | |
| Retail – Apparel and Shoe – 0.3% | | | | | | |
| | 483 | | | Hennes & Mauritz A.B. – Class B | | | 15,540 | | | |
| Retail – Convenience Stores – 0.6% | | | | | | |
| | 500 | | | Lawson, Inc. | | | 31,222 | | | |
| Retail – Discount – 0.2% | | | | | | |
| | 4,449 | | | Harvey Norman Holdings, Ltd. | | | 8,348 | | | |
| Retail – Major Department Stores – 0.6% | | | | | | |
| | 1,659 | | | Marks & Spencer Group PLC | | | 8,011 | | | |
| | 167 | | | PPR | | | 23,913 | | | |
| | | | | | | | 31,924 | | | |
| Retail – Restaurants – 1.5% | | | | | | |
| | 800 | | | McDonald’s Corp. | | | 80,264 | | | |
| Rubber – Tires – 0.1% | | | | | | |
| | 121 | | | Compagnie Generale des Etablissements Michelin – Class B | | | 7,152 | | | |
| Satellite Telecommunications – 0.3% | | | | | | |
| | 1,169 | | | Inmarsat PLC. | | | 7,346 | | | |
| | 317 | | | SES S.A. (FDR) | | | 7,607 | | | |
| | | | | | | | 14,953 | | | |
| Savings/Loan/Thrifts – 0.2% | | | | | | |
| | 900 | | | New York Community Bancorp., Inc. | | | 11,133 | | | |
| Semiconductor Components/Integrated Circuits – 0.1% | | | | | | |
| | 200 | | | Linear Technology Corp. | | | 6,006 | | | |
| Semiconductor Equipment – 0.2% | | | | | | |
| | 1,100 | | | ASM Pacific Technology, Ltd. | | | 12,344 | | | |
| Shipbuilding – 0.2% | | | | | | |
| | 5,000 | | | Cosco Corp. Singapore, Ltd. | | | 3,374 | | | |
| | 7,000 | | | Yangzijiang Shipbuilding Holdings, Ltd. | | | 4,912 | | | |
| | | | | | | | 8,286 | | | |
| Soap and Cleaning Preparations – 0.1% | | | | | | |
| | 149 | | | Reckitt Benckiser Group PLC | | | 7,357 | | | |
| Telecommunication Services – 3.2% | | | | | | |
| | 1,000 | | | BCE, Inc. | | | 41,699 | | | |
| | 15,000 | | | Singapore Telecommunications, Ltd. | | | 35,745 | | | |
| | 950 | | | Tele2 A.B. – Class B | | | 18,494 | | | |
| | 508 | | | Telenor A.S.A. | | | 8,336 | | | |
| | 100 | | | TELUS Corp. | | | 5,659 | | | |
| | 1,000 | | | TELUS Corp. | | | 53,647 | | | |
| | 530 | | | Vivendi | | | 11,605 | | | |
| | | | | | | | 175,185 | | | |
| Telephone – Integrated – 5.9% | | | | | | |
| | 300 | | | AT&T, Inc. | | | 9,072 | | | |
| | 466 | | | Belgacom S.A. | | | 14,618 | | | |
| | 10,481 | | | Bezeq Israeli Telecommunication Corp., Ltd. | | | 19,274 | | | |
| | 300 | | | CenturyLink, Inc. | | | 11,160 | | | |
| | 806 | | | Elisa Oyj | | | 16,824 | | | |
| | 1,080 | | | France Telecom S.A. | | | 16,960 | | | |
| | 1,042 | | | Koninklijke KPN N.V. | | | 12,467 | | | |
| | 300 | | | Nippon Telegraph & Telephone Corp. | | | 15,341 | | | |
| | 60 | | | Swisscom A.G. | | | 22,741 | | | |
| | 1,090 | | | TDC A/S | | | 8,743 | | | |
| | 936 | | | Telefonica S.A. | | | 16,213 | | | |
| | 1,322 | | | TeliaSonera A.B. | | | 8,989 | | | |
| | 27,190 | | | Telstra Corp., Ltd. | | | 92,589 | | | |
| | 1,200 | | | Verizon Communications, Inc. | | | 48,144 | | | |
| | 1,100 | | | Windstream Corp. | | | 12,914 | | | |
| | | | | | | | 326,049 | | | |
See Notes to Schedules of Investments and Financial Statements.
Janus Mathematical Funds | 11
INTECH Global Dividend Fund
Schedule of Investments (unaudited)
As of December 31, 2011
| | | | | | | | | | | |
| Shares | | Value | | | |
| |
| Tobacco – 7.9% | | | | | | |
| | 2,239 | | | British American Tobacco PLC | | $ | 106,224 | | | |
| | 340 | | | Imperial Tobacco Group PLC | | | 12,855 | | | |
| | 1,000 | | | Lorillard, Inc. | | | 114,000 | | | |
| | 1,300 | | | Philip Morris International, Inc. | | | 102,024 | | | |
| | 2,400 | | | Reynolds American, Inc. | | | 99,408 | | | |
| | | | | | | | 434,511 | | | |
| Transportation – Marine – 0.1% | | | | | | |
| | 1,000 | | | Orient Overseas International, Ltd. | | | 5,839 | | | |
| Transportation – Services – 0.3% | | | | | | |
| | 6,000 | | | ComfortDelgro Corp., Ltd. | | | 6,547 | | | |
| | 2,070 | | | Toll Holdings, Ltd. | | | 8,933 | | | |
| | | | | | | | 15,480 | | | |
| Travel Services – 0.2% | | | | | | |
| | 3,716 | | | Tui Travel PLC | | | 9,566 | | | |
| Water – 1.0% | | | | | | |
| | 900 | | | American Water Works Co., Inc. | | | 28,674 | | | |
| | 774 | | | Severn Trent PLC | | | 17,979 | | | |
| | 661 | | | Suez Environment S.A. | | | 7,614 | | | |
| | | | | | | | 54,267 | | | |
| Wire and Cable Products – 0.1% | | | | | | |
| | 208 | | | Bekaert S.A. | | | 6,671 | | | |
| Wireless Equipment – 0.4% | | | | | | |
| | 4,883 | | | Nokia Oyj | | | 23,836 | | | |
| |
| |
| Total Common Stock (cost $4,986,946) | | | 5,141,306 | | | |
| |
| |
| Preferred Stock – 0.4% | | | | | | |
| Automotive – Cars and Light Trucks – 0.1% | | | | | | |
| | 111 | | | Bayerische Motoren Werke A.G. | | | 5,250 | | | |
| Electric – Integrated – 0.3% | | | | | | |
| | 428 | | | RWE A.G. | | | 14,088 | | | |
| |
| |
| Total Preferred Stock (cost $18,641) | | | 19,338 | | | |
| |
| |
| Money Market – 3.8% | | | | | | |
| | 209,000 | | | Janus Cash Liquidity Fund LLC, 0%
(cost $209,000) | | | 209,000 | | | |
| |
| |
| Total Investments (total cost $5,214,587) – 97.8% | | | 5,369,644 | | | |
| |
| |
| Cash, Receivables and Other Assets, net of Liabilities – 2.2% | | | 120,244 | | | |
| |
| |
| Net Assets – 100% | | $ | 5,489,888 | | | |
| |
| |
Summary of Investments by Country – (Long Positions)
| | | | | | | | | |
| | | | | | % of Investment
| |
| Country | | Value | | | Securities | |
| |
| |
| Australia | | $ | 289,585 | | | | 5.4% | |
| Austria | | | 10,700 | | | | 0.2% | |
| Belgium | | | 80,147 | | | | 1.5% | |
| Bermuda | | | 74,510 | | | | 1.4% | |
| Canada | | | 365,364 | | | | 6.8% | |
| Cayman Islands | | | 12,344 | | | | 0.2% | |
| Denmark | | | 8,743 | | | | 0.2% | |
| Finland | | | 96,491 | | | | 1.8% | |
| France | | | 189,519 | | | | 3.5% | |
| Germany | | | 95,547 | | | | 1.8% | |
| Greece | | | 5,590 | | | | 0.1% | |
| Guernsey | | | 21,848 | | | | 0.4% | |
| Hong Kong | | | 144,344 | | | | 2.7% | |
| Ireland | | | 26,906 | | | | 0.5% | |
| Israel | | | 51,138 | | | | 1.0% | |
| Italy | | | 60,513 | | | | 1.1% | |
| Japan | | | 472,618 | | | | 8.8% | |
| Luxembourg | | | 7,607 | | | | 0.2% | |
| Netherlands | | | 57,577 | | | | 1.1% | |
| New Zealand | | | 9,877 | | | | 0.2% | |
| Norway | | | 39,584 | | | | 0.7% | |
| Portugal | | | 25,262 | | | | 0.5% | |
| Singapore | | | 106,805 | | | | 2.0% | |
| Spain | | | 249,156 | | | | 4.6% | |
| Sweden | | | 93,299 | | | | 1.7% | |
| Switzerland | | | 269,962 | | | | 5.0% | |
| United Kingdom | | | 586,042 | | | | 10.9% | |
United States†† | | | 1,918,566 | | | | 35.7% | |
| |
| |
| Total | | $ | 5,369,644 | | | | 100.0% | |
| | | |
| †† | | Includes Cash Equivalents (31.8% excluding Cash Equivalents). |
See Notes to Schedules of Investments and Financial Statements.
12 | DECEMBER 31, 2011
INTECH International Fund (unaudited)
| | | | | | | |
Fund Snapshot
INTECH’s active approach focuses on adding value by selecting stocks with unique volatility characteristics and low correlations to one another.
| | | | | | Managed by
INTECH Investment Management LLC |
Performance Overview
For the six-month period ended December 31, 2011, INTECH International Fund’s Class I Shares returned -17.04%. This compares to the -16.31% return posted by the MSCI EAFE Index, the Fund’s benchmark.
Investment Strategy
INTECH’s mathematical investing process seeks to build a more efficient portfolio than its benchmark. The process seeks to minimize tracking error for a target level of excess return. In doing so, the process does not attempt to predict the direction of the market, nor does it have a view of any particular company in the portfolio. Instead, it employs a proprietary optimization process to build portfolios with the potential to outperform the index by capturing stocks’ natural volatility.
Within specific risk controls, INTECH’s disciplined mathematical process establishes target proportional weightings for stocks in the portfolio as a result of an optimization routine. Once the weights are determined and the portfolio is constructed, it is rebalanced and re-optimized on a periodic basis. By limiting the distance any one stock position can deviate from its benchmark weight, INTECH’s process attempts to control the relative risk of the portfolio. We believe that instituting an investment process aimed at providing consistent, positive excess returns at benchmark-like risk, will allow us to meet our investors’ objectives while minimizing the risk of significant underperformance relative to the benchmark.
Outlook
Going forward, we will continue building portfolios in a disciplined and deliberate manner, with risk management remaining the hallmark of our investment process. While we may experience short periods of underperformance, we expect to exceed the benchmark over a three- to five-year time horizon. As INTECH’s ongoing research efforts yield modest improvements, we will continue implementing changes that we believe are likely to improve the long-term results for our clients.
Thank you for your investment in INTECH International Fund.
Janus Mathematical Funds | 13
INTECH International Fund (unaudited)
INTECH International Fund At A Glance
5 Largest Equity Holdings – (% of Net Assets)
As of December 31, 2011
| | | | | |
Shire PLC
Medical – Drugs | | | 1.9% | |
Elan Corp. PLC
Medical – Drugs | | | 1.3% | |
British American Tobacco PLC
Tobacco | | | 1.1% | |
Roche Holding A.G.
Medical – Drugs | | | 1.1% | |
Telstra Corp., Ltd.
Telephone – Integrated | | | 1.1% | |
| | | | | |
| | | | 6.5% | |
Asset Allocation – (% of Net Assets)
As of December 31, 2011
Top Country Allocations – Long Positions (% of Investment Securities)
As of December 31, 2011
14 | DECEMBER 31, 2011
(unaudited)
| | | | | | | | | | | | |
| Average Annual Total Return – for the periods ended December 31, 2011 | | | Expense Ratios – per the October 28, 2011 prospectuses |
| | | Fiscal
| | One
| | Since
| | | Total Annual Fund
| | Net Annual Fund
|
| | | Year-to-Date | | Year | | Inception* | | | Operating Expenses | | Operating Expenses |
| | | | | | | | | | | | |
| INTECH International Fund – Class A Shares | | | | | | | | | | | |
| | | | | | | | | | | | |
| NAV | | –17.29% | | –13.42% | | –6.70% | | | 3.23% | | 1.32% |
| | | | | | | | | | | | |
| MOP | | –22.03% | | –18.40% | | –7.88% | | | | | |
| | | | | | | | | | | | |
| INTECH International Fund – Class C Shares | | | | | | | | | | | |
| | | | | | | | | | | | |
| NAV | | –17.54% | | –13.68% | | –7.00% | | | 3.97% | | 2.07% |
| | | | | | | | | | | | |
| CDSC | | –18.35% | | –14.54% | | –7.00% | | | | | |
| | | | | | | | | | | | |
| INTECH International Fund – Class I Shares | | –17.04% | | –13.48% | | –6.68% | | | 3.09% | | 1.07% |
| | | | | | | | | | | | |
| INTECH International Fund – Class S Shares | | –17.39% | | –13.42% | | –6.78% | | | 3.47% | | 1.58% |
| | | | | | | | | | | | |
| INTECH International Fund – Class T Shares | | –17.33% | | –13.57% | | –8.16% | | | 3.22% | | 1.32% |
| | | | | | | | | | | | |
| Morgan Stanley Capital International EAFE® Index | | –16.31% | | –12.14% | | –6.74% | | | | | |
| | | | | | | | | | | | |
| Lipper Quartile – Class I Shares | | – | | 3rd | | 3rd | | | | | |
| | | | | | | | | | | | |
| Lipper Ranking – based on total returns for International Funds | | – | | 655/1305 | | 492/923 | | | | | |
| | | | | | | | | | | | |
| Visit janus.com/advisor/mutual-funds to view current performance and characteristic information | | | | | |
| | | | | | | | | | | | |
Data presented represents past performance, which is no guarantee of future results. Investment results and principal value will fluctuate so that shares, when redeemed, may be worth more or less than their original cost. Due to market volatility, current performance may be higher or lower than the performance shown. Call 877.33JANUS(52687) or visit janus.com/advisor/mutual-funds for performance current to the most recent month-end.
Performance shown for Class A Shares at Maximum Offering Price (MOP) includes the Fund’s maximum sales charge of 5.75%. Performance shown at Net Asset Value (NAV) does not include this charge and would have been lower had this charge been taken into account.
Performance shown for Class C Shares includes a 1% contingent deferred sales charge (CDSC) on periods of less than 12 months. Performance shown at Net Asset Value (NAV) does not include this sales charge and would have been lower had this sales charge been taken into account.
For Class I Shares, Class S Shares, and Class T Shares, a 2% redemption fee may be imposed on shares held for 90 days or less. Performance shown does not reflect this redemption fee and, if reflected, performance would have been lower.
See important disclosures on the next page.
Janus Mathematical Funds | 15
INTECH International Fund (unaudited)
Janus Capital has contractually agreed to waive the Fund’s total annual fund operating expenses allocated to any class (excluding the distribution and shareholder servicing fees (applicable to Class A Shares, Class C Shares, and Class S Shares), administrative services fees payable pursuant to the Transfer Agency Agreement (except for networking and omnibus fees), brokerage commissions, interest, dividends, taxes, acquired fund fees and expenses, and extraordinary expenses) to certain limits until at least November 1, 2012. The contractual waiver may be terminated or modified prior to this date only at the discretion of the Board of Trustees. Returns shown include fee waivers, if any, and without such waivers, returns would have been lower.
The expense information shown was determined based on net assets as of the fiscal period ended June 30, 2011. The effect of contractual waivers agreed to by Janus Capital, when applicable, are reflected under “Net Annual Fund Operating Expenses.” (All expenses are shown without the effect of expense offset arrangements. Pursuant to such arrangements, credits realized as a result of uninvested cash balances are used to reduce custodian and transfer agent expenses.)
The Fund’s fee waiver exceeded the investment advisory fee for the period presented so the Fund did not pay Janus Capital any investment advisory fees (net of waivers).
The proprietary mathematical process used by INTECH Investment Management LLC (“INTECH”) may not achieve the desired results. The rebalancing techniques used by the Fund may result in a higher portfolio turnover rate, higher expenses and potentially higher net taxable gains or losses compared to a “buy and hold” or index fund strategy.
The Fund’s performance may be affected by risks that include those associated with investments in specific industries or countries and potential conflicts of interest with the Janus “funds of funds.” Additional risks to the Fund may include those associated with investing in foreign securities, initial public offerings (“IPOs”), real estate investment trusts (“REITs”), and derivatives. Please see a Janus prospectus or janus.com/info for more information about risks, portfolio holdings and other details.
The Fund invests in REITs, which may be subject to a higher degree of market risk because of concentration in a specific industry, sector or geographic region. REITs may be subject to risks including, but not limited to: legal, political, liquidity, and interest rate risks, a decline in the value of real estate, risks related to general and economic conditions, changes in the value of the underlying property owned by the trust and defaults by borrowers. To the extent the Fund invests in foreign REITs, the Fund may be subject to fluctuations in currency rates or political or economic conditions in a particular country.
Foreign securities have additional risks including exchange rate changes, political and economic upheaval, the relative lack of information, relatively low market liquidity and the potential lack of strict financial and accounting controls and standards. These risks are magnified in emerging markets. The prices of foreign securities held by the Fund, and therefore the Fund’s performance, may decline in response to such risks.
Returns include reinvestment of dividends from net investment income and distributions from capital gains. The returns shown do not reflect the deduction of taxes that a shareholder would pay on Fund distributions or the redemption of Fund shares. The returns do not include adjustments in accordance with generally accepted accounting principles required at the period end for financial reporting purposes.
Net dividends reinvested are the dividends that remain to be reinvested after foreign tax obligations have been met. Such obligations vary from country to country.
Class A Shares, Class C Shares, Class I Shares, Class S Shares and Class T Shares of the Fund commenced operations on July 6, 2009. The historical performance shown for periods prior to July 6, 2009 was calculated using the performance and the fees and expenses of one or more other share classes of a predecessor fund(s), accounting for, when applicable and permitted, any fee and expense limitations and waivers. If each respective share class of the Fund had been available during periods prior to July 6, 2009, the performance shown may have been different. Please refer to the Fund’s prospectus for further details concerning historical performance.
Lipper, a wholly-owned subsidiary of Thomson Reuters, provides independent insight on global collective investments including mutual funds, retirement funds, hedge funds, fund fees and expenses to the asset management and media communities. Lipper ranks the performance of mutual funds within a classification of funds that have similar investment objectives. Rankings are historical with capital gains and dividends reinvested and do not include the effect of loads.
Ranking is for Class I Shares only; other classes may have different performance characteristics. When an expense waiver is in effect, it may have a material effect on the total return, and therefore the ranking for the period.
There is no assurance that the investment process will consistently lead to successful investing.
See Notes to Schedules of Investments for index definitions.
The weighting of securities within the portfolio may differ significantly from the weightings within the index. The index is unmanaged and is not available for direct investment; therefore, its performance does not reflect the expenses associated with the active management of an actual portfolio.
Effective December 7, 2011, INTECH Risk-Managed International Fund changed its name to INTECH International Fund.
See “Explanations of Charts, Tables and Financial Statements.”
| | | |
| * | | The predecessor Fund’s inception date – May 2, 2007 |
16 | DECEMBER 31, 2011
(unaudited)
The examples below show you the ongoing costs (in dollars) of investing in your Fund and allow you to compare these costs with those of other mutual funds. Please refer to the section Useful Information About Your Fund Report for a detailed explanation of the information presented in these charts.
| | | | | | | | | | | | | | | |
| | | Beginning Account Value
| | Ending Account Value
| | Expenses Paid During Period
| | |
| Expense Example – Class A Shares | | (7/1/11) | | (12/31/11) | | (7/1/11 - 12/31/11)† | | |
| |
| |
| Actual | | $ | 1,000.00 | | | $ | 823.00 | | | $ | 5.77 | | | |
| |
| |
Hypothetical
(5% return before expenses) | | $ | 1,000.00 | | | $ | 1,018.80 | | | $ | 6.39 | | | |
| |
| |
| | | | | | | | | | | | | | | |
| | | | | | | | | | | | | | | |
| | | Beginning Account Value
| | Ending Account Value
| | Expenses Paid During Period
| | |
| Expense Example – Class C Shares | | (7/1/11) | | (12/31/11) | | (7/1/11 - 12/31/11)† | | |
| |
| |
| Actual | | $ | 1,000.00 | | | $ | 819.50 | | | $ | 9.19 | | | |
| |
| |
Hypothetical
(5% return before expenses) | | $ | 1,000.00 | | | $ | 1,015.03 | | | $ | 10.18 | | | |
| |
| |
| | | | | | | | | | | | | | | |
| | | | | | | | | | | | | | | |
| | | Beginning Account Value
| | Ending Account Value
| | Expenses Paid During Period
| | |
| Expense Example – Class I Shares | | (7/1/11) | | (12/31/11) | | (7/1/11 - 12/31/11)† | | |
| |
| |
| Actual | | $ | 1,000.00 | | | $ | 824.40 | | | $ | 4.63 | | | |
| |
| |
Hypothetical
(5% return before expenses) | | $ | 1,000.00 | | | $ | 1,020.06 | | | $ | 5.13 | | | |
| |
| |
| | | | | | | | | | | | | | | |
| | | | | | | | | | | | | | | |
| | | Beginning Account Value
| | Ending Account Value
| | Expenses Paid During Period
| | |
| Expense Example – Class S Shares | | (7/1/11) | | (12/31/11) | | (7/1/11 - 12/31/11)† | | |
| |
| |
| Actual | | $ | 1,000.00 | | | $ | 821.00 | | | $ | 6.91 | | | |
| |
| |
Hypothetical
(5% return before expenses) | | $ | 1,000.00 | | | $ | 1,017.55 | | | $ | 7.66 | | | |
| |
| |
| | | | | | | | | | | | | | | |
| | | | | | | | | | | | | | | |
| | | Beginning Account Value
| | Ending Account Value
| | Expenses Paid During Period
| | |
| Expense Example – Class T Shares | | (7/1/11) | | (12/31/11) | | (7/1/11 - 12/31/11)† | | |
| |
| |
| Actual | | $ | 1,000.00 | | | $ | 821.60 | | | $ | 5.77 | | | |
| |
| |
Hypothetical
(5% return before expenses) | | $ | 1,000.00 | | | $ | 1,018.80 | | | $ | 6.39 | | | |
| |
| |
| | | |
| † | | Expenses are equal to the annualized expense ratio of 1.26% for Class A Shares, 2.01% for Class C Shares, 1.01% for Class I Shares, 1.51% for Class S Shares and 1.26% for Class T Shares multiplied by the average account value over the period, multiplied by 184/366 (to reflect the one-half year period). Expenses include effect of contractual waivers by Janus Capital. |
Janus Mathematical Funds | 17
INTECH International Fund
Schedule of Investments (unaudited)
As of December 31, 2011
| | | | | | | | | | | |
| Shares | | Value | | | |
| |
| Common Stock – 98.4% | | | | | | |
| Advertising Services – 0.5% | | | | | | |
| | 2,100 | | | Dentsu, Inc. | | $ | 64,105 | | | |
| | 250 | | | Hakuhodo DY Holdings, Inc. | | | 14,360 | | | |
| | 13,000 | | | Toho Gas Co., Ltd. | | | 82,781 | | | |
| | | | | | | | 161,246 | | | |
| Aerospace and Defense – 0.2% | | | | | | |
| | 1,800 | | | Meggitt PLC | | | 9,860 | | | |
| | 1,034 | | | Rolls-Royce Holdings PLC | | | 11,985 | | | |
| | 1,558 | | | Thales S.A. | | | 49,196 | | | |
| | | | | | | | 71,041 | | | |
| Aerospace and Defense – Equipment – 0.5% | | | | | | |
| | 5,033 | | | European Aeronautic Defence and Space Co. N.V. | | | 157,293 | | | |
| Agricultural Chemicals – 0.3% | | | | | | |
| | 2,261 | | | Incitec Pivot, Ltd. | | | 7,191 | | | |
| | 175 | | | Syngenta A.G. | | | 51,251 | | | |
| | 1,165 | | | Yara International A.S.A. | | | 46,771 | | | |
| | | | | | | | 105,213 | | | |
| Agricultural Operations – 0% | | | | | | |
| | 2,000 | | | Wilmar International, Ltd. | | | 7,712 | | | |
| Airlines – 0.1% | | | | | | |
| | 13,000 | | | All Nippon Airways Co., Ltd. | | | 36,322 | | | |
| Airport Development – Maintenance – 0.3% | | | | | | |
| | 435 | | | Aeroports de Paris | | | 29,835 | | | |
| | 1,353 | | | Fraport A.G. Frankfurt Airport Services Worldwide | | | 66,535 | | | |
| | | | | | | | 96,370 | | | |
| Apparel Manufacturers – 0.7% | | | | | | |
| | 12,046 | | | Burberry Group PLC | | | 221,640 | | | |
| | 152 | | | Christian Dior | | | 18,020 | | | |
| | | | | | | | 239,660 | | | |
| Athletic Footwear – 0.6% | | | | | | |
| | 1,455 | | | Adidas A.G. | | | 94,635 | | | |
| | 10,200 | | | Asics Corp. | | | 115,057 | | | |
| | | | | | | | 209,692 | | | |
| Automotive – Cars and Light Trucks – 1.2% | | | | | | |
| | 1,986 | | | Bayerische Motoren Werke A.G. | | | 133,027 | | | |
| | 1,000 | | | Daihatsu Motor Co., Ltd. | | | 17,856 | | | |
| | 15,176 | | | Fiat SpA | | | 69,719 | | | |
| | 2,000 | | | Mazda Motor Corp. | | | 3,535 | | | |
| | 29,000 | | | Mitsubishi Motors Corp.* | | | 34,295 | | | |
| | 4,600 | | | Nissan Motor Co., Ltd. | | | 41,367 | | | |
| | 805 | | | Volkswagen A.G. | | | 107,977 | | | |
| | | | | | | | 407,776 | | | |
| Automotive – Medium and Heavy Duty Trucks – 0% | | | | | | |
| | 2,000 | | | Hino Motors, Ltd. | | | 12,138 | | | |
| Automotive – Truck Parts and Equipment – Original – 0.1% | | | | | | |
| | 7,951 | | | GKN PLC | | | 22,592 | | | |
| | 600 | | | Sumitomo Electric Industries, Ltd. | | | 6,534 | | | |
| | | | | | | | 29,126 | | | |
| Beverages – Non-Alcoholic – 0.3% | | | | | | |
| | 9,287 | | | Coca-Cola Amatil, Ltd. | | | 109,309 | | | |
| Beverages – Wine and Spirits – 0.2% | | | | | | |
| | 2,606 | | | Diageo PLC | | | 56,912 | | | |
| | 83 | | | Pernod-Ricard S.A. | | | 7,697 | | | |
| | | | | | | | 64,609 | | | |
| Bicycle Manufacturing – 0.1% | | | | | | |
| | 500 | | | Shimano, Inc. | | | 24,301 | | | |
| Brewery – 1.4% | | | | | | |
| | 1,000 | | | Asahi Breweries, Ltd. | | | 21,963 | | | |
| | 5,352 | | | Heineken Holding N.V. | | | 219,000 | | | |
| | 4,621 | | | Heineken N.V. | | | 213,905 | | | |
| | 463 | | | SABMiller PLC | | | 16,294 | | | |
| | | | | | | | 471,162 | | | |
| Building – Heavy Construction – 0.4% | | | | | | |
| | 1,186 | | | Acciona S.A. | | | 102,417 | | | |
| | 139 | | | ACS Actividades de Construccion y Servicios S.A. | | | 4,119 | | | |
| | 204 | | | Fomento de Construcciones y Contratas S.A. | | | 5,291 | | | |
| | 333 | | | Vinci S.A. | | | 14,548 | | | |
| | | | | | | | 126,375 | | | |
| Building – Maintenance and Service – 0.7% | | | | | | |
| | 20,818 | | | Babcock International Group PLC | | | 237,744 | | | |
| Building – Residential and Commercial – 0.2% | | | | | | |
| | 1,000 | | | Daiwa House Industry Co., Ltd. | | | 11,930 | | | |
| | 9,000 | | | Sekisui Chemical Co., Ltd. | | | 74,269 | | | |
| | | | | | | | 86,199 | | | |
| Building and Construction – Miscellaneous – 0.9% | | | | | | |
| | 5,637 | | | Balfour Beatty PLC | | | 23,177 | | | |
| | 14,288 | | | Cintra Concesiones de Infraestructuras de Transporte S.A. | | | 172,420 | | | |
| | 385 | | | Eiffage S.A. | | | 9,319 | | | |
| | 6,000 | | | Kajima Corp. | | | 18,401 | | | |
| | 4,000 | | | Obayashi Corp. | | | 17,778 | | | |
| | 2,000 | | | Shimzu Corp. | | | 8,395 | | | |
| | 24,000 | | | Taisei Corp. | | | 60,819 | | | |
| | | | | | | | 310,309 | | | |
| Building and Construction Products – Miscellaneous – 1.6% | | | | | | |
| | 1,562 | | | Cie de Saint-Gobain | | | 59,964 | | | |
| | 42,820 | | | Fletcher Building, Ltd. | | | 204,574 | | | |
| | 642 | | | Geberit A.G. | | | 123,751 | | | |
| | 600 | | | JS Group Corp. | | | 11,501 | | | |
| | 74 | | | Sika A.G. | | | 139,489 | | | |
| | 1,000 | | | TOTO, Ltd. | | | 7,719 | | | |
| | | | | | | | 546,998 | | | |
| Building Products – Air and Heating – 0.2% | | | | | | |
| | 1,100 | | | Daikin Industries, Ltd. | | | 30,134 | | | |
| | 600 | | | Rinnai Corp. | | | 42,963 | | | |
| | | | | | | | 73,097 | | | |
| Building Products – Cement and Aggregate – 0.3% | | | | | | |
| | 11,321 | | | Cimpor-Cimentos de Portugal | | | 77,897 | | | |
| | 1,219 | | | CRH PLC | | | 24,230 | | | |
| | 2,173 | | | James Hardie Industries N.V. | | | 15,155 | | | |
| | | | | | | | 117,282 | | | |
| Building Products – Doors and Windows – 0.3% | | | | | | |
| | 62,000 | | | Nippon Sheet Glass Co., Ltd. | | | 116,023 | | | |
See Notes to Schedules of Investments and Financial Statements.
18 | DECEMBER 31, 2011
Schedule of Investments (unaudited)
As of December 31, 2011
| | | | | | | | | | | |
| Shares | | Value | | | |
| |
| Cable/Satellite Television – 1.2% | | | | | | |
| | 19,501 | | | British Sky Broadcasting Group PLC | | $ | 221,795 | | | |
| | 24 | | | Jupiter Telecommunications Co., Ltd. | | | 24,327 | | | |
| | 3,036 | | | Kabel Deutschland Holding A.G.* | | | 154,071 | | | |
| | | | | | | | 400,193 | | | |
| Casino Hotels – 1.2% | | | | | | |
| | 8,133 | | | Crown, Ltd. | | | 67,283 | | | |
| | 98,000 | | | Galaxy Entertainment Group, Ltd.* | | | 179,689 | | | |
| | 112,000 | | | SJM Holdings, Ltd. | | | 182,862 | | | |
| | | | | | | | 429,834 | | | |
| Casino Services – 0% | | | | | | |
| | 200 | | | Sankyo Co., Ltd. | | | 10,123 | | | |
| Cellular Telecommunications – 1.4% | | | | | | |
| | 1,905 | | | Millicom International Cellular S.A. (SDR) | | | 190,965 | | | |
| | 1,541 | | | Mobistar S.A. | | | 80,745 | | | |
| | 72,322 | | | Vodafone Group PLC | | | 200,895 | | | |
| | | | | | | | 472,605 | | | |
| Chemicals – Diversified – 2.1% | | | | | | |
| | 2,183 | | | Arkema | | | 154,528 | | | |
| | 2,000 | | | Asahi Kasei Corp. | | | 12,060 | | | |
| | 1,958 | | | BASF S.E. | | | 136,549 | | | |
| | 324 | | | Johnson Matthey PLC | | | 9,236 | | | |
| | 500 | | | Kuraray Co., Ltd. | | | 7,115 | | | |
| | 2,868 | | | Lanxess A.G. | | | 148,459 | | | |
| | 5,000 | | | Mitsubishi Chemical Holdings Corp. | | | 27,550 | | | |
| | 400 | | | Shin-Etsu Chemical Co., Ltd. | | | 19,701 | | | |
| | 2,255 | | | Solvay S.A. | | | 185,772 | | | |
| | 7,000 | | | Ube Industries, Ltd. | | | 19,194 | | | |
| | | | | | | | 720,164 | | | |
| Chemicals – Specialty – 0.2% | | | | | | |
| | 459 | | | Brenntag A.G. | | | 42,737 | | | |
| | 2,000 | | | Daicel Corp. | | | 12,190 | | | |
| | | | | | | | 54,927 | | | |
| Coatings and Paint Products – 0% | | | | | | |
| | 1,000 | | | Kansai Paint Co., Ltd. | | | 8,928 | | | |
| Collectibles – 0% | | | | | | |
| | 100 | | | Sanrio Co., Ltd. | | | 5,140 | | | |
| Commercial Banks – 3.5% | | | | | | |
| | 979 | | | Banco Bilbao Vizcaya Argentaria S.A. | | | 8,463 | | | |
| | 3,721 | | | Banco de Sabadell S.A. | | | 14,128 | | | |
| | 1,757 | | | Banco Popular Espanol S.A. | | | 8,004 | | | |
| | 1,000 | | | Bank of Kyoto, Ltd. | | | 8,616 | | | |
| | 1,000 | | | Bank Of Yokohama, Ltd. | | | 4,730 | | | |
| | 1,200 | | | Bankia S.A.* | | | 5,583 | | | |
| | 2,630 | | | Bankinter S.A. | | | 16,167 | | | |
| | 1,087 | | | Bendigo and Adelaide Bank, Ltd. | | | 8,926 | | | |
| | 25,643 | | | CaixaBank | | | 125,935 | | | |
| | 12,000 | | | Chiba Bank, Ltd. | | | 77,349 | | | |
| | 10,000 | | | Chugoku Bank, Ltd. | | | 139,441 | | | |
| | 2,000 | | | Chuo Mitsui Trust Holdings, Inc. | | | 5,874 | | | |
| | 1,379 | | | Commonwealth Bank of Australia | | | 69,408 | | | |
| | 4,000 | | | DBS Group Holdings, Ltd. | | | 35,536 | | | |
| | 2,000 | | | Fukuoka Financial Group, Inc. | | | 8,395 | | | |
| | 5,000 | | | Gunma Bank, Ltd. | | | 27,485 | | | |
| | 2,000 | | | Hachijuni Bank, Ltd. | | | 11,410 | | | |
| | 6,000 | | | Hiroshima Bank, Ltd. | | | 27,914 | | | |
| | 17,000 | | | Hokuhoku Financial Group, Inc. | | | 33,138 | | | |
| | 14,000 | | | Iyo Bank, Ltd. | | | 138,272 | | | |
| | 10,000 | | | Joyo Bank, Ltd. | | | 44,185 | | | |
| | 15,764 | | | Lloyds Banking Group PLC* | | | 6,341 | | | |
| | 1,421 | | | National Australia Bank, Ltd. | | | 33,945 | | | |
| | 5,000 | | | Nishin-Nippon City Bank, Ltd. | | | 14,360 | | | |
| | 2,000 | | | Oversea-Chinese Banking Corp., Ltd. | | | 12,077 | | | |
| | 1,220 | | | Pohjola Bank PLC | | | 11,857 | | | |
| | 2,700 | | | Resona Holdings, Inc. | | | 11,895 | | | |
| | 4,000 | | | Shizuoka Bank, Ltd. | | | 42,157 | | | |
| | 5,174 | | | Sparbanken Sverige A.B. – Class A | | | 67,062 | | | |
| | 4,000 | | | Suruga Bank, Ltd. | | | 35,815 | | | |
| | 7,000 | | | United Overseas Bank, Ltd. | | | 82,432 | | | |
| | 493 | | | Westpac Banking Corp. | | | 10,083 | | | |
| | 8,000 | | | Yamaguchi Financial Group, Inc. | | | 76,413 | | | |
| | | | | | | | 1,223,396 | | | |
| Commercial Services – 1.6% | | | | | | |
| | 1,819 | | | Aggreko PLC | | | 56,967 | | | |
| | 7,441 | | | Edenred | | | 183,151 | | | |
| | 250 | | | Intertek Group PLC | | | 7,900 | | | |
| | 195 | | | SGS S.A. | | | 322,923 | | | |
| | | | | | | | 570,941 | | | |
| Commercial Services – Finance – 0% | | | | | | |
| | 1,100 | | | Experian PLC | | | 14,953 | | | |
| Computer Aided Design – 0.1% | | | | | | |
| | 304 | | | Dassault Systemes S.A. | | | 24,364 | | | |
| Computer Services – 0.1% | | | | | | |
| | 216 | | | Atos Origin S.A. | | | 9,479 | | | |
| | 2,577 | | | Indra Sistemas S.A. | | | 32,805 | | | |
| | | | | | | | 42,284 | | | |
| Computers – Integrated Systems – 0.3% | | | | | | |
| | 1,800 | | | Itochu Techno-Solutions Corp. | | | 80,819 | | | |
| | 9 | | | NTT Data Corp. | | | 28,748 | | | |
| | | | | | | | 109,567 | | | |
| Consulting Services – 0.1% | | | | | | |
| | 601 | | | Bereau Veritas S.A. | | | 43,787 | | | |
| Containers – Metal and Glass – 0.5% | | | | | | |
| | 33,263 | | | Rexam PLC | | | 182,212 | | | |
| Containers – Paper and Plastic – 0.2% | | | | | | |
| | 11,648 | | | Amcor, Ltd. | | | 85,880 | | | |
| Cosmetics and Toiletries – 0.9% | | | | | | |
| | 3,399 | | | Beiersdorf A.G. | | | 192,748 | | | |
| | 500 | | | Kao Corp. | | | 13,665 | | | |
| | 407 | | | L’Oreal S.A. | | | 42,504 | | | |
| | 1,400 | | | Shiseido Co., Ltd. | | | 25,744 | | | |
| | 1,000 | | | Unicharm Corp. | | | 49,318 | | | |
| | | | | | | | 323,979 | | | |
| Dialysis Centers – 1.0% | | | | | | |
| | 4,894 | | | Fresenius Medical Care A.G. & Co. KGaA | | | 332,499 | | | |
| Distribution/Wholesale – 0.7% | | | | | | |
| | 300 | | | Hitachi High-Technologies Corp. | | | 6,511 | | | |
| | 6,000 | | | Jardine Cycle & Carriage, Ltd. | | | 222,657 | | | |
| | 614 | | | Wolseley PLC | | | 20,326 | | | |
| | | | | | | | 249,494 | | | |
| Diversified Banking Institutions – 0.1% | | | | | | |
| | 2,281 | | | Barclays PLC | | | 6,235 | | | |
| | 231 | | | Julius Baer Group, Ltd. | | | 9,038 | | | |
See Notes to Schedules of Investments and Financial Statements.
Janus Mathematical Funds | 19
INTECH International Fund
Schedule of Investments (unaudited)
As of December 31, 2011
| | | | | | | | | | | |
| Shares | | Value | | | |
| |
| Diversified Banking Institutions – (continued) | | | | | | |
| | | | | | | | | | | |
| | 1,900 | | | Mitsubishi UFJ Financial Group, Inc. | | $ | 8,074 | | | |
| | 18,432 | | | Royal Bank of Scotland Group PLC* | | | 5,776 | | | |
| | | | | | | | 29,123 | | | |
| Diversified Minerals – 1.0% | | | | | | |
| | 538 | | | BHP Billiton, Ltd. | | | 18,936 | | | |
| | 19,844 | | | Iluka Resources, Ltd. | | | 314,533 | | | |
| | 1,000 | | | Sumitomo Metal Mining Co., Ltd. | | | 12,853 | | | |
| | | | | | | | 346,322 | | | |
| Diversified Operations – 0.9% | | | | | | |
| | 200 | | | Campbell Brothers, Ltd. | | | 10,019 | | | |
| | 5,000 | | | First Pacific Co. | | | 5,202 | | | |
| | 3,342 | | | GEA Group A.G. | | | 94,498 | | | |
| | 6,000 | | | Hutchison Whampoa, Ltd. | | | 50,256 | | | |
| | 12,500 | | | Keppel Corp., Ltd. | | | 89,651 | | | |
| | 310 | | | LVMH Moet Hennessy Louis Vuitton S.A. | | | 43,888 | | | |
| | 56 | | | Siemens A.G. | | | 5,358 | | | |
| | 66 | | | Sulzer A.G. | | | 7,057 | | | |
| | | | | | | | 305,929 | | | |
| Diversified Operations – Commercial Services – 0.3% | | | | | | |
| | 3,228 | | | Brambles, Ltd. | | | 23,635 | | | |
| | 3,086 | | | Bunzl PLC | | | 42,358 | | | |
| | 514 | | | Sodexo | | | 36,897 | | | |
| | | | | | | | 102,890 | | | |
| E-Commerce/Services – 0.3% | | | | | | |
| | 2,600 | | | Dena Co., Ltd. | | | 78,017 | | | |
| | 20 | | | Rakuten, Inc. | | | 21,520 | | | |
| | | | | | | | 99,537 | | | |
| E-Marketing/Information – 0.5% | | | | | | |
| | 4,600 | | | Gree, Inc. | | | 158,534 | | | |
| Electric – Distribution – 0.1% | | | | | | |
| | 1,813 | | | AGL Energy, Ltd. | | | 26,567 | | | |
| Electric – Generation – 0% | | | | | | |
| | 200 | | | Electric Power Development Co., Ltd. | | | 5,320 | | | |
| Electric – Integrated – 2.6% | | | | | | |
| | 22,288 | | | A2A SpA | | | 20,954 | | | |
| | 300 | | | Chubu Electric Power Co., Inc. | | | 5,602 | | | |
| | 11,500 | | | CLP Holdings, Ltd. | | | 97,804 | | | |
| | 284 | | | E.ON A.G. | | | 6,127 | | | |
| | 277 | | | EDF S.A. | | | 6,739 | | | |
| | 41,874 | | | Enel SpA | | | 170,370 | | | |
| | 3,077 | | | Energias de Portugal S.A. | | | 9,521 | | | |
| | 24,000 | | | HongKong Electric Holdings | | | 177,536 | | | |
| | 2,389 | | | International Power PLC | | | 12,508 | | | |
| | 300 | | | Shikoku Electric Power Co., Inc. | | | 8,601 | | | |
| | 18,758 | | | SSE PLC | | | 376,011 | | | |
| | | | | | | | 891,773 | | | |
| Electric Products – Miscellaneous – 0.1% | | | | | | |
| | 4,000 | | | Hitachi, Ltd. | | | 21,001 | | | |
| | 100 | | | Nidec Corp. | | | 8,694 | | | |
| | | | | | | | 29,695 | | | |
| Electric – Transmission – 0.4% | | | | | | |
| | 2,329 | | | Red Electrica Corp. S.A. | | | 99,656 | | | |
| | 14,192 | | | Terna Rete Elettrica Nazionale SpA | | | 47,825 | | | |
| | | | | | | | 147,481 | | | |
| Electronic Components – Miscellaneous – 0.1% | | | | | | |
| | 400 | | | Hoya Corp. | | | 8,619 | | | �� |
| | 5,000 | | | NEC Corp. | | | 10,136 | | | |
| | | | | | | | 18,755 | | | |
| Electronic Components – Semiconductors – 0.2% | | | | | | |
| | 8,671 | | | ARM Holdings PLC | | | 79,704 | | | |
| Electronic Measuring Instruments – 0.2% | | | | | | |
| | 100 | | | Keyence Corp. | | | 24,119 | | | |
| | 4,800 | | | Yokogawa Electric Corp. | | | 43,353 | | | |
| | | | | | | | 67,472 | | | |
| Electronics – Military – 0.2% | | | | | | |
| | 2,688 | | | Safran S.A. | | | 80,719 | | | |
| Energy – Alternate Sources – 0% | | | | | | |
| | 1,486 | | | EDP Renovaveis S.A.* | | | 9,092 | | | |
| Engineering – Research and Development Services – 1.3% | | | | | | |
| | 351 | | | ABB, Ltd. | | | 6,609 | | | |
| | 11,000 | | | Chiyoda Corp. | | | 111,930 | | | |
| | 5,000 | | | JGC Corp. | | | 120,078 | | | |
| | 28,000 | | | SembCorp Industries, Ltd. | | | 87,453 | | | |
| | 3,000 | | | Singapore Technologies Engineering, Ltd. | | | 6,223 | | | |
| | 4,100 | | | WorleyParsons, Ltd. | | | 107,625 | | | |
| | | | | | | | 439,918 | | | |
| Enterprise Software/Services – 0.3% | | | | | | |
| | 500 | | | Nomura Research Institute, Ltd. | | | 11,306 | | | |
| | 1,487 | | | SAP A.G. | | | 78,609 | | | |
| | | | | | | | 89,915 | | | |
| Entertainment Software – 0.5% | | | | | | |
| | 4,800 | | | Konami Corp. | | | 143,782 | | | |
| | 900 | | | Square Enix Co., Ltd. | | | 17,672 | | | |
| | | | | | | | 161,454 | | | |
| Filtration and Separations Products – 0.1% | | | | | | |
| | 2,541 | | | Afla Laval A.B. | | | 48,173 | | | |
| Finance – Credit Card – 0.5% | | | | | | |
| | 4,200 | | | Aeon Credit Service Co., Ltd. | | | 66,370 | | | |
| | 4,500 | | | Credit Saison Co., Ltd. | | | 90,234 | | | |
| | | | | | | | 156,604 | | | |
| Finance – Leasing Companies – 0% | | | | | | |
| | 250 | | | Mitsubishi UFJ Lease & Finance Co., Ltd. | | | 9,909 | | | |
| Finance – Other Services – 0.1% | | | | | | |
| | 1,907 | | | London Stock Exchange Group PLC | | | 23,540 | | | |
| Fisheries – 0.1% | | | | | | |
| | 2,000 | | | Toyo Suisan Kaisha, Ltd. | | | 48,473 | | | |
| Food – Baking – 0.8% | | | | | | |
| | 4,578 | | | ARYZTA A.G. | | | 221,343 | | | |
| | 4,000 | | | Yamazaki Baking Co., Ltd. | | | 52,554 | | | |
| | | | | | | | 273,897 | | | |
| Food – Catering – 0.1% | | | | | | |
| | 3,879 | | | Compass Group PLC | | | 36,800 | | | |
| Food – Confectionary – 0.9% | | | | | | |
| | 5 | | | Lindt & Spruengli A.G. | | | 167,146 | | | |
| | 45 | | | Lindt & Spruengli A.G. | | | 133,898 | | | |
| | | | | | | | 301,044 | | | |
| Food – Flour and Grain – 0% | | | | | | |
| | 1,000 | | | Nisshin Seifun Group, Inc. | | | 12,125 | | | |
See Notes to Schedules of Investments and Financial Statements.
20 | DECEMBER 31, 2011
Schedule of Investments (unaudited)
As of December 31, 2011
| | | | | | | | | | | |
| Shares | | Value | | | |
| |
| Food – Miscellaneous/Diversified – 3.0% | | | | | | |
| | 3,000 | | | Ajinomoto Co., Inc. | | $ | 36,023 | | | |
| | 706 | | | Associated British Foods PLC | | | 12,135 | | | |
| | 5,141 | | | Groupe Danone | | | 323,134 | | | |
| | 3,970 | | | Kerry Group PLC | | | 145,316 | | | |
| | 1,000 | | | Kikkoman Corp. | | | 11,488 | | | |
| | 200 | | | MEIJI Holdings Co., Ltd. | | | 8,304 | | | |
| | 6,000 | | | Nestle S.A. | | | 345,048 | | | |
| | 300 | | | Nissin Foods Holdings Co., Ltd. | | | 11,754 | | | |
| | 2,873 | | | Unilever N.V. | | | 98,786 | | | |
| | 1,411 | | | Unilever PLC | | | 47,388 | | | |
| | | | | | | | 1,039,376 | | | |
| Food – Retail – 1.4% | | | | | | |
| | 71 | | | Casino Guichard Perrachon S.A. | | | 5,980 | | | |
| | 2,309 | | | Colruyt S.A. | | | 87,401 | | | |
| | 5,321 | | | Jeronimo Martins SGPS S.A. | | | 88,070 | | | |
| | 1,409 | | | Koninklijke Ahold N.V. | | | 18,972 | | | |
| | 900 | | | Tesco PLC | | | 5,638 | | | |
| | 44,498 | | | WM Morrison Supermarkets PLC | | | 225,378 | | | |
| | 2,201 | | | Woolworths, Ltd. | | | 56,494 | | | |
| | | | | | | | 487,933 | | | |
| Food – Wholesale/Distribution – 0.2% | | | | | | |
| | 19,050 | | | Metcash, Ltd. | | | 78,701 | | | |
| Gambling – Non-Hotel – 0.1% | | | | | | |
| | 7,655 | | | TABCORP Holdings, Ltd. | | | 21,370 | | | |
| Gas – Distribution – 0% | | | | | | |
| | 2,000 | | | Osaka Gas Co., Ltd. | | | 7,901 | | | |
| Gas – Transportation – 2.0% | | | | | | |
| | 1,254 | | | Centrica PLC | | | 5,633 | | | |
| | 2,131 | | | Enagas | | | 39,408 | | | |
| | 13,528 | | | Gas Natural SDG S.A. | | | 232,224 | | | |
| | 33,000 | | | Hong Kong & China Gas Co., Ltd. | | | 76,484 | | | |
| | 14,734 | | | National Grid PLC | | | 142,984 | | | |
| | 41,062 | | | Snam Rete Gas SpA | | | 180,989 | | | |
| | | | | | | | 677,722 | | | |
| Gold Mining – 0.3% | | | | | | |
| | 284 | | | Newcrest Mining, Ltd. | | | 8,596 | | | |
| | 904 | | | Randgold Resources, Ltd. | | | 92,430 | | | |
| | | | | | | | 101,026 | | | |
| Human Resources – 0.2% | | | | | | |
| | 6,239 | | | Capita Group PLC | | | 60,885 | | | |
| Import/Export – 0.2% | | | | | | |
| | 1,000 | | | Itochu Corp. | | | 10,162 | | | |
| | 1,300 | | | Mitsui & Co., Ltd. | | | 20,222 | | | |
| | 600 | | | Sumitomo Corp. | | | 8,125 | | | |
| | 800 | | | Toyota Tsusho Corp. | | | 14,150 | | | |
| | | | | | | | 52,659 | | | |
| Industrial Automation and Robotics – 0.3% | | | | | | |
| | 700 | | | Fanuc Corp. | | | 107,161 | | | |
| Industrial Gases – 0.7% | | | | | | |
| | 321 | | | Air Liquide S.A. | | | 39,709 | | | |
| | 1,000 | | | Air Water, Inc. | | | 12,735 | | | |
| | 1,231 | | | Linde A.G. | | | 183,119 | | | |
| | | | | | | | 235,563 | | | |
| Instruments – Scientific – 0.1% | | | | | | |
| | 600 | | | Hamamatsu Photonics K.K. | | | 20,998 | | | |
| Internet Security – 0.1% | | | | | | |
| | 1,200 | | | Trend Micro, Inc. | | | 35,883 | | | |
| Investment Companies – 1.5% | | | | | | |
| | 29,000 | | | Cheung Kong Infrastructure Holdings, Ltd. | | | 169,901 | | | |
| | 2,269 | | | Kinnevik Investment A.B. | | | 44,237 | | | |
| | 841 | | | Pargesa Holding S.A. | | | 55,081 | | | |
| | 65,642 | | | Resolution, Ltd. | | | 256,233 | | | |
| | | | | | | | 525,452 | | | |
| Investment Management and Advisory Services – 0% | | | | | | |
| | 45 | | | Partners Group Holdings A.G. | | | 7,855 | | | |
| Leisure & Recreation Products – 0.1% | | | | | | |
| | 1,200 | | | Sega Sammy Holdings, Inc. | | | 25,934 | | | |
| Life and Health Insurance – 0.6% | | | | | | |
| | 76,406 | | | Legal & General Group PLC | | | 121,957 | | | |
| | 3,838 | | | Prudential PLC | | | 38,050 | | | |
| | 4,712 | | | Standard Life PLC | | | 15,094 | | | |
| | 263 | | | Swiss Life Holdings | | | 24,199 | | | |
| | | | | | | | 199,300 | | | |
| Lottery Services – 0.1% | | | | | | |
| | 10,914 | | | Tatts Group, Ltd. | | | 27,232 | | | |
| Machinery – Construction and Mining – 0.7% | | | | | | |
| | 4,668 | | | Atlas Copco A.B. – Class A | | | 100,442 | | | |
| | 5,417 | | | Atlas Copco A.B. – Class B | | | 103,013 | | | |
| | 1,100 | | | Komatsu, Ltd. | | | 25,717 | | | |
| | | | | | | | 229,172 | | | |
| Machinery – Electrical – 0.7% | | | | | | |
| | 657 | | | Schindler Holding A.G. | | | 76,335 | | | |
| | 1,222 | | | Schindler Holding A.G. | | | 142,372 | | | |
| | 100 | | | SMC Corp. | | | 16,140 | | | |
| | | | | | | | 234,847 | | | |
| Machinery – General Industrial – 0.9% | | | | | | |
| | 425 | | | Alstom S.A. | | | 12,886 | | | |
| | 771 | | | Kone Oyj – Class B | | | 40,010 | | | |
| | 620 | | | MAN A.G. | | | 55,121 | | | |
| | 41,000 | | | Mitsubishi Heavy Industries, Ltd. | | | 174,763 | | | |
| | 1,973 | | | Zardoya Otis S.A. | | | 27,064 | | | |
| | | | | | | | 309,844 | | | |
| Machinery – Pumps – 0.8% | | | | | | |
| | 8,555 | | | Weir Group PLC | | | 269,917 | | | |
| Medical – Biomedical and Genetic – 0.1% | | | | | | |
| | 615 | | | Novozymes A/S | | | 18,989 | | | |
| Medical – Drugs – 9.8% | | | | | | |
| | 100 | | | Astellas Pharma, Inc. | | | 4,068 | | | |
| | 2,018 | | | AstraZeneca PLC | | | 93,217 | | | |
| | 500 | | | Chugai Pharmaceutical Co., Ltd. | | | 8,246 | | | |
| | 300 | | | Daiichi Sankyo Co., Ltd. | | | 5,949 | | | |
| | 1,300 | | | Dainippon Sumitomo Pharma Co., Ltd. | | | 14,816 | | | |
| | 3,000 | | | Eisai Co., Ltd. | | | 124,172 | | | |
| | 31,218 | | | Elan Corp. PLC* | | | 433,078 | | | |
| | 9,901 | | | GlaxoSmithKline PLC | | | 226,218 | | | |
| | 9,027 | | | Grifols S.A. | | | 151,863 | | | |
| | 400 | | | Hisamitsu Pharmaceutical Co., Inc. | | | 16,946 | | | |
| | 1,000 | | | Kyowa Hakko Kogyo Co., Ltd. | | | 12,242 | | | |
| | 2,721 | | | Merck KGaA | | | 271,241 | | | |
| | 400 | | | Miraca Holdings, Inc. | | | 15,932 | | | |
| | 1,000 | | | Mitsubishi Tanabe Pharma Corp. | | | 15,828 | | | |
| | 2,548 | | | Novartis A.G. | | | 145,716 | | | |
See Notes to Schedules of Investments and Financial Statements.
Janus Mathematical Funds | 21
INTECH International Fund
Schedule of Investments (unaudited)
As of December 31, 2011
| | | | | | | | | | | |
| Shares | | Value | | | |
| |
| Medical – Drugs – (continued) | | | | | | |
| | | | | | | | | | | |
| | 603 | | | Novo Nordisk A/S | | $ | 69,308 | | | |
| | 1,600 | | | ONO Pharmaceutical Co., Ltd. | | | 89,825 | | | |
| | 6,325 | | | Orion Oyj – Class B | | | 123,187 | | | |
| | 1,800 | | | Otsuka Holdings Co., Ltd. | | | 50,620 | | | |
| | 2,318 | | | Roche Holding A.G. | | | 392,998 | | | |
| | 2,330 | | | Sanofi | | | 171,115 | | | |
| | 2,900 | | | Santen Pharmaceutical Co., Ltd. | | | 119,467 | | | |
| | 18,441 | | | Shire PLC | | | 642,245 | | | |
| | 200 | | | Taisho Pharmaceutical Holdings Co., Ltd. | | | 15,439 | | | |
| | 4,499 | | | UCB S.A. | | | 189,278 | | | |
| | | | | | | | 3,403,014 | | | |
| Medical – Hospitals – 0.2% | | | | | | |
| | 3,494 | | | Ramsay Health Care, Ltd. | | | 68,887 | | | |
| Medical – Wholesale Drug Distributors – 0.2% | | | | | | |
| | 300 | | | Alfresa Holdings Corp. | | | 12,651 | | | |
| | 4,300 | | | Mediceo Paltac Holdings Co., Ltd. | | | 44,928 | | | |
| | 300 | | | Suzuken Co., Ltd. | | | 8,320 | | | |
| | | | | | | | 65,899 | | | |
| Medical Instruments – 0.3% | | | | | | |
| | 3,486 | | | Getinge A.B. | | | 88,389 | | | |
| | 1,000 | | | Shimadzu Corp. | | | 8,473 | | | |
| | 500 | | | Sysmex Corp. | | | 16,297 | | | |
| | | | | | | | 113,159 | | | |
| Medical Products – 2.1% | | | | | | |
| | 316 | | | Coloplast A/S | | | 45,456 | | | |
| | 3,280 | | | Fresenius S.E. & Co. KGaA | | | 303,406 | | | |
| | 2,161 | | | Synthes, Inc. | | | 362,468 | | | |
| | 323 | | | William Demant Holding* | | | 26,865 | | | |
| | | | | | | | 738,195 | | | |
| Metal – Aluminum – 0.2% | | | | | | |
| | 47,995 | | | Alumina, Ltd. | | | 54,724 | | | |
| Metal – Copper – 0.1% | | | | | | |
| | 2,090 | | | Antofagasta PLC | | | 39,428 | | | |
| Metal – Diversified – 0.1% | | | | | | |
| | 651 | | | Eurasian Natural Resources Corp. | | | 6,423 | | | |
| | 274 | | | Glencore International PLC | | | 1,668 | | | |
| | 143 | | | Rio Tinto, Ltd. | | | 8,818 | | | |
| | | | | | | | 16,909 | | | |
| Metal – Iron – 0% | | | | | | |
| | 1,426 | | | Fortescue Metals Group, Ltd. | | | 6,227 | | | |
| Metal Processors and Fabricators – 0.1% | | | | | | |
| | 2,000 | | | NSK, Ltd. | | | 12,996 | | | |
| | 9,000 | | | NTN Corp. | | | 36,257 | | | |
| | | | | | | | 49,253 | | | |
| Mining Services – 0.3% | | | | | | |
| | 4,269 | | | Orica, Ltd. | | | 105,819 | | | |
| Motion Pictures and Services – 0.4% | | | | | | |
| | 7,300 | | | Toho Co., Ltd. | | | 130,157 | | | |
| MRI and Medical Diagnostic Imaging Center – 0.1% | | | | | | |
| | 2,202 | | | Sonic Healthcare, Ltd. | | | 25,400 | | | |
| Multi-Line Insurance – 0.9% | | | | | | |
| | 4,747 | | | AGEAS | | | 7,372 | | | |
| | 378 | | | Assicurazioni Generali SpA | | | 5,689 | | | |
| | 467 | | | AXA S.A. | | | 6,071 | | | |
| | 1,478 | | | Baloise Holding A.G. | | | 101,366 | | | |
| | 2,208 | | | Gjensidige Forsikring A.S.A. | | | 25,596 | | | |
| | 28,538 | | | Mapfre S.A. | | | 90,665 | | | |
| | 3,253 | | | Sampo Oyj – Class A | | | 80,700 | | | |
| | | | | | | | 317,459 | | | |
| Multimedia – 0.5% | | | | | | |
| | 8,836 | | | Pearson PLC | | | 166,008 | | | |
| Office Automation and Equipment – 0% | | | | | | |
| | 200 | | | Canon, Inc. | | | 8,863 | | | |
| Office Supplies and Forms – 0.1% | | | | | | |
| | 290 | | | Societe BIC S.A. | | | 25,707 | | | |
| Oil – Field Services – 0.7% | | | | | | |
| | 297 | | | AMEC PLC | | | 4,185 | | | |
| | 1,075 | | | Saipem SpA | | | 45,699 | | | |
| | 6,932 | | | SBM Offshore N.V. | | | 142,813 | | | |
| | 553 | | | Technip S.A. | | | 51,970 | | | |
| | | | | | | | 244,667 | | | |
| Oil and Gas Drilling – 0.2% | | | | | | |
| | 1,462 | | | Seadrill, Ltd. | | | 48,912 | | | |
| | 138 | | | Transocean, Ltd. | | | 5,330 | | | |
| | | | | | | | 54,242 | | | |
| Oil Companies – Exploration and Production – 1.1% | | | | | | |
| | 49 | | | INPEX Corp. | | | 308,837 | | | |
| | 1,724 | | | Lundin Pertroleum A.B.* | | | 42,409 | | | |
| | 1,926 | | | Santos, Ltd. | | | 24,107 | | | |
| | | | | | | | 375,353 | | | |
| Oil Companies – Integrated – 0.9% | | | | | | |
| | 230 | | | BG Group PLC | | | 4,916 | | | |
| | 834 | | | BP PLC | | | 5,963 | | | |
| | 731 | | | ENI SpA | | | 15,145 | | | |
| | 1,023 | | | Galp Energia SGPS S.A. – Class B | | | 15,066 | | | |
| | 200 | | | Idemitsu Kosan Co., Ltd. | | | 20,637 | | | |
| | 2,950 | | | Repsol YPF S.A. | | | 90,610 | | | |
| | 838 | | | Royal Dutch Shell PLC – Class A | | | 30,851 | | | |
| | 2,204 | | | Royal Dutch Shell PLC – Class B | | | 83,979 | | | |
| | 1,510 | | | StatoilHydro A.S.A. | | | 38,772 | | | |
| | 116 | | | Total S.A. | | | 5,930 | | | |
| | | | | | | | 311,869 | | | |
| Oil Refining and Marketing – 0.1% | | | | | | |
| | 1,065 | | | Caltex Australia, Ltd. | | | 12,818 | | | |
| | 1,100 | | | JX Holdings, Inc. | | | 6,647 | | | |
| | 2,000 | | | TonenGeneral Sekiyu K.K. | | | 21,859 | | | |
| | | | | | | | 41,324 | | | |
| Optical Supplies – 0.8% | | | | | | |
| | 3,594 | | | Cie Generale d’Optique Essilor International S.A. | | | 253,711 | | | |
| | 482 | | | Luxottica Group SpA | | | 13,536 | | | |
| | | | | | | | 267,247 | | | |
| Paper and Related Products – 0.2% | | | | | | |
| | 1,200 | | | Nippon Paper Group, Inc. | | | 26,199 | | | |
| | 8,000 | | | OJI Paper Co., Ltd. | | | 41,065 | | | |
| | | | | | | | 67,264 | | | |
| Petrochemicals – 0% | | | | | | |
| | 3,000 | | | Mitsui Chemicals, Inc. | | | 9,162 | | | |
See Notes to Schedules of Investments and Financial Statements.
22 | DECEMBER 31, 2011
Schedule of Investments (unaudited)
As of December 31, 2011
| | | | | | | | | | | |
| Shares | | Value | | | |
| |
| Photo Equipment and Supplies – 0.1% | | | | | | |
| | 1,200 | | | Nikon Corp. | | $ | 26,729 | | | |
| | 1,600 | | | Olympus Corp. | | | 21,042 | | | |
| | | | | | | | 47,771 | | | |
| Property and Casualty Insurance – 0.2% | | | | | | |
| | 1,000 | | | Mitsui Sumitomo Insurance Group Holdings, Inc. | | | 18,532 | | | |
| | 600 | | | Tokio Marine Holdings, Inc. | | | 13,294 | | | |
| | 707 | | | TrygVesta A.S. | | | 39,276 | | | |
| | | | | | | | 71,102 | | | |
| Public Thoroughfares – 0.7% | | | | | | |
| | 7,198 | | | Abertis Infraestucturas S.A. | | | 114,946 | | | |
| | 23,096 | | | Transurban Group | | | 132,733 | | | |
| | | | | | | | 247,679 | | | |
| Publishing – Books – 0% | | | | | | |
| | 426 | | | Reed Elsevier N.V. | | | 4,966 | | | |
| | 1,336 | | | Reed Elsevier PLC | | | 10,766 | | | |
| | | | | | | | 15,732 | | | |
| Publishing – Newspapers – 0.1% | | | | | | |
| | 14,000 | | | Singapore Press Holdings, Ltd. | | | 39,840 | | | |
| Real Estate Management/Services – 0.3% | | | | | | |
| | 400 | | | Aeon Mall Co., Ltd. | | | 8,494 | | | |
| | 12,193 | | | Lend Lease Corp., Ltd. | | | 89,275 | | | |
| | 600 | | | Nomura Real Estate Holdings, Inc. | | | 8,935 | | | |
| | | | | | | | 106,704 | | | |
| Real Estate Operating/Development – 0.8% | | | | | | |
| | 1,100 | | | Daito Trust Construction Co., Ltd. | | | 94,347 | | | |
| | 13,000 | | | Fraser and Neave, Ltd. | | | 62,158 | | | |
| | 1,000 | | | Mitsui Fudosan Co., Ltd. | | | 14,581 | | | |
| | 1,000 | | | Sumitomo Realty & Development Co., Ltd. | | | 17,518 | | | |
| | 32,000 | | | UOL Group, Ltd. | | | 98,712 | | | |
| | | | | | | | 287,316 | | | |
| Reinsurance – 0.1% | | | | | | |
| | 102 | | | Hannover Rueckversicherung A.G. | | | 5,059 | | | |
| | 57 | | | Muenchener Rueckversicherungs A.G. | | | 6,991 | | | |
| | 283 | | | SCOR S.E. | | | 6,614 | | | |
| | 175 | | | Swiss Re, Ltd. | | | 8,922 | | | |
| | | | | | | | 27,586 | | | |
| REIT – Diversified – 4.1% | | | | | | |
| | 17,619 | | | British Land Co. PLC | | | 126,526 | | | |
| | 174,336 | | | Dexus Property Group | | | 147,969 | | | |
| | 1,729 | | | Gecina S.A. | | | 145,437 | | | |
| | 214,190 | | | Goodman Group | | | 124,848 | | | |
| | 53,850 | | | GPT Group | | | 169,056 | | | |
| | 16,638 | | | Hammerson PLC | | | 93,002 | | | |
| | 3,208 | | | Klepierre | | | 91,498 | | | |
| | 31,121 | | | Land Securities Group PLC | | | 307,083 | | | |
| | 1,263 | | | Unibail-Rodamco | | | 227,024 | | | |
| | | | | | | | 1,432,443 | | | |
| REIT – Office Property – 0.1% | | | | | | |
| | 338 | | | ICADE | | | 26,590 | | | |
| | 1 | | | Japan Real Estate Investment Corp. | | | 7,797 | | | |
| | 2 | | | Nippon Building Fund, Inc. | | | 16,374 | | | |
| | | | | | | | 50,761 | | | |
| REIT – Shopping Centers – 0.1% | | | | | | |
| | 17,438 | | | CFS Retail Property Trust | | | 30,047 | | | |
| | 2,828 | | | Westfield Retail Trust | | | 7,201 | | | |
| | | | | | | | 37,248 | | | |
| Resorts and Theme Parks – 0.1% | | | | | | |
| | 400 | | | Oriental Land Co., Ltd. | | | 42,261 | | | |
| Retail – Apparel and Shoe – 1.5% | | | | | | |
| | 400 | | | Fast Retailing Co., Ltd. | | | 72,775 | | | |
| | 1,432 | | | Hennes & Mauritz A.B. – Class B | | | 46,073 | | | |
| | 2,575 | | | Inditex S.A. | | | 210,868 | | | |
| | 3,887 | | | Next PLC | | | 165,187 | | | |
| | 100 | | | Shimamura Co., Ltd. | | | 10,227 | | | |
| | | | | | | | 505,130 | | | |
| Retail – Automobile – 0% | | | | | | |
| | 130 | | | USS Co., Ltd. | | | 11,758 | | | |
| Retail – Building Products – 0.2% | | | | | | |
| | 19,498 | | | Kingfisher PLC | | | 75,898 | | | |
| Retail – Consumer Electronics – 0.1% | | | | | | |
| | 360 | | | Yamada Denki Co., Ltd. | | | 24,515 | | | |
| Retail – Convenience Stores – 0.1% | | | | | | |
| | 200 | | | FamilyMart Co., Ltd. | | | 8,083 | | | |
| | 400 | | | Lawson, Inc. | | | 24,977 | | | |
| | | | | | | | 33,060 | | | |
| Retail – Home Furnishings – 0.1% | | | | | | |
| | 350 | | | Nitori Co., Ltd. | | | 32,840 | | | |
| Retail – Jewelry – 1.7% | | | | | | |
| | 4,531 | | | Compagnie Financiere Richemont S.A. | | | 229,252 | | | |
| | 455 | | | Swatch Group A.G. | | | 170,322 | | | |
| | 2,701 | | | Swatch Group A.G. | | | 180,067 | | | |
| | | | | | | | 579,641 | | | |
| Retail – Major Department Stores – 0.4% | | | | | | |
| | 8,200 | | | Marui Group Co., Ltd. | | | 63,938 | | | |
| | 339 | | | PPR | | | 48,542 | | | |
| | 3,000 | | | Takashimaya Co., Ltd. | | | 21,715 | | | |
| | | | | | | | 134,195 | | | |
| Retail – Miscellaneous/Diversified – 0.4% | | | | | | |
| | 3,400 | | | Aeon Co., Ltd. | | | 46,703 | | | |
| | 1,200 | | | Seven & I Holdings Co., Ltd. | | | 33,450 | | | |
| | 1,407 | | | Wesfarmers, Ltd. | | | 42,445 | | | |
| | | | | | | | 122,598 | | | |
| Retail – Regional Department Stores – 0.2% | | | | | | |
| | 2,500 | | | Isetan Mitsukoshi Holdings, Ltd. | | | 26,218 | | | |
| | 6,000 | | | J. Front Retailing Co., Ltd. | | | 29,006 | | | |
| | | | | | | | 55,224 | | | |
| Retail – Restaurants – 0% | | | | | | |
| | 200 | | | McDonald’s Holdings Co. Japan, Ltd. | | | 5,398 | | | |
| Rubber – Tires – 1.8% | | | | | | |
| | 1,700 | | | Bridgestone Corp. | | | 38,551 | | | |
| | 2,981 | | | Compagnie Generale des Etablissements Michelin – Class B | | | 176,201 | | | |
| | 1,198 | | | Continental A.G. | | | 74,563 | | | |
| | 6,285 | | | Nokian Renkaat Oyj | | | 202,359 | | | |
| | 7,577 | | | Pirelli & C SpA | | | 63,784 | | | |
| | 4,400 | | | Sumitomo Rubber Industries, Inc. | | | 52,834 | | | |
| | | | | | | | 608,292 | | | |
See Notes to Schedules of Investments and Financial Statements.
Janus Mathematical Funds | 23
INTECH International Fund
Schedule of Investments (unaudited)
As of December 31, 2011
| | | | | | | | | | | |
| Shares | | Value | | | |
| |
| Rubber and Vinyl – 0% | | | | | | |
| | 300 | | | JSR Corp. | | $ | 5,536 | | | |
| Satellite Telecommunications – 0.5% | | | | | | |
| | 3,819 | | | Eutelsat Communications | | | 149,006 | | | |
| | 1,094 | | | SES S.A. (FDR) | | | 26,255 | | | |
| | | | | | | | 175,261 | | | |
| Schools – 0% | | | | | | |
| | 100 | | | Benesse Corp. | | | 4,841 | | | |
| Security Services – 0.4% | | | | | | |
| | 26,220 | | | G4S PLC | | | 110,654 | | | |
| | 200 | | | Secom Co., Ltd. | | | 9,227 | | | |
| | 784 | | | Securitas A.B. – Class B | | | 6,771 | | | |
| | | | | | | | 126,652 | | | |
| Semiconductor Equipment – 0% | | | | | | |
| | 179 | | | ASML Holding N.V. | | | 7,522 | | | |
| | 100 | | | Tokyo Electron, Ltd. | | | 5,088 | | | |
| | | | | | | | 12,610 | | | |
| Shipbuilding – 0.4% | | | | | | |
| | 46,000 | | | SembCorp Marine, Ltd. | | | 135,513 | | | |
| Silver Mining – 0.1% | | | | | | |
| | 1,707 | | | Fresnillo PLC | | | 40,472 | | | |
| Soap and Cleaning Preparations – 0.1% | | | | | | |
| | 183 | | | Henkel KGaA | | | 8,857 | | | |
| | 584 | | | Reckitt Benckiser Group PLC | | | 28,836 | | | |
| | | | | | | | 37,693 | | | |
| Steel – Producers – 0.2% | | | | | | |
| | 5,000 | | | Nippon Steel Corp. | | | 12,476 | | | |
| | 11,000 | | | Sumitomo Metal Industries, Ltd. | | | 20,013 | | | |
| | 1,442 | | | Voestapine A.G. | | | 40,536 | | | |
| | | | | | | | 73,025 | | | |
| Steel – Specialty – 0.1% | | | | | | |
| | 8,000 | | | Daido Steel Co., Ltd. | | | 50,214 | | | |
| Sugar – 0.5% | | | | | | |
| | 4,631 | | | Suedzucker A.G. | | | 147,726 | | | |
| | 1,100 | | | Tate & Lyle PLC | | | 12,033 | | | |
| | | | | | | | 159,759 | | | |
| Telecommunication Equipment – 0.4% | | | | | | |
| | 79,593 | | | Aclatel-Lucent* | | | 124,322 | | | |
| | 281 | | | NICE Systems, Ltd.* | | | 9,602 | | | |
| | | | | | | | 133,924 | | | |
| Telecommunication Services – 1.0% | | | | | | |
| | 43,000 | | | Singapore Telecommunications, Ltd. | | | 102,468 | | | |
| | 780 | | | Tele2 A.B. – Class B | | | 15,185 | | | |
| | 137,602 | | | Telecom Corp. of New Zealand, Ltd. | | | 221,631 | | | |
| | 458 | | | Telenor A.S.A. | | | 7,516 | | | |
| | 313 | | | Vivendi | | | 6,853 | | | |
| | | | | | | | 353,653 | | | |
| Telephone – Integrated – 2.9% | | | | | | |
| | 241 | | | Belgacom S.A. | | | 7,560 | | | |
| | 25,170 | | | BT Group PLC | | | 74,606 | | | |
| | 5,850 | | | Deutsche Telekom A.G. | | | 67,112 | | | |
| | 812 | | | France Telecom S.A. | | | 12,752 | | | |
| | 37 | | | KDDI Corp. | | | 238,012 | | | |
| | 400 | | | Nippon Telegraph & Telephone Corp. | | | 20,455 | | | |
| | 494 | | | Swisscom A.G. | | | 187,236 | | | |
| | 1,328 | | | TDC A/S | | | 10,652 | | | |
| | 554 | | | Telefonica S.A. | | | 9,596 | | | |
| | 115,340 | | | Telstra Corp., Ltd. | | | 392,762 | | | |
| | | | | | | | 1,020,743 | | | |
| Television – 0% | | | | | | |
| | 14,881 | | | ITV PLC | | | 15,747 | | | |
| Textile – Products – 0% | | | | | | |
| | 1,000 | | | Toray Industries, Inc. | | | 7,160 | | | |
| Tobacco – 2.2% | | | | | | |
| | 8,428 | | | British American Tobacco PLC | | | 399,847 | | | |
| | 3,584 | | | Imperial Tobacco Group PLC | | | 135,505 | | | |
| | 9 | | | Japan Tobacco, Inc. | | | 42,339 | | | |
| | 5,517 | | | Swedish Match A.B. | | | 195,953 | | | |
| | | | | | | | 773,644 | | | |
| Tools – Hand Held – 0.2% | | | | | | |
| | 2,300 | | | Makita Corp. | | | 74,455 | | | |
| Toys – 0.2% | | | | | | |
| | 5,700 | | | Namco Bandai Holdings, Inc. | | | 81,185 | | | |
| Transportation – Railroad – 2.4% | | | | | | |
| | 1 | | | Central Japan Railway Co. | | | 8,447 | | | |
| | 400 | | | East Japan Railway Co. | | | 25,471 | | | |
| | 878 | | | Groupe Eurotunnel S.A. | | | 5,977 | | | |
| | 15,000 | | | Keihin Electric Express Railway | | | 134,698 | | | |
| | 16,000 | | | Keio Corp. | | | 112,905 | | | |
| | 13,000 | | | Keisei Electric Railway Co., Ltd. | | | 95,621 | | | |
| | 40,000 | | | Kintetsu Corp. | | | 156,465 | | | |
| | 7,000 | | | Odakyu Electric Railway Co., Ltd. | | | 67,680 | | | |
| | 21,000 | | | Tobu Railway Co., Ltd. | | | 107,251 | | | |
| | 22,000 | | | Tokyu Corp. | | | 108,356 | | | |
| | 400 | | | West Japan Railway Co. | | | 17,388 | | | |
| | | | | | | | 840,259 | | | |
| Transportation – Services – 0.6% | | | | | | |
| | 2,214 | | | Asciano Group | | | 10,188 | | | |
| | 2,343 | | | Deutsche Post A.G. | | | 36,021 | | | |
| | 138 | | | Koninklijke Vopak N.V. | | | 7,291 | | | |
| | 1,377 | | | Kuehne + Nagel International A.G. | | | 154,711 | | | |
| | 1,370 | | | Toll Holdings, Ltd. | | | 5,912 | | | |
| | | | | | | | 214,123 | | | |
| Transportation – Truck – 0.5% | | | | | | |
| | 5,000 | | | Nippon Express Co., Ltd. | | | 19,493 | | | |
| | 8,400 | | | Yamato Holdings Co., Ltd. | | | 141,583 | | | |
| | | | | | | | 161,076 | | | |
| Warehousing and Harbor Transport Services – 0.1% | | | | | | |
| | 4,000 | | | Kamigumi Co., Ltd. | | | 34,516 | | | |
| Water – 0.7% | | | | | | |
| | 6,193 | | | Severn Trent PLC | | | 143,853 | | | |
| | 11,805 | | | United Utilities Group PLC | | | 111,078 | | | |
| | | | | | | | 254,931 | | | |
| Web Portals/Internet Service Providers – 0.2% | | | | | | |
| | 385 | | | Iliad S.A. | | | 47,506 | | | |
| | 1,575 | | | United Internet A.G. | | | 28,127 | | | |
| | | | | | | | 75,633 | | | |
See Notes to Schedules of Investments and Financial Statements.
24 | DECEMBER 31, 2011
Schedule of Investments (unaudited)
As of December 31, 2011
| | | | | | | | | | | |
| Shares | | Value | | | |
| |
| Wireless Equipment – 0.1% | | | | | | |
| | 5,554 | | | Nokia Oyj | | $ | 27,111 | | | |
| | 872 | | | Telefonaktiebolaget L.M. Ericsson – Class B | | | 8,925 | | | |
| | | | | | | | 36,036 | | | |
| |
| |
| Total Common Stock (cost $36,081,564) | | | 34,098,641 | | | |
| |
| |
| Preferred Stock – 1.2% | | | | | | |
| Automotive – Cars and Light Trucks – 0.8% | | | | | | |
| | 1,764 | | | Bayerische Motoren Werke A.G. | | | 83,436 | | | |
| | 727 | | | Porsche Automobil Holding S.E. | | | 38,902 | | | |
| | 1,066 | | | Volkswagen A.G. | | | 159,678 | | | |
| | | | | | | | 282,016 | | | |
| Soap and Cleaning Preparations – 0.4% | | | | | | |
| | 2,218 | | | Henkel A.G. & Co., KGaA | | | 127,987 | | | |
| |
| |
| Total Preferred Stock (cost $438,191) | | | 410,003 | | | |
| |
| |
| Money Market – 6.8% | | | | | | |
| | 2,357,237 | | | Janus Cash Liquidity Fund LLC, 0%
(cost $2,357,237) | | | 2,357,237 | | | |
| |
| |
| Total Investments (total cost $38,876,992) – 106.4% | | | 36,865,881 | | | |
| |
| |
| Liabilities, net of Cash, Receivables and Other Assets– (6.4)% | | | (2,210,696) | | | |
| |
| |
| Net Assets – 100% | | $ | 34,655,185 | | | |
| |
| |
Summary of Investments by Country – (Long Positions)
| | | | | | | | | |
| | | | | | % of Investment
| |
| Country | | Value | | | Securities | |
| |
| |
| Australia | | $ | 2,544,969 | | | | 6.9% | |
| Austria | | | 40,536 | | | | 0.1% | |
| Belgium | | | 558,128 | | | | 1.5% | |
| Bermuda | | | 224,015 | | | | 0.6% | |
| Denmark | | | 210,546 | | | | 0.6% | |
| Finland | | | 485,224 | | | | 1.3% | |
| France | | | 2,779,170 | | | | 7.5% | |
| Germany | | | 3,191,175 | | | | 8.7% | |
| Guernsey | | | 256,233 | | | | 0.7% | |
| Hong Kong | | | 764,631 | | | | 2.1% | |
| Ireland | | | 617,779 | | | | 1.7% | |
| Israel | | | 9,602 | | | | 0.0% | |
| Italy | | | 633,710 | | | | 1.7% | |
| Japan | | | 7,180,129 | | | | 19.5% | |
| Jersey | | | 771,622 | | | | 2.1% | |
| Luxembourg | | | 217,220 | | | | 0.6% | |
| Netherlands | | | 870,548 | | | | 2.4% | |
| New Zealand | | | 426,205 | | | | 1.1% | |
| Norway | | | 118,655 | | | | 0.3% | |
| Portugal | | | 190,554 | | | | 0.5% | |
| Singapore | | | 982,432 | | | | 2.7% | |
| Spain | | | 1,571,324 | | | | 4.3% | |
| Sweden | | | 766,632 | | | | 2.1% | |
| Switzerland | | | 3,409,315 | | | | 9.2% | |
| United Kingdom | | | 5,325,822 | | | | 14.4% | |
United States†† | | | 2,719,705 | | | | 7.4% | |
| |
| |
| Total | | $ | 36,865,881 | | | | 100.0% | |
| | | |
| †† | | Includes Cash Equivalents (1.0% excluding Cash Equivalents). |
See Notes to Schedules of Investments and Financial Statements.
Janus Mathematical Funds | 25
INTECH U.S. Core Fund (unaudited)
| | | | | | | |
Fund Snapshot
INTECH’s active approach focuses on adding value by selecting stocks with unique volatility characteristics and low correlations to one another.
| | | | | | Managed by
INTECH Investment Management LLC |
Performance Overview
For the six-month period ended December 31, 2011, INTECH U.S. Core Fund’s Class T Shares returned -3.61%. This compares to the -3.69% return posted by the S&P 500 Index, the Fund’s benchmark.
Investment Strategy
INTECH’s mathematical investing process seeks to build a more efficient portfolio than its benchmark. The process seeks to minimize tracking error for a target level of excess return. In doing so, the process does not attempt to predict the direction of the market, nor does it have a view of any particular company in the portfolio. Instead, it employs a proprietary optimization process to build portfolios with the potential to outperform the index by capturing stocks’ natural volatility.
Within specific risk controls, INTECH’s disciplined mathematical process establishes target proportional weightings for stocks in the portfolio as a result of an optimization routine. Once the weights are determined and the portfolio is constructed, it is rebalanced and re-optimized on a periodic basis. By limiting the distance any one stock position can deviate from its benchmark weight, INTECH’s process attempts to control the relative risk of the portfolio. We believe that instituting an investment process aimed at providing consistent, positive excess returns at benchmark-like risk, will allow us to meet our investors’ objectives while minimizing the risk of significant underperformance relative to the benchmark.
Outlook
Going forward, we will continue building portfolios in a disciplined and deliberate manner, with risk management remaining the hallmark of our investment process. While we may experience short periods of underperformance, we expect to exceed the benchmark over a three- to five-year time horizon. As INTECH’s ongoing research efforts yield modest improvements, we will continue implementing changes that we believe are likely to improve the long-term results for our clients.
Thank you for your investment in INTECH U.S. Core Fund.
26 | DECEMBER 31, 2011
(unaudited)
INTECH U.S. Core Fund At A Glance
5 Largest Equity Holdings – (% of Net Assets)
As of December 31, 2011
| | | | | |
Apple, Inc.
Computers | | | 3.5% | |
Estee Lauder Cos., Inc. – Class A
Cosmetics and Toiletries | | | 2.0% | |
DIRECTV – Class A
Cable/Satellite Television | | | 1.9% | |
Oneok, Inc.
Pipelines | | | 1.5% | |
Google, Inc. – Class A
Web Portals/Internet Service Providers | | | 1.5% | |
| | | | | |
| | | | 10.4% | |
Asset Allocation – (% of Net Assets)
As of December 31, 2011
Top Country Allocations – Long Positions (% of Investment Securities)
As of December 31, 2011
Janus Mathematical Funds | 27
INTECH U.S. Core Fund (unaudited)
| | | | | | | | | | | | | | |
| Average Annual Total Return – for the periods ended December 31, 2011 | | | Expense Ratios – per the October 28, 2011 prospectuses |
| | | Fiscal
| | One
| | Five
| | Since
| | | Total Annual Fund
| | Net Annual Fund
|
| | | Year-to-Date | | Year | | Year | | Inception* | | | Operating Expenses | | Operating Expenses |
| | | | | | | | | | | | | | |
| INTECH U.S. Core Fund – Class A Shares | | | | | | | | | | | | | |
| | | | | | | | | | | | | | |
| NAV | | –3.65% | | 4.85% | | 0.01% | | 7.50% | | | 0.99% | | 0.99% |
| | | | | | | | | | | | | | |
| MOP | | –9.17% | | –1.16% | | –1.16% | | 6.78% | | | | | |
| | | | | | | | | | | | | | |
| INTECH U.S. Core Fund – Class C Shares | | | | | | | | | | | | | |
| | | | | | | | | | | | | | |
| NAV | | –4.07% | | 4.03% | | –0.72% | | 6.71% | | | 1.81% | | 1.81% |
| | | | | | | | | | | | | | |
| CDSC | | –5.03% | | 2.99% | | –0.72% | | 6.71% | | | | | |
| | | | | | | | | | | | | | |
| INTECH U.S. Core Fund – Class D Shares(1) | | –3.59% | | 5.07% | | 0.29% | | 7.81% | | | 0.83% | | 0.83% |
| | | | | | | | | | | | | | |
| INTECH U.S. Core Fund – Class I Shares | | –3.56% | | 5.18% | | 0.25% | | 7.79% | | | 0.73% | | 0.73% |
| | | | | | | | | | | | | | |
| INTECH U.S. Core Fund – Class S Shares | | –3.72% | | 4.71% | | –0.14% | | 7.31% | | | 1.19% | | 1.19% |
| | | | | | | | | | | | | | |
| INTECH U.S. Core Fund – Class T Shares | | –3.61% | | 4.97% | | 0.25% | | 7.79% | | | 0.93% | | 0.93% |
| | | | | | | | | | | | | | |
| S&P 500® Index | | –3.69% | | 2.11% | | –0.25% | | 6.77% | | | | | |
| | | | | | | | | | | | | | |
| Lipper Quartile – Class T Shares | | – | | 1st | | 2nd | | 1st | | | | | |
| | | | | | | | | | | | | | |
| Lipper Ranking – based on total returns for Large-Cap Core Funds | | – | | 98/1064 | | 241/825 | | 74/599 | | | | | |
| | | | | | | | | | | | | | |
| Visit janus.com/advisor/mutual-funds (or janus.com/allfunds if you hold Shares directly with Janus Capital) to view current performance and characteristic information | | | | | |
| | | | | | | | | | | | | | |
Data presented represents past performance, which is no guarantee of future results. Investment results and principal value will fluctuate so that shares, when redeemed, may be worth more or less than their original cost. Due to market volatility, current performance may be higher or lower than the performance shown. Call 877.33JANUS(52687) (or 800.525.3713 if you hold shares directly with Janus Capital) or visit janus.com/advisor/mutual-funds (or janus.com/allfunds if you hold shares directly with Janus Capital) for performance current to the most recent month-end.
Performance shown for Class A Shares at Maximum Offering Price (MOP) includes the Fund’s maximum sales charge of 5.75%. Performance shown at Net Asset Value (NAV) does not include this charge and would have been lower had this charge been taken into account.
See important disclosures on the next page.
28 | DECEMBER 31, 2011
(unaudited)
Performance shown for Class C Shares includes a 1% contingent deferred sales charge (CDSC) on periods of less than 12 months. Performance shown at Net Asset Value (NAV) does not include this sales charge and would have been lower had this sales charge been taken into account.
For Class D Shares, Class I Shares, Class S Shares, and Class T Shares, a 2% redemption fee may be imposed on shares held for 90 days or less. Performance shown does not reflect this redemption fee and, if reflected, performance would have been lower.
Janus Capital has contractually agreed to waive the Fund’s total annual fund operating expenses allocated to any class (excluding any performance adjustments to management fees, the distribution and shareholder servicing fees (applicable to Class A Shares, Class C Shares, and Class S Shares), administrative services fees payable pursuant to the Transfer Agency Agreement (except for networking and omnibus fees), brokerage commissions, interest, dividends, taxes, acquired fund fees and expenses, and extraordinary expenses) to certain limits until at least November 1, 2012. The contractual waiver may be terminated or modified prior to this date only at the discretion of the Board of Trustees. Returns shown include fee waivers, if any, and without such waivers, returns would have been lower.
The voluntary waiver of the Fund’s management fee terminated June 25, 2004. Without such waivers, total returns from inception to June 25, 2004 would have been lower.
The expense information shown was determined based on net assets as of the fiscal period ended June 30, 2011. The effect of contractual waivers agreed to by Janus Capital, when applicable, are reflected under “Net Annual Fund Operating Expenses.” (All expenses are shown without the effect of expense offset arrangements. Pursuant to such arrangements, credits realized as a result of uninvested cash balances are used to reduce custodian and transfer agent expenses.)
The Fund has a performance-based management fee that adjusts up or down based on the Fund’s performance relative to an approved benchmark index over a performance measurement period. See the Fund’s Prospectus or Statement of Additional Information for more details.
The proprietary mathematical process used by INTECH Investment Management LLC (“INTECH”) may not achieve the desired results. The rebalancing techniques used by the Fund may result in a higher portfolio turnover rate, higher expenses and potentially higher net taxable gains or losses compared to a “buy and hold” or index fund strategy.
The Fund’s performance may be affected by risks that include those associated with investments in specific industries or countries and potential conflicts of interest with the Janus “funds of funds.” Additional risks to the Fund may include those associated with investing in foreign securities, initial public offerings (“IPOs”), real estate investment trusts (“REITs”), and derivatives. Please see a Janus prospectus or janus.com/info (or janus.com/reports if you hold shares directly with Janus Capital) for more information about risks, portfolio holdings and other details.
The Fund invests in REITs, which may be subject to a higher degree of market risk because of concentration in a specific industry, sector or geographic region. REITs may be subject to risks including, but not limited to: legal, political, liquidity, and interest rate risks, a decline in the value of real estate, risks related to general and economic conditions, changes in the value of the underlying property owned by the trust and defaults by borrowers. To the extent the Fund invests in foreign REITs, the Fund may be subject to fluctuations in currency rates or political or economic conditions in a particular country.
The Fund will normally invest at least 80% of its net assets, measured at the time of purchase, in the type of securities described by its name.
Returns include reinvestment of dividends from net investment income and distributions from capital gains. The returns shown do not reflect the deduction of taxes that a shareholder would pay on Fund distributions or the redemption of Fund shares. The returns do not include adjustments in accordance with generally accepted accounting principles required at the period end for financial reporting purposes.
Class A Shares, Class C Shares, and Class S Shares of the Fund commenced operations on July 6, 2009. The historical performance shown for periods prior to July 6, 2009 reflects the performance of one or more other share classes of the Fund, calculated using the fees and expenses of each respective share class without the effect of any fee and expense limitations and waivers. If each share class of the Fund had been available during periods prior to July 6, 2009, the performance shown may have been different. Please refer to the Fund’s prospectus for further details concerning historical performance.
Class D Shares of the Fund commenced operations on February 16, 2010, as a result of the restructuring of Class J Shares, the predecessor share class. The performance shown for Class D Shares for periods prior to February 16, 2010 reflects the performance of the Fund’s former Class J Shares. If Class D Shares of the Fund had been available during periods prior to February 16, 2010, the performance shown may have been different. The performance shown for periods following the Fund’s commencement of Class D Shares reflects the fees and expenses of Class D Shares, net of any fee and expense limitations or waivers.
Class I Shares commenced operations on July 6, 2009. Performance shown for Class I Shares for periods prior to July 6, 2009, reflects the performance of the Fund’s Class J Shares, the initial share class, calculated using the fees and expenses of Class J Shares, without the effect of any fee and expense limitations or waivers. If Class I Shares of the Fund had been available during periods prior to July 6, 2009, the performance shown may have been different. The performance shown for periods following the Fund’s commencement of Class I Shares reflects the fees and expenses of Class I Shares, net of any fee and expense limitations or waivers.
Lipper, a wholly-owned subsidiary of Thomson Reuters, provides independent insight on global collective investments including mutual funds, retirement funds, hedge funds, fund fees and expenses to the asset management and media communities. Lipper ranks the performance of mutual funds within a classification of funds that have similar investment objectives. Rankings are historical with capital gains and dividends reinvested and do not include the effect of loads.
Janus Mathematical Funds | 29
INTECH U.S. Core Fund (unaudited)
Ranking is for Class T Shares only; other classes may have different performance characteristics. When an expense waiver is in effect, it may have a material effect on the total return, and therefore the ranking for the period.
There is no assurance that the investment process will consistently lead to successful investing.
See Notes to Schedules of Investments for index definitions.
The weighting of securities within the portfolio may differ significantly from the weightings within the index. The index is unmanaged and is not available for direct investment; therefore, its performance does not reflect the expenses associated with the active management of an actual portfolio.
Effective December 7, 2011, INTECH Risk-Managed Core Fund changed its name to INTECH U.S. Core Fund.
See “Explanations of Charts, Tables and Financial Statements.”
| | | |
| * | | The Fund’s inception date – February 28, 2003 |
| (1) | | Closed to new investors. |
The examples below show you the ongoing costs (in dollars) of investing in your Fund and allow you to compare these costs with those of other mutual funds. Please refer to the section Useful Information About Your Fund Report for a detailed explanation of the information presented in these charts.
| | | | | | | | | | | | | | | |
| | | Beginning Account Value
| | Ending Account Value
| | Expenses Paid During Period
| | |
| Expense Example – Class A Shares | | (7/1/11) | | (12/31/11) | | (7/1/11 - 12/31/11)† | | |
| |
| |
| Actual | | $ | 1,000.00 | | | $ | 963.50 | | | $ | 4.94 | | | |
| |
| |
Hypothetical
(5% return before expenses) | | $ | 1,000.00 | | | $ | 1,020.11 | | | $ | 5.08 | | | |
| |
| |
| | | | | | | | | | | | | | | |
| | | | | | | | | | | | | | | |
| | | Beginning Account Value
| | Ending Account Value
| | Expenses Paid During Period
| | |
| Expense Example – Class C Shares | | (7/1/11) | | (12/31/11) | | (7/1/11 - 12/31/11)† | | |
| |
| |
| Actual | | $ | 1,000.00 | | | $ | 959.30 | | | $ | 9.06 | | | |
| |
| |
Hypothetical
(5% return before expenses) | | $ | 1,000.00 | | | $ | 1,015.89 | | | $ | 9.32 | | | |
| |
| |
| | | | | | | | | | | | | | | |
| | | | | | | | | | | | | | | |
| | | Beginning Account Value
| | Ending Account Value
| | Expenses Paid During Period
| | |
| Expense Example – Class D Shares | | (7/1/11) | | (12/31/11) | | (7/1/11 - 12/31/11)† | | |
| |
| |
| Actual | | $ | 1,000.00 | | | $ | 964.10 | | | $ | 4.25 | | | |
| |
| |
Hypothetical
(5% return before expenses) | | $ | 1,000.00 | | | $ | 1,020.81 | | | $ | 4.37 | | | |
| |
| |
| | | | | | | | | | | | | | | |
| | | | | | | | | | | | | | | |
| | | Beginning Account Value
| | Ending Account Value
| | Expenses Paid During Period
| | |
| Expense Example – Class I Shares | | (7/1/11) | | (12/31/11) | | (7/1/11 - 12/31/11)† | | |
| |
| |
| Actual | | $ | 1,000.00 | | | $ | 964.40 | | | $ | 3.75 | | | |
| |
| |
Hypothetical
(5% return before expenses) | | $ | 1,000.00 | | | $ | 1,021.32 | | | $ | 3.86 | | | |
| |
| |
| | | | | | | | | | | | | | | |
| | | | | | | | | | | | | | | |
| | | Beginning Account Value
| | Ending Account Value
| | Expenses Paid During Period
| | |
| Expense Example – Class S Shares | | (7/1/11) | | (12/31/11) | | (7/1/11 - 12/31/11)† | | |
| |
| |
| Actual | | $ | 1,000.00 | | | $ | 962.80 | | | $ | 5.97 | | | |
| |
| |
Hypothetical
(5% return before expenses) | | $ | 1,000.00 | | | $ | 1,019.05 | | | $ | 6.14 | | | |
| |
| |
| | | | | | | | | | | | | | | |
| | | | | | | | | | | | | | | |
| | | Beginning Account Value
| | Ending Account Value
| | Expenses Paid During Period
| | |
| Expense Example – Class T Shares | | (7/1/11) | | (12/31/11) | | (7/1/11 - 12/31/11)† | | |
| |
| |
| Actual | | $ | 1,000.00 | | | $ | 963.90 | | | $ | 4.74 | | | |
| |
| |
Hypothetical
(5% return before expenses) | | $ | 1,000.00 | | | $ | 1,020.31 | | | $ | 4.88 | | | |
| |
| |
| | | |
| † | | Expenses are equal to the annualized expense ratio of 1.00% for Class A Shares, 1.84% for Class C Shares, 0.86% for Class D Shares, 0.76% for Class I Shares, 1.21% for Class S Shares and 0.96% for Class T Shares multiplied by the average account value over the period, multiplied by 184/366 (to reflect the one-half year period). Expenses include effect of contractual waivers by Janus Capital. |
30 | DECEMBER 31, 2011
INTECH U.S. Core Fund
Schedule of Investments (unaudited)
As of December 31, 2011
| | | | | | | | | | | |
| Shares | | Value | | | |
| |
| Common Stock – 99.5% | | | | | | |
| Advertising Agencies – 0% | | | | | | |
| | 1,500 | | | Omnicom Group, Inc. | | $ | 66,870 | | | |
| Aerospace and Defense – 1.0% | | | | | | |
| | 2,000 | | | Boeing Co. | | | 146,700 | | | |
| | 1,100 | | | General Dynamics Corp. | | | 73,051 | | | |
| | 4,200 | | | Lockheed Martin Corp. | | | 339,780 | | | |
| | 21,200 | | | Northrop Grumman Corp. | | | 1,239,776 | | | |
| | 10,200 | | | Raytheon Co. | | | 493,476 | | | |
| | 15,300 | | | Rockwell Collins, Inc. | | | 847,161 | | | |
| | | | | | | | 3,139,944 | | | |
| Aerospace and Defense – Equipment – 0.2% | | | | | | |
| | 1,900 | | | B.F. Goodrich Co. | | | 235,030 | | | |
| | 3,600 | | | United Technologies Corp. | | | 263,124 | | | |
| | | | | | | | 498,154 | | | |
| Agricultural Chemicals – 0% | | | | | | |
| | 700 | | | Mosaic Co. | | | 35,301 | | | |
| Agricultural Operations – 0% | | | | | | |
| | 3,200 | | | Archer-Daniels-Midland Co. | | | 91,520 | | | |
| Apparel Manufacturers – 0.5% | | | | | | |
| | 8,500 | | | Coach, Inc. | | | 518,840 | | | |
| | 200 | | | Ralph Lauren Corp. | | | 27,616 | | | |
| | 8,400 | | | VF Corp. | | | 1,066,716 | | | |
| | | | | | | | 1,613,172 | | | |
| Applications Software – 1.1% | | | | | | |
| | 44,500 | | | Intuit, Inc. | | | 2,340,255 | | | |
| | 35,000 | | | Microsoft Corp. | | | 908,600 | | | |
| | 500 | | | Salesforce.com, Inc.* | | | 50,730 | | | |
| | | | | | | | 3,299,585 | | | |
| Athletic Footwear – 0.1% | | | | | | |
| | 2,600 | | | NIKE, Inc. – Class B | | | 250,562 | | | |
| Automotive – Truck Parts and Equipment – Original – 0.1% | | | | | | |
| | 3,000 | | | BorgWarner, Inc.* | | | 191,220 | | | |
| Beverages – Non-Alcoholic – 0.7% | | | | | | |
| | 17,500 | | | Coca-Cola Co. | | | 1,224,475 | | | |
| | 13,000 | | | Coca-Cola Enterprises, Inc. | | | 335,140 | | | |
| | 10,600 | | | Dr. Pepper Snapple Group, Inc. | | | 418,488 | | | |
| | 500 | | | PepsiCo, Inc. | | | 33,175 | | | |
| | | | | | | | 2,011,278 | | | |
| Beverages – Wine and Spirits – 0.7% | | | | | | |
| | 26,800 | | | Beam, Inc. | | | 1,372,964 | | | |
| | 8,600 | | | Brown-Forman Corp. – Class B | | | 692,386 | | | |
| | | | | | | | 2,065,350 | | | |
| Building – Residential and Commercial – 0% | | | | | | |
| | 13,000 | | | Pulte Homes, Inc.* | | | 82,030 | | | |
| Cable/Satellite Television – 2.7% | | | | | | |
| | 68,000 | | | Cablevision Systems New York Group – Class A | | | 966,960 | | | |
| | 34,600 | | | Comcast Corp. – Class A | | | 820,366 | | | |
| | 139,400 | | | DIRECTV – Class A* | | | 5,960,744 | | | |
| | 11,800 | | | Time Warner Cable, Inc. – Class A | | | 750,126 | | | |
| | | | | | | | 8,498,196 | | | |
| Casino Hotels – 0% | | | | | | |
| | 600 | | | Wynn Resorts, Ltd. | | | 66,294 | | | |
| Cellular Telecommunications – 0% | | | | | | |
| | 23,800 | | | Sprint Nextel Corp.* | | | 55,692 | | | |
| Chemicals – Diversified – 1.0% | | | | | | |
| | 69,300 | | | E.I. du Pont de Nemours & Co. | | | 3,172,554 | | | |
| Chemicals – Specialty – 1.0% | | | | | | |
| | 78,400 | | | Eastman Chemical Co. | | | 3,062,304 | | | |
| Coal – 0.1% | | | | | | |
| | 7,100 | | | Alpha Natural Resources, Inc.* | | | 145,053 | | | |
| | 3,900 | | | Consol Energy, Inc. | | | 143,130 | | | |
| | | | | | | | 288,183 | | | |
| Coatings and Paint Products – 0.1% | | | | | | |
| | 4,900 | | | Sherwin-Williams Co. | | | 437,423 | | | |
| Commercial Banks – 0.4% | | | | | | |
| | 13,500 | | | BB&T Corp. | | | 339,795 | | | |
| | 4,000 | | | First Horizon National Corp. | | | 32,000 | | | |
| | 5,000 | | | M&T Bank Corp. | | | 381,700 | | | |
| | 25,800 | | | Regions Financial Corp. | | | 110,940 | | | |
| | 26,700 | | | Zions Bancorp. | | | 434,676 | | | |
| | | | | | | | 1,299,111 | | | |
| Commercial Services – 0.6% | | | | | | |
| | 61,500 | | | Iron Mountain, Inc. | | | 1,894,200 | | | |
| Commercial Services – Finance – 1.7% | | | | | | |
| | 12,300 | | | Automatic Data Processing, Inc. | | | 664,323 | | | |
| | 42,400 | | | H&R Block, Inc. | | | 692,392 | | | |
| | 2,800 | | | MasterCard, Inc. – Class A | | | 1,043,896 | | | |
| | 50,700 | | | Moody’s Corp. | | | 1,707,576 | | | |
| | 22,600 | | | Paychex, Inc. | | | 680,486 | | | |
| | 6,200 | | | Total System Services, Inc. | | | 121,272 | | | |
| | 4,700 | | | Visa, Inc. – Class A | | | 477,191 | | | |
| | | | | | | | 5,387,136 | | | |
| Computer Services – 2.7% | | | | | | |
| | 17,900 | | | Accenture, Ltd. – Class A (U.S. Shares) | | | 952,817 | | | |
| | 66,200 | | | Cognizant Technology Solutions Corp.* | | | 4,257,322 | | | |
| | 17,300 | | | International Business Machines Corp. | | | 3,181,124 | | | |
| | | | | | | | 8,391,263 | | | |
| Computers – 3.5% | | | | | | |
| | 26,900 | | | Apple, Inc.* | | | 10,894,500 | | | |
| | 8,300 | | | Dell, Inc.* | | | 121,429 | | | |
| | | | | | | | 11,015,929 | | | |
| Computers – Integrated Systems – 0.2% | | | | | | |
| | 10,100 | | | Teradata Corp.* | | | 489,951 | | | |
| Computers – Memory Devices – 0.1% | | | | | | |
| | 8,200 | | | EMC Corp.* | | | 176,628 | | | |
| Computers – Peripheral Equipment – 0% | | | | | | |
| | 2,500 | | | Lexmark International, Inc. – Class A | | | 82,675 | | | |
| Consumer Products – Miscellaneous – 0.2% | | | | | | |
| | 9,300 | | | Kimberly-Clark Corp. | | | 684,108 | | | |
| Containers – Metal and Glass – 0.1% | | | | | | |
| | 9,600 | | | Ball Corp. | | | 342,816 | | | |
| Cosmetics and Toiletries – 2.4% | | | | | | |
| | 15,200 | | | Colgate-Palmolive Co. | | | 1,404,328 | | | |
| | 55,100 | | | Estee Lauder Cos., Inc. – Class A | | | 6,188,832 | | | |
| | | | | | | | 7,593,160 | | | |
| Data Processing and Management – 0% | | | | | | |
| | 5,400 | | | Fidelity National Information Services, Inc. | | | 143,586 | | | |
See Notes to Schedules of Investments and Financial Statements.
Janus Mathematical Funds | 31
INTECH U.S. Core Fund
Schedule of Investments (unaudited)
As of December 31, 2011
| | | | | | | | | | | |
| Shares | | Value | | | |
| |
| Dental Supplies and Equipment – 0% | | | | | | |
| | 1,900 | | | Dentsply International, Inc. | | $ | 66,481 | | | |
| Disposable Medical Products – 0.1% | | | | | | |
| | 4,800 | | | C.R. Bard, Inc. | | | 410,400 | | | |
| Distribution/Wholesale – 0.5% | | | | | | |
| �� | 9,500 | | | Fastenal Co. | | | 414,295 | | | |
| | 5,400 | | | Genuine Parts Co. | | | 330,480 | | | |
| | 3,500 | | | W.W. Grainger, Inc. | | | 655,165 | | | |
| | | | | | | | 1,399,940 | | | |
| Diversified Banking Institutions – 0.5% | | | | | | |
| | 32,800 | | | Bank of America Corp. | | | 182,368 | | | |
| | 4,500 | | | Citigroup, Inc. | | | 118,395 | | | |
| | 28,926 | | | JPMorgan Chase & Co. | | | 961,790 | | | |
| | 17,900 | | | Morgan Stanley | | | 270,827 | | | |
| | | | | | | | 1,533,380 | | | |
| Diversified Operations – 1.8% | | | | | | |
| | 2,500 | | | Cooper Industries, Ltd. – Class A (U.S. Shares) | | | 135,375 | | | |
| | 2,900 | | | Danaher Corp. | | | 136,416 | | | |
| | 1,000 | | | Dover Corp. | | | 58,050 | | | |
| | 65,500 | | | Eaton Corp. | | | 2,851,215 | | | |
| | 39,500 | | | General Electric Co. | | | 707,445 | | | |
| | 48,300 | | | Leucadia National Corp. | | | 1,098,342 | | | |
| | 5,000 | | | Parker Hannifin Corp. | | | 381,250 | | | |
| | 5,500 | | | Tyco International, Ltd. (U.S. Shares) | | | 256,905 | | | |
| | | | | | | | 5,624,998 | | | |
| E-Commerce/Products – 0.9% | | | | | | |
| | 7,600 | | | Amazon.com, Inc.* | | | 1,315,560 | | | |
| | 52,800 | | | eBay, Inc.* | | | 1,601,424 | | | |
| | | | | | | | 2,916,984 | | | |
| E-Commerce/Services – 1.2% | | | | | | |
| | 3,050 | | | Expedia, Inc. | | | 88,511 | | | |
| | 7,800 | | | Priceline.com, Inc.* | | | 3,648,138 | | | |
| | 3,050 | | | TripAdvisor, Inc. | | | 76,890 | | | |
| | | | | | | | 3,813,539 | | | |
| Electric – Integrated – 5.5% | | | | | | |
| | 17,200 | | | Ameren Corp. | | | 569,836 | | | |
| | 14,200 | | | American Electric Power Co., Inc. | | | 586,602 | | | |
| | 46,600 | | | CMS Energy Corp. | | | 1,028,928 | | | |
| | 24,700 | | | Consolidated Edison, Inc. | | | 1,532,141 | | | |
| | 47,300 | | | Constellation Energy Group, Inc. | | | 1,876,391 | | | |
| | 44,700 | | | Dominion Resources, Inc. | | | 2,372,676 | | | |
| | 10,800 | | | DTE Energy Co. | | | 588,060 | | | |
| | 28,100 | | | Duke Energy Corp. | | | 618,200 | | | |
| | 6,000 | | | Exelon Corp. | | | 260,220 | | | |
| | 41,600 | | | FirstEnergy Corp. | | | 1,842,880 | | | |
| | 1,700 | | | FPL Group, Inc. | | | 103,496 | | | |
| | 16,700 | | | Northeast Utilities | | | 602,369 | | | |
| | 12,000 | | | Pepco Holdings, Inc. | | | 243,600 | | | |
| | 16,000 | | | Pinnacle West Capital Corp. | | | 770,880 | | | |
| | 18,400 | | | PPL Corp. | | | 541,328 | | | |
| | 24,300 | | | Progress Energy, Inc. | | | 1,361,286 | | | |
| | 5,700 | | | Public Service Enterprise Group, Inc. | | | 188,157 | | | |
| | 3,800 | | | SCANA Corp. | | | 171,228 | | | |
| | 16,000 | | | Southern Co. | | | 740,640 | | | |
| | 17,800 | | | Wisconsin Energy Corp. | | | 622,288 | | | |
| | 13,500 | | | Xcel Energy, Inc. | | | 373,140 | | | |
| | | | | | | | 16,994,346 | | | |
| Electronic Components – Miscellaneous – 0.2% | | | | | | |
| | 5,200 | | | Jabil Circuit, Inc. | | | 102,232 | | | |
| | 14,500 | | | TE Connectivity, Ltd. (U.S. Shares) | | | 446,745 | | | |
| | | | | | | | 548,977 | | | |
| Electronic Components – Semiconductors – 1.2% | | | | | | |
| | 1,900 | | | First Solar, Inc.* | | | 64,144 | | | |
| | 5,400 | | | Intel Corp. | | | 130,950 | | | |
| | 118,600 | | | Texas Instruments, Inc. | | | 3,452,446 | | | |
| | | | | | | | 3,647,540 | | | |
| Electronic Measuring Instruments – 0.6% | | | | | | |
| | 51,500 | | | Agilent Technologies, Inc.* | | | 1,798,895 | | | |
| Electronics – Military – 0.1% | | | | | | |
| | 3,400 | | | L-3 Communications Holdings, Inc. | | | 226,712 | | | |
| Engineering – Research and Development Services – 0% | | | | | | |
| | 900 | | | Fluor Corp. | | | 45,225 | | | |
| Engines – Internal Combustion – 0% | | | | | | |
| | 600 | | | Cummins, Inc. | | | 52,812 | | | |
| Enterprise Software/Services – 0% | | | | | | |
| | 4,900 | | | Oracle Corp. | | | 125,685 | | | |
| Entertainment Software – 0.2% | | | | | | |
| | 35,900 | | | Electronic Arts, Inc.* | | | 739,540 | | | |
| Filtration and Separations Products – 0.5% | | | | | | |
| | 27,000 | | | Pall Corp. | | | 1,543,050 | | | |
| Finance – Consumer Loans – 0% | | | | | | |
| | 9,400 | | | SLM Corp. | | | 125,960 | | | |
| Finance – Credit Card – 0.3% | | | | | | |
| | 9,900 | | | American Express Co. | | | 466,983 | | | |
| | 21,400 | | | Discover Financial Services | | | 513,600 | | | |
| | | | | | | | 980,583 | | | |
| Finance – Investment Bankers/Brokers – 0% | | | | | | |
| | 6,600 | | | E*TRADE Financial Corp.* | | | 52,536 | | | |
| Finance – Other Services – 0.5% | | | | | | |
| | 21,100 | | | NASDAQ Stock Market, Inc.* | | | 517,161 | | | |
| | 34,200 | | | NYSE Euronext | | | 892,620 | | | |
| | | | | | | | 1,409,781 | | | |
| Food – Confectionary – 1.3% | | | | | | |
| | 21,200 | | | Hershey Co. | | | 1,309,736 | | | |
| | 35,500 | | | J.M. Smucker Co. | | | 2,775,035 | | | |
| | | | | | | | 4,084,771 | | | |
| Food – Dairy Products – 0.2% | | | | | | |
| | 65,900 | | | Dean Foods Co.* | | | 738,080 | | | |
| Food – Meat Products – 0.3% | | | | | | |
| | 31,400 | | | Hormel Foods Corp. | | | 919,706 | | | |
| | 900 | | | Tyson Foods, Inc. – Class A | | | 18,576 | | | |
| | | | | | | | 938,282 | | | |
| Food – Miscellaneous/Diversified – 3.1% | | | | | | |
| | 20,300 | | | ConAgra Foods, Inc. | | | 535,920 | | | |
| | 69,200 | | | General Mills, Inc. | | | 2,796,372 | | | |
| | 15,300 | | | H.J. Heinz Co. | | | 826,812 | | | |
| | 21,400 | | | Kellogg Co. | | | 1,082,198 | | | |
| | 29,000 | | | Kraft Foods, Inc. – Class A | | | 1,083,440 | | | |
| | 11,500 | | | McCormick & Co., Inc. | | | 579,830 | | | |
| | 148,500 | | | Sara Lee Corp. | | | 2,809,620 | | | |
| | | | | | | | 9,714,192 | | | |
See Notes to Schedules of Investments and Financial Statements.
32 | DECEMBER 31, 2011
Schedule of Investments (unaudited)
As of December 31, 2011
| | | | | | | | | | | |
| Shares | | Value | | | |
| |
| Food – Retail – 0.2% | | | | | | |
| | 6,100 | | | Kroger Co. | | $ | 147,742 | | | |
| | 42,300 | | | Supervalu, Inc. | | | 343,476 | | | |
| | 2,100 | | | Whole Foods Market, Inc. | | | 146,118 | | | |
| | | | | | | | 637,336 | | | |
| Food – Wholesale/Distribution – 0.1% | | | | | | |
| | 8,700 | | | Sysco Corp. | | | 255,171 | | | |
| Gas – Transportation – 1.8% | | | | | | |
| | 4,442 | | | AGL Resources, Inc. | | | 187,719 | | | |
| | 155,400 | | | CenterPoint Energy, Inc. | | | 3,121,986 | | | |
| | 101,200 | | | NiSource, Inc. | | | 2,409,572 | | | |
| | | | | | | | 5,719,277 | | | |
| Gold Mining – 0% | | | | | | |
| | 1,400 | | | Newmont Mining Corp. | | | 84,014 | | | |
| Hazardous Waste Disposal – 0.3% | | | | | | |
| | 10,400 | | | Stericycle, Inc.* | | | 810,368 | | | |
| Human Resources – 0.1% | | | | | | |
| | 6,500 | | | Robert Half International, Inc. | | | 184,990 | | | |
| Independent Power Producer – 0.1% | | | | | | |
| | 21,900 | | | NRG Energy, Inc.* | | | 396,828 | | | |
| Industrial Automation and Robotics – 0.8% | | | | | | |
| | 33,400 | | | Rockwell Automation, Inc. | | | 2,450,558 | | | |
| Instruments – Controls – 0.1% | | | | | | |
| | 3,400 | | | Honeywell International, Inc. | | | 184,790 | | | |
| Instruments – Scientific – 0.3% | | | | | | |
| | 3,000 | | | Thermo Fisher Scientific, Inc.* | | | 134,910 | | | |
| | 10,900 | | | Waters Corp.* | | | 807,145 | | | |
| | | | | | | | 942,055 | | | |
| Insurance Brokers – 0.9% | | | | | | |
| | 49,600 | | | AON Corp. | | | 2,321,280 | | | |
| | 13,900 | | | Marsh & McLennan Cos., Inc. | | | 439,518 | | | |
| | | | | | | | 2,760,798 | | | |
| Internet Infrastructure Software – 0% | | | | | | |
| | 700 | | | F5 Networks, Inc.* | | | 74,284 | | | |
| Investment Management and Advisory Services – 0.6% | | | | | | |
| | 18,200 | | | Ameriprise Financial, Inc. | | | 903,448 | | | |
| | 8,800 | | | Franklin Resources, Inc. | | | 845,328 | | | |
| | 800 | | | T. Rowe Price Group, Inc. | | | 45,560 | | | |
| | | | | | | | 1,794,336 | | | |
| Life and Health Insurance – 0.2% | | | | | | |
| | 1,200 | | | Aflac, Inc. | | | 51,912 | | | |
| | 2,800 | | | Prudential Financial, Inc. | | | 140,336 | | | |
| | 2,700 | | | Torchmark Corp. | | | 117,153 | | | |
| | 9,800 | | | Unum Group | | | 206,486 | | | |
| | | | | | | | 515,887 | | | |
| Linen Supply & Related Items – 0.1% | | | | | | |
| | 4,200 | | | Cintas Corp. | | | 146,202 | | | |
| Machinery – Construction and Mining – 1.5% | | | | | | |
| | 48,900 | | | Caterpillar, Inc. | | | 4,430,340 | | | |
| | 1,800 | | | Joy Global, Inc. | | | 134,946 | | | |
| | | | | | | | 4,565,286 | | | |
| Machinery – Farm – 0% | | | | | | |
| | 1,400 | | | Deere & Co. | | | 108,290 | | | |
| Machinery – Pumps – 0% | | | | | | |
| | 3,800 | | | Xylem, Inc. | | | 97,622 | | | |
| Medical – Biomedical and Genetic – 0.7% | | | | | | |
| | 19,100 | | | Biogen Idec, Inc.* | | | 2,101,955 | | | |
| | 1,700 | | | Celgene Corp.* | | | 114,920 | | | |
| | 2,300 | | | Gilead Sciences, Inc.* | | | 94,139 | | | |
| | | | | | | | 2,311,014 | | | |
| Medical – Drugs – 2.2% | | | | | | |
| | 8,600 | | | Abbott Laboratories | | | 483,578 | | | |
| | 15,200 | | | Allergan, Inc. | | | 1,333,648 | | | |
| | 35,300 | | | Bristol-Myers Squibb Co. | | | 1,243,972 | | | |
| | 22,600 | | | Eli Lilly & Co. | | | 939,256 | | | |
| | 18,700 | | | Forest Laboratories, Inc.* | | | 565,862 | | | |
| | 13,800 | | | Johnson & Johnson | | | 905,004 | | | |
| | 33,186 | | | Merck & Co., Inc. | | | 1,251,112 | | | |
| | | | | | | | 6,722,432 | | | |
| Medical – Generic Drugs – 0.5% | | | | | | |
| | 2,600 | | | Perrigo Co. | | | 252,980 | | | |
| | 19,200 | | | Watson Pharmaceuticals, Inc.* | | | 1,158,528 | | | |
| | | | | | | | 1,411,508 | | | |
| Medical – HMO – 2.2% | | | | | | |
| | 26,300 | | | Aetna, Inc. | | | 1,109,597 | | | |
| | 17,300 | | | Cigna Corp. | | | 726,600 | | | |
| | 29,600 | | | Coventry Health Care, Inc.* | | | 898,952 | | | |
| | 22,700 | | | Humana, Inc. | | | 1,988,747 | | | |
| | 20,800 | | | UnitedHealth Group, Inc. | | | 1,054,144 | | | |
| | 15,100 | | | WellPoint, Inc. | | | 1,000,375 | | | |
| | | | | | | | 6,778,415 | | | |
| Medical – Hospitals – 0% | | | | | | |
| | 21,400 | | | Tenet Healthcare Corp.* | | | 109,782 | | | |
| Medical – Wholesale Drug Distributors – 2.9% | | | | | | |
| | 99,600 | | | AmerisourceBergen Corp. | | | 3,704,124 | | | |
| | 102,300 | | | Cardinal Health, Inc. | | | 4,154,403 | | | |
| | 14,800 | | | McKesson Corp. | | | 1,153,068 | | | |
| | | | | | | | 9,011,595 | | | |
| Medical Information Systems – 0.7% | | | | | | |
| | 34,800 | | | Cerner Corp.* | | | 2,131,500 | | | |
| Medical Instruments – 1.0% | | | | | | |
| | 65,300 | | | Boston Scientific Corp.* | | | 348,702 | | | |
| | 3,500 | | | Edwards Lifesciences Corp.* | | | 247,450 | | | |
| | 3,700 | | | Intuitive Surgical, Inc.* | | | 1,713,137 | | | |
| | 19,100 | | | St. Jude Medical, Inc. | | | 655,130 | | | |
| | | | | | | | 2,964,419 | | | |
| Medical Products – 1.1% | | | | | | |
| | 12,400 | | | Baxter International, Inc. | | | 613,552 | | | |
| | 1,300 | | | Carefusion Corp.* | | | 33,033 | | | |
| | 34,600 | | | Covidien PLC (U.S. Shares) | | | 1,557,346 | | | |
| | 11,600 | | | Stryker Corp. | | | 576,636 | | | |
| | 700 | | | Varian Medical Systems, Inc.* | | | 46,991 | | | |
| | 9,500 | | | Zimmer Holdings, Inc. | | | 507,490 | | | |
| | | | | | | | 3,335,048 | | | |
| Metal – Copper – 0% | | | | | | |
| | 3,300 | | | Freeport-McMoRan Copper & Gold, Inc. – Class B | | | 121,407 | | | |
| Metal – Iron – 0% | | | | | | |
| | 1,500 | | | Cliffs Natural Resources, Inc. | | | 93,525 | | | |
See Notes to Schedules of Investments and Financial Statements.
Janus Mathematical Funds | 33
INTECH U.S. Core Fund
Schedule of Investments (unaudited)
As of December 31, 2011
| | | | | | | | | | | |
| Shares | | Value | | | |
| |
| Metal Processors and Fabricators – 0.2% | | | | | | |
| | 4,300 | | | Precision Castparts Corp. | | $ | 708,597 | | | |
| Motorcycle and Motor Scooter Manufacturing – 0% | | | | | | |
| | 2,100 | | | Harley-Davidson, Inc. | | | 81,627 | | | |
| Multi-Line Insurance – 0.2% | | | | | | |
| | 2,200 | | | ACE, Ltd. (U.S. Shares) | | | 154,264 | | | |
| | 1,400 | | | Assurant, Inc. | | | 57,484 | | | |
| | 43,500 | | | Genworth Financial, Inc. – Class A* | | | 284,925 | | | |
| | 6,500 | | | Hartford Financial Services Group, Inc. | | | 105,625 | | | |
| | 7,300 | | | XL Capital, Ltd. | | | 144,321 | | | |
| | | | | | | | 746,619 | | | |
| Multimedia – 0.8% | | | | | | |
| | 14,800 | | | McGraw-Hill Cos., Inc. | | | 665,556 | | | |
| | 11,300 | | | Time Warner, Inc. | | | 408,382 | | | |
| | 31,000 | | | Viacom, Inc. – Class B | | | 1,407,710 | | | |
| | | | | | | | 2,481,648 | | | |
| Non-Hazardous Waste Disposal – 0.2% | | | | | | |
| | 16,800 | | | Waste Management, Inc. | | | 549,528 | | | |
| Oil – Field Services – 1.4% | | | | | | |
| | 15,300 | | | Baker Hughes, Inc. | | | 744,192 | | | |
| | 8,400 | | | Halliburton Co. | | | 289,884 | | | |
| | 49,147 | | | Schlumberger, Ltd. (U.S. Shares) | | | 3,357,232 | | | |
| | | | | | | | 4,391,308 | | | |
| Oil and Gas Drilling – 0.2% | | | | | | |
| | 3,400 | | | Helmerich & Payne, Inc. | | | 198,424 | | | |
| | 3,900 | | | Nabors Industries, Ltd.* | | | 67,626 | | | |
| | 8,000 | | | Noble Corp. | | | 241,760 | | | |
| | | | | | | | 507,810 | | | |
| Oil Companies – Exploration and Production – 2.4% | | | | | | |
| | 11,100 | | | Cabot Oil & Gas Corp. | | | 842,490 | | | |
| | 105,200 | | | Chesapeake Energy Corp. | | | 2,344,908 | | | |
| | 5,900 | | | Devon Energy Corp. | | | 365,800 | | | |
| | 22,800 | | | EQT Corp. | | | 1,249,212 | | | |
| | 28,100 | | | Pioneer Natural Resources Co. | | | 2,514,388 | | | |
| | 1,500 | | | Southwestern Energy Co.* | | | 47,910 | | | |
| | | | | | | | 7,364,708 | | | |
| Oil Companies – Integrated – 4.3% | | | | | | |
| | 29,830 | | | Chevron Corp. | | | 3,173,912 | | | |
| | 14,400 | | | ConocoPhillips | | | 1,049,328 | | | |
| | 48,700 | | | Exxon Mobil Corp. | | | 4,127,812 | | | |
| | 8,600 | | | Hess Corp. | | | 488,480 | | | |
| | 98,600 | | | Marathon Oil Corp. | | | 2,886,022 | | | |
| | 50,200 | | | Marathon Petroleum Corp. | | | 1,671,158 | | | |
| | | | | | | | 13,396,712 | | | |
| Oil Field Machinery and Equipment – 1.3% | | | | | | |
| | 61,100 | | | National Oilwell Varco, Inc. | | | 4,154,189 | | | |
| Oil Refining and Marketing – 0.2% | | | | | | |
| | 17,300 | | | Tesoro Corp.* | | | 404,128 | | | |
| | 2,600 | | | Valero Energy Corp. | | | 54,730 | | | |
| | | | | | | | 458,858 | | | |
| Paper and Related Products – 0.4% | | | | | | |
| | 37,400 | | | MeadWestvaco Corp. | | | 1,120,130 | | | |
| Pipelines – 3.4% | | | | | | |
| | 101,600 | | | El Paso Corp. | | | 2,699,512 | | | |
| | 53,000 | | | Oneok, Inc. | | | 4,594,570 | | | |
| | 103,600 | | | Williams Cos., Inc. | | | 3,420,872 | | | |
| | | | | | | | 10,714,954 | | | |
| Printing – Commercial – 0% | | | | | | |
| | 5,900 | | | R.R. Donnelley & Sons Co. | | | 85,137 | | | |
| Property and Casualty Insurance – 0.7% | | | | | | |
| | 6,600 | | | Chubb Corp. | | | 456,852 | | | |
| | 34,400 | | | Progressive Corp. | | | 671,144 | | | |
| | 16,600 | | | Travelers Cos., Inc. | | | 982,222 | | | |
| | | | | | | | 2,110,218 | | | |
| Publishing – Newspapers – 0.3% | | | | | | |
| | 9,000 | | | Gannett Co., Inc. | | | 120,330 | | | |
| | 2,300 | | | Washington Post Co. – Class B | | | 866,663 | | | |
| | | | | | | | 986,993 | | | |
| Quarrying – 0% | | | | | | |
| | 1,800 | | | Vulcan Materials Co. | | | 70,830 | | | |
| Real Estate Management/Services – 0% | | | | | | |
| | 9,500 | | | CBRE Group, Inc.* | | | 144,590 | | | |
| REIT – Apartments – 0.9% | | | | | | |
| | 12,800 | | | Avalonbay Communities, Inc. | | | 1,671,680 | | | |
| | 18,900 | | | Equity Residential | | | 1,077,867 | | | |
| | | | | | | | 2,749,547 | | | |
| REIT – Diversified – 0.5% | | | | | | |
| | 75,200 | | | Weyerhaeuser Co. | | | 1,403,984 | | | |
| REIT – Health Care – 0% | | | | | | |
| | 2,500 | | | Heath Care REIT, Inc. | | | 136,325 | | | |
| REIT – Office Property – 0.4% | | | | | | |
| | 11,900 | | | Boston Properties, Inc. | | | 1,185,240 | | | |
| REIT – Regional Malls – 0.4% | | | | | | |
| | 9,000 | | | Simon Property Group, Inc. | | | 1,160,460 | | | |
| REIT – Storage – 0.4% | | | | | | |
| | 9,100 | | | Public Storage | | | 1,223,586 | | | |
| Retail – Apparel and Shoe – 0.8% | | | | | | |
| | 5,900 | | | Abercrombie & Fitch Co. – Class A | | | 288,156 | | | |
| | 38,900 | | | Limited Brands, Inc. | | | 1,569,615 | | | |
| | 14,400 | | | Ross Stores, Inc. | | | 684,432 | | | |
| | | | | | | | 2,542,203 | | | |
| Retail – Auto Parts – 1.1% | | | | | | |
| | 9,700 | | | AutoZone, Inc.* | | | 3,152,209 | | | |
| | 4,400 | | | O’Reilly Automotive, Inc.* | | | 351,780 | | | |
| | | | | | | | 3,503,989 | | | |
| Retail – Automobile – 0.3% | | | | | | |
| | 15,100 | | | AutoNation, Inc.* | | | 556,737 | | | |
| | 7,400 | | | Carmax, Inc.* | | | 225,552 | | | |
| | | | | | | | 782,289 | | | |
| Retail – Bedding – 0.2% | | | | | | |
| | 10,200 | | | Bed Bath & Beyond, Inc.* | | | 591,294 | | | |
| Retail – Building Products – 0% | | | | | | |
| | 2,200 | | | Home Depot, Inc. | | | 92,488 | | | |
| Retail – Computer Equipment – 0.2% | | | | | | |
| | 19,900 | | | GameStop Corp. – Class A* | | | 480,187 | | | |
See Notes to Schedules of Investments and Financial Statements.
34 | DECEMBER 31, 2011
Schedule of Investments (unaudited)
As of December 31, 2011
| | | | | | | | | | | |
| Shares | | Value | | | |
| |
| Retail – Discount – 0.8% | | | | | | |
| | 14,900 | | | Big Lots, Inc.* | | $ | 562,624 | | | |
| | 6,600 | | | Costco Wholesale Corp. | | | 549,912 | | | |
| | 3,400 | | | Dollar Tree, Inc.* | | | 282,574 | | | |
| | 15,700 | | | Family Dollar Stores, Inc. | | | 905,262 | | | |
| | 1,600 | | | Target Corp. | | | 81,952 | | | |
| | | | | | | | 2,382,324 | | | |
| Retail – Drug Store – 1.1% | | | | | | |
| | 14,700 | | | CVS Caremark Corp. | | | 599,466 | | | |
| | 85,800 | | | Walgreen Co. | | | 2,836,548 | | | |
| | | | | | | | 3,436,014 | | | |
| Retail – Jewelry – 0.2% | | | | | | |
| | 8,700 | | | Tiffany & Co. | | | 576,462 | | | |
| Retail – Major Department Stores – 1.5% | | | | | | |
| | 10,300 | | | JC Penney Co., Inc. | | | 362,045 | | | |
| | 2,500 | | | Nordstrom, Inc. | | | 124,275 | | | |
| | 9,100 | | | Sears Holdings Corp.* | | | 289,198 | | | |
| | 61,300 | | | TJX Cos., Inc. | | | 3,956,915 | | | |
| | | | | | | | 4,732,433 | | | |
| Retail – Regional Department Stores – 0.1% | | | | | | |
| | 11,500 | | | Macy’s, Inc. | | | 370,070 | | | |
| Retail – Restaurants – 3.1% | | | | | | |
| | 300 | | | Chipotle Mexican Grill, Inc. – Class A* | | | 101,322 | | | |
| | 900 | | | Darden Restaurants, Inc. | | | 41,022 | | | |
| | 23,900 | | | McDonald’s Corp. | | | 2,397,887 | | | |
| | 74,400 | | | Starbucks Corp. | | | 3,423,144 | | | |
| | 64,100 | | | Yum! Brands, Inc. | | | 3,782,541 | | | |
| | | | | | | | 9,745,916 | | | |
| Rubber – Tires – 0.1% | | | | | | |
| | 18,000 | | | Goodyear Tire & Rubber Co.* | | | 255,060 | | | |
| Savings/Loan/Thrifts – 0% | | | | | | |
| | 4,600 | | | People’s United Financial, Inc. | | | 59,110 | | | |
| Schools – 0.4% | | | | | | |
| | 10,000 | | | Apollo Group, Inc. – Class A* | | | 538,700 | | | |
| | 15,200 | | | Devry, Inc. | | | 584,592 | | | |
| | | | | | | | 1,123,292 | | | |
| Semiconductor Components/Integrated Circuits – 0.3% | | | | | | |
| | 14,600 | | | Qualcomm, Inc. | | | 798,620 | | | |
| Semiconductor Equipment – 0% | | | | | | |
| | 6,100 | | | Teradyne, Inc.* | | | 83,143 | | | |
| Super-Regional Banks – 0.5% | | | | | | |
| | 4,500 | | | Capital One Financial Corp. | | | 190,305 | | | |
| | 27,400 | | | Fifth Third Bancorp. | | | 348,528 | | | |
| | 32,300 | | | Huntington Bancshares, Inc. | | | 177,327 | | | |
| | 37,700 | | | Keycorp | | | 289,913 | | | |
| | 12,600 | | | U.S. Bancorp. | | | 340,830 | | | |
| | 4,980 | | | Wells Fargo & Co. | | | 137,249 | | | |
| | | | | | | | 1,484,152 | | | |
| Telephone – Integrated – 1.5% | | | | | | |
| | 12,658 | | | AT&T, Inc. | | | 382,778 | | | |
| | 108,485 | | | CenturyLink, Inc. | | | 4,035,642 | | | |
| | 19,500 | | | Windstream Corp. | | | 228,930 | | | |
| | | | | | | | 4,647,350 | | | |
| Television – 0.6% | | | | | | |
| | 71,200 | | | CBS Corp. – Class B | | | 1,932,368 | | | |
| Tobacco – 3.3% | | | | | | |
| | 95,700 | | | Altria Group, Inc. | | | 2,837,505 | | | |
| | 13,200 | | | Lorillard, Inc. | | | 1,504,800 | | | |
| | 31,200 | | | Philip Morris International, Inc. | | | 2,448,576 | | | |
| | 79,800 | | | Reynolds American, Inc. | | | 3,305,316 | | | |
| | | | | | | | 10,096,197 | | | |
| Tools – Hand Held – 1.1% | | | | | | |
| | 50,027 | | | Stanley Works | | | 3,381,825 | | | |
| Toys – 0.1% | | | | | | |
| | 13,200 | | | Mattel, Inc. | | | 366,432 | | | |
| Transportation – Railroad – 0.5% | | | | | | |
| | 53,800 | | | CSX Corp. | | | 1,133,028 | | | |
| | 5,700 | | | Norfolk Southern Corp. | | | 415,302 | | | |
| | | | | | | | 1,548,330 | | | |
| Transportation – Services – 1.3% | | | | | | |
| | 26,300 | | | C.H. Robinson Worldwide, Inc. | | | 1,835,214 | | | |
| | 5,300 | | | Expeditors International of Washington, Inc. | | | 217,088 | | | |
| | 21,000 | | | FedEx Corp. | | | 1,753,710 | | | |
| | 1,600 | | | Ryder System, Inc. | | | 85,024 | | | |
| | | | | | | | 3,891,036 | | | |
| Vitamins and Nutrition Products – 0.3% | | | | | | |
| | 12,800 | | | Mead Johnson Nutrition Co. – Class A | | | 879,744 | | | |
| Web Portals/Internet Service Providers – 1.5% | | | | | | |
| | 7,000 | | | Google, Inc. – Class A* | | | 4,521,300 | | | |
| Wireless Equipment – 1.4% | | | | | | |
| | 53,600 | | | American Tower Corp. – Class A | | | 3,216,536 | | | |
| | 1,537 | | | Motorola Mobility Holdings, Inc.* | | | 59,636 | | | |
| | 23,957 | | | Motorola, Inc. | | | 1,108,969 | | | |
| | | | | | | | 4,385,141 | | | |
| |
| |
| Total Common Stock (cost $268,272,219) | | | 309,299,988 | | | |
| |
| |
| Money Market – 0.5% | | | | | | |
| | 1,545,554 | | | Janus Cash Liquidity Fund LLC, 0%
(cost $1,545,554) | | | 1,545,554 | | | |
| |
| |
| Total Investments (total cost $269,817,773) – 100.0% | | | 310,845,542 | | | |
| |
| |
| Cash, Receivables and Other Assets, net of Liabilities – 0.0% | | | 49,292 | | | |
| |
| |
| Net Assets – 100% | | $ | 310,894,834 | | | |
| |
| |
Summary of Investments by Country – (Long Positions)
| | | | | | | | | |
| | | | | | % of Investment
| |
| Country | | Value | | | Securities | |
| |
| |
| Bermuda | | $ | 67,626 | | | | 0.0% | |
| Curacao | | | 3,357,232 | | | | 1.1% | |
| Ireland | | | 2,789,859 | | | | 0.9% | |
| Switzerland | | | 1,099,674 | | | | 0.4% | |
United States†† | | | 303,531,151 | | | | 97.6% | |
| |
| |
| Total | | $ | 310,845,542 | | | | 100.0% | |
| | | |
| †† | | Includes Cash Equivalents (97.1% excluding Cash Equivalents). |
See Notes to Schedules of Investments and Financial Statements.
Janus Mathematical Funds | 35
INTECH U.S. Growth Fund (unaudited)
| | | | | | | |
Fund Snapshot
INTECH’s active approach focuses on adding value by selecting stocks with unique volatility characteristics and low correlations to one another.
| | | | | | Managed by
INTECH Investment
Management LLC |
Performance Overview
For the six-month period ended December 31, 2011, INTECH U.S. Growth Fund returned -6.40% for its Class S Shares. This compares to the -3.92% return posted by the Russell 1000 Growth Index, the Fund’s benchmark.
Investment Strategy
INTECH’s mathematical investing process seeks to build a more efficient portfolio than its benchmark. The process seeks to minimize tracking error for a target level of excess return. In doing so, the process does not attempt to predict the direction of the market, nor does it have a view of any particular company in the portfolio. Instead, it employs a proprietary optimization process to build portfolios with the potential to outperform the index by capturing stocks’ natural volatility.
Within specific risk controls, INTECH’s disciplined mathematical process establishes target proportional weightings for stocks in the portfolio as a result of an optimization routine. Once the weights are determined and the portfolio is constructed, it is rebalanced and re-optimized on a periodic basis. By limiting the distance any one stock position can deviate from its benchmark weight, INTECH’s process attempts to control the relative risk of the portfolio. We believe that instituting an investment process aimed at providing consistent, positive excess returns at benchmark-like risk, will allow us to meet our investors’ objectives while minimizing the risk of significant underperformance relative to the benchmark.
Outlook
Going forward, we will continue building portfolios in a disciplined and deliberate manner, with risk management remaining the hallmark of our investment process. While we may experience short periods of underperformance, we expect to exceed the benchmark over a three- to five-year time horizon. As INTECH’s ongoing research efforts yield modest improvements, we will continue implementing changes that we believe are likely to improve the long-term results for our clients.
Thank you for your investment in INTECH U.S. Growth Fund.
36 | DECEMBER 31, 2011
(unaudited)
INTECH U.S. Growth Fund At A Glance
5 Largest Equity Holdings – (% of Net Assets)
As of December 31, 2011
| | | | | |
International Business Machines Corp.
Computer Services | | | 3.1% | |
Exxon Mobil Corp.
Oil Companies – Integrated | | | 2.5% | |
Apple, Inc.
Computers | | | 2.3% | |
Coca-Cola Co.
Beverages – Non-Alcoholic | | | 1.1% | |
Philip Morris International, Inc.
Tobacco | | | 1.1% | |
| | | | | |
| | | | 10.1% | |
Asset Allocation – (% of Net Assets)
As of December 31, 2011
Emerging markets comprised 0.4% of total net assets.
Top Country Allocations – Long Positions (% of Investment Securities)
As of December 31, 2011
Janus Mathematical Funds | 37
INTECH U.S. Growth Fund (unaudited)
| | | | | | | | | | | | | | |
| Average Annual Total Return – for the periods ended December 31, 2011 | | | Expense Ratios – per the October 28, 2011 prospectuses |
| | | Fiscal
| | One
| | Five
| | Since
| | | Total Annual Fund
| | Net Annual Fund
|
| | | Year-to-Date | | Year | | Year | | Inception* | | | Operating Expenses | | Operating Expenses |
| | | | | | | | | | | | | | |
| INTECH U.S. Growth Fund – Class A Shares | | | | | | | | | | | | | |
| | | | | | | | | | | | | | |
| NAV | | –6.26% | | 2.09% | | 0.28% | | 5.44% | | | 0.87% | | 0.87% |
| | | | | | | | | | | | | | |
| MOP | | –11.66% | | –3.80% | | –0.91% | | 4.96% | | | | | |
| | | | | | | | | | | | | | |
| INTECH U.S. Growth Fund – Class C Shares | | | | | | | | | | | | | |
| | | | | | | | | | | | | | |
| NAV | | –6.63% | | 1.28% | | –0.56% | | 4.84% | | | 1.72% | | 1.72% |
| | | | | | | | | | | | | | |
| CDSC | | –7.56% | | 0.27% | | –0.56% | | 4.84% | | | | | |
| | | | | | | | | | | | | | |
| INTECH U.S. Growth Fund – Class I Shares | | –6.11% | | 2.23% | | 0.53% | | 5.44% | | | 0.64% | | 0.64% |
| | | | | | | | | | | | | | |
| INTECH U.S. Growth Fund – Class S Shares | | –6.40% | | 1.73% | | 0.07% | | 5.44% | | | 1.08% | | 1.08% |
| | | | | | | | | | | | | | |
| INTECH U.S. Growth Fund – Class T Shares | | –6.23% | | 2.03% | | 0.07% | | 5.44% | | | 0.79% | | 0.79% |
| | | | | | | | | | | | | | |
| Russell 1000® Growth Index | | –3.92% | | 2.64% | | 2.50% | | 6.30% | | | | | |
| | | | | | | | | | | | | | |
| Lipper Quartile – Class S Shares | | – | | 1st | | 3rd | | 4th | | | | | |
| | | | | | | | | | | | | | |
| Lipper Ranking – based on total returns for Multi-Cap Growth Funds | | – | | 75/510 | | 215/347 | | 206/262 | | | | | |
| | | | | | | | | | | | | | |
| Visit janus.com/advisor/mutual-funds to view current performance and characteristic information | | | | | |
| | | | | | | | | | | | | | |
Data presented represents past performance, which is no guarantee of future results. Investment results and principal value will fluctuate so that shares, when redeemed, may be worth more or less than their original cost. Due to market volatility, current performance may be higher or lower than the performance shown. Call 877.33JANUS(52687) or visit janus.com/advisor/mutual-funds for performance current to the most recent month-end.
Performance shown for Class A Shares at Maximum Offering Price (MOP) includes the Fund’s maximum sales charge of 5.75%. Performance shown at Net Asset Value (NAV) does not include this charge and would have been lower had this charge been taken into account.
See important disclosures on the next page.
38 | DECEMBER 31, 2011
(unaudited)
Performance shown for Class C Shares includes a 1% contingent deferred sales charge (CDSC) on periods of less than 12 months. Performance shown at Net Asset Value (NAV) does not include this sales charge and would have been lower had this sales charge been taken into account.
For Class I Shares, Class S Shares, and Class T Shares, a 2% redemption fee may be imposed on shares held for 90 days or less. Performance shown does not reflect this redemption fee and, if reflected, performance would have been lower.
Janus Capital has contractually agreed to waive the Fund’s total annual fund operating expenses allocated to any class (excluding the distribution and shareholder servicing fees (applicable to Class A Shares, Class C Shares, and Class S Shares), administrative services fees payable pursuant to the Transfer Agency Agreement (except for networking and omnibus fees), brokerage commissions, interest, dividends, taxes, acquired fund fees and expenses, and extraordinary expenses) to certain limits until at least November 1, 2012. The contractual waiver may be terminated or modified prior to this date only at the discretion of the Board of Trustees. Returns shown include fee waivers, if any, and without such waivers, returns would have been lower.
The expense information shown was determined based on net assets as of the fiscal period ended June 30, 2011. The effect of contractual waivers agreed to by Janus Capital, when applicable, are reflected under “Net Annual Fund Operating Expenses.” (All expenses are shown without the effect of expense offset arrangements. Pursuant to such arrangements, credits realized as a result of uninvested cash balances are used to reduce custodian and transfer agent expenses.)
The proprietary mathematical process used by INTECH Investment Management LLC (“INTECH”) may not achieve the desired results. The rebalancing techniques used by the Fund may result in a higher portfolio turnover rate, higher expenses and potentially higher net taxable gains or losses compared to a “buy and hold” or index fund strategy.
The Fund’s performance may be affected by risks that include those associated with investments in specific industries or countries and potential conflicts of interest with the Janus “funds of funds.” Additional risks to the Fund may include those associated with investing in foreign securities, initial public offerings (“IPOs”), real estate investment trusts (“REITs”), and derivatives. Please see a Janus prospectus or janus.com/info for more information about risks, portfolio holdings and other details.
The Fund invests in REITs, which may be subject to a higher degree of market risk because of concentration in a specific industry, sector or geographic region. REITs may be subject to risks including, but not limited to: legal, political, liquidity, and interest rate risks, a decline in the value of real estate, risks related to general and economic conditions, changes in the value of the underlying property owned by the trust and defaults by borrowers. To the extent the Fund invests in foreign REITs, the Fund may be subject to fluctuations in currency rates or political or economic conditions in a particular country.
The Fund will normally invest at least 80% of its net assets, measured at the time of purchase, in the type of securities described by its name.
Returns include reinvestment of dividends from net investment income and distributions from capital gains. The returns shown do not reflect the deduction of taxes that a shareholder would pay on Fund distributions or the redemption of Fund shares. The returns do not include adjustments in accordance with generally accepted accounting principles required at the period end for financial reporting purposes.
Class A Shares, Class C Shares, Class I Shares, Class S Shares and Class T Shares of the Fund commenced operations on July 6, 2009. The historical performance shown for periods prior to July 6, 2009 was calculated using the performance and the fees and expenses of one or more other share classes of a predecessor fund(s), accounting for, when applicable and permitted, any fee and expense limitations and waivers. If each respective share class of the Fund had been available during periods prior to July 6, 2009, the performance shown may have been different. Please refer to the Fund’s prospectus for further details concerning historical performance.
Lipper, a wholly-owned subsidiary of Thomson Reuters, provides independent insight on global collective investments including mutual funds, retirement funds, hedge funds, fund fees and expenses to the asset management and media communities. Lipper ranks the performance of mutual funds within a classification of funds that have similar investment objectives. Rankings are historical with capital gains and dividends reinvested and do not include the effect of loads.
Ranking is for Class S Shares only; other classes may have different performance characteristics. When an expense waiver is in effect, it may have a material effect on the total return, and therefore the ranking for the period.
There is no assurance that the investment process will consistently lead to successful investing.
See Notes to Schedules of Investments for index definitions.
The weighting of securities within the portfolio may differ significantly from the weightings within the index. The index is unmanaged and is not available for direct investment; therefore, its performance does not reflect the expenses associated with the active management of an actual portfolio.
Effective December 7, 2011, INTECH Risk-Managed Growth Fund changed its name to INTECH U.S. Growth Fund.
See “Explanations of Charts, Tables and Financial Statements.”
| | | |
| * | | The predecessor Fund’s inception date – January 2, 2003 |
Janus Mathematical Funds | 39
INTECH U.S. Growth Fund (unaudited)
The examples below show you the ongoing costs (in dollars) of investing in your Fund and allow you to compare these costs with those of other mutual funds. Please refer to the section Useful Information About Your Fund Report for a detailed explanation of the information presented in these charts.
| | | | | | | | | | | | | | | |
| | | Beginning Account Value
| | Ending Account Value
| | Expenses Paid During Period
| | |
| Expense Example – Class A Shares | | (7/1/11) | | (12/31/11) | | (7/1/11 - 12/31/11)† | | |
| |
| |
| Actual | | $ | 1,000.00 | | | $ | 937.40 | | | $ | 4.29 | | | |
| |
| |
Hypothetical
(5% return before expenses) | | $ | 1,000.00 | | | $ | 1,020.71 | | | $ | 4.47 | | | |
| |
| |
| | | | | | | | | | | | | | | |
| | | | | | | | | | | | | | | |
| | | Beginning Account Value
| | Ending Account Value
| | Expenses Paid During Period
| | |
| Expense Example – Class C Shares | | (7/1/11) | | (12/31/11) | | (7/1/11 - 12/31/11)† | | |
| |
| |
| Actual | | $ | 1,000.00 | | | $ | 933.70 | | | $ | 8.46 | | | |
| |
| |
Hypothetical
(5% return before expenses) | | $ | 1,000.00 | | | $ | 1,016.39 | | | $ | 8.82 | | | |
| |
| |
| | | | | | | | | | | | | | | |
| | | | | | | | | | | | | | | |
| | | Beginning Account Value
| | Ending Account Value
| | Expenses Paid During Period
| | |
| Expense Example – Class I Shares | | (7/1/11) | | (12/31/11) | | (7/1/11 - 12/31/11)† | | |
| |
| |
| Actual | | $ | 1,000.00 | | | $ | 938.90 | | | $ | 3.17 | | | |
| |
| |
Hypothetical
(5% return before expenses) | | $ | 1,000.00 | | | $ | 1,021.87 | | | $ | 3.30 | | | |
| |
| |
| | | | | | | | | | | | | | | |
| | | | | | | | | | | | | | | |
| | | Beginning Account Value
| | Ending Account Value
| | Expenses Paid During Period
| | |
| Expense Example – Class S Shares | | (7/1/11) | | (12/31/11) | | (7/1/11 - 12/31/11)† | | |
| |
| |
| Actual | | $ | 1,000.00 | | | $ | 936.00 | | | $ | 5.30 | | | |
| |
| |
Hypothetical
(5% return before expenses) | | $ | 1,000.00 | | | $ | 1,019.66 | | | $ | 5.53 | | | |
| |
| |
| | | | | | | | | | | | | | | |
| | | | | | | | | | | | | | | |
| | | Beginning Account Value
| | Ending Account Value
| | Expenses Paid During Period
| | |
| Expense Example – Class T Shares | | (7/1/11) | | (12/31/11) | | (7/1/11 - 12/31/11)† | | |
| |
| |
| Actual | | $ | 1,000.00 | | | $ | 937.70 | | | $ | 4.09 | | | |
| |
| |
Hypothetical
(5% return before expenses) | | $ | 1,000.00 | | | $ | 1,020.91 | | | $ | 4.27 | | | |
| |
| |
| | | |
| † | | Expenses are equal to the annualized expense ratio of 0.88% for Class A Shares, 1.74% for Class C Shares, 0.65% for Class I Shares, 1.09% for Class S Shares and 0.84% for Class T Shares multiplied by the average account value over the period, multiplied by 184/366 (to reflect the one-half year period). Expenses include effect of contractual waivers by Janus Capital. |
40 | DECEMBER 31, 2011
INTECH U.S. Growth Fund
Schedule of Investments (unaudited)
As of December 31, 2011
| | | | | | | | | | | |
| Shares | | Value | | | |
| |
| Common Stock – 99.5% | | | | | | |
| Advertising Agencies – 0.1% | | | | | | |
| | 7,500 | | | Omnicom Group, Inc. | | $ | 334,350 | | | |
| Aerospace and Defense – 1.1% | | | | | | |
| | 8,700 | | | Boeing Co. | | | 638,145 | | | |
| | 6,600 | | | Lockheed Martin Corp. | | | 533,940 | | | |
| | 24,500 | | | TransDigm Group, Inc.* | | | 2,344,160 | | | |
| | | | | | | | 3,516,245 | | | |
| Aerospace and Defense – Equipment – 1.3% | | | | | | |
| | 13,400 | | | B.F. Goodrich Co. | | | 1,657,580 | | | |
| | 14,000 | | | BE Aerospace, Inc.* | | | 541,940 | | | |
| | 26,300 | | | United Technologies Corp. | | | 1,922,267 | | | |
| | | | | | | | 4,121,787 | | | |
| Agricultural Chemicals – 0.9% | | | | | | |
| | 9,200 | | | CF Industries Holdings, Inc. | | | 1,333,816 | | | |
| | 11,200 | | | Intrepid Potash, Inc.* | | | 253,456 | | | |
| | 14,200 | | | Monsanto Co. | | | 994,994 | | | |
| | 4,000 | | | Mosaic Co. | | | 201,720 | | | |
| | | | | | | | 2,783,986 | | | |
| Agricultural Operations – 0.1% | | | | | | |
| | 6,000 | | | Bunge, Ltd. | | | 343,200 | | | |
| Airlines – 0.4% | | | | | | |
| | 19,600 | | | Copa Holdings S.A. | | | 1,149,932 | | | |
| Apparel Manufacturers – 0.5% | | | | | | |
| | 11,200 | | | Coach, Inc. | | | 683,648 | | | |
| | 20,800 | | | Hanesbrands, Inc.* | | | 454,688 | | | |
| | 1,800 | | | Ralph Lauren Corp. | | | 248,544 | | | |
| | 900 | | | Under Armour, Inc. – Class A* | | | 64,611 | | | |
| | | | | | | | 1,451,491 | | | |
| Applications Software – 1.2% | | | | | | |
| | 1,400 | | | Citrix Systems, Inc.* | | | 85,008 | | | |
| | 3,500 | | | Intuit, Inc. | | | 184,065 | | | |
| | 95,800 | | | Microsoft Corp. | | | 2,486,968 | | | |
| | 23,900 | | | Nuance Communications, Inc.* | | | 601,324 | | | |
| | 6,000 | | | Red Hat, Inc.* | | | 247,740 | | | |
| | 600 | | | Salesforce.com, Inc.* | | | 60,876 | | | |
| | | | | | | | 3,665,981 | | | |
| Athletic Footwear – 0.2% | | | | | | |
| | 5,100 | | | NIKE, Inc. – Class B | | | 491,487 | | | |
| Automotive – Cars and Light Trucks – 0.1% | | | | | | |
| | 11,600 | | | Tesla Motors, Inc.* | | | 331,296 | | | |
| Automotive – Truck Parts and Equipment – Original – 0% | | | | | | |
| | 400 | | | BorgWarner, Inc.* | | | 25,496 | | | |
| Beverages – Non-Alcoholic – 2.4% | | | | | | |
| | 51,000 | | | Coca-Cola Co. | | | 3,568,470 | | | |
| | 66,200 | | | Coca-Cola Enterprises, Inc. | | | 1,706,636 | | | |
| | 9,200 | | | Dr. Pepper Snapple Group, Inc. | | | 363,216 | | | |
| | 18,500 | | | Hansen Natural Corp.* | | | 1,704,590 | | | |
| | 2,275 | | | PepsiCo, Inc. | | | 150,946 | | | |
| | | | | | | | 7,493,858 | | | |
| Beverages – Wine and Spirits – 0.3% | | | | | | |
| | 7,700 | | | Brown-Forman Corp. – Class B | | | 619,927 | | | |
| | 7,600 | | | Green Mountain Coffee Roasters, Inc.* | | | 340,860 | | | |
| | | | | | | | 960,787 | | | |
| Broadcast Services and Programming – 0% | | | | | | |
| | 3,000 | | | Discovery Holding Co. – Class A* | | | 122,910 | | | |
| Building – Heavy Construction – 0.1% | | | | | | |
| | 5,400 | | | Chicago Bridge & Iron Co. N.V. | | | 204,120 | | | |
| Cable/Satellite Television – 1.9% | | | | | | |
| | 3,100 | | | Charter Communications* | | | 176,514 | | | |
| | 77,000 | | | Comcast Corp. – Class A | | | 1,825,670 | | | |
| | 55,800 | | | DIRECTV – Class A* | | | 2,386,008 | | | |
| | 7,200 | | | DISH Network Corp. – Class A | | | 205,056 | | | |
| | 1,000 | | | Liberty Global, Inc. – Class A* | | | 41,030 | | | |
| | 21,700 | | | Time Warner Cable, Inc. – Class A | | | 1,379,469 | | | |
| | | | | | | | 6,013,747 | | | |
| Casino Hotels – 0.7% | | | | | | |
| | 14,100 | | | Las Vegas Sands Corp.* | | | 602,493 | | | |
| | 14,100 | | | Wynn Resorts, Ltd. | | | 1,557,909 | | | |
| | | | | | | | 2,160,402 | | | |
| Cellular Telecommunications – 0.1% | | | | | | |
| | 3,500 | | | MetroPCS Communications, Inc.* | | | 30,380 | | | |
| | 8,900 | | | N.I.I. Holdings, Inc.* | | | 189,570 | | | |
| | | | | | | | 219,950 | | | |
| Chemicals – Diversified – 1.0% | | | | | | |
| | 4,700 | | | Air Products & Chemicals, Inc. | | | 400,393 | | | |
| | 16,700 | | | Celanese Corp. – Class A | | | 739,309 | | | |
| | 19,700 | | | E.I. du Pont de Nemours & Co. | | | 901,866 | | | |
| | 3,900 | | | FMC Corp. | | | 335,556 | | | |
| | 6,300 | | | PPG Industries, Inc. | | | 525,987 | | | |
| | 7,200 | | | Rockwood Holdings, Inc.* | | | 283,464 | | | |
| | | | | | | | 3,186,575 | | | |
| Chemicals – Specialty – 1.0% | | | | | | |
| | 17,200 | | | Eastman Chemical Co. | | | 671,832 | | | |
| | 18,014 | | | Ecolab, Inc. | | | 1,041,389 | | | |
| | 14,500 | | | International Flavors & Fragrances, Inc. | | | 760,090 | | | |
| | 7,200 | | | Sigma-Aldrich Corp. | | | 449,712 | | | |
| | 5,800 | | | WR Grace & Co.* | | | 266,336 | | | |
| | | | | | | | 3,189,359 | | | |
| Coal – 0.1% | | | | | | |
| | 6,100 | | | Consol Energy, Inc. | | | 223,870 | | | |
| Coatings and Paint Products – 0.1% | | | | | | |
| | 3,900 | | | Valspar Corp. | | | 151,983 | | | |
| Commercial Services – 0.7% | | | | | | |
| | 39,000 | | | Iron Mountain, Inc. | | | 1,201,200 | | | |
| | 15,400 | | | Weight Watchers International, Inc. | | | 847,154 | | | |
| | | | | | | | 2,048,354 | | | |
| Commercial Services – Finance – 4.1% | | | | | | |
| | 17,300 | | | Alliance Data Systems Corp.* | | | 1,796,432 | | | |
| | 49,900 | | | Automatic Data Processing, Inc. | | | 2,695,099 | | | |
| | 2,100 | | | Equifax, Inc. | | | 81,354 | | | |
| | 22,100 | | | Global Payments, Inc. | | | 1,047,098 | | | |
| | 61,100 | | | H&R Block, Inc. | | | 997,763 | | | |
| | 6,300 | | | MasterCard, Inc. – Class A | | | 2,348,766 | | | |
| | 52,500 | | | Moody’s Corp. | | | 1,768,200 | | | |
| | 5,000 | | | Morningstar, Inc. | | | 297,250 | | | |
| | 13,400 | | | Paychex, Inc. | | | 403,474 | | | |
| | 13,700 | | | Visa, Inc. – Class A | | | 1,390,961 | | | |
| | | | | | | | 12,826,397 | | | |
See Notes to Schedules of Investments and Financial Statements.
Janus Mathematical Funds | 41
INTECH U.S. Growth Fund
Schedule of Investments (unaudited)
As of December 31, 2011
| | | | | | | | | | | |
| Shares | | Value | | | |
| |
| Computer Aided Design – 0.1% | | | | | | |
| | 4,700 | | | ANSYS, Inc.* | | $ | 269,216 | | | |
| | 4,400 | | | Autodesk, Inc.* | | | 133,452 | | | |
| | | | | | | | 402,668 | | | |
| Computer Services – 4.7% | | | | | | |
| | 40,900 | | | Accenture, Ltd. – Class A (U.S. Shares) | | | 2,177,107 | | | |
| | 37,000 | | | Cognizant Technology Solutions Corp.* | | | 2,379,470 | | | |
| | 4,200 | | | DST Systems, Inc. | | | 191,184 | | | |
| | 4,900 | | | IHS, Inc. – Class A* | | | 422,184 | | | |
| | 52,100 | | | International Business Machines Corp. | | | 9,580,148 | | | |
| | | | | | | | 14,750,093 | | | |
| Computers – 2.5% | | | | | | |
| | 17,700 | | | Apple, Inc.* | | | 7,168,500 | | | |
| | 39,000 | | | Dell, Inc.* | | | 570,570 | | | |
| | | | | | | | 7,739,070 | | | |
| Computers – Integrated Systems – 0.7% | | | | | | |
| | 3,200 | | | Micros Systems, Inc.* | | | 149,056 | | | |
| | 35,400 | | | NCR Corp.* | | | 582,684 | | | |
| | 31,900 | | | Teradata Corp.* | | | 1,547,469 | | | |
| | | | | | | | 2,279,209 | | | |
| Computers – Memory Devices – 0.4% | | | | | | |
| | 63,500 | | | EMC Corp.* | | | 1,367,790 | | | |
| Consulting Services – 0.8% | | | | | | |
| | 22,600 | | | Gartner, Inc.* | | | 785,802 | | | |
| | 32,700 | | | Genpact, Ltd.* | | | 488,865 | | | |
| | 4,300 | | | Towers Watson & Co. | | | 257,699 | | | |
| | 26,700 | | | Verisk Analytics, Inc.* | | | 1,071,471 | | | |
| | | | | | | | 2,603,837 | | | |
| Consumer Products – Miscellaneous – 0.8% | | | | | | |
| | 1,100 | | | Clorox Co. | | | 73,216 | | | |
| | 24,300 | | | Kimberly-Clark Corp. | | | 1,787,508 | | | |
| | 14,100 | | | Tupperware Brands Corp. | | | 789,177 | | | |
| | | | | | | | 2,649,901 | | | |
| Containers – Metal and Glass – 0.6% | | | | | | |
| | 38,500 | | | Ball Corp. | | | 1,374,835 | | | |
| | 18,300 | | | Crown Holdings, Inc.* | | | 614,514 | | | |
| | | | | | | | 1,989,349 | | | |
| Cosmetics and Toiletries – 2.1% | | | | | | |
| | 26,500 | | | Colgate-Palmolive Co. | | | 2,448,335 | | | |
| | 29,100 | | | Estee Lauder Cos., Inc. – Class A | | | 3,268,512 | | | |
| | 13,534 | | | Procter & Gamble Co. | | | 902,853 | | | |
| | | | | | | | 6,619,700 | | | |
| Data Processing and Management – 0.4% | | | | | | |
| | 23,400 | | | Broadridge Financial Solutions, Inc. | | | 527,670 | | | |
| | 11,200 | | | Fiserv, Inc.* | | | 657,888 | | | |
| | | | | | | | 1,185,558 | | | |
| Decision Support Software – 0.1% | | | | | | |
| | 8,800 | | | MSCI, Inc.* | | | 289,784 | | | |
| Dental Supplies and Equipment – 0.1% | | | | | | |
| | 8,000 | | | Dentsply International, Inc. | | | 279,920 | | | |
| | 3,900 | | | Patterson Cos., Inc. | | | 115,128 | | | |
| | | | | | | | 395,048 | | | |
| Diagnostic Kits – 0.3% | | | | | | |
| | 10,500 | | | Idexx Laboratories, Inc.* | | | 808,080 | | | |
| Disposable Medical Products – 0.3% | | | | | | |
| | 11,200 | | | C.R. Bard, Inc. | | | 957,600 | | | |
| Distribution/Wholesale – 1.8% | | | | | | |
| | 26,800 | | | Fastenal Co. | | | 1,168,748 | | | |
| | 12,100 | | | Fossil, Inc.* | | | 960,256 | | | |
| | 4,600 | | | Genuine Parts Co. | | | 281,520 | | | |
| | 15,700 | | | LKQ Corp.* | | | 472,256 | | | |
| | 14,100 | | | W.W. Grainger, Inc. | | | 2,639,379 | | | |
| | | | | | | | 5,522,159 | | | |
| Diversified Operations – 0.7% | | | | | | |
| | 23,500 | | | 3M Co. | | | 1,920,655 | | | |
| | 1,900 | | | Eaton Corp. | | | 82,707 | | | |
| | 4,100 | | | Illinois Tool Works, Inc. | | | 191,511 | | | |
| | 1,500 | | | Parker Hannifin Corp. | | | 114,375 | | | |
| | | | | | | | 2,309,248 | | | |
| E-Commerce/Products – 1.0% | | | | | | |
| | 9,900 | | | Amazon.com, Inc.* | | | 1,713,690 | | | |
| | 40,600 | | | eBay, Inc.* | | | 1,231,398 | | | |
| | 1,200 | | | Netflix, Inc.* | | | 83,148 | | | |
| | | | | | | | 3,028,236 | | | |
| E-Commerce/Services – 1.1% | | | | | | |
| | 30,250 | | | Expedia, Inc. | | | 877,855 | | | |
| | 4,000 | | | Priceline.com, Inc.* | | | 1,870,840 | | | |
| | 30,250 | | | TripAdvisor, Inc. | | | 762,602 | | | |
| | | | | | | | 3,511,297 | | | |
| Electric Products – Miscellaneous – 0.1% | | | | | | |
| | 4,900 | | | AMETEK, Inc. | | | 206,290 | | | |
| Electric – Transmission – 0.6% | | | | | | |
| | 23,300 | | | ITC Holdings Corp. | | | 1,768,004 | | | |
| Electronic Components – Miscellaneous – 0.1% | | | | | | |
| | 6,000 | | | Garmin, Ltd. | | | 238,860 | | | |
| | 3,900 | | | Jabil Circuit, Inc. | | | 76,674 | | | |
| | | | | | | | 315,534 | | | |
| Electronic Components – Semiconductors – 1.2% | | | | | | |
| | 4,000 | | | Altera Corp. | | | 148,400 | | | |
| | 9,800 | | | Avago Technologies, Ltd. | | | 282,828 | | | |
| | 11,100 | | | Broadcom Corp. – Class A | | | 325,896 | | | |
| | 11,900 | | | Intersil Corp. – Class A | | | 124,236 | | | |
| | 24,600 | | | Microchip Technology, Inc. | | | 901,098 | | | |
| | 4,500 | | | Silicon Laboratories, Inc.* | | | 195,390 | | | |
| | 45,500 | | | Texas Instruments, Inc. | | | 1,324,505 | | | |
| | 14,200 | | | Xilinx, Inc. | | | 455,252 | | | |
| | | | | | | | 3,757,605 | | | |
| Electronic Design Automation – 0.1% | | | | | | |
| | 21,400 | | | Cadence Design Systems, Inc.* | | | 222,560 | | | |
| Electronic Measuring Instruments – 0.1% | | | | | | |
| | 10,100 | | | Agilent Technologies, Inc.* | | | 352,793 | | | |
| Energy – Alternate Sources – 0% | | | | | | |
| | 6,300 | | | Covanta Holding Corp. | | | 86,247 | | | |
| Engineering – Research and Development Services – 0.1% | | | | | | |
| | 2,100 | | | KBR, Inc. | | | 58,527 | | | |
| | 10,000 | | | McDermott International, Inc. (U.S. Shares)* | | | 115,100 | | | |
| | | | | | | | 173,627 | | | |
| Engines – Internal Combustion – 0.1% | | | | | | |
| | 4,100 | | | Cummins, Inc. | | | 360,882 | | | |
See Notes to Schedules of Investments and Financial Statements.
42 | DECEMBER 31, 2011
Schedule of Investments (unaudited)
As of December 31, 2011
| | | | | | | | | | | |
| Shares | | Value | | | |
| |
| Enterprise Software/Services – 1.1% | | | | | | |
| | 18,200 | | | BMC Software, Inc.* | | $ | 596,596 | | | |
| | 22,100 | | | Informatica Corp.* | | | 816,153 | | | |
| | 81,544 | | | Oracle Corp. | | | 2,091,604 | | | |
| | | | | | | | 3,504,353 | | | |
| Entertainment Software – 0.2% | | | | | | |
| | 37,400 | | | Electronic Arts, Inc.* | | | 770,440 | | | |
| Filtration and Separations Products – 0.1% | | | | | | |
| | 1,500 | | | Donaldson Co., Inc. | | | 102,120 | | | |
| | 3,200 | | | Polypore International, Inc.* | | | 140,768 | | | |
| | | | | | | | 242,888 | | | |
| Finance – Credit Card – 0.5% | | | | | | |
| | 24,100 | | | American Express Co. | | | 1,136,797 | | | |
| | 13,000 | | | Discover Financial Services | | | 312,000 | | | |
| | | | | | | | 1,448,797 | | | |
| Finance – Other Services – 0.2% | | | | | | |
| | 3,100 | | | CBOE Holdings, Inc. | | | 80,166 | | | |
| | 1,700 | | | IntercontinentalExchange, Inc.* | | | 204,935 | | | |
| | 4,600 | | | NASDAQ Stock Market, Inc.* | | | 112,746 | | | |
| | 3,000 | | | NYSE Euronext | | | 78,300 | | | |
| | | | | | | | 476,147 | | | |
| Food – Baking – 0.5% | | | | | | |
| | 87,350 | | | Flowers Foods, Inc. | | | 1,657,903 | | | |
| Food – Confectionary – 0.3% | | | | | | |
| | 16,200 | | | Hershey Co. | | | 1,000,836 | | | |
| Food – Meat Products – 0.1% | | | | | | |
| | 14,700 | | | Hormel Foods Corp. | | | 430,563 | | | |
| Food – Miscellaneous/Diversified – 3.4% | | | | | | |
| | 4,700 | | | Campbell Soup Co. | | | 156,228 | | | |
| | 25,600 | | | ConAgra Foods, Inc. | | | 675,840 | | | |
| | 20,700 | | | Corn Products International, Inc. | | | 1,088,613 | | | |
| | 26,500 | | | General Mills, Inc. | | | 1,070,865 | | | |
| | 30,200 | | | H.J. Heinz Co. | | | 1,632,008 | | | |
| | 39,000 | | | Kellogg Co. | | | 1,972,230 | | | |
| | 45,200 | | | McCormick & Co., Inc. | | | 2,278,984 | | | |
| | 93,200 | | | Sara Lee Corp. | | | 1,763,344 | | | |
| | | | | | | | 10,638,112 | | | |
| Food – Retail – 0.3% | | | | | | |
| | 14,700 | | | Kroger Co. | | | 356,034 | | | |
| | 7,700 | | | Whole Foods Market, Inc. | | | 535,766 | | | |
| | | | | | | | 891,800 | | | |
| Food – Wholesale/Distribution – 0.1% | | | | | | |
| | 10,400 | | | Sysco Corp. | | | 305,032 | | | |
| Footwear and Related Apparel – 0.1% | | | | | | |
| | 3,600 | | | Deckers Outdoor Corp.* | | | 272,052 | | | |
| Gambling – Non-Hotel – 0.1% | | | | | | |
| | 13,200 | | | International Game Technology | | | 227,040 | | | |
| Gold Mining – 0.4% | | | | | | |
| | 5,800 | | | Allied Nevada Gold Corp.* | | | 175,624 | | | |
| | 13,800 | | | Royal Gold, Inc. | | | 930,534 | | | |
| | | | | | | | 1,106,158 | | | |
| Hazardous Waste Disposal – 0.1% | | | | | | |
| | 5,300 | | | Stericycle, Inc.* | | | 412,976 | | | |
| Home Furnishings – 0.3% | | | | | | |
| | 16,300 | | | Tempur-Pedic International, Inc.* | | | 856,239 | | | |
| Hotels and Motels – 0% | | | | | | |
| | 2,900 | | | Starwood Hotels & Resorts Worldwide, Inc. | | | 139,113 | | | |
| Industrial Gases – 0.4% | | | | | | |
| | 8,700 | | | Airgas, Inc. | | | 679,296 | | | |
| | 5,600 | | | Praxair, Inc. | | | 598,640 | | | |
| | | | | | | | 1,277,936 | | | |
| Instruments – Controls – 0.4% | | | | | | |
| | 8,700 | | | Honeywell International, Inc. | | | 472,845 | | | |
| | 5,200 | | | Mettler-Toledo International, Inc.* | | | 768,092 | | | |
| | | | | | | | 1,240,937 | | | |
| Instruments – Scientific – 0.1% | | | | | | |
| | 4,100 | | | Waters Corp.* | | | 303,605 | | | |
| Insurance Brokers – 0.5% | | | | | | |
| | 19,000 | | | Erie Indemnity Co. – Class A | | | 1,485,040 | | | |
| Internet Infrastructure Software – 0.1% | | | | | | |
| | 13,700 | | | TIBCO Software, Inc.* | | | 327,567 | | | |
| Internet Security – 0.1% | | | | | | |
| | 19,100 | | | Symantec Corp.* | | | 298,915 | | �� | |
| Investment Management and Advisory Services – 0.4% | | | | | | |
| | 400 | | | Affiliated Managers Group, Inc.* | | | 38,380 | | | |
| | 11,800 | | | Franklin Resources, Inc. | | | 1,133,508 | | | |
| | 1,900 | | | T. Rowe Price Group, Inc. | | | 108,205 | | | |
| | | | | | | | 1,280,093 | | | |
| Machine Tools and Related Products – 0.1% | | | | | | |
| | 7,700 | | | Kennametal, Inc. | | | 281,204 | | | |
| | 2,200 | | | Lincoln Electric Holdings, Inc. | | | 86,064 | | | |
| | | | | | | | 367,268 | | | |
| Machinery – Construction and Mining – 0.4% | | | | | | |
| | 10,900 | | | Caterpillar, Inc. | | | 987,540 | | | |
| | 3,800 | | | Joy Global, Inc. | | | 284,886 | | | |
| | | | | | | | 1,272,426 | | | |
| Machinery – General Industrial – 0.5% | | | | | | |
| | 11,100 | | | Gardner Denver, Inc. | | | 855,366 | | | |
| | 8,200 | | | Roper Industries, Inc. | | | 712,334 | | | |
| | 2,100 | | | Wabtec Corp. | | | 146,895 | | | |
| | | | | | | | 1,714,595 | | | |
| Machinery – Print Trade – 0% | | | | | | |
| | 1,800 | | | Zebra Technologies Corp.* | | | 64,404 | | | |
| Machinery – Pumps – 0.1% | | | | | | |
| | 8,800 | | | Graco, Inc. | | | 359,832 | | | |
| Medical – Biomedical and Genetic – 1.8% | | | | | | |
| | 38,200 | | | Alexion Pharmaceuticals, Inc.* | | | 2,731,300 | | | |
| | 15,900 | | | Biogen Idec, Inc.* | | | 1,749,795 | | | |
| | 7,700 | | | Celgene Corp.* | | | 520,520 | | | |
| | 4,100 | | | Gilead Sciences, Inc.* | | | 167,813 | | | |
| | 5,700 | | | Myriad Genetics, Inc.* | | | 119,358 | | | |
| | 3,900 | | | Regeneron Pharmaceuticals, Inc.* | | | 216,177 | | | |
| | 1,200 | | | Vertex Pharmaceuticals, Inc.* | | | 39,852 | | | |
| | | | | | | | 5,544,815 | | | |
| Medical – Drugs – 2.2% | | | | | | |
| | 15,300 | | | Abbott Laboratories | | | 860,319 | | | |
| | 14,700 | | | Allergan, Inc. | | | 1,289,778 | | | |
| | 22,600 | | | Eli Lilly & Co. | | | 939,256 | | | |
See Notes to Schedules of Investments and Financial Statements.
Janus Mathematical Funds | 43
INTECH U.S. Growth Fund
Schedule of Investments (unaudited)
As of December 31, 2011
| | | | | | | | | | | |
| Shares | | Value | | | |
| |
| Medical – Drugs – (continued) | | | | | | |
| | | | | | | | | | | |
| | 30,100 | | | Johnson & Johnson | | $ | 1,973,958 | | | |
| | 14,200 | | | Pharmasset, Inc.* | | | 1,820,440 | | | |
| | | | | | | | 6,883,751 | | | |
| Medical – Generic Drugs – 0.8% | | | | | | |
| | 11,500 | | | Mylan, Inc.* | | | 246,790 | | | |
| | 10,500 | | | Perrigo Co. | | | 1,021,650 | | | |
| | 18,700 | | | Watson Pharmaceuticals, Inc.* | | | 1,128,358 | | | |
| | | | | | | | 2,396,798 | | | |
| Medical – HMO – 0.2% | | | | | | |
| | 9,500 | | | Amerigroup Corp.* | | | 561,260 | | | |
| Medical – Hospitals – 0% | | | | | | |
| | 5,300 | | | HCA Holdings, Inc.* | | | 116,759 | | | |
| Medical – Wholesale Drug Distributors – 1.9% | | | | | | |
| | 83,100 | | | AmerisourceBergen Corp. | | | 3,090,489 | | | |
| | 38,000 | | | Cardinal Health, Inc. | | | 1,543,180 | | | |
| | 17,300 | | | McKesson Corp. | | | 1,347,843 | | | |
| | | | | | | | 5,981,512 | | | |
| Medical Information Systems – 0.6% | | | | | | |
| | 5,200 | | | Allscripts Healthcare Solutions, Inc.* | | | 98,488 | | | |
| | 29,400 | | | Cerner Corp.* | | | 1,800,750 | | | |
| | | | | | | | 1,899,238 | | | |
| Medical Instruments – 1.5% | | | | | | |
| | 8,800 | | | Edwards Lifesciences Corp.* | | | 622,160 | | | |
| | 3,300 | | | Intuitive Surgical, Inc.* | | | 1,527,933 | | | |
| | 3,700 | | | St. Jude Medical, Inc. | | | 126,910 | | | |
| | 10,700 | | | Techne Corp. | | | 730,382 | | | |
| | 52,900 | | | Thoratec Corp.* | | | 1,775,324 | | | |
| | | | | | | | 4,782,709 | | | |
| Medical Labs and Testing Services – 0.2% | | | | | | |
| | 8,700 | | | Laboratory Corp. of America Holdings* | | | 747,939 | | | |
| Medical Products – 1.2% | | | | | | |
| | 18,900 | | | Baxter International, Inc. | | | 935,172 | | | |
| | 3,200 | | | Becton, Dickinson and Co. | | | 239,104 | | | |
| | 3,500 | | | Carefusion Corp.* | | | 88,935 | | | |
| | 8,000 | | | Cooper Cos., Inc. | | | 564,160 | | | |
| | 10,000 | | | Covidien PLC (U.S. Shares) | | | 450,100 | | | |
| | 11,900 | | | Henry Schein, Inc.* | | | 766,717 | | | |
| | 3,300 | | | Hospira, Inc.* | | | 100,221 | | | |
| | 3,500 | | | Sirona Dental Systems, Inc.* | | | 154,140 | | | |
| | 5,200 | | | Varian Medical Systems, Inc.* | | | 349,076 | | | |
| | | | | | | | 3,647,625 | | | |
| Metal – Copper – 0.2% | | | | | | |
| | 11,700 | | | Freeport-McMoRan Copper & Gold, Inc. – Class B | | | 430,443 | | | |
| | 4,300 | | | Southern Copper Corp. | | | 129,774 | | | |
| | | | | | | | 560,217 | | | |
| Metal – Diversified – 0.1% | | | | | | |
| | 9,000 | | | Molycorp, Inc.* | | | 215,820 | | | |
| Metal – Iron – 0% | | | | | | |
| | 1,700 | | | Cliffs Natural Resources, Inc. | | | 105,995 | | | |
| Metal Processors and Fabricators – 0.6% | | | | | | |
| | 10,800 | | | Precision Castparts Corp. | | | 1,779,732 | | | |
| Motorcycle and Motor Scooter Manufacturing – 0.1% | | | | | | |
| | 9,000 | | | Harley-Davidson, Inc. | | | 349,830 | | | |
| Multimedia – 1.2% | | | | | | |
| | 13,100 | | | FactSet Research Systems, Inc. | | | 1,143,368 | | | |
| | 26,600 | | | McGraw-Hill Cos., Inc. | | | 1,196,202 | | | |
| | 33,200 | | | Viacom, Inc. – Class B | | | 1,507,612 | | | |
| | | | | | | | 3,847,182 | | | |
| Networking Products – 0% | | | | | | |
| | 8,500 | | | Polycom, Inc.* | | | 138,550 | | | |
| Non-Hazardous Waste Disposal – 0.9% | | | | | | |
| | 87,850 | | | Waste Connections, Inc. | | | 2,911,349 | | | |
| Oil – Field Services – 1.4% | | | | | | |
| | 5,900 | | | Atwood Oceanics, Inc.* | | | 234,761 | | | |
| | 23,800 | | | Baker Hughes, Inc. | | | 1,157,632 | | | |
| | 2,400 | | | CARBO Ceramics, Inc. | | | 295,992 | | | |
| | 2,000 | | | Core Laboratories N.V. | | | 227,900 | | | |
| | 27,200 | | | Halliburton Co. | | | 938,672 | | | |
| | 4,100 | | | Oceaneering International, Inc. | | | 189,133 | | | |
| | 4,600 | | | Oil States International, Inc.* | | | 351,302 | | | |
| | 13,500 | | | Schlumberger, Ltd. (U.S. Shares) | | | 922,185 | | | |
| | 3,000 | | | Superior Energy Services, Inc.* | | | 85,320 | | | |
| | | | | | | | 4,402,897 | | | |
| Oil and Gas Drilling – 0.1% | | | | | | |
| | 1,800 | | | Helmerich & Payne, Inc. | | | 105,048 | | | |
| | 5,500 | | | Patterson-UTI Energy, Inc. | | | 109,890 | | | |
| | 4,000 | | | Rowan Cos., Inc.* | | | 121,320 | | | |
| | | | | | | | 336,258 | | | |
| Oil Companies – Exploration and Production – 2.4% | | | | | | |
| | 2,500 | | | Anadarko Petroleum Corp. | | | 190,825 | | | |
| | 1,400 | | | Apache Corp. | | | 126,812 | | | |
| | 14,500 | | | Cabot Oil & Gas Corp. | | | 1,100,550 | | | |
| | 2,900 | | | Concho Resources, Inc.* | | | 271,875 | | | |
| | 1,300 | | | Continental Resources, Inc.* | | | 86,723 | | | |
| | 1,400 | | | EOG Resources, Inc. | | | 137,914 | | | |
| | 33,600 | | | EQT Corp. | | | 1,840,944 | | | |
| | 5,100 | | | Noble Energy, Inc. | | | 481,389 | | | |
| | 3,300 | | | Occidental Petroleum Corp. | | | 309,210 | | | |
| | 13,700 | | | QEP Resources, Inc. | | | 401,410 | | | |
| | 19,000 | | | Range Resources Corp. | | | 1,176,860 | | | |
| | 12,900 | | | SM Energy Co. | | | 942,990 | | | |
| | 12,000 | | | Southwestern Energy Co.* | | | 383,280 | | | |
| | | | | | | | 7,450,782 | | | |
| Oil Companies – Integrated – 3.4% | | | | | | |
| | 26,500 | | | Chevron Corp. | | | 2,819,600 | | | |
| | 91,100 | | | Exxon Mobil Corp. | | | 7,721,636 | | | |
| | | | | | | | 10,541,236 | | | |
| Oil Field Machinery and Equipment – 0.2% | | | | | | |
| | 5,200 | | | Cameron International Corp.* | | | 255,788 | | | |
| | 7,500 | | | FMC Technologies, Inc.* | | | 391,725 | | | |
| | | | | | | | 647,513 | | | |
| Oil Refining and Marketing – 0.5% | | | | | | |
| | 61,542 | | | HollyFrontier Corp. | | | 1,440,083 | | | |
| Pharmacy Services – 0.2% | | | | | | |
| | 900 | | | Express Scripts, Inc. – Class A* | | | 40,221 | | | |
| | 13,000 | | | SXC Health Solutions Corp. (U.S. Shares)* | | | 734,240 | | | |
| | | | | | | | 774,461 | | | |
| Physical Practice Management – 0.1% | | | | | | |
| | 3,000 | | | Mednax, Inc.* | | | 216,030 | | | |
See Notes to Schedules of Investments and Financial Statements.
44 | DECEMBER 31, 2011
Schedule of Investments (unaudited)
As of December 31, 2011
| | | | | | | | | | | |
| Shares | | Value | | | |
| |
| Pipelines – 1.1% | | | | | | |
| | 92,000 | | | El Paso Corp. | | $ | 2,444,440 | | | |
| | 7,800 | | | Kinder Morgan, Inc. | | | 250,926 | | | |
| | 7,700 | | | Oneok, Inc. | | | 667,513 | | | |
| | | | | | | | 3,362,879 | | | |
| Publishing – Books – 0.4% | | | | | | |
| | 28,200 | | | John Wiley & Sons, Inc. – Class A | | | 1,252,080 | | | |
| Recreational Vehicles – 0.5% | | | | | | |
| | 28,000 | | | Polaris Industries, Inc. | | | 1,567,440 | | | |
| REIT – Apartments – 1.2% | | | | | | |
| | 6,900 | | | Apartment Investment & Management Co. – Class A | | | 158,079 | | | |
| | 17,400 | | | Camden Property Trust | | | 1,082,976 | | | |
| | 13,600 | | | Equity Residential | | | 775,608 | | | |
| | 8,800 | | | Essex Property Trust, Inc. | | | 1,236,488 | | | |
| | 18,000 | | | UDR, Inc. | | | 451,800 | | | |
| | | | | | | | 3,704,951 | | | |
| REIT – Diversified – 1.0% | | | | | | |
| | 13,600 | | | Digital Realty Trust, Inc. | | | 906,712 | | | |
| | 6,100 | | | Plum Creek Timber Co., Inc. | | | 223,016 | | | |
| | 42,250 | | | Rayonier, Inc. | | | 1,885,618 | | | |
| | 1,800 | | | Vornado Realty Trust | | | 138,348 | | | |
| | | | | | | | 3,153,694 | | | |
| REIT – Health Care – 0.1% | | | | | | |
| | 5,900 | | | Ventas, Inc. | | | 325,267 | | | |
| REIT – Office Property – 0.6% | | | | | | |
| | 19,600 | | | Boston Properties, Inc. | | | 1,952,160 | | | |
| REIT – Regional Malls – 0.6% | | | | | | |
| | 9,800 | | | Macerich Co. | | | 495,880 | | | |
| | 11,400 | | | Simon Property Group, Inc. | | | 1,469,916 | | | |
| | | | | | | | 1,965,796 | | | |
| REIT – Shopping Centers – 0.4% | | | | | | |
| | 13,500 | | | Federal Realty Investment Trust | | | 1,225,125 | | | |
| REIT – Storage – 0.5% | | | | | | |
| | 12,200 | | | Public Storage | | | 1,640,412 | | | |
| Rental Auto/Equipment – 0.2% | | | | | | |
| | 17,900 | | | Aaron Rents, Inc. | | | 477,572 | | | |
| Retail – Apparel and Shoe – 1.4% | | | | | | |
| | 8,800 | | | Abercrombie & Fitch Co. – Class A | | | 429,792 | | | |
| | 31,000 | | | Limited Brands, Inc. | | | 1,250,850 | | | |
| | 2,700 | | | PVH Corp. | | | 190,323 | | | |
| | 53,600 | | | Ross Stores, Inc. | | | 2,547,608 | | | |
| | | | | | | | 4,418,573 | | | |
| Retail – Auto Parts – 1.1% | | | | | | |
| | 2,200 | | | Advance Auto Parts, Inc. | | | 153,186 | | | |
| | 8,500 | | | AutoZone, Inc.* | | | 2,762,245 | | | |
| | 5,400 | | | O’Reilly Automotive, Inc.* | | | 431,730 | | | |
| | | | | | | | 3,347,161 | | | |
| Retail – Automobile – 0.7% | | | | | | |
| | 19,600 | | | AutoNation, Inc.* | | | 722,652 | | | |
| | 4,100 | | | Carmax, Inc.* | | | 124,968 | | | |
| | 30,000 | | | Copart, Inc.* | | | 1,436,700 | | | |
| | | | | | | | 2,284,320 | | | |
| Retail – Bedding – 0.2% | | | | | | |
| | 8,900 | | | Bed Bath & Beyond, Inc.* | | | 515,933 | | | |
| Retail – Catalog Shopping – 0.1% | | | | | | |
| | 3,000 | | | MSC Industrial Direct Co. – Class A | | | 214,650 | | | |
| Retail – Discount – 2.1% | | | | | | |
| | 10,200 | | | Big Lots, Inc.* | | | 385,152 | | | |
| | 19,900 | | | Costco Wholesale Corp. | | | 1,658,068 | | | |
| | 15,100 | | | Dollar General Corp.* | | | 621,214 | | | |
| | 23,800 | | | Dollar Tree, Inc.* | | | 1,978,018 | | | |
| | 12,000 | | | Target Corp. | | | 614,640 | | | |
| | 22,100 | | | Wal-Mart Stores, Inc. | | | 1,320,696 | | | |
| | | | | | | | 6,577,788 | | | |
| Retail – Drug Store – 0% | | | | | | |
| | 1,700 | | | Walgreen Co. | | | 56,202 | | | |
| Retail – Gardening Products – 0.2% | | | | | | |
| | 7,800 | | | Tractor Supply Co. | | | 547,170 | | | |
| Retail – Jewelry – 0.3% | | | | | | |
| | 15,800 | | | Tiffany & Co. | | | 1,046,908 | | | |
| Retail – Major Department Stores – 0.9% | | | | | | |
| | 8,600 | | | Nordstrom, Inc. | | | 427,506 | | | |
| | 37,600 | | | TJX Cos., Inc. | | | 2,427,080 | | | |
| | | | | | | | 2,854,586 | | | |
| Retail – Miscellaneous/Diversified – 0.6% | | | | | | |
| | 91,900 | | | Sally Beauty Holdings, Inc.* | | | 1,941,847 | | | |
| Retail – Perfume and Cosmetics – 0.2% | | | | | | |
| | 8,700 | | | Ulta Salon, Cosmetics & Fragrance, Inc.* | | | 564,804 | | | |
| Retail – Pet Food and Supplies – 0.2% | | | | | | |
| | 13,100 | | | PetSmart, Inc. | | | 671,899 | | | |
| Retail – Regional Department Stores – 0.3% | | | | | | |
| | 2,100 | | | Kohl’s Corp. | | | 103,635 | | | |
| | 27,100 | | | Macy’s, Inc. | | | 872,078 | | | |
| | | | | | | | 975,713 | | | |
| Retail – Restaurants – 1.9% | | | | | | |
| | 2,200 | | | Chipotle Mexican Grill, Inc. – Class A* | | | 743,028 | | | |
| | 1,900 | | | Darden Restaurants, Inc. | | | 86,602 | | | |
| | 32,400 | | | McDonald’s Corp. | | | 3,250,692 | | | |
| | 26,300 | | | Starbucks Corp. | | | 1,210,063 | | | |
| | 10,400 | | | Yum! Brands, Inc. | | | 613,704 | | | |
| | | | | | | | 5,904,089 | | | |
| Rubber – Tires – 0% | | | | | | |
| | 10,200 | | | Goodyear Tire & Rubber Co.* | | | 144,534 | | | |
| Savings/Loan/Thrifts – 0.2% | | | | | | |
| | 37,800 | | | People’s United Financial, Inc. | | | 485,730 | | | |
| Schools – 0.4% | | | | | | |
| | 14,900 | | | Apollo Group, Inc. – Class A* | | | 802,663 | | | |
| | 2,000 | | | Devry, Inc. | | | 76,920 | | | |
| | 6,900 | | | ITT Educational Services, Inc.* | | | 392,541 | | | |
| | | | | | | | 1,272,124 | | | |
| Semiconductor Components/Integrated Circuits – 0.8% | | | | | | |
| | 7,000 | | | Analog Devices, Inc. | | | 250,460 | | | |
| | 6,200 | | | Linear Technology Corp. | | | 186,186 | | | |
| | 29,900 | | | Maxim Integrated Products | | | 778,596 | | | |
| | 24,000 | | | Qualcomm, Inc. | | | 1,312,800 | | | |
| | | | | | | | 2,528,042 | | | |
See Notes to Schedules of Investments and Financial Statements.
Janus Mathematical Funds | 45
INTECH U.S. Growth Fund
Schedule of Investments (unaudited)
As of December 31, 2011
| | | | | | | | | | | |
| Shares | | Value | | | |
| |
| Semiconductor Equipment – 0.4% | | | | | | |
| | 20,400 | | | Applied Materials, Inc. | | $ | 218,484 | | | |
| | 14,800 | | | KLA-Tencor Corp. | | | 714,100 | | | |
| | 9,400 | | | Lam Research Corp.* | | | 347,988 | | | |
| | | | | | | | 1,280,572 | | | |
| Soap and Cleaning Preparations – 0.2% | | | | | | |
| | 15,300 | | | Church & Dwight Co., Inc. | | | 700,128 | | | |
| Software Tools – 0.3% | | | | | | |
| | 9,500 | | | VMware, Inc. – Class A* | | | 790,305 | | | |
| Steel – Producers – 0.2% | | | | | | |
| | 9,900 | | | Carpenter Technology Corp. | | | 509,652 | | | |
| Steel Pipe and Tube – 0.1% | | | | | | |
| | 2,000 | | | Valmont Industries, Inc. | | | 181,580 | | | |
| Super-Regional Banks – 0.1% | | | | | | |
| | 10,100 | | | Wells Fargo & Co. | | | 278,356 | | | |
| Telecommunication Equipment – Fiber Optics – 0.2% | | | | | | |
| | 16,000 | | | IPG Photonics Corp.* | | | 541,920 | | | |
| Telecommunication Services – 0.3% | | | | | | |
| | 16,900 | | | NeuStar, Inc. – Class A* | | | 577,473 | | | |
| | 16,500 | | | tw telecom, inc.* | | | 319,770 | | | |
| | 1,300 | | | Virgin Media, Inc. | | | 27,794 | | | |
| | | | | | | | 925,037 | | | |
| Telephone – Integrated – 0.7% | | | | | | |
| | 41,800 | | | Verizon Communications, Inc. | | | 1,677,016 | | | |
| | 47,300 | | | Windstream Corp. | | | 555,302 | | | |
| | | | | | | | 2,232,318 | | | |
| Television – 0.5% | | | | | | |
| | 60,800 | | | CBS Corp. – Class B | | | 1,650,112 | | | |
| Therapeutics – 0.3% | | | | | | |
| | 24,700 | | | BioMarin Pharmaceutical, Inc.* | | | 849,186 | | | |
| Tobacco – 2.0% | | | | | | |
| | 67,800 | | | Altria Group, Inc. | | | 2,010,270 | | | |
| | 42,400 | | | Philip Morris International, Inc. | | | 3,327,552 | | | |
| | 19,300 | | | Reynolds American, Inc. | | | 799,406 | | | |
| | | | | | | | 6,137,228 | | | |
| Toys – 0.1% | | | | | | |
| | 14,200 | | | Mattel, Inc. | | | 394,192 | | | |
| Transactional Software – 0.3% | | | | | | |
| | 17,000 | | | Solera Holdings, Inc. | | | 757,180 | | | |
| | 3,700 | | | VeriFone Holdings, Inc.* | | | 131,424 | | | |
| | | | | | | | 888,604 | | | |
| Transportation – Marine – 0.1% | | | | | | |
| | 6,400 | | | Kirby Corp.* | | | 421,376 | | | |
| Transportation – Railroad – 0.9% | | | | | | |
| | 34,600 | | | CSX Corp. | | | 728,676 | | | |
| | 18,600 | | | Kansas City Southern* | | | 1,264,986 | | | |
| | 7,600 | | | Union Pacific Corp. | | | 805,144 | | | |
| | | | | | | | 2,798,806 | | | |
| Transportation – Services – 0.3% | | | | | | |
| | 10,100 | | | C.H. Robinson Worldwide, Inc. | | | 704,778 | | | |
| | 2,100 | | | Expeditors International of Washington, Inc. | | | 86,016 | | | |
| | 3,900 | | | United Parcel Service, Inc. – Class B | | | 285,441 | | | |
| | | | | | | | 1,076,235 | | | |
| Transportation – Truck – 0.2% | | | | | | |
| | 2,400 | | | J.B. Hunt Transport Services, Inc. | | | 108,168 | | | |
| | 8,600 | | | Landstar System, Inc. | | | 412,112 | | | |
| | | | | | | | 520,280 | | | |
| Vitamins and Nutrition Products – 1.1% | | | | | | |
| | 33,200 | | | Herbalife, Ltd. | | | 1,715,444 | | | |
| | 27,200 | | | Mead Johnson Nutrition Co. – Class A | | | 1,869,456 | | | |
| | | | | | | | 3,584,900 | | | |
| Water – 0% | | | | | | |
| | 5,800 | | | Aqua America, Inc. | | | 127,890 | | | |
| Web Hosting/Design – 0.1% | | | | | | |
| | 1,000 | | | Equinix, Inc.* | | | 101,400 | | | |
| | 6,100 | | | Rackspace Hosting, Inc.* | | | 262,361 | | | |
| | | | | | | | 363,761 | | | |
| Web Portals/Internet Service Providers – 0.8% | | | | | | |
| | 4,100 | | | Google, Inc. – Class A* | | | 2,648,190 | | | |
| Wireless Equipment – 0.1% | | | | | | |
| | 1,600 | | | American Tower Corp. – Class A | | | 96,016 | | | |
| | 4,200 | | | Crown Castle International Corp.* | | | 188,160 | | | |
| | | | | | | | 284,176 | | | |
| |
| |
| Total Investments (total cost $262,455,399) – 99.5% | | | 311,487,393 | | | |
| |
| |
| Cash, Receivables and Other Assets, net of Liabilities – 0.5% | | | 1,520,465 | | | |
| |
| |
| Net Assets – 100% | | $ | 313,007,858 | | | |
| |
| |
Summary of Investments by Country – (Long Positions)
| | | | | | | | | |
| | | | | | % of Investment
| |
| Country | | Value | | | Securities | |
| |
| |
| Bermuda | | $ | 832,065 | | | | 0.3% | |
| Canada | | | 734,240 | | | | 0.2% | |
| Cayman Islands | | | 1,715,444 | | | | 0.6% | |
| Curacao | | | 922,185 | | | | 0.3% | |
| Ireland | | | 2,627,207 | | | | 0.8% | |
| Netherlands | | | 432,020 | | | | 0.1% | |
| Panama | | | 1,265,032 | | | | 0.4% | |
| Singapore | | | 282,828 | | | | 0.1% | |
| Switzerland | | | 238,860 | | | | 0.1% | |
| United States | | | 302,437,512 | | | | 97.1% | |
| |
| |
| Total | | $ | 311,487,393 | | | | 100.0% | |
See Notes to Schedules of Investments and Financial Statements.
46 | DECEMBER 31, 2011
INTECH U.S. Value Fund (unaudited)
| | | | | | | |
Fund Snapshot
INTECH’s active approach focuses on adding value by selecting stocks with unique volatility characteristics and low correlations to one another.
| | | | | | Managed by
INTECH Investment Management LLC |
Performance Overview
For the six-month period ended December 31, 2011, INTECH U.S. Value Fund returned -4.01% for its Class I Shares. This compares to the -5.22% return posted by the Russell 1000 Value Index, the Fund’s benchmark.
Investment Strategy
INTECH’s mathematical investing process seeks to build a more efficient portfolio than its benchmark. The process seeks to minimize tracking error for a target level of excess return. In doing so, the process does not attempt to predict the direction of the market, nor does it have a view of any particular company in the portfolio. Instead, it employs a proprietary optimization process to build portfolios with the potential to outperform the index by capturing stocks’ natural volatility.
Within specific risk controls, INTECH’s disciplined mathematical process establishes target proportional weightings for stocks in the portfolio as a result of an optimization routine. Once the weights are determined and the portfolio is constructed, it is rebalanced and re-optimized on a periodic basis. By limiting the distance any one stock position can deviate from its benchmark weight, INTECH’s process attempts to control the relative risk of the portfolio. We believe that instituting an investment process aimed at providing consistent, positive excess returns at benchmark-like risk, will allow us to meet our investors’ objectives while minimizing the risk of significant underperformance relative to the benchmark.
Outlook
Going forward, we will continue building portfolios in a disciplined and deliberate manner, with risk management remaining the hallmark of our investment process. While we may experience short periods of underperformance, we expect to exceed the benchmark over a three- to five-year time horizon. As INTECH’s ongoing research efforts yield modest improvements, we will continue implementing changes that we believe are likely to improve the long-term results for our clients.
Thank you for your investment in INTECH U.S. Value Fund.
Janus Mathematical Funds | 47
INTECH U.S. Value Fund (unaudited)
INTECH U.S. Value Fund At A Glance
5 Largest Equity Holdings – (% of Net Assets)
As of December 31, 2011
| | | | | |
Exxon Mobil Corp.
Oil Companies – Integrated | | | 2.4% | |
Chevron Corp.
Oil Companies – Integrated | | | 2.2% | |
AT&T, Inc.
Telephone – Integrated | | | 1.6% | |
Berkshire Hathaway, Inc. – Class B
Reinsurance | | | 1.5% | |
Comcast Corp. – Class A
Cable/Satellite Television | | | 1.4% | |
| | | | | |
| | | | 9.1% | |
Asset Allocation – (% of Net Assets)
As of December 31, 2011
Emerging markets comprised 0.1% of total net assets.
Top Country Allocations – Long Positions (% of Investment Securities)
As of December 31, 2011
48 | DECEMBER 31, 2011
(unaudited)
| | | | | | | | | | | | | | |
| Average Annual Total Return – for the periods ended December 31, 2011 | | | Expense Ratios – per the October 28, 2011 prospectuses |
| | | Fiscal
| | One
| | Five
| | Since
| | | Total Annual Fund
| | Net Annual Fund
|
| | | Year-to-Date | | Year | | Year | | Inception* | | | Operating Expenses | | Operating Expenses |
| | | | | | | | | | | | | | |
| INTECH U.S. Value Fund – Class A Shares | | | | | | | | | | | | | |
| | | | | | | | | | | | | | |
| NAV | | –4.18% | | 2.03% | | –1.83% | | 1.14% | | | 0.96% | | 0.96% |
| | | | | | | | | | | | | | |
| MOP | | –9.67% | | –3.79% | | –3.00% | | 0.14% | | | | | |
| | | | | | | | | | | | | | |
| INTECH U.S. Value Fund – Class C Shares | | | | | | | | | | | | | |
| | | | | | | | | | | | | | |
| NAV | | –4.53% | | 1.17% | | –2.58% | | 0.37% | | | 1.75% | | 1.75% |
| | | | | | | | | | | | | | |
| CDSC | | –5.48% | | 0.16% | | –2.58% | | 0.37% | | | | | |
| | | | | | | | | | | | | | |
| INTECH U.S. Value Fund – Class I Shares | | –4.01% | | 2.28% | | –1.62% | | 1.37% | | | 0.69% | | 0.69% |
| | | | | | | | | | | | | | |
| INTECH U.S. Value Fund – Class S Shares | | –4.28% | | 1.81% | | –2.09% | | 0.89% | | | 1.18% | | 1.18% |
| | | | | | | | | | | | | | |
| INTECH U.S. Value Fund – Class T Shares | | –4.13% | | 2.07% | | –1.98% | | 0.96% | | | 0.96% | | 0.96% |
| | | | | | | | | | | | | | |
| Russell 1000® Value Index | | –5.22% | | 0.39% | | –2.64% | | 1.13% | | | | | |
| | | | | | | | | | | | | | |
| Lipper Quartile – Class I Shares | | – | | 1st | | 2nd | | 2nd | | | | | |
| | | | | | | | | | | | | | |
| Lipper Ranking – based on total returns for Multi-Cap Value Funds | | – | | 34/309 | | 78/219 | | 71/201 | | | | | |
| | | | | | | | | | | | | | |
| Visit janus.com/advisor/mutual-funds to view current performance and characteristic information | | | | | |
| | | | | | | | | | | | | | |
Data presented represents past performance, which is no guarantee of future results. Investment results and principal value will fluctuate so that shares, when redeemed, may be worth more or less than their original cost. Due to market volatility, current performance may be higher or lower than the performance shown. Call 877.33JANUS(52687) or visit janus.com/advisor/mutual-funds for performance current to the most recent month-end.
Performance shown for Class A Shares at Maximum Offering Price (MOP) includes the Fund’s maximum sales charge of 5.75%. Performance shown at Net Asset Value (NAV) does not include this charge and would have been lower had this charge been taken into account.
Performance shown for Class C Shares includes a 1% contingent deferred sales charge (CDSC) on periods of less than 12 months. Performance shown at Net Asset Value (NAV) does not include this sales charge and would have been lower had this sales charge been taken into account.
See important disclosures on the next page.
Janus Mathematical Funds | 49
INTECH U.S. Value Fund (unaudited)
For Class I Shares, Class S Shares, and Class T Shares, a 2% redemption fee may be imposed on shares held for 90 days or less. Performance shown does not reflect this redemption fee and, if reflected, performance would have been lower.
Janus Capital has contractually agreed to waive the Fund’s total annual fund operating expenses allocated to any class (excluding the distribution and shareholder servicing fees (applicable to Class A Shares, Class C Shares, and Class S Shares), administrative services fees payable pursuant to the Transfer Agency Agreement (except for networking and omnibus fees), brokerage commissions, interest, dividends, taxes, acquired fund fees and expenses, and extraordinary expenses) to certain limits until at least November 1, 2012. The contractual waiver may be terminated or modified prior to this date only at the discretion of the Board of Trustees. Returns shown include fee waivers, if any, and without such waivers, returns would have been lower.
The expense information shown was determined based on net assets as of the fiscal period ended June 30, 2011. The effect of contractual waivers agreed to by Janus Capital, when applicable, are reflected under “Net Annual Fund Operating Expenses.” (All expenses are shown without the effect of expense offset arrangements. Pursuant to such arrangements, credits realized as a result of uninvested cash balances are used to reduce custodian and transfer agent expenses.)
The proprietary mathematical process used by INTECH Investment Management LLC (“INTECH”) may not achieve the desired results. The rebalancing techniques used by the Fund may result in a higher portfolio turnover rate, higher expenses and potentially higher net taxable gains or losses compared to a “buy and hold” or index fund strategy.
The Fund’s performance may be affected by risks that include those associated with investments in specific industries or countries and potential conflicts of interest with the Janus “funds of funds.” Additional risks to the Fund may include those associated with investing in foreign securities, initial public offerings (“IPOs”), real estate investment trusts (“REITs”), and derivatives. Please see a Janus prospectus or janus.com/info for more information about risks, portfolio holdings and other details.
The Fund invests in REITs, which may be subject to a higher degree of market risk because of concentration in a specific industry, sector or geographic region. REITs may be subject to risks including, but not limited to: legal, political, liquidity, and interest rate risks, a decline in the value of real estate, risks related to general and economic conditions, changes in the value of the underlying property owned by the trust and defaults by borrowers. To the extent the Fund invests in foreign REITs, the Fund may be subject to fluctuations in currency rates or political or economic conditions in a particular country.
The Fund will normally invest at least 80% of its net assets, measured at the time of purchase, in the type of securities described by its name.
Returns include reinvestment of dividends from net investment income and distributions from capital gains. The returns shown do not reflect the deduction of taxes that a shareholder would pay on Fund distributions or the redemption of Fund shares. The returns do not include adjustments in accordance with generally accepted accounting principles required at the period end for financial reporting purposes.
Class A Shares, Class C Shares, Class I Shares, Class S Shares and Class T Shares of the Fund commenced operations on July 6, 2009. The historical performance shown for periods prior to July 6, 2009 was calculated using the performance and the fees and expenses of one or more other share classes of a predecessor fund(s), accounting for, when applicable and permitted, any fee and expense limitations and waivers. If each respective share class of the Fund had been available during periods prior to July 6, 2009, the performance shown may have been different. Please refer to the Fund’s prospectus for further details concerning historical performance.
Lipper, a wholly-owned subsidiary of Thomson Reuters, provides independent insight on global collective investments including mutual funds, retirement funds, hedge funds, fund fees and expenses to the asset management and media communities. Lipper ranks the performance of mutual funds within a classification of funds that have similar investment objectives. Rankings are historical with capital gains and dividends reinvested and do not include the effect of loads.
Ranking is for Class I Shares only; other classes may have different performance characteristics. When an expense waiver is in effect, it may have a material effect on the total return, and therefore the ranking for the period.
December 31, 2005 is the date used to calculate the since-inception Lipper ranking, which is slightly different from when the Fund began operations since Lipper provides fund rankings as of the last day of the month or the first Thursday after fund inception.
There is no assurance that the investment process will consistently lead to successful investing.
See Notes to Schedules of Investments for index definitions.
The weighting of securities within the portfolio may differ significantly from the weightings within the index. The index is unmanaged and is not available for direct investment; therefore, its performance does not reflect the expenses associated with the active management of an actual portfolio.
Effective December 7, 2011, INTECH Risk-Managed Value Fund changed its name to INTECH U.S. Value Fund.
See “Explanations of Charts, Tables and Financial Statements.”
| | | |
| * | | The predecessor Fund’s inception date – December 30, 2005 |
50 | DECEMBER 31, 2011
(unaudited)
The examples below show you the ongoing costs (in dollars) of investing in your Fund and allow you to compare these costs with those of other mutual funds. Please refer to the section Useful Information About Your Fund Report for a detailed explanation of the information presented in these charts.
| | | | | | | | | | | | | | | |
| | | Beginning Account Value
| | Ending Account Value
| | Expenses Paid During Period
| | |
| Expense Example – Class A Shares | | (7/1/11) | | (12/31/11) | | (7/1/11 - 12/31/11)† | | |
| |
| |
| Actual | | $ | 1,000.00 | | | $ | 958.20 | | | $ | 4.68 | | | |
| |
| |
Hypothetical
(5% return before expenses) | | $ | 1,000.00 | | | $ | 1,020.36 | | | $ | 4.82 | | | |
| |
| |
| | | | | | | | | | | | | | | |
| | | | | | | | | | | | | | | |
| | | Beginning Account Value
| | Ending Account Value
| | Expenses Paid During Period
| | |
| Expense Example – Class C Shares | | (7/1/11) | | (12/31/11) | | (7/1/11 - 12/31/11)† | | |
| |
| |
| Actual | | $ | 1,000.00 | | | $ | 954.70 | | | $ | 8.60 | | | |
| |
| |
Hypothetical
(5% return before expenses) | | $ | 1,000.00 | | | $ | 1,016.34 | | | $ | 8.87 | | | |
| |
| |
| | | | | | | | | | | | | | | |
| | | | | | | | | | | | | | | |
| | | Beginning Account Value
| | Ending Account Value
| | Expenses Paid During Period
| | |
| Expense Example – Class I Shares | | (7/1/11) | | (12/31/11) | | (7/1/11 - 12/31/11)† | | |
| |
| |
| Actual | | $ | 1,000.00 | | | $ | 960.90 | | | $ | 3.40 | | | |
| |
| |
Hypothetical
(5% return before expenses) | | $ | 1,000.00 | | | $ | 1,021.67 | | | $ | 3.51 | | | |
| |
| |
| | | | | | | | | | | | | | | |
| | | | | | | | | | | | | | | |
| | | Beginning Account Value
| | Ending Account Value
| | Expenses Paid During Period
| | |
| Expense Example – Class S Shares | | (7/1/11) | | (12/31/11) | | (7/1/11 - 12/31/11)† | | |
| |
| |
| Actual | | $ | 1,000.00 | | | $ | 958.20 | | | $ | 5.76 | | | |
| |
| |
Hypothetical
(5% return before expenses) | | $ | 1,000.00 | | | $ | 1,019.25 | | | $ | 5.94 | | | |
| |
| |
| | | | | | | | | | | | | | | |
| | | | | | | | | | | | | | | |
| | | Beginning Account Value
| | Ending Account Value
| | Expenses Paid During Period
| | |
| Expense Example – Class T Shares | | (7/1/11) | | (12/31/11) | | (7/1/11 - 12/31/11)† | | |
| |
| |
| Actual | | $ | 1,000.00 | | | $ | 958.70 | | | $ | 4.63 | | | |
| |
| |
Hypothetical
(5% return before expenses) | | $ | 1,000.00 | | | $ | 1,020.41 | | | $ | 4.77 | | | |
| |
| |
| | | |
| † | | Expenses are equal to the annualized expense ratio of 0.95% for Class A Shares, 1.75% for Class C Shares, 0.69% for Class I Shares, 1.17% for Class S Shares and 0.94% for Class T Shares multiplied by the average account value over the period, multiplied by 184/366 (to reflect the one-half year period). Expenses include effect of contractual waivers by Janus Capital. |
Janus Mathematical Funds | 51
INTECH U.S. Value Fund
Schedule of Investments (unaudited)
As of December 31, 2011
| | | | | | | | | | | |
| Shares | | Value | | | |
| |
| Common Stock – 99.4% | | | | | | |
| Aerospace and Defense – 0.8% | | | | | | |
| | 3,300 | | | Boeing Co. | | $ | 242,055 | | | |
| | 500 | | | General Dynamics Corp. | | | 33,205 | | | |
| | 2,600 | | | Lockheed Martin Corp. | | | 210,340 | | | |
| | 2,600 | | | Northrop Grumman Corp. | | | 152,048 | | | |
| | 1,100 | | | Raytheon Co. | | | 53,218 | | | |
| | 4,300 | | | Spirit Aerosystems Holdings, Inc.* | | | 89,354 | | | |
| | | | | | | | 780,220 | | | |
| Aerospace and Defense – Equipment – 0.5% | | | | | | |
| | 2,300 | | | B.F. Goodrich Co. | | | 284,510 | | | |
| | 500 | | | BE Aerospace, Inc.* | | | 19,355 | | | |
| | 2,900 | | | United Technologies Corp. | | | 211,961 | | | |
| | | | | | | | 515,826 | | | |
| Agricultural Chemicals – 0.1% | | | | | | |
| | 700 | | | CF Industries Holdings, Inc. | | | 101,486 | | | |
| Agricultural Operations – 0.1% | | | | | | |
| | 900 | | | Archer-Daniels-Midland Co. | | | 25,740 | | | |
| | 800 | | | Bunge, Ltd. | | | 45,760 | | | |
| | | | | | | | 71,500 | | | |
| Airlines – 0% | | | | | | |
| | 600 | | | Copa Holdings S.A. | | | 35,202 | | | |
| Apparel Manufacturers – 0.6% | | | | | | |
| | 4,800 | | | VF Corp. | | | 609,552 | | | |
| Audio and Video Products – 0.1% | | | | | | |
| | 1,200 | | | Harman International Industries, Inc. | | | 45,648 | | | |
| Automotive – Cars and Light Trucks – 0.5% | | | | | | |
| | 8,800 | | | Ford Motor Co. | | | 94,688 | | | |
| | 16,600 | | | General Motors Co.* | | | 336,482 | | | |
| | | | | | | | 431,170 | | | |
| Automotive – Truck Parts and Equipment – Original – 0.2% | | | | | | |
| | 700 | | | Autoliv, Inc. | | | 37,443 | | | |
| | 300 | | | Johnson Controls, Inc. | | | 9,378 | | | |
| | 2,700 | | | Lear Corp. | | | 107,460 | | | |
| | 1,100 | | | Visteon Corp.* | | | 54,934 | | | |
| | | | | | | | 209,215 | | | |
| Batteries & Battery Systems – 0.2% | | | | | | |
| | 2,600 | | | Energizer Holdings, Inc.* | | | 201,448 | | | |
| Beverages – Non-Alcoholic – 0.2% | | | | | | |
| | 8,500 | | | Coca-Cola Enterprises, Inc. | | | 219,130 | | | |
| Beverages – Wine and Spirits – 0.3% | | | | | | |
| | 2,400 | | | Beam, Inc. | | | 122,952 | | | |
| | 1,400 | | | Brown-Forman Corp. – Class B | | | 112,714 | | | |
| | 4,400 | | | Constellation Brands, Inc. – Class A* | | | 90,948 | | | |
| | | | | | | | 326,614 | | | |
| Broadcast Services and Programming – 0.8% | | | | | | |
| | 9,874 | | | Liberty Interactive Corp. – Liberty Capital* | | | 770,666 | | | |
| Building – Heavy Construction – 0.1% | | | | | | |
| | 1,900 | | | Chicago Bridge & Iron Co. N.V. | | | 71,820 | | | |
| Building – Residential and Commercial – 0.1% | | | | | | |
| | 3,800 | | | D.R. Horton, Inc. | | | 47,918 | | | |
| | 1,900 | | | Lennar Corp. – Class A | | | 37,335 | | | |
| | 3,100 | | | Pulte Homes, Inc.* | | | 19,561 | | | |
| | | | | | | | 104,814 | | | |
| Building and Construction Products – Miscellaneous – 0.1% | | | | | | |
| | 3,400 | | | Fortune Brands Home & Security, Inc.* | | | 57,902 | | | |
| | 1,700 | | | Owens Corning* | | | 48,824 | | | |
| | | | | | | | 106,726 | | | |
| Cable/Satellite Television – 1.4% | | | | | | |
| | 54,450 | | | Comcast Corp. – Class A | | | 1,291,009 | | | |
| | 1,900 | | | DISH Network Corp. – Class A | | | 54,112 | | | |
| | | | | | | | 1,345,121 | | | |
| Casino Hotels – 0.1% | | | | | | |
| | 6,100 | | | MGM Mirage* | | | 63,623 | | | |
| Chemicals – Diversified – 0.3% | | | | | | |
| | 3,900 | | | Dow Chemical Co. | | | 112,164 | | | |
| | 1,500 | | | Huntsman Corp. | | | 15,000 | | | |
| | 3,500 | | | LyondellBasell Industries N.V. | | | 113,715 | | | |
| | 500 | | | Rockwood Holdings, Inc.* | | | 19,685 | | | |
| | | | | | | | 260,564 | | | |
| Chemicals – Specialty – 0.1% | | | | | | |
| | 1,000 | | | Ashland, Inc. | | | 57,160 | | | |
| | 800 | | | Cytec Industries, Inc. | | | 35,720 | | | |
| | 800 | | | WR Grace & Co.* | | | 36,736 | | | |
| | | | | | | | 129,616 | | | |
| Coatings and Paint Products – 0.1% | | | | | | |
| | 2,200 | | | RPM International, Inc. | | | 54,010 | | | |
| | 300 | | | Valspar Corp. | | | 11,691 | | | |
| | | | | | | | 65,701 | | | |
| Commercial Banks – 1.4% | | | | | | |
| | 5,300 | | | Associated Banc-Corp. | | | 59,201 | | | |
| | 600 | | | Bank of Hawaii Corp. | | | 26,694 | | | |
| | 4,700 | | | BB&T Corp. | | | 118,299 | | | |
| | 7,100 | | | CapitalSource, Inc. | | | 47,570 | | | |
| | 1,600 | | | CIT Group, Inc.* | | | 55,792 | | | |
| | 500 | | | City National Corp. | | | 22,090 | | | |
| | 3,024 | | | Commerce Bancshares, Inc. | | | 115,275 | | | |
| | 3,700 | | | Cullen/Frost Bankers, Inc. | | | 195,767 | | | |
| | 5,300 | | | East West Bancorp, Inc. | | | 104,675 | | | |
| | 800 | | | First Republic Bank* | | | 24,488 | | | |
| | 16,200 | | | Fulton Financial Corp. | | | 158,922 | | | |
| | 3,400 | | | M&T Bank Corp. | | | 259,556 | | | |
| | 7,100 | | | Valley National Bancorp. | | | 87,827 | | | |
| | 3,900 | | | Zions Bancorp. | | | 63,492 | | | |
| | | | | | | | 1,339,648 | | | |
| Commercial Services – 0.1% | | | | | | |
| | 5,600 | | | Quanta Services, Inc.* | | | 120,624 | | | |
| Commercial Services – Finance – 1.2% | | | | | | |
| | 900 | | | Equifax, Inc. | | | 34,866 | | | |
| | 13,700 | | | H&R Block, Inc. | | | 223,721 | | | |
| | 9,800 | | | Total System Services, Inc. | | | 191,688 | | | |
| | 6,300 | | | Visa, Inc. – Class A | | | 639,639 | | | |
| | | | | | | | 1,089,914 | | | |
| Computer Services – 0.1% | | | | | | |
| | 1,200 | | | DST Systems, Inc. | | | 54,624 | | | |
| Computers – 0.6% | | | | | | |
| | 13,000 | | | Dell, Inc.* | | | 190,190 | | | |
| | 14,800 | | | Hewlett-Packard Co. | | | 381,248 | | | |
| | | | | | | | 571,438 | | | |
See Notes to Schedules of Investments and Financial Statements.
52 | DECEMBER 31, 2011
Schedule of Investments (unaudited)
As of December 31, 2011
| | | | | | | | | | | |
| Shares | | Value | | | |
| |
| Computers – Integrated Systems – 0.2% | | | | | | |
| | 2,800 | | | Diebold, Inc. | | $ | 84,196 | | | |
| | 3,400 | | | NCR Corp.* | | | 55,964 | | | |
| | | | | | | | 140,160 | | | |
| Computers – Memory Devices – 0.2% | | | | | | |
| | 2,100 | | | SanDisk Corp.* | | | 103,341 | | | |
| | 1,400 | | | Western Digital Corp.* | | | 43,330 | | | |
| | | | | | | | 146,671 | | | |
| Computers – Peripheral Equipment – 0.1% | | | | | | |
| | 2,100 | | | Lexmark International, Inc. – Class A | | | 69,447 | | | |
| Consulting Services – 0.4% | | | | | | |
| | 2,800 | | | Genpact, Ltd.* | | | 41,860 | | | |
| | 4,500 | | | Towers Watson & Co. | | | 269,685 | | | |
| | 1,300 | | | Verisk Analytics, Inc.* | | | 52,169 | | | |
| | | | | | | | 363,714 | | | |
| Consumer Products – Miscellaneous – 0.3% | | | | | | |
| | 400 | | | Clorox Co. | | | 26,624 | | | |
| | 2,400 | | | Jarden Corp. | | | 71,712 | | | |
| | 2,600 | | | Kimberly-Clark Corp. | | | 191,256 | | | |
| | | | | | | | 289,592 | | | |
| Containers – Paper and Plastic – 0.2% | | | | | | |
| | 1,500 | | | Bemis Co., Inc. | | | 45,120 | | | |
| | 3,300 | | | Temple-Inland, Inc. | | | 104,643 | | | |
| | | | | | | | 149,763 | | | |
| Cosmetics and Toiletries – 1.3% | | | | | | |
| | 2,200 | | | Colgate-Palmolive Co. | | | 203,258 | | | |
| | 15,200 | | | Procter & Gamble Co. | | | 1,013,992 | | | |
| | | | | | | | 1,217,250 | | | |
| Cruise Lines – 0.1% | | | | | | |
| | 1,900 | | | Carnival Corp. (U.S. Shares) | | | 62,016 | | | |
| Data Processing and Management – 0.3% | | | | | | |
| | 9,400 | | | Fidelity National Information Services, Inc. | | | 249,946 | | | |
| | 600 | | | Fiserv, Inc.* | | | 35,244 | | | |
| | | | | | | | 285,190 | | | |
| Dental Supplies and Equipment – 0.2% | | | | | | |
| | 5,400 | | | Dentsply International, Inc. | | | 188,946 | | | |
| | 800 | | | Patterson Cos., Inc. | | | 23,616 | | | |
| | | | | | | | 212,562 | | | |
| Distribution/Wholesale – 0.3% | | | | | | |
| | 2,900 | | | Arrow Electronics, Inc.* | | | 108,489 | | | |
| | 2,900 | | | Genuine Parts Co. | | | 177,480 | | | |
| | 2,200 | | | Ingram Micro, Inc. – Class A* | | | 40,018 | | | |
| | | | | | | | 325,987 | | | |
| Diversified Banking Institutions – 1.2% | | | | | | |
| | 14,105 | | | Bank of America Corp. | | | 78,424 | | | |
| | 7,170 | | | Citigroup, Inc. | | | 188,642 | | | |
| | 800 | | | Goldman Sachs Group, Inc. | | | 72,344 | | | |
| | 22,600 | | | JPMorgan Chase & Co. | | | 751,450 | | | |
| | 3,000 | | | Morgan Stanley | | | 45,390 | | | |
| | | | | | | | 1,136,250 | | | |
| Diversified Operations – 2.4% | | | | | | |
| | 800 | | | 3M Co. | | | 65,384 | | | |
| | 2,500 | | | Carlisle Cos., Inc. | | | 110,750 | | | |
| | 1,600 | | | Crane Co. | | | 74,736 | | | |
| | 1,100 | | | Eaton Corp. | | | 47,883 | | | |
| | 61,800 | | | General Electric Co. | | | 1,106,838 | | | |
| | 2,700 | | | Harsco Corp. | | | 55,566 | | | |
| | 900 | | | Leggett & Platt, Inc. | | | 20,736 | | | |
| | 8,300 | | | Leucadia National Corp. | | | 188,742 | | | |
| | 500 | | | Parker Hannifin Corp. | | | 38,125 | | | |
| | 1,100 | | | Pentair, Inc. | | | 36,619 | | | |
| | 3,000 | | | Textron, Inc. | | | 55,470 | | | |
| | 4,000 | | | Trinity Industries, Inc. | | | 120,240 | | | |
| | 7,200 | | | Tyco International, Ltd. (U.S. Shares) | | | 336,312 | | | |
| | | | | | | | 2,257,401 | | | |
| E-Commerce/Products – 0.8% | | | | | | |
| | 25,200 | | | eBay, Inc.* | | | 764,316 | | | |
| E-Commerce/Services – 0.6% | | | | | | |
| | 2,850 | | | Expedia, Inc. | | | 82,707 | | | |
| | 8,000 | | | IAC/InterActiveCorp | | | 340,800 | | | |
| | 5,800 | | | Liberty Interactive Corp. – Class A* | | | 94,047 | | | |
| | 2,850 | | | TripAdvisor, Inc. | | | 71,848 | | | |
| | | | | | | | 589,402 | | | |
| Electric – Generation – 0.1% | | | | | | |
| | 5,100 | | | AES Corp.* | | | 60,384 | | | |
| Electric – Integrated – 7.9% | | | | | | |
| | 7,400 | | | Alliant Energy Corp. | | | 326,414 | | | |
| | 4,300 | | | Ameren Corp. | | | 142,459 | | | |
| | 7,800 | | | American Electric Power Co., Inc. | | | 322,218 | | | |
| | 11,100 | | | CMS Energy Corp. | | | 245,088 | | | |
| | 3,300 | | | Consolidated Edison, Inc. | | | 204,699 | | | |
| | 9,600 | | | Constellation Energy Group, Inc. | | | 380,832 | | | |
| | 4,600 | | | Dominion Resources, Inc. | | | 244,168 | | | |
| | 4,100 | | | DTE Energy Co. | | | 223,245 | | | |
| | 15,700 | | | Duke Energy Corp. | | | 345,400 | | | |
| | 2,000 | | | Edison International | | | 82,800 | | | |
| | 500 | | | Entergy Corp. | | | 36,525 | | | |
| | 4,300 | | | Exelon Corp. | | | 186,491 | | | |
| | 11,867 | | | FirstEnergy Corp. | | | 525,708 | | | |
| | 3,200 | | | FPL Group, Inc. | | | 194,816 | | | |
| | 1,900 | | | Great Plains Energy, Inc. | | | 41,382 | | | |
| | 2,300 | | | Hawaiian Electric Industries, Inc. | | | 60,904 | | | |
| | 4,800 | | | Integrys Energy Group, Inc. | | | 260,064 | | | |
| | 3,600 | | | MDU Resources Group, Inc. | | | 77,256 | | | |
| | 3,000 | | | National Fuel Gas Co. | | | 166,740 | | | |
| | 11,600 | | | Northeast Utilities | | | 418,412 | | | |
| | 4,300 | | | NSTAR | | | 201,928 | | | |
| | 5,300 | | | OGE Energy Corp. | | | 300,563 | | | |
| | 9,600 | | | Pepco Holdings, Inc. | | | 194,880 | | | |
| | 800 | | | PG&E Corp. | | | 32,976 | | | |
| | 4,200 | | | Pinnacle West Capital Corp. | | | 202,356 | | | |
| | 7,200 | | | PPL Corp. | | | 211,824 | | | |
| | 6,000 | | | Progress Energy, Inc. | | | 336,120 | | | |
| | 4,500 | | | Public Service Enterprise Group, Inc. | | | 148,545 | | | |
| | 1,800 | | | SCANA Corp. | | | 81,108 | | | |
| | 12,400 | | | Sierra Pacific Resources | | | 202,740 | | | |
| | 7,900 | | | Southern Co. | | | 365,691 | | | |
| | 13,700 | | | TECO Energy, Inc. | | | 262,218 | | | |
| | 3,200 | | | Westar Energy, Inc. | | | 92,096 | | | |
| | 3,800 | | | Wisconsin Energy Corp. | | | 132,848 | | | |
| | 9,600 | | | Xcel Energy, Inc. | | | 265,344 | | | |
| | | | | | | | 7,516,858 | | | |
See Notes to Schedules of Investments and Financial Statements.
Janus Mathematical Funds | 53
INTECH U.S. Value Fund
Schedule of Investments (unaudited)
As of December 31, 2011
| | | | | | | | | | | |
| Shares | | Value | | | |
| |
| Electric Products – Miscellaneous – 0.1% | | | | | | |
| | 3,000 | | | Molex, Inc. | | $ | 71,580 | | | |
| Electronic Components – Miscellaneous – 0.1% | | | | | | |
| | 2,400 | | | Garmin, Ltd. | | | 95,544 | | | |
| | 1,600 | | | Jabil Circuit, Inc. | | | 31,456 | | | |
| | | | | | | | 127,000 | | | |
| Electronic Components – Semiconductors – 0.6% | | | | | | |
| | 3,700 | | | Fairchild Semiconductor International, Inc.* | | | 44,548 | | | |
| | 8,900 | | | Intel Corp. | | | 215,825 | | | |
| | 1,600 | | | International Rectifier Corp.* | | | 31,072 | | | |
| | 3,000 | | | Intersil Corp. – Class A | | | 31,320 | | | |
| | 23,800 | | | LSI Corp.* | | | 141,610 | | | |
| | 4,600 | | | Texas Instruments, Inc. | | | 133,906 | | | |
| | | | | | | | 598,281 | | | |
| Electronic Parts Distributors – 0.1% | | | | | | |
| | 1,300 | | | Avnet, Inc.* | | | 40,417 | | | |
| | 1,400 | | | Tech Data Corp.* | | | 69,174 | | | |
| | | | | | | | 109,591 | | | |
| Electronics – Military – 0.1% | | | | | | |
| | 700 | | | L-3 Communications Holdings, Inc. | | | 46,676 | | | |
| Energy – Alternate Sources – 0.1% | | | | | | |
| | 7,800 | | | Covanta Holding Corp. | | | 106,782 | | | |
| Engineering – Research and Development Services – 0.1% | | | | | | |
| | 3,500 | | | KBR, Inc. | | | 97,545 | | | |
| Enterprise Software/Services – 0% | | | | | | |
| | 1,900 | | | CA, Inc. | | | 38,408 | | | |
| Entertainment Software – 0.4% | | | | | | |
| | 29,500 | | | Activision Blizzard, Inc. | | | 363,440 | | | |
| Fiduciary Banks – 0.2% | | | | | | |
| | 4,224 | | | Bank of New York Mellon Corp. | | | 84,100 | | | |
| | 1,000 | | | Northern Trust Corp. | | | 39,660 | | | |
| | 2,000 | | | State Street Corp. | | | 80,620 | | | |
| | | | | | | | 204,380 | | | |
| Finance – Consumer Loans – 0.2% | | | | | | |
| | 13,400 | | | SLM Corp. | | | 179,560 | | | |
| Finance – Credit Card – 1.2% | | | | | | |
| | 8,900 | | | American Express Co. | | | 419,813 | | | |
| | 30,100 | | | Discover Financial Services | | | 722,400 | | | |
| | | | | | | | 1,142,213 | | | |
| Finance – Investment Bankers/Brokers – 0.3% | | | | | | |
| | 4,800 | | | E*TRADE Financial Corp.* | | | 38,208 | | | |
| | 6,300 | | | Raymond James Financial, Inc. | | | 195,048 | | | |
| | | | | | | | 233,256 | | | |
| Finance – Other Services – 0.1% | | | | | | |
| | 200 | | | CME Group, Inc. | | | 48,734 | | | |
| | 2,100 | | | NASDAQ Stock Market, Inc.* | | | 51,471 | | | |
| | 1,400 | | | NYSE Euronext | | | 36,540 | | | |
| | | | | | | | 136,745 | | | |
| Financial Guarantee Insurance – 0% | | | | | | |
| | 3,000 | | | Assured Guaranty, Ltd. | | | 39,420 | | | |
| Food – Confectionary – 0.7% | | | | | | |
| | 3,200 | | | Hershey Co. | | | 197,696 | | | |
| | 6,100 | | | J.M. Smucker Co. | | | 476,837 | | | |
| | | | | | | | 674,533 | | | |
| Food – Dairy Products – 0.1% | | | | | | |
| | 4,000 | | | Dean Foods Co.* | | | 44,800 | | | |
| Food – Meat Products – 0.4% | | | | | | |
| | 4,000 | | | Hormel Foods Corp. | | | 117,160 | | | |
| | 8,200 | | | Smithfield Foods, Inc.* | | | 199,096 | | | |
| | 5,100 | | | Tyson Foods, Inc. – Class A | | | 105,264 | | | |
| | | | | | | | 421,520 | | | |
| Food – Miscellaneous/Diversified – 3.2% | | | | | | |
| | 700 | | | Campbell Soup Co. | | | 23,268 | | | |
| | 7,000 | | | ConAgra Foods, Inc. | | | 184,800 | | | |
| | 15,000 | | | General Mills, Inc. | | | 606,150 | | | |
| | 9,700 | | | H.J. Heinz Co. | | | 524,188 | | | |
| | 2,100 | | | Kellogg Co. | | | 106,197 | | | |
| | 16,352 | | | Kraft Foods, Inc. – Class A | | | 610,911 | | | |
| | 5,500 | | | McCormick & Co., Inc. | | | 277,310 | | | |
| | 5,100 | | | Ralcorp Holdings, Inc.* | | | 436,050 | | | |
| | 13,400 | | | Sara Lee Corp. | | | 253,528 | | | |
| | | | | | | | 3,022,402 | | | |
| Food – Retail – 0.3% | | | | | | |
| | 9,800 | | | Kroger Co. | | | 237,356 | | | |
| | 10,600 | | | Supervalu, Inc. | | | 86,072 | | | |
| | | | | | | | 323,428 | | | |
| Funeral Services and Related Items – 0.2% | | | | | | |
| | 20,900 | | | Service Corp. International | | | 222,585 | | | |
| Gambling – Non-Hotel – 0.1% | | | | | | |
| | 7,200 | | | International Game Technology | | | 123,840 | | | |
| Gas – Transportation – 2.2% | | | | | | |
| | 3,400 | | | AGL Resources, Inc. | | | 143,684 | | | |
| | 3,700 | | | Atmos Energy Corp. | | | 123,395 | | | |
| | 27,400 | | | CenterPoint Energy, Inc. | | | 550,466 | | | |
| | 25,200 | | | NiSource, Inc. | | | 600,012 | | | |
| | 6,500 | | | Questar Corp. | | | 129,090 | | | |
| | 1,400 | | | Sempra Energy | | | 77,000 | | | |
| | 7,400 | | | Southern Union Co. | | | 311,614 | | | |
| | 1,500 | | | UGI Corp. | | | 44,100 | | | |
| | 3,400 | | | Vectren Corp. | | | 102,782 | | | |
| | | | | | | | 2,082,143 | | | |
| Gold Mining – 0.4% | | | | | | |
| | 6,200 | | | Newmont Mining Corp. | | | 372,062 | | | |
| Home Decoration Products – 0% | | | | | | |
| | 2,200 | | | Newell Rubbermaid, Inc. | | | 35,530 | | | |
| Hotels and Motels – 0.2% | | | | | | |
| | 800 | | | Hyatt Hotels Corp.* | | | 30,112 | | | |
| | 4,900 | | | Wyndham Worldwide Corp. | | | 185,367 | | | |
| | | | | | | | 215,479 | | | |
| Independent Power Producer – 0.5% | | | | | | |
| | 18,400 | | | Calpine Corp.* | | | 300,472 | | | |
| | 10,100 | | | NRG Energy, Inc.* | | | 183,012 | | | |
| | | | | | | | 483,484 | | | |
| Instruments – Scientific – 0.2% | | | | | | |
| | 4,300 | | | Thermo Fisher Scientific, Inc.* | | | 193,371 | | | |
| Insurance Brokers – 1.0% | | | | | | |
| | 13,100 | | | AON Corp. | | | 613,080 | | | |
| | 3,300 | | | Arthur J. Gallagher & Co. | | | 110,352 | | | |
| | 6,600 | | | Marsh & McLennan Cos., Inc. | | | 208,692 | | | |
| | | | | | | | 932,124 | | | |
See Notes to Schedules of Investments and Financial Statements.
54 | DECEMBER 31, 2011
Schedule of Investments (unaudited)
As of December 31, 2011
| | | | | | | | | | | |
| Shares | | Value | | | |
| |
| Investment Companies – 0.1% | | | | | | |
| | 6,100 | | | American Capital Strategies, Ltd.* | | $ | 41,053 | | | |
| | 4,900 | | | Ares Capital Corp. | | | 75,705 | | | |
| | | | | | | | 116,758 | | | |
| Investment Management and Advisory Services – 0.6% | | | | | | |
| | 400 | | | Affiliated Managers Group, Inc.* | | | 38,380 | | | |
| | 6,900 | | | Ameriprise Financial, Inc. | | | 342,516 | | | |
| | 500 | | | BlackRock, Inc. | | | 89,120 | | | |
| | 1,300 | | | INVESCO, Ltd. | | | 26,117 | | | |
| | 1,300 | | | Legg Mason, Inc. | | | 31,265 | | | |
| | | | | | | | 527,398 | | | |
| Life and Health Insurance – 0.9% | | | | | | |
| | 3,900 | | | Aflac, Inc. | | | 168,714 | | | |
| | 900 | | | Lincoln National Corp. | | | 17,478 | | | |
| | 1,700 | | | Principal Financial Group, Inc. | | | 41,820 | | | |
| | 3,300 | | | Prudential Financial, Inc. | | | 165,396 | | | |
| | 6,900 | | | Torchmark Corp. | | | 299,391 | | | |
| | 8,100 | | | Unum Group | | | 170,667 | | | |
| | | | | | | | 863,466 | | | |
| Linen Supply & Related Items – 0.3% | | | | | | |
| | 7,000 | | | Cintas Corp. | | | 243,670 | | | |
| Machine Tools and Related Products – 0.2% | | | | | | |
| | 2,900 | | | Kennametal, Inc. | | | 105,908 | | | |
| | 1,300 | | | Lincoln Electric Holdings, Inc. | | | 50,856 | | | |
| | | | | | | | 156,764 | | | |
| Machinery – Farm – 0.1% | | | | | | |
| | 2,800 | | | AGCO Corp.* | | | 120,316 | | | |
| Machinery – General Industrial – 0% | | | | | | |
| | 600 | | | IDEX Corp. | | | 22,266 | | | |
| Machinery – Pumps – 0% | | | | | | |
| | 1,100 | | | Xylem, Inc. | | | 28,259 | | | |
| Medical – Biomedical and Genetic – 0.5% | | | | | | |
| | 5,800 | | | Amgen, Inc. | | | 372,418 | | | |
| | 900 | | | Bio-Rad Laboratories, Inc.* | | | 86,436 | | | |
| | | | | | | | 458,854 | | | |
| Medical – Drugs – 3.7% | | | | | | |
| | 4,100 | | | Abbott Laboratories | | | 230,543 | | | |
| | 15,800 | | | Bristol-Myers Squibb Co. | | | 556,792 | | | |
| | 9,200 | | | Eli Lilly & Co. | | | 382,352 | | | |
| | 6,100 | | | Forest Laboratories, Inc.* | | | 184,586 | | | |
| | 9,600 | | | Johnson & Johnson | | | 629,568 | | | |
| | 7,075 | | | Merck & Co., Inc. | | | 266,728 | | | |
| | 56,371 | | | Pfizer, Inc. | | | 1,219,868 | | | |
| | | | | | | | 3,470,437 | | | |
| Medical – Generic Drugs – 0.1% | | | | | | |
| | 1,300 | | | Mylan, Inc.* | | | 27,898 | | | |
| | 900 | | | Watson Pharmaceuticals, Inc.* | | | 54,306 | | | |
| | | | | | | | 82,204 | | | |
| Medical – HMO – 3.3% | | | | | | |
| | 13,600 | | | Aetna, Inc. | | | 573,784 | | | |
| | 12,500 | | | Cigna Corp. | | | 525,000 | | | |
| | 10,800 | | | Coventry Health Care, Inc.* | | | 327,996 | | | |
| | 1,400 | | | Health Net, Inc.* | | | 42,588 | | | |
| | 10,400 | | | Humana, Inc. | | | 911,144 | | | |
| | 10,600 | | | UnitedHealth Group, Inc. | | | 537,208 | | | |
| | 2,900 | | | WellPoint, Inc. | | | 192,125 | | | |
| | | | | | | | 3,109,845 | | | |
| Medical – Hospitals – 0.1% | | | | | | |
| | 1,100 | | | HCA Holdings, Inc.* | | | 24,233 | | | |
| | 2,900 | | | LifePoint Hospitals, Inc.* | | | 107,735 | | | |
| | | | | | | | 131,968 | | | |
| Medical – Wholesale Drug Distributors – 0.5% | | | | | | |
| | 11,400 | | | Cardinal Health, Inc. | | | 462,954 | | | |
| Medical Information Systems – 0% | | | | | | |
| | 1,700 | | | Allscripts Healthcare Solutions, Inc.* | | | 32,198 | | | |
| Medical Instruments – 0.1% | | | | | | |
| | 12,500 | | | Boston Scientific Corp.* | | | 66,750 | | | |
| | 1,500 | | | Medtronic, Inc. | | | 57,375 | | | |
| | | | | | | | 124,125 | | | |
| Medical Labs and Testing Services – 0% | | | | | | |
| | 200 | | | Quest Diagnostics, Inc. | | | 11,612 | | | |
| Medical Products – 1.4% | | | | | | |
| | 5,000 | | | Baxter International, Inc. | | | 247,400 | | | |
| | 2,500 | | | Carefusion Corp.* | | | 63,525 | | | |
| | 3,800 | | | Cooper Cos., Inc. | | | 267,976 | | | |
| | 5,000 | | | Covidien PLC (U.S. Shares) | | | 225,050 | | | |
| | 1,400 | | | Henry Schein, Inc.* | | | 90,202 | | | |
| | 900 | | | Teleflex, Inc. | | | 55,161 | | | |
| | 6,300 | | | Zimmer Holdings, Inc. | | | 336,546 | | | |
| | | | | | | | 1,285,860 | | | |
| Metal – Aluminum – 0.1% | | | | | | |
| | 14,400 | | | Alcoa, Inc. | | | 124,560 | | | |
| Metal Processors and Fabricators – 0% | | | | | | |
| | 600 | | | Timken Co. | | | 23,226 | | | |
| Miscellaneous Manufacturing – 0.1% | | | | | | |
| | 1,900 | | | Aptargroup, Inc. | | | 99,123 | | | |
| Multi-Line Insurance – 1.9% | | | | | | |
| | 6,500 | | | ACE, Ltd. (U.S. Shares) | | | 455,780 | | | |
| | 5,400 | | | Allstate Corp. | | | 148,014 | | | |
| | 3,800 | | | American Financial Group, Inc. | | | 140,182 | | | |
| | 1,300 | | | American International Group, Inc.* | | | 30,160 | | | |
| | 4,000 | | | Assurant, Inc. | | | 164,240 | | | |
| | 6,600 | | | Cincinnati Financial Corp. | | | 201,036 | | | |
| | 9,700 | | | Loews Corp. | | | 365,205 | | | |
| | 2,100 | | | MetLife, Inc. | | | 65,478 | | | |
| | 2,500 | | | Unitrin, Inc. | | | 73,025 | | | |
| | 7,200 | | | XL Capital, Ltd. | | | 142,344 | | | |
| | | | | | | | 1,785,464 | | | |
| Multimedia – 2.1% | | | | | | |
| | 4,900 | | | McGraw-Hill Cos., Inc. | | | 220,353 | | | |
| | 17,600 | | | News Corp. – Class A | | | 313,984 | | | |
| | 20,900 | | | Time Warner, Inc. | | | 755,326 | | | |
| | 17,600 | | | Walt Disney Co. | | | 660,000 | | | |
| | | | | | | | 1,949,663 | | | |
| Networking Products – 0.8% | | | | | | |
| | 41,700 | | | Cisco Systems, Inc. | | | 753,936 | | | |
| Non-Ferrous Metals – 0% | | | | | | |
| | 1,500 | | | Titanium Metals Corp. | | | 22,470 | | | |
See Notes to Schedules of Investments and Financial Statements.
Janus Mathematical Funds | 55
INTECH U.S. Value Fund
Schedule of Investments (unaudited)
As of December 31, 2011
| | | | | | | | | | | |
| Shares | | Value | | | |
| |
| Non-Hazardous Waste Disposal – 0.2% | | | | | | |
| | 3,000 | | | Republic Services, Inc. | | $ | 82,650 | | | |
| | 1,100 | | | Waste Connections, Inc. | | | 36,454 | | | |
| | 3,100 | | | Waste Management, Inc. | | | 101,401 | | | |
| | | | | | | | 220,505 | | | |
| Office Automation and Equipment – 0% | | | | | | |
| | 500 | | | Pitney Bowes, Inc. | | | 9,270 | | | |
| Oil – Field Services – 0.9% | | | | | | |
| | 1,900 | | | Atwood Oceanics, Inc.* | | | 75,601 | | | |
| | 15,100 | | | Baker Hughes, Inc. | | | 734,464 | | | |
| | 600 | | | Oil States International, Inc.* | | | 45,822 | | | |
| | 200 | | | SEACOR Holdings, Inc. | | | 17,792 | | | |
| | | | | | | | 873,679 | | | |
| Oil and Gas Drilling – 0.3% | | | | | | |
| | 400 | | | Diamond Offshore Drilling, Inc. | | | 22,104 | | | |
| | 800 | | | Nabors Industries, Ltd.* | | | 13,872 | | | |
| | 4,000 | | | Patterson-UTI Energy, Inc. | | | 79,920 | | | |
| | 1,700 | | | Rowan Cos., Inc.* | | | 51,561 | | | |
| | 1,400 | | | Unit Corp.* | | | 64,960 | | | |
| | | | | | | | 232,417 | | | |
| Oil Companies – Exploration and Production – 2.8% | | | | | | |
| | 3,000 | | | Anadarko Petroleum Corp. | | | 228,990 | | | |
| | 1,524 | | | Apache Corp. | | | 138,044 | | | |
| | 21,000 | | | Chesapeake Energy Corp. | | | 468,090 | | | |
| | 1,800 | | | Devon Energy Corp. | | | 111,600 | | | |
| | 3,500 | | | Energen Corp. | | | 175,000 | | | |
| | 4,000 | | | EQT Corp. | | | 219,160 | | | |
| | 700 | | | Noble Energy, Inc. | | | 66,073 | | | |
| | 9,200 | | | Occidental Petroleum Corp. | | | 862,040 | | | |
| | 1,600 | | | Pioneer Natural Resources Co. | | | 143,168 | | | |
| | 2,200 | | | Plains Exploration & Production Co.* | | | 80,784 | | | |
| | 1,700 | | | QEP Resources, Inc. | | | 49,810 | | | |
| | 1,500 | | | SM Energy Co. | | | 109,650 | | | |
| | | | | | | | 2,652,409 | | | |
| Oil Companies – Integrated – 6.9% | | | | | | |
| | 19,900 | | | Chevron Corp. | | | 2,117,360 | | | |
| | 11,093 | | | ConocoPhillips | | | 808,347 | | | |
| | 27,429 | | | Exxon Mobil Corp. | | | 2,324,882 | | | |
| | 500 | | | Hess Corp. | | | 28,400 | | | |
| | 19,700 | | | Marathon Oil Corp. | | | 576,619 | | | |
| | 19,850 | | | Marathon Petroleum Corp. | | | 660,806 | | | |
| | | | | | | | 6,516,414 | | | |
| Oil Field Machinery and Equipment – 0.7% | | | | | | |
| | 2,500 | | | Cameron International Corp.* | | | 122,975 | | | |
| | 7,500 | | | National Oilwell Varco, Inc. | | | 509,925 | | | |
| | | | | | | | 632,900 | | | |
| Oil Refining and Marketing – 0.5% | | | | | | |
| | 2,400 | | | Sunoco, Inc. | | | 98,448 | | | |
| | 11,200 | | | Tesoro Corp.* | | | 261,632 | | | |
| | 4,300 | | | Valero Energy Corp. | | | 90,515 | | | |
| | | | | | | | 450,595 | | | |
| Paper and Related Products – 0.1% | | | | | | |
| | 300 | | | Domtar Corp. (U.S. Shares) | | | 23,988 | | | |
| | 500 | | | International Paper Co. | | | 14,800 | | | |
| | 2,100 | | | MeadWestvaco Corp. | | | 62,895 | | | |
| | | | | | | | 101,683 | | | |
| Pharmacy Services – 0.3% | | | | | | |
| | 7,400 | | | Omnicare, Inc. | | | 254,930 | | | |
| Pipelines – 2.3% | | | | | | |
| | 6,000 | | | El Paso Corp. | | | 159,420 | | | |
| | 1,200 | | | Kinder Morgan, Inc. | | | 38,604 | | | |
| | 10,100 | | | Oneok, Inc. | | | 875,569 | | | |
| | 12,500 | | | Spectra Energy Corp. | | | 384,375 | | | |
| | 23,300 | | | Williams Cos., Inc. | | | 769,366 | | | |
| | | | | | | | 2,227,334 | | | |
| Power Converters and Power Supply Equipment – 0.1% | | | | | | |
| | 1,100 | | | Hubbell, Inc. – Class A | | | 73,546 | | | |
| Printing – Commercial – 0% | | | | | | |
| | 2,500 | | | R.R. Donnelley & Sons Co. | | | 36,075 | | | |
| Private Corrections – 0% | | | | | | |
| | 1,600 | | | Corrections Corp. of America* | | | 32,592 | | | |
| Professional Sports – 0.1% | | | | | | |
| | 1,500 | | | Madison Square Garden, Inc.* | | | 42,960 | | | |
| Property and Casualty Insurance – 2.3% | | | | | | |
| | 302 | | | Alleghany Corp.* | | | 86,157 | | | |
| | 11,400 | | | Arch Capital Group, Ltd.* | | | 424,422 | | | |
| | 6,200 | | | Chubb Corp. | | | 429,164 | | | |
| | 8,000 | | | Fidelity National Financial, Inc. – Class A | | | 127,440 | | | |
| | 1,400 | | | Hanover Insurance Group, Inc. | | | 48,930 | | | |
| | 2,000 | | | HCC Insurance Holdings, Inc. | | | 55,000 | | | |
| | 300 | | | Markel Corp.* | | | 124,401 | | | |
| | 8,800 | | | Progressive Corp. | | | 171,688 | | | |
| | 3,100 | | | Travelers Cos., Inc. | | | 183,427 | | | |
| | 7,100 | | | W. R. Berkley Corp. | | | 244,169 | | | |
| | 700 | | | White Mountains Insurance Group, Ltd. | | | 317,422 | | | |
| | | | | | | | 2,212,220 | | | |
| Publishing – Newspapers – 0.1% | | | | | | |
| | 2,800 | | | Gannett Co., Inc. | | | 37,436 | | | |
| | 200 | | | Washington Post Co. – Class B | | | 75,362 | | | |
| | | | | | | | 112,798 | | | |
| Publishing – Periodicals – 0% | | | | | | |
| | 800 | | | Nielsen Holdings N.V.* | | | 23,752 | | | |
| Racetracks – 0.2% | | | | | | |
| | 4,500 | | | Penn National Gaming, Inc.* | | | 171,315 | | | |
| Real Estate Operating/Development – 0% | | | | | | |
| | 3,300 | | | Forest City Enterprises, Inc. – Class A* | | | 39,006 | | | |
| Reinsurance – 2.3% | | | | | | |
| | 800 | | | Allied World Assurance Co. Holdings, Ltd. | | | 50,344 | | | |
| | 1,300 | | | Aspen Insurance Holdings, Ltd. | | | 34,450 | | | |
| | 1,300 | | | Axis Capital Holdings, Ltd. | | | 41,548 | | | |
| | 18,600 | | | Berkshire Hathaway, Inc. – Class B* | | | 1,419,180 | | | |
| | 600 | | | Everest Re Group, Ltd. | | | 50,454 | | | |
| | 5,500 | | | Reinsurance Group of America, Inc. | | | 287,375 | | | |
| | 1,400 | | | RenaissanceRe Holdings, Ltd. | | | 104,118 | | | |
| | 2,600 | | | Transatlantic Holdings, Inc. | | | 142,298 | | | |
| | 1,500 | | | Validus Holdings, Ltd. | | | 47,250 | | | |
| | | | | | | | 2,177,017 | | | |
| REIT – Apartments – 1.7% | | | | | | |
| | 1,700 | | | Apartment Investment & Management Co. – Class A | | | 38,947 | | | |
| | 2,500 | | | Avalonbay Communities, Inc. | | | 326,500 | | | |
| | 4,300 | | | BRE Properties, Inc. – Class A | | | 217,064 | | | |
| | 4,000 | | | Camden Property Trust | | | 248,960 | | | |
See Notes to Schedules of Investments and Financial Statements.
56 | DECEMBER 31, 2011
Schedule of Investments (unaudited)
As of December 31, 2011
| | | | | | | | | | | |
| Shares | | Value | | | |
| |
| REIT – Apartments – (continued) | | | | | | |
| | | | | | | | | | | |
| | 6,400 | | | Equity Residential | | $ | 364,992 | | | |
| | 1,000 | | | Essex Property Trust, Inc. | | | 140,510 | | | |
| | 10,600 | | | UDR, Inc. | | | 266,060 | | | |
| | | | | | | | 1,603,033 | | | |
| REIT – Diversified – 0.4% | | | | | | |
| | 10,900 | | | Duke Realty Corp. | | | 131,345 | | | |
| | 700 | | | Liberty Property Trust | | | 21,616 | | | |
| | 1,300 | | | Plum Creek Timber Co., Inc. | | | 47,528 | | | |
| | 200 | | | Vornado Realty Trust | | | 15,372 | | | |
| | 10,040 | | | Weyerhaeuser Co. | | | 187,447 | | | |
| | | | | | | | 403,308 | | | |
| REIT – Health Care – 0.6% | | | | | | |
| | 4,700 | | | HCP, Inc. | | | 194,721 | | | |
| | 1,700 | | | Heath Care REIT, Inc. | | | 92,701 | | | |
| | 2,400 | | | Senior Housing Property Trust | | | 53,856 | | | |
| | 4,562 | | | Ventas, Inc. | | | 251,503 | | | |
| | | | | | | | 592,781 | | | |
| REIT – Hotels – 0.2% | | | | | | |
| | 6,400 | | | Hospitality Properties Trust | | | 147,072 | | | |
| REIT – Mortgage – 0.5% | | | | | | |
| | 4,500 | | | American Capital Agency Corp. | | | 126,360 | | | |
| | 24,300 | | | Annaly Mortgage Management, Inc. | | | 387,828 | | | |
| | | | | | | | 514,188 | | | |
| REIT – Office Property – 0.4% | | | | | | |
| | 200 | | | Alexandria Real Estate Equities, Inc. | | | 13,794 | | | |
| | 2,000 | | | Boston Properties, Inc. | | | 199,200 | | | |
| | 5,200 | | | Douglas Emmett, Inc. | | | 94,848 | | | |
| | 3,100 | | | Piedmont Office Realty Trust, Inc. | | | 52,824 | | | |
| | 800 | | | SL Green Realty Corp. | | | 53,312 | | | |
| | | | | | | | 413,978 | | | |
| REIT – Regional Malls – 0.7% | | | | | | |
| | 3,100 | | | General Growth Properties, Inc. | | | 46,562 | | | |
| | 1,300 | | | Macerich Co. | | | 65,780 | | | |
| | 2,723 | | | Simon Property Group, Inc. | | | 351,104 | | | |
| | 3,400 | | | Taubman Centers, Inc. | | | 211,140 | | | |
| | | | | | | | 674,586 | | | |
| REIT – Shopping Centers – 0.1% | | | | | | |
| | 2,600 | | | Developers Diversified Realty Corp. | | | 31,642 | | | |
| | 800 | | | Federal Realty Investment Trust | | | 72,600 | | | |
| | 400 | | | Regency Centers Corp. | | | 15,048 | | | �� |
| | | | | | | | 119,290 | | | |
| REIT – Storage – 0.1% | | | | | | |
| | 600 | | | Public Storage | | | 80,676 | | | |
| REIT – Warehouse and Industrial – 0.1% | | | | | | |
| | 4,630 | | | Prologis, Inc. | | | 132,372 | | | |
| Rental Auto/Equipment – 0.1% | | | | | | |
| | 1,800 | | | Aaron Rents, Inc. | | | 48,024 | | | |
| Retail – Apparel and Shoe – 0.6% | | | | | | |
| | 1,200 | | | Abercrombie & Fitch Co. – Class A | | | 58,608 | | | |
| | 1,800 | | | American Eagle Outfitters, Inc. | | | 27,522 | | | |
| | 6,100 | | | Chico’s FAS, Inc. | | | 67,954 | | | |
| | 7,100 | | | Foot Locker, Inc. | | | 169,264 | | | |
| | 5,400 | | | Gap, Inc. | | | 100,170 | | | |
| | 2,400 | | | PVH Corp. | | | 169,176 | | | |
| | | | | | | | 592,694 | | | |
| Retail – Automobile – 0.2% | | | | | | |
| | 2,800 | | | AutoNation, Inc.* | | | 103,236 | | | |
| | 1,800 | | | Carmax, Inc.* | | | 54,864 | | | |
| | | | | | | | 158,100 | | | |
| Retail – Building Products – 0.3% | | | | | | |
| | 6,100 | | | Home Depot, Inc. | | | 256,444 | | | |
| Retail – Computer Equipment �� 0.2% | | | | | | |
| | 6,800 | | | GameStop Corp. – Class A* | | | 164,084 | | | |
| Retail – Consumer Electronics – 0% | | | | | | |
| | 1,000 | | | Best Buy Co., Inc. | | | 23,370 | | | |
| Retail – Discount – 1.1% | | | | | | |
| | 3,400 | | | Big Lots, Inc.* | | | 128,384 | | | |
| | 6,400 | | | Target Corp. | | | 327,808 | | | |
| | 10,100 | | | Wal-Mart Stores, Inc. | | | 603,576 | | | |
| | | | | | | | 1,059,768 | | | |
| Retail – Drug Store – 0.3% | | | | | | |
| | 5,500 | | | CVS Caremark Corp. | | | 224,290 | | | |
| | 1,100 | | | Walgreen Co. | | | 36,366 | | | |
| | | | | | | | 260,656 | | | |
| Retail – Jewelry – 0.1% | | | | | | |
| | 2,900 | | | Signet Jewelers, Ltd. | | | 127,484 | | | |
| Retail – Mail Order – 0% | | | | | | |
| | 900 | | | Williams-Sonoma, Inc. | | | 34,650 | | | |
| Retail – Major Department Stores – 0.2% | | | | | | |
| | 4,300 | | | JC Penney Co., Inc. | | | 151,145 | | | |
| | 2,300 | | | Sears Holdings Corp.* | | | 73,094 | | | |
| | | | | | | | 224,239 | | | |
| Retail – Office Supplies – 0.1% | | | | | | |
| | 3,400 | | | Staples, Inc. | | | 47,226 | | | |
| Retail – Regional Department Stores – 0.7% | | | | | | |
| | 2,200 | | | Dillard’s, Inc. – Class A | | | 98,736 | | | |
| | 200 | | | Kohl’s Corp. | | | 9,870 | | | |
| | 16,000 | | | Macy’s, Inc. | | | 514,880 | | | |
| | | | | | | | 623,486 | | | |
| Retail – Restaurants – 0.1% | | | | | | |
| | 16,100 | | | Wendy’s Co. | | | 86,296 | | | |
| Savings/Loan/Thrifts – 0.4% | | | | | | |
| | 3,100 | | | Capitol Federal Financial | | | 35,774 | | | |
| | 4,200 | | | Hudson City Bancorp., Inc. | | | 26,250 | | | |
| | 10,300 | | | New York Community Bancorp., Inc. | | | 127,411 | | | |
| | 6,400 | | | People’s United Financial, Inc. | | | 82,240 | | | |
| | 6,100 | | | Washington Federal, Inc. | | | 85,339 | | | |
| | | | | | | | 357,014 | | | |
| Schools – 0% | | | | | | |
| | 600 | | | Devry, Inc. | | | 23,076 | | | |
| Semiconductor Components/Integrated Circuits – 0% | | | | | | |
| | 2,700 | | | Marvell Technology Group, Ltd.* | | | 37,395 | | | |
| Semiconductor Equipment – 0.4% | | | | | | |
| | 7,500 | | | Applied Materials, Inc. | | | 80,325 | | | |
| | 2,400 | | | KLA-Tencor Corp. | | | 115,800 | | | |
| | 1,300 | | | Novellus Systems, Inc.* | | | 53,677 | | | |
| | 7,900 | | | Teradyne, Inc.* | | | 107,677 | | | |
| | | | | | | | 357,479 | | | |
See Notes to Schedules of Investments and Financial Statements.
Janus Mathematical Funds | 57
INTECH U.S. Value Fund
Schedule of Investments (unaudited)
As of December 31, 2011
| | | | | | | | | | | |
| Shares | | Value | | | |
| |
| Soap and Cleaning Preparations – 0.1% | | | | | | |
| | 2,300 | | | Church & Dwight Co., Inc. | | $ | 105,248 | | | |
| Steel – Producers – 0% | | | | | | |
| | 700 | | | Nucor Corp. | | | 27,699 | | | |
| Super-Regional Banks – 1.9% | | | | | | |
| | 9,400 | | | Capital One Financial Corp. | | | 397,526 | | | |
| | 1,800 | | | Comerica, Inc. | | | 46,440 | | | |
| | 13,700 | | | Fifth Third Bancorp. | | | 174,264 | | | |
| | 11,500 | | | Huntington Bancshares, Inc. | | | 63,135 | | | |
| | 7,800 | | | Keycorp | | | 59,982 | | | |
| | 2,383 | | | PNC Financial Services Group, Inc. | | | 137,428 | | | |
| | 2,300 | | | SunTrust Banks, Inc. | | | 40,710 | | | |
| | 13,000 | | | U.S. Bancorp. | | | 351,650 | | | |
| | 17,861 | | | Wells Fargo & Co. | | | 492,249 | | | |
| | | | | | | | 1,763,384 | | | |
| Telecommunication Equipment – 0% | | | | | | |
| | 9,500 | | | Tellabs, Inc. | | | 38,380 | | | |
| Telecommunication Services – 0.1% | | | | | | |
| | 2,400 | | | Amdocs, Ltd. (U.S. Shares)* | | | 68,472 | | | |
| Telephone – Integrated – 3.0% | | | | | | |
| | 50,110 | | | AT&T, Inc. | | | 1,515,327 | | | |
| | 17,662 | | | CenturyLink, Inc. | | | 657,026 | | | |
| | 13,944 | | | Verizon Communications, Inc. | | | 559,433 | | | |
| | 7,000 | | | Windstream Corp. | | | 82,180 | | | |
| | | | | | | | 2,813,966 | | | |
| Television – 1.1% | | | | | | |
| | 38,600 | | | CBS Corp. – Class B | | | 1,047,604 | | | |
| Tobacco – 2.9% | | | | | | |
| | 20,100 | | | Altria Group, Inc. | | | 595,965 | | | |
| | 7,200 | | | Lorillard, Inc. | | | 820,800 | | | |
| | 9,200 | | | Philip Morris International, Inc. | | | 722,016 | | | |
| | 15,100 | | | Reynolds American, Inc. | | | 625,442 | | | |
| | | | | | | | 2,764,223 | | | |
| Tools – Hand Held – 0.4% | | | | | | |
| | 1,000 | | | Snap-On, Inc. | | | 50,620 | | | |
| | 4,255 | | | Stanley Works | | | 287,638 | | | |
| | | | | | | | 338,258 | | | |
| Toys – 0.1% | | | | | | |
| | 4,500 | | | Mattel, Inc. | | | 124,920 | | | |
| Transportation – Equipment & Leasing – 0.1% | | | | | | |
| | 2,200 | | | GATX Corp. | | | 96,052 | | | |
| Transportation – Marine – 0.2% | | | | | | |
| | 1,600 | | | Alexander & Baldwin, Inc. | | | 65,312 | | | |
| | 2,100 | | | Kirby Corp.* | | | 138,264 | | | |
| | | | | | | | 203,576 | | | |
| Transportation – Railroad – 0.6% | | | | | | |
| | 2,600 | | | Kansas City Southern* | | | 176,826 | | | |
| | 2,800 | | | Norfolk Southern Corp. | | | 204,008 | | | |
| | 1,400 | | | Union Pacific Corp. | | | 148,316 | | | |
| | | | | | | | 529,150 | | | |
| Transportation – Services – 0.1% | | | | | | |
| | 2,000 | | | Ryder System, Inc. | | | 106,280 | | | |
| Transportation – Truck – 0% | | | | | | |
| | 1,100 | | | Con-way, Inc. | | | 32,076 | | | |
| Veterinary Diagnostics – 0.1% | | | | | | |
| | 2,300 | | | VCA Antech, Inc.* | | | 45,425 | | | |
| Vitamins and Nutrition Products – 0.5% | | | | | | |
| | 7,500 | | | Mead Johnson Nutrition Co. – Class A | | | 515,475 | | | |
| Water – 0.6% | | | | | | |
| | 14,700 | | | American Water Works Co., Inc. | | | 468,342 | | | |
| | 4,100 | | | Aqua America, Inc. | | | 90,405 | | | |
| | | | | | | | 558,747 | | | |
| Web Portals/Internet Service Providers – 0% | | | | | | |
| | 1,800 | | | AOL, Inc.* | | | 27,180 | | | |
| Wireless Equipment – 1.0% | | | | | | |
| | 7,500 | | | Motorola Mobility Holdings, Inc.* | | | 291,000 | | | |
| | 13,985 | | | Motorola, Inc. | | | 647,366 | | | |
| | | | | | | | 938,366 | | | |
| X-Ray Equipment – 0.2% | | | | | | |
| | 11,200 | | | Hologic, Inc.* | | | 196,112 | | | |
| |
| |
| Total Common Stock (cost $84,389,833) | | | 94,475,226 | | | |
| |
| |
| Money Market – 0.5% | | | | | | |
| | 443,161 | | | Janus Cash Liquidity Fund LLC, 0%
(cost $443,161) | | | 443,161 | | | |
| |
| |
| Total Investments (total cost $84,832,994) – 99.9% | | | 94,918,387 | | | |
| |
| |
| Cash, Receivables and Other Assets, net of Liabilities – 0.1% | | | 141,073 | | | |
| |
| |
| Net Assets – 100% | | $ | 95,059,460 | | | |
| |
| |
Summary of Investments by Country – (Long Positions)
| | | | | | | | | |
| | | | | | % of Investment
| |
| Country | | Value | | | Securities | |
| |
| |
| Bermuda | | $ | 1,351,572 | | | | 1.4% | |
| Guernsey | | | 68,472 | | | | 0.1% | |
| Ireland | | | 367,394 | | | | 0.4% | |
| Netherlands | | | 209,287 | | | | 0.2% | |
| Panama | | | 97,218 | | | | 0.1% | |
| Switzerland | | | 937,980 | | | | 1.0% | |
United States†† | | | 91,886,464 | | | | 96.8% | |
| |
| |
| Total | | $ | 94,918,387 | | | | 100.0% | |
| | | |
| †† | | Includes Cash Equivalents (96.3% excluding Cash Equivalents). |
See Notes to Schedules of Investments and Financial Statements.
58 | DECEMBER 31, 2011
[This page intentionally left blank.]
Janus Mathematical Funds | 59
Statements of Assets and Liabilities
| | | | | | | | | | | | | | | | | | | | | |
As of December 31, 2011 (unaudited)
| | | | | | | | | | |
| (all numbers in thousands except net asset value per share) | | INTECH Global Dividend Fund | | INTECH International Fund(1) | | INTECH U.S. Core Fund(2) | | INTECH U.S. Growth Fund(3) | | INTECH U.S. Value Fund(4) |
|
| |
| Assets: | | | | | | | | | | | | | | | | | | | | |
| Investments at cost | | $ | 5,215 | | | $ | 38,877 | | | $ | 269,818 | | | $ | 262,455 | | | $ | 84,833 | |
| Unaffiliated investments at value | | $ | 5,161 | | | $ | 34,509 | | | $ | 309,300 | | | $ | 311,487 | | | $ | 94,475 | |
| Affiliated investments at value | | | 209 | | | | 2,357 | | | | 1,546 | | | | – | | | | 443 | |
| Cash | | | 29 | | | | – | | | | 91 | | | | – | | | | – | |
| Cash denominated in foreign currency(5) | | | 12 | | | | 178 | | | | – | | | | – | | | | – | |
| Receivables: | | | | | | | | | | | | | | | | | | | | |
| Investments sold | | | – | | | | – | | | | 3,872 | | | | 1,581 | | | | – | |
| Fund shares sold | | | 3 | | | | 44 | | | | 319 | | | | 131 | | | | 97 | |
| Dividends | | | 5 | | | | 42 | | | | 428 | | | | 385 | | | | 184 | |
| Foreign dividend tax reclaim | | | – | | | | 6 | | | | – | | | | – | | | | – | |
| Due from adviser | | | 16 | | | | – | | | | – | | | | – | | | | – | |
| Non-interested Trustees’ deferred compensation | | | – | | | | 1 | | | | 9 | | | | 9 | | | | 3 | |
| Other assets | | | 81 | | | | 1 | | | | 4 | | | | 3 | | | | 2 | |
| Total Assets | | | 5,516 | | | | 37,138 | | | | 315,569 | | | | 313,596 | | | | 95,204 | |
| Liabilities: | | | | | | | | | | | | | | | | | | | | |
| Payables: | | | | | | | | | | | | | | | | | | | | |
| Due to custodian | | | – | | | | 170 | | | | – | | | | 74 | | | | 17 | |
| Investments purchased | | | 21 | | | | 2,200 | | | | – | | | | – | | | | – | |
| Fund shares repurchased | | | – | | | | 42 | | | | 4,239 | | | | 151 | | | | 38 | |
| Dividends | | | – | | | | – | | | | 2 | | | | 1 | | | | – | |
| Advisory fees | | | 1 | | | | 13 | | | | 153 | | | | 133 | | | | 40 | |
| Fund administration fees | | | – | | | | – | | | | 3 | | | | 3 | | | | 1 | |
| Administrative services fees | | | – | | | | – | | | | 33 | | | | 3 | | | | – | |
| Distribution fees and shareholder servicing fees | | | 1 | | | | 1 | | | | 9 | | | | 8 | | | | 1 | |
| Administrative, networking and omnibus fees | | | – | | | | – | | | | 7 | | | | 85 | | | | 1 | |
| Non-interested Trustees’ fees and expenses | | | – | | | | – | | | | 3 | | | | 6 | | | | 1 | |
| Non-interested Trustees’ deferred compensation fees | | | – | | | | 1 | | | | 9 | | | | 9 | | | | 3 | |
| Accrued expenses and other payables | | | 3 | | | | 56 | | | | 216 | | | | 115 | | | | 43 | |
| Total Liabilities | | | 26 | | | | 2,483 | | | | 4,674 | | | | 588 | | | | 145 | |
| Net Assets | | $ | 5,490 | | | $ | 34,655 | | | $ | 310,895 | | | $ | 313,008 | | | $ | 95,059 | |
See footnotes at the end of the Statements.
See Notes to Financial Statements.
60 | DECEMBER 31, 2011
This page intentionally left blank. The content of this page is part of a ‘Double Page Spread’ table and appears on the previous page.
61
Statements of Assets and Liabilities (continued)
| | | | | | | | | | | | | | | | | | | | | |
As of December 31, 2011 (unaudited)
| | | | | | | | | | |
| (all numbers in thousands except net asset value per share) | | INTECH Global Dividend Fund | | INTECH International Fund(1) | | INTECH U.S. Core Fund(2) | | INTECH U.S. Growth Fund(3) | | INTECH U.S. Value Fund(4) |
|
| |
| Net Assets Consist of: | | | | | | | | | | | | | | | | | | | | |
| Capital (par value and paid-in surplus)* | | $ | 5,338 | | | $ | 40,683 | | | $ | 330,165 | | | $ | 520,334 | | | $ | 98,396 | |
| Undistributed net investment income/(loss)* | | | (3) | | | | (34) | | | | 11 | | | | 16 | | | | 317 | |
| Undistributed net realized gain/(loss) from investment and foreign currency transactions* | | | – | | | | (3,982) | | | | (60,308) | | | | (256,373) | | | | (13,739) | |
| Unrealized net appreciation/(depreciation) of investments, foreign currency translations and non-interested Trustees’ deferred compensation | | | 155 | | | | (2,012) | | | | 41,027 | | | | 49,031 | | | | 10,085 | |
| Total Net Assets | | $ | 5,490 | | | $ | 34,655 | | | $ | 310,895 | | | $ | 313,008 | | | $ | 95,059 | |
| Net Assets - Class A Shares | | $ | 859 | | | $ | 433 | | | $ | 14,032 | | | $ | 8,723 | | | $ | 5,103 | |
| Shares Outstanding, $0.01 Par Value (unlimited shares authorized) | | | 83 | | | | 66 | | | | 1,027 | | | | 666 | | | | 539 | |
| Net Asset Value Per Share(6) | | $ | 10.30 | | | $ | 6.60 | | | $ | 13.66 | | | $ | 13.10 | | | $ | 9.47 | |
| Maximum Offering Price Per Share(7) | | $ | 10.93 | | | $ | 7.00 | | | $ | 14.49 | | | $ | 13.90 | | | $ | 10.05 | |
| Net Assets - Class C Shares | | $ | 859 | | | $ | 448 | | | $ | 6,249 | | | $ | 3,120 | | | $ | 177 | |
| Shares Outstanding, $0.01 Par Value (unlimited shares authorized) | | | 83 | | | | 68 | | | | 457 | | | | 246 | | | | 19 | |
| Net Asset Value Per Share(6) | | $ | 10.30 | | | $ | 6.58 | | | $ | 13.68 | | | $ | 12.68 | | | $ | 9.49 | |
| Net Assets - Class D Shares | | $ | 994 | | | | N/A | | | $ | 165,908 | | | | N/A | | | | N/A | |
| Shares Outstanding, $0.01 Par Value (unlimited shares authorized) | | | 96 | | | | N/A | | | | 12,138 | | | | N/A | | | | N/A | |
| Net Asset Value Per Share | | $ | 10.30 | | | | N/A | | | $ | 13.67 | | | | N/A | | | | N/A | |
| Net Assets - Class I Shares | | $ | 859 | | | $ | 33,321 | | | $ | 47,491 | | | $ | 286,135 | | | $ | 89,524 | |
| Shares Outstanding, $0.01 Par Value (unlimited shares authorized) | | | 83 | | | | 5,066 | | | | 3,474 | | | | 22,014 | | | | 9,419 | |
| Net Asset Value Per Share | | $ | 10.30 | | | $ | 6.58 | | | $ | 13.67 | | | $ | 13.00 | | | $ | 9.51 | |
| Net Assets - Class S Shares | | $ | 859 | | | $ | 416 | | | $ | 4,608 | | | $ | 14,950 | | | $ | 207 | |
| Shares Outstanding, $0.01 Par Value (unlimited shares authorized) | | | 83 | | | | 63 | | | | 337 | | | | 1,144 | | | | 22 | |
| Net Asset Value Per Share | | $ | 10.30 | | | $ | 6.60 | | | $ | 13.67 | | | $ | 13.06 | | | $ | 9.49 | |
| Net Assets - Class T Shares | | $ | 1,060 | | | $ | 37 | | | $ | 72,607 | | | $ | 80 | | | $ | 48 | |
| Shares Outstanding, $0.01 Par Value (unlimited shares authorized) | | | 103 | | | | 6 | | | | 5,311 | | | | 6 | | | | 5 | |
| Net Asset Value Per Share | | $ | 10.30 | | | $ | 6.58 | | | $ | 13.67 | | | $ | 12.99 | | | $ | 9.50 | |
| | | |
| * | | See Note 5 in Notes to Financial Statements. |
| (1) | | Formerly named INTECH Risk-Managed International Fund. |
| (2) | | Formerly named INTECH Risk-Managed Core Fund. |
| (3) | | Formerly named INTECH Risk-Managed Growth Fund. |
| (4) | | Formerly named INTECH Risk-Managed Value Fund. |
| (5) | | Includes cost of $11,652 and $178,161 for INTECH Global Dividend Fund and INTECH International Fund, respectively. |
| (6) | | Redemption price per share may be reduced for any applicable contingent deferred sales charge. |
| (7) | | Maximum offering price is computed at 100/94.25 of net asset value. |
| | | |
| | | |
See Notes to Financial Statements.
62 | DECEMBER 31, 2011
This page intentionally left blank. The content of this page is part of a ‘Double Page Spread’ table and appears on the previous page.
63
Statements of Operations
| | | | | | | | | | | | | | | | | | | | | | | | | |
For the six-month period ended December 31, 2011 (unaudited)
| | | | | | | | | | | | |
| (all numbers in thousands) | | INTECH Global Dividend Fund(1) | | INTECH International Fund(2) | | INTECH U.S. Core Fund(3) | | INTECH U.S. Growth Fund(4) | | INTECH U.S. Value Fund(5) | | |
|
| |
| Investment Income: | | | | | | | | | | | | | | | | | | | | | | | | |
| Interest | | $ | – | | | $ | – | | | $ | – | | | $ | – | | | $ | – | | | | | |
| Dividends | | | 5 | | | | 279 | | | | 3,014 | | | | 2,578 | | | | 1,188 | | | | | |
| Dividends from affiliates | | | – | | | | 1 | | | | 1 | | | | 1 | | | | – | | | | | |
| Foreign tax withheld | | | – | | | | (18) | | | | – | | | | (1) | | | | (7) | | | | | |
| Total Investment Income | | | 5 | | | | 262 | | | | 3,015 | | | | 2,578 | | | | 1,181 | | | | | |
| Expenses: | | | | | | | | | | | | | | | | | | | | | | | | |
| Advisory fees | | | 1 | | | | 74 | | | | 849 | | | | 792 | | | | 230 | | | | | |
| Shareholder reports expense | | | – | | | | – | | | | 111 | | | | 26 | | | | 7 | | | | | |
| Transfer agent fees and expenses | | | – | | | | 1 | | | | 49 | | | | 15 | | | | 2 | | | | | |
| Registration fees | | | 13 | | | | 38 | | | | 57 | | | | 41 | | | | 39 | | | | | |
| Custodian fees | | | – | | | | 23 | | | | 1 | | | | 7 | | | | 1 | | | | | |
| Professional fees | | | 3 | | | | 17 | | | | 18 | | | | 17 | | | | 18 | | | | | |
| Non-interested Trustees’ fees and expenses | | | – | | | | – | | | | 4 | | | | 4 | | | | 1 | | | | | |
| Fund administration fees | | | – | | | | 1 | | | | 15 | | | | 16 | | | | 5 | | | | | |
| Administrative services fees - Class D Shares | | | – | | | | N/A | | | | 97 | | | | N/A | | | | N/A | | | | | |
| Administrative services fees - Class S Shares | | | – | | | | 1 | | | | 6 | | | | 18 | | | | – | | | | | |
| Administrative services fees - Class T Shares | | | – | | | | – | | | | 88 | | | | – | | | | – | | | | | |
| Distribution fees and shareholder servicing fees - Class A Shares | | | – | | | | 1 | | | | 17 | | | | 11 | | | | 6 | | | | | |
| Distribution fees and shareholder servicing fees - Class C Shares | | | 1 | | | | 3 | | | | 31 | | | | 16 | | | | 1 | | | | | |
| Distribution fees and shareholder servicing fees - Class S Shares | | | – | | | | 1 | | | | 6 | | | | 18 | | | | – | | | | | |
| Administrative, networking and omnibus fees - Class A Shares | | | – | | | | – | | | | 3 | | | | 2 | | | | 1 | | | | | |
| Administrative, networking and omnibus fees - Class C Shares | | | – | | | | – | | | | 4 | | | | 3 | | | | – | | | | | |
| Administrative, networking and omnibus fees - Class I Shares | | | – | | | | – | | | | 13 | | | | 90 | | | | 5 | | | | | |
| Other expenses | | | – | | | | 6 | | | | 11 | | | | 16 | | | | 8 | | | | | |
| Non-recurring costs (Note 4) | | | N/A | | | | N/A | | | | – | | | | – | | | | N/A | | | | | |
| Costs assumed by Janus Capital Management LLC (Note 4) | | | N/A | | | | N/A | | | | – | | | | – | | | | N/A | | | | | |
| Total Expenses | | | 18 | | | | 166 | | | | 1,380 | | | | 1,092 | | | | 324 | | | | | |
| Expense and Fee Offset | | | – | | | | – | | | | (1) | | | | – | | | | – | | | | | |
| Net Expenses | | | 18 | | | | 166 | | | | 1,379 | | | | 1,092 | | | | 324 | | | | | |
| Less: Excess Expense Reimbursement | | | (16) | | | | (26) | | | | – | | | | – | | | | – | | | | | |
| Net Expenses after Expense Reimbursement | | | 2 | | | | 140 | | | | 1,379 | | | | 1,092 | | | | 324 | | | | | |
| Net Investment Income | | | 3 | | | | 122 | | | | 1,636 | | | | 1,486 | | | | 857 | | | | | |
| Net Realized and Unrealized Gain/(Loss) on Investments: | | | | | | | | | | | | | | | | | | | | | | | | |
| Net realized gain/(loss) from investment and foreign currency transactions | | | – | | | | (1,442) | | | | 4,502 | | | | (6,465) | | | | (2,677) | | | | | |
| Change in unrealized net appreciation/(depreciation) of investments, foreign currency translations and non-interested Trustees’ deferred compensation | | | 155 | | | | (2,592) | | | | (18,088) | | | | (15,831) | | | | (2,201) | | | | | |
| Net Gain/(Loss) on Investments | | | 155 | | | | (4,034) | | | | (13,586) | | | | (22,296) | | | | (4,878) | | | | | |
| Net Increase/(Decrease) in Net Assets Resulting from Operations | | $ | 158 | | | $ | (3,912) | | | $ | (11,950) | | | $ | (20,810) | | | $ | (4,021) | | | | | |
| | | |
| (1) | | Period from December 15, 2011 (inception date) through December 31, 2011. |
| (2) | | Formerly named INTECH Risk-Managed International Fund. |
| (3) | | Formerly named INTECH Risk-Managed Core Fund. |
| (4) | | Formerly named INTECH Risk-Managed Growth Fund. |
| (5) | | Formerly named INTECH Risk-Managed Value Fund. |
| | | |
| | | |
See Notes to Financial Statements.
64 | DECEMBER 31, 2011
This page intentionally left blank. The content of this page is part of a ‘Double Page Spread’ table and appears on the previous page.
65
Statements of Changes in Net Assets
| | | | | | | | | | | | | | | | | | | | | | | | | | | | | | | | | | | | | |
| | | INTECH Global
| | | | | | INTECH U.S.
| | | | | | | | |
For the six-month period ended December 31, 2011 (unaudited) and the fiscal year ended June 30, 2011
| | Dividend Fund | | INTECH International Fund(1) | | Core Fund(2) | | INTECH U.S. Growth Fund(3) | | INTECH U.S. Value Fund(4) |
| (all numbers in thousands) | | 2011(5) | | 2011 | | 2011 | | 2011 | | 2011 | | 2011 | | 2011 | | 2011 | | 2011 |
|
| |
| Operations: | | | | | | | | | | | | | | | | | | | | | | | | | | | | | | | | | | | | |
| Net investment income | | $ | 3 | | | $ | 122 | | | $ | 146 | | | $ | 1,636 | | | $ | 2,791 | | | $ | 1,486 | | | $ | 2,880 | | | $ | 857 | | | $ | 1,449 | |
| Net realized gain/(loss) from investment and foreign currency transactions | | | – | | | | (1,442) | | | | 1,246 | | | | 4,502 | | | | 26,958 | | | | (6,465) | | | | 52,703 | | | | (2,677) | | | | 8,896 | |
| Change in unrealized net appreciation/(depreciation) of investments, foreign currency translations and non-interested Trustees’ deferred compensation | | | 155 | | | | (2,592) | | | | 733 | | | | (18,088) | | | | 56,828 | | | | (15,831) | | | | 51,885 | | | | (2,201) | | | | 11,100 | |
| Net Increase/(Decrease) in Net Assets Resulting from Operations | | | 158 | | | | (3,912) | | | | 2,125 | | | | (11,950) | | | | 86,577 | | | | (20,810) | | | | 107,468 | | | | (4,021) | | | | 21,445 | |
| Dividends and Distributions to Shareholders: | | | | | | | | | | | | | | | | | | | | | | | | | | | | | | | | | | | | |
| Net Investment Income* | | | | | | | | | | | | | | | | | | | | | | | | | | | | | | | | | | | | |
| Class A Shares | | | (1) | | | | (4) | | | | (30) | | | | (130) | | | | (98) | | | | (61) | | | | (80) | | | | (75) | | | | (52) | |
| Class C Shares | | | (1) | | | | (5) | | | | (30) | | | | – | | | | (6) | | | | – | | | | – | | | | – | | | | (3) | |
| Class D Shares | | | (1) | | | | N/A | | | | N/A | | | | (1,628) | | | | (1,637) | | | | N/A | | | | N/A | | | | N/A | | | | N/A | |
| Class I Shares | | | (1) | | | | (300) | | | | (21) | | | | (566) | | | | (597) | | | | (2,545) | | | | (3,799) | | | | (1,531) | | | | (1,105) | |
| Class S Shares | | | (1) | | | | (4) | | | | (30) | | | | (29) | | | | (31) | | | | (72) | | | | (98) | | | | (2) | | | | (2) | |
| Class T Shares | | | (1) | | | | – | | | | – | | | | (646) | | | | (636) | | | | (1) | | | | (1) | | | | – | | | | – | |
| Net Realized Gain/(Loss) from Investment Transactions* | | | | | | | | | | | | | | | | | | | | | | | | | | | | | | | | | | | | |
| Class A Shares | | | – | | | | – | | | | – | | | | – | | | | – | | | | – | | | | – | | | | – | | | | – | |
| Class C Shares | | | – | | | | – | | | | – | | | | – | | | | – | | | | – | | | | – | | | | – | | | | – | |
| Class D Shares | | | – | | | | N/A | | | | N/A | | | | – | | | | – | | | | N/A | | | | N/A | | | | N/A | | | | N/A | |
| Class I Shares | | | – | | | | – | | | | – | | | | – | | | | – | | | | – | | | | – | | | | – | | | | – | |
| Class S Shares | | | – | | | | – | | | | – | | | | – | | | | – | | | | – | | | | – | | | | – | | | | – | |
| Class T Shares | | | – | | | | – | | | | – | | | | – | | | | – | | | | – | | | | – | | | | – | | | | – | |
| Net Decrease from Dividends and Distributions | | | (6) | | | | (313) | | | | (111) | | | | (2,999) | | | | (3,005) | | | | (2,679) | | | | (3,978) | | | | (1,608) | | | | (1,162) | |
See footnotes at the end of the Statements.
See Notes to Financial Statements.
66 | DECEMBER 31, 2011
This page intentionally left blank. The content of this page is part of a ‘Double Page Spread’ table and appears on the previous page.
67
Statements of Changes in Net Assets (continued)
| | | | | | | | | | | | | | | | | | | | | | | | | | | | | | | | | | | | | |
| | | INTECH Global
| | | | | | INTECH U.S.
| | | | | | | | |
For the six-month period ended December 31, 2011 (unaudited) and the fiscal year ended June 30, 2011
| | Dividend Fund | | INTECH International Fund(1) | | Core Fund(2) | | INTECH U.S. Growth Fund(3) | | INTECH U.S. Value Fund(4) |
| (all numbers in thousands) | | 2011(5) | | 2011 | | 2011 | | 2011 | | 2011 | | 2011 | | 2011 | | 2011 | | 2011 |
|
| |
| Capital Share Transactions: | | | | | | | | | | | | | | | | | | | | | | | | | | | | | | | | | | | | |
| Shares Sold | | | | | | | | | | | | | | | | | | | | | | | | | | | | | | | | | | | | |
| Class A Shares | | | 833 | | | | – | | | | – | | | | 1,796 | | | | 3,916 | | | | 1,081 | | | | 1,983 | | | | 663 | | | | 1,061 | |
| Class C Shares | | | 833 | | | | 488 | | | | 71 | | | | 350 | | | | 479 | | | | 281 | | | | 131 | | | | 63 | | | | 136 | |
| Class D Shares | | | 971 | | | | N/A | | | | N/A | | | | 11,864 | | | | 18,484 | | | | N/A | | | | N/A | | | | N/A | | | | N/A | |
| Class I Shares | | | 833 | | | | 18,052 | | | | 19,493 | | | | 2,816 | | | | 9,273 | | | | 12,293 | | | | 35,392 | | | | 3,407 | | | | 16,363 | |
| Class S Shares | | | 833 | | | | 8 | | | | 1 | | | | 788 | | | | 868 | | | | 4,793 | | | | 2,020 | | | | – | | | | – | |
| Class T Shares | | | 1,034 | | | | 1 | | | | 29 | | | | 9,847 | | | | 14,956 | | | | 40 | | | | 51 | | | | 32 | | | | – | |
| Redemption Fees | | | | | | | | | | | | | | | | | | | | | | | | | | | | | | | | | | | | |
| Class D Shares | | | N/A | | | | N/A | | | | N/A | | | | 7 | | | | 5 | | | | N/A | | | | N/A | | | | N/A | | | | N/A | |
| Class I Shares | | | N/A | | | | 24 | | | | – | | | | 4 | | | | 1 | | | | 7 | | | | 10 | | | | – | | | | – | |
| Class S Shares | | | N/A | | | | – | | | | – | | | | – | | | | – | | | | 1 | | | | 1 | | | | – | | | | – | |
| Class T Shares | | | N/A | | | | – | | | | – | | | | 7 | | | | 5 | | | | – | | | | – | | | | – | | | | – | |
| Reinvested Dividends and Distributions | | | | | | | | | | | | | | | | | | | | | | | | | | | | | | | | | | | | |
| Class A Shares | | | 1 | | | | 4 | | | | 30 | | | | 116 | | | | 91 | | | | 55 | | | | 77 | | | | 74 | | | | 52 | |
| Class C Shares | | | 1 | | | | 5 | | | | 30 | | | | – | | | | 2 | | | | – | | | | – | | | | – | | | | 2 | |
| Class D Shares | | | 1 | | | | N/A | | | | N/A | | | | 1,610 | | | | 1,620 | | | | N/A | | | | N/A | | | | N/A | | | | N/A | |
| Class I Shares | | | 1 | | | | 300 | | | | 21 | | | | 395 | | | | 434 | | | | 2,069 | | | | 2,862 | | | | 1,494 | | | | 1,070 | |
| Class S Shares | | | 1 | | | | 4 | | | | 29 | | | | 29 | | | | 31 | | | | 72 | | | | 97 | | | | 2 | | | | 2 | |
| Class T Shares | | | 1 | | | | – | | | | – | | | | 637 | | | | 622 | | | | 1 | | | | – | | | | – | | | | – | |
| Shares Repurchased | | | | | | | | | | | | | | | | | | | | | | | | | | | | | | | | | | | | |
| Class A Shares | | | – | | | | – | | | | (1,693) | | | | (1,766) | | | | (4,178) | | | | (1,005) | | | | (7,675) | | | | (383) | | | | (904) | |
| Class C Shares | | | – | | | | (422) | | | | (1,670) | | | | (574) | | | | (2,079) | | | | (590) | | | | (1,535) | | | | (88) | | | | (343) | |
| Class D Shares | | | (5) | | | | N/A | | | | N/A | | | | (12,737) | | | | (25,970) | | | | N/A | | | | N/A | | | | N/A | | | | N/A | |
| Class I Shares | | | – | | | | (1,929) | | | | (502) | | | | (8,767) | | | | (19,601) | | | | (29,928) | | | | (189,101) | | | | (3,701) | | | | (8,920) | |
| Class S Shares | | | – | | | | – | | | | (1,666) | | | | (857) | | | | (1,197) | | | | (3,174) | | | | (8,161) | | | | – | | | | (59) | |
| Class T Shares | | | – | | | | – | | | | – | | | | (9,003) | | | | (18,434) | | | | (12) | | | | (15) | | | | – | | | | (26) | |
| Net Increase/(Decrease) from Capital Share Transactions | | | 5,338 | | | | 16,535 | | | | 14,173 | | | | (3,438) | | | | (20,672) | | | | (14,016) | | | | (163,863) | | | | 1,563 | | | | 8,434 | |
| Net Increase/(Decrease) in Net Assets | | | 5,490 | | | | 12,310 | | | | 16,187 | | | | (18,387) | | | | 62,900 | | | | (37,505) | | | | (60,373) | | | | (4,066) | | | | 28,717 | |
| Net Assets: | | | | | | | | | | | | | | | | | | | | | | | | | | | | | | | | | | | | |
| Beginning of period | | | – | | | | 22,345 | | | | 6,158 | | | | 329,282 | | | | 266,382 | | | | 350,513 | | | | 410,886 | | | | 99,125 | | | | 70,408 | |
| End of period | | $ | 5,490 | | | $ | 34,655 | | | $ | 22,345 | | | $ | 310,895 | | | $ | 329,282 | | | $ | 313,008 | | | $ | 350,513 | | | $ | 95,059 | | | $ | 99,125 | |
| | | | | | | | | | | | | | | | | | | | | | | | | | | | | | | | | | | | | |
| Undistributed Net Investment Income/(Loss)* | | $ | (3) | | | $ | (34) | | | $ | 158 | | | $ | 11 | | | $ | 1,375 | | | $ | 16 | | | $ | 1,209 | | | $ | 317 | | | $ | 1,068 | |
| | | |
| * | | See Note 5 in Notes to Financial Statements. |
| (1) | | Formerly named INTECH Risk-Managed International Fund. |
| (2) | | Formerly named INTECH Risk-Managed Core Fund. |
| (3) | | Formerly named INTECH Risk-Managed Growth Fund. |
| (4) | | Formerly named INTECH Risk-Managed Value Fund. |
| (5) | | Period from December 15, 2011 (inception date) through December 31, 2011. |
| | | |
| | | |
See Notes to Financial Statements.
68 | DECEMBER 31, 2011
This page intentionally left blank. The content of this page is part of a ‘Double Page Spread’ table and appears on the previous page.
69
Financial Highlights
Class A Shares
| | | | | | | |
| | | INTECH Global
| | |
| | | Dividend Fund | | |
| For a share outstanding during the period ended December 31, 2011 (unaudited) | | 2011(1) | | |
| |
| Net Asset Value, Beginning of Period | | | $10.00 | | | |
| Income from Investment Operations: | | | | | | |
| Net investment income | | | .01 | | | |
| Net gain/(loss) on investments (both realized and unrealized) | | | .30 | | | |
| Total from Investment Operations | | | .31 | | | |
| Less Distributions: | | | | | | |
| Dividends (from net investment income)* | | | (.01) | | | |
| Distributions (from capital gains)* | | | – | | | |
| Total Distributions | | | (.01) | | | |
| Net Asset Value, End of Period | | | $10.30 | | | |
| Total Return** | | | 3.11% | | | |
| Net Assets, End of Period (in thousands) | | | $859 | | | |
| Average Net Assets for the Period (in thousands) | | | $845 | | | |
Ratio of Gross Expenses to Average Net Assets***(2) | | | 1.03% | | | |
Ratio of Net Expenses to Average Net Assets***(2) | | | 1.03% | | | |
| Ratio of Net Investment Income to Average Net Assets*** | | | 1.24% | | | |
| Portfolio Turnover Rate*** | | | 0% | | | |
Class A Shares
| | | | | | | | | | | | | | | | | | | | | | | | | | | |
For a share outstanding during the six-month period ended
| | | | | | | | | | | | | | |
December 31, 2011 (unaudited), the fiscal year ended June 30,
| | | | | | | | | | | | | | |
2011, the eleven-month fiscal period ended June 30, 2010 and
| | INTECH International Fund(3) | | |
| each fiscal year or period ended July 31 | | 2011 | | 2011 | | 2010(4) | | 2009 | | 2008 | | 2007(5) | | |
| |
| Net Asset Value, Beginning of Period | | | $8.10 | | | | $6.16 | | | | $6.56 | | | | $8.97 | | | | $9.93 | | | | $10.00 | | | |
| Income from Investment Operations: | | | | | | | | | | | | | | | | | | | | | | | | | | |
| Net investment income | | | .02 | | | | .66 | | | | .13 | | | | .16 | | | | .20 | | | | .08 | | | |
| Net gain/(loss) on investments (both realized and unrealized) | | | (1.45) | | | | 1.39 | | | | (.47) | | | | (2.31) | | | | (1.01) | | | | (.15) | | | |
| Total from Investment Operations | | | (1.43) | | | | 2.05 | | | | (.34) | | | | (2.15) | | | | (.81) | | | | (.07) | | | |
| Less Distributions: | | | | | | | | | | | | | | | | | | | | | | | | | | |
| Dividends (from net investment income)* | | | (.07) | | | | (.11) | | | | (.06) | | | | (.26) | | | | (.15) | | | | – | | | |
| Distributions (from capital gains)* | | | – | | | | – | | | | – | | | | – | | | | – | | | | – | | | |
| Total Distributions | | | (.07) | | | | (.11) | | | | (.06) | | | | (.26) | | | | (.15) | | | | – | | | |
| Net Asset Value, End of Period | | | $6.60 | | | | $8.10 | | | | $6.16 | | | | $6.56 | | | | $8.97 | | | | $9.93 | | | |
| Total Return** | | | (17.70)% | | | | 33.42% | | | | (5.32)% | | | | (23.53)% | | | | (8.35)% | | | | (0.70)% | | | |
| Net Assets, End of Period (in thousands) | | | $433 | | | | $526 | | | | $1,684 | | | | $1,836 | | | | $2,326 | | | | $2,481 | | | |
| Average Net Assets for the Period (in thousands) | | | $454 | | | | $1,910 | | | | $1,900 | | | | $1,632 | | | | $2,507 | | | | $2,490 | | | |
Ratio of Gross Expenses to Average Net Assets***(2) | | | 1.26% | | | | 1.07%(6) | | | | 0.74%(6) | | | | 0.64%(6) | | | | 0.91% | | | | 0.91% | | | |
Ratio of Net Expenses to Average Net Assets***(2) | | | 1.26% | | | | 1.07%(6) | | | | 0.73%(6) | | | | 0.64%(6) | | | | 0.90% | | | | 0.90% | | | |
| Ratio of Net Investment Income to Average Net Assets*** | | | 0.85% | | | | 2.05% | | | | 1.87% | | | | 2.62% | | | | 1.92% | | | | 3.20% | | | |
| Portfolio Turnover Rate*** | | | 71% | | | | 179% | | | | 130% | | | | 115% | | | | 105% | | | | 140% | | | |
| | | |
| * | | See Note 5 in Notes to Financial Statements. |
| ** | | Total return not annualized for periods of less than one full year. |
| *** | | Annualized for periods of less than one full year. |
| (1) | | Period from December 15, 2011 (inception date) through December 31, 2011. |
| (2) | | See Note 6 in Notes to Financial Statements. |
| (3) | | Formerly named INTECH Risk-Managed International Fund. |
| (4) | | Period from August 1, 2009 through June 30, 2010. The Fund changed its fiscal year end from July 31 to June 30. |
| (5) | | Period from May 2, 2007 (inception date) through July 31, 2007. |
| (6) | | Pursuant to a contractual agreement, Janus waived certain fees and expenses during the period. The Ratio of Gross Expenses to Average Net Assets and Ratio of Net Expenses to Average Net Assets would have been 1.32% and 1.25%, respectively, in 2011, 1.26% and 1.25%, respectively, in 2010 and 0.93% and 0.93%, respectively, in 2009 without the waiver of these fees and expenses. |
See Notes to Financial Statements.
70 | DECEMBER 31, 2011
Class A Shares
| | | | | | | | | | | | | | | | | | | |
For a share outstanding during the six-month period ended December 31, 2011
| | | | | | | | | | |
(unaudited), the fiscal year ended June 30, 2011, the eight-month fiscal period ended
| | INTECH U.S. Core Fund(1) | | |
| June 30, 2010 and the fiscal period ended October 31, 2009 | | 2011 | | 2011 | | 2010(2) | | 2009(3) | | |
| |
| Net Asset Value, Beginning of Period | | | $14.31 | | | | $10.72 | | | | $10.56 | | | | $9.26 | | | |
| Income from Investment Operations: | | | | | | | | | | | | | | | | | | |
| Net investment income | | | .06 | | | | .10 | | | | .07 | | | | .05 | | | |
| Net gain/(loss) on investments (both realized and unrealized) | | | (.58) | | | | 3.58 | | | | .16 | | | | 1.25 | | | |
| Total from Investment Operations | | | (.52) | | | | 3.68 | | | | .23 | | | | 1.30 | | | |
| Less Distributions: | | | | | | | | | | | | | | | | | | |
| Dividends (from net investment income)* | | | (.13) | | | | (.09) | | | | (.07) | | | | – | | | |
| Distributions (from capital gains)* | | | – | | | | – | | | | – | | | | – | | | |
| Total Distributions | | | (.13) | | | | (.09) | | | | (.07) | | | | – | | | |
| Net Asset Value, End of Period | | | $13.66 | | | | $14.31 | | | | $10.72 | | | | $10.56 | | | |
| Total Return** | | | (3.65)% | | | | 34.44% | | | | 2.11% | | | | 14.04% | | | |
| Net Assets, End of Period (in thousands) | | | $14,032 | | | | $14,544 | | | | $11,026 | | | | $13,008 | | | |
| Average Net Assets for the Period (in thousands) | | | $13,568 | | | | $13,331 | | | | $12,844 | | | | $14,686 | | | |
Ratio of Gross Expenses to Average Net Assets***(4) | | | 1.00% | | | | 0.98% | | | | 1.06% | | | | 1.10% | | | |
Ratio of Net Expenses to Average Net Assets***(4) | | | 1.00% | | | | 0.98% | | | | 1.06% | | | | 1.08% | | | |
| Ratio of Net Investment Income to Average Net Assets*** | | | 0.96% | | | | 0.82% | | | | 0.85% | | | | 1.20% | | | |
| Portfolio Turnover Rate*** | | | 56% | | | | 93% | | | | 120% | | | | 111% | | | |
Class A Shares
| | | | | | | | | | | | | | | | | | | | | | | | | | | | | | | |
For a share outstanding during the six-month period ended
| | | | | | | | | | | | | | | | |
December 31, 2011 (unaudited), the fiscal year ended June 30,
| | | | | | | | | | | | | | | | |
2011, the eleven-month fiscal period ended June 30, 2010 and
| | INTECH U.S. Growth Fund(5) | | |
| each fiscal year or period ended July 31 | | 2011 | | 2011 | | 2010(6) | | 2009 | | 2008 | | 2007 | | 2006 | | |
| |
| Net Asset Value, Beginning of Period | | | $14.07 | | | | $10.52 | | | | $9.80 | | | | $12.88 | | | | $14.45 | | | | $12.81 | | | | $13.32 | | | |
| Income from Investment Operations: | | | | | | | | | | | | | | | | | | | | | | | | | | | | | | |
| Net investment income | | | .04 | | | | .23 | | | | .14 | | | | .14 | | | | .09 | | | | .06 | | | | .06 | | | |
| Net gain/(loss) on investments (both realized and unrealized) | | | (.92) | | | | 3.44 | | | | .64 | | | | (3.11) | | | | (.94) | | | | 1.62 | | | | .08 | | | |
| Total from Investment Operations | | | (.88) | | | | 3.67 | | | | .78 | | | | (2.97) | | | | (.85) | | | | 1.68 | | | | .14 | | | |
| Less Distributions: | | | | | | | | | | | | | | | | | | | | | | | | | | | | | | |
| Dividends (from net investment income)* | | | (.09) | | | | (.12) | | | | (.06) | | | | (.11) | | | | (.08) | | | | (.04) | | | | (.02) | | | |
| Distributions (from capital gains)* | | | – | | | | – | | | | – | | | | – | | | | (.64) | | | | – | | | | (.63) | | | |
| Total Distributions | | | (.09) | | | | (.12) | | | | (.06) | | | | (.11) | | | | (.72) | | | | (.04) | | | | (.65) | | | |
| Net Asset Value, End of Period | | | $13.10 | | | | $14.07 | | | | $10.52 | | | | $9.80 | | | | $12.88 | | | | $14.45 | | | | $12.81 | | | |
| Total Return** | | | (6.26)% | | | | 35.03% | | | | 7.97% | | | | (22.92)% | | | | (6.54)% | | | | 13.10% | | | | 0.84% | | | |
| Net Assets, End of Period (in thousands) | | | $8,723 | | | | $9,208 | | | | $11,914 | | | | $18,215 | | | | $34,231 | | | | $50,000 | | | | $30,875 | | | |
| Average Net Assets for the Period (in thousands) | | | $8,527 | | | | $9,550 | | | | $17,116 | | | | $20,041 | | | | $47,093 | | | | $39,807 | | | | $22,793 | | | |
Ratio of Gross Expenses to Average Net Assets***(4) | | | 0.88% | | | | 0.86% | | | | 0.90% | | | | 0.82% | | | | 0.78% | | | | 0.81% | | | | 0.85% | | | |
Ratio of Net Expenses to Average Net Assets***(4) | | | 0.88% | | | | 0.86% | | | | 0.90% | | | | 0.82% | | | | 0.78% | | | | 0.81% | | | | 0.85% | | | |
| Ratio of Net Investment Income to Average Net Assets*** | | | 0.76% | | | | 0.62% | | | | 0.71% | | | | 1.01% | | | | 0.57% | | | | 0.54% | | | | 0.61% | | | |
| Portfolio Turnover Rate*** | | | 71% | | | | 96% | | | | 128% | | | | 119% | | | | 125% | | | | 113% | | | | 100% | | | |
| | | |
| * | | See Note 5 in Notes to Financial Statements. |
| ** | | Total return not annualized for periods of less than one full year. |
| *** | | Annualized for periods of less than one full year. |
| (1) | | Formerly named INTECH Risk-Managed Core Fund. |
| (2) | | Period from November 1, 2009 through June 30, 2010. The Fund changed its fiscal year end from October 31 to June 30. |
| (3) | | Period from July 6, 2009 (inception date) through October 31, 2009. |
| (4) | | See Note 6 in Notes to Financial Statements. |
| (5) | | Formerly named INTECH Risk-Managed Growth Fund. |
| (6) | | Period from August 1, 2009 through June 30, 2010. The Fund changed its fiscal year end from July 31 to June 30. |
See Notes to Financial Statements.
Janus Mathematical Funds | 71
Financial Highlights (continued)
Class A Shares
| | | | | | | | | | | | | | | | | | | | | | | | | | | | | | | |
For a share outstanding during the six-month period ended
| | | | | | | | | | | | | | | | |
December 31, 2011 (unaudited), the fiscal year ended
| | | | | | | | | | | | | | | | |
June 30, 2011, the eleven-month fiscal period ended June 30,
| | INTECH U.S. Value Fund(1) | | |
| 2010 and each fiscal year or period ended July 31 | | 2011 | | 2011 | | 2010(2) | | 2009 | | 2008 | | 2007 | | 2006(3) | | |
| |
| Net Asset Value, Beginning of Period | | | $10.03 | | | | $7.85 | | | | $7.36 | | | | $9.88 | | | | $11.68 | | | | $10.64 | | | | $10.00 | | | |
| Income from Investment Operations: | | | | | | | | | | | | | | | | | | | | | | | | | | | | | | |
| Net investment income | | | .07 | | | | .13 | | | | .10 | | | | .15 | | | | .14 | | | | .16 | | | | .09 | | | |
| Net gain/(loss) on investments (both realized and unrealized) | | | (.49) | | | | 2.16 | | | | .43 | | | | (2.35) | | | | (1.58) | | | | 1.05 | | | | .55 | | | |
| Total from Investment Operations | | | (.42) | | | | 2.29 | | | | .53 | | | | (2.20) | | | | (1.44) | | | | 1.21 | | | | .64 | | | |
| Less Distributions: | | | | | | | | | | | | | | | | | | | | | | | | | | | | | | |
| Dividends (from net investment income)* | | | (.14) | | | | (.11) | | | | (.04) | | | | (.32) | | | | (.13) | | | | (.15) | | | | – | | | |
| Distributions (from capital gains)* | | | – | | | | – | | | | – | | | | – | | | | (.23) | | | | (.02) | | | | – | | | |
| Total Distributions | | | (.14) | | | | (.11) | | | | (.04) | | | | (.32) | | | | (.36) | | | | (.17) | | | | – | | | |
| Net Asset Value, End of Period | | | $9.47 | | | | $10.03 | | | | $7.85 | | | | $7.36 | | | | $9.88 | | | | $11.68 | | | | $10.64 | | | |
| Total Return** | | | (4.18)% | | | | 29.23% | | | | 7.21% | | | | (22.01)% | | | | (12.78)% | | | | 11.38% | | | | 6.40% | | | |
| Net Assets, End of Period (in thousands) | | | $5,103 | | | | $4,980 | | | | $3,694 | | | | $3,440 | | | | $1,032 | | | | $538 | | | | $266 | | | |
| Average Net Assets for the Period (in thousands) | | | $4,793 | | | | $4,598 | | | | $3,815 | | | | $1,762 | | | | $680 | | | | $414 | | | | $256 | | | |
Ratio of Gross Expenses to Average Net Assets***(4) | | | 0.95% | | | | 0.95% | | | | 1.01% | | | | 0.74% | | | | 0.85% | | | | 0.85% | | | | 0.85% | | | |
Ratio of Net Expenses to Average Net Assets***(4) | | | 0.95% | | | | 0.95% | | | | 1.01% | | | | 0.74% | | | | 0.85% | | | | 0.85% | | | | 0.85% | | | |
| Ratio of Net Investment Income to Average Net Assets*** | | | 1.63% | | | | 1.38% | | | | 1.26% | | | | 2.28% | | | | 2.08% | | | | 1.64% | | | | 1.48% | | | |
| Portfolio Turnover Rate*** | | | 71% | | | | 108% | | | | 101% | | | | 100% | | | | 78% | | | | 71% | | | | 98% | | | |
| | | |
| * | | See Note 5 in Notes to Financial Statements. |
| ** | | Total return not annualized for periods of less than one full year. |
| *** | | Annualized for periods of less than one full year. |
| (1) | | Formerly named INTECH Risk-Managed Value Fund. |
| (2) | | Period from August 1, 2009 through June 30, 2010. The Fund changed its fiscal year end from July 31 to June 30. |
| (3) | | Period from December 30, 2005 (inception date) through July 31, 2006. |
| (4) | | See Note 6 in Notes to Financial Statements. |
See Notes to Financial Statements.
72 | DECEMBER 31, 2011
Class C Shares
| | | | | | | |
| | | INTECH Global
| | |
| | | Dividend Fund | | |
| For a share outstanding during the period ended December 31, 2011 (unaudited) | | 2011(1) | | |
| |
| Net Asset Value, Beginning of Period | | | $10.00 | | | |
| Income from Investment Operations: | | | | | | |
| Net investment income | | | .01 | | | |
| Net gain/(loss) on investments (both realized and unrealized) | | | .30 | | | |
| Total from Investment Operations | | | .31 | | | |
| Less Distributions: | | | | | | |
| Dividends (from net investment income)* | | | (.01) | | | |
| Distributions (from capital gains)* | | | – | | | |
| Total Distributions | | | (.01) | | | |
| Net Asset Value, End of Period | | | $10.30 | | | |
| Total Return** | | | 3.11% | | | |
| Net Assets, End of Period (in thousands) | | | $859 | | | |
| Average Net Assets for the Period (in thousands) | | | $845 | | | |
Ratio of Gross Expenses to Average Net Assets***(2) | | | 1.20%(3) | | | |
Ratio of Net Expenses to Average Net Assets***(2) | | | 1.20%(3) | | | |
| Ratio of Net Investment Income to Average Net Assets*** | | | 1.06% | | | |
| Portfolio Turnover Rate*** | | | 0% | | | |
Class C Shares
| | | | | | | | | | | | | | | | | | | | | | | | | | | |
For a share outstanding during the six-month period ended
| | | | | | | | | | | | | | |
December 31, 2011 (unaudited), the fiscal year ended June 30,
| | | | | | | | | | | | | | |
2011, the eleven-month fiscal period ended June 30, 2010 and
| | INTECH International Fund(4) | | |
| each fiscal year or period ended July 31 | | 2011 | | 2011 | | 2010(5) | | 2009 | | 2008 | | 2007(6) | | |
| |
| Net Asset Value, Beginning of Period | | | $8.11 | | | | $6.17 | | | | $6.57 | | | | $8.93 | | | | $9.91 | | | | $10.00 | | | |
| Income from Investment Operations: | | | | | | | | | | | | | | | | | | | | | | | | | | |
| Net investment income | | | .01 | | | | .58 | | | | .13 | | | | .16 | | | | .13 | | | | .06 | | | |
| Net gain/(loss) on investments (both realized and unrealized) | | | (1.47) | | | | 1.47 | | | | (.47) | | | | (2.30) | | | | (1.01) | | | | (.15) | | | |
| Total from Investment Operations | | | (1.46) | | | | 2.05 | | | | (.34) | | | | (2.14) | | | | (.88) | | | | (.09) | | | |
| Less Distributions: | | | | | | | | | | | | | | | | | | | | | | | | | | |
| Dividends (from net investment income)* | | | (.07) | | | | (.11) | | | | (.06) | | | | (.22) | | | | (.10) | | | | – | | | |
| Distributions (from capital gains)* | | | – | | | | – | | | | – | | | | – | | | | – | | | | – | | | |
| Total Distributions | | | (.07) | | | | (.11) | | | | (.06) | | | | (.22) | | | | (.10) | | | | – | | | |
| Net Asset Value, End of Period | | | $6.58 | | | | $8.11 | | | | $6.17 | | | | $6.57 | | | | $8.93 | | | | $9.91 | | | |
| Total Return** | | | (18.05)% | | | | 33.37% | | | | (5.31)% | | | | (23.61)% | | | | (9.03)% | | | | (0.90)% | | | |
| Net Assets, End of Period (in thousands) | | | $448 | | | | $563 | | | | $1,642 | | | | $1,737 | | | | $2,274 | | | | $2,477 | | | |
| Average Net Assets for the Period (in thousands) | | | $701 | | | | $1,877 | | | | $1,827 | | | | $1,552 | | | | $2,485 | | | | $2,487 | | | |
Ratio of Gross Expenses to Average Net Assets***(2) | | | 2.01% | | | | 1.21%(7) | | | | 0.73%(7) | | | | 0.70%(7) | | | | 1.66% | | | | 1.66% | | | |
Ratio of Net Expenses to Average Net Assets***(2) | | | 2.01% | | | | 1.21%(7) | | | | 0.73%(7) | | | | 0.69%(7) | | | | 1.65% | | | | 1.65% | | | |
| Ratio of Net Investment Income to Average Net Assets*** | | | 0.13% | | | | 1.92% | | | | 1.88% | | | | 2.56% | | | | 1.17% | | | | 2.45% | | | |
| Portfolio Turnover Rate*** | | | 71% | | | | 179% | | | | 130% | | | | 115% | | | | 105% | | | | 140% | | | |
| | | |
| * | | See Note 5 in Notes to Financial Statements. |
| ** | | Total return not annualized for periods of less than one full year. |
| *** | | Annualized for periods of less than one full year. |
| (1) | | Period from December 15, 2011 (inception date) through December 31, 2011. |
| (2) | | See Note 6 in Notes to Financial Statements. |
| (3) | | Pursuant to a contractual agreement, Janus waived certain fees and expenses during the period. The Ratio of Gross Expenses to Average Net Assets and Ratio of Net Expenses to Average Net Assets would have been 1.97% and 1.97%, respectively, without the waiver of these fees and expenses. |
| (4) | | Formerly named INTECH Risk-Managed International Fund. |
| (5) | | Period from August 1, 2009 through June 30, 2010. The Fund changed its fiscal year end from July 31 to June 30. |
| (6) | | Period from May 2, 2007 (inception date) through July 31, 2007. |
| (7) | | Pursuant to a contractual agreement, Janus waived certain fees and expenses during the period. The Ratio of Gross Expenses to Average Net Assets and Ratio of Net Expenses to Average Net Assets would have been 2.07% and 2.00%, respectively, in 2011, 2.00% and 2.00%, respectively, in 2010 and 1.68% and 1.68%, respectively, in 2009 without the waiver of these fees and expenses. |
See Notes to Financial Statements.
Janus Mathematical Funds | 73
Financial Highlights (continued)
Class C Shares
| | | | | | | | | | | | | | | | | | | |
For a share outstanding during the six-month period ended December 31, 2011
| | | | | | | | | | |
(unaudited), the fiscal year ended June 30, 2011, the eight-month fiscal period ended
| | INTECH U.S. Core Fund(1) | | |
| June 30, 2010 and the fiscal period ended October 31, 2009 | | 2011 | | 2011 | | 2010(2) | | 2009(3) | | |
| |
| Net Asset Value, Beginning of Period | | | $14.26 | | | | $10.71 | | | | $10.54 | | | | $9.26 | | | |
| Income from Investment Operations: | | | | | | | | | | | | | | | | | | |
| Net investment income/(loss) | | | .01 | | | | – | | | | .03 | | | | .02 | | | |
| Net gain/(loss) on investments (both realized and unrealized) | | | (.59) | | | | 3.56 | | | | .16 | | | | 1.26 | | | |
| Total from Investment Operations | | | (.58) | | | | 3.56 | | | | .19 | | | | 1.28 | | | |
| Less Distributions: | | | | | | | | | | | | | | | | | | |
| Dividends (from net investment income)* | | | – | | | | (.01) | | | | (.02) | | | | – | | | |
| Distributions (from capital gains)* | | | – | | | | – | | | | – | | | | – | | | |
| Total Distributions | | | – | | | | (.01) | | | | (.02) | | | | – | | | |
| Net Asset Value, End of Period | | | $13.68 | | | | $14.26 | | | | $10.71 | | | | $10.54 | | | |
| Total Return** | | | (4.07)% | | | | 33.26% | | | | 1.82% | | | | 13.82% | | | |
| Net Assets, End of Period (in thousands) | | | $6,249 | | | | $6,755 | | | | $6,452 | | | | $7,938 | | | |
| Average Net Assets for the Period (in thousands) | | | $6,255 | | | | $6,690 | | | | $7,678 | | | | $8,527 | | | |
Ratio of Gross Expenses to Average Net Assets***(4) | | | 1.84% | | | | 1.80% | | | | 1.56% | | | | 1.85% | | | |
Ratio of Net Expenses to Average Net Assets***(4) | | | 1.84% | | | | 1.80% | | | | 1.56% | | | | 1.83% | | | |
| Ratio of Net Investment Income/(Loss) to Average Net Assets*** | | | 0.11% | | | | (0.01)% | | | | 0.35% | | | | 0.44% | | | |
| Portfolio Turnover Rate*** | | | 56% | | | | 93% | | | | 120% | | | | 111% | | | |
Class C Shares
| | | | | | | | | | | | | | | | | | | | | | | | | | | | | | | |
For a share outstanding during the six-month period ended
| | | | | | | | | | | | | | | | |
December 31, 2011 (unaudited), the fiscal year ended
| | | | | | | | | | | | | | | | |
June 30, 2011, the eleven-month fiscal period ended June 30,
| | INTECH U.S. Growth Fund(5) | | |
| 2010 and each fiscal year or period ended July 31 | | 2011 | | 2011 | | 2010(6) | | 2009 | | 2008 | | 2007(7) | | 2006 | | |
| |
| Net Asset Value, Beginning of Period | | | $13.58 | | | | $10.15 | | | | $9.50 | | | | $12.45 | | | | $14.03 | | | | $12.51 | | | | $13.10 | | | |
| Income from Investment Operations: | | | | | | | | | | | | | | | | | | | | | | | | | | | | | | |
| Net investment income/(loss) | | | (.08) | | | | (.22) | | | | (.14) | | | | (.05) | | | | (.11) | | | | (.01) | | | | – | | | |
| Net gain/(loss) on investments (both realized and unrealized) | | | (.82) | | | | 3.65 | | | | .81 | | | | (2.88) | | | | (.83) | | | | 1.53 | | | | .04 | | | |
| Total from Investment Operations | | | (.90) | | | | 3.43 | | | | .67 | | | | (2.93) | | | | (.94) | | | | 1.52 | | | | .04 | | | |
| Less Distributions and Other: | | | | | | | | | | | | | | | | | | | | | | | | | | | | | | |
| Dividends (from net investment income)* | | | – | | | | – | | | | (.02) | | | | (.02) | | | | – | | | | – | | | | – | | | |
| Distributions (from capital gains)* | | | – | | | | – | | | | – | | | | – | | | | (.64) | | | | – | | | | (.63) | | | |
| Redemption fees | | | – | | | | – | | | | –(8) | | | | – | | | | – | | | | – | | | | – | | | |
| Total Distributions and Other | | | – | | | | – | | | | (.02) | | | | (.02) | | | | (.64) | | | | – | | | | (.63) | | | |
| Net Asset Value, End of Period | | | $12.68 | | | | $13.58 | | | | $10.15 | | | | $9.50 | | | | $12.45 | | | | $14.03 | | | | $12.51 | | | |
| Total Return** | | | (6.63)% | | | | 33.79% | | | | 7.05% | | | | (23.53)% | | | | (7.31)% | | | | 12.15% | | | | 0.11% | | | |
| Net Assets, End of Period (in thousands) | | | $3,120 | | | | $3,717 | | | | $3,928 | | | | $4,921 | | | | $8,767 | | | | $15,250 | | | | $12,131 | | | |
| Average Net Assets for the Period (in thousands) | | | $3,282 | | | | $4,005 | | | | $4,571 | | | | $5,469 | | | | $12,982 | | | | $14,549 | | | | $10,135 | | | |
Ratio of Gross Expenses to Average Net Assets***(4) | | | 1.74% | | | | 1.71% | | | | 1.93% | | | | 1.62% | | | | 1.60% | | | | 1.59% | | | | 1.60% | | | |
Ratio of Net Expenses to Average Net Assets***(4) | | | 1.74% | | | | 1.70% | | | | 1.93% | | | | 1.62% | | | | 1.60% | | | | 1.59% | | | | 1.60% | | | |
| Ratio of Net Investment Income/(Loss) to Average Net Assets*** | | | (0.13)% | | | | (0.25)% | | | | (0.32)% | | | | 0.21% | | | | (0.25)% | | | | (0.22)% | | | | (0.16)% | | | |
| Portfolio Turnover Rate*** | | | 71% | | | | 96% | | | | 128% | | | | 119% | | | | 125% | | | | 113% | | | | 100% | | | |
| | | |
| * | | See Note 5 in Notes to Financial Statements. |
| ** | | Total return not annualized for periods of less than one full year. |
| *** | | Annualized for periods of less than one full year. |
| (1) | | Formerly named INTECH Risk-Managed Core Fund. |
| (2) | | Period from November 1, 2009 through June 30, 2010. The Fund changed its fiscal year end from October 31 to June 30. |
| (3) | | Period from July 6, 2009 (inception date) through October 31, 2009. |
| (4) | | See Note 6 in Notes to Financial Statements. |
| (5) | | Formerly named INTECH Risk-Managed Growth Fund. |
| (6) | | Period from August 1, 2009 through June 30, 2010. The Fund changed its fiscal year end from July 31 to June 30. |
| (7) | | Certain prior year amounts have been reclassified to conform with current year presentation. |
| (8) | | Redemption fees aggregated less than $.01 on a per share basis. |
See Notes to Financial Statements.
74 | DECEMBER 31, 2011
Class C Shares
| | | | | | | | | | | | | | | | | | | | | | | | | | | | | | | |
For a share outstanding during the six-month period ended
| | | | | | | | | | | | | | | | |
December 31, 2011 (unaudited), the fiscal year ended
| | | | | | | | | | | | | | | | |
June 30, 2011, the eleven-month fiscal period ended June 30,
| | INTECH U.S. Value Fund(1) | | |
| 2010 and each fiscal year or period ended July 31 | | 2011 | | 2011 | | 2010(2) | | 2009 | | 2008 | | 2007 | | 2006(3) | | |
| |
| Net Asset Value, Beginning of Period | | | $9.94 | | | | $7.81 | | | | $7.35 | | | | $9.78 | | | | $11.61 | | | | $10.60 | | | | $10.00 | | | |
| Income from Investment Operations: | | | | | | | | | | | | | | | | | | | | | | | | | | | | | | |
| Net investment income | | | .07 | | | | .14 | | | | .03 | | | | .12 | | | | .23 | | | | .07 | | | | .04 | | | |
| Net gain/(loss) on investments (both realized and unrealized) | | | (.52) | | | | 2.05 | | | | .45 | | | | (2.34) | | | | (1.75) | | | | 1.05 | | | | .56 | | | |
| Total from Investment Operations | | | (.45) | | | | 2.19 | | | | .48 | | | | (2.22) | | | | (1.52) | | | | 1.12 | | | | .60 | | | |
| Less Distributions: | | | | | | | | | | | | | | | | | | | | | | | | | | | | | | |
| Dividends (from net investment income)* | | | – | | | | (.06) | | | | (.02) | | | | (.21) | | | | (.08) | | | | (.09) | | | | – | | | |
| Distributions (from capital gains)* | | | – | | | | – | | | | – | | | | – | | | | (.23) | | | | (.02) | | | | – | | | |
| Total Distributions | | | – | | | | (.06) | | | | (.02) | | | | (.21) | | | | (.31) | | | | (.11) | | | | – | | | |
| Net Asset Value, End of Period | | | $9.49 | | | | $9.94 | | | | $7.81 | | | | $7.35 | | | | $9.78 | | | | $11.61 | | | | $10.60 | | | |
| Total Return** | | | (4.53)% | | | | 28.03% | | | | 6.51% | | | | (22.52)% | | | | (13.49)% | | | | 10.52% | | | | 6.00% | | | |
| Net Assets, End of Period (in thousands) | | | $177 | | | | $217 | | | | $330 | | | | $281 | | | | $342 | | | | $1,510 | | | | $267 | | | |
| Average Net Assets for the Period (in thousands) | | | $178 | | | | $432 | | | | $324 | | | | $266 | | | | $860 | | | | $577 | | | | $256 | | | |
Ratio of Gross Expenses to Average Net Assets***(4) | | | 1.75% | | | | 1.74% | | | | 1.76% | | | | 1.47% | | | | 1.60% | | | | 1.61% | | | | 1.60% | | | |
Ratio of Net Expenses to Average Net Assets***(4) | | | 1.75% | | | | 1.74% | | | | 1.76% | | | | 1.47% | | | | 1.60% | | | | 1.60% | | | | 1.60% | | | |
| Ratio of Net Investment Income to Average Net Assets*** | | | 0.78% | | | | 0.58% | | | | 0.51% | | | | 1.94% | | | | 1.36% | | | | 0.80% | | | | 0.73% | | | |
| Portfolio Turnover Rate*** | | | 71% | | | | 108% | | | | 101% | | | | 100% | | | | 78% | | | | 71% | | | | 98% | | | |
| | | |
| * | | See Note 5 in Notes to Financial Statements. |
| ** | | Total return not annualized for periods of less than one full year. |
| *** | | Annualized for periods of less than one full year. |
| (1) | | Formerly named INTECH Risk-Managed Value Fund. |
| (2) | | Period from August 1, 2009 through June 30, 2010. The Fund changed its fiscal year end from July 31 to June 30. |
| (3) | | Period from December 30, 2005 (inception date) through July 31, 2006. |
| (4) | | See Note 6 in Notes to Financial Statements. |
See Notes to Financial Statements.
Janus Mathematical Funds | 75
Financial Highlights (continued)
Class D Shares
| | | | | | | |
| | | INTECH Global
| | |
| | | Dividend Fund | | |
| For a share outstanding during the period ended December 31, 2011 (unaudited) | | 2011(1) | | |
| |
| Net Asset Value, Beginning of Period | | | $10.00 | | | |
| Income from Investment Operations: | | | | | | |
| Net investment income | | | .01 | | | |
| Net gain/(loss) on investments (both realized and unrealized) | | | .30 | | | |
| Total from Investment Operations | | | .31 | | | |
| Less Distributions: | | | | | | |
| Dividends (from net investment income)* | | | (.01) | | | |
| Distributions (from capital gains)* | | | – | | | |
| Total Distributions | | | (.01) | | | |
| Net Asset Value, End of Period | | | $10.30 | | | |
| Total Return** | | | 3.11% | | | |
| Net Assets, End of Period (in thousands) | | | $994 | | | |
| Average Net Assets for the Period (in thousands) | | | $881 | | | |
Ratio of Gross Expenses to Average Net Assets***(2) | | | 1.00% | | | |
Ratio of Net Expenses to Average Net Assets***(2) | | | 1.00% | | | |
| Ratio of Net Investment Income to Average Net Assets*** | | | 1.29% | | | |
| Portfolio Turnover Rate*** | | | 0% | | | |
Class D Shares
| | | | | | | | | | | | | | | |
For a share outstanding during the six-month period ended December 31, 2011 (unaudited),
| | INTECH U.S. Core Fund(3) | | |
| the fiscal year ended June 30, 2011 and the fiscal period ended June 30, 2010 | | 2011 | | 2011 | | 2010(4) | | |
| |
| Net Asset Value, Beginning of Period | | | $14.32 | | | | $10.74 | | | | $10.95 | | | |
| Income from Investment Operations: | | | | | | | | | | | | | | |
| Net investment income | | | .08 | | | | .13 | | | | .05 | | | |
| Net gain/(loss) on investments (both realized and unrealized) | | | (.59) | | | | 3.59 | | | | (.26) | | | |
| Total from Investment Operations | | | (.51) | | | | 3.72 | | | | (.21) | | | |
| Less Distributions and Other: | | | | | | | | | | | | | | |
| Dividends (from net investment income)* | | | (.14) | | | | (.14) | | | | – | | | |
| Distributions (from capital gains)* | | | – | | | | – | | | | – | | | |
| Redemption fees | | | –(5) | | | | –(5) | | | | –(5) | | | |
| Total Distributions and Other | | | (.14) | | | | (.14) | | | | – | | | |
| Net Asset Value, End of Period | | | $13.67 | | | | $14.32 | | | | $10.74 | | | |
| Total Return** | | | (3.59)% | | | | 34.74% | | | | (1.92)% | | | |
| Net Assets, End of Period (in thousands) | | | $165,908 | | | | $173,097 | | | | $135,712 | | | |
| Average Net Assets for the Period (in thousands) | | | $160,862 | | | | $156,479 | | | | $150,392 | | | |
Ratio of Gross Expenses to Average Net Assets***(2) | | | 0.86% | | | | 0.82% | | | | 0.61% | | | |
Ratio of Net Expenses to Average Net Assets***(2) | | | 0.86% | | | | 0.82% | | | | 0.60% | | | |
| Ratio of Net Investment Income to Average Net Assets*** | | | 1.10% | | | | 0.96% | | | | 1.22% | | | |
| Portfolio Turnover Rate*** | | | 56% | | | | 93% | | | | 120% | | | |
| | | |
| * | | See Note 5 in Notes to Financial Statements. |
| ** | | Total return not annualized for periods of less than one full year. |
| *** | | Annualized for periods of less than one full year. |
| (1) | | Period from December 15, 2011 (inception date) through December 31, 2011. |
| (2) | | See Note 6 in Notes to Financial Statements. |
| (3) | | Formerly named INTECH Risk-Managed Core Fund. |
| (4) | | Period from February 16, 2010 (inception date) through June 30, 2010. |
| (5) | | Redemption fees aggregated less than $.01 on a per share basis. |
See Notes to Financial Statements.
76 | DECEMBER 31, 2011
Class I Shares
| | | | | | | |
| | | INTECH Global
| | |
| | | Dividend Fund | | |
| For a share outstanding during the period ended December 31, 2011 (unaudited) | | 2011(1) | | |
| |
| Net Asset Value, Beginning of Period | | | $10.00 | | | |
| Income from Investment Operations: | | | | | | |
| Net investment income | | | .01 | | | |
| Net gain/(loss) on investments (both realized and unrealized) | | | .30 | | | |
| Total from Investment Operations | | | .31 | | | |
| Less Distributions: | | | | | | |
| Dividends (from net investment income)* | | | (.01) | | | |
| Distributions (from capital gains)* | | | – | | | |
| Total Distributions | | | (.01) | | | |
| Net Asset Value, End of Period | | | $10.30 | | | |
| Total Return** | | | 3.11% | | | |
| Net Assets, End of Period (in thousands) | | | $859 | | | |
| Average Net Assets for the Period (in thousands) | | | $845 | | | |
Ratio of Gross Expenses to Average Net Assets***(2) | | | 0.97% | | | |
Ratio of Net Expenses to Average Net Assets***(2) | | | 0.97% | | | |
| Ratio of Net Investment Income to Average Net Assets*** | | | 1.30% | | | |
| Portfolio Turnover Rate*** | | | 0% | | | |
Class I Shares
| | | | | | | | | | | | | | | | | | | | | | | | | | | |
For a share outstanding during the six-month period ended
| | | | | | | | | | | | | | |
December 31, 2011 (unaudited), the fiscal year ended June 30,
| | | | | | | | | | | | | | |
2011, the eleven-month fiscal period ended June 30, 2010 and
| | INTECH International Fund(3) | | |
| each fiscal year or period ended July 31 | | 2011 | | 2011 | | 2010(4) | | 2009 | | 2008 | | 2007(5) | | |
| |
| Net Asset Value, Beginning of Period | | | $8.06 | | | | $6.14 | | | | $6.55 | | | | $8.98 | | | | $9.93 | | | | $10.00 | | | |
| Income from Investment Operations: | | | | | | | | | | | | | | | | | | | | | | | | | | |
| Net investment income | | | .02 | | | | .03 | | | | .13 | | | | .15 | | | | .22 | | | | .09 | | | |
| Net gain/(loss) on investments (both realized and unrealized) | | | (1.44) | | | | 2.00 | | | | (.48) | | | | (2.30) | | | | (1.01) | | | | (.16) | | | |
| Total from Investment Operations | | | (1.42) | | | | 2.03 | | | | (.35) | | | | (2.15) | | | | (.79) | | | | (.07) | | | |
| Less Distributions and Other: | | | | | | | | | | | | | | | | | | | | | | | | | | |
| Dividends (from net investment income)* | | | (.06) | | | | (.11) | | | | (.06) | | | | (.28) | | | | (.16) | | | | – | | | |
| Distributions (from capital gains)* | | | – | | | | – | | | | – | | | | – | | | | – | | | | – | | | |
| Redemption fees | | | –(6) | | | | – | | | | –(6) | | | | – | | | | – | | | | – | | | |
| Total Distributions and Other | | | (.06) | | | | (.11) | | | | (.06) | | | | (.28) | | | | (.16) | | | | – | | | |
| Net Asset Value, End of Period | | | $6.58 | | | | $8.06 | | | | $6.14 | | | | $6.55 | | | | $8.98 | | | | $9.93 | | | |
| Total Return** | | | (17.56)% | | | | 33.20% | | | | (5.48)% | | | | (23.56)% | | | | (8.09)% | | | | (0.70)% | | | |
| Net Assets, End of Period (in thousands) | | | $33,321 | | | | $20,713 | | | | $1,180 | | | | $2,327 | | | | $2,571 | | | | $2,484 | | | |
| Average Net Assets for the Period (in thousands) | | | $25,097 | | | | $1,393 | | | | $2,223 | | | | $1,935 | | | | $2,694 | | | | $2,491 | | | |
Ratio of Gross Expenses to Average Net Assets***(2) | | | 1.01% | | | | 0.86% | | | | 1.00% | | | | 0.68% | | | | 0.66% | | | | 0.66% | | | |
Ratio of Net Expenses to Average Net Assets***(2) | | | 1.01% | | | | 0.86% | | | | 1.00% | | | | 0.68% | | | | 0.65% | | | | 0.65% | | | |
| Ratio of Net Investment Income to Average Net Assets*** | | | 0.93% | | | | 2.28% | | | | 1.38% | | | | 2.65% | | | | 2.18% | | | | 3.45% | | | |
| Portfolio Turnover Rate*** | | | 71% | | | | 179% | | | | 130% | | | | 115% | | | | 105% | | | | 140% | | | |
| | | |
| * | | See Note 5 in Notes to Financial Statements. |
| ** | | Total return not annualized for periods of less than one full year. |
| *** | | Annualized for periods of less than one full year. |
| (1) | | Period from December 15, 2011 (inception date) through December 31, 2011. |
| (2) | | See Note 6 in Notes to Financial Statements. |
| (3) | | Formerly named INTECH Risk-Managed International Fund. |
| (4) | | Period from August 1, 2009 through June 30, 2010. The Fund changed its fiscal year end from July 31 to June 30. |
| (5) | | Period from May 2, 2007 (inception date) through July 31, 2007. |
| (6) | | Redemption fees aggregated less than $.01 on a per share basis. |
See Notes to Financial Statements.
Janus Mathematical Funds | 77
Financial Highlights (continued)
Class I Shares
| | | | | | | | | | | | | | | | | | | |
For a share outstanding during the six-month period ended December 31, 2011
| | | | | | | | | | |
(unaudited), the fiscal year ended June 30, 2011, the eight-month fiscal period ended
| | INTECH U.S. Core Fund(1) | | |
| June 30, 2010 and the fiscal period ended October 31, 2009 | | 2011 | | 2011 | | 2010(2) | | 2009(3) | | |
| |
| Net Asset Value, Beginning of Period | | | $14.33 | | | | $10.75 | | | | $10.57 | | | | $9.26 | | | |
| Income from Investment Operations: | | | | | | | | | | | | | | | | | | |
| Net investment income | | | .08 | | | | .16 | | | | .11 | | | | .05 | | | |
| Net gain/(loss) on investments (both realized and unrealized) | | | (.59) | | | | 3.57 | | | | .16 | | | | 1.26 | | | |
| Total from Investment Operations | | | (.51) | | | | 3.73 | | | | .27 | | | | 1.31 | | | |
| Less Distributions and Other: | | | | | | | | | | | | | | | | | | |
| Dividends (from net investment income)* | | | (.15) | | | | (.15) | | | | (.09) | | | | – | | | |
| Distributions (from capital gains)* | | | – | | | | – | | | | – | | | | – | | | |
| Redemption fees | | | –(4) | | | | –(4) | | | | –(4) | | | | – | | | |
| Total Distributions and Other | | | (.15) | | | | (.15) | | | | (.09) | | | | – | | | |
| Net Asset Value, End of Period | | | $13.67 | | | | $14.33 | | | | $10.75 | | | | $10.57 | | | |
| Total Return** | | | (3.56)% | | | | 34.84% | | | | 2.51% | | | | 14.15% | | | |
| Net Assets, End of Period (in thousands) | | | $47,491 | | | | $55,567 | | | | $50,382 | | | | $45,795 | | | |
| Average Net Assets for the Period (in thousands) | | | $51,019 | | | | $53,512 | | | | $51,959 | | | | $49,319 | | | |
Ratio of Gross Expenses to Average Net Assets***(5) | | | 0.76% | | | | 0.72% | | | | 0.53% | | | | 0.80% | | | |
Ratio of Net Expenses to Average Net Assets***(5) | | | 0.76% | | | | 0.72% | | | | 0.53% | | | | 0.78% | | | |
| Ratio of Net Investment Income to Average Net Assets*** | | | 1.20% | | | | 1.07% | | | | 1.37% | | | | 1.49% | | | |
| Portfolio Turnover Rate*** | | | 56% | | | | 93% | | | | 120% | | | | 111% | | | |
Class I Shares
| | | | | | | | | | | | | | | | | | | | | | | | | | | | | | | |
For a share outstanding during the six-month period
| | | | | | | | | | | | | | | | |
ended December 31, 2011 (unaudited), the fiscal year
| | | | | | | | | | | | | | | | |
ended June 30, 2011, the eleven-month fiscal period
| | | | | | | | | | | | | | | | |
ended June 30, 2010 and each fiscal year or period
| | INTECH U.S. Growth Fund(6) | | |
| ended July 31 | | 2011 | | 2011 | | 2010(7) | | 2009 | | 2008 | | 2007 | | 2006(8) | | |
| |
| Net Asset Value, Beginning of Period | | | $13.97 | | | | $10.45 | | | | $9.72 | | | | $12.84 | | | | $14.40 | | | | $12.76 | | | | $13.52 | | | |
| Income from Investment Operations: | | | | | | | | | | | | | | | | | | | | | | | | | | | | | | |
| Net investment income | | | .07 | | | | .13 | | | | .12 | | | | .12 | | | | .11 | | | | .08 | | | | .05 | | | |
| Net gain/(loss) on investments (both realized and unrealized) | | | (.92) | | | | 3.55 | | | | .69 | | | | (3.07) | | | | (.93) | | | | 1.63 | | | | (.16) | | | |
| Total from Investment Operations | | | (.85) | | | | 3.68 | | | | .81 | | | | (2.95) | | | | (.82) | | | | 1.71 | | | | (.11) | | | |
| Less Distributions and Other: | | | | | | | | | | | | | | | | | | | | | | | | | | | | | | |
| Dividends (from net investment income)* | | | (.12) | | | | (.16) | | | | (.08) | | | | (.17) | | | | (.10) | | | | (.07) | | | | (.02) | | | |
| Distributions (from capital gains)* | | | – | | | | – | | | | – | | | | – | | | | (.64) | | | | – | | | | (.63) | | | |
| Redemption fees | | | –(4) | | | | –(4) | | | | –(4) | | | | –(4) | | | | – | | | | –(4) | | | | – | | | |
| Total Distributions and Other | | | (.12) | | | | (.16) | | | | (.08) | | | | (.17) | | | | (.74) | | | | (.07) | | | | (.65) | | | |
| Net Asset Value, End of Period | | | $13.00 | | | | $13.97 | | | | $10.45 | | | | $9.72 | | | | $12.84 | | | | $14.40 | | | | $12.76 | | | |
| Total Return** | | | (6.11)% | | | | 35.31% | | | | 8.29% | | | | (22.76)% | | | | (6.33)% | | | | 13.39% | | | | (0.99)% | | | |
| Net Assets, End of Period (in thousands) | | | $286,135 | | | | $323,567 | | | | $379,401 | | | | $807,347 | | | | $1,224,054 | | | | $1,223,851 | | | | $245,807 | | | |
| Average Net Assets for the Period (in thousands) | | | $288,823 | | | | $329,686 | | | | $768,204 | | | | $857,115 | | | | $1,288,020 | | | | $981,873 | | | | $99,407 | | | |
Ratio of Gross Expenses to Average Net Assets***(5) | | | 0.65% | | | | 0.63% | | | | 0.61% | | | | 0.55% | | | | 0.53% | | | | 0.56% | | | | 0.60% | | | |
Ratio of Net Expenses to Average Net Assets***(5) | | | 0.65% | | | | 0.63% | | | | 0.61% | | | | 0.55% | | | | 0.53% | | | | 0.56% | | | | 0.60% | | | |
| Ratio of Net Investment Income to Average Net Assets*** | | | 0.98% | | | | 0.84% | | | | 1.00% | | | | 1.30% | | | | 0.79% | | | | 0.77% | | | | 0.83% | | | |
| Portfolio Turnover Rate*** | | | 71% | | | | 96% | | | | 128% | | | | 119% | | | | 125% | | | | 113% | | | | 100% | | | |
| | | |
| * | | See Note 5 in Notes to Financial Statements. |
| ** | | Total return not annualized for periods of less than one full year. |
| *** | | Annualized for periods of less than one full year. |
| (1) | | Formerly named INTECH Risk-Managed Core Fund. |
| (2) | | Period from November 1, 2009 through June 30, 2010. The Fund changed its fiscal year end from October 31 to June 30. |
| (3) | | Period from July 6, 2009 (inception date) through October 31, 2009. |
| (4) | | Redemption fees aggregated less than $.01 on a per share basis. |
| (5) | | See Note 6 in Notes to Financial Statements. |
| (6) | | Formerly named INTECH Risk-Managed Growth Fund. |
| (7) | | Period from August 1, 2009 through June 30, 2010. The Fund changed its fiscal year end from July 31 to June 30. |
| (8) | | Period from November 28, 2005 (inception date) through July 31, 2006. |
See Notes to Financial Statements.
78 | DECEMBER 31, 2011
Class I Shares
| | | | | | | | | | | | | | | | | | | | | | | | | | | | | | | |
For a share outstanding during the six-month period ended
| | | | | | | | | | | | | | | | |
December 31, 2011 (unaudited), the fiscal year ended
| | | | | | | | | | | | | | | | |
June 30, 2011, the eleven-month fiscal period ended
| | INTECH U.S. Value Fund(1) | | |
| June 30, 2010 and each fiscal year or period ended July 31 | | 2011 | | 2011 | | 2010(2) | | 2009 | | 2008 | | 2007 | | 2006(3) | | |
| |
| Net Asset Value, Beginning of Period | | | $10.07 | | | | $7.89 | | | | $7.37 | | | | $9.91 | | | | $11.70 | | | | $10.66 | | | | $10.00 | | | |
| Income from Investment Operations: | | | | | | | | | | | | | | | | | | | | | | | | | | | | | | |
| Net investment income | | | .09 | | | | .15 | | | | .11 | | | | .18 | | | | .22 | | | | .20 | | | | .08 | | | |
| Net gain/(loss) on investments (both realized and unrealized) | | | (.48) | | | | 2.16 | | | | .45 | | | | (2.38) | | | | (1.64) | | | | 1.04 | | | | .58 | | | |
| Total from Investment Operations | | | (.39) | | | | 2.31 | | | | .56 | | | | (2.20) | | | | (1.42) | | | | 1.24 | | | | .66 | | | |
| Less Distributions and Other: | | | | | | | | | | | | | | | | | | | | | | | | | | | | | | |
| Dividends (from net investment income)* | | | (.17) | | | | (.13) | | | | (.04) | | | | (.34) | | | | (.14) | | | | (.18) | | | | – | | | |
| Distributions (from capital gains)* | | | – | | | | – | | | | – | | | | – | | | | (.23) | | | | (.02) | | | | – | | | |
| Redemption fees | | | –(4) | | | | – | | | | –(4) | | | | –(4) | | | | –(4) | | | | – | | | | – | | | |
| Total Distributions and Other | | | (.17) | | | | (.13) | | | | (.04) | | | | (.34) | | | | (.37) | | | | (.20) | | | | – | | | |
| Net Asset Value, End of Period | | | $9.51 | | | | $10.07 | | | | $7.89 | | | | $7.37 | | | | $9.91 | | | | $11.70 | | | | $10.66 | | | |
| Total Return** | | | (3.91)% | | | | 29.38% | | | | 7.62% | | | | (21.96)% | | | | (12.54)% | | | | 11.58% | | | | 6.60% | | | |
| Net Assets, End of Period (in thousands) | | | $89,524 | | | | $93,695 | | | | $66,137 | | | | $59,647 | | | | $63,472 | | | | $47,593 | | | | $18,723 | | | |
| Average Net Assets for the Period (in thousands) | | | $86,264 | | | | $84,034 | | | | $69,502 | | | | $53,614 | | | | $57,513 | | | | $31,496 | | | | $14,266 | | | |
Ratio of Gross Expenses to Average Net Assets***(5) | | | 0.69% | | | | 0.68% | | | | 0.75% | | | | 0.61% | | | | 0.60% | | | | 0.60% | | | | 0.61% | | | |
Ratio of Net Expenses to Average Net Assets***(5) | | | 0.69% | | | | 0.68% | | | | 0.75% | | | | 0.61% | | | | 0.60% | | | | 0.60% | | | | 0.60% | | | |
| Ratio of Net Investment Income to Average Net Assets*** | | | 1.88% | | | | 1.64% | | | | 1.53% | | | | 2.79% | | | | 2.34% | | | | 1.87% | | | | 1.70% | | | |
| Portfolio Turnover Rate*** | | | 71% | | | | 108% | | | | 101% | | | | 100% | | | | 78% | | | | 71% | | | | 98% | | | |
| | | |
| * | | See Note 5 in Notes to Financial Statements. |
| ** | | Total return not annualized for periods of less than one full year. |
| *** | | Annualized for periods of less than one full year. |
| (1) | | Formerly named INTECH Risk-Managed Value Fund. |
| (2) | | Period from August 1, 2009 through June 30, 2010. The Fund changed its fiscal year end from July 31 to June 30. |
| (3) | | Period from November 28, 2005 (inception date) through July 31, 2006. |
| (4) | | Redemption fees aggregated less than $.01 on a per share basis. |
| (5) | | See Note 6 in Notes to Financial Statements. |
See Notes to Financial Statements.
Janus Mathematical Funds | 79
Financial Highlights (continued)
Class S Shares
| | | | | | | |
| | | INTECH Global
| | |
| | | Dividend Fund | | |
| For a share outstanding during the period ended December 31, 2011 (unaudited) | | 2011(1) | | |
| |
| Net Asset Value, Beginning of Period | | | $10.00 | | | |
| Income from Investment Operations: | | | | | | |
| Net investment income | | | .01 | | | |
| Net gain/(loss) on investments (both realized and unrealized) | | | .30 | | | |
| Total from Investment Operations | | | .31 | | | |
| Less Distributions: | | | | | | |
| Dividends (from net investment income)* | | | (.01) | | | |
| Distributions (from capital gains)* | | | – | | | |
| Total Distributions | | | (.01) | | | |
| Net Asset Value, End of Period | | | $10.30 | | | |
| Total Return** | | | 3.11% | | | |
| Net Assets, End of Period (in thousands) | | | $859 | | | |
| Average Net Assets for the Period (in thousands) | | | $845 | | | |
Ratio of Gross Expenses to Average Net Assets***(2) | | | 1.09%(3) | | | |
Ratio of Net Expenses to Average Net Assets***(2) | | | 1.09%(3) | | | |
| Ratio of Net Investment Income to Average Net Assets*** | | | 1.18% | | | |
| Portfolio Turnover Rate*** | | | 0% | | | |
Class S Shares
| | | | | | | | | | | | | | | | | | | | | | | | | | | |
For a share outstanding during the six-month period ended
| | | | | | | | | | | | | | |
December 31, 2011 (unaudited), the fiscal year ended June 30,
| | | | | | | | | | | | | | |
2011, the eleven-month fiscal period ended June 30, 2010 and
| | INTECH International Fund(4) | | |
| each fiscal year or period ended July 31 | | 2011 | | 2011 | | 2010(5) | | 2009 | | 2008 | | 2007(6) | | |
| |
| Net Asset Value, Beginning of Period | | | $8.12 | | | | $6.16 | | | | $6.56 | | | | $8.95 | | | | $9.92 | | | | $10.00 | | | |
| Income from Investment Operations: | | | | | | | | | | | | | | | | | | | | | | | | | | |
| Net investment income | | | – | | | | .70 | | | | .13 | | | | .16 | | | | .18 | | | | .07 | | | |
| Net gain/(loss) on investments (both realized and unrealized) | | | (1.45) | | | | 1.37 | | | | (.47) | | | | (2.30) | | | | (1.02) | | | | (.15) | | | |
| Total from Investment Operations | | | (1.45) | | | | 2.07 | | | | (.34) | | | | (2.14) | | | | (.84) | | | | (.08) | | | |
| Less Distributions: | | | | | | | | | | | | | | | | | | | | | | | | | | |
| Dividends (from net investment income)* | | | (.07) | | | | (.11) | | | | (.06) | | | | (.25) | | | | (.13) | | | | – | | | |
| Distributions (from capital gains)* | | | – | | | | – | | | | – | | | | – | | | | – | | | | – | | | |
| Total Distributions | | | (.07) | | | | (.11) | | | | (.06) | | | | (.25) | | | | (.13) | | | | – | | | |
| Net Asset Value, End of Period | | | $6.60 | | | | $8.12 | | | | $6.16 | | | | $6.56 | | | | $8.95 | | | | $9.92 | | | |
| Total Return** | | | (17.90)% | | | | 33.75% | | | | (5.32)% | | | | (23.54)% | | | | (8.61)% | | | | (0.80)% | | | |
| Net Assets, End of Period (in thousands) | | | $416 | | | | $498 | | | | $1,642 | | | | $1,733 | | | | $2,268 | | | | $2,480 | | | |
| Average Net Assets for the Period (in thousands) | | | $437 | | | | $1,870 | | | | $1,831 | | | | $1,551 | | | | $2,477 | | | | $2,489 | | | |
Ratio of Gross Expenses to Average Net Assets***(2) | | | 1.51% | | | | 1.07%(7) | | | | 0.73%(7) | | | | 0.65%(7) | | | | 1.16% | | | | 1.16% | | | |
Ratio of Net Expenses to Average Net Assets***(2) | | | 1.51% | | | | 1.07%(7) | | | | 0.72%(7) | | | | 0.65%(7) | | | | 1.15% | | | | 1.15% | | | |
| Ratio of Net Investment Income to Average Net Assets*** | | | 0.60% | | | | 2.05% | | | | 1.89% | | | | 2.60% | | | | 1.67% | | | | 2.95% | | | |
| Portfolio Turnover Rate*** | | | 71% | | | | 179% | | | | 130% | | | | 115% | | | | 105% | | | | 140% | | | |
| | | |
| * | | See Note 5 in Notes to Financial Statements. |
| ** | | Total return not annualized for periods of less than one full year. |
| *** | | Annualized for periods of less than one full year. |
| (1) | | Period from December 15, 2011 (inception date) through December 31, 2011. |
| (2) | | See Note 6 in Notes to Financial Statements. |
| (3) | | Pursuant to a contractual agreement, Janus waived certain fees and expenses during the period. The Ratio of Gross Expenses to Average Net Assets and Ratio of Net Expenses to Average Net Assets would have been 1.47% and 1.47%, respectively, without the waiver of these fees and expenses. |
| (4) | | Formerly named INTECH Risk-Managed International Fund. |
| (5) | | Period from August 1, 2009 through June 30, 2010. The Fund changed its fiscal year end from July 31 to June 30. |
| (6) | | Period from May 2, 2007 (inception date) through July 31, 2007. |
| (7) | | Pursuant to a contractual agreement, Janus waived certain fees and expenses during the period. The Ratio of Gross Expenses to Average Net Assets and Ratio of Net Expenses to Average Net Assets would have been 1.58% and 1.50%, respectively, in 2011, 1.51% and 1.50%, respectively, in 2010 and 1.18% and 1.18%, respectively, in 2009 without the waiver of these fees and expenses. |
See Notes to Financial Statements.
80 | DECEMBER 31, 2011
Class S Shares
| | | | | | | | | | | | | | | | | | | |
For a share outstanding during the six-month period ended December 31, 2011
| | | | | | | | | | |
(unaudited), the fiscal year ended June 30, 2011, the eight-month fiscal period ended
| | INTECH U.S. Core Fund(1) | | |
| June 30, 2010 and the fiscal period ended October 31, 2009 | | 2011 | | 2011 | | 2010(2) | | 2009(3) | | |
| |
| Net Asset Value, Beginning of Period | | | $14.29 | | | | $10.73 | | | | $10.55 | | | | $9.26 | | | |
| Income from Investment Operations: | | | | | | | | | | | | | | | | | | |
| Net investment income/(loss) | | | .05 | | | | .08 | | | | .07 | | | | .04 | | | |
| Net gain/(loss) on investments (both realized and unrealized) | | | (.58) | | | | 3.57 | | | | .17 | | | | 1.25 | | | |
| Total from Investment Operations | | | (.53) | | | | 3.65 | | | | .24 | | | | 1.29 | | | |
| Less Distributions and Other: | | | | | | | | | | | | | | | | | | |
| Dividends (from net investment income)* | | | (.09) | | | | (.09) | | | | (.06) | | | | – | | | |
| Distributions (from capital gains)* | | | – | | | | – | | | | – | | | | – | | | |
| Redemption fees | | | –(4) | | | | –(4) | | | | –(4) | | | | –(4) | | | |
| Total Distributions and Other | | | (.09) | | | | (.09) | | | | (.06) | | | | – | | | |
| Net Asset Value, End of Period | | | $13.67 | | | | $14.29 | | | | $10.73 | | | | $10.55 | | | |
| Total Return** | | | (3.72)% | | | | 34.11% | | | | 2.26% | | | | 13.93% | | | |
| Net Assets, End of Period (in thousands) | | | $4,608 | | | | $4,836 | | | | $3,888 | | | | $4,558 | | | |
| Average Net Assets for the Period (in thousands) | | | $4,471 | | | | $4,423 | | | | $4,677 | | | | $5,179 | | | |
Ratio of Gross Expenses to Average Net Assets***(5) | | | 1.21% | | | | 1.18% | | | | 1.03% | | | | 1.27% | | | |
Ratio of Net Expenses to Average Net Assets***(5) | | | 1.21% | | | | 1.18% | | | | 1.02% | | | | 1.25% | | | |
| Ratio of Net Investment Income to Average Net Assets*** | | | 0.76% | | | | 0.61% | | | | 0.89% | | | | 1.02% | | | |
| Portfolio Turnover Rate*** | | | 56% | | | | 93% | | | | 120% | | | | 111% | | | |
Class S Shares
| | | | | | | | | | | | | | | | | | | | | | | | | | | | | | | |
For a share outstanding during the six-month period ended
| | | | | | | | | | | | | | | | |
December 31, 2011 (unaudited), the fiscal year ended
| | | | | | | | | | | | | | | | |
June 30, 2011, the eleven-month fiscal period ended
| | INTECH U.S. Growth Fund(6) | | |
| June 30, 2010 and each fiscal year ended July 31 | | 2011 | | 2011 | | 2010(7) | | 2009 | | 2008 | | 2007 | | 2006 | | |
| |
| Net Asset Value, Beginning of Period | | | $14.02 | | | | $10.48 | | | | $9.77 | | | | $12.81 | | | | $14.36 | | | | $12.75 | | | | $13.28 | | | |
| Income from Investment Operations: | | | | | | | | | | | | | | | | | | | | | | | | | | | | | | |
| Net investment income/(loss) | | | (.07) | | | | .33 | | | | .20 | | | | .33 | | | | .11 | | | | .04 | | | | .03 | | | |
| Net gain/(loss) on investments (both realized and unrealized) | | | (.83) | | | | 3.31 | | | | .56 | | | | (3.30) | | | | (.98) | | | | 1.58 | | | | .07 | | | |
| Total from Investment Operations | | | (.90) | | | | 3.64 | | | | .76 | | | | (2.97) | | | | (.87) | | | | 1.62 | | | | .10 | | | |
| Less Distributions and Other: | | | | | | | | | | | | | | | | | | | | | | | | | | | | | | |
| Dividends (from net investment income)* | | | (.06) | | | | (.10) | | | | (.05) | | | | (.07) | | | | (.04) | | | | (.01) | | | | – | | | |
| Distributions (from capital gains)* | | | – | | | | – | | | | – | | | | – | | | | (.64) | | | | – | | | | (.63) | | | |
| Redemption fees | | | –(4) | | | | –(4) | | | | –(4) | | | | –(4) | | | | –(4) | | | | –(4) | | | | –(4) | | | |
| Total Distributions and Other | | | (.06) | | | | (.10) | | | | (.05) | | | | (.07) | | | | (.68) | | | | (.01) | | | | (.63) | | | |
| Net Asset Value, End of Period | | | $13.06 | | | | $14.02 | | | | $10.48 | | | | $9.77 | | | | $12.81 | | | | $14.36 | | | | $12.75 | | | |
| Total Return** | | | (6.40)% | | | | 34.77% | | | | 7.73% | | | | (23.09)% | | | | (6.68)% | | | | 12.72% | | | | 0.59% | | | |
| Net Assets, End of Period (in thousands) | | | $14,950 | | | | $13,963 | | | | $15,629 | | | | $20,051 | | | | $70,963 | | | | $154,057 | | | | $121,473 | | | |
| Average Net Assets for the Period (in thousands) | | | $14,249 | | | | $14,606 | | | | $18,507 | | | | $40,058 | | | | $117,236 | | | | $151,536 | | | | $97,158 | | | |
Ratio of Gross Expenses to Average Net Assets***(5) | | | 1.09% | | | | 1.07% | | | | 1.12% | | | | 1.04% | | | | 1.02% | | | | 1.05% | | | | 1.10% | | | |
Ratio of Net Expenses to Average Net Assets***(5) | | | 1.09% | | | | 1.07% | | | | 1.12% | | | | 1.04% | | | | 1.02% | | | | 1.05% | | | | 1.10% | | | |
| Ratio of Net Investment Income to Average Net Assets*** | | | 0.54% | | | | 0.40% | | | | 0.49% | | | | 0.77% | | | | 0.36% | | | | 0.31% | | | | 0.35% | | | |
| Portfolio Turnover Rate*** | | | 71% | | | | 96% | | | | 128% | | | | 119% | | | | 125% | | | | 113% | | | | 100% | | | |
| | | |
| * | | See Note 5 in Notes to Financial Statements. |
| ** | | Total return not annualized for periods of less than one full year. |
| *** | | Annualized for periods of less than one full year. |
| (1) | | Formerly named INTECH Risk-Managed Core Fund. |
| (2) | | Period from November 1, 2009 through June 30, 2010. The Fund changed its fiscal year end from October 31 to June 30. |
| (3) | | Period from July 6, 2009 (inception date) through October 31, 2009. |
| (4) | | Redemption fees aggregated less than $.01 on a per share basis. |
| (5) | | See Note 6 in Notes to Financial Statements. |
| (6) | | Formerly named INTECH Risk-Managed Growth Fund. |
| (7) | | Period from August 1, 2009 through June 30, 2010. The Fund changed its fiscal year end from July 31 to June 30. |
See Notes to Financial Statements.
Janus Mathematical Funds | 81
Financial Highlights (continued)
Class S Shares
| | | | | | | | | | | | | | | | | | | | | | | | | | | | | | | |
For a share outstanding during the six-month period ended
| | | | | | | | | | | | | | | | |
December 31, 2011 (unaudited), the fiscal year ended
| | | | | | | | | | | | | | | | |
June 30, 2011, the eleven-month fiscal period ended June 30,
| | INTECH U.S. Value Fund(1) | | |
| 2010 and each fiscal year or period ended July 31 | | 2011 | | 2011 | | 2010(2) | | 2009 | | 2008 | | 2007 | | 2006(3) | | |
| |
| Net Asset Value, Beginning of Period | | | $10.02 | | | | $7.85 | | | | $7.37 | | | | $9.86 | | | | $11.66 | | | | $10.63 | | | | $10.00 | | | |
| Income from Investment Operations: | | | | | | | | | | | | | | | | | | | | | | | | | | | | | | |
| Net investment income | | | .06 | | | | .15 | | | | .08 | | | | .17 | | | | .20 | | | | .17 | | | | .07 | | | |
| Net gain/(loss) on investments (both realized and unrealized) | | | (.48) | | | | 2.11 | | | | .44 | | | | (2.38) | | | | (1.67) | | | | 1.00 | | | | .56 | | | |
| Total from Investment Operations | | | (.42) | | | | 2.26 | | | | .52 | | | | (2.21) | | | | (1.47) | | | | 1.17 | | | | .63 | | | |
| Less Distributions: | | | | | | | | | | | | | | | | | | | | | | | | | | | | | | |
| Dividends (from net investment income)* | | | (.11) | | | | (.09) | | | | (.04) | | | | (.28) | | | | (.10) | | | | (.12) | | | | – | | | |
| Distributions (from capital gains)* | | | – | | | | – | | | | – | | | | – | | | | (.23) | | | | (.02) | | | | – | | | |
| Total Distributions | | | (.11) | | | | (.09) | | | | (.04) | | | | (.28) | | | | (.33) | | | | (.14) | | | | – | | | |
| Net Asset Value, End of Period | | | $9.49 | | | | $10.02 | | | | $7.85 | | | | $7.37 | | | | $9.86 | | | | $11.66 | | | | $10.63 | | | |
| Total Return** | | | (4.18)% | | | | 28.81% | | | | 7.00% | | | | (22.15)% | | | | (12.98)% | | | | 11.00% | | | | 6.30% | | | |
| Net Assets, End of Period (in thousands) | | | $207 | | | | $216 | | | | $214 | | | | $200 | | | | $257 | | | | $295 | | | | $266 | | | |
| Average Net Assets for the Period (in thousands) | | | $199 | | | | $254 | | | | $225 | | | | $192 | | | | $284 | | | | $294 | | | | $256 | | | |
Ratio of Gross Expenses to Average Net Assets***(4) | | | 1.17% | | | | 1.17% | | | | 1.26% | | | | 0.97% | | | | 1.10% | | | | 1.10% | | | | 1.10% | | | |
Ratio of Net Expenses to Average Net Assets***(4) | | | 1.17% | | | | 1.17% | | | | 1.26% | | | | 0.97% | | | | 1.10% | | | | 1.10% | | | | 1.10% | | | |
| Ratio of Net Investment Income to Average Net Assets*** | | | 1.39% | | | | 1.16% | | | | 1.02% | | | | 2.43% | | | | 1.84% | | | | 1.43% | | | | 1.23% | | | |
| Portfolio Turnover Rate*** | | | 71% | | | | 108% | | | | 101% | | | | 100% | | | | 78% | | | | 71% | | | | 98% | | | |
| | | |
| * | | See Note 5 in Notes to Financial Statements. |
| ** | | Total return not annualized for periods of less than one full year. |
| *** | | Annualized for periods of less than one full year. |
| (1) | | Formerly named INTECH Risk-Managed Value Fund. |
| (2) | | Period from August 1, 2009 through June 30, 2010. The Fund changed its fiscal year end from July 31 to June 30. |
| (3) | | Period from December 30, 2005 (inception date) through July 31, 2006. |
| (4) | | See Note 6 in Notes to Financial Statements. |
See Notes to Financial Statements.
82 | DECEMBER 31, 2011
Class T Shares
| | | | | | | |
| | | INTECH Global
| | |
| | | Dividend Fund | | |
| For a share outstanding during the period ended December 31, 2011 (unaudited) | | 2011(1) | | |
| |
| Net Asset Value, Beginning of Period | | | $10.00 | | | |
| Income from Investment Operations: | | | | | | |
| Net investment income | | | – | | | |
| Net gain/(loss) on investments (both realized and unrealized) | | | .31 | | | |
| Total from Investment Operations | | | .31 | | | |
| Less Distributions: | | | | | | |
| Dividends (from net investment income)* | | | (.01) | | | |
| Distributions (from capital gains)* | | | – | | | |
| Total Distributions | | | (.01) | | | |
| Net Asset Value, End of Period | | | $10.30 | | | |
| Total Return** | | | 3.11% | | | |
| Net Assets, End of Period (in thousands) | | | $1,060 | | | |
| Average Net Assets for the Period (in thousands) | | | $845 | | | |
Ratio of Gross Expenses to Average Net Assets***(2) | | | 1.03% | | | |
Ratio of Net Expenses to Average Net Assets***(2) | | | 1.03% | | | |
| Ratio of Net Investment Income/(Loss) to Average Net Assets*** | | | 1.24% | | | |
| Portfolio Turnover Rate*** | | | 0% | | | |
Class T Shares
| | | | | | | | | | | | | | | | | | | |
For a share outstanding during the six-month period ended December 31, 2011
| | | | | | | | | | |
(unaudited), the fiscal year ended June 30, 2011, the eleven-month fiscal period ended
| | INTECH International Fund(3) | | |
| June 30, 2010 and the fiscal period ended July 31, 2009 | | 2011 | | 2011 | | 2010(4) | | 2009(5) | | |
| |
| Net Asset Value, Beginning of Period | | | $8.09 | | | | $6.16 | | | | $6.55 | | | | $5.93 | | | |
| Income from Investment Operations: | | | | | | | | | | | | | | | | | | |
| Net investment income | | | .03 | | | | .17 | | | | .12 | | | | – | | | |
| Net gain/(loss) on investments (both realized and unrealized) | | | (1.47) | | | | 1.87 | | | | (.45) | | | | .62 | | | |
| Total from Investment Operations | | | (1.44) | | | | 2.04 | | | | (.33) | | | | .62 | | | |
| Less Distributions: | | | | | | | | | | | | | | | | | | |
| Dividends (from net investment income)* | | | (.07) | | | | (.11) | | | | (.06) | | | | – | | | |
| Distributions (from capital gains)* | | | – | | | | – | | | | – | | | | – | | | |
| Total Distributions | | | (.07) | | | | (.11) | | | | (.06) | | | | – | | | |
| Net Asset Value, End of Period | | | $6.58 | | | | $8.09 | | | | $6.16 | | | | $6.55 | | | |
| Total Return** | | | (17.84)% | | | | 33.26% | | | | (5.17)% | | | | 10.46% | | | |
| Net Assets, End of Period (in thousands) | | | $37 | | | | $45 | | | | $10 | | | | $1 | | | |
| Average Net Assets for the Period (in thousands) | | | $39 | | | | $29 | | | | $8 | | | | $1 | | | |
Ratio of Gross Expenses to Average Net Assets***(2) | | | 1.26% | | | | 0.54%(6) | | | | 0.32%(6) | | | | 1.25% | | | |
Ratio of Net Expenses to Average Net Assets***(2) | | | 1.26% | | | | 0.54%(6) | | | | 0.31%(6) | | | | 1.25% | | | |
| Ratio of Net Investment Income/(Loss) to Average Net Assets*** | | | 0.85% | | | | 3.12% | | | | 2.47% | | | | (0.35)% | | | |
| Portfolio Turnover Rate*** | | | 71% | | | | 179% | | | | 130% | | | | 115% | | | |
| | | |
| * | | See Note 5 in Notes to Financial Statements. |
| ** | | Total return not annualized for periods of less than one full year. |
| *** | | Annualized for periods of less than one full year. |
| (1) | | Period from December 15, 2011 (inception date) through December 31, 2011. |
| (2) | | See Note 6 in Notes to Financial Statements. |
| (3) | | Formerly named INTECH Risk-Managed International Fund. |
| (4) | | Period from August 1, 2009 through June 30, 2010. The Fund changed its fiscal year end from July 31 to June 30. |
| (5) | | Period from July 6, 2009 (inception date) through July 31, 2009. |
| (6) | | Pursuant to a contractual agreement, Janus waived certain fees and expenses during the period. The Ratio of Gross Expenses to Average Net Assets and Ratio of Net Expenses to Average Net Assets would have been 0.91% and 1.25%, respectively, in 2011 and 1.26% and 1.25%, respectively, in 2010 without the waiver of these fees and expenses. |
See Notes to Financial Statements.
Janus Mathematical Funds | 83
Financial Highlights (continued)
Class T Shares
| | | | | | | | | | | | | | | | | | | | | | | | | | | | | | | |
For a share outstanding during the six-month period ended
| | | | | | | | | | | | | | | | |
December 31, 2011 (unaudited), the fiscal year ended
| | | | | | | | | | | | | | | | |
June 30, 2011, the eight-month fiscal period ended
| | INTECH U.S. Core Fund(1) | | |
| June 30, 2010 and each fiscal year ended October 31 | | 2011 | | 2011 | | 2010(2) | | 2009 | | 2008 | | 2007 | | 2006 | | |
| |
| Net Asset Value, Beginning of Period | | | $14.31 | | | | $10.74 | | | | $10.56 | | | | $10.21 | | | | $17.38 | | | | $16.46 | | | | $15.28 | | | |
| Income from Investment Operations: | | | | | | | | | | | | | | | | | | | | | | | | | | | | | | |
| Net investment income | | | .07 | | | | .12 | | | | .12 | | | | .18 | | | | .24 | | | | .20 | | | | .12 | | | |
| Net gain/(loss) on investments (both realized and unrealized) | | | (.59) | | | | 3.58 | | | | .14 | | | | .46 | | | | (5.75) | | | | 1.71 | | | | 1.96 | | | |
| Total from Investment Operations | | | (.52) | | | | 3.70 | | | | .26 | | | | .64 | | | | (5.51) | | | | 1.91 | | | | 2.08 | | | |
| Less Distributions and Other: | | | | | | | | | | | | | | | | | | | | | | | | | | | | | | |
| Dividends (from net investment income)* | | | (.12) | | | | (.13) | | | | (.08) | | | | (.29) | | | | (.24) | | | | (.12) | | | | (.13) | | | |
| Distributions (from capital gains)* | | | – | | | | – | | | | – | | | | – | | | | (1.42) | | | | (.87) | | | | (.77) | | | |
| Redemption fees | | | –(3) | | | | –(3) | | | | –(3) | | | | –(3) | | | | –(3) | | | | –(3) | | | | –(3) | | | |
| Total Distributions and Other | | | (.12) | | | | (.13) | | | | (.08) | | | | (.29) | | | | (1.66) | | | | (.99) | | | | (.90) | | | |
| Net Asset Value, End of Period | | | $13.67 | | | | $14.31 | | | | $10.74 | | | | $10.56 | | | | $10.21 | | | | $17.38 | | | | $16.46 | | | |
| Total Return** | | | (3.61)% | | | | 34.53% | | | | 2.39% | | | | 6.70% | | | | (34.82)% | | | | 12.11% | | | | 14.10% | | | |
| Net Assets, End of Period (in thousands) | | | $72,607 | | | | $74,483 | | | | $58,922 | | | | $222,932 | | | | $246,935 | | | | $512,837 | | | | $498,582 | | | |
| Average Net Assets for the Period (in thousands) | | | $70,163 | | | | $66,619 | | | | $140,726 | | | | $215,954 | | | | $386,247 | | | | $543,933 | | | | $433,127 | | | |
Ratio of Gross Expenses to Average Net Assets***(4) | | | 0.96% | | | | 0.92% | | | | 0.79% | | | | 0.91% | | | | 0.75% | | | | 0.77% | | | | 0.91% | | | |
Ratio of Net Expenses to Average Net Assets***(4) | | | 0.96% | | | | 0.92% | | | | 0.79% | | | | 0.91% | | | | 0.75% | | | | 0.77% | | | | 0.90% | | | |
| Ratio of Net Investment Income to Average Net Assets*** | | | 1.00% | | | | 0.87% | | | | 1.16% | | | | 1.78% | | | | 1.55% | | | | 1.08% | | | | 0.81% | | | |
| Portfolio Turnover Rate*** | | | 56% | | | | 93% | | | | 120% | | | | 111% | | | | 74% | | | | 109% | | | | 108% | | | |
Class T Shares
| | | | | | | | | | | | | | | | | | | |
For a share outstanding during the six-month period ended December 31, 2011
| | | | | | | | | | |
(unaudited), the fiscal year ended June 30, 2011, the eleven-month fiscal period ended
| | INTECH U.S. Growth Fund(5) | | |
| June 30, 2010 and the fiscal period ended July 31, 2009 | | 2011 | | 2011 | | 2010(6) | | 2009(7) | | |
| |
| Net Asset Value, Beginning of Period | | | $13.96 | | | | $10.48 | | | | $9.76 | | | | $8.98 | | | |
| Income from Investment Operations: | | | | | | | | | | | | | | | | | | |
| Net investment income | | | .08 | | | | .11 | | | | .06 | | | | .01 | | | |
| Net gain/(loss) on investments (both realized and unrealized) | | | (.97) | | | | 3.54 | | | | .73 | | | | .77 | | | |
| Total from Investment Operations | | | (.89) | | | | 3.65 | | | | .79 | | | | .78 | | | |
| Less Distributions and Other: | | | | | | | | | | | | | | | | | | |
| Dividends (from net investment income)* | | | (.10) | | | | (.17) | | | | (.07) | | | | – | | | |
| Distributions (from capital gains)* | | | – | | | | – | | | | – | | | | – | | | |
| Redemption fees | | | .02 | | | | – | | | | – | | | | – | | | |
| Total Distributions and Other | | | (.08) | | | | (.17) | | | | (.07) | | | | – | | | |
| Net Asset Value, End of Period | | | $12.99 | | | | $13.96 | | | | $10.48 | | | | $9.76 | | | |
| Total Return** | | | (6.23)% | | | | 34.99% | | | | 8.11% | | | | 8.69% | | | |
| Net Assets, End of Period (in thousands) | | | $80 | | | | $58 | | | | $14 | | | | $1 | | | |
| Average Net Assets for the Period (in thousands) | | | $77 | | | | $33 | | | | $10 | | | | $1 | | | |
Ratio of Gross Expenses to Average Net Assets***(4) | | | 0.84% | | | | 0.76% | | | | 0.85% | | | | 0.86% | | | |
Ratio of Net Expenses to Average Net Assets***(4) | | | 0.84% | | | | 0.76% | | | | 0.85% | | | | 0.85% | | | |
| Ratio of Net Investment Income to Average Net Assets*** | | | 0.80% | | | | 0.63% | | | | 0.67% | | | | 0.72% | | | |
| Portfolio Turnover Rate*** | | | 71% | | | | 96% | | | | 128% | | | | 119% | | | |
| | | |
| * | | See Note 5 in Notes to Financial Statements. |
| ** | | Total return not annualized for periods of less than one full year. |
| *** | | Annualized for periods of less than one full year. |
| (1) | | Formerly named INTECH Risk-Managed Core Fund. |
| (2) | | Period from November 1, 2009 through June 30, 2010. The Fund changed its fiscal year end from October 31 to June 30. |
| (3) | | Redemption fees aggregated less than $.01 on a per share basis. |
| (4) | | See Note 6 in Notes to Financial Statements. |
| (5) | | Formerly named INTECH Risk-Managed Growth Fund. |
| (6) | | Period from August 1, 2009 through June 30, 2010. The Fund changed its fiscal year end from July 31 to June 30. |
| (7) | | Period from July 6, 2009 (inception date) through July 31, 2009. |
See Notes to Financial Statements.
84 | DECEMBER 31, 2011
Class T Shares
| | | | | | | | | | | | | | | | | | | |
For a share outstanding during the six-month period ended December 31, 2011
| | | | | | | | | | |
(unaudited), the fiscal year ended June 30, 2011, the eleven-month fiscal period ended
| | INTECH U.S. Value Fund(1) | | |
| June 30, 2010 and the fiscal period ended July 31, 2009 | | 2011 | | 2011 | | 2010(2) | | 2009(3) | | |
| |
| Net Asset Value, Beginning of Period | | | $10.05 | | | | $7.87 | | | | $7.37 | | | | $6.63 | | | |
| Income from Investment Operations: | | | | | | | | | | | | | | | | | | |
| Net investment income | | | .05 | | | | .15 | | | | .05 | | | | .01 | | | |
| Net gain/(loss) on investments (both realized and unrealized) | | | (.47) | | | | 2.15 | | | | .49 | | | | .73 | | | |
| Total from Investment Operations | | | (.42) | | | | 2.30 | | | | .54 | | | | .74 | | | |
| Less Distributions: | | | | | | | | | | | | | | | | | | |
| Dividends (from net investment income)* | | | (.13) | | | | (.12) | | | | (.04) | | | | – | | | |
| Distributions (from capital gains)* | | | – | | | | – | | | | – | | | | – | | | |
| Total Distributions | | | (.13) | | | | (.12) | | | | (.04) | | | | – | | | |
| Net Asset Value, End of Period | | | $9.50 | | | | $10.05 | | | | $7.87 | | | | $7.37 | | | |
| Total Return** | | | (4.13)% | | | | 29.29% | | | | 7.31% | | | | 11.16% | | | |
| Net Assets, End of Period (in thousands) | | | $48 | | | | $17 | | | | $33 | | | | $1 | | | |
| Average Net Assets for the Period (in thousands) | | | $18 | | | | $35 | | | | $20 | | | | $1 | | | |
Ratio of Gross Expenses to Average Net Assets***(4) | | | 0.94% | | | | 0.95% | | | | 1.00% | | | | 1.00% | | | |
Ratio of Net Expenses to Average Net Assets***(4) | | | 0.94% | | | | 0.95% | | | | 1.00% | | | | 1.00% | | | |
| Ratio of Net Investment Income to Average Net Assets*** | | | 1.76% | | | | 1.39% | | | | 1.20% | | | | 2.08% | | | |
| Portfolio Turnover Rate*** | | | 71% | | | | 108% | | | | 101% | | | | 100% | | | |
| | | |
| * | | See Note 5 in Notes to Financial Statements. |
| ** | | Total return not annualized for periods of less than one full year. |
| *** | | Annualized for periods of less than one full year. |
| (1) | | Formerly named INTECH Risk-Managed Value Fund. |
| (2) | | Period from August 1, 2009 through June 30, 2010. The Fund changed its fiscal year end from July 31 to June 30. |
| (3) | | Period from July 6, 2009 (inception date) through July 31, 2009. |
| (4) | | See Note 6 in Notes to Financial Statements. |
See Notes to Financial Statements.
Janus Mathematical Funds | 85
Notes to Schedules of Investments (unaudited)
| | |
| Lipper International Funds | | Funds that invest their assets in securities with primary trading markets outside of the United States. |
| |
| Lipper Large-Cap Core Funds | | Funds that, by portfolio practice, invest at least 75% of their equity assets in companies with market capitalizations (on a three-year weighted basis) above Lipper’s U.S. Diversified Equity large-cap floor. Large-cap core funds have more latitude in the companies in which they invest. These funds typically have an average price-to-earnings ratio, price-to-book ratio, and three-year sales-per-share growth value, compared to the S&P 500® Index. |
| |
| Lipper Multi-Cap Growth Funds | | Funds that, by portfolio practice, invest in a variety of market capitalization ranges without concentrating 75% of their equity assets in any one market capitalization range over an extended period of time. Multi-cap growth funds typically have an above-average price-to-earnings ratio, price-to-book ratio, and three-year sales-per-share growth value, compared to the S&P SuperComposite 1500 Index. |
| |
| Lipper Multi-Cap Value Funds | | Funds that, by portfolio practice, invest in a variety of market capitalization ranges without concentrating 75% of their equity assets in any one market capitalization range over an extended period of time. Multi-cap value funds typically have a below-average price-to earnings ratio, price-to-book ratio, and three-year sales-per-share growth value, compared to the S&P SuperComposite 1500 Index. |
| |
| Morgan Stanley Capital International EAFE® Index | | A free float-adjusted market capitalization weighted index designed to measure developed market equity performance. The MSCI EAFE® Index is composed of companies representative of the market structure of developed market countries. The index includes reinvestment of dividends, net of foreign withholding taxes. |
| |
| Morgan Stanley Capital International World High Dividend Yield Index | | An index designed to reflect the performance of the high dividend yield securities contained within the broader MSCI World IndexSM. The index includes large and mid cap stocks from developed markets across the Americas, Asia-Pacific and Europe. |
| |
| Morgan Stanley Capital International World IndexSM | | A market capitalization weighted index composed of companies representative of the market structure of developed market countries in North America, Europe, and the Asia/Pacific Region. The index includes reinvestment of dividends, net of foreign withholding taxes. |
| |
| Russell 1000® Growth Index | | Measures the performance of those Russell 1000® Index companies with higher price-to-book ratios and higher forecasted growth values. |
| |
| Russell 1000® Value Index | | Measures the performance of those Russell 1000® Index companies with lower price-to-book ratios and lower forecasted growth values. |
| |
| S&P 500® Index | | A commonly recognized, market-capitalization weighted index of 500 widely held equity securities, designed to measure broad U.S. equity performance. |
| |
| FDR | | Fixed Depositary Receipt |
| |
| PLC | | Public Limited Company |
| |
| REIT | | Real Estate Investment Trust |
| |
| SDR | | Swedish Depositary Receipt |
| |
| U.S. Shares | | Securities of foreign companies trading on an American Stock Exchange. |
| | | |
| * | | Non-income producing security. |
86 | DECEMBER 31, 2011
The following is a summary of the inputs that were used to value the Funds’ investments in securities and other financial instruments as of December 31, 2011. See Notes to Financial Statements for more information.
Valuation Inputs Summary (as of December 31, 2011)
| | | | | | | | | | | | |
| | | | | Level 2 – Other Significant
| | Level 3 – Significant
| | |
| | | Level 1 – Quoted Prices | | Observable Inputs(a) | | Unobservable Inputs | | |
| |
Investments in Securities: | | | | | | | | | | | |
| INTECH Global Dividend Fund | | | | | | | | | | | |
Common Stock | | | | | | | | | | | |
| Cellular Telecommunications | | $ | 43,060 | | $ | 20,521 | | $ | – | | |
| Chemicals – Diversified | | | 31,614 | | | 11,343 | | | – | | |
| Commercial Banks | | | 222,748 | | | 4,897 | | | – | | |
| Oil Companies – Integrated | | | 188,352 | | | 5,803 | | | – | | |
| Satellite Telecommunications | | | 7,346 | | | 7,607 | | | – | | |
| Telephone – Integrated | | | 306,775 | | | 19,274 | | | – | | |
| All Other | | | 4,271,966 | | | – | | | – | | |
| | | | | | | | | | | | |
| | | | | | | | | | | | |
Preferred Stock | | | – | | | 19,338 | | | – | | |
| | | | | | | | | | | | |
| | | | | | | | | | | | |
Money Market | | | – | | | 209,000 | | | – | | |
| | | | | | | | | | | | |
| | | | | | | | | | | | |
| Total Investments in Securities | | $ | 5,071,861 | | $ | 297,783 | | $ | – | | |
| |
| |
Investments in Securities: | | | | | | | | | | | |
INTECH International Fund(b) | | | | | | | | | | | |
Common Stock | | | | | | | | | | | |
| Building Products – Cement and Aggregate | | $ | 102,127 | | $ | 15,155 | | $ | – | | |
| Cellular Telecommunications | | | 281,640 | | | 190,965 | | | – | | |
| Satellite Telecommunications | | | 149,006 | | | 26,255 | | | – | | |
| Steel – Producers | | | 32,489 | | | 40,536 | | | – | | |
| Telecommunication Equipment | | | 124,322 | | | 9,602 | | | – | | |
| All Other | | | 33,126,544 | | | – | | | – | | |
| | | | | | | | | | | | |
| | | | | | | | | | | | |
Preferred Stock | | | – | | | 410,003 | | | – | | |
| | | | | | | | | | | | |
| | | | | | | | | | | | |
Money Market | | | – | | | 2,357,237 | | | – | | |
| | | | | | | | | | | | |
| | | | | | | | | | | | |
| Total Investments in Securities | | $ | 33,816,128 | | $ | 3,049,753 | | $ | – | | |
| |
| |
Investments in Securities: | | | | | | | | | | | |
INTECH U.S. Core Fund(c) | | | | | | | | | | | |
Common Stock | | $ | 309,299,988 | | $ | – | | $ | – | | |
| | | | | | | | | | | | |
| | | | | | | | | | | | |
Money Market | | | – | | | 1,545,554 | | | – | | |
| | | | | | | | | | | | |
| | | | | | | | | | | | |
| Total Investments in Securities | | $ | 309,299,988 | | $ | 1,545,554 | | $ | – | | |
| |
| |
Investments in Securities: | | | | | | | | | | | |
INTECH U.S. Growth Fund(d) | | | | | | | | | | | |
Common Stock | | $ | 311,487,393 | | $ | – | | $ | – | | |
| | | | | | | | | | | | |
| | | | | | | | | | | | |
| Total Investments in Securities | | $ | 311,487,393 | | $ | – | | $ | – | | |
| |
| |
Investments in Securities: | | | | | | | | | | | |
INTECH U.S. Value Fund(e) | | | | | | | | | | | |
Common Stock | | $ | 94,475,226 | | $ | – | | $ | – | | |
| | | | | | | | | | | | |
| | | | | | | | | | | | |
Money Market | | | – | | | 443,161 | | | – | | |
| | | | | | | | | | | | |
| | | | | | | | | | | | |
| Total Investments in Securities | | $ | 94,475,226 | | $ | 443,161 | | $ | – | | |
| |
| |
| | | |
| (a) | | Includes Fair Value Factors. |
| (b) | | Formerly named INTECH Risk-Managed International Fund. |
| (c) | | Formerly named INTECH Risk-Managed Core Fund. |
| (d) | | Formerly named INTECH Risk-Managed Growth Fund. |
| (e) | | Formerly named INTECH Risk-Managed Value Fund. |
Janus Mathematical Funds | 87
Notes to Financial Statements (unaudited)
The following section describes the organization and significant accounting policies and provides more detailed information about the schedules and tables that appear throughout this report. In addition, the Notes to Financial Statements explain the methods used in preparing and presenting this report.
| |
| 1. | Organization and Significant Accounting Policies |
INTECH Global Dividend Fund, INTECH International Fund (formerly named INTECH Risk-Managed International Fund), INTECH U.S. Core Fund (formerly named INTECH Risk-Managed Core Fund), INTECH U.S. Growth Fund (formerly named INTECH Risk-Managed Growth Fund) and INTECH U.S. Value Fund (formerly named INTECH Risk-Managed Value Fund) (individually, a “Fund” and collectively, the “Funds”) are series funds. The Funds are part of Janus Investment Fund (the “Trust”), which is organized as a Massachusetts business trust and is registered under the Investment Company Act of 1940, as amended (the “1940 Act”), as an open-end management investment company. The financial statements include information for the fiscal period from December 15, 2011 (inception date) through December 31, 2011 for INTECH Global Dividend Fund and for the six-month period ended December 31, 2011 for INTECH International Fund, INTECH U.S. Core Fund, INTECH U.S. Growth Fund, and INTECH U.S. Value Fund. The Trust offers forty-five funds which include multiple series of shares, with differing investment objectives and policies. Each Fund in this report is classified as diversified, as defined in the 1940 Act.
Each Fund in this report offers multiple classes of shares in order to meet the needs of various types of investors. Each class represents an interest in the same portfolio of investments. Certain financial intermediaries may not offer all classes of shares.
Class A Shares and Class C Shares are generally offered through financial intermediary platforms including, but not limited to, traditional brokerage platforms, mutual fund wrap fee programs, bank trust platforms, and retirement platforms. The maximum purchase in Class C Shares is $500,000 for any single purchase.
Class D Shares are generally no longer being made available to new investors. The Shares are available only to investors who hold accounts directly with the Janus funds and to immediate family members or members of the same household of an eligible individual investor. The Shares are not offered through financial intermediaries.
Class I Shares are available through certain financial intermediary platforms including, but not limited to, mutual fund wrap fee programs, managed account programs, asset allocation programs, and bank trust platforms, as well as certain retirement platforms. Class I Shares are also available to certain institutional investors including, but not limited to, corporations, certain retirement plans, public plans, and foundations/endowments.
Class S Shares are offered through financial intermediary platforms including, but not limited to, retirement platforms and asset allocation, mutual fund wrap, or other discretionary or nondiscretionary fee-based investment advisory programs. In addition, Class S Shares may be available through certain financial intermediaries who have an agreement with Janus Capital Management LLC (“Janus Capital”) or its affiliates to offer Class S Shares on their supermarket platforms.
Class T Shares are available through certain financial intermediary platforms including, but not limited to, mutual fund wrap fee programs, managed account programs, asset allocation programs, bank trust platforms, as well as certain retirement platforms. In addition, Class T Shares may be available through certain financial intermediaries who have an agreement with Janus Capital or its affiliates to offer Class T Shares on their supermarket platforms.
The following accounting policies have been followed by the Funds and are in conformity with accounting principles generally accepted in the United States of America within the investment management industry.
Investment Valuation
Securities are valued at the last sales price or the official closing price for securities traded on a principal securities exchange (U.S. or foreign) and on the NASDAQ National Market. Securities traded on over-the-counter (“OTC”) markets and listed securities for which no sales are reported are valued at the latest bid price (or yield equivalent thereof) obtained from one or more dealers transacting in a market for such securities or by a pricing service approved by the Funds’ Trustees. Short-term securities with maturities of 60 days or less may be valued at amortized cost, which approximates market value. Debt securities with a remaining maturity of greater than 60 days are valued in accordance with the evaluated bid price supplied by the pricing service. The evaluated bid price supplied by the pricing service is an evaluation that reflects such factors as security prices, yields, maturities and ratings. Short positions shall be valued in accordance with the same methodologies, except that in the event that a last sale price is not available, the latest ask price shall be used instead of a bid price. Foreign securities and currencies are converted to U.S. dollars using the applicable exchange rate in effect as of the daily close of the New York Stock Exchange (“NYSE”). When market quotations are not readily available or deemed unreliable, or events or circumstances that may affect the value of portfolio securities held by the Funds are identified
88 | DECEMBER 31, 2011
between the closing of their principal markets and the time the net asset value (“NAV”) is determined, securities may be valued at fair value as determined in good faith under procedures established by and under the supervision of the Funds’ Trustees. Circumstances in which fair value pricing may be utilized include, but are not limited to: (i) a significant event that may affect the securities of a single issuer, such as a merger, bankruptcy, or significant issuer specific development; (ii) an event that may affect an entire market, such as a natural disaster or significant governmental action; (iii) a nonsignificant event such as a market closing early or not opening, or a security trading halt; and (iv) pricing of a non-valued security and a restricted or non-public security. The Funds may use systematic fair valuation models provided by independent third parties to value international equity securities in order to adjust for stale pricing, which may occur between the close of certain foreign exchanges and the close of the NYSE. Restricted and illiquid securities are valued in accordance with procedures established by the Funds’ Trustees.
Investment Transactions and Investment Income
Investment transactions are accounted for as of the date purchased or sold (trade date). Dividend income is recorded on the ex-dividend date. Certain dividends from foreign securities will be recorded as soon as the Trust is informed of the dividend, if such information is obtained subsequent to the ex-dividend date. Dividends from foreign securities may be subject to withholding taxes in foreign jurisdictions. Interest income is recorded on the accrual basis and includes amortization of premiums and accretion of discounts. Gains and losses are determined on the identified cost basis, which is the same basis used for federal income tax purposes. Income, as well as gains and losses, both realized and unrealized, are allocated daily to each class of shares based upon the ratio of net assets represented by each class as a percentage of total net assets.
Expenses
Each Fund bears expenses incurred specifically on its behalf, as well as a portion of general expenses, which may be allocated pro rata to each Fund. Each class of shares bears expenses incurred specifically on its behalf and, in addition, each class bears a portion of general expenses, which are allocated daily to each class of shares based upon the ratio of net assets represented by each class as a percentage of total net assets. Expenses directly attributable to a specific class of shares are charged against the operations of such class.
Estimates
The preparation of financial statements in conformity with accounting principles generally accepted in the United States of America requires management to make estimates and assumptions that affect the reported amount of assets and liabilities and disclosure of contingent assets and liabilities at the date of the financial statements, and the reported amounts of income and expenses during the reporting period. Actual results could differ from those estimates.
Foreign Currency Translations
The Funds do not isolate that portion of the results of operations resulting from the effect of changes in foreign exchange rates on investments from the fluctuations arising from changes in market prices of securities held at the date of the financial statements. Net unrealized appreciation or depreciation of investments and foreign currency translations arise from changes in the value of assets and liabilities, including investments in securities held at the date of the financial statements, resulting from changes in the exchange rates and changes in market prices of securities held.
Currency gains and losses are also calculated on payables and receivables that are denominated in foreign currencies. The payables and receivables are generally related to foreign security transactions and income translations.
Foreign currency-denominated assets and forward currency contracts may involve more risks than domestic transactions, including currency risk, political and economic risk, regulatory risk and equity risk. Risks may arise from the potential inability of a counterparty to meet the terms of a contract and from unanticipated movements in the value of foreign currencies relative to the U.S. dollar.
Dividend Distributions
Dividends of net investment income for INTECH Global Dividend Fund are normally declared and distributed monthly, and realized capital gains (if any) are distributed annually. The other Funds generally declare and distribute dividends of net investment income and realized capital gains (if any) annually. The majority of dividends and capital gains distributions from the Funds may be automatically reinvested into additional shares of that Fund, based on the discretion of the shareholder.
The Funds may make certain investments in real estate investment trusts (“REITs”) which pay dividends to their shareholders based upon funds available from operations. It is quite common for these dividends to exceed the REITs’ taxable earnings and profits, resulting in the excess portion of such dividends being designated as a return of
Janus Mathematical Funds | 89
Notes to Financial Statements (unaudited) (continued)
capital. If the Funds distribute such amounts, such distributions could constitute a return of capital to shareholders for federal income tax purposes.
Federal Income Taxes
No provision for income taxes is included in the accompanying financial statements as the Funds intend to distribute to shareholders all taxable investment income and realized gains and otherwise comply with Subchapter M of the Internal Revenue Code applicable to regulated investment companies.
In accordance with the Financial Accounting Standards Board (“FASB”) guidance, the Funds adopted the provisions of “Income Taxes.” These provisions require an evaluation of tax positions taken (or expected to be taken) in the course of preparing a Fund’s tax return to determine whether these positions meet a “more-likely-than-not” standard that, based on the technical merits, have a more than fifty percent likelihood of being sustained by a taxing authority upon examination. A tax position that meets the “more-likely-than-not” recognition threshold is measured to determine the amount of benefit to recognize in the financial statements. The Funds recognize interest and penalties, if any, related to unrecognized tax benefits in income tax expense on the Statements of Operations.
These provisions require management of the Funds to analyze all open tax years, as defined by the Statute of Limitations, for all major jurisdictions, including federal tax authorities and certain state tax authorities. As of and during the period ended December 31, 2011, the Funds did not have a liability for any unrecognized tax benefits. The Funds have no examinations in progress and are not aware of any tax positions for which it is reasonably possible that the total amounts of unrecognized tax benefits will significantly change in the next twelve months.
On December 22, 2010, the Regulated Investment Company Modernization Act of 2010 (the “Modernization Act”) was signed by the President. The Modernization Act is the first major piece of legislation affecting Regulated Investment Companies (“RICs”) since 1986 and it modernizes several of the federal income and excise tax provisions related to RICs. Some of the enacted provisions include:
New capital losses may now be carried forward indefinitely, and retain the character of the original loss. Under pre-enactment law, capital losses could be carried forward for eight years, and carried forward as short-term capital, irrespective of the character of the original loss.
The Modernization Act contains simplification provisions, which are aimed at preventing disqualification of a RIC for “inadvertent” failures of the asset diversification and/or qualifying income tests. Additionally, the Modernization Act exempts RICs from the preferential dividend rule, and repeals the 60-day designation requirement for certain types of pay-through income and gains.
Finally, the Modernization Act contains several provisions aimed at preserving the character of distributions made by a fiscal year RIC during the portion of its taxable year ending after October 31 or December 31, reducing the circumstances under which a RIC might be required to file amended Forms 1099 to restate previously reported distributions.
Except for the simplification provisions related to RIC qualification, the Modernization Act is effective for taxable years beginning after December 22, 2010. The provisions related to RIC qualification are effective for taxable years for which the extended due date of the tax return is after December 22, 2010.
Valuation Inputs Summary
In accordance with FASB guidance, the Funds utilize the “Fair Value Measurements” to define fair value, establish a framework for measuring fair value, and expand disclosure requirements regarding fair value measurements. The Fair Value Measurement Standard does not require new fair value measurements, but is applied to the extent that other accounting pronouncements require or permit fair value measurements. This standard emphasizes that fair value is a market-based measurement that should be determined based on the assumptions that market participants would use in pricing an asset or liability. Various inputs are used in determining the value of the Funds’ investments defined pursuant to this standard. These inputs are summarized into three broad levels:
Level 1 – Quoted prices in active markets for identical securities.
Level 2 – Prices determined using other significant observable inputs. Observable inputs are inputs that reflect the assumptions market participants would use in pricing a security and are developed based on market data obtained from sources independent of the reporting entity. These may include quoted prices for similar securities, interest rates, prepayment speeds, credit risk, and others.
Debt securities are valued in accordance with the evaluated bid price supplied by the pricing service and generally categorized as Level 2 in the hierarchy. Securities traded on OTC markets and listed securities for which no sales are reported are valued at the latest bid price (or yield equivalent thereof) obtained from one or more dealers transacting in a market for such securities or by a pricing service
90 | DECEMBER 31, 2011
approved by the Funds’ Trustees and are categorized as Level 2 in the hierarchy. Short-term securities with maturities of 60 days or less are valued at amortized cost, which approximates market value and are categorized as Level 2 in the hierarchy. Other securities that are categorized as Level 2 in the hierarchy include, but are not limited to, preferred stocks, bank loans, American Depositary Receipts (ADRs), Global Depositary Receipts (GDRs), warrants, swaps, investments in mutual funds, OTC options, and forward contracts. The Funds may use systematic fair valuation models provided by independent third parties to value international equity securities in order to adjust for stale pricing, which may occur between the close of certain foreign exchanges and the close of the NYSE. These are generally categorized as Level 2 in the hierarchy.
Level 3 – Prices determined using significant unobservable inputs. In situations where quoted prices or observable inputs are unavailable or deemed less relevant (for example, when there is little or no market activity for an investment at the end of the period), unobservable inputs may be used. Unobservable inputs are inputs that reflect the reporting entity’s own assumptions about the factors market participants would use in pricing the security and would be based on the best information available under the circumstances.
For restricted equity securities and private placements where observable inputs are limited, assumptions about market activity and risk are used in employing valuation techniques such as the market approach, the income approach, or the cost approach, as defined under the FASB Guidance. These are categorized as Level 3 in the hierarchy.
There have been no significant changes in valuation techniques used in valuing any such positions held by the Funds since the beginning of the fiscal year.
The inputs or methodology used for valuing securities are not necessarily an indication of the risk associated with investing in those securities. The summary of inputs used as of December 31, 2011 to value the Funds’ investments in securities and other financial instruments is included in the “Valuation Inputs Summary” and “Level 3 Valuation Reconciliation of Assets” (if applicable) in the Notes to Schedules of Investments.
The Funds adopted FASB Accounting Standards Update “Fair Value Measurements and Disclosures” (the “Update”). This Update applies to a Fund’s disclosures about transfers in and out of Level 1 and Level 2 of the fair value hierarchy and the reasons for the transfers. Disclosures about the valuation techniques and inputs used to measure fair value for investments that fall in either Level 2 or Level 3 fair value hierarchy are summarized under the Level 2 and Level 3 categories listed above.
There were no Level 3 securities during the period.
The following table shows transfers between Level 1 and Level 2 of the fair value hierarchy during the period ended December 31, 2011.
| | | | | | | | | | | |
| | | Transfers In
| | | Transfers Out
| | | |
| | | Level 1 to
| | | Level 2 to
| | | |
| Fund | | Level 2 | | | Level 1 | | | |
| |
| |
INTECH International Fund(1) | | $ | – | | | $ | 15,888,315 | | | |
| |
| |
| | | |
| (1) | | Formerly named INTECH Risk-Managed International Fund. |
Financial assets were transferred from Level 2 to Level 1 since certain foreign equity prices were applied a fair valuation adjustment factor at the beginning of the fiscal year and no factor was applied at the end of the period.
The Funds recognize transfers between the levels as of the beginning of the fiscal year.
| |
| 2. | Derivative Instruments |
The Funds may invest in various types of derivatives. A derivative is a financial instrument whose performance is derived from the performance of another asset. The Funds may invest in derivative instruments including, but not limited to: futures contracts, put options, call options, options on future contracts, and other equity-linked derivatives.
The Funds may use derivative instruments for hedging (to offset risks associated with an investment, currency exposure, or market conditions) or for speculative (to seek to enhance returns) purposes. When the Funds invest in a derivative for speculative purposes, the Funds will be fully exposed to the risks of loss of that derivative, which may sometimes be greater than the cost of the derivative. The Funds may not use any derivative to gain exposure to an asset or class of assets prohibited by their investment restrictions from purchasing directly. The Funds’ ability to use derivative instruments may also be limited by tax considerations.
Investments in derivatives are generally subject to market risks that may cause their prices to fluctuate over time. Investments in derivatives may not directly correlate with the price movements of the underlying instrument. As a result, the use of derivatives may expose the Funds to additional risks that they would not be subject to if they invested directly in the securities underlying those derivatives. The use of derivatives may result in larger losses or smaller gains than otherwise would be the case. Derivatives can be volatile and may involve significant
Janus Mathematical Funds | 91
Notes to Financial Statements (unaudited) (continued)
risks, including, but not limited to, counterparty risk, credit risk, currency risk, equity risk, index risk, interest rate risk, leverage risk, and liquidity risk.
Derivatives may generally be traded OTC or on an exchange. Derivatives traded OTC, such as options and structured notes, are agreements that are individually negotiated between parties and can be tailored to meet a purchaser’s needs.
OTC derivatives are not guaranteed by a clearing agency and may be subject to increased credit risk. In an effort to mitigate credit risk associated with derivatives traded OTC, the Funds may enter into collateral agreements with certain counterparties whereby, subject to certain minimum exposure requirements, a Fund may require the counterparty to post collateral if the Fund has a net aggregate unrealized gain on all OTC derivative contracts with a particular counterparty. There is no guarantee that counterparty exposure is reduced and these arrangements are dependent on Janus Capital’s ability to establish and maintain appropriate systems and trading.
In pursuit of their investment objectives, each Fund may seek to use derivatives to increase or decrease exposure to the following market risk factors:
| | |
| | • | Counterparty Risk – Counterparty risk is the risk that the counterparty (the party on the other side of the transaction) on a derivative transaction will be unable to honor its financial obligation to a Fund. |
| |
| | • | Credit Risk – Credit risk is the risk an issuer will be unable to make principal and interest payments when due, or will default on its obligations. |
| |
| | • | Currency Risk – Currency risk is the risk that changes in the exchange rate between currencies will adversely affect the value (in U.S. dollar terms) of an investment. |
| |
| | • | Equity Risk – Equity risk relates to the change in value of equity securities as they relate to increases or decreases in the general market. |
| |
| | • | Index Risk – If the derivative is linked to the performance of an index, it will be subject to the risks associated with changes in that index. If the index changes, a Fund could receive lower interest payments or experience a reduction in the value of the derivative to below what the Fund paid. Certain indexed securities, including inverse securities (which move in an opposite direction to the index), may create leverage, to the extent that they increase or decrease in value at a rate that is a multiple of the changes in the applicable index. |
| |
| | • | Interest Rate Risk – Interest rate risk is the risk that the value of fixed-income securities will generally decline as prevailing interest rates rise, which may cause a Fund’s NAV to likewise decrease, and vice versa. |
| |
| | • | Leverage Risk – Leverage risk is the risk associated with certain types of leveraged investments or trading strategies pursuant to which relatively small market movements may result in large changes in the value of an investment. A Fund creates leverage by using borrowed capital to increase the amount invested, or investing in instruments, including derivatives, where the investment loss can exceed the original amount invested. Certain investments or trading strategies that involve leverage can result in losses that greatly exceed the amount originally invested. |
| |
| | • | Liquidity Risk – Liquidity risk is the risk that certain securities may be difficult or impossible to sell at the time that the seller would like or at the price that the seller believes the security is currently worth. |
In accordance with FASB guidance, the Funds adopted the provisions for “Derivatives and Hedging,” which require qualitative disclosures about objectives and strategies for using derivatives, quantitative disclosures about fair value amounts of and gains and losses on derivative instruments, and disclosures about credit-risk-related contingent features in derivative agreements.
There were no derivatives held by the Funds during the period ended December 31, 2011.
| |
| 3. | Other investments and strategies |
Additional Investment Risk
It is important to note that events in both domestic and international equity and fixed-income markets have resulted, and may continue to result, in an unusually high degree of volatility in the markets, with issuers that have exposure to the real estate, mortgage, and credit markets particularly affected. These events and the resulting market upheavals may have an adverse effect on a Fund, such as a decline in the value and liquidity of many securities held by the Fund, unusually high and unanticipated levels of redemptions, an increase in portfolio turnover, a decrease in NAV, and an increase in Fund expenses. Because the situation is unprecedented and widespread, it may also be unusually difficult to identify both investment risks and opportunities, which could limit or preclude a Fund’s ability to achieve its investment objective. It is impossible to predict whether or for how long these conditions will continue. Therefore, it is
92 | DECEMBER 31, 2011
important to understand that the value of your investment may fall, sometimes sharply, and you could lose money.
Further, the instability experienced in the financial markets has resulted in the U.S. Government and various other governmental and regulatory entities taking actions to address the financial crisis. These actions include, but are not limited to, the enactment of the Dodd-Frank Wall Street Reform and Consumer Protection Act (the “Dodd-Frank Act”) in July 2010 which is expected to dramatically change the way in which the U.S. financial system is supervised and regulated. More specifically, the Dodd-Frank Act provides for widespread regulation of financial institutions, consumer financial products and services, broker-dealers, over-the-counter derivatives, investment advisers, credit rating agencies, and mortgage lending, which expands federal oversight in the financial sector and may affect the investment management industry as a whole. Given the broad scope, sweeping nature, and the fact that many provisions of the Dodd-Frank Act must be implemented through future rulemaking, the ultimate impact of the Dodd-Frank Act, and any resulting regulation, is not yet certain. As a result, there can be no assurance that these government and regulatory measures will not have an adverse effect on the value or marketability of securities held by a Fund, including potentially limiting or completely restricting the ability of the Fund to use a particular investment instrument as part of its investment strategy, increasing the costs of using these instruments, or possibly making them less effective in general. Furthermore, no assurance can be made that the U.S. Government or any U.S. regulatory entity (or other authority or regulatory entity) will not continue to take further legislative or regulatory action in response to the economic crisis or otherwise, and the effect of such actions, if taken, cannot be known.
Certain areas of the world have historically been prone to and economically sensitive to environmental events such as, but not limited to, hurricanes, earthquakes, typhoons, flooding, tidal waves, tsunamis, erupting volcanoes, wildfires or droughts, tornadoes, mudslides, or other weather-related phenomena. Such disasters, and the resulting physical or economic damage, could have a severe and negative impact on a Fund’s investment portfolio and, in the longer term, could impair the ability of issuers in which the Fund invests to conduct their businesses as they would under normal conditions. Adverse weather conditions may also have a particularly significant negative effect on issuers in the agricultural sector and on insurance companies that insure against the impact of natural disasters.
Counterparties
Fund transactions involving a counterparty are subject to the risk that the counterparty or a third party will not fulfill its obligation to a Fund (“counterparty risk”). Counterparty risk may arise because of the counterparty’s financial condition (i.e., financial difficulties, bankruptcy, or insolvency), market activities and developments, or other reasons, whether foreseen or not. A counterparty’s inability to fulfill its obligation may result in significant financial loss to a Fund. A Fund may be unable to recover its investment from the counterparty or may obtain a limited recovery, and/or recovery may be delayed. The extent of a Fund’s exposure to counterparty risk in respect to financial assets approximates their carrying value as recorded on the Fund’s Statement of Assets and Liabilities.
A Fund may be exposed to counterparty risk through participation in various programs including, but not limited to, lending its securities to third parties, cash sweep arrangements whereby a Fund’s cash balance is invested in one or more types of cash management vehicles, as well as investments in, but not limited to, repurchase agreements, debt securities, and derivatives, including various types of swaps, futures and options. A Fund intends to enter into financial transactions with counterparties that Janus Capital believes to be creditworthy at the time of the transaction. There is always the risk that Janus Capital’s analysis of a counterparty’s creditworthiness is incorrect or may change due to market conditions. To the extent that a Fund focuses its transactions with a limited number of counterparties, it will have greater exposure to the risks associated with one or more counterparties.
Emerging Market Investing
Investing in emerging markets may involve certain risks and considerations not typically associated with investing in the United States and imposes risks greater than, or in addition to, the risks associated with investing in securities of more developed foreign countries. Emerging markets securities are exposed to a number of additional risks, which may result from less government supervision and regulation of business and industry practices (including the potential lack of strict finance and accounting controls and standards), stock exchanges, brokers, and listed companies, making these investments potentially more volatile in price and less liquid than investments in developed securities markets, resulting in greater risk to investors. In addition, the Funds’ investments may be denominated in foreign currencies and therefore, changes in the value of a country’s currency compared to the U.S. dollar may affect the value of the Funds’ investments. To the extent that a Fund invests a significant portion of its assets in the securities of issuers in or companies of a single country or region, it is more likely to be impacted by
Janus Mathematical Funds | 93
Notes to Financial Statements (unaudited) (continued)
events or conditions affecting that country or region, which could have a negative impact on the Fund’s performance.
Initial Public Offerings
The Funds may invest in initial public offerings (“IPOs”). IPOs and other investment techniques may have a magnified performance impact on INTECH Global Dividend Fund. This Fund may not experience similar performance as their assets grow.
Interfund Lending
As permitted by the Securities and Exchange Commission (“SEC”), or the 1940 Act and rules promulgated thereunder, the Funds may be party to interfund lending agreements between the Funds and other Janus Capital sponsored mutual funds and certain pooled investment vehicles, which permit them to borrow or lend cash at a rate beneficial to both the borrowing and lending funds. Outstanding borrowings from all sources totaling 10% or more of a borrowing Fund’s total assets must be collateralized at 102% of the outstanding principal value of the loan; loans of less than 10% may be unsecured.
Real Estate Investing
The Funds may invest in equity securities of U.S. and non-U.S. real estate-related companies. Such companies may include those in the real estate industry or real estate-related industries. These securities may include common stocks, preferred stocks, and other equity securities, including, but not limited to, REITs and similar REIT-like entities such as foreign entities that have REIT characteristics.
Restricted Security Transactions
Restricted securities held by the Funds may not be sold except in exempt transactions or in a public offering registered under the Securities Act of 1933, as amended. The risk of investing in such securities is generally greater than the risk of investing in the securities of widely held, publicly traded companies. Lack of a secondary market and resale restrictions may result in the inability of the Funds to sell a security at a fair price and may substantially delay the sale of the security. In addition, these securities may exhibit greater price volatility than securities for which secondary markets exist.
Securities Lending
Under procedures adopted by the Trustees, the Funds may seek to earn additional income through lending their securities to certain qualified broker-dealers and institutions on a short-term or long-term basis. The Funds may lend portfolio securities on a short-term or long-term basis, in an amount equal to up to 1/3 of their total assets as determined at the time of the loan origination. When the Funds lend their securities, they receive collateral (including cash collateral), at least equal to the value of securities loaned. The Funds may earn income by investing this collateral in one or more affiliated or nonaffiliated cash management vehicles. It is also possible that, due to a decline in the value of a cash management vehicle, the Funds may lose money. There is also the risk that when portfolio securities are lent, the securities may not be returned on a timely basis, and the Funds may experience delays and costs in recovering the security or gaining access to the collateral provided to the Funds to collateralize the loan. If the Funds are unable to recover a security on loan, the Funds may use the collateral to purchase replacement securities in the market. There is a risk that the value of the collateral could decrease below the cost of the replacement security by the time the replacement investment is made, resulting in a loss to the Funds. Janus Capital intends to manage the cash collateral in an affiliated cash management vehicle and will receive an investment advisory fee for managing such assets.
The borrower pays fees at the Funds’ direction to Deutsche Bank AG (the “Lending Agent”). The Lending Agent may retain a portion of the interest earned on the cash collateral invested. The cash collateral invested by the Lending Agent is disclosed on the Schedules of Investments (if applicable). The lending fees and the Funds’ portion of the interest income earned on cash collateral are included on the Statements of Operations (if applicable).
The Funds did not have any securities on loan during the period ended December 31, 2011.
| |
| 4. | Investment Advisory Agreements and Other Transactions with Affiliates |
Each Fund pays Janus Capital an investment advisory fee which is calculated daily and paid monthly. The following table reflects each Fund’s contractual investment advisory fee rate or base fee rate, as applicable (expressed as an annual rate).
| | | | | | | | | |
| | | | | Contractual
| | |
| | | | | Investment
| | |
| | | | | Advisory Fee/
| | |
| | | Average Daily Net
| | Base Fee (%)
| | |
| Fund | | Assets of the Fund | | (annual rate) | | |
| |
| |
| INTECH Global Dividend Fund | | | All Asset Levels | | | 0.55 | | |
INTECH International Fund(1) | | | All Asset Levels | | | 0.55 | | |
INTECH U.S. Core Fund(2) | | | N/A | | | 0.50 | | |
INTECH U.S. Growth Fund(3) | | | All Asset Levels | | | 0.50 | | |
INTECH U.S. Value Fund(4) | | | All Asset Levels | | | 0.50 | | |
| |
| |
| | | |
| (1) | | Formerly named INTECH Risk-Managed International Fund. |
| (2) | | Formerly named INTECH Risk-Managed Core Fund. |
| (3) | | Formerly named INTECH Risk-Managed Growth Fund. |
| (4) | | Formerly named INTECH Risk-Managed Value Fund. |
94 | DECEMBER 31, 2011
For INTECH U.S. Core Fund, the investment advisory fee rate is determined by calculating a base fee and applying a performance adjustment. The base fee rate is the same as the contractual investment advisory fee rate shown in the table above. The performance adjustment either increases or decreases the base fee depending on how well the Fund has performed relative to its benchmark index, as shown below:
| | | | | | |
| Fund | | Benchmark Index | | |
| |
| |
INTECH U.S. Core Fund(1) | | | S&P 500® Index | | |
| |
| |
| | | |
| (1) | | Formerly named INTECH Risk-Managed Core Fund. |
Only the base fee rate applied until January 2007 for INTECH U.S. Core Fund. The calculation of the performance adjustment applies as follows:
Investment Advisory Fee = Base Fee Rate +/- Performance Adjustment
The investment advisory fee rate paid to Janus Capital by INTECH U.S. Core Fund consists of two components: (1) a base fee calculated by applying the contractual fixed rate of the advisory fee to the Fund’s average daily net assets during the previous month (“Base Fee Rate”), plus or minus (2) a performance-fee adjustment (“Performance Adjustment”) calculated by applying a variable rate of up to 0.15% (positive or negative) to the Fund’s average daily net assets during the applicable performance measurement period. The performance measurement period generally is the previous 36 months, although no Performance Adjustment is made until the Fund’s performance-based fee structure has been in effect for at least 12 months. When the Fund’s performance-based fee structure has been in effect for at least 12 months, but less than 36 months, the performance measurement period will be equal to the time that has elapsed since the performance-based fee structure took effect. As noted above, any applicable Performance Adjustments began January 2007 for the Fund.
No Performance Adjustment is applied unless the difference between the Fund’s investment performance and the cumulative investment record of the Fund’s benchmark index is 0.50% or greater (positive or negative) during the applicable performance measurement period. The Base Fee Rate is subject to an upward or downward Performance Adjustment for every full 0.50% increment by which the Fund outperforms or underperforms its benchmark index. Because the Performance Adjustment is tied to the Fund’s relative performance compared to its benchmark index (and not its absolute performance), the Performance Adjustment could increase Janus Capital’s fee even if the Fund’s Shares lose value during the performance measurement period and could decrease Janus Capital’s fee even if the Fund’s Shares increase in value during the performance measurement period. For purposes of computing the Base Fee Rate and the Performance Adjustment, net assets are averaged over different periods (average daily net assets during the previous month for the Base Fee Rate, versus average daily net assets during the performance measurement period for the Performance Adjustment). Performance of the Fund is calculated net of expenses, whereas the Fund’s benchmark index does not have any fees or expenses. Reinvestment of dividends and distributions is included in calculating both the performance of the Fund and the Fund’s benchmark index. The Base Fee Rate is calculated and accrued daily. The Performance Adjustment is calculated monthly in arrears and is accrued throughout the month. The investment fee is paid monthly in arrears. Under extreme circumstances involving underperformance by a rapidly shrinking Fund, the dollar amount of the Performance Adjustment could be more than the dollar amount of the Base Fee Rate. In such circumstances, Janus Capital would reimburse the Fund.
The application of an expense limit, if any, will have a positive effect upon the Fund’s performance and may result in an increase in the Performance Adjustment. It is possible that the cumulative dollar amount of additional compensation ultimately payable to Janus Capital may, under some circumstances, exceed the cumulative dollar amount of management fees waived by Janus Capital.
The investment performance of the Fund’s Class A Shares (waiving the upfront sales load) for the performance measurement period is used to calculate the Performance Adjustment. For performance measurement periods prior to July 6, 2009, INTECH U.S. Core Fund calculated its Performance Adjustment by comparing the performance of Class T Shares (formerly named Class J Shares) against the investment record of its benchmark index. For periods beginning July 6, 2009, the investment performance of the Fund’s load-waived Class A Shares for the performance measurement period is used to calculate the Performance Adjustment. Because the Performance Adjustment is based on a rolling 36-month performance measurement period, calculations based solely on the performance of the Fund’s load-waived Class A Shares will not be fully implemented for 36 months after July 6, 2009. Until that time, the Fund’s performance will be compared to a blended investment performance record that includes the Fund’s Class T Shares (formerly named Class J Shares) performance (the prior share class used for performance calculations) for the portion of the performance measurement period prior to July 6, 2009, and the Fund’s load-waived Class A Shares for the remainder of the period. At the conclusion of the transition period, the Fund’s Class T Shares will be eliminated from the Performance Adjustment calculation, and the
Janus Mathematical Funds | 95
Notes to Financial Statements (unaudited) (continued)
calculation will be based solely upon the Fund’s load-waived Class A Shares. After Janus Capital determines whether the Fund’s performance was above or below its benchmark index by comparing the investment performance of the Fund’s load-waived Class A Shares, or Class T Shares (formerly named Class J Shares) as the case may be, against the cumulative investment record of the Fund’s benchmark index, Janus Capital applies the same Performance Adjustment (positive or negative) across each other class of shares of the Fund, as applicable.
It is not possible to predict the effect of the Performance Adjustment on future overall compensation to Janus Capital since it depends on the performance of INTECH U.S. Core Fund relative to the record of the Fund’s benchmark index and future changes to the size of INTECH U.S. Core Fund.
INTECH U.S. Core Fund’s prospectuses and statement of additional information contain additional information about performance-based fees. The amount shown as advisory fees on the Statements of Operations reflects the Base Fee Rate plus/minus any Performance Adjustment, if applicable.
During the period ended December 31, 2011, INTECH U.S. Core Fund recorded a Performance Adjustment as indicated in the table below:
| | | | | | |
| | | Performance
| | |
| Fund | | Fee | | |
| |
| |
INTECH U.S. Core Fund(1) | | $ | 78,687 | | |
| |
| |
| | | |
| (1) | | Formerly named INTECH Risk-Managed Core Fund. |
INTECH Investment Management LLC (“INTECH”) serves as subadviser to each Fund. Janus Capital owns approximately 92% of INTECH.
Janus Capital pays INTECH a subadvisory fee rate equal to 50% of the investment advisory fee paid by the Funds to Janus Capital (calculated after any applicable performance fee adjustment for INTECH U.S. Core Fund, and after any fee waivers and expense reimbursements for INTECH Global Dividend Fund, INTECH International Fund and INTECH U.S. Value Fund). The subadvisory fee paid by Janus Capital to INTECH on behalf of INTECH U.S. Core Fund adjusts up or down based on the Fund’s performance relative to its benchmark index over the performance measurement period.
Janus Services LLC (“Janus Services”), a wholly-owned subsidiary of Janus Capital, is the Funds’ transfer agent. In addition, Janus Services provides or arranges for the provision of certain other administrative services including, but not limited to, recordkeeping, accounting, order processing, and other shareholder services for the Funds.
Certain, but not all, intermediaries may charge administrative fees to investors in Class A Shares, Class C Shares, and Class I Shares for administrative services provided on behalf of such investors. These administrative fees are paid by the Class A Shares, Class C Shares, and Class I Shares of the Funds to Janus Services, which uses such fees to reimburse intermediaries. Consistent with the Transfer Agency Agreement between Janus Services and the Funds, Janus Services may negotiate the level, structure, and/or terms of the administrative fees with intermediaries requiring such fees on behalf of the Funds. Janus Capital and its affiliates benefit from an increase in assets that may result from such relationships.
Class D Shares pay an annual administrative services fee of 0.12% of net assets. These administrative services fees are paid by the Shares of the Fund for shareholder services provided by Janus Services.
Janus Services receives an administrative services fee at an annual rate of 0.25% of the average daily net assets of Class S Shares and Class T Shares of the Funds for providing or procuring administrative services to investors in Class S Shares and Class T Shares of the Funds. Janus Services expects to use all or a significant portion of this fee to compensate retirement plan service providers, broker-dealers, bank trust departments, financial advisors, and other financial intermediaries for providing these services. Janus Services or its affiliates may also pay fees for services provided by intermediaries to the extent the fees charged by intermediaries exceed the 0.25% of net assets charged to Class S Shares and Class T Shares of each Fund.
Services provided by these financial intermediaries may include, but are not limited to, recordkeeping, subaccounting, order processing, providing periodic statements, forwarding prospectuses, shareholder reports, and other materials to existing customers and other administrative services. Order processing includes the submission of transactions through the National Securities Clearing Corporation (“NSCC”) or similar systems, or those processed on a manual basis with Janus Capital.
Janus Distributors LLC (“Janus Distributors”), a wholly-owned subsidiary of Janus Capital, is the distributor of the Funds. The Funds have adopted a Distribution and Shareholder Servicing Plan (the “Plan”) pursuant to Rule 12b-1 under the 1940 Act. The Plan authorizes payments by the Funds at an annual rate, as determined from time to time by the Board of Trustees, of up to 0.25% of the Class A Shares average daily net assets, of up to 1.00% of the Class C Shares average daily net assets, and of up to 0.25% of the Class S Shares average daily net assets. Payments under the Plan are not tied exclusively to actual distribution and shareholder service
96 | DECEMBER 31, 2011
expenses, and the payments may exceed distribution and shareholder service expenses actually incurred by the Funds. If any of a Fund’s actual distribution and shareholder service expenses incurred during a calendar year are less than the payments made during a calendar year, the Fund will be refunded the difference. Refunds, if any, are included in “Distribution fees and shareholder servicing fees” in the Statements of Operations.
Janus Capital has agreed to reimburse the Funds until at least November 1, 2012 (until at least November 1, 2013 for INTECH Global Dividend Fund) by the amount, if any, that such Fund’s normal operating expenses in any fiscal year, including the investment advisory fee, but excluding any performance adjustments to management fees, if applicable, class-specific distribution and shareholder servicing fees applicable to Class A Shares, Class C Shares, and Class S Shares, the administrative services fees payable pursuant to the Transfer Agency Agreement (except for networking and omnibus fees), brokerage commissions, interest, dividends, taxes, acquired fund fees and expenses, and extraordinary expenses, exceed the annual rates noted below. If applicable, amounts reimbursed to the Funds by Janus Capital are disclosed as “Excess Expense Reimbursement” on the Statements of Operations.
| | | | | | |
| | | Expense
| | |
| Fund | | Limit (%) | | |
| |
| |
| INTECH Global Dividend Fund | | | 1.00 | | |
INTECH International Fund(1) | | | 1.00 | | |
INTECH U.S. Core Fund(2) | | | 0.89 | | |
INTECH U.S. Growth Fund(3) | | | 0.90 | | |
INTECH U.S. Value Fund(4) | | | 0.75 | | |
| |
| |
| | | |
| (1) | | Formerly named INTECH Risk-Managed International Fund. |
| (2) | | Formerly named INTECH Risk-Managed Core Fund. |
| (3) | | Formerly named INTECH Risk-Managed Growth Fund. |
| (4) | | Formerly named INTECH Risk-Managed Value Fund. |
For a period of three years subsequent to INTECH Global Dividend Fund’s commencement of operations, Janus Capital may recover from the Fund fees and expenses previously waived or reimbursed, which could be then considered a deferral, if the Fund’s expense ratio, including recovered expenses, falls below the expense limit. The recoupment of such reimbursements expires December 15, 2014. For the period ended December 31, 2011, total reimbursement by Janus Capital was $16,295 for the Fund. As of December 31, 2011, the recoupment that may be potentially made to Janus Capital is $16,295.
The Board of Trustees has adopted a deferred compensation plan (the “Deferred Plan”) for independent Trustees to elect to defer receipt of all or a portion of the annual compensation they are entitled to receive from the Funds. All deferred fees are credited to an account established in the name of the Trustees. The amounts credited to the account then increase or decrease, as the case may be, in accordance with the performance of one or more of the Janus funds that are selected by the Trustees. The account balance continues to fluctuate in accordance with the performance of the selected fund or funds until final payment of all amounts are credited to the account. The fluctuation of the account balance is recorded by the Funds as unrealized appreciation/(depreciation) and is shown as of December 31, 2011 on the Statements of Assets and Liabilities as an asset, “Non-interested Trustees’ deferred compensation,” and a liability, “Non-interested Trustees’ deferred compensation fees.” Additionally, the recorded unrealized appreciation/(depreciation) is included in “Unrealized net appreciation/(depreciation) of investments, foreign currency translations and non-interested Trustees’ deferred compensation” on the Statements of Assets and Liabilities. Deferred compensation expenses for the period ended December 31, 2011 are included in “Non-interested Trustees’ fees and expenses” on the Statements of Operations. Trustees are allowed to change their designation of mutual funds from time to time. Amounts will be deferred until distributed in accordance with the Deferred Plan. No deferred fees were distributed to any Trustee under the Deferred Plan during the period ended December 31, 2011.
For the period ended December 31, 2011, Janus Capital assumed $39,214 of legal, consulting and Trustee costs and fees incurred by the funds in the Trust and Janus Aspen Series together with the Trust (the “Portfolios”), in connection with regulatory and civil litigation matters. These non-recurring costs were allocated to all Portfolios based on the Portfolios’ respective net assets as of July 31, 2004. Unless noted otherwise in the financial highlights, the effect of these non-recurring costs assumed by Janus Capital are included in the ratio of gross expenses to average net assets and were less than 0.01%. No fees were allocated to the Portfolios that commenced operations after July 31, 2004. Additionally, all future non-recurring costs will be allocated to the Portfolios based on the Portfolios’ respective net assets on July 31, 2004. These “Non-recurring costs” and “Costs assumed by Janus Capital” are shown on the Statements of Operations.
Certain officers of the Funds may also be officers and/or directors of Janus Capital. Such officers receive no compensation from the Funds, except for the Funds’ Chief Compliance Officer. The Funds reimburse Janus Capital for a portion of the compensation paid to the Chief Compliance Officer and certain compliance staff of the Trust. Total compensation of $286,615 was paid by the Trust during the period ended December 31, 2011. Each Fund’s portion is reported as part of “Other Expenses” on the Statements of Operations.
Janus Mathematical Funds | 97
Notes to Financial Statements (unaudited) (continued)
Class A Shares include a 5.75% upfront sales charge of the offering price of the Funds. The sales charge is allocated between Janus Distributors and financial intermediaries. During the period ended December 31, 2011, Janus Distributors retained the following upfront sales charges:
| | | | | | |
| | | Upfront
| | |
| Fund (Class A Shares) | | Sales Charge | | |
| |
| |
INTECH U.S. Core Fund(1) | | $ | 2,094 | | |
INTECH U.S. Growth Fund(2) | | | 251 | | |
INTECH U.S. Value Fund(3) | | | 10 | | |
| |
| |
| | | |
| (1) | | Formerly named INTECH Risk-Managed Core Fund. |
| (2) | | Formerly named INTECH Risk-Managed Growth Fund. |
| (3) | | Formerly named INTECH Risk-Managed Value Fund. |
A contingent deferred sales charge of 1.00% will be deducted with respect to Class A Shares purchased without a sales load and redeemed within 12 months of purchase, unless waived, as discussed in the Prospectus. Any applicable CDSC will be 1.00% of the lesser of the original purchase price or the value of the redemption of the Class A Shares redeemed. There were no contingent deferred sales charges paid by redeeming shareholders of Class A Shares to Janus Distributors during the period ended December 31, 2011.
Class C Shares include a 1.00% contingent deferred sales charge paid by redeeming shareholders to Janus Distributors. The contingent deferred sales charge applies to shares redeemed within 12 months of purchase. The redemption price may differ from the net asset value per share. During the period ended December 31, 2011, redeeming shareholders of Class C Shares paid the following contingent deferred sales charges:
| | | | | | |
| | | Contingent Deferred
| | |
| Fund (Class C Shares) | | Sales Charge | | |
| |
| |
INTECH International Fund(1) | | $ | 2,432 | | |
INTECH U.S. Core Fund(2) | | | 55 | | |
INTECH U.S. Growth Fund(3) | | | 11 | | |
INTECH U.S. Value Fund(4) | | | 153 | | |
| |
| |
| | | |
| (1) | | Formerly named INTECH Risk-Managed International Fund. |
| (2) | | Formerly named INTECH Risk-Managed Core Fund. |
| (3) | | Formerly named INTECH Risk-Managed Growth Fund. |
| (4) | | Formerly named INTECH Risk-Managed Value Fund. |
A 2.00% redemption fee may be imposed on Class D Shares, Class I Shares, Class S Shares, and Class T Shares of the Funds, as applicable, held for 90 days or less. This fee is paid to the Funds rather than Janus Capital, and is designed to deter excessive short-term trading and to offset the brokerage commissions, market impact, and other costs associated with changes in the Funds’ asset levels and cash flow due to short-term money movements in and out of the Funds. The redemption fee is accounted for as an addition to Paid-in Capital.
Total redemption fees received by the Funds for the period ended December 31, 2011 are indicated in the table below:
| | | | | | |
| Fund | | Redemption Fee | | |
| |
| |
INTECH International Fund(1) | | $ | 23,914 | | |
INTECH U.S. Core Fund(2) | | | 17,680 | | |
INTECH U.S. Growth Fund(3) | | | 8,244 | | |
| |
| |
| | | |
| (1) | | Formerly named INTECH Risk-Managed International Fund. |
| (2) | | Formerly named INTECH Risk-Managed Core Fund. |
| (3) | | Formerly named INTECH Risk-Managed Growth Fund. |
The Funds’ expenses may be reduced by expense offsets from an unaffiliated custodian and/or transfer agent. Such credits or offsets are included in “Expense and Fee Offset” on the Statements of Operations (if applicable). The transfer agent fee offsets received during the period reduce “Transfer agent fees and expenses” on the Statements of Operations (if applicable). Custodian offsets received reduce “Custodian fees” on the Statements of Operations (if applicable). The Funds could have employed the assets used by the custodian and/or transfer agent to produce income if they had not entered into an expense offset arrangement.
Pursuant to the terms and conditions of an SEC exemptive order and the provisions of the 1940 Act, the Funds may participate in an affiliated or nonaffiliated cash sweep program. In the cash sweep program, uninvested cash balances of the Funds may be used to purchase shares of affiliated or nonaffiliated money market funds or cash management pooled investment vehicles. The Funds are eligible to participate in the cash sweep program (the “Investing Funds”). Janus Cash Liquidity Fund LLC is an affiliated unregistered cash management pooled investment vehicle that invests primarily in highly-rated short-term fixed-income securities. Janus Cash Liquidity Fund LLC currently maintains a NAV of $1.00 per share and distributes income daily in a manner consistent with a registered 2a-7 product. There are no restrictions on the Funds’ ability to withdraw investments from Janus Cash Liquidity Fund LLC at will, and there are no unfunded capital commitments due from the Funds to Janus Cash Liquidity Fund LLC. As adviser, Janus Capital has an inherent conflict of interest because of its fiduciary duties to the affiliated cash management pooled investment vehicles and the Investing Funds.
98 | DECEMBER 31, 2011
During the period ended December 31, 2011, the following Funds recorded distributions from affiliated investment companies as affiliated dividend income, and had the following affiliated purchases and sales:
| | | | | | | | | | | | | | | |
| | | Purchases
| | Sales
| | Dividend
| | Value
| | |
| | | Shares/Cost | | Shares/Cost | | Income | | at 12/31/11 | | |
| |
Janus Cash Liquidity Fund LLC | | | | | | | | | | | | | | |
| INTECH Global Dividend Fund | | $ | 5,176,000 | | $ | (4,967,000) | | $ | 36 | | $ | 209,000 | | |
INTECH International Fund(1) | | | 19,171,584 | | | (36,059,347) | | | 556 | | | 2,357,237 | | |
INTECH U.S. Core Fund(2) | | | 15,138,812 | | | (14,913,070) | | | 814 | | | 1,545,554 | | |
INTECH U.S. Growth Fund(3) | | | 19,193,737 | | | (22,691,737) | | | 793 | | | – | | |
INTECH U.S. Value Fund(4) | | | 4,631,204 | | | (4,188,043) | | | 251 | | | 443,161 | | |
| |
| |
| | | $ | 63,311,337 | | $ | (82,819,197) | | $ | 2,450 | | $ | 4,554,952 | | |
| |
| |
| | | |
| (1) | | Formerly named INTECH Risk-Managed International Fund. |
| (2) | | Formerly named INTECH Risk-Managed Core Fund. |
| (3) | | Formerly named INTECH Risk-Managed Growth Fund. |
| (4) | | Formerly named INTECH Risk-Managed Value Fund. |
Janus Capital or an affiliate invested and/or redeemed initial seed capital during the period ended December 31, 2011, as indicated in the following table.
| | | | | | | | | | | | | | | | | | | | | |
| | | Seed Capital
| | | | Date of
| | | | Date of
| | Seed Capital
| | |
| Fund | | at 6/30/11 | | Purchases | | Purchases | | Redemptions | | Redemption | | at 12/31/11 | | |
| |
| |
| INTECH Global Dividend Fund - Class A Shares | | $ | – | | $ | 833,333 | | | 12/15/11 | | $ | – | | | – | | $ | 833,333 | | |
| INTECH Global Dividend Fund - Class C Shares | | | – | | | 833,333 | | | 12/15/11 | | | – | | | – | | | 833,333 | | |
| INTECH Global Dividend Fund - Class D Shares | | | – | | | 833,334 | | | 12/15/11 | | | – | | | – | | | 833,334 | | |
| INTECH Global Dividend Fund - Class I Shares | | | – | | | 833,333 | | | 12/15/11 | | | – | | | – | | | 833,333 | | |
| INTECH Global Dividend Fund - Class S Shares | | | – | | | 833,333 | | | 12/15/11 | | | – | | | – | | | 833,333 | | |
| INTECH Global Dividend Fund - Class T Shares | | | – | | | 833,334 | | | 12/15/11 | | | – | | | – | | | 833,334 | | |
INTECH International Fund(1) - Class A Shares | | | 411,445 | | | – | | | – | | | – | | | – | | | 411,445 | | |
INTECH International Fund(1) - Class C Shares | | | 411,445 | | | – | | | – | | | – | | | – | | | 411,445 | | |
INTECH International Fund(1) - Class I Shares | | | 686,890 | | | – | | | – | | | – | | | – | | | 686,890 | | |
INTECH International Fund(1) - Class S Shares | | | 411,445 | | | – | | | – | | | – | | | – | | | 411,445 | | |
INTECH International Fund(1) - Class T Shares | | | 11,000 | | | – | | | – | | | – | | | – | | | 11,000 | | |
INTECH U.S. Value Fund(2) - Class S Shares | | | 190,524 | | | – | | | – | | | – | | | – | | | 190,524 | | |
| |
| |
| | | |
| (1) | | Formerly named INTECH Risk-Managed International Fund. |
| (2) | | Formerly named INTECH Risk-Managed Value Fund. |
Income and capital gains distributions are determined in accordance with income tax regulations that may differ from accounting principles generally accepted in the United States of America. These differences are due to differing treatments for items such as net short-term gains, deferral of wash sale losses, foreign currency transactions, net investment losses and capital loss carryovers.
The Funds have elected to treat gains and losses on forward foreign currency contracts as capital gains and losses, if applicable. Other foreign currency gains and losses on debt instruments are treated as ordinary income for federal income tax purposes pursuant to Section 988 of the Internal Revenue Code.
Janus Mathematical Funds | 99
Notes to Financial Statements (unaudited) (continued)
The aggregate cost of investments and the composition of unrealized appreciation and depreciation of investment securities for federal income tax purposes as of December 31, 2011 are noted below.
Unrealized appreciation and unrealized depreciation in the table below exclude appreciation/(depreciation) on foreign currency translations. The primary difference between book and tax appreciation or depreciation of investments is wash sale loss deferrals and passive foreign investment companies.
| | | | | | | | | | | | | | | |
| | | | | | | | | Net Tax
| | |
| | | Federal Tax
| | Unrealized
| | Unrealized
| | Appreciation/
| | |
| Fund | | Cost | | Appreciation | | (Depreciation) | | (Depreciation) | | |
| |
| |
INTECH Global Dividend Fund(1) | | $ | 5,214,587 | | $ | 163,050 | | $ | (7,993) | | $ | 155,057 | | |
INTECH International Fund(2) | | | 38,904,462 | | | 784,361 | | | (2,822,942) | | | (2,038,581) | | |
INTECH U.S. Core Fund(3) | | | 270,125,338 | | | 51,350,106 | | | (10,629,902) | | | 40,720,204 | | |
INTECH U.S. Growth Fund(4) | | | 264,132,667 | | | 54,423,297 | | | (7,068,571) | | | 47,354,726 | | |
INTECH U.S. Value Fund(5) | | | 85,797,939 | | | 12,063,063 | | | (2,942,615) | | | 9,120,448 | | |
| |
| |
| | | |
| (1) | | Period from December 15, 2011 (inception date) through December 31, 2011. |
| (2) | | Formerly named INTECH Risk-Managed International Fund. |
| (3) | | Formerly named INTECH Risk-Managed Core Fund. |
| (4) | | Formerly named INTECH Risk-Managed Growth Fund. |
| (5) | | Formerly named INTECH Risk-Managed Value Fund. |
Net capital loss carryovers as of June 30, 2011 are indicated in the table below. These losses may be available to offset future realized capital gains and thereby reduce future taxable gains distributions. The following table shows the expiration dates of the carryovers.
Capital Loss Carryover Expiration Schedule
For the fiscal period ended June 30, 2011
| | | | | | | | | | | | | | | |
| | | | | | | | | Accumulated
| | |
| Fund | | June 30, 2016 | | June 30, 2017 | | June 30, 2018 | | Capital Losses | | |
| |
| |
INTECH International Fund(1) | | $ | – | | $ | (477,452) | | $ | (2,035,662) | | $ | (2,513,114) | | |
INTECH U.S. Core Fund(2),(3) | | | (16,986,360) | | | (47,434,201) | | | – | | | (64,420,561) | | |
INTECH U.S. Growth Fund(4) | | | – | | | (67,296,075) | | | (181,101,744) | | | (248,397,819) | | |
INTECH U.S. Value Fund(5) | | | – | | | – | | | (10,160,796) | | | (10,160,796) | | |
| |
| |
| | | |
| (1) | | Formerly named INTECH Risk-Managed International Fund. |
| (2) | | Formerly named INTECH Risk-Managed Core Fund. |
| (3) | | Capital loss carryovers subject to annual limitations. |
| (4) | | Formerly named INTECH Risk-Managed Growth Fund. |
| (5) | | Formerly named INTECH Risk-Managed Value Fund. |
Capital losses may be used to offset future taxable capital gains until expiration. Under the recently enacted Regulated Investment Company Modernization Act of 2010, the Funds will be permitted to carry forward capital losses incurred in taxable years beginning after December 22, 2010 for an unlimited period. Losses incurred during those future years will be required to be utilized prior to the losses incurred in pre-enactment taxable years. As a result of this ordering rule, pre-enactment capital loss carryforwards may more likely expire unused. Also, post-enactment capital losses that are carried forward will retain their character as either short-term or long-term capital losses rather than being considered all short-term as under previous law.
100 | DECEMBER 31, 2011
The expense ratios listed in the Financial Highlights reflect expenses prior to any expense offsets (gross expense ratio) and after expense offsets (net expense ratio). Both expense ratios reflect expenses after waivers (reimbursement). Listed below are the gross expense ratios for the Funds that would have been in effect, absent the waiver of certain fees and offsets.
For the six-month period ended December 31, 2011 (unaudited), the fiscal year ended June 30, 2011, the eight- or eleven-month fiscal period
ended June 30, 2010 and each fiscal
year or period ended October 31 or July 31
| | | | | | | | | | | | | | | | | | | | | |
| | | INTECH Global Dividend
| | INTECH International
| | INTECH U.S. Core
| | INTECH U.S. Growth
| | INTECH U.S. Value
|
| | | Fund | | Fund(1) | | Fund (2) | | Fund(3) | | Fund(4) |
| |
| |
| Class A Shares |
| 2011 | | | 7.72%(5) | | | | 1.51% | | | | 1.00% | | | | 0.88% | | | | 0.95% | |
| 2011 | | | N/A | | | | 3.22% | | | | 0.98% | | | | 0.86% | | | | 0.95% | |
2010(6) | | | N/A | | | | 4.61% | | | | N/A | | | | 0.90% | | | | 1.06% | |
2010(7) | | | N/A | | | | N/A | | | | 1.15% | | | | N/A | | | | N/A | |
2009(8) | | | N/A | | | | 6.45% | | | | N/A | | | | 0.82% | | | | 1.33% | |
2009(9) | | | N/A | | | | N/A | | | | 1.25% | | | | N/A | | | | N/A | |
| 2008 | | | N/A | | | | 4.18% | | | | N/A | | | | 0.78% | | | | 1.17% | |
| 2007 | | | N/A | | | | 6.11%(10) | | | | N/A | | | | 0.81% | | | | 1.35% | |
| 2006 | | | N/A | | | | N/A | | | | N/A | | | | 0.91% | | | | 3.67%(11) | |
| |
| |
| Class C Shares |
| 2011 | | | 8.47%(5) | | | | 2.29% | | | | 1.84% | | | | 1.74% | | | | 1.83% | |
| 2011 | | | N/A | | | | 3.96% | | | | 1.80% | | | | 1.71% | | | | 1.74% | |
2010(6) | | | N/A | | | | 5.33% | | | | N/A | | | | 2.82% | | | | 1.81% | |
2010(7) | | | N/A | | | | N/A | | | | 1.56% | | | | N/A | | | | N/A | |
2009(8) | | | N/A | | | | 7.20% | | | | N/A | | | | 1.67% | | | | 1.99% | |
2009(9) | | | N/A | | | | N/A | | | | 2.17% | | | | N/A | | | | N/A | |
| 2008 | | | N/A | | | | 4.93% | | | | N/A | | | | 1.60% | | | | 1.96% | |
| 2007 | | | N/A | | | | 6.86%(10) | | | | N/A | | | | 1.59% | | | | 2.05% | |
| 2006 | | | N/A | | | | N/A | | | | N/A | | | | 1.64% | | | | 4.42%(11) | |
| |
| |
| Class D Shares |
| 2011 | | | 8.01%(5) | | | | N/A | | | | 0.86% | | | | N/A | | | | N/A | |
| 2011 | | | N/A | | | | N/A | | | | 0.82% | | | | N/A | | | | N/A | |
2010(12) | | | N/A | | | | N/A | | | | 0.61% | | | | N/A | | | | N/A | |
| |
| |
| Class I Shares |
| 2011 | | | 7.47%(5) | | | | 1.20% | | | | 0.76% | | | | 0.65% | | | | 0.69% | |
| 2011 | | | N/A | | | | 3.08% | | | | 0.72% | | | | 0.63% | | | | 0.68% | |
2010(6) | | | N/A | | | | 4.68% | | | | N/A | | | | 0.62% | | | | 0.77% | |
2010(7) | | | N/A | | | | N/A | | | | 0.53% | | | | N/A | | | | N/A | |
2009(8) | | | N/A | | | | 6.34% | | | | N/A | | | | 0.55% | | | | 0.96% | |
2009(9) | | | N/A | | | | N/A | | | | 0.80% | | | | N/A | | | | N/A | |
| 2008 | | | N/A | | | | 3.92% | | | | N/A | | | | 0.53% | | | | 0.90% | |
| 2007 | | | N/A | | | | 5.86%(10) | | | | N/A | | | | 0.56% | | | | 1.09% | |
| 2006 | | | N/A | | | | N/A | | | | N/A | | | | 0.61%(13) | | | | 2.91%(11) | |
| |
| |
| Class S Shares |
| 2011 | | | 7.97%(5) | | | | 1.74% | | | | 1.21% | | | | 1.09% | | | | 1.17% | |
| 2011 | | | N/A | | | | 3.46% | | | | 1.18% | | | | 1.07% | | | | 1.17% | |
2010(6) | | | N/A | | | | 4.83% | | | | N/A | | | | 1.12% | | | | 1.28% | |
2010(7) | | | N/A | | | | N/A | | | | 1.03% | | | | N/A | | | | N/A | |
2009(8) | | | N/A | | | | 6.66% | | | | N/A | | | | 1.04% | | | | 1.44% | |
2009(9) | | | N/A | | | | N/A | | | | 1.27% | | | | N/A | | | | N/A | |
| 2008 | | | N/A | | | | 4.43% | | | | N/A | | | | 1.02% | | | | 1.41% | |
| 2007 | | | N/A | | | | 6.36%(10) | | | | N/A | | | | 1.05% | | | | 1.62% | |
| 2006 | | | N/A | | | | N/A | | | | N/A | | | | 1.15% | | | | 3.92%(11) | |
Janus Mathematical Funds | 101
Notes to Financial Statements (unaudited) (continued)
| | | | | | | | | | | | | | | | | | | | | |
| | | INTECH Global Dividend
| | INTECH International
| | INTECH U.S. Core
| | INTECH U.S. Growth
| | INTECH U.S. Value
|
| | | Fund | | Fund(1) | | Fund (2) | | Fund(3) | | Fund(4) |
| |
| |
| Class T Shares |
| 2011 | | | 7.91%(5) | | | | 1.49% | | | | 0.96% | | | | 0.84% | | | | 0.94% | |
| 2011 | | | N/A | | | | 2.41% | | | | 0.92% | | | | 0.76% | | | | 0.95% | |
2010(6) | | | N/A | | | | 4.81% | | | | N/A | | | | 0.85% | | | | 1.00% | |
2010(7) | | | N/A | | | | N/A | | | | 0.79% | | | | N/A | | | | N/A | |
2009(14) | | | N/A | | | | 14.17% | | | | N/A | | | | 0.75% | | | | 1.66% | |
2009(15) | | | N/A | | | | N/A | | | | 0.91% | | | | N/A | | | | N/A | |
| 2008 | | | N/A | | | | N/A | | | | 0.75% | | | | N/A | | | | N/A | |
| 2007 | | | N/A | | | | N/A | | | | 0.77% | | | | N/A | | | | N/A | |
| 2006 | | | N/A | | | | N/A | | | | 0.91% | | | | N/A | | | | N/A | |
| |
| |
| | | |
(1)
| | Formerly named INTECH Risk-Managed International Fund. |
| (2) | | Formerly named INTECH Risk-Managed Core Fund. |
| (3) | | Formerly named INTECH Risk-Managed Growth Fund. |
| (4) | | Formerly named INTECH Risk-Managed Value Fund. |
| (5) | | Period from December 15, 2011 (inception date) through December 31, 2011. |
| (6) | | Period from August 1, 2009 through June 30, 2010. The Fund changed its fiscal year end from July 31 to June 30. |
| (7) | | Period from November 1, 2009 through June 30, 2010. The Fund changed its fiscal year end from October 31 to June 30. |
| (8) | | Period from August 1, 2008 through July 31, 2009. |
| (9) | | Period from July 6, 2009 (inception date) through October 31, 2009. |
| (10) | | Period from May 2, 2007 (inception date) through July 31, 2007. |
| (11) | | Period from December 30, 2005 (inception date) through July 31, 2006. |
| (12) | | Period from February 16, 2010 (inception date) through June 30, 2010. |
| (13) | | Period from November 28, 2005 (inception date) through July 31, 2006. |
| (14) | | Period from July 6, 2009 (inception date) through July 31, 2009. |
| (15) | | Period from November 1, 2008 through October 31, 2009. |
102 | DECEMBER 31, 2011
| |
| 7. | Capital Share Transactions |
| | | | | | | | | | | | | | | | | | | | | | | | | | | | | | | | | | | | | | | |
| | | INTECH
| | | INTECH
| | | INTECH
| | | INTECH
| | | INTECH
| | | |
For the six-month period ended December 31, 2011
| | Global Dividend
| | | International
| | | U.S. Core
| | | U.S. Growth
| | | U.S. Value
| | | |
(unaudited) and the fiscal year ended June 30, 2011
| | Fund | | | Fund(1) | | | Fund(2) | | | Fund(3) | | | Fund(4) | | | |
| (all numbers in thousands) | | 2011(5) | | | 2011 | | | 2011 | | | 2011 | | | 2011 | | | 2011 | | | 2011 | | | 2011 | | | 2011 | | | |
| |
| Transactions in Fund Shares – Class A Shares: | | | | | | | | | | | | | | | | | | | | | | | | | | | | | | | | | | | | | | |
| Shares sold | | | 83 | | | | – | | | | – | | | | 133 | | | | 304 | | | | 84 | | | | 153 | | | | 75 | | | | 118 | | | |
| Reinvested dividends and distributions | | | – | | | | 1 | | | | 4 | | | | 9 | | | | 7 | | | | 4 | | | | 6 | | | | 8 | | | | 6 | | | |
| Shares repurchased | | | – | | | | – | | | | (212) | | | | (131) | | | | (323) | | | | (77) | | | | (636) | | | | (41) | | | | (97) | | | |
| Net Increase/(Decrease) in Fund Shares | | | 83 | | | | 1 | | | | (208) | | | | 11 | | | | (12) | | | | 11 | | | | (477) | | | | 42 | | | | 27 | | | |
| Shares Outstanding, Beginning of Period | | | – | | | | 65 | | | | 273 | | | | 1,016 | | | | 1,028 | | | | 655 | | | | 1,132 | | | | 497 | | | | 470 | | | |
| Shares Outstanding, End of Period | | | 83 | | | | 66 | | | | 65 | | | | 1,027 | | | | 1,016 | | | | 666 | | | | 655 | | | | 539 | | | | 497 | | | |
| Transactions in Fund Shares – Class C Shares: | | | | | | | | | | | | | | | | | | | | | | | | | | | | | | | | | | | | | | |
| Shares sold | | | 83 | | | | 60 | | | | 8 | | | | 25 | | | | 36 | | | | 22 | | | | 11 | | | | 7 | | | | 15 | | | |
| Reinvested dividends and distributions | | | – | | | | 1 | | | | 4 | | | | – | | | | – | | | | – | | | | – | | | | – | | | | – | | | |
| Shares repurchased | | | – | | | | (62) | | | | (209) | | | | (42) | | | | (165) | | | | (50) | | | | (124) | | | | (10) | | | | (35) | | | |
| Net Increase/(Decrease) in Fund Shares | | | 83 | | | | (1) | | | | (197) | | | | (17) | | | | (129) | | | | (28) | | | | (113) | | | | (3) | | | | (20) | | | |
| Shares Outstanding, Beginning of Period | | | – | | | | 69 | | | | 266 | | | | 474 | | | | 603 | | | | 274 | | | | 387 | | | | 22 | | | | 42 | | | |
| Shares Outstanding, End of Period | | | 83 | | | | 68 | | | | 69 | | | | 457 | | | | 474 | | | | 246 | | | | 274 | | | | 19 | | | | 22 | | | |
| Transactions in Fund Shares – Class D Shares: | | | | | | | | | | | | | | | | | | | | | | | | | | | | | | | | | | | | | | |
| Shares sold | | | 96 | | | | N/A | | | | N/A | | | | 879 | | | | 1,365 | | | | N/A | | | | N/A | | | | N/A | | | | N/A | | | |
| Reinvested dividends and distributions | | | – | | | | N/A | | | | N/A | | | | 118 | | | | 123 | | | | N/A | | | | N/A | | | | N/A | | | | N/A | | | |
| Shares repurchased | | | – | | | | N/A | | | | N/A | | | | (949) | | | | (2,029) | | | | N/A | | | | N/A | | | | N/A | | | | N/A | | | |
| Net Increase/(Decrease) in Fund Shares | | | 96 | | | | N/A | | | | N/A | | | | 48 | �� | | | (541) | | | | N/A | | | | N/A | | | | N/A | | | | N/A | | | |
| Shares Outstanding, Beginning of Period | | | – | | | | N/A | | | | N/A | | | | 12,090 | | | | 12,631 | | | | N/A | | | | N/A | | | | N/A | | | | N/A | | | |
| Shares Outstanding, End of Period | | | 96 | | | | N/A | | | | N/A | | | | 12,138 | | | | 12,090 | | | | N/A | | | | N/A | | | | N/A | | | | N/A | | | |
| Transactions in Fund Shares – Class I Shares: | | | | | | | | | | | | | | | | | | | | | | | | | | | | | | | | | | | | | | |
| Shares sold | | | 83 | | | | 2,726 | | | | 2,441 | | | | 209 | | | | 711 | | | | 951 | | | | 2,768 | | | | 366 | | | | 1,730 | | | |
| Reinvested dividends and distributions | | | – | | | | 46 | | | | 3 | | | | 29 | | | | 33 | | | | 160 | | | | 223 | | | | 158 | | | | 115 | | | |
| Shares repurchased | | | – | | | | (277) | | | | (65) | | | | (643) | | | | (1,552) | | | | (2,253) | | | | (16,126) | | | | (406) | | | | (931) | | | |
| Net Increase/(Decrease) in Fund Shares | | | 83 | | | | 2,495 | | | | 2,379 | | | | (405) | | | | (808) | | | | (1,142) | | | | (13,135) | | | | 118 | | | | 914 | | | |
| Shares Outstanding, Beginning of Period | | | – | | | | 2,571 | | | | 192 | | | | 3,879 | | | | 4,687 | | | | 23,156 | | | | 36,291 | | | | 9,301 | | | | 8,387 | | | |
| Shares Outstanding, End of Period | | | 83 | | | | 5,066 | | | | 2,571 | | | | 3,474 | | | | 3,879 | | | | 22,014 | | | | 23,156 | | | | 9,419 | | | | 9,301 | | | |
| Transactions in Fund Shares – Class S Shares: | | | | | | | | | | | | | | | | | | | | | | | | | | | | | | | | | | | | | | |
| Shares sold | | | 83 | | | | 1 | | | | – | | | | 59 | | | | 65 | | | | 383 | | | | 159 | | | | – | | | | – | | | |
| Reinvested dividends and distributions | | | – | | | | 1 | | | | 4 | | | | 2 | | | | 2 | | | | 6 | | | | 7 | | | | – | | | | – | | | |
| Shares repurchased | | | – | | | | – | | | | (209) | | | | (62) | | | | (92) | | | | (241) | | | | (661) | | | | – | | | | (5) | | | |
| Net Increase/(Decrease) in Fund Shares | | | 83 | | | | 2 | | | | (205) | | | | (1) | | | | (25) | | | | 148 | | | | (495) | | | | – | | | | (5) | | | |
| Shares Outstanding, Beginning of Period | | | – | | | | 61 | | | | 266 | | | | 338 | | | | 363 | | | | 996 | | | | 1,491 | | | | 22 | | | | 27 | | | |
| Shares Outstanding, End of Period | | | 83 | | | | 63 | | | | 61 | | | | 337 | | | | 338 | | | | 1,144 | | | | 996 | | | | 22 | | | | 22 | | | |
| Transactions in Fund Shares – Class T Shares: | | | | | | | | | | | | | | | | | | | | | | | | | | | | | | | | | | | | | | |
| Shares sold | | | 103 | | | | – | | | | 4 | | | | 737 | | | | 1,106 | | | | 3 | | | | 4 | | | | 3 | | | | – | | | |
| Reinvested dividends and distributions | | | – | | | | – | | | | – | | | | 47 | | | | 48 | | | | – | | | | – | | | | – | | | | – | | | |
| Shares repurchased | | | – | | | | – | | | | – | | | | (677) | | | | (1,435) | | | | (1) | | | | (1) | | | | – | | | | (2) | | | |
| Net Increase/(Decrease) in Fund Shares | | | 103 | | | | – | | | | 4 | | | | 107 | | | | (281) | | | | 2 | | | | 3 | | | | 3 | | | | (2) | | | |
| Shares Outstanding, Beginning of Period | | | – | | | | 6 | | | | 2 | | | | 5,204 | | | | 5,485 | | | | 4 | | | | 1 | | | | 2 | | | | 4 | | | |
| Shares Outstanding, End of Period | | | 103 | | | | 6 | | | | 6 | | | | 5,311 | | | | 5,204 | | | | 6 | | | | 4 | | | | 5 | | | | 2 | | | |
| | | |
| (1) | | Formerly named INTECH Risk-Managed International Fund. |
| (2) | | Formerly named INTECH Risk-Managed Core Fund. |
| (3) | | Formerly named INTECH Risk-Managed Growth Fund. |
| (4) | | Formerly named INTECH Risk-Managed Value Fund. |
| (5) | | Period from December 15, 2011 (inception date) through December 31, 2011. |
Janus Mathematical Funds | 103
Notes to Financial Statements (unaudited) (continued)
| |
| 8. | Purchases and Sales of Investment Securities |
For the period ended December 31, 2011, the aggregate cost of purchases and proceeds from sales of investment securities (excluding any short-term securities, short-term options contracts, and in-kind transactions) was as follows:
| | | | | | | | | | | | | | | |
| | | | | | | Purchases of Long-
| | Proceeds from Sales
| | |
| | | Purchases of
| | Proceeds from Sales
| | Term U.S. Government
| | of Long-Term U.S.
| | |
| Fund | | Securities | | of Securities | | Obligations | | Government Obligations | | |
| |
| INTECH Global Dividend Fund | | $ | 5,005,587 | | $ | – | | $ | – | | $ | – | | |
INTECH International Fund(1) | | | 25,814,442 | | | 9,007,706 | | | – | | | – | | |
INTECH U.S. Core Fund(2) | | | 86,501,106 | | | 91,670,520 | | | – | | | – | | |
INTECH U.S. Growth Fund(3) | | | 113,715,066 | | | 126,916,484 | | | – | | | – | | |
INTECH U.S. Value Fund(4) | | | 33,353,157 | | | 32,991,303 | | | – | | | – | | |
| |
| |
| | | |
| (1) | | Formerly named INTECH Risk-Managed International Fund. |
| (2) | | Formerly named INTECH Risk-Managed Core Fund. |
| (3) | | Formerly named INTECH Risk-Managed Growth Fund. |
| (4) | | Formerly named INTECH Risk-Managed Value Fund. |
| |
| 9. | New Accounting Pronouncements |
In May 2011, the FASB issued Accounting Standards Update, “Amendments to Achieve Common Fair Value Measurement and Disclosure Requirements.” The Accounting Standards Update requires disclosures about amounts and reasons for all transfers in and out of Level 1 and Level 2 fair value measurements. In addition, the Accounting Standards Update will require reporting entities to disclose the following information for fair value measurements categorized with Level 3 of the fair value hierarchy: quantitative information about the unobservable inputs used in the fair value measurement, the valuation processes used by the reporting entity, and a narrative description of the sensitivity of the fair value measurement to changes in unobservable inputs and the interrelationships between those unobservable inputs. This disclosure is effective for fiscal years beginning after December 15, 2011, and for interim periods within those fiscal years. The adoption of this Accounting Standards Update did not have any impact on the Funds’ financial position or the results of its operations.
Effective April 2, 2012, the 2.00% redemption fee charged by INTECH International Fund, INTECH U.S. Core Fund, INTECH U.S. Growth Fund, and INTECH U.S. Value Fund upon the sale or exchange of Class D Shares, Class I Shares, Class S Shares, or Class T Shares within 90 days of purchase or exchange is eliminated and will no longer be charged by the Funds.
Management has evaluated whether any other events or transactions occurred subsequent to December 31, 2011 and through the date of issuance of the Funds’ financial statements and determined that there were no other material events or transactions that would require recognition or disclosure in the Funds’ financial statements.
104 | DECEMBER 31, 2011
Additional Information (unaudited)
Proxy Voting Policies and Voting Record
A description of the policies and procedures that the Funds use to determine how to vote proxies relating to their portfolio securities is available without charge: (i) upon request, by calling 1-800-525-0020 (toll free); (ii) on the Funds’ website at janus.com/proxyvoting; and (iii) on the SEC’s website at http://www.sec.gov. Additionally, information regarding each Fund’s proxy voting record for the most recent twelve-month period ended June 30 is also available, free of charge, through janus.com/proxyvoting and from the SEC’s website at http://www.sec.gov.
Quarterly Portfolio Holdings
The Funds file their complete portfolio holdings (schedule of investments) with the SEC for the first and third quarters of each fiscal year on Form N-Q within 60 days of the end of such fiscal quarter. The Funds’ Form N-Q: (i) is available on the SEC’s website at http://www.sec.gov; (ii) may be reviewed and copied at the SEC’s Public Reference Room in Washington, D.C. (information on the Public Reference Room may be obtained by calling 1-800-SEC-0330); and (iii) is available without charge, upon request, by calling Janus at 1-800-525-0020 (toll free).
APPROVAL OF ADVISORY AGREEMENTS DURING THE PERIOD
The Trustees of Janus Investment Fund, none of whom has ever been affiliated with Janus Capital and each of whom serves as an “independent” Trustee (the “Trustees”), oversee the management of each Fund and, as required by law, determine annually whether to continue the investment advisory agreement for each Fund and the subadvisory agreements for the nine Funds that utilize subadvisers.
In connection with their most recent consideration of those agreements for each Fund, the Trustees received and reviewed a substantial amount of information provided by Janus Capital and the respective subadvisers in response to requests of the Trustees and their independent legal counsel. They also received and reviewed a considerable amount of information and analysis provided by, and at the request of, their independent fee consultant. Throughout their consideration of the agreements, the Trustees were advised by their independent legal counsel. The Trustees met with management to consider the agreements, and also met separately in executive session with their independent legal counsel and their independent fee consultant.
At a meeting held on December 8, 2011, based on the Trustees’ evaluation of the information provided by Janus Capital, the subadvisers and the independent fee consultant, as well as other information, the Trustees determined that the overall arrangements between each Fund and Janus Capital and each subadviser, as applicable, were fair and reasonable in light of the nature, extent and quality of the services provided by Janus Capital, its affiliates and the subadvisers, the fees charged for those services, and other matters that the Trustees considered relevant in the exercise of their business judgment. At that meeting, the Trustees unanimously approved the continuation of the investment advisory agreement for each Fund, and the subadvisory agreement for each subadvised Fund, for the period from February 1, 2012 through February 1, 2013, subject to earlier termination as provided for in each agreement.
In considering the continuation of those agreements, the Trustees reviewed and analyzed various factors that they determined were relevant, including the factors described below, none of which by itself was considered dispositive. However, the material factors and conclusions that formed the basis for the Trustees’ determination to approve the continuation of the agreements are discussed separately below.
Nature, Extent and Quality of Services
The Trustees reviewed the nature, extent and quality of the services provided by Janus Capital and the subadvisers to the Funds, taking into account the investment objective and strategy of each Fund and the knowledge the Trustees gained from their regular meetings with management on at least a quarterly basis and their ongoing review of information related to the Funds. In addition, the Trustees reviewed the resources and key personnel of Janus Capital and each subadviser, particularly noting those employees who provide investment and risk management services to the Funds. The Trustees also considered other services provided to the Funds by Janus Capital or the subadvisers, such as managing the execution of portfolio transactions and the selection of broker-dealers for those transactions. The Trustees considered Janus Capital’s role as administrator to the Funds, noting that Janus Capital does not receive a fee for its services but is reimbursed for its out-of-pocket costs. The Trustees considered the role of Janus Capital in monitoring adherence to the Funds’ investment restrictions, providing support services for the Trustees and Trustee committees, communicating with shareholders and overseeing the activities of other service providers, including monitoring compliance with various policies and procedures of the Funds and with applicable securities laws and regulations.
Janus Mathematical Funds | 105
Additional Information (unaudited) (continued)
The Trustees concluded that the nature, extent and quality of the services provided by Janus Capital or the subadviser to each Fund were appropriate and consistent with the terms of the respective advisory and subadvisory agreements, and that, taking into account steps taken to address those Funds whose performance lagged that of their peers for certain periods, the quality of those services had been consistent with or superior to quality norms in the industry and the Funds were likely to benefit from the continued provision of those services. They also concluded that Janus Capital and each subadviser had sufficient personnel, with the appropriate education and experience, to serve the Funds effectively and had demonstrated its continuing ability to attract well-qualified personnel.
Performance of the Funds
The Trustees considered the performance results of each Fund over various time periods. They reviewed information comparing each Fund’s performance with the performance of comparable funds and peer groups identified by Lipper, and with the Fund’s benchmark index. They concluded that the performance of various Funds was good to very good under current market conditions. Although the performance of other Funds lagged that of their peers for certain periods, the Trustees also concluded that Janus Capital had taken or was taking appropriate steps to address those instances of under-performance.
Costs of Services Provided
The Trustees examined information regarding the fees and expenses of each Fund in comparison to similar information for other comparable funds as provided by Lipper. They also reviewed an analysis of that information provided by their independent fee consultant and noted that the rate of management (investment advisory and any administration) fees for most of the Funds, after applicable contractual expense limitations, was below the mean management fee rate of the respective peer group of funds selected by Lipper.
The Trustees considered the methodology used by Janus Capital and each subadviser in determining compensation payable to portfolio managers, the competitive environment for investment management talent and the competitive market for mutual funds in different distribution channels. They concluded that the compensation methodology provided a good alignment of the interests of the portfolio managers with the interests of Fund shareholders.
The Trustees also reviewed management fees charged by Janus Capital and each subadviser to their separate account clients and to non-affiliated funds subadvised by Janus Capital or by a subadviser (for which Janus Capital provides only portfolio management services). Although in most instances subadvisory and separate account fee rates for various investment strategies were lower than management fee rates for Funds having a similar strategy, the Trustees noted that, under the terms of the management agreements with the Funds, Janus Capital performs significant additional services for the Funds that it does not provide to those other clients, including administration services, oversight of the Funds’ other service providers, trustee support, regulatory compliance and numerous other services, and that, in serving the Funds, Janus Capital assumes many legal risks that it does not assume in servicing its other clients. Moreover, they noted that the spread between the average fee rates charged to the Funds and the fee rates that Janus Capital charged to its separate account clients was smaller than the average spread for such fee rates of other advisers, based on publicly available data and research conducted by the Trustees’ independent fee consultant.
The Trustees reviewed information on the profitability to Janus Capital and its affiliates of their relationships with each Fund, as well as an explanation of the methodology utilized in allocating various expenses of Janus Capital and its affiliates among the Funds and other clients. The Trustees also reviewed the financial statements and corporate structure of Janus Capital’s parent company. In their review, the Trustees considered whether Janus Capital and each subadviser receive adequate incentives to manage the Funds effectively. The Trustees recognized that profitability comparisons among fund managers are difficult because very little comparative information is publicly available and the profitability of any fund manager is affected by numerous factors, including the organizational structure of the particular fund manager, the types of funds and other accounts it manages, possible other lines of business, the methodology for allocating expenses and the fund manager’s capital structure and cost of capital. However, taking into account those factors and the analysis provided by the Trustees’ independent fee consultant, and based on the information available, the Trustees concluded that Janus Capital’s profitability with respect to each Fund in relation to the services rendered was not unreasonable.
The Trustees concluded that the management fees and other compensation payable by each Fund to Janus Capital and its affiliates, as well as the fees paid by Janus Capital to the subadvisers of subadvised Funds, were reasonable in relation to the nature, extent and quality of the services provided, taking into account the fees charged by other advisers for managing comparable mutual funds with similar strategies, the fees Janus Capital and the subadvisers charge to other clients, and, as applicable, the impact of fund performance on fees
106 | DECEMBER 31, 2011
payable by the Funds. The Trustees also concluded that the overall expense ratio of each Fund was reasonable, taking into account the size of the Fund, the quality of services provided by Janus Capital and any subadviser, the investment performance of the Fund and any expense limitations agreed to by Janus Capital.
Economies of Scale
The Trustees considered information about the potential for Janus Capital to realize economies of scale as the assets of the Funds increase. They noted that, although many Funds pay advisory fees at a fixed rate as a percentage of net assets, without any breakpoints, the actual management fee rate paid by most of the Funds, after any contractual expense limitations, was below the mean management fee rate of the Fund’s peer group identified by Lipper; and, for those Funds whose expenses are being reduced by the contractual expense limitations of Janus Capital, Janus Capital is subsidizing the Funds because they have not reached adequate scale. Moreover, as the assets of many of the Funds have declined in the past few years, certain Funds have benefited from having advisory fee rates that have remained constant rather than increasing as assets declined. In addition, performance fee structures have been implemented for various Funds that have caused or will cause the effective rate of advisory fees payable by such a Fund to vary depending on the investment performance of the Fund relative to its benchmark index over the measurement period; and a few Funds have fee schedules with breakpoints and reduced fee rates above certain asset levels. The Trustees also noted that the Funds share directly in economies of scale through the lower charges of third-party service providers that are based in part on the combined scale of all of the Funds. Based on all of the information they reviewed, including research and analysis conducted by the Trustees’ independent fee consultant, the Trustees concluded that the current fee structure of each Fund was reasonable and that the current rates of fees do reflect a sharing between Janus Capital and the Fund of economies of scale at the current asset level of the Fund.
Other Benefits to Janus Capital
The Trustees also considered benefits that accrue to Janus Capital and its affiliates from their relationships with the Funds. They recognized that two affiliates of Janus Capital separately serve the Funds as transfer agent and distributor, respectively, and the transfer agent receives compensation directly from the non-money market funds for services provided. The Trustees also considered Janus Capital’s past and proposed use of commissions paid by the Funds on their portfolio brokerage transactions to obtain proprietary and third-party research products and services benefiting the Fund and/or other clients of Janus Capital. The Trustees concluded that Janus Capital’s use of these types of client commission arrangements to obtain proprietary and third-party research products and services was consistent with regulatory requirements and guidelines and was likely to benefit each Fund. The Trustees also concluded that, other than the services provided by Janus Capital and its affiliates pursuant to the agreements and the fees to be paid by each Fund therefor, the Funds and Janus Capital may potentially benefit from their relationship with each other in other ways. They concluded that Janus Capital benefits from the receipt of research products and services acquired through commissions paid on portfolio transactions of the Funds and that the Funds benefit from Janus Capital’s receipt of those products and services as well as research products and services acquired through commissions paid by other clients of Janus Capital. They further concluded that success of any Fund could attract other business to Janus Capital or other Janus funds, and that the success of Janus Capital could enhance Janus Capital’s ability to serve the Funds.
After full consideration of the above factors, as well as other factors, the Trustees, each of whom is an independent Trustee, concluded at their December 8, 2011 meeting that the proposed continuation of the investment advisory agreement and, if applicable, the subadvisory agreement for each Fund for another year was in the best interest of the respective Funds and their shareholders.
FOR INTECH GLOBAL DIVIDEND FUND
The Trustees of Janus Investment Fund, each of whom serves as an “independent” Trustee (the “Trustees”), and none of whom has ever been affiliated with Janus Capital or INTECH Investment Management LLC (“INTECH”), the investment adviser and subadviser, respectively, of INTECH Global Dividend Fund (the “New Fund”), considered the proposed investment advisory agreement and subadvisory agreement for the New Fund at a meeting held on September 14, 2011. In the course of their consideration of those agreements, the Trustees met in executive session and were advised by their independent legal counsel. The Trustees received and reviewed a substantial amount of information provided by Janus Capital and INTECH in response to requests of the Trustees and their counsel, and also considered information provided by their independent fee consultant. Throughout their consideration of the agreements, the Trustees were advised by their independent legal counsel. The Trustees met with management to consider the agreements, and also met separately with their independent legal counsel. Based on the Trustees’ evaluation of information provided to them, as well as
Janus Mathematical Funds | 107
Additional Information (unaudited) (continued)
other information, including information previously provided to them by Janus Capital in connection with their consideration of the continuation of other investment advisory agreements entered into with Janus Capital on behalf of other Funds, the Trustees unanimously approved the investment advisory agreement and subadvisory agreement for the New Fund for an initial term through February 1, 2013, subject to earlier termination as provided for in each agreement.
In considering the agreements and reaching their conclusions, the Trustees reviewed and analyzed various factors that they determined were relevant, including the factors described below, none of which by itself was considered dispositive.
Nature, Extent and Quality of Services
The Trustees reviewed the nature, extent, and quality of the services to be provided by Janus Capital and INTECH, taking into account the investment objective and strategy of the New Fund. In addition, the Trustees reviewed the resources and key personnel of Janus Capital and INTECH that will be providing investment and risk management services to the New Fund. The Trustees also considered other services to be provided to the New Fund by Janus Capital, and the involvement of INTECH in trade executions and the broker selection process. The Trustees considered Janus Capital’s role as administrator to the New Fund, noting that Janus Capital does not receive a fee for its services but is reimbursed for its out-of-pocket costs. The Trustees considered the role of each of Janus Capital and INTECH in monitoring adherence to the New Fund’s investment restrictions, providing support services for the Trustees and Trustee committees, communicating with shareholders and overseeing the activities of other service providers, including monitoring compliance with various Fund policies and procedures and with applicable securities laws and regulations.
The Trustees concluded that the nature, extent, and quality of the services to be provided by Janus Capital and INTECH were appropriate and consistent with the terms of the proposed investment advisory agreement and subadvisory agreement. They also concluded that each of Janus Capital and INTECH had sufficient personnel, with the appropriate education and experience, to serve the New Fund effectively.
Costs of Services Provided
The Trustees noted the information regarding the proposed fees and expenses of the New Fund in comparison to similar information for other comparable funds. The Trustees noted that they had previously reviewed management fees charged by Janus Capital and INTECH to their separate account clients and to non-affiliated funds subadvised by Janus Capital (for which Janus Capital provides only portfolio management services). The Trustees noted servicing that is provided by Janus Capital for the New Fund relative to those other clients, including regulatory compliance and administration services, and that, in serving the New Fund, Janus Capital assumes many legal risks that it does not assume in servicing its other clients.
The Trustees concluded that the advisory fee paid by the New Fund and the subadvisory fee payable by Janus Capital to INTECH was reasonable in relation to the nature, extent and quality of the services to be provided, taking into account the fees charged by other advisers for managing comparable mutual funds with similar strategies, the fees Janus Capital and INTECH charges to other clients, and the expense limitation agreement agreed to by Janus Capital.
Economies of Scale
The Trustees considered information about the potential for Janus Capital and INTECH to realize economies of scale as the assets of the New Fund increases. The Trustees noted that the New Fund is part of the overall Janus funds complex, which means, among other things, that the New Fund shares directly in economies of scale through the lower charges of third-party service providers that are based in part on the combined scale of all of the Janus funds.
Other Benefits to Janus Capital
The Trustees also considered benefits that accrue to Janus Capital, INTECH, and their affiliates from their relationship with the New Fund. They recognized that two affiliates of Janus Capital separately serve the New Fund as transfer agent and distributor, respectively. The Trustees also concluded that, other than the services provided by Janus Capital and its affiliates pursuant to the agreements and the fees to be paid by the New Fund therefor, the New Fund, Janus Capital, and INTECH may potentially benefit from their relationship with each other in other ways. They further concluded that success of the New Fund could attract other business to Janus Capital, INTECH, or other Funds, and that the success of Janus Capital and INTECH could enhance Janus Capital’s and INTECH’s ability to serve the New Fund.
After full consideration of the above factors, as well as other factors, all of the Trustees, all of whom are independent Trustees, concluded that approval of the New Fund’s agreements were in the best interest of the New Fund and its shareholders.
108 | DECEMBER 31, 2011
Explanations of Charts, Tables and
Financial Statements (unaudited)
Performance overview graphs compare the performance of a hypothetical $10,000 investment in each Fund (from inception) with one or more widely used market indices. The hypothetical example does not represent the returns of any particular investment.
When comparing the performance of a Fund with an index, keep in mind that market indices do not include brokerage commissions that would be incurred if you purchased the individual securities in the index. They also do not include taxes payable on dividends and interest or operating expenses incurred if you maintained a Fund invested in the index.
Average annual total returns are also quoted for each Fund. Average annual total return is calculated by taking the growth or decline in value of an investment over a period of time, including reinvestment of dividends and distributions, then calculating the annual compounded percentage rate that would have produced the same result had the rate of growth been constant throughout the period. Average annual total return does not reflect the deduction of taxes that a shareholder would pay on Fund distributions or redemptions of Fund shares.
Pursuant to federal securities rules, expense ratios shown in the performance chart reflect subsidized and unsubsidized ratios for the prior fiscal year. The total annual fund operating expenses ratio is gross of any fee waivers, reflecting a Fund’s unsubsidized expense ratio. The net annual fund operating expenses ratio (if applicable) includes contractual waivers of Janus Capital and reflects a Fund’s subsidized expense ratio. Both the total annual fund operating expenses ratio and net annual fund operating expenses ratio are based on average net assets as of the fiscal year ended June 30, 2011 . The ratios also include expenses indirectly incurred by a Fund as a result of investing in other investment companies or pooled investments, which are not reflected in the “Financial Highlights” of this report. As a result, these ratios may be higher or lower than those shown in the “Financial Highlights” in this report. All expenses are shown without the effect of expense offset arrangements. Pursuant to such arrangements, credits realized as a result of uninvested cash balances are used to reduce custodian and transfer agent expenses.
| |
| 2. | Schedules of Investments |
Following the performance overview section is each Fund’s Schedule of Investments. This schedule reports the industry concentrations and types of securities held in each Fund on the last day of the reporting period. Securities are usually listed by type (common stock, corporate bonds, U.S. Government obligations, etc.) and by industry classification (banking, communications, insurance, etc.). Holdings are subject to change without notice.
The value of each security is quoted as of the last day of the reporting period. The value of securities denominated in foreign currencies is converted into U.S. dollars.
If a Fund invests in foreign securities, it will also provide a summary of investments by country. This summary reports each Fund’s exposure to different countries by providing the percentage of securities invested in each country. The country of each security represents the country in which the company is incorporated. Each Fund’s Schedule of Investments relies upon the industry group and country classifications published by Bloomberg L.P.
| |
| 3. | Statements of Assets and Liabilities |
These statements are often referred to as the “balance sheets.” It lists the assets and liabilities of the Funds on the last day of the reporting period.
The Funds’ assets are calculated by adding the value of the securities owned, the receivable for securities sold but not yet settled, the receivable for dividends declared but not yet received on stocks owned and the receivable for Fund shares sold to investors but not yet settled. The Funds’ liabilities include payables for securities purchased but not yet settled, Fund shares redeemed but not yet paid and expenses owed but not yet paid. Additionally, there may be other assets and liabilities such as unrealized gain or loss on forward currency contracts.
The section entitled “Net Assets Consist of” breaks down the components of the Funds’ net assets. Because the Funds must distribute substantially all earnings, you will notice that a significant portion of net assets is shareholder capital.
The last section of this statement reports the net asset value (“NAV”) per share on the last day of the reporting period. The NAV is calculated by dividing the Funds’ net assets (assets minus liabilities) by the number of shares outstanding.
| |
| 4. | Statements of Operations |
These statements detail the Funds’ income, expenses, gains and losses on securities and currency transactions, and appreciation or depreciation of current Fund holdings.
The first section in this statement, entitled “Investment Income,” reports the dividends earned from stocks and interest earned from interest-bearing securities in the Funds.
Janus Mathematical Funds | 109
Explanations of Charts, Tables and
Financial Statements (unaudited) (continued)
The next section reports the expenses incurred by the Funds, including the advisory fee paid to the investment adviser, transfer agent fees and expenses, and printing and postage for mailing statements, financial reports and prospectuses. Expense offsets and expense reimbursements, if any, are also shown.
The last section lists the increase or decrease in the value of securities held in the Funds. The Funds will realize a gain (or loss) when they sell their position in a particular security. An unrealized gain (or loss) refers to the change in net appreciation or depreciation of the Funds during the reporting period. “Net Realized and Unrealized Gain/(Loss) on Investments” is affected both by changes in the market value of Fund holdings and by gains (or losses) realized during the reporting period.
| |
| 5. | Statements of Changes in Net Assets |
These statements report the increase or decrease in the Funds’ net assets during the reporting period. Changes in the Funds’ net assets are attributable to investment operations, dividends, distributions and capital share transactions. This is important to investors because it shows exactly what caused the Funds’ net asset size to change during the period.
The first section summarizes the information from the Statements of Operations regarding changes in net assets due to the Funds’ investment performance. The Funds’ net assets may also change as a result of dividend and capital gains distributions to investors. If investors receive their dividends in cash, money is taken out of the Funds to pay the distribution. If investors reinvest their dividends, the Funds’ net assets will not be affected. If you compare each Fund’s “Net Decrease from Dividends and Distributions” to the “Reinvested dividends and distributions,” you will notice that dividend distributions had little effect on each Fund’s net assets. This is because the majority of Janus investors reinvest their distributions.
The reinvestment of dividends is included under “Capital Share Transactions.” “Capital Shares” refers to the money investors contribute to the Funds through purchases or withdrawals via redemptions. “Redemption Fees” (if applicable) refers to the fee paid to the Funds for shares held for 90 days or less by a shareholder. The Funds’ net assets will increase and decrease in value as investors purchase and redeem shares from the Funds.
This schedule provides a per-share breakdown of the components that affect each Fund’s NAV for current and past reporting periods. Not only does this table provide you with total return, it also reports total distributions, asset size, expense ratios and portfolio turnover rate.
The first line in the table reflects the NAV per share at the beginning of the reporting period. The next line reports the net investment income per share, which comprises dividends and interest income earned on securities held by the Funds. Following is the total of gains/(losses), realized and unrealized. Dividends and distributions are then subtracted to arrive at the NAV per share at the end of the period. The next line reflects the average annual total return reported the last day of the period. The total return may include adjustments in accordance with generally accepted accounting principles. As a result, the total return may differ from the total return reflected for shareholder transactions.
Also included are the expense ratios, or the percentage of average net assets that were used to cover operating expenses during the period. Expense ratios vary across the Funds within the Trust for a number of reasons, including the differences in management fees, the frequency of dividend payments and the extent of foreign investments, which entail greater transaction costs.
The Funds’ expenses may be reduced through expense-reduction arrangements. These arrangements may include the use of balance credits or transfer agent fee offsets. The Statements of Operations reflect total expenses before any such offset, the amount of the offset and the net expenses. The expense ratios listed in the Financial Highlights reflect total expenses prior to any expense offset (gross expense ratio) and after the expense offsets (net expense ratio). Both expense ratios reflect expenses after waivers (reimbursements), if applicable.
The ratio of net investment income/(loss) summarizes the income earned less expenses, divided by the average net assets of a Fund during the reporting period. Don’t confuse this ratio with a Fund’s yield. The net investment income ratio is not a true measure of a Fund’s yield because it doesn’t take into account the dividends distributed to the Fund’s investors.
The next figure is the portfolio turnover rate, which measures the buying and selling activity in a Fund. Portfolio turnover is affected by market conditions, changes in the asset size of a Fund, fluctuating volume of shareholder purchase and redemption orders, the nature of the Fund’s investments and the investment style and/or outlook of the investment personnel. A 100% rate implies that an amount equal to the value of the entire portfolio was replaced once during the fiscal year; a 50% rate means that an amount equal to the value of half the portfolio is traded in a year; and a 200% rate means that an amount equal to the value of the entire portfolio is traded every six months.
110 | DECEMBER 31, 2011
Notes
Janus Mathematical Funds | 111
Notes
112 | DECEMBER 31, 2011
Notes
Janus Mathematical Funds | 113
Janus provides access to a wide range of investment disciplines.
Alternative
Janus alternative funds seek to deliver strong risk-adjusted returns over a full market cycle with lower correlation to equity markets than traditional investments.
Asset Allocation
Janus’ asset allocation funds utilize our fundamental, bottom-up research to balance risk over the long term. From fund options that meet investors’ risk tolerance and objectives to a method that incorporates non-traditional investment choices to seek non-correlated sources of risk and return, Janus’ asset allocation funds aim to allocate risk more effectively.
Fixed Income
Janus fixed income funds attempt to provide less risk relative to equities while seeking to deliver a competitive total return through high current income and appreciation. Janus money market funds seek capital preservation and liquidity with current income as a secondary objective.
Global & International
Janus global and international funds seek to leverage Janus’ research capabilities by taking advantage of inefficiencies in foreign markets, where accurate information and analytical insight are often at a premium.
Growth & Core
Janus growth funds focus on companies believed to be the leaders in their respective industries, with solid management teams, expanding market share, margins and efficiencies. Janus core funds seek investments in more stable and predictable companies. Our core funds look for a strategic combination of steady growth and, for certain funds, some degree of income.
Mathematical
Our mathematical funds seek to outperform their respective indices while maintaining a risk profile equal to or lower than the index itself. Managed by INTECH (a Janus subsidiary), these funds use a mathematical process in an attempt to build a more “efficient” portfolio than the index.
Value
Our value funds, managed by Perkins (a Janus subsidiary), seek to identify companies with favorable reward to risk characteristics by conducting rigorous downside analysis before determining upside potential.
For more information about our funds, contact your investment professional or go to janus.com/advisor/mutual-funds (or janus.com/allfunds if you hold Shares directly with Janus).
Please consider the charges, risks, expenses and investment objectives carefully before investing. For a prospectus or, if available, a summary prospectus containing this and other information, please call Janus at 877.33JANUS (52687) (or 800.525.3713 if you hold Shares directly with Janus); or download the file from janus.com/info (or janus.com/reports if you hold Shares directly with Janus). Read it carefully before you invest or send money.
Funds distributed by Janus Distributors LLC (02/12)
Investment products offered are: NOT FDIC-INSURED MAY LOSE VALUE NO BANK GUARANTEE
| |
| C-0112-127 | 125-24-93006 02-12 |
SEMIANNUAL REPORT
December 31, 2011
Janus Fixed Income & Money Market Funds
Fixed Income
Janus Flexible Bond Fund
Janus Global Bond Fund
Janus High-Yield Fund
Janus Short-Term Bond Fund
Money Market
Janus Government Money Market Fund
Janus Money Market Fund
HIGHLIGHTS
| |
| • | Portfolio management perspective |
| • | Investment strategy behind your fund |
| • | Fund performance, characteristics and holdings |
Table of Contents
Janus Fixed Income & Money Market Funds
| | | |
| | 1 |
| | 3 |
| | |
| | 5 |
| | 20 |
| | 34 |
| | 49 |
| | 65 |
| | 66 |
| | 68 |
| | 72 |
| | 74 |
| | 78 |
| | 91 |
| | 92 |
| | 93 |
| | 94 |
| | 96 |
| | 99 |
| | 118 |
| | 121 |
Please consider the charges, risks, expenses and investment objectives carefully before investing. For a prospectus or, if available, a summary prospectus containing this and other information, please call Janus at 877.33JANUS(52687) (or 800.525.3713 if you hold Shares directly with Janus); or download the file from janus.com/info (or janus.com/reports if you hold Shares directly with Janus). Read it carefully before you invest or send money.
Investment in money market funds are not insured or guaranteed by the Federal Deposit Insurance Corporation or any other government agency. Although money market funds seek to preserve the value of your investment at $1.00 per share, it is possible to lose money by investing in money market funds.
Co-Chief Investment Officers’ Market Perspective (unaudited)
Jonathan Coleman
Co-Chief Investment
Officer
Gibson Smith
Co-Chief Investment
Officer
Euphoria & Despair
We would like to take this opportunity to thank you for investing with Janus.
If there’s a lesson to be learned from the tumult of 2011, it’s that there are lies, damn lies and strategist reports. Few of the talking heads predicted that Europe’s debt crisis would precipitate a global crisis of confidence. Even fewer predicted that emerging markets would plunge and long-dated Treasuries would beat nearly every other asset class. We take no joy in the folly of such fortunetelling. Our point is that it is very difficult to accurately predict macro outcomes. While the macro has had tremendous influence on the markets, we continue to believe that focusing on individual company analysis is the key to long term success.
Does this mean we ignore the macro? Not at all. At the forefront of our concerns is Europe’s debt crisis. Long-term, Europe will be more competitive if it succeeds in strengthening its monetary union and implements some fiscal unity. Yet measures the EU has agreed upon will be slow, painful and potentially destabilizing. We expect to see volatility as this messy process evolves, and we expect a euro-zone recession in 2012, slowing global growth.
The U.S. has its own political circus, of course, and uncertainty over fiscal policy is not helping confidence. Yet we believe the U.S. is in a fairly stable, low growth environment. Leading economic indicators have picked up and consumer confidence has rebounded to the highest levels since April 2011. Unfortunately, the sustainability of U.S. growth is subject to external shocks (i.e. Europe) and remains a major risk factor.
Equities: Corporate Dynamism Prevails
Corporate earnings growth has generally been strong, yet valuations reflect fears that it may not last. A major concern is that profit margins are near record levels and will likely revert to the historical mean. Based on our research and observations, however, many businesses appear highly attuned to protecting margins. Equity valuations look compelling, moreover, when paired with companies that are well positioned strategically.
In terms of investing themes, our analysts are finding opportunities across sectors. In energy, we see attractive potential in oil-field services and equipment companies, which are benefiting from rising levels of exploration and production. In health care, our analysts are focusing on companies with innovative drugs that address unmet medical needs. Our consumer team, meanwhile, sees opportunity in retailers that are leveraging technology to extend their global brand and gain market share.
Overall, we think this is an opportune time to own equities. Entry points look attractive based on recent multiples and projected growth rates. We think the odds are stacked in favor of equities, especially if they have growing free cash and competitive advantages that can enable them to gain share.
Fixed Income: Lower Rates for Longer
If there’s a fixed income theme for 2012 it’s that investors should get used to low rates. The Federal Reserve (Fed) has stressed that its zero-rate policy will continue through 2013. The real questions now are around QE3 (a third round of quantitative easing). We think the Fed isn’t ready to shoot this bullet yet, but will respond if it sees economic weakness. An additional theme for 2012 will be that central banks around the globe will continue to engage in loose monetary policies as the threat of slower growth remains high.
Against this backdrop, we continue to believe that corporate credit offers some of the best risk-adjusted returns. Profit margins are high and companies are accumulating cash on balance sheets. Moreover, management teams are being more careful with balance sheets. We think this conservatism will continue through 2012, fueling more free cash flow, liquidity in the system and, ultimately, support for investment grade and high yield bonds.
In other areas, we are balancing our “risk positions” with Treasuries, which we believe offer an insurance policy against extreme events and market volatility. With the markets remaining volatile, we think this allocation to Treasuries needs to be actively managed, and we expect
Janus Fixed Income & Money Market Funds | 1
(Continued) (unaudited)
to reduce our allocation to take advantage of opportunities as the market presents them.
Conclusion: Corporate Playbooks Can Still Create Value
Despite the difficult environment, we continue to identify companies that look well positioned to grow. Multiples are undemanding historically, and many businesses have proven they can maintain earnings and margins even in a weak demand environment. Maintaining balance in a portfolio is critical in this environment, however. As long term investors, we are always attuned to protecting on the downside, while attempting to find opportunities in the marketplace with the most attractive risk/reward. Long term, we think this offers the best way to achieve strong results.
Sincerely,
Jonathan Coleman
Co-Chief Investment Officer
Gibson Smith
Co-Chief Investment Officer
The opinions are those of the authors as of 12-2011 and are subject to change at any time due to changes in market or economic conditions. The comments should not be construed as a recommendation of individual holdings or market sectors, but as an illustration of broader themes.
There is no assurance that the investment process will consistently lead to successful investing.
Investing involves market risk. Investment return and value will fluctuate and it is possible to lose money by investing.
Foreign securities have additional risks including exchange rate changes, political and economic upheaval, the relative lack of information, relatively low market liquidity and the potential lack of strict financial and accounting controls and standards. These risks are magnified in emerging markets. The prices of foreign securities held by the fund, and therefore a fund’s performance, may decline in response to such risks.
U.S. Treasury securities are direct debt obligations issued by the U.S. Government. With government bonds, the investor is a creditor of the government. Treasury Bills and U.S. Government Bonds are guaranteed by the full faith and credit of the United States government, are generally considered to be free of credit risk and typically carry lower yields than other securities. Bonds in a portfolio are typically intended to provide income and/or diversification. In general, the bond market is volatile. Bond prices rise when interest rates fall and vice versa. This effect is usually pronounced for longer-term securities. Any fixed income security sold or redeemed prior to maturity may be subject to a substantial gain or loss.
Statements in this piece that reflect projections or expectations of future financial or economic performance of a mutual fund or strategy and of the markets in general and statements of a fund’s plans and objectives for future operations are forward-looking statements. Actual results or events may differ materially from those projected, estimated, assumed or anticipated in any such forward-looking statements. Important factors that could result in such differences, in addition to the other factors noted with such forward-looking statements, include general economic conditions such as inflation, recession and interest rates.
2 | DECEMBER 31, 2011
Useful Information About Your Fund Report (unaudited)
Management Commentaries
The Management Commentaries in this report include valuable insight from each of the Funds’ managers as well as statistical information to help you understand how your Fund’s performance and characteristics stack up against those of comparable indices.
If a Fund invests in foreign securities, this report may include information about country exposure. Country exposure is based primarily on the country of domicile. However, the Funds’ managers may allocate a company to a country based on other factors such as location of the company’s principal office, the location of the principal trading market for the company’s securities, or the country where a majority of the company’s revenues are derived.
Please keep in mind that the opinions expressed by the Funds’ managers in the Management Commentaries are just that: opinions. They are a reflection of the managers’ best judgment at the time this report was compiled, which was December 31, 2011. As the investing environment changes, so could the managers’ opinions. These views are unique to each manager and aren’t necessarily shared by fellow employees or by Janus in general.
Fund Expenses
We believe it’s important for our shareholders to have a clear understanding of Fund expenses and the impact they have on investment return.
The following is important information regarding each Fund’s Expense Example, which appears in each Fund’s Management Commentary within this Semiannual Report. Please refer to this information when reviewing the Expense Example for each Fund.
Example
As a shareholder of a Fund, you incur two types of costs: (1) transaction costs, including sales charges (loads) on purchase payments (applicable to Class A Shares of the Fixed Income Funds only); redemption fees, where applicable (and any related exchange fees); and (2) ongoing costs, including management fees; distribution and shareholder servicing (12b-1) fees (applicable to Class A Shares, Class C Shares, Class R Shares, and Class S Shares of certain Fixed Income Funds only); administrative services fees payable pursuant to the Transfer Agency Agreement; administrative, networking or omnibus fees (applicable to Class A Shares, Class C Shares, and Class I Shares of the Fixed Income Funds only); and other Fund expenses. The example is intended to help you understand your ongoing costs (in dollars) of investing in the Fund and to compare these costs with the ongoing costs of investing in other mutual funds. To do so, compare this 5% hypothetical example with the 5% hypothetical examples that appear in the shareholder reports of the other funds. The example is based upon an investment of $1,000 invested at the beginning of the period and held for the six-month period from July 1, 2011 to December 31, 2011.
Actual Expenses
The first line of the table in each example provides information about actual account values and actual expenses. You may use the information in this line, together with the amount you invested, to estimate the expenses that you paid over the period. Simply divide your account value by $1,000 (for example, an $8,600 account value divided by $1,000 = 8.6), then multiply the result by the number in the first line under the heading entitled “Expenses Paid During Period” to estimate the expenses you paid on your account during the period.
Hypothetical Example for Comparison Purposes
The second line of the table in each example provides information about hypothetical account values and hypothetical expenses based upon each Fund’s actual expense ratio and an assumed rate of return of 5% per year before expenses, which is not the Fund’s actual return. The hypothetical account values and expenses may not be used to estimate the actual ending account balance or expenses you paid for the period. You may use this information to compare the ongoing costs of investing in each Fund and other funds. To do so, compare this 5% hypothetical example with the 5% hypothetical examples that appear in the shareholder reports of the other funds.
Janus Capital Management LLC (“Janus Capital”) has contractually agreed to waive each Fixed Income Fund’s total annual fund operating expenses, excluding any class-specific distribution and shareholder servicing (12b-1) fees (applicable to Class A Shares, Class C Shares, Class R Shares, and Class S Shares only), administrative services fees payable pursuant to the Transfer Agency Agreement (except for networking and omnibus fees), brokerage commissions, interest, dividends, taxes, acquired fund fees and expenses, and extraordinary expenses, to certain limits until at least November 1, 2012. Expenses in the examples reflect application of these waivers. Had the waivers not been in effect, your expenses would have been higher. More information regarding the waivers is available in the Funds’ prospectuses.
Janus Fixed Income & Money Market Funds | 3
(Continued) (unaudited)
Please note that the expenses shown in the tables are meant to highlight your ongoing costs only and do not reflect any transaction costs, such as redemption fees (where applicable) and any related exchange fees. These fees are fully described in the Funds’ prospectuses. Therefore, the second line of each table is useful in comparing ongoing costs only, and will not help you determine the relative total costs of owning different funds. In addition, if these transaction costs were included, your costs would have been higher.
4 | DECEMBER 31, 2011
Janus Flexible Bond Fund (unaudited)
| | | | | | | |
Fund Snapshot
We believe a bottom-up, fundamentally driven investment process that focuses on credit-oriented investments can generate risk-adjusted outperformance relative to our peers over time. Our comprehensive bottom-up view drives decision-making at a macro level, enabling us to make informed decisions about allocations to all sectors of the fixed income universe.
| | | |
Gibson Smith
co-portfolio manager | | 
Darrell Watters
co-portfolio manager |
Performance Overview
During the six-month period ended December 31, 2011, Janus Flexible Bond Fund’s Class T Shares returned 3.30%, compared to a 4.98% return for the Fund’s benchmark, the Barclays Capital U.S. Aggregate Bond Index.
Portfolio Manager Comments
The volatility in the bond markets has been mind-numbing at times, and a wake-up call to investors that key risks to the economy remain in place. We saw this reflected in the flight to safety that sent Treasury yields to near-record lows in 2011. Quite simply, the world has too much debt and not enough growth, and we are grinding through a deleveraging period that will be more painful and last longer than most investors anticipate. Unfortunately, we have also entered a period where policy actions are not necessarily effective in terms of stabilizing the imbalance and returning us to a more normal environment.
If there’s a theme for 2012 it’s that investors should get used to low rates. The Federal Reserve (Fed) has said that it expects to keep interest rates near zero into late 2014. The question now is whether the Fed will undertake a third round of quantitative easing (QE3) this year. We think the Fed isn’t ready to shoot this bullet yet, but will respond if it sees economic weakness or significant dislocation in the financial markets. We also expect easy monetary policies and low rates in Europe, where inflation expectations are falling as growth rates decline.
We expect interest rate volatility to remain high, as a risk-on/risk-off environment continues amid lack of confidence in global fiscal policy decisions. In a world that is out of balance, the bands of potential outcomes widen, making prediction more difficult. In a general sense, we have been investing against a fairly stable macro backdrop over the last 30 years. But the world changed in 2008, and since then we’ve seen massive intervention and very unconventional policy response, forcing investors to consider outcomes that exhibit much greater volatility. As long as governments around the world exhibit leverage profiles that create uncertainty, U.S. government bonds will continue to be the flight-to-quality asset of choice, due to their liquidity and perceived high quality.
Against this backdrop, we continue to believe that corporate credit offers some of the best risk -adjusted returns in the market. We entered 2011 with a similar belief. The last year was highly volatile for credit, especially financials, which had a big impact on the market. Yet underlying fundamentals continue to improve. Profit margins are high and companies are accumulating cash on balance sheets (more than $2 trillion by some estimates). Moreover, we think there is a newfound conservatism resonating across management teams and boards in the United States and Europe. Management teams are being more careful and have not been committing capital to their businesses – beyond replacement levels – as growth remains slow and uncertainty remains high. We think this will continue through 2012, fueling more free cash flow, liquidity in the system and ultimately support for credit spreads in both investment-grade and high-yield bonds.
Investment Environment
Volatility and headline risk were central themes for fixed-income investors in the second half of 2011. A rally in U.S. Treasuries became especially pronounced from late July through September, as worry mounted that the U.S. economy might slip into a double-dip recession. Investors were troubled by below-expectation U.S. gross domestic product (GDP) growth, a manufacturing slowdown and persistently weak employment, housing and consumer spending figures. Concern about high government debt levels, both in the United States and Europe, only heightened this negative market sentiment. A high-stakes political standoff in Congress in July and August over raising the U.S. debt ceiling did nothing to improve the situation. Credit rating agency Standard & Poor’s subsequently lowered the United States’ sovereign credit rating to AA+ from AAA. The downgrade was followed, ironically, by a near stampede into U.S. Treasury
Janus Fixed Income & Money Market Funds | 5
Janus Flexible Bond Fund (unaudited)
securities, as the darkening global economic picture made Treasuries appear to be the safest haven available.
All eyes returned to Europe in the fall, as fiscal problems in the so-called PIIGS (Portugal, Italy, Ireland, Greece and Spain) countries threatened to spiral out of control. By October, it appeared that European Union (EU) leaders would manage to contain euro-zone problems, and relieved investors briefly ventured out of Treasuries in search of higher yields. But uncertainty flooded back in November, as governments in Greece and then Italy fell amid market pressure to implement fiscal reforms. The late-November failure of the U.S. Congressional “super committee” to reach a deal to cut $1.2 trillion from the U.S. deficit added to the general malaise.
In December, some headway was made in Europe, as EU leaders announced a plan in which most members would agree to stricter fiscal rules and the European Central Bank served up a larger-than-expected $641 billion in 3-year loans. This injected some calm into the markets as volume wound down for the holidays, although investors remained concerned that credit ratings would be downgraded on one or more of the 17 euro zone countries.
Meanwhile, U.S. macroeconomic data reflected a strengthening domestic economy, with signs of increased hiring and rising consumer confidence. Fears of a double-dip recession, which mounted over the summer as U.S. economic indicators weakened, had receded by the fourth quarter.
Performance Discussion
The portfolio underperformed its benchmark, the Barclays Capital U.S. Aggregate Bond Index (Agg), during 2011. Our zero-weight positioning in government agency debt and underweight allocation to the mortgage sector were the top drivers of outperformance, while our overweight to corporate credit was the primary driver of underperformance. We remained significantly overweight corporate credit at year’s end, at nearly 61% of the portfolio, compared with the Agg’s 20% exposure. In terms of sectors, chemicals, paper and pharmaceuticals were the top-performing sectors, while banking, real estate investment trusts (REITs) and non-bank commercial financial services were the worst-performing sectors.
During the second half of 2011 we reduced the portfolio’s exposure to U.S. Treasury securities to roughly 16% as of December 31 from nearly 19% at the beginning of the period. We believe that a strategic allocation to Treasuries plays a critical defensive role during periods of uncertainty, and the flight-to-safety buying that drove longer-term Treasury yields lower throughout the last six months of 2011 certainly underscored the security’s safe-haven appeal. However, in light of the U.S. government’s fiscal challenges we continue to monitor how this will play out going forward. In 2012, we expect interest rates to trade in a more range-bound fashion than they did in 2011, as discussed further below in the Outlook section. We balance our risk positions with Treasuries because we believe they offer an insurance policy against tail risk and market volatility. However, considering the high volatility in the market, we think this allocation needs to be actively managed, and we expect to reduce our allocation to take advantage of opportunities as the market presents them.
We maintained zero exposure to U.S. government agency debt throughout the period. We have long argued that since the 2008-09 financial crisis, U.S. government agencies, agency mortgages and U.S. Treasuries have converged and now move as one large U.S. government sector. We believe that corporate credit represents a better alternative, offering the best risk-adjusted returns. Our focus on security selection also offers a more effective way of capturing alpha (outperformance versus the benchmark) within corporate credit, in our opinion.
That said, we did increase our exposure to select agency mortgage-backed securities (MBS), as MBS spreads have moved significantly wider over the past six months and presented good risk/reward opportunities in our opinion. We began the period with a 6% weight to mortgages but increased our allocation to nearly 15% as of December 31, compared with 32% for the Agg. However, because MBS returns trailed the Agg during the second half of the year, our underweight allocation proved beneficial during the time period. It’s worth noting that increasing our exposure to MBS was not a broad macroeconomic decision, but consistent with our investment process it was the result of seeking opportunities through close analysis of valuations and individual security fundamentals. Broadly speaking, when the U.S. government placed Fannie Mae and Freddie Mac into conservatorship in 2008, mortgage spreads tightened significantly compared with Treasuries, offering little potential for outperformance. The evolving dynamics within the mortgage market also made it difficult to model duration extension risk. However, over the past year both factors have eased. Particularly encouraging from our standpoint was the Federal Reserve’s announcement in September that it would reinvest maturing MBS paydowns into newly issued MBS, effectively changing the Fed from a net seller to a net buyer in the MBS market. We continue to focus on pre-pay-protected issues such as low-loan balance and seasoned pools to manage the
6 | DECEMBER 31, 2011
(unaudited)
interest rate risk inherent in the sector. Although we remain underweight MBS compared with the Agg, we stand ready to increase our allocation if it appears likely that the Federal Reserve will buy additional MBS as part of a potential QE3.
We also continued to hold small positions in commercial mortgage-backed securities (CMBS) and asset-backed securities (ABS), established in the first half of 2011, as we perceived fresh opportunities in those markets. We believe that there is opportunity for spread tightening in CMBS as the market slowly and haltingly returns to life following the financial crisis. As of December 31, CMBS accounted for 2.02% of the portfolio. As for the ABS markets, we prefer commercial ABS sectors (e.g. shipping containers, rail car leasing, timber) where we believe we have an advantage in identifying the best risk-adjusted return, given our bottom-up fundamental analysis and the coordination with our corporate credit analyst team. Although our allocation in the sector is not large, we believe that global ABS can offer good relative value – high credit quality at an attractive yield. As of December 31, ABS accounted for 0.26% of the portfolio.
Given the high levels of market volatility and economic uncertainty, we believe that individual security selection will be the most important driver of returns for bond investors. As always, we will continue to focus on opportunities that offer the best risk-adjusted returns.
Outlook
Largely because the U.S. economy is being held hostage to decisions in Europe and Washington, we expect another year of subpotential growth. We forecast U.S. gross domestic product growth of 2% in 2012, barring a worsening of the euro zone crisis and assuming that Congress extends long-term unemployment benefits and the payroll tax break until the end of the year; both are currently scheduled to expire at the end of February.
Given current high levels of productivity, we expect that hiring will continue to rise slowly as companies seek to meet essential demand. However, the modest pace will keep the unemployment rate elevated and fluctuating around the 9% level throughout the year. Excess slack in the labor market combined with slow economic growth will keep inflation from moving much higher. In our opinion, the core Consumer Price Index (CPI), excluding food and energy, will continue to accelerate through the first half of 2012, peaking at a 2.5% year-over-year growth rate before moving back below 2%. Core CPI’s recent increase has been largely due to artificial factors, including a supply/demand imbalance in the housing rental market that has pushed up owners’ equivalent rent (OER), a major component of core CPI. We believe this imbalance will correct itself. Meanwhile, producer input prices are dropping, reducing the level of price pressure in the pipeline.
This low-inflation environment would give the Federal Reserve room to continue its accommodative short-term interest rate policy. The Fed has said that it plans to keep short-term interest rates near zero through late 2014. We believe there is a 50% chance that the Fed will initiate QE3 in 2012, by buying mortgage-backed securities, if market conditions warrant. In our view the likelihood of QE3 is heavily dependent on the outcome in Europe, and may be necessary if we see continued dysfunction in Washington.
We expect global economic growth to slow to roughly 2.1% in 2012, with Europe the most challenged region worldwide. In our view Europe will be in recession next year, with growth of negative 0.5% to negative 1%. Policy risk remains high in all regions of the world. We expect inflation to decline globally as commodity prices level out and the pace of growth slows.
We believe that Treasury yields will remain relatively range-bound in 2012 due to the continued headline risk from Europe, political deadlock in Washington and automatic $1.2 trillion government spending cuts scheduled to begin in January 2013. However, we think that rates will be at the higher end of the range by the end of 2012, partly because by that point we should be on a path to stronger economic growth. The front end of the curve is anchored by the Fed’s stated intention to keep interest rates near zero until late 2014. The five-year Treasury is the pivot point and stands to benefit if the Fed implements a third round of quantitative easing. We believe that the 10-year and 30-year Treasury have little upside left, as they enjoyed a remarkable rally in 2011 but will become more vulnerable to inflation concerns the longer the Fed’s accommodative policy continues. We believe this scenario bodes well for fixed-income assets, as market participants likely will look for yield while staying away from equities due to the volatile nature of the market.
Top Detractors
AIG: American International Group (AIG), an international insurer, is a high-beta name that faced headwinds in 2011, partly due to general challenges in the financials sector and to the performance of its aircraft-leasing unit, International Lease Finance Corp. Despite the turmoil, we like AIG’s long-term deleveraging plan and
Janus Fixed Income & Money Market Funds | 7
Janus Flexible Bond Fund (unaudited)
recent track record of balance sheet focus. Its core businesses include companies with top market share in their sectors, such as Chartis and SunAmerica.
Jefferies Group: One of the last remaining independent – i.e. non-bank – brokers in the United States, Jefferies Group invested heavily in expanding its business during the credit crisis. Growing the business to include commodities and advisory services, the company has increased its headcount by more than 15%. We believe this expansion of business interest bodes well for Jefferies as merger & acquisition activity increases in the incrementally improving economy. We also like the fact that their independent status frees the company from the constraints being imposed by regulators on many of their peers, potentially providing market share gains at an important time in the economic cycle. We believe investors overreacted in distancing themselves from the company in early November in the wake of the MF Global bankruptcy. Jefferies has a highly invested management team, a well structured long-term debt profile and disciplined policies regarding sovereign debt exposure. We like that the company moved quickly to demonstrate the transparency and liquidity of its own European sovereign debt holdings to assuage investor concerns following MF Global.
Top Contributors
Pernod-Ricard: A French producer of distilled beverages, Pernod acquired Absolut Vodka in 2008 resulting in a downgrade of the company by ratings agencies. The company has demonstrated its ability to utilize free cash flow for the benefit of bondholders and remains focused on deleveraging.
International Paper: International Paper (IP), a global paper and packaging company, has been focused on deleveraging and recently acquired Temple-Inland, a corrugated packager. Strengthening its foothold in the packaging sector should make IP a more stable company going forward.
On behalf of every member of our investment team, thank you for your investment in Janus Flexible Bond Fund. We appreciate your entrusting your assets with us, and we look forward to continuing to serve your investment needs.
8 | DECEMBER 31, 2011
(unaudited)
Janus Flexible Bond Fund At A Glance
December 31, 2011
| | | |
Weighted Average Maturity | | 7.7 Years |
Average Effective Duration* | | 5.4 Years |
30-day Current Yield** | | |
| Class A Shares at NAV | | |
| Without Reimbursement | | 2.96% |
| With Reimbursement | | 2.96% |
| Class A Shares at MOP | | |
| Without Reimbursement | | 2.82% |
| With Reimbursement | | 2.82% |
| Class C Shares*** | | |
| Without Reimbursement | | 2.19% |
| With Reimbursement | | 2.19% |
| Class D Shares | | |
| Without Reimbursement | | 3.12% |
| With Reimbursement | | 3.12% |
| Class I Shares | | |
| Without Reimbursement | | 3.17% |
| With Reimbursement | | 3.17% |
| Class R Shares | | |
| Without Reimbursement | | 2.51% |
| With Reimbursement | | 2.51% |
| Class S Shares | | |
| Without Reimbursement | | 2.75% |
| With Reimbursement | | 2.75% |
| Class T Shares | | |
| Without Reimbursement | | 3.00% |
| With Reimbursement | | 3.00% |
Number of Bonds/Notes | | 319 |
| | | |
| * | | A theoretical measure of price volatility |
| ** | | Yield will fluctuate |
| *** | | Does not include the 1.00% contingent deferred sales charge. |
Ratings†Summary – (% of Investment Securities)
December 31, 2011
| | | |
AAA | | 0.7% |
AA | | 35.1% |
A | | 13.8% |
BBB | | 33.0% |
BB | | 13.7% |
B | | 1.2% |
Other | | 2.5% |
| | | |
| † | | Rated by Standard & Poor’s |
Significant Areas of Investment – (% of Net Assets)
As of December 31, 2011
Asset Allocation – (% of Net Assets)
As of December 31, 2011
Emerging markets comprised 0.8% of total net assets.
Janus Fixed Income & Money Market Funds | 9
Janus Flexible Bond Fund (unaudited)
| | | | | | | | | | | | | | | | |
| Average Annual Total Return – for the periods ended December 31, 2011 | | | Expense Ratios – per the October 28, 2011 prospectuses |
| | | Fiscal
| | One
| | Five
| | Ten
| | Since
| | | Total Annual Fund
| | Net Annual Fund
|
| | | Year-to-Date | | Year | | Year | | Year | | Inception* | | | Operating Expenses | | Operating Expenses |
| | | | | | | | | | | | | | | | |
| Janus Flexible Bond Fund – Class A Shares | | | | | | | | | | | | | | | |
| | | | | | | | | | | | | | | | |
| NAV | | 3.27% | | 6.45% | | 7.72% | | 6.43% | | 7.52% | | | 0.77% | | 0.77% |
| | | | | | | | | | | | | | | | |
| MOP | | –1.67% | | 1.38% | | 6.68% | | 5.92% | | 7.31% | | | | | |
| | | | | | | | | | | | | | | | |
| Janus Flexible Bond Fund – Class C Shares | | | | | | | | | | | | | | | |
| | | | | | | | | | | | | | | | |
| NAV | | 2.77% | | 5.64% | | 6.98% | | 5.73% | | 6.85% | | | 1.52% | | 1.52% |
| | | | | | | | | | | | | | | | |
| CDSC | | 1.77% | | 4.63% | | 6.98% | | 5.73% | | 6.85% | | | | | |
| | | | | | | | | | | | | | | | |
Janus Flexible Bond Fund –
Class D Shares(1) | | 3.36% | | 6.63% | | 7.82% | | 6.48% | | 7.55% | | | 0.60% | | 0.60% |
| | | | | | | | | | | | | | | | |
| Janus Flexible Bond Fund – Class I Shares | | 3.38% | | 6.66% | | 7.77% | | 6.46% | | 7.54% | | | 0.59% | | 0.56% |
| | | | | | | | | | | | | | | | |
| Janus Flexible Bond Fund – Class R Shares | | 3.04% | | 5.98% | | 7.27% | | 5.99% | | 7.12% | | | 1.21% | | 1.21% |
| | | | | | | | | | | | | | | | |
| Janus Flexible Bond Fund – Class S Shares | | 3.17% | | 6.24% | | 7.54% | | 6.24% | | 7.38% | | | 0.96% | | 0.96% |
| | | | | | | | | | | | | | | | |
| Janus Flexible Bond Fund – Class T Shares | | 3.30% | | 6.50% | | 7.77% | | 6.46% | | 7.54% | | | 0.71% | | 0.71% |
| | | | | | | | | | | | | | | | |
| Barclays Capital U.S. Aggregate Bond Index | | 4.98% | | 7.84% | | 6.50% | | 5.78% | | 7.34%** | | | | | |
| | | | | | | | | | | | | | | | |
| Lipper Quartile – Class T Shares | | – | | 2nd | | 1st | | 1st | | 1st | | | | | |
| | | | | | | | | | | | | | | | |
| Lipper Ranking – based on total returns for Intermediate Investment Grade Debt Funds | | – | | 299/597 | | 26/424 | | 24/293 | | 3/22 | | | | | |
| | | | | | | | | | | | | | | | |
| Visit janus.com/advisor/mutual-funds (or janus.com/allfunds if you hold Shares directly with Janus Capital) to view current performance and characteristic information | | | | | |
| | | | | | | | | | | | | | | | |
Data presented represents past performance, which is no guarantee of future results. Investment results and principal value will fluctuate so that shares, when redeemed, may be worth more or less than their original cost. Due to market volatility, current performance may be higher or lower than the performance shown. Call 877.33JANUS(52687) (or 800.525.3713 if you hold shares directly with Janus Capital) or visit janus.com/advisor/mutual-funds (or janus.com/allfunds if you hold shares directly with Janus Capital) for performance current to the most recent month-end.
Performance shown for Class A Shares at Maximum Offering Price (MOP) includes the Fund’s maximum sales charge of 4.75%. Performance shown at Net Asset Value (NAV) does not include this charge and would have been lower had this charge been taken into account.
See important disclosures on the next page.
10 | DECEMBER 31, 2011
(unaudited)
Performance shown for Class C Shares includes a 1% contingent deferred sales charge (CDSC) on periods of less than 12 months. Performance shown at Net Asset Value (NAV) does not include this sales charge and would have been lower had this sales charge been taken into account.
Janus Capital has contractually agreed to waive the Fund’s total annual fund operating expenses allocated to any class (excluding the distribution and shareholder servicing fees (applicable to Class A Shares, Class C Shares, Class R Shares and Class S Shares), administrative services fees payable pursuant to the Transfer Agency Agreement (except for networking and omnibus fees), brokerage commissions, interest, dividends, taxes, acquired fund fees and expenses, and extraordinary expenses) to certain limits until at least November 1, 2012. The contractual waiver may be terminated or modified prior to this date only at the discretion of the Board of Trustees. Returns shown include fee waivers, if any, and without such waivers, returns would have been lower.
The expense information shown was determined based on net assets as of the fiscal period ended June 30, 2011. The effect of contractual waivers agreed to by Janus Capital, when applicable, are reflected under “Net Annual Fund Operating Expenses.” (All expenses are shown without the effect of expense offset arrangements. Pursuant to such arrangements, credits realized as a result of uninvested cash balances are used to reduce custodian and transfer agent expenses.)
The Fund’s performance may be affected by risks that include those associated with non-investment grade debt securities, investments in specific industries or countries and potential conflicts of interest with the Janus “funds of funds.” Additional risks to the Fund may include those associated with investing in foreign securities, emerging markets, initial public offerings (“IPOs”), real estate investment trusts (“REITs”), and derivatives. Please see a Janus prospectus or janus.com/info (or janus.com/reports if you hold shares directly with Janus Capital) for more information about risks, portfolio holdings and other details.
Funds that invest in bonds have the same interest rate, inflation, and credit risks that are associated with the underlying bonds owned by the Fund. Unlike owning individual bonds, there are ongoing fees and expenses associated with owning shares of Fixed Income Funds. The return of principal is not guaranteed due to net asset value fluctuation that is caused by changes in the price of specific bonds held in the Fund and selling of bonds within the Fund by the portfolio managers.
The Fund invests in mortgage-backed securities. Mortgage-backed securities are subject to prepayment risk (early payoff of mortgages during periods of declining interest rates) and extension risk (extending the duration of mortgage-backed securities during periods of rising interest rates). These risks may increase the volatility of these securities and affect total returns.
High-yield/high-risk bonds, also known as “junk” bonds, involve a greater risk of default and price volatility than investment grade bonds. High-yield/high-risk bonds can experience sudden and sharp price swings which will affect net asset value.
The Fund invests in REITs, which may be subject to a higher degree of market risk because of concentration in a specific industry, sector or geographic region. REITs may be subject to risks including, but not limited to: legal, political, liquidity, and interest rate risks, a decline in the value of real estate, risks related to general and economic conditions, changes in the value of the underlying property owned by the trust and defaults by borrowers. To the extent the Fund invests in foreign REITs, the Fund may be subject to fluctuations in currency rates or political or economic conditions in a particular country.
The Fund may invest in derivatives which can be highly volatile and involve additional risks than if the underlying securities were held directly by the Fund. Such risks include gains or losses which, as a result of leverage, can be substantially greater than the derivatives’ original cost. There is also a possibility that derivatives may not perform as intended which can reduce opportunity for gains or result in losses by offsetting positive returns in other securities the Fund owns.
The Fund will normally invest at least 80% of its net assets, measured at the time of purchase, in the type of securities described by its name.
Returns include reinvestment of dividends from net investment income and distributions from capital gains. The returns shown do not reflect the deduction of taxes that a shareholder would pay on Fund distributions or the redemption of Fund shares. The returns do not include adjustments in accordance with generally accepted accounting principles required at the period end for financial reporting purposes.
Class A Shares, Class C Shares, Class R Shares, and Class S Shares of the Fund commenced operations on July 6, 2009. The historical performance shown for periods prior to July 6, 2009 reflects the performance of one or more other share classes of the Fund, calculated using the fees and expenses of each respective share class without the effect of any fee and expense limitations and waivers. If each share class of the Fund had been available during periods prior to July 6, 2009, the performance shown may have been different. Please refer to the Fund’s prospectus for further details concerning historical performance.
Class D Shares of the Fund commenced operations on February 16, 2010, as a result of the restructuring of Class J Shares, the predecessor share class. The performance shown for Class D Shares for periods prior to February 16, 2010 reflects the performance of the Fund’s former Class J Shares. If Class D Shares of the Fund had been available during periods prior to February 16, 2010, the performance shown may have been different. The performance shown for periods following the Fund’s commencement of Class D Shares reflects the fees and expenses of Class D Shares, net of any fee and expense limitations or waivers.
Class I Shares commenced operations on July 6, 2009. Performance shown for Class I Shares for periods prior to July 6, 2009, reflects the performance of the Fund’s Class J Shares, the initial share class, calculated using the fees and expenses of Class J Shares, without the effect of any fee and expense limitations or waivers. If Class I Shares of the Fund had been available during periods prior to July 6, 2009, the performance shown may have been different. The performance shown for periods following the Fund’s commencement of Class I Shares reflects the fees and expenses of Class I Shares, net of any fee and expense limitations or waivers.
Lipper, a wholly-owned subsidiary of Thomson Reuters, provides independent insight on global collective investments including mutual funds, retirement funds, hedge funds, fund fees and expenses to the asset management and media communities. Lipper ranks the performance of mutual funds within a classification of funds that have similar investment objectives. Rankings are historical with capital gains and dividends reinvested and do not include the effect of loads.
Janus Fixed Income & Money Market Funds | 11
Janus Flexible Bond Fund (unaudited)
Ranking is for Class T Shares only; other classes may have different performance characteristics. When an expense waiver is in effect, it may have a material effect on the total return or yield, and therefore the ranking for the period.
July 9, 1987 is the date used to calculate the since-inception Lipper ranking, which is slightly different from when the Fund began operations since Lipper provides fund rankings as of the last day of the month or the first Thursday after fund inception.
There is no assurance that the investment process will consistently lead to successful investing.
See Notes to Schedules of Investments for index definitions.
The Fund’s portfolio may differ significantly from the securities held in the index. The index is unmanaged and is not available for direct investment; therefore, its performance does not reflect the expenses associated with the active management of an actual portfolio.
See “Explanations of Charts, Tables and Financial Statements.”
| | | |
| * | | The Fund’s inception date – July 7, 1987. |
| ** | | The Barclays Capital U.S. Aggregate Bond Index’s since inception returns are calculated from June 30, 1987. |
| (1) | | Closed to new investors. |
The examples below show you the ongoing costs (in dollars) of investing in your Fund and allow you to compare these costs with those of other mutual funds. Please refer to the section Useful Information About Your Fund Report for a detailed explanation of the information presented in these charts.
| | | | | | | | | | | | | | | |
| | | Beginning Account Value
| | Ending Account Value
| | Expenses Paid During Period
| | |
| Expense Example – Class A Shares | | (7/1/11) | | (12/31/11) | | (7/1/11 - 12/31/11)† | | |
| |
| |
| Actual | | $ | 1,000.00 | | | $ | 1,032.80 | | | $ | 3.83 | | | |
| |
| |
Hypothetical
(5% return before expenses) | | $ | 1,000.00 | | | $ | 1,021.37 | | | $ | 3.81 | | | |
| |
| |
| | | | | | | | | | | | | | | |
| | | | | | | | | | | | | | | |
| | | Beginning Account Value
| | Ending Account Value
| | Expenses Paid During Period
| | |
| Expense Example – Class C Shares | | (7/1/11) | | (12/31/11) | | (7/1/11 - 12/31/11)† | | |
| |
| |
| Actual | | $ | 1,000.00 | | | $ | 1,028.70 | | | $ | 7.80 | | | |
| |
| |
Hypothetical
(5% return before expenses) | | $ | 1,000.00 | | | $ | 1,017.45 | | | $ | 7.76 | | | |
| |
| |
| | | | | | | | | | | | | | | |
| | | | | | | | | | | | | | | |
| | | Beginning Account Value
| | Ending Account Value
| | Expenses Paid During Period
| | |
| Expense Example – Class D Shares | | (7/1/11) | | (12/31/11) | | (7/1/11 - 12/31/11)† | | |
| |
| |
| Actual | | $ | 1,000.00 | | | $ | 1,033.60 | | | $ | 2.96 | | | |
| |
| |
Hypothetical
(5% return before expenses) | | $ | 1,000.00 | | | $ | 1,022.22 | | | $ | 2.95 | | | |
| |
| |
| | | | | | | | | | | | | | | |
| | | | | | | | | | | | | | | |
| | | Beginning Account Value
| | Ending Account Value
| | Expenses Paid During Period
| | |
| Expense Example – Class I Shares | | (7/1/11) | | (12/31/11) | | (7/1/11 - 12/31/11)† | | |
| |
| |
| Actual | | $ | 1,000.00 | | | $ | 1,033.80 | | | $ | 2.76 | | | |
| |
| |
Hypothetical
(5% return before expenses) | | $ | 1,000.00 | | | $ | 1,022.42 | | | $ | 2.75 | | | |
| |
| |
| | | | | | | | | | | | | | | |
| | | | | | | | | | | | | | | |
| | | Beginning Account Value
| | Ending Account Value
| | Expenses Paid During Period
| | |
| Expense Example – Class R Shares | | (7/1/11) | | (12/31/11) | | (7/1/11 - 12/31/11)† | | |
| |
| |
| Actual | | $ | 1,000.00 | | | $ | 1,030.40 | | | $ | 6.12 | | | |
| |
| |
Hypothetical
(5% return before expenses) | | $ | 1,000.00 | | | $ | 1,019.10 | | | $ | 6.09 | | | |
| |
| |
| | | | | | | | | | | | | | | |
| | | | | | | | | | | | | | | |
| | | Beginning Account Value
| | Ending Account Value
| | Expenses Paid During Period
| | |
| Expense Example – Class S Shares | | (7/1/11) | | (12/31/11) | | (7/1/11 - 12/31/11)† | | |
| |
| |
| Actual | | $ | 1,000.00 | | | $ | 1,031.70 | | | $ | 4.85 | | | |
| |
| |
Hypothetical
(5% return before expenses) | | $ | 1,000.00 | | | $ | 1,020.36 | | | $ | 4.82 | | | |
| |
| |
| | | | | | | | | | | | | | | |
| | | | | | | | | | | | | | | |
| | | Beginning Account Value
| | Ending Account Value
| | Expenses Paid During Period
| | |
| Expense Example – Class T Shares | | (7/1/11) | | (12/31/11) | | (7/1/11 - 12/31/11)† | | |
| |
| |
| Actual | | $ | 1,000.00 | | | $ | 1,033.00 | | | $ | 3.58 | | | |
| |
| |
Hypothetical
(5% return before expenses) | | $ | 1,000.00 | | | $ | 1,021.62 | | | $ | 3.56 | | | |
| |
| |
| | | |
| † | | Expenses are equal to the annualized expense ratio of 0.75% for Class A Shares, 1.53% for Class C Shares, 0.58% for Class D Shares, 0.54% for Class I Shares, 1.20% for Class R Shares, 0.95% for Class S Shares and 0.70% for Class T Shares multiplied by the average account value over the period, multiplied by 184/366 (to reflect the one-half year period). Expenses include effect of contractual waivers by Janus Capital. |
12 | DECEMBER 31, 2011
Janus Flexible Bond Fund
Schedule of Investments (unaudited)
As of December 31, 2011
| | | | | | | | | | | |
| Shares or Principal Amount | | Value | | | |
| |
| Asset-Backed/Commercial Mortgage-Backed Securities – 2.5% | | | | | | |
| $ | 6,940,000 | | | Bear Stearns Commercial Mortgage Securities
5.5370%, 10/12/41 | | $ | 7,791,302 | | | |
| | 8,594,078 | | | CLI Funding LLC
4.9400%, 10/15/26 (144A),‡ | | | 8,429,450 | | | |
| | 6,197,000 | | | Commercial Mortgage Pass Through Certificates
5.8137%, 12/10/49‡ | | | 6,917,246 | | | |
| | 6,280,000 | | | FREMF Mortgage Trust
4.7268%, 1/25/21 (144A),‡ | | | 5,393,672 | | | |
| | 4,052,000 | | | FREMF Mortgage Trust
5.1587%, 4/25/21 (144A),‡ | | | 3,622,877 | | | |
| | 7,387,000 | | | FREMF Mortgage Trust
4.9329%, 7/25/21‡ | | | 6,456,238 | | | |
| | 4,186,000 | | | FREMF Mortgage Trust
4.7507%, 10/25/21 (144A),‡ | | | 3,540,996 | | | |
| | 9,135,000 | | | FREMF Mortgage Trust
4.7705%, 4/25/44 (144A),‡ | | | 8,444,677 | | | |
| | 11,848,000 | | | FREMF Mortgage Trust
4.8868%, 7/25/44 (144A),‡ | | | 10,969,009 | | | |
| | 6,322,000 | | | GS Mortgage Securities Corp. II
5.5600%, 11/10/39 | | | 6,940,943 | | | |
| | 3,856,000 | | | JPMorgan Chase Commercial Mortgage Securities Corp.
3.3638%, 11/13/16 (144A),‡ | | | 3,894,868 | | | |
| | 10,357,000 | | | JPMorgan Chase Commercial Mortgage Securities Corp.
3.6620%, 7/5/24 (144A) | | | 10,620,037 | | | |
| | 4,012,000 | | | JPMorgan Chase Commercial Mortgage Securities Corp.
5.6330%, 12/5/27 (144A) | | | 4,561,471 | | | |
| | 4,012,000 | | | JPMorgan Chase Commercial Mortgage Securities Corp.
5.8748%, 4/15/45‡ | | | 4,502,792 | | | |
| | 6,068,000 | | | Morgan Stanley Capital I
3.8840%, 2/15/16 (144A) | | | 6,376,412 | | | |
| | 4,000,000 | | | Oxbow Resources LLC
4.9690%, 5/1/36 (144A) | | | 4,071,200 | | | |
| | 3,350,000 | | | SLM Student Loan Trust
4.3700%, 4/17/28 (144A) | | | 3,401,742 | | | |
| | 3,553,000 | | | SLM Student Loan Trust
2.7783%, 1/15/43 (144A),‡ | | | 3,401,718 | | | |
| |
| |
| Total Asset-Backed/Commercial Mortgage-Backed Securities (cost $109,240,408) | | | 109,336,650 | | | |
| |
| |
| Bank Loans – 0.6% | | | | | | |
| Auction House – Art Dealer – 0.1% | | | | | | |
| | 5,984,925 | | | KAR Auction Services, Inc.
5.0000%, 5/19/17‡ | | | 5,892,638 | | | |
| Electric – Generation – 0.2% | | | | | | |
| | 6,262,675 | | | AES Corp.
4.2500%, 6/1/18‡ | | | 6,233,742 | | | |
| Food – Miscellaneous/Diversified – 0.2% | | | | | | |
| | 10,110,193 | | | Del Monte Foods Co.
4.5000%, 3/8/18‡ | | | 9,579,407 | | | |
| Telecommunication Equipment – 0.1% | | | | | | |
| | 3,682,175 | | | CommScope, Inc.
5.0000%, 1/14/18‡ | | | 3,647,194 | | | |
| |
| |
| Total Bank Loans (cost $25,945,282) | | | 25,352,981 | | | |
| |
| |
| Corporate Bonds – 60.7% | | | | | | |
| Advertising Services – 0.4% | | | | | | |
| | 9,515,000 | | | WPP Finance UK
8.0000%, 9/15/14 | | | 10,598,844 | | | |
| | 5,812,000 | | | WPP Finance UK
4.7500%, 11/21/21 (144A) | | | 5,769,654 | | | |
| | | | | | | | 16,368,498 | | | |
| Aerospace and Defense – Equipment – 0.8% | | | | | | |
| | 15,951,000 | | | Exelis, Inc.
4.2500%, 10/1/16 (144A) | | | 16,094,559 | | | |
| | 16,248,000 | | | Exelis, Inc.
5.5500%, 10/1/21 (144A) | | | 16,963,237 | | | |
| | | | | | | | 33,057,796 | | | |
| Agricultural Chemicals – 1.1% | | | | | | |
| | 20,407,000 | | | CF Industries, Inc.
6.8750%, 5/1/18 | | | 23,366,015 | | | |
| | 7,245,000 | | | CF Industries, Inc.
7.1250%, 5/1/20 | | | 8,567,212 | | | |
| | 6,439,000 | | | Incitec Pivot, Ltd.
4.0000%, 12/7/15 (144A) | | | 6,570,671 | | | |
| | 4,121,000 | | | Mosaic Co.
3.7500%, 11/15/21 | | | 4,163,830 | | | |
| | 4,250,000 | | | Mosaic Co.
4.8750%, 11/15/41 | | | 4,393,310 | | | |
| | | | | | | | 47,061,038 | | | |
| Airlines – 0.3% | | | | | | |
| | 3,755,000 | | | Southwest Airlines Co.
5.2500%, 10/1/14 | | | 4,007,411 | | | |
| | 10,319,000 | | | Southwest Airlines Co.
5.1250%, 3/1/17 | | | 10,875,359 | | | |
| | | | | | | | 14,882,770 | | | |
| Beverages – Wine and Spirits – 1.9% | | | | | | |
| | 49,721,000 | | | Pernod-Ricard S.A.
5.7500%, 4/7/21 (144A) | | | 56,095,282 | | | |
| | 25,203,000 | | | Pernod-Ricard S.A.
4.4500%, 1/15/22 (144A) | | | 26,402,285 | | | |
| | | | | | | | 82,497,567 | | | |
| Brewery – 0.3% | | | | | | |
| | 12,832,000 | | | Anheuser-Busch InBev Worldwide, Inc.
1.5000%, 7/14/14 | | | 12,923,710 | | | |
| Building – Residential and Commercial – 0.1% | | | | | | |
| | 4,876,000 | | | MDC Holdings, Inc.
5.3750%, 12/15/14 | | | 5,045,178 | | | |
| Building Products – Cement and Aggregate – 0.4% | | | | | | |
| | 2,416,000 | | | CRH America, Inc.
4.1250%, 1/15/16 | | | 2,412,151 | | | |
| | 2,565,000 | | | CRH America, Inc.
5.7500%, 1/15/21 | | | 2,615,041 | | | |
| | 11,732,000 | | | Hanson, Ltd.
6.1250%, 8/15/16 | | | 11,907,980 | | | |
| | | | | | | | 16,935,172 | | | |
See Notes to Schedules of Investments and Financial Statements.
Janus Fixed Income & Money Market Funds | 13
Janus Flexible Bond Fund
Schedule of Investments (unaudited)
As of December 31, 2011
| | | | | | | | | | | |
| Shares or Principal Amount | | Value | | | |
| |
| Cable/Satellite Television – 0.4% | | | | | | |
| $ | 13,962,000 | | | Comcast Corp.
5.1500%, 3/1/20 | | $ | 15,878,033 | | | |
| Chemicals – Diversified – 1.2% | | | | | | |
| | 14,798,000 | | | Lyondell Chemical Co.
8.0000%, 11/1/17 | | | 16,166,815 | | | |
| | 10,624,397 | | | Lyondell Chemical Co.
11.0000%, 5/1/18 | | | 11,607,154 | | | |
| | 23,695,000 | | | LyondellBasell Industries N.V.
6.0000%, 11/15/21 (144A) | | | 24,583,562 | | | |
| | | | | | | | 52,357,531 | | | |
| Chemicals – Specialty – 1.3% | | | | | | |
| | 9,653,000 | | | Ashland, Inc.
9.1250%, 6/1/17 | | | 10,763,095 | | | |
| | 20,809,000 | | | Ecolab, Inc.
3.0000%, 12/8/16 | | | 21,525,037 | | | |
| | 17,732,000 | | | Ecolab, Inc.
4.3500%, 12/8/21 | | | 18,935,808 | | | |
| | 5,188,000 | | | Ecolab, Inc.
5.5000%, 12/8/41 | | | 5,749,041 | | | |
| | | | | | | | 56,972,981 | | | |
| Coatings and Paint Products – 0.2% | | | | | | |
| | 18,000 | | | RPM International, Inc.
6.2500%, 12/15/13 | | | 19,196 | | | |
| | 10,103,000 | | | RPM International, Inc.
6.1250%, 10/15/19 | | | 10,981,224 | | | |
| | | | | | | | 11,000,420 | | | |
| Commercial Banks – 2.8% | | | | | | |
| | 4,816,000 | | | Abbey National Treasury Services PLC
2.0022%, 4/25/14‡ | | | 4,384,405 | | | |
| | 10,054,000 | | | American Express Bank FSB
5.5000%, 4/16/13 | | | 10,508,974 | | | |
| | 32,707,000 | | | Bank of Montreal
2.6250%, 1/25/16 (144A) | | | 33,762,324 | | | |
| | 14,928,000 | | | CIT Group, Inc.
5.2500%, 4/1/14 (144A) | | | 14,872,020 | | | |
| | 12,062,000 | | | HSBC Bank USA
4.8750%, 8/24/20 | | | 11,192,764 | | | |
| | 14,427,000 | | | Standard Chartered PLC
3.2000%, 5/12/16 (144A) | | | 14,117,238 | | | |
| | 16,460,000 | | | SVB Financial Group
5.3750%, 9/15/20 | | | 16,862,924 | | | |
| | 12,466,000 | | | Zions Bancorp.
7.7500%, 9/23/14 | | | 13,217,575 | | | |
| | | | | | | | 118,918,224 | | | |
| Commercial Services – Finance – 0.3% | | | | | | |
| | 12,944,000 | | | Western Union Co.
3.6500%, 8/22/18 | | | 13,271,354 | | | |
| Computer Services – 0.2% | | | | | | |
| | 6,500,000 | | | International Business Machines Corp.
2.9000%, 11/1/21 | | | 6,700,486 | | | |
| Computers – Memory Devices – 0.3% | | | | | | |
| | 10,695,000 | | | Seagate Technology
10.0000%, 5/1/14 (144A) | | | 12,098,719 | | | |
| Consulting Services – 1.3% | | | | | | |
| | 10,327,000 | | | Verisk Analytics, Inc.
4.8750%, 1/15/19 | | | 10,418,910 | | | |
| | 41,102,000 | | | Verisk Analytics, Inc.
5.8000%, 5/1/21 | | | 44,246,057 | | | |
| | | | | | | | 54,664,967 | | | |
| Containers – Metal and Glass – 0.1% | | | | | | |
| | 3,401,000 | | | Ball Corp.
7.1250%, 9/1/16 | | | 3,698,587 | | | |
| Containers – Paper and Plastic – 0.3% | | | | | | |
| | 4,152,000 | | | Sonoco Products Co.
4.3750%, 11/1/21 | | | 4,300,529 | | | |
| | 7,212,000 | | | Sonoco Products Co.
5.7500%, 11/1/40 | | | 7,705,972 | | | |
| | | | | | | | 12,006,501 | | | |
| Data Processing and Management – 0.5% | | | | | | |
| | 10,990,000 | | | Fiserv, Inc.
3.1250%, 10/1/15 | | | 11,258,178 | | | |
| | 4,114,000 | | | Fiserv, Inc.
3.1250%, 6/15/16 | | | 4,188,846 | | | |
| | 4,117,000 | | | Fiserv, Inc.
4.7500%, 6/15/21 | | | 4,307,358 | | | |
| | | | | | | | 19,754,382 | | | |
| Diversified Banking Institutions – 2.8% | | | | | | |
| | 16,644,000 | | | Bank of America Corp.
4.5000%, 4/1/15 | | | 16,061,227 | | | |
| | 7,122,000 | | | Citigroup, Inc.
5.0000%, 9/15/14 | | | 7,048,700 | | | |
| | 6,058,000 | | | Citigroup, Inc.
4.8750%, 5/7/15 | | | 5,983,681 | | | |
| | 4,194,000 | | | Citigroup, Inc.
4.5000%, 1/14/22 | | | 4,034,725 | | | |
| | 3,404,000 | | | Goldman Sachs Group, Inc.
3.7000%, 8/1/15 | | | 3,334,912 | | | |
| | 10,313,000 | | | Goldman Sachs Group, Inc.
3.6250%, 2/7/16 | | | 9,964,658 | | | |
| | 8,408,000 | | | Goldman Sachs Group, Inc.
5.2500%, 7/27/21 | | | 8,202,340 | | | |
| | 9,385,000 | | | JPMorgan Chase & Co.
6.0000%, 1/15/18 | | | 10,470,647 | | | |
| | 11,550,000 | | | JPMorgan Chase & Co.
4.2500%, 10/15/20 | | | 11,631,116 | | | |
| | 10,310,000 | | | Morgan Stanley
4.0000%, 7/24/15 | | | 9,668,223 | | | |
| | 7,596,000 | | | Morgan Stanley
3.4500%, 11/2/15 | | | 6,993,569 | | | |
| | 13,590,000 | | | Morgan Stanley
5.6250%, 9/23/19 | | | 12,585,414 | | | |
| | 5,175,000 | | | Royal Bank of Scotland PLC
3.9500%, 9/21/15 | | | 4,852,618 | | | |
| | 12,085,000 | | | Royal Bank of Scotland PLC
4.3750%, 3/16/16 | | | 11,529,005 | | | |
| | | | | | | | 122,360,835 | | | |
| Diversified Financial Services – 1.8% | | | | | | |
| | 3,931,000 | | | General Electric Capital Corp.
4.8000%, 5/1/13 | | | 4,115,293 | | | |
| | 5,524,000 | | | General Electric Capital Corp.
5.9000%, 5/13/14 | | | 6,049,620 | | | |
See Notes to Schedules of Investments and Financial Statements.
14 | DECEMBER 31, 2011
Schedule of Investments (unaudited)
As of December 31, 2011
| | | | | | | | | | | |
| Shares or Principal Amount | | Value | | | |
| |
| Diversified Financial Services – (continued) | | | | | | |
| | | | | | | | | | | |
| $ | 26,309,000 | | | General Electric Capital Corp.
6.0000%, 8/7/19 | | $ | 30,219,254 | | | |
| | 21,957,000 | | | General Electric Capital Corp.
5.5000%, 1/8/20 | | | 24,159,111 | | | |
| | 14,186,000 | | | General Electric Capital Corp.
4.6500%, 10/17/21 | | | 14,805,460 | | | |
| | | | | | | | 79,348,738 | | | |
| Diversified Minerals – 0.4% | | | | | | |
| | 3,737,000 | | | Teck Resources, Ltd.
7.0000%, 9/15/12 | | | 3,879,178 | | | |
| | 3,322,000 | | | Teck Resources, Ltd.
9.7500%, 5/15/14 | | | 3,903,911 | | | |
| | 10,076,000 | | | Teck Resources, Ltd.
10.2500%, 5/15/16 | | | 11,587,400 | | | |
| | | | | | | | 19,370,489 | | | |
| Diversified Operations – 0.6% | | | | | | |
| | 8,331,000 | | | Danaher Corp.
2.3000%, 6/23/16 | | | 8,659,142 | | | |
| | 15,362,000 | | | Tyco Electronics Group S.A.
6.0000%, 10/1/12 | | | 15,901,037 | | | |
| | | | | | | | 24,560,179 | | | |
| Diversified Operations – Commercial Services – 0.2% | | | | | | |
| | 8,138,000 | | | ARAMARK Corp.
8.5000%, 2/1/15 | | | 8,341,450 | | | |
| Electric – Generation – 0.1% | | | | | | |
| | 2,519,000 | | | AES Corp.
7.7500%, 10/15/15 | | | 2,739,413 | | | |
| Electric – Integrated – 2.8% | | | | | | |
| | 7,655,000 | | | Calpine Construction Finance Co. L.P.
8.0000%, 6/1/16 (144A) | | | 8,267,400 | | | |
| | 6,297,000 | | | CMS Energy Corp.
1.3531%, 1/15/13‡ | | | 6,234,030 | | | |
| | 13,514,000 | | | CMS Energy Corp.
4.2500%, 9/30/15 | | | 13,658,573 | | | |
| | 10,060,000 | | | CMS Energy Corp.
5.0500%, 2/15/18 | | | 10,034,870 | | | |
| | 4,222,000 | | | Florida Power Corp.
3.1000%, 8/15/21 | | | 4,319,790 | | | |
| | 9,593,000 | | | Great Plains Energy, Inc.
4.8500%, 6/1/21 | | | 10,055,661 | | | |
| | 6,554,000 | | | Monongahela Power Co.
6.7000%, 6/15/14 | | | 7,267,409 | | | |
| | 2,032,000 | | | Pacific Gas & Electric Co.
3.2500%, 9/15/21 | | | 2,061,901 | | | |
| | 42,008,000 | | | PPL Energy Supply LLC
4.6000%, 12/15/21 | | | 42,600,271 | | | |
| | 5,745,000 | | | PPL WEM Holdings PLC
3.9000%, 5/1/16 (144A) | | | 5,758,828 | | | |
| | 2,235,000 | | | San Diego Gas & Electric Co.
3.0000%, 8/15/21 | | | 2,298,476 | | | |
| | 6,079,000 | | | Virginia Electric and Power Co.
5.1000%, 11/30/12 | | | 6,314,282 | | | |
| | 4,086,000 | | | Wisconsin Electric Power Co.
2.9500%, 9/15/21 | | | 4,164,480 | | | |
| | | | | | | | 123,035,971 | | | |
| Electronic Components – Semiconductors – 1.2% | | | | | | |
| | 6,451,000 | | | National Semiconductor Corp.
6.1500%, 6/15/12 | | | 6,609,127 | | | |
| | 19,093,000 | | | National Semiconductor Corp.
3.9500%, 4/15/15 | | | 20,624,163 | | | |
| | 13,405,000 | | | National Semiconductor Corp.
6.6000%, 6/15/17 | | | 16,464,973 | | | |
| | 7,714,000 | | | Texas Instruments, Inc.
2.3750%, 5/16/16 | | | 8,035,450 | | | |
| | | | | | | | 51,733,713 | | | |
| Electronic Connectors – 0.4% | | | | | | |
| | 15,790,000 | | | Amphenol Corp.
4.7500%, 11/15/14 | | | 16,918,511 | | | |
| Electronic Measuring Instruments – 0.4% | | | | | | |
| | 4,927,000 | | | Agilent Technologies, Inc.
2.5000%, 7/15/13 | | | 4,973,531 | | | |
| | 13,976,000 | | | FLIR Systems, Inc.
3.7500%, 9/1/16 | | | 13,923,352 | | | |
| | | | | | | | 18,896,883 | | | |
| Electronics – Military – 0.8% | | | | | | |
| | 16,620,000 | | | L-3 Communications Corp.
6.3750%, 10/15/15 | | | 17,035,500 | | | |
| | 4,652,000 | | | L-3 Communications Corp.
5.2000%, 10/15/19 | | | 4,719,082 | | | |
| | 13,722,000 | | | L-3 Communications Corp.
4.7500%, 7/15/20 | | | 13,558,022 | | | |
| | | | | | | | 35,312,604 | | | |
| Enterprise Software/Services – 0.2% | | | | | | |
| | 7,962,000 | | | BMC Software, Inc.
7.2500%, 6/1/18 | | | 9,181,707 | | | |
| Finance – Auto Loans – 1.5% | | | | | | |
| | 5,176,000 | | | Ford Motor Credit Co. LLC
7.5000%, 8/1/12 | | | 5,342,248 | | | |
| | 36,353,000 | | | Ford Motor Credit Co. LLC
3.8750%, 1/15/15 | | | 36,217,330 | | | |
| | 10,420,000 | | | Ford Motor Credit Co. LLC
6.6250%, 8/15/17 | | | 11,342,785 | | | |
| | 11,329,000 | | | Ford Motor Credit Co. LLC
5.0000%, 5/15/18 | | | 11,358,376 | | | |
| | | | | | | | 64,260,739 | | | |
| Finance – Consumer Loans – 0.5% | | | | | | |
| | 4,141,000 | | | John Deere Capital Corp.
3.9000%, 7/12/21 | | | 4,507,483 | | | |
| | 18,779,000 | | | SLM Corp.
6.2500%, 1/25/16 | | | 18,262,183 | | | |
| | | | | | | | 22,769,666 | | | |
| Finance – Credit Card – 0.6% | | | | | | |
| | 13,326,000 | | | American Express Co.
6.8000%, 9/1/66‡ | | | 13,259,370 | | | |
| | 13,733,000 | | | American Express Credit Co.
2.8000%, 9/19/16 | | | 13,800,292 | | | |
| | | | | | | | 27,059,662 | | | |
| Finance – Investment Bankers/Brokers – 1.6% | | | | | | |
| | 8,610,000 | | | Jefferies Group, Inc.
3.8750%, 11/9/15 | | | 7,619,850 | | | |
| | 14,967,000 | | | Jefferies Group, Inc.
5.1250%, 4/13/18 | | | 13,170,960 | | | |
| | 7,748,000 | | | Jefferies Group, Inc.
8.5000%, 7/15/19 | | | 7,864,220 | | | |
See Notes to Schedules of Investments and Financial Statements.
Janus Fixed Income & Money Market Funds | 15
Janus Flexible Bond Fund
Schedule of Investments (unaudited)
As of December 31, 2011
| | | | | | | | | | | |
| Shares or Principal Amount | | Value | | | |
| |
| Finance – Investment Bankers/Brokers – (continued) | | | | | | |
| | | | | | | | | | | |
| $ | 15,203,000 | | | Lazard Group LLC
7.1250%, 5/15/15 | | $ | 16,324,769 | | | |
| | 844,000 | | | Lazard Group LLC
6.8500%, 6/15/17 | | | 885,331 | | | |
| | 16,640,000 | | | TD Ameritrade Holding Corp.
4.1500%, 12/1/14 | | | 17,586,633 | | | |
| | 5,791,000 | | | TD Ameritrade Holding Corp.
5.6000%, 12/1/19 | | | 6,261,507 | | | |
| | | | | | | | 69,713,270 | | | |
| Finance – Mortgage Loan Banker – 0.5% | | | | | | |
| | 19,250,000 | | | Northern Rock Asset Management PLC
5.6250%, 6/22/17 (144A) | | | 20,241,375 | | | |
| Food – Meat Products – 0.9% | | | | | | |
| | 1,271,000 | | | Smithfield Foods, Inc.
7.7500%, 5/15/13 | | | 1,347,260 | | | |
| | 36,143,000 | | | Tyson Foods, Inc.
6.8500%, 4/1/16 | | | 39,666,942 | | | |
| | | | | | | | 41,014,202 | | | |
| Food – Miscellaneous/Diversified – 0.9% | | | | | | |
| | 13,319,000 | | | Corn Products International, Inc.
3.2000%, 11/1/15 | | | 13,761,178 | | | |
| | 1,766,000 | | | Del Monte Corp.
7.6250%, 2/15/19 | | | 1,695,360 | | | |
| | 2,149,000 | | | Dole Food Co., Inc.
13.8750%, 3/15/14 | | | 2,482,095 | | | |
| | 8,173,000 | | | Kellogg Co.
3.2500%, 5/21/18 | | | 8,594,947 | | | |
| | 9,001,000 | | | Kraft Foods, Inc.
5.3750%, 2/10/20 | | | 10,385,813 | | | |
| | | | | | | | 36,919,393 | | | |
| Gas – Transportation – 0% | | | | | | |
| | 1,890,000 | | | Southern Star Central Gas Pipeline, Inc.
6.0000%, 6/1/16 (144A) | | | 2,137,458 | | | |
| Hazardous Waste Disposal – 0.1% | | | | | | |
| | 4,234,000 | | | Clean Harbors, Inc.
7.6250%, 8/15/16 | | | 4,498,625 | | | |
| Hotels and Motels – 0.9% | | | | | | |
| | 7,053,000 | | | Hyatt Hotels Corp.
5.7500%, 8/15/15 (144A) | | | 7,552,867 | | | |
| | 2,268,000 | | | Hyatt Hotels Corp.
6.8750%, 8/15/19 (144A) | | | 2,530,886 | | | |
| | 9,946,000 | | | Marriott International, Inc.
4.6250%, 6/15/12 | | | 10,075,975 | | | |
| | 1,972,000 | | | Starwood Hotels & Resorts Worldwide, Inc.
7.8750%, 10/15/14 | | | 2,213,570 | | | |
| | 2,579,000 | | | Starwood Hotels & Resorts Worldwide, Inc.
6.7500%, 5/15/18 | | | 2,914,270 | | | |
| | 10,583,000 | | | Starwood Hotels & Resorts Worldwide, Inc.
7.1500%, 12/1/19 | | | 12,104,306 | | | |
| | | | | | | | 37,391,874 | | | |
| Investment Management and Advisory Services – 0.7% | | | | | | |
| | 3,241,000 | | | Ameriprise Financial, Inc.
7.3000%, 6/28/19 | | | 3,886,653 | | | |
| | 3,892,000 | | | Ameriprise Financial, Inc.
5.3000%, 3/15/20 | | | 4,188,025 | | | |
| | 12,537,000 | | | Ameriprise Financial, Inc.
7.5180%, 6/1/66‡ | | | 12,631,027 | | | |
| | 7,598,000 | | | FMR LLC
6.4500%, 11/15/39 (144A) | | | 8,150,185 | | | |
| | | | | | | | 28,855,890 | | | |
| Life and Health Insurance – 0.1% | | | | | | |
| | 2,797,000 | | | Prudential Financial, Inc.
4.7500%, 6/13/15 | | | 2,957,002 | | | |
| Linen Supply & Related Items – 0.3% | | | | | | |
| | 5,871,000 | | | Cintas Corp. No. 2
2.8500%, 6/1/16 | | | 6,020,963 | | | |
| | 6,263,000 | | | Cintas Corp. No. 2
4.3000%, 6/1/21 | | | 6,727,552 | | | |
| | | | | | | | 12,748,515 | | | |
| Medical – Biomedical and Genetic – 0.6% | | | | | | |
| | 6,570,000 | | | Bio-Rad Laboratories, Inc.
8.0000%, 9/15/16 | | | 7,194,150 | | | |
| | 10,477,000 | | | Gilead Sciences, Inc.
4.4000%, 12/1/21 | | | 11,091,916 | | | |
| | 8,537,000 | | | Gilead Sciences, Inc.
5.6500%, 12/1/41 | | | 9,451,851 | | | |
| | | | | | | | 27,737,917 | | | |
| Medical – HMO – 0.1% | | | | | | |
| | 2,108,000 | | | Health Care Service Corp.
4.7000%, 1/15/21 (144A) | | | 2,264,698 | | | |
| Medical Instruments – 0.7% | | | | | | |
| | 6,217,000 | | | Boston Scientific Corp.
4.5000%, 1/15/15 | | | 6,524,200 | | | |
| | 12,369,000 | | | Boston Scientific Corp.
6.0000%, 1/15/20 | | | 13,807,997 | | | |
| | 8,312,000 | | | Boston Scientific Corp.
7.0000%, 11/15/35 | | | 9,574,884 | | | |
| | | | | | | | 29,907,081 | | | |
| Medical Products – 0.1% | | | | | | |
| | 6,542,000 | | | CareFusion Corp.
4.1250%, 8/1/12 | | | 6,641,399 | | | |
| Metal Processors and Fabricators – 0.1% | | | | | | |
| | 2,268,000 | | | Timken Co.
6.0000%, 9/15/14 | | | 2,454,434 | | | |
| Money Center Banks – 0.5% | | | | | | |
| | 22,215,000 | | | Lloyds TSB Bank PLC
4.8750%, 1/21/16 | | | 21,650,384 | | | |
| Multi-Line Insurance – 1.9% | | | | | | |
| | 18,759,000 | | | American International Group, Inc.
4.2500%, 9/15/14 | | | 18,217,390 | | | |
| | 10,411,000 | | | American International Group, Inc.
5.4500%, 5/18/17 | | | 9,949,168 | | | |
| | 15,432,000 | | | American International Group, Inc.
6.4000%, 12/15/20 | | | 15,574,438 | | | |
| | 21,237,000 | | | American International Group, Inc.
8.1750%, 5/15/58‡ | | | 18,900,930 | | | |
| | 10,015,000 | | | MetLife, Inc.
2.3750%, 2/6/14 | | | 10,154,739 | | | |
See Notes to Schedules of Investments and Financial Statements.
16 | DECEMBER 31, 2011
Schedule of Investments (unaudited)
As of December 31, 2011
| | | | | | | | | | | |
| Shares or Principal Amount | | Value | | | |
| |
| Multi-Line Insurance – (continued) | | | | | | |
| | | | | | | | | | | |
| $ | 4,365,000 | | | MetLife, Inc.
6.7500%, 6/1/16 | | $ | 5,028,646 | | | |
| | 5,109,000 | | | MetLife, Inc.
7.7170%, 2/15/19 | | | 6,406,410 | | | |
| | | | | | | | 84,231,721 | | | |
| Oil – Field Services – 1.4% | | | | | | |
| | 11,131,000 | | | Korea National Oil Corp.
4.0000%, 10/27/16 (144A) | | | 11,430,813 | | | |
| | 18,961,000 | | | Schlumberger Investment S.A.
1.9500%, 9/14/16 (144A) | | | 19,184,114 | | | |
| | 18,973,000 | | | Schlumberger Investment S.A.
3.3000%, 9/14/21 (144A) | | | 19,491,665 | | | |
| | 8,262,000 | | | Weatherford International, Ltd.
5.1250%, 9/15/20 | | | 8,585,689 | | | |
| | | | | | | | 58,692,281 | | | |
| Oil and Gas Drilling – 0.8% | | | | | | |
| | 23,792,000 | | | Nabors Industries, Inc.
5.0000%, 9/15/20 | | | 24,255,968 | | | |
| | 8,584,000 | | | Rowan Cos., Inc.
5.0000%, 9/1/17 | | | 9,019,706 | | | |
| | | | | | | | 33,275,674 | | | |
| Oil Companies – Exploration and Production – 1.4% | | | | | | |
| | 21,850,000 | | | Anadarko Petroleum Corp.
6.4500%, 9/15/36 | | | 24,911,207 | | | |
| | 5,537,000 | | | Forest Oil Corp.
8.5000%, 2/15/14 | | | 6,035,330 | | | |
| | 7,647,000 | | | Occidental Petroleum Corp.
1.7500%, 2/15/17 | | | 7,745,264 | | | |
| | 4,274,000 | | | Occidental Petroleum Corp.
3.1250%, 2/15/22 | | | 4,384,466 | | | |
| | 2,154,000 | | | Petrohawk Energy Corp.
7.2500%, 8/15/18 | | | 2,423,250 | | | |
| | 11,849,000 | | | Petrohawk Energy Corp.
6.2500%, 6/1/19 | | | 13,033,900 | | | |
| | 1,509,000 | | | Whiting Petroleum Corp.
6.5000%, 10/1/18 | | | 1,576,905 | | | |
| | | | | | | | 60,110,322 | | | |
| Oil Companies – Integrated – 0.8% | | | | | | |
| | 14,211,000 | | | BP Capital Markets PLC
2.2480%, 11/1/16 | | | 14,301,624 | | | |
| | 8,675,000 | | | BP Capital Markets PLC
4.5000%, 10/1/20 | | | 9,554,393 | | | |
| | 10,092,000 | | | BP Capital Markets PLC
3.5610%, 11/1/21 | | | 10,506,620 | | | |
| | | | | | | | 34,362,637 | | | |
| Oil Refining and Marketing – 0.5% | | | | | | |
| | 3,251,000 | | | Frontier Oil Corp.
8.5000%, 9/15/16 | | | 3,462,315 | | | |
| | 7,651,000 | | | Motiva Enterprises LLC
5.7500%, 1/15/20 (144A) | | | 8,891,770 | | | |
| | 2,974,000 | | | Sunoco Logistics Partners Operations L.P.
4.6500%, 2/15/22 | | | 3,040,600 | | | |
| | 6,992,000 | | | Sunoco Logistics Partners Operations L.P.
6.1000%, 2/15/42 | | | 7,482,426 | | | |
| | | | | | | | 22,877,111 | | | |
| Paper and Related Products – 0.6% | | | | | | |
| | 5,817,000 | | | International Paper Co.
4.7500%, 2/15/22 | | | 6,183,192 | | | |
| | 17,685,000 | | | International Paper Co.
6.0000%, 11/15/41 | | | 19,199,066 | | | |
| | | | | | | | 25,382,258 | | | |
| Pharmacy Services – 0.8% | | | | | | |
| | 26,685,000 | | | Aristotle Holding, Inc.
4.7500%, 11/15/21 (144A) | | | 27,612,864 | | | |
| | 8,743,000 | | | Express Scripts, Inc.
3.1250%, 5/15/16 | | | 8,791,463 | | | |
| | | | | | | | 36,404,327 | | | |
| Pipelines – 3.8% | | | | | | |
| | 5,263,000 | | | Colorado Interstate Gas Co. LLC
6.8500%, 6/15/37 | | | 5,795,753 | | | |
| | 10,908,000 | | | DCP Midstream Operating L.P.
3.2500%, 10/1/15 | | | 11,008,136 | | | |
| | 4,545,000 | | | El Paso Corp.
7.7500%, 1/15/32 | | | 5,249,475 | | | |
| | 1,939,000 | | | El Paso Pipeline Partners Operating Co. LLC
6.5000%, 4/1/20 | | | 2,137,022 | | | |
| | 8,319,000 | | | El Paso Pipeline Partners Operating Co. LLC
5.0000%, 10/1/21 | | | 8,562,031 | | | |
| | 3,779,000 | | | Energy Transfer Partners L.P.
5.9500%, 2/1/15 | | | 4,084,619 | | | |
| | 8,034,000 | | | Energy Transfer Partners L.P.
4.6500%, 6/1/21 | | | 7,870,074 | | | |
| | 2,388,000 | | | Kinder Morgan Energy Partners L.P.
5.9500%, 2/15/18 | | | 2,728,156 | | | |
| | 16,420,000 | | | Kinder Morgan Finance Co. ULC
5.7000%, 1/5/16 | | | 16,789,450 | | | |
| | 15,652,000 | | | Magellan Midstream Partners L.P.
4.2500%, 2/1/21 | | | 16,404,877 | | | |
| | 14,372,000 | | | Plains All American Pipeline L.P.
3.9500%, 9/15/15 | | | 15,219,057 | | | |
| | 12,620,000 | | | Plains All American Pipeline L.P.
5.0000%, 2/1/21 | | | 13,902,167 | | | |
| | 7,647,000 | | | TC Pipelines L.P.
4.6500%, 6/15/21 | | | 8,006,707 | | | |
| | 38,755,000 | | | Western Gas Partners L.P.
5.3750%, 6/1/21 | | | 41,086,888 | | | |
| | 3,913,000 | | | Williams Partners L.P.
3.8000%, 2/15/15 | | | 4,107,840 | | | |
| | | | | | | | 162,952,252 | | | |
| Property and Casualty Insurance – 0.2% | | | | | | |
| | 5,003,000 | | | Fidelity National Financial, Inc.
6.6000%, 5/15/17 | | | 5,303,285 | | | |
| | 4,012,000 | | | Progressive Corp.
3.7500%, 8/23/21 | | | 4,168,945 | | | |
| | | | | | | | 9,472,230 | | | |
| Publishing – Newspapers – 0% | | | | | | |
| | 1,725,000 | | | Gannett Co., Inc.
6.3750%, 9/1/15 | | | 1,750,875 | | | |
| Publishing – Periodicals – 0.4% | | | | | | |
| | 16,458,000 | | | United Business Media, Ltd.
5.7500%, 11/3/20 (144A) | | | 16,600,460 | | | |
See Notes to Schedules of Investments and Financial Statements.
Janus Fixed Income & Money Market Funds | 17
Janus Flexible Bond Fund
Schedule of Investments (unaudited)
As of December 31, 2011
| | | | | | | | | | | |
| Shares or Principal Amount | | Value | | | |
| |
| Real Estate Management/Services – 0.3% | | | | | | |
| $ | 5,090,000 | | | CB Richard Ellis Services, Inc.
6.6250%, 10/15/20 | | $ | 5,217,250 | | | |
| | 3,818,000 | | | ProLogis L.P.
6.6250%, 5/15/18 | | | 4,146,489 | | | |
| | 4,134,000 | | | ProLogis L.P.
6.8750%, 3/15/20 | | | 4,590,084 | | | |
| | | | | | | | 13,953,823 | | | |
| Real Estate Operating/Development – 0.3% | | | | | | |
| | 10,927,000 | | | Post Apartment Homes L.P.
4.7500%, 10/15/17 | | | 11,081,759 | | | |
| Reinsurance – 0.3% | | | | | | |
| | 11,403,000 | | | Berkshire Hathaway, Inc.
3.2000%, 2/11/15 | | | 12,089,027 | | | |
| REIT – Diversified – 0.8% | | | | | | |
| | 10,508,000 | | | Goodman Funding Pty, Ltd.
6.3750%, 11/12/20 (144A) | | | 10,721,880 | | | |
| | 24,857,000 | | | Goodman Funding Pty, Ltd.
6.3750%, 4/15/21 (144A) | | | 25,292,569 | | | |
| | | | | | | | 36,014,449 | | | |
| REIT – Health Care – 0.8% | | | | | | |
| | 5,999,000 | | | Senior Housing Properties Trust
6.7500%, 4/15/20 | | | 6,113,677 | | | |
| | 8,346,000 | | | Senior Housing Properties Trust
6.7500%, 12/15/21 | | | 8,482,332 | | | |
| | 7,617,000 | | | Ventas Realty L.P. / Ventas Capital Corp.
6.5000%, 6/1/16 | | | 7,852,837 | | | |
| | 11,945,000 | | | Ventas Realty L.P. / Ventas Capital Corp.
6.7500%, 4/1/17 | | | 12,388,112 | | | |
| | | | | | | | 34,836,958 | | | |
| REIT – Hotels – 0.4% | | | | | | |
| | 15,875,000 | | | Host Hotels & Resorts L.P.
6.7500%, 6/1/16 | | | 16,311,562 | | | |
| REIT – Office Property – 0.8% | | | | | | |
| | 3,880,000 | | | Reckson Operating Partnership L.P.
6.0000%, 3/31/16 | | | 4,025,663 | | | |
| | 10,664,000 | | | Reckson Operating Partnership L.P.
5.0000%, 8/15/18 | | | 10,300,496 | | | |
| | 18,597,000 | | | Reckson Operating Partnership L.P.
7.7500%, 3/15/20 | | | 20,396,353 | | | |
| | | | | | | | 34,722,512 | | | |
| REIT – Regional Malls – 1.6% | | | | | | |
| | 42,731,000 | | | Rouse Co. L.P.
6.7500%, 5/1/13 (144A) | | | 43,104,896 | | | |
| | 24,601,000 | | | Rouse Co. L.P.
6.7500%, 11/9/15 | | | 24,877,761 | | | |
| | | | | | | | 67,982,657 | | | |
| REIT – Shopping Centers – 0.1% | | | | | | |
| | 4,156,000 | | | Developers Diversified Realty Corp.
4.7500%, 4/15/18 | | | 3,976,490 | | | |
| Retail – Regional Department Stores – 0.5% | | | | | | |
| | 5,103,000 | | | Macy’s Retail Holdings, Inc.
5.7500%, 7/15/14 | | | 5,428,097 | | | |
| | 11,018,000 | | | Macy’s Retail Holdings, Inc.
5.9000%, 12/1/16 | | | 12,312,306 | | | |
| | 5,478,000 | | | Macy’s Retail Holdings, Inc.
6.9000%, 4/1/29 | | | 6,024,924 | | | |
| | | | | | | | 23,765,327 | | | |
| Retail – Restaurants – 0.8% | | | | | | |
| | 10,919,000 | | | Brinker International
5.7500%, 6/1/14 | | | 11,517,001 | | | |
| | 21,365,000 | | | Darden Restaurants, Inc.
4.5000%, 10/15/21 | | | 21,920,020 | | | |
| | | | | | | | 33,437,021 | | | |
| Steel – Producers – 0.3% | | | | | | |
| | 13,654,000 | | | Steel Dynamics, Inc.
6.7500%, 4/1/15 | | | 13,961,215 | | | |
| Super-Regional Banks – 1.3% | | | | | | |
| | 3,914,000 | | | PNC Funding Corp.
3.6250%, 2/8/15 | | | 4,111,340 | | | |
| | 8,433,000 | | | SunTrust Banks, Inc.
3.6000%, 4/15/16 | | | 8,587,636 | | | |
| | 13,742,000 | | | SunTrust Banks, Inc.
3.5000%, 1/20/17 | | | 13,812,854 | | | |
| | 13,155,000 | | | US Bancorp
2.2000%, 11/15/16 | | | 13,281,393 | | | |
| | 16,393,000 | | | Wells Fargo & Co.
4.6000%, 4/1/21 | | | 17,977,908 | | | |
| | | | | | | | 57,771,131 | | | |
| Telecommunication Services – 0.5% | | | | | | |
| | 18,116,000 | | | Qwest Corp.
6.7500%, 12/1/21 | | | 19,746,440 | | | |
| Telephone – Integrated – 1.2% | | | | | | |
| | 5,133,000 | | | CenturyLink, Inc.
5.1500%, 6/15/17 | | | 5,087,737 | | | |
| | 4,927,000 | | | CenturyLink, Inc.
7.6000%, 9/15/39 | | | 4,834,693 | | | |
| | 4,046,000 | | | Qwest Communications International, Inc.
7.5000%, 2/15/14 | | | 4,061,274 | | | |
| | 36,139,000 | | | Qwest Communications International, Inc.
7.1250%, 4/1/18 | | | 37,584,560 | | | |
| | | | | | | | 51,568,264 | | | |
| Transportation – Railroad – 1.0% | | | | | | |
| | 4,365,000 | | | Burlington Northern Santa Fe LLC
3.4500%, 9/15/21 | | | 4,498,958 | | | |
| | 4,365,000 | | | Burlington Northern Santa Fe LLC
4.9500%, 9/15/41 | | | 4,815,315 | | | |
| | 2,482,739 | | | CSX Corp.
8.3750%, 10/15/14 | | | 2,826,946 | | | |
| | 7,545,000 | | | CSX Corp.
4.7500%, 5/30/42 | | | 7,785,293 | | | |
| | 16,235,000 | | | Kansas City Southern de Mexico S.A. de C.V.
8.0000%, 2/1/18 | | | 17,777,325 | | | |
| | 5,577,000 | | | Kansas City Southern de Mexico S.A. de C.V.
6.6250%, 12/15/20 | | | 5,911,620 | | | |
| | | | | | | | 43,615,457 | | | |
See Notes to Schedules of Investments and Financial Statements.
18 | DECEMBER 31, 2011
Schedule of Investments (unaudited)
As of December 31, 2011
| | | | | | | | | | | |
| Shares or Principal Amount | | Value | | | |
| |
| Transportation – Services – 0.1% | | | | | | |
| $ | 2,282,000 | | | Asciano Finance, Ltd.
3.1250%, 9/23/15 (144A) | | $ | 2,206,792 | | | |
| Transportation – Truck – 0.4% | | | | | | |
| | 16,446,000 | | | JB Hunt Transport Services, Inc.
3.3750%, 9/15/15 | | | 16,666,738 | | | |
| |
| |
| Total Corporate Bonds (cost $2,540,711,253) | | | 2,618,937,761 | | | |
| |
| |
| Mortgage-Backed Securities – 14.6% | | | | | | |
| | | | | Fannie Mae: | | | | | | |
| | 4,310,984 | | | 5.0000%, 2/1/23 | | | 4,656,259 | | | |
| | 8,072,978 | | | 5.5000%, 1/1/25 | | | 8,770,015 | | | |
| | 4,234,644 | | | 5.5000%, 1/1/33 | | | 4,650,317 | | | |
| | 3,555,554 | | | 5.0000%, 11/1/33 | | | 3,845,124 | | | |
| | 6,647,804 | | | 5.0000%, 12/1/33 | | | 7,189,212 | | | |
| | 3,782,743 | | | 5.0000%, 2/1/34 | | | 4,090,816 | | | |
| | 15,078,641 | | | 5.5000%, 4/1/34 | | | 16,483,371 | | | |
| | 24,965,254 | | | 5.5000%, 9/1/34 | | | 27,275,419 | | | |
| | 7,592,939 | | | 5.5000%, 5/1/35 | | | 8,290,807 | | | |
| | 58,143,899 | | | 5.5000%, 7/1/35 | | | 63,524,258 | | | |
| | 23,912,793 | | | 6.0000%, 12/1/35 | | | 26,663,357 | | | |
| | 48,224,062 | | | 5.5000%, 4/1/36 | | | 52,656,347 | | | |
| | 26,165,584 | | | 5.5000%, 7/1/36 | | | 28,586,822 | | | |
| | 7,046,858 | | | 6.0000%, 3/1/37 | | | 7,793,633 | | | |
| | 30,777,602 | | | 5.5000%, 5/1/37 | | | 33,798,738 | | | |
| | 7,125,765 | | | 6.0000%, 5/1/37 | | | 7,860,862 | | | |
| | 6,614,781 | | | 5.5000%, 7/1/37 | | | 7,208,277 | | | |
| | 4,982,995 | | | 5.5000%, 3/1/38 | | | 5,472,127 | | | |
| | 10,009,615 | | | 6.0000%, 11/1/38 | | | 11,042,211 | | | |
| | 19,061,490 | | | 6.0000%, 11/1/38 | | | 21,111,273 | | | |
| | 4,363,572 | | | 4.5000%, 10/1/40 | | | 4,647,117 | | | |
| | 4,067,848 | | | 4.0000%, 12/1/40 | | | 4,303,123 | | | |
| | 81,232,085 | | | 4.0000%, 2/1/41 | | | 85,879,596 | | | |
| | 3,913,393 | | | 5.0000%, 3/1/41 | | | 4,271,240 | | | |
| | 11,896,114 | | | 4.5000%, 4/1/41 | | | 12,769,495 | | | |
| | 7,946,169 | | | 5.0000%, 4/1/41 | | | 8,593,317 | | | |
| | 9,993,101 | | | 5.0000%, 4/1/41 | | | 10,822,568 | | | |
| | 12,570,329 | | | 4.5000%, 10/1/41 | | | 13,387,147 | | | |
| | 8,573,325 | | | 5.0000%, 10/1/41 | | | 9,271,550 | | | |
| | | | | Freddie Mac: | | | | | | |
| | 6,347,653 | | | 5.0000%, 1/1/19 | | | 6,836,212 | | | |
| | 5,362,687 | | | 5.0000%, 2/1/19 | | | 5,775,436 | | | |
| | 7,379,782 | | | 5.5000%, 8/1/19 | | | 8,003,129 | | | |
| | 15,772,475 | | | 6.0000%, 1/1/38 | | | 17,377,388 | | | |
| | 4,072,418 | | | 5.5000%, 5/1/38 | | | 4,456,259 | | | |
| | 10,832,484 | | | 5.5000%, 10/1/39 | | | 11,853,490 | | | |
| | 9,072,007 | | | 4.5000%, 1/1/41 | | | 9,616,442 | | | |
| | 12,065,467 | | | 4.5000%, 5/1/41 | | | 12,894,177 | | | |
| | 20,193,170 | | | 5.0000%, 5/1/41 | | | 21,752,541 | | | |
| | 2,933,490 | | | 4.5000%, 9/1/41 | | | 3,109,536 | | | |
| | 6,344,665 | | | 4.0000%, 10/1/41 | | | 6,720,548 | | | |
| | | | | Ginnie Mae: | | | | | | |
| | 12,435,734 | | | 5.5000%, 3/15/36 | | | 14,037,483 | | | |
| |
| |
| Total Mortgage-Backed Securities (cost $623,662,378) | | | 627,347,039 | | | |
| |
| |
| Preferred Stock – 0.1% | | | | | | |
| Diversified Financial Services – 0.1% | | | | | | |
| | 95,575 | | | Citigroup Capital XIII, 7.8750% (cost $2,394,831) | | | 2,490,684 | | | |
| |
| |
| U.S. Treasury Notes/Bonds – 16.1% | | | | | | |
| | | | | U.S. Treasury Notes/Bonds: | | | | | | |
| $ | 58,284,000 | | | 1.1250%, 6/15/13 | | | 59,051,251 | | | |
| | 95,578,000 | | | 1.0000%, 7/15/13 | | | 96,716,716 | | | |
| | 35,000,000 | | | 2.1250%, 5/31/15 | | | 36,949,605 | | | |
| | 7,918,000 | | | 1.0000%, 8/31/16 | | | 8,004,607 | | | |
| | 11,072,000 | | | 1.0000%, 9/30/16 | | | 11,186,175 | | | |
| | 8,912,000 | | | 1.0000%, 10/31/16 | | | 8,998,339 | | | |
| | 1,154,000 | | | 0.8750%, 11/30/16 | | | 1,157,516 | | | |
| | 16,661,000 | | | 2.3750%, 5/31/18 | | | 17,866,323 | | | |
| | 3,767,000 | | | 1.7500%, 10/31/18 | | | 3,877,068 | | | |
| | 94,098,000 | | | 3.1250%, 5/15/21** | | | 105,066,251 | | | |
| | 120,847,000 | | | 2.1250%, 8/15/21 | | | 123,943,704 | | | |
| | 49,042,000 | | | 2.0000%, 11/15/21 | | | 49,601,373 | | | |
| | 12,334,000 | | | 4.6250%, 2/15/40 | | | 16,635,483 | | | |
| | 20,304,000 | | | 3.8750%, 8/15/40 | | | 24,339,420 | | | |
| | 7,247,000 | | | 4.2500%, 11/15/40 | | | 9,242,186 | | | |
| | 2,134,000 | | | 4.7500%, 2/15/41 | | | 2,940,919 | | | |
| | 3,380,000 | | | 4.3750%, 5/15/41 | | | 4,404,035 | | | |
| | 63,668,000 | | | 3.7500%, 8/15/41 | | | 74,879,553 | | | |
| | 39,039,000 | | | 3.1250%, 11/15/41 | | | 40,899,443 | | | |
| |
| |
| Total U.S. Treasury Notes/Bonds (cost $660,267,446) | | | 695,759,967 | | | |
| |
| |
| Money Market – 4.0% | | | | | | |
| | 172,543,267 | | | Janus Cash Liquidity Fund LLC, 0%
(cost $172,543,267) | | | 172,543,267 | | | |
| |
| |
| Total Investments (total cost $4,134,764,865) – 98.6% | | | 4,251,768,349 | | | |
| |
| |
| Cash, Receivables and Other Assets, net of Liabilities – 1.4% | | | 62,441,730 | | | |
| |
| |
| Net Assets – 100% | | $ | 4,314,210,079 | | | |
| |
| |
Summary of Investments by Country – (Long Positions)
| | | | | | | | | |
| | | | | | % of Investment
| |
| Country | | Value | | | Securities | |
| |
| |
| Australia | | $ | 44,791,912 | | | | 1.0% | |
| Bermuda | | | 8,585,689 | | | | 0.2% | |
| Canada | | | 69,922,263 | | | | 1.6% | |
| Cayman Islands | | | 12,098,719 | | | | 0.3% | |
| France | | | 82,497,567 | | | | 1.9% | |
| Luxembourg | | | 54,576,816 | | | | 1.3% | |
| Mexico | | | 23,688,945 | | | | 0.6% | |
| Netherlands | | | 24,583,562 | | | | 0.6% | |
| South Korea | | | 11,430,813 | | | | 0.3% | |
| United Kingdom | | | 145,172,968 | | | | 3.4% | |
United States†† | | | 3,774,419,095 | | | | 88.8% | |
| |
| |
| Total | | $ | 4,251,768,349 | | | | 100.0% | |
| | | |
| †† | | Includes Cash Equivalents (84.7% excluding Cash Equivalents). |
See Notes to Schedules of Investments and Financial Statements.
Janus Fixed Income & Money Market Funds | 19
Janus Global Bond Fund (unaudited)
| | | | | | | |
Fund Snapshot
We believe a bottom-up, fundamentally driven investment process that focuses on credit-oriented investments anywhere in the world can generate risk-adjusted outperformance relative to our peers over time. Our comprehensive bottom-up view drives decision-making at a macro level, enabling us to make informed decisions about allocations to all sectors of the fixed income universe.
| |
Gibson Smith
co-portfolio manager | |
Darrell Watters
co-portfolio manager | | 
Chris Diaz
co-portfolio manager |
Performance Overview
During the six-month period ended December 31, 2011, Janus Global Bond Fund’s Class I Shares returned 1.57% compared to a 1.21% return for the Fund’s primary benchmark, the Barclays Capital Global Aggregate Bond Index.
Portfolio Manager Comments
The volatility in the bond markets has been mind-numbing at times, and a wake-up call to investors that key risks to the economy remain in place. We saw this reflected in the flight to safety that sent Treasury yields to near-record lows in 2011. Quite simply, the world has too much debt and not enough growth, and we are grinding through a deleveraging period that will be more painful and last longer than most investors anticipate. Unfortunately, we have also entered a period where policy actions are not necessarily effective in terms of stabilizing the imbalance and returning us to a more normal environment.
If there’s a theme for 2012 it’s that investors should get used to low rates. The Federal Reserve (Fed) has said that it expects to keep interest rates near zero into late 2014. The question now is whether the Fed will undertake a third round of quantitative easing (QE3) this year. We think the Fed isn’t ready to shoot this bullet yet, but will respond if it sees economic weakness or significant dislocation in the financial markets. We also expect easy monetary policies and low rates in Europe, where inflation expectations are falling as growth rates decline.
We expect interest rate volatility to remain high, as a risk-on/risk-off environment continues amid lack of confidence in global fiscal policy decisions. In a world that is out of balance, the bands of potential outcomes widen, making prediction more difficult. In a general sense, we have been investing against a fairly stable macro backdrop over the last 30 years. But the world changed in 2008, and since then we’ve seen massive intervention and very unconventional policy response, forcing investors to consider outcomes that exhibit much greater volatility. As long as governments around the world exhibit leverage profiles that create uncertainty, U.S. government bonds will continue to be the flight-to-quality asset of choice, due to their liquidity and perceived high quality.
Against this backdrop, we continue to believe that corporate credit offers some of the best risk -adjusted returns in the market. We entered 2011 with a similar belief. The last year was highly volatile for credit, especially financials, which had a big impact on the market. Yet underlying fundamentals continue to improve. Profit margins are high and companies are accumulating cash on balance sheets (more than $2 trillion by some estimates). Moreover, we think there is a newfound conservatism resonating across management teams and boards in the United States and Europe. Management teams are being more careful and have not been committing capital to their businesses – beyond replacement levels – as growth remains slow and uncertainty remains high. We think this will continue through 2012, fueling more free cash flow, liquidity in the system and ultimately support for credit spreads in both investment-grade and high-yield bonds.
Investment Environment
The second half of 2011 was dominated by government fiscal policy and investors’ fluctuating appetite for risk. The period began with a high-stakes political standoff in Congress in July and August over raising the U.S. debt ceiling, which heightened already existing concern that the United States might slip into a double-dip recession. In August, credit rating agency Standard & Poor’s lowered the United States’ sovereign credit rating to AA+ from AAA. The downgrade was followed, ironically, by a near stampede into U.S. Treasury securities, as the darkening global economic picture made Treasuries appear to be the safest haven available.
All eyes returned to Europe in the fall, as fiscal problems in the so-called PIIGS (Portugal, Italy, Ireland, Greece and Spain) countries threatened to spiral out of control. By October, it appeared that European Union (EU) leaders
20 | DECEMBER 31, 2011
(unaudited)
would manage to contain euro-zone problems, and relieved investors briefly ventured out of Treasuries in search of higher yield. But uncertainty flooded back in November as governments in Greece and then Italy fell amid market pressure to implement fiscal reforms, and investors quickly retreated from riskier assets. Volatility affected European bond markets throughout November and into early December, with Italian, Spanish and French bond yields remaining historically wide relative to German bonds.
In December, some progress was made, as EU leaders announced a plan in which most members would agree to stricter fiscal rules and the European Central Bank served up a larger-than-expected $641 billion in 3-year loans. This injected some calm into the markets as volume wound down for the holidays.
Amid the uncertainty, the euro slid, dropping nearly 11% against the U.S. dollar during the period. The British pound lost roughly 3% versus the U.S. dollar, while Japanese yen appreciated by 4.75% and Chinese currency gained nearly 3% against the U.S. dollar.
European high-yield corporate credit spreads also widened far more than U.S. or emerging-market (EM) high-yield corporate spreads, reaching a peak of 1,054 basis points (bps) on Oct. 4 before ending the year at 883 bps. By contrast, U.S. high-yield spreads ended the period at 699 bps and EM high-yield spreads at 656 bps. A similar trend was seen in investment-grade spreads, as European corporate issues struggled against investor perception of heightened country risk.
The risk-off mentality in place for much of the period was reflected in Treasury bond yields, as investors reaffirmed the attraction of U.S. sovereign debt as a safe haven during uncertain times. The 10-year Treasury yield dropped 128 bps to close the period at 1.88%, while the 30-year yield declined by 148 bps to 2.89% as of December 31.
Performance Discussion
The portfolio outperformed the Barclays Capital Global Aggregate Bond Index (Global Agg) during the six-month period. Heading into the period we held an overweight position in assets from the United States and underweight exposure to euro-denominated assets due to our concerns about the European debt situation, which proved beneficial as the euro continued to lose ground in the second half of 2011. We further reduced our euro exposure during the period; on December 31, 2011, roughly 16% of the portfolio was in euro-denominated securities and less than 4% in European sovereign debt, compared with 22% and nearly 9%, respectively, on June 30, 2011. We remain significantly underweight both to euro-denominated debt and to the European sovereigns compared with the index. At period end we had neutral exposure to the British pound, Canadian dollar and Japanese yen, while we were overweight to Swedish, Norwegian and New Zealand currency-denominated debt.
Our security selection within government sovereign debt was a strong contributor during the period. Most of our holdings were in U.S. Treasury securities, which rallied strongly during the second half of the year, with a far smaller exposure to euro zone sovereigns. We remain underweight sovereign debt compared with the index. In our opinion the Fund’s strategic allocation to high quality global sovereign debt plays a critical defensive role during periods of uncertainty and offers the most viable way to quickly address risk, although we continue to monitor the fiscal challenges facing many developed world countries.
Our fundamental bullish positioning toward credit remained in place, with period-end allocations roughly equal to their levels on June 30, 2011. We maintained significant overweighting to corporate credit during the period, with the chemicals, oil field services and food and beverage production industries providing the greatest contributions to performance. Top detractors included banking, REITs and non-bank commercial financial services.
We maintained zero exposure to government agency debt throughout the period. We have long argued that since the 2008-09 financial crisis, U.S. government agencies, agency mortgages and U.S. Treasuries have converged and now move as one large U.S. government sector. We believe that corporate credit represents a better alternative, offering the best risk-adjusted returns. Our focus on security selection also offers a more effective way of capturing alpha (outperformance versus the benchmark) within corporate credit, in our opinion.
That said, we did increase our exposure to select agency mortgage-backed securities (MBS) during the second half of 2011, as MBS spreads moved significantly wider and presented good risk/reward opportunities in our opinion. We began the year with a zero weight to mortgages – an area we had avoided since the third quarter of 2009 – but re-established and then increased our allocation as the year progressed; as of December 31 MBS accounted for more than 16% of the portfolio, compared with 12% for the Global Agg. It’s worth noting that increasing our exposure to MBS was not a broad macroeconomic decision, but consistent with our investment process it was the result of seeking opportunities through close
Janus Fixed Income & Money Market Funds | 21
Janus Global Bond Fund (unaudited)
analysis of valuations and individual security fundamentals. Broadly speaking, when the U.S. government placed Fannie Mae and Freddie Mac into conservatorship in 2008, mortgage spreads tightened significantly compared with Treasuries, offering little potential for outperformance. The evolving dynamics within the mortgage market also made it difficult to model duration extension risk. However, over the past year both factors have eased. Particularly encouraging from our standpoint was the Federal Reserve’s announcement in September that it would reinvest maturing MBS paydowns into newly issued MBS, effectively changing the Fed from a net seller to a net buyer in the MBS market. There also is the possibility that the Fed will buy additional MBS as part of a potential QE3, a likelihood that we estimate at about 50%. We continue to focus on pre-pay-protected issues such as low-loan balance and seasoned pools to manage the interest rate risk inherent in the sector.
We also held a small position in commercial mortgage-backed securities (CMBS). We believe that there is opportunity for spread tightening in CMBS as the market slowly and haltingly returns to life following the financial crisis.
We maintained a small weighting in bank loans. Bank loans offer a variable rate that can be attractive in rising interest rate environments, but bank loan prices have declined as concern about rising inflation has faded. A small cash position also weighed slightly on second-half 2011 performance. It is important to note that cash is not an active allocation within the strategy, but it is prudent to keep a certain level of “frictional” cash on hand to meet day-to-day needs.
Please see the Derivative Instruments section in the “Notes to Financial Statements” for a discussion of derivatives used by the Fund.
Outlook
We expect global growth to slow to roughly 2.1% in 2012, with Europe the most challenged region worldwide. We believe that Europe will be in recession next year, with growth of negative 0.5% to negative 1%, while the United States and Japan will grow by about 2%. China likely will be the strongest driver of worldwide growth, but even China’s growth is likely to moderate to about 8%. Policy risk remains high in all regions of the world. We expect inflation to decline globally as commodity prices level out and the pace of growth slows.
Headline risk remains significant, particularly in the euro zone as leaders continue to attempt to enforce greater fiscal discipline on EU members and prevent another spike in weaker countries’ borrowing costs. The U.S. fiscal policy debate is expected to heat up again, as well. Congress managed in late December to compromise on extending long-term unemployment benefits and the payroll tax holiday by an additional two months; the short time frame guarantees that the issue will resurface early in the year. We believe that failure to continue these programs through year-end 2012 would have a material impact on U.S. growth.
From a global perspective, we are underweight emerging-market sovereign debt due to valuations. Although spreads in these markets have widened, the downside risk remains considerable in our view compared with the risk-reward opportunities in more developed markets. However, with uncertainty remaining across Europe, we also are underweight euro-denominated sovereign and corporate debt. We believe that we will see additional opportunity in Asia next year, which is more insulated to the euro-zone situation than the United States.
In the United States, given current high levels of productivity we expect continued job growth as companies seek to meet essential demand. However, the modest pace will keep the unemployment rate elevated and fluctuating around the 9% level throughout the year. Excess slack in the labor market combined with slow economic growth will keep inflation from moving much higher. This low-inflation environment should give the Federal Reserve room to continue its accommodative short-term interest rate policy. Fed officials have said that they intend to keep short-term interest rates near zero until late 2014. We believe there is a 50% chance that the Fed will initiate QE3 in 2012, by buying mortgage-backed securities, if market conditions warrant. In our view the likelihood of QE3 is heavily dependent on the outcome in Europe, and may be necessary if we see continued dysfunction in Washington.
We believe that Treasury yields will remain relatively range-bound in 2012 due to the continued headline risk from Europe, political deadlock in Washington and automatic $1.2 trillion government spending cuts scheduled to begin in January 2013. However, we think that rates will be at the higher end of the range by the end of 2012, partly because by that point we should be on a path to stronger economic growth. The front end of the curve is anchored by the Fed’s stated intention to keep interest rates near zero until late 2014. The five-year Treasury is the pivot point and stands to benefit if the Fed implements a third round of quantitative easing. We believe that the 10-year and 30-year Treasury have little upside left, as they enjoyed a remarkable rally in 2011 but will become more vulnerable to inflation concerns the
22 | DECEMBER 31, 2011
(unaudited)
longer the Fed’s accommodative policy continues. We believe this scenario bodes well for fixed-income assets, as market participants likely will look for yield while staying away from equities due to the volatile nature of the market.
Top Contributors:
Pernod-Ricard: A French producer of distilled beverages, Pernod acquired Absolut Vodka in 2008 resulting in a downgrade of the company by ratings agencies. The company has demonstrated its ability to utilize free cash flow for the benefit of bondholders and remains focused on deleveraging.
Western Power: Western Power, a U.K.-based electricity transmission and distribution company, is owned by American utility corporation PPL. Because its business is distribution rather than production, it is relatively shielded from fluctuations in commodity prices, and because it’s regulated there’s a limit to how much debt the company can take on. We also like that it’s owned by PPL, a company that has been reducing the leverage on its balance sheet.
Top Detractors
AIG: American International Group (AIG), an international insurer, is a high-beta name that faced headwinds in 2011, partly due to general challenges in the financials sector and to the performance of its aircraft-leasing unit, International Lease Finance Corp. Despite the turmoil, we like AIG’s long-term deleveraging plan and recent track record of balance sheet focus. Its core businesses include companies with top market share in their sectors, such as Chartis and SunAmerica.
Royal Bank of Scotland: Very much a recovery story, RBS underwent the largest bank bailout in the world on a currency adjusted basis with the U.K. government holding nearly 80% of the company’s equity. Having split into core and non-core businesses, today RBS is very well capitalized inclusive of the potential impact from rolling off the non-core assets (expiration and/or discounted asset sales). We anticipate government restrictions on the firm will abate as the firm reaches debt reduction targets through increased funding from growing deposits and non-performing asset reduction.
On behalf of each member of our investment team, thank you for your investment in Janus Global Bond Fund. We appreciate you entrusting us with your assets and look forward to continuing to serve your investment needs.
Janus Fixed Income & Money Market Funds | 23
Janus Global Bond Fund (unaudited)
Janus Global Bond Fund At A Glance
December 31, 2011
| | | |
Weighted Average Maturity | | 6.9 Years |
Average Effective Duration* | | 5.1 Years |
30-day Current Yield** | | |
| Class A Shares at NAV | | |
| Without Reimbursement | | 1.94% |
| With Reimbursement | | 2.35% |
| Class A Shares at MOP | | |
| Without Reimbursement | | 1.84% |
| With Reimbursement | | 2.24% |
| Class C Shares*** | | |
| Without Reimbursement | | 0.94% |
| With Reimbursement | | 1.36% |
| Class D Shares | | |
| Without Reimbursement | | 1.81% |
| With Reimbursement | | 2.23% |
| Class I Shares | | |
| Without Reimbursement | | 1.93% |
| With Reimbursement | | 2.35% |
| Class S Shares | | |
| Without Reimbursement | | 1.43% |
| With Reimbursement | | 1.85% |
| Class T Shares | | |
| Without Reimbursement | | 1.68% |
| With Reimbursement | | 2.10% |
Number of Bonds/Notes | | 265 |
| | | |
| * | | A theoretical measure of price volatility |
| ** | | Yield will fluctuate |
| *** | | Does not include the 1.00% contingent deferred sales charge. |
Ratings†Summary – (% of Investment Securities)
December 31, 2011
| | | |
AAA | | 6.7% |
AA | | 31.2% |
A | | 16.5% |
BBB | | 18.3% |
BB | | 9.2% |
B | | 1.2% |
CCC | | 0.3% |
Other | | 16.6% |
| | | |
| † | | Rated by Standard & Poor’s |
Significant Areas of Investment – (% of Net Assets)
As of December 31, 2011
Asset Allocation – (% of Net Assets)
As of December 31, 2011
24 | DECEMBER 31, 2011
(unaudited)
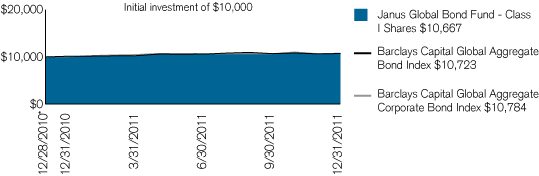
| | | | | | | | | | | | |
| Average Annual Total Return – for the periods ended December 31, 2011 | | | Expense Ratios – per the October 28, 2011 prospectuses |
| | | Fiscal
| | One
| | Since
| | | Total Annual Fund
| | Net Annual Fund
|
| | | Year-to-Date | | Year | | Inception* | | | Operating Expenses | | Operating Expenses |
| | | | | | | | | | | | |
| Janus Global Bond Fund – Class A Shares | | | | | | | | | | | |
| | | | | | | | | | | | |
| NAV | | 1.44% | | 6.51% | | 6.45% | | | 3.51% | | 1.02% |
| | | | | | | | | | | | |
| MOP | | –3.41% | | 1.44% | | 1.42% | | | | | |
| | | | | | | | | | | | |
| Janus Global Bond Fund – Class C Shares | | | | | | | | | | | |
| | | | | | | | | | | | |
| NAV | | 1.06% | | 5.81% | | 5.76% | | | 4.23% | | 1.77% |
| | | | | | | | | | | | |
| CDSC | | 0.07% | | 4.78% | | 5.76% | | | | | |
| | | | | | | | | | | | |
| Janus Global Bond Fund – Class D Shares(1) | | 1.51% | | 6.65% | | 6.59% | | | 2.93% | | 0.89% |
| | | | | | | | | | | | |
| Janus Global Bond Fund – Class I Shares | | 1.57% | | 6.67% | | 6.62% | | | 3.14% | | 0.77% |
| | | | | | | | | | | | |
| Janus Global Bond Fund – Class S Shares | | 1.31% | | 6.34% | | 6.29% | | | 3.85% | | 1.27% |
| | | | | | | | | | | | |
| Janus Global Bond Fund – Class T Shares | | 1.44% | | 6.51% | | 6.45% | | | 3.46% | | 1.01% |
| | | | | | | | | | | | |
| Barclays Capital Global Aggregate Bond Index | | 1.21% | | 5.64% | | 7.16% | | | | | |
| | | | | | | | | | | | |
| Barclays Capital Global Aggregate Corporate Bond Index | | –0.71% | | 4.32% | | 6.05% | | | | | |
| | | | | | | | | | | | |
| Lipper Quartile – Class I Shares | | – | | 1st | | 1st | | | | | |
| | | | | | | | | | | | |
| Lipper Ranking – based on total returns for Global Income Funds | | – | | 26/175 | | 30/169 | | | | | |
| | | | | | | | | | | | |
| Visit janus.com/advisor/mutual-funds (or janus.com/allfunds if you hold Shares directly with Janus Capital) to view current performance and characteristic information | | | | | |
| | | | | | | | | | | | |
Data presented represents past performance, which is no guarantee of future results. Investment results and principal value will fluctuate so that shares, when redeemed, may be worth more or less than their original cost. Due to market volatility, current performance may be higher or lower than the performance shown. Call 877.33JANUS(52687) (or 800.525.3713 if you hold shares directly with Janus Capital) or visit janus.com/advisor/mutual-funds (or janus.com/allfunds if you hold shares directly with Janus Capital) for performance current to the most recent month-end.
Performance shown for Class A Shares at Maximum Offering Price (MOP) includes the Fund’s maximum sales charge of 4.75%. Performance shown at Net Asset Value (NAV) does not include this charge and would have been lower had this charge been taken into account.
Performance shown for Class C Shares includes a 1% contingent deferred sales charge (CDSC) on periods of less than 12 months. Performance shown at Net Asset Value (NAV) does not include this sales charge and would have been lower had this sales charge been taken into account.
See important disclosures on the next page.
Janus Fixed Income & Money Market Funds | 25
Janus Global Bond Fund (unaudited)
Janus Capital has contractually agreed to waive the Fund’s total annual fund operating expenses allocated to any class (excluding the distribution and shareholder servicing fees (applicable to Class A Shares, Class C Shares and Class S Shares), administrative services fees payable pursuant to the Transfer Agency Agreement (except for networking and omnibus fees), brokerage commissions, interest, dividends, taxes, acquired fund fees and expenses, and extraordinary expenses) to certain limits until at least November 1, 2012. The contractual waiver may be terminated or modified prior to this date only at the discretion of the Board of Trustees. Returns shown include fee waivers, if any, and without such waivers, returns would have been lower.
The expense information shown was determined based on net assets as of the fiscal period ended June 30, 2011. The effect of contractual waivers agreed to by Janus Capital, when applicable, are reflected under “Net Annual Fund Operating Expenses.” (All expenses are shown without the effect of expense offset arrangements. Pursuant to such arrangements, credits realized as a result of uninvested cash balances are used to reduce custodian and transfer agent expenses.)
The Fund’s performance may be affected by risks that include those associated with non-investment grade debt securities, investments in specific industries or countries and potential conflicts of interest with the Janus “funds of funds.” Additional risks to the Fund may include those associated with investing in foreign securities, emerging markets, initial public offerings (“IPOs”), real estate investment trusts (“REITs”), and derivatives. Please see a Janus prospectus or janus.com/info (or janus.com/reports if you hold shares directly with Janus Capital) for more information about risks, portfolio holdings and other details.
Foreign securities have additional risks including exchange rate changes, political and economic upheaval, the relative lack of information, relatively low market liquidity and the potential lack of strict financial and accounting controls and standards. These risks are magnified in emerging markets. The prices of foreign securities held by the Fund, and therefore the Fund’s performance, may decline in response to such risks.
Funds that invest in bonds have the same interest rate, inflation, and credit risks that are associated with the underlying bonds owned by the Fund. Unlike owning individual bonds, there are ongoing fees and expenses associated with owning shares of Fixed Income Funds. The return of principal is not guaranteed due to net asset value fluctuation that is caused by changes in the price of specific bonds held in the Fund and selling of bonds within the Fund by the portfolio managers.
The Fund invests in mortgage-backed securities. Mortgage-backed securities are subject to prepayment risk (early payoff of mortgages during periods of declining interest rates) and extension risk (extending the duration of mortgage-backed securities during periods of rising interest rates). These risks may increase the volatility of these securities and affect total returns.
The Fund invests in REITs, which may be subject to a higher degree of market risk because of concentration in a specific industry, sector or geographic region. REITs may be subject to risks including, but not limited to: legal, political, liquidity, and interest rate risks, a decline in the value of real estate, risks related to general and economic conditions, changes in the value of the underlying property owned by the trust and defaults by borrowers. To the extent the Fund invests in foreign REITs, the Fund may be subject to fluctuations in currency rates or political or economic conditions in a particular country.
High-yield/high-risk bonds, also known as “junk” bonds, involve a greater risk of default and price volatility than investment grade bonds. High-yield/high-risk bonds can experience sudden and sharp price swings which will affect net asset value.
This Fund may have significant exposure to emerging markets. In general, emerging market investments have historically been subject to significant gains and/or losses. As such, the Fund’s returns and NAV may be subject to volatility.
Sovereign debt securities are subject to the additional risk that, under some political, diplomatic, social or economic circumstances, some developing countries that issue lower quality debt securities may be unable or unwilling to make principal or interest payments as they come due.
The Fund may invest in derivatives which can be highly volatile and involve additional risks than if the underlying securities were held directly by the Fund. Such risks include gains or losses which, as a result of leverage, can be substantially greater than the derivatives’ original cost. There is also a possibility that derivatives may not perform as intended which can reduce opportunity for gains or result in losses by offsetting positive returns in other securities the Fund owns.
For a period of three years subsequent to the Fund’s commencement of operations or until the Fund’s assets exceed the first breakpoint in the investment advisory fee schedule, whichever occurs first, Janus Capital may recover from the Fund fees and expenses previously waived or reimbursed, which could then be considered a deferral, if the Fund’s expense ratio, including recovered expenses, falls below the expense limit.
Due to certain investment strategies, the Fund may have an increased position in cash.
The Fund will normally invest at least 80% of its net assets, measured at the time of purchase, in the type of securities described by its name.
Returns include reinvestment of dividends from net investment income and distributions from capital gains. The returns shown do not reflect the deduction of taxes that a shareholder would pay on Fund distributions or the redemption of Fund shares. The returns do not include adjustments in accordance with generally accepted accounting principles required at the period end for financial reporting purposes.
Lipper, a wholly-owned subsidiary of Thomson Reuters, provides independent insight on global collective investments including mutual funds, retirement funds, hedge funds, fund fees and expenses to the asset management and media communities. Lipper ranks the performance of mutual funds within a classification of funds that have similar investment objectives. Rankings are historical with capital gains and dividends reinvested and do not include the effect of loads.
Ranking is for Class I Shares only; other classes may have different performance characteristics. When an expense waiver is in effect, it may have a material effect on the total return and yield, and therefore the ranking for the period.
26 | DECEMBER 31, 2011
(unaudited)
There is no assurance that the investment process will consistently lead to successful investing.
See Notes to Schedules of Investments for index definitions.
The Fund’s portfolio may differ significantly from the securities held in the indices. The indices are unmanaged and are not available for direct investment; therefore, their performance does not reflect the expenses associated with the active management of an actual portfolio.
See “Explanations of Charts, Tables and Financial Statements.”
| | | |
| * | | The Fund’s inception date – December 28, 2010 |
| (1) | | Closed to new investors. |
The examples below show you the ongoing costs (in dollars) of investing in your Fund and allow you to compare these costs with those of other mutual funds. Please refer to the section Useful Information About Your Fund Report for a detailed explanation of the information presented in these charts.
| | | | | | | | | | | | | | | |
| | | Beginning Account Value
| | Ending Account Value
| | Expenses Paid During Period
| | |
| Expense Example – Class A Shares | | (7/1/11) | | (12/31/11) | | (7/1/11 - 12/31/11)† | | |
| |
| |
| Actual | | $ | 1,000.00 | | | $ | 1,014.40 | | | $ | 5.06 | | | |
| |
| |
Hypothetical
(5% return before expenses) | | $ | 1,000.00 | | | $ | 1,020.11 | | | $ | 5.08 | | | |
| |
| |
| | | | | | | | | | | | | | | |
| | | | | | | | | | | | | | | |
| | | Beginning Account Value
| | Ending Account Value
| | Expenses Paid During Period
| | |
| Expense Example – Class C Shares | | (7/1/11) | | (12/31/11) | | (7/1/11 - 12/31/11)† | | |
| |
| |
| Actual | | $ | 1,000.00 | | | $ | 1,010.60 | | | $ | 8.84 | | | |
| |
| |
Hypothetical
(5% return before expenses) | | $ | 1,000.00 | | | $ | 1,016.34 | | | $ | 8.87 | | | |
| |
| |
| | | | | | | | | | | | | | | |
| | | | | | | | | | | | | | | |
| | | Beginning Account Value
| | Ending Account Value
| | Expenses Paid During Period
| | |
| Expense Example – Class D Shares | | (7/1/11) | | (12/31/11) | | (7/1/11 - 12/31/11)† | | |
| |
| |
| Actual | | $ | 1,000.00 | | | $ | 1,015.10 | | | $ | 4.41 | | | |
| |
| |
Hypothetical
(5% return before expenses) | | $ | 1,000.00 | | | $ | 1,020.76 | | | $ | 4.42 | | | |
| |
| |
| | | | | | | | | | | | | | | |
| | | | | | | | | | | | | | | |
| | | Beginning Account Value
| | Ending Account Value
| | Expenses Paid During Period
| | |
| Expense Example – Class I Shares | | (7/1/11) | | (12/31/11) | | (7/1/11 - 12/31/11)† | | |
| |
| |
| Actual | | $ | 1,000.00 | | | $ | 1,015.70 | | | $ | 3.80 | | | |
| |
| |
Hypothetical
(5% return before expenses) | | $ | 1,000.00 | | | $ | 1,021.37 | | | $ | 3.81 | | | |
| |
| |
| | | | | | | | | | | | | | | |
| | | | | | | | | | | | | | | |
| | | Beginning Account Value
| | Ending Account Value
| | Expenses Paid During Period
| | |
| Expense Example – Class S Shares | | (7/1/11) | | (12/31/11) | | (7/1/11 - 12/31/11)† | | |
| |
| |
| Actual | | $ | 1,000.00 | | | $ | 1,013.10 | | | $ | 6.33 | | | |
| |
| |
Hypothetical
(5% return before expenses) | | $ | 1,000.00 | | | $ | 1,018.85 | | | $ | 6.34 | | | |
| |
| |
| | | | | | | | | | | | | | | |
| | | | | | | | | | | | | | | |
| | | Beginning Account Value
| | Ending Account Value
| | Expenses Paid During Period
| | |
| Expense Example – Class T Shares | | (7/1/11) | | (12/31/11) | | (7/1/11 - 12/31/11)† | | |
| |
| |
| Actual | | $ | 1,000.00 | | | $ | 1,014.50 | | | $ | 5.06 | | | |
| |
| |
Hypothetical
(5% return before expenses) | | $ | 1,000.00 | | | $ | 1,020.11 | | | $ | 5.08 | | | |
| |
| |
| | | |
| † | | Expenses are equal to the annualized expense ratio of 1.00% for Class A Shares, 1.75% for Class C Shares, 0.87% for Class D Shares, 0.75% for Class I Shares, 1.25% for Class S Shares and 1.00% for Class T Shares multiplied by the average account value over the period, multiplied by 184/366 (to reflect the one-half year period). Expenses include effect of contractual waivers by Janus Capital. |
Janus Fixed Income & Money Market Funds | 27
Janus Global Bond Fund
Schedule of Investments (unaudited)
As of December 31, 2011
| | | | | | | | | | | |
| Shares or Principal Amount | | Value | | | |
| |
| Asset-Backed/Commercial Mortgage-Backed Securities – 7.1% | | | | | | |
| EUR | 500,000 | | | Arena BV
2.2920%, 10/17/51**,‡ | | $ | 624,194 | | | |
| $ | 23,000 | | | Bear Stearns Commercial Mortgage Securities
5.5370%, 10/12/41 | | | 25,821 | | | |
| | 98,240 | | | CLI Funding LLC
4.9400%, 10/15/26 (144A),‡ | | | 96,359 | | | |
| | 17,000 | | | Commercial Mortgage Pass Through Certificates
5.8137%, 12/10/49‡ | | | 18,976 | | | |
| GBP | 124,369 | | | DECO Series
4.7745%, 5/22/21**,‡ | | | 179,107 | | | |
| EUR | 100,000 | | | Dutch MBS BV
3.3000%, 7/2/37**,‡ | | | 125,572 | | | |
| EUR | 500,000 | | | Dutch Mortgage Portfolio
2.6100%, 11/20/35**,‡ | | | 613,122 | | | |
| | 69,000 | | | FREMF Mortgage Trust
4.9329%, 7/25/21‡ | | | 60,306 | | | |
| | 29,000 | | | FREMF Mortgage Trust
4.7507%, 10/25/21 (144A),‡ | | | 24,532 | | | |
| | 71,000 | | | FREMF Mortgage Trust
4.7705%, 4/25/44 (144A),‡ | | | 65,635 | | | |
| | 111,000 | | | FREMF Mortgage Trust
4.8868%, 7/25/44 (144A),‡ | | | 102,765 | | | |
| | 121,000 | | | GS Mortgage Securities Corp. II
5.5600%, 11/10/39 | | | 132,846 | | | |
| | 84,000 | | | JPMorgan Chase Commercial Mortgage Securities Corp.
3.6620%, 7/5/24 (144A) | | | 86,133 | | | |
| | 13,000 | | | JPMorgan Chase Commercial Mortgage Securities Corp.
5.6330%, 12/5/27 (144A) | | | 14,780 | | | |
| | 13,000 | | | JPMorgan Chase Commercial Mortgage Securities Corp.
5.8748%, 4/15/45‡ | | | 14,590 | | | |
| | 21,000 | | | Morgan Stanley Capital I
3.8840%, 2/15/16 (144A) | | | 22,067 | | | |
| | 200,000 | | | Penarth Master Issuer PLC
0.9346%, 7/18/13 (144A),‡ | | | 199,339 | | | |
| |
| |
| Total Asset-Backed/Commercial Mortgage-Backed Securities (cost $2,574,701) | | | 2,406,144 | | | |
| |
| |
| Bank Loan – 0.1% | | | | | | |
| Food – Miscellaneous/Diversified – 0.1% | | | | | | |
| | 34,785 | | | Del Monte Foods Co.
4.5000%, 3/8/18‡ (cost $34,708) | | | 32,959 | | | |
| |
| |
| Corporate Bonds – 45.5% | | | | | | |
| Aerospace and Defense – Equipment – 0.5% | | | | | | |
| | 84,000 | | | Exelis, Inc.
4.2500%, 10/1/16 (144A) | | | 84,756 | | | |
| | 86,000 | | | Exelis, Inc.
5.5500%, 10/1/21 (144A) | | | 89,786 | | | |
| | | | | | | | 174,542 | | | |
| Agricultural Chemicals – 0.6% | | | | | | |
| | 91,000 | | | CF Industries, Inc.
6.8750%, 5/1/18 | | | 104,195 | | | |
| | 30,000 | | | CF Industries, Inc.
7.1250%, 5/1/20 | | | 35,475 | | | |
| | 24,000 | | | Mosaic Co.
3.7500%, 11/15/21 | | | 24,249 | | | |
| | 25,000 | | | Mosaic Co.
4.8750%, 11/15/41 | | | 25,843 | | | |
| | | | | | | | 189,762 | | | |
| Airlines – 0.2% | | | | | | |
| | 56,000 | | | Southwest Airlines Co.
5.1250%, 3/1/17 | | | 59,019 | | | |
| Apparel Manufacturers – 0.3% | | | | | | |
| | 25,000 | | | Levi Strauss & Co.
8.8750%, 4/1/16 | | | 26,000 | | | |
| | 100,000 | | | Quiksilver, Inc.
6.8750%, 4/15/15 | | | 92,875 | | | |
| | | | | | | | 118,875 | | | |
| Beverages – Wine and Spirits – 1.8% | | | | | | |
| EUR | 250,000 | | | Pernod-Ricard S.A.
4.8750%, 3/18/16** | | | 337,727 | | | |
| | 150,000 | | | Pernod-Ricard S.A.
5.7500%, 4/7/21 (144A),** | | | 169,230 | | | |
| | 86,000 | | | Pernod-Ricard S.A.
4.4500%, 1/15/22 (144A),** | | | 90,092 | | | |
| | | | | | | | 597,049 | | | |
| Brewery – 0.2% | | | | | | |
| | 60,000 | | | Anheuser-Busch InBev Worldwide, Inc.
1.5000%, 7/14/14 | | | 60,429 | | | |
| Building Products – Cement and Aggregate – 0.1% | | | | | | |
| | 16,000 | | | CRH America, Inc.
4.1250%, 1/15/16 | | | 15,975 | | | |
| | 10,000 | | | CRH America, Inc.
5.7500%, 1/15/21 | | | 10,195 | | | |
| | | | | | | | 26,170 | | | |
| Cable/Satellite Television – 0.9% | | | | | | |
| | 70,000 | | | Comcast Corp.
5.1500%, 3/1/20 | | | 79,606 | | | |
| EUR | 200,000 | | | Nara Cable Funding, Ltd.
8.8750%, 12/1/18 (144A),** | | | 227,761 | | | |
| | | | | | | | 307,367 | | | |
| Cellular Telecommunications – 0.6% | | | | | | |
| | 200,000 | | | America Movil S.A.B. de C.V.
2.3750%, 9/8/16 | | | 199,443 | | | |
| Chemicals – Diversified – 1.2% | | | | | | |
| | 120,000 | | | Lyondell Chemical Co.
8.0000%, 11/1/17 | | | 131,100 | | | |
| | 49,910 | | | Lyondell Chemical Co.
11.0000%, 5/1/18 | | | 54,527 | | | |
| | 200,000 | | | LyondellBasell Industries N.V.
6.0000%, 11/15/21 (144A),** | | | 207,500 | | | |
| | | | | | | | 393,127 | | | |
| Chemicals – Specialty – 1.0% | | | | | | |
| | 153,000 | | | Ecolab, Inc.
3.0000%, 12/8/16 | | | 158,265 | | | |
| | 128,000 | | | Ecolab, Inc.
4.3500%, 12/8/21 | | | 136,690 | | | |
| | 38,000 | | | Ecolab, Inc.
5.5000%, 12/8/41 | | | 42,109 | | | |
| | | | | | | | 337,064 | | | |
| | | | | | | | | | | |
See Notes to Schedules of Investments and Financial Statements.
28 | DECEMBER 31, 2011
Schedule of Investments (unaudited)
As of December 31, 2011
| | | | | | | | | | | |
| Shares or Principal Amount | | Value | | | |
| |
| Commercial Banks – 2.5% | | | | | | |
| $ | 13,000 | | | Abbey National Treasury Services PLC
2.0022%, 4/25/14**,‡ | | $ | 11,835 | | | |
| | 100,000 | | | Barclays Bank PLC
5.0000%, 9/22/16** | | | 103,566 | | | |
| | 63,000 | | | CIT Group, Inc.
5.2500%, 4/1/14 (144A) | | | 62,764 | | | |
| | 150,000 | | | HSBC Bank PLC
4.7500%, 1/19/21 (144A),** | | | 155,545 | | | |
| EUR | 100,000 | | | Nordea Bank A.B.
3.7500%, 2/24/17 | | | 131,572 | | | |
| EUR | 35,000 | | | Rabobank Nederland N.V.
4.3750%, 5/5/16** | | | 47,998 | | | |
| | 100,000 | | | Standard Chartered PLC
3.2000%, 5/12/16 (144A),** | | | 97,853 | | | |
| EUR | 150,000 | | | Standard Chartered PLC
3.8750%, 10/20/16** | | | 196,611 | | | |
| | 55,000 | | | Zions Bancorp.
7.7500%, 9/23/14 | | | 58,316 | | | |
| | | | | | | | 866,060 | | | |
| Commercial Services – Finance – 0.2% | | | | | | |
| | 66,000 | | | Western Union Co.
3.6500%, 8/22/18 | | | 67,669 | | | |
| Computers – Memory Devices – 0% | | | | | | |
| | 14,000 | | | Seagate Technology
10.0000%, 5/1/14 (144A) | | | 15,838 | | | |
| Consulting Services – 1.1% | | | | | | |
| | 77,000 | | | Verisk Analytics, Inc.
4.8750%, 1/15/19 | | | 77,685 | | | |
| | 195,000 | | | Verisk Analytics, Inc.
5.8000%, 5/1/21** | | | 209,917 | | | |
| GBP | 50,000 | | | WPP PLC
6.0000%, 4/4/17** | | | 85,972 | | | |
| | | | | | | | 373,574 | | | |
| Containers – Paper and Plastic – 0.2% | | | | | | |
| | 24,000 | | | Sonoco Products Co.
4.3750%, 11/1/21 | | | 24,858 | | | |
| | 38,000 | | | Sonoco Products Co.
5.7500%, 11/1/40 | | | 40,603 | | | |
| | | | | | | | 65,461 | | | |
| Data Processing and Management – 0.2% | | | | | | |
| | 48,000 | | | Fiserv, Inc.
3.1250%, 10/1/15 | | | 49,171 | | | |
| | 13,000 | | | Fiserv, Inc.
3.1250%, 6/15/16 | | | 13,237 | | | |
| | 13,000 | | | Fiserv, Inc.
4.7500%, 6/15/21 | | | 13,601 | | | |
| | | | | | | | 76,009 | | | |
| Diversified Banking Institutions – 2.9% | | | | | | |
| | 30,000 | | | Bank of America Corp.
4.5000%, 4/1/15 | | | 28,949 | | | |
| EUR | 185,000 | | | Citigroup, Inc.
4.7500%, 11/12/13 | | | 241,361 | | | |
| | 18,000 | | | Goldman Sachs Group, Inc.
3.6250%, 2/7/16 | | | 17,392 | | | |
| | 96,000 | | | JPMorgan Chase & Co.
5.7500%, 1/2/13 | | | 99,585 | | | |
| | 35,000 | | | JPMorgan Chase & Co.
6.0000%, 1/15/18 | | | 39,049 | | | |
| | 170,000 | | | JPMorgan Chase & Co.
4.2500%, 10/15/20 | | | 171,194 | | | |
| | 100,000 | | | Morgan Stanley
3.4500%, 11/2/15 | | | 92,069 | | | |
| EUR | 50,000 | | | Morgan Stanley
4.0000%, 11/17/15 | | | 59,265 | | | |
| | 185,000 | | | Morgan Stanley
5.6250%, 9/23/19 | | | 171,324 | | | |
| | 26,000 | | | Royal Bank of Scotland PLC
4.3750%, 3/16/16** | | | 24,804 | | | |
| | 30,000 | | | Royal Bank of Scotland PLC
5.6250%, 8/24/20** | | | 28,774 | | | |
| | | | | | | | 973,766 | | | |
| Diversified Financial Services – 1.2% | | | | | | |
| | 390,000 | | | General Electric Capital Corp.
4.3750%, 9/16/20 | | | 398,535 | | | |
| Diversified Minerals – 0.1% | | | | | | |
| | 43,000 | | | Teck Resources, Ltd.
10.2500%, 5/15/16** | | | 49,450 | | | |
| Diversified Operations – 0.1% | | | | | | |
| | 39,000 | | | Danaher Corp.
2.3000%, 6/23/16 | | | 40,536 | | | |
| Diversified Operations – Commercial Services – 0.1% | | | | | | |
| | 33,000 | | | ARAMARK Corp.
8.5000%, 2/1/15 | | | 33,825 | | | |
| Electric – Generation – 0% | | | | | | |
| | 8,000 | | | AES Corp.
7.7500%, 10/15/15 | | | 8,700 | | | |
| Electric – Integrated – 2.3% | | | | | | |
| | 31,000 | | | Calpine Construction Finance Co. L.P.
8.0000%, 6/1/16 (144A) | | | 33,480 | | | |
| | 9,000 | | | CMS Energy Corp.
4.2500%, 9/30/15 | | | 9,096 | | | |
| | 46,000 | | | CMS Energy Corp.
5.0500%, 2/15/18 | | | 45,885 | | | |
| EUR | 200,000 | | | Enel Finance International N.V.
5.7500%, 10/24/18** | | | 255,174 | | | |
| | 25,000 | | | Florida Power Corp.
3.1000%, 8/15/21 | | | 25,579 | | | |
| | 42,000 | | | Great Plains Energy, Inc.
4.8500%, 6/1/21 | | | 44,026 | | | |
| | 9,000 | | | Pacific Gas & Electric Co.
3.2500%, 9/15/21 | | | 9,132 | | | |
| | 305,000 | | | PPL Energy Supply LLC
4.6000%, 12/15/21 | | | 309,300 | | | |
| | 16,000 | | | PPL WEM Holdings PLC
3.9000%, 5/1/16 (144A),** | | | 16,038 | | | |
| | 9,000 | | | San Diego Gas & Electric Co.
3.0000%, 8/15/21 | | | 9,256 | | | |
| | 23,000 | | | Wisconsin Electric Power Co.
2.9500%, 9/15/21 | | | 23,442 | | | |
| | | | | | | | 780,408 | | | |
See Notes to Schedules of Investments and Financial Statements.
Janus Fixed Income & Money Market Funds | 29
Janus Global Bond Fund
Schedule of Investments (unaudited)
As of December 31, 2011
| | | | | | | | | | | |
| Shares or Principal Amount | | Value | | | |
| |
| Electric – Transmission – 1.6% | | | | | | |
| GBP | 210,000 | | | SPI Australia Assets Pty, Ltd.
5.1250%, 2/11/21 | | $ | 357,352 | | | |
| GBP | 100,000 | | | Western Power Distribution (West Midlands) PLC
5.7500%, 4/16/32** | | | 172,618 | | | |
| | | | | | | | 529,970 | | | |
| Electronic Components – Semiconductors – 0.7% | | | | | | |
| $ | 85,000 | | | National Semiconductor Corp.
3.9500%, 4/15/15 | | | 91,817 | | | |
| | 100,000 | | | STATS ChipPAC, Ltd.
7.5000%, 8/12/15 (144A) | | | 104,500 | | | |
| | 33,000 | | | Texas Instruments, Inc.
2.3750%, 5/16/16 | | | 34,375 | | | |
| | | | | | | | 230,692 | | | |
| Electronic Measuring Instruments – 0.4% | | | | | | |
| | 122,000 | | | FLIR Systems, Inc.
3.7500%, 9/1/16 | | | 121,540 | | | |
| Electronics – Military – 0.5% | | | | | | |
| | 100,000 | | | L-3 Communications Corp.
6.3750%, 10/15/15 | | | 102,500 | | | |
| | 61,000 | | | L-3 Communications Corp.
4.7500%, 7/15/20 | | | 60,271 | | | |
| | | | | | | | 162,771 | | | |
| Finance – Auto Loans – 1.8% | | | | | | |
| | 344,000 | | | Ford Motor Credit Co. LLC
3.8750%, 1/15/15 | | | 342,716 | | | |
| | 100,000 | | | Ford Motor Credit Co. LLC
6.6250%, 8/15/17 | | | 108,856 | | | |
| | 125,000 | | | Ford Motor Credit Co. LLC
8.1250%, 1/15/20 | | | 147,134 | | | |
| | | | | | | | 598,706 | | | |
| Finance – Consumer Loans – 0.3% | | | | | | |
| | 17,000 | | | John Deere Capital Corp.
3.9000%, 7/12/21 | | | 18,505 | | | |
| | 69,000 | | | SLM Corp.
6.2500%, 1/25/16 | | | 67,101 | | | |
| | | | | | | | 85,606 | | | |
| Finance – Credit Card – 0.2% | | | | | | |
| | 80,000 | | | American Express Credit Co.
2.8000%, 9/19/16 | | | 80,392 | | | |
| Finance – Investment Bankers/Brokers – 0.4% | | | | | | |
| | 65,000 | | | Jefferies Group, Inc.
5.1250%, 4/13/18 | | | 57,200 | | | |
| | 64,000 | | | Lazard Group LLC
7.1250%, 5/15/15 | | | 68,722 | | | |
| | 3,000 | | | Lazard Group LLC
6.8500%, 6/15/17 | | | 3,147 | | | |
| | | | | | | | 129,069 | | | |
| Finance – Mortgage Loan Banker – 0.4% | | | | | | |
| | 142,000 | | | Northern Rock Asset Management PLC
5.6250%, 6/22/17 (144A),** | | | 149,313 | | | |
| Food – Meat Products – 0.3% | | | | | | |
| | 26,000 | | | Smithfield Foods, Inc.
7.7500%, 5/15/13 | | | 27,560 | | | |
| | 73,000 | | | Smithfield Foods, Inc.
10.0000%, 7/15/14 | | | 84,863 | | | |
| | | | | | | | 112,423 | | | |
| Food – Miscellaneous/Diversified – 0.1% | | | | | | |
| | 26,000 | | | Kellogg Co.
3.2500%, 5/21/18 | | | 27,342 | | | |
| Investment Management and Advisory Services – 0% | | | | | | |
| | 10,000 | | | Ameriprise Financial, Inc.
7.5180%, 6/1/66‡ | | | 10,075 | | | |
| Life and Health Insurance – 0.3% | | | | | | |
| | 106,000 | | | Prudential Financial, Inc.
3.6250%, 9/17/12 | | | 107,643 | | | |
| Linen Supply & Related Items – 0.1% | | | | | | |
| | 19,000 | | | Cintas Corp. No. 2
2.8500%, 6/1/16 | | | 19,485 | | | |
| | 16,000 | | | Cintas Corp. No. 2
4.3000%, 6/1/21 | | | 17,187 | | | |
| | | | | | | | 36,672 | | | |
| Lottery Services – 0.2% | | | | | | |
| EUR | 50,000 | | | Lottomatica SpA
5.3750%, 2/2/18** | | | 57,264 | | | |
| Medical – Biomedical and Genetic – 0.5% | | | | | | |
| | 4,000 | | | Bio-Rad Laboratories, Inc.
8.0000%, 9/15/16 | | | 4,380 | | | |
| | 77,000 | | | Gilead Sciences, Inc.
4.4000%, 12/1/21 | | | 81,520 | | | |
| | 63,000 | | | Gilead Sciences, Inc.
5.6500%, 12/1/41 | | | 69,751 | | | |
| | | | | | | | 155,651 | | | |
| Medical – HMO – 0% | | | | | | |
| | 2,000 | | | Health Care Service Corp.
4.7000%, 1/15/21 (144A) | | | 2,149 | | | |
| Medical Instruments – 0.3% | | | | | | |
| | 17,000 | | | Boston Scientific Corp.
4.5000%, 1/15/15 | | | 17,840 | | | |
| | 52,000 | | | Boston Scientific Corp.
6.0000%, 1/15/20 | | | 58,049 | | | |
| | 36,000 | | | Boston Scientific Corp.
7.0000%, 11/15/35 | | | 41,470 | | | |
| | | | | | | | 117,359 | | | |
| Money Center Banks – 0.6% | | | | | | |
| | 58,000 | | | Lloyds TSB Bank PLC
4.8750%, 1/21/16** | | | 56,526 | | | |
| CAD | 150,000 | | | Lloyds TSB Bank PLC
5.2800%, 4/19/16** | | | 140,923 | | | |
| | | | | | | | 197,449 | | | |
| Multi-Line Insurance – 1.5% | | | | | | |
| | 99,000 | | | American International Group, Inc.
4.2500%, 9/15/14 | | | 96,142 | | | |
| | 43,000 | | | American International Group, Inc.
5.4500%, 5/18/17 | | | 41,092 | | | |
| | 52,000 | | | American International Group, Inc.
6.4000%, 12/15/20 | | | 52,480 | | | |
See Notes to Schedules of Investments and Financial Statements.
30 | DECEMBER 31, 2011
Schedule of Investments (unaudited)
As of December 31, 2011
| | | | | | | | | | | |
| Shares or Principal Amount | | Value | | | |
| |
| Multi-Line Insurance – (continued) | | | | | | |
| | | | | | | | | | | |
| EUR | 50,000 | | | American International Group, Inc.
8.0000%, 5/22/38 (144A),‡ | | $ | 51,764 | | | |
| $ | 199,000 | | | American International Group, Inc.
8.1750%, 5/15/58‡ | | | 177,110 | | | |
| GBP | 50,000 | | | MetLife, Inc.
5.2500%, 6/29/20 | | | 81,061 | | | |
| | | | | | | | 499,649 | | | |
| Office Automation and Equipment – 0.3% | | | | | | |
| | 104,000 | | | Xerox Corp.
5.6500%, 5/15/13 | | | 109,179 | | | |
| Oil – Field Services – 1.3% | | | | | | |
| | 200,000 | | | Korea National Oil Corp.
4.0000%, 10/27/16 (144A) | | | 205,387 | | | |
| | 101,000 | | | Schlumberger Investment S.A.
1.9500%, 9/14/16 (144A),** | | | 102,189 | | | |
| | 100,000 | | | Schlumberger Investment S.A.
3.3000%, 9/14/21 (144A),** | | | 102,734 | | | |
| | 36,000 | | | Weatherford International, Ltd.
5.1250%, 9/15/20 | | | 37,410 | | | |
| | | | | | | | 447,720 | | | |
| Oil and Gas Drilling – 0.4% | | | | | | |
| | 99,000 | | | Nabors Industries, Inc.
5.0000%, 9/15/20 | | | 100,930 | | | |
| | 46,000 | | | Rowan Cos., Inc.
5.0000%, 9/1/17 | | | 48,335 | | | |
| | | | | | | | 149,265 | | | |
| Oil Companies – Exploration and Production – 0.6% | | | | | | |
| | 116,000 | | | Anadarko Petroleum Corp.
6.4500%, 9/15/36 | | | 132,252 | | | |
| | 38,000 | | | Occidental Petroleum Corp.
1.7500%, 2/15/17 | | | 38,488 | | | |
| | 23,000 | | | Occidental Petroleum Corp.
3.1250%, 2/15/22 | | | 23,594 | | | |
| | | | | | | | 194,334 | | | |
| Oil Companies – Integrated – 1.0% | | | | | | |
| | 79,000 | | | BP Capital Markets PLC
2.2480%, 11/1/16** | | | 79,504 | | | |
| EUR | 50,000 | | | BP Capital Markets PLC
3.8300%, 10/6/17** | | | 68,753 | | | |
| | 55,000 | | | BP Capital Markets PLC
3.5610%, 11/1/21** | | | 57,259 | | | |
| EUR | 95,000 | | | Shell International Finance BV
4.3750%, 5/14/18** | | | 137,848 | | | |
| | | | | | | | 343,364 | | | |
| Oil Refining and Marketing – 0.2% | | | | | | |
| | 13,000 | | | Sunoco Logistics Partners Operations L.P.
4.6500%, 2/15/22 | | | 13,291 | | | |
| | 39,000 | | | Sunoco Logistics Partners Operations L.P.
6.1000%, 2/15/42 | | | 41,736 | | | |
| | | | | | | | 55,027 | | | |
| Paper and Related Products – 0.6% | | | | | | |
| | 44,000 | | | International Paper Co.
4.7500%, 2/15/22 | | | 46,770 | | | |
| | 134,000 | | | International Paper Co.
6.0000%, 11/15/41 | | | 145,472 | | | |
| | | | | | | | 192,242 | | | |
| Pharmacy Services – 0.7% | | | | | | |
| | 199,000 | | | Aristotle Holding, Inc.
4.7500%, 11/15/21 (144A) | | | 205,919 | | | |
| | 35,000 | | | Express Scripts, Inc.
3.1250%, 5/15/16 | | | 35,194 | | | |
| | | | | | | | 241,113 | | | |
| Pipelines – 3.1% | | | | | | |
| | 29,000 | | | Colorado Interstate Gas Co. LLC
6.8500%, 6/15/37 | | | 31,935 | | | |
| | 34,000 | | | El Paso Corp.
7.7500%, 1/15/32 | | | 39,270 | | | |
| | 43,000 | | | El Paso Pipeline Partners Operating Co. LLC
5.0000%, 10/1/21 | | | 44,256 | | | |
| | 60,000 | | | Energy Transfer Partners L.P.
5.6500%, 8/1/12 | | | 61,300 | | | |
| | 45,000 | | | Energy Transfer Partners L.P.
4.6500%, 6/1/21 | | | 44,082 | | | |
| | 106,000 | | | Kinder Morgan Finance Co. ULC
5.7000%, 1/5/16** | | | 108,385 | | | |
| | 85,000 | | | Magellan Midstream Partners L.P.
4.2500%, 2/1/21 | | | 89,089 | | | |
| | 65,000 | | | Plains All American Pipeline L.P.
3.9500%, 9/15/15 | | | 68,831 | | | |
| | 57,000 | | | Plains All American Pipeline L.P.
5.0000%, 2/1/21 | | | 62,791 | | | |
| | 23,000 | | | TC Pipelines L.P.
4.6500%, 6/15/21 | | | 24,082 | | | |
| | 180,000 | | | TransCanada PipeLines, Ltd.
3.4000%, 6/1/15** | | | 190,655 | | | |
| | 283,000 | | | Western Gas Partners L.P.
5.3750%, 6/1/21 | | | 300,028 | | | |
| | | | | | | | 1,064,704 | | | |
| Property and Casualty Insurance – 0.1% | | | | | | |
| | 21,000 | | | Progressive Corp.
3.7500%, 8/23/21 | | | 21,822 | | | |
| Property Trust – 1.3% | | | | | | |
| EUR | 338,000 | | | Prologis International Funding S.A.
5.8750%, 10/23/14** | | | 435,218 | | | |
| Real Estate Management/Services – 0.2% | | | | | | |
| | 31,000 | | | ProLogis L.P.
6.6250%, 5/15/18 | | | 33,667 | | | |
| | 39,000 | | | ProLogis L.P.
6.8750%, 3/15/20 | | | 43,303 | | | |
| | | | | | | | 76,970 | | | |
| Real Estate Operating/Development – 0.3% | | | | | | |
| | 101,000 | | | Brookfield Asset Management, Inc.
7.1250%, 6/15/12** | | | 103,429 | | | |
| REIT – Diversified – 1.3% | | | | | | |
| | 250,000 | | | Goodman Funding Pty, Ltd.
6.3750%, 11/12/20 (144A) | | | 255,088 | | | |
| EUR | 100,000 | | | Unibail-Rodamco S.E.
3.5000%, 4/6/16** | | | 131,236 | | | |
| EUR | 50,000 | | | Unibail-Rodamco S.E.
4.6250%, 9/23/16** | | | 68,563 | | | |
| | | | | | | | 454,887 | | | |
See Notes to Schedules of Investments and Financial Statements.
Janus Fixed Income & Money Market Funds | 31
Janus Global Bond Fund
Schedule of Investments (unaudited)
As of December 31, 2011
| | | | | | | | | | | |
| Shares or Principal Amount | | Value | | | |
| |
| REIT – Health Care – 0.4% | | | | | | |
| $ | 1,000 | | | HCP, Inc.
2.7000%, 2/1/14 | | $ | 999 | | | |
| | 61,000 | | | Senior Housing Properties Trust
6.7500%, 12/15/21 | | | 61,996 | | | |
| | 4,000 | | | Ventas Realty L.P. / Ventas Capital Corp.
6.5000%, 6/1/16 | | | 4,124 | | | |
| | 53,000 | | | Ventas Realty L.P. / Ventas Capital Corp.
6.7500%, 4/1/17 | | | 54,966 | | | |
| | | | | | | | 122,085 | | | |
| REIT – Office Property – 0.1% | | | | | | |
| | 52,000 | | | Reckson Operating Partnership L.P.
5.0000%, 8/15/18 | | | 50,227 | | | |
| REIT – Regional Malls – 1.3% | | | | | | |
| | 106,000 | | | Rouse Co. L.P.
7.2000%, 9/15/12 | | | 107,723 | | | |
| | 58,000 | | | Rouse Co. L.P.
6.7500%, 5/1/13 (144A) | | | 58,508 | | | |
| | 274,000 | | | Rouse Co. L.P.
6.7500%, 11/9/15 | | | 277,082 | | | |
| | | | | | | | 443,313 | | | |
| REIT – Shopping Centers – 0% | | | | | | |
| | 9,000 | | | Developers Diversified Realty Corp.
4.7500%, 4/15/18 | | | 8,611 | | | |
| Retail – Restaurants – 0.3% | | | | | | |
| | 116,000 | | | Darden Restaurants, Inc.
4.5000%, 10/15/21 | | | 119,013 | | | |
| Steel – Producers – 0.2% | | | | | | |
| | 65,000 | | | Steel Dynamics, Inc.
6.7500%, 4/1/15 | | | 66,463 | | | |
| Super-Regional Banks – 0.6% | | | | | | |
| | 15,000 | | | SunTrust Banks, Inc.
3.6000%, 4/15/16 | | | 15,275 | | | |
| | 74,000 | | | SunTrust Banks, Inc.
3.5000%, 1/20/17 | | | 74,382 | | | |
| | 69,000 | | | US Bancorp
2.2000%, 11/15/16 | | | 69,663 | | | |
| | 34,000 | | | Wells Fargo & Co.
4.6000%, 4/1/21 | | | 37,287 | | | |
| | | | | | | | 196,607 | | | |
| Telecommunication Services – 0.5% | | | | | | |
| | 96,000 | | | Qwest Corp.
6.7500%, 12/1/21 | | | 104,640 | | | |
| GBP | 50,000 | | | Virgin Media Secured Finance PLC
7.0000%, 1/15/18** | | | 82,293 | | | |
| | | | | | | | 186,933 | | | |
| Telephone – Integrated – 1.7% | | | | | | |
| | 19,000 | | | CenturyLink, Inc.
5.1500%, 6/15/17 | | | 18,832 | | | |
| | 18,000 | | | CenturyLink, Inc.
7.6000%, 9/15/39 | | | 17,663 | | | |
| | 167,000 | | | Qwest Communications International, Inc.
7.1250%, 4/1/18 | | | 173,680 | | | |
| EUR | 200,000 | | | Telecom Italia SpA
7.0000%, 1/20/17** | | | 257,745 | | | |
| | 100,000 | | | Virgin Media Finance PLC
9.5000%, 8/15/16** | | | 112,250 | | | |
| | | | | | | | 580,170 | | | |
| Transportation – Railroad – 0.5% | | | | | | |
| | 24,000 | | | Burlington Northern Santa Fe LLC
3.4500%, 9/15/21 | | | 24,736 | | | |
| | 24,000 | | | Burlington Northern Santa Fe LLC
4.9500%, 9/15/41 | | | 26,476 | | | |
| | 41,000 | | | CSX Corp.
4.7500%, 5/30/42 | | | 42,306 | | | |
| | 70,000 | | | Kansas City Southern de Mexico S.A. de C.V.
8.0000%, 2/1/18 | | | 76,650 | | | |
| | | | | | | | 170,168 | | | |
| Transportation – Services – 0% | | | | | | |
| | 4,000 | | | Asciano Finance, Ltd.
3.1250%, 9/23/15 (144A) | | | 3,868 | | | |
| |
| |
| Total Corporate Bonds (cost $15,545,670) | | | 15,461,145 | | | |
| |
| |
| Foreign Government Bonds – 16.9% | | | | | | |
| AUD | 320,000 | | | Australia Government Bond
4.7500%, 6/15/16 | | | 347,193 | | | |
| EUR | 29,000 | | | Bundesobligation
4.0000%, 10/11/13** | | | 40,092 | | | |
| EUR | 277,000 | | | Bundesobligation
2.0000%, 2/26/16** | | | 378,947 | | | |
| EUR | 66,000 | | | Bundesrepublik Deutschland
3.7500%, 1/4/17** | | | 97,568 | | | |
| EUR | 40,000 | | | Bundesschatzanweisungen
1.0000%, 12/14/12** | | | 52,243 | | | |
| CAD | 310,000 | | | Canadian Government Bond
2.7500%, 9/1/16** | | | 324,610 | | | |
| CAD | 285,000 | | | Canadian Government Bond
4.2500%, 6/1/18** | | | 326,540 | | | |
| EUR | 545,000 | | | Italy Buoni Poliennali Del Tesoro
5.0000%, 3/1/22** | | | 606,825 | | | |
| NZD | 310,000 | | | New Zealand Government Bond
6.0000%, 5/15/21 | | | 282,490 | | | |
| NOK | 2,500,000 | | | Norway Government Bond
6.5000%, 5/15/13 | | | 446,948 | | | |
| SEK | 5,100,000 | | | Sweden Government Bond
5.5000%, 10/8/12 | | | 766,312 | | | |
| GBP | 123,000 | | | United Kingdom Gilt
4.5000%, 3/7/13** | | | 200,372 | | | |
| GBP | 101,000 | | | United Kingdom Gilt
2.2500%, 3/7/14** | | | 163,412 | | | |
| GBP | 412,000 | | | United Kingdom Gilt
2.0000%, 1/22/16** | | | 671,608 | | | |
| GBP | 261,000 | | | United Kingdom Gilt
3.7500%, 9/7/20** | | | 468,798 | | | |
| GBP | 68,000 | | | United Kingdom Gilt
3.7500%, 9/7/21** | | | 122,115 | | | |
| GBP | 101,000 | | | United Kingdom Gilt
4.2500%, 3/7/36** | | | 192,437 | | | |
| GBP | 145,000 | | | United Kingdom Gilt
4.2500%, 12/7/40** | | | 277,149 | | | |
| |
| |
| Total Foreign Government Bonds (cost $5,840,452) | | | 5,765,659 | | | |
| |
| |
| Mortgage-Backed Securities – 16.4% | | | | | | |
| | | | | Fannie Mae: | | | | | | |
| | 40,540 | | | 5.0000%, 2/1/23 | | | 43,786 | | | |
| | 75,786 | | | 5.5000%, 1/1/25 | | | 82,330 | | | |
| | 39,822 | | | 5.5000%, 1/1/33 | | | 43,731 | | | |
| | 28,125 | | | 5.0000%, 11/1/33 | | | 30,416 | | | |
See Notes to Schedules of Investments and Financial Statements.
32 | DECEMBER 31, 2011
Schedule of Investments (unaudited)
As of December 31, 2011
| | | | | | | | | | | |
| Shares or Principal Amount | | Value | | | |
| |
| Mortgage-Backed Securities – (continued) | | | | | | |
| | | | | | | | | | | |
| | | | | Fannie Mae: (continued) | | | | | | |
| $ | 52,406 | | | 5.0000%, 12/1/33 | | $ | 56,674 | | | |
| | 29,688 | | | 5.0000%, 2/1/34 | | | 32,106 | | | |
| | 138,585 | | | 5.5000%, 4/1/34 | | | 151,496 | | | |
| | 234,813 | | | 5.5000%, 9/1/34 | | | 256,542 | | | |
| | 60,101 | | | 5.5000%, 5/1/35 | | | 65,625 | | | |
| | 543,706 | | | 5.5000%, 7/1/35 | | | 594,018 | | | |
| | 222,572 | | | 6.0000%, 12/1/35 | | | 248,173 | | | |
| | 457,037 | | | 5.5000%, 4/1/36 | | | 499,044 | | | |
| | 259,153 | | | 5.5000%, 7/1/36 | | | 283,134 | | | |
| | 242,754 | | | 5.5000%, 5/1/37 | | | 266,583 | | | |
| | 67,355 | | | 6.0000%, 5/1/37 | | | 74,303 | | | |
| | 61,635 | | | 5.5000%, 7/1/37 | | | 67,165 | | | |
| | 39,360 | | | 5.5000%, 3/1/38 | | | 43,223 | | | |
| | 94,156 | | | 6.0000%, 11/1/38 | | | 103,869 | | | |
| | 178,306 | | | 6.0000%, 11/1/38 | | | 197,480 | | | |
| | 34,467 | | | 4.5000%, 10/1/40 | | | 36,706 | | | |
| | 40,290 | | | 4.0000%, 12/1/40 | | | 42,620 | | | |
| | 770,552 | | | 4.0000%, 2/1/41 | | | 814,638 | | | |
| | 30,955 | | | 5.0000%, 3/1/41 | | | 33,786 | | | |
| | 94,330 | | | 4.5000%, 4/1/41 | | | 101,256 | | | |
| | 62,856 | | | 5.0000%, 4/1/41 | | | 67,975 | | | |
| | 79,048 | | | 5.0000%, 4/1/41 | | | 85,609 | | | |
| | 124,501 | | | 4.5000%, 10/1/41 | | | 132,591 | | | |
| | 81,325 | | | 5.0000%, 10/1/41 | | | 87,948 | | | |
| | | | | Freddie Mac: | | | | | | |
| | 50,221 | | | 5.0000%, 1/1/19 | | | 54,087 | | | |
| | 50,147 | | | 5.0000%, 2/1/19 | | | 54,006 | | | |
| | 68,688 | | | 5.5000%, 8/1/19 | | | 74,490 | | | |
| | 124,468 | | | 6.0000%, 1/1/38 | | | 137,133 | | | |
| | 31,976 | | | 5.5000%, 5/1/38 | | | 34,989 | | | |
| | 85,563 | | | 5.5000%, 10/1/39 | | | 93,628 | | | |
| | 71,372 | | | 4.5000%, 1/1/41 | | | 75,656 | | | |
| | 95,673 | | | 4.5000%, 5/1/41 | | | 102,245 | | | |
| | 159,288 | | | 5.0000%, 5/1/41 | | | 171,588 | | | |
| | 29,054 | | | 4.5000%, 9/1/41 | | | 30,797 | | | |
| | 62,840 | | | 4.0000%, 10/1/41 | | | 66,563 | | | |
| | | | | Ginnie Mae: | | | | | | |
| | 123,168 | | | 5.5000%, 3/15/36 | | | 139,032 | | | |
| |
| |
| Total Mortgage-Backed Securities (cost $5,545,179) | | | 5,577,041 | | | |
| |
| |
| U.S. Treasury Notes/Bonds – 10.3% | | | | | | |
| | | | | U.S. Treasury Notes/Bonds: | | | | | | |
| | 760,000 | | | 0.2500%, 11/30/13 | | | 760,089 | | | |
| | 425,000 | | | 0.2500%, 12/15/14 | | | 423,605 | | | |
| | 420,000 | | | 0.8750%, 11/30/16 | | | 421,280 | | | |
| | 29,000 | | | 2.7500%, 12/31/17 | | | 31,791 | | | |
| | 46,000 | | | 2.7500%, 2/28/18 | | | 50,435 | | | |
| | 75,000 | | | 2.3750%, 5/31/18 | | | 80,426 | | | |
| | 15,000 | | | 1.7500%, 10/31/18 | | | 15,438 | | | |
| | 577,000 | | | 2.1250%, 8/15/21 | | | 591,786 | | | |
| | 204,000 | | | 2.0000%, 11/15/21 | | | 206,327 | | | |
| | 340,000 | | | 3.7500%, 8/15/41 | | | 399,872 | | | |
| | 503,000 | | | 3.1250%, 11/15/41 | | | 526,971 | | | |
| |
| |
| Total U.S. Treasury Notes/Bonds (cost $3,449,023) | | | 3,508,020 | | | |
| |
| |
| Money Market – 4.9% | | | | | | |
| | 1,669,000 | | | Janus Cash Liquidity Fund LLC, 0%
(cost $1,669,000) | | | 1,669,000 | | | |
| |
| |
| Total Investments (total cost $34,658,733) – 101.2% | | | 34,419,968 | | | |
| |
| |
| Liabilities, net of Cash, Receivables and Other Assets– (1.2)% | | | (419,583) | | | |
| |
| |
| Net Assets – 100% | | $ | 34,000,385 | | | |
| |
| |
Summary of Investments by Country – (Long Positions)
| | | | | | | | | |
| | | | | | % of Investment
| |
| Country | | Value | | | Securities | |
| |
| |
| Australia | | $ | 963,501 | | | | 2.8% | |
| Bermuda | | | 37,410 | | | | 0.1% | |
| Canada | | | 1,103,069 | | | | 3.2% | |
| Cayman Islands | | | 15,838 | | | | 0.0% | |
| France | | | 796,848 | | | | 2.3% | |
| Germany | | | 568,850 | | | | 1.6% | |
| Ireland | | | 227,761 | | | | 0.7% | |
| Italy | | | 921,834 | | | | 2.7% | |
| Luxembourg | | | 640,141 | | | | 1.9% | |
| Mexico | | | 276,093 | | | | 0.8% | |
| Netherlands | | | 1,398,286 | | | | 4.1% | |
| New Zealand | | | 282,490 | | | | 0.8% | |
| Norway | | | 446,948 | | | | 1.3% | |
| Singapore | | | 104,500 | | | | 0.3% | |
| South Korea | | | 205,387 | | | | 0.6% | |
| Sweden | | | 897,884 | | | | 2.6% | |
| United Kingdom | | | 4,528,557 | | | | 13.2% | |
United States†† | | | 21,004,571 | | | | 61.0% | |
| |
| |
| Total | | $ | 34,419,968 | | | | 100.0% | |
| | | |
| †† | | Includes Cash Equivalents (56.2% excluding Cash Equivalents). |
Forward Currency Contracts, Open
| | | | | | | | | | | | | |
| | | Currency Units
| | | | | | Unrealized
| |
Counterparty/Currency Sold/
| | Sold/
| | | Currency
| | | Appreciation/
| |
| (Purchased) and Settlement Date | | (Purchased) | | | Value U.S. $ | | | (Depreciation) | |
| | |
| JPMorgan Chase & Co.: | | | | | | | | | | | | |
| British Pound 1/12/12 | | | 773,000 | | | $ | 1,200,133 | | | $ | 6,033 | |
| Canadian Dollar 1/12/12 | | | (153,000) | | | | (150,190) | | | | 582 | |
| Euro 1/12/12 | | | (59,000) | | | | (76,356) | | | | (67) | |
| Japanese Yen 1/12/12 | | | (539,563,000) | | | | (7,012,876) | | | | 71,822 | |
| |
| |
| Total | | | | | | $ | (6,039,289) | | | $ | 78,370 | |
| |
| |
See Notes to Schedules of Investments and Financial Statements.
Janus Fixed Income & Money Market Funds | 33
Janus High-Yield Fund (unaudited)
| | | | | | | |
Fund Snapshot
We believe a bottom-up, fundamentally driven investment process that is focused on key credit characteristics can generate risk-adjusted outperformance relative to our peers over time. Through our comprehensive research process, we seek to gain differentiated research that will allow us to invest with conviction in the high-yield space.
| | | |
Gibson Smith
co-portfolio manager | |
Darrell Watters
co-portfolio manager |
Performance Overview
For the six-month period ended December 31, 2011, Janus High-Yield Fund’s Class T Shares returned -0.78%, compared to a 0.01% return for its benchmark, the Barclays Capital U.S. Corporate High-Yield Bond Index.
Portfolio Manager Comments
The volatility in the bond markets has been mind-numbing at times, and a wake-up call to investors that key risks to the economy remain in place. We saw this reflected in the flight to safety that sent Treasury yields to near-record lows in 2011. Quite simply, the world has too much debt and not enough growth, and we are grinding through a deleveraging period that will be more painful and last longer than most investors anticipate. Unfortunately, we have also entered a period where policy actions are not necessarily effective in terms of stabilizing the imbalance and returning us to a more normal environment.
If there’s a theme for 2012 it’s that investors should get used to low rates. The Federal Reserve (Fed) has said that it expects to keep interest rates near zero into late 2014. The question now is whether the Fed will undertake a third round of quantitative easing (QE3) this year. We think the Fed isn’t ready to shoot this bullet yet, but will respond if it sees economic weakness or significant dislocation in the financial markets. We also expect easy monetary policies and low rates in Europe, where inflation expectations are falling as growth rates decline.
We expect interest rate volatility to remain high, as a risk-on/risk-off environment continues amid lack of confidence in global fiscal policy decisions. In a world that is out of balance, the bands of potential outcomes widen, making prediction more difficult. In a general sense, we have been investing against a fairly stable macro backdrop over the last 30 years. But the world changed in 2008, and since then we’ve seen massive intervention and very unconventional policy response, forcing investors to consider outcomes that exhibit much greater volatility. As long as governments around the world exhibit leverage profiles that create uncertainty, U.S. government bonds will continue to be the flight-to-quality asset of choice, due to their liquidity and perceived high quality.
Against this backdrop, we continue to believe that corporate credit offers some of the best risk -adjusted returns in the market. We entered 2011 with a similar belief. The last year was highly volatile for credit, especially financials, which had a big impact on the market. Yet underlying fundamentals continue to improve. Profit margins are high and companies are accumulating cash on balance sheets (more than $2 trillion by some estimates). Moreover, we think there is a newfound conservatism resonating across management teams and boards in the United States and Europe. Management teams are being more careful and have not been committing capital to their businesses – beyond replacement levels – as growth remains slow and uncertainty remains high. We think this will continue through 2012, fueling more free cash flow, liquidity in the system and ultimately support for credit spreads in both investment-grade and high-yield bonds.
Investment Environment
Volatility and headline risk were central themes for fixed-income investors in the second half of 2011. A rally in U.S. Treasuries became especially pronounced from late July through September, as worry mounted that the U.S. economy might slip into a double-dip recession. Investors were troubled by below-expectation U.S. gross domestic product (GDP) growth, a manufacturing slowdown and persistently weak employment, housing and consumer spending figures. Concern about high government debt levels, both in the United States and Europe, only heightened this negative market sentiment. A high-stakes political standoff in Congress in July and August over raising the U.S. debt ceiling did nothing to improve the situation. Credit rating agency Standard & Poor’s subsequently lowered the United States’ sovereign credit rating to AA+ from AAA. The downgrade was followed, ironically, by a near stampede into U.S. Treasury
34 | DECEMBER 31, 2011
(unaudited)
securities, as the darkening global economic picture made Treasuries appear to be the safest haven available.
All eyes returned to Europe in the fall, as fiscal problems in the so-called PIIGS (Portugal, Italy, Ireland, Greece and Spain) countries threatened to spiral out of control. By October, it appeared that European Union (EU) leaders would manage to contain euro-zone problems, and relieved investors briefly ventured out of Treasuries in search of higher yields. But uncertainty flooded back in November, as governments in Greece and then Italy fell amid market pressure to implement fiscal reforms. The late-November failure of the U.S. Congressional “super committee” to reach a deal to cut $1.2 trillion from the U.S. deficit added to the general malaise.
In December, some headway was made in Europe, as EU leaders announced a plan in which most members would agree to stricter fiscal rules and the European Central Bank served up a larger-than-expected $641 billion in 3-year loans. This injected some calm into the markets as volume wound down for the holidays, although investors remained concerned that credit ratings would be downgraded on one or more of the 17 euro zone countries.
Meanwhile, U.S. macroeconomic data reflected a strengthening domestic economy, with signs of increased hiring and rising consumer confidence. Fears of a double-dip recession, which mounted over the summer as U.S. economic indicators weakened, had receded by the fourth quarter.
High-yield bonds rode the waves of investor unease. U.S. high-yield corporate spreads began the six-month period at 525 bps, peaked at 876 bps on October 4 as investors nervously watched the U.S. debt ceiling debate, domestic economic indicators and the euro zone debt situation, and then began a choppy retreat to finish the period at 699 bps. During the same period, the benchmark 10-year U.S. Treasury yield narrowed by roughly 128 bps to 1.88%. Investors’ fluctuating appetite for risk has been a primary driver in fixed-income markets during the past six months, with the performance of the Treasury market confirming U.S. sovereign debt’s attraction as a safe haven during uncertain times.
Performance Discussion
Janus High-Yield Fund modestly underperformed its benchmark, the Barclays Capital U.S. Corporate High Yield Bond Index, during the six-month period ended December 31, 2011. However, because of the moderate-beta profile of the portfolio and the fact that we focus on companies that are repairing their balance sheets, we are comfortable with the results given our lower appetite for risk.
U.S. high-yield corporate credit spreads widened during the second half of 2011 as investors remained risk-averse for large portions of the period. This spread widening was partially offset by a rally in underlying interest rates, limiting the price impact. In addition, the positive carry generated by the higher yielding bonds more than offset the negative price action, resulting in a modestly negative return for Janus High-Yield Fund.
In terms of portfolio performance, and consistent with our investment process, security selection within high yield credit was the greatest contributor to relative performance. Looking at detractors, a modest cash position weighed on performance, as did certain residual equity positions that were removed from the portfolio during the period. It is important to note that cash is not an active allocation within the strategy, merely a frictional component of the investment process. Certain convertible and preferred bonds were also sources of relative underperformance. Ultimately, results came down to strong outperformance in a few names – Petrohawk Energy, Lyondell – decent outperformance in some and sharp underperformance in others, including Cengage, Springleaf Finance and Harrah’s.
Outlook
Largely because the U.S. economy is being held hostage to decisions in Europe and Washington, we expect another year of subpotential growth. We forecast U.S. gross domestic product growth of 2% in 2012, barring a worsening of the euro zone crisis and assuming that Congress extends long-term unemployment benefits and the payroll tax break until the end of the year; both are currently scheduled to expire at the end of February.
Given current high levels of productivity, we expect that hiring will continue to rise slowly as companies seek to meet essential demand. However, the modest pace will keep the unemployment rate elevated and fluctuating around the 9% level throughout the year. Excess slack in the labor market combined with slow economic growth will keep inflation from moving much higher. In our opinion, the core Consumer Price Index (CPI), excluding food and energy, will continue to accelerate through the first half of 2012, peaking at a 2.5% year-over-year growth rate before moving back below 2%. Core CPI’s recent increase has been largely due to artificial factors, including a supply/demand imbalance in the housing rental market that has pushed up owners’ equivalent rent (OER), a major component of core CPI. We believe this imbalance will
Janus Fixed Income & Money Market Funds | 35
Janus High-Yield Fund (unaudited)
correct itself. Meanwhile, producer input prices are dropping, reducing the level of price pressure in the pipeline.
This low-inflation environment would give the Federal Reserve room to continue its accommodative short-term interest rate policy. The Fed has said that it plans to keep short-term interest rates near zero through late 2014. We believe there is a 50% chance that the Fed will initiate QE3 in 2012, by buying mortgage-backed securities, if market conditions warrant. In our view the likelihood of QE3 is heavily dependent on the outcome in Europe, and may be necessary if we see continued dysfunction in Washington.
We expect global economic growth to slow to roughly 2.1% in 2012, with Europe the most challenged region worldwide. In our view Europe will be in recession next year, with growth of negative 0.5% to negative 1%. Policy risk remains high in all regions of the world. We expect inflation to decline globally as commodity prices level out and the pace of growth slows.
We believe that Treasury yields will remain relatively range-bound in 2012 due to the continued headline risk from Europe, political deadlock in Washington and automatic $1.2 trillion government spending cuts scheduled to begin in January 2013. However, we think that rates will be at the higher end of the range by the end of 2012, partly because by that point we should be on a path to stronger economic growth. The front end of the curve is anchored by the Fed’s stated intention to keep interest rates near zero until late 2014. The five-year Treasury is the pivot point and stands to benefit if the Fed implements a third round of quantitative easing. We believe that the 10-year and 30-year Treasury have little upside left, as they enjoyed a remarkable rally in 2011 but will become more vulnerable to inflation concerns the longer the Fed’s accommodative policy continues. We believe this scenario bodes well for fixed-income assets, as market participants likely will look for yield while staying away from equities due to the volatile nature of the market.
We believe there is potential for high-yield spreads to narrow during 2012 given the significant levels of cash available to businesses, conservative balance sheet management and the continued search for yield by investors. This view is balanced by our anticipation of headline-driven credit spread volatility as Europe navigates a difficult debt crisis and election-year politics in the U.S. may lead to investor uncertainty.
The high-yield portfolio continues to focus on businesses that are undergoing a period of balance sheet repair, often through debt reduction. Historically this has resulted in generally higher rating-agency ratings, however these ratings are not an active part of our research process and are merely a residual outcome. In terms of high-yield sectors, there are no sectors that are demonstrating significant mispricing, in our opinion, so our focus is more toward areas of reduced volatility in seeking to navigate the headline risks mentioned earlier. The energy sector, with an emphasis on oil and away from natural gas, is demonstrating stable cash flows and limited spread volatility. In addition, we like the cable television sector during this U.S. election year given the incremental revenues from political advertisements and companies’ ability to minimize cash flow volatility.
Top Detractors
Cengage: As the second-largest producer of higher education text books, we think Cengage is a compelling long-term growth business tied to increasing enrollments at universities across the United States. We like the company’s solid equity cushion, pricing strength and free cash flow generation. Although pressures on for-profit educators and the rental market have had a short term impact on the business, we believe this will be a transient negative. We are also constructive on the ongoing conversion to digital books, which will result in decreased used book volumes and higher margins.
Springleaf Finance: In 2010, AIG sold an 80% stake in consumer lender Springleaf Financial, formerly American General Finance, to funds managed by Fortress Investment Group. In order to drive long-term profitability and return on investment, we believe that Fortress will seek to lower funding costs, an intention that the management team underscored when it refinanced a $3 billion term loan last year. We believe Springleaf will look to diversify its funding sources via securitizations and a real estate investment trust (REIT) IPO in order to improve margins and bridge liquidity. Delinquency ratios have shown stabilization and the demographic that Springleaf targets appears underbanked in light of heightened regulatory scrutiny within the banking industry.
Top Contributors
Petrohawk Energy: Petrohawk was acquired in August 2011 by BHP Billiton, one of the largest global mining companies and the third-largest oil and gas producer in the U.S. Gulf of Mexico. Petrohawk is a Houston-based company whose oil and gas interests are concentrated primarily in U.S. onshore shale plays, specifically in Texas and Louisiana. The acquisition was expected to nearly double BHP’s oil and gas resource bases and increase
36 | DECEMBER 31, 2011
(unaudited)
the company’s production by about 10% over the next 10 years. The deal highlights growing interest in shale fracturing as a means to reduce U.S. dependence on foreign oil imports.
Lyondell: The third largest chemical producer in the United States, Lyondell in November tendered above market price for a large portion of its outstanding debt. We believe the commodity chemicals this company produces have a significant cost-of-production advantage due to the emergence of shale gas. The primary raw input to their production process is natural gas, a commodity that has experienced considerable price pressure due to excess supply, driving higher margins at Lyondell. The company’s new management team is return-on-capital driven and disciplined on investing in their business. They are also targeting an investment grade rating as debt retirement efforts continue.
On behalf of every member of our investment team, thank you for your investment in Janus High-Yield Fund. We appreciate your entrusting your assets with us, and we look forward to continuing to serve your investment needs.
Janus Fixed Income & Money Market Funds | 37
Janus High-Yield Fund (unaudited)
Janus High-Yield Fund At A Glance
December 31, 2011
| | | |
Weighted Average Maturity | | 7.3 Years |
Average Effective Duration* | | 4.1 Years |
30-day Current Yield** | | |
| Class A Shares at NAV | | |
| Without Reimbursement | | 7.25% |
| With Reimbursement | | 7.25% |
| Class A Shares at MOP | | |
| Without Reimbursement | | 6.90% |
| With Reimbursement | | 6.90% |
| Class C Shares*** | | |
| Without Reimbursement | | 6.45% |
| With Reimbursement | | 6.45% |
| Class D Shares | | |
| Without Reimbursement | | 7.38% |
| With Reimbursement | | 7.38% |
| Class I Shares | | |
| Without Reimbursement | | 7.47% |
| With Reimbursement | | 7.47% |
| Class R Shares | | |
| Without Reimbursement | | 6.75% |
| With Reimbursement | | 6.75% |
| Class S Shares | | |
| Without Reimbursement | | 7.00% |
| With Reimbursement | | 7.00% |
| Class T Shares | | |
| Without Reimbursement | | 7.26% |
| With Reimbursement | | 7.26% |
Number of Bonds/Notes | | 246 |
| | | |
| * | | A theoretical measure of price volatility |
| ** | | Yield will fluctuate |
| *** | | Does not include the 1.00% contingent deferred sales charge. |
Ratings†Summary – (% of Investment Securities )
December 31, 2011
| | | |
A | | 2.2% |
BBB | | 5.9% |
BB | | 28.3% |
B | | 47.6% |
CCC | | 13.3% |
CC | | 0.3% |
Other | | 2.4% |
| | | |
| † | | Rated by Standard & Poor’s |
Significant Areas of Investment – (% of Net Assets)
As of December 31, 2011
Asset Allocation – (% of Net Assets)
As of December 31, 2011
Emerging markets comprised 1.0% of total net assets.
38 | DECEMBER 31, 2011
(unaudited)
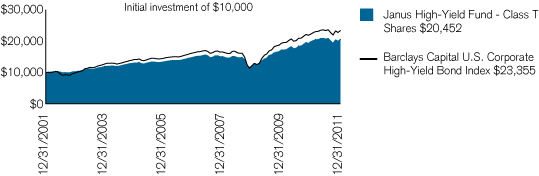
| | | | | | | | | | | | | | | | |
| Average Annual Total Return – for the periods ended December 31, 2011 | | | Expense Ratios – per the October 28, 2011 prospectuses |
| | | Fiscal
| | One
| | Five
| | Ten
| | Since
| | | Total Annual Fund
| | Net Annual Fund
|
| | | Year-to-Date | | Year | | Year | | Year | | Inception* | | | Operating Expenses | | Operating Expenses |
| | | | | | | | | | | | | | | | |
| Janus High-Yield Fund – Class A Shares | | | | | | | | | | | | | | | |
| | | | | | | | | | | | | | | | |
| NAV | | –0.80% | | 3.16% | | 6.48% | | 7.34% | | 7.78% | | | 0.93% | | 0.93% |
| | | | | | | | | | | | | | | | |
| MOP | | –5.56% | | –1.71% | | 5.45% | | 6.82% | | 7.46% | | | | | |
| | | | | | | | | | | | | | | | |
| Janus High-Yield Fund – Class C Shares | | | | | | | | | | | | | | | |
| | | | | | | | | | | | | | | | |
| NAV | | –1.19% | | 2.33% | | 5.74% | | 6.59% | | 7.02% | | | 1.69% | | 1.69% |
| | | | | | | | | | | | | | | | |
| CDSC | | –2.14% | | 1.37% | | 5.74% | | 6.59% | | 7.02% | | | | | |
| | | | | | | | | | | | | | | | |
| Janus High-Yield Fund – Class D Shares(1) | | –0.72% | | 3.32% | | 6.62% | | 7.44% | | 7.85% | | | 0.77% | | 0.77% |
| | | | | | | | | | | | | | | | |
| Janus High-Yield Fund – Class I Shares | | –0.58% | | 3.36% | | 6.58% | | 7.42% | | 7.83% | | | 0.71% | | 0.71% |
| | | | | | | | | | | | | | | | |
| Janus High-Yield Fund – Class R Shares | | –1.03% | | 2.74% | | 6.01% | | 6.85% | | 7.29% | | | 1.34% | | 1.34% |
| | | | | | | | | | | | | | | | |
| Janus High-Yield Fund – Class S Shares | | –0.90% | | 2.95% | | 6.30% | | 7.12% | | 7.56% | | | 1.14% | | 1.14% |
| | | | | | | | | | | | | | | | |
| Janus High-Yield Fund – Class T Shares | | –0.78% | | 3.20% | | 6.58% | | 7.42% | | 7.83% | | | 0.89% | | 0.89% |
| | | | | | | | | | | | | | | | |
| Barclays Capital U.S. Corporate High-Yield Bond Index | | 0.01% | | 4.98% | | 7.54% | | 8.85% | | 7.18% | | | | | |
| | | | | | | | | | | | | | | | |
| Lipper Quartile – Class T Shares | | – | | 3rd | | 1st | | 2nd | | 1st | | | | | |
| | | | | | | | | | | | | | | | |
| Lipper Ranking – based on total returns for High Current Yield Funds | | – | | 264/491 | | 68/356 | | 92/238 | | 7/81 | | | | | |
| | | | | | | | | | | | | | | | |
| Visit janus.com/advisor/mutual-funds (or janus.com/allfunds if you hold Shares directly with Janus Capital) to view current performance and characteristic information | | | | | |
| | | | | | | | | | | | | | | | |
Data presented represents past performance, which is no guarantee of future results. Investment results and principal value will fluctuate so that shares, when redeemed, may be worth more or less than their original cost. Due to market volatility, current performance may be higher or lower than the performance shown. Call 877.33JANUS(52687) (or 800.525.3713 if you hold shares directly with Janus Capital) or visit janus.com/advisor/mutual-funds (or janus.com/allfunds if you hold shares directly with Janus Capital) for performance current to the most recent month-end.
Performance shown for Class A Shares at Maximum Offering Price (MOP) includes the Fund’s maximum sales charge of 4.75%. Performance shown at Net Asset Value (NAV) does not include this charge and would have been lower had this charge been taken into account.
See important disclosures on the next page.
Janus Fixed Income & Money Market Funds | 39
Janus High-Yield Fund (unaudited)
Performance shown for Class C Shares includes a 1% contingent deferred sales charge (CDSC) on periods of less than 12 months. Performance shown at Net Asset Value (NAV) does not include this sales charge and would have been lower had this sales charge been taken into account.
For Class D Shares, Class I Shares, Class R Shares, Class S Shares and Class T Shares, a 2% redemption fee may be imposed on shares held for 90 days or less. Performance shown does not reflect this redemption fee and, if reflected, performance would have been lower.
Janus Capital has contractually agreed to waive the Fund’s total annual fund operating expenses allocated to any class (excluding the distribution and shareholder servicing fees (applicable to Class A Shares, Class C Shares, Class R Shares and Class S Shares), administrative services fees payable pursuant to the Transfer Agency Agreement (except for networking and omnibus fees), brokerage commissions, interest, dividends, taxes, acquired fund fees and expenses, and extraordinary expenses) to certain limits until at least November 1, 2012. The contractual waiver may be terminated or modified prior to this date only at the discretion of the Board of Trustees. Returns shown include fee waivers, if any, and without such waivers, returns would have been lower.
The expense information shown was determined based on net assets as of the fiscal period ended June 30, 2011. The effect of contractual waivers agreed to by Janus Capital, when applicable, are reflected under “Net Annual Fund Operating Expenses.” (All expenses are shown without the effect of expense offset arrangements. Pursuant to such arrangements, credits realized as a result of uninvested cash balances are used to reduce custodian and transfer agent expenses.)
The Fund’s performance may be affected by risks that include those associated with non-investment grade debt securities, investments in specific industries or countries and potential conflicts of interest with the Janus “funds of funds.” Additional risks to the Fund may include those associated with investing in foreign securities, emerging markets, initial public offerings (“IPOs”), real estate investment trusts (“REITs”), and derivatives. Please see a Janus prospectus or janus.com/info (or janus.com/reports if you hold shares directly with Janus Capital) for more information about risks, portfolio holdings and other details.
Funds that invest in bonds have the same interest rate, inflation, and credit risks that are associated with the underlying bonds owned by the Fund. Unlike owning individual bonds, there are ongoing fees and expenses associated with owning shares of Fixed Income Funds. The return of principal is not guaranteed due to net asset value fluctuation that is caused by changes in the price of specific bonds held in the Fund and selling of bonds within the Fund by the portfolio managers.
High-yield/high-risk bonds, also known as “junk” bonds, involve a greater risk of default and price volatility than investment grade bonds. High-yield/high-risk bonds can experience sudden and sharp price swings which will affect net asset value.
The Fund invests in REITs, which may be subject to a higher degree of market risk because of concentration in a specific industry, sector or geographic region. REITs may be subject to risks including, but not limited to: legal, political, liquidity, and interest rate risks, a decline in the value of real estate, risks related to general and economic conditions, changes in the value of the underlying property owned by the trust and defaults by borrowers. To the extent the Fund invests in foreign REITs, the Fund may be subject to fluctuations in currency rates or political or economic conditions in a particular country.
The Fund will normally invest at least 80% of its net assets, measured at the time of purchase, in the type of securities described by its name.
Returns include reinvestment of dividends from net investment income and distributions from capital gains. The returns shown do not reflect the deduction of taxes that a shareholder would pay on Fund distributions or the redemption of Fund shares. The returns do not include adjustments in accordance with generally accepted accounting principles required at the period end for financial reporting purposes.
Class A Shares, Class C Shares, Class R Shares, and Class S Shares of the Fund commenced operations on July 6, 2009. The historical performance shown for periods prior to July 6, 2009 reflects the performance of one or more other share classes of the Fund, calculated using the fees and expenses of each respective share class without the effect of any fee and expense limitations and waivers. If each share class of the Fund had been available during periods prior to July 6, 2009, the performance shown may have been different. Please refer to the Fund’s prospectus for further details concerning historical performance.
Class D Shares of the Fund commenced operations on February 16, 2010, as a result of the restructuring of Class J Shares, the predecessor share class. The performance shown for Class D Shares for periods prior to February 16, 2010 reflects the performance of the Fund’s former Class J Shares. If Class D Shares of the Fund had been available during periods prior to February 16, 2010, the performance shown may have been different. The performance shown for periods following the Fund’s commencement of Class D Shares reflects the fees and expenses of Class D Shares, net of any fee and expense limitations or waivers.
Class I Shares commenced operations on July 6, 2009. Performance shown for Class I Shares for periods prior to July 6, 2009, reflects the performance of the Fund’s Class J Shares, the initial share class, calculated using the fees and expenses of Class J Shares, without the effect of any fee and expense limitations or waivers. If Class I Shares of the Fund had been available during periods prior to July 6, 2009, the performance shown may have been different. The performance shown for periods following the Fund’s commencement of Class I Shares reflects the fees and expenses of Class I Shares, net of any fee and expense limitations or waivers.
Lipper, a wholly-owned subsidiary of Thomson Reuters, provides independent insight on global collective investments including mutual funds, retirement funds, hedge funds, fund fees and expenses to the asset management and media communities. Lipper ranks the performance of mutual funds within a classification of funds that have similar investment objectives. Rankings are historical with capital gains and dividends reinvested and do not include the effect of loads.
Ranking is for Class T Shares only; other classes may have different performance characteristics. When an expense waiver is in effect, it may have a material effect on the total return or yield, and therefore the ranking for the period.
40 | DECEMBER 31, 2011
(unaudited)
December 31, 1995 is the date used to calculate the since-inception Lipper ranking, which is slightly different from when the Fund began operations since Lipper provides fund rankings as of the last day of the month or the first Thursday after fund inception.
There is no assurance that the investment process will consistently lead to successful investing.
See Notes to Schedules of Investments for index definitions.
The Fund’s portfolio may differ significantly from the securities held in the index. The index is unmanaged and is not available for direct investment; therefore, its performance does not reflect the expenses associated with the active management of an actual portfolio.
See “Explanations of Charts, Tables and Financial Statements.”
| | | |
| * | | The Fund’s inception date – December 29, 1995 |
| (1) | | Closed to new investors. |
The examples below show you the ongoing costs (in dollars) of investing in your Fund and allow you to compare these costs with those of other mutual funds. Please refer to the section Useful Information About Your Fund Report for a detailed explanation of the information presented in these charts.
| | | | | | | | | | | | | | | |
| | | Beginning Account Value
| | Ending Account Value
| | Expenses Paid During Period
| | |
| Expense Example – Class A Shares | | (7/1/11) | | (12/31/11) | | (7/1/11 - 12/31/11)† | | |
| |
| |
| Actual | | $ | 1,000.00 | | | $ | 992.00 | | | $ | 4.51 | | | |
| |
| |
Hypothetical
(5% return before expenses) | | $ | 1,000.00 | | | $ | 1,020.61 | | | $ | 4.57 | | | |
| |
| |
| | | | | | | | | | | | | | | |
| | | | | | | | | | | | | | | |
| | | Beginning Account Value
| | Ending Account Value
| | Expenses Paid During Period
| | |
| Expense Example – Class C Shares | | (7/1/11) | | (12/31/11) | | (7/1/11 - 12/31/11)† | | |
| |
| |
| Actual | | $ | 1,000.00 | | | $ | 988.10 | | | $ | 8.40 | | | |
| |
| |
Hypothetical
(5% return before expenses) | | $ | 1,000.00 | | | $ | 1,016.69 | | | $ | 8.52 | | | |
| |
| |
| | | | | | | | | | | | | | | |
| | | | | | | | | | | | | | | |
| | | Beginning Account Value
| | Ending Account Value
| | Expenses Paid During Period
| | |
| Expense Example – Class D Shares | | (7/1/11) | | (12/31/11) | | (7/1/11 - 12/31/11)† | | |
| |
| |
| Actual | | $ | 1,000.00 | | | $ | 992.80 | | | $ | 3.76 | | | |
| |
| |
Hypothetical
(5% return before expenses) | | $ | 1,000.00 | | | $ | 1,021.37 | | | $ | 3.81 | | | |
| |
| |
| | | | | | | | | | | | | | | |
| | | | | | | | | | | | | | | |
| | | Beginning Account Value
| | Ending Account Value
| | Expenses Paid During Period
| | |
| Expense Example – Class I Shares | | (7/1/11) | | (12/31/11) | | (7/1/11 - 12/31/11)† | | |
| |
| |
| Actual | | $ | 1,000.00 | | | $ | 993.10 | | | $ | 3.46 | | | |
| |
| |
Hypothetical
(5% return before expenses) | | $ | 1,000.00 | | | $ | 1,021.67 | | | $ | 3.51 | | | |
| |
| |
| | | | | | | | | | | | | | | |
| | | | | | | | | | | | | | | |
| | | Beginning Account Value
| | Ending Account Value
| | Expenses Paid During Period
| | |
| Expense Example – Class R Shares | | (7/1/11) | | (12/31/11) | | (7/1/11 - 12/31/11)† | | |
| |
| |
| Actual | | $ | 1,000.00 | | | $ | 989.70 | | | $ | 6.85 | | | |
| |
| |
Hypothetical
(5% return before expenses) | | $ | 1,000.00 | | | $ | 1,018.25 | | | $ | 6.95 | | | |
| |
| |
| | | | | | | | | | | | | | | |
| | | | | | | | | | | | | | | |
| | | Beginning Account Value
| | Ending Account Value
| | Expenses Paid During Period
| | |
| Expense Example – Class S Shares | | (7/1/11) | | (12/31/11) | | (7/1/11 - 12/31/11)† | | |
| |
| |
| Actual | | $ | 1,000.00 | | | $ | 991.00 | | | $ | 5.61 | | | |
| |
| |
Hypothetical
(5% return before expenses) | | $ | 1,000.00 | | | $ | 1,019.51 | | | $ | 5.69 | | | |
| |
| |
| | | | | | | | | | | | | | | |
| | | | | | | | | | | | | | | |
| | | Beginning Account Value
| | Ending Account Value
| | Expenses Paid During Period
| | |
| Expense Example – Class T Shares | | (7/1/11) | | (12/31/11) | | (7/1/11 - 12/31/11)† | | |
| |
| |
| Actual | | $ | 1,000.00 | | | $ | 992.20 | | | $ | 4.36 | | | |
| |
| |
Hypothetical
(5% return before expenses) | | $ | 1,000.00 | | | $ | 1,020.76 | | | $ | 4.42 | | | |
| |
| |
| | | |
| † | | Expenses are equal to the annualized expense ratio of 0.90% for Class A Shares, 1.68% for Class C Shares, 0.75% for Class D Shares, 0.69% for Class I Shares, 1.37% for Class R Shares, 1.12% for Class S Shares and 0.87% for Class T Shares multiplied by the average account value over the period, multiplied by 184/366 (to reflect the one-half year period). Expenses include effect of contractual waivers by Janus Capital. |
Janus Fixed Income & Money Market Funds | 41
Janus High-Yield Fund
Schedule of Investments (unaudited)
As of December 31, 2011
| | | | | | | | | | | |
| Shares or Principal Amount | | Value | | | |
| |
| Bank Loans – 4.3% | | | | | | |
| Advertising Sales – 0.1% | | | | | | |
| $ | 1,526,256 | | | Visant Corp.
5.2500%, 12/22/16‡ | | $ | 1,428,133 | | | |
| | 15,601 | | | Visant Corp.
6.2500%, 12/22/16‡ | | | 14,598 | | | |
| | | | | | | | 1,442,731 | | | |
| Bicycle Manufacturing – 0.1% | | | | | | |
| | 1,485,000 | | | SRAM, LLC
8.5000%, 12/7/18‡ | | | 1,485,000 | | | |
| Broadcast Services and Programming – 0.5% | | | | | | |
| | 10,685,000 | | | Hubbard Broadcasting, Inc.
8.7500%, 4/30/18‡ | | | 10,578,150 | | | |
| Building – Residential and Commercial – 0.1% | | | | | | |
| | 1,791,463 | | | Orleans Homebuilders, Inc.
10.5000%, 2/14/16‡ | | | 1,692,932 | | | |
| Building Products – Air and Heating – 0.2% | | | | | | |
| | 1,388,803 | | | Goodman Global, Inc.
5.7500%, 10/28/16‡ | | | 1,386,206 | | | |
| | 2,089,182 | | | Goodman Global, Inc.
9.0000%, 10/30/17‡ | | | 2,091,355 | | | |
| | | | | | | | 3,477,561 | | | |
| Casino Hotels – 1.1% | | | | | | |
| | 14,257,000 | | | Caesars Entertainment Corp.
9.2500%, 4/25/17‡ | | | 13,529,893 | | | |
| | 7,787,000 | | | MGM Resorts International
7.0000%, 2/21/14‡ | | | 7,627,989 | | | |
| | | | | | | | 21,157,882 | | | |
| Casino Services – 0.1% | | | | | | |
| | 2,299,151 | | | CCM Merger, Inc.
7.0000%, 3/1/17‡ | | | 2,274,252 | | | |
| Educational Software – 0.8% | | | | | | |
| | 18,058,000 | | | Blackboard, Inc.
11.5000%, 4/4/19‡ | | | 16,071,620 | | | |
| Food – Miscellaneous/Diversified – 0.3% | | | | | | |
| | 5,356,723 | | | Del Monte Foods Co.
4.5000%, 3/8/18‡ | | | 5,075,495 | | | |
| Food – Retail – 0.1% | | | | | | |
| | 1,504,000 | | | Great Atlantic & Pacific Tea Co.
8.7500%, 6/14/12‡ | | | 1,505,880 | | | |
| Investment Companies – 0.3% | | | | | | |
| | 5,114,559 | | | Fox Acquisition LLC
4.7500%, 7/14/15‡ | | | 4,986,644 | | | |
| Medical – Outpatient and Home Medical Care – 0.2% | | | | | | |
| | 4,781,700 | | | Res-Care, Inc.
7.2500%, 12/22/16‡ | | | 4,518,707 | | | |
| Retail – Pet Food and Supplies – 0.1% | | | | | | |
| | 2,957,130 | | | Petco Animal Supplies, Inc.
4.5000%, 11/14/17‡ | | | 2,876,193 | | | |
| Retail – Restaurants – 0.1% | | | | | | |
| | 2,306,618 | | | Burger King Corp.
4.5000%, 10/19/16‡ | | | 2,260,485 | | | |
| Toys – 0.2% | | | | | | |
| | 3,344,875 | | | Oriental Trading Co., Inc.
7.0000%, 2/11/17‡ | | | 3,223,624 | | | |
| |
| |
| Total Bank Loans (cost $84,779,528) | | | 82,627,156 | | | |
| |
| |
| Corporate Bonds – 89.4% | | | | | | |
| Advertising Services – 0.6% | | | | | | |
| | 2,471,000 | | | Checkout Holding Corp.
0%, 11/15/15 (144A) | | | 1,309,630 | | | |
| | 11,513,000 | | | Visant Corp.
10.0000%, 10/1/17 | | | 10,534,395 | | | |
| | | | | | | | 11,844,025 | | | |
| Aerospace and Defense – 2.0% | | | | | | |
| | 38,363,000 | | | ADS Tactical, Inc.
11.0000%, 4/1/18 (144A) | | | 37,979,370 | | | |
| Aerospace and Defense – Equipment – 0.6% | | | | | | |
| | 9,906,000 | | | TransDigm, Inc.
7.7500%, 12/15/18 | | | 10,648,950 | | | |
| Agricultural Chemicals – 1.0% | | | | | | |
| | 1,165,000 | | | CF Industries, Inc.
6.8750%, 5/1/18 | | | 1,333,925 | | | |
| | 12,255,000 | | | CF Industries, Inc.
7.1250%, 5/1/20 | | | 14,491,537 | | | |
| | 3,109,000 | | | Phibro Animal Health Corp.
9.2500%, 7/1/18 (144A) | | | 2,697,058 | | | |
| | | | | | | | 18,522,520 | | | |
| Airlines – 0.5% | | | | | | |
| | 966,000 | | | Delta Air Lines, Inc.
9.5000%, 9/15/14 (144A) | | | 994,980 | | | |
| | 4,473,000 | | | United Air Lines, Inc.
9.8750%, 8/1/13 (144A) | | | 4,573,642 | | | |
| | 4,341,000 | | | United Air Lines, Inc.
12.0000%, 11/1/13 (144A) | | | 4,525,493 | | | |
| | | | | | | | 10,094,115 | | | |
| Apparel Manufacturers – 0.9% | | | | | | |
| | 6,759,000 | | | Levi Strauss & Co.
8.8750%, 4/1/16 | | | 7,029,360 | | | |
| | 11,548,000 | | | Quiksilver, Inc.
6.8750%, 4/15/15 | | | 10,725,205 | | | |
| | | | | | | | 17,754,565 | | | |
| Automotive – Cars and Light Trucks – 0.7% | | | | | | |
| | 11,648,000 | | | Ford Motor Co.
7.4500%, 7/16/31** | | | 13,977,600 | | | |
| Automotive – Truck Parts and Equipment – Original – 1.4% | | | | | | |
| | 3,101,000 | | | Accuride Corp.
9.5000%, 8/1/18 | | | 2,992,465 | | | |
| | 10,897,000 | | | American Axle & Manufacturing Holdings, Inc.
9.2500%, 1/15/17 (144A) | | | 11,823,245 | | | |
| | 3,699,000 | | | International Automotive Components Group S.L.
9.1250%, 6/1/18 (144A) | | | 3,310,605 | | | |
| | 4,673,000 | | | Tenneco, Inc.
7.7500%, 8/15/18 | | | 4,953,380 | | | |
| | 4,185,000 | | | Tomkins LLC / Tomkins, Inc.
9.0000%, 10/1/18 | | | 4,640,119 | | | |
| | | | | | | | 27,719,814 | | | |
See Notes to Schedules of Investments and Financial Statements.
42 | DECEMBER 31, 2011
Schedule of Investments (unaudited)
As of December 31, 2011
| | | | | | | | | | | |
| Shares or Principal Amount | | Value | | | |
| |
| Automotive – Truck Parts and Equipment – Replacement – 0.5% | | | | | | |
| $ | 12,482,000 | | | Exide Technologies
8.6250%, 2/1/18 | | $ | 9,611,140 | | | |
| Beverages – Wine and Spirits – 1.1% | | | | | | |
| | 1,240,000 | | | Constellation Brands, Inc.
8.3750%, 12/15/14 | | | 1,391,900 | | | |
| | 16,743,000 | | | Pernod-Ricard S.A.
5.7500%, 4/7/21 (144A) | | | 18,889,469 | | | |
| | | | | | | | 20,281,369 | | | |
| Broadcast Services and Programming – 0.8% | | | | | | |
| | 14,534,000 | | | Crown Media Holdings, Inc.
10.5000%, 7/15/19 | | | 15,297,035 | | | |
| Building – Residential and Commercial – 1.0% | | | | | | |
| | 6,201,000 | | | Lennar Corp.
5.6000%, 5/31/15 | | | 6,107,985 | | | |
| | 7,441,000 | | | M/I Homes, Inc.
8.6250%, 11/15/18 | | | 6,585,285 | | | |
| | 6,201,000 | | | Meritage Homes Corp.
6.2500%, 3/15/15 | | | 6,107,985 | | | |
| | | | | | | | 18,801,255 | | | |
| Building and Construction – Miscellaneous – 0.3% | | | | | | |
| | 4,961,000 | | | American Residential Services LLC
12.0000%, 4/15/15 (144A) | | | 4,961,000 | | | |
| Building and Construction Products – Miscellaneous – 0.6% | | | | | | |
| | 9,935,000 | | | Ply Gem Industries, Inc.
13.1250%, 7/15/14 | | | 8,792,475 | | | |
| | 3,090,000 | | | Ply Gem Industries, Inc.
8.2500%, 2/15/18 | | | 2,692,163 | | | |
| | | | | | | | 11,484,638 | | | |
| Building Products – Cement and Aggregate – 0.6% | | | | | | |
| | 11,130,000 | | | Cemex Espana Luxembourg
9.2500%, 5/12/20 (144A) | | | 8,486,625 | | | |
| | 3,008,000 | | | Cemex S.A.B. de C.V.
5.3686%, 9/30/15 (144A),‡ | | | 2,237,200 | | | |
| | | | | | | | 10,723,825 | | | |
| Building Products – Doors and Windows – 0.3% | | | | | | |
| | 6,179,000 | | | Masonite International Corp.
8.2500%, 4/15/21 (144A) | | | 6,055,420 | | | |
| Building Products – Wood – 0.5% | | | | | | |
| | 9,407,000 | | | Boise Cascade LLC
7.1250%, 10/15/14 | | | 9,348,206 | | | |
| Cable/Satellite Television – 1.9% | | | | | | |
| | 9,940,000 | | | Block Communications, Inc.
8.2500%, 12/15/15 (144A) | | | 10,126,375 | | | |
| | 16,123,000 | | | Ono Finance II PLC
10.8750%, 7/15/19 (144A) | | | 14,349,470 | | | |
| | 10,788,000 | | | Unitymedia Hessen/Unitymedia NRW
8.1250%, 12/1/17 (144A) | | | 11,394,825 | | | |
| | | | | | | | 35,870,670 | | | |
| Casino Hotels – 5.6% | | | | | | |
| | 15,035,000 | | | Ameristar Casinos, Inc.
7.5000%, 4/15/21 | | | 15,486,050 | | | |
| | 2,485,000 | | | Caesars Entertainment Operating Co., Inc.
11.2500%, 6/1/17 | | | 2,637,206 | | | |
| | 1,860,000 | | | Caesars Entertainment Operating Co., Inc.
12.7500%, 4/15/18 | | | 1,478,700 | | | |
| | 32,569,000 | | | Caesars Entertainment Operating Co., Inc.
10.0000%, 12/15/18 | | | 22,309,765 | | | |
| | 3,091,000 | | | CityCenter Holdings LLC / CityCenter Finance Corp.
7.6250%, 1/15/16 (144A) | | | 3,168,275 | | | |
| | 4,477,000 | | | MGM Mirage
10.3750%, 5/15/14 | | | 5,114,973 | | | |
| | 12,085,000 | | | MGM Mirage
4.2500%, 4/15/15 | | | 11,465,644 | | | |
| | 10,549,000 | | | MGM Mirage
7.5000%, 6/1/16 | | | 10,100,667 | | | |
| | 4,314,000 | | | MGM Mirage
11.1250%, 11/15/17 | | | 4,917,960 | | | |
| | 3,423,000 | | | MGM Mirage
11.3750%, 3/1/18 | | | 3,765,300 | | | |
| | 6,212,000 | | | MGM Mirage
9.0000%, 3/15/20 | | | 6,879,790 | | | |
| | 7,999,000 | | | MGM Resorts International
6.6250%, 7/15/15 | | | 7,599,050 | | | |
| | 10,891,000 | | | Wynn Las Vegas LLC / Wynn Las Vegas Capital Corp.
7.7500%, 8/15/20 | | | 12,089,010 | | | |
| | | | | | | | 107,012,390 | | | |
| Casino Services – 1.3% | | | | | | |
| | 16,508,000 | | | CCM Merger, Inc.
8.0000%, 8/1/13 (144A) | | | 15,930,220 | | | |
| | 8,290,000 | | | International Game Technology
3.2500%, 5/1/14 | | | 9,720,025 | | | |
| | | | | | | | 25,650,245 | | | |
| Cellular Telecommunications – 0.3% | | | | | | |
| | 7,710,000 | | | Sprint Nextel Corp.
6.0000%, 12/1/16 | | | 6,399,300 | | | |
| Chemicals – Diversified – 2.4% | | | | | | |
| | 9,145,000 | | | Lyondell Chemical Co.
8.0000%, 11/1/17 | | | 9,990,912 | | | |
| | 3,764,205 | | | Lyondell Chemical Co.
11.0000%, 5/1/18 | | | 4,112,394 | | | |
| | 31,620,000 | | | LyondellBasell Industries N.V.
6.0000%, 11/15/21 (144A) | | | 32,805,750 | | | |
| | | | | | | | 46,909,056 | | | |
| Commercial Banks – 2.2% | | | | | | |
| | 7,136,000 | | | CIT Group, Inc.
7.0000%, 5/4/15 (144A) | | | 7,144,920 | | | |
| | 28,281,000 | | | CIT Group, Inc.
7.0000%, 5/1/17** | | | 28,281,000 | | | |
| | 6,504,000 | | | CIT Group, Inc.
6.6250%, 4/1/18 (144A) | | | 6,731,640 | | | |
| | | | | | | | 42,157,560 | | | |
| Commercial Services – 0.6% | | | | | | |
| | 921,000 | | | Iron Mountain, Inc.
7.7500%, 10/1/19 | | | 972,806 | | | |
| | 9,707,000 | | | Iron Mountain, Inc.
8.3750%, 8/15/21 | | | 10,337,955 | | | |
| | | | | | | | 11,310,761 | | | |
See Notes to Schedules of Investments and Financial Statements.
Janus Fixed Income & Money Market Funds | 43
Janus High-Yield Fund
Schedule of Investments (unaudited)
As of December 31, 2011
| | | | | | | | | | | |
| Shares or Principal Amount | | Value | | | |
| |
| Commercial Services – Finance – 0.7% | | | | | | |
| $ | 12,442,000 | | | Cardtronics, Inc.
8.2500%, 9/1/18 | | $ | 13,530,675 | | | |
| Consulting Services – 0.5% | | | | | | |
| | 9,360,000 | | | Verisk Analytics, Inc.
4.8750%, 1/15/19 | | | 9,443,304 | | | |
| Consumer Products – Miscellaneous – 0.6% | | | | | | |
| | 5,905,000 | | | Reynolds Group Issuer, Inc.
7.1250%, 4/15/19 (144A) | | | 6,008,338 | | | |
| | 3,101,000 | | | Reynolds Group Issuer, Inc.
9.0000%, 4/15/19 (144A) | | | 2,945,950 | | | |
| | 2,170,000 | | | Reynolds Group Issuer, Inc.
7.8750%, 8/15/19 (144A) | | | 2,267,650 | | | |
| | | | | | | | 11,221,938 | | | |
| Containers – Metal and Glass – 0.7% | | | | | | |
| | 4,961,000 | | | Ardagh Packaging Finance PLC
7.3750%, 10/15/17 (144A) | | | 5,010,610 | | | |
| | 8,372,000 | | | Ardagh Packaging Finance PLC
9.1250%, 10/15/20 (144A) | | | 8,288,280 | | | |
| | | | | | | | 13,298,890 | | | |
| Containers – Paper and Plastic – 0.5% | | | | | | |
| | 6,221,000 | | | Graphic Packaging International, Inc.
7.8750%, 10/1/18 | | | 6,625,365 | | | |
| | 2,836,000 | | | Sealed Air Corp
8.1250%, 9/15/19 (144A) | | | 3,105,420 | | | |
| | | | | | | | 9,730,785 | | | |
| Cosmetics and Toiletries – 0.1% | | | | | | |
| | 1,854,000 | | | Elizabeth Arden, Inc.
7.3750%, 3/15/21 | | | 1,928,160 | | | |
| Cruise Lines – 0.2% | | | | | | |
| | 4,016,000 | | | NCL Corp, Ltd.
9.5000%, 11/15/18 | | | 4,186,680 | | | |
| Data Processing and Management – 0.2% | | | | | | |
| | 4,735,000 | | | First Data Corp.
11.2500%, 3/31/16** | | | 3,930,050 | | | |
| Direct Marketing – 0.8% | | | | | | |
| | 9,935,000 | | | Affinion Group Holdings, Inc.
11.6250%, 11/15/15 | | | 8,246,050 | | | |
| | 7,095,000 | | | Affinion Group, Inc.
11.5000%, 10/15/15 | | | 6,190,388 | | | |
| | | | | | | | 14,436,438 | | | |
| Distribution/Wholesale – 0.5% | | | | | | |
| | 3,938,000 | | | Ace Hardware Corp.
9.1250%, 6/1/16 (144A) | | | 4,174,280 | | | |
| | 4,961,000 | | | McJunkin Red Man Corp.
9.5000%, 12/15/16 | | | 5,035,415 | | | |
| | | | | | | | 9,209,695 | | | |
| Diversified Banking Institutions – 2.7% | | | | | | |
| | 12,723,000 | | | Ally Financial, Inc.
7.5000%, 9/15/20 | | | 12,850,230 | | | |
| | 14,377,000 | | | Bank of America Corp.
5.0000%, 5/13/21 | | | 13,095,075 | | | |
| | 13,762,000 | | | Goldman Sachs Group, Inc.
5.2500%, 7/27/21 | | | 13,425,381 | | | |
| | 14,341,000 | | | Morgan Stanley
5.5000%, 7/28/21 | | | 13,260,191 | | | |
| | | | | | | | 52,630,877 | | | |
| Diversified Minerals – 1.6% | | | | | | |
| | 22,609,000 | | | FMG Resources August 2006 Pty, Ltd.
7.0000%, 11/1/15 (144A) | | | 22,835,090 | | | |
| | 8,525,000 | | | FMG Resources August 2006 Pty, Ltd.
8.2500%, 11/1/19 (144A) | | | 8,674,187 | | | |
| | | | | | | | 31,509,277 | | | |
| Diversified Operations – 0.4% | | | | | | |
| | 7,423,000 | | | Park-Ohio Industries, Inc.
8.1250%, 4/1/21 | | | 7,311,655 | | | |
| Diversified Operations – Commercial Services – 0.4% | | | | | | |
| | 6,621,000 | | | ARAMARK Corp.
8.5000%, 2/1/15 | | | 6,786,525 | | | |
| Electric – Generation – 0.6% | | | | | | |
| | 2,480,000 | | | AES Corp.
9.7500%, 4/15/16 | | | 2,839,600 | | | |
| | 7,058,000 | | | AES Corp.
8.0000%, 10/15/17 | | | 7,763,800 | | | |
| | | | | | | | 10,603,400 | | | |
| Electric – Integrated – 0.9% | | | | | | |
| | 6,218,000 | | | Calpine Construction Finance Co. L.P.
8.0000%, 6/1/16 (144A) | | | 6,715,440 | | | |
| | 10,787,000 | | | Ipalco Enterprises, Inc.
5.0000%, 5/1/18 | | | 10,571,260 | | | |
| | | | | | | | 17,286,700 | | | |
| Electronic Components – Semiconductors – 0.9% | | | | | | |
| | 9,873,000 | | | Advanced Micro Devices, Inc.
8.1250%, 12/15/17 | | | 10,243,237 | | | |
| | 6,839,000 | | | STATS ChipPAC, Ltd.
7.5000%, 8/12/15 (144A) | | | 7,146,755 | | | |
| | | | | | | | 17,389,992 | | | |
| Engines – Internal Combustion – 0.3% | | | | | | |
| | 5,628,000 | | | Briggs & Stratton Corp.
6.8750%, 12/15/20 | | | 5,768,700 | | | |
| Enterprise Software/Services – 0.6% | | | | | | |
| | 12,306,000 | | | Lawson Software
11.5000%, 7/15/18 (144A) | | | 11,936,820 | | | |
| Finance – Auto Loans – 1.0% | | | | | | |
| | 5,891,000 | | | Ford Motor Credit Co. LLC
8.0000%, 6/1/14 | | | 6,412,159 | | | |
| | 2,480,000 | | | Ford Motor Credit Co. LLC
8.7000%, 10/1/14 | | | 2,769,178 | | | |
| | 9,302,000 | | | Ford Motor Credit Co. LLC
8.1250%, 1/15/20 | | | 10,949,087 | | | |
| | | | | | | | 20,130,424 | | | |
| Finance – Consumer Loans – 0.7% | | | | | | |
| | 13,226,000 | | | AGFC Capital Trust I
6.0000%, 1/15/67 (144A),‡ | | | 5,488,790 | | | |
| | 10,848,000 | | | Springleaf Finance Corp.
6.9000%, 12/15/17 | | | 7,810,560 | | | |
| | | | | | | | 13,299,350 | | | |
| Finance – Investment Bankers/Brokers – 0.9% | | | | | | |
| | 17,110,000 | | | E*Trade Financial Corp.
6.7500%, 6/1/16 | | | 16,596,700 | | | |
| Food – Dairy Products – 0.8% | | | | | | |
| | 15,156,000 | | | Dean Foods Co.
9.7500%, 12/15/18 | | | 16,141,140 | | | |
See Notes to Schedules of Investments and Financial Statements.
44 | DECEMBER 31, 2011
Schedule of Investments (unaudited)
As of December 31, 2011
| | | | | | | | | | | |
| Shares or Principal Amount | | Value | | | |
| |
| Food – Meat Products – 2.1% | | | | | | |
| $ | 12,999,000 | | | JBS USA LLC/JBS USA Finance, Inc.
7.2500%, 6/1/21 (144A) | | $ | 12,121,567 | | | |
| | 20,136,000 | | | Pilgrim’s Pride Corp.
7.8750%, 12/15/18 | | | 18,927,840 | | | |
| | 3,707,000 | | | Smithfield Foods Inc.
4.0000%, 6/30/13 | | | 4,545,709 | | | |
| | 3,310,000 | | | Smithfield Foods, Inc.
10.0000%, 7/15/14 | | | 3,847,875 | | | |
| | | | | | | | 39,442,991 | | | |
| Food – Miscellaneous/Diversified – 1.6% | | | | | | |
| | 13,203,000 | | | Del Monte Corp.
7.6250%, 2/15/19 | | | 12,674,880 | | | |
| | 5,504,000 | | | Dole Food Co., Inc.
8.7500%, 7/15/13 | | | 5,820,480 | | | |
| | 5,779,000 | | | Dole Food Co., Inc.
13.8750%, 3/15/14 | | | 6,674,745 | | | |
| | 5,299,000 | | | Dole Foods Co.
8.0000%, 10/1/16 (144A) | | | 5,524,207 | | | |
| | | | | | | | 30,694,312 | | | |
| Food – Retail – 0.3% | | | | | | |
| | 3,287,000 | | | Stater Brothers Holdings, Inc.
7.7500%, 4/15/15 | | | 3,373,284 | | | |
| | 2,499,000 | | | Stater Brothers Holdings, Inc.
7.3750%, 11/15/18 | | | 2,636,445 | | | |
| | | | | | | | 6,009,729 | | | |
| Gambling – Non-Hotel – 0.5% | | | | | | |
| | 5,947,000 | | | Jacobs Entertainment, Inc.
9.7500%, 6/15/14 | | | 5,500,975 | | | |
| | 4,707,000 | | | Pinnacle Entertainment, Inc.
8.7500%, 5/15/20 | | | 4,612,860 | | | |
| | | | | | | | 10,113,835 | | | |
| Health Care Cost Containment – 0.2% | | | | | | |
| | 4,617,000 | | | ExamWorks Group, Inc.
9.0000%, 7/15/19 (144A) | | | 4,178,385 | | | |
| Home Furnishings – 0.4% | | | | | | |
| | 8,372,000 | | | Norcraft Cos. L.P. / Norcraft Finance Corp.
10.5000%, 12/15/15 | | | 7,806,890 | | | |
| Hotels and Motels – 0.1% | | | | | | |
| | 2,362,000 | | | Starwood Hotels & Resorts Worldwide, Inc.
6.7500%, 5/15/18 | | | 2,669,060 | | | |
| Independent Power Producer – 1.1% | | | | | | |
| | 6,520,000 | | | Calpine Corp.
7.8750%, 7/31/20 (144A) | | | 7,025,300 | | | |
| | 6,539,000 | | | NRG Energy, Inc.
7.3750%, 1/15/17 | | | 6,784,212 | | | |
| | 6,520,000 | | | NRG Energy, Inc.
8.5000%, 6/15/19 | | | 6,617,800 | | | |
| | | | | | | | 20,427,312 | | | |
| Machine Tools and Related Products – 0.2% | | | | | | |
| | 3,090,000 | | | Thermadyne Holdings Corp.
9.0000%, 12/15/17 | | | 3,198,150 | | | |
| Machinery – Farm – 0.1% | | | | | | |
| | 1,860,000 | | | Case New Holland, Inc.
7.8750%, 12/1/17 | | | 2,101,800 | | | |
| Medical – Hospitals – 1.5% | | | | | | |
| | 5,538,000 | | | HCA, Inc.
6.5000%, 2/15/20 | | | 5,745,675 | | | |
| | 8,803,000 | | | Iasis Healthcare LLC/Iasis Capital Corp.
8.3750%, 5/15/19 | | | 7,680,618 | | | |
| | 4,969,000 | | | LifePoint Hospitals, Inc.
6.6250%, 10/1/20 | | | 5,149,126 | | | |
| | 10,820,000 | | | Universal Health Services, Inc.
7.0000%, 10/1/18 | | | 11,225,750 | | | |
| | | | | | | | 29,801,169 | | | |
| Medical – Outpatient and Home Medical Care – 0% | | | | | | |
| | 618,000 | | | Res-Care, Inc.
10.7500%, 1/15/19 | | | 638,085 | | | |
| Medical Labs and Testing Services – 0.2% | | | | | | |
| | 4,326,000 | | | Aurora Diagnostics Holdings / Aurora Diagnostics Financing, Inc.
10.7500%, 1/15/18 | | | 4,304,370 | | | |
| Motion Pictures and Services – 0.6% | | | | | | |
| | 12,386,000 | | | Lions Gate Entertainment, Inc.
10.2500%, 11/1/16 (144A) | | | 12,447,930 | | | |
| Multi-Line Insurance – 0.9% | | | | | | |
| | 19,812,000 | | | American International Group, Inc.
8.1750%, 5/15/58‡ | | | 17,632,680 | | | |
| Office Furnishings – Original – 0.3% | | | | | | |
| | 5,646,000 | | | Interface, Inc.
7.6250%, 12/1/18 | | | 5,970,645 | | | |
| Office Supplies and Forms – 0.3% | | | | | | |
| | 5,592,000 | | | ACCO Brands Corp.
10.6250%, 3/15/15 | | | 6,221,100 | | | |
| Oil – Field Services – 0.3% | | | | | | |
| | 1,664,000 | | | Basic Energy Services, Inc.
7.1250%, 4/15/16 | | | 1,668,160 | | | |
| | 2,782,000 | | | Basic Energy Services, Inc.
7.7500%, 2/15/19 | | | 2,802,865 | | | |
| | 1,545,000 | | | Calfrac Holdings L.P.
7.5000%, 12/1/20 (144A) | | | 1,506,375 | | | |
| | | | | | | | 5,977,400 | | | |
| Oil and Gas Drilling – 0.1% | | | | | | |
| | 1,538,000 | | | Precision Drilling Corp.
6.5000%, 12/15/21 (144A) | | | 1,568,760 | | | |
| Oil Companies – Exploration and Production – 7.7% | | | | | | |
| | 3,090,000 | | | Antero Resources Finance Corp.
7.2500%, 8/1/19 (144A) | | | 3,167,250 | | | |
| | 3,101,000 | | | Chaparral Energy, Inc.
9.8750%, 10/1/20 | | | 3,349,080 | | | |
| | 7,451,000 | | | Chaparral Energy, Inc.
8.2500%, 9/1/21 | | | 7,544,137 | | | |
| | 3,424,000 | | | Chesapeake Energy Corp.
6.8750%, 11/15/20 | | | 3,663,680 | | | |
| | 13,281,000 | | | Chesapeake Energy Corp.
6.1250%, 2/15/21 | | | 13,646,227 | | | |
| | 4,975,000 | | | Continental Resources, Inc.
8.2500%, 10/1/19 | | | 5,472,500 | | | |
| | 3,101,000 | | | Continental Resources, Inc.
7.1250%, 4/1/21 | | | 3,364,585 | | | |
| | 3,091,000 | | | Denbury Resources, Inc.
6.3750%, 8/15/21 | | | 3,230,095 | | | |
See Notes to Schedules of Investments and Financial Statements.
Janus Fixed Income & Money Market Funds | 45
Janus High-Yield Fund
Schedule of Investments (unaudited)
As of December 31, 2011
| | | | | | | | | | | |
| Shares or Principal Amount | | Value | | | |
| |
| Oil Companies – Exploration and Production – (continued) | | | | | | |
| | | | | | | | | | | |
| $ | 8,964,000 | | | EV Energy Partners L.P. / EV Energy Finance Corp
8.0000%, 4/15/19 | | $ | 9,120,870 | | | |
| | 6,352,000 | | | Harvest Operations Corp.
6.8750%, 10/1/17 (144A) | | | 6,574,320 | | | |
| | 3,101,000 | | | Hilcorp Energy L.P. / Hilcorp Finance Co.
7.6250%, 4/15/21 (144A) | | | 3,248,298 | | | |
| | 4,154,000 | | | Kodiak Oil & Gas Corp.
8.1250%, 12/1/19 (144A) | | | 4,304,582 | | | |
| | 4,557,000 | | | Linn Energy LLC / Linn Energy Finance Corp.
6.5000%, 5/15/19 (144A) | | | 4,522,822 | | | |
| | 4,975,000 | | | Linn Energy LLC / Linn Energy Finance Corp.
7.7500%, 2/1/21 | | | 5,174,000 | | | |
| | 6,793,000 | | | Newfield Exploration Co.
5.7500%, 1/30/22 | | | 7,336,440 | | | |
| | 3,951,000 | | | Oasis Petroleum, Inc.
6.5000%, 11/1/21 | | | 3,921,368 | | | |
| | 6,975,000 | | | OGX Petroleo e Gas Participacoes S.A.
8.5000%, 6/1/18 (144A) | | | 6,835,500 | | | |
| | 1,115,000 | | | Pioneer Natural Resources Co.
5.8750%, 7/15/16 | | | 1,213,447 | | | |
| | 1,628,000 | | | Pioneer Natural Resources Co.
6.6500%, 3/15/17 | | | 1,801,327 | | | |
| | 12,381,000 | | | Plains Exploration & Production Co.
6.6250%, 5/1/21 | | | 13,000,050 | | | |
| | 537,000 | | | Range Resources, Corp.
7.2500%, 5/1/18 | | | 574,590 | | | |
| | 5,588,000 | | | SandRidge Energy, Inc.
9.8750%, 5/15/16 (144A) | | | 5,979,160 | | | |
| | 2,472,000 | | | SM Energy Co.
6.6250%, 2/15/19 (144A) | | | 2,570,880 | | | |
| | 3,926,000 | | | SM Energy Co.
6.5000%, 11/15/21 (144A) | | | 4,043,780 | | | |
| | 11,994,000 | | | Stone Energy Corp.
6.7500%, 12/15/14 | | | 11,814,090 | | | |
| | 8,888,000 | | | Venoco, Inc.
8.8750%, 2/15/19 | | | 7,999,200 | | | |
| | 3,584,000 | | | W&T Offshore, Inc.
8.5000%, 6/15/19 (144A) | | | 3,709,440 | | | |
| | | | | | | | 147,181,718 | | | |
| Oil Field Machinery and Equipment – 0.5% | | | | | | |
| | 9,573,000 | | | Dresser-Rand Group, Inc.
6.5000%, 5/1/21 (144A) | | | 9,788,393 | | | |
| Oil Refining and Marketing – 0.5% | | | | | | |
| | 7,447,000 | | | Chesapeake Oilfield Operating LLC/Chesapeake Oilfield Finance, Inc.
6.6250%, 11/15/19 (144A) | | | 7,744,880 | | | |
| | 2,472,000 | | | Frontier Oil Corp.
6.8750%, 11/15/18 | | | 2,533,800 | | | |
| | | | | | | | 10,278,680 | | | |
| Paper and Related Products – 0.5% | | | | | | |
| | 8,700,000 | | | Longview Fibre Paper & Packaging, Inc.
8.0000%, 6/1/16 (144A) | | | 8,700,000 | | | |
| Pharmacy Services – 1.0% | | | | | | |
| | 18,408,000 | | | Omnicare, Inc.
7.7500%, 6/1/20 | | | 19,765,590 | | | |
| Physical Therapy and Rehabilitation Centers – 0.5% | | | | | | |
| | 6,181,000 | | | Healthsouth Corp.
7.2500%, 10/1/18 | | | 6,134,642 | | | |
| | 3,089,000 | | | Healthsouth Corp.
7.7500%, 9/15/22 | | | 3,038,804 | | | |
| | | | | | | | 9,173,446 | | | |
| Pipelines – 2.9% | | | | | | |
| | 3,114,000 | | | Crestwood Midstream Partners L.P. / Crestwood Midstream Finance Corp.
7.7500%, 4/1/19 (144A) | | | 3,028,365 | | | |
| | 17,452,000 | | | Crosstex Energy L.P. / Crosstex Energy Finance Corp.
8.8750%, 2/15/18 | | | 19,066,310 | | | |
| | 6,271,000 | | | El Paso Corp.
6.5000%, 9/15/20 | | | 6,778,914 | | | |
| | 2,152,000 | | | El Paso Corp.
7.7500%, 1/15/32 | | | 2,485,560 | | | |
| | 9,211,000 | | | El Paso Pipeline Partners Operating Co. LLC
5.0000%, 10/1/21 | | | 9,480,090 | | | |
| | 9,919,000 | | | MarkWest Energy Partners L.P. / MarkWest Energy Finance Corp
6.2500%, 6/15/22 | | | 10,365,355 | | | |
| | 3,742,000 | | | Regency Energy Partners L.P. / Regency Energy Finance Corp.
6.8750%, 12/1/18 | | | 3,975,875 | | | |
| | | | | | | | 55,180,469 | | | |
| Printing – Commercial – 1.3% | | | | | | |
| | 13,445,000 | | | American Reprographics Co.
10.5000%, 12/15/16 | | | 11,966,050 | | | |
| | 15,653,000 | | | Cenveo Corp.
8.8750%, 2/1/18 | | | 13,657,242 | | | |
| | | | | | | | 25,623,292 | | | |
| Publishing – Books – 0.8% | | | | | | |
| | 25,043,000 | | | Cengage Learning Acquisitions, Inc.
13.2500%, 7/15/15 (144A),‡ | | | 16,090,128 | | | |
| Publishing – Newspapers – 0.3% | | | | | | |
| | 3,735,000 | | | Gannett Co., Inc.
6.3750%, 9/1/15 | | | 3,791,025 | | | |
| | 1,788,000 | | | Gannett Co., Inc.
7.1250%, 9/1/18 | | | 1,761,180 | | | |
| | | | | | | | 5,552,205 | | | |
| Publishing – Periodicals – 0.5% | | | | | | |
| | 7,452,000 | | | Nielsen Finance LLC / Nielsen Finance Co.
7.7500%, 10/15/18 | | | 8,048,160 | | | |
| | 2,014,000 | | | Nielson Finance Co. LLC
11.5000%, 5/1/16 | | | 2,306,030 | | | |
| | | | | | | | 10,354,190 | | | |
| Radio – 1.4% | | | | | | |
| | 15,574,000 | | | Entercom Radio LLC
10.5000%, 12/1/19 (144A) | | | 15,574,000 | | | |
| | 10,557,000 | | | Sirius XM Radio, Inc.
8.7500%, 4/1/15 (144A) | | | 11,559,915 | | | |
| | | | | | | | 27,133,915 | | | |
| Real Estate Management/Services – 0.9% | | | | | | |
| | 16,945,000 | | | Kennedy-Wilson, Inc.
8.7500%, 4/1/19 (144A) | | | 16,521,375 | | | |
See Notes to Schedules of Investments and Financial Statements.
46 | DECEMBER 31, 2011
Schedule of Investments (unaudited)
As of December 31, 2011
| | | | | | | | | | | |
| Shares or Principal Amount | | Value | | | |
| |
| REIT – Hotels – 0.4% | | | | | | |
| $ | 2,664,000 | | | Host Hotels & Resorts L.P.
6.7500%, 6/1/16 | | $ | 2,737,260 | | | |
| | 5,730,000 | | | Host Hotels & Resorts L.P.
6.0000%, 10/1/21 (144A) | | | 5,873,250 | | | |
| | | | | | | | 8,610,510 | | | |
| REIT – Office Property – 1.0% | | | | | | |
| | 16,743,000 | | | Reckson Operating Partnership L.P.
7.7500%, 3/15/20 | | | 18,362,969 | | | |
| REIT – Regional Malls – 0.5% | | | | | | |
| | 8,798,000 | | | Rouse Co. L.P.
6.7500%, 11/9/15 | | | 8,896,978 | | | |
| Rental Auto/Equipment – 0.4% | | | | | | |
| | 3,422,000 | | | Avis Budget Car Rental LLC / Avis Budget Finance, Inc.
7.7500%, 5/15/16 | | | 3,447,665 | | | |
| | 4,043,000 | | | Hertz Corp.
7.5000%, 10/15/18 | | | 4,224,935 | | | |
| | | | | | | | 7,672,600 | | | |
| Research & Development – 0.2% | | | | | | |
| | 4,164,000 | | | Jaguar Holding Co.
9.5000%, 12/1/19 (144A) | | | 4,372,200 | | | |
| Retail – Apparel and Shoe – 0.1% | | | | | | |
| | 2,472,000 | | | J Crew Group, Inc.
8.1250%, 3/1/19 | | | 2,360,760 | | | |
| Retail – Arts and Crafts – 0.5% | | | | | | |
| | 9,018,000 | | | Michael’s Stores, Inc.
11.3750%, 11/1/16 | | | 9,558,178 | | | |
| Retail – Drug Store – 0.3% | | | | | | |
| | 6,224,000 | | | Rite Aid Corp.
9.5000%, 6/15/17 | | | 5,679,400 | | | |
| Retail – Leisure Products – 0.2% | | | | | | |
| | 3,877,000 | | | Steinway Musical Instruments
7.0000%, 3/1/14 (144A) | | | 3,881,846 | | | |
| Retail – Perfume and Cosmetics – 0.6% | | | | | | |
| | 10,495,000 | | | Sally Holdings LLC / Sally Capital, Inc.
6.8750%, 11/15/19 (144A) | | | 10,967,275 | | | |
| Retail – Propane Distribution – 1.0% | | | | | | |
| | 1,889,000 | | | Ferrellgas L.P. / Ferrellgas Finance Corp.
9.1250%, 10/1/17 | | | 1,974,005 | | | |
| | 4,897,000 | | | Ferrellgas Partners L.P. / Ferrellgas Partners Finance Corp.
8.6250%, 6/15/20 | | | 4,737,847 | | | |
| | 9,185,000 | | | Inergy L.P./Inergy Finance Corp.
7.0000%, 10/1/18 | | | 9,322,775 | | | |
| | 2,226,000 | | | Inergy L.P./Inergy Finance Corp.
6.8750%, 8/1/21 | | | 2,237,130 | | | |
| | | | | | | | 18,271,757 | | | |
| Retail – Regional Department Stores – 0.6% | | | | | | |
| | 5,283,000 | | | Macy’s Retail Holdings, Inc.
7.4500%, 7/15/17 | | | 6,168,378 | | | |
| | 5,595,000 | | | Neiman Marcus Group, Inc.
10.3750%, 10/15/15 | | | 5,811,862 | | | |
| | | | | | | | 11,980,240 | | | |
| Retail – Restaurants – 1.8% | | | | | | |
| | 7,729,000 | | | DineEquity, Inc.
9.5000%, 10/30/18 | | | 8,299,014 | | | |
| | 4,837,000 | | | Landry’s Acquisition Co.
11.6250%, 12/1/15 (144A) | | | 5,090,943 | | | |
| | 4,651,000 | | | Landry’s Holdings, Inc.
11.5000%, 6/1/14 (144A) | | | 4,557,980 | | | |
| | 1,854,000 | | | Landry’s Restaurants, Inc.
11.6250%, 12/1/15 (144A) | | | 1,951,335 | | | |
| | 6,237,000 | | | Landry’s Restaurants, Inc.
11.6250%, 12/1/15 | | | 6,564,442 | | | |
| | 7,454,000 | | | OSI Restaurant Partners, Inc.
10.0000%, 6/15/15 | | | 7,705,572 | | | |
| | | | | | | | 34,169,286 | | | |
| Retail – Sporting Goods – 0% | | | | | | |
| | 615,000 | | | Academy, Ltd. / Academy Finance Corp.
9.2500%, 8/1/19 (144A) | | | 607,313 | | | |
| Retail – Toy Store – 0.2% | | | | | | |
| | 3,112,000 | | | Toys R Us Property Co. LLC
8.5000%, 12/1/17 | | | 3,220,920 | | | |
| Satellite Telecommunications – 0.7% | | | | | | |
| | 3,708,000 | | | Intelsat Jackson Holdings S.A.
7.2500%, 4/1/19 (144A) | | | 3,763,620 | | | |
| | 5,692,000 | | | Intelsat Jackson Holdings S.A.
7.2500%, 10/15/20 (144A) | | | 5,777,380 | | | |
| | 4,326,000 | | | Intelsat Jackson Holdings S.A.
7.5000%, 4/1/21 (144A) | | | 4,374,668 | | | |
| | | | | | | | 13,915,668 | | | |
| Semiconductor Equipment – 0.6% | | | | | | |
| | 11,437,000 | | | Sensata Technologies Holding N.V.
6.5000%, 5/15/19 (144A) | | | 11,294,038 | | | |
| Shipbuilding – 0.4% | | | | | | |
| | 8,405,000 | | | Huntington Ingalls Industries, Inc.
6.8750%, 3/15/18 (144A) | | | 8,236,900 | | | |
| Telecommunication Services – 0.7% | | | | | | |
| | 6,852,000 | | | Level 3 Communications, Inc.
11.8750%, 2/1/19 | | | 7,297,380 | | | |
| | 5,581,000 | | | Qwest Corp.
8.3750%, 5/1/16 | | | 6,392,327 | | | |
| | | | | | | | 13,689,707 | | | |
| Telephone – Integrated – 2.7% | | | | | | |
| | 8,383,000 | | | Level 3 Financing, Inc.
10.0000%, 2/1/18 | | | 8,885,980 | | | |
| | 12,377,000 | | | Level 3 Financing, Inc.
9.3750%, 4/1/19 | | | 12,918,494 | | | |
| | 4,129,000 | | | Level 3 Financing, Inc.
8.1250%, 7/1/19 (144A) | | | 4,067,065 | | | |
| | 16,035,000 | | | Qwest Communications International, Inc.
7.1250%, 4/1/18 | | | 16,676,400 | | | |
| | 4,349,000 | | | Virgin Media Finance PLC
8.3750%, 10/15/19 | | | 4,773,027 | | | |
| | 4,354,000 | | | Windstream Corp.
7.7500%, 10/15/20 | | | 4,500,948 | | | |
| | | | | | | | 51,821,914 | | | |
| Theaters – 0.4% | | | | | | |
| | 7,384,000 | | | National CineMedia LLC
7.8750%, 7/15/21 | | | 7,319,390 | | | |
| Transportation – Air Freight – 0.4% | | | | | | |
| | 6,801,000 | | | AMGH Merger Sub, Inc.
9.2500%, 11/1/18 (144A) | | | 7,005,030 | | | |
See Notes to Schedules of Investments and Financial Statements.
Janus Fixed Income & Money Market Funds | 47
Janus High-Yield Fund
Schedule of Investments (unaudited)
As of December 31, 2011
| | | | | | | | | | | |
| Shares or Principal Amount | | Value | | | |
| |
| Transportation – Railroad – 1.0% | | | | | | |
| $ | 9,509,000 | | | Florida East Coast Railway Corp.
8.1250%, 2/1/17 | | $ | 9,390,137 | | | |
| | 2,660,000 | | | Kansas City Southern de Mexico S.A. de C.V.
8.0000%, 2/1/18 | | | 2,912,700 | | | |
| | 7,327,000 | | | Kansas City Southern de Mexico S.A. de C.V.
6.6250%, 12/15/20 | | | 7,766,620 | | | |
| | | | | | | | 20,069,457 | | | |
| Transportation – Truck – 0.8% | | | | | | |
| | 14,630,000 | | | Swift Services Holdings, Inc.
10.0000%, 11/15/18 | | | 15,398,075 | | | |
| |
| |
| Total Corporate Bonds (cost $1,701,115,637) | | | 1,718,633,419 | | | |
| |
| |
| Preferred Stock – 1.2% | | | | | | |
| Diversified Banking Institutions – 0.4% | | | | | | |
| | 120,325 | | | GMAC Capital Trust I, 8.1250% | | | 2,327,085 | | | |
| | 445,975 | | | Royal Bank of Scotland Group PLC, 7.2500% | | | 5,695,101 | | | |
| | | | | | | | 8,022,186 | | | |
| Diversified Financial Services – 0.4% | | | | | | |
| | 326,325 | | | Citigroup Capital XIII, 7.8750% | | | 8,504,030 | | | |
| Electric – Integrated – 0.2% | | | | | | |
| | 59,000 | | | PPL Corp., 8.7500% | | | 3,274,500 | | | |
| Special Purpose Entity – 0.2% | | | | | | |
| | 361,215 | | | Dole Food Automatic Exchange, 7.0000%§ | | | 3,087,268 | | | |
| |
| |
| Total Preferred Stock (cost $27,381,651) | | | 22,887,984 | | | |
| |
| |
| Money Market – 3.8% | | | | | | |
| | 73,519,843 | | | Janus Cash Liquidity Fund LLC, 0%
(cost $73,519,843) | | | 73,519,843 | | | |
| |
| |
| Total Investments (total cost $1,886,796,659) – 98.7% | | | 1,897,668,402 | | | |
| |
| |
| Cash, Receivables and Other Assets, net of Liabilities – 1.3% | | | 25,148,508 | | | |
| |
| |
| Net Assets – 100% | | $ | 1,922,816,910 | | | |
| |
| |
Summary of Investments by Country – (Long Positions)
| | | | | | | | | |
| | | | | | % of Investment
| |
| Country | | Value | | | Securities | |
| |
| |
| Australia | | $ | 31,509,277 | | | | 1.7% | |
| Bermuda | | | 4,186,680 | | | | 0.2% | |
| Brazil | | | 6,835,500 | | | | 0.4% | |
| Canada | | | 18,503,082 | | | | 1.0% | |
| France | | | 18,889,469 | | | | 1.0% | |
| Germany | | | 11,394,825 | | | | 0.6% | |
| Ireland | | | 27,648,360 | | | | 1.5% | |
| Luxembourg | | | 13,915,668 | | | | 0.7% | |
| Mexico | | | 12,916,520 | | | | 0.7% | |
| Netherlands | | | 44,099,788 | | | | 2.3% | |
| Singapore | | | 7,146,755 | | | | 0.4% | |
| Spain | | | 11,797,230 | | | | 0.6% | |
| United Kingdom | | | 10,468,128 | | | | 0.5% | |
United States†† | | | 1,678,357,120 | | | | 88.4% | |
| |
| |
| Total | | $ | 1,897,668,402 | | | | 100.0% | |
| | | |
| †† | | Includes Cash Equivalents (84.6% excluding Cash Equivalents). |
See Notes to Schedules of Investments and Financial Statements.
48 | DECEMBER 31, 2011
Janus Short-Term Bond Fund (unaudited)
| | | | | | | |
Fund Snapshot
We believe a bottom-up, fundamentally driven investment process that focuses on credit-oriented investments can generate risk-adjusted outperformance relative to our peers over time. Our comprehensive bottom-up view drives decision-making at a macro level, enabling us to make informed decisions about overall portfolio allocations.
| | | |
Gibson Smith
co-portfolio manager | |
Darrell Watters
co-portfolio manager |
Performance Overview
For the six-month period ended December 31, 2011, Janus Short-Term Bond Fund’s Class T Shares returned -0.06%, compared to a 0.53% return for its benchmark, the Barclays Capital 1-3 Year U.S. Government/Credit Index.
Portfolio Manager Comments
The volatility in the bond markets has been mind-numbing at times, and a wake-up call to investors that key risks to the economy remain in place. We saw this reflected in the flight to safety that sent Treasury yields to near-record lows in 2011. Quite simply, the world has too much debt and not enough growth, and we are grinding through a deleveraging period that will be more painful and last longer than most investors anticipate. Unfortunately, we have also entered a period where policy actions are not necessarily effective in terms of stabilizing the imbalance and returning us to a more normal environment.
If there’s a theme for 2012 it’s that investors should get used to low rates. The Federal Reserve (Fed) has said that it expects to keep interest rates near zero into late 2014. The question now is whether the Fed will undertake a third round of quantitative easing (QE3) this year. We think the Fed isn’t ready to shoot this bullet yet, but will respond if it sees economic weakness or significant dislocation in the financial markets. We also expect easy monetary policies and low rates in Europe, where inflation expectations are falling as growth rates decline.
We expect interest rate volatility to remain high, as a risk-on/risk-off environment continues amid lack of confidence in global fiscal policy decisions. In a world that is out of balance, the bands of potential outcomes widen, making prediction more difficult. In a general sense, we have been investing against a fairly stable macro backdrop over the last 30 years. But the world changed in 2008, and since then we’ve seen massive intervention and very unconventional policy response, forcing investors to consider outcomes that exhibit much greater volatility. As long as governments around the world exhibit leverage profiles that create uncertainty, U.S. government bonds will continue to be the flight-to-quality asset of choice, due to their liquidity and perceived high quality.
Against this backdrop, we continue to believe that corporate credit offers some of the best risk -adjusted returns in the market. We entered 2011 with a similar belief. The last year was highly volatile for credit, especially financials, which had a big impact on the market. Yet underlying fundamentals continue to improve. Profit margins are high and companies are accumulating cash on balance sheets (more than $2 trillion by some estimates). Moreover, we think there is a newfound conservatism resonating across management teams and boards in the United States and Europe. Management teams are being more careful and have not been committing capital to their businesses – beyond replacement levels – as growth remains slow and uncertainty remains high. We think this will continue through 2012, fueling more free cash flow, liquidity in the system and ultimately support for credit spreads in both investment-grade and high-yield bonds.
Investment Environment
Volatility and headline risk were central themes for fixed-income investors in the second half of 2011. A rally in U.S. Treasuries became especially pronounced from late July through September, as worry mounted that the U.S. economy might slip into a double-dip recession. Investors were troubled by below-expectation U.S. gross domestic product (GDP) growth, a manufacturing slowdown and persistently weak employment, housing and consumer spending figures. Concern about high government debt levels, both in the United States and Europe, only heightened this negative market sentiment. A high-stakes political standoff in Congress in July and August over raising the U.S. debt ceiling did nothing to improve the situation. Credit rating agency Standard & Poor’s subsequently lowered the United States’ sovereign credit rating to AA+ from AAA. The downgrade was followed, ironically, by a near stampede into U.S. Treasury
Janus Fixed Income & Money Market Funds | 49
Janus Short-Term Bond Fund (unaudited)
securities, as the darkening global economic picture made Treasury’s appear to be the safest haven available.
All eyes returned to Europe in the fall, as fiscal problems in the so-called PIIGS (Portugal, Italy, Ireland, Greece and Spain) countries threatened to spiral out of control. By October, it appeared that European Union (EU) leaders would manage to contain euro-zone problems, and relieved investors briefly ventured out of Treasuries in search of higher yields. But uncertainty flooded back in November, as governments in Greece and then Italy fell amid market pressure to implement fiscal reforms. The late-November failure of the U.S. Congressional “super committee” to reach a deal to cut $1.2 trillion from the U.S. deficit added to the general malaise.
In December, some headway was made in Europe, as EU leaders announced a plan in which most members would agree to stricter fiscal rules and the European Central Bank served up a larger-than-expected $641 billion in 3-year loans. This injected some calm into the markets as volume wound down for the holidays, although investors remained concerned that credit ratings would be downgraded on one or more of the 17 euro zone countries.
Meanwhile, U.S. macroeconomic data reflected a strengthening domestic economy, with signs of increased hiring and rising consumer confidence. Fears of a double-dip recession, which mounted over the summer as U.S. economic indicators weakened, had receded by the fourth quarter.
Performance discussion
Our underweight exposure to the U.S. Treasury market provided a drag on return in the second half of 2011. Treasuries made up 15% of the fund’s assets at the end of the period. We expect that rates will remain range-bound throughout 2012 and anticipate little accretive value for the portfolio from U.S. Treasuries. However, a position in U.S. Treasuries will be maintained to satisfy any liquidity needs due to sentiment shifts that may cause investors to shift asset classes out of fixed income into equity. Nonetheless, we always intend to maximize risk-adjusted returns from the asset class, with preservation of capital first and foremost on our minds.
We reduced our allocation to bank loans during the period, to roughly 2.6% at year’s end from 3.9% at the beginning of the six-month period. Bank loans offer a variable rate that can be attractive in rising interest rate environments, but bank loan prices have declined as concern about rising inflation has faded. A small cash position also weighed slightly on second-half 2011 performance. It is important to note that cash is not an active allocation within the strategy, but it is prudent to keep a certain level of “frictional” cash on hand to meet day-to-day needs.
Security selection within corporate credit was the greatest contributor to performance during the period. Consistent with recent years, many of our most compelling names came from our credit work in higher-yielding issuers focused on balance sheet repair. With capital preservation foremost in our minds, our judicious selection of certain sub-investment-grade names contributed notably to performance.
At period end, 17% of the portfolio was composed of banks, a sector that we believe has struggled because investors still perceive it as risky, but which in our opinion offers potential for good returns. Most of the credits in the portfolio have enough cash on their balance sheets to satisfy their portfolio maturities. These important credit metrics are not often recognized in the current hyperactive markets, but we believe this is an opportunity for investors and intend to take advantage of it in 2012 – but, as always, with both eyes on capital preservation and risk-adjusted returns.
Consumer noncyclicals such as food and beverage occupy the second spot in portfolio weight. Large consumer-driven names with improving credit profiles historically hold up well when things get rough in other sectors of the market and provide solid return potential in many market environments.
Real estate investment trust (REIT) debt completes the top three weightings in the fund. We believe these credits are improving and have hard assets to satisfy missteps they could suffer in the worst markets. We see rents in virtually every REIT asset class rising, from residential apartments to New York City office space, and the sector has improved dramatically.
At year-end, 86% of portfolio assets were U.S.-domiciled, 8% resided in Europe, 2.7% in Canada and the balance in Latin America, Australia and Asia. We continue to believe that the United States should deliver respectable returns, but are mindful of opportunities elsewhere. It is important to note that all bonds within the portfolio are denominated in U.S. dollars.
At period end, 28% of portfolio assets were rated BBB, 28% were rated A, and 24% were rated AA, with the balance in AAA, BB, B or not rated. We typically position lower-rated credits further out on the interest rate curve to allow for maximum total return as credit tightens. At present we don’t expect much change in the allocation of credit quality, except that when warranted the BB and B
50 | DECEMBER 31, 2011
(unaudited)
sectors may move higher by a few percentage points. We don’t foresee greater than 20-22% of the portfolio allocation to BB or less in the coming months.
Outlook
Largely because the U.S. economy is being held hostage to decisions in Europe and Washington, we expect another year of subpotential growth. We forecast U.S. gross domestic product growth of 2% in 2012, barring a worsening of the euro zone crisis and assuming that Congress extends long-term unemployment benefits and the payroll tax break until the end of the year; both are currently scheduled to expire at the end of February.
Given current high levels of productivity, we expect that hiring will continue to rise slowly as companies seek to meet essential demand. However, the modest pace will keep the unemployment rate elevated and fluctuating around the 9% level throughout the year. Excess slack in the labor market combined with slow economic growth will keep inflation from moving much higher. In our opinion, the core Consumer Price Index (CPI), excluding food and energy, will continue to accelerate through the first half of 2012, peaking at a 2.5% year-over-year growth rate before moving back below 2%. Core CPI’s recent increase has been largely due to artificial factors, including a supply/demand imbalance in the housing rental market that has pushed up owners’ equivalent rent (OER), a major component of core CPI. We believe this imbalance will correct itself. Meanwhile, producer input prices are dropping, reducing the level of price pressure in the pipeline.
This low-inflation environment would give the Federal Reserve room to continue its accommodative short-term interest rate policy. The Fed has said that it plans to keep short-term interest rates near zero through late 2014. We believe there is a 50% chance that the Fed will initiate QE3 in 2012, by buying mortgage-backed securities, if market conditions warrant. In our view the likelihood of QE3 is heavily dependent on the outcome in Europe, and may be necessary if we see continued dysfunction in Washington.
We expect global economic growth to slow to roughly 2.1% in 2012, with Europe the most challenged region worldwide. In our view Europe will be in recession next year, with growth of negative 0.5% to negative 1%. Policy risk remains high in all regions of the world. We expect inflation to decline globally as commodity prices level out and the pace of growth slows.
We believe that Treasury yields will remain relatively range-bound in 2012 due to the continued headline risk from Europe, political deadlock in Washington and automatic $1.2 trillion government spending cuts scheduled to begin in January 2013. However, we think that rates will be at the higher end of the range by the end of 2012, partly because by that point we should be on a path to stronger economic growth. The front end of the curve is anchored by the Fed’s stated intention to keep interest rates near zero until late 2014. The five-year Treasury is the pivot point and stands to benefit if the Fed implements a third round of quantitative easing. We believe that the 10-year and 30-year Treasury have little upside left, as they enjoyed a remarkable rally in 2011 but will become more vulnerable to inflation concerns the longer the Fed’s accommodative policy continues. We believe this scenario bodes well for fixed-income assets, as market participants likely will look for yield while staying away from equities due to the volatile nature of the market.
Top Detractors
Morgan Stanley: A worldwide financial services provider, Morgan Stanley continues to diversify into less capital intensive businesses with higher margins and lower volatility. Their bonds also trade wide relative to peers, providing an attractive valuation opportunity to us that we think will eventually close with the company’s capital levels increasing and improving liquidity metrics. Management is focused on growing the advisory business of Morgan Stanley Smith Barney, which we believe will help mitigate some cash flow and earnings volatility from legacy lines of business. Lastly, investor Mitsubishi recently converted all of its preferred stock in Morgan Stanley to common equity, improving our position as bondholders in the capital structure.
��
Jefferies Group: One of the last remaining independent – i.e. non-bank – brokers in the United States, Jefferies Group invested heavily in expanding its business during the credit crisis. Growing the business to include commodities and advisory services, the company has increased its headcount by more than 15%. We believe this expansion of business interest bodes well for Jefferies as merger & acquisition activity increases in the incrementally improving economy. We also like the fact that their independent status frees the company from the constraints being imposed by regulators on many of their peers, potentially providing market share gains at an important time in the economic cycle. We believe investors overreacted in distancing themselves from the company in early November in the wake of the MF Global bankruptcy. Jefferies has a highly invested management team, a well structured long-term debt profile and disciplined policies
Janus Fixed Income & Money Market Funds | 51
Janus Short-Term Bond Fund (unaudited)
regarding sovereign debt exposure. We like that the company moved quickly to demonstrate the transparency and liquidity of its own European sovereign debt holdings to assuage investor concerns following MF Global.
Top Contributors
Lyondell: The third largest chemical producer in the United States, Lyondell in November tendered above market price for a large portion of its outstanding debt. We believe the commodity chemicals this company produces have a significant cost-of-production advantage due to the emergence of shale gas. The primary raw input to their production process is natural gas, a commodity that has experienced considerable price pressure due to excess supply, driving higher margins at Lyondell. The company’s new management team is return-on-capital driven and disciplined on investing in their business. They are also targeting an investment grade rating as debt retirement efforts continue.
GE Capital: We like GE Capital’s focus on mid-market commercial lending as this represents one of the first areas of loan growth in a recovering economic environment. The company is actively paying down debt in an effort to improve capital levels and shrink the company to approximately 30% of its parent company’s revenues. We believe GE Capital’s profitability will continue to improve thanks to higher margins and lower cost of capital. We also support the company’s pre-emptive move toward bank-regulated capital ratios.
On behalf of every member of our investment team, thank you for your investment in Janus Short-Term Bond Fund. We appreciate your entrusting your assets with us, and we look forward to continuing to serve your investment needs.
52 | DECEMBER 31, 2011
(unaudited)
Janus Short-Term Bond Fund At A Glance
December 31, 2011
| | | |
| Weighted Average Maturity | | 2.5 Years |
| Average Effective Duration* | | 1.8 Years |
| 30-day Current Yield** | | |
| Class A Shares at NAV | | |
| Without Reimbursement | | 1.66% |
| With Reimbursement | | 1.72% |
| Class A Shares at MOP | | |
| Without Reimbursement | | 1.62% |
| With Reimbursement | | 1.68% |
| Class C Shares*** | | |
| Without Reimbursement | | 0.88% |
| With Reimbursement | | 0.98% |
| Class D Shares | | |
| Without Reimbursement | | 1.80% |
| With Reimbursement | | 1.85% |
| Class I Shares | | |
| Without Reimbursement | | 1.89% |
| With Reimbursement | | 1.97% |
| Class S Shares | | |
| Without Reimbursement | | 1.44% |
| With Reimbursement | | 1.48% |
| Class T Shares | | |
| Without Reimbursement | | 1.69% |
| With Reimbursement | | 1.72% |
| Number of Bonds/Notes | | 241 |
| | | |
| * | | A theoretical measure of price volatility |
| ** | | Yield will fluctuate |
| *** | | Does not include the 1.00% contingent deferred sales charge. |
Ratings†Summary – (% of Investment Securities)
December 31, 2011
| | | |
AAA | | 0.7% |
AA | | 24.8% |
A | | 28.3% |
BBB | | 28.3% |
BB | | 12.8% |
B | | 1.9% |
Other | | 3.2% |
| | | |
| † | | Rated by Standard & Poor’s |
Significant Areas of Investment – (% of Net Assets)
As of December 31, 2011
Asset Allocation – (% of Net Assets)
As of December 31, 2011
Emerging markets comprised 0.6% of total net assets.
Janus Fixed Income & Money Market Funds | 53
Janus Short-Term Bond Fund (unaudited)
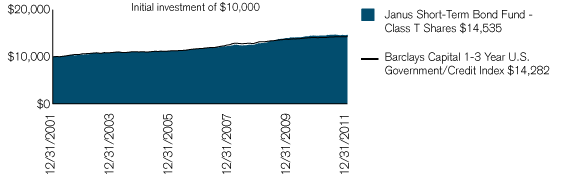
| | | | | | | | | | | | | | | | |
| Average Annual Total Return – for the periods ended December 31, 2011 | | | Expense Ratios – per the October 28, 2011 prospectuses |
| | | Fiscal
| | One
| | Five
| | Ten
| | Since
| | | Total Annual Fund
| | Net Annual Fund
|
| | | Year-to-Date | | Year | | Year | | Year | | Inception* | | | Operating Expenses | | Operating Expenses |
| | | | | | | | | | | | | | | | |
Janus Short-Term Bond Fund –
Class A Shares | | | | | | | | | | | | | | | |
| | | | | | | | | | | | | | | | |
| NAV | | 0.26% | | 1.37% | | 4.42% | | 3.48% | | 4.25% | | | 0.89% | | 0.80% |
| | | | | | | | | | | | | | | | |
| MOP | | –2.27% | | –1.20% | | 3.41% | | 2.98% | | 3.98% | | | | | |
| | | | | | | | | | | | | | | | |
Janus Short-Term Bond Fund –
Class C Shares | | | | | | | | | | | | | | | |
| | | | | | | | | | | | | | | | |
| NAV | | –0.12% | | 0.96% | | 3.84% | | 2.87% | | 3.58% | | | 1.65% | | 1.55% |
| | | | | | | | | | | | | | | | |
| CDSC | | –1.11% | | –0.03% | | 3.84% | | 2.87% | | 3.58% | | | | | |
| | | | | | | | | | | | | | | | |
Janus Short-Term Bond Fund –
Class D Shares(1) | | 0.00% | | 1.50% | | 4.65% | | 3.83% | | 4.65% | | | 0.73% | | 0.68% |
| | | | | | | | | | | | | | | | |
Janus Short-Term Bond Fund –
Class I Shares | | 0.07% | | 1.62% | | 4.59% | | 3.69% | | 4.47% | | | 0.64% | | 0.55% |
| | | | | | | | | | | | | | | | |
Janus Short-Term Bond Fund –
Class S Shares | | –0.19% | | 1.13% | | 4.09% | | 3.25% | | 4.05% | | | 1.09% | | 1.05% |
| | | | | | | | | | | | | | | | |
Janus Short-Term Bond Fund –
Class T Shares | | –0.06% | | 1.37% | | 4.60% | | 3.81% | | 4.64% | | | 0.85% | | 0.80% |
| | | | | | | | | | | | | | | | |
| Barclays Capital 1-3 Year U.S. Government/Credit Index | | 0.53% | | 1.59% | | 3.99% | | 3.63% | | 4.80%** | | | | | |
| | | | | | | | | | | | | | | | |
| Lipper Quartile – Class T Shares | | – | | 2nd | | 1st | | 1st | | 1st | | | | | |
| | | | | | | | | | | | | | | | |
| Lipper Ranking – based on total returns for Short Investment Grade Debt Funds | | – | | 109/254 | | 17/191 | | 18/102 | | 6/25 | | | | | |
| | | | | | | | | | | | | | | | |
| Visit janus.com/advisor/mutual-funds (or janus.com/allfunds if you hold Shares directly with Janus Capital) to view current performance and characteristic information | | | | | |
| | | | | | | | | | | | | | | | |
Data presented represents past performance, which is no guarantee of future results. Investment results and principal value will fluctuate so that shares, when redeemed, may be worth more or less than their original cost. Due to market volatility, current performance may be higher or lower than the performance shown. Call 877.33JANUS(52687) (or 800.525.3713 if you hold shares directly with Janus Capital) or visit janus.com/advisor/mutual-funds (or janus.com/allfunds if you hold shares directly with Janus Capital) for performance current to the most recent month-end.
See important disclosures on the next page.
54 | DECEMBER 31, 2011
(unaudited)
Performance shown for Class A Shares at Maximum Offering Price (MOP) includes the Fund’s maximum sales charge of 2.50%. Performance shown at Net Asset Value (NAV) does not include this charge and would have been lower had this charge been taken into account.
Performance shown for Class C Shares includes a 1% contingent deferred sales charge (CDSC) on periods of less than 12 months. Performance shown at Net Asset Value (NAV) does not include this sales charge and would have been lower had this sales charge been taken into account.
Janus Capital has contractually agreed to waive the Fund’s total annual fund operating expenses allocated to any class (excluding the distribution and shareholder servicing fees (applicable to Class A Shares, Class C Shares, and Class S Shares), administrative services fees payable pursuant to the Transfer Agency (except for networking and omnibus fees), brokerage commissions, interest, dividends, taxes, acquired fund fees and expenses, and extraordinary expenses) to certain limits until at least November 1, 2012. The contractual waiver may be terminated or modified prior to this date only at the discretion of the Board of Trustees. Returns shown include fee waivers, if any, and without such waivers, returns would have been lower.
The expense information shown was determined based on net assets as of the fiscal period ended June 30, 2011. The effect of contractual waivers agreed to by Janus Capital, when applicable, are reflected under “Net Annual Fund Operating Expenses.” (All expenses are shown without the effect of expense offset arrangements. Pursuant to such arrangements, credits realized as a result of uninvested cash balances are used to reduce custodian and transfer agent expenses.)
The Fund’s performance may be affected by risks that include those associated with non-investment grade debt securities, investments in specific industries or countries and potential conflicts of interest with the Janus “funds of funds.” Additional risks to the Fund may include those associated with investing in foreign securities, emerging markets, initial public offerings (“IPOs”), real estate investment trusts (“REITs”), and derivatives. Please see a Janus prospectus or janus.com/info (or janus.com/reports if you hold shares directly with Janus Capital) for more information about risks, portfolio holdings and other details.
Funds that invest in bonds have the same interest rate, inflation, and credit risks that are associated with the underlying bonds owned by the Fund. Unlike owning individual bonds, there are ongoing fees and expenses associated with owning shares of Fixed Income Funds. The return of principal is not guaranteed due to net asset value fluctuation that is caused by changes in the price of specific bonds held in the Fund and selling of bonds within the Fund by the portfolio managers.
The Fund invests in mortgage-backed securities. Mortgage-backed securities are subject to prepayment risk (early payoff of mortgages during periods of declining interest rates) and extension risk (extending the duration of mortgage-backed securities during periods of rising interest rates). These risks may increase the volatility of these securities and affect total returns.
High-yield/high-risk bonds, also known as “junk” bonds, involve a greater risk of default and price volatility than investment grade bonds. High-yield/high-risk bonds can experience sudden and sharp price swings which will affect net asset value.
The Fund invests in REITs, which may be subject to a higher degree of market risk because of concentration in a specific industry, sector or geographic region. REITs may be subject to risks including, but not limited to: legal, political, liquidity, and interest rate risks, a decline in the value of real estate, risks related to general and economic conditions, changes in the value of the underlying property owned by the trust and defaults by borrowers. To the extent the Fund invests in foreign REITs, the Fund may be subject to fluctuations in currency rates or political or economic conditions in a particular country.
The Fund may invest in derivatives which can be highly volatile and involve additional risks than if the underlying securities were held directly by the Fund. Such risks include gains or losses which, as a result of leverage, can be substantially greater than the derivatives’ original cost. There is also a possibility that derivatives may not perform as intended which can reduce opportunity for gains or result in losses by offsetting positive returns in other securities the Fund owns.
The Fund will normally invest at least 80% of its net assets, measured at the time of purchase, in the type of securities described by its name.
Returns include reinvestment of dividends from net investment income and distributions from capital gains. The returns shown do not reflect the deduction of taxes that a shareholder would pay on Fund distributions or the redemption of Fund shares. The returns do not include adjustments in accordance with generally accepted accounting principles required at the period end for financial reporting purposes.
Class A Shares, Class C Shares, Class I Shares, and Class S Shares of the Fund commenced operations on July 6, 2009. The historical performance shown for periods prior to July 6, 2009 reflects the performance of one or more other share classes of the Fund, calculated using the fees and expenses of each respective share class without the effect of any fee and expense limitations and waivers. If each share class of the Fund had been available during periods prior to July 6, 2009, the performance shown may have been different. Please refer to the Fund’s prospectus for further details concerning historical performance.
Class D Shares of the Fund commenced operations on February 16, 2010, as a result of the restructuring of Class J Shares, the predecessor share class. The performance shown for Class D Shares for periods prior to February 16, 2010 reflects the performance of the Fund’s former Class J Shares. If Class D Shares of the Fund had been available during periods prior to February 16, 2010, the performance shown may have been different. The performance shown for periods following the Fund’s commencement of Class D Shares reflects the fees and expenses of Class D Shares, net of any fee and expense limitations or waivers.
Janus Fixed Income & Money Market Funds | 55
Janus Short-Term Bond Fund (unaudited)
Lipper, a wholly-owned subsidiary of Thomson Reuters, provides independent insight on global collective investments including mutual funds, retirement funds, hedge funds, fund fees and expenses to the asset management and media communities. Lipper ranks the performance of mutual funds within a classification of funds that have similar investment objectives. Rankings are historical with capital gains and dividends reinvested and do not include the effect of loads.
Ranking is for Class T Shares only; other classes may have different performance characteristics. When an expense waiver is in effect, it may have a material effect on the total return or yield, and therefore the ranking for the period.
September 3, 1992 is the date used to calculate the since-inception Lipper ranking, which is slightly different from when the Fund began operations since Lipper provides fund rankings as of the last day of the month or the first Thursday after fund inception.
There is no assurance that the investment process will consistently lead to successful investing.
See Notes to Schedules of Investments for index definitions.
The Fund’s portfolio may differ significantly from the securities held in the index. The index is unmanaged and is not available for direct investment; therefore, its performance does not reflect the expenses associated with the active management of an actual portfolio.
See “Explanations of Charts, Tables and Financial Statements.”
| | | |
| * | | The Fund’s inception date – September 1, 1992 |
| ** | | The Barclays Capital 1-3 Year U.S. Government/Credit Index’s since inception returns are calculated from August 31, 1992. |
| (1) | | Closed to new investors. |
The examples below show you the ongoing costs (in dollars) of investing in your Fund and allow you to compare these costs with those of other mutual funds. Please refer to the section Useful Information About Your Fund Report for a detailed explanation of the information presented in these charts.
| | | | | | | | | | | | | | | |
| | | Beginning Account Value
| | Ending Account Value
| | Expenses Paid During Period
| | |
| Expense Example – Class A Shares | | (7/1/11) | | (12/31/11) | | (7/1/11 - 12/31/11)† | | |
| |
| |
| Actual | | $ | 1,000.00 | | | $ | 1,002.60 | | | $ | 3.93 | | | |
| |
| |
Hypothetical
(5% return before expenses) | | $ | 1,000.00 | | | $ | 1,021.22 | | | $ | 3.96 | | | |
| |
| |
| | | | | | | | | | | | | | | |
| | | | | | | | | | | | | | | |
| | | Beginning Account Value
| | Ending Account Value
| | Expenses Paid During Period
| | |
| Expense Example – Class C Shares | | (7/1/11) | | (12/31/11) | | (7/1/11 - 12/31/11)† | | |
| |
| |
| Actual | | $ | 1,000.00 | | | $ | 995.60 | | | $ | 7.67 | | | |
| |
| |
Hypothetical
(5% return before expenses) | | $ | 1,000.00 | | | $ | 1,017.45 | | | $ | 7.76 | | | |
| |
| |
| | | | | | | | | | | | | | | |
| | | | | | | | | | | | | | | |
| | | Beginning Account Value
| | Ending Account Value
| | Expenses Paid During Period
| | |
| Expense Example – Class D Shares | | (7/1/11) | | (12/31/11) | | (7/1/11 - 12/31/11)† | | |
| |
| |
| Actual | | $ | 1,000.00 | | | $ | 1,000.00 | | | $ | 3.32 | | | |
| |
| |
Hypothetical
(5% return before expenses) | | $ | 1,000.00 | | | $ | 1,021.82 | | | $ | 3.35 | | | |
| |
| |
| | | | | | | | | | | | | | | |
| | | | | | | | | | | | | | | |
| | | Beginning Account Value
| | Ending Account Value
| | Expenses Paid During Period
| | |
| Expense Example – Class I Shares | | (7/1/11) | | (12/31/11) | | (7/1/11 - 12/31/11)† | | |
| |
| |
| Actual | | $ | 1,000.00 | | | $ | 1,003.90 | | | $ | 2.77 | | | |
| |
| |
Hypothetical
(5% return before expenses) | | $ | 1,000.00 | | | $ | 1,022.37 | | | $ | 2.80 | | | |
| |
| |
| | | | | | | | | | | | | | | |
| | | | | | | | | | | | | | | |
| | | Beginning Account Value
| | Ending Account Value
| | Expenses Paid During Period
| | |
| Expense Example – Class S Shares | | (7/1/11) | | (12/31/11) | | (7/1/11 - 12/31/11)† | | |
| |
| |
| Actual | | $ | 1,000.00 | | | $ | 998.10 | | | $ | 5.17 | | | |
| |
| |
Hypothetical
(5% return before expenses) | | $ | 1,000.00 | | | $ | 1,019.96 | | | $ | 5.23 | | | |
| |
| |
| | | | | | | | | | | | | | | |
| | | | | | | | | | | | | | | |
| | | Beginning Account Value
| | Ending Account Value
| | Expenses Paid During Period
| | |
| Expense Example – Class T Shares | | (7/1/11) | | (12/31/11) | | (7/1/11 - 12/31/11)† | | |
| |
| |
| Actual | | $ | 1,000.00 | | | $ | 999.40 | | | $ | 3.92 | | | |
| |
| |
Hypothetical
(5% return before expenses) | | $ | 1,000.00 | | | $ | 1,021.22 | | | $ | 3.96 | | | |
| |
| |
| | | |
| † | | Expenses are equal to the annualized expense ratio of 0.78% for Class A Shares, 1.53% for Class C Shares, 0.66% for Class D Shares, 0.55% for Class I Shares, 1.03% for Class S Shares and 0.78% for Class T Shares multiplied by the average account value over the period, multiplied by 184/366 (to reflect the one-half year period). Expenses include effect of contractual waivers by Janus Capital. |
56 | DECEMBER 31, 2011
Janus Short-Term Bond Fund
Schedule of Investments (unaudited)
As of December 31, 2011
| | | | | | | | | | | |
| Shares or Principal Amount | | Value | | | |
| |
| Asset-Backed/Commercial Mortgage-Backed Securities – 1.8% | | | | | | |
| $ | 13,931,000 | | | Macquarie SMART Series 2011-2 U.S. Trust
1.5400%, 3/14/15 (144A) | | $ | 13,927,718 | | | |
| | 8,658,000 | | | Penarth Master Issuer PLC
0.9346%, 7/18/13‡ | | | 8,629,403 | | | |
| | 30,586,000 | | | Permanent Master Issuer PLC
1.9305%, 7/15/42 (144A),‡ | | | 30,474,697 | | | |
| |
| |
| Total Asset-Backed/Commercial Mortgage-Backed Securities (cost $53,172,620) | | | 53,031,818 | | | |
| |
| |
| Bank Loans – 2.6% | | | | | | |
| Advertising Sales – 0.4% | | | | | | |
| | 11,249,730 | | | Visant Corp.
5.2500%, 12/22/16‡ | | | 10,526,486 | | | |
| | 114,990 | | | Visant Corp.
6.2500%, 12/22/16‡ | | | 107,597 | | | |
| | | | | | | | 10,634,083 | | | |
| Automotive – Truck Parts and Equipment – Original – 0.2% | | | | | | |
| | 5,906,534 | | | Delphi Automotive LLP
3.5000%, 3/31/17‡ | | | 5,877,001 | | | |
| Broadcast Services and Programming – 0.1% | | | | | | |
| | 3,735,234 | | | Sinclair Television Group, Inc.
4.0000%, 10/28/16‡ | | | 3,719,210 | | | |
| Casino Hotels – 0.1% | | | | | | |
| | 898,213 | | | Ameristar Casinos, Inc.
4.0000%, 4/16/18‡ | | | 894,287 | | | |
| Computer Services – 0.1% | | | | | | |
| | 3,640,000 | | | SunGard Data Systems, Inc.
3.7776%, 2/28/14‡ | | | 3,585,400 | | | |
| Containers – Paper and Plastic – 0.2% | | | | | | |
| | 4,520,285 | | | Rock-Tenn Co.
3.5000%, 5/28/18‡ | | | 4,513,821 | | | |
| Medical – Hospitals – 0.8% | | | | | | |
| | 19,816,490 | | | HCA, Inc.
1.5463%, 11/16/12‡ | | | 19,652,013 | | | |
| | 4,488,085 | | | IASIS Healthcare LLC
5.0000%, 5/3/18‡ | | | 4,322,609 | | | |
| | | | | | | | 23,974,622 | | | |
| Retail – Apparel and Shoe – 0.2% | | | | | | |
| | 5,419,765 | | | J Crew Group, Inc.
4.7500%, 3/7/18‡ | | | 5,079,079 | | | |
| Shipbuilding – 0.5% | | | | | | |
| | 15,750,350 | | | Huntington Ingalls Industries, Inc.
3.0625%, 3/30/16‡ | | | 15,356,591 | | | |
| |
| |
| Total Bank Loans (cost $75,230,721) | | | 73,634,094 | | | |
| |
| |
| Corporate Bonds – 75.3% | | | | | | |
| Advertising Services – 0.1% | | | | | | |
| | 1,660,000 | | | WPP Finance UK
5.8750%, 6/15/14 | | | 1,773,310 | | | |
| Aerospace and Defense – Equipment – 0.9% | | | | | | |
| | 26,388,000 | | | Exelis, Inc.
4.2500%, 10/1/16 (144A) | | | 26,625,492 | | | |
| Airlines – 0.6% | | | | | | |
| | 8,235,000 | | | Southwest Airlines Co.
6.5000%, 3/1/12 | | | 8,301,069 | | | |
| | 9,444,000 | | | Southwest Airlines Co.
5.2500%, 10/1/14 | | | 10,078,826 | | | |
| | | | | | | | 18,379,895 | | | |
| Automotive – Cars and Light Trucks – 0.5% | | | | | | |
| | 14,652,000 | | | Volkswagen International Finance N.V.
1.6250%, 8/12/13 (144A) | | | 14,692,249 | | | |
| Beverages – Non-Alcoholic – 0.6% | | | | | | |
| | 5,034,000 | | | PepsiCo, Inc.
3.7500%, 3/1/14 | | | 5,352,416 | | | |
| | 11,886,000 | | | PepsiCo, Inc.
0.8000%, 8/25/14 | | | 11,876,063 | | | |
| | | | | | | | 17,228,479 | | | |
| Brewery – 1.4% | | | | | | |
| | 8,918,000 | | | Anheuser-Busch InBev Worldwide, Inc.
3.0000%, 10/15/12 | | | 9,057,584 | | | |
| | 20,511,000 | | | Anheuser-Busch InBev Worldwide, Inc.
2.5000%, 3/26/13 | | | 20,890,146 | | | |
| | 11,393,000 | | | Anheuser-Busch InBev Worldwide, Inc.
1.5000%, 7/14/14 | | | 11,474,426 | | | |
| | | | | | | | 41,422,156 | | | |
| Building Products – Cement and Aggregate – 0.2% | | | | | | |
| | 5,351,000 | | | CRH America, Inc.
5.3000%, 10/15/13 | | | 5,557,768 | | | |
| Cable/Satellite Television – 0.2% | | | | | | |
| | 1,338,000 | | | COX Communications, Inc.
7.1250%, 10/1/12 | | | 1,400,957 | | | |
| | 3,121,000 | | | Time Warner Cable, Inc.
5.4000%, 7/2/12 | | | 3,191,372 | | | |
| | 1,070,000 | | | Time Warner Cable, Inc.
6.2000%, 7/1/13 | | | 1,148,180 | | | |
| | | | | | | | 5,740,509 | | | |
| Cellular Telecommunications – 0.2% | | | | | | |
| | 1,017,000 | | | Cellco Partnership / Verizon Wireless Capital LLC
5.2500%, 2/1/12 | | | 1,020,505 | | | |
| | 1,650,000 | | | Cellco Partnership / Verizon Wireless Capital LLC
7.3750%, 11/15/13 | | | 1,837,176 | | | |
| | 1,694,000 | | | Cellco Partnership / Verizon Wireless Capital LLC
5.5500%, 2/1/14 | | | 1,840,465 | | | |
| | | | | | | | 4,698,146 | | | |
| Chemicals – Diversified – 1.2% | | | | | | |
| | 2,675,000 | | | Dow Chemical Co.
4.8500%, 8/15/12 | | | 2,736,728 | | | |
| | 2,738,000 | | | Dow Chemical Co.
7.6000%, 5/15/14 | | | 3,096,180 | | | |
| | 12,541,000 | | | Lyondell Chemical Co.
8.0000%, 11/1/17 | | | 13,701,042 | | | |
| | 2,275,000 | | | Lyondell Chemical Co.
11.0000%, 5/1/18 | | | 2,485,437 | | | |
See Notes to Schedules of Investments and Financial Statements.
Janus Fixed Income & Money Market Funds | 57
Janus Short-Term Bond Fund
Schedule of Investments (unaudited)
As of December 31, 2011
| | | | | | | | | | | |
| Shares or Principal Amount | | Value | | | |
| |
| Chemicals – Diversified – (continued) | | | | | | |
| | | | | | | | | | | |
| $ | 4,700,000 | | | Nova Chemicals Corp.
6.5000%, 1/15/12 | | $ | 4,705,875 | | | |
| | 6,985,000 | | | Rohm & Hass Co.
5.6000%, 3/15/13 | | | 7,297,691 | | | |
| | | | | | | | 34,022,953 | | | |
| Chemicals – Specialty – 0.7% | | | | | | |
| | 4,017,000 | | | Ashland, Inc.
9.1250%, 6/1/17 | | | 4,478,955 | | | |
| | 14,674,000 | | | Ecolab, Inc.
2.3750%, 12/8/14 | | | 14,959,013 | | | |
| | | | | | | | 19,437,968 | | | |
| Coatings and Paint Products – 0.5% | | | | | | |
| | 14,316,000 | | | RPM International, Inc.
6.2500%, 12/15/13 | | | 15,267,570 | | | |
| Commercial Banks – 5.8% | | | | | | |
| | 4,018,000 | | | Abbey National Treasury Services PLC
2.0022%, 4/25/14‡ | | | 3,657,919 | | | |
| | 8,608,000 | | | Abbey National Treasury Services PLC
2.8750%, 4/25/14 | | | 8,024,825 | | | |
| | 14,001,000 | | | American Express Bank FSB
5.5500%, 10/17/12 | | | 14,468,325 | | | |
| | 8,383,000 | | | Banco Santander Chile
2.8750%, 11/13/12 (144A) | | | 8,416,415 | | | |
| | 17,835,000 | | | BB&T Corp.
2.0500%, 4/28/14 | | | 18,009,533 | | | |
| | 17,835,000 | | | Canadian Imperial Bank of Commerce/Canada
1.4500%, 9/13/13 | | | 17,834,590 | | | |
| | 12,416,000 | | | CIT Group, Inc.
5.2500%, 4/1/14 (144A) | | | 12,369,440 | | | |
| | 3,803,000 | | | Credit Suisse / New York NY
5.5000%, 5/1/14 | | | 3,952,914 | | | |
| | 25,861,000 | | | HSBC Bank PLC
1.6250%, 8/12/13 (144A) | | | 25,474,378 | | | |
| | 15,775,000 | | | National Australia Bank, Ltd.
2.5000%, 1/8/13 (144A) | | | 15,855,595 | | | |
| | 7,738,000 | | | National Bank of Canada
1.6500%, 1/30/14 (144A) | | | 7,819,698 | | | |
| | 17,835,000 | | | Nordea Bank A.B.
1.7500%, 10/4/13 (144A) | | | 17,427,345 | | | |
| | 9,979,000 | | | Svenska Handelsbanken A.B.
2.8750%, 9/14/12 (144A) | | | 10,073,371 | | | |
| | 4,066,000 | | | Westpac Securities NZ, Ltd.
2.6250%, 1/28/13 (144A) | | | 4,100,179 | | | |
| | | | | | | | 167,484,527 | | | |
| Computers – Memory Devices – 0.3% | | | | | | |
| | 8,874,000 | | | Seagate Technology
10.0000%, 5/1/14 (144A) | | | 10,038,712 | | | |
| Data Processing and Management – 0.7% | | | | | | |
| | 19,152,000 | | | Fiserv, Inc.
3.1250%, 10/1/15 | | | 19,619,347 | | | |
| Diversified Banking Institutions – 10.2% | | | | | | |
| | 22,299,000 | | | Bank of America Corp.
4.5000%, 4/1/15 | | | 21,518,223 | | | |
| | 13,176,000 | | | Citigroup, Inc.
5.6250%, 8/27/12 | | | 13,374,997 | | | |
| | 27,377,000 | | | Citigroup, Inc.
1.3072%, 2/15/13‡ | | | 26,866,747 | | | |
| | 14,714,000 | | | Citigroup, Inc.
5.5000%, 4/11/13 | | | 15,021,861 | | | |
| | 10,585,000 | | | Citigroup, Inc.
5.0000%, 9/15/14 | | | 10,476,059 | | | |
| | 5,507,000 | | | Citigroup, Inc.
4.8750%, 5/7/15 | | | 5,439,440 | | | |
| | 4,530,000 | | | Citigroup, Inc.
4.7500%, 5/19/15 | | | 4,587,798 | | | |
| | 17,835,000 | | | Goldman Sachs Group, Inc.
4.7500%, 7/15/13 | | | 18,070,886 | | | |
| | 2,876,000 | | | Goldman Sachs Group, Inc.
3.7000%, 8/1/15 | | | 2,817,629 | | | |
| | 26,702,000 | | | JPMorgan Chase & Co.
5.7500%, 1/2/13 | | | 27,699,053 | | | |
| | 18,476,000 | | | JPMorgan Chase & Co.
4.8750%, 3/15/14 | | | 19,281,905 | | | |
| | 17,612,000 | | | Morgan Stanley
5.3000%, 3/1/13 | | | 17,827,571 | | | |
| | 11,147,000 | | | Morgan Stanley
2.9528%, 5/14/13‡ | | | 10,703,595 | | | |
| | 6,242,000 | | | Morgan Stanley
6.7500%, 10/15/13 | | | 6,482,323 | | | |
| | 20,734,000 | | | Morgan Stanley
2.8750%, 1/24/14 | | | 19,858,859 | | | |
| | 8,907,000 | | | Morgan Stanley
2.8750%, 7/28/14 | | | 8,388,265 | | | |
| | 16,241,000 | | | Royal Bank of Scotland PLC
3.4000%, 8/23/13 | | | 15,800,252 | | | |
| | 9,728,000 | | | Royal Bank of Scotland PLC
4.3750%, 3/16/16 | | | 9,280,444 | | | |
| | 27,127,000 | | | UBS A.G.
2.2500%, 8/12/13 | | | 26,885,163 | | | |
| | 16,944,000 | | | UBS A.G.
2.2500%, 1/28/14 | | | 16,488,511 | | | |
| | | | | | | | 296,869,581 | | | |
| Diversified Financial Services – 2.7% | | | | | | |
| | 15,717,000 | | | General Electric Capital Corp.
2.8000%, 1/8/13 | | | 16,015,623 | | | |
| | 4,459,000 | | | General Electric Capital Corp.
5.4500%, 1/15/13 | | | 4,665,282 | | | |
| | 26,575,000 | | | General Electric Capital Corp.
1.8750%, 9/16/13 | | | 26,902,324 | | | |
| | 3,465,000 | | | General Electric Capital Corp.
5.9000%, 5/13/14 | | | 3,794,702 | | | |
| | 26,753,000 | | | General Electric Capital Corp.
2.9500%, 5/9/16 | | | 27,515,006 | | | |
| | | | | | | | 78,892,937 | | | |
| Diversified Minerals – 0.9% | | | | | | |
| | 8,026,000 | | | Anglo American Capital PLC
2.1500%, 9/27/13 | | | 8,039,331 | | | |
| | 6,349,000 | | | Teck Resources, Ltd.
7.0000%, 9/15/12 | | | 6,590,554 | | | |
| | 8,831,000 | | | Teck Resources, Ltd.
10.2500%, 5/15/16 | | | 10,155,650 | | | |
| | | | | | | | 24,785,535 | | | |
| Diversified Operations – 0.9% | | | | | | |
| | 13,376,000 | | | Danaher Corp.
1.3000%, 6/23/14 | | | 13,568,173 | | | |
See Notes to Schedules of Investments and Financial Statements.
58 | DECEMBER 31, 2011
Schedule of Investments (unaudited)
As of December 31, 2011
| | | | | | | | | | | |
| Shares or Principal Amount | | Value | | | |
| |
| Diversified Operations – (continued) | | | | | | |
| | | | | | | | | | | |
| $ | 972,000 | | | Eaton Corp.
4.9000%, 5/15/13 | | $ | 1,023,881 | | | |
| | 11,283,000 | | | Tyco Electronics Group S.A.
6.0000%, 10/1/12 | | | 11,678,909 | | | |
| | | | | | | | 26,270,963 | | | |
| Diversified Operations – Commercial Services – 0.4% | | | | | | |
| | 10,097,000 | | | ARAMARK Corp.
8.5000%, 2/1/15 | | | 10,349,425 | | | |
| Electric – Distribution – 0.2% | | | | | | |
| | 5,395,000 | | | SP Powerassets, Ltd.
5.0000%, 10/22/13 (144A) | | | 5,723,917 | | | |
| Electric – Generation – 0.7% | | | | | | |
| | 2,314,000 | | | AES Corp.
7.7500%, 10/15/15 | | | 2,516,475 | | | |
| | 18,040,000 | | | Allegheny Energy Supply Co. LLC
8.2500%, 4/15/12 (144A) | | | 18,365,730 | | | |
| | | | | | | | 20,882,205 | | | |
| Electric – Integrated – 1.8% | | | | | | |
| | 6,010,000 | | | CMS Energy Corp.
2.7500%, 5/15/14 | | | 5,935,692 | | | |
| | 1,471,000 | | | Duke Energy Corp.
6.3000%, 2/1/14 | | | 1,622,931 | | | |
| | 892,000 | | | Georgia Power Co.
6.0000%, 11/1/13 | | | 974,131 | | | |
| | 1,338,000 | | | Monongahela Power Co.
7.9500%, 12/15/13 (144A) | | | 1,496,085 | | | |
| | 4,459,000 | | | NiSource, Inc.
5.4000%, 7/15/14 | | | 4,837,935 | | | |
| | 696,000 | | | Oncor Electric Delivery Co.
5.9500%, 9/1/13 | | | 744,729 | | | |
| | 13,656,000 | | | PPL WEM Holdings PLC
3.9000%, 5/1/16 (144A) | | | 13,688,870 | | | |
| | 16,723,000 | | | Southern Co.
1.9500%, 9/1/16 | | | 16,880,815 | | | |
| | 4,459,000 | | | Union Electric Co.
4.6500%, 10/1/13 | | | 4,707,308 | | | |
| | | | | | | | 50,888,496 | | | |
| Electronic Components – Semiconductors – 1.0% | | | | | | |
| | 8,918,000 | | | Advanced Micro Devices, Inc.
5.7500%, 8/15/12 | | | 9,007,180 | | | |
| | 6,033,000 | | | National Semiconductor Corp.
6.1500%, 6/15/12 | | | 6,180,881 | | | |
| | 3,722,000 | | | Texas Instruments, Inc.
0.8750%, 5/15/13 | | | 3,731,781 | | | |
| | 10,569,000 | | | Texas Instruments, Inc.
1.3750%, 5/15/14 | | | 10,700,542 | | | |
| | | | | | | | 29,620,384 | | | |
| Electronic Measuring Instruments – 0.5% | | | | | | |
| | 4,107,000 | | | Agilent Technologies, Inc.
2.5000%, 7/15/13 | | | 4,145,786 | | | |
| | 11,728,000 | | | FLIR Systems, Inc.
3.7500%, 9/1/16 | | | 11,683,821 | | | |
| | | | | | | | 15,829,607 | | | |
| Electronics – Military – 0.6% | | | | | | |
| | 16,886,000 | | | L-3 Communications Corp.
6.3750%, 10/15/15 | | | 17,308,150 | | | |
| Fiduciary Banks – 0.1% | | | | | | |
| | 1,784,000 | | | Northern Trust Corp.
5.5000%, 8/15/13 | | | 1,897,305 | | | |
| Finance – Auto Loans – 1.9% | | | | | | |
| | 19,895,000 | | | Ford Motor Credit Co. LLC
8.0000%, 6/1/14 | | | 21,655,051 | | | |
| | 26,982,000 | | | Ford Motor Credit Co. LLC
3.8750%, 1/15/15 | | | 26,881,303 | | | |
| | 7,005,000 | | | PACCAR Financial Corp.
1.9500%, 12/17/12 | | | 7,094,748 | | | |
| | | | | | | | 55,631,102 | | | |
| Finance – Commercial – 0.4% | | | | | | |
| | 10,701,000 | | | Caterpillar, Inc.
2.0000%, 4/5/13 | | | 10,887,968 | | | |
| Finance – Consumer Loans – 0.5% | | | | | | |
| | 14,819,000 | | | SLM Corp.
5.0000%, 10/1/13 | | | 14,819,000 | | | |
| Finance – Credit Card – 0.3% | | | | | | |
| | 535,000 | | | American Express Credit Co.
5.8750%, 5/2/13 | | | 562,368 | | | |
| | 8,633,000 | | | American Express Credit Co.
2.8000%, 9/19/16 | | | 8,675,302 | | | |
| | | | | | | | 9,237,670 | | | |
| Finance – Investment Bankers/Brokers – 2.0% | | | | | | |
| | 3,206,000 | | | Charles Schwab Corp.
4.9500%, 6/1/14 | | | 3,474,486 | | | |
| | 13,019,000 | | | Jefferies Group, Inc.
3.8750%, 11/9/15 | | | 11,521,815 | | | |
| | 6,064,000 | | | Merrill Lynch & Co., Inc.
5.4500%, 2/5/13 | | | 6,108,079 | | | |
| | 8,918,000 | | | Merrill Lynch & Co., Inc.
6.1500%, 4/25/13 | | | 9,001,553 | | | |
| | 11,697,000 | | | Raymond James Financial, Inc.
4.2500%, 4/15/16 | | | 11,949,901 | | | |
| | 8,414,000 | | | TD Ameritrade Holding Corp.
2.9500%, 12/1/12 | | | 8,519,167 | | | |
| | 5,975,000 | | | TD Ameritrade Holding Corp.
4.1500%, 12/1/14 | | | 6,314,912 | | | |
| | | | | | | | 56,889,913 | | | |
| Finance – Other Services – 0.2% | | | | | | |
| | 1,784,000 | | | National Rural Utilities Cooperative Finance Corp.
2.6250%, 9/16/12 | | | 1,806,659 | | | |
| | 2,563,000 | | | National Rural Utilities Cooperative Finance Corp.
5.5000%, 7/1/13 | | | 2,741,223 | | | |
| | | | | | | | 4,547,882 | | | |
| Food – Confectionary – 1.1% | | | | | | |
| | 10,808,000 | | | WM Wrigley Jr. Co.
2.4500%, 6/28/12 (144A) | | | 10,888,044 | | | |
| | 11,593,000 | | | WM Wrigley Jr. Co.
3.0500%, 6/28/13 (144A) | | | 11,804,711 | | | |
| | 8,918,000 | | | WM Wrigley Jr. Co.
3.7000%, 6/30/14 (144A) | | | 9,193,843 | | | |
| | | | | | | | 31,886,598 | | | |
| Food – Meat Products – 0.3% | | | | | | |
| | 9,520,000 | | | Smithfield Foods, Inc.
7.7500%, 5/15/13 | | | 10,091,200 | | | |
See Notes to Schedules of Investments and Financial Statements.
Janus Fixed Income & Money Market Funds | 59
Janus Short-Term Bond Fund
Schedule of Investments (unaudited)
As of December 31, 2011
| | | | | | | | | | | |
| Shares or Principal Amount | | Value | | | |
| |
| Food – Miscellaneous/Diversified – 1.5% | | | | | | |
| $ | 8,764,000 | | | General Mills, Inc.
1.5500%, 5/16/14 | | $ | 8,822,833 | | | |
| | 2,933,000 | | | Kellogg, Co.
5.1250%, 12/3/12 | | | 3,048,229 | | | |
| | 30,900,000 | | | Kraft Foods, Inc.
2.6250%, 5/8/13 | | | 31,568,274 | | | |
| | 482,000 | | | Kraft Foods, Inc.
6.7500%, 2/19/14 | | | 535,665 | | | |
| | | | | | | | 43,975,001 | | | |
| Food – Retail – 0% | | | | | | |
| | 334,000 | | | Delhaize Group
5.8750%, 2/1/14 | | | 362,514 | | | |
| Hotels and Motels – 0.5% | | | | | | |
| | 11,236,000 | | | Marriott International, Inc.
4.6250%, 6/15/12 | | | 11,382,832 | | | |
| | 3,933,000 | | | Starwood Hotels & Resorts Worldwide, Inc.
7.8750%, 10/15/14 | | | 4,414,793 | | | |
| | | | | | | | 15,797,625 | | | |
| Industrial Gases – 1.3% | | | | | | |
| | 16,052,000 | | | Praxair, Inc.
2.1250%, 6/14/13 | | | 16,372,895 | | | |
| | 18,490,000 | | | Praxair, Inc.
4.6250%, 3/30/15 | | | 20,409,817 | | | |
| | | | | | | | 36,782,712 | | | |
| Investment Management and Advisory Services – 0.3% | | | | | | |
| | 9,230,000 | | | Franklin Resources, Inc.
2.0000%, 5/20/13 | | | 9,324,091 | | | |
| Life and Health Insurance – 1.3% | | | | | | |
| | 33,378,000 | | | Prudential Financial, Inc.
3.6250%, 9/17/12 | | | 33,895,426 | | | |
| | 892,000 | | | Prudential Financial, Inc.
4.5000%, 7/15/13 | | | 924,744 | | | |
| | 1,445,000 | | | Prudential Financial, Inc.
6.2000%, 1/15/15 | | | 1,579,031 | | | |
| | | | | | | | 36,399,201 | | | |
| Linen Supply & Related Items – 0.2% | | | | | | |
| | 5,152,000 | | | Cintas Corp. No. 2
2.8500%, 6/1/16 | | | 5,283,598 | | | |
| Machinery – General Industrial – 0.2% | | | | | | |
| | 5,767,000 | | | Wabtec Corp.
6.8750%, 7/31/13 | | | 6,012,097 | | | |
| Medical – Biomedical and Genetic – 1.0% | | | | | | |
| | 17,813,000 | | | Amgen, Inc.
2.3000%, 6/15/16 | | | 17,934,699 | | | |
| | 10,276,000 | | | Gilead Sciences, Inc.
2.4000%, 12/1/14 | | | 10,461,050 | | | |
| | | | | | | | 28,395,749 | | | |
| Medical – Drugs – 0.4% | | | | | | |
| | 11,465,000 | | | Johnson & Johnson
1.2000%, 5/15/14 | | | 11,641,939 | | | |
| Medical Products – 0.1% | | | | | | |
| | 2,702,000 | | | CareFusion Corp.
4.1250%, 8/1/12 | | | 2,743,054 | | | |
| | 1,338,000 | | | Covidien International Finance S.A.
5.4500%, 10/15/12 | | | 1,384,692 | | | |
| | | | | | | | 4,127,746 | | | |
| Multi-Line Insurance – 2.4% | | | | | | |
| | 8,721,000 | | | American International Group, Inc.
3.6500%, 1/15/14 | | | 8,469,748 | | | |
| | 30,909,000 | | | American International Group, Inc.
4.2500%, 9/15/14 | | | 30,016,595 | | | |
| | 12,485,000 | | | MetLife, Inc.
1.6850%, 8/6/13‡ | | | 12,532,380 | | | |
| | 17,030,000 | | | MetLife, Inc.
2.3750%, 2/6/14 | | | 17,267,620 | | | |
| | | | | | | | 68,286,343 | | | |
| Multimedia – 1.1% | | | | | | |
| | 17,835,000 | | | NBC Universal Media LLC
2.1000%, 4/1/14 | | | 18,128,832 | | | |
| | 14,500,000 | | | Time Warner, Inc.
3.1500%, 7/15/15 | | | 15,081,740 | | | |
| | | | | | | | 33,210,572 | | | |
| Office Automation and Equipment – 0.1% | | | | | | |
| | 3,072,000 | | | Xerox Corp.
5.5000%, 5/15/12 | | | 3,122,937 | | | |
| | 993,000 | | | Xerox Corp.
8.2500%, 5/15/14 | | | 1,120,482 | | | |
| | | | | | | | 4,243,419 | | | |
| Oil – Field Services – 0.8% | | | | | | |
| | 8,391,000 | | | Korea National Oil Corp.
4.0000%, 10/27/16 (144A) | | | 8,617,012 | | | |
| | 15,644,000 | | | Schlumberger Investment S.A.
1.9500%, 9/14/16 (144A) | | | 15,828,083 | | | |
| | | | | | | | 24,445,095 | | | |
| Oil Companies – Exploration and Production – 1.6% | | | | | | |
| | 15,719,000 | | | Canadian Natural Resources, Ltd.
1.4500%, 11/14/14 | | | 15,810,563 | | | |
| | 20,416,000 | | | Petrohawk Energy Corp.
7.8750%, 6/1/15 | | | 21,743,040 | | | |
| | 8,670,000 | | | Whiting Petroleum Corp.
7.0000%, 2/1/14 | | | 9,233,550 | | | |
| | | | | | | | 46,787,153 | | | |
| Oil Companies – Integrated – 1.4% | | | | | | |
| | 10,509,000 | | | BP Capital Markets PLC
2.2480%, 11/1/16 | | | 10,576,016 | | | |
| | 2,229,000 | | | ConocoPhillips
4.7500%, 2/1/14 | | | 2,407,362 | | | |
| | 3,955,000 | | | ConocoPhillips Australia Funding Co.
5.5000%, 4/15/13 | | | 4,188,626 | | | |
| | 22,613,000 | | | Shell International Finance B.V.
1.8750%, 3/25/13 | | | 23,033,851 | | | |
| | | | | | | | 40,205,855 | | | |
See Notes to Schedules of Investments and Financial Statements.
60 | DECEMBER 31, 2011
Schedule of Investments (unaudited)
As of December 31, 2011
| | | | | | | | | | | |
| Shares or Principal Amount | | Value | | | |
| |
| Oil Refining and Marketing – 0.4% | | | | | | |
| $ | 4,280,000 | | | Sunoco, Inc.
4.8750%, 10/15/14 | | $ | 4,364,722 | | | |
| | 7,642,000 | | | Valero Energy Corp.
6.8750%, 4/15/12 | | | 7,766,221 | | | |
| | | | | | | | 12,130,943 | | | |
| Pharmacy Services – 1.3% | | | | | | |
| | 30,298,000 | | | Aristotle Holding, Inc.
2.7500%, 11/21/14 (144A) | | | 30,665,333 | | | |
| | 7,158,000 | | | Express Scripts, Inc.
3.1250%, 5/15/16 | | | 7,197,677 | | | |
| | | | | | | | 37,863,010 | | | |
| Pipelines – 3.2% | | | | | | |
| | 1,927,000 | | | El Paso Corp.
7.3750%, 12/15/12 | | | 2,005,088 | | | |
| | 8,680,000 | | | Energy Transfer Partners L.P.
5.6500%, 8/1/12 | | | 8,868,104 | | | |
| | 13,663,000 | | | Enterprise Products Operating LLC
4.6000%, 8/1/12 | | | 13,864,024 | | | |
| | 2,492,000 | | | Kinder Morgan Energy Partners L.P.
5.8500%, 9/15/12 | | | 2,572,342 | | | |
| | 2,880,000 | | | Kinder Morgan Energy Partners L.P.
5.0000%, 12/15/13 | | | 3,052,636 | | | |
| | 3,567,000 | | | Kinder Morgan Finance Co. ULC
5.7000%, 1/5/16 | | | 3,647,258 | | | |
| | 13,250,000 | | | Kinder Morgan, Inc.
6.5000%, 9/1/12 | | | 13,548,125 | | | |
| | 25,052,000 | | | Plains All American Pipeline L.P.
4.2500%, 9/1/12 | | | 25,554,668 | | | |
| | 18,687,000 | | | Plains All American Pipeline L.P.
3.9500%, 9/15/15 | | | 19,788,374 | | | |
| | | | | | | | 92,900,619 | | | |
| Property and Casualty Insurance – 0.1% | | | | | | |
| | 1,601,000 | | | Chubb Corp.
5.2000%, 4/1/13 | | | 1,674,963 | | | |
| Property Trust – 0.7% | | | | | | |
| | 10,701,000 | | | WEA Finance LLC / WCI Finance LLC
5.4000%, 10/1/12 (144A) | | | 10,963,966 | | | |
| | 8,762,000 | | | WT Finance Aust Pty Ltd.
5.1250%, 11/15/14 (144A) | | | 9,180,053 | | | |
| | | | | | | | 20,144,019 | | | |
| Publishing – Books – 0.4% | | | | | | |
| | 11,407,000 | | | Scholastic Corp.
5.0000%, 4/15/13 | | | 11,435,517 | | | |
| Publishing – Newspapers – 0.4% | | | | | | |
| | 12,485,000 | | | Gannett Co., Inc.
6.3750%, 9/1/15 | | | 12,672,275 | | | |
| Real Estate Management/Services – 0.5% | | | | | | |
| | 8,918,000 | | | CB Richard Ellis Services, Inc.
11.6250%, 6/15/17 | | | 10,277,995 | | | |
| | 4,702,000 | | | ProLogis L.P.
7.6250%, 8/15/14 | | | 5,149,894 | | | |
| | | | | | | | 15,427,889 | | | |
| Real Estate Operating/Development – 0.3% | | | | | | |
| | 9,619,000 | | | Brookfield Asset Management, Inc.
7.1250%, 6/15/12 | | | 9,850,337 | | | |
| Reinsurance – 1.4% | | | | | | |
| | 4,459,000 | | | Berkshire Hathaway Finance Corp
4.0000%, 4/15/12 | | | 4,503,715 | | | |
| | 2,943,000 | | | Berkshire Hathaway Finance Corp.
4.6000%, 5/15/13 | | | 3,095,571 | | | |
| | 1,048,000 | | | Berkshire Hathaway Finance Corp.
5.0000%, 8/15/13 | | | 1,115,964 | | | |
| | 30,396,000 | | | Berkshire Hathaway, Inc.
2.1250%, 2/11/13 | | | 30,911,060 | | | |
| | | | | | | | 39,626,310 | | | |
| REIT – Health Care – 2.9% | | | | | | |
| | 23,840,000 | | | HCP, Inc.
6.4500%, 6/25/12 | | | 24,279,371 | | | |
| | 12,770,000 | | | HCP, Inc.
5.6250%, 2/28/13 | | | 13,016,972 | | | |
| | 14,152,000 | | | HCP, Inc.
5.6500%, 12/15/13 | | | 14,883,135 | | | |
| | 4,297,000 | | | HCP, Inc.
2.7000%, 2/1/14 | | | 4,290,752 | | | |
| | 5,110,000 | | | Healthcare Realty Trust, Inc.
5.1250%, 4/1/14 | | | 5,241,485 | | | |
| | 16,496,000 | | | Senior Housing Properties Trust
8.6250%, 1/15/12 | | | 16,525,017 | | | |
| | 5,999,000 | | | Ventas Realty L.P. / Ventas Capital Corp.
3.1250%, 11/30/15 | | | 5,866,380 | | | |
| | 1,528,000 | | | Ventas Realty L.P. / Ventas Capital Corp.
6.5000%, 6/1/16 | | | 1,575,310 | | | |
| | | | | | | | 85,678,422 | | | |
| REIT – Hotels – 1.4% | | | | | | |
| | 18,210,000 | | | Host Hotels & Resorts L.P.
6.8750%, 11/1/14 | | | 18,574,200 | | | |
| | 20,446,000 | | | Host Hotels & Resorts L.P.
6.3750%, 3/15/15 | | | 20,803,805 | | | |
| | | | | | | | 39,378,005 | | | |
| REIT – Office Property – 0.5% | | | | | | |
| | 14,456,000 | | | Reckson Operating Partnership L.P.
6.0000%, 3/31/16 | | | 14,998,707 | | | |
| REIT – Regional Malls – 2.1% | | | | | | |
| | 29,636,000 | | | Rouse Co. L.P.
7.2000%, 9/15/12 | | | 30,117,585 | | | |
| | 26,352,000 | | | Rouse Co. L.P.
6.7500%, 5/1/13 (144A) | | | 26,582,580 | | | |
| | 3,545,000 | | | Simon Property Group L.P.
4.9000%, 1/30/14 | | | 3,778,644 | | | |
| | | | | | | | 60,478,809 | | | |
| REIT – Shopping Centers – 0.3% | | | | | | |
| | 4,459,000 | | | Developers Diversified Realty Corp.
5.3750%, 10/15/12 | | | 4,500,589 | | | |
| | 4,459,000 | | | Equity One, Inc.
6.2500%, 12/15/14 | | | 4,689,339 | | | |
| | | | | | | | 9,189,928 | | | |
| Retail – Discount – 0% | | | | | | |
| | 932,000 | | | Wal-Mart Stores, Inc.
3.2000%, 5/15/14 | | | 984,281 | | | |
| Retail – Drug Store – 0.1% | | | | | | |
| | 1,516,000 | | | Walgreen Co.
4.8750%, 8/1/13 | | | 1,617,410 | | | |
See Notes to Schedules of Investments and Financial Statements.
Janus Fixed Income & Money Market Funds | 61
Janus Short-Term Bond Fund
Schedule of Investments (unaudited)
As of December 31, 2011
| | | | | | | | | | | |
| Shares or Principal Amount | | Value | | | |
| |
| Retail – Regional Department Stores – 0.5% | | | | | | |
| $ | 8,918,000 | | | Macy’s Retail Holdings, Inc.
5.3500%, 3/15/12 | | $ | 8,979,151 | | | |
| | 4,062,000 | | | Macy’s Retail Holdings, Inc.
5.8750%, 1/15/13 | | | 4,182,028 | | | |
| | | | | | | | 13,161,179 | | | |
| Retail – Restaurants – 0.6% | | | | | | |
| | 10,995,000 | | | Brinker International
5.7500%, 6/1/14 | | | 11,597,163 | | | |
| | 4,485,000 | | | Darden Restaurants, Inc.
5.6250%, 10/15/12 | | | 4,636,808 | | | |
| | | | | | | | 16,233,971 | | | |
| Semiconductor Components/Integrated Circuits – 1.0% | | | | | | |
| | 10,880,000 | | | Analog Devices, Inc.
5.0000%, 7/1/14 | | | 11,874,487 | | | |
| | 15,976,000 | | | Maxim Integrated Products, Inc.
3.4500%, 6/14/13 | | | 16,409,908 | | | |
| | | | | | | | 28,284,395 | | | |
| Steel – Producers – 0.1% | | | | | | |
| | 2,760,000 | | | Steel Dynamics, Inc.
7.7500%, 4/15/16 | | | 2,877,300 | | | |
| Super-Regional Banks – 0.8% | | | | | | |
| | 3,300,000 | | | PNC Funding Corp.
5.2500%, 11/15/15 | | | 3,589,229 | | | |
| | 10,125,000 | | | SunTrust Banks, Inc.
3.5000%, 1/20/17 | | | 10,177,204 | | | |
| | 9,700,000 | | | US Bancorp
2.2000%, 11/15/16 | | | 9,793,198 | | | |
| | | | | | | | 23,559,631 | | | |
| Telephone – Integrated – 0.5% | | | | | | |
| | 1,338,000 | | | AT&T, Inc.
5.8750%, 8/15/12 | | | 1,381,258 | | | |
| | 981,000 | | | AT&T, Inc.
4.9500%, 1/15/13 | | | 1,022,417 | | | |
| | 13,358,000 | | | Qwest Communications International, Inc.
7.5000%, 2/15/14 | | | 13,408,426 | | | |
| | | | | | | | 15,812,101 | | | |
| Transportation – Railroad – 0.2% | | | | | | |
| | 2,185,000 | | | Kansas City Southern Railway
8.0000%, 6/1/15 | | | 2,318,831 | | | |
| | 2,497,000 | | | Union Pacific Corp.
5.4500%, 1/31/13 | | | 2,619,301 | | | |
| | | | | | | | 4,938,132 | | | |
| Transportation – Services – 0.8% | | | | | | |
| | 20,770,000 | | | Asciano Finance, Ltd.
3.1250%, 9/23/15 (144A) | | | 20,085,483 | | | |
| | 892,000 | | | Fedex Corp.
7.3750%, 1/15/14 | | | 996,587 | | | |
| | 2,241,000 | | | United Parcel Service, Inc.
3.8750%, 4/1/14 | | | 2,391,093 | | | |
| | | | | | | | 23,473,163 | | | |
| |
| |
| Total Corporate Bonds (cost $2,177,007,144) | | | 2,184,970,945 | | | |
| |
| |
| U.S. Treasury Notes/Bonds – 15.3% | | | | | | |
| | | | | U.S. Treasury Notes/Bonds: | | | | | | |
| | 31,754,000 | | | 0.6250%, 6/30/12 | | | 31,842,054 | | | |
| | 23,905,000 | | | 0.6250%, 12/31/12 | | | 24,017,067 | | | |
| �� | 92,090,000 | | | 0.6250%, 2/28/13 | | | 92,568,408 | | | |
| | 66,113,000 | | | 1.7500%, 4/15/13 | | | 67,424,946 | | | |
| | 23,059,000 | | | 0.6250%, 4/30/13 | | | 23,193,203 | | | |
| | 4,400,000 | | | 1.1250%, 6/15/13 | | | 4,457,922 | | | |
| | 20,824,000 | | | 0.1250%, 9/30/13 | | | 20,782,519 | | | |
| | 13,669,000 | | | 1.2500%, 2/15/14 | | | 13,949,857 | | | |
| | 14,967,000 | | | 1.2500%, 3/15/14 | | | 15,283,881 | | | |
| | 1,765,000 | | | 0.5000%, 8/15/14 | | | 1,772,997 | | | |
| | 8,869,000 | | | 0.2500%, 9/15/14 | | | 8,846,827 | | | |
| | 7,012,000 | | | 1.0000%, 9/30/16 | | | 7,084,308 | | | |
| | 102,137,000 | | | 1.0000%, 10/31/16 | | | 103,126,503 | | | |
| | 29,059,000 | | | 0.8750%, 11/30/16 | | | 29,147,543 | | | |
| |
| |
| Total U.S. Treasury Notes/Bonds (cost $440,425,442) | | | 443,498,035 | | | |
| |
| |
| Short-Term Taxable Variable Rate Demand Note – 0% | | | | | | |
| | | | | | | | | | | |
| | | | | | | | | | | |
| | 1,060,000 | | | California Infrastructure & Economic Development Bank
0.5900%, 4/1/24‡ (cost $1,060,000) | | | 1,060,000 | | | |
| |
| |
| Money Market – 4.2% | | | | | | |
| | 121,421,154 | | | Janus Cash Liquidity Fund LLC, 0%
(cost $121,421,154) | | | 121,421,154 | | | |
| |
| |
| Total Investments (total cost $2,868,317,081) – 99.2% | | | 2,877,616,046 | | | |
| |
| |
| Cash, Receivables and Other Assets, net of Liabilities – 0.8% | | | 24,147,265 | | | |
| |
| |
| Net Assets – 100% | | $ | 2,901,763,311 | | | |
| |
| |
Summary of Investments by Country – (Long Positions)
| | | | | | | | | |
| | | | | | % of Investment
| |
| Country | | Value | | | Securities | |
| |
| |
| Australia | | $ | 59,048,849 | | | | 2.1% | |
| Belgium | | | 362,514 | | | | 0.0% | |
| Canada | | | 76,414,525 | | | | 2.7% | |
| Cayman Islands | | | 10,038,712 | | | | 0.4% | |
| Chile | | | 8,416,415 | | | | 0.3% | |
| Luxembourg | | | 28,891,684 | | | | 1.0% | |
| Netherlands | | | 37,726,100 | | | | 1.3% | |
| New Zealand | | | 4,100,179 | | | | 0.1% | |
| Singapore | | | 5,723,917 | | | | 0.2% | |
| South Korea | | | 8,617,012 | | | | 0.3% | |
| Sweden | | | 27,500,716 | | | | 1.0% | |
| Switzerland | | | 47,326,588 | | | | 1.6% | |
| United Kingdom | | | 96,315,345 | | | | 3.3% | |
United States†† | | | 2,467,133,490 | | | | 85.7% | |
| |
| |
| Total | | $ | 2,877,616,046 | | | | 100.0% | |
| | | |
| †† | | Includes Cash Equivalents (81.5% excluding Cash Equivalents). |
See Notes to Schedules of Investments and Financial Statements.
62 | DECEMBER 31, 2011
Janus Money Market Funds (unaudited)
| | | |
| | | Co-Portfolio Manager
|
Janus Government Money Market Fund
| | Eric Thorderson
|
Average Annual Total Return
| | Co-Portfolio Manager
|
| For the Periods Ended December 31, 2011 | | David Spilsted |
| |
| |
Class D Shares(1) | | |
| Fiscal Year-to-Date | | 0.00% |
| 1 Year | | 0.00% |
| 5 Year | | 1.29% |
| 10 Year | | 1.64% |
| Since Inception (February 14, 1995) | | 2.99% |
| Class T Shares | | |
| Fiscal Year-to-Date | | 0.00% |
| 1 Year | | 0.00% |
| 5 Year | | 1.29% |
| 10 Year | | 1.64% |
| Since Inception (February 14, 1995) | | 2.99% |
| |
| |
| Seven-Day Current Yield | | |
Class D Shares(1) | | |
| With Reimbursement | | 0.0014% |
| Without Reimbursement | | –0.4955% |
| Class T Shares | | |
| With Reimbursement | | 0.0014% |
| Without Reimbursement | | –0.5153% |
| |
| |
| Expense Ratio | | |
Per the October 28, 2011 prospectus | | |
| |
| |
Class D Shares(1) | | |
| Total Annual Fund Operating Expenses | | 0.71% |
| Class T Shares | | |
| Total Annual Fund Operating Expenses | | 0.74% |
| |
| |
| | | |
| | | Co-Portfolio Manager
|
Janus Money Market Fund
| | Eric Thorderson
|
Average Annual Total Return
| | Co-Portfolio Manager
|
| For the Periods Ended December 31, 2011 | | David Spilsted |
| |
| |
Class D Shares(1) | | |
| Fiscal Year-to-Date | | 0.00% |
| 1 Year | | 0.01% |
| 5 Year | | 1.39% |
| 10 Year | | 1.73% |
| Since Inception (February 14, 1995) | | 3.08% |
| Class T Shares | | |
| Fiscal Year-to-Date | | 0.00% |
| 1 Year | | 0.01% |
| 5 Year | | 1.39% |
| 10 Year | | 1.73% |
| Since Inception (February 14, 1995) | | 3.08% |
| |
| |
| Seven-Day Current Yield | | |
Class D Shares(1) | | |
| With Reimbursement | | 0.0057% |
| Without Reimbursement | | –0.4423% |
| Class T Shares | | |
| With Reimbursement | | 0.0057% |
| Without Reimbursement | | –0.4622% |
| |
| |
| Expense Ratio | | |
Per the October 28, 2011 prospectus | | |
| |
| |
Class D Shares(1) | | |
| Total Annual Fund Operating Expenses | | 0.67% |
| Class T Shares | | |
| Total Annual Fund Operating Expenses | | 0.69% |
| |
| |
Data presented represents past performance, which is no guarantee of future results. Current performance may be higher or lower than the performance shown. Call 877.33JANUS(52687) (or 800.525.3713 if you hold shares directly with Janus Capital) or visit janus.com/advisor/mutual-funds (or janus.com/allfunds if you hold shares directly with Janus Capital) for performance current to the most recent month-end.
An investment in a money market fund is not insured or guaranteed by the Federal Deposit Insurance Corporation or any other government agency. Although the money market fund seeks to preserve the value of your investment at $1.00 per share, it is possible to lose money by investing in the Fund.
Janus Capital has agreed to waive one-half of its investment advisory fee. Such waiver is voluntary and could change or be terminated at any time at the discretion of Janus Capital. Total returns shown include fee waivers, if any, and without such waivers, each Fund’s yields and total returns would have been lower. Janus Capital may also voluntarily waive additional fees to the extent necessary to assist each Fund in attempting to maintain a yield of at least 0.00%. These waivers and reimbursements are voluntary and could change or be terminated at any time at the discretion of Janus Capital.
Included in the Total Annual Fund Operating Expenses is an administration fee of 0.46% for Class D Shares and 0.48% for Class T Shares of the average daily net assets of each Fund to compensate Janus Capital for providing certain administrative services including, but not limited to, recordkeeping and registration functions.
The expense information shown was determined based on net assets as of the fiscal period ended June 30, 2011. (All expenses are shown without the effect of expense offset arrangements. Pursuant to such arrangements, credits realized as a result of uninvested cash balances are used to reduce custodian and transfer agent expenses.)
Class D Shares of each Fund commenced operations on February 16, 2010, as a result of the restructuring of Class J Shares, the predecessor share class. The performance shown for Class D Shares for periods prior to February 16, 2010, reflects the performance of each Fund’s former Class J Shares. If Class D Shares of each Fund had been available during periods prior to February 16, 2010, the performance shown may have been different. The performance shown for periods following each Fund’s commencement of Class D Shares reflects the fees and expenses of Class D Shares, net of any fee and expense limitations or waivers.
Returns include reinvestment of dividends from net investment income and distributions from capital gains.
The yield more closely reflects the current earnings of each Fund than the total return.
See Notes to Schedules of Investments and Financial Statements.
See “Explanations of Charts, Tables and Financial Statements.”
| | | |
| (1) | | Closed to new investors. |
Janus Fixed Income & Money Market Funds | 63
Janus Government Money Market Fund (unaudited)
The examples below show you the ongoing costs (in dollars) of investing in your Fund and allow you to compare these costs with those of other mutual funds. Please refer to the section Useful Information About Your Fund Report for a detailed explanation of the information presented in these charts.
| | | | | | | | | | | | | | | |
| | | Beginning
| | Ending
| | Expenses Paid
| | |
| | | Account Value
| | Account Value
| | During Period
| | |
| Expense Example – Class D Shares | | (7/1/11) | | (12/31/11) | | (7/1/11 - 12/31/11)† | | |
| |
| |
| Actual | | $ | 1,000.00 | | | $ | 1,000.00 | | | $ | 0.85 | | | |
| |
| |
Hypothetical
(5% return before expenses) | | $ | 1,000.00 | | | $ | 1,024.28 | | | $ | 0.87 | | | |
| |
| |
| | | | | | | | | | | | | | | |
| | | | | | | | | | | | | | | |
| | | Beginning
| | Ending
| | Expenses Paid
| | |
| | | Account Value
| | Account Value
| | During Period
| | |
| Expense Example – Class T Shares | | (7/1/11) | | (12/31/11) | | (7/1/11 - 12/31/11)† | | |
| |
| |
| Actual | | $ | 1,000.00 | | | $ | 1,000.00 | | | $ | 0.85 | | | |
| |
| |
Hypothetical
(5% return before expenses) | | $ | 1,000.00 | | | $ | 1,024.28 | | | $ | 0.87 | | | |
| |
| |
| | | |
| † | | Expenses are equal to the annualized expense ratio of 0.17% for Class D and 0.17% for Class T Shares, Shares multiplied by the average account value over the period, multiplied by 184/366 (to reflect the one-half year period). Expenses include effect of voluntary waivers by Janus Capital. |
Janus Money Market Fund (unaudited)
The examples below show you the ongoing costs (in dollars) of investing in your Fund and allow you to compare these costs with those of other mutual funds. Please refer to the section Useful Information About Your Fund Report for a detailed explanation of the information presented in these charts.
| | | | | | | | | | | | | | | |
| | | Beginning
| | Ending
| | Expenses Paid
| | |
| | | Account Value
| | Account Value
| | During Period
| | |
| Expense Example – Class D Shares | | (7/1/11) | | (12/31/11) | | (7/1/11 - 12/31/11)† | | |
| |
| |
| Actual | | $ | 1,000.00 | | | $ | 1,000.00 | | | $ | 0.65 | | | |
| |
| |
Hypothetical
(5% return before expenses) | | $ | 1,000.00 | | | $ | 1,024.48 | | | $ | 0.66 | | | |
| |
| |
| | | | | | | | | | | | | | | |
| | | | | | | | | | | | | | | |
| | | Beginning
| | Ending
| | Expenses Paid
| | |
| | | Account Value
| | Account Value
| | During Period
| | |
| Expense Example – Class T Shares | | (7/1/11) | | (12/31/11) | | (7/1/11 - 12/31/11)† | | |
| |
| |
| Actual | | $ | 1,000.00 | | | $ | 1,000.00 | | | $ | 0.65 | | | |
| |
| |
Hypothetical
(5% return before expenses) | | $ | 1,000.00 | | | $ | 1,024.48 | | | $ | 0.66 | | | |
| |
| |
| | | |
| † | | Expenses are equal to the annualized expense ratio of 0.13% for Class D Shares and 0.13% for Class T Shares multiplied by the average account value over the period, multiplied by 184/366 (to reflect the one-half year period). Expenses include effect of voluntary waivers by Janus Capital. |
64 | DECEMBER 31, 2011
Janus Government Money Market Fund
Schedule of Investments (unaudited)
As of December 31, 2011
| | | | | | | | | | | |
| Principal Amount | | Value | | | |
| |
| Repurchase Agreements – 17.7% | | | | | | |
| $ | 30,700,000 | | | Credit Suisse Securities (USA) LLC, 0.0400%
dated 12/30/11, maturing 1/3/12
to be repurchased at $30,700,136 collateralized by $465,029,423
in U.S. Government Agencies 0.1473% – 5.6371%, 7/25/21 – 6/20/40,
with a value of $31,316,747 | | $ | 30,700,000 | | | |
| | 4,700,000 | | | RBC Capital Markets Corp., 0.0200%
dated 12/30/11, maturing 1/3/12
to be repurchased at $4,700,010 collateralized by $4,607,686
in U.S. Government Agencies 4.0000% 9/1/31 – 11/1/41,
with a value of $4,794,000 | | | 4,700,000 | | | |
| |
| |
| Total Repurchase Agreements (amortized cost $35,400,000) | | | 35,400,000 | | | |
| |
| |
| U.S. Government Agency Notes – 39.2% | | | | | | |
| | | | | Army & Air Force Exchange Services: | | | | | | |
| | 5,000,000 | | | 0.3500%, 1/4/12 | | | 5,000,000 | | | |
| | 5,000,000 | | | 0.3500%, 1/13/12ß | | | 5,000,000 | | | |
| | | | | Fannie Mae: | | | | | | |
| | 1,999,902 | | | 0.1100%, 1/17/12 | | | 1,999,902 | | | |
| | 2,999,806 | | | 0.1100%, 2/1/12 | | | 2,999,806 | | | |
| | 2,249,471 | | | 0.1800%, 2/17/12 | | | 2,249,471 | | | |
| | 1,999,533 | | | 0.1400%, 3/1/12 | | | 1,999,533 | | | |
| | 1,499,740 | | | 0.0800%, 3/19/12 | | | 1,499,740 | | | |
| | 2,999,137 | | | 0.0900%, 4/25/12 | | | 2,999,137 | | | |
| | 1,999,071 | | | 0.1100%, 6/1/12 | | | 1,999,071 | | | |
| | | | | Federal Home Loan Bank System: | | | | | | |
| | 2,998,883 | | | 0.2000%, 3/8/12 | | | 2,998,883 | | | |
| | 1,749,738 | | | 0.5000%, 4/18/12 | | | 1,749,738 | | | |
| | 3,498,495 | | | 0.0900%, 6/21/12 | | | 3,498,495 | | | |
| | 2,998,167 | | | 0.1000%, 8/8/12 | | | 2,998,167 | | | |
| | 6,518,652 | | | 0.2500%, 1/15/42 | | | 6,518,652 | | | |
| | | | | Freddie Mac: | | | | | | |
| | 2,999,798 | | | 0.1100%, 1/23/12 | | | 2,999,798 | | | |
| | 2,999,770 | | | 0.1200%, 1/24/12 | | | 2,999,770 | | | |
| | 1,999,887 | | | 0.0900%, 1/30/12 | | | 1,999,887 | | | |
| | 2,999,588 | | | 0.1300%, 2/8/12 | | | 2,999,588 | | | |
| | 2,599,402 | | | 0.0900%, 4/2/12 | | | 2,599,402 | | | |
| | 2,999,380 | | | 0.0800%, 4/3/12 | | | 2,999,380 | | | |
| | 2,999,464 | | | 0.0650%, 4/9/12 | | | 2,999,464 | | | |
| | 999,794 | | | 0.0700%, 4/16/12 | | | 999,794 | | | |
| | 2,499,500 | | | 0.0700%, 4/30/12 | | | 2,499,500 | | | |
| | 1,999,172 | | | 0.1000%, 5/29/12 | | | 1,999,172 | | | |
| | 1,999,397 | | | 0.0700%, 6/4/12 | | | 1,999,397 | | | |
| | 4,497,855 | | | 0.1100%, 6/5/12 | | | 4,497,855 | | | |
| | 1,499,189 | | | 0.1100%, 6/26/12 | | | 1,499,189 | | | |
| | 1,999,031 | | | 0.1000%, 8/6/12 | | | 1,999,031 | | | |
| |
| |
| Total U.S. Government Agency Notes (amortized cost $78,601,822) | | | 78,601,822 | | | |
| |
| |
| Variable Rate Demand Agency Notes – 43.2% | | | | | | |
| | 1,180,000 | | | A.E. Realty LLC, Series 2003
0.2500%, 10/1/23 | | | 1,180,000 | | | |
| | 1,500,000 | | | Clearwater Solutions LLC
0.3600%, 9/1/21 | | | 1,500,000 | | | |
| | 9,000,000 | | | Cypress Bend Real Estate Development LLC
0.2500%, 4/1/33 | | | 9,000,000 | | | |
| | 6,160,000 | | | Florida Housing Financial Corp. Multifamily Revenue, (Stone Harbor Apartments), Series K
0.1000%, 7/15/36 | | | 6,160,000 | | | |
| | 3,000,000 | | | Greer Family LLC
0.2500%, 8/1/31 | | | 3,000,000 | | | |
| | 3,135,000 | | | Indian Hills Country Club
0.2500%, 3/1/30 | | | 3,135,000 | | | |
| | 2,500,000 | | | Irrevocable Trust Agreement John A Thomas & Elizabeth F Thomas
0.2500%, 12/1/20 | | | 2,500,000 | | | |
| | 3,745,000 | | | Johnson Capital Management LLC.
0.2700%, 6/1/47 | | | 3,745,000 | | | |
| | 160,000 | | | Lakeshore Professional Properties LLC.
0.3200%, 7/1/45 | | | 160,000 | | | |
| | 700,000 | | | Maryland State Community Development Administration Multifamily Development (Crusader-D)
0.0800%, 2/1/41 | | | 700,000 | | | |
| | 27,525,000 | | | Mesivta Yeshiva Rabbi Chaim Berlin
0.2960%, 11/1/35 | | | 27,525,000 | | | |
| | 4,560,000 | | | Mississippi Business Finance, Corp.
0.3400%, 3/1/29 | | | 4,560,000 | | | |
| | 4,880,000 | | | Mississippi Business Finance, Corp.
0.3400%, 3/1/29 | | | 4,880,000 | | | |
| | 5,500,000 | | | Mississippi Business Finance, Corp.
0.3400%, 9/1/41 | | | 5,500,000 | | | |
| | 2,065,000 | | | New York City Housing Development Corp. Multifamily Revenue (Aldus St. Apartments), Series A
0.1000%, 6/15/37 | | | 2,065,000 | | | |
| | 500,000 | | | Sacramento California Redevelopment Agency
0.2300%, 1/15/36 | | | 500,000 | | | |
| | 1,715,000 | | | Shepherd Capital LLC.
0.3200%, 10/1/53 | | | 1,715,000 | | | |
| | 4,500,000 | | | Thomas H Turner Family Irrevocably Trust
0.2500%, 6/1/20 | | | 4,500,000 | | | |
| | 4,190,000 | | | Tyler Enterprises LLC.
0.2500%, 10/1/22 | | | 4,190,000 | | | |
| |
| |
| Total Variable Rate Demand Agency Notes (amortized cost $86,515,000) | | | 86,515,000 | | | |
| |
| |
Total Investments
(total amortized cost $200,516,822 ) – 100.1% | | | 200,516,822 | | | |
| |
| |
| Liabilities, net of Cash, Receivables and Other Assets– (0.1)% | | | (119,957) | | | |
| |
| |
| Net Assets – 100% | | $ | 200,396,865 | | | |
| |
| |
See Notes to Schedules of Investments and Financial Statements.
Janus Fixed Income & Money Market Funds | 65
Janus Money Market Fund
Schedule of Investments (unaudited)
As of December 31, 2011
| | | | | | | | | | | |
| Principal Amount | | Value | | | |
| |
| Certificates Of Deposit – 14.9% | | | | | | |
| $ | 20,000,000 | | | Bank of Montreal
0.0500%, 1/5/12 | | $ | 20,000,000 | | | |
| | 25,000,000 | | | Bank of Montreal
0.0800%, 1/13/12 | | | 25,000,000 | | | |
| | 20,000,000 | | | Bank of Montreal
0.1700%, 1/30/12 | | | 20,000,000 | | | |
| | 22,000,000 | | | National Bank of Canada
0.1600%, 1/9/12 | | | 22,000,000 | | | |
| | 20,000,000 | | | National Bank of Canada
0.1000%, 1/13/12 | | | 20,000,000 | | | |
| | 21,500,000 | | | Royal Bank of Canada
0.0500%, 1/9/12 | | | 21,500,000 | | | |
| | 22,000,452 | | | Svenska Handelsbanken AB
0.3850%, 1/31/12 | | | 22,000,452 | | | |
| | 20,000,193 | | | Svenska Handelsbanken AB
0.4850%, 3/7/12 | | | 20,000,193 | | | |
| | 25,000,000 | | | Toronto-Dominion Bank
0.1200%, 1/30/12 | | | 25,000,000 | | | |
| |
| |
| Total Certificates Of Deposit (amortized cost $195,500,645) | | | 195,500,645 | | | |
| |
| |
| Commercial Paper – 9.8% | | | | | | |
| | 13,999,767 | | | Nieuw Amsterdam Receivables Corp.
0.3000%, 1/3/12 (Section 4(2)) | | | 13,999,767 | | | |
| | 24,999,223 | | | Nieuw Amsterdam Receivables Corp.
0.2800%, 1/5/12 (Section 4(2)) | | | 24,999,223 | | | |
| | 24,999,099 | | | Nieuw Amsterdam Receivables Corp.
0.2600%, 1/6/12 (Section 4(2)) | | | 24,999,099 | | | |
| | 19,999,534 | | | Standard Chartered Bank
0.2100%, 1/5/12 (Section 4(2)) | | | 19,999,534 | | | |
| | 19,997,401 | | | Standard Chartered Bank
0.1800%, 1/27/12 | | | 19,997,401 | | | |
| | 24,991,758 | | | Standard Chartered Bank
0.3600%, 2/3/12 (Section 4(2)) | | | 24,991,758 | | | |
| |
| |
| Total Commercial Paper (amortized cost $128,986,782) | | | 128,986,782 | | | |
| |
| |
| Repurchase Agreements – 30.2% | | | | | | |
| | 100,000,000 | | | Credit Agricole, New York Branch, 0.0100%
dated 12/30/11, maturing 1/3/12
to be repurchased at $100,000,111
collateralized by $102,861,754
in U.S. Government Agencies, 3.5000%-5.5000%.
11/1/25 – 10/1/41,
and $12,564,294
in a U.S Treasury, 4.0000%, 8/15/18 with respective values of $87,041,950 and $14,958,060 | | | 100,000,000 | | | |
| | 100,000,000 | | | Goldman Sachs & Co., 0.1000%
dated 12/30/11, maturing 1/3/12
to be repurchased at $100,001,111
collateralized by $125,581,663
in U.S. Government Agencies 5.0000%- 6.0000%
5/1/38 – 12/1/39,
with a value of $102,000,000 | | | 100,000,000 | | | |
| | 50,000,000 | | | HSBC Securities (USA), Inc., 0.4000%
dated 12/30/11, maturing 1/3/12
to be repurchased at $50,000,222
collateralized by $50,809,000
in U.S. Treasuries 0.2500% – 0.7500%
10/31/13 – 12/15/13,
with a value of $51,000,620 | | | 50,000,000 | | | |
| | 100,000,000 | | | ING Financial Markets LLC, 0.0100%
dated 12/30/11, maturing 1/3/12
to be repurchased at $100,000,111
collateralized by $945,638,183
in U.S. Government Agencies 0.0000% – 49.8276%
4/20/16 – 2/25/47,
with a value of $102,000,251 | | | 100,000,000 | | | |
| | 46,800,000 | | | RBC Capital Markets Corp., 0.0200%
dated 12/30/11, maturing 1/3/12
to be repurchased at $46,800,104
collateralized by $45,880,784
in U.S. Government Agencies 4.0000%
9/1/31 – 11/1/41,
with a value of $47,736,000 | | | 46,800,000 | | | |
| |
| |
| Total Repurchase Agreements (amortized cost $396,800,000) | | | 396,800,000 | | | |
| |
| |
| U.S. Government Agency Notes – 29.1% | | | | | | |
| | | | | Army & Air Force Exchange Services: | | | | | | |
| | 5,000,000 | | | 0.3500%, 1/4/12 | | | 5,000,000 | | | |
| | 20,000,000 | | | 0.3500%, 1/5/12 | | | 20,000,000 | | | |
| | 10,000,000 | | | 0.3500%, 1/6/12 | | | 10,000,000 | | | |
| | 9,000,000 | | | 0.3300%, 1/11/12ß | | | 9,000,000 | | | |
| | 21,000,000 | | | 0.3500%, 1/13/12ß | | | 21,000,000 | | | |
| | | | | Fannie Mae: | | | | | | |
| | 9,999,925 | | | 0.9000%, 1/4/12 | | | 9,999,925 | | | |
| | 9,999,511 | | | 0.1100%, 1/17/12 | | | 9,999,511 | | | |
| | 9,999,528 | | | 0.1000%, 1/18/12 | | | 9,999,528 | | | |
| | 9,999,053 | | | 0.1100%, 2/1/12 | | | 9,999,053 | | | |
| | 9,997,666 | | | 0.1400%, 3/1/12 | | | 9,997,666 | | | |
| | 4,798,957 | | | 0.0850%, 4/2/12 | | | 4,798,957 | | | |
| | 9,997,125 | | | 0.0900%, 4/25/12 | | | 9,997,125 | | | |
| | 9,997,454 | | | 0.0650%, 5/21/12 | | | 9,997,454 | | | |
| | 9,997,039 | | | 0.0650%, 6/13/12 | | | 9,997,039 | | | |
| | 9,996,913 | | | 0.0650%, 6/20/12 | | | 9,996,913 | | | |
| | 11,993,207 | | | 0.0950%, 9/4/12 | | | 11,993,207 | | | |
| | | | | Federal Home Loan Bank System: | | | | | | |
| | 9,999,667 | | | 0.1000%, 1/13/12 | | | 9,999,667 | | | |
| | 9,997,662 | | | 0.0850%, 4/9/12 | | | 9,997,662 | | | |
| | 10,297,082 | | | 0.0750%, 5/16/12 | | | 10,297,082 | | | |
| | 14,995,400 | | | 0.0800%, 5/18/12 | | | 14,995,400 | | | |
| | 9,997,083 | | | 0.0700%, 5/30/12 | | | 9,997,083 | | | |
| | 7,995,111 | | | 0.1000%, 8/8/12 | | | 7,995,111 | | | |
| | 2,998,328 | | | 0.0850%, 8/24/12 | | | 2,998,328 | | | |
| | 4,997,178 | | | 0.0850%, 8/27/12 | | | 4,997,178 | | | |
| | | | | Freddie Mac: | | | | | | |
| | 9,999,950 | | | 0.0900%, 1/3/12 | | | 9,999,950 | | | |
| | 9,999,778 | | | 0.1000%, 1/9/12 | | | 9,999,778 | | | |
| | 9,999,328 | | | 0.1100%, 1/23/12 | | | 9,999,328 | | | |
| | 9,997,933 | | | 0.0800%, 4/3/12 | | | 9,997,933 | | | |
| | 9,998,212 | | | 0.0650%, 4/9/12 | | | 9,998,212 | | | |
| | 9,997,667 | | | 0.0700%, 4/30/12 | | | 9,997,667 | | | |
| | 9,998,236 | | | 0.0500%, 5/7/12 | | | 9,998,236 | | | |
| | 7,497,361 | | | 0.1000%, 5/29/12 | | | 7,497,361 | | | |
See Notes to Schedules of Investments and Financial Statements.
66 | DECEMBER 31, 2011
Schedule of Investments (unaudited)
As of December 31, 2011
| | | | | | | | | | | |
| Principal Amount | | Value | | | |
| |
| U.S. Government Agency Notes – (continued) | | | | | | |
| | | | | | | | | | | |
| | | | | Freddie Mac: (continued) | | | | | | |
| $ | 9,996,986 | | | 0.0700%, 6/4/12 | | $ | 9,996,986 | | | |
| | 9,995,233 | | | 0.1100%, 6/5/12 | | | 9,995,233 | | | |
| | 9,996,949 | | | 0.0650%, 6/18/12 | | | 9,996,949 | | | |
| | 10,494,449 | | | 0.1100%, 6/22/12 | | | 10,494,449 | | | |
| | 9,995,858 | | | 0.0700%, 8/1/12 | | | 9,995,858 | | | |
| | 9,993,944 | | | 0.1000%, 8/6/12 | | | 9,993,944 | | | |
| |
| |
| Total U.S. Government Agency Notes (amortized cost $381,015,773) | | | 381,015,773 | | | |
| |
| |
| Variable Rate Demand Agency Notes – 15.8% | | | | | | |
| | 220,000 | | | Arapahoe County, Colorado, Industrial Development Revenue, (Cottrell), Series B
0.4900%, 10/1/19 | | | 220,000 | | | |
| | 5,265,000 | | | Auburn Industrial Development Board
0.2500%, 7/1/26 | | | 5,265,000 | | | |
| | 4,000,000 | | | Breckenridge Terrace LLC
0.2500%, 5/1/39 | | | 4,000,000 | | | |
| | 14,980,000 | | | Breckenridge Terrace LLC
0.2500%, 5/1/39 | | | 14,980,000 | | | |
| | 2,000,000 | | | Brevard County Health Facilities Authority
0.0600%, 9/1/25 | | | 2,000,000 | | | |
| | 800,000 | | | California Infrastructure and Economic Development
0.3200%, 7/1/33 | | | 800,000 | | | |
| | 1,095,000 | | | Capital Markets Access
0.2600%, 7/1/25 | | | 1,095,000 | | | |
| | 5,700,000 | | | Colorado Housing Facilities Revenue, (Tenderfoot Seasonal Housing LLC), Series A
0.3000%, 7/1/35 | | | 5,700,000 | | | |
| | 6,170,000 | | | Congress/Commons LLC
0.3900%, 12/1/50 | | | 6,170,000 | | | |
| | 6,180,000 | | | Danville-Pittsylvania, Virginia Facility Revenue, (Cane Creek Project)
0.2200%, 1/1/26 | | | 6,180,000 | | | |
| | 9,100,000 | | | Eagle County, Colorado Housing Facility Revenue, (BC Housing LLC Project), Series A
0.3000%, 6/1/27 | | | 9,100,000 | | | |
| | 8,000,000 | | | Eagle County, Colorado Housing Facility Revenue, (BC Housing LLC Project), Series A
0.3000%, 5/1/39 | | | 8,000,000 | | | |
| | 11,655,000 | | | Eskaton Properties, Inc.
0.3500%, 12/1/37 | | | 11,655,000 | | | |
| | 4,290,000 | | | FJM Properties-Wilmar
0.3900%, 10/1/24 | | | 4,290,000 | | | |
| | 4,000,000 | | | Florissant Industrial Development Authority
0.0600%, 9/1/28 | | | 4,000,000 | | | |
| | 9,660,000 | | | Franklin County Ohio Health Care Facility Revenue, (Adjusted Friendship Village Dublin), Series A
0.0800%, 11/1/22 | | | 9,660,000 | | | |
| | 6,885,000 | | | Franklin County Ohio Health Care Facility Revenue, (Variable Friendship Village Dublin), Series B
0.0800%, 11/1/34 | | | 6,885,000 | | | |
| | 5,620,000 | | | Hunter’s Ridge, South Point
0.2300%, 6/1/25 | | | 5,620,000 | | | |
| | 4,650,000 | | | J-J Properties LLC
0.2300%, 7/1/35 | | | 4,650,000 | | | |
| | 530,000 | | | Kentucky Economic Development Finance Authority
1.0000%, 11/1/15 | | | 530,000 | | | |
| | 1,375,000 | | | Lone Tree Building Authority
0.5800%, 12/1/17 | | | 1,375,000 | | | |
| | 9,000,000 | | | Louisiana Local Government Environmental Facilities
0.0600%, 7/1/47 | | | 9,000,000 | | | |
| | 10,000,000 | | | Massachusetts Health & Educational Facilities Authority
0.0700%, 10/1/42 | | | 10,000,000 | | | |
| | 6,415,000 | | | Mississippi Business Finance Corp.
0.3900%, 12/1/39 | | | 6,415,000 | | | |
| | 5,845,000 | | | Monongallia Health Systems
0.5000%, 7/1/40 | | | 5,845,000 | | | |
| | 8,690,000 | | | Orange County Florida Health Facilities Authority Revenue (Adventist Long Term Care)
0.0800%, 11/15/36 | | | 8,690,000 | | | |
| | 160,000 | | | Phoenix, Illinois Realty Special Account Multifamily Revenue, (Brightons Mark)
0.3300%, 4/1/20 | | | 160,000 | | | |
| | 10,865,000 | | | RBS Insurance Trust
0.2600%, 11/1/31 | | | 10,865,000 | | | |
| | 3,650,000 | | | Riley Family Eagle Lake/Lexington Heights LP
0.2200%, 9/1/33 | | | 3,650,000 | | | |
| | 4,430,000 | | | Springfield, Tennessee, Health and Educational Facilities Revenue, Series A
0.2700%, 6/1/26 | | | 4,430,000 | | | |
| | 2,600,000 | | | Tift County, Georgia Development Authority, (Heatcraft), Series A
0.2700%, 2/1/18 | | | 2,600,000 | | | |
| | 3,765,000 | | | Timber Ridge County Affordable Housing Corp., Series 2003
0.2300%, 12/1/32 | | | 3,765,000 | | | |
| | 4,595,000 | | | Triple Crown Investments LLC
0.2500%, 8/1/25 | | | 4,595,000 | | | |
| | 1,720,000 | | | Volunteers of America, Alabama
0.2700%, 9/1/23 | | | 1,720,000 | | | |
| | 22,835,000 | | | Washington Higher Education Facilities Authority
0.0800%, 10/1/30 | | | 22,835,000 | | | |
| |
| |
| Total Variable Rate Demand Agency Notes (amortized cost $206,745,000) | | | 206,745,000 | | | |
| |
| |
Total Investments
(total amortized cost $1,309,048,200 ) – 99.8% | | | 1,309,048,200 | | | |
| |
| |
| Cash, Receivables and Other Assets, net of Liabilities – 0.2% | | | 3,146,660 | | | |
| |
| |
| Net Assets – 100% | | $ | 1,312,194,860 | | | |
| |
| |
See Notes to Schedules of Investments and Financial Statements.
Janus Fixed Income & Money Market Funds | 67
Statements of Assets and Liabilities - Fixed Income Funds
| | | | | | | | | | | | | | | | | |
As of December 31, 2011 (unaudited)
| | | | | | | | |
| (all numbers in thousands except net asset value per share) | | Janus Flexible Bond Fund | | Janus Global Bond Fund | | Janus High-Yield Fund | | Janus Short-Term Bond Fund |
|
| |
| Assets: | | | | | | | | | | | | | | | | |
| Investments at cost | | $ | 4,134,765 | | | $ | 34,659 | | | $ | 1,886,797 | | | $ | 2,868,317 | |
| Unaffiliated investments at value | | $ | 4,079,225 | | | $ | 32,751 | | | $ | 1,824,149 | | | $ | 2,756,195 | |
| Affiliated investments at value | | | 172,543 | | | | 1,669 | | | | 73,520 | | | | 121,421 | |
| Cash | | | 377 | | | | – | | | | 973 | | | | 60 | |
| Receivables: | | | | | | | | | | | | | | | | |
| Investments sold | | | 26,179 | | | | 20 | | | | 2,390 | | | | – | |
| Fund shares sold | | | 10,737 | | | | 95 | | | | 3,199 | | | | 4,374 | |
| Dividends | | | 9 | | | | – | | | | 6 | | | | 9 | |
| Interest | | | 37,440 | | | | 326 | | | | 33,765 | | | | 23,736 | |
| Non-interested Trustees’ deferred compensation | | | 127 | | | | 1 | | | | 56 | | | | 85 | |
| Other assets | | | 94 | | | | – | | | | 788 | | | | 1,661 | |
| Forward currency contracts | | | – | | | | 78 | | | | – | | | | – | |
| Total Assets | | | 4,326,731 | | | | 34,940 | | | | 1,938,846 | | | | 2,907,541 | |
| Liabilities: | | | | | | | | | | | | | | | | |
| Payables: | | | | | | | | | | | | | | | | |
| Due to custodian | | | – | | | | 13 | | | | – | | | | – | |
| Investments purchased | | | – | | | | 861 | | | | 9,479 | | | | – | |
| Fund shares repurchased | | | 8,679 | | | | 28 | | | | 4,471 | | | | 4,945 | |
| Dividends | | | 992 | | | | – | | | | 573 | | | | 78 | |
| Advisory fees | | | 1,457 | | | | 5 | | | | 906 | | | | 18 | |
| Fund administration fees | | | 35 | | | | 1 | | | | 16 | | | | 25 | |
| Administrative services fees | | | 303 | | | | 2 | | | | 256 | | | | 418 | |
| Distribution fees and shareholder servicing fees | | | 407 | | | | 2 | | | | 106 | | | | 145 | |
| Administrative, networking and omnibus fees | | | 279 | | | | – | | | | 19 | | | | 22 | |
| Non-interested Trustees’ fees and expenses | | | 41 | | | | – | | | | 15 | | | | 25 | |
| Non-interested Trustees’ deferred compensation fees | | | 127 | | | | 1 | | | | 56 | | | | 85 | |
| Accrued expenses and other payables | | | 201 | | | | 27 | | | | 132 | | | | 17 | |
| Forward currency contracts | | | – | | | | – | | | | – | | | | – | |
| Total Liabilities | | | 12,521 | | | | 940 | | | | 16,029 | | | | 5,778 | |
| Net Assets | | $ | 4,314,210 | | | $ | 34,000 | | | $ | 1,922,817 | | | $ | 2,901,763 | |
See footnotes at the end of the Statements.
See Notes to Financial Statements.
68 | DECEMBER 31, 2011
This page intentionally left blank. The content of this page is part of a ‘Double Page Spread’ table and appears on the previous page.
69
Statements of Assets and Liabilities - Fixed Income Funds (continued)
| | | | | | | | | | | | | | | | | |
As of December 31, 2011 (unaudited)
| | | | | | | | |
| (all numbers in thousands except net asset value per share) | | Janus Flexible Bond Fund | | Janus Global Bond Fund | | Janus High-Yield Fund | | Janus Short-Term Bond Fund |
|
| |
| Net Assets Consist of: | | | | | | | | | | | | | | | | |
| Capital (par value and paid-in surplus)* | | $ | 4,207,507 | | | $ | 33,907 | | | $ | 1,938,176 | | | $ | 2,892,067 | |
| Undistributed net investment income/(loss)* | | | (2,580) | | | | 28 | | | | (313) | | | | 85 | |
| Undistributed net realized gain/(loss) from investment and foreign currency transactions* | | | (7,712) | | | | 226 | | | | (25,914) | | | | 318 | |
| Unrealized net appreciation/(depreciation) of investments, foreign currency translations and non-interested Trustees’ deferred compensation | | | 116,995 | | | | (161) | | | | 10,868 | | | | 9,293 | |
| Total Net Assets | | $ | 4,314,210 | | | $ | 34,000 | | | $ | 1,922,817 | | | $ | 2,901,763 | |
| Net Assets - Class A Shares | | $ | 531,331 | | | $ | 4,518 | | | $ | 211,335 | | | $ | 379,004 | |
| Shares Outstanding, $0.01 Par Value (unlimited shares authorized) | | | 50,393 | | | | 439 | | | | 24,206 | | | | 124,393 | |
| Net Asset Value Per Share(1) | | $ | 10.54 | | | $ | 10.28 | | | $ | 8.73 | | | $ | 3.05 | |
| Maximum Offering Price Per Share(2) | | $ | 11.07 | | | $ | 10.79 | | | $ | 9.17 | | | $ | 3.13 | |
| Net Assets - Class C Shares | | $ | 334,106 | | | $ | 1,543 | | | $ | 71,036 | | | $ | 77,370 | |
| Shares Outstanding, $0.01 Par Value (unlimited shares authorized) | | | 31,685 | | | | 150 | | | | 8,133 | | | | 25,412 | |
| Net Asset Value Per Share(1) | | $ | 10.54 | | | $ | 10.29 | | | $ | 8.73 | | | $ | 3.04 | |
| Net Assets - Class D Shares | | $ | 749,432 | | | $ | 11,498 | | | $ | 302,620 | | | $ | 205,964 | |
| Shares Outstanding, $0.01 Par Value (unlimited shares authorized) | | | 71,078 | | | | 1,119 | | | | 34,659 | | | | 67,493 | |
| Net Asset Value Per Share | | $ | 10.54 | | | $ | 10.28 | | | $ | 8.73 | | | $ | 3.05 | |
| Net Assets - Class I Shares | | $ | 1,593,444 | | | $ | 12,713 | | | $ | 257,280 | | | $ | 369,789 | |
| Shares Outstanding, $0.01 Par Value (unlimited shares authorized) | | | 151,135 | | | | 1,237 | | | | 29,455 | | | | 121,362 | |
| Net Asset Value Per Share | | $ | 10.54 | | | $ | 10.27 | | | $ | 8.73 | | | $ | 3.05 | |
| Net Assets - Class R Shares | | $ | 12,069 | | | | N/A | | | $ | 896 | | | | N/A | |
| Shares Outstanding, $0.01 Par Value (unlimited shares authorized) | | | 1,145 | | | | N/A | | | | 103 | | | | N/A | |
| Net Asset Value Per Share | | $ | 10.54 | | | | N/A | | | $ | 8.73 | | | | N/A | |
| Net Assets - Class S Shares | | $ | 66,393 | | | $ | 886 | | | $ | 5,589 | | | $ | 5,726 | |
| Shares Outstanding, $0.01 Par Value (unlimited shares authorized) | | | 6,295 | | | | 86 | | | | 639 | | | | 1,881 | |
| Net Asset Value Per Share | | $ | 10.55 | | | $ | 10.29 | | | $ | 8.75 | | | $ | 3.04 | |
| Net Assets - Class T Shares | | $ | 1,027,435 | | | $ | 2,842 | | | $ | 1,074,061 | | | $ | 1,863,910 | |
| Shares Outstanding, $0.01 Par Value (unlimited shares authorized) | | | 97,441 | | | | 276 | | | | 122,989 | | | | 610,515 | |
| Net Asset Value Per Share | | $ | 10.54 | | | $ | 10.28 | | | $ | 8.73 | | | $ | 3.05 | |
| | | |
| * | | See Note 5 in Notes to Financial Statements. |
| (1) | | Redemption price per share may be reduced for any applicable contingent deferred sales charge. |
| (2) | | Maximum offering price is computed at 100/95.25 of net asset value for Janus Flexible Bond Fund, Janus Global Bond Fund, and Janus High-Yield Fund and 100/97.50 of net asset value for Janus Short-Term Bond Fund. |
| | | |
| | | |
See Notes to Financial Statements.
70 | DECEMBER 31, 2011
This page intentionally left blank. The content of this page is part of a ‘Double Page Spread’ table and appears on the previous page.
71
Statements of Operations - Fixed Income Funds
| | | | | | | | | | | | | | | | | | | | | |
For the six-month period ended December 31, 2011 (unaudited)
| | | | | | | | | | |
| (all numbers in thousands) | | Janus Flexible Bond Fund | | Janus Global Bond Fund | | Janus High-Yield Fund | | Janus Short-Term Bond Fund | | |
|
| |
| Investment Income: | | | | | | | | | | | | | | | | | | | | |
| Interest | | $ | 79,090 | | | $ | 555 | | | $ | 70,636 | | | $ | 43,189 | | | | | |
| Dividends | | | 344 | | | | 1 | | | | 1,052 | | | | – | | | | | |
| Dividends from affiliates | | | 66 | | | | 1 | | | | 45 | | | | 45 | | | | | |
| Fee income | | | – | | | | – | | | | 111 | | | | 48 | | | | | |
| Total Investment Income | | | 79,500 | | | | 557 | | | | 71,844 | | | | 43,282 | | | | | |
| Expenses: | | | | | | | | | | | | | | | | | | | | |
| Advisory fees | | | 7,900 | | | | 98 | | | | 5,075 | | | | 8,340 | | | | | |
| Shareholder reports expense | | | 309 | | | | 5 | | | | 118 | | | | 148 | | | | | |
| Transfer agent fees and expenses | | | 111 | | | | 1 | | | | 55 | | | | 50 | | | | | |
| Registration fees | | | 131 | | | | 60 | | | | 70 | | | | 106 | | | | | |
| Custodian fees | | | 4 | | | | 3 | | | | 6 | | | | 9 | | | | | |
| Professional fees | | | 34 | | | | 16 | | | | 27 | | | | 37 | | | | | |
| Non-interested Trustees’ fees and expenses | | | 49 | | | | – | | | | 22 | | | | 42 | | | | | |
| Fund administration fees | | | 194 | | | | 2 | | | | 90 | | | | 152 | | | | | |
| Administrative services fees - Class D Shares | | | 434 | | | | 6 | | | | 183 | | | | 126 | | | | | |
| Administrative services fees - Class R Shares | | | 14 | | | | N/A | | | | 1 | | | | N/A | | | | | |
| Administrative services fees - Class S Shares | | | 80 | | | | 1 | | | | 7 | | | | 7 | | | | | |
| Administrative services fees - Class T Shares | | | 1,134 | | | | 9 | | | | 1,298 | | | | 2,397 | | | | | |
| Distribution fees and shareholder servicing fees - Class A Shares | | | 580 | | | | 2 | | | | 237 | | | | 475 | | | | | |
| Distribution fees and shareholder servicing fees - Class C Shares | | | 1,501 | | | | 7 | | | | 361 | | | | 373 | | | | | |
| Distribution fees and shareholder servicing fees - Class R Shares | | | 29 | | | | N/A | | | | 3 | | | | N/A | | | | | |
| Distribution fees and shareholder servicing fees - Class S Shares | | | 80 | | | | 1 | | | | 7 | | | | 7 | | | | | |
| Administrative, networking and omnibus fees - Class A Shares | | | 108 | | | | – | | | | 32 | | | | 983 | | | | | |
| Administrative, networking and omnibus fees - Class C Shares | | | 118 | | | | – | | | | 22 | | | | 24 | | | | | |
| Administrative, networking and omnibus fees - Class I Shares | | | 654 | | | | – | | | | 63 | | | | 81 | | | | | |
| Other expenses | | | 74 | | | | 2 | | | | 97 | | | | 72 | | | | | |
| Non-recurring costs (Note 4) | | | 1 | | | | N/A | | | | – | | | | – | | | | | |
| Costs assumed by Janus Capital Management LLC (Note 4) | | | (1) | | | | N/A | | | | – | | | | – | | | | | |
| Total Expenses | | | 13,538 | | | | 213 | | | | 7,774 | | | | 13,429 | | | | | |
| Expense and Fee Offset | | | (5) | | | | – | | | | (2) | | | | (4) | | | | | |
| Net Expenses | | | 13,533 | | | | 213 | | | | 7,772 | | | | 13,425 | | | | | |
| Less: Excess Expense Reimbursement | | | – | | | | (64) | | | | – | | | | (1,928) | | | | | |
| Net Expenses after Expense Reimbursement | | | 13,533 | | | | 149 | | | | 7,772 | | | | 11,497 | | | | | |
| Net Investment Income | | | 65,967 | | | | 408 | | | | 64,072 | | | | 31,785 | | | | | |
| Net Realized and Unrealized Gain/(Loss) on Investments: | | | | | | | | | | | | | | | | | | | | |
| Net realized gain/(loss) from investment and foreign currency transactions | | | 16,468 | | | | 392 | | | | (13,693) | | | | 687 | | | | | |
| Change in unrealized net appreciation/(depreciation) of investments, foreign currency translations and non-interested Trustees’ deferred compensation | | | 39,469 | | | | (429) | | | | (63,774) | | | | (31,973) | | | | | |
| Net Gain/(Loss) on Investments | | | 55,937 | | | | (37) | | | | (77,467) | | | | (31,286) | | | | | |
| Net Increase/(Decrease) in Net Assets Resulting from Operations | | $ | 121,904 | | | $ | 371 | | | $ | (13,395) | | | $ | 499 | | | | | |
See Notes to Financial Statements.
72 | DECEMBER 31, 2011
This page intentionally left blank. The content of this page is part of a ‘Double Page Spread’ table and appears on the previous page.
73
Statements of Changes in Net Assets - Fixed Income Funds
| | | | | | | | | | | | | | | | | | | | | | | | | | | | | | | | | |
| | | Janus Flexible
| | Janus Global
| | Janus
| | Janus Short-Term
|
For the six-month period ended December 31, 2011 (unaudited) and the fiscal year ended June 30, 2011
| | Bond Fund | | Bond Fund | | High-Yield Fund | | Bond Fund |
| (all numbers in thousands) | | 2011 | | 2011 | | 2011 | | 2011(1) | | 2011 | | 2011 | | 2011 | | 2011 |
|
| |
| Operations: | | | | | | | | | | | | | | | | | | | | | | | | | | | | | | | | |
| Net investment income | | $ | 65,967 | | | $ | 113,530 | | | $ | 408 | | | $ | 222 | | | $ | 64,072 | | | $ | 114,641 | | | $ | 31,785 | | | $ | 60,099 | |
Net realized gain/(loss) from investment and foreign currency transactions(2) | | | 16,468 | | | | 83,986 | | | | 392 | | | | 140 | | | | (13,693) | | | | 78,739 | | | | 687 | | | | 15,457 | |
| Change in unrealized net appreciation/(depreciation) of investments, foreign currency translations and non-interested Trustees’ deferred compensation | | | 39,469 | | | | (36,246) | | | | (429) | | | | 269 | | | | (63,774) | | | | 18,300 | | | | (31,973) | | | | 3,285 | |
| Net Increase/(Decrease) in Net Assets Resulting from Operations | | | 121,904 | | | | 161,270 | | | | 371 | | | | 631 | | | | (13,395) | | | | 211,680 | | | | 499 | | | | 78,841 | |
| Dividends and Distributions to Shareholders: | | | | | | | | | | | | | | | | | | | | | | | | | | | | | | | | |
| Net Investment Income* | | | | | | | | | | | | | | | | | | | | | | | | | | | | | | | | |
| Class A Shares | | | (8,104) | | | | (13,108) | | | | (25) | | | | (14) | | | | (6,908) | | | | (10,312) | | | | (3,917) | | | | (3,544) | |
| Class C Shares | | | (4,060) | | | | (7,328) | | | | (14) | | | | (10) | | | | (2,329) | | | | (4,991) | | | | (490) | | | | (997) | |
| Class D Shares | | | (13,193) | | | | (25,542) | | | | (146) | | | | (35) | | | | (11,261) | | | | (21,573) | | | | (2,286) | | | | (5,053) | |
| Class I Shares | | | (26,007) | | | | (39,912) | | | | (170) | | | | (124) | | | | (6,774) | | | | (13,219) | | | | (5,064) | | | | (8,457) | |
| Class R Shares | | | (176) | | | | (244) | | | | N/A | | | | N/A | | | | (38) | | | | (68) | | | | N/A | | | | N/A | |
| Class S Shares | | | (1,045) | | | | (2,016) | | | | (11) | | | | (11) | | | | (205) | | | | (496) | | | | (52) | | | | (99) | |
| Class T Shares | | | (16,035) | | | | (26,053) | | | | (89) | | | | (23) | | | | (37,853) | | | | (63,379) | | | | (19,725) | | | | (41,906) | |
| Net Realized Gain/(Loss) from Investment Transactions* | | | | | | | | | | | | | | | | | | | | | | | | | | | | | | | | |
| Class A Shares | | | (7,683) | | | | (11,992) | | | | (29) | | | | – | | | | – | | | | – | | | | (729) | | | | (1,038) | |
| Class C Shares | | | (4,783) | | | | (8,699) | | | | (11) | | | | – | | | | – | | | | – | | | | (150) | | | | (565) | |
| Class D Shares | | | (10,736) | | | | (22,228) | | | | (84) | | | | – | | | | – | | | | – | | | | (403) | | | | (1,775) | |
| Class I Shares | | | (22,886) | | | | (34,295) | | | | (85) | | | | – | | | | – | | | | – | | | | (724) | | | | (2,459) | |
| Class R Shares | | | (173) | | | | (258) | | | | N/A | | | | N/A | | | | – | | | | – | | | | N/A | | | | N/A | |
| Class S Shares | | | (946) | | | | (1,864) | | | | (6) | | | | – | | | | – | | | | – | | | | (11) | | | | (38) | |
| Class T Shares | | | (14,600) | | | | (23,387) | | | | (21) | | | | – | | | | – | | | | – | | | | (3,655) | | | | (15,511) | |
| Net Decrease from Dividends and Distributions | | | (130,427) | | | | (216,926) | | | | (691) | | | | (217) | | | | (65,368) | | | | (114,038) | | | | (37,206) | | | | (81,442) | |
See footnotes at the end of the Statements.
See Notes to Financial Statements.
74 | DECEMBER 31, 2011
This page intentionally left blank. The content of this page is part of a ‘Double Page Spread’ table and appears on the previous page.
75
Statements of Changes in Net Assets - Fixed Income Funds (continued)
| | | | | | | | | | | | | | | | | | | | | | | | | | | | | | | | | |
| | | Janus Flexible
| | Janus Global
| | Janus
| | Janus Short-Term
|
For the six-month period ended December 31, 2011 (unaudited) and the fiscal year ended June 30, 2011
| | Bond Fund | | Bond Fund | | High-Yield Fund | | Bond Fund |
| (all numbers in thousands) | | 2011 | | 2011 | | 2011 | | 2011(1) | | 2011 | | 2011 | | 2011 | | 2011 |
|
| |
| Capital Share Transactions: | | | | | | | | | | | | | | | | | | | | | | | | | | | | | | | | |
| Shares Sold | | | | | | | | | | | | | | | | | | | | | | | | | | | | | | | | |
| Class A Shares | | | 199,380 | | | | 236,791 | | | | 3,386 | | | | 1,142 | | | | 80,964 | | | | 101,346 | | | | 100,318 | | | | 343,501 | |
| Class C Shares | | | 89,310 | | | | 116,406 | | | | 371 | | | | 1,256 | | | | 7,693 | | | | 24,608 | | | | 19,979 | | | | 31,038 | |
| Class D Shares | | | 104,320 | | | | 163,433 | | | | 10,760 | | | | 5,279 | | | | 25,574 | | | | 83,778 | | | | 24,851 | | | | 55,233 | |
| Class I Shares | | | 543,749 | | | | 738,213 | | | | 2,868 | | | | 10,584 | | | | 159,712 | | | | 197,281 | | | | 115,069 | | | | 517,969 | |
| Class R Shares | | | 4,922 | | | | 8,944 | | | | N/A | | | | N/A | | | | 376 | | | | 515 | | | | N/A | | | | N/A | |
| Class S Shares | | | 20,226 | | | | 26,590 | | | | – | | | | 834 | | | | 864 | | | | 2,622 | | | | 313 | | | | 3,127 | |
| Class T Shares | | | 351,062 | | | | 487,789 | | | | 1,417 | | | | 8,775 | | | | 203,648 | | | | 491,082 | | | | 308,563 | | | | 951,013 | |
| Redemption Fees | | | | | | | | | | | | | | | | | | | | | | | | | | | | | | | | |
| Class D Shares | | | N/A | | | | N/A | | | | N/A | | | | N/A | | | | 23 | | | | 32 | | | | N/A | | | | N/A | |
| Class I Shares | | | N/A | | | | N/A | | | | N/A | | | | N/A | | | | 3 | | | | 9 | | | | N/A | | | | N/A | |
| Class R Shares | | | N/A | | | | N/A | | | | N/A | | | | N/A | | | | – | | | | – | | | | N/A | | | | N/A | |
| Class S Shares | | | N/A | | | | N/A | | | | N/A | | | | N/A | | | | – | | | | – | | | | N/A | | | | N/A | |
| Class T Shares | | | N/A | | | | N/A | | | | N/A | | | | N/A | | | | 161 | | | | 121 | | | | N/A | | | | N/A | |
| Reinvested Dividends and Distributions | | | | | | | | | | | | | | | | | | | | | | | | | | | | | | | | |
| Class A Shares | | | 14,341 | | | | 22,589 | | | | 53 | | | | 13 | | | | 6,443 | | | | 8,816 | | | | 4,445 | | | | 4,010 | |
| Class C Shares | | | 5,996 | | | | 9,461 | | | | 26 | | | | 10 | | | | 1,894 | | | | 3,746 | | | | 467 | | | | 1,096 | |
| Class D Shares | | | 22,388 | | | | 44,266 | | | | 226 | | | | 34 | | | | 9,544 | | | | 18,155 | | | | 2,622 | | | | 6,651 | |
| Class I Shares | | | 41,715 | | | | 63,798 | | | | 254 | | | | 124 | | | | 5,774 | | | | 11,810 | | | | 4,291 | | | | 7,533 | |
| Class R Shares | | | 301 | | | | 450 | | | | N/A | | | | N/A | | | | 30 | | | | 58 | | | | N/A | | | | N/A | |
| Class S Shares | | | 1,982 | | | | 3,857 | | | | 17 | | | | 11 | | | | 201 | | | | 496 | | | | 64 | | | | 137 | |
| Class T Shares | | | 30,298 | | | | 48,530 | | | | 110 | | | | 23 | | | | 37,251 | | | | 61,957 | | | | 23,109 | | | | 56,769 | |
| Shares Repurchased | | | | | | | | | | | | | | | | | | | | | | | | | | | | | | | | |
| Class A Shares | | | (82,082) | | | | (176,709) | | | | (88) | | | | – | | | | (40,431) | | | | (55,880) | | | | (96,243) | | | | (92,986) | |
| Class C Shares | | | (29,134) | | | | (89,404) | | | | (131) | | | | – | | | | (13,539) | | | | (23,685) | | | | (12,681) | | | | (24,554) | |
| Class D Shares | | | (63,190) | | | | (175,942) | | | | (4,146) | | | | (481) | | | | (35,572) | | | | (52,283) | | | | (29,510) | | | | (78,296) | |
| Class I Shares | | | (218,451) | | | | (319,248) | | | | (793) | | | | (504) | | | | (76,293) | | | | (117,124) | | | | (287,909) | | | | (152,256) | |
| Class R Shares | | | (2,721) | | | | (5,250) | | | | N/A | | | | N/A | | | | (554) | | | | (417) | | | | N/A | | | | N/A | |
| Class S Shares | | | (13,589) | | | | (33,391) | | | | – | | | | – | | | | (2,153) | | | | (2,959) | | | | (273) | | | | (2,715) | |
| Class T Shares | | | (145,999) | | | | (370,997) | | | | (7,516) | | | | (8) | | | | (181,257) | | | | (253,310) | | | | (397,671) | | | | (1,010,651) | |
| Net Increase/(Decrease) from Capital Share Transactions | | | 874,824 | | | | 800,176 | | | | 6,814 | | | | 27,092 | | | | 190,356 | | | | 500,774 | | | | (220,196) | | | | 616,619 | |
| Net Increase/(Decrease) in Net Assets | | | 866,301 | | | | 744,520 | | | | 6,494 | | | | 27,506 | | | | 111,593 | | | | 598,416 | | | | (256,903) | | | | 614,018 | |
| Net Assets: | | | | | | | | | | | | | | | | | | | | | | | | | | | | | | | | |
| Beginning of period | | | 3,447,909 | | | | 2,703,389 | | | | 27,506 | | | | – | | | | 1,811,224 | | | | 1,212,808 | | | | 3,158,666 | | | | 2,544,648 | |
| End of period | | $ | 4,314,210 | | | $ | 3,447,909 | | | $ | 34,000 | | | $ | 27,506 | | | $ | 1,922,817 | | | $ | 1,811,224 | | | $ | 2,901,763 | | | $ | 3,158,666 | |
| | | | | | | | | | | | | | | | | | | | | | | | | | | | | | | | | |
| Undistributed Net Investment Income/(Loss)* | | $ | (2,580) | | | $ | 72 | | | $ | 28 | | | $ | 75 | | | $ | (313) | | | $ | 983 | | | $ | 85 | | | $ | (166) | |
| | | |
| * | | See Note 5 in Notes to Financial Statements. |
| (1) | | Period from December 28, 2010 (inception date) through June 30, 2011. |
| (2) | | Certain prior year amounts have been reclassified to conform with current year presentation. |
| | | |
| | | |
See Notes to Financial Statements.
76 | DECEMBER 31, 2011
This page intentionally left blank. The content of this page is part of a ‘Double Page Spread’ table and appears on the previous page.
77
Financial Highlights - Fixed Income Funds
Class A Shares
| | | | | | | | | | | | | | | | | | | |
For a share outstanding during the six-month period ended December 31, 2011
| | | | | | | | | | |
(unaudited), the fiscal year ended June 30, 2011, the eight-month fiscal period
| | Janus Flexible Bond Fund | | |
| ended June 30, 2010 and the fiscal period ended October 31, 2009 | | 2011 | | 2011 | | 2010(1) | | 2009(2) | | |
| |
| Net Asset Value, Beginning of Period | | | $10.54 | | | | $10.70 | | | | $10.41 | | | | $9.97 | | | |
| Income from Investment Operations: | | | | | | | | | | | | | | | | | | |
| Net investment income | | | .18 | | | | .37 | | | | .28 | | | | .14 | | | |
| Net gain on investments (both realized and unrealized) | | | .16 | | | | .19 | | | | .35 | | | | .44 | | | |
| Total from Investment Operations | | | .34 | | | | .56 | | | | .63 | | | | .58 | | | |
| Less Distributions: | | | | | | | | | | | | | | | | | | |
| Dividends (from net investment income)* | | | (.19) | | | | (.38) | | | | (.28) | | | | (.14) | | | |
| Distributions (from capital gains)* | | | (.15) | | | | (.34) | | | | (.06) | | | | – | | | |
| Total Distributions | | | (.34) | | | | (.72) | | | | (.34) | | | | (.14) | | | |
| Net Asset Value, End of Period | | | $10.54 | | | | $10.54 | | | | $10.70 | | | | $10.41 | | | |
| Total Return** | | | 3.27% | | | | 5.41% | | | | 6.16% | | | | 5.87% | | | |
| Net Assets, End of Period (in thousands) | | | $531,331 | | | | $400,706 | | | | $324,085 | | | | $231,112 | | | |
| Average Net Assets for the Period (in thousands) | | | $461,735 | | | | $371,462 | | | | $265,798 | | | | $218,408 | | | |
Ratio of Gross Expenses to Average Net Assets***(3) | | | 0.75% | | | | 0.76% | | | | 0.76% | | | | 0.80% | | | |
Ratio of Net Expenses to Average Net Assets***(3) | | | 0.75% | | | | 0.76% | | | | 0.76% | | | | 0.80% | | | |
| Ratio of Net Investment Income to Average Net Assets*** | | | 3.35% | | | | 3.51% | | | | 4.04% | | | | 4.28% | | | |
| Portfolio Turnover Rate*** | | | 131% | | | | 147% | | | | 130% | | | | 215% | | | |
Class A Shares
| | | | | | | | | | | |
For a share outstanding during the six-month period ended December 31, 2011
| | Janus Global Bond Fund | | |
| (unaudited) and the fiscal period ended June 30, 2011 | | 2011 | | 2011(4) | | |
| |
| Net Asset Value, Beginning of Period | | | $10.35 | | | | $10.00 | | | |
| Income from Investment Operations: | | | | | | | | | | |
| Net investment income | | | .09 | | | | .19 | | | |
| Net gain on investments (both realized and unrealized) | | | .06 | | | | .31 | | | |
| Total from Investment Operations | | | .15 | | | | .50 | | | |
| Less Distributions: | | | | | | | | | | |
| Dividends (from net investment income)* | | | (.14) | | | | (.15) | | | |
| Distributions (from capital gains)* | | | (.08) | | | | – | | | |
| Total Distributions | | | (.22) | | | | (.15) | | | |
| Net Asset Value, End of Period | | | $10.28 | | | | $10.35 | | | |
| Total Return** | | | 1.44% | | | | 4.99% | | | |
| Net Assets, End of Period (in thousands) | | | $4,518 | | | | $1,190 | | | |
| Average Net Assets for the Period (in thousands) | | | $1,698 | | | | $958 | | | |
Ratio of Gross Expenses to Average Net Assets***(3) | | | 1.00% | | | | 0.80% | | | |
Ratio of Net Expenses to Average Net Assets***(3) | | | 1.00% | | | | 0.79% | | | |
| Ratio of Net Investment Income to Average Net Assets*** | | | 2.19% | | | | 3.03% | | | |
| Portfolio Turnover Rate*** | | | 258% | | | | 173% | | | |
| | | |
| * | | See Note 5 in Notes to Financial Statements. |
| ** | | Total return not annualized for periods of less than one full year. |
| *** | | Annualized for periods of less than one full year. |
| (1) | | Period from November 1, 2009 through June 30, 2010. The Fund changed its fiscal year end from October 31 to June 30. |
| (2) | | Period from July 6, 2009 (inception date) through October 31, 2009. |
| (3) | | See Note 6 in Notes to Financial Statements. |
| (4) | | Period from December 28, 2010 (inception date) through June 30, 2011. |
See Notes to Financial Statements.
78 | DECEMBER 31, 2011
Class A Shares
| | | | | | | | | | | | | | | | | | | |
For a share outstanding during the six-month period ended December 31, 2011
| | | | | | | | | | |
(unaudited), the fiscal year ended June 30, 2011, the eight-month fiscal period
| | Janus High-Yield Fund | | |
| ended June 30, 2010 and the fiscal period ended October 31, 2009 | | 2011 | | 2011 | | 2010(1) | | 2009(2) | | |
| |
| Net Asset Value, Beginning of Period | | | $9.13 | | | | $8.45 | | | | $8.29 | | | | $7.61 | | | |
| Income from Investment Operations: | | | | | | | | | | | | | | | | | | |
| Net investment income | | | .32 | | | | .65 | | | | .47 | | | | .27 | | | |
| Net gain/(loss) on investments (both realized and unrealized) | | | (.40) | | | | .68 | | | | .16 | | | | .68 | | | |
| Total from Investment Operations | | | (.08) | | | | 1.33 | | | | .63 | | | | .95 | | | |
| Less Distributions: | | | | | | | | | | | | | | | | | | |
| Dividends (from net investment income)* | | | (.32) | | | | (.65) | | | | (.47) | | | | (.27) | | | |
| Distributions (from capital gains)* | | | – | | | | – | | | | – | | | | – | | | |
| Total Distributions | | | (.32) | | | | (.65) | | | | (.47) | | | | (.27) | | | |
| Net Asset Value, End of Period | | | $8.73 | | | | $9.13 | | | | $8.45 | | | | $8.29 | | | |
| Total Return** | | | (0.80)% | | | | 16.09%(3) | | | | 7.66% | | | | 12.63% | | | |
| Net Assets, End of Period (in thousands) | | | $211,335 | | | | $171,976 | | | | $109,096 | | | | $84,972 | | | |
| Average Net Assets for the Period (in thousands) | | | $188,942 | | | | $143,277 | | | | $98,784 | | | | $75,369 | | | |
Ratio of Gross Expenses to Average Net Assets***(4) | | | 0.90% | | | | 0.92% | | | | 0.92% | | | | 0.96% | | | |
Ratio of Net Expenses to Average Net Assets***(4) | | | 0.90% | | | | 0.92% | | | | 0.92% | | | | 0.96% | | | |
| Ratio of Net Investment Income to Average Net Assets*** | | | 7.12% | | | | 7.23% | | | | 8.30% | | | | 10.07% | | | |
| Portfolio Turnover Rate*** | | | 51% | | | | 92% | | | | 91% | | | | 97% | | | |
Class A Shares
| | | | | | | | | | | | | | | | | | | |
For a share outstanding during the six-month period ended December 31, 2011
| | | | | | | | | | |
(unaudited), the fiscal year ended June 30, 2011, the eight-month fiscal period
| | Janus Short-Term Bond Fund | | |
| ended June 30, 2010 and the fiscal period ended October 31, 2009 | | 2011 | | 2011 | | 2010(1) | | 2009(2) | | |
| |
| Net Asset Value, Beginning of Period | | | $3.08 | | | | $3.09 | | | | $3.06 | | | | $3.01 | | | |
| Income from Investment Operations: | | | | | | | | | | | | | | | | | | |
| Net investment income | | | .03 | | | | .07 | | | | .05 | | | | .04 | | | |
| Net gain/(loss) on investments (both realized and unrealized) | | | (.02) | | | | .01 | | | | .03 | | | | .05 | | | |
| Total from Investment Operations | | | .01 | | | | .08 | | | | .08 | | | | .09 | | | |
| Less Distributions: | | | | | | | | | | | | | | | | | | |
| Dividends (from net investment income)* | | | (.03) | | | | (.07) | | | | (.05) | | | | (.04) | | | |
| Distributions (from capital gains)* | | | (.01) | | | | (.02) | | | | – | | | | – | | | |
| Total Distributions | | | (.04) | | | | (.09) | | | | (.05) | | | | (.04) | | | |
| Net Asset Value, End of Period | | | $3.05 | | | | $3.08 | | | | $3.09 | | | | $3.06 | | | |
| Total Return** | | | 0.26% | | | | 2.65% | | | | 2.65% | | | | 3.05% | | | |
| Net Assets, End of Period (in thousands) | | | $379,004 | | | | $374,981 | | | | $121,254 | | | | $43,636 | | | |
| Average Net Assets for the Period (in thousands) | | | $377,956 | | | | $164,464 | | | | $82,728 | | | | $18,271 | | | |
Ratio of Gross Expenses to Average Net Assets***(4) | | | 0.78% | | | | 0.80% | | | | 0.80% | | | | 0.82% | | | |
Ratio of Net Expenses to Average Net Assets***(4) | | | 0.78% | | | | 0.80% | | | | 0.80% | | | | 0.81% | | | |
| Ratio of Net Investment Income to Average Net Assets*** | | | 2.08% | | | | 2.12% | | | | 2.39% | | | | 2.78% | | | |
| Portfolio Turnover Rate*** | | | 94% | | | | 100% | | | | 50% | | | | 57% | | | |
| | | |
| * | | See Note 5 in Notes to Financial Statements. |
| ** | | Total return not annualized for periods of less than one full year. |
| *** | | Annualized for periods of less than one full year. |
| (1) | | Period from November 1, 2009 through June 30, 2010. The Fund changed its fiscal year end from October 31 to June 30. |
| (2) | | Period from July 6, 2009 (inception date) through October 31, 2009. |
| (3) | | Impact on performance due to reimbursement from advisor was 0.51%. |
| (4) | | See Note 6 in Notes to Financial Statements. |
See Notes to Financial Statements.
Janus Fixed Income & Money Market Funds | 79
Financial Highlights - Fixed Income Funds (continued)
Class C Shares
| | | | | | | | | | | | | | | | | | | |
For a share outstanding during the six-month period ended December 31, 2011
| | | | | | | | | | |
(unaudited), the fiscal year ended June 30, 2011, the eight-month fiscal period
| | Janus Flexible Bond Fund | | |
| ended June 30, 2010 and the fiscal period ended October 31, 2009 | | 2011 | | 2011 | | 2010(1) | | 2009(2) | | |
| |
| Net Asset Value, Beginning of Period | | | $10.54 | | | | $10.70 | | | | $10.41 | | | | $9.97 | | | |
| Income from Investment Operations: | | | | | | | | | | | | | | | | | | |
| Net investment income | | | .14 | | | | .29 | | | | .23 | | | | .12 | | | |
| Net gain on investments (both realized and unrealized) | | | .16 | | | | .19 | | | | .35 | | | | .44 | | | |
| Total from Investment Operations | | | .30 | | | | .48 | | | | .58 | | | | .56 | | | |
| Less Distributions: | | | | | | | | | | | | | | | | | | |
| Dividends (from net investment income)* | | | (.15) | | | | (.30) | | | | (.23) | | | | (.12) | | | |
| Distributions (from capital gains)* | | | (.15) | | | | (.34) | | | | (.06) | | | | – | | | |
| Total Distributions | | | (.30) | | | | (.64) | | | | (.29) | | | | (.12) | | | |
| Net Asset Value, End of Period | | | $10.54 | | | | $10.54 | | | | $10.70 | | | | $10.41 | | | |
| Total Return** | | | 2.87% | | | | 4.62% | | | | 5.63% | | | | 5.61% | | | |
| Net Assets, End of Period (in thousands) | | | $334,106 | | | | $268,575 | | | | $236,850 | | | | $161,218 | | | |
| Average Net Assets for the Period (in thousands) | | | $298,621 | | | | $264,522 | | | | $195,825 | | | | $137,244 | | | |
Ratio of Gross Expenses to Average Net Assets***(3) | | | 1.53% | | | | 1.51% | | | | 1.51% | | | | 1.57% | | | |
Ratio of Net Expenses to Average Net Assets***(3) | | | 1.53% | | | | 1.51% | | | | 1.51% | | | | 1.57% | | | |
| Ratio of Net Investment Income to Average Net Assets*** | | | 2.57% | | | | 2.75% | | | | 3.29% | | | | 3.51% | | | |
| Portfolio Turnover Rate*** | | | 131% | | | | 147% | | | | 130% | | | | 215% | | | |
Class C Shares
| | | | | | | | | | | |
For a share outstanding during the six-month period ended December 31, 2011
| | Janus Global Bond Fund | | |
| (unaudited) and the fiscal period ended June 30, 2011 | | 2011 | | 2011(4) | | |
| |
| Net Asset Value, Beginning of Period | | | $10.36 | | | | $10.00 | | | |
| Income from Investment Operations: | | | | | | | | | | |
| Net investment income | | | .08 | | | | .16 | | | |
| Net gain on investments (both realized and unrealized) | | | .03 | | | | .31 | | | |
| Total from Investment Operations | | | .11 | | | | .47 | | | |
| Less Distributions: | | | | | | | | | | |
| Dividends (from net investment income)* | | | (.10) | | | | (.11) | | | |
| Distributions (from capital gains)* | | | (.08) | | | | – | | | |
| Total Distributions | | | (.18) | | | | (.11) | | | |
| Net Asset Value, End of Period | | | $10.29 | | | | $10.36 | | | |
| Total Return** | | | 1.06% | | | | 4.70% | | | |
| Net Assets, End of Period (in thousands) | | | $1,543 | | | | $1,293 | | | |
| Average Net Assets for the Period (in thousands) | | | $1,451 | | | | $908 | | | |
Ratio of Gross Expenses to Average Net Assets***(3) | | | 1.75% | | | | 1.36%(5) | | | |
Ratio of Net Expenses to Average Net Assets***(3) | | | 1.75% | | | | 1.36%(5) | | | |
| Ratio of Net Investment Income to Average Net Assets*** | | | 1.68% | | | | 2.45% | | | |
| Portfolio Turnover Rate*** | | | 258% | | | | 173% | | | |
| | | |
| * | | See Note 5 in Notes to Financial Statements. |
| ** | | Total return not annualized for periods of less than one full year. |
| *** | | Annualized for periods of less than one full year. |
| (1) | | Period from November 1, 2009 through June 30, 2010. The Fund changed its fiscal year end from October 31 to June 30. |
| (2) | | Period from July 6, 2009 (inception date) through October 31, 2009. |
| (3) | | See Note 6 in Notes to Financial Statements. |
| (4) | | Period from December 28, 2010 (inception date) through June 30, 2011. |
| (5) | | Pursuant to a contractual agreement, Janus waived certain fees and expenses during the period. The Ratio of Gross Expenses to Average Net Assets and Ratio of Net Expenses to Average Net Assets would be 1.77% and 1.77%, respectively, without the waiver of these fees and expenses. |
See Notes to Financial Statements.
80 | DECEMBER 31, 2011
Class C Shares
| | | | | | | | | | | | | | | | | | | |
For a share outstanding during the six-month period ended December 31, 2011
| | | | | | | | | | |
(unaudited), the fiscal year ended June 30, 2011, the eight-month fiscal period
| | Janus High-Yield Fund | | |
| ended June 30, 2010 and the fiscal period ended October 31, 2009 | | 2011 | | 2011 | | 2010(1) | | 2009(2) | | |
| |
| Net Asset Value, Beginning of Period | | | $9.13 | | | | $8.45 | | | | $8.29 | | | | $7.61 | | | |
| Income from Investment Operations: | | | | | | | | | | | | | | | | | | |
| Net investment income | | | .28 | | | | .59 | | | | .43 | | | | .27 | | | |
| Net gain/(loss) on investments (both realized and unrealized) | | | (.39) | | | | .68 | | | | .16 | | | | .68 | | | |
| Total from Investment Operations | | | (.11) | | | | 1.27 | | | | .59 | | | | .95 | | | |
| Less Distributions: | | | | | | | | | | | | | | | | | | |
| Dividends (from net investment income)* | | | (.29) | | | | (.59) | | | | (.43) | | | | (.27) | | | |
| Distributions (from capital gains)* | | | – | | | | – | | | | – | | | | – | | | |
| Total Distributions | | | (.29) | | | | (.59) | | | | (.43) | | | | (.27) | | | |
| Net Asset Value, End of Period | | | $8.73 | | | | $9.13 | | | | $8.45 | | | | $8.29 | | | |
| Total Return** | | | (1.19)% | | | | 15.30%(3) | | | | 7.14% | | | | 12.36% | | | |
| Net Assets, End of Period (in thousands) | | | $71,036 | | | | $78,456 | | | | $68,485 | | | | $61,744 | | | |
| Average Net Assets for the Period (in thousands) | | | $71,705 | | | | $76,507 | | | | $67,693 | | | | $51,080 | | | |
Ratio of Gross Expenses to Average Net Assets***(4) | | | 1.68% | | | | 1.61% | | | | 1.65% | | | | 1.71% | | | |
Ratio of Net Expenses to Average Net Assets***(4) | | | 1.68% | | | | 1.61% | | | | 1.65% | | | | 1.71% | | | |
| Ratio of Net Investment Income to Average Net Assets*** | | | 6.33% | | | | 6.57% | | | | 7.59% | | | | 9.27% | | | |
| Portfolio Turnover Rate*** | | | 51% | | | | 92% | | | | 91% | | | | 97% | | | |
Class C Shares
| | | | | | | | | | | | | | | | | | | |
For a share outstanding during the six-month period ended December 31, 2011
| | | | | | | | | | |
(unaudited), the fiscal year ended June 30, 2011, the eight-month fiscal period
| | Janus Short-Term Bond Fund | | |
| ended June 30, 2010 and the fiscal period ended October 31, 2009 | | 2011 | | 2011 | | 2010(1) | | 2009(2) | | |
| |
| Net Asset Value, Beginning of Period | | | $3.08 | | | | $3.08 | | | | $3.06 | | | | $3.01 | | | |
| Income from Investment Operations: | | | | | | | | | | | | | | | | | | |
| Net investment income | | | .02 | | | | .04 | | | | .03 | | | | .05 | | | |
| Net gain/(loss) on investments (both realized and unrealized) | | | (.03) | | | | .02 | | | | .02 | | | | .05 | | | |
| Total from Investment Operations | | | (.01) | | | | .06 | | | | .05 | | | | .10 | | | |
| Less Distributions: | | | | | | | | | | | | | | | | | | |
| Dividends (from net investment income)* | | | (.02) | | | | (.04) | | | | (.03) | | | | (.05) | | | |
| Distributions (from capital gains)* | | | (.01) | | | | (.02) | | | | – | | | | – | | | |
| Total Distributions | | | (.03) | | | | (.06) | | | | (.03) | | | | (.05) | | | |
| Net Asset Value, End of Period | | | $3.04 | | | | $3.08 | | | | $3.08 | | | | $3.06 | | | |
| Total Return** | | | (0.44)% | | | | 2.24% | | | | 1.82% | | | | 3.31% | | | |
| Net Assets, End of Period (in thousands) | | | $77,370 | | | | $70,507 | | | | $63,030 | | | | $23,567 | | | |
| Average Net Assets for the Period (in thousands) | | | $74,261 | | | | $69,983 | | | | $42,824 | | | | $8,848 | | | |
Ratio of Gross Expenses to Average Net Assets***(4) | | | 1.53% | | | | 1.53% | | | | 1.55% | | | | 1.57% | | | |
Ratio of Net Expenses to Average Net Assets***(4) | | | 1.53% | | | | 1.53% | | | | 1.55% | | | | 1.56% | | | |
| Ratio of Net Investment Income to Average Net Assets*** | | | 1.33% | | | | 1.40% | | | | 1.64% | | | | 2.01% | | | |
| Portfolio Turnover Rate*** | | | 94% | | | | 100% | | | | 50% | | | | 57% | | | |
| | | |
| * | | See Note 5 in Notes to Financial Statements. |
| ** | | Total return not annualized for periods of less than one full year. |
| *** | | Annualized for periods of less than one full year. |
| (1) | | Period from November 1, 2009 through June 30, 2010. The Fund changed its fiscal year end from October 31 to June 30. |
| (2) | | Period from July 6, 2009 (inception date) through October 31, 2009. |
| (3) | | Impact on performance due to reimbursement from advisor was 0.51%. |
| (4) | | See Note 6 in Notes to Financial Statements. |
See Notes to Financial Statements.
Janus Fixed Income & Money Market Funds | 81
Financial Highlights - Fixed Income Funds (continued)
Class D Shares
| | | | | | | | | | | | | | | |
For a share outstanding during the six-month period ended December 31, 2011 (unaudited),
| | Janus Flexible Bond Fund | | |
| the fiscal year ended June 30, 2011 and the fiscal period ended June 30, 2010 | | 2011 | | 2011 | | 2010(1) | | |
| |
| Net Asset Value, Beginning of Period | | | $10.54 | | | | $10.70 | | | | $10.43 | | | |
| Income from Investment Operations: | | | | | | | | | | | | | | |
| Net investment income | | | .19 | | | | .39 | | | | .16 | | | |
| Net gain on investments (both realized and unrealized) | | | .16 | | | | .18 | | | | .27 | | | |
| Total from Investment Operations | | | .35 | | | | .57 | | | | .43 | | | |
| Less Distributions: | | | | | | | | | | | | | | |
| Dividends (from net investment income)* | | | (.20) | | | | (.39) | | | | (.16) | | | |
| Distributions (from capital gains)* | | | (.15) | | | | (.34) | | | | – | | | |
| Total Distributions | | | (.35) | | | | (.73) | | | | (.16) | | | |
| Net Asset Value, End of Period | | | $10.54 | | | | $10.54 | | | | $10.70 | | | |
| Total Return** | | | 3.36% | | | | 5.59% | | | | 4.13% | | | |
| Net Assets, End of Period (in thousands) | | | $749,432 | | | | $686,500 | | | | $665,736 | | | |
| Average Net Assets for the Period (in thousands) | | | $719,490 | | | | $691,039 | | | | $632,441 | | | |
Ratio of Gross Expenses to Average Net Assets***(2) | | | 0.58% | | | | 0.59% | | | | 0.60% | | | |
Ratio of Net Expenses to Average Net Assets***(2) | | | 0.58% | | | | 0.59% | | | | 0.60% | | | |
| Ratio of Net Investment Income to Average Net Assets*** | | | 3.52% | | | | 3.68% | | | | 4.09% | | | |
| Portfolio Turnover Rate*** | | | 131% | | | | 147% | | | | 130% | | | |
Class D Shares
| | | | | | | | | | | |
For a share outstanding during the six-month period ended December 31, 2011 (unaudited)
| | Janus Global Bond Fund | | |
| and the fiscal period ended June 30, 2011 | | 2011 | | 2011(3) | | |
| |
| Net Asset Value, Beginning of Period | | | $10.35 | | | | $10.00 | | | |
| Income from Investment Operations: | | | | | | | | | | |
| Net investment income | | | .12 | | | | .18 | | | |
| Net gain on investments (both realized and unrealized) | | | .04 | | | | .32 | | | |
| Total from Investment Operations | | | .16 | | | | .50 | | | |
| Less Distributions: | | | | | | | | | | |
| Dividends (from net investment income)* | | | (.15) | | | | (.15) | | | |
| Distributions (from capital gains)* | | | (.08) | | | | – | | | |
| Total Distributions | | | (.23) | | | | (.15) | | | |
| Net Asset Value, End of Period | | | $10.28 | | | | $10.35 | | | |
| Total Return** | | | 1.51% | | | | 5.06% | | | |
| Net Assets, End of Period (in thousands) | | | $11,498 | | | | $4,876 | | | |
| Average Net Assets for the Period (in thousands) | | | $9,938 | | | | $2,296 | | | |
Ratio of Gross Expenses to Average Net Assets***(2) | | | 0.87% | | | | 0.72% | | | |
Ratio of Net Expenses to Average Net Assets***(2) | | | 0.87% | | | | 0.72% | | | |
| Ratio of Net Investment Income to Average Net Assets*** | | | 2.59% | | | | 3.08% | | | |
| Portfolio Turnover Rate*** | | | 258% | | | | 173% | | | |
| | | |
| * | | See Note 5 in Notes to Financial Statements. |
| ** | | Total return not annualized for periods of less than one full year. |
| *** | | Annualized for periods of less than one full year. |
| (1) | | Period from February 16, 2010 (inception date) through June 30, 2010. |
| (2) | | See Note 6 in Notes to Financial Statements. |
| (3) | | Period from December 28, 2010 (inception date) through June 30, 2011. |
See Notes to Financial Statements.
82 | DECEMBER 31, 2011
Class D Shares
| | | | | | | | | | | | | | | |
For a share outstanding during the six-month period ended December 31, 2011 (unaudited),
| | Janus High-Yield Fund | | |
| the fiscal year ended June 30, 2011 and the fiscal period ended June 30, 2010 | | 2011 | | 2011 | | 2010(1) | | |
| |
| Net Asset Value, Beginning of Period | | | $9.13 | | | | $8.45 | | | | $8.27 | | | |
| Income from Investment Operations: | | | | | | | | | | | | | | |
| Net investment income | | | .32 | | | | .67 | | | | .26 | | | |
| Net gain/(loss) on investments (both realized and unrealized) | | | (.39) | | | | .68 | | | | .18 | | | |
| Total from Investment Operations | | | (.07) | | | | 1.35 | | | | .44 | | | |
| Less Distributions and Other: | | | | | | | | | | | | | | |
| Dividends (from net investment income)* | | | (.33) | | | | (.67) | | | | (.26) | | | |
| Distributions (from capital gains)* | | | – | | | | – | | | | – | | | |
| Redemption fees | | | –(2) | | | | –(2) | | | | –(2) | | | |
| Total Distributions and Other | | | (.33) | | | | (.67) | | | | (.26) | | | |
| Net Asset Value, End of Period | | | $8.73 | | | | $9.13 | | | | $8.45 | | | |
| Total Return** | | | (0.72)% | | | | 16.28%(3) | | | | 5.31% | | | |
| Net Assets, End of Period (in thousands) | | | $302,620 | | | | $317,038 | | | | $247,945 | | | |
| Average Net Assets for the Period (in thousands) | | | $302,752 | | | | $292,765 | | | | $245,710 | | | |
Ratio of Gross Expenses to Average Net Assets***(4) | | | 0.75% | | | | 0.76% | | | | 0.77% | | | |
Ratio of Net Expenses to Average Net Assets***(4) | | | 0.75% | | | | 0.76% | | | | 0.77% | | | |
| Ratio of Net Investment Income to Average Net Assets*** | | | 7.27% | | | | 7.41% | | | | 8.27% | | | |
| Portfolio Turnover Rate*** | | | 51% | | | | 92% | | | | 91% | | | |
Class D Shares
| | | | | | | | | | | | | | | |
For a share outstanding during the six-month period ended December 31, 2011 (unaudited),
| | Janus Short-Term Bond Fund | | |
| the fiscal year ended June 30, 2011 and the fiscal period ended June 30, 2010 | | 2011 | | 2011 | | 2010(1) | | |
| |
| Net Asset Value, Beginning of Period | | | $3.09 | | | | $3.09 | | | | $3.08 | | | |
| Income from Investment Operations: | | | | | | | | | | | | | | |
| Net investment income | | | .03 | | | | .07 | | | | .03 | | | |
| Net gain/(loss) on investments (both realized and unrealized) | | | (.03) | | | | .02 | | | | .01 | | | |
| Total from Investment Operations | | | – | | | | .09 | | | | .04 | | | |
| Less Distributions: | | | | | | | | | | | | | | |
| Dividends (from net investment income)* | | | (.03) | | | | (.07) | | | | (.03) | | | |
| Distributions (from capital gains)* | | | (.01) | | | | (.02) | | | | – | | | |
| Total Distributions | | | (.04) | | | | (.09) | | | | (.03) | | | |
| Net Asset Value, End of Period | | | $3.05 | | | | $3.09 | | | | $3.09 | | | |
| Total Return** | | | 0.00% | | | | 3.12% | | | | 1.21% | | | |
| Net Assets, End of Period (in thousands) | | | $205,964 | | | | $210,532 | | | | $227,147 | | | |
| Average Net Assets for the Period (in thousands) | | | $208,350 | | | | $221,970 | | | | $221,604 | | | |
Ratio of Gross Expenses to Average Net Assets***(4) | | | 0.66% | | | | 0.67% | | | | 0.67% | | | |
Ratio of Net Expenses to Average Net Assets***(4) | | | 0.66% | | | | 0.67% | | | | 0.67% | | | |
| Ratio of Net Investment Income to Average Net Assets*** | | | 2.20% | | | | 2.25% | | | | 2.42% | | | |
| Portfolio Turnover Rate*** | | | 94% | | | | 100% | | | | 50% | | | |
| | | |
| * | | See Note 5 in Notes to Financial Statements. |
| ** | | Total return not annualized for periods of less than one full year. |
| *** | | Annualized for periods of less than one full year. |
| (1) | | Period from February 16, 2010 (inception date) through June 30, 2010. |
| (2) | | Redemption fees aggregated less than $.01 on a per share basis. |
| (3) | | Impact on performance due to reimbursement from advisor was 0.51%. |
| (4) | | See Note 6 in Notes to Financial Statements. |
See Notes to Financial Statements.
Janus Fixed Income & Money Market Funds | 83
Financial Highlights - Fixed Income Funds (continued)
Class I Shares
| | | | | | | | | | | | | | | | | | | |
For a share outstanding during the six-month period ended December 31, 2011
| | | | | | | | | | |
(unaudited), the fiscal year ended June 30, 2011, the eight-month fiscal period
| | Janus Flexible Bond Fund | | |
| ended June 30, 2010 and the fiscal period ended October 31, 2009 | | 2011 | | 2011 | | 2010(1) | | 2009(2) | | |
| |
| Net Asset Value, Beginning of Period | | | $10.54 | | | | $10.70 | | | | $10.41 | | | | $9.97 | | | |
| Income from Investment Operations: | | | | | | | | | | | | | | | | | | |
| Net investment income | | | .19 | | | | .40 | | | | .30 | | | | .15 | | | |
| Net gain on investments (both realized and unrealized) | | | .16 | | | | .18 | | | | .35 | | | | .44 | | | |
| Total from Investment Operations | | | .35 | | | | .58 | | | | .65 | | | | .59 | | | |
| Less Distributions: | | | | | | | | | | | | | | | | | | |
| Dividends (from net investment income)* | | | (.20) | | | | (.40) | | | | (.30) | | | | (.15) | | | |
| Distributions (from capital gains)* | | | (.15) | | | | (.34) | | | | (.06) | | | | – | | | |
| Total Distributions | | | (.35) | | | | (.74) | | | | (.36) | | | | (.15) | | | |
| Net Asset Value, End of Period | | | $10.54 | | | | $10.54 | | | | $10.70 | | | | $10.41 | | | |
| Total Return** | | | 3.38% | | | | 5.62% | | | | 6.32% | | | | 5.96% | | | |
| Net Assets, End of Period (in thousands) | | | $1,593,444 | | | | $1,230,115 | | | | $767,784 | | | | $453,037 | | | |
| Average Net Assets for the Period (in thousands) | | | $1,400,483 | | | | $1,067,665 | | | | $609,814 | | | | $202,602 | | | |
Ratio of Gross Expenses to Average Net Assets***(3) | | | 0.54% | | | | 0.56% | | | | 0.55% | | | | 0.48% | | | |
Ratio of Net Expenses to Average Net Assets***(3) | | | 0.54% | | | | 0.56% | | | | 0.55% | | | | 0.48% | | | |
| Ratio of Net Investment Income to Average Net Assets*** | | | 3.55% | | | | 3.72% | | | | 4.24% | | | | 4.55% | | | |
| Portfolio Turnover Rate*** | | | 131% | | | | 147% | | | | 130% | | | | 215% | | | |
Class I Shares
| | | | | | | | | | | |
For a share outstanding during the six-month period ended December 31, 2011
| | Janus Global Bond Fund | | |
| (unaudited) and the fiscal period ended June 30, 2011 | | 2011 | | 2011(4) | | |
| |
| Net Asset Value, Beginning of Period | | | $10.34 | | | | $10.00 | | | |
| Income from Investment Operations: | | | | | | | | | | |
| Net investment income | | | .14 | | | | .19 | | | |
| Net gain on investments (both realized and unrealized) | | | .03 | | | | .31 | | | |
| Total from Investment Operations | | | .17 | | | | .50 | | | |
| Less Distributions: | | | | | | | | | | |
| Dividends (from net investment income)* | | | (.16) | | | | (.16) | | | |
| Distributions (from capital gains)* | | | (.08) | | | | – | | | |
| Total Distributions | | | (.24) | | | | (.16) | | | |
| Net Asset Value, End of Period | | | $10.27 | | | | $10.34 | | | |
| Total Return** | | | 1.57% | | | | 5.02% | | | |
| Net Assets, End of Period (in thousands) | | | $12,713 | | | | $10,464 | | | |
| Average Net Assets for the Period (in thousands) | | | $11,316 | | | | $7,863 | | | |
Ratio of Gross Expenses to Average Net Assets***(3) | | | 0.75% | | | | 0.77% | | | |
Ratio of Net Expenses to Average Net Assets***(3) | | | 0.75% | | | | 0.77% | | | |
| Ratio of Net Investment Income to Average Net Assets*** | | | 2.68% | | | | 3.06% | | | |
| Portfolio Turnover Rate*** | | | 258% | | | | 173% | | | |
| | | |
| * | | See Note 5 in Notes to Financial Statements. |
| ** | | Total return not annualized for periods of less than one full year. |
| *** | | Annualized for periods of less than one full year. |
| (1) | | Period from November 1, 2009 through June 30, 2010. The Fund changed its fiscal year end from October 31 to June 30. |
| (2) | | Period from July 6, 2009 (inception date) through October 31, 2009. |
| (3) | | See Note 6 in Notes to Financial Statements. |
| (4) | | Period from December 28, 2010 (inception date) through June 30, 2011. |
See Notes to Financial Statements.
84 | DECEMBER 31, 2011
Class I Shares
| | | | | | | | | | | | | | | | | | | |
For a share outstanding during the six-month period ended December 31, 2011
| | | | | | | | | | |
(unaudited), the fiscal year ended June 30, 2011, the eight-month fiscal period
| | Janus High-Yield Fund | | |
| ended June 30, 2010 and the fiscal period ended October 31, 2009 | | 2011 | | 2011 | | 2010(1) | | 2009(2) | | |
| |
| Net Asset Value, Beginning of Period | | | $9.13 | | | | $8.45 | | | | $8.28 | | | | $7.61 | | | |
| Income from Investment Operations: | | | | | | | | | | | | | | | | | | |
| Net investment income | | | .33 | | | | .67 | | | | .48 | | | | .28 | | | |
| Net gain/(loss) on investments (both realized and unrealized) | | | (.40) | | | | .68 | | | | .17 | | | | .67 | | | |
| Total from Investment Operations | | | (.07) | | | | 1.35 | | | | .65 | | | | .95 | | | |
| Less Distributions and Other: | | | | | | | | | | | | | | | | | | |
| Dividends (from net investment income)* | | | (.33) | | | | (.67) | | | | (.48) | | | | (.28) | | | |
| Distributions (from capital gains)* | | | – | | | | – | | | | – | | | | – | | | |
| Redemption fees | | | –(3) | | | | –(3) | | | | –(3) | | | | – | | | |
| Total Distributions and Other | | | (.33) | | | | (.67) | | | | (.48) | | | | (.28) | | | |
| Net Asset Value, End of Period | | | $8.73 | | | | $9.13 | | | | $8.45 | | | | $8.28 | | | |
| Total Return** | | | (0.69)% | | | | 16.35%(4) | | | | 7.98% | | | | 12.60% | | | |
| Net Assets, End of Period (in thousands) | | | $257,280 | | | | $174,961 | | | | $73,042 | | | | $22,052 | | | |
| Average Net Assets for the Period (in thousands) | | | $178,581 | | | | $178,564 | | | | $43,060 | | | | $14,845 | | | |
Ratio of Gross Expenses to Average Net Assets***(5) | | | 0.69% | | | | 0.70% | | | | 0.64% | | | | 0.66% | | | |
Ratio of Net Expenses to Average Net Assets***(5) | | | 0.69% | | | | 0.70% | | | | 0.64% | | | | 0.66% | | | |
| Ratio of Net Investment Income to Average Net Assets*** | | | 7.35% | | | | 7.43% | | | | 8.50% | | | | 10.33% | | | |
| Portfolio Turnover Rate*** | | | 51% | | | | 92% | | | | 91% | | | | 97% | | | |
Class I Shares
| | | | | | | | | | | | | | | | | | | |
For a share outstanding during the six-month period ended December 31, 2011
| | | | | | | | | | |
(unaudited), the fiscal year ended June 30, 2011, the eight-month fiscal period
| | Janus Short-Term Bond Fund | | |
| ended June 30, 2010 and the fiscal period ended October 31, 2009 | | 2011 | | 2011 | | 2010(1) | | 2009(2) | | |
| |
| Net Asset Value, Beginning of Period | | | $3.08 | | | | $3.09 | | | | $3.06 | | | | $3.01 | | | |
| Income from Investment Operations: | | | | | | | | | | | | | | | | | | |
| Net investment income | | | .04 | | | | .07 | | | | .06 | | | | .03 | | | |
| Net gain/(loss) on investments (both realized and unrealized) | | | (.02) | | | | .01 | | | | .02 | | | | .05 | | | |
| Total from Investment Operations | | | .02 | | | | .08 | | | | .08 | | | | .08 | | | |
| Less Distributions: | | | | | | | | | | | | | | | | | | |
| Dividends (from net investment income)* | | | (.04) | | | | (.07) | | | | (.05) | | | | (.03) | | | |
| Distributions (from capital gains)* | | | (.01) | | | | (.02) | | | | – | | | | – | | | |
| Total Distributions | | | (.05) | | | | (.09) | | | | (.05) | | | | (.03) | | | |
| Net Asset Value, End of Period | | | $3.05 | | | | $3.08 | | | | $3.09 | | | | $3.06 | | | |
| Total Return** | | | 0.39% | | | | 2.91% | | | | 2.82% | | | | 2.75% | | | |
| Net Assets, End of Period (in thousands) | | | $369,789 | | | | $543,799 | | | | $171,201 | | | | $69,785 | | | |
| Average Net Assets for the Period (in thousands) | | | $440,800 | | | | $350,062 | | | | $115,010 | | | | $8,399 | | | |
Ratio of Gross Expenses to Average Net Assets***(5) | | | 0.55% | | | | 0.56% | | | | 0.55% | | | | 0.59% | | | |
Ratio of Net Expenses to Average Net Assets***(5) | | | 0.55% | | | | 0.56% | | | | 0.55% | | | | 0.57% | | | |
| Ratio of Net Investment Income to Average Net Assets*** | | | 2.28% | | | | 2.39% | | | | 2.64% | | | | 2.85% | | | |
| Portfolio Turnover Rate*** | | | 94% | | | | 100% | | | | 50% | | | | 57% | | | |
| | | |
| * | | See Note 5 in Notes to Financial Statements. |
| ** | | Total return not annualized for periods of less than one full year. |
| *** | | Annualized for periods of less than one full year. |
| (1) | | Period from November 1, 2009 through June 30, 2010. The Fund changed its fiscal year end from October 31 to June 30. |
| (2) | | Period from July 6, 2009 (inception date) through October 31, 2009. |
| (3) | | Redemption fees aggregated less than $.01 on a per share basis. |
| (4) | | Impact on performance due to reimbursement from advisor was 0.51%. |
| (5) | | See Note 6 in Notes to Financial Statements. |
See Notes to Financial Statements.
Janus Fixed Income & Money Market Funds | 85
Financial Highlights - Fixed Income Funds (continued)
Class R Shares
| | | | | | | | | | | | | | | | | | | |
For a share outstanding during the six-month period ended December 31, 2011
| | | | | | | | | | |
(unaudited), the fiscal year ended June 30, 2011, the eight-month fiscal period
| | Janus Flexible Bond Fund | | |
| ended June 30, 2010 and the fiscal period ended October 31, 2009 | | 2011 | | 2011 | | 2010(1) | | 2009(2) | | |
| |
| Net Asset Value, Beginning of Period | | | $10.54 | | | | $10.70 | | | | $10.42 | | | | $9.97 | | | |
| Income from Investment Operations: | | | | | | | | | | | | | | | | | | |
| Net investment income | | | .16 | | | | .33 | | | | .25 | | | | .13 | | | |
| Net gain/(loss) on investments (both realized and unrealized) | | | .15 | | | | .18 | | | | .34 | | | | .45 | | | |
| Total from Investment Operations | | | .31 | | | | .51 | | | | .59 | | | | .58 | | | |
| Less Distributions: | | | | | | | | | | | | | | | | | | |
| Dividends (from net investment income)* | | | (.16) | | | | (.33) | | | | (.25) | | | | (.13) | | | |
| Distributions (from capital gains)* | | | (.15) | | | | (.34) | | | | (.06) | | | | – | | | |
| Total Distributions | | | (.31) | | | | (.67) | | | | (.31) | | | | (.13) | | | |
| Net Asset Value, End of Period | | | $10.54 | | | | $10.54 | | | | $10.70 | | | | $10.42 | | | |
| Total Return** | | | 3.04% | | | | 4.94% | | | | 5.76% | | | | 5.81% | | | |
| Net Assets, End of Period (in thousands) | | | $12,069 | | | | $9,585 | | | | $5,582 | | | | $3,120 | | | |
| Average Net Assets for the Period (in thousands) | | | $11,544 | | | | $7,906 | | | | $4,675 | | | | $2,700 | | | |
Ratio of Gross Expenses to Average Net Assets***(3) | | | 1.20% | | | | 1.20% | | | | 1.20% | | | | 1.25% | | | |
Ratio of Net Expenses to Average Net Assets***(3) | | | 1.20% | | | | 1.20% | | | | 1.20% | | | | 1.24% | | | |
| Ratio of Net Investment Income to Average Net Assets*** | | | 2.90% | | | | 3.06% | | | | 3.59% | | | | 3.83% | | | |
| Portfolio Turnover Rate*** | | | 131% | | | | 147% | | | | 130% | | | | 215% | | | |
Class R Shares
| | | | | | | | | | | | | | | | | | | |
For a share outstanding during the six-month period ended December 31, 2011
| | | | | | | | | | |
(unaudited), the fiscal year ended June 30, 2011, the eight-month fiscal period
| | Janus High-Yield Fund | | |
| ended June 30, 2010 and the fiscal period ended October 31, 2009 | | 2011 | | 2011 | | 2010(1) | | 2009(2) | | |
| |
| Net Asset Value, Beginning of Period | | | $9.13 | | �� | | $8.45 | | | | $8.28 | | | | $7.61 | | | |
| Income from Investment Operations: | | | | | | | | | | | | | | | | | | |
| Net investment income | | | .30 | | | | .61 | | | | .45 | | | | .26 | | | |
| Net gain/(loss) on investments (both realized and unrealized) | | | (.40) | | | | .68 | | | | .17 | | | | .67 | | | |
| Total from Investment Operations | | | (.10) | | | | 1.29 | | | | .62 | | | | .93 | | | |
| Less Distributions and Other: | | | | | | | | | | | | | | | | | | |
| Dividends (from net investment income)* | | | (.30) | | | | (.61) | | | | (.45) | | | | (.26) | | | |
| Distributions (from capital gains)* | | | – | | | | – | | | | – | | | | – | | | |
| Redemption fees | | | –(4) | | | | –(4) | | | | – | | | | – | | | |
| Total Distributions and Other | | | (.30) | | | | (.61) | | | | (.45) | | | | (.26) | | | |
| Net Asset Value, End of Period | | | $8.73 | | | | $9.13 | | | | $8.45 | | | | $8.28 | | | |
| Total Return** | | | (1.03)% | | | | 15.62%(5) | | | | 7.46% | | | | 12.33% | | | |
| Net Assets, End of Period (in thousands) | | | $896 | | | | $1,100 | | | | $876 | | | | $959 | | | |
| Average Net Assets for the Period (in thousands) | | | $1,121 | | | | $997 | | | | $1,095 | | | | $885 | | | |
Ratio of Gross Expenses to Average Net Assets***(3) | | | 1.37% | | | | 1.33% | | | | 1.37% | | | | 1.41% | | | |
Ratio of Net Expenses to Average Net Assets***(3) | | | 1.37% | | | | 1.33% | | | | 1.37% | | | | 1.41% | | | |
| Ratio of Net Investment Income to Average Net Assets*** | | | 6.66% | | | | 6.85% | | | | 7.88% | | | | 9.83% | | | |
| Portfolio Turnover Rate*** | | | 51% | | | | 92% | | | | 91% | | | | 97% | | | |
| | | |
| * | | See Note 5 in Notes to Financial Statements. |
| ** | | Total return not annualized for periods of less than one full year. |
| *** | | Annualized for periods of less than one full year. |
| (1) | | Period from November 1, 2009 through June 30, 2010. The Fund changed its fiscal year end from October 31 to June 30. |
| (2) | | Period from July 6, 2009 (inception date) through October 31, 2009. |
| (3) | | See Note 6 in Notes to Financial Statements. |
| (4) | | Redemption fees aggregated less than $.01 on a per share basis. |
| (5) | | Impact on performance due to reimbursement from advisor was 0.50%. |
See Notes to Financial Statements.
86 | DECEMBER 31, 2011
Class S Shares
| | | | | | | | | | | | | | | | | | | |
For a share outstanding during the six-month period ended December 31, 2011
| | | | | | | | | | |
(unaudited), the fiscal year ended June 30, 2011, the eight-month fiscal period
| | Janus Flexible Bond Fund | | |
| ended June 30, 2010 and the fiscal period ended October 31, 2009 | | 2011 | | 2011 | | 2010(1) | | 2009(2) | | |
| |
| Net Asset Value, Beginning of Period | | | $10.55 | | | | $10.71 | | | | $10.42 | | | | $9.97 | | | |
| Income from Investment Operations: | | | | | | | | | | | | | | | | | | |
| Net investment income | | | .17 | | | | .35 | | | | .27 | | | | .14 | | | |
| Net gain on investments (both realized and unrealized) | | | .16 | | | | .19 | | | | .35 | | | | .45 | | | |
| Total from Investment Operations | | | .33 | | | | .54 | | | | .62 | | | | .59 | | | |
| Less Distributions: | | | | | | | | | | | | | | | | | | |
| Dividends (from net investment income)* | | | (.18) | | | | (.36) | | | | (.27) | | | | (.14) | | | |
| Distributions (from capital gains)* | | | (.15) | | | | (.34) | | | | (.06) | | | | – | | | |
| Total Distributions | | | (.33) | | | | (.70) | | | | (.33) | | | | (.14) | | | |
| Net Asset Value, End of Period | | | $10.55 | | | | $10.55 | | | | $10.71 | | | | $10.42 | | | |
| Total Return** | | | 3.17% | | | | 5.21% | | | | 6.04% | | | | 5.89% | | | |
| Net Assets, End of Period (in thousands) | | | $66,393 | | | | $57,799 | | | | $61,541 | | | | $70,553 | | | |
| Average Net Assets for the Period (in thousands) | | | $63,270 | | | | $60,614 | | | | $66,480 | | | | $67,591 | | | |
Ratio of Gross Expenses to Average Net Assets***(3) | | | 0.95% | | | | 0.95% | | | | 0.95% | | | | 0.99% | | | |
Ratio of Net Expenses to Average Net Assets***(3) | | | 0.95% | | | | 0.95% | | | | 0.95% | | | | 0.99% | | | |
| Ratio of Net Investment Income to Average Net Assets*** | | | 3.16% | | | | 3.31% | | | | 3.87% | | | | 4.10% | | | |
| Portfolio Turnover Rate*** | | | 131% | | | | 147% | | | | 130% | | | | 215% | | | |
Class S Shares
| | �� | | | | | | | | | |
For a share outstanding during the six-month period ended December 31, 2011
| | Janus Global Bond Fund | | |
| (unaudited) and the fiscal period ended June 30, 2011 | | 2011 | | 2011(4) | | |
| |
| Net Asset Value, Beginning of Period | | | $10.36 | | | | $10.00 | | | |
| Income from Investment Operations: | | | | | | | | | | |
| Net investment income | | | .11 | | | | .20 | | | |
| Net gain on investments (both realized and unrealized) | | | .03 | | | | .29 | | | |
| Total from Investment Operations | | | .14 | | | | .49 | | | |
| Less Distributions: | | | | | | | | | | |
| Dividends (from net investment income)* | | | (.13) | | | | (.13) | | | |
| Distributions (from capital gains)* | | | (.08) | | | | – | | | |
| Total Distributions | | | (.21) | | | | (.13) | | | |
| Net Asset Value, End of Period | | | $10.29 | | | | $10.36 | | | |
| Total Return** | | | 1.31% | | | | 4.96% | | | |
| Net Assets, End of Period (in thousands) | | | $886 | | | | $875 | | | |
| Average Net Assets for the Period (in thousands) | | | $887 | | | | $851 | | | |
Ratio of Gross Expenses to Average Net Assets***(3) | | | 1.25% | | | | 0.86%(5) | | | |
Ratio of Net Expenses to Average Net Assets***(3) | | | 1.25% | | | | 0.86%(5) | | | |
| Ratio of Net Investment Income to Average Net Assets*** | | | 2.18% | | | | 2.97% | | | |
| Portfolio Turnover Rate*** | | | 258% | | | | 173% | | | |
| | | |
| * | | See Note 5 in Notes to Financial Statements. |
| ** | | Total return not annualized for periods of less than one full year. |
| *** | | Annualized for periods of less than one full year. |
| (1) | | Period from November 1, 2009 through June 30, 2010. The Fund changed its fiscal year end from October 31 to June 30. |
| (2) | | Period from July 6, 2009 (inception date) through October 31, 2009. |
| (3) | | See Note 6 in Notes to Financial Statements. |
| (4) | | Period from December 28, 2010 (inception date) through June 30, 2011. |
| (5) | | Pursuant to a contractual agreement, Janus waived certain fees and expenses during the period. The Ratio of Gross Expenses to Average Net Assets and Ratio of Net Expenses to Average Net Assets would be 1.27% and 1.27%, respectively, without the waiver of these fees and expenses. |
See Notes to Financial Statements.
Janus Fixed Income & Money Market Funds | 87
Financial Highlights - Fixed Income Funds (continued)
Class S Shares
| | | | | | | | | | | | | | | | | | | |
For a share outstanding during the six-month period ended December 31, 2011
| | | | | | | | | | |
(unaudited), the fiscal year ended June 30, 2011, the eight-month fiscal period
| | Janus High-Yield Fund | | |
| ended June 30, 2010 and the fiscal period ended October 31, 2009 | | 2011 | | 2011 | | 2010(1) | | 2009(2) | | |
| |
| Net Asset Value, Beginning of Period | | | $9.15 | | | | $8.47 | | | | $8.29 | | | | $7.61 | | | |
| Income from Investment Operations: | | | | | | | | | | | | | | | | | | |
| Net investment income | | | .31 | | | | .63 | | | | .46 | | | | .27 | | | |
| Net gain/(loss) on investments (both realized and unrealized) | | | (.40) | | | | .68 | | | | .17 | | | | .67 | | | |
| Total from Investment Operations | | | (.09) | | | | 1.31 | | | | .63 | | | | .94 | | | |
| Less Distributions and Other: | | | | | | | | | | | | | | | | | | |
| Dividends (from net investment income)* | | | (.31) | | | | (.63) | | | | (.45) | | | | (.27) | | | |
| Distributions (from capital gains)* | | | – | | | | – | | | | – | | | | – | | | |
| Redemption fees | | | –(3) | | | | –(3) | | | | –(3) | | | | .01 | | | |
| Total Distributions and Other | | | (.31) | | | | (.63) | | | | (.45) | | | | (.26) | | | |
| Net Asset Value, End of Period | | | $8.75 | | | | $9.15 | | | | $8.47 | | | | $8.29 | | | |
| Total Return** | | | (0.90)% | | | | 15.83%(4) | | | | 7.77% | | | | 12.55% | | | |
| Net Assets, End of Period (in thousands) | | | $5,589 | | | | $7,015 | | | | $6,354 | | | | $5,841 | | | |
| Average Net Assets for the Period (in thousands) | | | $5,837 | | | | $7,079 | | | | $6,774 | | | | $5,037 | | | |
Ratio of Gross Expenses to Average Net Assets***(5) | | | 1.12% | | | | 1.13% | | | | 1.12% | | | | 1.18% | | | |
Ratio of Net Expenses to Average Net Assets***(5) | | | 1.12% | | | | 1.13% | | | | 1.12% | | | | 1.18% | | | |
| Ratio of Net Investment Income to Average Net Assets*** | | | 6.88% | | | | 7.05% | | | | 8.12% | | | | 9.82% | | | |
| Portfolio Turnover Rate*** | | | 51% | | | | 92% | | | | 91% | | | | 97% | | | |
Class S Shares
| | | | | | | | | | | | | | | | | | | |
For a share outstanding during the six-month period ended December 31, 2011
| | | | | | | | | | |
(unaudited), the fiscal year ended June 30, 2011, the eight-month fiscal period
| | Janus Short-Term Bond Fund | | |
| ended June 30, 2010 and the fiscal period ended October 31, 2009 | | 2011 | | 2011 | | 2010(1) | | 2009(2) | | |
| |
| Net Asset Value, Beginning of Period | | | $3.08 | | | | $3.08 | | | | $3.06 | | | | $3.01 | | | |
| Income from Investment Operations: | | | | | | | | | | | | | | | | | | |
| Net investment income | | | .03 | | | | .06 | | | | .04 | | | | .03 | | | |
| Net gain/(loss) on investments (both realized and unrealized) | | | (.03) | | | | .02 | | | | .03 | | | | .05 | | | |
| Total from Investment Operations | | | – | | | | .08 | | | | .07 | | | | .08 | | | |
| Less Distributions: | | | | | | | | | | | | | | | | | | |
| Dividends (from net investment income)* | | | (.03) | | | | (.06) | | | | (.05) | | | | (.03) | | | |
| Distributions (from capital gains)* | | | (.01) | | | | (.02) | | | | – | | | | – | | | |
| Total Distributions | | | (.04) | | | | (.08) | | | | (.05) | | | | (.03) | | | |
| Net Asset Value, End of Period | | | $3.04 | | | | $3.08 | | | | $3.08 | | | | $3.06 | | | |
| Total Return** | | | (0.19)% | | | | 2.74% | | | | 2.16% | | | | 2.62% | | | |
| Net Assets, End of Period (in thousands) | | | $5,726 | | | | $5,692 | | | | $5,145 | | | | $4,549 | | | |
| Average Net Assets for the Period (in thousands) | | | $5,765 | | | | $5,172 | | | | $4,928 | | | | $2,543 | | | |
Ratio of Gross Expenses to Average Net Assets***(5) | | | 1.03% | | | | 1.03% | | | | 1.05% | | | | 1.07% | | | |
Ratio of Net Expenses to Average Net Assets***(5) | | | 1.03% | | | | 1.03% | | | | 1.05% | | | | 1.06% | | | |
| Ratio of Net Investment Income to Average Net Assets*** | | | 1.83% | | | | 1.90% | | | | 2.20% | | | | 2.59% | | | |
| Portfolio Turnover Rate*** | | | 94% | | | | 100% | | | | 50% | | | | 57% | | | |
| | | |
| * | | See Note 5 in Notes to Financial Statements. |
| ** | | Total return not annualized for periods of less than one full year. |
| *** | | Annualized for periods of less than one full year. |
| (1) | | Period from November 1, 2009 through June 30, 2010. The Fund changed its fiscal year end from October 31 to June 30. |
| (2) | | Period from July 6, 2009 (inception date) through October 31, 2009. |
| (3) | | Redemption fees aggregated less than $.01 on a per share basis. |
| (4) | | Impact on performance due to reimbursement from advisor was 0.50%. |
| (5) | | See Note 6 in Notes to Financial Statements. |
See Notes to Financial Statements.
88 | DECEMBER 31, 2011
Class T Shares
| | | | | | | | | | | | | | | | | | | | | | | | | | | | | | | |
For a share outstanding during the six-month period
| | | | | | | | | | | | | | | | |
ended December 31, 2011 (unaudited), the fiscal year
| | | | | | | | | | | | | | | | |
ended June 30, 2011, the eight-month fiscal period
| | | | | | | | | | | | | | | | |
ended June 30, 2010 and each fiscal year ended
| | Janus Flexible Bond Fund | | |
| October 31 | | 2011 | | 2011 | | 2010(1) | | 2009 | | 2008 | | 2007 | | 2006 | | |
| |
| Net Asset Value, Beginning of Period | | | $10.54 | | | | $10.70 | | | | $10.42 | | | | $9.09 | | | | $9.45 | | | | $9.42 | | | | $9.41 | | | |
| Income from Investment Operations: | | | | | | | | | | | | | | | | | | | | | | | | | | | | | | |
| Net investment income | | | .18 | | | | .38 | | | | .29 | | | | .43 | | | | .42 | | | | .46 | | | | .42 | | | |
| Net gain/(loss) on investments (both realized and unrealized) | | | .16 | | | | .18 | | | | .34 | | | | 1.33 | | | | (.36) | | | | .02 | | | | .02 | | | |
| Total from Investment Operations | | | .34 | | | | .56 | | | | .63 | | | | 1.76 | | | | .06 | | | | .48 | | | | .44 | | | |
| Less Distributions: | | | | | | | | | | | | | | | | | | | | | | | | | | | | | | |
| Dividends (from net investment income)* | | | (.19) | | | | (.38) | | | | (.29) | | | | (.43) | | | | (.42) | | | | (.45) | | | | (.43) | | | |
| Distributions (from capital gains)* | | | (.15) | | | | (.34) | | | | (.06) | | | | – | | | | – | | | | – | | | | – | | | |
| Total Distributions | | | (.34) | | | | (.72) | | | | (.35) | | | | (.43) | | | | (.42) | | | | (.45) | | | | (.43) | | | |
| Net Asset Value, End of Period | | | $10.54 | | | | $10.54 | | | | $10.70 | | | | $10.42 | | | | $9.09 | | | | $9.45 | | | | $9.42 | | | |
| Total Return** | | | 3.30% | | | | 5.47% | | | | 6.13% | | | | 19.74% | | | | 0.50% | | | | 5.27% | | | | 4.80% | | | |
| Net Assets, End of Period (in thousands) | | | $1,027,435 | | | | $794,629 | | | | $641,811 | | | | $1,086,604 | | | | $740,543 | | | | $759,576 | | | | $766,863 | | | |
| Average Net Assets for the Period (in thousands) | | | $902,460 | | | | $727,010 | | | | $831,851 | | | | $915,900 | | | | $855,399 | | | | $755,593 | | | | $827,407 | | | |
Ratio of Gross Expenses to Average Net Assets***(2) | | | 0.70% | | | | 0.70% | | | | 0.66% | | | | 0.73% | | | | 0.78% | | | | 0.80% | | | | 0.83% | | | |
Ratio of Net Expenses to Average Net Assets***(2) | | | 0.70% | | | | 0.70% | | | | 0.66% | | | | 0.73% | | | | 0.77% | | | | 0.80% | | | | 0.82% | | | |
| Ratio of Net Investment Income to Average Net Assets*** | | | 3.40% | | | | 3.56% | | | | 4.19% | | | | 4.34% | | | | 4.32% | | | | 4.81% | | | | 4.37% | | | |
| Portfolio Turnover Rate*** | | | 131% | | | | 147% | | | | 130% | | | | 215% | | | | 185% | | | | 140%(3) | | | | 144%(3) | | | |
Class T Shares
| | | | | | | | | | | |
For a share outstanding during the six-month period ended December 31, 2011 (unaudited)
| | Janus Global Bond Fund | | |
| and the fiscal period ended June 30, 2011 | | 2011 | | 2011(4) | | |
| |
| Net Asset Value, Beginning of Period | | | $10.35 | | | | $10.00 | | | |
| Income from Investment Operations: | | | | | | | | | | |
| Net investment income | | | .16 | | | | .16 | | | |
| Net gain/(loss) on investments (both realized and unrealized) | | | (.01) | | | | .34 | | | |
| Total from Investment Operations | | | .15 | | | | .50 | | | |
| Less Distributions: | | | | | | | | | | |
| Dividends (from net investment income)* | | | (.14) | | | | (.15) | | | |
| Distributions (from capital gains)* | | | (.08) | | | | – | | | |
| Total Distributions | | | (.22) | | | | (.15) | | | |
| Net Asset Value, End of Period | | | $10.28 | | | | $10.35 | | | |
| Total Return** | | | 1.44% | | | | 4.99% | | | |
| Net Assets, End of Period (in thousands) | | | $2,842 | | | | $8,808 | | | |
| Average Net Assets for the Period (in thousands) | | | $7,169 | | | | $1,739 | | | |
Ratio of Gross Expenses to Average Net Assets***(2) | | | 1.00% | | | | 0.68%(5) | | | |
Ratio of Net Expenses to Average Net Assets***(2) | | | 1.00% | | | | 0.68%(5) | | | |
| Ratio of Net Investment Income to Average Net Assets*** | | | 2.36% | | | | 2.92% | | | |
| Portfolio Turnover Rate*** | | | 258% | | | | 173% | | | |
| | | |
| * | | See Note 5 in Notes to Financial Statements. |
| ** | | Total return not annualized for periods of less than one full year. |
| *** | | Annualized for periods of less than one full year. |
| (1) | | Period from November 1, 2009 through June 30, 2010. The Fund changed its fiscal year end from October 31 to June 30. |
| (2) | | See Note 6 in Notes to Financial Statements. |
| (3) | | Excluding mortgage dollar roll transactions. If mortgage dollar roll transactions had been included, the portfolio turnover rate would have been 141% in 2007 and 147% in 2006. |
| (4) | | Period from December 28, 2010 (inception date) through June 30, 2011. |
| (5) | | Pursuant to a contractual agreement, Janus waived certain fees and expenses during the period. The Ratio of Gross Expenses to Average Net Assets and Ratio of Net Expenses to Average Net Assets would be 1.01% and 1.01%, respectively, without the waiver of these fees and expenses. |
See Notes to Financial Statements.
Janus Fixed Income & Money Market Funds | 89
Financial Highlights - Fixed Income Funds (continued)
Class T Shares
| | | | | | | | | | | | | | | | | | | | | | | | | | | | | | | |
For a share outstanding during the six-month period
| | | | | | | | | | | | | | | | |
ended December 31, 2011 (unaudited), the fiscal
| | | | | | | | | | | | | | | | |
year ended June 30, 2011, the eight-month fiscal
| | | | | | | | | | | | | | | | |
period ended June 30, 2010 and each fiscal year
| | Janus High-Yield Fund | | |
| ended October 31 | | 2011 | | 2011 | | 2010(1) | | 2009 | | 2008 | | 2007 | | 2006 | | |
| |
| Net Asset Value, Beginning of Period | | | $9.13 | | | | $8.45 | | | | $8.28 | | | | $6.94 | | | | $9.53 | | | | $9.69 | | | | $9.48 | | | |
| Income from Investment Operations: | | | | | | | | | | | | | | | | | | | | | | | | | | | | | | |
| Net investment income | | | .32 | | | | .65 | | | | .47 | | | | .93 | | | | .73 | | | | .73 | | | | .71 | | | |
| Net gain/(loss) on investments (both realized and unrealized) | | | (.40) | | | | .69 | | | | .17 | | | | 1.34 | | | | (2.59) | | | | (.16) | | | | .20 | | | |
| Total from Investment Operations | | | (.08) | | | | 1.34 | | | | .64 | | | | 2.27 | | | | (1.86) | | | | .57 | | | | .91 | | | |
| Less Distributions and Other: | | | | | | | | | | | | | | | | | | | | | | | | | | | | | | |
| Dividends (from net investment income)* | | | (.32) | | | | (.66) | | | | (.47) | | | | (.93) | | | | (.73) | | | | (.73) | | | | (.70) | | | |
| Distributions (from capital gains)* | | | – | | | | – | | | | – | | | | – | | | | – | | | | – | | | | – | | | |
| Redemption fees | | | –(2) | | | | –(2) | | | | –(2) | | | | –(2) | | | | –(2) | | | | –(2) | | | | –(2) | | | |
| Total Distributions and Other | | | (.32) | | | | (.66) | | | | (.47) | | | | (.93) | | | | (.73) | | | | (.73) | | | | (.70) | | | |
| Net Asset Value, End of Period | | | $8.73 | | | | $9.13 | | | | $8.45 | | | | $8.28 | | | | $6.94 | | | | $9.53 | | | | $9.69 | | | |
| Total Return** | | | (0.78)% | | | | 16.14%(3) | | | | 7.83% | | | | 35.34% | | | | (20.74)% | | | | 6.04% | | | | 10.00% | | | |
| Net Assets, End of Period (in thousands) | | | $1,074,061 | | | | $1,060,678 | | | | $707,010 | | | | $881,347 | | | | $381,290 | | | | $591,876 | | | | $511,619 | | | |
| Average Net Assets for the Period (in thousands) | | | $1,033,289 | | | | $875,192 | | | | $819,927 | | | | $574,291 | | | | $510,868 | | | | $579,507 | | | | $490,849 | | | |
Ratio of Gross Expenses to Average Net Assets***(4) | | | 0.87% | | | | 0.88% | | | | 0.86% | | | | 0.89% | | | | 0.90% | | | | 0.87% | | | | 0.91% | | | |
Ratio of Net Expenses to Average Net Assets***(4) | | | 0.87% | | | | 0.88% | | | | 0.86% | | | | 0.89% | | | | 0.89% | | | | 0.86% | | | | 0.90% | | | |
| Ratio of Net Investment Income to Average Net Assets*** | | | 7.15% | | | | 7.28% | | | | 8.42% | | | | 12.44% | | | | 8.26% | | | | 7.54% | | | | 7.37% | | | |
| Portfolio Turnover Rate*** | | | 51% | | | | 92% | | | | 91% | | | | 97% | | | | 109% | | | | 114% | | | | 119% | | | |
Class T Shares
| | | | | | | | | | | | | | | | | | | | | | | | | | | | | | | |
For a share outstanding during the six-month period
| | | | | | | | | | | | | | | | |
ended December 31, 2011 (unaudited), the fiscal
| | | | | | | | | | | | | | | | |
year ended June 30, 2011, the eight-month fiscal
| | | | | | | | | | | | | | | | |
period ended June 30, 2010 and each fiscal year
| | Janus Short-Term Bond Fund | | |
| ended October 31 | | 2011 | | 2011 | | 2010(1) | | 2009 | | 2008 | | 2007 | | 2006 | | |
| |
| Net Asset Value, Beginning of Period | | | $3.09 | | | | $3.09 | | | | $3.06 | | | | $2.87 | | | | $2.88 | | | | $2.88 | | | | $2.87 | | | |
| Income from Investment Operations: | | | | | | | | | | | | | | | | | | | | | | | | | | | | | | |
| Net investment income | | | .03 | | | | .07 | | | | .05 | | | | .10 | | | | .10 | | | | .13 | | | | .11 | | | |
| Net gain/(loss) on investments (both realized and unrealized) | | | (.03) | | | | .02 | | | | .03 | | | | .19 | | | | (.01) | | | | – | | | | .01 | | | |
| Total from Investment Operations | | | – | | | | .09 | | | | .08 | | | | .29 | | | | .09 | | | | .13 | | | | .12 | | | |
| Less Distributions: | | | | | | | | | | | | | | | | | | | | | | | | | | | | | | |
| Dividends (from net investment income)* | | | (.03) | | | | (.07) | | | | (.05) | | | | (.10) | | | | (.10) | | | | (.13) | | | | (.11) | | | |
| Distributions (from capital gains)* | | | (.01) | | | | (.02) | | | | – | | | | – | | | | – | | | | – | | | | – | | | |
| Total Distributions | | | (.04) | | | | (.09) | | | | (.05) | | | | (.10) | | | | (.10) | | | | (.13) | | | | (.11) | | | |
| Net Asset Value, End of Period | | | $3.05 | | | | $3.09 | | | | $3.09 | | | | $3.06 | | | | $2.87 | | | | $2.88 | | | | $2.88 | | | |
| Total Return** | | | (0.06)% | | | | 2.99% | | | | 2.68% | | | | 10.35% | | | | 3.24% | | | | 4.74% | | | | 4.08% | | | |
| Net Assets, End of Period (in thousands) | | | $1,863,910 | | | | $1,953,155 | | | | $1,956,871 | | | | $1,212,465 | | | | $231,823 | | | | $172,642 | | | | $175,258 | | | |
| Average Net Assets for the Period (in thousands) | | | $1,907,387 | | | | $1,950,013 | | | | $1,637,559 | | | | $588,441 | | | | $193,360 | | | | $172,326 | | | | $182,285 | | | |
Ratio of Gross Expenses to Average Net Assets***(4) | | | 0.78% | | | | 0.80% | | | | 0.79% | | | | 0.72% | | | | 0.65% | | | | 0.65% | | | | 0.65% | | | |
Ratio of Net Expenses to Average Net Assets***(4) | | | 0.78% | | | | 0.80% | | | | 0.79% | | | | 0.72% | | | | 0.64% | | | | 0.64% | | | | 0.64% | | | |
| Ratio of Net Investment Income to Average Net Assets*** | | | 2.08% | | | | 2.16% | | | | 2.44% | | | | 3.46% | | | | 3.51% | | | | 4.63% | | | | 3.65% | | | |
| Portfolio Turnover Rate*** | | | 94% | | | | 100% | | | | 50% | | | | 57% | | | | 127% | | | | 130% | | | | 120% | | | |
| | | |
| * | | See Note 5 in Notes to Financial Statements. |
| ** | | Total return not annualized for periods of less than one full year. |
| *** | | Annualized for periods of less than one full year. |
| (1) | | Period from November 1, 2009 through June 30, 2010. The Fund changed its fiscal year end from October 31 to June 30. |
| (2) | | Redemption fees aggregated less than $.01 on a per share basis. |
| (3) | | Impact on performance due to reimbursement from advisor was 0.51%. |
| (4) | | See Note 6 in Notes to Financial Statements. |
See Notes to Financial Statements.
90 | DECEMBER 31, 2011
Statements of Assets and Liabilities - Money Market Funds
| | | | | | | | | |
As of December 31, 2011 (unaudited)
| | Janus Government
| | Janus Money
|
| (all numbers in thousands except net asset value per share) | | Money Market Fund | | Market Fund |
|
| |
| Assets: | | | | | | | | |
| Investments at cost | | $ | 200,517 | | | $ | 1,309,048 | |
| Investments at value | | $ | 165,117 | | | $ | 912,248 | |
| Repurchase agreements(1) | | | 35,400 | | | | 396,800 | |
| Cash | | | 62 | | | | 136 | |
| Receivables: | | | | | | | | |
| Fund shares sold | | | 108 | | | | 6,216 | |
| Interest | | | 23 | | | | 127 | |
| Non-interested Trustees’ deferred compensation | | | 6 | | | | 39 | |
| Other assets | | | – | | | | – | |
| Total Assets | | | 200,716 | | | | 1,315,566 | |
| Liabilities: | | | | | | | | |
| Payables: | | | | | | | | |
| Fund shares repurchased | | | 235 | | | | 3,161 | |
| Dividends | | | 1 | | | | 11 | |
| Advisory fees | | | 17 | | | | 111 | |
| Administrative services fees | | | – | | | | 28 | |
| Non-interested Trustees’ fees and expenses | | | 4 | | | | 4 | |
| Non-interested Trustees’ deferred compensation fees | | | 6 | | | | 39 | |
| Accrued expenses and other payables | | | 56 | | | | 17 | |
| Total Liabilities | | | 319 | | | | 3,371 | |
| Net Assets | | $ | 200,397 | | | $ | 1,312,195 | |
| Net Assets Consist of: | | | | | | | | |
| Capital (par value and paid-in surplus)* | | $ | 200,412 | | | $ | 1,312,236 | |
| Undistributed net investment loss* | | | (15) | | | | (38) | |
| Undistributed net realized gain from investment and foreign currency transactions* | | | – | | | | – | |
| Unrealized net appreciation/(depreciation) of investments, foreign currency translations and non-interested Trustees’ deferred compensation | | | – | | | | (3) | |
| Total Net Assets | | $ | 200,397 | | | $ | 1,312,195 | |
| Net Assets - Class D Shares | | $ | 194,486 | | | $ | 1,150,150 | |
| Shares Outstanding, $0.01 Par Value (unlimited shares authorized) | | | 194,501 | | | | 1,150,180 | |
| Net Asset Value Per Share | | $ | 1.00 | | | $ | 1.00 | |
| Net Assets - Class T Shares | | $ | 5,911 | | | $ | 162,045 | |
| Shares Outstanding, $0.01 Par Value (unlimited shares authorized) | | | 5,911 | | | | 162,048 | |
| Net Asset Value Per Share | | $ | 1.00 | | | $ | 1.00 | |
| | | |
| * | | See Note 5 in Notes to Financial Statements. |
| (1) | | Includes cost of $35,400,000 and $396,800,000 for Janus Government Money Market Fund and Janus Money Market Fund, respectively. |
See Notes to Financial Statements.
Janus Fixed Income & Money Market Funds | 91
Statements of Operations - Money Market Funds
| | | | | | | | | |
For the six-month period ended December 31, 2011 (unaudited)
| | Janus Government
| | Janus
|
| (all numbers in thousands) | | Money Market Fund | | Money Market Fund |
|
| |
| Investment Income: | | | | | | | | |
| Interest | | $ | 171 | | | $ | 873 | |
| Total Investment Income | | | 171 | | | | 873 | |
| Expenses: | | | | | | | | |
| Advisory fees | | | 198 | | | | 1,308 | |
| Professional fees | | | 60 | | | | 27 | |
| Non-interested Trustees’ fees and expenses | | | 8 | | | | 30 | |
| Administrative services fees - Class D Shares | | | 451 | | | | 2,675 | |
| Administrative services fees - Class T Shares | | | 12 | | | | 392 | |
| Other expenses | | | – | | | | – | |
| Total Expenses | | | 729 | | | | 4,432 | |
| Less: Excess Expense Reimbursement | | | (561) | | | | (3,587) | |
| Net Expenses after Expense Reimbursement | | | 168 | | | | 845 | |
| Net Investment Income | | | 3 | | | | 28 | |
| Net Realized and Unrealized Gain/(Loss) on Investments: | | | | | | | | |
| Change in unrealized net appreciation/(depreciation) of non-interested Trustees’ deferred compensation | | | (1) | | | | (4) | |
| Net Loss on Investments | | | (1) | | | | (4) | |
| Net Increase in Net Assets Resulting from Operations | | $ | 2 | | | $ | 24 | |
See Notes to Financial Statements.
92 | DECEMBER 31, 2011
Statements of Changes in Net Assets - Money Market Funds
| | | | | | | | | | | | | | | | | |
| | | Janus Government
| | Janus Money
|
For the six-month period ended December 31, 2011 (unaudited) and the fiscal year ended June 30, 2011
| | Money Market Fund | | Market Fund |
| (all numbers in thousands) | | 2011 | | 2011 | | 2011 | | 2011 |
|
| |
| Operations: | | | | | | | | | | | | | | | | |
| Net investment income | | $ | 3 | | | $ | 8 | | | $ | 28 | | | $ | 60 | |
| Net realized gain from investment and foreign currency transactions | | | – | | | | 2 | | | | – | | | | 7 | |
| Change in unrealized net appreciation/(depreciation) of non-interested Trustees’ deferred compensation | | | (1) | | | | 1 | | | | (4) | | | | 6 | |
| Net Increase in Net Assets Resulting from Operations | | | 2 | | | | 11 | | | | 24 | | | | 73 | |
| Dividends and Distributions to Shareholders: | | | | | | | | | | | | | | | | |
| Net Investment Income* | | | | | | | | | | | | | | | | |
| Class D Shares | | | (2) | | | | (11) | | | | (22) | | | | (62) | |
| Class T Shares | | | – | | | | – | | | | (5) | | | | (13) | |
| Net Realized Gain/(Loss) from Investment Transactions* | | | | | | | | | | | | | | | | |
| Class D Shares | | | (2) | | | | – | | | | (6) | | | | – | |
| Class T Shares | | | – | | | | – | | | | (1) | | | | – | |
| Net Decrease from Dividends and Distributions | | | (4) | | | | (11) | | | | (34) | | | | (75) | |
| Capital Share Transactions: | | | | | | | | | | | | | | | | |
| Shares Sold | | | | | | | | | | | | | | | | |
| Class D Shares | | | 49,014 | | | | 81,476 | | | | 377,970 | | | | 566,926 | |
| Class T Shares | | | 2,557 | | | | 4,889 | | | | 46,599 | | | | 94,123 | |
| Reinvested Dividends and Distributions | | | | | | | | | | | | | | | | |
| Class D Shares | | | 4 | | | | 10 | | | | 22 | | | | 62 | |
| Class T Shares | | | – | | | | 4 | | | | 2 | | | | 34 | |
| Shares Repurchased | | | | | | | | | | | | | | | | |
| Class D Shares | | | (43,779) | | | | (103,984) | | | | (333,125) | | | | (698,689) | |
| Class T Shares | | | (2,377) | | | | (3,607) | | | | (49,104) | | | | (95,908) | |
| Net Increase/(Decrease) from Capital Share Transactions | | | 5,419 | | | | (21,212) | | | | 42,364 | | | | (133,452) | |
| Net Increase/(Decrease) in Net Assets | | | 5,417 | | | | (21,212) | | | | 42,354 | | | | (133,454) | |
| Net Assets: | | | | | | | | | | | | | | | | |
| Beginning of period | | | 194,980 | | | | 216,192 | | | | 1,269,841 | | | | 1,403,295 | |
| End of period | | $ | 200,397 | | | $ | 194,980 | | | $ | 1,312,195 | | | $ | 1,269,841 | |
| | | | | | | | | | | | | | | | | |
| Undistributed Net Investment Loss* | | $ | (15) | | | $ | (16) | | | $ | (38) | | | $ | (40) | |
| | | |
| * | | See Note 5 in Notes to Financial Statements. |
See Notes to Financial Statements.
Janus Fixed Income & Money Market Funds | 93
Financial Highlights - Money Market Funds
Class D Shares
| | | | | | | | | | | | | | | |
For a share outstanding during the six-month period ended December 31, 2011 (unaudited),
| | Janus Government Money Market Fund | | |
| the fiscal year ended June 30, 2011 and the fiscal period ended June 30, 2010 | | 2011 | | 2011 | | 2010(1) | | |
| |
| Net Asset Value, Beginning of Period | | | $1.00 | | | | $1.00 | | | | $1.00 | | | |
| Income from Investment Operations: | | | | | | | | | | | | | | |
| Net investment income | | | – | | | | – | | | | – | | | |
| Net gain on investments (both realized and unrealized) | | | – | | | | – | | | | – | | | |
| Total from Investment Operations | | | – | | | | – | | | | – | | | |
| Less Distributions: | | | | | | | | | | | | | | |
| Dividends (from net investment income)* | | | – | | | | – | | | | – | | | |
| Distributions (from capital gains)* | | | – | | | | – | | | | – | | | |
| Total Distributions | | | – | | | | – | | | | – | | | |
| Net Asset Value, End of Period | | | $1.00 | | | | $1.00 | | | | $1.00 | | | |
| Total Return** | | | 0.00% | | | | 0.00% | | | | 0.01% | | | |
| Net Assets, End of Period (in thousands) | | | $194,486 | | | | $189,249 | | | | $211,746 | | | |
| Average Net Assets for the Period (in thousands) | | | $195,057 | | | | $199,694 | | | | $209,798 | | | |
| Ratio of Gross Expenses to Average Net Assets*** | | | 0.17%(2) | | | | 0.23%(2) | | | | 0.26%(2) | | | |
| Ratio of Net Expenses to Average Net Assets*** | | | 0.17% | | | | 0.23% | | | | 0.26% | | | |
| Ratio of Net Investment Income/(Loss) to Average Net Assets*** | | | 0.00% | | | | 0.00% | | | | (0.03)% | | | |
Class D Shares
| | | | | | | | | | | | | | | |
For a share outstanding during the six-month period ended December 31, 2011
| | Janus Money Market Fund | | |
| (unaudited), the fiscal year ended June 30, 2011 and the fiscal period ended June 30, 2010 | | 2011 | | 2011 | | 2010(1) | | |
| |
| Net Asset Value, Beginning of Period | | | $1.00 | | | | $1.00 | | | | $1.00 | | | |
| Income from Investment Operations: | | | | | | | | | | | | | | |
| Net investment income | | | – | | | | – | | | | – | | | |
| Net gain on investments (both realized and unrealized) | | | – | | | | – | | | | – | | | |
| Total from Investment Operations | | | – | | | | – | | | | – | | | |
| Less Distributions: | | | | | | | | | | | | | | |
| Dividends (from net investment income)* | | | – | | | | – | | | | – | | | |
| Distributions (from capital gains)* | | | – | | | | – | | | | – | | | |
| Total Distributions | | | – | | | | – | | | | – | | | |
| Net Asset Value, End of Period | | | $1.00 | | | | $1.00 | | | | $1.00 | | | |
| Total Return** | | | 0.00% | | | | 0.01% | | | | 0.00% | | | |
| Net Assets, End of Period (in thousands) | | | $1,150,150 | | | | $1,105,288 | | | | $1,236,987 | | | |
| Average Net Assets for the Period (in thousands) | | | $1,156,478 | | | | $1,148,654 | | | | $1,244,263 | | | |
| Ratio of Gross Expenses to Average Net Assets*** | | | 0.13%(3) | | | | 0.22%(3) | | | | 0.24%(3) | | | |
| Ratio of Net Expenses to Average Net Assets*** | | | 0.13% | | | | 0.22% | | | | 0.24% | | | |
| Ratio of Net Investment Income/(Loss) to Average Net Assets*** | | | 0.00% | | | | 0.00% | | | | 0.01% | | | |
| | | |
| * | | See Note 5 in Notes to Financial Statements. |
| ** | | Total return not annualized for periods of less than one full year. |
| *** | | Annualized for periods of less than one full year. |
| (1) | | Period from February 16, 2010 (inception date) through June 30, 2010. |
| (2) | | The ratio was 0.72% during the six-month period ended December 31, 2011, 0.71% in 2011, and 0.68% in 2010 before waiver of certain fees incurred by the Fund. |
| (3) | | The ratio was 0.67% during the six-month period ended December 31, 2011, 0.67% in 2011, and 0.67% in 2010 before waiver of certain fees incurred by the Fund. |
See Notes to Financial Statements.
94 | DECEMBER 31, 2011
Class T Shares
| | | | | | | | | | | | | | | | | | | | | | | | | | | | | | | |
For a share outstanding during the six-month period ended
| | | | | | | | | | | | | | | | |
December 31, 2011 (unaudited), the fiscal year ended
| | | | | | | | | | | | | | | | |
June 30, 2011, the eight-month fiscal period ended
| | Janus Government Money Market Fund | | |
| June 30, 2010 and each fiscal year ended October 31 | | 2011 | | 2011 | | 2010(1) | | 2009 | | 2008 | | 2007 | | 2006 | | |
| |
| Net Asset Value, Beginning of Period | | | $1.00 | | | | $1.00 | | | | $1.00 | | | | $1.00 | | | | $1.00 | | | | $1.00 | | | | $1.00 | | | |
| Income from Investment Operations: | | | | | | | | | | | | | | | | | | | | | | | | | | | | | | |
| Net investment income | | | – | | | | – | | | | .01(2) | | | | – | | | | .02 | | | | .05 | | | | .04 | | | |
| Net gain/(loss) on investments (both realized and unrealized) | | | – | | | | – | | | | (.01)(2) | | | | – | | | | – | | | | – | | | | – | | | |
| Total from Investment Operations | | | – | | | | – | | | | – | | | | – | | | | .02 | | | | .05 | | | | .04 | | | |
| Less Distributions: | | | | | | | | | | | | | | | | | | | | | | | | | | | | | | |
| Dividends (from net investment income)* | | | – | | | | – | | | | – | | | | – | | | | (.02) | | | | (.05) | | | | (.04) | | | |
| Distributions (from capital gains)* | | | – | | | | – | | | | – | | | | – | | | | – | | | | – | | | | – | | | |
| Total Distributions | | | – | | | | – | | | | – | | | | – | | | | (.02) | | | | (.05) | | | | (.04) | | | |
| Net Asset Value, End of Period | | | $1.00 | | | | $1.00 | | | | $1.00 | | | | $1.00 | | | | $1.00 | | | | $1.00 | | | | $1.00 | | | |
| Total Return** | | | 0.00% | | | | 0.00% | | | | 0.02% | | | | 0.08% | | | | 2.46% | | | | 4.79% | | | | 4.31% | | | |
| Net Assets, End of Period (in thousands) | | | $5,911 | | | | $5,731 | | | | $4,446 | | | | $228,531 | | | | $312,248 | | | | $188,133 | | | | $176,188 | | | |
| Average Net Assets for the Period (in thousands) | | | $5,131 | | | | $4,596 | | | | $100,419 | | | | $273,901 | | | | $225,293 | | | | $177,655 | | | | $176,580 | | | |
| Ratio of Gross Expenses to Average Net Assets*** | | | 0.17%(3) | | | | 0.22%(3) | | | | 0.24%(3) | | | | 0.55%(3) | | | | 0.62%(3) | | | | 0.61%(3) | | | | 0.61%(3) | | | |
| Ratio of Net Expenses to Average Net Assets*** | | | 0.17% | | | | 0.22% | | | | 0.24% | | | | 0.55% | | | | 0.62% | | | | 0.61% | | | | 0.61% | | | |
| Ratio of Net Investment Income to Average Net Assets*** | | | 0.00% | | | | 0.00% | | | | 0.05% | | | | 0.10% | | | | 2.33% | | | | 4.69% | | | | 4.22% | | | |
Class T Shares
| | | | | | | | | | | | | | | | | | | | | | | | | | | | | | | |
For a share outstanding during the six-month period
| | | | | | | | | | | | | | | | |
ended December 31, 2011 (unaudited), the fiscal
| | | | | | | | | | | | | | | | |
year ended June 30, 2011, the eight-month fiscal
| | | | | | | | | | | | | | | | |
period ended June 30, 2010 and each fiscal year
| | Janus Money Market Fund | | |
| ended October 31 | | 2011 | | 2011 | | 2010(1) | | 2009 | | 2008 | | 2007 | | 2006 | | |
| |
| Net Asset Value, Beginning of Period | | | $1.00 | | | | $1.00 | | | | $1.00 | | | | $1.00 | | | | $1.00 | | | | $1.00 | | | | $1.00 | | | |
| Income from Investment Operations: | | | | | | | | | | | | | | | | | | | | | | | | | | | | | | |
| Net investment income | | | – | | | | – | | | | – | | | | – | | | | .03 | | | | .05 | | | | .04 | | | |
| Net gain/(loss) on investments (both realized and unrealized) | | | – | | | | – | | | | – | | | | – | | | | – | | | | – | | | | – | | | |
| Total from Investment Operations | | | – | | | | – | | | | – | | | | – | | | | .03 | | | | .05 | | | | .04 | | | |
| Less Distributions: | | | | | | | | | | | | | | | | | | | | | | | | | | | | | | |
| Dividends (from net investment income)* | | | – | | | | – | | | | – | | | | – | | | | (.03) | | | | (.05) | | | | (.04) | | | |
| Distributions (from capital gains)* | | | – | | | | – | | | | – | | | | – | | | | – | | | | – | | | | – | | | |
| Total Distributions | | | – | | | | – | | | | – | | | | – | | | | (.03) | | | | (.05) | | | | (.04) | | | |
| Net Asset Value, End of Period | | | $1.00 | | | | $1.00 | | | | $1.00 | | | | $1.00 | | | | $1.00 | | | | $1.00 | | | | $1.00 | | | |
| Total Return** | | | 0.00% | | | | 0.01% | | | | 0.00% | | | | 0.18% | | | | 2.76% | | | | 4.93% | | | | 4.39% | | | |
| Net Assets, End of Period (in thousands) | | | $162,045 | | | | $164,553 | | | | $166,308 | | | | $1,517,715 | | | | $1,983,438 | | | | $1,721,914 | | | | $1,412,927 | | | |
| Average Net Assets for the Period (in thousands) | | | $162,612 | | | | $163,660 | | | | $741,343 | | | | $1,785,483 | | | | $1,931,685 | | | | $1,577,950 | | | | $1,362,170 | | | |
| Ratio of Gross Expenses to Average Net Assets*** | | | 0.13%(4) | | | | 0.22%(4) | | | | 0.25%(4) | | | | 0.54%(4) | | | | 0.61%(4) | | | | 0.60%(4) | | | | 0.60%(4) | | | |
| Ratio of Net Expenses to Average Net Assets*** | | | 0.13% | | | | 0.22% | | | | 0.25% | | | | 0.54% | | | | 0.61% | | | | 0.60% | | | | 0.60% | | | |
| Ratio of Net Investment Income to Average Net Assets*** | | | 0.00% | | | | 0.00% | | | | 0.00% | | | | 0.20% | | | | 2.68% | | | | 4.82% | | | | 4.31% | | | |
| | | |
| * | | See Note 5 in Notes to Financial Statements. |
| ** | | Total return not annualized for periods of less than one full year. |
| *** | | Annualized for periods of less than one full year. |
| (1) | | Period from November 1, 2009 through June 30, 2010. The Fund changed its fiscal year end from October 31 to June 30. |
| (2) | | Due to decreased shares outstanding during the period, amounts shown for a share outstanding do not correspond with the aggregate net investment income and net gain/(loss) on investments. |
| (3) | | The ratio was 0.74% during the six-month period ended December 31, 2011, 0.74% in 2011, 0.72% in 2010, 0.73% in 2009, 0.72% in 2008, 0.71% in 2007, and 0.71% in 2006 before waiver of certain fees incurred by the Fund. |
| (4) | | The ratio was 0.69% during the six-month period ended December 31, 2011, 0.69% in 2011, 0.71% in 2010, 0.73% in 2009, 0.71% in 2008, 0.70% in 2007, and 0.70% in 2006 before waiver of certain fees incurred by the Fund. |
See Notes to Financial Statements.
Janus Fixed Income & Money Market Funds | 95
Notes to Schedules of Investments (unaudited)
| | |
| Barclays Capital 1-3 Year U.S. Government/Credit Index | | Composed of all bonds of investment grade with a maturity between one and three years. |
| |
| Barclays Capital Global Aggregate Bond Index | | Provides a broad-based measure of the global investment grade fixed-rate debt markets. It is comprised of the U.S. Aggregate, Pan-European Aggregate, and the Asian-Pacific Aggregate Indexes. It also includes a wide range of standard and customized subindices by liquidity constraint, sector, quality and maturity. |
| |
| Barclays Capital Global Aggregate Corporate Bond Index | | The corporate component of the Barclays Capital Global Aggregate Bond Index. |
| |
| Barclays Capital U.S. Aggregate Bond Index | | Made up of the Barclays Capital U.S. Government/Corporate Bond Index, Mortgage-Backed Securities Index, and Asset-Backed Securities Index, including securities that are of investment grade quality or better, have at least one year to maturity, and have an outstanding par value of at least $100 million. |
| |
| Barclays Capital U.S. Corporate High-Yield Bond Index | | Composed of fixed-rate, publicly issued, non-investment grade debt. |
| |
| Lipper Global Income Funds | | Funds that state in their prospectus that they invest primarily in U.S. dollar and non-U.S. dollar debt securities of issuers located in at least three countries, one of which may be the United States. |
| |
| Lipper High Current Yield Funds | | Funds that aim at high (relative) current yield from fixed income securities, have no quality or maturity restrictions, and tend to invest in lower grade debt issues. |
| |
| Lipper Intermediate Investment Grade Debt Funds | | Funds that invest primarily in investment grade debt issues (rated in the top four grades) with dollar-weighted average maturities of five to ten years. |
| |
| Lipper Short Investment Grade Debt Funds | | Funds that invest primarily in investment grade debt issues (rated in the top four grades) with dollar-weighted average maturities of less than three years. |
| |
| PLC | | Public Limited Company |
| |
| REIT | | Real Estate Investment Trust |
| |
| Section 4(2) | | Securities subject to legal and/or contractual restrictions on resale and may not be publicly sold without registration under the Securities Act of 1933, as amended. |
| |
| ULC | | Unlimited Liability Company |
| | | |
| ** | | A portion of this security has been segregated by the custodian to cover margin or segregation requirements on open futures contracts, forward currency contracts, options contracts, short sales, swap agreements, and/or securities with extended settlement dates. |
| ‡ | | Rate is subject to change. Rate shown reflects current rate. |
| ß | | Security is illiquid. |
§ Schedule of Restricted and Illiquid Securities (as of December 31, 2011)
| | | | | | | | | | | | | |
| | | Acquisition
| | Acquisition
| | | | Value as a
| | |
| | | Date | | Cost | | Value | | % of Net Assets | | |
| |
| |
Janus High-Yield Fund | | | | | | | | | | | | |
| Dole Food Automatic Exchange, 7.0000% | | 10/22/09 | | $ | 4,515,188 | | $ | 3,087,268 | | 0.2% | | |
| |
| |
The Fund has registration rights for certain restricted securities held as of December 31, 2011. The issuer incurs all registration costs.
96 | DECEMBER 31, 2011
| |
| 144A | Securities sold under Rule 144A of the Securities Act of 1933, as amended, are subject to legal and/or contractual restrictions on resale and may not be publicly sold without registration under the 1933 Act. These securities have been determined to be liquid under guidelines established by the Board of Trustees. The total value of 144A securities as of the period ended December 31, 2011 is indicated in the table below: |
| | | | | | | | | | | |
| | | | | | Value as a %
| | | |
| Fund | | Value | | | of Net Assets | | | |
| |
Fixed Income | | | | | | | | | | |
| Janus Flexible Bond Fund | | $ | 545,499,200 | | | | 12.6 | % | | |
| Janus Global Bond Fund | | | 3,103,672 | | | | 9.1 | % | | |
| Janus High-Yield Fund | | | 564,249,277 | | | | 29.3 | % | | |
| Janus Short-Term Bond Fund | | | 390,378,999 | | | | 13.5 | % | | |
| |
| |
The following is a summary of the inputs that were used to value the Funds’ investments in securities and other financial instruments as of December 31, 2011. See Notes to Financial Statements for more information.
Valuation Inputs Summary (as of December 31, 2011)
| | | | | | | | | | | | |
| | | | | Level 2 – Other Significant
| | Level 3 – Significant
| | |
| | | Level 1 – Quoted Prices | | Observable Inputs(a) | | Unobservable Inputs | | |
| |
Investments in Securities: | | | | | | | | | | | |
| Janus Flexible Bond Fund | | | | | | | | | | | |
Asset-Backed/Commercial Mortgage-Backed Securities | | $ | – | | $ | 109,336,650 | | $ | – | | |
| | | | | | | | | | | | |
| | | | | | | | | | | | |
Bank Loans | | | – | | | 25,352,981 | | | – | | |
| | | | | | | | | | | | |
| | | | | | | | | | | | |
Corporate Bonds | | | – | | | 2,618,937,761 | | | – | | |
| | | | | | | | | | | | |
| | | | | | | | | | | | |
Mortgage-Backed Securities | | | – | | | 627,347,039 | | | – | | |
| | | | | | | | | | | | |
| | | | | | | | | | | | |
Preferred Stock | | | – | | | 2,490,684 | | | – | | |
| | | | | | | | | | | | |
| | | | | | | | | | | | |
U.S. Treasury Notes/Bonds | | | – | | | 695,759,967 | | | – | | |
| | | | | | | | | | | | |
| | | | | | | | | | | | |
Money Market | | | – | | | 172,543,267 | | | – | | |
| | | | | | | | | | | | |
| | | | | | | | | | | | |
| Total Investments in Securities | | $ | – | | $ | 4,251,768,349 | | $ | – | | |
| |
| |
Investments in Securities: | | | | | | | | | | | |
| Janus Global Bond Fund | | | | | | | | | | | |
Asset-Backed/Commercial Mortgage-Backed Securities | | $ | – | | $ | 2,406,144 | | $ | – | | |
| | | | | | | | | | | | |
| | | | | | | | | | | | |
Bank Loan | | | – | | | 32,959 | | | – | | |
| | | | | | | | | | | | |
| | | | | | | | | | | | |
Corporate Bonds | | | – | | | 15,461,145 | | | – | | |
| | | | | | | | | | | | |
| | | | | | | | | | | | |
Foreign Government Bonds | | | – | | | 5,765,659 | | | – | | |
| | | | | | | | | | | | |
| | | | | | | | | | | | |
Mortgage-Backed Securities | | | – | | | 5,577,041 | | | – | | |
| | | | | | | | | | | | |
| | | | | | | | | | | | |
U.S. Treasury Notes/Bonds | | | – | | | 3,508,020 | | | – | | |
| | | | | | | | | | | | |
| | | | | | | | | | | | |
Money Market | | | – | | | 1,669,000 | | | – | | |
| | | | | | | | | | | | |
| | | | | | | | | | | | |
| Total Investments in Securities | | $ | – | | $ | 34,419,968 | | $ | – | | |
| |
| |
Investments in Securities: | | | | | | | | | | | |
| Janus High-Yield Fund | | | | | | | | | | | |
Bank Loans | | $ | – | | $ | 82,627,156 | | $ | – | | |
| | | | | | | | | | | | |
| | | | | | | | | | | | |
Corporate Bonds | | | – | | | 1,718,633,419 | | | – | | |
| | | | | | | | | | | | |
| | | | | | | | | | | | |
Preferred Stock | | | – | | | 22,887,984 | | | – | | |
| | | | | | | | | | | | |
| | | | | | | | | | | | |
Money Market | | | – | | | 73,519,843 | | | – | | |
| | | | | | | | | | | | |
| | | | | | | | | | | | |
| Total Investments in Securities | | $ | – | | $ | 1,897,668,402 | | $ | – | | |
| |
| |
Janus Fixed Income & Money Market Funds | 97
Notes to Schedules of Investments (unaudited) (continued)
| | | | | | | | | | | | |
| | | | | Level 2 – Other Significant
| | Level 3 – Significant
| | |
| | | Level 1 – Quoted Prices | | Observable Inputs(a) | | Unobservable Inputs | | |
| |
Investments in Securities: | | | | | | | | | | | |
| Janus Short-Term Bond Fund | | | | | | | | | | | |
Asset-Backed/Commercial Mortgage-Backed Securities | | $ | – | | $ | 53,031,818 | | $ | – | | |
| | | | | | | | | | | | |
| | | | | | | | | | | | |
Bank Loans | | | – | | | 73,634,094 | | | – | | |
| | | | | | | | | | | | |
| | | | | | | | | | | | |
Corporate Bonds | | | – | | | 2,184,970,945 | | | – | | |
| | | | | | | | | | | | |
| | | | | | | | | | | | |
U.S. Treasury Notes/Bonds | | | – | | | 443,498,035 | | | – | | |
| | | | | | | | | | | | |
| | | | | | | | | | | | |
Short-Term Taxable Variable Rate Demand Note | | | – | | | 1,060,000 | | | – | | |
| | | | | | | | | | | | |
| | | | | | | | | | | | |
Money Market | | | – | | | 121,421,154 | | | – | | |
| | | | | | | | | | | | |
| | | | | | | | | | | | |
| Total Investments in Securities | | $ | – | | $ | 2,877,616,046 | | $ | – | | |
| |
| |
Investments in Securities: | | | | | | | | | | | |
| Janus Government Money Market Fund | | | | | | | | | | | |
Repurchase Agreements | | $ | – | | $ | 35,400,000 | | $ | – | | |
| | | | | | | | | | | | |
| | | | | | | | | | | | |
U.S. Government Agency Notes | | | – | | | 78,601,822 | | | – | | |
| | | | | | | | | | | | |
| | | | | | | | | | | | |
Variable Rate Demand Agency Notes | | | – | | | 86,515,000 | | | – | | |
| | | | | | | | | | | | |
| | | | | | | | | | | | |
| Total Investments in Securities | | $ | – | | $ | 200,516,822 | | $ | – | | |
| |
| |
Investments in Securities: | | | | | | | | | | | |
| Janus Money Market Fund | | | | | | | | | | | |
Certificates of Deposit | | $ | – | | $ | 195,500,645 | | $ | – | | |
| | | | | | | | | | | | |
| | | | | | | | | | | | |
Commercial Paper | | | – | | | 128,986,782 | | | – | | |
| | | | | | | | | | | | |
| | | | | | | | | | | | |
Repurchase Agreements | | | – | | | 396,800,000 | | | – | | |
| | | | | | | | | | | | |
| | | | | | | | | | | | |
U.S. Government Agency Notes | | | – | | | 381,015,773 | | | – | | |
| | | | | | | | | | | | |
| | | | | | | | | | | | |
Variable Rate Demand Agency Notes | | | – | | | 206,745,000 | | | – | | |
| | | | | | | | | | | | |
| | | | | | | | | | | | |
| Total Investments in Securities | | $ | – | | $ | 1,309,048,200 | | $ | – | | |
| |
| |
Other Financial Instruments(b): | | | | | | | | | | | |
| Janus Global Bond Fund | | $ | – | | $ | 78,370 | | $ | – | | |
| |
| |
| | | |
| (a) | | Includes Fair Value Factors. |
| (b) | | Other financial instruments include futures, forward currency, written option, and swap contracts. Forward currency contracts and swap contracts are reported at their unrealized appreciation/(depreciation) at measurement date, which represents the change in the contract’s value from trade date. Futures are reported at their variation margin at measurement date, which represents the amount due to/from the Fund at that date. Options are reported at their market value at measurement date. |
Aggregate collateral segregated to cover margin or segregation requirements on open futures contracts, forward currency contracts, options contracts, short sales, swap agreements, and/or securities with extended settlement dates as of December 31, 2011 is noted below.
| | | | | | |
| Fund | | Aggregate Value | | |
| |
| |
Fixed Income | | | | | |
| Janus Flexible Bond Fund | | $ | 44,662,480 | | |
| Janus Global Bond Fund | | | 10,346,819 | | |
| Janus High-Yield Fund | | | 31,863,650 | | |
| |
| |
The interest rate on floating rate notes is based on an index or market interest rates and is subject to change. Rates in the security description are as of December 31, 2011.
Money market funds may hold securities with stated maturities of greater than 397 days when those securities have features that allow a fund to “put” back the security to the issuer or to a third party within 397 days of acquisition. The maturity dates shown in the security descriptions are the stated maturity dates.
Repurchase agreements held by a Fund are fully collateralized, and such collateral is in the possession of the Fund’s custodian or, for tri-party agreements, the custodian designated by the agreement. The collateral is evaluated daily to ensure its market value exceeds the current market value of the repurchase agreements, including accrued interest. In the event of default on the obligation to repurchase, the Fund has the right to liquidate the collateral and apply the proceeds in satisfaction of the obligation. In the event of default or bankruptcy by the other party to the agreement, realization and/or retention of the collateral or proceeds may be subject to legal proceedings.
98 | DECEMBER 31, 2011
Notes to Financial Statements (unaudited)
The following section describes the organization and significant accounting policies and provides more detailed information about the schedules and tables that appear throughout this report. In addition, the Notes to Financial Statements explain the methods used in preparing and presenting this report.
| |
| 1. | Organization and Significant Accounting Policies |
Janus Flexible Bond Fund, Janus Global Bond Fund, Janus High-Yield Fund and Janus Short-Term Bond Fund (collectively, the “Fixed Income Funds”) and Janus Money Market Fund and Janus Government Money Market Fund (collectively, the “Money Market Funds”) are series funds. The Fixed Income Funds and the Money Market Funds (individually, a “Fund” and collectively, the “Funds”) are part of Janus Investment Fund (the “Trust”), which is organized as a Massachusetts business trust and is registered under the Investment Company Act of 1940, as amended (the “1940 Act”), as an open-end management investment company. The financial statements include information for the six-month period ended December 31, 2011. The Trust offers forty-five funds which include multiple series of shares, with differing investment objectives and policies. The Fixed Income Funds invest primarily in income-producing securities. The Money Market Funds invest primarily in short-term money market securities. Each Fixed Income Fund in this report is classified as diversified, as defined in the 1940 Act.
Each Fixed Income Fund in this report offers multiple classes of shares in order to meet the needs of various types of investors. Each Money Market Fund offers only Class D Shares and Class T Shares. Each class represents an interest in the same portfolio of investments. Certain financial intermediaries may not offer all classes of shares.
Class A Shares and Class C Shares are generally offered through financial intermediary platforms including, but not limited to, traditional brokerage platforms, mutual fund wrap fee programs, bank trust platforms, and retirement platforms. The maximum purchase in Class C Shares is $500,000 for any single purchase.
Class D Shares are generally no longer being made available to new investors. The Shares are available only to investors who hold accounts directly with the Janus funds and to immediate family members or members of the same household of an eligible individual investor. The Shares are not offered through financial intermediaries.
Class I Shares are available through certain financial intermediary platforms including, but not limited to, mutual fund wrap fee programs, managed account programs, asset allocation programs, and bank trust platforms, as well as certain retirement platforms. Class I Shares are also available to certain institutional investors including, but not limited to, corporations, certain retirement plans, public plans, and foundations/endowments.
Class R Shares are offered through financial intermediary platforms including, but not limited to, retirement platforms.
Class S Shares are offered through financial intermediary platforms including, but not limited to, retirement platforms and asset allocation, mutual fund wrap, or other discretionary or nondiscretionary fee-based investment advisory programs. In addition, Class S Shares may be available through certain financial intermediaries who have an agreement with Janus Capital Management LLC (“Janus Capital”) or its affiliates to offer Class S Shares on their supermarket platforms.
Class T Shares are available through certain financial intermediary platforms including, but not limited to, mutual fund wrap fee programs, managed account programs, asset allocation programs, bank trust platforms, as well as certain retirement platforms. In addition, Class T Shares may be available through certain financial intermediaries who have an agreement with Janus Capital or its affiliates to offer Class T Shares on their supermarket platforms.
The following accounting policies have been followed by the Funds and are in conformity with accounting principles generally accepted in the United States of America within the investment management industry.
Investment Valuation
Securities are valued at the last sales price or the official closing price for securities traded on a principal securities exchange (U.S. or foreign) and on the NASDAQ National Market. Securities traded on over-the-counter (“OTC”) markets and listed securities for which no sales are reported are valued at the latest bid price (or yield equivalent thereof) obtained from one or more dealers transacting in a market for such securities or by a pricing service approved by the Funds’ Trustees. Short-term securities with maturities of 60 days or less may be valued at amortized cost, which approximates market value. Investments held by the Money Market Funds are valued utilizing the amortized cost method of valuation permitted in accordance with Rule 2a-7 under the 1940 Act and certain conditions therein. Under the amortized cost method, which does not take into account unrealized capital gains or losses, an instrument is initially valued at its cost and thereafter assumes a constant accretion/amortization to maturity of any discount or premium. Debt securities with a remaining maturity of greater than 60 days are valued in accordance with the evaluated bid price supplied by the pricing service. The evaluated bid price supplied by the pricing service is an evaluation that reflects such factors as security prices, yields, maturities
Janus Fixed Income & Money Market Funds | 99
Notes to Financial Statements (unaudited) (continued)
and ratings. Short positions shall be valued in accordance with the same methodologies, except that in the event that a last sale price is not available, the latest ask price shall be used instead of a bid price. Foreign securities and currencies are converted to U.S. dollars using the applicable exchange rate in effect as of the daily close of the New York Stock Exchange (“NYSE”). When market quotations are not readily available or deemed unreliable, or events or circumstances that may affect the value of portfolio securities held by the Funds are identified between the closing of their principal markets and the time the net asset value (“NAV”) is determined, securities may be valued at fair value as determined in good faith under procedures established by and under the supervision of the Funds’ Trustees. Circumstances in which fair value pricing may be utilized include, but are not limited to: (i) a significant event that may affect the securities of a single issuer, such as a merger, bankruptcy, or significant issuer specific development; (ii) an event that may affect an entire market, such as a natural disaster or significant governmental action; (iii) a nonsignificant event such as a market closing early or not opening, or a security trading halt; and (iv) pricing of a non-valued security and a restricted or non-public security. The Funds may use systematic fair valuation models provided by independent third parties to value international equity securities in order to adjust for stale pricing, which may occur between the close of certain foreign exchanges and the close of the NYSE. Restricted and illiquid securities are valued in accordance with procedures established by the Funds’ Trustees.
Investment Transactions and Investment Income
Investment transactions are accounted for as of the date purchased or sold (trade date). Dividend income is recorded on the ex-dividend date. Certain dividends from foreign securities will be recorded as soon as the Trust is informed of the dividend, if such information is obtained subsequent to the ex-dividend date. Dividends from foreign securities may be subject to withholding taxes in foreign jurisdictions. Interest income is recorded on the accrual basis and includes amortization of premiums and accretion of discounts. Gains and losses are determined on the identified cost basis, which is the same basis used for federal income tax purposes. Income, as well as gains and losses, both realized and unrealized, are allocated daily to each class of shares based upon the ratio of net assets represented by each class as a percentage of total net assets.
Expenses
Each Fund bears expenses incurred specifically on its behalf, as well as a portion of general expenses, which may be allocated pro rata to each Fund. Each class of shares bears expenses incurred specifically on its behalf and, in addition, each class bears a portion of general expenses, which are allocated daily to each class of shares based upon the ratio of net assets represented by each class as a percentage of total net assets. Expenses directly attributable to a specific class of shares are charged against the operations of such class.
Estimates
The preparation of financial statements in conformity with accounting principles generally accepted in the United States of America requires management to make estimates and assumptions that affect the reported amount of assets and liabilities and disclosure of contingent assets and liabilities at the date of the financial statements, and the reported amounts of income and expenses during the reporting period. Actual results could differ from those estimates.
Foreign Currency Translations
The Fixed Income Funds do not isolate that portion of the results of operations resulting from the effect of changes in foreign exchange rates on investments from the fluctuations arising from changes in market prices of securities held at the date of the financial statements. Net unrealized appreciation or depreciation of investments and foreign currency translations arise from changes in the value of assets and liabilities, including investments in securities held at the date of the financial statements, resulting from changes in the exchange rates and changes in market prices of securities held.
Currency gains and losses are also calculated on payables and receivables that are denominated in foreign currencies. The payables and receivables are generally related to foreign security transactions and income translations.
Foreign currency-denominated assets and forward currency contracts may involve more risks than domestic transactions, including currency risk, political and economic risk, regulatory risk and equity risk. Risks may arise from the potential inability of a counterparty to meet the terms of a contract and from unanticipated movements in the value of foreign currencies relative to the U.S. dollar.
Dividend Distributions
Dividends are declared daily and distributed monthly for the Funds. Realized capital gains, if any, are declared and distributed in December. The majority of dividends and net realized capital gains distributions from the Funds will be automatically reinvested into additional shares of that Fund, based on the discretion of the shareholder.
100 | DECEMBER 31, 2011
The Fixed Income Funds may make certain investments in real estate investment trusts (“REITs”) which pay dividends to their shareholders based upon funds available from operations. It is quite common for these dividends to exceed the REITs’ taxable earnings and profits, resulting in the excess portion of such dividends being designated as a return of capital. If the Funds distribute such amounts, such distributions could constitute a return of capital to shareholders for federal income tax purposes.
Federal Income Taxes
No provision for income taxes is included in the accompanying financial statements as the Funds intend to distribute to shareholders all taxable investment income and realized gains and otherwise comply with Subchapter M of the Internal Revenue Code applicable to regulated investment companies.
In accordance with the Financial Accounting Standards Board (“FASB”) guidance, the Funds adopted the provisions of “Income Taxes.” These provisions require an evaluation of tax positions taken (or expected to be taken) in the course of preparing a Fund’s tax return to determine whether these positions meet a “more-likely-than-not” standard that, based on the technical merits, have a more than fifty percent likelihood of being sustained by a taxing authority upon examination. A tax position that meets the “more-likely-than-not” recognition threshold is measured to determine the amount of benefit to recognize in the financial statements. The Funds recognize interest and penalties, if any, related to unrecognized tax benefits in income tax expense on the Statements of Operations.
These provisions require management of the Funds to analyze all open tax years, as defined by the Statute of Limitations, for all major jurisdictions, including federal tax authorities and certain state tax authorities. As of and during the period ended December 31, 2011, the Funds did not have a liability for any unrecognized tax benefits. The Funds have no examinations in progress and are not aware of any tax positions for which it is reasonably possible that the total amounts of unrecognized tax benefits will significantly change in the next twelve months.
On December 22, 2010, the Regulated Investment Company Modernization Act of 2010 (the “Modernization Act”) was signed by the President. The Modernization Act is the first major piece of legislation affecting Regulated Investment Companies (“RICs”) since 1986 and it modernizes several of the federal income and excise tax provisions related to RICs. Some of the enacted provisions include:
New capital losses may now be carried forward indefinitely, and retain the character of the original loss. Under pre-enactment law, capital losses could be carried forward for eight years, and carried forward as short-term capital, irrespective of the character of the original loss.
The Modernization Act contains simplification provisions, which are aimed at preventing disqualification of a RIC for “inadvertent” failures of the asset diversification and/or qualifying income tests. Additionally, the Modernization Act exempts RICs from the preferential dividend rule, and repeals the 60-day designation requirement for certain types of pay-through income and gains.
Finally, the Modernization Act contains several provisions aimed at preserving the character of distributions made by a fiscal year RIC during the portion of its taxable year ending after October 31 or December 31, reducing the circumstances under which a RIC might be required to file amended Forms 1099 to restate previously reported distributions.
Except for the simplification provisions related to RIC qualification, the Modernization Act is effective for taxable years beginning after December 22, 2010. The provisions related to RIC qualification are effective for taxable years for which the extended due date of the tax return is after December 22, 2010.
Valuation Inputs Summary
In accordance with FASB guidance, the Funds utilize the “Fair Value Measurements” to define fair value, establish a framework for measuring fair value, and expand disclosure requirements regarding fair value measurements. The Fair Value Measurement Standard does not require new fair value measurements, but is applied to the extent that other accounting pronouncements require or permit fair value measurements. This standard emphasizes that fair value is a market-based measurement that should be determined based on the assumptions that market participants would use in pricing an asset or liability. Various inputs are used in determining the value of the Funds’ investments defined pursuant to this standard. These inputs are summarized into three broad levels:
Level 1 – Quoted prices in active markets for identical securities.
Level 2 – Prices determined using other significant observable inputs. Observable inputs are inputs that reflect the assumptions market participants would use in pricing a security and are developed based on market data obtained from sources independent of the reporting entity. These may include quoted prices
Janus Fixed Income & Money Market Funds | 101
Notes to Financial Statements (unaudited) (continued)
for similar securities, interest rates, prepayment speeds, credit risk, and others.
Debt securities are valued in accordance with the evaluated bid price supplied by the pricing service and generally categorized as Level 2 in the hierarchy. Securities traded on OTC markets and listed securities for which no sales are reported are valued at the latest bid price (or yield equivalent thereof) obtained from one or more dealers transacting in a market for such securities or by a pricing service approved by the Funds’ Trustees and are categorized as Level 2 in the hierarchy. Short-term securities with maturities of 60 days or less are valued at amortized cost, which approximates market value and are categorized as Level 2 in the hierarchy. Periodic review and monitoring of the valuation of short-term securities is performed in an effort to ensure that amortized cost approximates market value. Other securities that are categorized as Level 2 in the hierarchy include, but are not limited to, preferred stocks, bank loans, American Depositary Receipts (ADRs), Global Depositary Receipts (GDRs), warrants, swaps, investments in mutual funds, OTC options, and forward contracts. The Funds may use systematic fair valuation models provided by independent third parties to value international equity securities in order to adjust for stale pricing, which may occur between the close of certain foreign exchanges and the close of the NYSE. These are generally categorized as Level 2 in the hierarchy.
Level 3 – Prices determined using significant unobservable inputs. In situations where quoted prices or observable inputs are unavailable or deemed less relevant (for example, when there is little or no market activity for an investment at the end of the period), unobservable inputs may be used. Unobservable inputs are inputs that reflect the reporting entity’s own assumptions about the factors market participants would use in pricing the security and would be based on the best information available under the circumstances.
For restricted equity securities and private placements where observable inputs are limited, assumptions about market activity and risk are used in employing valuation techniques such as the market approach, the income approach, or the cost approach, as defined under the FASB Guidance. These are categorized as Level 3 in the hierarchy.
There have been no significant changes in valuation techniques used in valuing any such positions held by the Funds since the beginning of the fiscal year.
The inputs or methodology used for valuing securities are not necessarily an indication of the risk associated with investing in those securities. The summary of inputs used as of December 31, 2011 to value the Funds’ investments in securities and other financial instruments is included in the “Valuation Inputs Summary” and “Level 3 Valuation Reconciliation of Assets” (if applicable) in the Notes to Schedules of Investments.
The Funds adopted FASB Accounting Standards Update “Fair Value Measurements and Disclosures” (the “Update”). This Update applies to a Fund’s disclosures about transfers in and out of Level 1 and Level 2 of the fair value hierarchy and the reasons for the transfers. Disclosures about the valuation techniques and inputs used to measure fair value for investments that fall in either Level 2 or Level 3 fair value hierarchy are summarized under the Level 2 and Level 3 categories listed above. There were no transfers between Level 1 and Level 2 of the fair value hierarchy during the period.
There were no Level 3 securities during the period.
The Funds recognize transfers between the levels as of the beginning of the fiscal year.
| |
| 2. | Derivative Instruments |
The Fixed Income Funds may invest in various types of derivatives, which may at times result in significant derivative exposure. A derivative is a financial instrument whose performance is derived from the performance of another asset. The Fixed Income Funds may invest in derivative instruments including, but not limited to: futures contracts, put options, call options, options on swap contracts, options on future contracts, options on foreign currencies, swaps, forward contracts, structured investments, and other equity-linked derivatives. Each derivative instrument that was held by one or more Fixed Income Funds during the period ended December 31, 2011 is discussed in further detail below. A summary of derivative activity by Fund is reflected in the tables at the end of this section.
The Fixed Income Funds may use derivative instruments for hedging (to offset risks associated with an investment, currency exposure, or market conditions) or for speculative (to seek to enhance returns) purposes. When the Fixed Income Funds invest in a derivative for speculative purposes, the Fixed Income Funds will be fully exposed to the risks of loss of that derivative, which may sometimes be greater than the cost of the derivative. The Fixed Income Funds may not use any derivative to gain exposure to an asset or class of assets prohibited by their investment restrictions from purchasing directly. The Fixed Income Funds’ ability to use derivative instruments may also be limited by tax considerations.
102 | DECEMBER 31, 2011
Investments in derivatives are generally subject to market risks that may cause their prices to fluctuate over time. Investments in derivatives may not directly correlate with the price movements of the underlying instrument. As a result, the use of derivatives may expose the Fixed Income Funds to additional risks that they would not be subject to if they invested directly in the securities underlying those derivatives. The use of derivatives may result in larger losses or smaller gains than otherwise would be the case. Derivatives can be volatile and may involve significant risks, including, but not limited to, counterparty risk, credit risk, currency risk, equity risk, index risk, interest rate risk, leverage risk, and liquidity risk.
Derivatives may generally be traded OTC or on an exchange. Derivatives traded OTC, such as options and structured notes, are agreements that are individually negotiated between parties and can be tailored to meet a purchaser’s needs.
OTC derivatives are not guaranteed by a clearing agency and may be subject to increased credit risk. In an effort to mitigate credit risk associated with derivatives traded OTC, the Fixed Income Funds may enter into collateral agreements with certain counterparties whereby, subject to certain minimum exposure requirements, a Fixed Income Fund may require the counterparty to post collateral if the Fixed Income Fund has a net aggregate unrealized gain on all OTC derivative contracts with a particular counterparty. There is no guarantee that counterparty exposure is reduced and these arrangements are dependent on Janus Capital’s ability to establish and maintain appropriate systems and trading.
In pursuit of their investment objectives, each Fund may seek to use derivatives to increase or decrease exposure to the following market risk factors:
| | |
| | • | Counterparty Risk – Counterparty risk is the risk that the counterparty (the party on the other side of the transaction) on a derivative transaction will be unable to honor its financial obligation to a Fund. |
| |
| | • | Credit Risk – Credit risk is the risk an issuer will be unable to make principal and interest payments when due, or will default on its obligations. |
| |
| | • | Currency Risk – Currency risk is the risk that changes in the exchange rate between currencies will adversely affect the value (in U.S. dollar terms) of an investment. |
| |
| | • | Equity Risk – Equity risk relates to the change in value of equity securities as they relate to increases or decreases in the general market. |
| |
| | • | Index Risk – If the derivative is linked to the performance of an index, it will be subject to the risks associated with changes in that index. If the index changes, a Fund could receive lower interest payments or experience a reduction in the value of the derivative to below what the Fund paid. Certain indexed securities, including inverse securities (which move in an opposite direction to the index), may create leverage, to the extent that they increase or decrease in value at a rate that is a multiple of the changes in the applicable index. |
| |
| | • | Interest Rate Risk – Interest rate risk is the risk that the value of fixed-income securities will generally decline as prevailing interest rates rise, which may cause a Fund’s NAV to likewise decrease, and vice versa. |
| |
| | • | Leverage Risk – Leverage risk is the risk associated with certain types of leveraged investments or trading strategies pursuant to which relatively small market movements may result in large changes in the value of an investment. A Fund creates leverage by using borrowed capital to increase the amount invested, or investing in instruments, including derivatives, where the investment loss can exceed the original amount invested. Certain investments or trading strategies that involve leverage can result in losses that greatly exceed the amount originally invested. |
| |
| | • | Liquidity Risk – Liquidity risk is the risk that certain securities may be difficult or impossible to sell at the time that the seller would like or at the price that the seller believes the security is currently worth. |
Forward Foreign Currency Exchange Contracts
A forward foreign currency exchange contract (“forward currency contract”) is a commitment to purchase or sell a foreign currency at a future date at a negotiated rate. The Fixed Income Funds may enter into forward currency contracts for hedging purposes, including, but not limited to, reducing exposure to changes in foreign currency exchange rates on foreign portfolio holdings and locking in the U.S. dollar cost of firm purchase and sale commitments for securities denominated in or exposed to foreign currencies. The Fixed Income Funds may also invest in forward currency contracts for nonhedging purposes such as seeking to enhance returns. The Fixed Income Funds are subject to currency risk in the normal course of pursuing their investment objectives through their investments in forward currency contracts.
The gain or loss arising from the difference between the U.S. dollar cost of the original contract and the value of the foreign currency in U.S. dollars upon closing a contract
Janus Fixed Income & Money Market Funds | 103
Notes to Financial Statements (unaudited) (continued)
is included in “Net realized gain/(loss) from investment and foreign currency transactions” on the Statements of Operations (if applicable).
Forward currency contracts held by the Fixed Income Funds are fully collateralized by other securities, which are denoted on the accompanying Schedules of Investments (if applicable). The collateral is evaluated daily to ensure its market value equals or exceeds the current market value of the corresponding forward currency contracts. Such collateral is in the possession of the Fixed Income Funds’ custodian.
Futures Contracts
A futures contract is an exchange-traded agreement to take or make delivery of an underlying asset at a specific time in the future for a specific predetermined negotiated price. The Fixed Income Funds may enter into futures contracts to gain exposure to the stock market pending investment of cash balances or to meet liquidity needs. The Funds are subject to interest rate risk, equity risk, and currency risk in the normal course of pursuing their investment objectives through their investments in futures contracts. The Funds may also use such derivative instruments to hedge or protect from adverse movements in securities prices, currency rates or interest rates. The use of futures contracts may involve risks such as the possibility of illiquid markets or imperfect correlation between the values of the contracts and the underlying securities, or that the counterparty will fail to perform its obligations.
Futures contracts are marked-to-market daily, and the daily variation margin is recorded as a receivable or payable on the Statements of Assets and Liabilities (if applicable). When a contract is closed, a realized gain or loss is recorded as “Net realized gain/(loss) from futures contracts” on the Statements of Operations (if applicable), equal to the difference between the opening and closing value of the contract. Generally, futures contracts are marked-to-market (i.e., treated as realized and subject to distribution) for federal income tax purposes at fiscal year-end. Securities held by the Fixed Income Funds that are designated as collateral for market value on futures contracts are noted on the Schedules of Investments (if applicable). Such collateral is in the possession of the Funds’ custodian or with the counterparty broker.
With futures, there is minimal counterparty credit risk to the Funds since futures are exchange-traded and the exchange’s clearinghouse, as counterparty to all exchange-traded futures, guarantees the futures against default.
In accordance with FASB guidance, the Funds adopted the provisions for “Derivatives and Hedging,” which require qualitative disclosures about objectives and strategies for using derivatives, quantitative disclosures about fair value amounts of and gains and losses on derivative instruments, and disclosures about credit-risk-related contingent features in derivative agreements.
The following tables, grouped by derivative type, provide information about the fair value and location of derivatives within the Statements of Assets and Liabilities as of December 31, 2011.
Fair Value of Derivative Instruments as of December 31, 2011
| | | | | | | | | | | | | |
Derivatives not accounted for as
| | Asset Derivatives | | | Liability Derivatives | |
| hedging instruments | | Statements of Assets and Liabilities Location | | Fair Value | | | Statements of Assets and Liabilities Location | | Fair Value | |
| |
| |
Janus Global Bond Fund | | | | | | | | | | | | |
| |
| |
| Foreign Exchange Contracts | | Forward currency contracts | | $ | 78,437 | | | Forward currency contracts | | $ | 67 | |
| |
| |
| Total | | | | $ | 78,437 | | | | | $ | 67 | |
| |
| |
The following tables provide information about the effect of derivatives and hedging activities on the Fund’s Statements of Operations for the period ended December 31, 2011.
The effect of Derivative Instruments on the Statement of Operations for the six-month period ended December 31, 2011
| | | | | | | | | | | | | | | | | | | | | |
| Amount of Realized Gain/(Loss) on Derivatives Recognized in Income | |
| | | | | | | | | | | | Forward Currency
| | | | |
| Derivatives not accounted for as hedging instruments | | Futures | | | Swaps | | | Options | | | Contracts | | | Total | |
| |
| |
Janus Global Bond Fund | | | | | | | | | | | | | | | | | | | | |
| |
| |
| Foreign Exchange Contracts | | $ | – | | | $ | – | | | $ | – | | | $ | 45,587 | | | $ | 45,587 | |
| |
| |
| Total | | $ | – | | | $ | – | | | $ | – | | | $ | 45,587 | | | $ | 45,587 | |
| |
| |
104 | DECEMBER 31, 2011
| | | | | | | | | | | | | | | | | | | | | |
| Change in Unrealized Appreciation/(Depreciation) on Derivatives Recognized in Income | |
| | | | | | | | | | | | Forward Currency
| | | | |
| Derivatives not accounted for as hedging instruments | | Futures | | | Swaps | | | Options | | | Contracts | | | Total | |
| |
| |
Janus Global Bond Fund | | | | | | | | | | | | | | | | | | | | |
| |
| |
| Foreign Exchange Contracts | | $ | – | | | $ | – | | | $ | – | | | $ | 80,896 | | | $ | 80,896 | |
| |
| |
| Total | | $ | – | | | $ | – | | | $ | – | | | $ | 80,896 | | | $ | 80,896 | |
| |
| |
Please see the Fund’s Statements of Operations for the Fund’s “Net Realized and Unrealized Gain/(Loss) on Investments.”
The value of derivative instruments at period end and the effect of derivatives on the Statements of Operations are indicative of the Fund’s volumes throughout the period.
| |
| 3. | Other investments and strategies |
Additional Investment Risk
The Fixed Income Funds may be invested in lower-rated debt securities that have a higher risk of default or loss of value since these securities may be sensitive to economic changes, political changes or adverse developments specific to the issuer.
It is important to note that events in both domestic and international equity and fixed-income markets have resulted, and may continue to result, in an unusually high degree of volatility in the markets, with issuers that have exposure to the real estate, mortgage, and credit markets particularly affected. These events and the resulting market upheavals may have an adverse effect on a Fund, such as a decline in the value and liquidity of many securities held by the Fund, unusually high and unanticipated levels of redemptions, an increase in portfolio turnover, a decrease in NAV, and an increase in Fund expenses. Because the situation is unprecedented and widespread, it may also be unusually difficult to identify both investment risks and opportunities, which could limit or preclude a Fund’s ability to achieve its investment objective. It is impossible to predict whether or for how long these conditions will continue. Therefore, it is important to understand that the value of your investment may fall, sometimes sharply, and you could lose money.
Further, the instability experienced in the financial markets has resulted in the U.S. Government and various other governmental and regulatory entities taking actions to address the financial crisis. These actions include, but are not limited to, the enactment of the Dodd-Frank Wall Street Reform and Consumer Protection Act (the “Dodd-Frank Act”) in July 2010 which is expected to dramatically change the way in which the U.S. financial system is supervised and regulated. More specifically, the Dodd-Frank Act provides for widespread regulation of financial institutions, consumer financial products and services, broker-dealers, over-the-counter derivatives, investment advisers, credit rating agencies, and mortgage lending, which expands federal oversight in the financial sector and may affect the investment management industry as a whole. Given the broad scope, sweeping nature, and the fact that many provisions of the Dodd-Frank Act must be implemented through future rulemaking, the ultimate impact of the Dodd-Frank Act, and any resulting regulation, is not yet certain. As a result, there can be no assurance that these government and regulatory measures will not have an adverse effect on the value or marketability of securities held by a Fund, including potentially limiting or completely restricting the ability of the Fund to use a particular investment instrument as part of its investment strategy, increasing the costs of using these instruments, or possibly making them less effective in general. Furthermore, no assurance can be made that the U.S. Government or any U.S. regulatory entity (or other authority or regulatory entity) will not continue to take further legislative or regulatory action in response to the economic crisis or otherwise, and the effect of such actions, if taken, cannot be known.
Certain areas of the world have historically been prone to and economically sensitive to environmental events such as, but not limited to, hurricanes, earthquakes, typhoons, flooding, tidal waves, tsunamis, erupting volcanoes, wildfires or droughts, tornadoes, mudslides, or other weather-related phenomena. Such disasters, and the resulting physical or economic damage, could have a severe and negative impact on a Fund’s investment portfolio and, in the longer term, could impair the ability of issuers in which the Fund invests to conduct their businesses as they would under normal conditions. Adverse weather conditions may also have a particularly significant negative effect on issuers in the agricultural sector and on insurance companies that insure against the impact of natural disasters.
Bank Loans
The Fixed Income Funds may invest in bank loans, which include institutionally traded floating rate securities generally acquired as an assignment from another holder of, or participation interest in, loans originated by a bank or financial institution (the “Lender”) that acts as agent for
Janus Fixed Income & Money Market Funds | 105
Notes to Financial Statements (unaudited) (continued)
all holders. The agent administers the terms of the loan, as specified in the loan agreement. When investing in a loan participation, a Fixed Income Fund has the right to receive payments of principal, interest and any fees to which it is entitled only from the Lender selling the loan agreement and only upon receipt by the Lender of payments from the borrower. The Fixed Income Funds generally have no right to enforce compliance with the terms of the loan agreement with the borrower. Assignments and participations involve credit, interest rate, and liquidity risk. Interest rates on floating rate securities adjust with general interest rate changes and/or issuer credit quality. The interest rates paid on a floating rate security in which the Fixed Income Funds invest generally are readjusted periodically to an increment over a designated benchmark rate, such as the one-month, three-month, six-month, or one-year London Interbank Offered Rate (“LIBOR”). LIBOR is a short-term interest rate that banks charge one another and is generally representative of the most competitive and current cash rates.
The Fixed Income Funds may have difficulty trading assignments and participations to third parties. There may be restrictions on transfer and only limited opportunities may exist to sell such securities in secondary markets. As a result, the Fixed Income Funds may be unable to sell assignments or participations at the desired time or may be able to sell only at a price less than fair market value. The Fixed Income Funds utilize an independent third party to value individual bank loans on a daily basis.
The average monthly value of borrowings outstanding under bank loan arrangements and the related rate range during the period ended December 31, 2011 is indicated in the table below:
| | | | | | | | | |
| | | Average Monthly
| | | | |
| Fund | | Value | | Rates | | |
| |
| |
Fixed Income | | | | | | | | |
| Janus Flexible Bond Fund | | $ | 49,765,811 | | | 2.9400% - 5.2500% | | |
| Janus Global Bond Fund | | | 45,610 | | | 4.5000% | | |
| Janus High-Yield Fund | | | 80,753,202 | | | 4.0000% - 11.5000% | | |
| Janus Short-Term Bond Fund | | | 93,995,815 | | | 1.4958% - 6.2500% | | |
| |
| |
Counterparties
Fund transactions involving a counterparty are subject to the risk that the counterparty or a third party will not fulfill its obligation to a Fund (“counterparty risk”). Counterparty risk may arise because of the counterparty’s financial condition (i.e., financial difficulties, bankruptcy, or insolvency), market activities and developments, or other reasons, whether foreseen or not. A counterparty’s inability to fulfill its obligation may result in significant financial loss to a Fund. A Fund may be unable to recover its investment from the counterparty or may obtain a limited recovery, and/or recovery may be delayed. The extent of a Fund’s exposure to counterparty risk in respect to financial assets approximates their carrying value as recorded on the Fund’s Statement of Assets and Liabilities.
A Fund may be exposed to counterparty risk through participation in various programs including, but not limited to, lending its securities to third parties, cash sweep arrangements whereby a Fund’s cash balance is invested in one or more types of cash management vehicles, as well as investments in, but not limited to, repurchase agreements, debt securities, and derivatives, including various types of swaps, futures and options. A Fund intends to enter into financial transactions with counterparties that Janus Capital believes to be creditworthy at the time of the transaction. There is always the risk that Janus Capital’s analysis of a counterparty’s creditworthiness is incorrect or may change due to market conditions. To the extent that a Fund focuses its transactions with a limited number of counterparties, it will have greater exposure to the risks associated with one or more counterparties.
Emerging Market Investing
Investing in emerging markets may involve certain risks and considerations not typically associated with investing in the United States and imposes risks greater than, or in addition to, the risks associated with investing in securities of more developed foreign countries. Emerging markets securities are exposed to a number of additional risks, which may result from less government supervision and regulation of business and industry practices (including the potential lack of strict finance and accounting controls and standards), stock exchanges, brokers, and listed companies, making these investments potentially more volatile in price and less liquid than investments in developed securities markets, resulting in greater risk to investors. In addition, the Fixed Income Funds’ investments may be denominated in foreign currencies and therefore, changes in the value of a country’s currency compared to the U.S. dollar may affect the value of the Fixed Income Funds’ investments. To the extent that a Fixed Income Fund invests a significant portion of its assets in the securities of issuers in or companies of a single country or region, it is more likely to be impacted by events or conditions affecting that country or region, which could have a negative impact on the Fixed Income Fund’s performance.
Exchange-Traded Funds
The Fixed Income Funds may invest in exchange-traded funds (“ETFs”) which generally are index-based investment companies that hold substantially all of their assets in securities representing their specific index. As a shareholder of another investment company, a Fixed
106 | DECEMBER 31, 2011
Income Fund would bear its pro rata portion of the other investment company’s expenses, including advisory fees, in addition to the expenses the Fund bears directly in connection with its own operations.
Exchange-Traded Notes
The Fixed Income Funds may invest directly in exchange-traded notes (“ETNs”), which are senior, unsecured, unsubordinated debt securities whose returns are linked to a particular index and provide exposure to the total returns of various market indices, including indices linked to stocks, bonds, commodities and currencies. This type of debt security differs from other types of bonds and notes. ETN returns are based upon the performance of a market index minus applicable fees; no periodic coupon payments are distributed and no principal protections exist. ETNs do not pay cash distributions. Instead, the value of dividends, interest, and investment gains are captured in a Fixed Income Fund’s total return. The Fixed Income Funds may invest in these securities when desiring exposure to debt securities or commodities. When evaluating ETNs for investment, Janus Capital will consider the potential risks involved, expected tax efficiency, rate of return, and credit risk. When the Fixed Income Funds invest in ETNs, they will bear their proportionate share of any fees and expenses borne by the ETN. There may be restrictions on the Fixed Income Funds’ right to redeem their investment in an ETN, which is meant to be held until maturity. The Fixed Income Funds’ decision to sell their ETN holdings may be limited by the availability of a secondary market.
Floating Rate Loans
The Fixed Income Funds may invest in floating rate loans. Floating rate loans are debt securities that have floating interest rates, which adjust periodically, and are tied to a benchmark lending rate, such as LIBOR. In other cases, the lending rate could be tied to the prime rate offered by one or more major U.S. banks or the rate paid on large certificates of deposit traded in the secondary markets. If the benchmark lending rate changes, the rate payable to lenders under the loan will change at the next scheduled adjustment date specified in the loan agreement. Floating rate loans are typically issued to companies (“borrowers”) in connection with recapitalizations, acquisitions, and refinancings. Floating rate loan investments are generally below investment grade. Senior floating rate loans are secured by specific collateral of a borrower and are senior in the borrower’s capital structure. The senior position in the borrower’s capital structure generally gives holders of senior loans a claim on certain of the borrower’s assets that is senior to subordinated debt and preferred and common stock in the case of a borrower’s default. Floating rate loan investments may involve foreign borrowers, and investments may be denominated in foreign currencies. Floating rate loans often involve borrowers whose financial condition is troubled or uncertain and companies that are highly leveraged. The Fixed Income Funds may invest in obligations of borrowers who are in bankruptcy proceedings. Floating rate loans may include fully funded term loans or revolving lines of credit.
Purchasers of floating rate loans may pay and/or receive certain fees. The Portfolio may receive fees such as covenant waiver fees or prepayment penalty fees. The Portfolio may pay fees such as facility fees. Such fees may affect the Portfolio’s return.
Initial Public Offerings
The Fixed Income Funds may invest in initial public offerings (“IPOs”). IPOs and other investment techniques may have a magnified performance impact on a Fixed Income Fund with a small asset base. The Fixed Income Funds may not experience similar performance as their assets grow.
Interfund Lending
As permitted by the Securities and Exchange Commission (“SEC”), or the 1940 Act and rules promulgated thereunder, the Funds may be party to interfund lending agreements between the Funds and other Janus Capital sponsored mutual funds and certain pooled investment vehicles, which permit them to borrow or lend cash at a rate beneficial to both the borrowing and lending funds. Outstanding borrowings from all sources totaling 10% or more of a borrowing Fund’s total assets must be collateralized at 102% of the outstanding principal value of the loan; loans of less than 10% may be unsecured.
Mortgage- and Asset-Backed Securities
The Funds may purchase fixed or variable rate mortgage-backed securities issued by the Government National Mortgage Association (“Ginnie Mae”), the Federal National Mortgage Association (“Fannie Mae”), the Federal Home Loan Mortgage Corporation (“Freddie Mac”), or other governmental or government-related entities. Historically, Fannie Maes and Freddie Macs were not backed by the full faith and credit of the U.S. Government, and may not be in the future. In September 2008, the Federal Housing Finance Agency (“FHFA”), an agency of the U.S. Government, placed Fannie Mae and Freddie Mac under conservatorship to provide stability in the financial markets, mortgage availability and taxpayer protection by preserving Fannie Mae’s and Freddie Mac’s assets, and placing them in a sound and solvent condition. Under the conservatorship, the management of Fannie Mae and Freddie Mac was replaced. The effect that the FHFA’s conservatorship will have on Fannie Mae’s and Freddie Mac’s debt and equities is unclear. The Funds may
Janus Fixed Income & Money Market Funds | 107
Notes to Financial Statements (unaudited) (continued)
purchase other mortgage- and asset-backed securities through single- and multi-seller conduits, collateralized debt obligations, structured investment vehicles, and other similar securities. Asset-backed securities may be backed by automobile loans, equipment leases, credit card receivables, or other collateral. In the event the underlying securities fail to perform, these investment vehicles could be forced to sell the assets and recognize losses on such assets, which could impact the Funds’ yield and your return.
Unlike traditional debt instruments, payments on these securities include both interest and a partial payment of principal. Prepayment risk, which results from prepayments of the principal of underlying loans at a faster pace than expected, may shorten the effective maturities of these securities and may result in the Fund having to reinvest proceeds at a lower interest rate. In addition to prepayment risk, investments in mortgage-backed securities, including those comprised of subprime mortgages, and investments in other asset-backed securities comprised of under-performing assets may be subject to a higher degree of credit risk, valuation risk, and liquidity risk. Additionally, although mortgages and mortgage-related securities are generally supported by some form of government or private guarantee and/or insurance, there is no assurance that private guarantors or insurers will meet their obligations.
Mortgage- and asset-backed securities are also subject to extension risk, which is the risk that rising interest rates could cause mortgages or other obligations underlying these securities to be paid more slowly than expected, increasing the Funds’ sensitivity to interest rate changes and causing its price to decline.
Real Estate Investing
The Fixed Income Funds may invest in debt securities of U.S. real estate-related companies. Such companies may include those in the real estate industry or real estate-related industries. These securities may include corporate bonds, preferred stocks, and other securities, including, but not limited to, REITs and similar REIT-like entities such as foreign entities that have REIT characteristics.
Restricted Security Transactions
Restricted securities held by the Funds may not be sold except in exempt transactions or in a public offering registered under the Securities Act of 1933, as amended. The risk of investing in such securities is generally greater than the risk of investing in the securities of widely held, publicly traded companies. Lack of a secondary market and resale restrictions may result in the inability of the Funds to sell a security at a fair price and may substantially delay the sale of the security. In addition, these securities may exhibit greater price volatility than securities for which secondary markets exist.
Securities Lending
Under procedures adopted by the Trustees, the Funds may seek to earn additional income through lending their securities to certain qualified broker-dealers and institutions on a short-term or long-term basis. The Funds may lend portfolio securities on a short-term or long-term basis, in an amount equal to up to 1/3 of their total assets as determined at the time of the loan origination. When the Funds lend their securities, they receive collateral (including cash collateral), at least equal to the value of securities loaned. The Funds may earn income by investing this collateral in one or more affiliated or nonaffiliated cash management vehicles. It is also possible that, due to a decline in the value of a cash management vehicle, the Funds may lose money. There is also the risk that when portfolio securities are lent, the securities may not be returned on a timely basis, and the Funds may experience delays and costs in recovering the security or gaining access to the collateral provided to the Funds to collateralize the loan. If the Funds are unable to recover a security on loan, the Funds may use the collateral to purchase replacement securities in the market. There is a risk that the value of the collateral could decrease below the cost of the replacement security by the time the replacement investment is made, resulting in a loss to the Funds. Janus Capital intends to manage the cash collateral in an affiliated cash management vehicle and will receive an investment advisory fee for managing such assets.
The borrower pays fees at the Funds’ direction to Deutsche Bank AG (the “Lending Agent”). The Lending Agent may retain a portion of the interest earned on the cash collateral invested. The cash collateral invested by the Lending Agent is disclosed on the Schedules of Investments (if applicable). The lending fees and the Funds’ portion of the interest income earned on cash collateral are included on the Statements of Operations (if applicable).
The Funds did not have any securities on loan during the period ended December 31, 2011.
Sovereign Debt
Investments in foreign government debt securities (“sovereign debt”) can involve a high degree of risk including the risk that the governmental entity that controls the repayment of sovereign debt may not be willing or able to repay the principal and/or to pay the interest on its sovereign debt in a timely manner. A sovereign debtor’s willingness or ability to satisfy its debt obligation may be affected by various factors including its
108 | DECEMBER 31, 2011
cash flow situation, the extent of its foreign currency reserves, the availability of foreign exchange when a payment is due, the relative size of its debt position in relation to its economy as a whole, the sovereign debtor’s policy toward international lenders, and local political constraints to which the governmental entity may be subject. Sovereign debtors may also be dependent on expected disbursements from foreign governments, multilateral agencies, and other entities. The failure of a sovereign debtor to implement economic reforms, achieve specified levels of economic performance, or repay principal or interest when due may result in the cancellation of third party commitments to lend funds to the sovereign debtor, which may further impair such debtor’s ability or willingness to timely service its debts. A Fund may be requested to participate in the rescheduling of such sovereign debt and to extend further loans to governmental entities which may adversely affect the Fund’s holdings. In the event of default, there may be limited or no legal remedies for collecting sovereign debt and there may be no bankruptcy proceedings through which the Fund may collect all or part of the sovereign debt that a governmental entity has not repaid.
| |
| 4. | Investment Advisory Agreements and Other Transactions with Affiliates |
Each Fund pays Janus Capital an investment advisory fee which is calculated daily and paid monthly. The following table reflects each Fund’s contractual investment advisory fee rate (expressed as an annual rate).
| | | | | | | | | |
| | | | | Contractual
| | |
| | | | | Investment
| | |
| | | Average
| | Advisory
| | |
| | | Daily Net Assets
| | Fee (%)
| | |
| Fund | | of the Fund | | (annual rate) | | |
| |
| |
Fixed Income | | | | | | | | |
| Janus Flexible Bond Fund | | First $ | 300 Million | | | 0.50 | | |
| | | Over $ | 300 Million | | | 0.40 | | |
| Janus Global Bond Fund | | First $ | 1 Billion | | | 0.60 | | |
| | | Next $ | 1 Billion | | | 0.55 | | |
| | | Over $ | 2 Billion | | | 0.50 | | |
| Janus High-Yield Fund | | First $ | 300 Million | | | 0.65 | | |
| | | Over $ | 300 Million | | | 0.55 | | |
| Janus Short-Term Bond Fund | | First $ | 300 Million | | | 0.64 | | |
| | | Over $ | 300 Million | | | 0.54 | | |
Money Market | | | | | | | | |
Janus Government Money
Market Fund | | | All Asset Levels | | | 0.20 | | |
| Janus Money Market Fund | | | All Asset Levels | | | 0.20 | | |
| |
| |
Janus Capital has agreed to waive one-half of each Money Market Fund’s advisory fees. Such waiver is voluntary and could change or be terminated at any time at the discretion of Janus Capital. Janus Capital may also voluntarily waive additional fees to the extent necessary to assist the Money Market Funds in attempting to maintain a yield of at least 0.00%. These reimbursements are voluntary and could change or be terminated at any time at the discretion of Janus Capital. In addition, the Money Market Funds pay Janus Capital an administration fee. Prior to February 16, 2010, this fee was 0.50% of average daily net assets. Effective February 16, 2010, Class D Shares of each Fund will compensate Janus Capital at an annual rate of 0.46% and Class T Shares of each Fund will compensate Janus Capital at an annual rate of 0.48%. The Money Market Funds pay those expenses not assumed by Janus Capital. The expenses not assumed by Janus Capital include interest and taxes, fees and expenses of Trustees who are not interested persons of Janus Capital, audit fees and expenses, and extraordinary expenses.
Janus Services LLC (“Janus Services”), a wholly-owned subsidiary of Janus Capital, is the Funds’ transfer agent. In addition, Janus Services provides or arranges for the provision of certain other administrative services including, but not limited to, recordkeeping, accounting, order processing, and other shareholder services for the Funds.
Certain, but not all, intermediaries may charge administrative fees to investors in Class A Shares, Class C Shares, and Class I Shares of the Fixed Income Funds for administrative services provided on behalf of such investors. These administrative fees are paid by the Class A Shares, Class C Shares, and Class I Shares of the Funds to Janus Services, which uses such fees to reimburse intermediaries. Consistent with the Transfer Agency Agreement between Janus Services and the Funds, Janus Services may negotiate the level, structure, and/or terms of the administrative fees with intermediaries requiring such fees on behalf of the Funds. Janus Capital and its affiliates benefit from an increase in assets that may result from such relationships.
Class D Shares pay an annual administrative services fee of 0.12% of net assets. These administrative services fees are paid by the Shares of each Fund for shareholder services provided by Janus Services.
Janus Services receives an administrative services fee at an annual rate of 0.25% of the average daily net assets of Class R Shares, Class S Shares and Class T Shares of the Fixed Income Funds for providing or procuring administrative services to investors in Class R Shares, Class S Shares and Class T Shares of the Funds. Janus Services expects to use all or a significant portion of this fee to compensate retirement plan service providers, broker-dealers, bank trust departments, financial advisors, and other financial intermediaries for providing these services. Janus Services or its affiliates may also pay fees for services provided by intermediaries to the extent the fees charged by intermediaries exceed the 0.25% of net
Janus Fixed Income & Money Market Funds | 109
Notes to Financial Statements (unaudited) (continued)
assets charged to Class R Shares, Class S Shares, and Class T Shares of each Fund.
Services provided by these financial intermediaries may include, but are not limited to, recordkeeping, subaccounting, order processing, providing periodic statements, forwarding prospectuses, shareholder reports, and other materials to existing customers and other administrative services. Order processing includes the submission of transactions through the National Securities Clearing Corporation (“NSCC”) or similar systems, or those processed on a manual basis with Janus Capital.
Janus Distributors LLC (“Janus Distributors”), a wholly-owned subsidiary of Janus Capital, is the distributor of the Funds. The Funds have adopted a Distribution and Shareholder Servicing Plan (the “Plan”) pursuant to Rule 12b-1 under the 1940 Act. The Plan authorizes payments by the Fixed Income Funds at an annual rate, as determined from time to time by the Board of Trustees, of up to 0.25% of the Class A Shares average daily net assets, of up to 1.00% of the Class C Shares average daily net assets, of up to 0.50% of the Class R Shares average daily net assets, and of up to 0.25% of the Class S Shares average daily net assets. Payments under the Plan are not tied exclusively to actual distribution and shareholder service expenses, and the payments may exceed distribution and shareholder service expenses actually incurred by the Funds. If any of a Fund’s actual distribution and shareholder service expenses incurred during a calendar year are less than the payments made during a calendar year, the Fund will be refunded the difference. Refunds, if any, are included in “Distribution fees and shareholder servicing fees” in the Statements of Operations.
Janus Capital has agreed to reimburse the Fixed Income Funds until at least November 1, 2012 by the amount, if any, that such Fund’s normal operating expenses in any fiscal year, including the investment advisory fee, but excluding any class-specific distribution and shareholder servicing fees applicable to Class A Shares, Class C Shares, Class R Shares, and Class S Shares, the administrative services fees payable pursuant to the Transfer Agency Agreement (except for networking and omnibus fees), brokerage commissions, interest, dividends, taxes, acquired fund fees and expenses, and extraordinary expenses, exceed the annual rates noted below. If applicable, amounts reimbursed to the Funds by Janus Capital are disclosed as “Excess Expense Reimbursement” on the Statements of Operations.
| | | | | | |
| | | Expense
| | |
| Fund | | Limit (%) | | |
| |
| |
Fixed Income | | | | | |
| Janus Flexible Bond Fund | | | 0.55 | | |
| Janus Global Bond Fund | | | 0.75 | | |
| Janus High-Yield Fund | | | 0.78 | | |
| Janus Short-Term Bond Fund | | | 0.55 | | |
| |
| |
For a period of three years subsequent to Janus Global Bond Fund’s commencement of operations or until the Fund’s assets exceed the first breakpoint in the investment advisory fee schedule, whichever occurs first, Janus Capital may recover from the Fund fees and expenses previously waived or reimbursed, which could then be considered a deferral, if the Fund’s expense ratio, including recovered expenses, falls below the expense limit. The recoupment of such reimbursements expires December 28, 2013. For the period ended December 31, 2011, total reimbursement by Janus Capital was $64,090 for the Fund. As of December 31, 2011, the aggregate amount of recoupment that may be potentially made to Janus Capital is $237,375.
The Board of Trustees has adopted a deferred compensation plan (the “Deferred Plan”) for independent Trustees to elect to defer receipt of all or a portion of the annual compensation they are entitled to receive from the Funds. All deferred fees are credited to an account established in the name of the Trustees. The amounts credited to the account then increase or decrease, as the case may be, in accordance with the performance of one or more of the Janus funds that are selected by the Trustees. The account balance continues to fluctuate in accordance with the performance of the selected fund or funds until final payment of all amounts are credited to the account. The fluctuation of the account balance is recorded by the Funds as unrealized appreciation/(depreciation) and is shown as of December 31, 2011 on the Statements of Assets and Liabilities as an asset, “Non-interested Trustees’ deferred compensation,” and a liability, “Non-interested Trustees’ deferred compensation fees.” Additionally, the recorded unrealized appreciation/(depreciation) is included in “Unrealized net appreciation/(depreciation) of investments, foreign currency translations and non-interested Trustees’ deferred compensation” for the Fixed Income Funds, and “Unrealized net appreciation/(depreciation) of investments for non-interested Trustees’ deferred compensation” for the Money Market Funds on the Statements of Assets and Liabilities. Deferred compensation expenses for the period ended December 31, 2011 are included in “Non-interested Trustees’ fees and expenses” on the Statements of Operations. Trustees are allowed to change their designation of mutual funds from time to time. Amounts will be deferred until distributed in accordance with the Deferred Plan. No deferred fees were distributed to any
110 | DECEMBER 31, 2011
Trustee under the Deferred Plan during the period ended December 31, 2011.
For the period ended December 31, 2011, Janus Capital assumed $39,214 of legal, consulting and Trustee costs and fees incurred by the funds in the Trust and Janus Aspen Series together with the Trust (the “Portfolios”), in connection with regulatory and civil litigation matters. These non-recurring costs were allocated to all Portfolios based on the Portfolios’ respective net assets as of July 31, 2004. Unless noted otherwise in the financial highlights, the effect of these non-recurring costs assumed by Janus Capital are included in the ratio of gross expenses to average net assets and were less than 0.01%. No fees were allocated to the Portfolios that commenced operations after July 31, 2004. Additionally, all future non-recurring costs will be allocated to the Portfolios based on the Portfolios’ respective net assets on July 31, 2004. These “Non-recurring costs” and “Costs assumed by Janus Capital” are shown on the Statements of Operations.
Certain officers of the Funds may also be officers and/or directors of Janus Capital. Such officers receive no compensation from the Funds, except for the Funds’ Chief Compliance Officer. The Funds reimburse Janus Capital for a portion of the compensation paid to the Chief Compliance Officer and certain compliance staff of the Trust. Total compensation of $286,615 was paid by the Trust during the period ended December 31, 2011. Each Fund’s portion is reported as part of “Other Expenses” on the Statements of Operations.
Class A Shares of Janus Flexible Bond Fund, Janus Global Bond Fund and Janus High-Yield Fund include a 4.75% upfront sales charge of the offering price. Class A Shares of Janus Short-Term Bond Fund include a 2.50% upfront sales charge of the offering price. The sales charge is allocated between Janus Distributors and financial intermediaries. During the period ended December 31, 2011, Janus Distributors retained the following upfront sales charges:
| | | | | | |
| | | Upfront
| | |
| Fund (Class A Shares) | | Sales Charge | | |
| |
| |
Fixed Income | | | | | |
| Janus Flexible Bond Fund | | $ | 59,698 | | |
| Janus Global Bond Fund | | | 390 | | |
| Janus High-Yield Fund | | | 14,201 | | |
| Janus Short-Term Bond Fund | | | 8,820 | | |
| |
| |
A contingent deferred sales charge of 1.00% will be deducted with respect to Class A Shares purchased without a sales load and redeemed within 12 months of purchase, unless waived, as discussed in the Prospectus. Any applicable CDSC will be 1.00% of the lesser of the original purchase price or the value of the redemption of the Class A Shares redeemed. During the period ended December 31, 2011, redeeming shareholders of Class A Shares paid the following contingent deferred sales charges to Janus Distributors:
| | | | | | |
| | | Contingent Deferred
| | |
| Fund (Class A Shares) | | Sales Charge | | |
| |
| |
Fixed Income | | | | | |
| Janus Flexible Bond Fund | | $ | 19 | | |
| Janus High-Yield Fund | | | 243 | | |
| Janus Short-Term Bond Fund | | | 843 | | |
| |
| |
Class C Shares include a 1.00% contingent deferred sales charge paid by redeeming shareholders to Janus Distributors. The contingent deferred sales charge applies to shares redeemed within 12 months of purchase. The redemption price may differ from the net asset value per share. During the period ended December 31, 2011, redeeming shareholders of Class C Shares paid the following contingent deferred sales charges:
| | | | | | |
| | | Contingent Deferred
| | |
| Fund (Class C Shares) | | Sales Charge | | |
| |
| |
Fixed Income | | | | | |
| Janus Flexible Bond Fund | | $ | 31,945 | | |
| Janus High-Yield Fund | | | 7,412 | | |
| Janus Short-Term Bond Fund | | | 8,336 | | |
| |
| |
A 2.00% redemption fee may be imposed on Class D Shares, Class I Shares, Class R Shares, Class S Shares, and Class T Shares of Janus High-Yield Fund held for 90 days or less. This fee is paid to the Fund rather than Janus Capital, and is designed to deter excessive short-term trading and to offset the brokerage commissions, market impact, and other costs associated with changes in the Fund’s asset levels and cash flow due to short-term money movements in and out of the Fund. The redemption fee is accounted for as an addition to Paid-in Capital.
Total redemption fees received by the Fund for the period ended December 31, 2011 are indicated in the table below:
| | | | | | |
| Fund | | Redemption Fee | | |
| |
| |
Fixed Income | | | | | |
| Janus High-Yield Fund | | $ | 187,475 | | |
| |
| |
The Fixed Income Funds’ expenses may be reduced by expense offsets from an unaffiliated custodian and/or transfer agent. Such credits or offsets are included in “Expense and Fee Offset” on the Statements of Operations (if applicable). The transfer agent fee offsets received during the period reduce “Transfer agent fees and expenses” on the Statements of Operations (if applicable). Custodian offsets received reduce “Custodian fees” on the Statements of Operations (if applicable). The Funds could have employed the assets used by the custodian and/or transfer agent to produce income if they had not entered into an expense offset arrangement.
Janus Fixed Income & Money Market Funds | 111
Notes to Financial Statements (unaudited) (continued)
Pursuant to the terms and conditions of an SEC exemptive order and the provisions of the 1940 Act, the Fixed Income Funds may participate in an affiliated or nonaffiliated cash sweep program. In the cash sweep program, uninvested cash balances of the Funds may be used to purchase shares of affiliated or nonaffiliated money market funds or cash management pooled investment vehicles. The Funds are eligible to participate in the cash sweep program (the “Investing Funds”). Janus Cash Liquidity Fund LLC is an affiliated unregistered cash management pooled investment vehicle that invests primarily in highly-rated short-term fixed-income securities. Janus Cash Liquidity Fund LLC currently maintains a NAV of $1.00 per share and distributes income daily in a manner consistent with a registered 2a-7 product. There are no restrictions on the Funds’ ability to withdraw investments from Janus Cash Liquidity Fund LLC at will, and there are no unfunded capital commitments due from the Funds to Janus Cash Liquidity Fund LLC. As adviser, Janus Capital has an inherent conflict of interest because of its fiduciary duties to the affiliated cash management pooled investment vehicles and the Investing Funds.
During the period ended December 31, 2011, the following Funds recorded distributions from affiliated investment companies as affiliated dividend income, and had the following affiliated purchases and sales:
| | | | | | | | | | | | | | | |
| | | Purchases
| | Sales
| | Dividend
| | Value
| | |
| | | Shares/Cost | | Shares/Cost | | Income | | at 12/31/11 | | |
| |
Janus Cash Liquidity Fund LLC | | | | | | | | | | | | | | |
Fixed Income | | | | | | | | | | | | | | |
| Janus Flexible Bond Fund | | $ | 1,745,958,267 | | $ | (1,615,162,000) | | $ | 65,923 | | $ | 172,543,267 | | |
| Janus Global Bond Fund | | | 28,223,799 | | | (28,017,764) | | | 670 | | | 1,669,000 | | |
| Janus High-Yield Fund | | | 583,752,064 | | | (638,647,000) | | | 44,707 | | | 73,519,843 | | |
| Janus Short-Term Bond Fund | | | 1,011,781,659 | | | (1,012,580,722) | | | 44,902 | | | 121,421,154 | | |
| |
| |
| | | $ | 3,369,715,789 | | $ | (3,294,407,486) | | $ | 156,202 | | $ | 369,153,264 | | |
| |
| |
Janus Capital or an affiliate invested and/or redeemed initial seed capital during the period ended December 31, 2011, as indicated in the following table.
| | | | | | | | | | | | | | | | | | | | | |
| | | Seed
| | | | | | | | | | Seed
| | |
| | | Capital at
| | | | Date of
| | | | Date of
| | Capital at
| | |
| Fund | | 6/30/11 | | Purchases | | Purchases | | Redemptions | | Redemption | | 12/31/11 | | |
| |
| |
Fixed Income | | | | | | | | | | | | | | | | | | | | |
| Janus Global Bond Fund - Class A Shares | | $ | 833,333 | | $ | – | | | – | | $ | – | | | – | | $ | 833,333 | | |
| Janus Global Bond Fund - Class C Shares | | | 833,334 | | | – | | | – | | | – | | | – | | | 833,334 | | |
| Janus Global Bond Fund - Class D Shares | | | 833,333 | | | – | | | – | | | – | | | – | | | 833,333 | | |
| Janus Global Bond Fund - Class I Shares | | | 833,333 | | | – | | | – | | | – | | | – | | | 833,333 | | |
| Janus Global Bond Fund - Class S Shares | | | 833,334 | | | – | | | – | | | – | | | – | | | 833,334 | | |
| Janus Global Bond Fund - Class T Shares | | | 833,333 | | | – | | | – | | | – | | | – | | | 833,333 | | |
| |
| |
Income and capital gains distributions are determined in accordance with income tax regulations that may differ from accounting principles generally accepted in the United States of America. These differences are due to differing treatments for items such as net short-term gains, deferral of wash sale losses, foreign currency transactions, net investment losses and capital loss carryovers.
The Funds have elected to treat gains and losses on forward foreign currency contracts as capital gains and losses, if applicable. Other foreign currency gains and losses on debt instruments are treated as ordinary income for federal income tax purposes pursuant to Section 988 of the Internal Revenue Code.
The aggregate cost of investments and the composition of unrealized appreciation and depreciation of investment securities for federal income tax purposes as of December 31, 2011 are noted below.
Unrealized appreciation and unrealized depreciation in the table below exclude appreciation/(depreciation) on foreign currency translations. The primary difference between book and tax appreciation or depreciation of investments is wash sale loss deferrals.
112 | DECEMBER 31, 2011
| | | | | | | | | | | | | | | |
| | | | | | | | | Net Tax
| | |
| | | Federal Tax
| | Unrealized
| | Unrealized
| | Appreciation/
| | |
| Fund | | Cost | | Appreciation | | (Depreciation) | | (Depreciation) | | |
| |
| |
Fixed Income | | | | | | | | | | | | | | |
| Janus Flexible Bond Fund | | $ | 4,144,364,031 | | $ | 127,151,393 | | $ | (19,747,075) | | $ | 107,404,318 | | |
| Janus Global Bond Fund | | | 34,703,020 | | | 400,942 | | | (683,994) | | | (283,052) | | |
| Janus High-Yield Fund | | | 1,890,491,585 | | | 61,948,290 | | | (54,771,473) | | | 7,176,817 | | |
| Janus Short-Term Bond Fund | | | 2,868,631,990 | | | 26,037,345 | | | (17,053,289) | | | 8,984,056 | | |
Money Market | | | | | | | | | | | | | | |
| Janus Government Money Market Fund | | | 200,516,822 | | | – | | | – | | | – | | |
| Janus Money Market Fund | | | 1,309,048,200 | | | – | | | – | | | – | | |
| |
| |
Net capital loss carryovers as of June 30, 2011 are indicated in the table below. These losses may be available to offset future realized capital gains and thereby reduce future taxable gains distributions. The following table shows the expiration dates of the carryovers.
Capital Loss Carryover Expiration Schedule
For the fiscal year ended June 30, 2011
| | | | | | | | | |
| | | | | Accumulated
| | |
| Fund | | June 30, 2017 | | Capital Losses | | |
| |
| |
Fixed Income | | | | | | | | |
| Janus High-Yield Fund | | $ | (9,550,597) | | $ | (9,550,597) | | |
| |
| |
Capital losses may be used to offset future taxable capital gains until expiration. Under the recently enacted Regulated Investment Company Modernization Act of 2010, the Funds will be permitted to carry forward capital losses incurred in taxable years beginning after December 22, 2010 for an unlimited period. Losses incurred during those future years will be required to be utilized prior to the losses incurred in pre-enactment taxable years. As a result of this ordering rule, pre-enactment capital loss carryforwards may more likely expire unused. Also, post-enactment capital losses that are carried forward will retain their character as either short-term or long-term capital losses rather than being considered all short-term as under previous law.
The expense ratios listed in the Financial Highlights reflect expenses prior to any expense offsets (gross expense ratio) and after expense offsets (net expense ratio). Both expense ratios reflect expenses after waivers (reimbursement). Listed below are the gross expense ratios for the Fixed Income Funds that would have been in effect, absent the waiver of certain fees and offsets.
For the six-month period ended December 31, 2011 (unaudited),
the fiscal year ended June 30, 2011
the eight-month fiscal period ended June 30, 2010
and each fiscal year or period ended October 31
| | | | | | | | | | | | | | | | | |
| | | Janus Flexible
| | Janus Global
| | Janus High-Yield
| | Janus Short-Term
|
| | | Bond Fund | | Bond Fund | | Fund | | Bond Fund |
| |
| |
| Class A Shares |
| 2011 | | | 0.75% | | | | 1.40% | | | | 0.90% | | | | 1.36% | |
| 2011 | | | 0.76% | | | | 3.50%(1) | | | | 0.92% | | | | 0.88% | |
2010(2) | | | 0.76% | | | | N/A | | | | 0.92% | | | | 0.84% | |
2009(3) | | | 0.80% | | | | N/A | | | | 0.96% | | | | 0.88% | |
| |
| |
| Class C Shares |
| 2011 | | | 1.53% | | | | 2.15% | | | | 1.68% | | | | 1.65% | |
| 2011 | | | 1.51% | | | | 4.22%(1) | | | | 1.61% | | | | 1.64% | |
2010(2) | | | 1.51% | | | | N/A | | | | 1.65% | | | | 1.59% | |
2009(3) | | | 1.58% | | | | N/A | | | | 1.71% | | | | 1.63% | |
| |
| |
| Class D Shares |
| 2011 | | | 0.58% | | | | 1.27% | | | | 0.75% | | | | 0.72% | |
| 2011 | | | 0.59% | | | | 2.92%(1) | | | | 0.76% | | | | 0.72% | |
2010(4) | | | 0.60% | | | | N/A | | | | 0.77% | | | | 0.74% | |
Janus Fixed Income & Money Market Funds | 113
Notes to Financial Statements (unaudited) (continued)
| | | | | | | | | | | | | | | | | |
| | | Janus Flexible
| | Janus Global
| | Janus High-Yield
| | Janus Short-Term
|
| | | Bond Fund | | Bond Fund | | Fund | | Bond Fund |
| |
| |
| Class I Shares |
| 2011 | | | 0.54% | | | | 1.15% | | | | 0.69% | | | | 0.63% | |
| 2011 | | | 0.58% | | | | 3.13%(1) | | | | 0.70% | | | | 0.63% | |
2010(2) | | | 0.59% | | | | N/A | | | | 0.64% | | | | 0.59% | |
2009(3) | | | 0.48% | | | | N/A | | | | 0.66% | | | | 0.79% | |
| |
| |
| Class R Shares |
| 2011 | | | 1.20% | | | | N/A | | | | 1.37% | | | | N/A | |
| 2011 | | | 1.20% | | | | N/A | | | | 1.33% | | | | N/A | |
2010(2) | | | 1.20% | | | | N/A | | | | 1.37% | | | | N/A | |
2009(3) | | | 1.25% | | | | N/A | | | | 1.41% | | | | N/A | |
| |
| |
| Class S Shares |
| 2011 | | | 0.95% | | | | 1.65% | | | | 1.12% | | | | 1.09% | |
| 2011 | | | 0.95% | | | | 3.84%(1) | | | | 1.13% | | | | 1.08% | |
2010(2) | | | 0.95% | | | | N/A | | | | 1.12% | | | | 1.09% | |
2009(3) | | | 0.99% | | | | N/A | | | | 1.18% | | | | 1.13% | |
| |
| |
| Class T Shares |
| 2011 | | | 0.70% | | | | 1.39% | | | | 0.87% | | | | 0.84% | |
| 2011 | | | 0.70% | | | | 2.33%(1) | | | | 0.88% | | | | 0.84% | |
2010(2) | | | 0.66% | | | | N/A | | | | 0.86% | | | | 0.83% | |
| 2009 | | | 0.73% | | | | N/A | | | | 0.89% | | | | 0.87% | |
| 2008 | | | 0.78% | | | | N/A | | | | 0.90% | | | | 0.98% | |
| 2007 | | | 0.80% | | | | N/A | | | | 0.87% | | | | 1.01% | |
| 2006 | | | 0.83% | | | | N/A | | | | 0.93% | | | | 1.06% | |
| |
| |
| | | |
(1)
| | Period from December 28, 2010 (inception date) through June 30, 2011. |
| (2) | | Period from November 1, 2009 through June 30, 2010. The Fund changed its fiscal year end from October 31 to June 30. |
| (3) | | Period from July 6, 2009 (inception date) through October 31, 2009. |
| (4) | | Period from February 16, 2010 (inception date) through June 30, 2010. |
| |
| 7. | Capital Share Transactions |
| | | | | | | | | | | | | | | | | | | |
For the six-month period ended December 31, 2011 (unaudited)
| | Janus Flexible
| | Janus Global
| | |
and the fiscal year ended June 30, 2011 (all numbers in thousands)
| | Bond Fund | | Bond Fund | | |
| Fixed Income | | 2011 | | 2011 | | 2011 | | 2011(1) | | |
| |
| Transactions in Fund Shares – Class A Shares: | | | | | | | | | | | | | | | | | | |
| Shares sold | | | 18,734 | | | | 22,145 | | | | 328 | | | | 114 | | | |
| Reinvested dividends and distributions | | | 1,357 | | | | 2,146 | | | | 5 | | | | 1 | | | |
| Shares repurchased | | | (7,703) | | | | (16,568) | | | | (9) | | | | – | | | |
| Net Increase/(Decrease) in Fund Shares | | | 12,388 | | | | 7,723 | | | | 324 | | | | 115 | | | |
| Shares Outstanding, Beginning of Period | | | 38,005 | | | | 30,282 | | | | 115 | | | | – | | | |
| Shares Outstanding, End of Period | | | 50,393 | | | | 38,005 | | | | 439 | | | | 115 | | | |
| Transactions in Fund Shares – Class C Shares: | | | | | | | | | | | | | | | | | | |
| Shares sold | | | 8,384 | | | | 10,865 | | | | 35 | | | | 124 | | | |
| Reinvested dividends and distributions | | | 568 | | | | 900 | | | | 2 | | | | 1 | | | |
| Shares repurchased | | | (2,738) | | | | (8,423) | | | | (12) | | | | – | | | |
| Net Increase/(Decrease) in Fund Shares | | | 6,214 | | | | 3,342 | | | | 25 | | | | 125 | | | |
| Shares Outstanding, Beginning of Period | | | 25,471 | | | | 22,129 | | | | 125 | | | | – | | | |
| Shares Outstanding, End of Period | | | 31,685 | | | | 25,471 | | | | 150 | | | | 125 | | | |
| Transactions in Fund Shares – Class D Shares: | | | | | | | | | | | | | | | | | | |
| Shares sold | | | 9,788 | | | | 15,249 | | | | 1,024 | | | | 515 | | | |
| Reinvested dividends and distributions | | | 2,118 | | | | 4,203 | | | | 22 | | | | 3 | | | |
| Shares repurchased | | | (5,938) | | | | (16,546) | | | | (398) | | | | (47) | | | |
| Net Increase/(Decrease) in Fund Shares | | | 5,968 | | | | 2,906 | | | | 648 | | | | 471 | | | |
| Shares Outstanding, Beginning of Period | | | 65,110 | | | | 62,204 | | | | 471 | | | | – | | | |
| Shares Outstanding, End of Period | | | 71,078 | | | | 65,110 | | | | 1,119 | | | | 471 | | | |
114 | DECEMBER 31, 2011
| | | | | | | | | | | | | | | | | | | |
For the six-month period ended December 31, 2011 (unaudited)
| | Janus Flexible
| | Janus Global
| | |
and the fiscal year ended June 30, 2011 (all numbers in thousands)
| | Bond Fund | | Bond Fund | | |
| Fixed Income | | 2011 | | 2011 | | 2011 | | 2011(1) | | |
| |
| Transactions in Fund Shares – Class I Shares: | | | | | | | | | | | | | | | | | | |
| Shares sold | | | 51,027 | | | | 68,920 | | | | 277 | | | | 1,049 | | | |
| Reinvested dividends and distributions | | | 3,949 | | | | 6,062 | | | | 25 | | | | 12 | | | |
| Shares repurchased | | | (20,517) | | | | (30,047) | | | | (77) | | | | (49) | | | |
| Net Increase/(Decrease) in Fund Shares | | | 34,459 | | | | 44,935 | | | | 225 | | | | 1,012 | | | |
| Shares Outstanding, Beginning of Period | | | 116,676 | | | | 71,741 | | | | 1,012 | | | | – | | | |
| Shares Outstanding, End of Period | | | 151,135 | | | | 116,676 | | | | 1,237 | | | | 1,012 | | | |
| Transactions in Fund Shares – Class R Shares: | | | | | | | | | | | | | | | | | | |
| Shares sold | | | 463 | | | | 840 | | | | N/A | | | | N/A | | | |
| Reinvested dividends and distributions | | | 28 | | | | 43 | | | | N/A | | | | N/A | | | |
| Shares repurchased | | | (255) | | | | (496) | | | | N/A | | | | N/A | | | |
| Net Increase/(Decrease) in Fund Shares | | | 236 | | | | 387 | | | | N/A | | | | N/A | | | |
| Shares Outstanding, Beginning of Period | | | 909 | | | | 522 | | | | N/A | | | | N/A | | | |
| Shares Outstanding, End of Period | | | 1,145 | | | | 909 | | | | N/A | | | | N/A | | | |
| Transactions in Fund Shares – Class S Shares: | | | | | | | | | | | | | | | | | | |
| Shares sold | | | 1,902 | | | | 2,507 | | | | – | | | | 83 | | | |
| Reinvested dividends and distributions | | | 188 | | | | 366 | | | | 2 | | | | 1 | | | |
| Shares repurchased | | | (1,276) | | | | (3,141) | | | | – | | | | – | | | |
| Net Increase/(Decrease) in Fund Shares | | | 814 | | | | (268) | | | | 2 | | | | 84 | | | |
| Shares Outstanding, Beginning of Period | | | 5,481 | | | | 5,749 | | | | 84 | | | | – | | | |
| Shares Outstanding, End of Period | | | 6,295 | | | | 5,481 | | | | 86 | | | | 84 | | | |
| Transactions in Fund Shares – Class T Shares: | | | | | | | | | | | | | | | | | | |
| Shares sold | | | 32,942 | | | | 45,603 | | | | 134 | | | | 849 | | | |
| Reinvested dividends and distributions | | | 2,867 | | | | 4,609 | | | | 11 | | | | 3 | | | |
| Shares repurchased | | | (13,732) | | | | (34,816) | | | | (720) | | | | (1) | | | |
| Net Increase/(Decrease) in Fund Shares | | | 22,077 | | | | 15,396 | | | | (575) | | | | 851 | | | |
| Shares Outstanding, Beginning of Period | | | 75,364 | | | | 59,968 | | | | 851 | | | | – | | | |
| Shares Outstanding, End of Period | | | 97,441 | | | | 75,364 | | | | 276 | | | | 851 | | | |
| | | |
| (1) | | Period from December 28, 2010 (inception date) through June 30, 2011. |
Janus Fixed Income & Money Market Funds | 115
Notes to Financial Statements (unaudited) (continued)
| | | | | | | | | | | | | | | | | | | |
| | | Janus
| | Janus
| | |
For the six-month period ended December 31, 2011 (unaudited)
| | High-Yield
| | Short-Term
| | |
and the fiscal year ended June 30, 2011 (all numbers in thousands)
| | Fund | | Bond Fund | | |
| Fixed Income | | 2011 | | 2011 | | 2011 | | 2011 | | |
| |
| Transactions in Fund Shares – Class A Shares: | | | | | | | | | | | | | | | | | | |
| Shares sold | | | 9,269 | | | | 11,097 | | | | 32,754 | | | | 111,075 | | | |
| Reinvested dividends and distributions | | | 739 | | | | 973 | | | | 1,453 | | | | 1,297 | | | |
| Shares repurchased | | | (4,638) | | | | (6,146) | | | | (31,404) | | | | (30,021) | | | |
| Net Increase/(Decrease) in Fund Shares | | | 5,370 | | | | 5,924 | | | | 2,803 | | | | 82,351 | | | |
| Shares Outstanding, Beginning of Period | | | 18,836 | | | | 12,912 | | | | 121,590 | | | | 39,239 | | | |
| Shares Outstanding, End of Period | | | 24,206 | | | | 18,836 | | | | 124,393 | | | | 121,590 | | | |
| Transactions in Fund Shares – Class C Shares: | | | | | | | | | | | | | | | | | | |
| Shares sold | | | 879 | | | | 2,682 | | | | 6,518 | | | | 10,034 | | | |
| Reinvested dividends and distributions | | | 217 | | | | 414 | | | | 153 | | | | 356 | | | |
| Shares repurchased | | | (1,553) | | | | (2,609) | | | | (4,139) | | | | (7,943) | | | |
| Net Increase/(Decrease) in Fund Shares | | | (457) | | | | 487 | | | | 2,532 | | | | 2,447 | | | |
| Shares Outstanding, Beginning of Period | | | 8,590 | | | | 8,103 | | | | 22,880 | | | | 20,433 | | | |
| Shares Outstanding, End of Period | | | 8,133 | | | | 8,590 | | | | 25,412 | | | | 22,880 | | | |
| Transactions in Fund Shares – Class D Shares: | | | | | | | | | | | | | | | | | | |
| Shares sold | | | 2,915 | | | | 9,132 | | | | 8,080 | | | | 17,815 | | | |
| Reinvested dividends and distributions | | | 1,093 | | | | 2,004 | | | | 856 | | | | 2,149 | | | |
| Shares repurchased | | | (4,075) | | | | (5,762) | | | | (9,602) | | | | (25,275) | | | |
| Net Increase/(Decrease) in Fund Shares | | | (67) | | | | 5,374 | | | | (666) | | | | (5,311) | | | |
| Shares Outstanding, Beginning of Period | | | 34,726 | | | | 29,352 | | | | 68,159 | | | | 73,470 | | | |
| Shares Outstanding, End of Period | | | 34,659 | | | | 34,726 | | | | 67,493 | | | | 68,159 | | | |
| Transactions in Fund Shares – Class I Shares: | | | | | | | | | | | | | | | | | | |
| Shares sold | | | 18,383 | | | | 22,048 | | | | 37,543 | | | | 167,595 | | | |
| Reinvested dividends and distributions | | | 661 | | | | 1,298 | | | | 1,402 | | | | 2,440 | | | |
| Shares repurchased | | | (8,744) | | | | (12,833) | | | | (93,864) | | | | (49,214) | | | |
| Net Increase/(Decrease) in Fund Shares | | | 10,300 | | | | 10,513 | | | | (54,919) | | | | 120,821 | | | |
| Shares Outstanding, Beginning of Period | | | 19,155 | | | | 8,642 | | | | 176,281 | | | | 55,460 | | | |
| Shares Outstanding, End of Period | | | 29,455 | | | | 19,155 | | | | 121,362 | | | | 176,281 | | | |
| Transactions in Fund Shares – Class R Shares: | | | | | | | | | | | | | | | | | | |
| Shares sold | | | 43 | | | | 56 | | | | N/A | | | | N/A | | | |
| Reinvested dividends and distributions | | | 3 | | | | 7 | | | | N/A | | | | N/A | | | |
| Shares repurchased | | | (64) | | | | (46) | | | | N/A | | | | N/A | | | |
| Net Increase/(Decrease) in Fund Shares | | | (18) | | | | 17 | | | | N/A | | | | N/A | | | |
| Shares Outstanding, Beginning of Period | | | 121 | | | | 104 | | | | N/A | | | | N/A | | | |
| Shares Outstanding, End of Period | | | 103 | | | | 121 | | | | N/A | | | | N/A | | | |
| Transactions in Fund Shares – Class S Shares: | | | | | | | | | | | | | | | | | | |
| Shares sold | | | 98 | | | | 287 | | | | 102 | | | | 1,012 | | | |
| Reinvested dividends and distributions | | | 23 | | | | 55 | | | | 21 | | | | 44 | | | |
| Shares repurchased | | | (249) | | | | (326) | | | | (89) | | | | (878) | | | |
| Net Increase/(Decrease) in Fund Shares | | | (128) | | | | 16 | | | | 34 | | | | 178 | | | |
| Shares Outstanding, Beginning of Period | | | 767 | | | | 751 | | | | 1,847 | | | | 1,669 | | | |
| Shares Outstanding, End of Period | | | 639 | | | | 767 | | | | 1,881 | | | | 1,847 | | | |
| Transactions in Fund Shares – Class T Shares: | | | | | | | | | | | | | | | | | | |
| Shares sold | | | 23,346 | | | | 53,808 | | | | 100,490 | | | | 306,798 | | | |
| Reinvested dividends and distributions | | | 4,268 | | | | 6,835 | | | | 7,541 | | | | 18,345 | | | |
| Shares repurchased | | | (20,790) | | | | (28,170) | | | | (129,581) | | | | (326,058) | | | |
| Net Increase/(Decrease) in Fund Shares | | | 6,824 | | | | 32,473 | | | | (21,550) | | | | (915) | | | |
| Shares Outstanding, Beginning of Period | | | 116,165 | | | | 83,692 | | | | 632,065 | | | | 632,980 | | | |
| Shares Outstanding, End of Period | | | 122,989 | | | | 116,165 | | | | 610,515 | | | | 632,065 | | | |
116 | DECEMBER 31, 2011
| | | | | | | | | | | | | | | | | | | |
For the six-month period ended December 31, 2011 (unaudited)
| | Janus Government
| | | | | | |
and the fiscal year ended June 30, 2011 (all numbers in thousands)
| | Money Market Fund | | Janus Money Market Fund | | |
| Money Market | | 2011 | | 2011 | | 2011 | | 2011 | | |
| |
| Transactions in Fund Shares – Class D Shares: | | | | | | | | | | | | | | | | | | |
| Shares sold | | | 49,014 | | | | 81,476 | | | | 377,970 | | | | 566,928 | | | |
| Reinvested dividends and distributions | | | 4 | | | | 10 | | | | 22 | | | | 62 | | | |
| Shares repurchased | | | (43,779) | | | | (103,984) | | | | (333,125) | | | | (698,689) | | | |
| Net Increase/(Decrease) in Fund Shares | | | 5,239 | | | | (22,498) | | | | 44,867 | | | | (131,699) | | | |
| Shares Outstanding, Beginning of Period | | | 189,262 | | | | 211,760 | | | | 1,105,313 | | | | 1,237,012 | | | |
| Shares Outstanding, End of Period | | | 194,501 | | | | 189,262 | | | | 1,150,180 | | | | 1,105,313 | | | |
| Transactions in Fund Shares – Class T Shares: | | | | | | | | | | | | | | | | | | |
| Shares sold | | | 2,556 | | | | 4,893 | | | | 46,598 | | | | 94,195 | | | |
| Reinvested dividends and distributions | | | – | | | | 4 | | | | 1 | | | | 34 | | | |
| Shares repurchased | | | (2,377) | | | | (3,607) | | | | (49,104) | | | | (95,908) | | | |
| Net Increase/(Decrease) in Fund Shares | | | 179 | | | | 1,290 | | | | (2,505) | | | | (1,679) | | | |
| Shares Outstanding, Beginning of Period | | | 5,732 | | | | 4,442 | | | | 164,553 | | | | 166,232 | | | |
| Shares Outstanding, End of Period | | | 5,911 | | | | 5,732 | | | | 162,048 | | | | 164,553 | | | |
| |
| 8. | Purchases and Sales of Investment Securities |
For the period ended December 31, 2011, the aggregate cost of purchases and proceeds from sales of investment securities (excluding any short-term securities, short-term options contracts, and in-kind transactions) was as follows:
| | | | | | | | | | | | | | | |
| | | | | | | Purchases of Long-
| | Proceeds from Sales
| | |
| | | Purchases of
| | Proceeds from Sales
| | Term U.S. Government
| | of Long-Term U.S.
| | |
| Fund | | Securities | | of Securities | | Obligations | | Government Obligations | | |
| |
Fixed Income | | | | | | | | | | | | | | |
| Janus Flexible Bond Fund | | $ | 1,751,335,463 | | $ | 1,075,056,526 | | $ | 1,396,835,753 | | $ | 1,369,219,110 | | |
| Janus Global Bond Fund | | | 35,770,574 | | | 26,697,956 | | | 11,872,966 | | | 14,198,565 | | |
| Janus High-Yield Fund | | | 650,006,908 | | | 433,586,636 | | | – | | | – | | |
| Janus Short-Term Bond Fund | | | 761,633,730 | | | 729,533,943 | | | 614,521,254 | | | 861,787,968 | | |
| |
| |
| |
| 9. | New Accounting Pronouncements |
In May 2011, the FASB issued Accounting Standards Update, “Amendments to Achieve Common Fair Value Measurement and Disclosure Requirements.” The Accounting Standards Update requires disclosures about amounts and reasons for all transfers in and out of Level 1 and Level 2 fair value measurements. In addition, the Accounting Standards Update will require reporting entities to disclose the following information for fair value measurements categorized with Level 3 of the fair value hierarchy: quantitative information about the unobservable inputs used in the fair value measurement, the valuation processes used by the reporting entity, and a narrative description of the sensitivity of the fair value measurement to changes in unobservable inputs and the interrelationships between those unobservable inputs. This disclosure is effective for fiscal years beginning after December 15, 2011, and for interim periods within those fiscal years. Management is currently evaluating the impact these amendments may have on the Funds’ financial statements.
Effective April 2, 2012, the 2.00% redemption fee charged by Janus High-Yield Fund upon the sale or exchange of Class D Shares, Class I Shares, Class R Shares, Class S Shares, or Class T Shares within 90 days of purchase or exchange is eliminated and will no longer be charged by the Fund.
Management has evaluated whether any other events or transactions occurred subsequent to December 31, 2011 and through the date of issuance of the Funds’ financial statements and determined that there were no other material events or transactions that would require recognition or disclosure in the Funds’ financial statements.
Janus Fixed Income & Money Market Funds | 117
Additional Information (unaudited)
Proxy Voting Policies and Voting Record
A description of the policies and procedures that the Funds use to determine how to vote proxies relating to their portfolio securities is available without charge: (i) upon request, by calling 1-800-525-0020 (toll free); (ii) on the Funds’ website at janus.com/proxyvoting; and (iii) on the SEC’s website at http://www.sec.gov. Additionally, information regarding each Fund’s proxy voting record for the most recent twelve-month period ended June 30 is also available, free of charge, through janus.com/proxyvoting and from the SEC’s website at http://www.sec.gov.
Quarterly Portfolio Holdings
The Funds file their complete portfolio holdings (schedule of investments) with the SEC for the first and third quarters of each fiscal year on Form N-Q within 60 days of the end of such fiscal quarter. The Funds’ Form N-Q: (i) is available on the SEC’s website at http://www.sec.gov; (ii) may be reviewed and copied at the SEC’s Public Reference Room in Washington, D.C. (information on the Public Reference Room may be obtained by calling 1-800-SEC-0330); and (iii) is available without charge, upon request, by calling Janus at 1-800-525-0020 (toll free).
APPROVAL OF ADVISORY AGREEMENTS DURING THE PERIOD
The Trustees of Janus Investment Fund, none of whom has ever been affiliated with Janus Capital and each of whom serves as an “independent” Trustee (the “Trustees”), oversee the management of each Fund and, as required by law, determine annually whether to continue the investment advisory agreement for each Fund and the subadvisory agreements for the nine Funds that utilize subadvisers.
In connection with their most recent consideration of those agreements for each Fund, the Trustees received and reviewed a substantial amount of information provided by Janus Capital and the respective subadvisers in response to requests of the Trustees and their independent legal counsel. They also received and reviewed a considerable amount of information and analysis provided by, and at the request of, their independent fee consultant. Throughout their consideration of the agreements, the Trustees were advised by their independent legal counsel. The Trustees met with management to consider the agreements, and also met separately in executive session with their independent legal counsel and their independent fee consultant.
At a meeting held on December 8, 2011, based on the Trustees’ evaluation of the information provided by Janus Capital, the subadvisers and the independent fee consultant, as well as other information, the Trustees determined that the overall arrangements between each Fund and Janus Capital and each subadviser, as applicable, were fair and reasonable in light of the nature, extent and quality of the services provided by Janus Capital, its affiliates and the subadvisers, the fees charged for those services, and other matters that the Trustees considered relevant in the exercise of their business judgment. At that meeting, the Trustees unanimously approved the continuation of the investment advisory agreement for each Fund, and the subadvisory agreement for each subadvised Fund, for the period from February 1, 2012 through February 1, 2013, subject to earlier termination as provided for in each agreement.
In considering the continuation of those agreements, the Trustees reviewed and analyzed various factors that they determined were relevant, including the factors described below, none of which by itself was considered dispositive. However, the material factors and conclusions that formed the basis for the Trustees’ determination to approve the continuation of the agreements are discussed separately below.
Nature, Extent and Quality of Services
The Trustees reviewed the nature, extent and quality of the services provided by Janus Capital and the subadvisers to the Funds, taking into account the investment objective and strategy of each Fund and the knowledge the Trustees gained from their regular meetings with management on at least a quarterly basis and their ongoing review of information related to the Funds. In addition, the Trustees reviewed the resources and key personnel of Janus Capital and each subadviser, particularly noting those employees who provide investment and risk management services to the Funds. The Trustees also considered other services provided to the Funds by Janus Capital or the subadvisers, such as managing the execution of portfolio transactions and the selection of broker-dealers for those transactions. The Trustees considered Janus Capital’s role as administrator to the Funds, noting that Janus Capital does not receive a fee for its services but is reimbursed for its out-of-pocket costs. The Trustees considered the role of Janus Capital in monitoring adherence to the Funds’ investment restrictions, providing support services for the Trustees and Trustee committees, communicating with shareholders and overseeing the activities of other service providers, including monitoring compliance with various policies and procedures of the Funds and with applicable securities laws and regulations.
118 | DECEMBER 31, 2011
The Trustees concluded that the nature, extent and quality of the services provided by Janus Capital or the subadviser to each Fund were appropriate and consistent with the terms of the respective advisory and subadvisory agreements, and that, taking into account steps taken to address those Funds whose performance lagged that of their peers for certain periods, the quality of those services had been consistent with or superior to quality norms in the industry and the Funds were likely to benefit from the continued provision of those services. They also concluded that Janus Capital and each subadviser had sufficient personnel, with the appropriate education and experience, to serve the Funds effectively and had demonstrated its continuing ability to attract well-qualified personnel.
Performance of the Funds
The Trustees considered the performance results of each Fund over various time periods. They reviewed information comparing each Fund’s performance with the performance of comparable funds and peer groups identified by Lipper, and with the Fund’s benchmark index. They concluded that the performance of various Funds was good to very good under current market conditions. Although the performance of other Funds lagged that of their peers for certain periods, the Trustees also concluded that Janus Capital had taken or was taking appropriate steps to address those instances of under-performance.
Costs of Services Provided
The Trustees examined information regarding the fees and expenses of each Fund in comparison to similar information for other comparable funds as provided by Lipper. They also reviewed an analysis of that information provided by their independent fee consultant and noted that the rate of management (investment advisory and any administration) fees for most of the Funds, after applicable contractual expense limitations, was below the mean management fee rate of the respective peer group of funds selected by Lipper.
The Trustees considered the methodology used by Janus Capital and each subadviser in determining compensation payable to portfolio managers, the competitive environment for investment management talent and the competitive market for mutual funds in different distribution channels. They concluded that the compensation methodology provided a good alignment of the interests of the portfolio managers with the interests of Fund shareholders.
The Trustees also reviewed management fees charged by Janus Capital and each subadviser to their separate account clients and to non-affiliated funds subadvised by Janus Capital or by a subadviser (for which Janus Capital provides only portfolio management services). Although in most instances subadvisory and separate account fee rates for various investment strategies were lower than management fee rates for Funds having a similar strategy, the Trustees noted that, under the terms of the management agreements with the Funds, Janus Capital performs significant additional services for the Funds that it does not provide to those other clients, including administration services, oversight of the Funds’ other service providers, trustee support, regulatory compliance and numerous other services, and that, in serving the Funds, Janus Capital assumes many legal risks that it does not assume in servicing its other clients. Moreover, they noted that the spread between the average fee rates charged to the Funds and the fee rates that Janus Capital charged to its separate account clients was smaller than the average spread for such fee rates of other advisers, based on publicly available data and research conducted by the Trustees’ independent fee consultant.
The Trustees reviewed information on the profitability to Janus Capital and its affiliates of their relationships with each Fund, as well as an explanation of the methodology utilized in allocating various expenses of Janus Capital and its affiliates among the Funds and other clients. The Trustees also reviewed the financial statements and corporate structure of Janus Capital’s parent company. In their review, the Trustees considered whether Janus Capital and each subadviser receive adequate incentives to manage the Funds effectively. The Trustees recognized that profitability comparisons among fund managers are difficult because very little comparative information is publicly available and the profitability of any fund manager is affected by numerous factors, including the organizational structure of the particular fund manager, the types of funds and other accounts it manages, possible other lines of business, the methodology for allocating expenses and the fund manager’s capital structure and cost of capital. However, taking into account those factors and the analysis provided by the Trustees’ independent fee consultant, and based on the information available, the Trustees concluded that Janus Capital’s profitability with respect to each Fund in relation to the services rendered was not unreasonable.
The Trustees concluded that the management fees and other compensation payable by each Fund to Janus Capital and its affiliates, as well as the fees paid by Janus Capital to the subadvisers of subadvised Funds, were reasonable in relation to the nature, extent and quality of the services provided, taking into account the fees charged by other advisers for managing comparable mutual funds with similar strategies, the fees Janus Capital and the subadvisers charge to other clients, and, as applicable, the impact of fund performance on fees
Janus Fixed Income & Money Market Funds | 119
Additional Information (unaudited) (continued)
payable by the Funds. The Trustees also concluded that the overall expense ratio of each Fund was reasonable, taking into account the size of the Fund, the quality of services provided by Janus Capital and any subadviser, the investment performance of the Fund and any expense limitations agreed to by Janus Capital.
Economies of Scale
The Trustees considered information about the potential for Janus Capital to realize economies of scale as the assets of the Funds increase. They noted that, although many Funds pay advisory fees at a fixed rate as a percentage of net assets, without any breakpoints, the actual management fee rate paid by most of the Funds, after any contractual expense limitations, was below the mean management fee rate of the Fund’s peer group identified by Lipper; and, for those Funds whose expenses are being reduced by the contractual expense limitations of Janus Capital, Janus Capital is subsidizing the Funds because they have not reached adequate scale. Moreover, as the assets of many of the Funds have declined in the past few years, certain Funds have benefited from having advisory fee rates that have remained constant rather than increasing as assets declined. In addition, performance fee structures have been implemented for various Funds that have caused or will cause the effective rate of advisory fees payable by such a Fund to vary depending on the investment performance of the Fund relative to its benchmark index over the measurement period; and a few Funds have fee schedules with breakpoints and reduced fee rates above certain asset levels. The Trustees also noted that the Funds share directly in economies of scale through the lower charges of third-party service providers that are based in part on the combined scale of all of the Funds. Based on all of the information they reviewed, including research and analysis conducted by the Trustees’ independent fee consultant, the Trustees concluded that the current fee structure of each Fund was reasonable and that the current rates of fees do reflect a sharing between Janus Capital and the Fund of economies of scale at the current asset level of the Fund.
Other Benefits to Janus Capital
The Trustees also considered benefits that accrue to Janus Capital and its affiliates from their relationships with the Funds. They recognized that two affiliates of Janus Capital separately serve the Funds as transfer agent and distributor, respectively, and the transfer agent receives compensation directly from the non-money market funds for services provided. The Trustees also considered Janus Capital’s past and proposed use of commissions paid by the Funds on their portfolio brokerage transactions to obtain proprietary and third-party research products and services benefiting the Fund and/or other clients of Janus Capital. The Trustees concluded that Janus Capital’s use of these types of client commission arrangements to obtain proprietary and third-party research products and services was consistent with regulatory requirements and guidelines and was likely to benefit each Fund. The Trustees also concluded that, other than the services provided by Janus Capital and its affiliates pursuant to the agreements and the fees to be paid by each Fund therefor, the Funds and Janus Capital may potentially benefit from their relationship with each other in other ways. They concluded that Janus Capital benefits from the receipt of research products and services acquired through commissions paid on portfolio transactions of the Funds and that the Funds benefit from Janus Capital’s receipt of those products and services as well as research products and services acquired through commissions paid by other clients of Janus Capital. They further concluded that success of any Fund could attract other business to Janus Capital or other Janus funds, and that the success of Janus Capital could enhance Janus Capital’s ability to serve the Funds.
After full consideration of the above factors, as well as other factors, the Trustees, each of whom is an independent Trustee, concluded at their December 8, 2011 meeting that the proposed continuation of the investment advisory agreement and, if applicable, the subadvisory agreement for each Fund for another year was in the best interest of the respective Funds and their shareholders.
120 | DECEMBER 31, 2011
Explanations of Charts, Tables and
Financial Statements (unaudited)
Performance overview graphs compare the performance of a hypothetical $10,000 investment in each Fund (from inception) with one or more widely used market indices. The hypothetical example does not represent the returns of any particular investment.
When comparing the performance of a Fund with an index, keep in mind that market indices do not include brokerage commissions that would be incurred if you purchased the individual securities in the index. They also do not include taxes payable on dividends and interest or operating expenses incurred if you maintained a Fund invested in the index.
Average annual total returns are also quoted for each Fund. Average annual total return is calculated by taking the growth or decline in value of an investment over a period of time, including reinvestment of dividends and distributions, then calculating the annual compounded percentage rate that would have produced the same result had the rate of growth been constant throughout the period. Average annual total return does not reflect the deduction of taxes that a shareholder would pay on Fund distributions or redemptions of Fund shares.
Pursuant to federal securities rules, expense ratios shown in the performance chart reflect subsidized and unsubsidized ratios for the prior fiscal year. The total annual fund operating expenses ratio is gross of any fee waivers, reflecting a Fund’s unsubsidized expense ratio. The net annual fund operating expenses ratio (if applicable) includes contractual waivers of Janus Capital and reflects a Fund’s subsidized expense ratio. Both the total annual fund operating expenses ratio and net annual fund operating expenses ratio are based on average net assets as of the fiscal year ended June 30, 2011 . The ratios also include expenses indirectly incurred by a Fund as a result of investing in other investment companies or pooled investments, which are not reflected in the “Financial Highlights” of this report. As a result, these ratios may be higher or lower than those shown in the “Financial Highlights” in this report. All expenses are shown without the effect of expense offset arrangements. Pursuant to such arrangements, credits realized as a result of uninvested cash balances are used to reduce custodian and transfer agent expenses.
| |
| 2. | Schedules of Investments |
Following the performance overview section is each Fund’s Schedule of Investments. This schedule reports the industry concentrations and types of securities held in each Fund on the last day of the reporting period. Securities are usually listed by type (common stock, corporate bonds, U.S. Government obligations, etc.) and by industry classification (banking, communications, insurance, etc.). Holdings are subject to change without notice.
The value of each security is quoted as of the last day of the reporting period. The value of securities denominated in foreign currencies is converted into U.S. dollars.
If a Fund invests in foreign securities, it will also provide a summary of investments by country. This summary reports each Fund’s exposure to different countries by providing the percentage of securities invested in each country. The country of each security represents the country in which the company is incorporated. Each Fund’s Schedule of Investments relies upon the industry group and country classifications published by Bloomberg L.P.
2a. Forward Currency Contracts
A table listing forward currency contracts follows each Fund’s Schedule of Investments (if applicable). Forward currency contracts are agreements to deliver or receive a preset amount of currency at a future date. Forward currency contracts are used to hedge against foreign currency risk in the Funds’ long-term holdings.
The table provides the name of the foreign currency, the settlement date of the contract, the amount of the contract, the value of the currency in U.S. dollars and the amount of unrealized gain or loss. The amount of unrealized gain or loss reflects the change in currency exchange rates from the time the contract was opened to the last day of the reporting period.
2b. Futures
A table listing futures contracts follows each Fund’s Schedule of Investments (if applicable). Futures contracts are contracts that obligate the buyer to receive and the seller to deliver an instrument or money at a specified price on a specified date. Futures are used to hedge against adverse movements in securities prices, currency risk or interest rates.
The table provides the name of the contract, number of contracts held, the expiration date, the principal amount, value and the amount of unrealized gain or loss. The amount of unrealized gain or loss reflects the marked-to-market amount for the last day of the reporting period.
| |
| 3. | Statements of Assets and Liabilities |
These statements are often referred to as the “balance sheets.” It lists the assets and liabilities of the Funds on the last day of the reporting period.
The Funds’ assets are calculated by adding the value of the securities owned, the receivable for securities sold but
Janus Fixed Income & Money Market Funds | 121
Explanations of Charts, Tables and
Financial Statements (unaudited) (continued)
not yet settled, the receivable for dividends declared but not yet received on stocks owned and the receivable for Fund shares sold to investors but not yet settled. The Funds’ liabilities include payables for securities purchased but not yet settled, Fund shares redeemed but not yet paid and expenses owed but not yet paid. Additionally, there may be other assets and liabilities such as unrealized gain or loss on forward currency contracts.
The section entitled “Net Assets Consist of” breaks down the components of the Funds’ net assets. Because the Funds must distribute substantially all earnings, you will notice that a significant portion of net assets is shareholder capital.
The last section of this statement reports the net asset value (“NAV”) per share on the last day of the reporting period. The NAV is calculated by dividing the Funds’ net assets (assets minus liabilities) by the number of shares outstanding.
| |
| 4. | Statements of Operations |
These statements detail the Funds’ income, expenses, gains and losses on securities and currency transactions, and appreciation or depreciation of current Fund holdings.
The first section in this statement, entitled “Investment Income,” reports the dividends earned from stocks and interest earned from interest-bearing securities in the Funds.
The next section reports the expenses incurred by the Funds, including the advisory fee paid to the investment adviser, transfer agent fees and expenses, and printing and postage for mailing statements, financial reports and prospectuses. Expense offsets and expense reimbursements, if any, are also shown.
The last section lists the increase or decrease in the value of securities held in the Funds. The Funds will realize a gain (or loss) when they sell their position in a particular security. An unrealized gain (or loss) refers to the change in net appreciation or depreciation of the Funds during the reporting period. “Net Realized and Unrealized Gain/(Loss) on Investments” is affected both by changes in the market value of Fund holdings and by gains (or losses) realized during the reporting period.
| |
| 5. | Statements of Changes in Net Assets |
These statements report the increase or decrease in the Funds’ net assets during the reporting period. Changes in the Funds’ net assets are attributable to investment operations, dividends, distributions and capital share transactions. This is important to investors because it shows exactly what caused the Funds’ net asset size to change during the period.
The first section summarizes the information from the Statements of Operations regarding changes in net assets due to the Funds’ investment performance. The Funds’ net assets may also change as a result of dividend and capital gains distributions to investors. If investors receive their dividends in cash, money is taken out of the Funds to pay the distribution. If investors reinvest their dividends, the Funds’ net assets will not be affected. If you compare each Fund’s “Net Decrease from Dividends and Distributions” to the “Reinvested dividends and distributions,” you will notice that dividend distributions had little effect on each Fund’s net assets. This is because the majority of Janus investors reinvest their distributions.
The reinvestment of dividends is included under “Capital Share Transactions.” “Capital Shares” refers to the money investors contribute to the Funds through purchases or withdrawals via redemptions. “Redemption Fees” (if applicable) refers to the fee paid to the Funds for shares held for 90 days or less by a shareholder. The Funds’ net assets will increase and decrease in value as investors purchase and redeem shares from the Funds.
This schedule provides a per-share breakdown of the components that affect each Fund’s NAV for current and past reporting periods. Not only does this table provide you with total return, it also reports total distributions, asset size, expense ratios and portfolio turnover rate.
The first line in the table reflects the NAV per share at the beginning of the reporting period. The next line reports the net investment income per share, which comprises dividends and interest income earned on securities held by the Funds. Following is the total of gains/(losses), realized and unrealized. Dividends and distributions are then subtracted to arrive at the NAV per share at the end of the period. The next line reflects the average annual total return reported the last day of the period. The total return may include adjustments in accordance with generally accepted accounting principles. As a result, the total return may differ from the total return reflected for shareholder transactions.
Also included are the expense ratios, or the percentage of average net assets that were used to cover operating expenses during the period. Expense ratios vary across the Funds within the Trust for a number of reasons, including the differences in management fees, the frequency of dividend payments and the extent of foreign investments, which entail greater transaction costs.
122 | DECEMBER 31, 2011
The Funds’ expenses may be reduced through expense-reduction arrangements. These arrangements may include the use of balance credits or transfer agent fee offsets. The Statements of Operations reflect total expenses before any such offset, the amount of the offset and the net expenses. The expense ratios listed in the Financial Highlights reflect total expenses prior to any expense offset (gross expense ratio) and after the expense offsets (net expense ratio). Both expense ratios reflect expenses after waivers (reimbursements), if applicable.
The ratio of net investment income/(loss) summarizes the income earned less expenses, divided by the average net assets of a Fund during the reporting period. Don’t confuse this ratio with a Fund’s yield. The net investment income ratio is not a true measure of a Fund’s yield because it doesn’t take into account the dividends distributed to the Fund’s investors.
The next figure is the portfolio turnover rate, which measures the buying and selling activity in a Fund. Portfolio turnover is affected by market conditions, changes in the asset size of a Fund, fluctuating volume of shareholder purchase and redemption orders, the nature of the Fund’s investments and the investment style and/or outlook of the portfolio manager. A 100% rate implies that an amount equal to the value of the entire portfolio was replaced once during the fiscal year; a 50% rate means that an amount equal to the value of half the portfolio is traded in a year; and a 200% rate means that an amount equal to the value of the entire portfolio is traded every six months.
Janus Fixed Income & Money Market Funds | 123
Notes
124 | DECEMBER 31, 2011
Notes
Janus Fixed Income & Money Market Funds | 125
Janus provides access to a wide range of investment disciplines.
Alternative
Janus alternative funds seek to deliver strong risk-adjusted returns over a full market cycle with lower correlation to equity markets than traditional investments.
Asset Allocation
Janus’ asset allocation funds utilize our fundamental, bottom-up research to balance risk over the long term. From fund options that meet investors’ risk tolerance and objectives to a method that incorporates non-traditional investment choices to seek non-correlated sources of risk and return, Janus’ asset allocation funds aim to allocate risk more effectively.
Fixed Income
Janus fixed income funds attempt to provide less risk relative to equities while seeking to deliver a competitive total return through high current income and appreciation. Janus money market funds seek capital preservation and liquidity with current income as a secondary objective.
Global & International
Janus global and international funds seek to leverage Janus’ research capabilities by taking advantage of inefficiencies in foreign markets, where accurate information and analytical insight are often at a premium.
Growth & Core
Janus growth funds focus on companies believed to be the leaders in their respective industries, with solid management teams, expanding market share, margins and efficiencies. Janus core funds seek investments in more stable and predictable companies. Our core funds look for a strategic combination of steady growth and, for certain funds, some degree of income.
Mathematical
Our mathematical funds seek to outperform their respective indices while maintaining a risk profile equal to or lower than the index itself. Managed by INTECH (a Janus subsidiary), these funds use a mathematical process in an attempt to build a more “efficient” portfolio than the index.
Value
Our value funds, managed by Perkins (a Janus subsidiary), seek to identify companies with favorable reward to risk characteristics by conducting rigorous downside analysis before determining upside potential.
For more information about our funds, contact your investment professional or go to janus.com/advisor/mutual-funds (or janus.com/allfunds if you hold Shares directly with Janus).
Please consider the charges, risks, expenses and investment objectives carefully before investing. For a prospectus or, if available, a summary prospectus containing this and other information, please call Janus at 877.33JANUS (52687) (or 800.525.3713 if you hold Shares directly with Janus); or download the file from janus.com/info (or janus.com/reports if you hold Shares directly with Janus). Read it carefully before you invest or send money.
Funds distributed by Janus Distributors LLC (02/12)
Investment products offered are: NOT FDIC-INSURED MAY LOSE VALUE NO BANK GUARANTEE
| |
| C-0112-127 | 125-24-93004 02-12 |
SEMIANNUAL REPORT
December 31, 2011
Janus Value Funds
Perkins Large Cap Value FundPerkins Mid Cap Value Fund
Perkins Select Value Fund
Perkins Small Cap Value Fund
Perkins Value Plus Income Fund
HIGHLIGHTS
| |
| • | Portfolio management perspective |
| • | Investment strategy behind your fund |
| • | Fund performance, characteristics and holdings |
Table of Contents
Janus Value Funds
| | | |
| | 1 |
| | 3 |
| | |
| | 5 |
| | 15 |
| | 27 |
| | 34 |
| | 44 |
| | 64 |
| | 68 |
| | 70 |
| | 74 |
| | 89 |
| | 93 |
| | 114 |
| | 119 |
Please consider the charges, risks, expenses and investment objectives carefully before investing. For a prospectus or, if available, a summary prospectus containing this and other information, please call Janus at 877.33JANUS(52687) (or 800.525.3713 if you hold Shares directly with Janus); or download the file from janus.com/info (or janus.com/reports if you hold Shares directly with Janus). Read it carefully before you invest or send money.
Chief Investment Officer’s Market Perspective (unaudited)
Jeff Kautz
Chief Investment
Officer
A Tentative End to a Volatile Year
Equity markets ended 2011 on an optimistic – if bumpy – note. The S&P 500 Index rose 11.82% in the fourth quarter and eked out a 2.11% return for the year. Of course, this recent rebound may be just the latest chapter in another year marked by extreme up-and-down markets. The market’s severe swings appear to be driven by very light trading volume, a trend likely to remain in place without meaningful progress in the difficulties plaguing global markets. Until this occurs, high correlations and elevated volatility levels will probably remain the norm. Our portfolios continue to be positioned somewhat defensively based on this outlook. We also have taken advantage of heightened volatility in an effort to further strengthen our overall risk profiles and portfolio quality.
Preparing for Prolonged Uncertainty
We think a cautious approach makes sense given the macroeconomic risks that have been whipsawing markets. In addition to lackluster growth, both Europe and the U.S. have a tremendous amount of deleveraging to work through. There seems to be little agreement by government leaders on how to solve these challenges, and a lack of action is likely to keep markets in a state of uncertainty.
The situation in Europe may soon come to a head. At this point, a Greek exit from the euro zone may be unavoidable. The bigger issue is what might happen in Italy and Spain, since these countries play a much more prominent economic role in the region. In a worst-case scenario, the undercapitalized European banking system may start to collapse. Meanwhile, European Union political leaders seem content to debate how best to handle these problems, with little consensus emerging. Let’s hope they take a more unified approach to avoid a complete fiscal debacle before another shoe drops.
Political antics in the U.S. are no better. Contentious rhetoric from both parties has kept investors on edge, and this bickering has distracted Washington from meaningful dialogue about the structural problems that are impeding healthier economic expansion. We need politicians to think past the next election cycle and make some tough decisions. Most importantly, we need jobs. There has been some improvement on this front, but the sheer volume of unemployed Americans remains staggering.
China has problems as well. Dramatic levels of fixed asset investment, largely credit financed, have supported China’s remarkable expansion, and many parts of the global economy have come to depend on strong and sustained growth in China. A significant disruption of this trend could be quite a shock, both to equity fundamentals and valuation multiples.
Protect on the Downside
Looking further out, a number of indicators make us bullish over the next 5+ years. First, the U.S. economy has proven to be surprisingly resilient, chugging along despite a steady stream of market shocks. While a full-blown recovery remains elusive, we expect gross domestic product to continue expanding in the 1.5-2.5% range over the next 12 months. Second, U.S. companies remain financially strong, with healthy balance sheets and sizable cash holdings. Margin compression continues to be a concern and without top-line growth, earnings may soon come under pressure. Nevertheless, many firms have been able to capture additional growth potential from smart merger and acquisition activity. Furthermore, stock valuations appear reasonable. The S&P 500 was trading around 13x forward earnings at year end, with a 2.08% dividend yield, notably higher than the 1.88% offered by the 10-year U.S. Treasury note. This is the first time in five decades that the S&P 500 dividend yield is higher than that of 10-year U.S. Treasuries. With this in mind, U.S. stocks look to be a decent long-term investment.
Looking ahead, our bias remains firmly on high-quality stocks – those with strong balance sheets, solid free cash flows and robust operating efficiencies. We believe these companies have the strength not only to navigate a difficult environment, but also to enhance their competitive position as weaker entities struggle. Although the valuation gap between small- and large cap stocks has narrowed over the past 12 months, we think that large caps carry less absolute risk, and we have found potential across most sectors. However, because of macro headwinds we have been underweight in consumer discretionary. We also remain underweight electric utilities
Janus Value Funds | 1
(Continued) (unaudited)
due to the regulated nature of their business and levered balance sheets that are not supported by free cash flow.
As we enter 2012, we want to thank you for the confidence you have placed in Perkins Investment Management. We continue to be excited about the long-term opportunities we are finding in a difficult market and look forward to providing strong performance for many years to come.
Sincerely,
Jeff Kautz
Chief Investment Officer
Past performance is no guarantee of future results.
The opinions are those of the authors as of 12-2011 and are subject to change at any time due to changes in market or economic conditions. The comments should not be construed as a recommendation of individual holdings or market sectors, but as an illustration of broader themes.
There is no assurance that the investment process will consistently lead to successful investing.
U.S. Treasury securities are direct debt obligations issued by the U.S. Government. With government bonds, the investor is a creditor of the government. Treasury Bills and U.S. Government Bonds are guaranteed by the full faith and credit of the United States government, are generally considered to be free of credit risk and typically carry lower yields than other securities. Bonds in a portfolio are typically intended to provide income and/or diversification. In general, the bond market is volatile. Bond prices rise when interest rates fall and vice versa. This effect is usually pronounced for longer-term securities. Any fixed income security sold or redeemed prior to maturity may be subject to a substantial gain or loss.
S&P 500® Index is a commonly recognized, market capitalization weighted index of 500 widely held equity securities, designed to measure broad U.S. equity performance.
2 | DECEMBER 31, 2011
Useful Information About Your Fund Report (unaudited)
Management Commentaries
The Management Commentaries in this report include valuable insight from each of the Funds’ managers as well as statistical information to help you understand how your Fund’s performance and characteristics stack up against those of comparable indices.
If a Fund invests in foreign securities, this report may include information about country exposure. Country exposure is based primarily on the country of domicile. However, the Funds’ managers may allocate a company to a country based on other factors such as location of the company’s principal office, the location of the principal trading market for the company’s securities, or the country where a majority of the company’s revenues are derived.
Please keep in mind that the opinions expressed by the Funds’ managers in the Management Commentaries are just that: opinions. They are a reflection of the managers’ best judgment at the time this report was compiled, which was December 31, 2011. As the investing environment changes, so could the managers’ opinions. These views are unique to each manager and aren’t necessarily shared by fellow employees or by Janus in general.
Fund Expenses
We believe it’s important for our shareholders to have a clear understanding of Fund expenses and the impact they have on investment return.
The following is important information regarding each Fund’s Expense Example, which appears in each Fund’s Management Commentary within this Semiannual Report. Please refer to this information when reviewing the Expense Example for each Fund.
Example
As a shareholder of a Fund, you incur two types of costs: (1) transaction costs, including sales charges (loads) on purchase payments (applicable to Class A Shares only); redemption fees, where applicable (and any related exchange fees); and (2) ongoing costs, including management fees; distribution and shareholder servicing (12b-1) fees (applicable to Class A Shares, Class C Shares, Class R Shares, and Class S Shares only); administrative services fees payable pursuant to the Transfer Agency Agreement; administrative, networking or omnibus fees (applicable to Class A Shares, Class C Shares, and Class I Shares only); and other Fund expenses. The example is intended to help you understand your ongoing costs (in dollars) of investing in the Fund and to compare these costs with the ongoing costs of investing in other mutual funds. To do so, compare this 5% hypothetical example with the 5% hypothetical examples that appear in the shareholder reports of the other funds. The example is based upon an investment of $1,000 invested at the beginning of the period and held for the six-month period from July 1, 2011 to December 31, 2011.
Actual Expenses
The first line of the table in each example provides information about actual account values and actual expenses. You may use the information in this line, together with the amount you invested, to estimate the expenses that you paid over the period. Simply divide your account value by $1,000 (for example, an $8,600 account value divided by $1,000 = 8.6), then multiply the result by the number in the first line under the heading entitled “Expenses Paid During Period” to estimate the expenses you paid on your account during the period.
Hypothetical Example for Comparison Purposes
The second line of the table in each example provides information about hypothetical account values and hypothetical expenses based upon each Fund’s actual expense ratio and an assumed rate of return of 5% per year before expenses, which is not the Fund’s actual return. The hypothetical account values and expenses may not be used to estimate the actual ending account balance or expenses you paid for the period. You may use this information to compare the ongoing costs of investing in each Fund and other funds. To do so, compare this 5% hypothetical example with the 5% hypothetical examples that appear in the shareholder reports of the other funds.
Janus Capital Management LLC (“Janus Capital”) has contractually agreed to waive each Fund’s total annual fund operating expenses, excluding any performance adjustments to management fees, class-specific distribution and shareholder servicing (12b-1) fees (applicable to Class A Shares, Class C Shares, Class R Shares, and Class S Shares only), administrative services fees payable pursuant to the Transfer Agency Agreement (except for networking and omnibus fees), brokerage commissions, interest, dividends, taxes, acquired fund fees and expenses, and extraordinary expenses, to certain limits until at least November 1, 2012 (until at least November 1, 2013 for Perkins Select Value Fund). Expenses in the examples reflect application of these waivers. Had the waivers not been in effect, your expenses would have been higher. More information regarding the waivers is available in the Funds’ prospectuses.
Janus Value Funds | 3
(Continued) (unaudited)
Please note that the expenses shown in the tables are meant to highlight your ongoing costs only and do not reflect any transaction costs, such as redemption fees (where applicable) and any related exchange fees. These fees are fully described in the Funds’ prospectuses. Therefore, the second line of each table is useful in comparing ongoing costs only, and will not help you determine the relative total costs of owning different funds. In addition, if these transaction costs were included, your costs would have been higher.
4 | DECEMBER 31, 2011
Perkins Large Cap Value Fund (unaudited)
| | | | | | | |
Fund Snapshot
The Fund seeks to invest in what we believe are fundamentally and financially strong larger capitalization companies exhibiting favorable risk-reward characteristics. We believe in the timeless adage of the power of compounding and in doing so our focus is on mitigating losses in difficult markets. We invest in securities we believe have favorable risk/reward ratios by focusing first on rigorous downside analysis prior to determining upside potential. We seek to outperform both our benchmark and peers over a full market cycle by building a diversified portfolio of high-quality, undervalued stocks.
| | | | 
Tom Perkins
co-portfolio manager | | 
Kevin Preloger
co-portfolio manager |
Performance Overview
During the six months ended December 31, 2011, Perkins Large Cap Value Fund’s Class I Shares returned -5.20%, slightly outperforming its benchmark, the Russell 1000 Value Index, which returned -5.22%.
Stock selection was additive relative to the benchmark. Consistent with our downside-risk sensitive approach, we held up best on a relative basis in the worst performing sector, financials, within the index. One of the contributors to the Fund’s underperformance for 2011 was our normal significant underweight in utilities, as it was the best performing sector in the index. Utilities’ balance sheets and free cash flows are below average and, along with their regulated nature, make them less attractive to us on a secular basis.
Market Commentary
Stocks suffered a significant sell-off in the third quarter, as problems in Europe became much more apparent. The focus was on European sovereign debt issues and undercapitalized European banks. The inability to take substantive action to address those problems created a situation of great uncertainty and raised questions of global contagion.
The stock market rebounded from the third quarter correction, but not enough to entirely offset the losses from the third quarter. The bounce back was fueled by strong earnings reports, improving economic data, and a late December liquidity injection by the European Central Bank (ECB). Despite these short-term trend improvements, our market perspective has not changed, as we remain somewhat cautious with higher than normal cash levels. The environment remains one of extremely strong company fundamentals offset by very challenging economic and financial issues. Economic vulnerability persists with continuous headwinds from the European debt crisis coupled with ongoing governmental and consumer deleveraging, and high unemployment levels. Volatility drives market sentiment, even with the backdrop of continued monetary actions at home (securities repurchases, low interest rates), and, to date, ineffective attempts to remedy the long term capital shortage of European banks. And so, during the short term, uncertainty will likely persist until we regain footing on macro fundamentals.
Contagion risk remains as mounting European debt problems affect financial structures globally. Concerns revolve around the European banking system as many banks are thinly capitalized and carry debt of distressed “PIIGS” (Portugal, Italy, Ireland, Greece and Spain) countries at unrealistically high values. In an effort to absorb any potential shocks from the Euro zone debt crisis and encourage domestic growth, U.S. Fed policy indicates interest rates will remain somewhat artificially low well into 2013.
In spite of macroeconomic headwinds, microeconomic fundamentals remain positive. The market appears reasonably valued with the S&P 500 Index trading at period end at about 13x 2011 earnings estimates of $95, and an earnings yield of almost 8%. As compared to 10-year Treasuries’ yields of slightly under 2%, there is a 6% risk premium to owning stocks – the highest level in three decades. Moreover, for the first time in 50 years, stocks yield more than 10-year Treasuries, as the S&P 500 dividend yield currently is over 2%. Corporate balance sheets continue to strengthen, and U.S. banks have much better capital structures than before the financial crisis. By these metrics, equities remain an attractive asset class, especially compared to bonds. Continuing high volatility provides for pricing dislocation and opportunity.
Janus Value Funds | 5
Perkins Large Cap Value Fund (unaudited)
Contributors
Pharmaceutical giants Merck and Pfizer were the largest contributors during the six-month period. Pfizer’s earnings remained steady despite the Lipitor patent expiration. Also, the company continued to return capital to shareholders in the form of an increased dividend and larger share buyback. Looking to 2012, it is expected that the company will either sell or spin-off, its animal health and nutrition business units. We continue to maintain a position due to its strong dividend yield of 4%, its valuation of 10x estimated 2012 earnings and a healthy product pipeline.
Vodafone, the global wireless telecom company, was another leading gainer. We appreciate management’s efforts to clean up its complicated holding company structure, including selling its stake in China Mobile and putting the various remaining equity holdings into a single business unit. There is also renewed focus in the market on the potential for a monetization of Vodafone’s significant stake in Verizon Wireless. In the meantime, the stock has a dividend yield of over 7% (including distributions from Verizon Wireless) and sells at 10 x estimated 2011 earnings.
Detractors
Life science tool provider Thermo Fisher declined over 30% due to uncertainty related to the level of healthcare capital expenditures and government funding for life sciences research. We maintain our long held position in this industry leader based on its valuation of less than 10x earnings, its preeminent leadership position in the industry, strong balance sheet, and above average stable free cash flow generation, in our view.
Two financial holdings, SunTrust Banks and JPMorgan Chase, also weighed on performance. We consider SunTrust’s valuation attractive on normalized earnings. While we are significantly underweight the money center banks, we do maintain a position in JPMorgan Chase. All the money centers, including JPMorgan, were weak due to contagion worries from a deteriorating credit situation in Europe. We believe the exposure at JPMorgan is manageable but prefer to overweight the super regional banks, such as SunTrust, that are less exposed.
Market Outlook
We believe that our quality-oriented, risk-sensitive investment approach is especially important in this type of difficult environment. High-quality companies with strong balance sheets and high free cash flows will likely hold up better in stressed environments over the long term, and are better positioned against weaker competitors. We have found excellent buys in the bank, health care and infrastructure sectors. Banks, from the super regionals to the small cap thrifts, offer good values with solid capital levels in our view, attractive valuations based on normalized earnings and dividend yields of 3%-5%. On the health care side, medical equipment stocks have traded off during the year on growth concerns. However, we think the longer term demographics are favorable to support earnings growth, and in the meantime, the balance sheets appear very strong and free cash flow yields approach 10% in many instances. In the infrastructure area, engineering and construction companies are trading at below average multiples of earnings with strong balance sheets in our view and could benefit from any infrastructure stimulus plan originating from Washington. Given the continuing economic uncertainty, we are maintaining above average cash levels. These cash reserves not only enhance our risk profile, but also give us flexibility to be opportunistic in what is likely to be a continued volatile market.
Overall, due to the significant number of negative headwinds domestically and abroad, we believe it is important to be risk sensitive while maintaining a long-term focus. The ability to outperform on the downside is a critical component of compounding returns in the long term. Short-term volatility is likely to remain high, and it is easy to make short-term mistakes at the expense of long-term results. Our fundamental approach to investing seeks above average returns over a full market cycle. This reinforces our confidence to pursue our disciplined, value-oriented investment process.
Thank you for your investment in Perkins Large Cap Value Fund.
6 | DECEMBER 31, 2011
(unaudited)
Perkins Large Cap Value Fund At A Glance
5 Top Performers – Holdings
| | | | | |
| | | Contribution |
| |
| Merck & Co., Inc | | | 0.18% | |
| Pfizer, Inc. | | | 0.18% | |
| Vodafone Group PLC (ADR) | | | 0.15% | |
| Wal-Mart Stores, Inc. | | | 0.13% | |
| Cisco Systems, Inc. | | | 0.13% | |
5 Bottom Performers – Holdings
| | | | | |
| | | Contribution |
| |
| Thermo Fisher Scientific, Inc. | | | –0.36% | |
| SunTrust Banks, Inc. | | | –0.32% | |
| JPMorgan Chase & Co. | | | –0.30% | |
| QEP Resources, Inc. | | | –0.30% | |
| Alcoa, Inc. | | | –0.29% | |
5 Top Performers – Sectors*
| | | | | | | | | | | | | |
| | | | | Fund Weighting
| | Russell 1000® Value
|
| | | Fund Contribution | | (Average % of Equity) | | Index Weighting |
| |
| Financials | | | 1.82% | | | | 22.72% | | | | 25.18% | |
| Consumer Discretionary | | | 0.51% | | | | 7.53% | | | | 8.90% | |
| Telecommunication Services | | | 0.31% | | | | 5.67% | | | | 4.78% | |
| Consumer Staples | | | 0.19% | | | | 9.75% | | | | 7.88% | |
| Industrials | | | –0.06% | | | | 10.42% | | | | 9.03% | |
5 Bottom Performers – Sectors*
| | | | | | | | | | | | | |
| | | | | Fund Weighting
| | Russell 1000® Value
|
| | | Fund Contribution | | (Average % of Equity) | | Index Weighting |
| |
| Health Care | | | –0.80% | | | | 16.59% | | | | 12.56% | |
| Utilities | | | –0.72% | | | | 1.90% | | | | 7.54% | |
| Energy | | | –0.53% | | | | 13.54% | | | | 12.47% | |
| Materials | | | –0.41% | | | | 3.64% | | | | 2.73% | |
| Information Technology | | | –0.18% | | | | 8.24% | | | | 8.93% | |
| | | |
| | | Security contribution to performance is measured by using an algorithm that multiplies the daily performance of each security with the previous day’s ending weight in the portfolio and is gross of advisory fees. Fixed income securities and certain equity securities, such as private placements and some share classes of equity securities, are excluded. |
| * | | Based on sector classification according to the Global Industry Classification Standard codes, which are the exclusive property and a service mark of MSCI Inc. and Standard & Poor’s. |
Janus Value Funds | 7
Perkins Large Cap Value Fund (unaudited)
5 Largest Equity Holdings – (% of Net Assets)
As of December 31, 2011
| | | | | |
AT&T, Inc.
Telephone – Integrated | | | 1.8% | |
Merck & Co., Inc.
Medical – Drugs | | | 1.7% | |
Pfizer, Inc.
Medical – Drugs | | | 1.7% | |
Ameriprise Financial, Inc.
Investment Management and Advisory Services | | | 1.7% | |
Berkshire Hathaway, Inc. – Class B
Reinsurance | | | 1.6% | |
| | | | | |
| | | | 8.5% | |
Asset Allocation – (% of Net Assets)
As of December 31, 2011
Top Country Allocations – Long Positions (% of Investment Securities)
As of December 31, 2011
8 | DECEMBER 31, 2011
(unaudited)
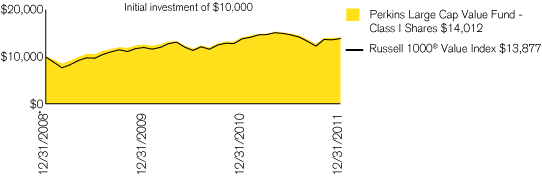
| | | | | | | | | | | | |
| Average Annual Total Return – for the periods ended December 31, 2011 | | | Expense Ratios – per the October 28, 2011 prospectuses |
| | | Fiscal
| | One
| | Since
| | | Total Annual Fund
| | Net Annual Fund
|
| | | Year-to-Date | | Year | | Inception* | | | Operating Expenses | | Operating Expenses |
| | | | | | | | | | | | |
| Perkins Large Cap Value Fund – Class A Shares | | | | | | | | | | | |
| | | | | | | | | | | | |
| NAV | | –5.40% | | –0.57% | | 11.58% | | | 1.19% | | 1.19% |
| | | | | | | | | | | | |
| MOP | | –10.85% | | –6.25% | | 9.40% | | | | | |
| | | | | | | | | | | | |
| Perkins Large Cap Value Fund – Class C Shares | | | | | | | | | | | |
| | | | | | | | | | | | |
| NAV | | –5.71% | | –1.27% | | 10.74% | | | 1.97% | | 1.97% |
| | | | | | | | | | | | |
| CDSC | | –6.60% | | –2.20% | | 10.74% | | | | | |
| | | | | | | | | | | | |
| Perkins Large Cap Value Fund – Class D Shares(1) | | –5.30% | | –0.37% | | 11.29% | | | 0.93% | | 0.93% |
| | | | | | | | | | | | |
| Perkins Large Cap Value Fund – Class I Shares | | –5.20% | | –0.20% | | 11.90% | | | 0.85% | | 0.85% |
| | | | | | | | | | | | |
| Perkins Large Cap Value Fund – Class S Shares | | –5.49% | | –0.72% | | 11.36% | | | 1.35% | | 1.35% |
| | | | | | | | | | | | |
| Perkins Large Cap Value Fund – Class T Shares | | –5.34% | | –0.41% | | 11.49% | | | 1.06% | | 1.06% |
| | | | | | | | | | | | |
| Russell 1000® Value Index | | –5.22% | | 0.39% | | 11.55% | | | | | |
| | | | | | | | | | | | |
| Lipper Quartile – Class I Shares | | – | | 2nd | | 3rd | | | | | |
| | | | | | | | | | | | |
| Lipper Ranking – based on total returns for Large-Cap Core Funds | | – | | 492/1064 | | 625/958 | | | | | |
| | | | | | | | | | | | |
| Visit janus.com/advisor/mutual-funds (or janus.com/allfunds if you hold Shares directly with Janus Capital) to view current performance and characteristic information | | | | | |
| | | | | | | | | | | | |
Data presented represents past performance, which is no guarantee of future results. Investment results and principal value will fluctuate so that shares, when redeemed, may be worth more or less than their original cost. Due to market volatility, current performance may be higher or lower than the performance shown. Call 877.33JANUS(52687) (or 800.525.3713 if you hold shares directly with Janus Capital) or visit janus.com/advisor/mutual-funds (or janus.com/allfunds if you hold shares directly with Janus Capital) for performance current to the most recent month-end.
Performance shown for Class A Shares at Maximum Offering Price (MOP) includes the Fund’s maximum sales charge of 5.75%. Performance shown at Net Asset Value (NAV) does not include this charge and would have been lower had this charge been taken into account.
Performance shown for Class C Shares includes a 1% contingent deferred sales charge (CDSC) on periods of less than 12 months. Performance shown at Net Asset Value (NAV) does not include this sales charge and would have been lower had this sales charge been taken into account.
See important disclosures on the next page.
Janus Value Funds | 9
Perkins Large Cap Value Fund (unaudited)
Janus Capital has contractually agreed to waive the Fund’s total annual fund operating expenses allocated to any class (excluding any performance adjustments to management fees, the distribution and shareholder servicing fees (applicable to Class A Shares, Class C Shares and Class S Shares), administrative services fees payable pursuant to the Transfer Agency Agreement (except for networking and omnibus fees), brokerage commissions, interest, dividends, taxes, acquired fund fees and expenses, and extraordinary expenses) to certain limits until at least November 1, 2012. The contractual waiver may be terminated or modified prior to this date only at the discretion of the Board of Trustees. Returns shown include fee waivers, if any, and without such waivers, returns would have been lower.
The expense information shown was determined based on net assets as of the fiscal period ended June 30, 2011. The effect of contractual waivers agreed to by Janus Capital, when applicable, are reflected under “Net Annual Fund Operating Expenses.” (All expenses are shown without the effect of expense offset arrangements. Pursuant to such arrangements, credits realized as a result of uninvested cash balances are used to reduce custodian and transfer agent expenses.)
The Fund has a performance-based management fee that adjusts up or down based on the Fund’s performance relative to an approved benchmark index over a performance measurement period. See the Fund’s Prospectus or Statement of Additional Information for more details.
The Fund’s performance may be affected by risks that include those associated with undervalued or overlooked companies, investments in specific industries or countries and potential conflicts of interest with the Janus “funds of funds.” Additional risks to the Fund may include those associated with investing in foreign securities, emerging markets, initial public offerings (“IPOs”), real estate investment trusts (“REITs”), and derivatives. Please see a Janus prospectus or janus.com/info (or janus.com/reports if you hold shares directly with Janus Capital) for more information about risks, portfolio holdings and other details.
The Fund may invest in derivatives which can be highly volatile and involve additional risks than if the underlying securities were held directly by the Fund. Such risks include gains or losses which, as a result of leverage, can be substantially greater than the derivatives’ original cost. There is also a possibility that derivatives may not perform as intended which can reduce opportunity for gains or result in losses by offsetting positive returns in other securities the Fund owns.
The Fund invests in REITs, which may be subject to a higher degree of market risk because of concentration in a specific industry, sector or geographic region. REITs may be subject to risks including, but not limited to: legal, political, liquidity, and interest rate risks, a decline in the value of real estate, risks related to general and economic conditions, changes in the value of the underlying property owned by the trust and defaults by borrowers. To the extent the Fund invests in foreign REITs, the Fund may be subject to fluctuations in currency rates or political or economic conditions in a particular country.
The Fund will normally invest at least 80% of its net assets, measured at the time of purchase, in the type of securities described by its name.
Due to certain investment strategies, the Fund may have an increased position in cash.
Returns include reinvestment of dividends from net investment income and distributions from capital gains. The returns shown do not reflect the deduction of taxes that a shareholder would pay on Fund distributions or the redemption of Fund shares. The returns do not include adjustments in accordance with generally accepted accounting principles required at the period end for financial reporting purposes.
Class A Shares, Class C Shares, Class S Shares, Class I Shares, and Class T Shares of the Fund commenced operations on July 6, 2009. The historical performance shown for periods prior to July 6, 2009 was calculated using the performance and the fees and expenses of one or more other share classes of a predecessor fund(s), accounting for, when applicable and permitted, any fee and expense limitations and waivers. If each respective share class of the Fund had been available during periods prior to July 6, 2009, the performance shown may have been different. Please refer to the Fund’s prospectus for further details concerning historical performance.
Class D Shares commenced operations on February 16, 2010. The performance shown for Class D Shares for periods prior to February 16, 2010, reflects the performance of the Fund’s Class I Shares. The performance shown reflects the fees and expenses of Class D Shares, without the effect of any fee and expense limitations or waivers. If Class D Shares of the Fund had been available during periods prior to February 16, 2010, the performance shown may have been different. The performance shown for periods following the Fund’s commencement of Class D Shares reflects the fees and expenses of Class D Shares, net of any fee and expense limitations or waivers.
Lipper, a wholly-owned subsidiary of Thomson Reuters, provides independent insight on global collective investments including mutual funds, retirement funds, hedge funds, fund fees and expenses to the asset management and media communities. Lipper ranks the performance of mutual funds within a classification of funds that have similar investment objectives. Rankings are historical with capital gains and dividends reinvested and do not include the effect of loads.
Ranking is for Class I Shares only; other classes may have different performance characteristics. When an expense waiver is in effect, it may have a material effect on the total return, and therefore the ranking for the period.
There is no assurance that the investment process will consistently lead to successful investing.
See Notes to Schedules of Investments for index definitions.
The Fund’s portfolio may differ significantly from the securities held in the index. The index is unmanaged and is not available for direct investment; therefore, its performance does not reflect the expenses associated with the active management of an actual portfolio.
See “Explanations of Charts, Tables and Financial Statements.”
| | | |
| * | | The predecessor Fund’s inception date – December 31, 2008 |
| (1) | | Closed to new investors. |
10 | DECEMBER 31, 2011
(unaudited)
The examples below show you the ongoing costs (in dollars) of investing in your Fund and allow you to compare these costs with those of other mutual funds. Please refer to the section Useful Information About Your Fund Report for a detailed explanation of the information presented in these charts.
| | | | | | | | | | | | | | | |
| | | Beginning Account Value
| | Ending Account Value
| | Expenses Paid During Period
| | |
| Expense Example – Class A Shares | | (7/1/11) | | (12/31/11) | | (7/1/11 - 12/31/11)† | | |
| |
| |
| Actual | | $ | 1,000.00 | | | $ | 946.00 | | | $ | 5.53 | | | |
| |
| |
Hypothetical
(5% return before expenses) | | $ | 1,000.00 | | | $ | 1,019.46 | | | $ | 5.74 | | | |
| |
| |
| | | | | | | | | | | | | | | |
| | | | | | | | | | | | | | | |
| | | Beginning Account Value
| | Ending Account Value
| | Expenses Paid During Period
| | |
| Expense Example – Class C Shares | | (7/1/11) | | (12/31/11) | | (7/1/11 - 12/31/11)† | | |
| |
| |
| Actual | | $ | 1,000.00 | | | $ | 942.90 | | | $ | 9.57 | | | |
| |
| |
Hypothetical
(5% return before expenses) | | $ | 1,000.00 | | | $ | 1,015.28 | | | $ | 9.93 | | | |
| |
| |
| | | | | | | | | | | | | | | |
| | | | | | | | | | | | | | | |
| | | Beginning Account Value
| | Ending Account Value
| | Expenses Paid During Period
| | |
| Expense Example – Class D Shares | | (7/1/11) | | (12/31/11) | | (7/1/11 - 12/31/11)† | | |
| |
| |
| Actual | | $ | 1,000.00 | | | $ | 947.00 | | | $ | 4.65 | | | |
| |
| |
Hypothetical
(5% return before expenses) | | $ | 1,000.00 | | | $ | 1,020.36 | | | $ | 4.82 | | | |
| |
| |
| | | | | | | | | | | | | | | |
| | | | | | | | | | | | | | | |
| | | Beginning Account Value
| | Ending Account Value
| | Expenses Paid During Period
| | |
| Expense Example – Class I Shares | | (7/1/11) | | (12/31/11) | | (7/1/11 - 12/31/11)† | | |
| |
| |
| Actual | | $ | 1,000.00 | | | $ | 948.00 | | | $ | 4.06 | | | |
| |
| |
Hypothetical
(5% return before expenses) | | $ | 1,000.00 | | | $ | 1,020.96 | | | $ | 4.22 | | | |
| |
| |
| | | | | | | | | | | | | | | |
| | | | | | | | | | | | | | | |
| | | Beginning Account Value
| | Ending Account Value
| | Expenses Paid During Period
| | |
| Expense Example – Class S Shares | | (7/1/11) | | (12/31/11) | | (7/1/11 - 12/31/11)† | | |
| |
| |
| Actual | | $ | 1,000.00 | | | $ | 945.10 | | | $ | 6.41 | | | |
| |
| |
Hypothetical
(5% return before expenses) | | $ | 1,000.00 | | | $ | 1,018.55 | | | $ | 6.65 | | | |
| |
| |
| | | | | | | | | | | | | | | |
| | | | | | | | | | | | | | | |
| | | Beginning Account Value
| | Ending Account Value
| | Expenses Paid During Period
| | |
| Expense Example – Class T Shares | | (7/1/11) | | (12/31/11) | | (7/1/11 - 12/31/11)† | | |
| |
| |
| Actual | | $ | 1,000.00 | | | $ | 946.60 | | | $ | 5.19 | | | |
| |
| |
Hypothetical
(5% return before expenses) | | $ | 1,000.00 | | | $ | 1,019.81 | | | $ | 5.38 | | | |
| |
| |
| | | |
| † | | Expenses are equal to the annualized expense ratio of 1.13% for Class A Shares, 1.96% for Class C Shares, 0.95% for Class D Shares, 0.83% for Class I Shares, 1.31% for Class S Shares and 1.06% for Class T Shares multiplied by the average account value over the period, multiplied by 184/366 (to reflect the one-half year period). Expenses include effect of contractual waivers by Janus Capital. |
Janus Value Funds | 11
Perkins Large Cap Value Fund
Schedule of Investments (unaudited)
As of December 31, 2011
| | | | | | | | | | | |
| Shares or Principal Amount | | Value | | | |
| |
| Common Stock – 89.8% | | | | | | |
| Aerospace and Defense – 2.0% | | | | | | |
| | 14,200 | | | General Dynamics Corp. | | $ | 943,022 | | | |
| | 29,000 | | | Raytheon Co. | | | 1,403,020 | | | |
| | 6,500 | | | Rockwell Collins, Inc. | | | 359,905 | | | |
| | | | | | | | 2,705,947 | | | |
| Aerospace and Defense – Equipment – 0.4% | | | | | | |
| | 6,500 | | | United Technologies Corp. | | | 475,085 | | | |
| Agricultural Chemicals – 0.8% | | | | | | |
| | 21,000 | | | Mosaic Co. | | | 1,059,030 | | | |
| Applications Software – 1.2% | | | | | | |
| | 62,000 | | | Microsoft Corp. | | | 1,609,520 | | | |
| Beverages – Non-Alcoholic – 1.3% | | | | | | |
| | 26,500 | | | PepsiCo, Inc. | | | 1,758,275 | | | |
| Brewery – 1.2% | | | | | | |
| | 35,000 | | | Molson Coors Brewing Co. – Class B | | | 1,523,900 | | | |
| Cable/Satellite Television – 0.8% | | | | | | |
| | 42,000 | | | Comcast Corp. – Class A | | | 995,820 | | | |
| Cellular Telecommunications – 1.6% | | | | | | |
| | 75,000 | | | Vodafone Group PLC (ADR) | | | 2,102,250 | | | |
| Commercial Banks – 0.7% | | | | | | |
| | 38,500 | | | BB&T Corp. | | | 969,045 | | | |
| Commercial Services – Finance – 1.0% | | | | | | |
| | 70,000 | | | Western Union Co. | | | 1,278,200 | | | |
| Computer Services – 0.7% | | | | | | |
| | 6,500 | | | Accenture, Ltd. – Class A (U.S. Shares) | | | 345,995 | | | |
| | 3,000 | | | International Business Machines Corp. | | | 551,640 | | | |
| | | | | | | | 897,635 | | | |
| Computer Software – 0.2% | | | | | | |
| | 9,000 | | | Akamai Technologies, Inc.* | | | 290,520 | | | |
| Computers – 0.2% | | | | | | |
| | 11,000 | | | Hewlett-Packard Co. | | | 283,360 | | | |
| Computers – Memory Devices – 0.3% | | | | | | |
| | 12,500 | | | NetApp, Inc.* | | | 453,375 | | | |
| Consumer Products – Miscellaneous – 0.3% | | | | | | |
| | 6,000 | | | Kimberly-Clark Corp. | | | 441,360 | | | |
| Cosmetics and Toiletries – 1.2% | | | | | | |
| | 23,000 | | | Procter & Gamble Co. | | | 1,534,330 | | | |
| Diversified Banking Institutions – 2.1% | | | | | | |
| | 58,000 | | | Bank of America Corp. | | | 322,480 | | | |
| | 7,500 | | | Goldman Sachs Group, Inc. | | | 678,225 | | | |
| | 54,000 | | | JPMorgan Chase & Co. | | | 1,795,500 | | | |
| | | | | | | | 2,796,205 | | | |
| Diversified Operations – 2.8% | | | | | | |
| | 79,000 | | | General Electric Co. | | | 1,414,890 | | | |
| | 16,300 | | | Illinois Tool Works, Inc. | | | 761,373 | | | |
| | 32,000 | | | Tyco International, Ltd. (U.S. Shares) | | | 1,494,720 | | | |
| | | | | | | | 3,670,983 | | | |
| Electric – Integrated – 2.1% | | | | | | |
| | 18,100 | | | Entergy Corp. | | | 1,322,205 | | | |
| | 12,100 | | | Exelon Corp. | | | 524,777 | | | |
| | 33,000 | | | PPL Corp. | | | 970,860 | | | |
| | | | | | | | 2,817,842 | | | |
| Electronic Components – Miscellaneous – 0.4% | | | | | | |
| | 14,000 | | | Garmin, Ltd. | | | 557,340 | | | |
| Electronic Components – Semiconductors – 0.9% | | | | | | |
| | 7,500 | | | Altera Corp. | | | 278,250 | | | |
| | 36,500 | | | Intel Corp. | | | 885,125 | | | |
| | | | | | | | 1,163,375 | | | |
| Electronic Forms – 0.4% | | | | | | |
| | 16,500 | | | Adobe Systems, Inc.* | | | 466,455 | | | |
| Engineering – Research and Development Services – 1.5% | | | | | | |
| | 16,000 | | | Jacobs Engineering Group, Inc.* | | | 649,280 | | | |
| | 19,000 | | | KBR, Inc. | | | 529,530 | | | |
| | 22,000 | | | URS Corp.* | | | 772,640 | | | |
| | | | | | | | 1,951,450 | | | |
| Enterprise Software/Services – 0.3% | | | | | | |
| | 15,500 | | | Oracle Corp. | | | 397,575 | | | |
| Fiduciary Banks – 0.8% | | | | | | |
| | 27,500 | | | State Street Corp. | | | 1,108,525 | | | |
| Finance – Credit Card – 1.1% | | | | | | |
| | 59,000 | | | Discover Financial Services | | | 1,416,000 | | | |
| Food – Miscellaneous/Diversified – 1.1% | | | | | | |
| | 42,500 | | | Unilever PLC (ADR) | | | 1,424,600 | | | |
| Food – Retail – 1.0% | | | | | | |
| | 30,000 | | | Kroger Co. | | | 726,600 | | | |
| | 28,000 | | | Safeway, Inc. | | | 589,120 | | | |
| | | | | | | | 1,315,720 | | | |
| Food – Wholesale/Distribution – 0.5% | | | | | | |
| | 24,000 | | | Sysco Corp. | | | 703,920 | | | |
| Gold Mining – 1.0% | | | | | | |
| | 19,000 | | | Goldcorp, Inc. (U.S. Shares) | | | 840,750 | | | |
| | 9,000 | | | Newmont Mining Corp. | | | 540,090 | | | |
| | | | | | | | 1,380,840 | | | |
| Instruments – Controls – 0.5% | | | | | | |
| | 12,500 | | | Honeywell International, Inc. | | | 679,375 | | | |
| Instruments – Scientific – 0.9% | | | | | | |
| | 26,000 | | | Thermo Fisher Scientific, Inc.* | | | 1,169,220 | | | |
| Internet Security – 0.5% | | | | | | |
| | 41,000 | | | Symantec Corp.* | | | 641,650 | | | |
| Investment Management and Advisory Services – 3.3% | | | | | | |
| | 45,500 | | | Ameriprise Financial, Inc. | | | 2,258,620 | | | |
| | 13,000 | | | Franklin Resources, Inc. | | | 1,248,780 | | | |
| | 42,000 | | | INVESCO, Ltd. | | | 843,780 | | | |
| | | | | | | | 4,351,180 | | | |
| Machinery – Farm – 0.4% | | | | | | |
| | 6,000 | | | Deere & Co. | | | 464,100 | | | |
| Medical – Biomedical and Genetic – 1.8% | | | | | | |
| | 15,000 | | | Amgen, Inc. | | | 963,150 | | | |
| | 14,000 | | | Gilead Sciences, Inc.* | | | 573,020 | | | |
| | 23,000 | | | Life Technologies Corp.* | | | 894,930 | | | |
| | | | | | | | 2,431,100 | | | |
| Medical – Drugs – 6.6% | | | | | | |
| | 31,400 | | | Abbott Laboratories | | | 1,765,622 | | | |
| | 19,500 | | | Johnson & Johnson | | | 1,278,810 | | | |
| | 61,000 | | | Merck & Co., Inc. | | | 2,299,700 | | | |
See Notes to Schedules of Investments and Financial Statements.
12 | DECEMBER 31, 2011
Schedule of Investments (unaudited)
As of December 31, 2011
| | | | | | | | | | | |
| Shares or Principal Amount | | Value | | | |
| |
| Medical – Drugs – (continued) | | | | | | |
| | | | | | | | | | | |
| | 19,500 | | | Novartis A.G. (ADR) | | $ | 1,114,815 | | | |
| | 106,000 | | | Pfizer, Inc. | | | 2,293,840 | | | |
| | | | | | | | 8,752,787 | | | |
| Medical – Generic Drugs – 0.7% | | | | | | |
| | 24,000 | | | Teva Pharmaceutical S.P. (ADR) | | | 968,640 | | | |
| Medical – HMO – 0.4% | | | | | | |
| | 8,000 | | | WellPoint, Inc. | | | 530,000 | | | |
| Medical – Wholesale Drug Distributors – 0.5% | | | | | | |
| | 8,000 | | | McKesson Corp. | | | 623,280 | | | |
| Medical Instruments – 1.3% | | | | | | |
| | 23,000 | | | Medtronic, Inc. | | | 879,750 | | | |
| | 25,000 | | | St. Jude Medical, Inc. | | | 857,500 | | | |
| | | | | | | | 1,737,250 | | | |
| Medical Labs and Testing Services – 0.5% | | | �� | | | |
| | 7,000 | | | Laboratory Corp. of America Holdings* | | | 601,790 | | | |
| Medical Products – 2.7% | | | | | | |
| | 20,500 | | | Becton, Dickinson and Co. | | | 1,531,760 | | | |
| | 24,000 | | | Covidien PLC (U.S. Shares) | | | 1,080,240 | | | |
| | 17,500 | | | Zimmer Holdings, Inc. | | | 934,850 | | | |
| | | | | | | | 3,546,850 | | | |
| Metal – Aluminum – 0.4% | | | | | | |
| | 61,000 | | | Alcoa, Inc. | | | 527,650 | | | |
| Metal – Copper – 0.6% | | | | | | |
| | 23,000 | | | Freeport-McMoRan Copper & Gold, Inc. – Class B | | | 846,170 | | | |
| Motion Pictures and Services – 0.3% | | | | | | |
| | 11,500 | | | Dolby Laboratories, Inc.* | | | 350,865 | | | |
| Multi-Line Insurance – 1.4% | | | | | | |
| | 69,000 | | | Allstate Corp. | | | 1,891,290 | | | |
| Multimedia – 1.9% | | | | | | |
| | 26,000 | | | News Corp. – Class A | | | 463,840 | | | |
| | 21,000 | | | Time Warner, Inc. | | | 758,940 | | | |
| | 35,500 | | | Walt Disney Co. | | | 1,331,250 | | | |
| | | | | | | | 2,554,030 | | | |
| Networking Products – 0.8% | | | | | | |
| | 61,000 | | | Cisco Systems, Inc. | | | 1,102,880 | | | |
| Non-Hazardous Waste Disposal – 0.8% | | | | | | |
| | 36,000 | | | Republic Services, Inc. | | | 991,800 | | | |
| Oil – Field Services – 0.4% | | | | | | |
| | 8,000 | | | Schlumberger, Ltd. (U.S. Shares) | | | 546,480 | | | |
| Oil and Gas Drilling – 0.9% | | | | | | |
| | 24,000 | | | Ensco International PLC (ADR) | | | 1,126,080 | | | |
| Oil Companies – Exploration and Production – 6.5% | | | | | | |
| | 12,500 | | | Anadarko Petroleum Corp. | | | 954,125 | | | |
| | 5,100 | | | Apache Corp. | | | 461,958 | | | |
| | 18,000 | | | Devon Energy Corp. | | | 1,116,000 | | | |
| | 9,500 | | | EQT Corp. | | | 520,505 | | | |
| | 65,000 | | | Exco Resources, Inc. | | | 679,250 | | | |
| | 26,500 | | | Forest Oil Corp.* | | | 359,075 | | | |
| | 1 | | | Lone Pine Resources, Inc.* | | | 7 | | | |
| | 15,500 | | | Noble Energy, Inc. | | | 1,463,045 | | | |
| | 9,000 | | | Occidental Petroleum Corp. | | | 843,300 | | | |
| | 22,000 | | | Plains Exploration & Production Co.* | | | 807,840 | | | |
| | 30,500 | | | QEP Resources, Inc. | | | 893,650 | | | |
| | 15,300 | | | Southwestern Energy Co.* | | | 488,682 | | | |
| | | | | | | | 8,587,437 | | | |
| Oil Companies – Integrated – 2.7% | | | | | | |
| | 9,000 | | | Chevron Corp. | | | 957,600 | | | |
| | 12,500 | | | Exxon Mobil Corp. | | | 1,059,500 | | | |
| | 28,500 | | | Hess Corp. | | | 1,618,800 | | | |
| | | | | | | | 3,635,900 | | | |
| Oil Field Machinery and Equipment – 0.6% | | | | | | |
| | 12,000 | | | National Oilwell Varco, Inc. | | | 815,880 | | | |
| Pipelines – 0.5% | | | | | | |
| | 14,000 | | | Enterprise Products Partners L.P. | | | 649,320 | | | |
| Property and Casualty Insurance – 0.8% | | | | | | |
| | 17,000 | | | Travelers Cos., Inc. | | | 1,005,890 | | | |
| Publishing – Books – 0.7% | | | | | | |
| | 40,500 | | | Reed Elsevier N.V. (ADR) | | | 940,005 | | | |
| Reinsurance – 3.2% | | | | | | |
| | 28,000 | | | Berkshire Hathaway, Inc. – Class B* | | | 2,136,400 | | | |
| | 12,500 | | | Everest Re Group, Ltd. | | | 1,051,125 | | | |
| | 17,000 | | | PartnerRe, Ltd. | | | 1,091,570 | | | |
| | | | | | | | 4,279,095 | | | |
| REIT – Diversified – 1.1% | | | | | | |
| | 81,000 | | | Weyerhaeuser Co. | | | 1,512,270 | | | |
| Retail – Building Products – 0.3% | | | | | | |
| | 17,000 | | | Lowe’s Cos., Inc. | | | 431,460 | | | |
| Retail – Consumer Electronics – 0.3% | | | | | | |
| | 15,500 | | | Best Buy Co., Inc. | | | 362,235 | | | |
| Retail – Discount – 1.4% | | | | | | |
| | 13,500 | | | Target Corp. | | | 691,470 | | | |
| | 19,500 | | | Wal-Mart Stores, Inc. | | | 1,165,320 | | | |
| | | | | | | | 1,856,790 | | | |
| Retail – Drug Store – 1.5% | | | | | | |
| | 19,500 | | | CVS Caremark Corp. | | | 795,210 | | | |
| | 34,000 | | | Walgreen Co. | | | 1,124,040 | | | |
| | | | | | | | 1,919,250 | | | |
| Retail – Office Supplies – 0.6% | | | | | | |
| | 60,000 | | | Staples, Inc. | | | 833,400 | | | |
| Retail – Regional Department Stores – 0.4% | | | | | | |
| | 12,000 | | | Kohl’s Corp. | | | 592,200 | | | |
| Savings/Loan/Thrifts – 0.8% | | | | | | |
| | 79,000 | | | First Niagara Financial Group, Inc. | | | 681,770 | | | |
| | 30,000 | | | Washington Federal, Inc. | | | 419,700 | | | |
| | | | | | | | 1,101,470 | | | |
| Semiconductor Components/Integrated Circuits – 0.3% | | | | | | |
| | 7,000 | | | Qualcomm, Inc. | | | 382,900 | | | |
| Semiconductor Equipment – 0.7% | | | | | | |
| | 92,000 | | | Applied Materials, Inc. | | | 985,320 | | | |
| Super-Regional Banks – 5.3% | | | | | | |
| | 69,000 | | | Fifth Third Bancorp. | | | 877,680 | | | |
| | 32,000 | | | PNC Financial Services Group, Inc. | | | 1,845,440 | | | |
| | 64,000 | | | SunTrust Banks, Inc. | | | 1,132,800 | | | |
See Notes to Schedules of Investments and Financial Statements.
Janus Value Funds | 13
Perkins Large Cap Value Fund
Schedule of Investments (unaudited)
As of December 31, 2011
| | | | | | | | | | | |
| Shares or Principal Amount | | Value | | | |
| |
| Super-Regional Banks – (continued) | | | | | | |
| | | | | | | | | | | |
| | 41,000 | | | U.S. Bancorp. | | $ | 1,109,050 | | | |
| | 72,500 | | | Wells Fargo & Co. | | | 1,998,100 | | | |
| | | | | | | | 6,963,070 | | | |
| Telephone – Integrated – 3.6% | | | | | | |
| | 79,500 | | | AT&T, Inc. | | | 2,404,080 | | | |
| | 42,000 | | | CenturyLink, Inc. | | | 1,562,400 | | | |
| | 21,500 | | | Verizon Communications, Inc. | | | 862,580 | | | |
| | | | | | | | 4,829,060 | | | |
| Transportation – Railroad – 0.2% | | | | | | |
| | 3,500 | | | Kansas City Southern* | | | 238,035 | | | |
| Transportation – Services – 0.5% | | | | | | |
| | 7,500 | | | FedEx Corp. | | | 626,325 | | | |
| X-Ray Equipment – 0.3% | | | | | | |
| | 24,000 | | | Hologic, Inc.* | | | 420,240 | | | |
| |
| |
| Total Common Stock (cost $114,928,440) | | | 118,950,501 | | | |
| |
| |
| Repurchase Agreement – 10.0% | | | | | | |
| | $13,281,000 | | | ING Financial Markets LLC, 0.0100%, dated 12/30/11, maturing 1/3/12 to be repurchased at $13,281,015
collateralized by $983,577 in U.S. Government Agencies 2.2250% – 5.0000%, 7/17/15 – 2/1/36 and by $12,271,552 in U.S. Treasuries 0.2500% – 4.5000%,
5/31/13 – 11/15/41
with respective values of $566,246 and $12,980,461 (cost $13,281,000) | | | 13,281,000 | | | |
| |
| |
| Total Investments (total cost $128,209,440) – 99.8% | | | 132,231,501 | | | |
| |
| |
| Cash, Receivables and Other Assets, net of Liabilities – 0.2% | | | 221,649 | | | |
| |
| |
| Net Assets – 100% | | $ | 132,453,150 | | | |
| |
| |
Summary of Investments by Country – (Long Positions)
| | | | | | | | | |
| | | | | | % of Investment
| |
| Country | | Value | | | Securities | |
| |
| |
| Bermuda | | $ | 2,986,475 | | | | 2.3% | |
| Canada | | | 840,750 | | | | 0.6% | |
| Curacao | | | 546,480 | | | | 0.4% | |
| Ireland | | | 1,426,235 | | | | 1.1% | |
| Israel | | �� | 968,640 | | | | 0.7% | |
| Netherlands | | | 940,005 | | | | 0.7% | |
| Switzerland | | | 3,166,875 | | | | 2.4% | |
| United Kingdom | | | 4,652,930 | | | | 3.5% | |
United States†† | | | 116,703,111 | | | | 88.3% | |
| |
| |
| Total | | $ | 132,231,501 | | | | 100.0% | |
| | | |
| †† | | Includes Cash Equivalents (78.2% excluding Cash Equivalents). |
See Notes to Schedules of Investments and Financial Statements.
14 | DECEMBER 31, 2011
Perkins Mid Cap Value Fund (unaudited)(closed to certain new investors)
| | | | | | | |
Fund Snapshot
This Fund seeks to uncover what the portfolio managers believe are fundamentally and financially strong mid-sized companies exhibiting favorable risk-reward characteristics.
| | | |
Tom Perkins
co-portfolio manager | | 
Jeff Kautz
co-portfolio manager |
Performance Overview
During the six months ended December 31, 2011, Perkins Mid Cap Value Fund’s Class T Shares returned -7.20%, outperforming the Fund’s benchmark, the Russell Midcap Value Index, which returned -7.56%.
Our stock selection was positive relative to the benchmark. Not surprisingly, the Fund held up significantly better in the areas where the index had some of the largest declines (industrials, financials and telecommunication services). This is consistent with our approach of identifying higher quality stocks with less downside risk. Our cash position and small investment in index puts helped mitigate the market decline. The primary negative influence was our normal significant underweight in utilities. Utilities, which were up over 8%, detracted over 150 basis points from performance. Also detracting from performance was our small investment in index puts.
Economic Environment
Stocks suffered a significant sell-off in the third quarter, as problems in Europe became much more apparent. The focus was on European sovereign debt issues and undercapitalized European banks. The inability to take substantive action to address those problems created a situation of great uncertainty and raised questions of global contagion.
The stock market rebounded from the third quarter correction, but not enough to entirely offset the losses from the third quarter. The bounce back was fueled by strong earnings reports, improving economic data, and a late December liquidity injection by the European Central Bank (ECB). Despite these short-term trend improvements, our market perspective has not changed, as we remain somewhat cautious with higher than normal cash levels. The environment remains one of extremely strong company fundamentals offset by very challenging economic and financial issues. Economic vulnerability persists with continuous headwinds from the European debt crisis coupled with ongoing governmental and consumer deleveraging, and high unemployment levels. Volatility drives market sentiment, even with the backdrop of continued monetary actions at home (securities repurchases, low interest rates), and, to date, ineffective attempts to remedy the long term capital shortage of European banks. And so, during the short term, uncertainty will likely persist until we regain footing on macro fundamentals.
Contagion risk remains as mounting European debt problems affect financial structures globally. Concerns revolve around the European banking system as many banks are thinly capitalized and carry debt of distressed “PIIGS” (Portugal, Italy, Ireland, Greece and Spain) countries at unrealistically high values. In an effort to absorb any potential shocks from the Euro zone debt crisis and encourage domestic growth, U.S. Fed policy indicates interest rates will remain somewhat artificially low well into 2013.
In spite of macroeconomic headwinds, microeconomic fundamentals remain positive. The market appears reasonably valued with the S&P 500 Index trading at period end at about 13x 2011 earnings estimates of $95, and an earnings yield of almost 8%. As compared to 10-year Treasuries’ yields of slightly under 2%, there is a 6% risk premium to owning stocks – the highest level in three decades. Moreover, for the first time in 50 years, stocks yield more than 10-year Treasuries, as the S&P 500 dividend yield currently is over 2%. Corporate balance sheets continue to strengthen, and U.S. banks have much better capital structures than before the financial crisis. By these metrics, equities remain an attractive asset class, especially compared to bonds. Continuing high volatility provides for pricing dislocation and opportunity.
Holdings That Contributed to Performance
Oil & gas producer Petrohawk Energy rallied 53% on news that BHP Billiton would acquire the company, allowing it to tap into the American shale natural gas market. The acquisition price was slightly above what our
Janus Value Funds | 15
Perkins Mid Cap Value Fund (unaudited)(closed to certain new investors)
estimate of the stock’s asset value had been. We exited the position.
Immucor, a maker of systems used in blood transfusions, rose 27% after it agreed to be acquired by private equity firm TPG Capital in a $1.97 billion deal. We eliminated the position.
In the past the fund has consistently benefited from merger and acquisition activity. We view this as an affirmation of the valuation focus of our investment process. We believe that merger and acquisition activity will be strong in the coming year.
Holdings That Detracted from Performance
First Niagara Financial Group was a disappointment in 2011. With a strong, high-quality earnings stream in our view, no credit problems, a large dividend and robust capital ratios First Niagara was purchased with downside protection in mind. However, two items hurt the stock. First, the bank agreed to purchase a large deposit franchise from HSBC in a deal that required a capital raise. This overhang hurt the stock more than we anticipated. Second, the collapse of interest rates in the U.S. adversely impacted highly liquid balance sheets like First Niagara as re-investment in lower yielding securities drags down returns. The bank finally raised capital in December, and unfortunately cut the dividend. We retained our position as the stock sells at less than 10x current earnings and has a 3.6% dividend yield. We also appreciate the company’s liquid and strong balance sheet and what we believe are its good growth prospects.
Life science tool provider Thermo Fisher declined over 30% due to uncertainty related to government funding for life science research. We maintain our long-held position in the stock based on its attractive reward/risk ratio, its preeminent leadership position in the industry, strong balance sheet, and above average stable free cash flow generation, in our view.
Derivatives
Small investments in index put options were maintained during the period for hedging purposes (making an investment in an attempt to reduce the risk of adverse price movements) reflecting our concerns about macroeconomic issues. We believe that these puts provide some insurance against the small but real possibility of a significant market disruption from sovereign risk compounded by contagion and trillions of dollars of derivatives. We believe including this type of investment is consistent with our sensitivity to the need to preserve capital and our objective of providing steady, above average long-term investment returns on both an absolute and relative basis. In aggregate, these positions were slightly additive to the Fund’s performance in the period. Please see “Notes to Financial Statements” for a discussion of derivatives used by the Fund.
Outlook and Positioning
We believe that our quality-oriented, risk-sensitive investment approach is especially important in this type of difficult environment. High-quality companies with strong balance sheets and high free cash flows will likely hold up better in stressed environments over the long term, and are better positioned against weaker competitors. We have found excellent buys in banks, health care and infrastructure. Banks, from the super regionals to the small cap thrifts, offer good values with solid capital levels, in our view attractive valuations based on normalized earnings and dividend yields of 3%-5%. On the health care side, medical equipment stocks have traded off during the year on growth concerns. However, we think the longer term demographics are favorable to support earnings growth, and in the meantime, the balance sheets appear very strong and free cash flow yields approach 10% in many instances. In the infrastructure area, engineering and construction companies are trading at below average multiples of earnings with strong balance sheets in our view and could benefit from any infrastructure stimulus plan originating from Washington. Given the continuing economic uncertainty, we are maintaining above average cash levels. These cash reserves not only enhance our risk profile, but also give us flexibility to be opportunistic in what is likely to be a volatile market.
Overall, due to the significant number of negative headwinds domestically and abroad, we believe it is important to be risk sensitive while maintaining a long-term focus. The ability to outperform on the downside is a critical component of compounding returns. Volatility is likely to remain high, and it is easy to make short-term mistakes at the expense of long-term results. Our fundamental approach to investing has created above average returns over each full market cycle of our Funds’ existence. This reinforces our confidence to pursue our disciplined, value oriented, investment process.
Thank you for your investment in Perkins Mid Cap Value Fund.
16 | DECEMBER 31, 2011
(unaudited)(closed to certain new investors)
Perkins Mid Cap Value Fund At A Glance
5 Top Performers – Holdings
| | | | | |
| | | Contribution |
| |
iShares Russell 2000® Index Fund (ETF) | | | 0.68% | |
| Petrohawk Energy Corp. | | | 0.21% | |
| American Eagle Outfitters, Inc. | | | 0.15% | |
| Immucor, Inc. | | | 0.15% | |
| Garmin, Ltd. | | | 0.14% | |
5 Bottom Performers – Holdings
| | | | | |
| | | Contribution |
| |
| First Niagara Financial Group, Inc. | | | –0.46% | |
| Thermo Fisher Scientific, Inc. | | | –0.36% | |
| QEP Resources, Inc. | | | –0.36% | |
| Forest Oil Corp. | | | –0.36% | |
| URS Corp. | | | –0.33% | |
5 Top Performers – Sectors*
| | | | | | | | | | | | | |
| | | | | Fund Weighting
| | Russell Midcap® Value
|
| | | Fund Contribution | | (Average % of Equity) | | Index Weighting |
| |
| Industrials | | | 0.88% | | | | 13.26% | | | | 10.40% | |
| Telecommunication Services | | | 0.47% | | | | 2.83% | | | | 0.86% | |
| Financials | | | 0.45% | | | | 25.23% | | | | 30.85% | |
| Consumer Staples | | | 0.31% | | | | 6.37% | | | | 6.71% | |
| Information Technology | | | 0.24% | | | | 11.21% | | | | 8.27% | |
5 Bottom Performers – Sectors*
| | | | | | | | | | | | | |
| | | | | Fund Weighting
| | Russell Midcap® Value
|
| | | Fund Contribution | | (Average % of Equity) | | Index Weighting |
| |
| Utilities | | | –1.66% | | | | 3.26% | | | | 13.91% | |
| Health Care | | | –0.69% | | | | 12.24% | | | | 6.40% | |
| Materials | | | –0.12% | | | | 5.50% | | | | 4.60% | |
| Energy | | | 0.00% | | | | 13.85% | | | | 6.74% | |
| Other** | | | 0.07% | | | | –4.85% | | | | 0.00% | |
| | | |
| | | Security contribution to performance is measured by using an algorithm that multiplies the daily performance of each security with the previous day’s ending weight in the portfolio and is gross of advisory fees. Fixed income securities and certain equity securities, such as private placements and some share classes of equity securities, are excluded. |
| * | | Based on sector classification according to the Global Industry Classification Standard (“GICS”) codes, which are the exclusive property and a service mark of MSCI Inc. and Standard & Poor’s. |
| ** | | Not a GICS classified sector. |
Janus Value Funds | 17
Perkins Mid Cap Value Fund (unaudited)(closed to certain new investors)
5 Largest Equity Holdings – (% of Net Assets)
As of December 31, 2011
| | | | | |
Ameriprise Financial, Inc.
Investment Management and Advisory Services | | | 1.8% | |
Allstate Corp.
Multi-Line Insurance | | | 1.4% | |
Western Union Co.
Commercial Services – Finance | | | 1.4% | |
CenturyLink, Inc.
Telephone – Integrated | | | 1.4% | |
URS Corp.
Engineering – Research and Development Services | | | 1.2% | |
| | | | | |
| | | | 7.2% | |
Asset Allocation – (% of Net Assets)
As of December 31, 2011
Top Country Allocations – Long Positions (% of Investment Securities)
As of December 31, 2011
18 | DECEMBER 31, 2011
(unaudited)(closed to certain new investors)
| | | | | | | | | | | | | | | | |
| Average Annual Total Return – for the periods ended December 31, 2011 | | | Expense Ratios – per the October 28, 2011 prospectuses |
| | | Fiscal
| | One
| | Five
| | Ten
| | Since
| | | Total Annual Fund
| | Net Annual Fund
|
| | | Year-to-Date | | Year | | Year | | Year | | Inception* | | | Operating Expenses | | Operating Expenses |
| | | | | | | | | | | | | | | | |
Perkins Mid Cap Value Fund –
Class A Shares(1) | | | | | | | | | | | | | | | |
| | | | | | | | | | | | | | | | |
| NAV | | –7.24% | | –2.71% | | 2.45% | | 7.39% | | 11.61% | | | 1.21% | | 1.17% |
| | | | | | | | | | | | | | | | |
| MOP | | –12.56% | | –8.32% | | 1.24% | | 6.75% | | 11.12% | | | | | |
| | | | | | | | | | | | | | | | |
Perkins Mid Cap Value Fund –
Class C Shares(1) | | | | | | | | | | | | | | | |
| | | | | | | | | | | | | | | | |
| NAV | | –7.57% | | –3.38% | | 1.71% | | 6.62% | | 10.90% | | | 1.88% | | 1.88% |
| | | | | | | | | | | | | | | | |
| CDSC | | –8.43% | | –4.27% | | 1.71% | | 6.62% | | 10.90% | | | | | |
| | | | | | | | | | | | | | | | |
Perkins Mid Cap Value Fund –
Class D Shares(1) | | –7.11% | | –2.42% | | 2.68% | | 7.60% | | 11.78% | | | 0.89% | | 0.89% |
| | | | | | | | | | | | | | | | |
Perkins Mid Cap Value Fund –
Class I Shares(1) | | –7.12% | | –2.43% | | 2.63% | | 7.58% | | 11.76% | | | 0.85% | | 0.85% |
| | | | | | | | | | | | | | | | |
Perkins Mid Cap Value Fund –
Class L Shares(1) | | –7.12% | | –2.33% | | 2.84% | | 7.79% | | 11.92% | | | 1.00% | | 1.00% |
| | | | | | | | | | | | | | | | |
Perkins Mid Cap Value Fund –
Class R Shares(1) | | –7.41% | | –3.01% | | 2.08% | | 7.00% | | 11.29% | | | 1.50% | | 1.50% |
| | | | | | | | | | | | | | | | |
Perkins Mid Cap Value Fund –
Class S Shares(1) | | –7.25% | | –2.73% | | 2.34% | | 7.27% | | 11.51% | | | 1.25% | | 1.25% |
| | | | | | | | | | | | | | | | |
Perkins Mid Cap Value Fund –
Class T Shares(1) | | –7.20% | | –2.55% | | 2.63% | | 7.58% | | 11.76% | | | 1.00% | | 1.00% |
| | | | | | | | | | | | | | | | |
| Russell Midcap® Value Index | | –7.56% | | –1.38% | | 0.04% | | 7.67% | | 7.70% | | | | | |
| | | | | | | | | | | | | | | | |
| Lipper Quartile – Class T Shares | | – | | 2nd | | 1st | | 1st | | 1st | | | | | |
| | | | | | | | | | | | | | | | |
| Lipper Ranking – based on total returns for Multi-Cap Core Funds | | – | | 371/777 | | 43/591 | | 13/301 | | 2/147 | | | | | |
| | | | | | | | | | | | | | | | |
| Visit janus.com/advisor/mutual-funds (or janus.com/allfunds if you hold Shares directly with Janus Capital) to view current performance and characteristic information | | | | | |
| | | | | | | | | | | | | | | | |
Data presented represents past performance, which is no guarantee of future results. Investment results and principal value will fluctuate so that shares, when redeemed, may be worth more or less than their original cost. Due to market volatility, current performance may be higher or lower than the performance shown. Call 877.33JANUS(52687) (or 800.525.3713 if you hold shares directly with Janus Capital) or visit janus.com/advisor/mutual-funds (or janus.com/allfunds if you hold shares directly with Janus Capital) for performance current to the most recent month-end.
See important disclosures on the next page.
Janus Value Funds | 19
Perkins Mid Cap Value Fund (unaudited)(closed to certain new investors)
Performance shown for Class A Shares at Maximum Offering Price (MOP) includes the Fund’s maximum sales charge of 5.75%. Performance shown at Net Asset Value (NAV) does not include this charge and would have been lower had this charge been taken into account.
Performance shown for Class C Shares includes a 1% contingent deferred sales charge (CDSC) on periods of less than 12 months. Performance shown at Net Asset Value (NAV) does not include this sales charge and would have been lower had this sales charge been taken into account.
Janus Capital has contractually agreed to waive the Fund’s total annual fund operating expenses allocated to any class (excluding any performance adjustments to management fees, the distribution and shareholder servicing fees (applicable to Class A Shares, Class C Shares, Class R Shares and Class S Shares), administrative services fees payable pursuant to the Transfer Agency Agreement (except for networking and omnibus fees), brokerage commissions, interest, dividends, taxes, acquired fund fees and expenses, and extraordinary expenses) to certain limits until at least November 1, 2012. The contractual waiver may be terminated or modified prior to this date only at the discretion of the Board of Trustees. Returns shown include fee waivers, if any, and without such waivers returns would have been lower.
Janus Services LLC has agreed to waive all or a portion of the administrative fee applicable to the Fund’s Class L Shares. Such waiver is voluntary and could change or be terminated at any time at the discretion of Janus Services LLC or Janus Capital without prior notification to shareholders. Total returns shown include fee waivers, if any, and without such waivers, the total returns would have been lower.
The expense information shown was determined based on net assets as of the fiscal period ended June 30, 2011. The effect of contractual waivers agreed to by Janus Capital, when applicable, are reflected under “Net Annual Fund Operating Expenses.” (All expenses are shown without the effect of expense offset arrangements. Pursuant to such arrangements, credits realized as a result of uninvested cash balances are used to reduce custodian and transfer agent expenses.)
The Fund has a performance-based management fee that adjusts up or down based on the Fund’s performance relative to an approved benchmark index over a performance measurement period. See the Fund’s Prospectus or Statement of Additional Information for more details.
The Fund’s performance may be affected by risks that include those associated with undervalued or overlooked companies, investments in specific industries or countries and potential conflicts of interest with the Janus “funds of funds.” Additional risks to the Fund may include those associated with investing in foreign securities, emerging markets, initial public offerings (“IPOs”), real estate investment trusts (“REITs”), and derivatives. Please see a Janus prospectus or janus.com/info (or janus.com/reports if you hold shares directly with Janus Capital) for more information about risks, portfolio holdings and other details.
The Fund invests in REITs, which may be subject to a higher degree of market risk because of concentration in a specific industry, sector or geographic region. REITs may be subject to risks including, but not limited to: legal, political, liquidity, and interest rate risks, a decline in the value of real estate, risks related to general and economic conditions, changes in the value of the underlying property owned by the trust and defaults by borrowers. To the extent the Fund invests in foreign REITs, the Fund may be subject to fluctuations in currency rates or political or economic conditions in a particular country.
The Fund may invest in derivatives which can be highly volatile and involve additional risks than if the underlying securities were held directly by the Fund. Such risks include gains or losses which, as a result of leverage, can be substantially greater than the derivatives’ original cost. There is also a possibility that derivatives may not perform as intended which can reduce opportunity for gains or result in losses by offsetting positive returns in other securities the Fund owns.
The Fund will normally invest at least 80% of its net assets, measured at the time of purchase, in the type of securities described by its name.
Returns include reinvestment of dividends from net investment income and distributions from capital gains. The returns shown do not reflect the deduction of taxes that a shareholder would pay on Fund distributions or the redemption of Fund shares. The returns do not include adjustments in accordance with generally accepted accounting principles required at the period end for financial reporting purposes.
Class A Shares, Class C Shares, Class R Shares and Class S Shares of the Fund commenced operations on July 6, 2009. The historical performance shown for periods prior to July 6, 2009 reflects the performance of one or more other share classes of the Fund or a predecessor fund, calculated using the fees and expenses of each respective share class without the effect of any fee and expense limitations and waivers. If each share class of the Fund had been available during periods prior to July 6, 2009, the performance shown may have been different. Please refer to the Fund’s prospectus for further details concerning historical performance.
Class D Shares of the Fund commenced operations on February 16, 2010. The historical performance shown for periods prior to February 16, 2010 reflects the performance of one or more other share classes of the Fund or a predecessor fund. If Class D Shares of the Fund had been available during periods prior to February 16, 2010, the performance shown may have been different. Please refer to the Fund’s prospectus for further details concerning historical performance.
Class I Shares of the Fund commenced operations on July 6, 2009. The historical performance shown for periods prior to July 6, 2009 was calculated using the performance and the fees and expenses of one or more other share classes of the Fund or a predecessor fund, accounting for, when applicable and permitted, any fee and expense limitations and waivers. If Class I Shares of the Fund had been available during periods prior to July 6, 2009, the performance shown may have been different. Please refer to the Fund’s prospectus for further details concerning historical performance.
20 | DECEMBER 31, 2011
(unaudited)(closed to certain new investors)
Class L Shares of the Fund commenced operations on April 21, 2003. The historical performance shown for periods prior to April 21, 2003 reflects the performance of one or more other share classes of a predecessor fund. Please refer to the Fund’s prospectus for further details concerning historical performance.
Class T Shares of the Fund commenced operations with the Fund’s inception. The historical performance shown for periods prior to April 21, 2003 reflects the performance of another share class of a predecessor fund. Please refer to the Fund’s prospectus for further details concerning historical performance.
Lipper, a wholly-owned subsidiary of Thomson Reuters, provides independent insight on global collective investments including mutual funds, retirement funds, hedge funds, fund fees and expenses to the asset management and media communities. Lipper ranks the performance of mutual funds within a classification of funds that have similar investment objectives. Rankings are historical with capital gains and dividends reinvested and do not include the effect of loads.
Ranking is for Class T Shares only; other classes may have different performance characteristics. When an expense waiver is in effect, it may have a material effect on the total return, and therefore the ranking for the period.
August 13, 1998 is the date used to calculate the since-inception Lipper ranking, which is slightly different from when the Fund began operations since Lipper provides fund rankings as of the last day of the month or the first Thursday after fund inception.
There is no assurance that the investment process will consistently lead to successful investing.
See Notes to Schedules of Investments for index definitions.
The Fund’s portfolio may differ significantly from the securities held in the index. The index is unmanaged and is not available for direct investment; therefore, its performance does not reflect the expenses associated with the active management of an actual portfolio.
See “Explanations of Charts, Tables and Financial Statements.”
| | | |
| * | | The predecessor Fund’s inception date – August 12, 1998 |
(1) Closed to certain distribution channels. Please see current prospectus for details.
Janus Value Funds | 21
Perkins Mid Cap Value Fund (unaudited)(closed to certain new investors)
The examples below show you the ongoing costs (in dollars) of investing in your Fund and allow you to compare these costs with those of other mutual funds. Please refer to the section Useful Information About Your Fund Report for a detailed explanation of the information presented in these charts.
| | | | | | | | | | | | | | | |
| | | Beginning Account Value
| | Ending Account Value
| | Expenses Paid During Period
| | |
| Expense Example – Class A Shares | | (7/1/11) | | (12/31/11) | | (7/1/11 - 12/31/11)† | | |
| |
| |
| Actual | | $ | 1,000.00 | | | $ | 927.60 | | | $ | 5.14 | | | |
| |
| |
Hypothetical
(5% return before expenses) | | $ | 1,000.00 | | | $ | 1,019.81 | | | $ | 5.38 | | | |
| |
| |
| | | | | | | | | | | | | | | |
| | | | | | | | | | | | | | | |
| | | Beginning Account Value
| | Ending Account Value
| | Expenses Paid During Period
| | |
| Expense Example – Class C Shares | | (7/1/11) | | (12/31/11) | | (7/1/11 - 12/31/11)† | | |
| |
| |
| Actual | | $ | 1,000.00 | | | $ | 923.90 | | | $ | 8.56 | | | |
| |
| |
Hypothetical
(5% return before expenses) | | $ | 1,000.00 | | | $ | 1,016.24 | | | $ | 8.97 | | | |
| |
| |
| | | | | | | | | | | | | | | |
| | | | | | | | | | | | | | | |
| | | Beginning Account Value
| | Ending Account Value
| | Expenses Paid During Period
| | |
| Expense Example – Class D Shares | | (7/1/11) | | (12/31/11) | | (7/1/11 - 12/31/11)† | | |
| |
| |
| Actual | | $ | 1,000.00 | | | $ | 928.90 | | | $ | 3.73 | | | |
| |
| |
Hypothetical
(5% return before expenses) | | $ | 1,000.00 | | | $ | 1,021.27 | | | $ | 3.91 | | | |
| |
| |
| | | | | | | | | | | | | | | |
| | | | | | | | | | | | | | | |
| | | Beginning Account Value
| | Ending Account Value
| | Expenses Paid During Period
| | |
| Expense Example – Class I Shares | | (7/1/11) | | (12/31/11) | | (7/1/11 - 12/31/11)† | | |
| |
| |
| Actual | | $ | 1,000.00 | | | $ | 928.80 | | | $ | 3.54 | | | |
| |
| |
Hypothetical
(5% return before expenses) | | $ | 1,000.00 | | | $ | 1,021.47 | | | $ | 3.71 | | | |
| |
| |
| | | | | | | | | | | | | | | |
| | | | | | | | | | | | | | | |
| | | Beginning Account Value
| | Ending Account Value
| | Expenses Paid During Period
| | |
| Expense Example – Class L Shares | | (7/1/11) | | (12/31/11) | | (7/1/11 - 12/31/11)† | | |
| |
| |
| Actual | | $ | 1,000.00 | | | $ | 928.90 | | | $ | 3.68 | | | |
| |
| |
Hypothetical
(5% return before expenses) | | $ | 1,000.00 | | | $ | 1,021.32 | | | $ | 3.86 | | | |
| |
| |
| | | | | | | | | | | | | | | |
| | | | | | | | | | | | | | | |
| | | Beginning Account Value
| | Ending Account Value
| | Expenses Paid During Period
| | |
| Expense Example – Class R Shares | | (7/1/11) | | (12/31/11) | | (7/1/11 - 12/31/11)† | | |
| |
| |
| Actual | | $ | 1,000.00 | | | $ | 925.90 | | | $ | 6.68 | | | |
| |
| |
Hypothetical
(5% return before expenses) | | $ | 1,000.00 | | | $ | 1,018.20 | | | $ | 7.00 | | | |
| |
| |
| | | | | | | | | | | | | | | |
| | | | | | | | | | | | | | | |
| | | Beginning Account Value
| | Ending Account Value
| | Expenses Paid During Period
| | |
| Expense Example – Class S Shares | | (7/1/11) | | (12/31/11) | | (7/1/11 - 12/31/11)† | | |
| |
| |
| Actual | | $ | 1,000.00 | | | $ | 927.50 | | | $ | 5.48 | | | |
| |
| |
Hypothetical
(5% return before expenses) | | $ | 1,000.00 | | | $ | 1,019.46 | | | $ | 5.74 | | | |
| |
| |
| | | | | | | | | | | | | | | |
| | | | | | | | | | | | | | | |
| | | Beginning Account Value
| | Ending Account Value
| | Expenses Paid During Period
| | |
| Expense Example – Class T Shares | | (7/1/11) | | (12/31/11) | | (7/1/11 - 12/31/11)† | | |
| |
| |
| Actual | | $ | 1,000.00 | | | $ | 928.50 | | | $ | 4.27 | | | |
| |
| |
Hypothetical
(5% return before expenses) | | $ | 1,000.00 | | | $ | 1,020.71 | | | $ | 4.47 | | | |
| |
| |
| | | |
| † | | Expenses are equal to the annualized expense ratio of 1.06% for Class A Shares,1.77% for Class C Shares, 0.77% for Class D Shares, 0.73% for Class I Shares, 0.76% for Class L Shares, 1.38% for Class R Shares, 1.13% for Class S Shares and 0.88% for Class T Shares multiplied by the average account value over the period, multiplied by 184/366 (to reflect the one-half year period). Expenses include effect of contractual waivers by Janus Capital. |
22 | DECEMBER 31, 2011
Perkins Mid Cap Value Fund
Schedule of Investments (unaudited)
As of December 31, 2011
| | | | | | | | | | | |
| Shares/Principal/Contract Amounts | | Value | | | |
| |
| Common Stock – 90.7% | | | | | | |
| Aerospace and Defense – 1.4% | | | | | | |
| | 800,000 | | | General Dynamics Corp. | | $ | 53,128,000 | | | |
| | 1,500,000 | | | Raytheon Co. | | | 72,570,000 | | | |
| | 950,000 | | | Rockwell Collins, Inc. | | | 52,601,500 | | | |
| | | | | | | | 178,299,500 | | | |
| Agricultural Chemicals – 0.7% | | | | | | |
| | 1,800,000 | | | Mosaic Co. | | | 90,774,000 | | | |
| Applications Software – 0.9% | | | | | | |
| | 3,000,000 | | | Microsoft Corp.** | | | 77,880,000 | | | |
| | 2,100,000 | | | Progress Software Corp.* | | | 40,635,000 | | | |
| | | | | | | | 118,515,000 | | | |
| Brewery – 1.3% | | | | | | |
| | 3,700,000 | | | Molson Coors Brewing Co. – Class B | | | 161,098,000 | | | |
| Building – Residential and Commercial – 0.4% | | | | | | |
| | 2,700,270 | | | M.D.C. Holdings, Inc.£ | | | 47,605,760 | | | |
| Cable/Satellite Television – 0.3% | | | | | | |
| | 1,800,000 | | | Comcast Corp. – Class A | | | 42,678,000 | | | |
| Cellular Telecommunications – 1.2% | | | | | | |
| | 5,600,485 | | | Vodafone Group PLC (ADR) | | | 156,981,594 | | | |
| Chemicals – Diversified – 0.6% | | | | | | |
| | 850,571 | | | FMC Corp. | | | 73,183,129 | | | |
| Commercial Banks – 0.6% | | | | | | |
| | 7,800,000 | | | TCF Financial Corp. | | | 80,496,000 | | | |
| Commercial Services – Finance – 1.9% | | | | | | |
| | 1,500,000 | | | Global Payments, Inc. | | | 71,070,000 | | | |
| | 9,700,000 | | | Western Union Co. | | | 177,122,000 | | | |
| | | | | | | | 248,192,000 | | | |
| Computer Software – 0.4% | | | | | | |
| | 1,600,000 | | | Akamai Technologies, Inc.* | | | 51,648,000 | | | |
| Computers – Integrated Systems – 0.2% | | | | | | |
| | 1,000,000 | | | Diebold, Inc. | | | 30,070,000 | | | |
| Computers – Memory Devices – 0.3% | | | | | | |
| | 1,100,000 | | | NetApp, Inc.* | | | 39,897,000 | | | |
| Containers – Paper and Plastic – 0.4% | | | | | | |
| | 2,111,055 | | | Packaging Corp. of America | | | 53,283,028 | | | |
| Dental Supplies and Equipment – 0.3% | | | | | | |
| | 1,203,800 | | | Patterson Cos., Inc. | | | 35,536,176 | | | |
| Diversified Operations �� 1.4% | | | | | | |
| | 800,000 | | | Illinois Tool Works, Inc. | | | 37,368,000 | | | |
| | 3,000,567 | | | Tyco International, Ltd. (U.S. Shares) | | | 140,156,485 | | | |
| | | | | | | | 177,524,485 | | | |
| Electric – Integrated – 3.0% | | | | | | |
| | 1,050,000 | | | Constellation Energy Group, Inc. | | | 41,653,500 | | | |
| | 1,401,900 | | | Entergy Corp. | | | 102,408,795 | | | |
| | 2,100,865 | | | Exelon Corp. | | | 91,114,515 | | | |
| | 700,000 | | | PG&E Corp. | | | 28,854,000 | | | |
| | 4,300,000 | | | PPL Corp. | | | 126,506,000 | | | |
| | | | | | | | 390,536,810 | | | |
| Electronic Components – Miscellaneous – 0.6% | | | | | | |
| | 1,900,000 | | | Garmin, Ltd. | | | 75,639,000 | | | |
| Electronic Components – Semiconductors – 1.3% | | | | | | |
| | 1,000,000 | | | Altera Corp. | | | 37,100,000 | | | |
| | 4,800,200 | | | QLogic Corp.*,£ | | | 72,003,000 | | | |
| | 2,200,000 | | | Semtech Corp.* | | | 54,604,000 | | | |
| | | | | | | | 163,707,000 | | | |
| Electronic Connectors – 0.4% | | | | | | |
| | 1,000,000 | | | Thomas & Betts Corp.* | | | 54,600,000 | | | |
| Electronic Forms – 0.4% | | | | | | |
| | 1,700,000 | | | Adobe Systems, Inc.* | | | 48,059,000 | | | |
| Electronic Parts Distributors – 0.7% | | | | | | |
| | 1,700,000 | | | Tech Data Corp.*,£ | | | 83,997,000 | | | |
| Engineering – Research and Development Services – 3.2% | | | | | | |
| | 3,750,000 | | | Jacobs Engineering Group, Inc.* | | | 152,175,000 | | | |
| | 3,700,000 | | | KBR, Inc. | | | 103,119,000 | | | |
| | 4,600,000 | | | URS Corp.*,£ | | | 161,552,000 | | | |
| | | | | | | | 416,846,000 | | | |
| Fiduciary Banks – 1.0% | | | | | | |
| | 3,300,000 | | | State Street Corp. | | | 133,023,000 | | | |
| Filtration and Separations Products – 0.2% | | | | | | |
| | 500,000 | | | Pall Corp. | | | 28,575,000 | | | |
| Finance – Credit Card – 1.2% | | | | | | |
| | 6,300,000 | | | Discover Financial Services | | | 151,200,000 | | | |
| Finance – Investment Bankers/Brokers – 0.5% | | | | | | |
| | 1,300,212 | | | Raymond James Financial, Inc. | | | 40,254,564 | | | |
| | 1,700,230 | | | TD Ameritrade Holding Corp. | | | 26,608,599 | | | |
| | | | | | | | 66,863,163 | | | |
| Food – Miscellaneous/Diversified – 0.9% | | | | | | |
| | 3,500,000 | | | Unilever PLC (ADR) | | | 117,320,000 | | | |
| Food – Retail – 0.8% | | | | | | |
| | 1,700,000 | | | Kroger Co. | | | 41,174,000 | | | |
| | 2,999,835 | | | Safeway, Inc. | | | 63,116,528 | | | |
| | | | | | | | 104,290,528 | | | |
| Food – Wholesale/Distribution – 0.8% | | | | | | |
| | 3,600,000 | | | Sysco Corp. | | | 105,588,000 | | | |
| Gas – Transportation – 0.3% | | | | | | |
| | 1,000,000 | | | AGL Resources, Inc. | | | 42,260,000 | | | |
| Gold Mining – 1.7% | | | | | | |
| | 6,800,000 | | | Eldorado Gold Corp. | | | 93,228,000 | | | |
| | 2,000,000 | | | Goldcorp, Inc. (U.S. Shares) | | | 88,500,000 | | | |
| | 600,000 | | | Newmont Mining Corp. | | | 36,006,000 | | | |
| | | | | | | | 217,734,000 | | | |
| Instruments – Scientific – 1.6% | | | | | | |
| | 4,000,000 | | | PerkinElmer, Inc. | | | 80,000,000 | | | |
| | 2,750,000 | | | Thermo Fisher Scientific, Inc.* | | | 123,667,500 | | | |
| | | | | | | | 203,667,500 | | | |
| Internet Security – 0.9% | | | | | | |
| | 7,000,000 | | | Symantec Corp.* | | | 109,550,000 | | | |
| Intimate Apparel – 0.6% | | | | | | |
| | 1,450,000 | | | Warnaco Group, Inc.* | | | 72,558,000 | | | |
See Notes to Schedules of Investments and Financial Statements.
Janus Value Funds | 23
Perkins Mid Cap Value Fund
Schedule of Investments (unaudited)
As of December 31, 2011
| | | | | | | | | | | |
| Shares/Principal/Contract Amounts | | Value | | | |
| |
| Investment Management and Advisory Services – 3.5% | | | | | | |
| | 4,755,014 | | | Ameriprise Financial, Inc. | | $ | 236,038,895 | | | |
| | 1,150,000 | | | Franklin Resources, Inc. | | | 110,469,000 | | | |
| | 5,300,030 | | | INVESCO, Ltd. | | | 106,477,603 | | | |
| | | | | | | | 452,985,498 | | | |
| Leisure & Recreation Products – 0.5% | | | | | | |
| | 3,300,000 | | | WMS Industries, Inc.*,£ | | | 67,716,000 | | | |
| Machinery – Farm – 0.7% | | | | | | |
| | 1,150,000 | | | Deere & Co. | | | 88,952,500 | | | |
| Machinery – General Industrial – 0.4% | | | | | | |
| | 2,000,000 | | | Babcock & Wilcox Co.* | | | 48,280,000 | | | |
| Medical – Biomedical and Genetic – 1.8% | | | | | | |
| | 2,300,000 | | | Charles River Laboratories International, Inc.* | | | 62,859,000 | | | |
| | 3,200,000 | | | Life Technologies Corp.* | | | 124,512,000 | | | |
| | 1,800,000 | | | Myriad Genetics, Inc.* | | | 37,692,000 | | | |
| | | | | | | | 225,063,000 | | | |
| Medical – Drugs – 1.2% | | | | | | |
| | 1,400,000 | | | Forest Laboratories, Inc.* | | | 42,364,000 | | | |
| | 1,900,000 | | | Novartis A.G. (ADR) | | | 108,623,000 | | | |
| | | | | | | | 150,987,000 | | | |
| Medical – Generic Drugs – 0.6% | | | | | | |
| | 1,900,555 | | | Teva Pharmaceutical S.P. (ADR) | | | 76,706,400 | | | |
| Medical – HMO – 0.4% | | | | | | |
| | 1,500,000 | | | Health Net, Inc.* | | | 45,630,000 | | | |
| Medical – Wholesale Drug Distributors – 0.3% | | | | | | |
| | 550,480 | | | McKesson Corp. | | | 42,887,897 | | | |
| Medical Instruments – 0.6% | | | | | | |
| | 2,200,000 | | | St. Jude Medical, Inc. | | | 75,460,000 | | | |
| Medical Labs and Testing Services – 0.8% | | | | | | |
| | 1,252,963 | | | Laboratory Corp. of America Holdings* | | | 107,717,229 | | | |
| Medical Products – 2.4% | | | | | | |
| | 1,750,400 | | | Becton, Dickinson and Co. | | | 130,789,888 | | | |
| | 2,050,500 | | | Covidien PLC (U.S. Shares) | | | 92,293,005 | | | |
| | 1,700,815 | | | Zimmer Holdings, Inc. | | | 90,857,537 | | | |
| | | | | | | | 313,940,430 | | | |
| Medical Sterilization Products – 0.6% | | | | | | |
| | 2,500,000 | | | STERIS Corp. | | | 74,550,000 | | | |
| Metal – Aluminum – 0.3% | | | | | | |
| | 4,100,000 | | | Alcoa, Inc. | | | 35,465,000 | | | |
| Metal – Copper – 0.6% | | | | | | |
| | 2,100,000 | | | Freeport-McMoRan Copper & Gold, Inc. – Class B | | | 77,259,000 | | | |
| Metal Processors and Fabricators – 0.4% | | | | | | |
| | 1,751,349 | | | Kaydon Corp.£ | | | 53,416,144 | | | |
| Motion Pictures and Services – 0.3% | | | | | | |
| | 1,400,000 | | | Dolby Laboratories, Inc.* | | | 42,714,000 | | | |
| Multi-Line Insurance – 1.7% | | | | | | |
| | 6,500,600 | | | Allstate Corp. | | | 178,181,446 | | | |
| | 4,600,000 | | | Old Republic International Corp. | | | 42,642,000 | | | |
| | | | | | | | 220,823,446 | | | |
| Multimedia – 0.5% | | | | | | |
| | 1,500,000 | | | Viacom, Inc. – Class B | | | 68,115,000 | | | |
| Networking Products – 1.0% | | | | | | |
| | 5,700,800 | | | Cisco Systems, Inc. | | | 103,070,464 | | | |
| | 1,500,000 | | | Polycom, Inc.* | | | 24,450,000 | | | |
| | | | | | | | 127,520,464 | | | |
| Non-Hazardous Waste Disposal – 0.9% | | | | | | |
| | 4,200,000 | | | Republic Services, Inc. | | | 115,710,000 | | | |
| Oil and Gas Drilling – 1.0% | | | | | | |
| | 2,750,483 | | | Ensco International PLC (ADR) | | | 129,052,662 | | | |
| Oil Companies – Exploration and Production – 7.1% | | | | | | |
| | 1,000,000 | | | Anadarko Petroleum Corp. | | | 76,330,000 | | | |
| | 2,000,000 | | | Bill Barrett Corp.* | | | 68,140,000 | | | |
| | 1,400,000 | | | Devon Energy Corp. | | | 86,800,000 | | | |
| | 1,250,000 | | | EQT Corp. | | | 68,487,500 | | | |
| | 9,200,000 | | | Exco Resources, Inc. | | | 96,140,000 | | | |
| | 4,200,000 | | | Forest Oil Corp.* | | | 56,910,000 | | | |
| | 3,184,922 | | | Lone Pine Resources, Inc.* | | | 22,326,303 | | | |
| | 1,250,000 | | | Noble Energy, Inc. | | | 117,987,500 | | | |
| | 2,000,270 | | | Plains Exploration & Production Co.* | | | 73,449,915 | | | |
| | 3,700,000 | | | QEP Resources, Inc. | | | 108,410,000 | | | |
| | 1,800,000 | | | Southwestern Energy Co.* | | | 57,492,000 | | | |
| | 1,750,870 | | | Whitting Petroleum Corp.* | | | 81,748,120 | | | |
| | | | | | | | 914,221,338 | | | |
| Oil Companies – Integrated – 1.0% | | | | | | |
| | 2,200,000 | | | Hess Corp. | | | 124,960,000 | | | |
| Oil Field Machinery and Equipment – 0.4% | | | | | | |
| | 700,000 | | | National Oilwell Varco, Inc. | | | 47,593,000 | | | |
| Pipelines – 0.9% | | | | | | |
| | 1,600,000 | | | Plains All American Pipeline L.P. | | | 117,520,000 | | | |
| Publishing – Books – 1.0% | | | | | | |
| | 16,000,000 | | | Reed Elsevier PLC | | | 128,936,091 | | | |
| Reinsurance – 2.8% | | | | | | |
| | 600,000 | | | Berkshire Hathaway, Inc. – Class B* | | | 45,780,000 | | | |
| | 1,800,000 | | | Everest Re Group, Ltd. | | | 151,362,000 | | | |
| | 1,400,000 | | | PartnerRe, Ltd. | | | 89,894,000 | | | |
| | 1,500,015 | | | Reinsurance Group of America, Inc. | | | 78,375,784 | | | |
| | | | | | | | 365,411,784 | | | |
| REIT – Apartments – 1.1% | | | | | | |
| | 300,000 | | | Avalonbay Communities, Inc. | | | 39,180,000 | | | |
| | 900,000 | | | BRE Properties, Inc. – Class A | | | 45,432,000 | | | |
| | 800,000 | | | Mid-America Apartment Communities, Inc. | | | 50,040,000 | | | |
| | | | | | | | 134,652,000 | | | |
| REIT – Diversified – 2.4% | | | | | | |
| | 1,200,120 | | | Liberty Property Trust | | | 37,059,706 | | | |
| | 2,050,300 | | | Potlatch Corp.£ | | | 63,784,833 | | | |
| | 1,800,000 | | | Rayonier, Inc. | | | 80,334,000 | | | |
| | 6,800,000 | | | Weyerhaeuser Co. | | | 126,956,000 | | | |
| | | | | | | | 308,134,539 | | | |
| REIT – Hotels – 0.4% | | | | | | |
| | 3,300,000 | | | Host Hotels & Resorts, Inc. | | | 48,741,000 | | | |
| REIT – Mortgage – 0.5% | | | | | | |
| | 1,200,000 | | | Annaly Mortgage Management, Inc. | | | 19,152,000 | | | |
| | 3,800,000 | | | Redwood Trust, Inc. | | | 38,684,000 | | | |
| | | | | | | | 57,836,000 | | | |
See Notes to Schedules of Investments and Financial Statements.
24 | DECEMBER 31, 2011
Schedule of Investments (unaudited)
As of December 31, 2011
| | | | | | | | | | | |
| Shares/Principal/Contract Amounts | | Value | | | |
| |
| REIT – Office Property – 1.8% | | | | | | |
| | 950,244 | | | Alexandria Real Estate Equities, Inc. | | $ | 65,538,329 | | | |
| | 800,000 | | | Boston Properties, Inc. | | | 79,680,000 | | | |
| | 900,000 | | | Corporate Office Properties | | | 19,134,000 | | | |
| | 2,600,000 | | | Mack-Cali Realty Corp. | | | 69,394,000 | | | |
| | | | | | | | 233,746,329 | | | |
| REIT – Regional Malls – 0.4% | | | | | | |
| | 800,000 | | | Taubman Centers, Inc. | | | 49,680,000 | | | |
| REIT – Storage – 0.4% | | | | | | |
| | 421,825 | | | Public Storage | | | 56,718,589 | | | |
| REIT – Warehouse and Industrial – 0.4% | | | | | | |
| | 1,900,000 | | | Prologis, Inc. | | | 54,321,000 | | | |
| Retail – Apparel and Shoe – 1.1% | | | | | | |
| | 5,300,000 | | | American Eagle Outfitters, Inc. | | | 81,037,000 | | | |
| | 2,100,000 | | | Guess?, Inc. | | | 62,622,000 | | | |
| | | | | | | | 143,659,000 | | | |
| Retail – Consumer Electronics – 0.4% | | | | | | |
| | 5,800,000 | | | RadioShack Corp.£ | | | 56,318,000 | | | |
| Retail – Discount – 0.5% | | | | | | |
| | 500,000 | | | Big Lots, Inc.* | | | 18,880,000 | | | |
| | 750,000 | | | Wal-Mart Stores, Inc. | | | 44,820,000 | | | |
| | | | | | | | 63,700,000 | | | |
| Retail – Drug Store – 1.3% | | | | | | |
| | 2,006,347 | | | CVS Caremark Corp. | | | 81,818,831 | | | |
| | 2,600,000 | | | Walgreen Co. | | | 85,956,000 | | | |
| | | | | | | | 167,774,831 | | | |
| Retail – Office Supplies – 0.8% | | | | | | |
| | 7,500,000 | | | Staples, Inc. | | | 104,175,000 | | | |
| Retail – Regional Department Stores – 1.1% | | | | | | |
| | 1,600,000 | | | Kohl’s Corp. | | | 78,960,000 | | | |
| | 2,100,000 | | | Macy’s, Inc. | | | 67,578,000 | | | |
| | | | | | | | 146,538,000 | | | |
| Savings/Loan/Thrifts – 1.8% | | | | | | |
| | 14,500,000 | | | First Niagara Financial Group, Inc. | | | 125,135,000 | | | |
| | 1,600,000 | | | People’s United Financial, Inc. | | | 20,560,000 | | | |
| | 5,800,000 | | | Washington Federal, Inc.£ | | | 81,142,000 | | | |
| | | | | | | | 226,837,000 | | | |
| Semiconductor Components/Integrated Circuits – 0.7% | | | | | | |
| | 1,450,000 | | | Analog Devices, Inc. | | | 51,881,000 | | | |
| | 725,315 | | | Qualcomm, Inc. | | | 39,674,730 | | | |
| | | | | | | | 91,555,730 | | | |
| Semiconductor Equipment – 0.6% | | | | | | |
| | 7,400,000 | | | Applied Materials, Inc. | | | 79,254,000 | | | |
| Super-Regional Banks – 3.2% | | | | | | |
| | 10,000,000 | | | Fifth Third Bancorp. | | | 127,200,000 | | | |
| | 2,800,000 | | | PNC Financial Services Group, Inc. | | | 161,476,000 | | | |
| | 6,700,000 | | | SunTrust Banks, Inc. | | | 118,590,000 | | | |
| | | | | | | | 407,266,000 | | | |
| Telephone – Integrated – 1.4% | | | | | | |
| | 4,700,000 | | | CenturyLink, Inc.** | | | 174,840,000 | | | |
| Textile-Home Furnishings – 0.3% | | | | | | |
| | 741,289 | | | Mohawk Industries, Inc.* | | | 44,366,147 | | | |
| Tools – Hand Held – 0.7% | | | | | | |
| | 800,000 | | | Snap-On, Inc. | | | 40,496,000 | | | |
| | 650,000 | | | Stanley Works | | | 43,940,000 | | | |
| | | | | | | | 84,436,000 | | | |
| Transportation – Marine – 0.8% | | | | | | |
| | 600,000 | | | Kirby Corp.* | | | 39,504,000 | | | |
| | 1,300,000 | | | Tidewater, Inc. | | | 64,090,000 | | | |
| | | | | | | | 103,594,000 | | | |
| Transportation – Railroad – 1.4% | | | | | | |
| | 2,000,000 | | | CSX Corp. | | | 42,120,000 | | | |
| | 801,700 | | | Kansas City Southern* | | | 54,523,617 | | | |
| | 802,500 | | | Union Pacific Corp. | | | 85,016,850 | | | |
| | | | | | | | 181,660,467 | | | |
| Transportation – Truck – 0.4% | | | | | | |
| | 1,100,000 | | | J.B. Hunt Transport Services, Inc. | | | 49,577,000 | | | |
| X-Ray Equipment – 0.7% | | | | | | |
| | 5,300,000 | | | Hologic, Inc.* | | | 92,803,000 | | | |
| |
| |
| Total Common Stock (cost $10,962,243,586) | | | 11,673,573,188 | | | |
| |
| |
| Purchased Option – Call – 0% | | | | | | |
| | 7,300 | | | iShares Russell 2000® Index Fund (ETF)
expires January 2012
exercise price $73.91**
(premiums paid $2,160,800) | | | 1,344,334 | | | |
| |
| |
| Purchased Options – Puts – 0.2% | | | | | | |
| | 7,300 | | | iShares Russell 2000® Index Fund (ETF)
expires January 2012
exercise price $63.83 | | | 123,727 | | | |
| | 9,200 | | | iShares Russell 2000® Index Fund (ETF)
expires January 2012
exercise price $66.00 | | | 292,326 | | | |
| | 14,741 | | | iShares Russell 2000® Index Fund (ETF)
expires January 2012
exercise price $67.00 | | | 596,509 | | | |
| | 42,306 | | | iShares Russell 2000® Index Fund (ETF)
expires January 2012
exercise price $70.00 | | | 3,514,393 | | | |
| | 19,540 | | | iShares Russell 2000® Index Fund (ETF)
expires January 2012
exercise price $71.00 | | | 2,049,220 | | | |
| | 68,529 | | | iShares Russell 2000® Index Fund (ETF)
expires February 2012
exercise price $70.00 | | | 13,401,881 | | | |
| | 14,789 | | | iShares Russell 2000® Index Fund (ETF)
expires March 2012
exercise price $67.00 | | | 3,112,888 | | | |
| |
| |
| Total Purchased Options – Puts (premiums paid $57,614,805) | | | 23,090,944 | | | |
| |
| |
See Notes to Schedules of Investments and Financial Statements.
Janus Value Funds | 25
Perkins Mid Cap Value Fund
Schedule of Investments (unaudited)
As of December 31, 2011
| | | | | | | | | | | |
| Shares/Principal/Contract Amounts | | Value | | | |
| |
| Repurchase Agreements – 9.2% | | | | | | |
| | $300,000,000 | | | Credit Agricole, New York Branch, 0.0100%, dated 12/30/11, maturing 1/3/12 to be repurchased at $300,000,333 collateralized
by $308,585,261 in U.S. Government Agencies 3.5000% – 5.5000% and $37,692,882 in a U.S. Treasury 4.0000%, 8/15/18,
with respective values of $261,125,849 and $44,874,179 | | $ | 300,000,000 | | | |
| | 100,000,000 | | | Deutsche Bank Securities, Inc., 0.0100%, dated 12/30/11, maturing 1/3/12 to be repurchased at $100,000,111 collateralized by
$99,395,800 in a U.S. Treasury 1.2500%,10/31/15
with a value of $102,000,014 | | | 100,000,000 | | | |
| | 100,000,000 | | | HSBC Securities (USA), Inc., 0.0100%, dated 12/30/11, maturing 1/3/12 to be repurchased at $100,000,111
collateralized by $126,550,616 in a U.S. Treasury 0.0000%,
11/15/21 – 5/15/22
with a value of $102,000,700 | | | 100,000,000 | | | |
| | 182,955,000 | | | ING Financial Markets LLC, 0.0100%,dated 12/30/11, maturing 1/3/12 to be repurchased at $182,955,203 collateralized by
$13,549,459 in U.S. Government Agencies 2.2250% – 5.0000% and $169,049,148 in U.S. Treasuries 0.2500% – 4.5000%,
5/31/13 – 11/15/41
with respective values of $7,800,436 and $178,814,865 | | | 182,955,000 | | | |
| | 500,000,000 | | | RBC Capital Markets Corp., 0.0050%, dated 12/30/11, maturing 1/3/12 to be repurchased at $500,000,278
collateralized by $486,540,571 in U.S. Treasuries 0.0000% – 3.3750%, 6/28/12 – 11/15/19
with a value of $510,000,040 | | | 500,000,000 | | | |
| |
| |
| Total Repurchase Agreements (cost $1,182,955,000) | | | 1,182,955,000 | | | |
| |
| |
| Total Investments (total cost $12,204,974,191) – 100.1% | | | 12,880,963,466 | | | |
| |
| |
| Liabilities, net of Cash, Receivables and Other Assets**– (0.1)% | | | (9,023,097) | | | |
| |
| |
| Net Assets – 100% | | $ | 12,871,940,369 | | | |
| |
| |
Summary of Investments by Country – (Long Positions)
| | | | | | | | | |
| | | | | | % of Investment
| |
| Country | | Value | | | Securities | |
| |
| |
| Bermuda | | $ | 347,733,603 | | | | 2.7% | |
| Canada | | | 181,728,000 | | | | 1.4% | |
| Ireland | | | 92,293,005 | | | | 0.7% | |
| Israel | | | 76,706,400 | | | | 0.6% | |
| Switzerland | | | 324,418,485 | | | | 2.5% | |
| United Kingdom | | | 532,290,347 | | | | 4.2% | |
United States†† | | | 11,325,793,626 | | | | 87.9% | |
| |
| |
| Total | | $ | 12,880,963,466 | | | | 100.0% | |
| | | |
| †† | | Includes Cash Equivalents (78.7% excluding Cash Equivalents). |
| | | | | |
| Schedule of Written Options – Calls | | Value | |
| | |
iShares Russell 2000® Index Fund (ETF)
expires January 2012
7,300 contracts
exercise price $70.55
(premiums received $3,058,700) | | $ | (3,000,126) | |
| |
| |
See Notes to Schedules of Investments and Financial Statements.
26 | DECEMBER 31, 2011
Perkins Select Value Fund (unaudited)
| | | | | | | |
Fund Snapshot
We believe in the timeless adage of the power of compounding and in doing so our focus is on mitigating losses in difficult markets. We invest in securities we believe have favorable risk/reward ratios by focusing first on rigorous downside analysis prior to determining upside potential. We seek to outperform both our benchmark and peers over a full market cycle by building a diversified portfolio of high-quality, undervalued stocks.
| | | | 
Robert Perkins
co-portfolio manager | |
Kevin Preloger
co-portfolio manager |
Perkins Select Value Fund began investment operations on December 15, 2011. The information provided for Perkins Select Value Fund reflects investment activity for the period December 15, 2011 to December 31, 2011.
Janus Value Funds | 27
Perkins Select Value Fund (unaudited)
Perkins Select Value Fund At A Glance
5 Largest Equity Holdings – (% of Net Assets)
As of December 31, 2011
| | | | | |
| | | | | |
First Niagara Financial Group, Inc.
Savings/Loan/Thrifts | | | 2.5% | |
Discover Financial Services
Finance – Credit Card | | | 1.8% | |
Kaydon Corp.
Metal Processors and Fabricators | | | 1.7% | |
Orkla A.S.A
Diversified Operations | | | 1.7% | |
SunTrust Banks, Inc.
Super-Regional Banks | | | 1.7% | |
| | | | | |
| | | | 9.4% | |
Asset Allocation – (% of Net Assets)
As of December 31, 2011
Emerging markets comprised 1.0% of total net assets.
Top Country Allocations – Long Positions (% of Investment Securities)
As of December 31, 2011
28 | DECEMBER 31, 2011
(unaudited)
| | | | | | | | |
| Cumulative Total Return – for the periods ended December 31, 2011 | | | Expense Ratios – estimated for the fiscal year |
| | | Since
| | | Total Annual Fund
| | Net Annual Fund
|
| | | Inception* | | | Operating Expenses | | Operating Expenses |
| | | | | | | | |
| Perkins Select Value Fund – Class A Shares | | | | | | | |
| | | | | | | | |
| NAV | | 2.20% | | | 1.43% | | 1.26% |
| | | | | | | | |
| MOP | | –3.68% | | | | | |
| | | | | | | | |
| Perkins Select Value Fund – Class C Shares | | | | | | | |
| | | | | | | | |
| NAV | | 2.20% | | | 2.20% | | 2.01% |
| | | | | | | | |
| CDSC | | 1.18% | | | | | |
| | | | | | | | |
| Perkins Select Value Fund – Class D Shares(1) | | 2.30% | | | 1.35% | | 1.16% |
| | | | | | | | |
| Perkins Select Value Fund – Class I Shares | | 2.30% | | | 1.15% | | 1.01% |
| | | | | | | | |
| Perkins Select Value Fund – Class S Shares | | 2.20% | | | 1.58% | | 1.51% |
| | | | | | | | |
| Perkins Select Value Fund – Class T Shares | | 2.20% | | | 1.33% | | 1.26% |
| | | | | | | | |
| Russell 3000® Value Index | | 4.10% | | | | | |
| | | | | | | | |
| Visit janus.com/advisor/mutual-funds (or janus.com/allfunds if you hold Shares directly with Janus Capital) to view current performance and characteristic information | | | | | |
| | | | | | | | |
Data presented represents past performance, which is no guarantee of future results. Investment results and principal value will fluctuate so that shares, when redeemed, may be worth more or less than their original cost. Due to market volatility, current performance may be higher or lower than the performance shown. Call 877.33JANUS(52687) (or 800.525.3713 if you hold shares directly with Janus Capital) or visit janus.com/advisor/mutual-funds (or janus.com/allfunds if you hold shares directly with Janus Capital) for performance current to the most recent month-end.
Performance shown for Class A Shares at Maximum Offering Price (MOP) includes the Fund’s maximum sales charge of 5.75%. Performance shown at Net Asset Value (NAV) does not include this charge and would have been lower had this charge been taken into account.
Performance shown for Class C Shares includes a 1% contingent deferred sales charge (CDSC) on periods of less than 12 months. Performance shown at Net Asset Value (NAV) does not include this sales charge and would have been lower had this sales charge been taken into account.
See important disclosures on the next page.
Janus Value Funds | 29
Perkins Select Value Fund (unaudited)
Janus Capital has contractually agreed to waive the Fund’s total annual fund operating expenses allocated to any class (excluding the distribution and shareholder servicing fees (applicable to Class A Shares, Class C Shares and Class S Shares), administrative services fees payable pursuant to the Transfer Agency Agreement (except for networking and omnibus fees), brokerage commissions, interest, dividends, taxes, acquired fund fees and expenses, and extraordinary expenses) to certain limits until at least November 1, 2013. The contractual waiver may be terminated or modified prior to this date only at the discretion of the Board of Trustees. Returns shown include fee waivers, if any, and without such waivers, returns would have been lower.
The expense information shown reflects estimated annualized expenses that the share classes of the Fund expect to incur during their initial fiscal year. The effect of contractual waivers agreed to by Janus Capital, when applicable, are reflected under “Net Annual Fund Operating Expenses.” (All expenses are shown without the effect of expense offset arrangements. Pursuant to such arrangements, credits realized as a result of uninvested cash balances are used to reduce custodian and transfer agent expenses.)
The Fund has a performance-based management fee that adjusts up or down based on the Fund’s performance relative to an approved benchmark index over a performance measurement period. See the Fund’s Prospectus or Statement of Additional Information for more details.
The Fund’s performance may be affected by risks that include those associated with undervalued or overlooked companies, investments in specific industries or countries and potential conflicts of interest with the Janus “funds of funds.” Additional risks to the Fund may include those associated with investing in foreign securities, emerging markets, initial public offerings (“IPOs”), real estate investment trusts (“REITs”), and derivatives. Please see a Janus prospectus or janus.com/info (or janus.com/reports if you hold shares directly with Janus Capital) for more information about risks, portfolio holdings and other details.
The Fund invests in REITs, which may be subject to a higher degree of market risk because of concentration in a specific industry, sector or geographic region. REITs may be subject to risks including, but not limited to: legal, political, liquidity, and interest rate risks, a decline in the value of real estate, risks related to general and economic conditions, changes in the value of the underlying property owned by the trust and defaults by borrowers. To the extent the Fund invests in foreign REITs, the Fund may be subject to fluctuations in currency rates or political or economic conditions in a particular country.
The Fund’s performance for very short time periods may not be indicative of future performance.
Due to certain investment strategies, the Fund may have an increased position in cash.
Returns include reinvestment of dividends from net investment income and distributions from capital gains. The returns shown do not reflect the deduction of taxes that a shareholder would pay on Fund distributions or the redemption of Fund shares. The returns do not include adjustments in accordance with generally accepted accounting principles required at the period end for financial reporting purposes.
Lipper does not rank this Fund as it is less than one year old.
There is no assurance that the investment process will consistently lead to successful investing.
See Notes to Schedules of Investments for index definitions.
The Fund’s portfolio may differ significantly from the securities held in the index. The index is unmanaged and is not available for direct investment; therefore, its performance does not reflect the expenses associated with the active management of an actual portfolio.
See “Explanations of Charts, Tables and Financial Statements.”
| | | |
| * | | The Fund’s inception date – December 15, 2011 |
| (1) | | Closed to new investors. |
30 | DECEMBER 31, 2011
(unaudited)
The examples below show you the ongoing costs (in dollars) of investing in your Fund and allow you to compare these costs with those of other mutual funds. Please refer to the section Useful Information About Your Fund Report for a detailed explanation of the information presented in these charts.
| | | | | | | | | | | | | | | |
| | | Beginning Account Value
| | Ending Account Value
| | Expenses Paid During Period
| | |
| Expense Example – Class A Shares | | (12/15/11) | | (12/31/11) | | (12/15/11 - 12/31/11)† | | |
| |
| |
| Actual | | $ | 1,000.00 | | | $ | 1,022.00 | | | $ | 0.57 | | | |
| |
| |
Hypothetical
(5% return before expenses) | | $ | 1,000.00 | | | $ | 1,019.05 | | | $ | 6.14 | | | |
| |
| |
| | | | | | | | | | | | | | | |
| | | | | | | | | | | | | | | |
| | | Beginning Account Value
| | Ending Account Value
| | Expenses Paid During Period
| | |
| Expense Example – Class C Shares | | (12/15/11) | | (12/31/11) | | (12/15/11 - 12/31/11)† | | |
| |
| |
| Actual | | $ | 1,000.00 | | | $ | 1,022.00 | | | $ | 0.92 | | | |
| |
| |
Hypothetical
(5% return before expenses) | | $ | 1,000.00 | | | $ | 1,015.33 | | | $ | 9.88 | | | |
| |
| |
| | | | | | | | | | | | | | | |
| | | | | | | | | | | | | | | |
| | | Beginning Account Value
| | Ending Account Value
| | Expenses Paid During Period
| | |
| Expense Example – Class D Shares | | (12/15/11) | | (12/31/11) | | (12/15/11 - 12/31/11)† | | |
| |
| |
| Actual | | $ | 1,000.00 | | | $ | 1,023.00 | | | $ | 0.68 | | | |
| |
| |
Hypothetical
(5% return before expenses) | | $ | 1,000.00 | | | $ | 1,017.90 | | | $ | 7.30 | | | |
| |
| |
| | | | | | | | | | | | | | | |
| | | | | | | | | | | | | | | |
| | | Beginning Account Value
| | Ending Account Value
| | Expenses Paid During Period
| | |
| Expense Example – Class I Shares | | (12/15/11) | | (12/31/11) | | (12/15/11 - 12/31/11)† | | |
| |
| |
| Actual | | $ | 1,000.00 | | | $ | 1,022.00 | | | $ | 0.48 | | | |
| |
| |
Hypothetical
(5% return before expenses) | | $ | 1,000.00 | | | $ | 1,020.01 | | | $ | 5.18 | | | |
| |
| |
| | | | | | | | | | | | | | | |
| | | | | | | | | | | | | | | |
| | | Beginning Account Value
| | Ending Account Value
| | Expenses Paid During Period
| | |
| Expense Example – Class S Shares | | (12/15/11) | | (12/31/11) | | (12/15/11 - 12/31/11)† | | |
| |
| |
| Actual | | $ | 1,000.00 | | | $ | 1,022.00 | | | $ | 0.68 | | | |
| |
| |
Hypothetical
(5% return before expenses) | | $ | 1,000.00 | | | $ | 1,017.85 | | | $ | 7.35 | | | |
| |
| |
| | | | | | | | | | | | | | | |
| | | | | | | | | | | | | | | |
| | | Beginning Account Value
| | Ending Account Value
| | Expenses Paid During Period
| | |
| Expense Example – Class T Shares | | (12/15/11) | | (12/31/11) | | (12/15/11 - 12/31/11)† | | |
| |
| |
| Actual | | $ | 1,000.00 | | | $ | 1,022.00 | | | $ | 0.57 | | | |
| |
| |
Hypothetical
(5% return before expenses) | | $ | 1,000.00 | | | $ | 1,019.00 | | | $ | 6.19 | | | |
| |
| |
| | | |
| † | | Actual Expenses paid reflect only the inception period (December 15, 2011 to December 31, 2011). Therefore actual expenses shown are lower than would be expected for a six-month period. Actual expenses are equal to the annualized expense ratio of 1.21% for Class A Shares, 1.95% for Class C Shares, 1.44% for Class D Shares, 1.02% for Class I Shares, 1.45% for Class S Shares and 1.22% for Class T Shares multiplied by the average account value over the period, multiplied by 17/366 (to reflect the period). Expenses include effect of contractual waivers by Janus Capital. |
Janus Value Funds | 31
Perkins Select Value Fund
Schedule of Investments (unaudited)
As of December 31, 2011
| | | | | | | | | | | |
| Shares or Principal Amount | | Value | | | |
| |
| Common Stock – 72.3% | | | | | | |
| Aerospace and Defense – 1.5% | | | | | | |
| | 4,000 | | | General Dynamics Corp. | | $ | 265,640 | | | |
| | 11,000 | | | Raytheon Co. | | | 532,180 | | | |
| | | | | | | | 797,820 | | | |
| Agricultural Chemicals – 1.2% | | | | | | |
| | 12,000 | | | Mosaic Co. | | | 605,160 | | | |
| Applications Software – 1.5% | | | | | | |
| | 10,000 | | | Microsoft Corp. | | | 259,600 | | | |
| | 27,000 | | | Progress Software Corp.* | | | 522,450 | | | |
| | | | | | | | 782,050 | | | |
| Building – Heavy Construction – 1.8% | | | | | | |
| | 20,000 | | | Granite Construction, Inc. | | | 474,400 | | | |
| | 45,000 | | | Sterling Construction Co., Inc.* | | | 484,650 | | | |
| | | | | | | | 959,050 | | | |
| Building – Residential and Commercial – 1.1% | | | | | | |
| | 32,000 | | | M.D.C. Holdings, Inc. | | | 564,160 | | | |
| Cellular Telecommunications – 2.5% | | | | | | |
| | 40,000 | | | SK Telecom Co., Ltd. (ADR) | | | 544,400 | | | |
| | 28,000 | | | Vodafone Group PLC (ADR) | | | 784,840 | | | |
| | | | | | | | 1,329,240 | | | |
| Circuit Boards – 0.7% | | | | | | |
| | 35,000 | | | TTM Technologies, Inc.* | | | 383,600 | | | |
| Commercial Banks – 1.0% | | | | | | |
| | 55,000 | | | Fulton Financial Corp. | | | 539,550 | | | |
| Commercial Services – Finance – 2.1% | | | | | | |
| | 12,000 | | | Global Payments, Inc. | | | 568,560 | | | |
| | 28,000 | | | Western Union Co. | | | 511,280 | | | |
| | | | | | | | 1,079,840 | | | |
| Computers – Integrated Systems – 1.3% | | | | | | |
| | 23,000 | | | Diebold, Inc. | | | 691,610 | | | |
| Dental Supplies and Equipment – 1.1% | | | | | | |
| | 20,000 | | | Patterson Cos., Inc. | | | 590,400 | | | |
| Diversified Operations – 1.7% | | | | | | |
| | 120,000 | | | Orkla A.S.A. | | | 896,271 | | | |
| Electronic Components – Miscellaneous – 0.5% | | | | | | |
| | 7,000 | | | Garmin, Ltd. | | | 278,670 | | | |
| Electronic Components – Semiconductors – 1.8% | | | | | | |
| | 35,000 | | | OmniVision Technologies, Inc.* | | | 428,225 | | | |
| | 20,000 | | | Semtech Corp.* | | | 496,400 | | | |
| | | | | | | | 924,625 | | | |
| Engineering – Research and Development Services – 3.1% | | | | | | |
| | 20,000 | | | KBR, Inc. | | | 557,400 | | | |
| | 35,000 | | | Michael Baker Corp.* | | | 686,350 | | | |
| | 11,000 | | | URS Corp.* | | | 386,320 | | | |
| | | | | | | | 1,630,070 | | | |
| Engines – Internal Combustion – 0.7% | | | | | | |
| | 25,000 | | | Briggs & Stratton Corp. | | | 387,250 | | | |
| Finance – Credit Card – 1.8% | | | | | | |
| | 40,000 | | | Discover Financial Services | | | 960,000 | | | |
| Footwear and Related Apparel – 1.0% | | | | | | |
| | 14,000 | | | Wolverine World Wide, Inc. | | | 498,960 | | | |
| Gold Mining – 0.8% | | | | | | |
| | 10,000 | | | Goldcorp, Inc. (U.S. Shares) | | | 442,500 | | | |
| Golf – 0.8% | | | | | | |
| | 80,000 | | | Callaway Golf Co. | | | 442,400 | | | |
| Instruments – Scientific – 2.2% | | | | | | |
| | 28,000 | | | PerkinElmer, Inc. | | | 560,000 | | | |
| | 13,000 | | | Thermo Fisher Scientific, Inc.* | | | 584,610 | | | |
| | | | | | | | 1,144,610 | | | |
| Internet Security – 1.6% | | | | | | |
| | 55,000 | | | Symantec Corp.* | | | 860,750 | | | |
| Investment Management and Advisory Services – 1.4% | | | | | | |
| | 11,000 | | | Ameriprise Financial, Inc. | | | 546,040 | | | |
| | 2,000 | | | Franklin Resources, Inc. | | | 192,120 | | | |
| | | | | | | | 738,160 | | | |
| Medical – Drugs – 3.0% | | | | | | |
| | 17,000 | | | Forest Laboratories, Inc.* | | | 514,420 | | | |
| | 14,000 | | | Merck & Co., Inc. | | | 527,800 | | | |
| | 9,000 | | | Novartis A.G. (ADR) | | | 514,530 | | | |
| | | | | | | | 1,556,750 | | | |
| Medical – Generic Drugs – 1.2% | | | | | | |
| | 16,000 | | | Teva Pharmaceutical S.P. (ADR) | | | 645,760 | | | |
| Medical Instruments – 0.9% | | | | | | |
| | 14,000 | | | St. Jude Medical, Inc. | | | 480,200 | | | |
| Medical Labs and Testing Services – 1.1% | | | | | | |
| | 33,000 | | | ICON PLC (ADR)* | | | 564,630 | | | |
| Medical Products – 3.7% | | | | | | |
| | 8,000 | | | Becton, Dickinson and Co. | | | 597,760 | | | |
| | 14,000 | | | Covidien PLC (U.S. Shares) | | | 630,140 | | | |
| | 11,000 | | | PSS World Medical, Inc.* | | | 266,090 | | | |
| | 8,000 | | | Zimmer Holdings, Inc. | | | 427,360 | | | |
| | | | | | | | 1,921,350 | | | |
| Medical Sterilization Products – 1.0% | | | | | | |
| | 17,000 | | | STERIS Corp. | | | 506,940 | | | |
| Metal – Copper – 0.6% | | | | | | |
| | 9,000 | | | Freeport-McMoRan Copper & Gold, Inc. – Class B | | | 331,110 | | | |
| Metal Processors and Fabricators – 1.7% | | | | | | |
| | 30,000 | | | Kaydon Corp. | | | 915,000 | | | |
| Multi-Line Insurance – 1.5% | | | | | | |
| | 19,000 | | | Allstate Corp. | | | 520,790 | | | |
| | 9,000 | | | Unitrin, Inc. | | | 262,890 | | | |
| | | | | | | | 783,680 | | | |
| Oil – Field Services – 1.4% | | | | | | |
| | 40,000 | | | PAA Natural Gas Storage L.P. | | | 750,000 | | | |
| Oil Companies – Exploration and Production – 5.7% | | | | | | |
| | 15,000 | | | Bill Barrett Corp.* | | | 511,050 | | | |
| | 10,000 | | | Devon Energy Corp. | | | 620,000 | | | |
| | 50,000 | | | Exco Resources, Inc. | | | 522,500 | | | |
| | 72,000 | | | Lone Pine Resources, Inc.* | | | 504,720 | | | |
| | 28,000 | | | QEP Resources, Inc. | | | 820,400 | | | |
| | | | | | | | 2,978,670 | | | |
| Oil Companies – Integrated – 1.5% | | | | | | |
| | 14,000 | | | Hess Corp. | | | 795,200 | | | |
See Notes to Schedules of Investments and Financial Statements.
32 | DECEMBER 31, 2011
Schedule of Investments (unaudited)
As of December 31, 2011
| | | | | | | | | | | |
| Shares or Principal Amount | | Value | | | |
| |
| Real Estate Operating/Development – 1.1% | | | | | | |
| | 40,000 | | | St. Joe Co.* | | $ | 586,400 | | | |
| Reinsurance – 0.8% | | | | | | |
| | 5,000 | | | Everest Re Group, Ltd. | | | 420,450 | | | |
| REIT – Diversified – 2.7% | | | | | | |
| | 25,000 | | | Potlatch Corp. | | | 777,750 | | | |
| | 34,000 | | | Weyerhaeuser Co. | | | 634,780 | | | |
| | | | | | | | 1,412,530 | | | |
| REIT – Hotels – 0.5% | | | | | | |
| | 28,000 | | | DiamondRock Hospitality Co. | | | 269,920 | | | |
| REIT – Mortgage – 1.0% | | | | | | |
| | 54,000 | | | Redwood Trust, Inc. | | | 549,720 | | | |
| Retail – Apparel and Shoe – 1.3% | | | | | | |
| | 22,000 | | | Guess?, Inc. | | | 656,040 | | | |
| Retail – Leisure Products – 0.7% | | | | | | |
| | 55,604 | | | MarineMax, Inc.* | | | 362,538 | | | |
| Savings/Loan/Thrifts – 2.5% | | | | | | |
| | 150,000 | | | First Niagara Financial Group, Inc. | | | 1,294,500 | | | |
| Semiconductor Equipment – 1.0% | | | | | | |
| | 50,000 | | | Applied Materials, Inc. | | | 535,500 | | | |
| Super-Regional Banks – 3.0% | | | | | | |
| | 32,000 | | | Fifth Third Bancorp. | | | 407,040 | | | |
| | 5,000 | | | PNC Financial Services Group, Inc. | | | 288,350 | | | |
| | 50,000 | | | SunTrust Banks, Inc. | | | 885,000 | | | |
| | | | | | | | 1,580,390 | | | |
| X-Ray Equipment – 1.2% | | | | | | |
| | 35,000 | | | Hologic, Inc.* | | | 612,850 | | | |
| |
| |
| Total Common Stock (cost $36,911,298) | | | 38,036,874 | | | |
| |
| |
| Repurchase Agreement – 31.8% | | | | | | |
| | $16,700,000 | | | HSBC Securities (USA), Inc., 0.0100%, dated 12/30/11, maturing 1/3/12 to be repurchased at $16,700,019
collateralized by $21,133,953 in U.S. Treasuries 0.0000%, 11/15/21 – 5/15/22
with a value of $17,034,117 (cost $16,700,000) | | | 16,700,000 | | | |
| |
| |
| Total Investments (total cost $53,611,298) – 104.1% | | | 54,736,874 | | | |
| |
| |
| Liabilities, net of Cash, Receivables and Other Assets– (4.1)% | | | (2,166,255) | | | |
| |
| |
| Net Assets – 100% | | $ | 52,570,619 | | | |
| |
| |
Summary of Investments by Country – (Long Positions)
| | | | | | | | | |
| | | | | | % of Investment
| |
| Country | | Value | | | Securities | |
| |
| |
| Bermuda | | $ | 420,450 | | | | 0.8% | |
| Canada | | | 442,500 | | | | 0.8% | |
| Ireland | | | 1,194,770 | | | | 2.2% | |
| Israel | | | 645,760 | | | | 1.2% | |
| Norway | | | 896,271 | | | | 1.6% | |
| South Korea | | | 544,400 | | | | 1.0% | |
| Switzerland | | | 793,200 | | | | 1.5% | |
| United Kingdom | | | 784,840 | | | | 1.4% | |
United States†† | | | 49,014,683 | | | | 89.5% | |
| |
| |
| Total | | $ | 54,736,874 | | | | 100.0% | |
| | | |
| †† | | Includes Cash Equivalents (59.0% excluding Cash Equivalents). |
See Notes to Schedules of Investments and Financial Statements.
Janus Value Funds | 33
Perkins Small Cap Value Fund (unaudited)(closed to certain new investors)
| | | | | | | |
Fund Snapshot
We believe in the timeless adage of the power of compounding and in doing so our focus is on mitigating losses in difficult markets. We invest in securities that we believe to have favorable risk/reward ratios by focusing first on rigorous downside analysis prior to determining upside potential. We seek to outperform both our benchmark and peers over a full market cycle by building diversified portfolios of high-quality, undervalued stocks.
| |
Robert Perkins
co-portfolio manager | | 
Todd Perkins
co-portfolio manager | | 
Justin Tugman
co-portfolio manager |
Performance Overview
During the six months ended December 31, 2011, Perkins Small Cap Value Fund’s Class T Shares returned -7.14%, versus a -8.94% return for the Fund’s benchmark, the Russell 2000 Value Index. Stock selection in general was strong led by technology, consumer staples, and consumer discretionary. During a turbulent six months, the portfolio behaved as we would have expected – the Fund was down, but down less than the Index. The ability to limit losses is a critical component of compounding returns over the long term, in our view.
Economic Environment
Stocks gave up gains during a significant sell-off in the third quarter, as problems in Europe became much more apparent. The focus was on European sovereign debt issues and undercapitalized European banks. The inability to take substantive action to address those problems created a situation of great uncertainty and raised questions of global contagion.
The stock market rebounded from the third quarter correction, but not enough to entirely offset the losses from the third quarter. The bounce back was fueled by strong earnings reports, improving economic data, and a late December liquidity injection by the European Central Bank (ECB). Despite these short-term trend improvements, our market perspective has not changed, as we remain somewhat cautious with higher than normal cash levels. The environment remains one of extremely strong company fundamentals offset by very challenging economic and financial issues. Economic vulnerability persists with continuous headwinds from the European debt crisis coupled with ongoing governmental and consumer deleveraging, and high unemployment levels. Volatility drives market sentiment, even with the backdrop of continued monetary actions at home (securities repurchases, low interest rates), and, to date, ineffective attempts to remedy the long term capital shortage of European banks. And so, during the short term, uncertainty will likely persist until we regain footing on macro fundamentals.
Contagion risk remains as mounting European debt problems affect financial structures globally. Concerns revolve around the European banking system as many banks are thinly capitalized and carry debt of distressed “PIIGS” (Portugal, Italy, Ireland, Greece and Spain) countries at unrealistically high values. In an effort to absorb any potential shocks from the Euro zone debt crisis and encourage domestic growth, U.S. Fed policy indicates interest rates will remain somewhat artificially low well into 2013.
In spite of macroeconomic headwinds, microeconomic fundamentals remain positive. The market appears reasonably valued with the S&P 500 Index trading at period end at about 13x 2011 earnings estimates of $95, and an earnings yield of almost 8%. As compared to 10-year Treasuries’ yields of slightly under 2%, there is a 6% risk premium to owning stocks – the highest level in three decades. Moreover, for the first time in 50 years, stocks yield more than 10-year Treasuries, as the S&P 500 dividend yield currently is over 2%. Corporate balance sheets continue to strengthen, and U.S. banks have much better capital structures than before the financial crisis. By these metrics, equities remain an attractive asset class, especially compared to bonds. Continuing high volatility provides for pricing dislocation and opportunity.
Holdings That Contributed to Performance
Immucor, a maker of systems used in blood transfusions, rose 27% after it agreed to be acquired by private equity firm TPG Capital in a $1.97 billion deal. We eliminated the position after the deal was announced.
Convenience store operator Casey’s General Stores also recorded strong gains. The company continues to successfully integrate small acquisitions and their core business remains stable. We trimmed our position on
34 | DECEMBER 31, 2011
(unaudited)(closed to certain new investors)
strength, as we felt the reward-to-risk ratio became less favorable.
Retailer American Eagle Outfitters rebounded from weakness earlier in the year when it had difficulty passing on rising cotton costs to the consumer. We trimmed our holding on the gains, but we believe it remains inexpensive on trough margins and has significant cash on the balance sheet.
Holdings That Detracted From Performance
Forest Oil underperformed as the lingering negative sentiment from recent production guide downs as well as a disappointing initial public offering of its Canadian assets weighed on the shares. We believe management will need to prove it is capable of resolving its issues and posting improved performance, for which the market appears not willing to give them credit until results actually do improve. The balance sheet continues to improve and we believe that both Forest Oil and Lone Pine Resources, its spun-off Canadian asset unit, remain undervalued.
First Niagara (FNFG) was a disappointment in 2011. With a strong, high quality earnings stream in our view, no credit problems, a large dividend and robust capital ratios FNFG in many ways typified what we look for in an investment. We felt our downside was limited given valuation and the flexibility the firm’s financial strength allowed. Even as we incorporated a lower estimate for a longer type of interest rate environment, the shares remained attractive. Unfortunately, we didn’t account properly for a poorly timed and executed large acquisition. This was a mistake on our part, in so far as we’ve followed the bank for a long time, owning the shares from time to time and had always considered acquisition appetite to be a considerable risk. We believe their appetite has been sated for the time being, and with a capital raise and a dividend cut behind us, we maintained our position by adding on the weakness as the stock is now one of the cheapest in our universe on a price-to-earnings basis.
Engineering and construction stocks like URS lagged due to the economic slowdown and the impact that could have on capital spending. URS also has 50% exposure to the federal government and potential cutbacks there have also weighed on the shares. While the company’s large government exposure is a concern, most of those contracts are long term in nature on the non procurement side. We maintain a position as we believe it has an attractive valuation at current levels, strong 15% free cash flow yield, and a clean balance sheet.
Market Outlook
We believe that our quality-oriented, risk-sensitive investment approach is especially important in this type of difficult environment. High-quality companies with strong balance sheets and consistent free cash flows will likely hold up better in stressed environments over the long term, and are better positioned against weaker competitors. We have attractive long-term opportunities in financials, health care and infrastructure. Banks offer good values with solid capital levels in our view, attractive valuations based on normalized earnings and dividend yields of 3%-5%. On the health care side, medical equipment stocks have traded off during the year on growth concerns. However, we think the longer term demographics are favorable to support earnings growth, and in the meantime, valuations are well below historical levels, balance sheets appear very strong and free cash flow yields approach 10% in many instances. In the infrastructure area, engineering and construction companies are trading at below average multiples of earnings with strong balance sheets and in our view could benefit from any infrastructure stimulus plan originating from Washington.
Overall, due to the significant number of negative headwinds domestically and abroad, we believe it is important to be risk sensitive while maintaining a long-term focus. The ability to outperform on the downside is a critical component of compounding returns in the long term. Short-term volatility is likely to remain high, and it is easy to make short-term mistakes at the expense of long-term results. Our fundamental approach to investing has produced above average returns over the long term. This reinforces our confidence to pursue our disciplined, value oriented, investment process.
Thank you for your investment in Perkins Small Cap Value Fund.
Janus Value Funds | 35
Perkins Small Cap Value Fund (unaudited)(closed to certain new investors)
Perkins Small Cap Value Fund At A Glance
5 Top Performers – Holdings
| | | | | |
| | | Contribution |
| |
| Immucor, Inc | | | 0.53% | |
| Casey’s General Stores, Inc. | | | 0.28% | |
| American Eagle Outfitters, Inc. | | | 0.27% | |
| Akamai Technologies, Inc. | | | 0.23% | |
| Petroleum Development Corp. | | | 0.18% | |
5 Bottom Performers – Holdings
| | | | | |
| | | Contribution |
| |
| First Niagara Financial Group, Inc. | | | –0.96% | |
| Forest Oil Corp. | | | –0.56% | |
| URS Corp. | | | –0.52% | |
| Bill Barrett Corp. | | | –0.41% | |
| Kaydon Corp. | | | –0.39% | |
5 Top Performers – Sectors*
| | | | | | | | | | | | | |
| | | | | Fund Weighting
| | Russell 2000®
|
| | | Fund Contribution | | (Average % of Equity) | | Value Index Weighting |
| |
| Information Technology | | | 1.83% | | | | 14.11% | | | | 11.29% | |
| Consumer Staples | | | 0.78% | | | | 6.60% | | | | 2.97% | |
| Consumer Discretionary | | | 0.47% | | | | 10.09% | | | | 11.70% | |
| Industrials | | | 0.28% | | | | 10.18% | | | | 14.80% | |
| Health Care | | | 0.25% | | | | 12.09% | | | | 5.36% | |
5 Bottom Performers – Sectors*
| | | | | | | | | | | | | |
| | | | | Fund Weighting
| | Russell 2000®
|
| | | Fund Contribution | | (Average % of Equity) | | Value Index Weighting |
| |
| Financials | | | –1.69% | | | | 32.73% | | | | 35.68% | |
| Utilities | | | –1.04% | | | | 0.00% | | | | 7.30% | |
| Energy | | | –0.31% | | | | 10.65% | | | | 5.07% | |
| Telecommunication Services | | | 0.16% | | | | 0.18% | | | | 0.71% | |
| Materials | | | 0.21% | | | | 3.37% | | | | 5.12% | |
| | | |
| | | Security contribution to performance is measured by using an algorithm that multiplies the daily performance of each security with the previous day’s ending weight in the portfolio and is gross of advisory fees. Fixed income securities and certain equity securities, such as private placements and some share classes of equity securities, are excluded. |
| * | | Based on sector classification according to the Global Industry Classification Standard codes, which are the exclusive property and a service mark of MSCI Inc. and Standard & Poor’s. |
36 | DECEMBER 31, 2011
(unaudited)(closed to certain new investors)
5 Largest Equity Holdings – (% of Net Assets)
As of December 31, 2011
| | | | | |
First Niagara Financial Group, Inc.
Savings/Loan/Thrifts | | | 2.3% | |
Kaydon Corp.
Metal Processors and Fabricators | | | 2.1% | |
Unitrin, Inc.
Multi-Line Insurance | | | 2.1% | |
Hancock Holding Co.
Commercial Banks | | | 2.0% | |
STERIS Corp.
Medical Sterilization Products | | | 1.9% | |
| | | | | |
| | | | 10.4% | |
Asset Allocation – (% of Net Assets)
As of December 31, 2011
Top County Allocations – Long Positions (% of Investment Securities)
As of December 31, 2011
Janus Value Funds | 37
Perkins Small Cap Value Fund (unaudited)(closed to certain new investors)
| | | | | | | | | | | | | | |
| Average Annual Total Return – for the periods ended December 31, 2011 | | | Expense Ratios – per the October 28, 2011 prospectuses |
| | | Fiscal
| | One
| | Five
| | Ten
| | | Total Annual Fund
| | Net Annual Fund
|
| | | Year-to-Date | | Year | | Year | | Year | | | Operating Expenses | | Operating Expenses |
| | | | | | | | | | | | | | |
| Perkins Small Cap Value Fund – Class A Shares(1) | | | | | | | | | | | | | |
| | | | | | | | | | | | | | |
| NAV | | –7.23% | | –3.58% | | 4.40% | | 6.97% | | | 1.26% | | 1.26% |
| | | | | | | | | | | | | | |
| MOP | | –12.57% | | –9.12% | | 3.17% | | 6.34% | | | | | |
| | | | | | | | | | | | | | |
| Perkins Small Cap Value Fund – Class C Shares(1) | | | | | | | | | | | | | |
| | | | | | | | | | | | | | |
| NAV | | –7.60% | | –4.37% | | 3.62% | | 6.22% | | | 2.06% | | 2.05% |
| | | | | | | | | | | | | | |
| CDSC | | –8.41% | | –5.21% | | 3.62% | | 6.22% | | | | | |
| | | | | | | | | | | | | | |
| Perkins Small Cap Value Fund – Class D Shares(1) | | –7.08% | | –3.33% | | 4.64% | | 7.25% | | | 1.00% | | 1.00% |
| | | | | | | | | | | | | | |
| Perkins Small Cap Value Fund – Class I Shares(1) | | –7.07% | | –3.28% | | 4.60% | | 7.23% | | | 0.94% | | 0.94% |
| | | | | | | | | | | | | | |
| Perkins Small Cap Value Fund – Class L Shares(1) | | –7.04% | | –3.18% | | 4.85% | | 7.48% | | | 1.09% | | 1.09% |
| | | | | | | | | | | | | | |
| Perkins Small Cap Value Fund – Class R Shares(1) | | –7.35% | | –3.89% | | 4.10% | | 6.72% | | | 1.61% | | 1.61% |
| | | | | | | | | | | | | | |
| Perkins Small Cap Value Fund – Class S Shares(1) | | –7.26% | | –3.69% | | 4.36% | | 6.98% | | | 1.36% | | 1.36% |
| | | | | | | | | | | | | | |
| Perkins Small Cap Value Fund – Class T Shares(1) | | –7.14% | | –3.43% | | 4.60% | | 7.23% | | | 1.11% | | 1.11% |
| | | | | | | | | | | | | | |
| Russell 2000® Value Index | | –8.94% | | –5.50% | | –1.87% | | 6.40% | | | | | |
| | | | | | | | | | | | | | |
| Lipper Quartile – Class T Shares | | – | | 3rd | | 1st | | 1st | | | | | |
| | | | | | | | | | | | | | |
| Lipper Ranking – based on total returns for Small-Cap Core Funds | | – | | 376/698 | | 36/501 | | 69/304 | | | | | |
| | | | | | | | | | | | | | |
| Visit janus.com/advisor/mutual-funds (or janus.com/allfunds if you hold Shares directly with Janus Capital) to view current performance and characteristic information | | | | | |
| | | | | | | | | | | | | | |
Data presented represents past performance, which is no guarantee of future results. Investment results and principal value will fluctuate so that shares, when redeemed, may be worth more or less than their original cost. Due to market volatility, current performance may be higher or lower than the performance shown. Call 877.33JANUS(52687) (or 800.525.3713 if you hold shares directly with Janus Capital) or visit janus.com/advisor/mutual-funds (or janus.com/allfunds if you hold shares directly with Janus Capital) for performance current to the most recent month-end.
Performance shown for Class A Shares at Maximum Offering Price (MOP) includes the Fund’s maximum sales charge of 5.75%. Performance shown at Net Asset Value (NAV) does not include this charge and would have been lower had this charge been taken into account.
Performance shown for Class C Shares includes a 1% contingent deferred sales charge (CDSC) on periods of less than 12 months. Performance shown at Net Asset Value (NAV) does not include this sales charge and would have been lower had this sales charge been taken into account.
See important disclosures on the next page.
38 | DECEMBER 31, 2011
(unaudited)(closed to certain new investors)
Janus Capital has contractually agreed to waive the Fund’s total annual fund operating expenses allocated to any class (excluding any performance adjustments to management fees, the distribution and shareholder servicing fees (applicable to Class A Shares, Class C Shares, Class R Shares and Class S Shares), administrative services fees payable pursuant to the Transfer Agency Agreement (except for networking and omnibus fees), brokerage commissions, interest, dividends, taxes, acquired fund fees and expenses, and extraordinary expenses) to certain limits until at least November 1, 2012. The contractual waiver may be terminated or modified prior to this date only at the discretion of the Board of Trustees. Returns shown include fee waivers, if any, and without such waivers returns would have been lower.
Janus Services LLC has agreed to waive all or a portion of the administrative fee applicable to the Fund’s Class L Shares. Such waiver is voluntary and could change or be terminated at any time at the discretion of Janus Services LLC or Janus Capital without prior notification to shareholders. Total returns shown include fee waivers, if any, and without such waivers, the total returns would have been lower.
The expense information shown was determined based on net assets as of the fiscal period ended June 30, 2011. The effect of contractual waivers agreed to by Janus Capital, when applicable, are reflected under “Net Annual Fund Operating Expenses.” (All expenses are shown without the effect of expense offset arrangements. Pursuant to such arrangements, credits realized as a result of uninvested cash balances are used to reduce custodian and transfer agent expenses.)
The Fund has a performance-based management fee that adjusts up or down based on the Fund’s performance relative to an approved benchmark index over a performance measurement period. See the Fund’s Prospectus or Statement of Additional Information for more details.
The Fund’s performance may be affected by risks that include those associated with undervalued or overlooked companies, investments in specific industries or countries and potential conflicts of interest with the Janus “funds of funds.” Additional risks to the Fund may include those associated with investing in foreign securities, emerging markets, initial public offerings (“IPOs”), real estate investment trusts (“REITs”), derivatives and companies with relatively small market capitalizations. Please see a Janus prospectus or janus.com/info (or janus.com/reports if you hold shares directly with Janus Capital) for more information about risks, portfolio holdings and other details.
The Fund invests in REITs, which may be subject to a higher degree of market risk because of concentration in a specific industry, sector or geographic region. REITs may be subject to risks including, but not limited to: legal, political, liquidity, and interest rate risks, a decline in the value of real estate, risks related to general and economic conditions, changes in the value of the underlying property owned by the trust and defaults by borrowers. To the extent the Fund invests in foreign REITs, the Fund may be subject to fluctuations in currency rates or political or economic conditions in a particular country.
The Fund will normally invest at least 80% of its net assets, measured at the time of purchase, in the type of securities described by its name.
Due to certain investment strategies, the Fund may have an increased position in cash.
Returns include reinvestment of dividends from net investment income and distributions from capital gains. The returns shown do not reflect the deduction of taxes that a shareholder would pay on Fund distributions or the redemption of Fund shares. The returns do not include adjustments in accordance with generally accepted accounting principles required at the period end for financial reporting purposes.
Class A Shares, Class C Shares, Class R Shares and Class S Shares of the Fund commenced operations on July 6, 2009. The historical performance shown for periods prior to July 6, 2009 reflects the performance of one or more other share classes of the Fund or a predecessor fund, calculated using the fees and expenses of each respective share class without the effect of any fee and expense limitations and waivers. If each share class of the Fund had been available during periods prior to July 6, 2009, the performance shown may have been different. Please refer to the Fund’s prospectus for further details concerning historical performance.
Class D Shares of the Fund commenced operations on February 16, 2010. The historical performance shown for periods prior to February 16, 2010 reflects the performance of one or more other share classes of the Fund or a predecessor fund. If Class D Shares of the Fund had been available during periods prior to February 16, 2010, the performance shown may have been different. Please refer to the Fund’s prospectus for further details concerning historical performance.
Class I Shares of the Fund commenced operations on July 6, 2009. The historical performance shown for periods prior to July 6, 2009 was calculated using the performance and the fees and expenses of one or more other share classes of the Fund or a predecessor fund, accounting for, when applicable and permitted, any fee and expense limitations and waivers. If Class I Shares of the Fund had been available during periods prior to July 6, 2009, the performance shown may have been different. Please refer to the Fund’s prospectus for further details concerning historical performance.
Class L Shares of the Fund commenced operations on April 21, 2003. The historical performance shown for periods prior to April 21, 2003 reflects the performance of one or more other share classes of a predecessor fund. Please refer to the Fund’s prospectus for further details concerning historical performance.
Class T Shares of the Fund commenced operations with the Fund’s inception. The historical performance shown for periods prior to April 21, 2003 reflects the performance of another share class of a predecessor fund. Please refer to the Fund’s prospectus for further details concerning historical performance.
Lipper, a wholly-owned subsidiary of Thomson Reuters, provides independent insight on global collective investments including mutual funds, retirement funds, hedge funds, fund fees and expenses to the asset management and media communities. Lipper ranks the performance of mutual funds within a classification of funds that have similar investment objectives. Rankings are historical with capital gains and dividends reinvested and do not include the effect of loads.
Ranking is for Class T Shares only; other classes may have different performance characteristics. When an expense waiver is in effect, it may have a material effect on the total return, and therefore the ranking for the period.
Janus Value Funds | 39
Perkins Small Cap Value Fund (unaudited)(closed to certain new investors)
There is no assurance that the investment process will consistently lead to successful investing.
See Notes to Schedules of Investments for index definitions.
The Fund’s portfolio may differ significantly from the securities held in the index. The index is unmanaged and is not available for direct investment; therefore, its performance does not reflect the expenses associated with the active management of an actual portfolio.
See “Explanations of Charts, Tables and Financial Statements.”
| | | |
| (1) | | Closed to certain new investors. Please see current prospectus for details. |
The examples below show you the ongoing costs (in dollars) of investing in your Fund and allow you to compare these costs with those of other mutual funds. Please refer to the section Useful Information About Your Fund Report for a detailed explanation of the information presented in these charts.
| | | | | | | | | | | | | | | |
| | | Beginning Account Value
| | Ending Account Value
| | Expenses Paid During Period
| | |
| Expense Example – Class A Shares | | (7/1/11) | | (12/31/11) | | (7/1/11 - 12/31/11)† | | |
| |
| |
| Actual | | $ | 1,000.00 | | | $ | 927.70 | | | $ | 6.40 | | | |
| |
| |
Hypothetical
(5% return before expenses) | | $ | 1,000.00 | | | $ | 1,018.50 | | | $ | 6.70 | | | |
| |
| |
| | | | | | | | | | | | | | | |
| | | | | | | | | | | | | | | |
| | | Beginning Account Value
| | Ending Account Value
| | Expenses Paid During Period
| | |
| Expense Example – Class C Shares | | (7/1/11) | | (12/31/11) | | (7/1/11 - 12/31/11)† | | |
| |
| |
| Actual | | $ | 1,000.00 | | | $ | 924.50 | | | $ | 10.01 | | | |
| |
| |
Hypothetical
(5% return before expenses) | | $ | 1,000.00 | | | $ | 1,014.73 | | | $ | 10.48 | | | |
| |
| |
| | | | | | | | | | | | | | | |
| | | | | | | | | | | | | | | |
| | | Beginning Account Value
| | Ending Account Value
| | Expenses Paid During Period
| | |
| Expense Example – Class D Shares | | (7/1/11) | | (12/31/11) | | (7/1/11 - 12/31/11)† | | |
| |
| |
| Actual | | $ | 1,000.00 | | | $ | 929.20 | | | $ | 4.99 | | | |
| |
| |
Hypothetical
(5% return before expenses) | | $ | 1,000.00 | | | $ | 1,019.96 | | | $ | 5.23 | | | |
| |
| |
| | | | | | | | | | | | | | | |
| | | | | | | | | | | | | | | |
| | | Beginning Account Value
| | Ending Account Value
| | Expenses Paid During Period
| | |
| Expense Example – Class I Shares | | (7/1/11) | | (12/31/11) | | (7/1/11 - 12/31/11)† | | |
| |
| |
| Actual | | $ | 1,000.00 | | | $ | 929.30 | | | $ | 4.70 | | | |
| |
| |
Hypothetical
(5% return before expenses) | | $ | 1,000.00 | | | $ | 1,020.26 | | | $ | 4.93 | | | |
| |
| |
| | | | | | | | | | | | | | | |
| | | | | | | | | | | | | | | |
| | | Beginning Account Value
| | Ending Account Value
| | Expenses Paid During Period
| | |
| Expense Example – Class L Shares | | (7/1/11) | | (12/31/11) | | (7/1/11 - 12/31/11)† | | |
| |
| |
| Actual | | $ | 1,000.00 | | | $ | 929.60 | | | $ | 4.27 | | | |
| |
| |
Hypothetical
(5% return before expenses) | | $ | 1,000.00 | | | $ | 1,020.71 | | | $ | 4.47 | | | |
| |
| |
| | | | | | | | | | | | | | | |
| | | | | | | | | | | | | | | |
| | | Beginning Account Value
| | Ending Account Value
| | Expenses Paid During Period
| | |
| Expense Example – Class R Shares | | (7/1/11) | | (12/31/11) | | (7/1/11 - 12/31/11)† | | |
| |
| |
| Actual | | $ | 1,000.00 | | | $ | 926.50 | | | $ | 7.89 | | | |
| |
| |
Hypothetical
(5% return before expenses) | | $ | 1,000.00 | | | $ | 1,016.94 | | | $ | 8.26 | | | |
| |
| |
| | | | | | | | | | | | | | | |
| | | | | | | | | | | | | | | |
| | | Beginning Account Value
| | Ending Account Value
| | Expenses Paid During Period
| | |
| Expense Example – Class S Shares | | (7/1/11) | | (12/31/11) | | (7/1/11 - 12/31/11)† | | |
| |
| |
| Actual | | $ | 1,000.00 | | | $ | 927.40 | | | $ | 6.69 | | | |
| |
| |
Hypothetical
(5% return before expenses) | | $ | 1,000.00 | | | $ | 1,018.20 | | | $ | 7.00 | | | |
| |
| |
| | | | | | | | | | | | | | | |
| | | | | | | | | | | | | | | |
| | | Beginning Account Value
| | Ending Account Value
| | Expenses Paid During Period
| | |
| Expense Example – Class T Shares | | (7/1/11) | | (12/31/11) | | (7/1/11 - 12/31/11)† | | |
| |
| |
| Actual | | $ | 1,000.00 | | | $ | 928.60 | | | $ | 5.48 | | | |
| |
| |
Hypothetical
(5% return before expenses) | | $ | 1,000.00 | | | $ | 1,019.46 | | | $ | 5.74 | | | |
| |
| |
| | | |
| † | | Expenses are equal to the annualized expense ratio of 1.32% for Class A Shares, 2.07% for Class C Shares,1.03% for Class D Shares, 0.97% for Class I Shares, 0.88% for Class L Shares, 1.63% for Class R Shares, 1.38% for Class S Shares and 1.13% for Class T Shares multiplied by the average account value over the period, multiplied by 184/366 (to reflect the one-half year period). Expenses include effect of contractual waivers by Janus Capital. |
40 | DECEMBER 31, 2011
Perkins Small Cap Value Fund
Schedule of Investments (unaudited)
As of December 31, 2011
| | | | | | | | | | | |
| Shares or Principal Amount | | Value | | | |
| |
| Common Stock – 85.5% | | | | | | |
| Applications Software – 0.6% | | | | | | |
| | 800,000 | | | Progress Software Corp.* | | $ | 15,480,000 | | | |
| Building – Heavy Construction – 2.0% | | | | | | |
| | 1,900,000 | | | Granite Construction, Inc.£ | | | 45,068,000 | | | |
| | 1,160,179 | | | Sterling Construction Co., Inc.*,£ | | | 12,495,128 | | | |
| | | | | | | | 57,563,128 | | | |
| Building – Residential and Commercial – 0.3% | | | | | | |
| | 550,000 | | | M.D.C. Holdings, Inc. | | | 9,696,500 | | | |
| Circuit Boards – 0.7% | | | | | | |
| | 1,800,000 | | | TTM Technologies, Inc.* | | | 19,728,000 | | | |
| Commercial Banks – 8.9% | | | | | | |
| | 596,441 | | | Columbia Banking System, Inc. | | | 11,493,418 | | | |
| | 1,550,000 | | | FirstMerit Corp. | | | 23,451,500 | | | |
| | 5,200,000 | | | Fulton Financial Corp. | | | 51,012,000 | | | |
| | 3,800,000 | | | Glacier Bancorp., Inc.£ | | | 45,714,000 | | | |
| | 1,800,000 | | | Hancock Holding Co. | | | 57,546,000 | | | |
| | 4,200,000 | | | TCF Financial Corp. | | | 43,344,000 | | | |
| | 620,000 | | | Texas Capital Bancshares, Inc.* | | | 18,978,200 | | | |
| | | | | | | | 251,539,118 | | | |
| Commercial Services – Finance – 0.7% | | | | | | |
| | 425,000 | | | Global Payments, Inc. | | | 20,136,500 | | | |
| Computer Services – 0.9% | | | | | | |
| | 850,000 | | | j2 Global, Inc. | | | 23,919,000 | | | |
| Computer Software – 0.3% | | | | | | |
| | 300,000 | | | Akamai Technologies, Inc.* | | | 9,684,000 | | | |
| Computers – Integrated Systems – 1.7% | | | | | | |
| | 1,550,000 | | | Diebold, Inc. | | | 46,608,500 | | | |
| Computers – Memory Devices – 0.6% | | | | | | |
| | 1,900,000 | | | STEC, Inc.* | | | 16,321,000 | | | |
| Containers – Paper and Plastic – 1.5% | | | | | | |
| | 400,000 | | | Packaging Corp. of America | | | 10,096,000 | | | |
| | 1,000,000 | | | Sonoco Products Co. | | | 32,960,000 | | | |
| | | | | | | | 43,056,000 | | | |
| Dental Supplies and Equipment – 0.8% | | | | | | |
| | 750,000 | | | Patterson Cos., Inc. | | | 22,140,000 | | | |
| Direct Marketing – 0.9% | | | | | | |
| | 2,728,441 | | | Harte-Hanks, Inc.£ | | | 24,801,529 | | | |
| Distribution/Wholesale – 1.4% | | | | | | |
| | 1,450,000 | | | Owens & Minor, Inc. | | | 40,295,500 | | | |
| Electronic Components – Semiconductors – 3.3% | | | | | | |
| | 1,596,511 | | | Monolithic Power Systems, Inc.*,£ | | | 24,059,421 | | | |
| | 1,031,962 | | | OmniVision Technologies, Inc.* | | | 12,626,055 | | | |
| | 2,000,000 | | | QLogic Corp.* | | | 30,000,000 | | | |
| | 1,000,000 | | | Semtech Corp.* | | | 24,820,000 | | | |
| | | | | | | | 91,505,476 | | | |
| Electronic Connectors – 0.5% | | | | | | |
| | 275,000 | | | Thomas & Betts Corp.* | | | 15,015,000 | | | |
| Electronic Design Automation – 0.6% | | | | | | |
| | 646,035 | | | Synopsys, Inc.* | | | 17,572,152 | | | |
| Engineering – Research and Development Services – 1.7% | | | | | | |
| | 1,400,000 | | | URS Corp.* | | | 49,168,000 | | | |
| Engines – Internal Combustion – 0.5% | | | | | | |
| | 950,000 | | | Briggs & Stratton Corp. | | | 14,715,500 | | | |
| Enterprise Software/Services – 0.4% | | | | | | |
| | 700,000 | | | Omnicell, Inc.* | | | 11,564,000 | | | |
| Finance – Investment Bankers/Brokers – 0.3% | | | | | | |
| | 362,500 | | | Lazard, Ltd. – Class A | | | 9,464,875 | | | |
| Food – Baking – 1.7% | | | | | | |
| | 2,450,000 | | | Flowers Foods, Inc. | | | 46,501,000 | | | |
| Food – Miscellaneous/Diversified – 0.9% | | | | | | |
| | 496,952 | | | J&J Snack Foods Corp. | | | 26,477,603 | | | |
| Food – Retail – 0.8% | | | | | | |
| | 500,000 | | | Ruddick Corp. | | | 21,320,000 | | | |
| Footwear and Related Apparel – 0.7% | | | | | | |
| | 575,000 | | | Wolverine World Wide, Inc. | | | 20,493,000 | | | |
| Golf – 0.8% | | | | | | |
| | 4,175,000 | | | Callaway Golf Co.£ | | | 23,087,750 | | | |
| Instruments – Scientific – 1.1% | | | | | | |
| | 1,600,000 | | | PerkinElmer, Inc. | | | 32,000,000 | | | |
| Insurance Brokers – 0.8% | | | | | | |
| | 1,000,000 | | | Brown & Brown, Inc. | | | 22,630,000 | | | |
| Intimate Apparel – 0.7% | | | | | | |
| | 400,000 | | | Warnaco Group, Inc.* | | | 20,016,000 | | | |
| Leisure & Recreation Products – 0.8% | | | | | | |
| | 1,050,000 | | | WMS Industries, Inc.* | | | 21,546,000 | | | |
| Machine Tools and Related Products – 0.6% | | | | | | |
| | 400,000 | | | Lincoln Electric Holdings, Inc. | | | 15,648,000 | | | |
| Machinery – General Industrial – 0.3% | | | | | | |
| | 400,000 | | | Albany International Corp. – Class A | | | 9,248,000 | | | |
| Medical – Biomedical and Genetic – 1.5% | | | | | | |
| | 1,500,000 | | | Charles River Laboratories International, Inc.* | | | 40,995,000 | | | |
| Medical Instruments – 0.9% | | | | | | |
| | 1,762,071 | | | Angiodynamics, Inc.*,£ | | | 26,096,272 | | | |
| Medical Labs and Testing Services – 1.8% | | | | | | |
| | 330,000 | | | Covance, Inc.* | | | 15,087,600 | | | |
| | 2,100,000 | | | ICON PLC (ADR)* | | | 35,931,000 | | | |
| | | | | | | | 51,018,600 | | | |
| Medical Products – 1.7% | | | | | | |
| | 825,000 | | | PSS World Medical, Inc.* | | | 19,956,750 | | | |
| | 725,000 | | | West Pharmaceutical Services, Inc. | | | 27,513,750 | | | |
| | | | | | | | 47,470,500 | | | |
| Medical Sterilization Products – 1.9% | | | | | | |
| | 1,800,000 | | | STERIS Corp. | | | 53,676,000 | | | |
| Metal Processors and Fabricators – 2.1% | | | | | | |
| | 1,975,458 | | | Kaydon Corp.£ | | | 60,251,469 | | | |
| Miscellaneous Manufacturing – 0.3% | | | | | | |
| | 500,000 | | | Movado Group, Inc. | | | 9,085,000 | | | |
| Multi-Line Insurance – 3.4% | | | | | | |
| | 4,000,000 | | | Old Republic International Corp. | | | 37,080,000 | | | |
| | 2,002,378 | | | Unitrin, Inc. | | | 58,489,461 | | | |
| | | | | | | | 95,569,461 | | | |
| Networking Products – 0.4% | | | | | | |
| | 715,000 | | | Polycom, Inc.* | | | 11,654,500 | | | |
See Notes to Schedules of Investments and Financial Statements.
Janus Value Funds | 41
Perkins Small Cap Value Fund
Schedule of Investments (unaudited)
As of December 31, 2011
| | | | | | | | | | | |
| Shares or Principal Amount | | Value | | | |
| |
| Non-Ferrous Metals – 0.5% | | | | | | |
| | 1,125,000 | | | Globe Specialty Metals, Inc. | | $ | 15,063,750 | | | |
| Oil – Field Services – 1.6% | | | | | | |
| | 800,000 | | | C&J Energy Services, Inc.* | | | 16,744,000 | | | |
| | 1,500,000 | | | PAA Natural Gas Storage L.P. | | | 28,125,000 | | | |
| | | | | | | | 44,869,000 | | | |
| Oil Companies – Exploration and Production – 6.4% | | | | | | |
| | 1,250,000 | | | Bill Barrett Corp.* | | | 42,587,500 | | | |
| | 800,000 | | | Comstock Resources, Inc.* | | | 12,240,000 | | | |
| | 3,200,000 | | | Exco Resources, Inc. | | | 33,440,000 | | | |
| | 1,550,000 | | | Forest Oil Corp.* | | | 21,002,500 | | | |
| | 3,300,000 | | | Lone Pine Resources, Inc.* | | | 23,133,000 | | | |
| | 525,000 | | | Petroleum Development Corp.* | | | 18,432,750 | | | |
| | 2,300,000 | | | PetroQuest Energy, Inc.*,£ | | | 15,180,000 | | | |
| | 310,000 | | | Whitting Petroleum Corp.* | | | 14,473,900 | | | |
| | | | | | | | 180,489,650 | | | |
| Paper and Related Products – 1.4% | | | | | | |
| | 2,800,000 | | | Glatfelter£ | | | 39,536,000 | | | |
| Pharmacy Services – 0.3% | | | | | | |
| | 225,000 | | | Omnicare, Inc. | | | 7,751,250 | | | |
| Pipelines – 0.7% | | | | | | |
| | 500,000 | | | Western Gas Partners L.P. | | | 20,635,000 | | | |
| Poultry – 0.4% | | | | | | |
| | 200,000 | | | Sanderson Farms, Inc. | | | 10,026,000 | | | |
| Property and Casualty Insurance – 2.6% | | | | | | |
| | 550,000 | | | Infinity Property & Casualty Corp.£ | | | 31,207,000 | | | |
| | 900,000 | | | Navigators Group, Inc.*,£ | | | 42,912,000 | | | |
| | | | | | | | 74,119,000 | | | |
| Real Estate Operating/Development – 0.9% | | | | | | |
| | 1,725,000 | | | St. Joe Co.* | | | 25,288,500 | | | |
| Reinsurance – 0.8% | | | | | | |
| | 900,000 | | | Alterra Capital Holdings, Ltd. | | | 21,267,000 | | | |
| REIT – Diversified – 1.6% | | | | | | |
| | 1,400,000 | | | Potlatch Corp. | | | 43,554,000 | | | |
| REIT – Hotels – 1.2% | | | | | | |
| | 3,352,674 | | | DiamondRock Hospitality Co. | | | 32,319,777 | | | |
| REIT – Mortgage – 0.5% | | | | | | |
| | 1,450,000 | | | Redwood Trust, Inc. | | | 14,761,000 | | | |
| REIT – Office Property – 2.9% | | | | | | |
| | 2,285,970 | | | Government Properties Income Trust | | | 51,548,623 | | | |
| | 1,100,000 | | | Mack-Cali Realty Corp. | | | 29,359,000 | | | |
| | | | | | | | 80,907,623 | | | |
| Retail – Apparel and Shoe – 1.6% | | | | | | |
| | 1,900,000 | | | American Eagle Outfitters, Inc. | | | 29,051,000 | | | |
| | 550,000 | | | Guess?, Inc. | | | 16,401,000 | | | |
| | | | | | | | 45,452,000 | | | |
| Retail – Consumer Electronics – 0.9% | | | | | | |
| | 2,700,000 | | | RadioShack Corp. | | | 26,217,000 | | | |
| Retail – Convenience Stores – 1.1% | | | | | | |
| | 575,000 | | | Casey’s General Stores, Inc. | | | 29,618,250 | | | |
| Retail – Leisure Products – 0.5% | | | | | | |
| | 2,000,000 | | | MarineMax, Inc.*,£ | | | 13,040,000 | | | |
| Retail – Restaurants – 0.6% | | | | | | |
| | 500,000 | | | Bob Evans Farms | | | 16,770,000 | | | |
| Savings/Loan/Thrifts – 5.5% | | | | | | |
| | 7,400,000 | | | First Niagara Financial Group, Inc. | | | 63,862,000 | | | |
| | 1,300,000 | | | Investors Bancorp, Inc.* | | | 17,524,000 | | | |
| | 1,838,714 | | | Provident Financial Services, Inc. | | | 24,620,380 | | | |
| | 3,578,041 | | | Washington Federal, Inc. | | | 50,056,794 | | | |
| | | | | | | | 156,063,174 | | | |
| Semiconductor Equipment – 0.7% | | | | | | |
| | 750,000 | | | MKS Instruments, Inc. | | | 20,865,000 | | | |
| Textile-Home Furnishings – 0.3% | | | | | | |
| | 125,000 | | | Mohawk Industries, Inc.* | | | 7,481,250 | | | |
| Transportation – Marine – 0.7% | | | | | | |
| | 61,798 | | | Kirby Corp.* | | | 4,068,780 | | | |
| | 290,000 | | | Tidewater, Inc. | | | 14,297,000 | | | |
| | | | | | | | 18,365,780 | | | |
| |
| |
| Total Common Stock (cost $2,423,281,749) | | | 2,409,217,937 | | | |
| |
| |
| Repurchase Agreements – 14.7% | | | | | | |
| | $100,000,000 | | | Credit Agricole, New York Branch, 0.0100%, dated 12/30/11, maturing 1/3/12 to be repurchased at $100,000,111 collateralized by
$102,861,754 in U.S. Government Agencies 3.5000% – 5.5000%, 11/1/25 – 10/1/41 and $12,564,294 in U.S. Treasuries 4.0000%, 8/15/18
with respective values of $87,041,950 and $14,958,060 | | | 100,000,000 | | | |
| | 50,000,000 | | | Deutsche Bank Securities, Inc., 0.0100%, dated 12/30/11, maturing 1/3/12 to be repurchased at $50,000,056
collateralized by $49,697,900 in U.S. Treasuries 1.2500%, 10/31/15
with a value of $51,000,007 | | | 50,000,000 | | | |
| | 33,300,000 | | | HSBC Securities (USA), Inc., 0.0100%, dated 12/30/11, maturing 1/3/12 to be repurchased at $33,330,037
collateralized by $42,141,355 in U.S. Treasuries 0.0000%,
11/15/21 – 5/15/22
with a value of $33,966,233 | | | 33,300,000 | | | |
| | 30,108,000 | | | ING Financial Markets LLC, 0.0100%, dated 12/30/11, maturing 1/3/12 to be repurchased at $31,108,033
collateralized by $2,229,767 in U.S. Government Agencies 2.2250% – 5.0000%, 7/17/15 – 2/1/36 and $27,819,583 in U.S. Treasuries 0.2500% – 4.5000%,
5/31/13 – 11/15/41
with respective values of $1,283,679 and $29,426,678 | | | 30,108,000 | | | |
See Notes to Schedules of Investments and Financial Statements.
42 | DECEMBER 31, 2011
Schedule of Investments (unaudited)
As of December 31, 2011
| | | | | | | | | | | |
| Shares or Principal Amount | | Value | | | |
| |
| | $200,000,000 | | | RBC Capital Markets Corp., 0.0050%, dated 12/30/11, maturing 1/3/12 to be repurchased at $200,000,111
collateralized by $194,616,229 in U.S. Treasuries 0.0000% – 3.3750%, 6/28/12 – 11/15/19
with a value of $204,000,016 | | $ | 200,000,000 | | | |
| |
| |
| Total Repurchase Agreements (cost $413,408,000) | | | 413,408,000 | | | |
| |
| |
| Total Investments (total cost $2,836,689,749) – 100.2% | | | 2,822,625,937 | | | |
| |
| |
| Liabilities, net of Cash, Receivables and Other Assets– (0.2)% | | | (5,752,482) | | | |
| |
| |
| Net Assets – 100% | | $ | 2,816,873,455 | | | |
| |
| |
Summary of Investments by Country – (Long Positions)
| | | | | | | | | |
| | | | | | % of Investment
| |
| Country | | Value | | | Securities | |
| |
| |
| Bermuda | | $ | 30,731,875 | | | | 1.1% | |
| Ireland | | | 35,931,000 | | | | 1.3% | |
United States†† | | | 2,755,963,062 | | | | 97.6% | |
| |
| |
| Total | | $ | 2,822,625,937 | | | | 100.0% | |
| | | |
| †† | | Includes Cash Equivalents (83.0% excluding Cash Equivalents). |
See Notes to Schedules of Investments and Financial Statements.
Janus Value Funds | 43
Perkins Value Plus Income Fund (unaudited)
Performance Overview
For the six months ended December 31, 2011, Perkins Value Plus Income Fund’s Class I Shares returned -1.06%, while the Fund’s primary benchmark, the Russell 1000 Value Index, returned -5.22%. Its secondary benchmark, the Value Income Index, a hypothetical internally-calculated index that combines the total returns from the Russell 1000 Value Index (50%) and the Barclays Capital U.S. Aggregate Bond Index (50%), returned 0.10%. The Fund’s other secondary benchmark, the Barclays Capital U.S. Aggregate Bond Index (the “Agg”), returned 4.98% during the period.
Market Environment
Stocks suffered a significant sell-off in the third quarter, as problems in Europe became much more apparent. The focus was on European sovereign debt issues and undercapitalized European banks. The inability to take substantive action to address those problems created a situation of great uncertainty and raised questions of global contagion.
The stock market enjoyed a strong rebound from the third quarter correction, fueled by strong earnings reports, improving economic data, and a late December liquidity injection by the European Central Bank (ECB). Despite these short-term trend improvements, our market perspective has not changed as we remain somewhat cautious. The environment remains one of extremely strong company fundamentals offset by very challenging economic and financial issues. Economic vulnerability persists with continuous headwinds from the European debt crisis coupled with ongoing governmental and consumer deleveraging, and high unemployment levels. Volatility drives market sentiment, even with the backdrop of continued monetary actions at home (securities repurchases, low interest rates), and, to date, ineffective attempts to remedy the long term capital shortage of European banks. As a result, uncertainty will likely persist in the short term until we regain footing on macro fundamentals.
In spite of macroeconomic headwinds, microeconomic fundamentals remain positive. The market appears reasonably valued with the S&P 500 Index currently trading at about 13x 2011 earnings estimates of $95, and an earnings yield of almost 8%. As compared to 10 year Treasury yields of slightly under 2%, there is a 6% risk premium to owning stocks – the highest level in three decades. Moreover, for the first time in 50 years, stocks yield more than Treasuries, as the S&P dividend yield currently is over 2%. Corporate balance sheets continue to strengthen, and U.S. banks have much better capital structures than before the financial crisis. By these metrics, equities remain an attractive asset class, especially compared to bonds. Continuing high volatility provides for pricing dislocation and opportunity.
Volatility and headline risk were central themes for fixed-income investors in the second half of 2011. A rally in U.S. Treasuries became especially pronounced from late July through September, as worry mounted that the U.S. economy might slip into a double-dip recession. Investors were troubled by below-expectation U.S. gross domestic product (GDP) growth, a manufacturing slowdown and persistently weak employment, housing and consumer spending figures. Concern about high government debt levels, both in the United States and Europe, only heightened this negative market sentiment. A high-stakes political standoff in Congress in July and August over raising the U.S. debt ceiling did nothing to improve the situation. Credit rating agency Standard & Poor’s subsequently lowered the United States’ sovereign credit rating to AA+ from AAA. The downgrade was followed, ironically, by a near stampede into U.S. Treasury securities, as the darkening global economic picture made Treasuries appear to be the safest haven available.
44 | DECEMBER 31, 2011
(unaudited)
All eyes returned to Europe in the fall, as fiscal problems in the so-called PIIGS (Portugal, Italy, Ireland, Greece and Spain) countries threatened to spiral out of control. By October, it appeared that European Union (EU) leaders would manage to contain euro-zone problems, and relieved investors briefly ventured out of Treasuries in search of higher yields. But uncertainty flooded back in November, as governments in Greece and then Italy fell amid market pressure to implement fiscal reforms. The late-November failure of the U.S. Congressional “super committee” to reach a deal to cut $1.2 trillion from the U.S. deficit added to the general malaise.
In December, some headway was made in Europe, as EU leaders announced a plan in which most members would agree to stricter fiscal rules and the ECB served up a larger-than-expected $641 billion in 3-year loans. This injected some calm into the markets as volume wound down for the holidays, although investors remained concerned that credit ratings would be downgraded on one or more of the 17 euro zone countries.
Meanwhile, U.S. macroeconomic data continued to reflect a strengthening domestic economy, with signs of increased hiring and rising consumer confidence. Fears of a double-dip recession, which mounted over the summer as U.S. economic indicators weakened, had receded by the fourth quarter.
Portfolio Overview
We were overweight in equities during the period and finished the year with a mix of 55% equities and 45% fixed income. The overweight hurt relative performance, given fixed income’s significant outperformance relative to equities.
Our equity sleeve in aggregate underperformed the Russell 1000 Value Index. Our holdings within utilities, materials and health care detracted from relative performance. Our usual underweight in utilities also weighed on relative performance. Meanwhile, our holdings and underweight in financials, the weakest sector within the index, were the largest contributors followed by our holdings in consumer discretionary and energy.
The fixed income sleeve also underperformed the Fund’s secondary benchmark, the Agg, largely due to our holdings and overweight in corporate credit. Contributors included our zero-weight positioning in government agency debt and underweight allocation to the mortgage sector. We remained significantly overweight corporate credit at year’s end, at nearly 66.8% of the sleeve, compared with the Agg’s 20% exposure. In terms of sectors, paper, lodging, aerospace and retail weighed the most on relative performance, while paper, cable and health care contributed.
In our joint management of the Fund, both Perkins and Janus investment teams are at least as focused on absolute total returns as we are on relative returns, and therefore, are focused on the long term. Our emphasis on determining the potential downside or risk of an opportunity, both within fixed income and equities, has served us well in challenging market environments as shown by the Fund’s placement in the top quartile of its Lipper group since inception.
Equity Detractors
First Niagara Financial Group was a disappointment during the period. With a strong, high quality earnings stream in our view, no credit problems, a large dividend and robust capital ratios First Niagara was purchased with downside protection in mind. However two items hurt the stock. First, the bank agreed to a purchase a large deposit franchise from HSBC in a deal that required a capital raise. This overhang hurt the stock more than we anticipated. Second, the collapse of interest rates in the U.S. adversely impacts highly liquid balance sheets like First Niagara as re-investment in lower yielding securities drags down returns. First Niagara raised capital in December and unfortunately cut the dividend. We added to our position, as it sells at less than 10x current earnings, has a healthy 3.6% dividend yield, as well as a strong balance sheet with good growth prospects, in our view.
SK Telecom, the leading mobile phone operator in South Korea, also detracted from performance when the stock reacted negatively to the company’s stated interest in bidding for a stake in technology company Hynix Semiconductor, also of South Korea. We maintained our position in SK Telecom based on their strong competitive position and relatively stable business, which allows them to potentially generate significant free cash flow and maintain a strong balance sheet.
Equity Contributors
Individually, grocery store operator Safeway was the largest contributor followed by technology networking giant Cisco, which rebounded from weakness earlier in the year when we had added to the position. We believe Cisco’s margins have stabilized and like its leadership role in an industry that should benefit from a rebound in enterprise spending. We also appreciated the significant cash levels on its balance sheet and its attractive
Janus Value Funds | 45
Perkins Value Plus Income Fund (unaudited)
valuation, in our view. We maintained our position during the period.
Vodafone, the global wireless telecom company, was another leading gainer. We appreciate management’s efforts to clean up its complicated holding company structure, including selling its stake in China Mobile and putting the various remaining equity holdings into a single business unit. There is also renewed focus in the market on the potential for a monetization of Vodafone’s significant stake in Verizon Wireless.
Fixed Income Detractors
American International Group (AIG), an international insurer, is a high-beta name that faced headwinds during the period, partly due to general challenges in the financial sector and to the performance of its aircraft-leasing unit, International Lease Finance Corp. Despite the turmoil, we like AIG’s long-term deleveraging plan and recent track record of balance sheet focus. Its core businesses include companies with top market share in their sectors, such as Chartis and SunAmerica.
Ford Motor Co. also weighed on performance. One of the world’s largest and most recognized auto manufacturers, Ford has benefited from a number of improvements in its business model including reduced costs, better product mix, and their competitors’ stigma of having accepted government bailouts. These tailwinds have lessened somewhat as input costs have risen and rising gas prices began to compel new-car purchasers toward less profitable, more fuel efficient models. Despite these changes in the market, we believe Ford’s debt reduction strategy remains on course and that an upgrade to investment grade remains likely.
Fixed Income Contributors
Bank of America was the largest individual contributor. Holding the number-one position in U.S. deposits and a large bank branch network, Bank of America is transitioning from being a serial acquirer to focusing on optimizing their existing business lines. As the U.S.’s largest originator and servicer of mortgages, Bank of America’s asset recovery is more sensitive to U.S. real estate and employment improvements. The company continues to improve its capital structure, running off term-debt at a $40-55 billion per year pace and we expect the deleveraging to continue for the next few years. Depending on one’s perspective, Bank of America’s sensitivity to headline risk particularly of the mortgage or regulatory variety can provide attractive opportunities but also periodic volatility. It is also worth noting that the bank is making progress in reducing the mortgage risk within their business.
Pernod-Ricard also aided performance. A French producer of distilled beverages, Pernod acquired Absolut Vodka from the Swedish government in 2008 resulting in a downgrade of the company by ratings agencies. The company has demonstrated its ability to utilize free cash flow for the benefit of bondholders and remains focused on deleveraging, in our view.
Derivatives
The Fund employs an option-writing strategy based on our valuation framework of individual stocks in the portfolio. Characteristics of the strategy include selling covered calls at strike prices where our risk/reward ratio would warrant trimming the position or selling puts at strike prices where our risk/reward ratio warrants adding to the position. On average, written options have strike prices that are approximately 10% out of the money. Total portfolio exposure (the sum of absolute position changes if options are exercised) for each month has been in the approximate range of 5-10%. During the period, these positions modestly aided performance. Please see the Derivative Instruments section in the “Notes to Financial Statements” for a discussion of derivatives used by the Fund.
Market Outlook
We believe that our quality-oriented, risk-sensitive investment approach is especially important in this type of difficult environment. High quality companies with strong balance sheets and high free cash flows will likely hold up better in stressed environments over the long term, and are better positioned against weaker competitors. We have found excellent buys in banks and healthcare. Banks, from the super regionals to the small cap thrifts, offer good values with solid capital levels in our view, attractive valuations based on normalized earnings and dividend yields of 3%-5%. On the healthcare side, medical equipment stocks have traded off during the year on growth concerns. However, we think the longer term demographics are favorable to support earnings growth, and in the meantime, the balance sheets appear very strong and free cash flow yields approach 10% in many instances.
Overall, due to the significant number of negative headwinds domestically and abroad, we believe it is important to be risk sensitive while maintaining a long-term focus. The ability to outperform on the downside is a critical component of compounding returns in the long-
46 | DECEMBER 31, 2011
(unaudited)
term. Short-term volatility is likely to remain high, and it is easy to make short-term mistakes at the expense of long-term results. Our fundamental approach to investing seeks above average returns over a full market cycle. This reinforces our confidence to pursue our disciplined, value oriented, investment process.
In fixed income, largely because the U.S. economy is being held hostage to decisions in Europe and Washington, we expect another year of subpotential growth. We forecast U.S. gross domestic product growth of 2% in 2012, barring a worsening of the euro zone crisis and assuming that Congress extends long-term unemployment benefits and the payroll tax break until the end of the year; both are currently scheduled to expire at the end of February.
Given current high levels of productivity, we expect that hiring will continue to rise slowly as companies seek to meet essential demand. However, the modest pace will likely keep the unemployment rate elevated and fluctuating around the 9% level throughout the year. Excess slack in the labor market combined with slow economic growth will likely keep inflation from moving much higher. In our opinion, the core Consumer Price Index (CPI) will continue to rise through the first half of 2012, peaking at 2.5% before descending back below 2%. Core CPI’s recent rise has been due largely to artificial factors, including a supply/demand imbalance in the housing rental market that has pushed up owners’ equivalent rent (OER), a major component of core CPI. We believe this imbalance will correct itself. Meanwhile, producer input prices have been dropping, reducing the amount of price pressure in the pipeline.
This low-inflation environment would give the Federal Reserve room to continue its accommodative short-term interest rate policy. The Fed has said that it plans to keep short-term interest rates near zero through late 2014. We believe there is a 50% chance that the Fed will initiate the third round of quantitative easing (QE3) in 2012, by buying mortgage-backed securities, if market conditions warrant. In our view the likelihood of QE3 is heavily dependent on the outcome in Europe, and may be necessary if we see continued dysfunction in Washington.
We expect global economic growth to slow to roughly 2.1% in 2012, with Europe the most challenged region worldwide. In our view Europe will be in recession next year, with growth of negative 0.5% to negative 1%. Policy risk remains high in all regions of the world. We expect inflation to decline globally as commodity prices level out and the pace of growth slows.
We believe that Treasury yields will remain relatively range-bound in 2012 due to the continued headline risk from Europe, political deadlock in Washington and automatic $1.2 trillion in government spending cuts scheduled to begin in January 2013. However, we think that rates could be at the higher end of the range by the end of 2012, partly because by that point we should be on a path to stronger economic growth. The front end of the curve is anchored by current Fed policy, while the five-year Treasury is the pivot point and stands to benefit if the Fed implements QE3. We believe that the 10-year and 30-year Treasury have little upside left, as they enjoyed a remarkable rally in 2011 but will be vulnerable to inflation concerns the longer the Fed’s accommodative policy continues.
Against this backdrop, we continue to believe that corporate credit offers some of the best risk-adjusted returns in the market. We entered 2011 with a similar belief. The last year was highly volatile for credit, especially financials, which had a big impact on the market. Yet underlying fundamentals continue to improve. Profit margins are high and companies are accumulating cash on balance sheets (more than $2 trillion by some estimates). Moreover, we think there is a newfound conservatism resonating across management teams and boards in the U.S. and Europe. Management teams are being more careful and have not been committing capital to their businesses – beyond replacement levels – as growth remains slow and uncertainty remains high. We think this will continue through 2012, fueling more free cash flow, liquidity in the system and ultimately support for credit spreads in both investment-grade and high-yield bonds.
Thank you for your investment with us in Perkins Value Plus Income Fund.
Janus Value Funds | 47
Perkins Value Plus Income Fund (unaudited)
Perkins Value Plus Income Fund At A Glance
5 Top Performers – Equity Holdings
| | | | | |
| | | Contribution |
| |
| Safeway, Inc. | | | 0.21% | |
| Cisco Systems, Inc. | | | 0.19% | |
| Vodafone Group PLC (ADR) | | | 0.16% | |
| Pall Corp. | | | 0.15% | |
| Royal Dutch Shell PLC (ADR) | | | 0.14% | |
5 Bottom Performers – Equity Holdings
| | | | | |
| | | Contribution |
| |
| First Niagara Financial Group, Inc. | | | –0.53% | |
| SK Telecom Co., Ltd. (ADR) | | | –0.47% | |
| Redwood Trust, Inc. | | | –0.27% | |
| Old Republic International Corp. | | | –0.25% | |
| SunTrust Banks, Inc. | | | –0.25% | |
5 Top Performers – Sectors*
| | | | | | | | | | | | | |
| | | | | Fund Weighting
| | Russell 1000® Value
|
| | | Fund Contribution | | (Average % of Equity) | | Index Weighting |
| |
| Financials | | | 1.44% | | | | 22.98% | | | | 25.18% | |
| Consumer Discretionary | | | 0.57% | | | | 8.18% | | | | 8.90% | |
| Energy | | | 0.52% | | | | 12.02% | | | | 12.47% | |
| Information Technology | | | 0.50% | | | | 8.34% | | | | 8.93% | |
| Consumer Staples | | | 0.19% | | | | 8.30% | | | | 7.88% | |
5 Bottom Performers – Sectors*
| | | | | | | | | | | | | |
| | | | | Fund Weighting
| | Russell 1000® Value
|
| | | Fund Contribution | | (Average % of Equity) | | Index Weighting |
| |
| Utilities | | | –1.00% | | | | 4.20% | | | | 7.54% | |
| Materials | | | –0.34% | | | | 4.36% | | | | 2.74% | |
| Health Care | | | –0.22% | | | | 15.60% | | | | 12.56% | |
| Telecommunication Services | | | –0.20% | | | | 7.13% | | | | 4.78% | |
| Industrials | | | 0.18% | | | | 8.89% | | | | 9.02% | |
| | | |
| | | Security contribution to performance is measured by using an algorithm that multiplies the daily performance of each security with the previous day’s ending weight in the portfolio and is gross of advisory fees. Fixed income securities and certain equity securities, such as private placements and some share classes of equity securities, are excluded. |
| * | | Based on sector classification according to the Global Industry Classification Standard codes, which are the exclusive property and a service mark of MSCI Inc. and Standard & Poor’s. |
48 | DECEMBER 31, 2011
(unaudited)
5 Largest Equity Holdings – (% of Net Assets)
As of December 31, 2011
| | | | | |
Vodafone Group PLC (ADR)
Cellular Telecommunications | | | 1.0% | |
CenturyLink, Inc.
Telephone – Integrated | | | 0.9% | |
Chevron Corp.
Oil Companies – Integrated | | | 0.9% | |
Pfizer, Inc.
Medical – Drugs | | | 0.9% | |
AT&T, Inc.
Telephone – Integrated | | | 0.9% | |
| | | | | |
| | | | 4.6% | |
Asset Allocation – (% of Net Assets)
As of December 31, 2011
Emerging markets comprised 2.1% of total net assets.
Top Country Allocations – Long Positions (% of Investment Securities)
As of December 31, 2011
Janus Value Funds | 49
Perkins Value Plus Income Fund (unaudited)
| | | | | | | | | | | | |
| Average Annual Total Return – for the periods ended December 31, 2011 | | | Expense Ratios – per the October 28, 2011 prospectuses |
| | | Fiscal
| | One
| | Since
| | | Total Annual Fund
| | Net Annual Fund
|
| | | Year-to-Date | | Year | | Inception* | | | Operating Expenses | | Operating Expenses |
| | | | | | | | | | | | |
| Perkins Value Plus Income Fund – Class A Shares | | | | | | | | | | | |
| | | | | | | | | | | | |
| NAV | | –1.18% | | 3.54% | | 9.08% | | | 1.87% | | 1.03% |
| | | | | | | | | | | | |
| MOP | | –6.86% | | –2.44% | | 4.63% | | | | | |
| | | | | | | | | | | | |
| Perkins Value Plus Income Fund – Class C Shares | | | | | | | | | | | |
| | | | | | | | | | | | |
| NAV | | –1.56% | | 2.76% | | 8.27% | | | 2.63% | | 1.78% |
| | | | | | | | | | | | |
| CDSC | | –2.50% | | 1.79% | | 8.27% | | | | | |
| | | | | | | | | | | | |
| Perkins Value Plus Income Fund – Class D Shares(1) | | –1.11% | | 3.66% | | 9.21% | | | 1.74% | | 0.88% |
| | | | | | | | | | | | |
| Perkins Value Plus Income Fund – Class I Shares | | –1.06% | | 3.74% | | 9.28% | | | 1.62% | | 0.77% |
| | | | | | | | | | | | |
| Perkins Value Plus Income Fund – Class S Shares | | –1.31% | | 3.27% | | 8.80% | | | 2.13% | | 1.29% |
| | | | | | | | | | | | |
| Perkins Value Plus Income Fund – Class T Shares | | –1.18% | | 3.54% | | 9.08% | | | 1.87% | | 1.03% |
| | | | | | | | | | | | |
| Russell 1000® Value Index | | –5.22% | | 0.39% | | 9.97% | | | | | |
| | | | | | | | | | | | |
| Barclays Capital U.S. Aggregate Bond Index | | 4.98% | | 7.84% | | 5.51% | | | | | |
| | | | | | | | | | | | |
| Value Income Index | | 0.10% | | 4.44% | | 8.16% | | | | | |
| | | | | | | | | | | | |
| Lipper Quartile – Class I Shares | | – | | 1st | | 1st | | | | | |
| | | | | | | | | | | | |
| Lipper Ranking – based on total returns for Mixed-Asset Target Allocation Moderate Funds | | – | | 53/483 | | 49/480 | | | | | |
| | | | | | | | | | | | |
| Visit janus.com/advisor/mutual-funds (or janus.com/allfunds if you hold Shares directly with Janus Capital) to view current performance and characteristic information | | | | | |
| | | | | | | | | | | | |
Data presented represents past performance, which is no guarantee of future results. Investment results and principal value will fluctuate so that shares, when redeemed, may be worth more or less than their original cost. Due to market volatility, current performance may be higher or lower than the performance shown. Call 877.33JANUS(52687) (or 800.525.3713 if you hold shares directly with Janus Capital) or visit janus.com/advisor/mutual-funds (or janus.com/allfunds if you hold shares directly with Janus Capital) for performance current to the most recent month-end.
Performance shown for Class A Shares at Maximum Offering Price (MOP) includes the Fund’s maximum sales charge of 5.75%. Performance shown at Net Asset Value (NAV) does not include this charge and would have been lower had this charge been taken into account.
Performance shown for Class C Shares includes a 1% contingent deferred sales charge (CDSC) on periods of less than 12 months. Performance shown at Net Asset Value (NAV) does not include this sales charge and would have been lower had this sales charge been taken into account.
See important disclosures on the next page.
50 | DECEMBER 31, 2011
(unaudited)
Janus Capital has contractually agreed to waive the Fund’s total operating expenses allocated to any class (excluding the distribution and shareholder servicing fees (applicable to Class A Shares, Class C Shares and Class S Shares), administrative services fees payable pursuant to the Transfer Agency Agreement (except for networking and omnibus fees), brokerage commissions, interest, dividends, taxes, acquired fund fees and expenses, and extraordinary expenses) to certain limits until at least November 1, 2012. The contractual waiver may be terminated or modified prior to this date only at the discretion of the Board of Trustees. Returns shown include fee waivers, if any, and without such waivers, returns would have been lower.
The expense information shown was determined based on net assets as of the fiscal period ended June 30, 2011. The effect of contractual waivers agreed to by Janus Capital, when applicable, are reflected under “Net Annual Fund Operating Expenses.” (All expenses are shown without the effect of expense offset arrangements. Pursuant to such arrangements, credits realized as a result of uninvested cash balances are used to reduce custodian and transfer agent expenses.)
The Fund’s performance may be affected by risks that include those associated with non-investment grade debt securities, high-yield/high-risk securities, undervalued or overlooked companies, investments in specific industries or countries and potential conflicts of interest with the Janus “funds of funds.” Additional risks to the Fund may include those associated with investing in foreign securities, emerging markets, initial public offerings (“IPOs”), real estate investment trusts (“REITs”), derivatives, short sales and companies with relatively small market capitalizations. Please see a Janus prospectus or janus.com/info (or janus.com/reports if you hold shares directly with Janus Capital) for more information about risks, portfolio holdings and other details.
The Fund invests in REITs, which may be subject to a higher degree of market risk because of concentration in a specific industry, sector or geographic region. REITs may be subject to risks including, but not limited to: legal, political, liquidity, and interest rate risks, a decline in the value of real estate, risks related to general and economic conditions, changes in the value of the underlying property owned by the trust and defaults by borrowers. To the extent the Fund invests in foreign REITs, the Fund may be subject to fluctuations in currency rates or political or economic conditions in a particular country.
The Fund may invest in derivatives which can be highly volatile and involve additional risks than if the underlying securities were held directly by the Fund. Such risks include gains or losses which, as a result of leverage, can be substantially greater than the derivatives’ original cost. There is also a possibility that derivatives may not perform as intended which can reduce opportunity for gains or result in losses by offsetting positive returns in other securities the Fund owns.
Funds that invest in bonds have the same interest rate, inflation, and credit risks that are associated with the underlying bonds owned by the fund. Unlike owning individual bonds, there are ongoing fees and expenses associated with owning shares of bonds funds. The return of principal is not guaranteed due to net asset value fluctuation that is caused by changes in the price of specific bonds held in the fund and selling of bonds within the fund by the portfolio managers.
High-yield/high-risk bonds, also known as “junk” bonds, involve a greater risk of default and price volatility than investment grade bonds. High-yield/high-risk bonds can experience sudden and sharp price swings which will affect net asset value.
For a period of three years subsequent to the Fund’s commencement of operations, Janus Capital may recover from the Fund fees and expenses previously waived or reimbursed, which could then be considered a deferral, if the Fund’s expense ratio, including recovered expenses, falls below the expense limit.
Returns include reinvestment of dividends from net investment income and distributions from capital gains. The returns shown do not reflect the deduction of taxes that a shareholder would pay on Fund distributions or the redemption of Fund shares. The returns do not include adjustments in accordance with generally accepted accounting principles required at the period end for financial reporting purposes.
Lipper, a wholly-owned subsidiary of Thomson Reuters, provides independent insight on global collective investments including mutual funds, retirement funds, hedge funds, fund fees and expenses to the asset management and media communities. Lipper ranks the performance of mutual funds within a classification of funds that have similar investment objectives. Rankings are historical with capital gains and dividends reinvested and do not include the effect of loads.
Ranking is for Class I Shares only; other classes may have different performance characteristics. When an expense waiver is in effect, it may have a material effect on the total return, and therefore the ranking for the period.
There is no assurance that the investment process will consistently lead to successful investing.
See Notes to Schedules of Investments for index definitions.
The Fund’s portfolio may differ significantly from the securities held in the indices. The indices are unmanaged and are not available for direct investment; therefore, their performance does not reflect the expenses associated with the active management of an actual portfolio.
See “Explanations of Charts, Tables and Financial Statements.”
| | | |
| * | | The Fund’s inception date – July 30, 2010 |
| (1) | | Closed to new investors. |
Janus Value Funds | 51
Perkins Value Plus Income Fund (unaudited)
The examples below show you the ongoing costs (in dollars) of investing in your Fund and allow you to compare these costs with those of other mutual funds. Please refer to the section Useful Information About Your Fund Report for a detailed explanation of the information presented in these charts.
| | | | | | | | | | | | | | | |
| | | Beginning Account Value
| | Ending Account Value
| | Expenses Paid During Period
| | |
| Expense Example – Class A Shares | | (7/1/11) | | (12/31/11) | | (7/1/11 - 12/31/11)† | | |
| |
| |
| Actual | | $ | 1,000.00 | | | $ | 988.20 | | | $ | 5.05 | | | |
| |
| |
Hypothetical
(5% return before expenses) | | $ | 1,000.00 | | | $ | 1,020.06 | | | $ | 5.13 | | | |
| |
| |
| | | | | | | | | | | | | | | |
| | | | | | | | | | | | | | | |
| | | Beginning Account Value
| | Ending Account Value
| | Expenses Paid During Period
| | |
| Expense Example – Class C Shares | | (7/1/11) | | (12/31/11) | | (7/1/11 - 12/31/11)† | | |
| |
| |
| Actual | | $ | 1,000.00 | | | $ | 984.40 | | | $ | 8.78 | | | |
| |
| |
Hypothetical
(5% return before expenses) | | $ | 1,000.00 | | | $ | 1,016.29 | | | $ | 8.92 | | | |
| |
| |
| | | | | | | | | | | | | | | |
| | | | | | | | | | | | | | | |
| | | Beginning Account Value
| | Ending Account Value
| | Expenses Paid During Period
| | |
| Expense Example – Class D Shares | | (7/1/11) | | (12/31/11) | | (7/1/11 - 12/31/11)† | | |
| |
| |
| Actual | | $ | 1,000.00 | | | $ | 988.90 | | | $ | 4.35 | | | |
| |
| |
Hypothetical
(5% return before expenses) | | $ | 1,000.00 | | | $ | 1,020.76 | | | $ | 4.42 | | | |
| |
| |
| | | | | | | | | | | | | | | |
| | | | | | | | | | | | | | | |
| | | Beginning Account Value
| | Ending Account Value
| | Expenses Paid During Period
| | |
| Expense Example – Class I Shares | | (7/1/11) | | (12/31/11) | | (7/1/11 - 12/31/11)† | | |
| |
| |
| Actual | | $ | 1,000.00 | | | $ | 989.40 | | | $ | 3.90 | | | |
| |
| |
Hypothetical
(5% return before expenses) | | $ | 1,000.00 | | | $ | 1,021.22 | | | $ | 3.96 | | | |
| |
| |
| | | | | | | | | | | | | | | |
| | | | | | | | | | | | | | | |
| | | Beginning Account Value
| | Ending Account Value
| | Expenses Paid During Period
| | |
| Expense Example – Class S Shares | | (7/1/11) | | (12/31/11) | | (7/1/11 - 12/31/11)† | | |
| |
| |
| Actual | | $ | 1,000.00 | | | $ | 986.90 | | | $ | 6.24 | | | |
| |
| |
Hypothetical
(5% return before expenses) | | $ | 1,000.00 | | | $ | 1,018.85 | | | $ | 6.34 | | | |
| |
| |
| | | | | | | | | | | | | | | |
| | | | | | | | | | | | | | | |
| | | Beginning Account Value
| | Ending Account Value
| | Expenses Paid During Period
| | |
| Expense Example – Class T Shares | | (7/1/11) | | (12/31/11) | | (7/1/11 - 12/31/11)† | | |
| |
| |
| Actual | | $ | 1,000.00 | | | $ | 988.20 | | | $ | 5.00 | | | |
| |
| |
Hypothetical
(5% return before expenses) | | $ | 1,000.00 | | | $ | 1,020.11 | | | $ | 5.08 | | | |
| |
| |
| | | |
| † | | Expenses are equal to the annualized expense ratio of 1.01% for Class A Shares, 1.76% for Class C Shares, 0.87% for Class D Shares, 0.78% for Class I Shares, 1.25% for Class S Shares and 1.00% for Class T Shares multiplied by the average account value over the period, multiplied by 184/366 (to reflect the one-half year period). Expenses include effect of contractual waivers by Janus Capital. |
52 | DECEMBER 31, 2011
Perkins Value Plus Income Fund
Schedule of Investments (unaudited)
As of December 31, 2011
| | | | | | | | | | | |
| Shares or Principal Amount | | Value | | | |
| |
| Asset-Backed/Commercial Mortgage-Backed Securities – 0.9% | | | | | | |
| $ | 32,000 | | | Bear Stearns Commercial Mortgage Securities
5.5370%, 10/12/41 | | $ | 35,925 | | | |
| | 34,000 | | | Commercial Mortgage Pass Through Certificates
5.8137%, 12/10/49‡ | | | 37,952 | | | |
| | 35,000 | | | FREMF Mortgage Trust
4.9329%, 7/25/21‡ | | | 30,590 | | | |
| | 19,000 | | | FREMF Mortgage Trust
4.7507%, 10/25/21 (144A),‡ | | | 16,072 | | | |
| | 47,000 | | | FREMF Mortgage Trust
4.7705%, 4/25/44 (144A),‡ | | | 43,448 | | | |
| | 61,000 | | | FREMF Mortgage Trust
4.8868%, 7/25/44 (144A),‡ | | | 56,475 | | | |
| | 30,000 | | | GS Mortgage Securities Corp. II
5.5600%, 11/10/39 | | | 32,937 | | | |
| | 58,000 | | | JPMorgan Chase Commercial Mortgage Securities Corp.
3.6620%, 7/5/24 (144A) | | | 59,473 | | | |
| | 18,000 | | | JPMorgan Chase Commercial Mortgage Securities Corp.
5.6330%, 12/5/27 (144A) | | | 20,465 | | | |
| | 18,000 | | | JPMorgan Chase Commercial Mortgage Securities Corp.
5.8748%, 4/15/45‡ | | | 20,202 | | | |
| | 31,000 | | | Morgan Stanley Capital I
3.8840%, 2/15/16 (144A) | | | 32,576 | | | |
| |
| |
| Total Asset-Backed/Commercial Mortgage-Backed Securities (cost $380,521) | | | 386,115 | | | |
| |
| |
| Bank Loans – 0.3% | | | | | | |
| Food – Miscellaneous/Diversified – 0.2% | | | | | | |
| | 97,393 | | | Del Monte Foods Co.
4.5000%, 3/8/18‡ | | | 92,280 | | | |
| Telecommunication Equipment – 0.1% | | | | | | |
| | 16,873 | | | CommScope, Inc.
5.0000%, 1/14/18‡ | | | 16,712 | | | |
| |
| |
| Total Bank Loans (cost $113,976) | | | 108,992 | | | |
| |
| |
| Common Stock – 54.0% | | | | | | |
| Aerospace and Defense – 1.1% | | | | | | |
| | 3,300 | | | General Dynamics Corp.** | | | 219,153 | | | |
| | 5,000 | | | Raytheon Co. | | | 241,900 | | | |
| | | | | | | | 461,053 | | | |
| Agricultural Chemicals – 0.3% | | | | | | |
| | 2,500 | | | Mosaic Co.** | | | 126,075 | | | |
| Applications Software – 0.7% | | | | | | |
| | 11,280 | | | Microsoft Corp.** | | | 292,829 | | | |
| Beverages – Non-Alcoholic – 0.8% | | | | | | |
| | 4,900 | | | PepsiCo, Inc.** | | | 325,115 | | | |
| Brewery – 0.6% | | | | | | |
| | 5,400 | | | Molson Coors Brewing Co. – Class B** | | | 235,116 | | | |
| Building – Residential and Commercial – 0.3% | | | | | | |
| | 7,900 | | | M.D.C. Holdings, Inc. | | | 139,277 | | | |
| Cellular Telecommunications – 1.8% | | | | | | |
| | 24,300 | | | SK Telecom Co., Ltd. (ADR) | | | 330,723 | | | |
| | 15,200 | | | Vodafone Group PLC (ADR) | | | 426,056 | | | |
| | | | | | | | 756,779 | | | |
| Commercial Banks – 0.9% | | | | | | |
| | 5,000 | | | FirstMerit Corp. | | | 75,650 | | | |
| | 18,600 | | | Fulton Financial Corp. | | | 182,466 | | | |
| | 10,000 | | | Glacier Bancorp., Inc. | | | 120,300 | | | |
| | | | | | | | 378,416 | | | |
| Commercial Services – Finance – 1.1% | | | | | | |
| | 5,700 | | | Paychex, Inc. | | | 171,627 | | | |
| | 15,000 | | | Western Union Co. | | | 273,900 | | | |
| | | | | | | | 445,527 | | | |
| Computer Services – 0.2% | | | | | | |
| | 500 | | | International Business Machines Corp.** | | | 91,940 | | | |
| Computers – 0.3% | | | | | | |
| | 4,300 | | | Hewlett-Packard Co.** | | | 110,768 | | | |
| Containers – Metal and Glass – 0.7% | | | | | | |
| | 6,000 | | | Greif, Inc.** | | | 273,300 | | | |
| Cruise Lines – 0.4% | | | | | | |
| | 5,500 | | | Carnival Corp. (U.S. Shares) | | | 179,520 | | | |
| Dental Supplies and Equipment – 0.3% | | | | | | |
| | 3,800 | | | Patterson Cos., Inc.** | | | 112,176 | | | |
| Distribution/Wholesale – 0.3% | | | | | | |
| | 4,800 | | | Owens & Minor, Inc. | | | 133,392 | | | |
| Diversified Banking Institutions – 0.3% | | | | | | |
| | 4,000 | | | JPMorgan Chase & Co. | | | 133,000 | | | |
| Diversified Operations – 2.4% | | | | | | |
| | 14,100 | | | General Electric Co. | | | 252,531 | | | |
| | 4,000 | | | Illinois Tool Works, Inc. | | | 186,840 | | | |
| | 4,500 | | | Koppers Holdings, Inc. | | | 154,620 | | | |
| | 20,000 | | | Orkla A.S.A. | | | 149,378 | | | |
| | 5,000 | | | Tyco International, Ltd. (U.S. Shares)** | | | 233,550 | | | |
| | | | | | | | 976,919 | | | |
| Electric – Integrated – 2.3% | | | | | | |
| | 2,300 | | | Entergy Corp. | | | 168,015 | | | |
| | 6,000 | | | Exelon Corp. | | | 260,220 | | | |
| | 6,000 | | | GDF Suez | | | 163,988 | | | |
| | 12,000 | | | PPL Corp. | | | 353,040 | | | |
| | | | | | | | 945,263 | | | |
| Electronic Components – Semiconductors – 0.2% | | | | | | |
| | 2,500 | | | Microchip Technology, Inc. | | | 91,575 | | | |
| Enterprise Software/Services – 0.2% | | | | | | |
| | 2,700 | | | Oracle Corp.** | | | 69,255 | | | |
| Filtration and Separations Products – 0.3% | | | | | | |
| | 2,100 | | | Pall Corp.** | | | 120,015 | | | |
| Finance – Other Services – 0.3% | | | | | | |
| | 4,000 | | | NYSE Euronext | | | 104,400 | | | |
| Food – Miscellaneous/Diversified – 0.4% | | | | | | |
| | 5,200 | | | Unilever PLC (ADR) | | | 174,304 | | | |
| Food – Retail – 0.7% | | | | | | |
| | 14,300 | | | Safeway, Inc. | | | 300,872 | | | |
| Food – Wholesale/Distribution – 0.8% | | | | | | |
| | 11,500 | | | Sysco Corp. | | | 337,295 | | | |
| Gold Mining – 0.3% | | | | | | |
| | 3,000 | | | Goldcorp, Inc. (U.S. Shares)** | | | 132,750 | | | |
| Human Resources – 0.1% | | | | | | |
| | 1,100 | | | Manpower Group | | | 39,325 | | | |
See Notes to Schedules of Investments and Financial Statements.
Janus Value Funds | 53
Perkins Value Plus Income Fund
Schedule of Investments (unaudited)
As of December 31, 2011
| | | | | | | | | | | |
| Shares or Principal Amount | | Value | | | |
| |
| Instruments – Scientific – 0.6% | | | | | | |
| | 11,500 | | | PerkinElmer, Inc. | | $ | 230,000 | | | |
| Investment Management and Advisory Services – 0.3% | | | | | | |
| | 600 | | | BlackRock, Inc.** | | | 106,944 | | | |
| Medical – Biomedical and Genetic – 0.4% | | | | | | |
| | 2,500 | | | Amgen, Inc.** | | | 160,525 | | | |
| Medical – Drugs – 4.1% | | | | | | |
| | 5,300 | | | Abbott Laboratories | | | 298,019 | | | |
| | 4,500 | | | GlaxoSmithKline PLC (ADR)** | | | 205,335 | | | |
| | 3,000 | | | Johnson & Johnson** | | | 196,740 | | | |
| | 6,800 | | | Merck & Co., Inc. | | | 256,360 | | | |
| | 6,000 | | | Novartis A.G. (ADR) | | | 343,020 | | | |
| | 16,900 | | | Pfizer, Inc.** | | | 365,716 | | | |
| | | | | | | | 1,665,190 | | | |
| Medical – Generic Drugs – 0.5% | | | | | | |
| | 5,000 | | | Teva Pharmaceutical S.P. (ADR)** | | | 201,800 | | | |
| Medical – Wholesale Drug Distributors – 0.3% | | | | | | |
| | 1,400 | | | McKesson Corp.** | | | 109,074 | | | |
| Medical Instruments – 0.9% | | | | | | |
| | 8,500 | | | Medtronic, Inc.** | | | 325,125 | | | |
| | 1,300 | | | St. Jude Medical, Inc. | | | 44,590 | | | |
| | | | | | | | 369,715 | | | |
| Medical Products – 1.6% | | | | | | |
| | 1,400 | | | Baxter International, Inc.** | | | 69,272 | | | |
| | 2,900 | | | Becton, Dickinson and Co.** | | | 216,688 | | | |
| | 3,500 | | | Covidien PLC (U.S. Shares)** | | | 157,535 | | | |
| | 3,200 | | | Stryker Corp.** | | | 159,072 | | | |
| | 1,300 | | | West Pharmaceutical Services, Inc. | | | 49,335 | | | |
| | | | | | | | 651,902 | | | |
| Metal – Copper – 0.3% | | | | | | |
| | 3,500 | | | Freeport-McMoRan Copper & Gold, Inc. – Class B** | | | 128,765 | | | |
| Multi-Line Insurance – 1.5% | | | | | | |
| | 11,500 | | | Allstate Corp. | | | 315,215 | | | |
| | 10,000 | | | Unitrin, Inc. | | | 292,100 | | | |
| | | | | | | | 607,315 | | | |
| Multimedia – 0.2% | | | | | | |
| | 2,500 | | | Time Warner, Inc. | | | 90,350 | | | |
| Networking Products – 0.8% | | | | | | |
| | 17,100 | | | Cisco Systems, Inc. | | | 309,168 | | | |
| Non-Hazardous Waste Disposal – 0.7% | | | | | | |
| | 11,000 | | | Republic Services, Inc. | | | 303,050 | | | |
| Oil – Field Services – 0.7% | | | | | | |
| | 3,920 | | | Schlumberger, Ltd. (U.S. Shares)** | | | 267,775 | | | |
| Oil and Gas Drilling – 0.3% | | | | | | |
| | 3,000 | | | Ensco International PLC (ADR) | | | 140,760 | | | |
| Oil Companies – Exploration and Production – 1.4% | | | | | | |
| | 2,500 | | | Devon Energy Corp.** | | | 155,000 | | | |
| | 2,000 | | | EQT Corp.** | | | 109,580 | | | |
| | 11,300 | | | Exco Resources, Inc. | | | 118,085 | | | |
| | 1,500 | | | Noble Energy, Inc.** | | | 141,585 | | | |
| | 700 | | | Occidental Petroleum Corp.** | | | 65,590 | | | |
| | | | | | | | 589,840 | | | |
| Oil Companies – Integrated – 3.3% | | | | | | |
| | 3,500 | | | BP PLC (ADR)** | | | 149,590 | | | |
| | 3,500 | | | Chevron Corp.** | | | 372,400 | | | |
| | 1,500 | | | ConocoPhillips** | | | 109,305 | | | |
| | 2,200 | | | Exxon Mobil Corp.** | | | 186,472 | | | |
| | 4,500 | | | Royal Dutch Shell PLC (ADR) | | | 328,905 | | | |
| | 4,000 | | | Total S.A. (ADR)** | | | 204,440 | | | |
| | | | | | | | 1,351,112 | | | |
| Paper and Related Products – 0.3% | | | | | | |
| | 9,500 | | | Glatfelter | | | 134,140 | | | |
| Property and Casualty Insurance – 0.2% | | | | | | |
| | 1,000 | | | Chubb Corp.** | | | 69,220 | | | |
| Protection – Safety – 0.4% | | | | | | |
| | 3,500 | | | Landauer, Inc. | | | 180,250 | | | |
| Publishing – Books – 0.5% | | | | | | |
| | 25,000 | | | Reed Elsevier PLC | | | 201,463 | | | |
| Publishing – Periodicals – 0.2% | | | | | | |
| | 11,000 | | | UBM PLC | | | 81,538 | | | |
| Real Estate Management/Services – 0.3% | | | | | | |
| | 10,000 | | | Brookfield Real Estate Services, Inc. | | | 123,613 | | | |
| Reinsurance – 0.6% | | | | | | |
| | 1,500 | | | Everest Re Group, Ltd.** | | | 126,135 | | | |
| | 2,000 | | | PartnerRe, Ltd. | | | 128,420 | | | |
| | | | | | | | 254,555 | | | |
| REIT – Apartments – 0.3% | | | | | | |
| | 14,000 | | | Campus Crest Communities, Inc. | | | 140,840 | | | |
| REIT – Diversified – 1.4% | | | | | | |
| | 5,500 | | | Potlatch Corp. | | | 171,105 | | | |
| | 4,050 | | | Rayonier, Inc. | | | 180,751 | | | |
| | 12,000 | | | Weyerhaeuser Co. | | | 224,040 | | | |
| | | | | | | | 575,896 | | | |
| REIT – Health Care – 0.6% | | | | | | |
| | 12,900 | | | Healthcare Realty Trust, Inc. | | | 239,811 | | | |
| REIT – Mortgage – 0.9% | | | | | | |
| | 5,700 | | | Annaly Mortgage Management, Inc. | | | 90,972 | | | |
| | 15,000 | | | Redwood Trust, Inc. | | | 152,700 | | | |
| | 12,000 | | | Two Harbors Investment Corp. | | | 110,880 | | | |
| | | | | | | | 354,552 | | | |
| REIT – Office Property – 1.4% | | | | | | |
| | 3,300 | | | BioMed Realty Trust, Inc. | | | 59,664 | | | |
| | 8,900 | | | Corporate Office Properties | | | 189,214 | | | |
| | 7,000 | | | Government Properties Income Trust | | | 157,850 | | | |
| | 5,500 | | | Mack-Cali Realty Corp. | | | 146,795 | | | |
| | | | | | | | 553,523 | | | |
| Retail – Apparel and Shoe – 0.5% | | | | | | |
| | 5,000 | | | American Eagle Outfitters, Inc. | | | 76,450 | | | |
| | 4,000 | | | Guess?, Inc.** | | | 119,280 | | | |
| | | | | | | | 195,730 | | | |
| Retail – Consumer Electronics – 0.4% | | | | | | |
| | 16,300 | | | RadioShack Corp. | | | 158,273 | | | |
| Retail – Discount – 0.4% | | | | | | |
| | 3,000 | | | Wal-Mart Stores, Inc.** | | | 179,280 | | | |
| Retail – Drug Store – 0.5% | | | | | | |
| | 6,000 | | | Walgreen Co.** | | | 198,360 | | | |
See Notes to Schedules of Investments and Financial Statements.
54 | DECEMBER 31, 2011
Schedule of Investments (unaudited)
As of December 31, 2011
| | | | | | | | | | | |
| Shares or Principal Amount | | Value | | | |
| |
| Retail – Office Supplies – 0.5% | | | | | | |
| | 15,300 | | | Staples, Inc.** | | $ | 212,517 | | | |
| Retail – Regional Department Stores – 0.1% | | | | | | |
| | 1,200 | | | Kohl’s Corp. | | | 59,220 | | | |
| Savings/Loan/Thrifts – 1.1% | | | | | | |
| | 37,200 | | | First Niagara Financial Group, Inc. | | | 321,036 | | | |
| | 10,000 | | | Washington Federal, Inc. | | | 139,900 | | | |
| | | | | | | | 460,936 | | | |
| Semiconductor Components/Integrated Circuits – 0.3% | | | | | | |
| | 4,000 | | | Analog Devices, Inc. | | | 143,120 | | | |
| Semiconductor Equipment – 0.6% | | | | | | |
| | 12,000 | | | Applied Materials, Inc.** | | | 128,520 | | | |
| | 4,100 | | | MKS Instruments, Inc. | | | 114,062 | | | |
| | | | | | | | 242,582 | | | |
| Super-Regional Banks – 2.7% | | | | | | |
| | 18,100 | | | Fifth Third Bancorp. | | | 230,232 | | | |
| | 6,100 | | | PNC Financial Services Group, Inc. | | | 351,787 | | | |
| | 10,900 | | | SunTrust Banks, Inc. | | | 192,930 | | | |
| | 12,500 | | | Wells Fargo & Co.** | | | 344,500 | | | |
| | | | | | | | 1,119,449 | | | |
| Telecommunication Services – 0.3% | | | | | | |
| | 5,500 | | | Vivendi | | | 120,429 | | | |
| Telephone – Integrated – 1.8% | | | | | | |
| | 12,000 | | | AT&T, Inc.** | | | 362,880 | | | |
| | 10,400 | | | CenturyLink, Inc. | | | 386,880 | | | |
| | | | | | | | 749,760 | | | |
| Tobacco – 0.3% | | | | | | |
| | 3,500 | | | Altria Group, Inc. | | | 103,775 | | | |
| Transportation – Marine – 0.3% | | | | | | |
| | 2,300 | | | Tidewater, Inc.** | | | 113,390 | | | |
| Transportation – Railroad – 0.4% | | | | | | |
| | 600 | | | Norfolk Southern Corp.** | | | 43,716 | | | |
| | 1,200 | | | Union Pacific Corp.** | | | 127,128 | | | |
| | | | | | | | 170,844 | | | |
| Transportation – Services – 0.4% | | | | | | |
| | 5,000 | | | PostNL N.V. (ADR) | | | 15,850 | | | |
| | 5,000 | | | TNT Express N.V. (ADR) | | | 36,800 | | | |
| | 1,300 | | | United Parcel Service, Inc. – Class B | | | 95,147 | | | |
| | | | | | | | 147,797 | | | |
| Water – 0.3% | | | | | | |
| | 9,000 | | | Suez Environment S.A. | | | 103,669 | | | |
| |
| |
| Total Common Stock (cost $22,199,706) | | | 22,158,073 | | | |
| |
| |
| Corporate Bonds – 30.6% | | | | | | |
| Advertising Services – 0.1% | | | | | | |
| $ | 21,000 | | | WPP Finance UK
4.7500%, 11/21/21 (144A) | | | 20,847 | | | |
| Aerospace and Defense – Equipment – 0.4% | | | | | | |
| | 79,000 | | | Exelis, Inc.
4.2500%, 10/1/16 (144A) | | | 79,711 | | | |
| | 82,000 | | | Exelis, Inc.
5.5500%, 10/1/21 (144A) | | | 85,610 | | | |
| | | | | | | | 165,321 | | | |
| Agricultural Chemicals – 0.5% | | | | | | |
| | 65,000 | | | CF Industries, Inc.
6.8750%, 5/1/18 | | | 74,425 | | | |
| | 36,000 | | | CF Industries, Inc.
7.1250%, 5/1/20 | | | 42,570 | | | |
| | 23,000 | | | Incitec Pivot, Ltd.
4.0000%, 12/7/15 (144A) | | | 23,470 | | | |
| | 20,000 | | | Mosaic Co.
3.7500%, 11/15/21 | | | 20,208 | | | |
| | 20,000 | | | Mosaic Co.
4.8750%, 11/15/41 | | | 20,675 | | | |
| | 36,000 | | | Phibro Animal Health Corp.
9.2500%, 7/1/18 (144A) | | | 31,230 | | | |
| | | | | | | | 212,578 | | | |
| Airlines – 0.1% | | | | | | |
| | 53,000 | | | Southwest Airlines Co.
5.1250%, 3/1/17 | | | 55,858 | | | |
| Automotive – Truck Parts and Equipment – Original – 0.1% | | | | | | |
| | 45,000 | | | American Axle & Manufacturing Holdings, Inc.
9.2500%, 1/15/17 (144A) | | | 48,825 | | | |
| Beverages – Non-Alcoholic – 0.5% | | | | | | |
| | 111,000 | | | Coca-Cola Co.
0.7500%, 11/15/13 | | | 111,203 | | | |
| | 77,000 | | | Coca-Cola Co.
1.5000%, 11/15/15 | | | 78,051 | | | |
| | | | | | | | 189,254 | | | |
| Beverages – Wine and Spirits – 1.2% | | | | | | |
| | 300,000 | | | Pernod-Ricard S.A.
5.7500%, 4/7/21 (144A) | | | 338,460 | | | |
| | 150,000 | | | Pernod-Ricard S.A.
4.4500%, 1/15/22 (144A) | | | 157,138 | | | |
| | | | | | | | 495,598 | | | |
| Brewery – 0.3% | | | | | | |
| | 69,000 | | | Anheuser-Busch InBev Worldwide, Inc.
1.5000%, 7/14/14 | | | 69,493 | | | |
| | 50,000 | | | Anheuser-Busch InBev Worldwide, Inc.
7.7500%, 1/15/19 | | | 64,758 | | | |
| | | | | | | | 134,251 | | | |
| Building Products – Cement and Aggregate – 0% | | | | | | |
| | 7,000 | | | CRH America, Inc.
4.1250%, 1/15/16 | | | 6,989 | | | |
| | 9,000 | | | CRH America, Inc.
5.7500%, 1/15/21 | | | 9,175 | | | |
| | | | | | | | 16,164 | | | |
| Cable/Satellite Television – 0.1% | | | | | | |
| | 50,000 | | | Comcast Corp.
5.1500%, 3/1/20 | | | 56,862 | | | |
| Chemicals – Diversified – 0.9% | | | | | | |
| | 50,000 | | | Dow Chemical Co.
7.6000%, 5/15/14 | | | 56,541 | | | |
| | 34,000 | | | Lyondell Chemical Co.
8.0000%, 11/1/17 | | | 37,145 | | | |
| | 49,910 | | | Lyondell Chemical Co.
11.0000%, 5/1/18 | | | 54,527 | | | |
| | 200,000 | | | LyondellBasell Industries N.V.
6.0000%, 11/15/21 (144A) | | | 207,500 | | | |
| | | | | | | | 355,713 | | | |
See Notes to Schedules of Investments and Financial Statements.
Janus Value Funds | 55
Perkins Value Plus Income Fund
Schedule of Investments (unaudited)
As of December 31, 2011
| | | | | | | | | | | |
| Shares or Principal Amount | | Value | | | |
| |
| Chemicals – Specialty – 0.6% | | | | | | |
| $ | 27,000 | | | Ashland, Inc.
9.1250%, 6/1/17 | | $ | 30,105 | | | |
| | 99,000 | | | Ecolab, Inc.
3.0000%, 12/8/16 | | | 102,407 | | | |
| | 85,000 | | | Ecolab, Inc.
4.3500%, 12/8/21 | | | 90,771 | | | |
| | 25,000 | | | Ecolab, Inc.
5.5000%, 12/8/41 | | | 27,703 | | | |
| | | | | | | | 250,986 | | | |
| Commercial Banks – 1.5% | | | | | | |
| | 25,000 | | | Abbey National Treasury Services PLC
2.0022%, 4/25/14‡ | | | 22,760 | | | |
| | 76,000 | | | CIT Group, Inc.
5.2500%, 4/1/14 (144A) | | | 75,715 | | | |
| | 50,000 | | | CIT Group, Inc.
7.0000%, 5/4/15 (144A) | | | 50,062 | | | |
| | 250,000 | | | CIT Group, Inc.
7.0000%, 5/1/17 | | | 250,000 | | | |
| | 100,000 | | | Standard Chartered PLC
3.2000%, 5/12/16 (144A) | | | 97,853 | | | |
| | 56,000 | | | SVB Financial Group
5.3750%, 9/15/20 | | | 57,371 | | | |
| | 72,000 | | | Zions Bancorp.
7.7500%, 9/23/14 | | | 76,341 | | | |
| | | | | | | | 630,102 | | | |
| Commercial Services – Finance – 0.2% | | | | | | |
| | 66,000 | | | Western Union Co.
3.6500%, 8/22/18 | | | 67,669 | | | |
| Computers – Memory Devices – 0.1% | | | | | | |
| | 35,000 | | | Seagate Technology
10.0000%, 5/1/14 (144A) | | | 39,594 | | | |
| Consulting Services – 0.7% | | | | | | |
| | 49,000 | | | Verisk Analytics, Inc.
4.8750%, 1/15/19 | | | 49,436 | | | |
| | 214,000 | | | Verisk Analytics, Inc.
5.8000%, 5/1/21 | | | 230,370 | | | |
| | | | | | | | 279,806 | | | |
| Containers – Paper and Plastic – 0.1% | | | | | | |
| | 20,000 | | | Sonoco Products Co.
4.3750%, 11/1/21 | | | 20,715 | | | |
| | 34,000 | | | Sonoco Products Co.
5.7500%, 11/1/40 | | | 36,329 | | | |
| | | | | | | | 57,044 | | | |
| Data Processing and Management – 0.2% | | | | | | |
| | 37,000 | | | Fiserv, Inc.
3.1250%, 10/1/15 | | | 37,903 | | | |
| | 22,000 | | | Fiserv, Inc.
3.1250%, 6/15/16 | | | 22,400 | | | |
| | 22,000 | | | Fiserv, Inc.
4.7500%, 6/15/21 | | | 23,017 | | | |
| | | | | | | | 83,320 | | | |
| Diversified Banking Institutions – 1.7% | | | | | | |
| | 85,000 | | | Bank of America Corp.
4.5000%, 4/1/15 | | | 82,024 | | | |
| | 50,000 | | | Citigroup, Inc.
5.0000%, 9/15/14 | | | 49,485 | | | |
| | 36,000 | | | Citigroup, Inc.
4.8750%, 5/7/15 | | | 35,558 | | | |
| | 17,000 | | | Citigroup, Inc.
4.7500%, 5/19/15 | | | 17,217 | | | |
| | 21,000 | | | Citigroup, Inc.
4.5000%, 1/14/22 | | | 20,202 | | | |
| | 49,000 | | | Goldman Sachs Group, Inc.
3.6250%, 2/7/16 | | | 47,345 | | | |
| | 51,000 | | | Goldman Sachs Group, Inc.
5.2500%, 7/27/21 | | | 49,753 | | | |
| | 85,000 | | | JPMorgan Chase & Co.
5.7500%, 1/2/13 | | | 88,174 | | | |
| | 50,000 | | | JPMorgan Chase & Co.
6.0000%, 1/15/18 | | | 55,784 | | | |
| | 100,000 | | | Morgan Stanley
3.4500%, 11/2/15 | | | 92,069 | | | |
| | 75,000 | | | Morgan Stanley
5.6250%, 9/23/19 | | | 69,456 | | | |
| | 17,000 | | | Royal Bank of Scotland PLC
3.9500%, 9/21/15 | | | 15,941 | | | |
| | 61,000 | | | Royal Bank of Scotland PLC
4.3750%, 3/16/16 | | | 58,194 | | | |
| | | | | | | | 681,202 | | | |
| Diversified Financial Services – 0.8% | | | | | | |
| | 50,000 | | | General Electric Capital Corp.
4.8000%, 5/1/13 | | | 52,344 | | | |
| | 50,000 | | | General Electric Capital Corp.
6.0000%, 8/7/19 | | | 57,431 | | | |
| | 150,000 | | | General Electric Capital Corp.
5.5000%, 1/8/20 | | | 165,044 | | | |
| | 58,000 | | | General Electric Capital Corp.
4.6500%, 10/17/21 | | | 60,533 | | | |
| | | | | | | | 335,352 | | | |
| Diversified Minerals – 0.1% | | | | | | |
| | 50,000 | | | Teck Resources, Ltd.
10.2500%, 5/15/16 | | | 57,500 | | | |
| Diversified Operations – 0.1% | | | | | | |
| | 45,000 | | | Danaher Corp.
2.3000%, 6/23/16 | | | 46,772 | | | |
| Diversified Operations – Commercial Services – 0.1% | | | | | | |
| | 41,000 | | | ARAMARK Corp.
8.5000%, 2/1/15 | | | 42,025 | | | |
| Electric – Generation – 0% | | | | | | |
| | 15,000 | | | AES Corp.
7.7500%, 10/15/15 | | | 16,312 | | | |
| Electric – Integrated – 1.5% | | | | | | |
| | 39,000 | | | Calpine Construction Finance Co. L.P.
8.0000%, 6/1/16 (144A) | | | 42,120 | | | |
| | 51,000 | | | CMS Energy Corp.
4.2500%, 9/30/15 | | | 51,546 | | | |
| | 38,000 | | | CMS Energy Corp.
5.0500%, 2/15/18 | | | 37,905 | | | |
| | 22,000 | | | Florida Power Corp.
3.1000%, 8/15/21 | | | 22,510 | | | |
| | 49,000 | | | Great Plains Energy, Inc.
4.8500%, 6/1/21 | | | 51,363 | | | |
| | 10,000 | | | Pacific Gas & Electric Co.
3.2500%, 9/15/21 | | | 10,147 | | | |
See Notes to Schedules of Investments and Financial Statements.
56 | DECEMBER 31, 2011
Schedule of Investments (unaudited)
As of December 31, 2011
| | | | | | | | | | | |
| Shares or Principal Amount | | Value | | | |
| |
| Electric – Integrated – (continued) | | | | | | |
| | | | | | | | | | | |
| $ | 198,000 | | | PPL Energy Supply LLC
4.6000%, 12/15/21 | | $ | 200,792 | | | |
| | 30,000 | | | PPL WEM Holdings PLC
3.9000%, 5/1/16 (144A) | | | 30,072 | | | |
| | 31,000 | | | Public Service Co. of Colorado
3.2000%, 11/15/20 | | | 32,157 | | | |
| | 11,000 | | | San Diego Gas & Electric Co.
3.0000%, 8/15/21 | | | 11,312 | | | |
| | 20,000 | | | Wisconsin Electric Power Co.
2.9500%, 9/15/21 | | | 20,384 | | | |
| | 100,000 | | | Xcel Energy, Inc.
4.7000%, 5/15/20 | | | 112,702 | | | |
| | | | | | | | 623,010 | | | |
| Electronic Components – Semiconductors – 0.5% | | | | | | |
| | 50,000 | | | Advanced Micro Devices, Inc.
8.1250%, 12/15/17 | | | 51,875 | | | |
| | 32,000 | | | National Semiconductor Corp.
3.9500%, 4/15/15 | | | 34,566 | | | |
| | 59,000 | | | National Semiconductor Corp.
6.6000%, 6/15/17 | | | 72,468 | | | |
| | 41,000 | | | Texas Instruments, Inc.
2.3750%, 5/16/16 | | | 42,709 | | | |
| | | | | | | | 201,618 | | | |
| Electronic Measuring Instruments – 0.3% | | | | | | |
| | 60,000 | | | Agilent Technologies, Inc.
2.5000%, 7/15/13 | | | 60,567 | | | |
| | 69,000 | | | FLIR Systems, Inc.
3.7500%, 9/1/16 | | | 68,740 | | | |
| | | | | | | | 129,307 | | | |
| Electronics – Military – 0.4% | | | | | | |
| | 100,000 | | | L-3 Communications Corp.
6.3750%, 10/15/15 | | | 102,500 | | | |
| | 15,000 | | | L-3 Communications Corp.
5.2000%, 10/15/19 | | | 15,216 | | | |
| | 64,000 | | | L-3 Communications Corp.
4.7500%, 7/15/20 | | | 63,235 | | | |
| | | | | | | | 180,951 | | | |
| Finance – Auto Loans – 0.5% | | | | | | |
| | 200,000 | | | Ford Motor Credit Co. LLC
3.8750%, 1/15/15 | | | 199,254 | | | |
| Finance – Consumer Loans – 0.3% | | | | | | |
| | 21,000 | | | John Deere Capital Corp.
3.9000%, 7/12/21 | | | 22,859 | | | |
| | 90,000 | | | SLM Corp.
6.2500%, 1/25/16 | | | 87,523 | | | |
| | | | | | | | 110,382 | | | |
| Finance – Credit Card – 0.2% | | | | | | |
| | 65,000 | | | American Express Co.
6.8000%, 9/1/66‡ | | | 64,675 | | | |
| Finance – Investment Bankers/Brokers – 0.5% | | | | | | |
| | 50,000 | | | Charles Schwab Corp.
4.4500%, 7/22/20 | | | 52,903 | | | |
| | 31,000 | | | Jefferies Group, Inc.
3.8750%, 11/9/15 | | | 27,435 | | | |
| | 77,000 | | | Jefferies Group, Inc.
5.1250%, 4/13/18 | | | 67,760 | | | |
| | 51,000 | | | Lazard Group LLC
7.1250%, 5/15/15 | | | 54,763 | | | |
| | 4,000 | | | Lazard Group LLC
6.8500%, 6/15/17 | | | 4,196 | | | |
| | | | | | | | 207,057 | | | |
| Finance – Mortgage Loan Banker – 0.3% | | | | | | |
| | 100,000 | | | Northern Rock Asset Management PLC
5.6250%, 6/22/17 (144A) | | | 105,150 | | | |
| Food – Meat Products – 0.5% | | | | | | |
| | 21,000 | | | Smithfield Foods, Inc.
7.7500%, 5/15/13 | | | 22,260 | | | |
| | 62,000 | | | Smithfield Foods, Inc.
10.0000%, 7/15/14 | | | 72,075 | | | |
| | 100,000 | | | Tyson Foods, Inc.‡
6.8500%, 4/1/16 | | | 109,750 | | | |
| | | | | | | | 204,085 | | | |
| Food – Miscellaneous/Diversified – 0.4% | | | | | | |
| | 44,000 | | | Corn Products International, Inc.
3.2000%, 11/1/15 | | | 45,461 | | | |
| | 32,000 | | | Del Monte Corp.
7.6250%, 2/15/19 | | | 30,720 | | | |
| | 44,000 | | | Kellogg Co.
3.2500%, 5/21/18 | | | 46,272 | | | |
| | 50,000 | | | Kraft Foods, Inc.
5.3750%, 2/10/20 | | | 57,692 | | | |
| | | | | | | | 180,145 | | | |
| Gambling – Non-Hotel – 0.1% | | | | | | |
| | 50,000 | | | Jacobs Entertainment, Inc.
9.7500%, 6/15/14 | | | 46,250 | | | |
| Hotels and Motels – 0.5% | | | | | | |
| | 18,000 | | | Hyatt Hotels Corp.
5.7500%, 8/15/15 (144A) | | | 19,276 | | | |
| | 50,000 | | | Hyatt Hotels Corp.
6.8750%, 8/15/19 (144A) | | | 55,796 | | | |
| | 50,000 | | | Starwood Hotels & Resorts Worldwide, Inc.
6.7500%, 5/15/18 | | | 56,500 | | | |
| | 50,000 | | | Starwood Hotels & Resorts Worldwide, Inc.
7.1500%, 12/1/19 | | | 57,187 | | | |
| | | | | | | | 188,759 | | | |
| Investment Management and Advisory Services – 0.3% | | | | | | |
| | 50,000 | | | Ameriprise Financial, Inc.
5.3000%, 3/15/20 | | | 53,803 | | | |
| | 61,000 | | | Ameriprise Financial, Inc.
7.5180%, 6/1/66‡ | | | 61,457 | | | |
| | | | | | | | 115,260 | | | |
| Linen Supply & Related Items – 0.2% | | | | | | |
| | 31,000 | | | Cintas Corp. No. 2
2.8500%, 6/1/16 | | | 31,792 | | | |
| | 34,000 | | | Cintas Corp. No. 2
4.3000%, 6/1/21 | | | 36,522 | | | |
| | | | | | | | 68,314 | | | |
| Medical – Biomedical and Genetic – 0.3% | | | | | | |
| | 12,000 | | | Bio-Rad Laboratories, Inc.
8.0000%, 9/15/16 | | | 13,140 | | | |
See Notes to Schedules of Investments and Financial Statements.
Janus Value Funds | 57
Perkins Value Plus Income Fund
Schedule of Investments (unaudited)
As of December 31, 2011
| | | | | | | | | | | |
| Shares or Principal Amount | | Value | | | |
| |
| Medical – Biomedical and Genetic – (continued) | | | | | | |
| | | | | | | | | | | |
| $ | 51,000 | | | Gilead Sciences, Inc.
4.4000%, 12/1/21 | | $ | 53,993 | | | |
| | 41,000 | | | Gilead Sciences, Inc.
5.6500%, 12/1/41 | | | 45,394 | | | |
| | | | | | | | 112,527 | | | |
| Medical – HMO – 0% | | | | | | |
| | 7,000 | | | Health Care Service Corp.
4.7000%, 1/15/21 (144A) | | | 7,520 | | | |
| Medical Instruments – 0.4% | | | | | | |
| | 29,000 | | | Boston Scientific Corp.
4.5000%, 1/15/15 | | | 30,433 | | | |
| | 68,000 | | | Boston Scientific Corp.
6.0000%, 1/15/20 | | | 75,911 | | | |
| | 43,000 | | | Boston Scientific Corp.
7.0000%, 11/15/35 | | | 49,533 | | | |
| | | | | | | | 155,877 | | | |
| Money Center Banks – 0.2% | | | | | | |
| | 84,000 | | | Lloyds TSB Bank PLC
4.8750%, 1/21/16 | | | 81,865 | | | |
| Multi-Line Insurance – 0.9% | | | | | | |
| | 94,000 | | | American International Group, Inc.
4.2500%, 9/15/14 | | | 91,286 | | | |
| | 47,000 | | | American International Group, Inc.
5.4500%, 5/18/17 | | | 44,915 | | | |
| | 68,000 | | | American International Group, Inc.
6.4000%, 12/15/20 | | | 68,628 | | | |
| | 101,000 | | | American International Group, Inc.
8.1750%, 5/15/58‡ | | | 89,890 | | | |
| | 50,000 | | | MetLife, Inc.
7.7170%, 2/15/19 | | | 62,697 | | | |
| | | | | | | | 357,416 | | | |
| Oil – Field Services – 1.1% | | | | | | |
| | 200,000 | | | Korea National Oil Corp.
4.0000%, 10/27/16 (144A) | | | 205,387 | | | |
| | 94,000 | | | Schlumberger Investment S.A.
1.9500%, 9/14/16 (144A) | | | 95,106 | | | |
| | 93,000 | | | Schlumberger Investment S.A.
3.3000%, 9/14/21 (144A) | | | 95,542 | | | |
| | 44,000 | | | Weatherford International, Ltd.
5.1250%, 9/15/20 | | | 45,724 | | | |
| | | | | | | | 441,759 | | | |
| Oil and Gas Drilling – 0.4% | | | | | | |
| | 100,000 | | | Nabors Industries, Inc.
5.0000%, 9/15/20 | | | 101,950 | | | |
| | 43,000 | | | Rowan Cos., Inc.
5.0000%, 9/1/17 | | | 45,183 | | | |
| | | | | | | | 147,133 | | | |
| Oil Companies – Exploration and Production – 0.9% | | | | | | |
| | 103,000 | | | Anadarko Petroleum Corp.
6.4500%, 9/15/36 | | | 117,430 | | | |
| | 50,000 | | | Forest Oil Corp.
8.5000%, 2/15/14 | | | 54,500 | | | |
| | 39,000 | | | Occidental Petroleum Corp.
1.7500%, 2/15/17 | | | 39,501 | | | |
| | 21,000 | | | Occidental Petroleum Corp.
3.1250%, 2/15/22 | | | 21,543 | | | |
| | 128,000 | | | Petrohawk Energy Corp.
7.8750%, 6/1/15 | | | 136,320 | | | |
| | | | | | | | 369,294 | | | |
| Oil Companies – Integrated – 0.5% | | | | | | |
| | 60,000 | | | BP Capital Markets PLC
3.1250%, 10/1/15 | | | 62,845 | | | |
| | 68,000 | | | BP Capital Markets PLC
2.2480%, 11/1/16 | | | 68,434 | | | |
| | 28,000 | | | BP Capital Markets PLC
4.5000%, 10/1/20 | | | 30,838 | | | |
| | 48,000 | | | BP Capital Markets PLC
3.5610%, 11/1/21 | | | 49,972 | | | |
| | | | | | | | 212,089 | | | |
| Oil Refining and Marketing – 0.3% | | | | | | |
| | 50,000 | | | Motiva Enterprises LLC
5.7500%, 1/15/20 (144A) | | | 58,109 | | | |
| | 16,000 | | | Sunoco Logistics Partners Operations L.P.
4.6500%, 2/15/22 | | | 16,358 | | | |
| | 35,000 | | | Sunoco Logistics Partners Operations L.P.
6.1000%, 2/15/42 | | | 37,455 | | | |
| | | | | | | | 111,922 | | | |
| Paper and Related Products – 0.3% | | | | | | |
| | 29,000 | | | International Paper Co.
4.7500%, 2/15/22 | | | 30,826 | | | |
| | 87,000 | | | International Paper Co.
6.0000%, 11/15/41 | | | 94,448 | | | |
| | | | | | | | 125,274 | | | |
| Pharmacy Services – 0.4% | | | | | | |
| | 130,000 | | | Aristotle Holding, Inc.
4.7500%, 11/15/21 (144A) | | | 134,520 | | | |
| | 45,000 | | | Express Scripts, Inc.
3.1250%, 5/15/16 | | | 45,250 | | | |
| | | | | | | | 179,770 | | | |
| Pipelines – 2.2% | | | | | | |
| | 24,000 | | | Colorado Interstate Gas Co. LLC
6.8500%, 6/15/37 | | | 26,429 | | | |
| | 50,000 | | | Crosstex Energy L.P. / Crosstex Energy Finance Corp.
8.8750%, 2/15/18 | | | 54,625 | | | |
| | 37,000 | | | DCP Midstream Operating L.P.
3.2500%, 10/1/15 | | | 37,340 | | | |
| | 22,000 | | | El Paso Corp.
7.7500%, 1/15/32 | | | 25,410 | | | |
| | 50,000 | | | El Paso Pipeline Partners Operating Co. LLC
6.5000%, 4/1/20 | | | 55,106 | | | |
| | 37,000 | | | El Paso Pipeline Partners Operating Co. LLC
5.0000%, 10/1/21 | | | 38,081 | | | |
| | 39,000 | | | Energy Transfer Partners L.P.
4.6500%, 6/1/21 | | | 38,204 | | | |
| | 50,000 | | | Kinder Morgan Energy Partners L.P.
5.9500%, 2/15/18 | | | 57,122 | | | |
| | 142,000 | | | Kinder Morgan Finance Co. ULC
5.7000%, 1/5/16 | | | 145,195 | | | |
| | 78,000 | | | Magellan Midstream Partners L.P.
4.2500%, 2/1/21 | | | 81,752 | | | |
See Notes to Schedules of Investments and Financial Statements.
58 | DECEMBER 31, 2011
Schedule of Investments (unaudited)
As of December 31, 2011
| | | | | | | | | | | |
| Shares or Principal Amount | | Value | | | |
| |
| Pipelines – (continued) | | | | | | |
| | | | | | | | | | | |
| $ | 50,000 | | | Plains All American Pipeline L.P.
3.9500%, 9/15/15 | | $ | 52,947 | | | |
| | 54,000 | | | Plains All American Pipeline L.P.
5.0000%, 2/1/21 | | | 59,486 | | | |
| | 40,000 | | | TC Pipelines L.P.
4.6500%, 6/15/21 | | | 41,882 | | | |
| | 185,000 | | | Western Gas Partners L.P.
5.3750%, 6/1/21 | | | 196,132 | | | |
| | | | | | | | 909,711 | | | |
| Property and Casualty Insurance – 0.1% | | | | | | |
| | 20,000 | | | Progressive Corp.
3.7500%, 8/23/21 | | | 20,782 | | | |
| Publishing – Newspapers – 0% | | | | | | |
| | 6,000 | | | Gannett Co., Inc.
6.3750%, 9/1/15 | | | 6,090 | | | |
| Publishing – Periodicals – 0.1% | | | | | | |
| | 58,000 | | | United Business Media, Ltd.
5.7500%, 11/3/20 (144A) | | | 58,502 | | | |
| Radio – 0.1% | | | | | | |
| | 50,000 | | | Sirius XM Radio, Inc.
8.7500%, 4/1/15 (144A) | | | 54,750 | | | |
| Real Estate Management/Services – 0.2% | | | | | | |
| | 17,000 | | | CB Richard Ellis Services, Inc.
6.6250%, 10/15/20 | | | 17,425 | | | |
| | 19,000 | | | ProLogis L.P.
6.6250%, 5/15/18 | | | 20,635 | | | |
| | 20,000 | | | ProLogis L.P.
6.8750%, 3/15/20 | | | 22,206 | | | |
| | | | | | | | 60,266 | | | |
| Real Estate Operating/Development – 0.1% | | | | | | |
| | 37,000 | | | Post Apartment Homes L.P.
4.7500%, 10/15/17 | | | 37,524 | | | |
| REIT – Diversified – 0.6% | | | | | | |
| | 250,000 | | | Goodman Funding Pty, Ltd.
6.3750%, 4/15/21 (144A) | | | 254,381 | | | |
| REIT – Health Care – 0.3% | | | | | | |
| | 9,000 | | | HCP, Inc.
2.7000%, 2/1/14 | | | 8,987 | | | |
| | 40,000 | | | Senior Housing Properties Trust
6.7500%, 12/15/21 | | | 40,653 | | | |
| | 4,000 | | | Ventas Realty L.P. / Ventas Capital Corp.
6.5000%, 6/1/16 | | | 4,124 | | | |
| | 52,000 | | | Ventas Realty L.P. / Ventas Capital Corp.
6.7500%, 4/1/17 | | | 53,929 | | | |
| | | | | | | | 107,693 | | | |
| REIT – Hotels – 0.1% | | | | | | |
| | 55,000 | | | Host Hotels & Resorts L.P.
6.7500%, 6/1/16 | | | 56,512 | | | |
| REIT – Office Property – 0.1% | | | | | | |
| | 55,000 | | | Reckson Operating Partnership L.P.
5.0000%, 8/15/18 | | | 53,125 | | | |
| REIT – Regional Malls – 1.0% | | | | | | |
| | 91,000 | | | Rouse Co. L.P.
7.2000%, 9/15/12 | | | 92,479 | | | |
| | 189,000 | | | Rouse Co. L.P.
6.7500%, 5/1/13 (144A) | | | 190,653 | | | |
| | 132,000 | | | Rouse Co. L.P.
6.7500%, 11/9/15 | | | 133,485 | | | |
| | | | | | | | 416,617 | | | |
| REIT – Shopping Centers – 0.1% | | | | | | |
| | 21,000 | | | Developers Diversified Realty Corp.
4.7500%, 4/15/18 | | | 20,093 | | | |
| Retail – Regional Department Stores – 0.3% | | | | | | |
| | 50,000 | | | Macy’s Retail Holdings, Inc.
5.9000%, 12/1/16 | | | 55,874 | | | |
| | 47,000 | | | Macy’s Retail Holdings, Inc.
6.9000%, 4/1/29 | | | 51,692 | | | |
| | | | | | | | 107,566 | | | |
| Retail – Restaurants – 0.3% | | | | | | |
| | 102,000 | | | Darden Restaurants, Inc.
4.5000%, 10/15/21 | | | 104,650 | | | |
| Retail – Toy Store – 0.1% | | | | | | |
| | 50,000 | | | Toys R Us Property Co. LLC
8.5000%, 12/1/17 | | | 51,750 | | | |
| Steel – Producers – 0.2% | | | | | | |
| | 92,000 | | | Steel Dynamics, Inc.
6.7500%, 4/1/15 | | | 94,070 | | | |
| Super-Regional Banks – 0.7% | | | | | | |
| | 42,000 | | | SunTrust Banks, Inc.
3.6000%, 4/15/16 | | | 42,770 | | | |
| | 67,000 | | | SunTrust Banks, Inc.
3.5000%, 1/20/17 | | | 67,346 | | | |
| | 64,000 | | | US Bancorp
2.2000%, 11/15/16 | | | 64,615 | | | |
| | 84,000 | | | Wells Fargo & Co.
4.6000%, 4/1/21 | | | 92,121 | | | |
| | | | | | | | 266,852 | | | |
| Telecommunication Services – 0.2% | | | | | | |
| | 87,000 | | | Qwest Corp.
6.7500%, 12/1/21 | | | 94,830 | | | |
| Telephone – Integrated – 0.6% | | | | | | |
| | 27,000 | | | CenturyLink, Inc.
5.1500%, 6/15/17 | | | 26,762 | | | |
| | 27,000 | | | CenturyLink, Inc.
7.6000%, 9/15/39 | | | 26,494 | | | |
| | 50,000 | | | Qwest Communications International, Inc.
7.5000%, 2/15/14 | | | 50,189 | | | |
| | 124,000 | | | Qwest Communications International, Inc.
7.1250%, 4/1/18 | | | 128,960 | | | |
| | | | | | | | 232,405 | | | |
| Transportation – Railroad – 0.5% | | | | | | |
| | 23,000 | | | Burlington Northern Santa Fe LLC
3.4500%, 9/15/21 | | | 23,706 | | | |
| | 23,000 | | | Burlington Northern Santa Fe LLC
4.9500%, 9/15/41 | | | 25,373 | | | |
| | 38,000 | | | CSX Corp.
4.7500%, 5/30/42 | | | 39,210 | | | |
See Notes to Schedules of Investments and Financial Statements.
Janus Value Funds | 59
Perkins Value Plus Income Fund
Schedule of Investments (unaudited)
As of December 31, 2011
| | | | | | | | | | | |
| Shares or Principal Amount | | Value | | | |
| |
| Transportation – Railroad – (continued) | | | | | | |
| | | | | | | | | | | |
| $ | 100,000 | | | Kansas City Southern de Mexico S.A. de C.V.
8.0000%, 2/1/18 | | $ | 109,500 | | | |
| | 20,000 | | | Kansas City Southern de Mexico S.A. de C.V.
6.6250%, 12/15/20 | | | 21,200 | | | |
| | | | | | | | 218,989 | | | |
| Transportation – Services – 0% | | | | | | |
| | 7,000 | | | Asciano Finance, Ltd.
3.1250%, 9/23/15 (144A) | | | 6,769 | | | |
| Transportation – Truck – 0.1% | | | | | | |
| | 55,000 | | | JB Hunt Transport Services, Inc.
3.3750%, 9/15/15 | | | 55,738 | | | |
| |
| |
| Total Corporate Bonds (cost $12,324,043) | | | 12,555,283 | | | |
| |
| |
| Mortgage-Backed Securities – 6.6% | | | | | | |
| | | | | Fannie Mae: | | | | | | |
| | 19,957 | | | 5.0000%, 2/1/23 | | | 21,555 | | | |
| | 38,754 | | | 5.5000%, 1/1/25 | | | 42,101 | | | |
| | 19,649 | | | 5.5000%, 1/1/33 | | | 21,578 | | | |
| | 18,099 | | | 5.0000%, 11/1/33 | | | 19,573 | | | |
| | 36,992 | | | 5.0000%, 12/1/33 | | | 40,005 | | | |
| | 21,771 | | | 5.0000%, 2/1/34 | | | 23,544 | | | |
| | 70,052 | | | 5.5000%, 4/1/34 | | | 76,578 | | | |
| | 118,097 | | | 5.5000%, 9/1/34 | | | 129,025 | | | |
| | 39,872 | | | 5.5000%, 5/1/35 | | | 43,537 | | | |
| | 276,805 | | | 5.5000%, 7/1/35 | | | 302,419 | | | |
| | 111,775 | | | 6.0000%, 12/1/35 | | | 124,632 | | | |
| | 173,604 | | | 5.5000%, 4/1/36 | | | 189,561 | | | |
| | 167,986 | | | 5.5000%, 5/1/37 | | | 184,475 | | | |
| | 34,466 | | | 6.0000%, 5/1/37 | | | 38,021 | | | |
| | 32,833 | | | 5.5000%, 7/1/37 | | | 35,779 | | | |
| | 25,141 | | | 5.5000%, 3/1/38 | | | 27,609 | | | |
| | 48,534 | | | 6.0000%, 11/1/38 | | | 53,541 | | | |
| | 92,484 | | | 6.0000%, 11/1/38 | | | 102,429 | | | |
| | 21,536 | | | 4.5000%, 10/1/40 | | | 22,935 | | | |
| | 402,692 | | | 4.0000%, 2/1/41 | | | 425,731 | | | |
| | 20,199 | | | 5.0000%, 3/1/41 | | | 22,046 | | | |
| | 65,745 | | | 4.5000%, 4/1/41 | | | 70,572 | | | |
| | 44,032 | | | 5.0000%, 4/1/41 | | | 47,618 | | | |
| | 55,018 | | | 5.0000%, 4/1/41 | | | 59,584 | | | |
| | 41,014 | | | 5.0000%, 10/1/41 | | | 44,354 | | | |
| | | | | Freddie Mac: | | | | | | |
| | 34,305 | | | 5.0000%, 1/1/19 | | | 36,945 | | | |
| | 25,954 | | | 5.0000%, 2/1/19 | | | 27,952 | | | |
| | 35,392 | | | 5.5000%, 8/1/19 | | | 38,381 | | | |
| | 87,810 | | | 6.0000%, 1/1/38 | | | 96,745 | | | |
| | 23,022 | | | 5.5000%, 5/1/38 | | | 25,193 | | | |
| | 59,543 | | | 5.5000%, 10/1/39 | | | 65,155 | | | |
| | 50,154 | | | 4.5000%, 1/1/41 | | | 53,163 | | | |
| | 66,681 | | | 4.5000%, 5/1/41 | | | 71,261 | | | |
| | 112,091 | | | 5.0000%, 5/1/41 | | | 120,748 | | | |
| |
| |
| Total Mortgage-Backed Securities (cost $2,686,636) | | | 2,704,345 | | | |
| |
| |
| Preferred Stock – 0.1% | | | | | | |
| Diversified Financial Services – 0% | | | | | | |
| | 800 | | | Citigroup Capital XIII, 7.8750% | | | 20,848 | | | |
| Electric – Integrated – 0.1% | | | | | | |
| | 600 | | | PPL Corp., 8.7500% | | | 33,300 | | | |
| |
| |
| Total Preferred Stock (cost $50,606) | | | 54,148 | | | |
| |
| |
| U.S. Treasury Notes/Bonds – 4.0% | | | | | | |
| | | | | U.S. Treasury Notes/Bonds: | | | | | | |
| $ | 19,000 | | | 1.5000%, 6/30/16 | | | 19,649 | | | |
| | 45,000 | | | 1.0000%, 9/30/16 | | | 45,464 | | | |
| | 29,000 | | | 1.0000%, 10/31/16 | | | 29,281 | | | |
| | 20,000 | | | 0.8750%, 11/30/16 | | | 20,061 | | | |
| | 90,000 | | | 2.3750%, 5/31/18 | | | 96,511 | | | |
| | 20,000 | | | 1.7500%, 10/31/18 | | | 20,584 | | | |
| | 69,000 | | | 3.1250%, 5/15/21 | | | 77,043 | | | |
| | 570,000 | | | 2.1250%, 8/15/21 | | | 584,606 | | | |
| | 235,000 | | | 2.0000%, 11/15/21 | | | 237,680 | | | |
| | 275,000 | | | 3.7500%, 8/15/41 | | | 323,426 | | | |
| | 180,000 | | | 3.1250%, 11/15/41 | | | 188,578 | | | |
| |
| |
| Total U.S. Treasury Notes/Bonds (cost $1,592,512) | | | 1,642,883 | | | |
| |
| |
| Money Market – 2.8% | | | | | | |
| | 1,162,096 | | | Janus Cash Liquidity Fund LLC, 0%
(cost $1,162,096) | | | 1,162,096 | | | |
| |
| |
| Total Investments (total cost $40,510,096) – 99.3% | | | 40,771,935 | | | |
| |
| |
| Cash, Receivables and Other Assets, net of Liabilities – 0.7% | | | 270,454 | | | |
| |
| |
| Net Assets – 100% | | $ | 41,042,389 | | | |
| |
| |
Summary of Investments by Country – (Long Positions)
| | | | | | | | | |
| | | | | | % of Investment
| |
| Country | | Value | | | Securities | |
| |
| |
| Australia | | $ | 284,620 | | | | 0.7% | |
| Bermuda | | | 300,279 | | | | 0.7% | |
| Canada | | | 459,058 | | | | 1.1% | |
| Cayman Islands | | | 39,594 | | | | 0.1% | |
| Curacao | | | 267,775 | | | | 0.7% | |
| France | | | 1,088,124 | | | | 2.7% | |
| Ireland | | | 157,535 | | | | 0.4% | |
| Israel | | | 201,800 | | | | 0.5% | |
| Jersey | | | 81,538 | | | | 0.2% | |
| Luxembourg | | | 190,648 | | | | 0.5% | |
| Mexico | | | 130,700 | | | | 0.3% | |
| Netherlands | | | 260,150 | | | | 0.6% | |
| Norway | | | 149,378 | | | | 0.4% | |
| Panama | | | 179,520 | | | | 0.4% | |
| South Korea | | | 536,110 | | | | 1.3% | |
| Switzerland | | | 576,570 | | | | 1.4% | |
| United Kingdom | | | 2,271,184 | | | | 5.6% | |
United States†† | | | 33,597,352 | | | | 82.4% | |
| |
| |
| Total | | $ | 40,771,935 | | | | 100.0% | |
| | | |
| †† | | Includes Cash Equivalents (79.6% excluding Cash Equivalents). |
| | | | | |
| Schedule of Written Options – Calls | | Value | |
| | |
Amgen, Inc.
expires January 2012
7 contracts
exercise price $65.00 | | $ | (622) | |
Blackrock, Inc.
expires January 2012
3 contracts
exercise price $190.00 | | | (265) | |
See Notes to Schedules of Investments and Financial Statements.
60 | DECEMBER 31, 2011
Schedule of Investments (unaudited)
As of December 31, 2011
| | | | | |
| | | Value | |
| | |
| Schedule of Written Options – Calls – (continued) | |
Chevron Corp.
expires January 2012
4 contracts
exercise price $110.00 | | $ | (341) | |
Chubb Corp.
expires January 2012
7 contracts
exercise price $70.00 | | | 0 | |
ConocoPhillips
expires January 2012
6 contracts
exercise price $75.00 | | | (307) | |
Exxon Mobil Corp.
expires January 2012
5 contracts
exercise price $87.50 | | | (223) | |
Freeport-McMoRan Copper & Gold, Inc. – Class B
expires January 2012
12 contracts
exercise price $43.00 | | | (136) | |
GlaxoSmithKline PLC (ADR)
expires January 2012
10 contracts
exercise price $47.50 | | | (99) | |
Goldcorp, Inc. (U.S. Shares)
expires January 2012
10 contracts
exercise price $55.00 | | | (23) | |
Greif, Inc.
expires January 2012
10 contracts
exercise price $50.00 | | | (185) | |
International Business Machines Corp.
expires January 2012
2 contracts
exercise price $195.00 | | | (99) | |
Johnson & Johnson
expires January 2012
7 contracts
exercise price $67.50 | | | (86) | |
McKesson Corp.
expires January 2012
6 contracts
exercise price $85.00 | | | (53) | |
Medtronic, Inc.
expires January 2012
12 contracts
exercise price $39.00 | | | (509) | |
Molson Coors Brewing Co. – Class B
expires January 2012
10 contracts
exercise price $45.00 | | | (343) | |
Mosaic Co.
expires January 2012
9 contracts
exercise price $57.50 | | | (281) | |
Noble Energy, Inc.
expires January 2012
5 contracts
exercise price $105.00 | | | (169) | |
Occidental Petroleum Corp.
expires January 2012
5 contracts
exercise price $105.00 | | | (48) | |
Pall Corp.
expires January 2012
4 contracts
exercise price $60.00 | | | (206) | |
Pfizer, Inc.
expires January 2012
21 contracts
exercise price$22.50 | | | (186) | |
Schlumberger, Ltd. (U.S. Shares)
expires January 2012
7 contracts
exercise price $77.50 | | | (117) | |
Teva Pharmaceutical S.P. (ADR)
expires January 2012
11 contracts
exercise price $47.50 | | | (18) | |
Tidewater, Inc.
expires January 2012
9 contracts
exercise price $50.00 | | | (1,038) | |
Union Pacific Corp.
expires January 2012
4 contracts
exercise price $110.00 | | | (373) | |
Wal-Mart Stores, Inc.
expires January 2012
7 contracts
exercise price $62.50 | | | (41) | |
| |
| |
Total Written Options – Calls
(premiums received $4,765 ) | | $ | (5,768) | |
| |
| |
| Schedule of Written Options – Puts | | | |
Applied Materials, Inc.
expires January 2012
22 contracts
exercise price $9.00 | | $ | (41) | |
Baxter International, Inc.
expires January 2012
5 contracts
exercise price $42.50 | | | (36) | |
Becton, Dickson and Co.
expires January 2012
3 contracts
exercise price $65.00 | | | (28) | |
Blackrock, Inc.
expires January 2012
1 contracts
exercise price $120.00 | | | (3) | |
See Notes to Schedules of Investments and Financial Statements.
Janus Value Funds | 61
Perkins Value Plus Income Fund
Schedule of Investments (unaudited)
As of December 31, 2011
| | | | | |
| | | Value | |
| | |
| Schedule of Written Options – Puts – (continued) | |
BP PLC (ADR)
expires January 2012
5 contracts
exercise price $35.00 | | $ | (21) | |
Chevron Corp.
expires January 2012
2 contracts
exercise price $87.50 | | | (13) | |
Covidien PLC (U.S. Shares)
expires January 2012
5 contracts
exercise price $40.00 | | | (67) | |
Devon Energy Corp.
expires January 2012
4 contracts
exercise price $55.00 | | | (121) | |
EQT Corp.
expires January 2012
4 contracts
exercise price $45.00 | | | (66) | |
Everest RE Group, Ltd.
expires January 2012
3 contracts
exercise price $70.00 | | | (28) | |
Exxon Mobil Corp.
expires January 2012
3 contracts
exercise price $72.50 | | | (16) | |
Freeport-McMoRan Copper & Gold, Inc. – Class B
expires January 2012
6 contracts
exercise price $26.50 | | | (32) | |
General Dynamics Corp.
expires January 2012
3 contracts
exercise price $52.50 | | | (21) | |
Goldcorp, Inc. (U.S. Shares)
expires January 2012
5 contracts
exercise price $37.00 | | | (48) | |
Guess?, Inc.
expires January 2012
8 contracts
exercise price $25.00 | | | (61) | |
Hewlett-Packard Co.
expires January 2012
9 contracts
exercise price $22.50 | | | (93) | |
International Business Machines Corp.
expires January 2012
1 contracts
exercise price $155.00 | | | (15) | |
McKesson Corp.
expires January 2012
3 contracts
exercise price $67.50 | | | (52) | |
Medtronic, Inc.
expires January 2012
6 contracts
exercise price $31.00 | | | (20) | |
Microsoft Corp.
expires January 2012
15 contracts
exercise price $25.00 | | | (371) | |
Microsoft Corp.
expires January 2012
9 contracts
exercise price $22.50 | | | (27) | |
Mosaic Co.
expires January 2012
4 contracts
exercise price $40.00 | | | (48) | |
Noble Energy, Inc.
expires January 2012
2 contracts
exercise price $77.50 | | | (29) | |
Norfolk Southern Corp.
expires January 2012
3 contracts
exercise price $60.00 | | | (4) | |
Occidental Petroleum Corp.
expires January 2012
2 contracts
exercise price $77.50 | | | (47) | |
Oracle Corp.
expires January 2012
9 contracts
exercise price $22.50 | | | (68) | |
Patterson Cos., Inc.
expires January 2012
8 contracts
exercise price $26.00 | | | (108) | |
PepsiCo, Inc.
expires January 2012
3 contracts
exercise price $60.00 | | | (22) | |
Schlumberger, Ltd. (U.S. Shares)
expires January 2012
3 contracts
exercise price $55.00 | | | (41) | |
Staples, Inc.
expires January 2012
16 contracts
exercise price $12.50 | | | (119) | |
Stryker Corp.
expires January 2012
5 contracts
exercise price $43.00 | | | (58) | |
Teva Pharmaceutical S.P. (ADR)
expires January 2012
5 contracts
exercise price $35.00 | | | (40) | |
See Notes to Schedules of Investments and Financial Statements.
62 | DECEMBER 31, 2011
Schedule of Investments (unaudited)
As of December 31, 2011
| | | | | |
| | | Value | |
| | |
| Schedule of Written Options – Puts – (continued) | |
Tidewater, Inc.
expires January 2012
5 contracts
exercise price $40.00 | | $ | (33) | |
Total S.A. (ADR)
expires January 2012
5 contracts
exercise price $42.50 | | | (26) | |
Tyco International, Ltd. (U.S. Shares)
expires January 2012
5 contracts
exercise price $41.00 | | | (26) | |
Union Pacific Corp.
expires January 2012
2 contracts
exercise price $85.00 | | | (27) | |
Walgreen Co.
expires January 2012
7 contracts
exercise price $29.00 | | | (77) | |
Wells Fargo & Co.
expires January 2012
8 contracts
exercise price $21.00 | | | (29) | |
| |
| |
Total Written Options – Puts
(premiums received $4,478 ) | | $ | (1,982) | |
| |
| |
See Notes to Schedules of Investments and Financial Statements.
Janus Value Funds | 63
Statements of Assets and Liabilities
| | | | | | | | | | | | | | | | | | | | | |
As of December 31, 2011 (unaudited)
| | | | | | | | | | |
| (all numbers in thousands except net asset value per share) | | Perkins Large Cap Value Fund | | Perkins Mid Cap Value Fund | | Perkins Select Value Fund | | Perkins Small Cap Value Fund | | Perkins Value Plus Income Fund |
|
| |
| Assets: | | | | | | | | | | | | | | | | | | | | |
| Investments at cost | | $ | 128,209 | | | $ | 12,204,974 | | | $ | 53,611 | | | $ | 2,836,690 | | | $ | 40,510 | |
| Unaffiliated investments at value | | $ | 118,951 | | | $ | 11,166,474 | | | $ | 38,037 | | | $ | 2,146,085 | | | $ | 39,610 | |
| Affiliated investments at value | | | – | | | | 531,535 | | | | – | | | | 263,133 | | | | 1,162 | |
| Repurchase agreements(1) | | | 13,281 | | | | 1,182,955 | | | | 16,700 | | | | 413,408 | | | | – | |
| Cash | | | – | | | | 868 | | | | 215 | | | | 1,849 | | | | 25 | |
| Cash denominated in foreign currency(2) | | | – | | | | – | | | | – | | | | – | | | | 1 | |
| Restricted cash (Note 1) | | | – | | | | 1,500 | | | | – | | | | – | | | | – | |
| Receivables: | | | | | | | | | | | | | | | | | | | | |
| Investments sold | | | 563 | | | | 62,944 | | | | – | | | | 26,048 | | | | 148 | |
| Fund shares sold | | | 188 | | | | 12,527 | | | | 197 | | | | 2,207 | | | | 87 | |
| Dividends | | | 304 | | | | 24,516 | | | | 24 | | | | 2,290 | | | | 78 | |
| Foreign dividend tax reclaim | | | – | | | | 756 | | | | – | | | | – | | | | 4 | |
| Interest | | | – | | | | 6 | | | | – | | | | – | | | | 175 | |
| Non-interested Trustees’ deferred compensation | | | 4 | | | | 380 | | | | 2 | | | | 84 | | | | 1 | |
| Other assets | | | 3 | | | | 229 | | | | 79 | | | | 46 | | | | – | |
| Total Assets | | | 133,294 | | | | 12,984,690 | | | | 55,254 | | | | 2,855,150 | | | | 41,291 | |
| Liabilities: | | | | | | | | | | | | | | | | | | | | |
| Payables: | | | | | | | | | | | | | | | | | | | | |
| Options written, at value(3) | | | – | | | | 3,000 | | | | – | | | | – | | | | 8 | |
| Due to custodian | | | 37 | | | | – | | | | – | | | | – | | | | – | |
| Investments purchased | | | 516 | | | | 52,472 | | | | 2,679 | | | | 9,695 | | | | 179 | |
| Fund shares repurchased | | | 187 | | | | 47,692 | | | | – | | | | 25,776 | | | | 17 | |
| Dividends | | | – | | | | 2 | | | | – | | | | 43 | | | | 5 | |
| Advisory fees | | | 77 | | | | 5,594 | | | | – | | | | 1,956 | | | | 2 | |
| Fund administration fees | | | 1 | | | | 110 | | | | – | | | | 24 | | | | – | |
| Administrative services fees | | | 3 | | | | 1,690 | | | | – | | | | 300 | | | | 3 | |
| Distribution fees and shareholder servicing fees | | | 2 | | | | 649 | | | | – | | | | 89 | | | | 6 | |
| Administrative, networking and omnibus fees | | | 1 | | | | 173 | | | | – | | | | 19 | | | | 2 | |
| Non-interested Trustees’ fees and expenses | | | – | | | | 113 | | | | – | | | | 22 | | | | – | |
| Non-interested Trustees’ deferred compensation fees | | | 4 | | | | 380 | | | | 2 | | | | 84 | | | | 1 | |
| Accrued expenses and other payables | | | 13 | | | | 875 | | | | 2 | | | | 269 | | | | 26 | |
| Total Liabilities | | | 841 | | | | 112,750 | | | | 2,683 | | | | 38,277 | | | | 249 | |
| Net Assets | | $ | 132,453 | | | $ | 12,871,940 | | | $ | 52,571 | | | $ | 2,816,873 | | | $ | 41,042 | |
See footnotes at the end of the Statements.
See Notes to Financial Statements.
64 | DECEMBER 31, 2011
This page intentionally left blank. The content of this page is part of a ‘Double Page Spread’ table and appears on the previous page.
65
Statements of Assets and Liabilities (continued)
| | | | | | | | | | | | | | | | | | | | | |
As of December 31, 2011 (unaudited)
| | | | | | | | | | |
| (all numbers in thousands except net asset value per share) | | Perkins Large Cap Value Fund | | Perkins Mid Cap Value Fund | | Perkins Select Value Fund | | Perkins Small Cap Value Fund | | Perkins Value Plus Income Fund |
|
| |
| Net Assets Consist of: | | | | | | | | | | | | | | | | | | | | |
| Capital (par value and paid-in surplus)* | | $ | 128,933 | | | $ | 12,267,910 | | | $ | 51,439 | | | $ | 2,780,322 | | | $ | 40,735 | |
| Undistributed net investment income* | | | 80 | | | | 30,946 | | | | 6 | | | | 13,953 | | | | 17 | |
| Undistributed net realized gain/(loss) from investment and foreign currency transactions* | | | (582) | | | | (102,940) | | | | – | | | | 36,667 | | | | 27 | |
| Unrealized net appreciation/(depreciation) of investments, foreign currency translations and non-interested Trustees’ deferred compensation | | | 4,022 | | | | 676,024 | | | | 1,126 | | | | (14,069) | | | | 263 | |
| Total Net Assets | | $ | 132,453 | | | $ | 12,871,940 | | | $ | 52,571 | | | $ | 2,816,873 | | | $ | 41,042 | |
| Net Assets - Class A Shares | | $ | 2,547 | | | $ | 1,144,604 | | | $ | 10 | | | $ | 166,353 | | | $ | 4,629 | |
| Shares Outstanding, $0.01 Par Value (unlimited shares authorized) | | | 202 | | | | 56,702 | | | | 1 | | | | 8,183 | | | | 443 | |
| Net Asset Value Per Share(4) | | $ | 12.62 | | | $ | 20.19 | | | $ | 10.22 | | | $ | 20.33 | | | $ | 10.46 | |
| Maximum Offering Price Per Share(5) | | $ | 13.39 | | | $ | 21.42 | | | $ | 10.84 | | | $ | 21.57 | | | $ | 11.10 | |
| Net Assets - Class C Shares | | $ | 1,925 | | | $ | 210,509 | | | $ | 10 | | | $ | 24,128 | | | $ | 4,516 | |
| Shares Outstanding, $0.01 Par Value (unlimited shares authorized) | | | 154 | | | | 10,483 | | | | 1 | | | | 1,208 | | | | 432 | |
| Net Asset Value Per Share(4) | | $ | 12.52 | | | $ | 20.08 | | | $ | 10.22 | | | $ | 19.97 | | | $ | 10.46 | |
| Net Assets - Class D Shares | | $ | 15,559 | | | $ | 829,042 | | | $ | 411 | | | $ | 74,757 | | | $ | 15,845 | |
| Shares Outstanding, $0.01 Par Value (unlimited shares authorized) | | | 1,238 | | | | 41,055 | | | | 40 | | | | 3,669 | | | | 1,515 | |
| Net Asset Value Per Share | | $ | 12.56 | | | $ | 20.19 | | | $ | 10.23 | | | $ | 20.37 | | | $ | 10.46 | |
| Net Assets - Class I Shares | | $ | 109,518 | | | $ | 3,151,592 | | | $ | 51,920 | | | $ | 1,159,234 | | | $ | 7,856 | |
| Shares Outstanding, $0.01 Par Value (unlimited shares authorized) | | | 8,703 | | | | 156,158 | | | | 5,078 | | | | 56,823 | | | | 751 | |
| Net Asset Value Per Share | | $ | 12.58 | | | $ | 20.18 | | | $ | 10.22 | | | $ | 20.40 | | | $ | 10.46 | |
| Net Assets - Class L Shares | | | N/A | | | $ | 51,701 | | | | N/A | | | $ | 279,756 | | | | N/A | |
| Shares Outstanding, $0.01 Par Value (unlimited shares authorized) | | | N/A | | | | 2,540 | | | | N/A | | | | 13,513 | | | | N/A | |
| Net Asset Value Per Share | | | N/A | | | $ | 20.35 | | | | N/A | | | $ | 20.70 | | | | N/A | |
| Net Assets - Class R Shares | | | N/A | | | $ | 150,281 | | | | N/A | | | $ | 33,713 | | | | N/A | |
| Shares Outstanding, $0.01 Par Value (unlimited shares authorized) | | | N/A | | | | 7,458 | | | | N/A | | | | 1,673 | | | | N/A | |
| Net Asset Value Per Share | | | N/A | | | $ | 20.15 | | | | N/A | | | $ | 20.15 | | | | N/A | |
| Net Assets - Class S Shares | | $ | 648 | | | $ | 772,281 | | | $ | 10 | | | $ | 91,325 | | | $ | 3,758 | |
| Shares Outstanding, $0.01 Par Value (unlimited shares authorized) | | | 51 | | | | 38,295 | | | | 1 | | | | 4,502 | | | | 359 | |
| Net Asset Value Per Share | | $ | 12.59 | | | $ | 20.17 | | | $ | 10.22 | | | $ | 20.28 | | | $ | 10.46 | |
| Net Assets - Class T Shares | | $ | 2,256 | | | $ | 6,561,930 | | | $ | 210 | | | $ | 987,607 | | | $ | 4,438 | |
| Shares Outstanding, $0.01 Par Value (unlimited shares authorized) | | | 180 | | | | 324,919 | | | | 21 | | | | 48,498 | | | | 424 | |
| Net Asset Value Per Share | | $ | 12.55 | | | $ | 20.20 | | | $ | 10.22 | | | $ | 20.36 | | | $ | 10.46 | |
| | | |
| * | | See Note 5 in Notes to Financial Statements. |
| (1) | | Includes cost of $13,281,000, $1,182,955,000, $16,700,000 and $413,408,000 for Perkins Large Cap Value Fund, Perkins Mid Cap Value Fund, Perkins Select Value Fund and Perkins Small Cap Value Fund, respectively. |
| (2) | | Includes cost of $768 for Perkins Value Plus Income Fund. |
| (3) | | Includes premiums of $3,058,700 and $9,243 on written options for Perkins Mid Cap Value Fund and Perkins Value Plus Income Fund, respectively. |
| (4) | | Redemption price per share may be reduced for any applicable contingent deferred sales charge. |
| (5) | | Maximum offering price is computed at 100/94.25 of net asset value. |
| | | |
| | | |
See Notes to Financial Statements.
66 | DECEMBER 31, 2011
This page intentionally left blank. The content of this page is part of a ‘Double Page Spread’ table and appears on the previous page.
67
Statements of Operations
| | | | | | | | | | | | | | | | | | | | | | | | | |
For the six-month period ended December 31, 2011 (unaudited)
| | | | | | | | | | | | |
| (all numbers in thousands) | | Perkins Large Cap Value Fund | | Perkins Mid Cap Value Fund | | Perkins Select Value Fund(1) | | Perkins Small Cap Value Fund | | Perkins Value Plus Income Fund | | |
|
| |
| Investment Income: | | | | | | | | | | | | | | | | | | | | | | | | |
| Interest | | $ | 3 | | | $ | 319 | | | $ | 1 | | | $ | 100 | | | $ | 339 | | | | | |
| Dividends | | | 1,441 | | | | 124,797 | | | | 24 | | | | 27,073 | | | | 410 | | | | | |
| Dividends from affiliates | | | – | | | | 7,792 | | | | – | | | | 2,836 | | | | – | | | | | |
| Fee income | | | – | | | | – | | | | – | | | | – | | | | – | | | | | |
| Foreign tax withheld | | | (5) | | | | (384) | | | | – | | | | – | | | | (9) | | | | | |
| Total Investment Income | | | 1,439 | | | | 132,524 | | | | 25 | | | | 30,009 | | | | 740 | | | | | |
| Expenses: | | | | | | | | | | | | | | | | | | | | | | | | |
| Advisory fees | | | 434 | | | | 38,774 | | | | 13 | | | | 12,341 | | | | 115 | | | | | |
| Shareholder reports expense | | | 3 | | | | 1,601 | | | | 1 | | | | 305 | | | | 1 | | | | | |
| Transfer agent fees and expenses | | | 3 | | | | 285 | | | | – | | | | 48 | | | | 2 | | | | | |
| Registration fees | | | 40 | | | | 207 | | | | 13 | | | | 141 | | | | 75 | | | | | |
| Custodian fees | | | 3 | | | | 48 | | | | 1 | | | | 11 | | | | 3 | | | | | |
| Professional fees | | | 27 | | | | 84 | | | | 3 | | | | 40 | | | | 19 | | | | | |
| Non-interested Trustees’ fees and expenses | | | 1 | | | | 188 | | | | – | | | | 42 | | | | – | | | | | |
| Fund administration fees | | | 6 | | | | 664 | | | | – | | | | 148 | | | | 2 | | | | | |
| Administrative services fees - Class D Shares | | | 9 | | | | 508 | | | | – | | | | 46 | | | | 8 | | | | | |
| Administrative services fees - Class L Shares | | | N/A | | | | 70 | | | | N/A | | | | 331 | | | | N/A | | | | | |
| Administrative services fees - Class R Shares | | | N/A | | | | 194 | | | | N/A | | | | 43 | | | | N/A | | | | | |
| Administrative services fees - Class S Shares | | | 1 | | | | 975 | | | | – | | | | 118 | | | | 4 | | | | | |
| Administrative services fees - Class T Shares | | | 3 | | | | 8,578 | | | | – | | | | 1,337 | | | | 6 | | | | | |
| Distribution fees and shareholder servicing fees - Class A Shares | | | 3 | | | | 1,513 | | | | – | | | | 234 | | | | 6 | | | | | |
| Distribution fees and shareholder servicing fees - Class C Shares | | | 10 | | | | 1,087 | | | | – | | | | 128 | | | | 21 | | | | | |
| Distribution fees and shareholder servicing fees - Class R Shares | | | N/A | | | | 387 | | | | N/A | | | | 85 | | | | N/A | | | | | |
| Distribution fees and shareholder servicing fees - Class S Shares | | | 1 | | | | 975 | | | | – | | | | 118 | | | | 5 | | | | | |
| Administrative, networking and omnibus fees - Class A Shares | | | 1 | | | | 1,257 | | | | – | | | | 187 | | | | 1 | | | | | |
| Administrative, networking and omnibus fees - Class C Shares | | | 1 | | | | 151 | | | | – | | | | 30 | | | | 1 | | | | | |
| Administrative, networking and omnibus fees - Class I Shares | | | 6 | | | | 1,508 | | | | – | | | | 523 | | | | 1 | | | | | |
| Other expenses | | | 7 | | | | 294 | | | | 1 | | | | 64 | | | | 12 | | | | | |
| Non-recurring costs (Note 4) | | | N/A | | | | 1 | | | | N/A | | | | 1 | | | | N/A | | | | | |
| Costs assumed by Janus Capital Management LLC (Note 4) | | | N/A | | | | (1) | | | | N/A | | | | (1) | | | | N/A | | | | | |
| Total Expenses | | | 559 | | | | 59,348 | | | | 32 | | | | 16,320 | | | | 282 | | | | | |
| Expense and Fee Offset | | | – | | | | (17) | | | | – | | | | (3) | | | | – | | | | | |
| Net Expenses | | | 559 | | | | 59,331 | | | | 32 | | | | 16,317 | | | | 282 | | | | | |
| Less: Excess Expense Reimbursement | | | – | | | | (236) | | | | (13) | | | | (350) | | | | (87) | | | | | |
| Net Expenses after Expense Reimbursement | | | 559 | | | | 59,095 | | | | 19 | | | | 15,967 | | | | 195 | | | | | |
| Net Investment Income | | | 880 | | | | 73,429 | | | | 6 | | | | 14,042 | | | | 545 | | | | | |
| Net Realized and Unrealized Gain/(Loss) on Investments: | | | | | | | | | | | | | | | | | | | | | | | | |
| Net realized gain from investment and foreign currency transactions(2) | | | 1,723 | | | | 377,419 | | | | – | | | | 76,946(3) | | | | 130 | | | | | |
| Net realized gain from written options contracts | | | – | | | | 2,468 | | | | – | | | | – | | | | 46 | | | | | |
| Change in unrealized net appreciation/(depreciation) of investments, foreign currency translations and non-interested Trustees’ deferred compensation | | | (9,329) | | | | (1,506,353) | | | | 1,125 | | | | (336,055) | | | | (1,124) | | | | | |
| Change in unrealized net appreciation/(depreciation) of written option contracts | | | – | | | | (14,848) | | | | – | | | | – | | | | (2) | | | | | |
| Net Gain/(Loss) on Investments | | | (7,606) | | | | (1,141,314) | | | | 1,125 | | | | (259,109) | | | | (950) | | | | | |
| Net Increase/(Decrease) in Net Assets Resulting from Operations | | $ | (6,726) | | | $ | (1,067,885) | | | $ | 1,131 | | | $ | (245,067) | | | $ | (405) | | | | | |
| | | |
| (1) | | Period from December 15, 2011 (inception date) through December 31, 2011. |
| (2) | | Includes realized gain/(loss) from affiliated investment companies. See affiliates table in Notes to Schedules of Investments. |
| (3) | | Includes $178,147 of realized losses resulting from a redemption-in-kind during the six-month period ended December 31, 2011 for Perkins Small Cap Value Fund. |
| | | |
| | | |
See Notes to Financial Statements.
68 | DECEMBER 31, 2011
This page intentionally left blank. The content of this page is part of a ‘Double Page Spread’ table and appears on the previous page.
69
Statements of Changes in Net Assets
| | | | | | | | | | | | | | | | | | | | | | | | | | | | | | | | | | | | | |
| | | Perkins Large Cap
| | Perkins Mid Cap
| | | | Perkins Small Cap
| | Perkins Value Plus
|
For the six-month period ended December 31, 2011 (unaudited) and the fiscal year ended June 30, 2011
| | Value Fund | | Value Fund | | Perkins Select Value Fund | | Value Fund | | Income Fund |
| (all numbers in thousands) | | 2011 | | 2011 | | 2011 | | 2011 | | 2011(1) | | 2011 | | 2011 | | 2011 | | 2011(2) |
|
| |
| Operations: | | | | | | | | | | | | | | | | | | | | | | | | | | | | | | | | | | | | |
| Net investment income | | $ | 880 | | | $ | 1,464 | | | $ | 73,429 | | | $ | 138,373 | | | $ | 6 | | | $ | 14,042 | | | $ | 15,197 | | | $ | 545 | | | $ | 808 | |
Net realized gain from investment and foreign currency transactions(3)(4) | | | 1,723 | | | | 5,434 | | | | 379,887 | | | | 1,204,526 | | | | – | | | | 76,946 | | | | 361,248 | | | | 176 | | | | 1,352 | |
| Change in unrealized net appreciation/(depreciation) of investments, foreign currency translations and non-interested Trustees’ deferred compensation | | | (9,329) | | | | 14,292 | | | | (1,521,201) | | | | 1,630,190 | | | | 1,125 | | | | (336,055) | | | | 239,642 | | | | (1,126) | | | | 1,388 | |
| Net Increase/(Decrease) in Net Assets Resulting from Operations | | | (6,726) | | | | 21,190 | | | | (1,067,885) | | | | 2,973,089 | | | | 1,131 | | | | (245,067) | | | | 616,087 | | | | (405) | | | | 3,548 | |
| Dividends and Distributions to Shareholders: | | | | | | | | | | | | | | | | | | | | | | | | | | | | | | | | | | | | |
| Net Investment Income* | | | | | | | | | | | | | | | | | | | | | | | | | | | | | | | | | | | | |
| Class A Shares | | | (28) | | | | (2) | | | | (6,645) | | | | (7,649) | | | | – | | | | (135) | | | | (825) | | | | (82) | | | | (92) | |
| Class C Shares | | | – | | | | (4) | | | | – | | | | (42) | | | | – | | | | – | | | | (20) | | | | (56) | | | | (60) | |
| Class D Shares | | | (192) | | | | (42) | | | | (7,689) | | | | (7,218) | | | | – | | | | (258) | | | | (324) | | | | (247) | | | | (199) | |
| Class I Shares | | | (1,399) | | | | (822) | | | | (30,539) | | | | (25,831) | | | | – | | | | (5,171) | | | | (5,252) | | | | (143) | | | | (151) | |
| Class L Shares | | | N/A | | | | N/A | | | | (538) | | | | (566) | | | | N/A | | | | (1,368) | | | | (2,079) | | | | N/A | | | | N/A | |
| Class R Shares | | | N/A | | | | N/A | | | | (423) | | | | (569) | | | | N/A | | | | – | | | | (95) | | | | N/A | | | | N/A | |
| Class S Shares | | | (5) | | | | (4) | | | | (4,413) | | | | (4,198) | | | | – | | | | (53) | | | | (266) | | | | (59) | | | | (74) | |
| Class T Shares | | | (25) | | | | (9) | | | | (52,212) | | | | (54,317) | | | | – | | | | (1,998) | | | | (4,598) | | | | (79) | | | | (94) | |
| Net Realized Gain/(Loss) from Investment Transactions* | | | | | | | | | | | | | | | | | | | | | | | | | | | | | | | | | | | | |
| Class A Shares | | | (133) | | | | (20) | | | | (85,970) | | | | – | | | | – | | | | (20,201) | | | | (4,904) | | | | (169) | | | | (15) | |
| Class C Shares | | | (93) | | | | (47) | | | | (15,894) | | | | – | | | | – | | | | (2,976) | | | | (742) | | | | (154) | | | | (15) | |
| Class D Shares | | | (823) | | | | (100) | | | | (61,779) | | | | – | | | | – | | | | (8,954) | | | | (2,118) | | | | (523) | | | | (27) | |
| Class I Shares | | | (5,521) | | | | (2,000) | | | | (236,480) | | | | – | | | | – | | | | (143,900) | | | | (27,280) | | | | (267) | | | | (22) | |
| Class L Shares | | | N/A | | | | N/A | | | | (4,013) | | | | – | | | | N/A | | | | (33,189) | | | | (11,495) | | | | N/A | | | | N/A | |
| Class R Shares | | | N/A | | | | N/A | | | | (11,285) | | | | – | | | | N/A | | | | (4,083) | | | | (698) | | | | N/A | | | | N/A | |
| Class S Shares | | | (33) | | | | (16) | | | | (58,382) | | | | – | | | | – | | | | (10,947) | | | | (2,120) | | | | (128) | | | | (15) | |
| Class T Shares | | | (115) | | | | (24) | | | | (493,500) | | | | – | | | | – | | | | (119,912) | | | | (31,971) | | | | (151) | | | | (15) | |
| Net Decrease from Dividends and Distributions | | | (8,367) | | | | (3,090) | | | | (1,069,762) | | | | (100,390) | | | | – | | | | (353,145) | | | | (94,787) | | | | (2,058) | | | | (779) | |
See footnotes at the end of the Statements.
See Notes to Financial Statements.
70 | DECEMBER 31, 2011
This page intentionally left blank. The content of this page is part of a ‘Double Page Spread’ table and appears on the previous page.
71
Statements of Changes in Net Assets (continued)
| | | | | | | | | | | | | | | | | | | | | | | | | | | | | | | | | | | | | |
| | | Perkins Large Cap
| | Perkins Mid Cap
| | | | Perkins Small Cap
| | Perkins Value Plus
|
For the six-month period ended December 31, 2011 (unaudited) and the fiscal year ended June 30, 2011
| | Value Fund | | Value Fund | | Perkins Select Value Fund | | Value Fund | | Income Fund |
| (all numbers in thousands) | | 2011 | | 2011 | | 2011 | | 2011 | | 2011(1) | | 2011 | | 2011 | | 2011 | | 2011(2) |
|
| |
| Capital Share Transactions: | | | | | | | | | | | | | | | | | | | | | | | | | | | | | | | | | | | | |
| Shares Sold | | | | | | | | | | | | | | | | | | | | | | | | | | | | | | | | | | | | |
| Class A Shares | | | 802 | | | | 1,727 | | | | 148,432 | | | | 446,748 | | | | 10 | | | | 31,757 | | | | 173,179 | | | | 274 | | | | 4,354 | |
| Class C Shares | | | 454 | | | | 1,913 | | | | 20,730 | | | | 74,751 | | | | 10 | | | | 1,372 | | | | 5,291 | | | | 501 | | | | 3,741 | |
| Class D Shares | | | 4,788 | | | | 14,590 | | | | 17,129 | | | | 69,912 | | | | 407 | | | | 2,206 | | | | 9,111 | | | | 4,962 | | | | 12,476 | |
| Class I Shares | | | 10,891 | | | | 33,001 | | | | 482,006 | | | | 1,268,213 | | | | 50,793 | | | | 168,649 | | | | 927,157 | | | | 306 | | | | 7,470 | |
| Class L Shares | | | N/A | | | | N/A | | | | 2,357 | | | | 10,698 | | | | N/A | | | | 9,333 | | | | 47,140 | | | | N/A | | | | N/A | |
| Class R Shares | | | N/A | | | | N/A | | | | 26,740 | | | | 81,716 | | | | N/A | | | | 4,936 | | | | 33,179 | | | | N/A | | | | N/A | |
| Class S Shares | | | – | | | | 15 | | | | 131,629 | | | | 363,240 | | | | 10 | | | | 11,820 | | | | 63,070 | | | | – | | | | 3,333 | |
| Class T Shares | | | 499 | | | | 1,691 | | | | 507,313 | | | | 1,629,048 | | | | 210 | | | | 55,279 | | | | 400,700 | | | | 335 | | | | 4,617 | |
| Reinvested Dividends and Distributions | | | | | | | | | | | | | | | | | | | | | | | | | | | | | | | | | | | | |
| Class A Shares | | | 127 | | | | 21 | | | | 79,405 | | | | 6,592 | | | | – | | | | 14,050 | | | | 4,373 | | | | 251 | | | | 108 | |
| Class C Shares | | | 71 | | | | 40 | | | | 11,148 | | | | 29 | | | | – | | | | 2,259 | | | | 577 | | | | 202 | | | | 75 | |
| Class D Shares | | | 1,007 | | | | 141 | | | | 67,869 | | | | 7,020 | | | | – | | | | 9,022 | | | | 2,393 | | | | 687 | | | | 201 | |
| Class I Shares | | | 6,768 | | | | 2,704 | | | | 229,324 | | | | 20,679 | | | | – | | | | 115,330 | | | | 22,565 | | | | 408 | | | | 171 | |
| Class L Shares | | | N/A | | | | N/A | | | | 4,188 | | | | 515 | | | | N/A | | | | 33,165 | | | | 13,145 | | | | N/A | | | | N/A | |
| Class R Shares | | | N/A | | | | N/A | | | | 10,523 | | | | 496 | | | | N/A | | | | 3,469 | | | | 609 | | | | N/A | | | | N/A | |
| Class S Shares | | | 38 | | | | 20 | | | | 62,682 | | | | 4,187 | | | | – | | | | 10,999 | | | | 2,386 | | | | 187 | | | | 89 | |
| Class T Shares | | | 140 | | | | 33 | | | | 526,578 | | | | 52,353 | | | | – | | | | 119,251 | | | | 35,829 | | | | 229 | | | | 109 | |
Shares Repurchased(5) | | | | | | | | | | | | | | | | | | | | | | | | | | | | | | | | | | | | |
| Class A Shares | | | (364) | | | | (1,324) | | | | (248,047) | | | | (357,161) | | | | – | | | | (64,999) | | | | (67,765) | | | | (453) | | | | (2) | |
| Class C Shares | | | (1,079) | | | | (831) | | | | (29,034) | | | | (42,925) | | | | – | | | | (3,671) | | | | (8,004) | | | | (49) | | | | (76) | |
| Class D Shares | | | (3,501) | | | | (3,008) | | | | (56,413) | | | | (126,143) | | | | – | | | | (7,460) | | | | (17,688) | | | | (1,600) | | | | (677) | |
| Class I Shares | | | (8,076) | | | | (8,971) | | | | (438,720) | | | | (710,167) | | | | – | | | | (201,229) | | | | (334,568) | | | | (229) | | | | (350) | |
| Class L Shares | | | N/A | | | | N/A | | | | (9,299) | | | | (24,114) | | | | N/A | | | | (30,255) | | | | (475,827) | | | | N/A | | | | N/A | |
| Class R Shares | | | N/A | | | | N/A | | | | (33,125) | | | | (44,791) | | | | N/A | | | | (6,147) | | | | (22,099) | | | | N/A | | | | N/A | |
| Class S Shares | | | – | | | | (60) | | | | (131,941) | | | | (253,868) | | | | – | | | | (19,334) | | | | (22,837) | | | | – | | | | – | |
| Class T Shares | | | (338) | | | | (309) | | | | (1,160,989) | | | | (2,325,371) | | | | – | | | | (228,810) | | | | (393,596) | | | | (820) | | | | (94) | |
| Net Increase from Capital Share Transactions | | | 12,227 | | | | 41,393 | | | | 220,485 | | | | 151,657 | | | | 51,440 | | | | 30,992 | | | | 398,320 | | | | 5,191 | | | | 35,545 | |
| Net Increase/(Decrease) in Net Assets | | | (2,866) | | | | 59,493 | | | | (1,917,162) | | | | 3,024,356 | | | | 52,571 | | | | (567,220) | | | | 919,620 | | | | 2,728 | | | | 38,314 | |
| Net Assets: | | | | | | | | | | | | | | | | | | | | | | | | | | | | | | | | | | | | |
| Beginning of period | | | 135,319 | | | | 75,826 | | | | 14,789,102 | | | | 11,764,746 | | | | – | | | | 3,384,093 | | | | 2,464,473 | | | | 38,314 | | | | – | |
| End of period | | $ | 132,453 | | | $ | 135,319 | | | $ | 12,871,940 | | | $ | 14,789,102 | | | $ | 52,571 | | | $ | 2,816,873 | | | $ | 3,384,093 | | | $ | 41,042 | | | $ | 38,314 | |
| | | | | | | | | | | | | | | | | | | | | | | | | | | | | | | | | | | | | |
| Undistributed Net Investment Income* | | $ | 80 | | | $ | 849 | | | $ | 30,946 | | | $ | 59,976 | | | $ | 6 | | | $ | 13,953 | | | $ | 8,895 | | | $ | 17 | | | $ | 138 | |
| | | |
| * | | See Note 5 in Notes to Financial Statements. |
| (1) | | Period from December 15, 2011 (inception date) through December 31, 2011. |
| (2) | | Period from July 30, 2010 (inception date) through June 30, 2011. |
| (3) | | Certain prior year amounts have been reclassified to conform with current year presentation. |
| (4) | | Includes realized gain/(loss) from affiliated investment companies. See affiliates table in Notes to Schedules of Investments. |
| (5) | | During the six-month period ended December 31, 2011, Perkins Small Cap Value Fund disbursed to a redeeming shareholder portfolio securities and cash valued at $15,940,516 and $2,270,372, respectively, at the date of redemption. |
| | | |
| | | |
See Notes to Financial Statements.
72 | DECEMBER 31, 2011
This page intentionally left blank. The content of this page is part of a ‘Double Page Spread’ table and appears on the previous page.
73
Financial Highlights
Class A Shares
| | | | | | | | | | | | | | | | | | | |
For a share outstanding during the six-month period ended December 31, 2011
| | | | | | | | | | |
(unaudited), the fiscal year ended June 30, 2011, the eleven-month fiscal period ended
| | Perkins Large Cap Value Fund | | |
| June 30, 2010 and the fiscal period ended July 31, 2009 | | 2011 | | 2011 | | 2010(1) | | 2009(2) | | |
| |
| Net Asset Value, Beginning of Period | | | $14.21 | | | | $11.56 | | | | $11.14 | | | | $10.00 | | | |
| Income from Investment Operations: | | | | | | | | | | | | | | | | | | |
| Net investment income/(loss) | | | .04 | | | | .13 | | | | .03 | | | | .05 | | | |
| Net gain/(loss) on investments (both realized and unrealized) | | | (.81) | | | | 2.87 | | | | .44 | | | | 1.11 | | | |
| Total from Investment Operations | | | (.77) | | | | 3.00 | | | | .47 | | | | 1.16 | | | |
| Less Distributions: | | | | | | | | | | | | | | | | | | |
| Dividends (from net investment income)* | | | (.14) | | | | (.03) | | | | (.03) | | | | (.02) | | | |
| Distributions (from capital gains)* | | | (.68) | | | | (.32) | | | | (.02) | | | | – | | | |
| Total Distributions | | | (.82) | | | | (.35) | | | | (.05) | | | | (.02) | | | |
| Net Asset Value, End of Period | | | $12.62 | | | | $14.21 | | | | $11.56 | | | | $11.14 | | | |
| Total Return** | | | (5.40)% | | | | 26.21% | | | | 4.20% | | | | 11.64% | | | |
| Net Assets, End of Period (in thousands) | | | $2,547 | | | | $2,265 | | | | $1,654 | | | | $718 | | | |
| Average Net Assets for the Period (in thousands) | | | $2,293 | | | | $1,237 | | | | $1,514 | | | | $530 | | | |
Ratio of Gross Expenses to Average Net Assets***(3) | | | 1.13% | | | | 1.18% | | | | 1.29% | | | | 1.23% | | | |
Ratio of Net Expenses to Average Net Assets***(3) | | | 1.13% | | | | 1.18% | | | | 1.29% | | | | 1.23% | | | |
| Ratio of Net Investment Income to Average Net Assets*** | | | 1.12% | | | | 1.40% | | | | 0.48% | | | | 1.19% | | | |
| Portfolio Turnover Rate*** | | | 47% | | | | 43% | | | | 35% | | | | 57% | | | |
Class A Shares
| | | | | | | | | | | | | | | | | | | |
For a share outstanding during the six-month period ended December 31,
| | | | | | | | | | |
2011 (unaudited), the fiscal year ended June 30, 2011, the eight-month fiscal
| | Perkins Mid Cap Value Fund | | |
| period ended June 30, 2010 and the fiscal period ended October 31, 2009 | | 2011 | | 2011 | | 2010(4) | | 2009(5) | | |
| |
| Net Asset Value, Beginning of Period | | | $23.66 | | | | $19.04 | | | | $18.66 | | | | $16.07 | | | |
| Income from Investment Operations: | | | | | | | | | | | | | | | | | | |
| Net investment income/(loss) | | | .11 | | | | .19 | | | | .04 | | | | (.01) | | | |
| Net gain/(loss) on investments (both realized and unrealized) | | | (1.82) | | | | 4.57 | | | | .36 | | | | 2.60 | | | |
| Total from Investment Operations | | | (1.71) | | | | 4.76 | | | | .40 | | | | 2.59 | | | |
| Less Distributions: | | | | | | | | | | | | | | | | | | |
| Dividends (from net investment income)* | | | (.13) | | | | (.14) | | | | (.02) | | | | – | | | |
| Distributions (from capital gains)* | | | (1.63) | | | | – | | | | – | | | | – | | | |
| Total Distributions | | | (1.76) | | | | (.14) | | | | (.02) | | | | – | | | |
| Net Asset Value, End of Period | | | $20.19 | | | | $23.66 | | | | $19.04 | | | | $18.66 | | | |
| Total Return** | | | (7.24)% | | | | 25.04% | | | | 2.17% | | | | 16.12% | | | |
| Net Assets, End of Period (in thousands) | | | $1,144,604 | | | | $1,358,791 | | | | $1,011,334 | | | | $781,960 | | | |
| Average Net Assets for the Period (in thousands) | | | $1,204,096 | | | | $1,228,239 | | | | $966,540 | | | | $736,402 | | | |
Ratio of Gross Expenses to Average Net Assets***(3) | | | 1.06% | | | | 1.17% | | | | 1.17% | | | | 1.22% | | | |
Ratio of Net Expenses to Average Net Assets***(3) | | | 1.06% | | | | 1.17% | | | | 1.17% | | | | 1.22% | | | |
| Ratio of Net Investment Income to Average Net Assets*** | | | 0.93% | | | | 0.82% | | | | 0.33% | | | | 0.35% | | | |
| Portfolio Turnover Rate*** | | | 56% | | | | 66% | | | | 66% | | | | 88% | | | |
| | | |
| * | | See Note 5 in Notes to Financial Statements. |
| ** | | Total return not annualized for periods of less than one full year. |
| *** | | Annualized for periods of less than one full year. |
| (1) | | Period from August 1, 2009 through June 30, 2010. The Fund changed its fiscal year end from July 31 to June 30. |
| (2) | | Period from December 31, 2008 (inception date) through July 31, 2009. |
| (3) | | See Note 6 in Notes to Financial Statements. |
| (4) | | Period from November 1, 2009 through June 30, 2010. The Fund changed its fiscal year end from October 31 to June 30. |
| (5) | | Period from July 6, 2009 (inception date) through October 31, 2009. |
See Notes to Financial Statements.
74 | DECEMBER 31, 2011
Class A Shares
| | | | | | | | | | | | | | | | | | | | | | | |
For a share outstanding during the six-month period
| | | | | | | | | | | | |
ended December 31, 2011 (unaudited), the fiscal year
| | | | | | | | | | | | |
ended June 30, 2011, the eight-month fiscal period
| | | | | | | | | | | | |
ended June 30, 2010 and the fiscal period ended
| | Perkins Select Value Fund | | Perkins Small Cap Value Fund | | |
| October 31, 2009 | | 2011(1) | | 2011 | | 2011 | | 2010(2) | | 2009(3) | | |
| |
| Net Asset Value, Beginning of Period | | | $10.00 | | | | $24.89 | | | | $20.92 | | | | $19.48 | | | | $16.47 | | | |
| Income from Investment Operations: | | | | | | | | | | | | | | | | | | | | | | |
| Net investment income/(loss) | | | – | | | | .07 | | | | – | | | | .09 | | | | (.07) | | | |
| Net gain/(loss) on investments (both realized and unrealized) | | | .22 | | | | (1.85) | | | | 4.68 | | | | 1.35 | | | | 3.08 | | | |
| Total from Investment Operations | | | .22 | | | | (1.78) | | | | 4.68 | | | | 1.44 | | | | 3.01 | | | |
| Less Distributions: | | | | | | | | | | | | | | | | | | | | | | |
| Dividends (from net investment income)* | | | – | | | | (.02) | | | | (.10) | | | | – | | | | – | | | |
| Distributions (from capital gains)* | | | – | | | | (2.76) | | | | (.61) | | | | – | | | | – | | | |
| Total Distributions | | | – | | | | (2.78) | | | | (.71) | | | | – | | | | – | | | |
| Net Asset Value, End of Period | | | $10.22 | | | | $20.33 | | | | $24.89 | | | | $20.92 | | | | $19.48 | | | |
| Total Return** | | | 2.20% | | | | (7.23)% | | | | 22.53% | | | | 7.39% | | | | 18.28% | | | |
| Net Assets, End of Period (in thousands) | | | $10 | | | | $166,353 | | | | $223,229 | | | | $86,403 | | | | $20,039 | | | |
| Average Net Assets for the Period (in thousands) | | | $10 | | | | $185,873 | | | | $181,662 | | | | $52,788 | | | | $13,537 | | | |
Ratio of Gross Expenses to Average Net Assets***(4) | | | 1.21% | | | | 1.32% | | | | 1.25% | | | | 1.21% | | | | 0.97% | | | |
Ratio of Net Expenses to Average Net Assets***(4) | | | 1.21% | | | | 1.32% | | | | 1.25% | | | | 1.21% | | | | 0.96% | | | |
| Ratio of Net Investment Income/(Loss) to Average Net Assets*** | | | (0.18)% | | | | 0.68% | | | | 0.23% | | | | 0.06% | | | | 0.62% | | | |
| Portfolio Turnover Rate*** | | | 0% | | | | 62% | | | | 64% | | | | 59% | | | | 85% | | | |
Class A Shares
| | | | | | | | | | | |
| | | Perkins Value Plus
| | |
For a share outstanding during the six-month period ended December 31, 2011
| | Income Fund | | |
| (unaudited) and the fiscal period ended June 30, 2011 | | 2011 | | 2011(5) | | |
| |
| Net Asset Value, Beginning of Period | | | $11.15 | | | | $10.00 | | | |
| Income from Investment Operations: | | | | | | | | | | |
| Net investment income/(loss) | | | .15 | | | | .29 | | | |
| Net gain/(loss) on investments (both realized and unrealized) | | | (.29) | | | | 1.14 | | | |
| Total from Investment Operations | | | (.14) | | | | 1.43 | | | |
| Less Distributions: | | | | | | | | | | |
| Dividends (from net investment income)* | | | (.18) | | | | (.24) | | | |
| Distributions (from capital gains)* | | | (.37) | | | | (.04) | | | |
| Total Distributions | | | (.55) | | | | (.28) | | | |
| Net Asset Value, End of Period | | | $10.46 | | | | $11.15 | | | |
| Total Return** | | | (1.18)% | | | | 14.49% | | | |
| Net Assets, End of Period (in thousands) | | | $4,629 | | | | $4,861 | | | |
| Average Net Assets for the Period (in thousands) | | | $4,780 | | | | $3,951 | | | |
Ratio of Gross Expenses to Average Net Assets***(4) | | | 1.01% | | | | 0.94% | | | |
Ratio of Net Expenses to Average Net Assets***(4) | | | 1.01% | | | | 0.94% | | | |
| Ratio of Net Investment Income/(Loss) to Average Net Assets*** | | | 2.83% | | | | 3.05% | | | |
| Portfolio Turnover Rate*** | | | 107% | | | | 93% | | | |
| | | |
| * | | See Note 5 in Notes to Financial Statements. |
| ** | | Total return not annualized for periods of less than one full year. |
| *** | | Annualized for periods of less than one full year. |
| (1) | | Period from December 15, 2011 (inception date) through December 31, 2011. |
| (2) | | Period from November 1, 2009 through June 30, 2010. The Fund changed its fiscal year end from October 31 to June 30. |
| (3) | | Period from July 6, 2009 (inception date) through October 31, 2009. |
| (4) | | See Note 6 in Notes to Financial Statements. |
| (5) | | Period from July 30, 2010 (inception date) through June 30, 2011. |
See Notes to Financial Statements.
Janus Value Funds | 75
Financial Highlights (continued)
Class C Shares
| | | | | | | | | | | | | | | | | | | |
For a share outstanding during the six-month period ended December 31, 2011
| | | | | | | | | | |
(unaudited), the fiscal year ended June 30, 2011, the eleven-month fiscal period
| | Perkins Large Cap Value Fund | | |
| ended June 30, 2010 and the fiscal period ended July 31, 2009 | | 2011 | | 2011 | | 2010(1) | | 2009(2) | | |
| |
| Net Asset Value, Beginning of Period | | | $14.00 | | | | $11.48 | | | | $11.11 | | | | $10.00 | | | |
| Income from Investment Operations: | | | | | | | | | | | | | | | | | | |
| Net investment income/(loss) | | | .02 | | | | .05 | | | | (.03) | | | | .02 | | | |
| Net gain/(loss) on investments (both realized and unrealized) | | | (.82) | | | | 2.82 | | | | .42 | | | | 1.09 | | | |
| Total from Investment Operations | | | (.80) | | | | 2.87 | | | | .39 | | | | 1.11 | | | |
| Less Distributions: | | | | | | | | | | | | | | | | | | |
| Dividends (from net investment income)* | | | – | | | | (.03) | | | | – | | | | – | | | |
| Distributions (from capital gains)* | | | (.68) | | | | (.32) | | | | (.02) | | | | – | | | |
| Total Distributions | | | (.68) | | | | (.35) | | | | (.02) | | | | – | | | |
| Net Asset Value, End of Period | | | $12.52 | | | | $14.00 | | | | $11.48 | | | | $11.11 | | | |
| Total Return** | | | (5.71)% | | | | 25.21% | | | | 3.54% | | | | 11.10% | | | |
| Net Assets, End of Period (in thousands) | | | $1,925 | | | | $2,797 | | | | $1,336 | | | | $556 | | | |
| Average Net Assets for the Period (in thousands) | | | $1,970 | | | | $2,070 | | | | $929 | | | | $484 | | | |
Ratio of Gross Expenses to Average Net Assets***(3) | | | 1.96% | | | | 1.96% | | | | 2.04% | | | | 1.98% | | | |
Ratio of Net Expenses to Average Net Assets***(3) | | | 1.96% | | | | 1.96% | | | | 2.04% | | | | 1.97% | | | |
| Ratio of Net Investment Income/(Loss) to Average Net Assets*** | | | 0.24% | | | | 0.31% | | | | (0.23)% | | | | 0.48% | | | |
| Portfolio Turnover Rate*** | | | 47% | | | | 43% | | | | 35% | | | | 57% | | | |
Class C Shares
| | | | | | | | | | | | | | | | | | | |
For a share outstanding during the six-month period ended December 31, 2011
| | | | | | | | | | |
(unaudited), the fiscal year ended June 30, 2011, the eight-month fiscal period
| | Perkins Mid Cap Value Fund | | |
| ended June 30, 2010 and the fiscal period ended October 31, 2009 | | 2011 | | 2011 | | 2010(4) | | 2009(5) | | |
| |
| Net Asset Value, Beginning of Period | | | $23.50 | | | | $18.93 | | | | $18.62 | | | | $16.07 | | | |
| Income from Investment Operations: | | | | | | | | | | | | | | | | | | |
| Net investment income/(loss) | | | .02 | | | | .04 | | | | (.04) | | | | (.05) | | | |
| Net gain/(loss) on investments (both realized and unrealized) | | | (1.81) | | | | 4.53 | | | | .35 | | | | 2.60 | | | |
| Total from Investment Operations | | | (1.79) | | | | 4.57 | | | | .31 | | | | 2.55 | | | |
| Less Distributions: | | | | | | | | | | | | | | | | | | |
| Dividends (from net investment income)* | | | – | | | | –(6) | | | | – | | | | – | | | |
| Distributions (from capital gains)* | | | (1.63) | | | | – | | | | – | | | | – | | | |
| Total Distributions | | | (1.63) | | | | – | | | | – | | | | – | | | |
| Net Asset Value, End of Period | | | $20.08 | | | | $23.50 | | | | $18.93 | | | | $18.62 | | | |
| Total Return** | | | (7.61)% | | | | 24.17% | | | | 1.66% | | | | 15.87% | | | |
| Net Assets, End of Period (in thousands) | | | $210,509 | | | | $242,324 | | | | $168,093 | | | | $121,166 | | | |
| Average Net Assets for the Period (in thousands) | | | $216,308 | | | | $211,474 | | | | $155,180 | | | | $107,362 | | | |
Ratio of Gross Expenses to Average Net Assets***(3) | | | 1.77% | | | | 1.87% | | | | 1.91% | | | | 1.97% | | | |
Ratio of Net Expenses to Average Net Assets***(3) | | | 1.77% | | | | 1.87% | | | | 1.91% | | | | 1.97% | | | |
| Ratio of Net Investment Income/(Loss) to Average Net Assets*** | | | 0.22% | | | | 0.11% | | | | (0.41)% | | | | (0.41)% | | | |
| Portfolio Turnover Rate*** | | | 56% | | | | 66% | | | | 66% | | | | 88% | | | |
| | | |
| * | | See Note 5 in Notes to Financial Statements. |
| ** | | Total return not annualized for periods of less than one full year. |
| *** | | Annualized for periods of less than one full year. |
| (1) | | Period from August 1, 2009 through June 30, 2010. The Fund changed its fiscal year end from July 31 to June 30. |
| (2) | | Period from December 31, 2008 (inception date) through July 31, 2009. |
| (3) | | See Note 6 in Notes to Financial Statements. |
| (4) | | Period from November 1, 2009 through June 30, 2010. The Fund changed its fiscal year end from October 31 to June 30. |
| (5) | | Period from July 6, 2009 (inception date) through October 31, 2009. |
| (6) | | Dividends (from net investment income) aggregated less than $.01 on a per share basis. |
See Notes to Financial Statements.
76 | DECEMBER 31, 2011
Class C Shares
| | | | | | | | | | | | | | | | | | | | | | | |
For a share outstanding during the six-month period ended
| | | | | | | | | | | | |
December 31, 2011 (unaudited), the fiscal year ended
| | | | | | | | | | | | |
June 30, 2011, the eight-month fiscal period ended
| | | | | | | | | | | | |
June 30, 2010 and the fiscal period ended October 31,
| | Perkins Select Value Fund | | Perkins Small Cap Value Fund | | |
| 2009 | | 2011(1) | | 2011 | | 2011 | | 2010(2) | | 2009(3) | | |
| |
| Net Asset Value, Beginning of Period | | | $10.00 | | | | $24.57 | | | | $20.75 | | | | $19.43 | | | | $16.47 | | | |
| Income from Investment Operations: | | | | | | | | | | | | | | | | | | | | | | |
| Net investment income/(loss) | | | – | | | | – | | | | (.18) | | | | .05 | | | | (.10) | | | |
| Net gain/(loss) on investments (both realized and unrealized) | | | .22 | | | | (1.84) | �� | | | 4.63 | | | | 1.27 | | | | 3.06 | | | |
| Total from Investment Operations | | | .22 | | | | (1.84) | | | | 4.45 | | | | 1.32 | | | | 2.96 | | | |
| Less Distributions: | | | | | | | | | | | | | | | | | | | | | | |
| Dividends (from net investment income)* | | | – | | | | – | | | | (.02) | | | | – | | | | – | | | |
| Distributions (from capital gains)* | | | – | | | | (2.76) | | | | (.61) | | | | – | | | | – | | | |
| Total Distributions | | | – | | | | (2.76) | | | | (.63) | | | | – | | | | – | | | |
| Net Asset Value, End of Period | | | $10.22 | | | | $19.97 | | | | $24.57 | | | | $20.75 | | | | $19.43 | | | |
| Total Return** | | | 2.20% | | | | (7.55)% | | | | 21.55% | | | | 6.79% | | | | 17.97% | | | |
| Net Assets, End of Period (in thousands) | | | $10 | | | | $24,128 | | | | $29,444 | | | | $26,768 | | | | $6,196 | | | |
| Average Net Assets for the Period (in thousands) | | | $10 | | | | $25,484 | | | | $29,169 | | | | $16,540 | | | | $3,739 | | | |
Ratio of Gross Expenses to Average Net Assets***(4) | | | 1.95% | | | | 2.07% | | | | 2.05% | | | | 1.96% | | | | 1.95% | | | |
Ratio of Net Expenses to Average Net Assets***(4) | | | 1.95% | | | | 2.07% | | | | 2.05% | | | | 1.96% | | | | 1.95% | | | |
| Ratio of Net Investment Income/(Loss) to Average Net Assets*** | | | (0.92)% | | | | (0.06)% | | | | (0.52)% | | | | (0.69)% | | | | (0.39)% | | | |
| Portfolio Turnover Rate*** | | | 0% | | | | 62% | | | | 64% | | | | 59% | | | | 85% | | | |
Class C Shares
| | | | | | | | | | | |
| | | Perkins Value Plus
| | |
For a share outstanding during the six-month period ended December 31, 2011
| | Income Fund | | |
| (unaudited) and the fiscal period ended June 30, 2011 | | 2011 | | 2011(5) | | |
| |
| Net Asset Value, Beginning of Period | | | $11.15 | | | | $10.00 | | | |
| Income from Investment Operations: | | | | | | | | | | |
| Net investment income/(loss) | | | .11 | | | | .22 | | | |
| Net gain/(loss) on investments (both realized and unrealized) | | | (.29) | | | | 1.14 | | | |
| Total from Investment Operations | | | (.18) | | | | 1.36 | | | |
| Less Distributions: | | | | | | | | | | |
| Dividends (from net investment income)* | | | (.14) | | | | (.17) | | | |
| Distributions (from capital gains)* | | | (.37) | | | | (.04) | | | |
| Total Distributions | | | (.51) | | | | (.21) | | | |
| Net Asset Value, End of Period | | | $10.46 | | | | $11.15 | | | |
| Total Return** | | | (1.56)% | | | | 13.74% | | | |
| Net Assets, End of Period (in thousands) | | | $4,516 | | | | $4,128 | | | |
| Average Net Assets for the Period (in thousands) | | | $4,119 | | | | $3,701 | | | |
Ratio of Gross Expenses to Average Net Assets***(4) | | | 1.76% | | | | 1.69% | | | |
Ratio of Net Expenses to Average Net Assets***(4) | | | 1.76% | | | | 1.69% | | | |
| Ratio of Net Investment Income/(Loss) to Average Net Assets*** | | | 2.10% | | | | 2.27% | | | |
| Portfolio Turnover Rate*** | | | 107% | | | | 93% | | | |
| | | |
| * | | See Note 5 in Notes to Financial Statements. |
| ** | | Total return not annualized for periods of less than one full year. |
| *** | | Annualized for periods of less than one full year. |
| (1) | | Period from December 15, 2011 (inception date) through December 31, 2011. |
| (2) | | Period from November 1, 2009 through June 30, 2010. The Fund changed its fiscal year end from October 31 to June 30. |
| (3) | | Period from July 6, 2009 (inception date) through October 31, 2009. |
| (4) | | See Note 6 in Notes to Financial Statements. |
| (5) | | Period from July 30, 2010 (inception date) through June 30, 2011. |
See Notes to Financial Statements.
Janus Value Funds | 77
Financial Highlights (continued)
Class D Shares
| | | | | | | | | | | | | | | |
For a share outstanding during the six-month period ended December 31, 2011
| | Perkins Large Cap Value Fund | | |
| (unaudited) and each fiscal year or period ended June 30 | | 2011 | | 2011 | | 2010(1) | | |
| |
| Net Asset Value, Beginning of Period | | | $14.15 | | | | $11.58 | | | | $12.15 | | | |
| Income from Investment Operations: | | | | | | | | | | | | | | |
| Net investment income | | | .07 | | | | .18 | | | | .02 | | | |
| Net gain/(loss) on investments (both realized and unrealized) | | | (.82) | | | | 2.85 | | | | (.59) | | | |
| Total from Investment Operations | | | (.75) | | | | 3.03 | | | | (.57) | | | |
| Less Distributions: | | | | | | | | | | | | | | |
| Dividends (from net investment income)* | | | (.16) | | | | (.14) | | | | – | | | |
| Distributions (from capital gains)* | | | (.68) | | | | (.32) | | | | – | | | |
| Total Distributions | | | (.84) | | | | (.46) | | | | – | | | |
| Net Asset Value, End of Period | | | $12.56 | | | | $14.15 | | | | $11.58 | | | |
| Total Return** | | | (5.30)% | | | | 26.41% | | | | (4.69)% | | | |
| Net Assets, End of Period (in thousands) | | | $15,559 | | | | $15,001 | | | | $2,437 | | | |
| Average Net Assets for the Period (in thousands) | | | $14,849 | | | | $7,705 | | | | $1,548 | | | |
Ratio of Gross Expenses to Average Net Assets***(2) | | | 0.95% | | | | 0.92% | | | | 1.16% | | | |
Ratio of Net Expenses to Average Net Assets***(2) | | | 0.95% | | | | 0.92% | | | | 1.16% | | | |
| Ratio of Net Investment Income to Average Net Assets*** | | | 1.29% | | | | 1.26% | | | | 0.70% | | | |
| Portfolio Turnover Rate*** | | | 47% | | | | 43% | | | | 35% | | | |
Class D Shares
| | | | | | | | | | | | | | | |
For a share outstanding during the six-month period ended December 31, 2011
| | Perkins Mid Cap Value Fund | | |
| (unaudited) and each fiscal year or period ended June 30 | | 2011 | | 2011 | | 2010(1) | | |
| |
| Net Asset Value, Beginning of Period | | | $23.71 | | | | $19.06 | | | | $19.52 | | | |
| Income from Investment Operations: | | | | | | | | | | | | | | |
| Net investment income | | | .14 | | | | .26 | | | | .04 | | | |
| Net gain/(loss) on investments (both realized and unrealized) | | | (1.83) | | | | 4.57 | | | | (.50) | | | |
| Total from Investment Operations | | | (1.69) | | | | 4.83 | | | | (.46) | | | |
| Less Distributions: | | | | | | | | | | | | | | |
| Dividends (from net investment income)* | | | (.20) | | | | (.18) | | | | – | | | |
| Distributions (from capital gains)* | | | (1.63) | | | | – | | | | – | | | |
| Total Distributions | | | (1.83) | | | | (.18) | | | | – | | | |
| Net Asset Value, End of Period | | | $20.19 | | | | $23.71 | | | | $19.06 | | | |
| Total Return** | | | (7.11)% | | | | 25.40% | | | | (2.36)% | | | |
| Net Assets, End of Period (in thousands) | | | $829,042 | | | | $936,795 | | | | $796,330 | | | |
| Average Net Assets for the Period (in thousands) | | | $841,193 | | | | $896,522 | | | | $868,198 | | | |
Ratio of Gross Expenses to Average Net Assets***(2) | | | 0.77% | | | | 0.88% | | | | 0.93% | | | |
Ratio of Net Expenses to Average Net Assets***(2) | | | 0.77% | | | | 0.88% | | | | 0.93% | | | |
| Ratio of Net Investment Income to Average Net Assets*** | | | 1.23% | | | | 1.14% | | | | 0.49% | | | |
| Portfolio Turnover Rate*** | | | 56% | | | | 66% | | | | 66% | | | |
| | | |
| * | | See Note 5 in Notes to Financial Statements. |
| ** | | Total return not annualized for periods of less than one full year. |
| *** | | Annualized for periods of less than one full year. |
| (1) | | Period from February 16, 2010 (inception date) through June 30, 2010. |
| (2) | | See Note 6 in Notes to Financial Statements. |
See Notes to Financial Statements.
78 | DECEMBER 31, 2011
Class D Shares
| | | | | | | | | | | | | | | | | | | |
For a share outstanding during the six-month period ended
| | | | Perkins Small Cap
| | |
December 31, 2011 (unaudited), the fiscal year ended June 30, 2011
| | Perkins Select Value Fund | | Value Fund | | |
| and the fiscal period ended June 30, 2010 | | 2011(1) | | 2011 | | 2011 | | 2010(2) | | |
| |
| Net Asset Value, Beginning of Period | | | $10.00 | | | | $24.96 | | | | $20.92 | | | | $20.79 | | | |
| Income from Investment Operations: | | | | | | | | | | | | | | | | | | |
| Net investment income | | | – | | | | .11 | | | | .09 | | | | .07 | | | |
| Net gain/(loss) on investments (both realized and unrealized) | | | .23 | | | | (1.86) | | | | 4.65 | | | | .06 | | | |
| Total from Investment Operations | | | .23 | | | | (1.75) | | | | 4.74 | | | | .13 | | | |
| Less Distributions: | | | | | | | | | | | | | | | | | | |
| Dividends (from net investment income)* | | | – | | | | (.08) | | | | (.09) | | | | – | | | |
| Distributions (from capital gains)* | | | – | | | | (2.76) | | | | (.61) | | | | – | | | |
| Total Distributions | | | – | | | | (2.84) | | | | (.70) | | | | – | | | |
| Net Asset Value, End of Period | | | $10.23 | | | | $20.37 | | | | $24.96 | | | | $20.92 | | | |
| Total Return** | | | 2.30% | | | | (7.08)% | | | | 22.83% | | | | 0.63% | | | |
| Net Assets, End of Period (in thousands) | | | $411 | | | | $74,757 | | | | $86,402 | | | | $78,237 | | | |
| Average Net Assets for the Period (in thousands) | | | $164 | | | | $75,981 | | | | $84,313 | | | | $74,758 | | | |
Ratio of Gross Expenses to Average Net Assets***(3) | | | 1.44% | | | | 1.03% | | | | 0.99% | | | | 0.98% | | | |
Ratio of Net Expenses to Average Net Assets***(3) | | | 1.44% | | | | 1.03% | | | | 0.99% | | | | 0.98% | | | |
| Ratio of Net Investment Income to Average Net Assets*** | | | 0.47% | | | | 0.99% | | | | 0.54% | | | | 0.12% | | | |
| Portfolio Turnover Rate*** | | | 0% | | | | 62% | | | | 64% | | | | 59% | | | |
Class D Shares
| | | | | | | | | | | |
| | | Perkins Value Plus
| | |
For a share outstanding during the six-month period ended December 31, 2011
| | Income Fund | | |
| (unaudited) and the fiscal period ended June 30, 2011 | | 2011 | | 2011(4) | | |
| |
| Net Asset Value, Beginning of Period | | | $11.15 | | | | $10.00 | | | |
| Income from Investment Operations: | | | | | | | | | | |
| Net investment income | | | .15 | | | | .29 | | | |
| Net gain/(loss) on investments (both realized and unrealized) | | | (.28) | | | | 1.16 | | | |
| Total from Investment Operations | | | (.13) | | | | 1.45 | | | |
| Less Distributions: | | | | | | | | | | |
| Dividends (from net investment income)* | | | (.19) | | | | (.26) | | | |
| Distributions (from capital gains)* | | | (.37) | | | | (.04) | | | |
| Total Distributions | | | (.56) | | | | (.30) | | | |
| Net Asset Value, End of Period | | | $10.46 | | | | $11.15 | | | |
| Total Return** | | | (1.11)% | | | | 14.62% | | | |
| Net Assets, End of Period (in thousands) | | | $15,845 | | | | $12,627 | | | |
| Average Net Assets for the Period (in thousands) | | | $13,336 | | | | $7,656 | | | |
Ratio of Gross Expenses to Average Net Assets***(3) | | | 0.87% | | | | 0.79% | | | |
Ratio of Net Expenses to Average Net Assets***(3) | | | 0.87% | | | | 0.79% | | | |
| Ratio of Net Investment Income to Average Net Assets*** | | | 3.00% | | | | 3.33% | | | |
| Portfolio Turnover Rate*** | | | 107% | | | | 93% | | | |
| | | |
| * | | See Note 5 in Notes to Financial Statements. |
| ** | | Total return not annualized for periods of less than one full year. |
| *** | | Annualized for periods of less than one full year. |
| (1) | | Period from December 15, 2011 (inception date) through December 31, 2011. |
| (2) | | Period from February 16, 2010 (inception date) through June 30, 2010. |
| (3) | | See Note 6 in Notes to Financial Statements. |
| (4) | | Period from July 30, 2010 (inception date) through June 30, 2011. |
See Notes to Financial Statements.
Janus Value Funds | 79
Financial Highlights (continued)
Class I Shares
| | | | | | | | | | | | | | | | | | | |
For a share outstanding during the six-month period ended December 31, 2011
| | | | | | | | | | |
(unaudited), the fiscal year ended June 30, 2011, the eleven-month fiscal period
| | Perkins Large Cap Value Fund | | |
| ended June 30, 2010 and the fiscal period ended July 31, 2009 | | 2011 | | 2011 | | 2010(1) | | 2009(2) | | |
| |
| Net Asset Value, Beginning of Period | | | $14.17 | | | | $11.58 | | | | $11.14 | | | | $10.00 | | | |
| Income from Investment Operations: | | | | | | | | | | | | | | | | | | |
| Net investment income | | | .09 | | | | .19 | | | | .07 | | | | .04 | | | |
| Net gain/(loss) on investments (both realized and unrealized) | | | (.83) | | | | 2.85 | | | | .43 | | | | 1.13 | | | |
| Total from Investment Operations | | | (.74) | | | | 3.04 | | | | .50 | | | | 1.17 | | | |
| Less Distributions: | | | | | | | | | | | | | | | | | | |
| Dividends (from net investment income)* | | | (.17) | | | | (.13) | | | | (.04) | | | | (.03) | | | |
| Distributions (from capital gains)* | | | (.68) | | | | (.32) | | | | (.02) | | | | – | | | |
| Total Distributions | | | (.85) | | | | (.45) | | | | (.06) | | | | (.03) | | | |
| Net Asset Value, End of Period | | | $12.58 | | | | $14.17 | | | | $11.58 | | | | $11.14 | | | |
| Total Return** | | | (5.20)% | | | | 26.57% | | | | 4.49% | | | | 11.76% | | | |
| Net Assets, End of Period (in thousands) | | | $109,518 | | | | $112,360 | | | | $69,225 | | | | $28,863 | | | |
| Average Net Assets for the Period (in thousands) | | | $106,237 | | | | $91,088 | | | | $53,625 | | | | $17,284 | | | |
Ratio of Gross Expenses to Average Net Assets***(3) | | | 0.83% | | | | 0.84% | | | | 1.04% | | | | 1.00% | | | |
Ratio of Net Expenses to Average Net Assets***(3) | | | 0.83% | | | | 0.84% | | | | 1.03% | | | | 1.00% | | | |
| Ratio of Net Investment Income to Average Net Assets*** | | | 1.41% | | | | 1.45% | | | | 0.76% | | | | 1.36% | | | |
| Portfolio Turnover Rate*** | | | 47% | | | | 43% | | | | 35% | | | | 57% | | | |
Class I Shares
| | | | | | | | | | | | | | | | | | | |
For a share outstanding during the six-month period ended December 31,
| | | | | | | | | | |
2011 (unaudited), the fiscal year ended June 30, 2011, the eight-month
| | | | | | | | | | |
fiscal period ended June 30, 2010 and the fiscal period ended October 31,
| | Perkins Mid Cap Value Fund | | |
| 2009 | | 2011 | | 2011 | | 2010(4) | | 2009(5) | | |
| |
| Net Asset Value, Beginning of Period | | | $23.71 | | | | $19.07 | | | | $18.68 | | | | $16.07 | | | |
| Income from Investment Operations: | | | | | | | | | | | | | | | | | | |
| Net investment income | | | .14 | | | | .25 | | | | .08 | | | | .01 | | | |
| Net gain/(loss) on investments (both realized and unrealized) | | | (1.83) | | | | 4.59 | | | | .37 | | | | 2.60 | | | |
| Total from Investment Operations | | | (1.69) | | | | 4.84 | | | | .45 | | | | 2.61 | | | |
| Less Distributions: | | | | | | | | | | | | | | | | | | |
| Dividends (from net investment income)* | | | (.21) | | | | (.20) | | | | (.06) | | | | – | | | |
| Distributions (from capital gains)* | | | (1.63) | | | | – | | | | – | | | | – | | | |
| Total Distributions | | | (1.84) | | | | (.20) | | | | (.06) | | | | – | | | |
| Net Asset Value, End of Period | | | $20.18 | | | | $23.71 | | | | $19.07 | | | | $18.68 | | | |
| Total Return** | | | (7.12)% | | | | 25.46% | | | | 2.40% | | | | 16.24% | | | |
| Net Assets, End of Period (in thousands) | | | $3,151,592 | | | | $3,385,626 | | | | $2,223,203 | | | | $1,258,548 | | | |
| Average Net Assets for the Period (in thousands) | | | $3,133,061 | | | | $2,900,600 | | | | $1,712,121 | | | | $1,058,484 | | | |
Ratio of Gross Expenses to Average Net Assets***(3) | | | 0.73% | | | | 0.84% | | | | 0.83% | | | | 0.81% | | | |
Ratio of Net Expenses to Average Net Assets***(3) | | | 0.73% | | | | 0.84% | | | | 0.83% | | | | 0.81% | | | |
| Ratio of Net Investment Income to Average Net Assets*** | | | 1.28% | | | | 1.14% | | | | 0.63% | | | | 0.75% | | | |
| Portfolio Turnover Rate*** | | | 56% | | | | 66% | | | | 66% | | | | 88% | | | |
| | | |
| * | | See Note 5 in Notes to Financial Statements. |
| ** | | Total return not annualized for periods of less than one full year. |
| *** | | Annualized for periods of less than one full year. |
| (1) | | Period from August 1, 2009 through June 30, 2010. The Fund changed its fiscal year end from July 31 to June 30. |
| (2) | | Period from December 31, 2008 (inception date) through July 31, 2009. |
| (3) | | See Note 6 in Notes to Financial Statements. |
| (4) | | Period from November 1, 2009 through June 30, 2010. The Fund changed its fiscal year end from October 31 to June 30. |
| (5) | | Period from July 6, 2009 (inception date) through October 31, 2009. |
See Notes to Financial Statements.
80 | DECEMBER 31, 2011
Class I Shares
| | | | | | | | | | | | | | | | | | | | | | | |
For a share outstanding during the six-month
| | | | | | | | | | | | |
period ended December 31, 2011 (unaudited),
| | | | | | | | | | | | |
the fiscal year ended June 30, 2011, the eight-
| | | | | | | | | | | | |
month fiscal period ended June 30, 2010 and the
| | Perkins Select Value Fund | | Perkins Small Cap Value Fund | | |
| fiscal period ended October 31, 2009 | | 2011(1) | | 2011 | | 2011 | | 2010(2) | | 2009(3) | | |
| |
| Net Asset Value, Beginning of Period | | | $10.00 | | | | $25.01 | | | | $20.97 | | | | $19.49 | | | | $16.47 | | | |
| Income from Investment Operations: | | | | | | | | | | | | | | | | | | | | | | |
| Net investment income/(loss) | | | – | | | | .12 | | | | .04 | | | | .11 | | | | (.02) | | | |
| Net gain/(loss) on investments (both realized and unrealized) | | | .22 | | | | (1.87) | | | | 4.73 | | | | 1.37 | | | | 3.04 | | | |
| Total from Investment Operations | | | .22 | | | | (1.75) | | | | 4.77 | | | | 1.48 | | | | 3.02 | | | |
| Less Distributions: | | | | | | | | | | | | | | | | | | | | | | |
| Dividends (from net investment income)* | | | – | | �� | | (.10) | | | | (.12) | | | | – | | | | – | | | |
| Distributions (from capital gains)* | | | – | | | | (2.76) | | | | (.61) | | | | – | | | | – | | | |
| Total Distributions | | | – | | | | (2.86) | | | | (.73) | | | | – | | | | – | | | |
| Net Asset Value, End of Period | | | $10.22 | | | | $20.40 | | | | $25.01 | | | | $20.97 | | | | $19.49 | | | |
| Total Return** | | | 2.20% | | | | (7.07)% | | | | 22.89% | | | | 7.59% | | | | 18.34% | | | |
| Net Assets, End of Period (in thousands) | | | $51,920 | | | | $1,159,234 | | | | $1,317,183 | | | | $532,188 | | | | $236,437 | | | |
| Average Net Assets for the Period (in thousands) | | | $39,039 | | | | $1,186,492 | | | | $1,091,334 | | | | $408,417 | | | | $42,710 | | | |
Ratio of Gross Expenses to Average Net Assets***(4) | | | 1.02% | | | | 0.97% | | | | 0.93% | | | | 0.85% | | | | 0.77% | | | |
Ratio of Net Expenses to Average Net Assets***(4) | | | 1.02% | | | | 0.97% | | | | 0.93% | | | | 0.85% | | | | 0.75% | | | |
| Ratio of Net Investment Income to Average Net Assets*** | | | 0.33% | | | | 1.06% | | | | 0.55% | | | | 0.52% | | | | 0.80% | | | |
| Portfolio Turnover Rate*** | | | 0% | | | | 62% | | | | 64% | | | | 59% | | | | 85% | | | |
Class I Shares
| | | | | | | | | | | |
| | | Perkins Value Plus
| | |
For a share outstanding during the six-month period ended December 31, 2011 (unaudited) and the fiscal
| | Income Fund | | |
| period ended June 30, 2011 | | 2011 | | 2011(5) | | |
| |
| Net Asset Value, Beginning of Period | | | $11.15 | | | | $10.00 | | | |
| Income from Investment Operations: | | | | | | | | | | |
| Net investment income/(loss) | | | .16 | | | | .30 | | | |
| Net gain/(loss) on investments (both realized and unrealized) | | | (.28) | | | | 1.15 | | | |
| Total from Investment Operations | | | (.12) | | | | 1.45 | | | |
| Less Distributions: | | | | | | | | | | |
| Dividends (from net investment income)* | | | (.20) | | | | (.26) | | | |
| Distributions (from capital gains)* | | | (.37) | | | | (.04) | | | |
| Total Distributions | | | (.57) | | | | (.30) | | | |
| Net Asset Value, End of Period | | | $10.46 | | | | $11.15 | | | |
| Total Return** | | | (1.06)% | | | | 14.66% | | | |
| Net Assets, End of Period (in thousands) | | | $7,856 | | | | $7,860 | | | |
| Average Net Assets for the Period (in thousands) | | | $7,717 | | | | $6,004 | | | |
Ratio of Gross Expenses to Average Net Assets***(4) | | | 0.78% | | | | 0.77% | | | |
Ratio of Net Expenses to Average Net Assets***(4) | | | 0.78% | | | | 0.77% | | | |
| Ratio of Net Investment Income to Average Net Assets*** | | | 3.06% | | | | 3.27% | | | |
| Portfolio Turnover Rate*** | | | 107% | | | | 93% | | | |
| | | |
| * | | See Note 5 in Notes to Financial Statements. |
| ** | | Total return not annualized for periods of less than one full year. |
| *** | | Annualized for periods of less than one full year. |
| (1) | | Period from December 15, 2011 (inception date) through December 31, 2011. |
| (2) | | Period from November 1, 2009 through June 30, 2010. The Fund changed its fiscal year end from October 31 to June 30. |
| (3) | | Period from July 6, 2009 (inception date) through October 31, 2009. |
| (4) | | See Note 6 in Notes to Financial Statements. |
| (5) | | Period from July 30, 2010 (inception date) through June 30, 2011. |
See Notes to Financial Statements.
Janus Value Funds | 81
Financial Highlights (continued)
Class L Shares
| | | | | | | | | | | | | | | | | | | | | | | | | | | | | | | |
For a share outstanding during the six-month period
| | | | | | | | | | | | | | | | |
ended December 31, 2011 (unaudited), the fiscal year
| | | | | | | | | | | | | | | | |
ended June 30, 2011, the eight-month fiscal period
| | | | | | | | | | | | | | | | |
ended June 30, 2010 and each fiscal year ended
| | Perkins Mid Cap Value Fund | | |
| October 31 | | 2011 | | 2011 | | 2010(1) | | 2009 | | 2008 | | 2007 | | 2006 | | |
| |
| Net Asset Value, Beginning of Period | | | $23.90 | | | | $19.18 | | | | $18.79 | | | | $16.75 | | | | $26.69 | | | | $24.99 | | | | $23.34 | | | |
| Income from Investment Operations: | | | | | | | | | | | | | | | | | | | | | | | | | | | | | | |
| Net investment income | | | .26 | | | | .73 | | | | 1.72 | | | | .23 | | | | .49 | | | | .39 | | | | .39 | | | |
| Net gain/(loss) on investments (both realized and unrealized) | | | (1.96) | | | | 4.18 | | | | (1.28) | | | | 2.93 | | | | (7.31) | | | | 3.28 | | | | 3.37 | | | |
| Total from Investment Operations | | | (1.70) | | | | 4.91 | | | | .44 | | | | 3.16 | | | | (6.82) | | | | 3.67 | | | | 3.76 | | | |
| Less Distributions: | | | | | | | | | | | | | | | | | | | | | | | | | | | | | | |
| Dividends (from net investment income)* | | | (.22) | | | | (.19) | | | | (.05) | | | | (.33) | | | | (.39) | | | | (.35) | | | | (.28) | | | |
| Distributions (from capital gains)* | | | (1.63) | | | | – | | | | – | | | | (.79) | | | | (2.73) | | | | (1.62) | | | | (1.83) | | | |
| Total Distributions | | | (1.85) | | | | (.19) | | | | (.05) | | | | (1.12) | | | | (3.12) | | | | (1.97) | | | | (2.11) | | | |
| Net Asset Value, End of Period | | | $20.35 | | | | $23.90 | | | | $19.18 | | | | $18.79 | | | | $16.75 | | | | $26.69 | | | | $24.99 | | | |
| Total Return** | | | (7.11)% | | | | 25.66% | | | | 2.36% | | | | 20.67% | | | | (28.49)% | | | | 15.49% | | | | 17.08% | | | |
| Net Assets, End of Period (in thousands) | | | $51,701 | | | | $63,549 | | | | $61,880 | | | | $350,003 | | | | $365,505 | | | | $885,293 | | | | $1,068,045 | | | |
| Average Net Assets for the Period (in thousands) | | | $56,064 | | | | $66,281 | | | | $347,623 | | | | $298,741 | | | | $759,342 | | | | $1,043,566 | | | | $921,447 | | | |
Ratio of Gross Expenses to Average Net Assets***(2) | | | 0.76% | | | | 0.74% | | | | 0.76% | | | | 0.87% | | | | 0.84% | | | | 0.77% | | | | 0.78% | | | |
Ratio of Net Expenses to Average Net Assets***(2) | | | 0.76% | | | | 0.74% | | | | 0.76% | | | | 0.87% | | | | 0.84% | | | | 0.77% | | | | 0.77% | | | |
| Ratio of Net Investment Income to Average Net Assets*** | | | 1.23% | | | | 1.32% | | | | 0.85% | | | | 1.11% | | | | 1.76% | | | | 1.60% | | | | 1.79% | | | |
| Portfolio Turnover Rate*** | | | 56% | | | | 66% | | | | 66% | | | | 88% | | | | 103% | | | | 95% | | | | 95% | | | |
Class L Shares
| | | | | | | | | | | | | | | | | | | | | | | | | | | | | | | |
For a share outstanding during the six-month period
| | | | | | | | | | | | | | | | |
ended December 31, 2011 (unaudited), the fiscal year
| | | | | | | | | | | | | | | | |
ended June 30, 2011, the eight-month fiscal period
| | | | | | | | | | | | | | | | |
ended June 30, 2010 and each fiscal year ended
| | Perkins Small Cap Value Fund | | |
| October 31 | | 2011 | | 2011 | | 2010(1) | | 2009 | | 2008 | | 2007 | | 2006 | | |
| |
| Net Asset Value, Beginning of Period | | | $25.34 | | | | $21.21 | | | | $19.72 | | | | $18.24 | | | | $28.20 | | | | $30.54 | | | | $31.38 | | | |
| Income from Investment Operations: | | | | | | | | | | | | | | | | | | | | | | | | | | | | | | |
| Net investment income | | | .10 | | | | .51 | | | | .18 | | | | .09 | | | | .33 | | | | .38 | | | | .54 | | | |
| Net gain/(loss) on investments (both realized and unrealized) | | | (1.87) | | | | 4.34 | | | | 1.31 | | | | 3.45 | | | | (5.86) | | | | 2.61 | | | | 3.43 | | | |
| Total from Investment Operations | | | (1.77) | | | | 4.85 | | | | 1.49 | | | | 3.54 | | | | (5.53) | | | | 2.99 | | | | 3.97 | | | |
| Less Distributions and Other: | | | | | | | | | | | | | | | | | | | | | | | | | | | | | | |
| Dividends (from net investment income)* | | | (.11) | | | | (.11) | | | | – | | | | (.38) | | | | (.35) | | | | (.50) | | | | (.36) | | | |
| Distributions (from capital gains)* | | | (2.76) | | | | (.61) | | | | – | | | | (1.62) | | | | (4.08) | | | | (4.83) | | | | (4.45) | | | |
| Return of capital | | | N/A | | | | N/A | | | | N/A | | | | (.06) | | | | N/A | | | | N/A | | | | N/A | | | |
| Total Distributions and Other | | | (2.87) | | | | (.72) | | | | – | | | | (2.06) | | | | (4.43) | | | | (5.33) | | | | (4.81) | | | |
| Net Asset Value, End of Period | | | $20.70 | | | | $25.34 | | | | $21.21 | | | | $19.72 | | | | $18.24 | | | | $28.20 | | | | $30.54 | | | |
| Total Return** | | | (7.04)% | | | | 23.03% | | | | 7.56% | | | | 23.12% | | | | (22.39)% | | | | 11.06% | | | | 13.93% | | | |
| Net Assets, End of Period (in thousands) | | | $279,756 | | | | $325,503 | | | | $657,562 | | | | $706,873 | | | | $563,464 | | | | $771,789 | | | | $923,755 | | | |
| Average Net Assets for the Period (in thousands) | | | $288,030 | | | | $419,652 | | | | $706,615 | | | | $613,826 | | | | $664,935 | | | | $831,092 | | | | $1,092,751 | | | |
Ratio of Gross Expenses to Average Net Assets***(2) | | | 0.88% | | | | 0.84% | | | | 0.83% | | | | 0.85% | | | | 0.82% | | | | 0.80% | | | | 0.80% | | | |
Ratio of Net Expenses to Average Net Assets***(2) | | | 0.88% | | | | 0.84% | | | | 0.83% | | | | 0.85% | | | | 0.81% | | | | 0.79% | | | | 0.79% | | | |
| Ratio of Net Investment Income to Average Net Assets*** | | | 1.14% | | | | 0.76% | | | | 0.70% | | | | 1.28% | | | | 1.65% | | | | 1.34% | | | | 1.51% | | | |
| Portfolio Turnover Rate*** | | | 62% | | | | 64% | | | | 59% | | | | 85% | | | | 112% | | | | 59% | | | | 62% | | | |
| | | |
| * | | See Note 5 in Notes to Financial Statements. |
| ** | | Total return not annualized for periods of less than one full year. |
| *** | | Annualized for periods of less than one full year. |
| (1) | | Period from November 1, 2009 through June 30, 2010. The Fund changed its fiscal year end from October 31 to June 30. |
| (2) | | See Note 6 in Notes to Financial Statements. |
See Notes to Financial Statements.
82 | DECEMBER 31, 2011
Class R Shares
| | | | | | | | | | | | | | | | | | | |
For a share outstanding during the six-month period ended December 31, 2011
| | | | | | | | | | |
(unaudited), the fiscal year ended June 30, 2011, the eight-month fiscal period
| | Perkins Mid Cap Value Fund | | |
| ended June 30, 2010 and the fiscal period ended October 31, 2009 | | 2011 | | 2011 | | 2010(1) | | 2009(2) | | |
| |
| Net Asset Value, Beginning of Period | | | $23.59 | | | | $19.00 | | | | $18.64 | | | | $16.07 | | | |
| Income from Investment Operations: | | | | | | | | | | | | | | | | | | |
| Net investment income/(loss) | | | .07 | | | | .12 | | | | – | | | | (.03) | | | |
| Net gain/(loss) on investments (both realized and unrealized) | | | (1.82) | | | | 4.56 | | | | .36 | | | | 2.60 | | | |
| Total from Investment Operations | | | (1.75) | | | | 4.68 | | | | .36 | | | | 2.57 | | | |
| Less Distributions: | | | | | | | | | | | | | | | | | | |
| Dividends (from net investment income)* | | | (.06) | | | | (.09) | | | | – | | | | – | | | |
| Distributions (from capital gains)* | | | (1.63) | | | | – | | | | – | | | | – | | | |
| Total Distributions | | | (1.69) | | | | (.09) | | | | – | | | | – | | | |
| Net Asset Value, End of Period | | | $20.15 | | | | $23.59 | | | | $19.00 | | | | $18.64 | | | |
| Total Return** | | | (7.41)% | | | | 24.64% | | | | 1.93% | | | | 15.99% | | | |
| Net Assets, End of Period (in thousands) | | | $150,281 | | | | $170,602 | | | | $103,961 | | | | $71,203 | | | |
| Average Net Assets for the Period (in thousands) | | | $154,051 | | | | $146,674 | | | | $94,163 | | | | $64,070 | | | |
Ratio of Gross Expenses to Average Net Assets***(3) | | | 1.38% | | | | 1.49% | | | | 1.52% | | | | 1.53% | | | |
Ratio of Net Expenses to Average Net Assets***(3) | | | 1.38% | | | | 1.49% | | | | 1.52% | | | | 1.53% | | | |
| Ratio of Net Investment Income/(Loss) to Average Net Assets*** | | | 0.61% | | | | 0.47% | | | | (0.04)% | | | | 0.03% | | | |
| Portfolio Turnover Rate*** | | | 56% | | | | 66% | | | | 66% | | | | 88% | | | |
Class R Shares
| | | | | | | | | | | | | | | | | | | |
For a share outstanding during the six-month period ended December 31, 2011
| | | | | | | | | | |
(unaudited), the fiscal year ended June 30, 2011, the eight-month fiscal period ended
| | Perkins Small Cap Value Fund | | |
| June 30, 2010 and the fiscal period ended October 31, 2009 | | 2011 | | 2011 | | 2010(1) | | 2009(2) | | |
| |
| Net Asset Value, Beginning of Period | | | $24.71 | | | | $20.83 | | | | $19.46 | | | | $16.47 | | | |
| Income from Investment Operations: | | | | | | | | | | | | | | | | | | |
| Net investment income/(loss) | | | .05 | | | | (.04) | | | | .11 | | | | (.12) | | | |
| Net gain/(loss) on investments (both realized and unrealized) | | | (1.85) | | | | 4.61 | | | | 1.26 | | | | 3.11 | | | |
| Total from Investment Operations | | | (1.80) | | | | 4.57 | | | | 1.37 | | | | 2.99 | | | |
| Less Distributions: | | | | | | | | | | | | | | | | | | |
| Dividends (from net investment income)* | | | – | | | | (.08) | | | | – | | | | – | | | |
| Distributions (from capital gains)* | | | (2.76) | | | | (.61) | | | | – | | | | – | | | |
| Total Distributions | | | (2.76) | | | | (.69) | | | | – | | | | – | | | |
| Net Asset Value, End of Period | | | $20.15 | | | | $24.71 | | | | $20.83 | | | | $19.46 | | | |
| Total Return** | | | (7.35)% | | | | 22.10% | | | | 7.04% | | | | 18.15% | | | |
| Net Assets, End of Period (in thousands) | | | $33,713 | | | | $38,302 | | | | $21,450 | | | | $3,734 | | | |
| Average Net Assets for the Period (in thousands) | | | $33,989 | | | | $32,917 | | | | $8,368 | | | | $3,362 | | | |
Ratio of Gross Expenses to Average Net Assets***(3) | | | 1.63% | | | | 1.60% | | | | 1.57% | | | | 1.54% | | | |
Ratio of Net Expenses to Average Net Assets***(3) | | | 1.63% | | | | 1.60% | | | | 1.57% | | | | 1.54% | | | |
| Ratio of Net Investment Income/(Loss) to Average Net Assets*** | | | 0.39% | | | | (0.10)% | | | | (0.28)% | | | | 0.10% | | | |
| Portfolio Turnover Rate*** | | | 62% | | | | 64% | | | | 59% | | | | 85% | | | |
| | | |
| * | | See Note 5 in Notes to Financial Statements. |
| ** | | Total return not annualized for periods of less than one full year. |
| *** | | Annualized for periods of less than one full year. |
| (1) | | Period from November 1, 2009 through June 30, 2010. The Fund changed its fiscal year end from October 31 to June 30. |
| (2) | | Period from July 6, 2009 (inception date) through October 31, 2009. |
| (3) | | See Note 6 in Notes to Financial Statements. |
See Notes to Financial Statements.
Janus Value Funds | 83
Financial Highlights (continued)
Class S Shares
| | | | | | | | | | | | | | | | | | | |
For a share outstanding during the six-month period ended December 31, 2011
| | | | | | | | | | |
(unaudited), the fiscal year ended June 30, 2011, the eleven-month fiscal period ended
| | Perkins Large Cap Value Fund | | |
| June 30, 2010 and the fiscal period ended July 31, 2009 | | 2011 | | 2011 | | 2010(1) | | 2009(2) | | |
| |
| Net Asset Value, Beginning of Period | | | $14.15 | | | | $11.56 | | | | $11.13 | | | | $10.00 | | | |
| Income from Investment Operations: | | | | | | | | | | | | | | | | | | |
| Net investment income/(loss) | | | .05 | | | | .14 | | | | .03 | | | | .04 | | | |
| Net gain/(loss) on investments (both realized and unrealized) | | | (.83) | | | | 2.84 | | | | .42 | | | | 1.10 | | | |
| Total from Investment Operations | | | (.78) | | | | 2.98 | | | | .45 | | | | 1.14 | | | |
| Less Distributions: | | | | | | | | | | | | | | | | | | |
| Dividends (from net investment income)* | | | (.10) | | | | (.07) | | | | – | | | | (.01) | | | |
| Distributions (from capital gains)* | | | (.68) | | | | (.32) | | | | (.02) | | | | – | | | |
| Total Distributions | | | (.78) | | | | (.39) | | | | (.02) | | | | (.01) | | | |
| Net Asset Value, End of Period | | | $12.59 | | | | $14.15 | | | | $11.56 | | | | $11.13 | | | |
| Total Return** | | | (5.49)% | | | | 26.01% | | | | 4.07% | | | | 11.40% | | | |
| Net Assets, End of Period (in thousands) | | | $648 | | | | $685 | | | | $580 | | | | $557 | | | |
| Average Net Assets for the Period (in thousands) | | | $632 | | | | $685 | | | | $616 | | | | $484 | | | |
Ratio of Gross Expenses to Average Net Assets***(3) | | | 1.31% | | | | 1.34% | | | | 1.53% | | | | 1.48% | | | |
Ratio of Net Expenses to Average Net Assets***(3) | | | 1.31% | | | | 1.34% | | | | 1.53% | | | | 1.47% | | | |
| Ratio of Net Investment Income to Average Net Assets*** | | | 0.91% | | | | 0.97% | | | | 0.28% | | | | 0.98% | | | |
| Portfolio Turnover Rate*** | | | 47% | | | | 43% | | | | 35% | | | | 57% | | | |
Class S Shares
| | | | | | | | | | | | | | | | | | | |
For a share outstanding during the six-month period ended December 31, 2011
| | | | | | | | | | |
(unaudited), the fiscal year ended June 30, 2011, the eight-month fiscal period
| | Perkins Mid Cap Value Fund | | |
| ended June 30, 2010 and the fiscal period ended October 31, 2009 | | 2011 | | 2011 | | 2010(4) | | 2009(5) | | |
| |
| Net Asset Value, Beginning of Period | | | $23.64 | | | | $19.03 | | | | $18.66 | | | | $16.07 | | | |
| Income from Investment Operations: | | | | | | | | | | | | | | | | | | |
| Net investment income/(loss) | | | .09 | | | | .17 | | | | .03 | | | | (.02) | | | |
| Net gain/(loss) on investments (both realized and unrealized) | | | (1.81) | | | | 4.56 | | | | .36 | | | | 2.61 | | | |
| Total from Investment Operations | | | (1.72) | | | | 4.73 | | | | .39 | | | | 2.59 | | | |
| Less Distributions: | | | | | | | | | | | | | | | | | | |
| Dividends (from net investment income)* | | | (.12) | | | | (.12) | | | | (.02) | | | | – | | | |
| Distributions (from capital gains)* | | | (1.63) | | | | – | | | | – | | | | – | | | |
| Total Distributions | | | (1.75) | | | | (.12) | | | | (.02) | | | | – | | | |
| Net Asset Value, End of Period | | | $20.17 | | | | $23.64 | | | | $19.03 | | | | $18.66 | | | |
| Total Return** | | | (7.25)% | | | | 24.91% | | | | 2.09% | | | | 16.12% | | | |
| Net Assets, End of Period (in thousands) | | | $772,281 | | | | $834,778 | | | | $569,777 | | | | $434,615 | | | |
| Average Net Assets for the Period (in thousands) | | | $775,484 | | | | $742,692 | | | | $559,518 | | | | $397,613 | | | |
Ratio of Gross Expenses to Average Net Assets***(3) | | | 1.13% | | | | 1.24% | | | | 1.27% | | | | 1.28% | | | |
Ratio of Net Expenses to Average Net Assets***(3) | | | 1.13% | | | | 1.24% | | | | 1.27% | | | | 1.28% | | | |
| Ratio of Net Investment Income to Average Net Assets*** | | | 0.87% | | | | 0.74% | | | | 0.22% | | | | 0.28% | | | |
| Portfolio Turnover Rate*** | | | 56% | | | | 66% | | | | 66% | | | | 88% | | | |
| | | |
| * | | See Note 5 in Notes to Financial Statements. |
| ** | | Total return not annualized for periods of less than one full year. |
| *** | | Annualized for periods of less than one full year. |
| (1) | | Period from August 1, 2009 through June 30, 2010. The Fund changed its fiscal year end from July 31 to June 30. |
| (2) | | Period from December 31, 2008 (inception date) through July 31, 2009. |
| (3) | | See Note 6 in Notes to Financial Statements. |
| (4) | | Period from November 1, 2009 through June 30, 2010. The Fund changed its fiscal year end from October 31 to June 30. |
| (5) | | Period from July 6, 2009 (inception date) through October 31, 2009. |
See Notes to Financial Statements.
84 | DECEMBER 31, 2011
Class S Shares
| | | | | | | | | | | | | | | | | | | | | | | |
For a share outstanding during the six-month period
| | | | | | | | | | | | |
ended December 31, 2011 (unaudited), the fiscal year
| | | | | | | | | | | | |
ended June 30, 2011, the eight-month fiscal period
| | | | | | | | | | | | |
ended June 30, 2010 and the fiscal period ended
| | Perkins Select Value Fund | | Perkins Small Cap Value Fund | | |
| October 31, 2009 | | 2011(1) | | 2011 | | 2011 | | 2010(2) | | 2009(3) | | |
| |
| Net Asset Value, Beginning of Period | | | $10.00 | | | | $24.84 | | | | $20.88 | | | | $19.47 | | | | $16.47 | | | |
| Income from Investment Operations: | | | | | | | | | | | | | | | | | | | | | | |
| Net investment income/(loss) | | | – | | | | .07 | | | | – | | | | .11 | | | | (.10) | | | |
| Net gain/(loss) on investments (both realized and unrealized) | | | .22 | | | | (1.86) | | | | 4.65 | | | | 1.30 | | | | 3.10 | | | |
| Total from Investment Operations | | | .22 | | | | (1.79) | | | | 4.65 | | | | 1.41 | | | | 3.00 | | | |
| Less Distributions: | | | | | | | | | | | | | | | | | | | | | | |
| Dividends (from net investment income)* | | | – | | | | (.01) | | | | (.08) | | | | – | | | | – | | | |
| Distributions (from capital gains)* | | | – | | | | (2.76) | | | | (.61) | | | | – | | | | – | | | |
| Total Distributions | | | – | | | | (2.77) | | | | (.69) | | | | – | | | | – | | | |
| Net Asset Value, End of Period | | | $10.22 | | | | $20.28 | | | | $24.84 | | | | $20.88 | | | | $19.47 | | | |
| Total Return** | | | 2.20% | | | | (7.26)% | | | | 22.40% | | | | 7.24% | | | | 18.21% | | | |
| Net Assets, End of Period (in thousands) | | | $10 | | | | $91,325 | | | | $106,549 | | | | $51,460 | | | | $26,401 | | | |
| Average Net Assets for the Period (in thousands) | | | $10 | | | | $94,210 | | | | $83,981 | | | | $44,047 | | | | $24,792 | | | |
Ratio of Gross Expenses to Average Net Assets***(4) | | | 1.45% | | | | 1.38% | | | | 1.35% | | | | 1.32% | | | | 1.21% | | | |
Ratio of Net Expenses to Average Net Assets***(4) | | | 1.45% | | | | 1.38% | | | | 1.35% | | | | 1.32% | | | | 1.20% | | | |
| Ratio of Net Investment Income/(Loss) to Average Net Assets*** | | | (0.42)% | | | | 0.64% | | | | 0.14% | | | | 0.07% | | | | 0.46% | | | |
| Portfolio Turnover Rate*** | | | 0% | | | | 62% | | | | 64% | | | | 59% | | | | 85% | | | |
Class S Shares
| | | | | | | | | | | |
| | | Perkins Value Plus
| | |
For a share outstanding during the six-month period ended December 31, 2011 (unaudited) and the fiscal
| | Income Fund | | |
| period ended June 30, 2011 | | 2011 | | 2011(5) | | |
| |
| Net Asset Value, Beginning of Period | | | $11.15 | | | | $10.00 | | | |
| Income from Investment Operations: | | | | | | | | | | |
| Net investment income/(loss) | | | .14 | | | | .27 | | | |
| Net gain/(loss) on investments (both realized and unrealized) | | | (.29) | | | | 1.14 | | | |
| Total from Investment Operations | | | (.15) | | | | 1.41 | | | |
| Less Distributions: | | | | | | | | | | |
| Dividends (from net investment income)* | | | (.17) | | | | (.22) | | | |
| Distributions (from capital gains)* | | | (.37) | | | | (.04) | | | |
| Total Distributions | | | (.54) | | | | (.26) | | | |
| Net Asset Value, End of Period | | | $10.46 | | | | $11.15 | | | |
| Total Return** | | | (1.31)% | | | | 14.24% | | | |
| Net Assets, End of Period (in thousands) | | | $3,758 | | | | $3,808 | | | |
| Average Net Assets for the Period (in thousands) | | | $3,673 | | | | $3,596 | | | |
Ratio of Gross Expenses to Average Net Assets***(4) | | | 1.25% | | | | 1.20% | | | |
Ratio of Net Expenses to Average Net Assets***(4) | | | 1.25% | | | | 1.20% | | | |
| Ratio of Net Investment Income/(Loss) to Average Net Assets*** | | | 2.59% | | | | 2.75% | | | |
| Portfolio Turnover Rate*** | | | 107% | | | | 93% | | | |
| | | |
| * | | See Note 5 in Notes to Financial Statements. |
| ** | | Total return not annualized for periods of less than one full year. |
| *** | | Annualized for periods of less than one full year. |
| (1) | | Period from December 15, 2011 (inception date) through December 31, 2011. |
| (2) | | Period from November 1, 2009 through June 30, 2010. The Fund changed its fiscal year end from October 31 to June 30. |
| (3) | | Period from July 6, 2009 (inception date) through October 31, 2009. |
| (4) | | See Note 6 in Notes to Financial Statements. |
| (5) | | Period from July 30, 2010 (inception date) through June 30, 2011. |
See Notes to Financial Statements.
Janus Value Funds | 85
Financial Highlights (continued)
Class T Shares
| | | | | | | | | | | | | | | | | | | |
For a share outstanding during the six-month period ended December 31, 2011
| | | | | | | | | | |
(unaudited), the fiscal year ended June 30, 2011, the eleven-month fiscal period ended
| | Perkins Large Cap Value Fund | | |
| June 30, 2010 and the fiscal period ended July 31, 2009 | | 2011 | | 2011 | | 2010(1) | | 2009(2) | | |
| |
| Net Asset Value, Beginning of Period | | | $14.13 | | | | $11.56 | | | | $11.13 | | | | $10.22 | | | |
| Income from Investment Operations: | | | | | | | | | | | | | | | | | | |
| Net investment income | | | .07 | | | | .17 | | | | .04 | | | | – | | | |
| Net gain/(loss) on investments (both realized and unrealized) | | | (.83) | | | | 2.85 | | | | .44 | | | | .91 | | | |
| Total from Investment Operations | | | (.76) | | | | 3.02 | | | | .48 | | | | .91 | | | |
| Less Distributions: | | | | | | | | | | | | | | | | | | |
| Dividends (from net investment income)* | | | (.14) | | | | (.13) | | | | (.03) | | | | – | | | |
| Distributions (from capital gains)* | | | (.68) | | | | (.32) | | | | (.02) | | | | – | | | |
| Total Distributions | | | (.82) | | | | (.45) | | | | (.05) | | | | – | | | |
| Net Asset Value, End of Period | | | $12.55 | | | | $14.13 | | | | $11.56 | | | | $11.13 | | | |
| Total Return** | | | (5.34)% | | | | 26.37% | | | | 4.32% | | | | 8.90% | | | |
| Net Assets, End of Period (in thousands) | | | $2,256 | | | | $2,211 | | | | $594 | | | | $1 | | | |
| Average Net Assets for the Period (in thousands) | | | $2,119 | | | | $1,402 | | | | $142 | | | | $1 | | | |
Ratio of Gross Expenses to Average Net Assets***(3) | | | 1.06% | | | | 1.05% | | | | 1.29% | | | | 1.26% | | | |
Ratio of Net Expenses to Average Net Assets***(3) | | | 1.06% | | | | 1.05% | | | | 1.29% | | | | 1.25% | | | |
| Ratio of Net Investment Income to Average Net Assets*** | | | 1.18% | | | | 1.16% | | | | 0.53% | | | | 1.39% | | | |
| Portfolio Turnover Rate*** | | | 47% | | | | 43% | | | | 35% | | | | 57% | | | |
Class T Shares
| | | | | | | | | | | | | | | | | | | | | | | | | | | | | | | |
For a share outstanding during the six-month
| | | | | | | | | | | | | | | | |
period ended December 31, 2011 (unaudited),
| | | | | | | | | | | | | | | | |
the fiscal year ended June 30, 2011, the eight-
| | | | | | | | | | | | | | | | |
month fiscal period ended June 30, 2010 and
| | Perkins Mid Cap Value Fund | | |
| each fiscal year ended October 31 | | 2011 | | 2011 | | 2010(4) | | 2009 | | 2008 | | 2007 | | 2006 | | |
| |
| Net Asset Value, Beginning of Period | | | $23.70 | | | | $19.06 | | | | $18.67 | | | | $16.63 | | | | $26.56 | | | | $24.87 | | | | $23.24 | | | |
| Income from Investment Operations: | | | | | | | | | | | | | | | | | | | | | | | | | | | | | | |
| Net investment income | | | .13 | | | | .24 | | | | .06 | | | | .11 | | | | .29 | | | | .32 | | | | .37 | | | |
| Net gain/(loss) on investments (both realized and unrealized) | | | (1.83) | | | | 4.56 | | | | .37 | | | | 2.97 | | | | (7.09) | | | | 3.30 | | | | 3.33 | | | |
| Total from Investment Operations | | | (1.70) | | | | 4.80 | | | | .43 | | | | 3.08 | | | | (6.80) | | | | 3.62 | | | | 3.70 | | | |
| Less Distributions: | | | | | | | | | | | | | | | | | | | | | | | | | | | | | | |
| Dividends (from net investment income)* | | | (.17) | | | | (.16) | | | | (.04) | | | | (.25) | | | | (.40) | | | | (.31) | | | | (.24) | | | |
| Distributions (from capital gains)* | | | (1.63) | | | | – | | | | – | | | | (.79) | | | | (2.73) | | | | (1.62) | | | | (1.83) | | | |
| Total Distributions | | | (1.80) | | | | (.16) | | | | (.04) | | | | (1.04) | | | | (3.13) | | | | (1.93) | | | | (2.07) | | | |
| Net Asset Value, End of Period | | | $20.20 | | | | $23.70 | | | | $19.06 | | | | $18.67 | | | | $16.63 | | | | $26.56 | | | | $24.87 | | | |
| Total Return** | | | (7.15)% | | | | 25.24% | | | | 2.27% | | | | 20.27% | | | | (28.59)% | | | | 15.38% | | | | 16.88% | | | |
| Net Assets, End of Period (in thousands) | | | $6,561,930 | | | | $7,796,637 | | | | $6,830,168 | | | | $7,321,160 | | | | $5,170,228 | | | | $5,892,209 | | | | $5,181,449 | | | |
| Average Net Assets for the Period (in thousands) | | | $6,825,043 | | | | $7,597,129 | | | | $7,518,444 | | | | $5,907,999 | | | | $6,009,064 | | | | $5,710,028 | | | | $4,806,698 | | | |
Ratio of Gross Expenses to Average Net Assets***(3) | | | 0.88% | | | | 0.99% | | | | 1.03% | | | | 1.11% | | | | 1.07% | | | | 0.86% | | | | 0.93% | | | |
Ratio of Net Expenses to Average Net Assets***(3) | | | 0.88% | | | | 0.99% | | | | 1.03% | | | | 1.11% | | | | 1.06% | | | | 0.85% | | | | 0.93% | | | |
| Ratio of Net Investment Income to Average Net Assets*** | | | 1.11% | | | | 1.02% | | | | 0.49% | | | | 0.84% | | | | 1.47% | | | | 1.49% | | | | 1.69% | | | |
| Portfolio Turnover Rate*** | | | 56% | | | | 66% | | | | 66% | | | | 88% | | | | 103% | | | | 95% | | | | 95% | | | |
| | | |
| * | | See Note 5 in Notes to Financial Statements. |
| ** | | Total return not annualized for periods of less than one full year. |
| *** | | Annualized for periods of less than one full year. |
| (1) | | Period from August 1, 2009 through June 30, 2010. The Fund changed its fiscal year end from July 31 to June 30. |
| (2) | | Period from July 6, 2009 (inception date) through July 31, 2009. |
| (3) | | See Note 6 in Notes to Financial Statements. |
| (4) | | Period from November 1, 2009 through June 30, 2010. The Fund changed its fiscal year end from October 31 to June 30. |
See Notes to Financial Statements.
86 | DECEMBER 31, 2011
Class T Shares
| | | | | | | |
| | | Perkins Select Value Fund | | |
| For a share outstanding during the six-month period ended December 31, 2011 (unaudited) | | 2011(1) | | |
| |
| Net Asset Value, Beginning of Period | | | $10.00 | | | |
| Income from Investment Operations: | | | | | | |
| Net investment income | | | – | | | |
| Net gain/(loss) on investments (both realized and unrealized) | | | .22 | | | |
| Total from Investment Operations | | | .22 | | | |
| Less Distributions: | | | | | | |
| Dividends (from net investment income)* | | | – | | | |
| Distributions (from capital gains)* | | | – | | | |
| Total Distributions | | | – | | | |
| Net Asset Value, End of Period | | | $10.22 | | | |
| Total Return** | | | 2.20% | | | |
| Net Assets, End of Period (in thousands) | | | $210 | | | |
| Average Net Assets for the Period (in thousands) | | | $10 | | | |
Ratio of Gross Expenses to Average Net Assets***(2) | | | 1.22% | | | |
Ratio of Net Expenses to Average Net Assets***(2) | | | 1.22% | | | |
| Ratio of Net Investment Income to Average Net Assets*** | | | 3.65% | | | |
| Portfolio Turnover Rate*** | | | 0% | | | |
Class T Shares
| | | | | | | | | | | | | | | | | | | | | | | | | | | | | | | |
For a share outstanding during the six-month period
| | | | | | | | | | | | | | | | |
ended December 31, 2011 (unaudited), the fiscal
| | | | | | | | | | | | | | | | |
year ended June 30, 2011, the eight-month fiscal
| | | | | | | | | | | | | | | | |
period ended June 30, 2010 and each fiscal year
| | Perkins Small Cap Value Fund | | |
| ended October 31 | | 2011 | | 2011 | | 2010(3) | | 2009 | | 2008 | | 2007 | | 2006 | | |
| |
| Net Asset Value, Beginning of Period | | | $24.93 | | | | $20.92 | | | | $19.47 | | | | $17.98 | | | | $27.90 | | | | $30.29 | | | | $31.16 | | | |
| Income from Investment Operations: | | | | | | | | | | | | | | | | | | | | | | | | | | | | | | |
| Net investment income | | | .10 | | | | .05 | | | | .12 | | | | .08 | | | | .32 | | | | .32 | | | | .39 | | | |
| Net gain/(loss) on investments (both realized and unrealized) | | | (1.86) | | | | 4.66 | | | | 1.33 | | | | 3.39 | | | | (5.83) | | | | 2.57 | | | | 3.49 | | | |
| Total from Investment Operations | | | (1.76) | | | | 4.71 | | | | 1.45 | | | | 3.47 | | | | (5.51) | | | | 2.89 | | | | 3.88 | | | |
| Less Distributions and Other: | | | | | | | | | | | | | | | | | | | | | | | | | | | | | | |
| Dividends (from net investment income)* | | | (.05) | | | | (.09) | | | | – | | | | (.31) | | | | (.33) | | | | (.45) | | | | (.30) | | | |
| Distributions (from capital gains)* | | | (2.76) | | | | (.61) | | | | – | | | | (1.62) | | | | (4.08) | | | | (4.83) | | | | (4.45) | | | |
| Return of capital | | | N/A | | | | N/A | | | | N/A | | | | (.05) | | | | N/A | | | | N/A | | | | N/A | | | |
| Total Distributions and Other | | | (2.81) | | | | (.70) | | | | – | | | | (1.98) | | | | (4.41) | | | | (5.28) | | | | (4.75) | | | |
| Net Asset Value, End of Period | | | $20.36 | | | | $24.93 | | | | $20.92 | | | | $19.47 | | | | $17.98 | | | | $27.90 | | | | $30.29 | | | |
| Total Return** | | | (7.14)% | | | | 22.65% | | | | 7.45% | | | | 22.87% | | | | (22.57)% | | | | 10.77% | | | | 13.71% | | | |
| Net Assets, End of Period (in thousands) | | | $987,607 | | | | $1,257,481 | | | | $1,010,405 | | | | $659,087 | | | | $503,335 | | | | $813,857 | | | | $1,153,144 | | | |
| Average Net Assets for the Period (in thousands) | | | $1,063,610 | | | | $1,219,414 | | | | $936,037 | | | | $441,820 | | | | $662,033 | | | | $974,404 | | | | $1,259,565 | | | |
Ratio of Gross Expenses to Average Net Assets***(2) | | | 1.13% | | | | 1.10% | | | | 1.08% | | | | 1.11% | | | | 1.03% | | | | 1.01% | | | | 1.01% | | | |
Ratio of Net Expenses to Average Net Assets***(2) | | | 1.13% | | | | 1.10% | | | | 1.08% | | | | 1.11% | | | | 1.03% | | | | 1.00% | | | | 1.00% | | | |
| Ratio of Net Investment Income to Average Net Assets*** | | | 0.88% | | | | 0.42% | | | | 0.35% | | | | 1.06% | | | | 1.44% | | | | 1.13% | | | | 1.26% | | | |
| Portfolio Turnover Rate*** | | | 62% | | | | 64% | | | | 59% | | | | 85% | | | | 112% | | | | 59% | | | | 62% | | | |
| | | |
| * | | See Note 5 in Notes to Financial Statements. |
| ** | | Total return not annualized for periods of less than one full year. |
| *** | | Annualized for periods of less than one full year. |
| (1) | | Period from December 15, 2011 (inception date) through December 31, 2011. |
| (2) | | See Note 6 in Notes to Financial Statements. |
| (3) | | Period from November 1, 2009 through June 30, 2010. The Fund changed its fiscal year end from October 31 to June 30. |
See Notes to Financial Statements.
Janus Value Funds | 87
Financial Highlights (continued)
Class T Shares
| | | | | | | | | | | |
| | | Perkins Value Plus
| | |
For a share outstanding during the six-month period ended December 31, 2011
| | Income Fund | | |
| (unaudited) and the fiscal period ended June 30, 2011 | | 2011 | | 2011(1) | | |
| |
| Net Asset Value, Beginning of Period | | | $11.15 | | | | $10.00 | | | |
| Income from Investment Operations: | | | | | | | | | | |
| Net investment income | | | .15 | | | | .29 | | | |
| Net gain/(loss) on investments (both realized and unrealized) | | | (.29) | | | | 1.14 | | | |
| Total from Investment Operations | | | (.14) | | | | 1.43 | | | |
| Less Distributions: | | | | | | | | | | |
| Dividends (from net investment income)* | | | (.18) | | | | (.24) | | | |
| Distributions (from capital gains)* | | | (.37) | | | | (.04) | | | |
| Total Distributions | | | (.55) | | | | (.28) | | | |
| Net Asset Value, End of Period | | | $10.46 | | | | $11.15 | | | |
| Total Return** | | | (1.18)% | | | | 14.49% | | | |
| Net Assets, End of Period (in thousands) | | | $4,438 | | | | $5,030 | | | |
| Average Net Assets for the Period (in thousands) | | | $4,585 | | | | $4,002 | | | |
Ratio of Gross Expenses to Average Net Assets***(2) | | | 1.00% | | | | 0.94% | | | |
Ratio of Net Expenses to Average Net Assets***(2) | | | 1.00% | | | | 0.94% | | | |
| Ratio of Net Investment Income to Average Net Assets*** | | | 2.82% | | | | 3.08% | | | |
| Portfolio Turnover Rate*** | | | 107% | | | | 93% | | | |
| | | |
| * | | See Note 5 in Notes to Financial Statements. |
| ** | | Total return not annualized for periods of less than one full year. |
| *** | | Annualized for periods of less than one full year. |
| (1) | | Period from July 30, 2010 (inception date) through June 30, 2011. |
| (2) | | See Note 6 in Notes to Financial Statements. |
See Notes to Financial Statements.
88 | DECEMBER 31, 2011
Notes to Schedules of Investments (unaudited)
| | |
| Barclays Capital U.S. Aggregate Bond Index | | Made up of the Barclays Capital U.S. Government/Corporate Bond Index, Mortgage-Backed Securities Index, and Asset-Backed Securities Index, including securities that are of investment grade quality or better, have at least one year to maturity, and have an outstanding par value of at least $100 million. |
| |
| Lipper Large-Cap Core Funds | | Funds that, by portfolio practice, invest at least 75% of their equity assets in companies with market capitalizations (on a three-year weighted basis) above Lipper’s U.S. Diversified Equity large-cap floor. Large-cap core funds have more latitude in the companies in which they invest. These funds typically have an average price-to-earnings ratio, price-to-book ratio, and three-year sales-per-share growth value, compared to the S&P 500® Index. |
| |
| Lipper Mixed-Asset Target Allocation Moderate Funds | | Funds that, by portfolio practice, maintain a mix of between 40%-60% equity securities, with the remainder invested in bonds, cash and cash equivalents. |
| |
| Lipper Multi-Cap Core Funds | | Funds that, by portfolio practice, invest in a variety of market capitalization ranges without concentrating 75% of their equity assets in any one market capitalization range over an extended period of time. Multi-cap core funds typically have an average price-to-earnings ratio, price-to-book ratio, and three-year sales-per-share growth value, compared to the S&P SuperComposite 1500 Index. |
| |
| Lipper Small-Cap Core Funds | | Funds that, by portfolio practice, invest at least 75% of their equity assets in companies with market capitalizations (on a three-year weighted basis) less than 250% of the dollar-weighted median of the smallest 500 of the middle 1,000 securities of the S&P SuperComposite 1500 Index. Small-cap core funds have more latitude in the companies in which they invest. These funds typically have an average price-to-earnings ratio, price-to-book ratio, and three-year sales-per-share growth value, compared to the S&P SmallCap 600 Index. |
| |
| Russell 1000® Value Index | | Measures the performance of those Russell 1000® Index companies with lower price-to-book ratios and lower forecasted growth values. |
| |
| Russell 2000® Index | | Measures the performance of the 2,000 smallest companies in the Russell 3000® Index. |
| |
| Russell 2000® Value Index | | Measures the performance of those Russell 2000® Index companies with lower price-to-book ratios and lower forecasted growth values. |
| |
| Russell 3000® Value Index | | Measures the performance of those Russell 3000® Index companies with lower price-to-book ratios and lower forecasted growth values. |
| |
| Russell Midcap® Value Index | | Measures the performance of those Russell Midcap® Index companies with lower price-to-book ratios and lower forecasted growth values. |
| |
| S&P 500® Index | | A commonly recognized, market-capitalization weighted index of 500 widely held equity securities, designed to measure broad U.S. equity performance. |
| |
| Value Income Index | | Value Income Index is a hypothetical internally-calculated index which combines the total returns from the Russell 1000® Value Index (50%) and the Barclays Capital U.S. Aggregate Bond Index (50%). |
| |
| ADR | | American Depositary Receipt |
| |
| ETF | | Exchange-Traded Fund |
| |
| PLC | | Public Limited Company |
| |
| REIT | | Real Estate Investment Trust |
| |
| ULC | | Unlimited Liability Company |
| |
| U.S. Shares | | Securities of foreign companies trading on an American Stock Exchange. |
| | | |
| * | | Non-income producing security. |
| ** | | A portion of this security has been segregated by the custodian to cover margin or segregation requirements on open futures contracts, forward currency contracts, options contracts, short sales, swap agreements, and/or securities with extended settlement dates. |
| ‡ | | Rate is subject to change. Rate shown reflects current rate. |
Janus Value Funds | 89
Notes to Schedules of Investments (unaudited) (continued)
| |
| 144A | Securities sold under Rule 144A of the Securities Act of 1933, as amended, are subject to legal and/or contractual restrictions on resale and may not be publicly sold without registration under the 1933 Act. These securities have been determined to be liquid under guidelines established by the Board of Trustees. The total value of 144A securities as of the period ended December 31, 2011 is indicated in the table below: |
| | | | | | | | | | | |
| | | | | | Value as a %
| | | |
| Fund | | Value | | | of Net Assets | | | |
| |
| Perkins Value Plus Income Fund | | $ | 2,898,177 | | | | 7.1 | % | | |
| |
| |
| |
| £ | The Investment Company Act of 1940, as amended, defines affiliates as those companies in which a fund holds 5% or more of the outstanding voting securities at any time during the period ended December 31, 2011. |
| | | | | | | | | | | | | | | | | | | | | | |
| | | Purchases | | Sales | | Realized
| | Dividend
| | Value
| | |
| | | Shares | | Cost | | Shares | | Cost | | Gain/(Loss) | | Income | | at 12/31/11 | | |
| |
Perkins Mid Cap Value Fund | | | | | | | | | | | | | | | | | | | | | |
| Kaydon Corp. | | 79,049 | | $ | 2,260,273 | | 227,700 | | $ | 8,339,446 | | $ | (113,898) | | $ | 700,270 | | $ | 53,416,144 | | |
| M.D.C. Holdings, Inc. | | – | | | – | | – | | | – | | | – | | | 1,350,135 | | | 47,605,760 | | |
| Potlatch Corp. | | – | | | – | | – | | | – | | | – | | | 1,681,246 | | | 63,784,833 | | |
QLogic Corp.*,(1) | | – | | | – | | 700,000 | | | 12,121,871 | | | (2,251,118) | | | – | | | N/A | | |
| RadioShack Corp. | | 600,000 | | | 7,582,199 | | – | | | – | | | – | | | 2,900,000 | | | 56,318,000 | | |
Tech Data Corp.*,(1) | | – | | | – | | 850,000 | | | 35,818,175 | | | 2,017,662 | | | – | | | N/A | | |
| URS Corp.* | | 456,000 | | | 15,347,444 | | 356,000 | | | 16,124,694 | | | (3,211,248) | | | – | | | 161,552,000 | | |
| Washington Federal, Inc. | | – | | | – | | – | | | – | | | – | | | 1,160,000 | | | 81,142,000 | | |
| WMS Industries, Inc.* | | 1,000,000 | | | 19,229,896 | | – | | | – | | | – | | | – | | | 67,716,000 | | |
| |
| |
| | | | | $ | 44,419,812 | | | | $ | 72,404,186 | | $ | (3,558,602) | | $ | 7,791,651 | | $ | 531,534,737 | | |
| |
| |
| | | | | | | | | | | | | | | | | | | | | | |
| | | | | | | | | | | | | | | | | | | | | | |
| | | Purchases | | Sales | | Realized
| | Dividend
| | Value
| | |
| | | Shares | | Cost | | Shares | | Cost | | Gain/(Loss) | | Income | | at 12/31/11 | | |
| |
Perkins Small Cap Value Fund | | | | | | | | | | | | | | | | | | | | | |
| Angiodynamics, Inc.* | | – | | $ | – | | 10,819 | | $ | 153,476 | | $ | 2,318 | | $ | – | | $ | 26,096,272 | | |
| Callaway Golf Co. | | 298,791 | | | 1,606,745 | | 23,791 | | | 177,710 | | | (44,005) | | | 80,750 | | | 23,087,750 | | |
| Glacier Bancorp., Inc. | | 350,000 | | | 4,544,709 | | 500,000 | | | 7,518,261 | | | (2,030,610) | | | 1,075,590 | | | 45,714,000 | | |
| Glatfelter | | 615,864 | | | 7,931,993 | | 15,864 | | | 184,708 | | | 43,099 | | | 252,000 | | | 39,536,000 | | |
Granite Construction, Inc.(1) | | 613,419 | | | 12,293,696 | | 413,419 | | | 11,348,058 | | | (1,579,299) | | | 298,091 | | | N/A | | |
Harte-Hanks, Inc.(1) | | – | | | – | | 571,559 | | | 7,190,264 | | | (2,232,269) | | | 262,389 | | | N/A | | |
Infinity Property & Casualty Corp.(1) | | 66,091 | | | 3,194,756 | | 91,091 | | | 3,612,645 | | | 1,664,041 | | | 114,692 | | | N/A | | |
| Kaydon Corp. | | 186,437 | | | 5,257,817 | | 10,979 | | | 362,930 | | | 6,184 | | | 752,896 | | | 60,251,469 | | |
| MarineMax, Inc.* | | 482,387 | | | 2,953,101 | | 9,316 | | | 68,456 | | | (5,200) | | | – | | | 13,040,000 | | |
Monolithic Power Systems, Inc.*,(1) | | 300,000 | | | 3,843,135 | | 303,489 | | | 4,855,568 | | | (693,235) | | | – | | | N/A | | |
| Navigators Group, Inc.* | | – | | | – | | 300,000 | | | 14,307,280 | | | (570,705) | | | – | | | 42,912,000 | | |
PetroQuest Energy, Inc.*,(1) | | 300,000 | | | 1,923,521 | | 1,300,000 | | | 11,078,478 | | | (1,347,974) | | | – | | | N/A | | |
| Sterling Construction Co., Inc.* | | – | | | – | | 39,821 | | | 553,267 | | | (61,462) | | | – | | | 12,495,128 | | |
| |
| |
| | | | | $ | 43,549,473 | | | | $ | 61,411,101 | | $ | (6,849,117) | | $ | 2,836,408 | | $ | 263,132,619 | | |
| |
| |
| | |
| (1) | | Company was no longer an affiliate as of December 31, 2011. |
The following is a summary of the inputs that were used to value the Funds’ investments in securities and other financial instruments as of December 31, 2011. See Notes to Financial Statements for more information.
Valuation Inputs Summary (as of December 31, 2011)
| | | | | | | | | | | | |
| | | | | Level 2 – Other Significant
| | Level 3 – Significant
| | |
| | | Level 1 – Quoted Prices | | Observable Inputs(a) | | Unobservable Inputs | | |
| |
Investments in Securities: | | | | | | | | | | | |
| Perkins Large Cap Value Fund | | | | | | | | | | | |
Common Stock | | | | | | | | | | | |
| Cellular Telecommunications | | $ | – | | $ | 2,102,250 | | $ | – | | |
| Food – Miscellaneous/Diversified | | | – | | | 1,424,600 | | | – | | |
| Medical – Drugs | | | 7,637,972 | | | 1,114,815 | | | – | | |
| Medical – Generic Drugs | | | – | | | 968,640 | | | – | | |
| Oil and Gas Drilling | | | – | | | 1,126,080 | | | – | | |
| Publishing – Books | | | – | | | 940,005 | | | – | | |
| All Other | | | 103,636,139 | | | – | | | – | | |
| | | | | | | | | | | | |
| | | | | | | | | | | | |
Repurchase Agreement | | | – | | | 13,281,000 | | | – | | |
| | | | | | | | | | | | |
| | | | | | | | | | | | |
| Total Investments in Securities | | $ | 111,274,111 | | $ | 20,957,390 | | $ | – | | |
| |
| |
90 | DECEMBER 31, 2011
| | | | | | | | | | | | |
| | | | | Level 2 – Other Significant
| | Level 3 – Significant
| | |
| | | Level 1 – Quoted Prices | | Observable Inputs(a) | | Unobservable Inputs | | |
| |
Investments in Securities: | | | | | | | | | | | |
| Perkins Mid Cap Value Fund | | | | | | | | | | | |
Common Stock | | | | | | | | | | | |
| Cellular Telecommunications | | $ | – | | $ | 156,981,594 | | $ | – | | |
| Food – Miscellaneous/Diversified | | | – | | | 117,320,000 | | | – | | |
| Medical – Drugs | | | 42,364,000 | | | 108,623,000 | | | – | | |
| Medical – Generic Drugs | | | – | | | 76,706,400 | | | – | | |
| Oil and Gas Drilling | | | – | | | 129,052,662 | | | – | | |
| All Other | | | 11,042,525,532 | | | – | | | – | | |
| | | | | | | | | | | | |
| | | | | | | | | | | | |
Repurchase Agreements | | | – | | | 1,182,955,000 | | | – | | |
| | | | | | | | | | | | |
| | | | | | | | | | | | |
| Total Investments in Securities | | $ | 11,084,889,532 | | $ | 1,771,638,656 | | $ | – | | |
| |
| |
Investments in Securities: | | | | | | | | | | | |
| Perkins Select Value Fund | | | | | | | | | | | |
Common Stock | | | | | | | | | | | |
| Cellular Telecommunications | | $ | – | | $ | 1,329,240 | | $ | – | | |
| Medical – Drugs | | | 1,042,220 | | | 514,530 | | | – | | |
| Medical – Generic Drugs | | | – | | | 645,760 | | | – | | |
| Medical Labs and Testing Services | | | – | | | 564,630 | | | – | | |
| All Other | | | 33,940,494 | | | – | | | – | | |
| | | | | | | | | | | | |
| | | | | | | | | | | | |
Repurchase Agreement | | | – | | | 16,700,000 | | | – | | |
| | | | | | | | | | | | |
| | | | | | | | | | | | |
| Total Investments in Securities | | $ | 34,982,714 | | $ | 19,754,160 | | $ | – | | |
| |
| |
Investments in Securities: | | | | | | | | | | | |
| Perkins Small Cap Value Fund | | | | | | | | | | | |
Common Stock | | | | | | | | | | | |
| Medical Labs and Testing Services | | $ | 15,087,600 | | $ | 35,931,000 | | $ | – | | |
| All Other | | | 2,358,199,337 | | | – | | | – | | |
| | | | | | | | | | | | |
| | | | | | | | | | | | |
Repurchase Agreements | | | – | | | 413,408,000 | | | – | | |
| | | | | | | | | | | | |
| | | | | | | | | | | | |
| Total Investments in Securities | | $ | 2,373,286,937 | | $ | 449,339,000 | | $ | – | | |
| |
| |
Investments in Securities: | | | | | | | | | | | |
| Perkins Value Plus Income Fund | | | | | | | | | | | |
Asset-Backed/Commercial Mortgage-Backed Securities | | $ | – | | $ | 386,115 | | $ | – | | |
| | | | | | | | | | | | |
| | | | | | | | | | | | |
Bank Loans | | | – | | | 108,992 | | | – | | |
| | | | | | | | | | | | |
| | | | | | | | | | | | |
Common Stock | | | | | | | | | | | |
| Cellular Telecommunications | | | – | | | 756,779 | | | – | | |
| Food – Miscellaneous/Diversified | | | – | | | 174,304 | | | – | | |
| Medical – Drugs | | | 1,116,835 | | | 548,355 | | | – | | |
| Medical – Generic Drugs | | | – | | | 201,800 | | | – | | |
| Oil and Gas Drilling | | | – | | | 140,760 | | | – | | |
| Oil Companies – Integrated | | | 668,177 | | | 682,935 | | | – | | |
| Transportation – Services | | | 95,147 | | | 52,650 | | | – | | |
| All Other | | | 17,720,331 | | | – | | | – | | |
| | | | | | | | | | | | |
| | | | | | | | | | | | |
Corporate Bonds | | | – | | | 12,555,283 | | | – | | |
| | | | | | | | | | | | |
| | | | | | | | | | | | |
Mortgaged-Backed Securities | | | – | | | 2,704,345 | | | – | | |
| | | | | | | | | | | | |
| | | | | | | | | | | | |
Preferred Stock | | | – | | | 54,148 | | | – | | |
| | | | | | | | | | | | |
| | | | | | | | | | | | |
U.S. Treasury Notes/Bonds | | | – | | | 1,642,883 | | | – | | |
| | | | | | | | | | | | |
| | | | | | | | | | | | |
Money Market | | | – | | | 1,162,096 | | | – | | |
| | | | | | | | | | | | |
| | | | | | | | | | | | |
| Total Investments in Securities | | $ | 19,600,490 | | $ | 21,171,445 | | $ | – | | |
| |
| |
Investments in Purchased Options: | | | | | | | | | | | |
| Perkins Mid Cap Value Fund | | $ | – | | $ | 24,435,278 | | $ | – | | |
| |
| |
Janus Value Funds | 91
Notes to Schedules of Investments (unaudited) (continued)
| | | | | | | | | | | | |
| | | | | Level 2 – Other Significant
| | Level 3 – Significant
| | |
| | | Level 1 – Quoted Prices | | Observable Inputs(a) | | Unobservable Inputs | | |
| |
Other Financial Instruments(b): | | | | | | | | | | | |
| Perkins Mid Cap Value Fund | | $ | – | | $ | (3,000,126) | | $ | – | | |
| Perkins Value Plus Income Fund | | | – | | | (7,750) | | | – | | |
| |
| |
| | | |
| (a) | | Includes Fair Value Factors. |
| (b) | | Other financial instruments include futures, forward currency, written option, and swap contracts. Forward currency contracts and swap contracts are reported at their unrealized appreciation/(depreciation) at measurement date, which represents the change in the contract’s value from trade date. Futures are reported at their variation margin at measurement date, which represents the amount due to/from the Fund at that date. Options are reported at their market value at measurement date. |
Aggregate collateral segregated to cover margin or segregation requirements on open futures contracts, forward currency contracts, options contracts, short sales, swap agreements, and/or securities with extended settlement dates as of December 31, 2011 is noted below.
| | | | | | |
| Fund | | Aggregate Value | | |
| |
| |
| Perkins Mid Cap Value Fund | | $ | 5,745,399 | | |
| Perkins Value Plus Income Fund | | | 2,179,973 | | |
| |
| |
Repurchase agreements held by a Fund are fully collateralized, and such collateral is in the possession of the Fund’s custodian or, for tri-party agreements, the custodian designated by the agreement. The collateral is evaluated daily to ensure its market value exceeds the current market value of the repurchase agreements, including accrued interest. In the event of default on the obligation to repurchase, the Fund has the right to liquidate the collateral and apply the proceeds in satisfaction of the obligation. In the event of default or bankruptcy by the other party to the agreement, realization and/or retention of the collateral or proceeds may be subject to legal proceedings.
92 | DECEMBER 31, 2011
Notes to Financial Statements (unaudited)
The following section describes the organization and significant accounting policies and provides more detailed information about the schedules and tables that appear throughout this report. In addition, the Notes to Financial Statements explain the methods used in preparing and presenting this report.
| |
| 1. | Organization and Significant Accounting Policies |
Perkins Large Cap Value Fund, Perkins Mid Cap Value Fund, Perkins Select Value Fund, Perkins Small Cap Value Fund and Perkins Value Plus Income Fund (individually, a “Fund” and collectively, the “Funds”) are series funds. The Funds are part of Janus Investment Fund (the “Trust”), which is organized as a Massachusetts business trust and is registered under the Investment Company Act of 1940, as amended (the “1940 Act”), as an open-end management investment company. The financial statements include information for the fiscal period from December 15, 2011 (inception date) through December 31, 2011 for Perkins Select Value Fund and for the six-month period ended December 31, 2011 for Perkins Large Cap Value Fund, Perkins Mid Cap Value Fund, Perkins Small Cap Value Fund, and Perkins Value Plus Income Fund. The Trust offers forty-five funds which include multiple series of shares, with differing investment objectives and policies. The Funds invest primarily in equity securities. Each Fund in this report is classified as diversified, as defined in the 1940 Act.
Each Fund in this report offers multiple classes of shares in order to meet the needs of various types of investors. Each class represents an interest in the same portfolio of investments. Certain financial intermediaries may not offer all classes of shares.
Class A Shares and Class C Shares are generally offered through financial intermediary platforms including, but not limited to, traditional brokerage platforms, mutual fund wrap fee programs, bank trust platforms, and retirement platforms. The maximum purchase in Class C Shares is $500,000 for any single purchase.
Class D Shares are generally no longer being made available to new investors. The Shares are available only to investors who hold accounts directly with the Janus funds and to immediate family members or members of the same household of an eligible individual investor. The Shares are not offered through financial intermediaries.
Class I Shares are available through certain financial intermediary platforms including, but not limited to, mutual fund wrap fee programs, managed account programs, asset allocation programs, and bank trust platforms, as well as certain retirement platforms. Class I Shares are also available to certain institutional investors including, but not limited to, corporations, certain retirement plans, public plans, and foundations/endowments.
Class L Shares are designed for pension and profit-sharing plans, employee benefit trusts, endowments, foundations and corporations, as well as high net worth individuals and financial intermediaries who are willing to maintain a minimum account balance of $250,000.
Class R Shares are offered through financial intermediary platforms including, but not limited to, retirement platforms.
Class S Shares are offered through financial intermediary platforms including, but not limited to, retirement platforms and asset allocation, mutual fund wrap, or other discretionary or nondiscretionary fee-based investment advisory programs. In addition, Class S Shares may be available through certain financial intermediaries who have an agreement with Janus Capital Management LLC (“Janus Capital”) or its affiliates to offer Class S Shares on their supermarket platforms.
Class T Shares are available through certain financial intermediary platforms including, but not limited to, mutual fund wrap fee programs, managed account programs, asset allocation programs, bank trust platforms, as well as certain retirement platforms. In addition, Class T Shares may be available through certain financial intermediaries who have an agreement with Janus Capital or its affiliates to offer Class T Shares on their supermarket platforms.
The following accounting policies have been followed by the Funds and are in conformity with accounting principles generally accepted in the United States of America within the investment management industry.
Investment Valuation
Securities are valued at the last sales price or the official closing price for securities traded on a principal securities exchange (U.S. or foreign) and on the NASDAQ National Market. Securities traded on over-the-counter (“OTC”) markets and listed securities for which no sales are reported are valued at the latest bid price (or yield equivalent thereof) obtained from one or more dealers transacting in a market for such securities or by a pricing service approved by the Funds’ Trustees. Short-term securities with maturities of 60 days or less may be valued at amortized cost, which approximates market value. Debt securities with a remaining maturity of greater than 60 days are valued in accordance with the evaluated bid price supplied by the pricing service. The evaluated bid price supplied by the pricing service is an evaluation that reflects such factors as security prices, yields, maturities and ratings. Short positions shall be valued in accordance with the same methodologies, except that in the event that a last sale price is not available, the latest ask price shall be used instead of a bid price. Foreign securities and
Janus Value Funds | 93
Notes to Financial Statements (unaudited) (continued)
currencies are converted to U.S. dollars using the applicable exchange rate in effect as of the daily close of the New York Stock Exchange (“NYSE”). When market quotations are not readily available or deemed unreliable, or events or circumstances that may affect the value of portfolio securities held by the Funds are identified between the closing of their principal markets and the time the net asset value (“NAV”) is determined, securities may be valued at fair value as determined in good faith under procedures established by and under the supervision of the Funds’ Trustees. Circumstances in which fair value pricing may be utilized include, but are not limited to: (i) a significant event that may affect the securities of a single issuer, such as a merger, bankruptcy, or significant issuer specific development; (ii) an event that may affect an entire market, such as a natural disaster or significant governmental action; (iii) a nonsignificant event such as a market closing early or not opening, or a security trading halt; and (iv) pricing of a non-valued security and a restricted or non-public security. The Funds may use systematic fair valuation models provided by independent third parties to value international equity securities in order to adjust for stale pricing, which may occur between the close of certain foreign exchanges and the close of the NYSE. Restricted and illiquid securities are valued in accordance with procedures established by the Funds’ Trustees.
Investment Transactions and Investment Income
Investment transactions are accounted for as of the date purchased or sold (trade date). Dividend income is recorded on the ex-dividend date. Certain dividends from foreign securities will be recorded as soon as the Trust is informed of the dividend, if such information is obtained subsequent to the ex-dividend date. Dividends from foreign securities may be subject to withholding taxes in foreign jurisdictions. Interest income is recorded on the accrual basis and includes amortization of premiums and accretion of discounts. Gains and losses are determined on the identified cost basis, which is the same basis used for federal income tax purposes. Income, as well as gains and losses, both realized and unrealized, are allocated daily to each class of shares based upon the ratio of net assets represented by each class as a percentage of total net assets.
Expenses
Each Fund bears expenses incurred specifically on its behalf, as well as a portion of general expenses, which may be allocated pro rata to each Fund. Each class of shares bears expenses incurred specifically on its behalf and, in addition, each class bears a portion of general expenses, which are allocated daily to each class of shares based upon the ratio of net assets represented by each class as a percentage of total net assets. Expenses directly attributable to a specific class of shares are charged against the operations of such class.
Estimates
The preparation of financial statements in conformity with accounting principles generally accepted in the United States of America requires management to make estimates and assumptions that affect the reported amount of assets and liabilities and disclosure of contingent assets and liabilities at the date of the financial statements, and the reported amounts of income and expenses during the reporting period. Actual results could differ from those estimates.
Foreign Currency Translations
The Funds do not isolate that portion of the results of operations resulting from the effect of changes in foreign exchange rates on investments from the fluctuations arising from changes in market prices of securities held at the date of the financial statements. Net unrealized appreciation or depreciation of investments and foreign currency translations arise from changes in the value of assets and liabilities, including investments in securities held at the date of the financial statements, resulting from changes in the exchange rates and changes in market prices of securities held.
Currency gains and losses are also calculated on payables and receivables that are denominated in foreign currencies. The payables and receivables are generally related to foreign security transactions and income translations.
Foreign currency-denominated assets and forward currency contracts may involve more risks than domestic transactions, including currency risk, political and economic risk, regulatory risk and equity risk. Risks may arise from the potential inability of a counterparty to meet the terms of a contract and from unanticipated movements in the value of foreign currencies relative to the U.S. dollar.
Dividend Distributions
Dividends of net investment income for Perkins Value Plus Income Fund are normally declared and distributed monthly, and realized capital gains (if any) are distributed annually. The other Funds generally declare and distribute dividends of net investment income and realized capital gains (if any) annually. The majority of dividends and capital gains distributions from the Funds may be automatically reinvested into additional shares of that Fund, based on the discretion of the shareholder.
The Funds may make certain investments in real estate investment trusts (“REITs”) which pay dividends to their
94 | DECEMBER 31, 2011
shareholders based upon funds available from operations. It is quite common for these dividends to exceed the REITs’ taxable earnings and profits, resulting in the excess portion of such dividends being designated as a return of capital. If the Funds distribute such amounts, such distributions could constitute a return of capital to shareholders for federal income tax purposes.
Federal Income Taxes
No provision for income taxes is included in the accompanying financial statements as the Funds intend to distribute to shareholders all taxable investment income and realized gains and otherwise comply with Subchapter M of the Internal Revenue Code applicable to regulated investment companies.
In accordance with the Financial Accounting Standards Board (“FASB”) guidance, the Funds adopted the provisions of “Income Taxes.” These provisions require an evaluation of tax positions taken (or expected to be taken) in the course of preparing a Fund’s tax return to determine whether these positions meet a “more-likely-than-not” standard that, based on the technical merits, have a more than fifty percent likelihood of being sustained by a taxing authority upon examination. A tax position that meets the “more-likely-than-not” recognition threshold is measured to determine the amount of benefit to recognize in the financial statements. The Funds recognize interest and penalties, if any, related to unrecognized tax benefits in income tax expense on the Statements of Operations.
These provisions require management of the Funds to analyze all open tax years, as defined by the Statute of Limitations, for all major jurisdictions, including federal tax authorities and certain state tax authorities. As of and during the period ended December 31, 2011, the Funds did not have a liability for any unrecognized tax benefits. The Funds have no examinations in progress and are not aware of any tax positions for which it is reasonably possible that the total amounts of unrecognized tax benefits will significantly change in the next twelve months.
On December 22, 2010, the Regulated Investment Company Modernization Act of 2010 (the “Modernization Act”) was signed by the President. The Modernization Act is the first major piece of legislation affecting Regulated Investment Companies (“RICs”) since 1986 and it modernizes several of the federal income and excise tax provisions related to RICs. Some of the enacted provisions include:
New capital losses may now be carried forward indefinitely, and retain the character of the original loss. Under pre-enactment law, capital losses could be carried forward for eight years, and carried forward as short-term capital, irrespective of the character of the original loss.
The Modernization Act contains simplification provisions, which are aimed at preventing disqualification of a RIC for “inadvertent” failures of the asset diversification and/or qualifying income tests. Additionally, the Modernization Act exempts RICs from the preferential dividend rule, and repeals the 60-day designation requirement for certain types of pay-through income and gains.
Finally, the Modernization Act contains several provisions aimed at preserving the character of distributions made by a fiscal year RIC during the portion of its taxable year ending after October 31 or December 31, reducing the circumstances under which a RIC might be required to file amended Forms 1099 to restate previously reported distributions.
Except for the simplification provisions related to RIC qualification, the Modernization Act is effective for taxable years beginning after December 22, 2010. The provisions related to RIC qualification are effective for taxable years for which the extended due date of the tax return is after December 22, 2010.
Restricted Cash
As of December 31, 2011, Perkins Mid Cap Value Fund had restricted cash in the amount of $1,500,000, respectively. The restricted cash represents collateral received in relation to options contracts invested in by the Fund at December 31, 2011. The restricted cash is held at the Fund’s custodian, State Street Bank and Trust Company. The carrying value of the restricted cash approximates fair value.
Valuation Inputs Summary
In accordance with FASB guidance, the Funds utilize the “Fair Value Measurements” to define fair value, establish a framework for measuring fair value, and expand disclosure requirements regarding fair value measurements. The Fair Value Measurement Standard does not require new fair value measurements, but is applied to the extent that other accounting pronouncements require or permit fair value measurements. This standard emphasizes that fair value is a market-based measurement that should be determined based on the assumptions that market participants would use in pricing an asset or liability. Various inputs are used in determining the value of the Funds’ investments defined pursuant to this standard. These inputs are summarized into three broad levels:
Level 1 – Quoted prices in active markets for identical securities.
Level 2 – Prices determined using other significant observable inputs. Observable inputs are inputs that
Janus Value Funds | 95
Notes to Financial Statements (unaudited) (continued)
reflect the assumptions market participants would use in pricing a security and are developed based on market data obtained from sources independent of the reporting entity. These may include quoted prices for similar securities, interest rates, prepayment speeds, credit risk, and others.
Debt securities are valued in accordance with the evaluated bid price supplied by the pricing service and generally categorized as Level 2 in the hierarchy. Securities traded on OTC markets and listed securities for which no sales are reported are valued at the latest bid price (or yield equivalent thereof) obtained from one or more dealers transacting in a market for such securities or by a pricing service approved by the Funds’ Trustees and are categorized as Level 2 in the hierarchy. Short-term securities with maturities of 60 days or less are valued at amortized cost, which approximates market value and are categorized as Level 2 in the hierarchy. Other securities that are categorized as Level 2 in the hierarchy include, but are not limited to, preferred stocks, bank loans, American Depositary Receipts (ADRs), Global Depositary Receipts (GDRs), warrants, swaps, investments in mutual funds, OTC options, and forward contracts. The Funds may use systematic fair valuation models provided by independent third parties to value international equity securities in order to adjust for stale pricing, which may occur between the close of certain foreign exchanges and the close of the NYSE. These are generally categorized as Level 2 in the hierarchy.
Level 3 – Prices determined using significant unobservable inputs. In situations where quoted prices or observable inputs are unavailable or deemed less relevant (for example, when there is little or no market activity for an investment at the end of the period), unobservable inputs may be used. Unobservable inputs are inputs that reflect the reporting entity’s own assumptions about the factors market participants would use in pricing the security and would be based on the best information available under the circumstances.
For restricted equity securities and private placements where observable inputs are limited, assumptions about market activity and risk are used in employing valuation techniques such as the market approach, the income approach, or the cost approach, as defined under the FASB Guidance. These are categorized as Level 3 in the hierarchy.
There have been no significant changes in valuation techniques used in valuing any such positions held by the Funds since the beginning of the fiscal year.
The inputs or methodology used for valuing securities are not necessarily an indication of the risk associated with investing in those securities. The summary of inputs used as of December 31, 2011 to value the Funds’ investments in securities and other financial instruments is included in the “Valuation Inputs Summary” and “Level 3 Valuation Reconciliation of Assets” (if applicable) in the Notes to Schedules of Investments.
The Funds adopted FASB Accounting Standards Update “Fair Value Measurements and Disclosures” (the “Update”). This Update applies to a Fund’s disclosures about transfers in and out of Level 1 and Level 2 of the fair value hierarchy and the reasons for the transfers. Disclosures about the valuation techniques and inputs used to measure fair value for investments that fall in either Level 2 or Level 3 fair value hierarchy are summarized under the Level 2 and Level 3 categories listed above.
There were no Level 3 securities during the period.
The following table shows transfers between Level 1 and Level 2 of the fair value hierarchy during the period ended December 31, 2011.
| | | | | | | | | | | |
| | | Transfers In
| | | Transfers Out
| | | |
| | | Level 1 to
| | | Level 2
| | | |
| Fund | | Level 2 | | | to Level 1 | | | |
| |
| |
| Perkins Mid Cap Value Fund | | $ | – | | | $ | 110,024,896 | | | |
| Perkins Value Plus Income Fund | | | – | | | | 410,288 | | | |
| |
| |
Financial assets were transferred from Level 2 to Level 1 since certain foreign equity prices were applied a fair valuation adjustment factor at the beginning of the fiscal year and no factor was applied at the end of the period.
The Funds recognize transfers between the levels as of the beginning of the fiscal year.
| |
| 2. | Derivative Instruments |
The Funds may invest in various types of derivatives, which may at times result in significant derivative exposure. A derivative is a financial instrument whose performance is derived from the performance of another asset. The Funds may invest in derivative instruments including, but not limited to: futures contracts, put options, call options, options on swap contracts, options on future contracts, options on foreign currencies, swaps, forward contracts, structured investments, and other equity-linked derivatives. Each derivative instrument that was held by one or more Funds during the period ended December 31, 2011 is discussed in further detail below. A summary of derivative activity by Fund is reflected in the tables at the end of this section.
The Funds may use derivative instruments for hedging (to offset risks associated with an investment, currency
96 | DECEMBER 31, 2011
exposure, or market conditions) or for speculative (to seek to enhance returns) purposes. When the Funds invest in a derivative for speculative purposes, the Funds will be fully exposed to the risks of loss of that derivative, which may sometimes be greater than the cost of the derivative. The Funds may not use any derivative to gain exposure to an asset or class of assets prohibited by their investment restrictions from purchasing directly. The Funds’ ability to use derivative instruments may also be limited by tax considerations.
Investments in derivatives are generally subject to market risks that may cause their prices to fluctuate over time. Investments in derivatives may not directly correlate with the price movements of the underlying instrument. As a result, the use of derivatives may expose the Funds to additional risks that they would not be subject to if they invested directly in the securities underlying those derivatives. The use of derivatives may result in larger losses or smaller gains than otherwise would be the case. Derivatives can be volatile and may involve significant risks, including, but not limited to, counterparty risk, credit risk, currency risk, equity risk, index risk, interest rate risk, leverage risk, and liquidity risk.
Derivatives may generally be traded OTC or on an exchange. Derivatives traded OTC, such as options and structured notes, are agreements that are individually negotiated between parties and can be tailored to meet a purchaser’s needs.
OTC derivatives are not guaranteed by a clearing agency and may be subject to increased credit risk. In an effort to mitigate credit risk associated with derivatives traded OTC, the Funds may enter into collateral agreements with certain counterparties whereby, subject to certain minimum exposure requirements, a Fund may require the counterparty to post collateral if the Fund has a net aggregate unrealized gain on all OTC derivative contracts with a particular counterparty. There is no guarantee that counterparty exposure is reduced and these arrangements are dependent on Janus Capital’s ability to establish and maintain appropriate systems and trading.
In pursuit of their investment objectives, each Fund may seek to use derivatives to increase or decrease exposure to the following market risk factors:
| | |
| | • | Counterparty Risk – Counterparty risk is the risk that the counterparty (the party on the other side of the transaction) on a derivative transaction will be unable to honor its financial obligation to a Fund. |
| |
| | • | Credit Risk – Credit risk is the risk an issuer will be unable to make principal and interest payments when due, or will default on its obligations. |
| |
| | • | Currency Risk – Currency risk is the risk that changes in the exchange rate between currencies will adversely affect the value (in U.S. dollar terms) of an investment. |
| |
| | • | Equity Risk – Equity risk relates to the change in value of equity securities as they relate to increases or decreases in the general market. |
| |
| | • | Index Risk – If the derivative is linked to the performance of an index, it will be subject to the risks associated with changes in that index. If the index changes, a Fund could receive lower interest payments or experience a reduction in the value of the derivative to below what the Fund paid. Certain indexed securities, including inverse securities (which move in an opposite direction to the index), may create leverage, to the extent that they increase or decrease in value at a rate that is a multiple of the changes in the applicable index. |
| |
| | • | Interest Rate Risk – Interest rate risk is the risk that the value of fixed-income securities will generally decline as prevailing interest rates rise, which may cause a Fund’s NAV to likewise decrease, and vice versa. |
| |
| | • | Leverage Risk – Leverage risk is the risk associated with certain types of leveraged investments or trading strategies pursuant to which relatively small market movements may result in large changes in the value of an investment. A Fund creates leverage by using borrowed capital to increase the amount invested, or investing in instruments, including derivatives, where the investment loss can exceed the original amount invested. Certain investments or trading strategies that involve leverage can result in losses that greatly exceed the amount originally invested. |
| |
| | • | Liquidity Risk – Liquidity risk is the risk that certain securities may be difficult or impossible to sell at the time that the seller would like or at the price that the seller believes the security is currently worth. |
Futures Contracts
A futures contract is an exchange-traded agreement to take or make delivery of an underlying asset at a specific time in the future for a specific predetermined negotiated price. The Funds may enter into futures contracts to gain exposure to the stock market pending investment of cash balances or to meet liquidity needs. The Funds are subject to interest rate risk, equity risk, and currency risk in the normal course of pursuing their investment objectives
Janus Value Funds | 97
Notes to Financial Statements (unaudited) (continued)
through their investments in futures contracts. The Funds may also use such derivative instruments to hedge or protect from adverse movements in securities prices, currency rates or interest rates. The use of futures contracts may involve risks such as the possibility of illiquid markets or imperfect correlation between the values of the contracts and the underlying securities, or that the counterparty will fail to perform its obligations.
Futures contracts are marked-to-market daily, and the daily variation margin is recorded as a receivable or payable on the Statements of Assets and Liabilities (if applicable). When a contract is closed, a realized gain or loss is recorded as “Net realized gain/(loss) from futures contracts” on the Statements of Operations (if applicable), equal to the difference between the opening and closing value of the contract. Generally, futures contracts are marked-to-market (i.e., treated as realized and subject to distribution) for federal income tax purposes at fiscal year-end. Securities held by the Funds that are designated as collateral for market value on futures contracts are noted on the Schedules of Investments (if applicable). Such collateral is in the possession of the Funds’ custodian or with the counterparty broker.
With futures, there is minimal counterparty credit risk to the Funds since futures are exchange-traded and the exchange’s clearinghouse, as counterparty to all exchange-traded futures, guarantees the futures against default.
Options Contracts
An options contract provides the purchaser with the right, but not the obligation, to buy (call option) or sell (put option) a financial instrument at an agreed upon price. The Funds may purchase or write covered and uncovered put and call options on swap contracts (“swaptions”), futures contracts, and on portfolio securities for hedging purposes or as a substitute for an investment. The Funds are subject to interest rate risk, liquidity risk, equity risk, and currency risk in the normal course of pursuing their investment objectives through their investments in options contracts. The Funds may use options contracts to hedge against changes in interest rates, the values of equities, or foreign currencies. The Funds may utilize American-style and European-style options. An American-style option is an option contract that can be exercised at any time between the time of purchase and the option’s expiration date. A European-style option is an option contract that can only be exercised on the option’s expiration date. The Funds may also purchase or write put and call options on foreign currencies in a manner similar to that in which futures or forward contracts on foreign currencies will be utilized. The Funds may also invest in long-term equity anticipation securities, which are long-term option contracts that can be maintained for a period of up to three years. The Funds may also enter into a swaption contract which grants the purchaser the right, but not the obligation, to enter into a swap transaction at preset terms detailed in the underlying agreement within a specified period of time. Entering into a swaption contract involves, to varying degrees, the elements of credit, market and interest rate risk, associated with both option contracts and swap contracts. The Funds generally invest in options to hedge against adverse movements in the value of portfolio holdings.
When an option is written, the Funds receive a premium and become obligated to sell or purchase the underlying security at a fixed price, upon exercise of the option. In writing an option, the Funds bear the risk of an unfavorable change in the price of the security underlying the written option. Exercise of an option written by the Funds could result in the Funds buying or selling a security at a price different from the current market value.
When an option is exercised, the proceeds on sales for a written call option, the purchase cost for a written put option, or the cost of the security for a purchased put or call option are adjusted by the amount of premium received or paid.
The Funds may also purchase and write exchange-listed and OTC put and call options on domestic securities indices, and on foreign securities indices listed on domestic and foreign securities exchanges. Options on securities indices are similar to options on securities except that (1) the expiration cycles of securities index options are monthly, while those of securities options are currently quarterly, and (2) the delivery requirements are different. Instead of giving the right to take or make delivery of securities at a specified price, an option on a securities index gives the holder the right to receive a cash “exercise settlement amount” equal to (a) the amount, if any, by which the fixed exercise price of the option exceeds (in the case of a put) or is less than (in the case of a call) the closing value of the underlying index on the date of exercise, multiplied by (b) a fixed “index multiplier.” Receipt of this cash amount will depend upon the closing level of the securities index upon which the option is based being greater than, in the case of a call, or less than, in the case of a put, the exercise price of the index and the exercise price of the option times a specified multiple. The writer of the option is obligated, in return for the premium received, to make delivery of this amount.
Options traded on an exchange are regulated and the terms of the options are standardized. Options traded OTC expose the Funds to counterparty risk in the event that the counterparty does not perform. This risk is mitigated
98 | DECEMBER 31, 2011
by having a netting arrangement between the Funds and the counterparty and by having the counterparty post collateral to cover the Funds’ exposure to the counterparty.
Holdings of the Funds designated to cover outstanding written options are noted on the Schedules of Investments (if applicable). Options written are reported as a liability on the Statements of Assets and Liabilities as “Options written at value” (if applicable). Realized gains and losses are reported as “Net realized gain/(loss) from written options contracts” on the Statements of Operations (if applicable).
The risk in writing call options is that the Funds give up the opportunity for profit if the market price of the security increases and the options are exercised. The risk in writing put options is that the Funds may incur a loss if the market price of the security decreases and the options are exercised. The risk in buying options is that the Funds pay a premium whether or not the options are exercised. The use of such instruments may involve certain additional risks as a result of unanticipated movements in the market. A lack of correlation between the value of an instrument underlying an option and the asset being hedged, or unexpected adverse price movements, could render the Funds’ hedging strategy unsuccessful. In addition, there can be no assurance that a liquid secondary market will exist for any option purchased or sold. There is no limit to the loss the Funds may recognize due to written call options.
Written option activity for the period ended December 31, 2011 is indicated in the tables below:
| | | | | | | | | |
| | | Number of
| | Premiums
| | |
| Call Options | | Contracts | | Received | | |
| |
| |
| Perkins Mid Cap Value Fund | | | | | | | | |
| Options outstanding at June 30, 2011 | | | – | | $ | – | | |
| Options written | | | 18,250 | | | 7,077,350 | | |
| Options closed | | | (7,160) | | | (2,623,380) | | |
| Options expired | | | (3,790) | | | (1,395,270) | | |
| Options exercised | | | – | | | – | | |
| |
| |
| Options outstanding at December 31, 2011 | | | 7,300 | | $ | 3,058,700 | | |
| |
| |
| | | | | | | | | |
| | | Number of
| | Premiums
| | |
| Put Options | | Contracts | | Received | | |
| |
| |
| Perkins Mid Cap Value Fund | | | | | | | | |
| Options outstanding at June 30, 2011 | | | 131,480 | | $ | 23,549,564 | | |
| Options written | | | 17,075 | | | 2,709,648 | | |
| Options closed | | | (131,015) | | | (22,373,535) | | |
| Options expired | | | (17,540) | | | (3,885,677) | | |
| Options exercised | | | – | | | – | | |
| |
| |
| Options outstanding at December 31, 2011 | | | – | | $ | – | | |
| |
| |
| | | | | | | | | |
| | | Number of
| | Premiums
| | |
| Call Options | | Contracts | | Received | | |
| |
| |
| Perkins Value Plus Income Fund | | | | | | | | |
| Options outstanding at June 30, 2011 | | | 182 | | $ | 2,434 | | |
| Options written | | | 1,014 | | | 21,946 | | |
| Options closed | | | (71) | | | (1,653) | | |
| Options expired | | | (846) | | | (16,020) | | |
| Options exercised | | | (86) | | | (1,942) | | |
| |
| |
| Options outstanding at December 31, 2011 | | | 193 | | $ | 4,765 | | |
| |
| |
| | | | | | | | | |
| | | Number of
| | Premiums
| | |
| Put Options | | Contracts | | Received | | |
| |
| |
| Perkins Value Plus Income Fund | | | | | | | | |
| Options outstanding at June 30, 2011 | | | 223 | | $ | 6,286 | | |
| Options written | | | 1,282 | | | 30,058 | | |
| Options closed | | | – | | | – | | |
| Options expired | | | (1,131) | | | (29,276) | | |
| Options exercised | | | (160) | | | (2,590) | | |
| |
| |
| Options outstanding at December 31, 2011 | | | 214 | | $ | 4,478 | | |
| |
| |
In accordance with FASB guidance, the Funds adopted the provisions for “Derivatives and Hedging,” which require qualitative disclosures about objectives and strategies for using derivatives, quantitative disclosures about fair value amounts of and gains and losses on derivative instruments, and disclosures about credit-risk-related contingent features in derivative agreements.
The following tables, grouped by derivative type, provide information about the fair value and location of derivatives within the Statements of Assets and Liabilities as of December 31, 2011.
Fair Value of Derivative Instruments as of December 31, 2011
| | | | | | | | | | | | | |
Derivatives not accounted
| | Asset Derivatives | | | Liability Derivatives | |
| for as hedging instruments | | Statements of Assets and Liabilities Location | | Fair Value | | | Statements of Assets and Liabilities Location | | Fair Value | |
| |
| |
Perkins Mid Cap Value Fund | | | | | | | | | | | | |
| Equity Contracts | | Unaffiliated investments at value | | $ | 24,435,278 | | | Options written, at value | | $ | 3,000,126 | |
| |
| |
| Total | | | | $ | 24,435,278 | | | | | $ | 3,000,126 | |
| |
| |
| | | | | | | | | | | | | |
Derivatives not accounted for as
| | Asset Derivatives | | | Liability Derivatives | |
| hedging instruments | | Statements of Assets and Liabilities Location | | Fair Value | | | Statements of Assets and Liabilities Location | | Fair Value | |
| |
| |
Perkins Value Plus Income Fund | | | | | | | | | | | | |
| Equity Contracts | | | | | | | | Options written, at value | | $ | 7,750 | |
| |
| |
| Total | | | | | | | | | | $ | 7,750 | |
| |
| |
Janus Value Funds | 99
Notes to Financial Statements (unaudited) (continued)
The following tables provide information about the effect of derivatives and hedging activities on the Fund’s Statements of Operations for the period ended December 31, 2011.
The effect of Derivative Instruments on the Statements of Operations for the six-month period ended December 31, 2011
| | | | | | | | | | | | | | | | | | | | | |
| Amount of Realized Gain/(Loss) on Derivatives Recognized in Income | |
| Derivatives not accounted for as hedging instruments | | Futures | | | Swaps | | | Options | | | Forward Currency Contracts | | | Total | |
| |
| |
Perkins Mid Cap Value Fund | | | | | | | | | | | | | | | | | | | | |
| |
| |
| Equity Contracts | | $ | – | | | $ | – | | | $ | 67,138,496 | | | $ | – | | | $ | 67,138,496 | |
| |
| |
| Total | | $ | – | | | $ | – | | | $ | 67,138,496 | | | $ | – | | | $ | 67,138,496 | |
| |
| |
| | | | | | | | | | | | | | | | | | | | | |
| Change in Unrealized Appreciation/(Depreciation) on Derivatives Recognized in Income | |
| Derivatives not accounted for as hedging instruments | | Futures | | | Swaps | | | Options | | | Forward Currency Contracts | | | Total | |
| |
| |
Perkins Mid Cap Value Fund | | | | | | | | | | | | | | | | | | | | |
| |
| |
| Equity Contracts | | $ | – | | | $ | – | | | $ | (1,982,342 | ) | | $ | – | | | $ | (1,982,342 | ) |
| |
| |
| Total | | $ | – | | | $ | – | | | $ | (1,982,342 | ) | | $ | – | | | $ | (1,982,342 | ) |
| |
| |
| | | | | | | | | | | | | | | | | | | | | |
| Amount of Realized Gain/(Loss) on Derivatives Recognized in Income | |
| Derivatives not accounted for as hedging instruments | | Futures | | | Swaps | | | Options | | | Forward Currency Contracts | | | Total | |
| |
| |
Perkins Value Plus Income Fund | | | | | | | | | | | | | | | | | | | | |
| |
| |
| Equity Contracts | | $ | – | | | $ | – | | | $ | 46,162 | | | $ | – | | | $ | 46,162 | |
| |
| |
| Total | | $ | – | | | $ | – | | | $ | 46,162 | | | $ | – | | | $ | 46,162 | |
| |
| |
| | | | | | | | | | | | | | | | | | | | | |
| Change in Unrealized Appreciation/(Depreciation) on Derivatives Recognized in Income | |
| Derivatives not accounted for as hedging instruments | | Futures | | | Swaps | | | Options | | | Forward Currency Contracts | | | Total | |
| |
| |
Perkins Value Plus Income Fund | | | | | | | | | | | | | | | | | | | | |
| |
| |
| Equity Contracts | | $ | – | | | $ | – | | | $ | (1,768 | ) | | $ | – | | | $ | (1,768 | ) |
| |
| |
| Total | | $ | – | | | $ | – | | | $ | (1,768 | ) | | $ | – | | | $ | (1,768 | ) |
| |
| |
Please see the Funds’ Statements of Operations for the Funds’ “Net Realized and Unrealized Gain/(Loss) on Investments.”
The value of derivative instruments at period end and the effect of derivatives on the Statements of Operations are indicative of the Funds’ volumes throughout the period.
| |
| 3. | Other investments and strategies |
Additional Investment Risk
The Funds, particularly Perkins Value Plus Income Fund, may be invested in lower-rated debt securities that have a higher risk of default or loss of value since these securities may be sensitive to economic changes, political changes or adverse developments specific to the issuer.
It is important to note that events in both domestic and international equity and fixed-income markets have resulted, and may continue to result, in an unusually high degree of volatility in the markets, with issuers that have exposure to the real estate, mortgage, and credit markets particularly affected. These events and the resulting market upheavals may have an adverse effect on a Fund, such as a decline in the value and liquidity of many securities held by the Fund, unusually high and unanticipated levels of redemptions, an increase in portfolio turnover, a decrease in NAV, and an increase in Fund expenses. Because the situation is unprecedented and widespread, it may also be unusually difficult to identify both investment risks and opportunities, which could limit or preclude a Fund’s ability to achieve its investment objective. It is impossible to predict whether or for how long these conditions will continue. Therefore, it is important to understand that the value of your investment may fall, sometimes sharply, and you could lose money.
Further, the instability experienced in the financial markets has resulted in the U.S. Government and various other governmental and regulatory entities taking actions to address the financial crisis. These actions include, but are not limited to, the enactment of the Dodd-Frank Wall Street Reform and Consumer Protection Act (the “Dodd-Frank Act”) in July 2010 which is expected to dramatically change the way in which the U.S. financial system is supervised and regulated. More specifically, the Dodd-Frank Act provides for widespread regulation of financial institutions, consumer financial products and services, broker-dealers, over-the-counter derivatives, investment advisers, credit rating agencies, and mortgage lending,
100 | DECEMBER 31, 2011
which expands federal oversight in the financial sector and may affect the investment management industry as a whole. Given the broad scope, sweeping nature, and the fact that many provisions of the Dodd-Frank Act must be implemented through future rulemaking, the ultimate impact of the Dodd-Frank Act, and any resulting regulation, is not yet certain. As a result, there can be no assurance that these government and regulatory measures will not have an adverse effect on the value or marketability of securities held by a Fund, including potentially limiting or completely restricting the ability of the Fund to use a particular investment instrument as part of its investment strategy, increasing the costs of using these instruments, or possibly making them less effective in general. Furthermore, no assurance can be made that the U.S. Government or any U.S. regulatory entity (or other authority or regulatory entity) will not continue to take further legislative or regulatory action in response to the economic crisis or otherwise, and the effect of such actions, if taken, cannot be known.
Certain areas of the world have historically been prone to and economically sensitive to environmental events such as, but not limited to, hurricanes, earthquakes, typhoons, flooding, tidal waves, tsunamis, erupting volcanoes, wildfires or droughts, tornadoes, mudslides, or other weather-related phenomena. Such disasters, and the resulting physical or economic damage, could have a severe and negative impact on a Fund’s investment portfolio and, in the longer term, could impair the ability of issuers in which the Fund invests to conduct their businesses as they would under normal conditions. Adverse weather conditions may also have a particularly significant negative effect on issuers in the agricultural sector and on insurance companies that insure against the impact of natural disasters.
Bank Loans
Perkins Value Plus Income Fund may invest in bank loans, which include institutionally traded floating rate securities generally acquired as an assignment from another holder of, or participation interest in, loans originated by a bank or financial institution (the “Lender”) that acts as agent for all holders. The agent administers the terms of the loan, as specified in the loan agreement. When investing in a loan participation, the Fund has the right to receive payments of principal, interest and any fees to which it is entitled only from the Lender selling the loan agreement and only upon receipt by the Lender of payments from the borrower. The Fund generally has no right to enforce compliance with the terms of the loan agreement with the borrower. Assignments and participations involve credit, interest rate, and liquidity risk. Interest rates on floating rate securities adjust with general interest rate changes and/or issuer credit quality. The interest rates paid on a floating rate security in which the Fund invests generally are readjusted periodically to an increment over a designated benchmark rate, such as the one-month, three-month, six-month, or one-year London Interbank Offered Rate (“LIBOR”). LIBOR is a short-term interest rate that banks charge one another and is generally representative of the most competitive and current cash rates.
The Fund may have difficulty trading assignments and participations to third parties. There may be restrictions on transfer and only limited opportunities may exist to sell such securities in secondary markets. As a result, the Fund may be unable to sell assignments or participations at the desired time or may be able to sell only at a price less than fair market value. The Fund utilizes an independent third party to value individual bank loans on a daily basis.
The average monthly value of borrowings outstanding under bank loan arrangements and the related rate range during the fiscal period ended December 31, 2011 is indicated in the table below:
| | | | | | | | | |
| | | Average Monthly
| | | | |
| Fund | | Value | | Rates | | |
| |
| |
| Perkins Value Plus Income Fund | | $ | 223,705 | | | 2.9400% - 5.2500% | | |
| |
| |
Counterparties
Fund transactions involving a counterparty are subject to the risk that the counterparty or a third party will not fulfill its obligation to a Fund (“counterparty risk”). Counterparty risk may arise because of the counterparty’s financial condition (i.e., financial difficulties, bankruptcy, or insolvency), market activities and developments, or other reasons, whether foreseen or not. A counterparty’s inability to fulfill its obligation may result in significant financial loss to a Fund. A Fund may be unable to recover its investment from the counterparty or may obtain a limited recovery, and/or recovery may be delayed. The extent of a Fund’s exposure to counterparty risk in respect to financial assets approximates their carrying value as recorded on the Fund’s Statement of Assets and Liabilities.
A Fund may be exposed to counterparty risk through participation in various programs including, but not limited to, lending its securities to third parties, cash sweep arrangements whereby a Fund’s cash balance is invested in one or more types of cash management vehicles, as well as investments in, but not limited to, repurchase agreements, debt securities, and derivatives, including various types of swaps, futures and options. A Fund intends to enter into financial transactions with counterparties that Janus Capital believes to be creditworthy at the time of the transaction. There is always the risk that Janus Capital’s analysis of a counterparty’s
Janus Value Funds | 101
Notes to Financial Statements (unaudited) (continued)
creditworthiness is incorrect or may change due to market conditions. To the extent that a Fund focuses its transactions with a limited number of counterparties, it will have greater exposure to the risks associated with one or more counterparties.
Emerging Market Investing
Within the parameters of their investment policies, the Funds may invest in securities of issuers or companies from or with exposure to one or more “developing countries” or “emerging markets.” Investing in emerging markets may involve certain risks and considerations not typically associated with investing in the United States and imposes risks greater than, or in addition to, the risks associated with investing in securities of more developed foreign countries. Emerging markets securities are exposed to a number of additional risks, which may result from less government supervision and regulation of business and industry practices (including the potential lack of strict finance and accounting controls and standards), stock exchanges, brokers, and listed companies, making these investments potentially more volatile in price and less liquid than investments in developed securities markets, resulting in greater risk to investors. In addition, the Funds’ investments may be denominated in foreign currencies and therefore, changes in the value of a country’s currency compared to the U.S. dollar may affect the value of the Funds’ investments. To the extent that a Fund invests a significant portion of its assets in the securities of issuers in or companies of a single country or region, it is more likely to be impacted by events or conditions affecting that country or region, which could have a negative impact on the Fund’s performance.
Exchange-Traded Funds
The Funds may invest in exchange-traded funds (“ETFs”) which generally are index-based investment companies that hold substantially all of their assets in securities representing their specific index. As a shareholder of another investment company, a Fund would bear its pro rata portion of the other investment company’s expenses, including advisory fees, in addition to the expenses the Fund bears directly in connection with its own operations.
Exchange-Traded Notes
The Funds may invest directly in exchange-traded notes (“ETNs”), which are senior, unsecured, unsubordinated debt securities whose returns are linked to a particular index and provide exposure to the total returns of various market indices, including indices linked to stocks, bonds, commodities and currencies. This type of debt security differs from other types of bonds and notes. ETN returns are based upon the performance of a market index minus applicable fees; no periodic coupon payments are distributed and no principal protections exist. ETNs do not pay cash distributions. Instead, the value of dividends, interest, and investment gains are captured in a Fund’s total return. The Funds may invest in these securities when desiring exposure to debt securities or commodities. When evaluating ETNs for investment, Janus Capital or the subadviser, as applicable, will consider the potential risks involved, expected tax efficiency, rate of return, and credit risk. When the Funds invest in ETNs, they will bear their proportionate share of any fees and expenses borne by the ETN. There may be restrictions on the Funds’ right to redeem their investment in an ETN, which is meant to be held until maturity. The Funds’ decision to sell their ETN holdings may be limited by the availability of a secondary market.
Initial Public Offerings
The Funds may invest in initial public offerings (“IPOs”). IPOs and other investment techniques may have a magnified performance impact on Perkins Select Value Fund. This Fund may not experience similar performance as their assets grow.
Interfund Lending
As permitted by the Securities and Exchange Commission (“SEC”), or the 1940 Act and rules promulgated thereunder, the Funds may be party to interfund lending agreements between the Funds and other Janus Capital sponsored mutual funds and certain pooled investment vehicles, which permit them to borrow or lend cash at a rate beneficial to both the borrowing and lending funds. Outstanding borrowings from all sources totaling 10% or more of a borrowing Fund’s total assets must be collateralized at 102% of the outstanding principal value of the loan; loans of less than 10% may be unsecured.
Real Estate Investing
The Funds may invest in equity and debt securities of U.S. real estate-related companies. Such companies may include those in the real estate industry or real estate-related industries. These securities may include common stocks, preferred stocks, and other equity securities, including, but not limited to, REITs and similar REIT-like entities such as foreign entities that have REIT characteristics.
Restricted Security Transactions
Restricted securities held by the Funds may not be sold except in exempt transactions or in a public offering registered under the Securities Act of 1933, as amended. The risk of investing in such securities is generally greater than the risk of investing in the securities of widely held, publicly traded companies. Lack of a secondary market and resale restrictions may result in the inability of the
102 | DECEMBER 31, 2011
Funds to sell a security at a fair price and may substantially delay the sale of the security. In addition, these securities may exhibit greater price volatility than securities for which secondary markets exist.
Securities Lending
Under procedures adopted by the Trustees, the Funds may seek to earn additional income through lending their securities to certain qualified broker-dealers and institutions on a short-term or long-term basis. The Funds may lend portfolio securities on a short-term or long-term basis, in an amount equal to up to 1/3 of their total assets as determined at the time of the loan origination. When the Funds lend their securities, they receive collateral (including cash collateral), at least equal to the value of securities loaned. The Funds may earn income by investing this collateral in one or more affiliated or nonaffiliated cash management vehicles. It is also possible that, due to a decline in the value of a cash management vehicle, the Funds may lose money. There is also the risk that when portfolio securities are lent, the securities may not be returned on a timely basis, and the Funds may experience delays and costs in recovering the security or gaining access to the collateral provided to the Funds to collateralize the loan. If the Funds are unable to recover a security on loan, the Funds may use the collateral to purchase replacement securities in the market. There is a risk that the value of the collateral could decrease below the cost of the replacement security by the time the replacement investment is made, resulting in a loss to the Funds. Janus Capital intends to manage the cash collateral in an affiliated cash management vehicle and will receive an investment advisory fee for managing such assets.
The borrower pays fees at the Funds’ direction to Deutsche Bank AG (the “Lending Agent”). The Lending Agent may retain a portion of the interest earned on the cash collateral invested. The cash collateral invested by the Lending Agent is disclosed on the Schedules of Investments (if applicable). The lending fees and the Funds’ portion of the interest income earned on cash collateral are included on the Statements of Operations (if applicable).
The Funds did not have any securities on loan during the period ended December 31, 2011.
Short Sales
The Funds may engage in “short sales against the box.” Short sales against the box involve either selling short a security that the Funds own or selling short a security that the Funds have the right to obtain, for delivery at a specified date in the future. The Funds may enter into short sales against the box to hedge against anticipated declines in the market price of portfolio securities. The Funds do not deliver from their portfolios the securities sold short and do not immediately receive the proceeds of the short sale. The Funds borrow the securities sold short and receive proceeds from the short sale only when they deliver the securities to the lender. If the value of the securities sold short increases prior to the scheduled delivery date, the Funds lose the opportunity to participate in the gain.
The Funds may also engage in other short sales. The Funds may engage in short sales when the portfolio managers anticipate that a security’s market purchase price will be less than its borrowing price. To complete the transaction, the Funds must borrow the security to deliver it to the purchaser and buy that same security in the market to return it to the lender. No more than 10% of a Fund’s net assets may be invested in short positions (through short sales of stocks, structured products, futures, swaps, and uncovered written calls). The Funds may engage in short sales “against the box” and options for hedging purposes that are not subject to this 10% limit. Although the potential for gain as a result of a short sale is limited to the price at which the Fund sold the security short less the cost of borrowing the security, the potential for loss is theoretically unlimited because there is no limit to the cost of replacing the borrowed security. There is no assurance the Funds will be able to close out a short position at a particular time or at an acceptable price. A gain or a loss will be recognized upon termination of a short sale. Short sales held by the Funds are fully collateralized by restricted cash or other securities, which are denoted on the accompanying Schedules of Investments (if applicable). The Funds are also required to pay the lender of the security any dividends or interest that accrue on a borrowed security during the period of the loan. Depending on the arrangements made with the broker or custodian, a Fund may or may not receive any payments (including interest) on collateral it has deposited with the broker. The Funds pay stock loan fees, disclosed on the Statements of Operations (if applicable), on assets borrowed from the security broker.
The Funds may also enter into short positions through derivative instruments, such as options contracts, futures contracts, and swap agreements, which may expose the Funds to similar risks. To the extent that the Funds enter into short derivative positions, the Funds may be exposed to risks similar to those associated with short sales, including the risk that the Funds’ losses are theoretically unlimited.
Janus Value Funds | 103
Notes to Financial Statements (unaudited) (continued)
| |
| 4. | Investment Advisory Agreements and Other Transactions with Affiliates |
Each Fund pays Janus Capital an investment advisory fee which is calculated daily and paid monthly. The following table reflects each Fund’s contractual investment advisory fee rate or base fee rate, as applicable (expressed as an annual rate).
| | | | | | | | | |
| | | | | Contractual
| | |
| | | | | Investment
| | |
| | | | | Advisory Fee/
| | |
| | | Average Daily Net
| | Base Fee (%)
| | |
| Fund | | Assets of the Fund | | (annual rate) | | |
| |
| |
| Perkins Large Cap Value Fund | | | N/A | | | 0.64 | | |
| Perkins Mid Cap Value Fund | | | N/A | | | 0.64 | | |
| Perkins Select Value Fund | | | N/A | | | 0.70 | | |
| Perkins Small Cap Value Fund | | | N/A | | | 0.72 | | |
| Perkins Value Plus Income Fund | | | All Asset Levels | | | 0.60 | | |
| |
| |
For each Fund, except Perkins Value Plus Income Fund, the investment advisory fee rate is determined by calculating a base fee and applying a performance adjustment. The base fee rate is the same as the contractual investment advisory fee rate shown in the table above. The performance adjustment either increases or decreases the base fee depending on how well each Fund has performed relative to its benchmark index, as shown below:
| | | | | | |
| Fund | | Benchmark Index | | |
| |
| |
| Perkins Large Cap Value Fund | | | Russell 1000® Value Index | | |
| Perkins Mid Cap Value Fund | | | Russell Midcap® Value Index | | |
| Perkins Select Value Fund | | | Russell 3000® Value Index | | |
| Perkins Small Cap Value Fund | | | Russell 2000® Value Index | | |
| |
| |
Only the base fee rate applied until February 2007 for Perkins Mid Cap Value Fund and January 2010 for each of Perkins Large Cap Value Fund and Perkins Small Cap Value Fund and will apply until January 2013 for Perkins Select Value Fund. The calculation of the performance adjustment applies as follows:
Investment Advisory Fee = Base Fee Rate +/- Performance Adjustment
The investment advisory fee rate paid to Janus Capital by each of the Funds listed above consists of two components: (1) a base fee calculated by applying the contractual fixed rate of the advisory fee to the Fund’s average daily net assets during the previous month (“Base Fee Rate”), plus or minus (2) a performance-fee adjustment (“Performance Adjustment”) calculated by applying a variable rate of up to 0.15% (positive or negative) to the Fund’s average daily net assets during the applicable performance measurement period. The performance measurement period generally is the previous 36 months, although no Performance Adjustment is made until a Fund’s performance-based fee structure has been in effect for at least 12 months. When a Fund’s performance-based fee structure has been in effect for at least 12 months, but less than 36 months, the performance measurement period will be equal to the time that has elapsed since the performance-based fee structure took effect. As noted above, any applicable Performance Adjustments began February 2007 for Perkins Mid Cap Value Fund and January 2010 for each of Perkins Large Cap Value Fund and Perkins Small Cap Value Fund and will begin January 2013 for Perkins Select Value Fund.
No Performance Adjustment is applied unless the difference between a Fund’s investment performance and the cumulative investment record of the Fund’s benchmark index is 0.50% or greater (positive or negative) during the applicable performance measurement period. The Base Fee Rate is subject to an upward or downward Performance Adjustment for every full 0.50% increment by which a Fund outperforms or underperforms its benchmark index. Because the Performance Adjustment is tied to a Fund’s relative performance compared to its benchmark index (and not its absolute performance), the Performance Adjustment could increase Janus Capital’s fee even if the Fund’s Shares lose value during the performance measurement period and could decrease Janus Capital’s fee even if the Fund’s Shares increase in value during the performance measurement period. For purposes of computing the Base Fee Rate and the Performance Adjustment, net assets are averaged over different periods (average daily net assets during the previous month for the Base Fee Rate, versus average daily net assets during the performance measurement period for the Performance Adjustment). Performance of a Fund is calculated net of expenses, whereas a Fund’s benchmark index does not have any fees or expenses. Reinvestment of dividends and distributions is included in calculating both the performance of a Fund and the Fund’s benchmark index. The Base Fee Rate is calculated and accrued daily. The Performance Adjustment is calculated monthly in arrears and is accrued throughout the month. The investment fee is paid monthly in arrears. Under extreme circumstances involving underperformance by a rapidly shrinking Fund, the dollar amount of the Performance Adjustment could be more than the dollar amount of the Base Fee Rate. In such circumstances, Janus Capital would reimburse the applicable Fund.
The application of an expense limit, if any, will have a positive effect upon a Fund’s performance and may result in an increase in the Performance Adjustment. It is possible that the cumulative dollar amount of additional compensation ultimately payable to Janus Capital may, under some circumstances, exceed the cumulative dollar amount of management fees waived by Janus Capital.
104 | DECEMBER 31, 2011
The investment performance of a Fund’s Class A Shares (waiving the upfront sales load) for the performance measurement period is used to calculate the Performance Adjustment. For performance measurement periods prior to July 6, 2009, certain Funds calculated their Performance Adjustment by comparing the performance of Class T Shares (formerly named Class J Shares) against the investment record of each Fund’s respective benchmark index. For periods beginning July 6, 2009, the investment performance of each Fund’s load-waived Class A Shares for the performance measurement period is used to calculate the Performance Adjustment. Because the Performance Adjustment is based on a rolling 36-month performance measurement period, calculations based solely on the performance of a Fund’s load-waived Class A Shares will not be fully implemented for 36 months after July 6, 2009. Until that time, the Fund’s performance will be compared to a blended investment performance record that includes the Fund’s Class T Shares (formerly named Class J Shares) performance (the prior share class used for performance calculations) for the portion of the performance measurement period prior to July 6, 2009, and the Fund’s load-waived Class A Shares for the remainder of the period. At the conclusion of the transition period, the Fund’s Class T Shares will be eliminated from the Performance Adjustment calculation, and the calculation will be based solely upon a Fund’s load-waived Class A Shares. After Janus Capital determines whether a particular Fund’s performance was above or below its benchmark index by comparing the investment performance of the Fund’s load-waived Class A Shares, or Class T Shares (formerly named Class J Shares) as the case may be, against the cumulative investment record of the Fund’s benchmark index, Janus Capital applies the same Performance Adjustment (positive or negative) across each other class of shares of the Fund, as applicable.
It is not possible to predict the effect of the Performance Adjustment on future overall compensation to Janus Capital since it depends on the performance of each Fund relative to the record of the Fund’s benchmark index and future changes to the size of each Fund.
The Funds’ prospectuses and statements of additional information contain additional information about performance-based fees. The amount shown as advisory fees on the Statements of Operations reflects the Base Fee Rate plus/minus any Performance Adjustment, if applicable.
During the period ended December 31, 2011, the following Funds recorded a Performance Adjustment as indicated in the table below:
| | | | | | |
| | | Performance
| | |
| Fund | | Fee | | |
| |
| |
| Perkins Large Cap Value Fund | | $ | 21,867 | | |
| Perkins Mid Cap Value Fund | | | (3,714,377) | | |
| Perkins Small Cap Value Fund | | | 1,649,611 | | |
| |
| |
Perkins Investment Management LLC (“Perkins”) serves as subadviser to the Funds. Janus Capital pays Perkins a fee equal to 50% of the advisory fee paid by each of Perkins Large Cap Value Fund, Perkins Mid Cap Value Fund, Perkins Select Value Fund, and Perkins Small Cap Value Fund to Janus Capital (calculated after any applicable performance fee adjustment, fee waivers, and expense reimbursements) and 50% of the advisory fee payable by the equity portion of Perkins Value Plus Income Fund to Janus Capital (net of any fee waivers and expense reimbursements). The subadvisory fee paid by Janus Capital to Perkins adjusts up or down based on each of Perkins Large Cap Value Fund’s, Perkins Mid Cap Value Fund’s, Perkins Select Value Fund’s, and Perkins Small Cap Value Fund’s performance relative to each Fund’s respective benchmark index over the performance measurement period.
Perkins or its predecessors have been in the investment management business since 1984 and serves as investment adviser or subadviser to other Janus registered investment companies and other accounts. Janus Capital owns approximately 78% of Perkins.
Janus Services LLC (“Janus Services”), a wholly-owned subsidiary of Janus Capital, is the Funds’ transfer agent. In addition, Janus Services provides or arranges for the provision of certain other administrative services including, but not limited to, recordkeeping, accounting, order processing, and other shareholder services for the Funds.
Certain, but not all, intermediaries may charge administrative fees to investors in Class A Shares, Class C Shares, and Class I Shares for administrative services provided on behalf of such investors. These administrative fees are paid by the Class A Shares, Class C Shares, and Class I Shares of the Funds to Janus Services, which uses such fees to reimburse intermediaries. Consistent with the Transfer Agency Agreement between Janus Services and the Funds, Janus Services may negotiate the level, structure, and/or terms of the administrative fees with intermediaries requiring such fees on behalf of the Funds. Janus Capital and its affiliates benefit from an increase in assets that may result from such relationships.
Class D Shares pay an annual administrative services fee of 0.12% of net assets. These administrative services fees
Janus Value Funds | 105
Notes to Financial Statements (unaudited) (continued)
are paid by the Shares of each Fund for shareholder services provided by Janus Services.
Janus Services receives an administrative services fee at an annual rate of 0.25% of the average daily net assets of Class R Shares, Class S Shares and Class T Shares of the Funds for providing or procuring administrative services to investors in Class R Shares, Class S Shares and Class T Shares of the Funds. Janus Services expects to use all or a significant portion of this fee to compensate retirement plan service providers, broker-dealers, bank trust departments, financial advisors, and other financial intermediaries for providing these services. Janus Services or its affiliates may also pay fees for services provided by intermediaries to the extent the fees charged by intermediaries exceed the 0.25% of net assets charged to Class R Shares, Class S Shares, and Class T Shares of each Fund.
Services provided by these financial intermediaries may include, but are not limited to, recordkeeping, subaccounting, order processing, providing periodic statements, forwarding prospectuses, shareholder reports, and other materials to existing customers and other administrative services. Order processing includes the submission of transactions through the National Securities Clearing Corporation (“NSCC”) or similar systems, or those processed on a manual basis with Janus Capital.
For transfer agency and other services, Janus Services receives an asset-weighted fee from the Class L Shares of Perkins Mid Cap Value Fund and Perkins Small Cap Value Fund based on the average proportion of each Fund’s total net assets sold directly and the average proportion of each Fund’s net assets sold through financial intermediaries on a monthly basis. The asset-weighted fee is calculated by applying a blended annual fee rate of 0.12% on average net assets for the proportion of assets sold directly and 0.25% on average net assets for the proportion of assets sold through financial intermediaries. Depending on the shareholder composition of a Fund each month, the asset-weighted fee could increase or decrease from the amount that otherwise would have been paid under the prior transfer agency fee structure.
Janus Services has agreed to waive all or a portion of the administrative fees payable by the Class L Shares of Perkins Mid Cap Value Fund and Perkins Small Cap Value Fund. Such waiver is voluntary and could change or be terminated at any time at the discretion of Janus Services or Janus Capital without prior notification to shareholders. Removal of this fee waiver may have a significant impact on Class L Shares’ total expense ratio. If applicable, amounts waived to the Funds by Janus Capital are disclosed as “Excess Expense Reimbursement” on the Statements of Operations.
Janus Distributors LLC (“Janus Distributors”), a wholly-owned subsidiary of Janus Capital, is the distributor of the Funds. The Funds have adopted a Distribution and Shareholder Servicing Plan (the “Plan”) pursuant to Rule 12b-1 under the 1940 Act. The Plan authorizes payments by the Funds at an annual rate, as determined from time to time by the Board of Trustees, of up to 0.25% of the Class A Shares average daily net assets, of up to 1.00% of the Class C Shares average daily net assets, of up to 0.50% of the Class R Shares average daily net assets, and of up to 0.25% of the Class S Shares average daily net assets. Payments under the Plan are not tied exclusively to actual distribution and shareholder service expenses, and the payments may exceed distribution and shareholder service expenses actually incurred by the Funds. If any of a Fund’s actual distribution and shareholder service expenses incurred during a calendar year are less than the payments made during a calendar year, the Fund will be refunded the difference. Refunds, if any, are included in “Distribution fees and shareholder servicing fees” in the Statements of Operations.
Janus Capital has agreed to reimburse the Funds until at least November 1, 2012 (until at least November 1, 2013 for Perkins Select Value Fund) by the amount, if any, that such Fund’s normal operating expenses in any fiscal year, including the investment advisory fee, but excluding any performance adjustments to management fees, if applicable, class-specific distribution and shareholder servicing fees applicable to Class A Shares, Class C Shares, Class R Shares, and Class S Shares, the administrative services fees payable pursuant to the Transfer Agency Agreement (except for networking and omnibus fees), brokerage commissions, interest, dividends, taxes, acquired fund fees and expenses, and extraordinary expenses, exceed the annual rates noted below. If applicable, amounts reimbursed to the Funds by Janus Capital are disclosed as “Excess Expense Reimbursement” on the Statements of Operations.
| | | | | | |
| | | Expense
| | |
| Fund | | Limit (%) | | |
| |
| |
| Perkins Large Cap Value Fund | | | 1.00 | | |
| Perkins Mid Cap Value Fund | | | 0.86 | | |
| Perkins Select Value Fund | | | 1.00 | | |
| Perkins Small Cap Value Fund | | | 0.96 | | |
| Perkins Value Plus Income Fund | | | 0.76 | | |
| |
| |
For a period of three years subsequent to Perkins Value Plus Income Fund’s commencement of operations, Janus Capital may recover from the Fund fees and expenses previously waived or reimbursed, which could be then considered a deferral, if the Fund’s expense ratio,
106 | DECEMBER 31, 2011
including recovered expenses, falls below the expense limit. The recoupment of such reimbursements expires July 30, 2013 for Perkins Value Plus Income Fund. For the period ended December 31, 2011, total reimbursement by Janus Capital was $86,795 for the Fund. As of December 31, 2011, the aggregate amount of recoupment that may be potentially made to Janus Capital is $329,203.
The Board of Trustees has adopted a deferred compensation plan (the “Deferred Plan”) for independent Trustees to elect to defer receipt of all or a portion of the annual compensation they are entitled to receive from the Funds. All deferred fees are credited to an account established in the name of the Trustees. The amounts credited to the account then increase or decrease, as the case may be, in accordance with the performance of one or more of the Janus funds that are selected by the Trustees. The account balance continues to fluctuate in accordance with the performance of the selected fund or funds until final payment of all amounts are credited to the account. The fluctuation of the account balance is recorded by the Funds as unrealized appreciation/(depreciation) and is shown as of December 31, 2011 on the Statements of Assets and Liabilities as an asset, “Non-interested Trustees’ deferred compensation,” and a liability, “Non-interested Trustees’ deferred compensation fees.” Additionally, the recorded unrealized appreciation/(depreciation) is included in “Unrealized net appreciation/(depreciation) of investments, foreign currency translations and non-interested Trustees’ deferred compensation” on the Statements of Assets and Liabilities. Deferred compensation expenses for the period ended December 31, 2011 are included in “Non-interested Trustees’ fees and expenses” on the Statements of Operations. Trustees are allowed to change their designation of mutual funds from time to time. Amounts will be deferred until distributed in accordance with the Deferred Plan. No deferred fees were distributed to any Trustee under the Deferred Plan during the period ended December 31, 2011.
For the period ended December 31, 2011, Janus Capital assumed $39,214 of legal, consulting and Trustee costs and fees incurred by the funds in the Trust and Janus Aspen Series together with the Trust (the “Portfolios”), in connection with regulatory and civil litigation matters. These non-recurring costs were allocated to all Portfolios based on the Portfolios’ respective net assets as of July 31, 2004. Unless noted otherwise in the financial highlights, the effect of these non-recurring costs assumed by Janus Capital are included in the ratio of gross expenses to average net assets and were less than 0.01%. No fees were allocated to the Portfolios that commenced operations after July 31, 2004. Additionally, all future non-recurring costs will be allocated to the Portfolios based on the Portfolios’ respective net assets on July 31, 2004. These “Non-recurring costs” and “Costs assumed by Janus Capital” are shown on the Statements of Operations.
Certain officers of the Funds may also be officers and/or directors of Janus Capital. Such officers receive no compensation from the Funds, except for the Funds’ Chief Compliance Officer. The Funds reimburse Janus Capital for a portion of the compensation paid to the Chief Compliance Officer and certain compliance staff of the Trust. Total compensation of $286,615 was paid by the Trust during the period ended December 31, 2011. Each Fund’s portion is reported as part of “Other Expenses” on the Statements of Operations.
Class A Shares include a 5.75% upfront sales charge of the offering price of the Funds. The sales charge is allocated between Janus Distributors and financial intermediaries. During the period ended December 31, 2011, Janus Distributors retained the following upfront sales charges:
| | | | | | |
| | | Upfront
| | |
| Fund (Class A Shares) | | Sales Charge | | |
| |
| |
| Perkins Large Cap Value Fund | | $ | 749 | | |
| Perkins Mid Cap Value Fund | | | 22,236 | | |
| Perkins Small Cap Value Fund | | | 793 | | |
| Perkins Value Plus Income Fund | | | 185 | | |
| |
| |
A contingent deferred sales charge of 1.00% will be deducted with respect to Class A Shares purchased without a sales load and redeemed within 12 months of purchase, unless waived, as discussed in the Prospectus. Any applicable CDSC will be 1.00% of the lesser of the original purchase price or the value of the redemption of the Class A Shares redeemed. There were no contingent deferred sales charges paid by redeeming shareholders of Class A Shares to Janus Distributors during the period ended December 31, 2011.
Class C Shares include a 1.00% contingent deferred sales charge paid by redeeming shareholders to Janus Distributors. The contingent deferred sales charge applies to shares redeemed within 12 months of purchase. The redemption price may differ from the net asset value per share. During the period ended December 31, 2011, redeeming shareholders of Class C Shares paid the following contingent deferred sales charges:
| | | | | | |
| | | Contingent Deferred
| | |
| Fund (Class C Shares) | | Sales Charge | | |
| |
| |
| Perkins Large Cap Value Fund | | $ | 218 | | |
| Perkins Mid Cap Value Fund | | | 17,268 | | |
| Perkins Small Cap Value Fund | | | 1,813 | | |
| Perkins Value Plus Income Fund | | | 99 | | |
| |
| |
Janus Value Funds | 107
Notes to Financial Statements (unaudited) (continued)
The Funds’ expenses may be reduced by expense offsets from an unaffiliated custodian and/or transfer agent. Such credits or offsets are included in “Expense and Fee Offset” on the Statements of Operations (if applicable). The transfer agent fee offsets received during the period reduce “Transfer agent fees and expenses” on the Statements of Operations (if applicable). Custodian offsets received reduce “Custodian fees” on the Statements of Operations (if applicable). The Funds could have employed the assets used by the custodian and/or transfer agent to produce income if they had not entered into an expense offset arrangement.
Pursuant to the terms and conditions of an SEC exemptive order and the provisions of the 1940 Act, the Funds may participate in an affiliated or nonaffiliated cash sweep program. In the cash sweep program, uninvested cash balances of the Funds may be used to purchase shares of affiliated or nonaffiliated money market funds or cash management pooled investment vehicles. The Funds are eligible to participate in the cash sweep program (the “Investing Funds”). Janus Cash Liquidity Fund LLC is an affiliated unregistered cash management pooled investment vehicle that invests primarily in highly-rated short-term fixed-income securities. Janus Cash Liquidity Fund LLC currently maintains a NAV of $1.00 per share and distributes income daily in a manner consistent with a registered 2a-7 product. There are no restrictions on the Funds’ ability to withdraw investments from Janus Cash Liquidity Fund LLC at will, and there are no unfunded capital commitments due from the Funds to Janus Cash Liquidity Fund LLC. As adviser, Janus Capital has an inherent conflict of interest because of its fiduciary duties to the affiliated cash management pooled investment vehicles and the Investing Funds.
During the period ended December 31, 2011, the following Fund recorded distributions from affiliated investment companies as affiliated dividend income, and had the following affiliated purchases and sales:
| | | | | | | | | | | | | | | |
| | | Purchases
| | Sales
| | Dividend
| | Value
| | |
| | | Shares/Cost | | Shares/Cost | | Income | | at 12/31/11 | | |
| |
Janus Cash Liquidity Fund LLC | | | | | | | | | | | | | | |
| Perkins Value Plus Income Fund | | $ | 12,906,415 | | $ | (12,589,658) | | $ | 408 | | $ | 1,162,096 | | |
| |
| |
Janus Capital or an affiliate invested and/or redeemed initial seed capital during the period ended December 31, 2011, as indicated in the following table.
| | | | | | | | | | | | | | | | | | | | | |
| | | Seed Capital
| | | | Date of
| | | | Date of
| | Seed Capital
| | |
| Fund | | at 6/30/11 | | Purchases | | Purchases | | Redemptions | | Redemption | | at 12/31/11 | | |
| |
| |
| Perkins Large Cap Value Fund - Class C Shares | | $ | 140,288 | | $ | – | | | – | | $ | – | | | – | | $ | 140,288 | | |
| Perkins Large Cap Value Fund - Class S Shares | | | 460,826 | | | – | | | – | | | – | | | – | | | 460,826 | | |
| Perkins Select Value Fund - Class A Shares | | | – | | | 10,000 | | | 12/15/11 | | | – | | | – | | | 10,000 | | |
| Perkins Select Value Fund - Class C Shares | | | – | | | 10,000 | | | 12/15/11 | | | – | | | – | | | 10,000 | | |
| Perkins Select Value Fund - Class D Shares | | | – | | | 10,000 | | | 12/15/11 | | | – | | | – | | | 10,000 | | |
| Perkins Select Value Fund - Class I Shares | | | – | | | 10,000 | | | 12/15/11 | | | – | | | – | | | 10,000 | | |
| Perkins Select Value Fund - Class S Shares | | | – | | | 10,000 | | | 12/15/11 | | | – | | | – | | | 10,000 | | |
| Perkins Select Value Fund - Class T Shares | | | – | | | 10,000 | | | 12/15/11 | | | – | | | – | | | 10,000 | | |
| Perkins Value Plus Income Fund - Class A Shares | | | 3,333,333 | | | – | | | – | | | – | | | – | | | 3,333,333 | | |
| Perkins Value Plus Income Fund - Class C Shares | | | 3,333,333 | | | – | | | – | | | – | | | – | | | 3,333,333 | | |
| Perkins Value Plus Income Fund - Class D Shares | | | 3,333,333 | | | – | | | – | | | – | | | – | | | 3,333,333 | | |
| Perkins Value Plus Income Fund - Class I Shares | | | 3,333,334 | | | – | | | – | | | – | | | – | | | 3,333,334 | | |
| Perkins Value Plus Income Fund - Class S Shares | | | 3,333,333 | | | – | | | – | | | – | | | – | | | 3,333,333 | | |
| Perkins Value Plus Income Fund - Class T Shares | | | 3,333,334 | | | – | | | – | | | – | | | – | | | 3,333,334 | | |
| |
| |
Income and capital gains distributions are determined in accordance with income tax regulations that may differ from accounting principles generally accepted in the United States of America. These differences are due to differing treatments for items such as net short-term gains, deferral of wash sale losses, foreign currency transactions, net investment losses and capital loss carryovers.
The Funds have elected to treat gains and losses on forward foreign currency contracts as capital gains and losses, if applicable. Other foreign currency gains and losses on debt instruments are treated as ordinary income for federal income tax purposes pursuant to Section 988 of the Internal Revenue Code.
The aggregate cost of investments and the composition of unrealized appreciation and depreciation of investment securities for federal income tax purposes as of December 31, 2011 are noted below.
Unrealized appreciation and unrealized depreciation in the table below exclude appreciation/(depreciation) on foreign currency translations. The primary difference between
108 | DECEMBER 31, 2011
book and tax appreciation or depreciation of investments is wash sale loss deferrals.
| | | | | | | | | | | | | | | |
| | | | | | | | | Net Tax
| | |
| | | Federal Tax
| | Unrealized
| | Unrealized
| | Appreciation/
| | |
| Fund | | Cost | | Appreciation | | (Depreciation) | | (Depreciation) | | |
| |
| |
| Perkins Large Cap Value Fund | | $ | 128,611,856 | | $ | 9,804,662 | | $ | (6,185,017) | | $ | 3,619,645 | | |
| Perkins Mid Cap Value Fund | | | 12,297,893,115 | | | 1,303,766,328 | | | (720,695,977) | | | 583,070,351 | | |
Perkins Select Value Fund(1) | | | 53,611,298 | | | 1,263,694 | | | (138,118) | | | 1,125,576 | | |
| Perkins Small Cap Value Fund | | | 2,833,920,226 | | | 189,617,042 | | | (200,911,331) | | | (11,294,289) | | |
| Perkins Value Plus Income Fund | | | 40,570,798 | | | 1,716,558 | | | (1,515,421) | | | 201,137 | | |
| |
| |
| | | |
| (1) | | Period from December 15, 2011 (inception date) through December 31, 2011. |
Net capital loss carryovers as of June 30, 2011 are indicated in the table below. These losses may be available to offset future realized capital gains and thereby reduce future taxable gains distributions. The following table shows the expiration dates of the carryovers.
Capital Loss Carryover Expiration Schedule
For the fiscal year ended June 30, 2011
| | | | | | | | | |
| | | | | Accumulated
| | |
| Fund | | June 30, 2016 | | Capital Losses | | |
| |
| |
Perkins Mid Cap Value Fund(1) | | $ | (25,850,502) | | $ | (25,850,502) | | |
Perkins Small Cap Value Fund(1) | | | (9,938,310) | | | (9,938,310) | | |
| |
| |
| | | |
| (1) | | Capital loss carryovers subject to annual limitations. |
Capital losses may be used to offset future taxable capital gains until expiration. Under the recently enacted Regulated Investment Company Modernization Act of 2010, the Funds will be permitted to carry forward capital losses incurred in taxable years beginning after December 22, 2010 for an unlimited period. Losses incurred during those future years will be required to be utilized prior to the losses incurred in pre-enactment taxable years. As a result of this ordering rule, pre-enactment capital loss carryforwards may more likely expire unused. Also, post-enactment capital losses that are carried forward will retain their character as either short-term or long-term capital losses rather than being considered all short-term as under previous law.
The expense ratios listed in the Financial Highlights reflect expenses prior to any expense offsets (gross expense ratio) and after expense offsets (net expense ratio). Both expense ratios reflect expenses after waivers (reimbursement). Listed below are the gross expense ratios for the Funds that would have been in effect, absent the waiver of certain fees and offsets.
For the six-month period ended December 31, 2011 (unaudited), the fiscal year or period ended June 30, 2011, the eight- or eleven-month fiscal period ended June 30, 2010 and each fiscal year or period ended October 31 or July 31
| | | | | | | | | | | | | | | | | | | | | |
| | | Perkins Large Cap
| | Perkins Mid Cap
| | Perkins Select
| | Perkins Small Cap
| | Perkins Value Plus
|
| | | Value Fund | | Value Fund | | Value Fund | | Value Fund | | Income Fund |
| |
| |
| Class A Shares |
| 2011 | | | 1.13% | | | | 1.09% | | | | 1.59%(1) | | | | 1.33% | | | | 1.47% | |
| 2011 | | | 1.18% | | | | 1.20% | | | | N/A | | | | 1.25% | | | | 1.86%(2) | |
2010(3) | | | 1.32% | | | | N/A | | | | N/A | | | | N/A | | | | N/A | |
2010(4) | | | N/A | | | | 1.17% | | | | N/A | | | | 1.21% | | | | N/A | |
2009(5) | | | 2.19% | | | | N/A | | | | N/A | | | | N/A | | | | N/A | |
2009(6) | | | N/A | | | | 1.27% | | | | N/A | | | | 1.02% | | | | N/A | |
| |
| |
| Class C Shares |
| 2011 | | | 1.96% | | | | 1.77% | | | | 2.29%(1) | | | | 2.12% | | | | 2.22% | |
| 2011 | | | 1.96% | | | | 1.87% | | | | N/A | | | | 2.05% | | | | 2.62%(2) | |
2010(3) | | | 2.09% | | | | N/A | | | | N/A | | | | N/A | | | | N/A | |
2010(4) | | | N/A | | | | 1.91% | | | | N/A | | | | 1.96% | | | | N/A | |
2009(5) | | | 2.90% | | | | N/A | | | | N/A | | | | N/A | | | | N/A | |
2009(6) | | | N/A | | | | 2.00% | | | | N/A | | | | 2.13% | | | | N/A | |
| |
| |
Janus Value Funds | 109
Notes to Financial Statements (unaudited) (continued)
| | | | | | | | | | | | | | | | | | | | | |
| | | Perkins Large Cap
| | Perkins Mid Cap
| | Perkins Select
| | Perkins Small Cap
| | Perkins Value Plus
|
| | | Value Fund | | Value Fund | | Value Fund | | Value Fund | | Income Fund |
| |
| |
| Class D Shares |
| 2011 | | | 0.95% | | | | 0.77% | | | | 3.64%(1) | | | | 1.03% | | | | 1.32% | |
| 2011 | | | 0.92% | | | | 0.88% | | | | N/A | | | | 0.99% | | | | 1.73%(2) | |
2010(7) | | | 1.16% | | | | 0.93% | | | | N/A | | | | 0.98% | | | | N/A | |
| |
| |
| Class I Shares |
| 2011 | | | 0.83% | | | | 0.73% | | | | 1.70%(1) | | | | 0.97% | | | | 1.23% | |
| 2011 | | | 0.84% | | | | 0.84% | | | | N/A | | | | 0.93% | | | | 1.61%(2) | |
2010(3) | | | 1.08% | | | | N/A | | | | N/A | | | | N/A | | | | N/A | |
2010(4) | | | N/A | | | | 0.83% | | | | N/A | | | | 0.85% | | | | N/A | |
2009(5) | | | 2.15% | | | | N/A | | | | N/A | | | | N/A | | | | N/A | |
2009(6) | | | N/A | | | | 0.81% | | | | N/A | | | | 0.77% | | | | N/A | |
| |
| |
| Class L Shares |
| 2011 | | | N/A | | | | 0.88% | | | | N/A | | | | 1.11% | | | | N/A | |
| 2011 | | | N/A | | | | 0.99% | | | | N/A | | | | 1.08% | | | | N/A | |
2010(4) | | | N/A | | | | 1.02% | | | | N/A | | | | 1.08% | | | | N/A | |
| 2009 | | | N/A | | | | 1.13% | | | | N/A | | | | 1.10% | | | | N/A | |
| 2008 | | | N/A | | | | 1.04% | | | | N/A | | | | 1.02% | | | | N/A | |
| 2007 | | | N/A | | | | 0.81% | | | | N/A | | | | 0.97% | | | | N/A | |
| 2006 | | | N/A | | | | 0.89% | | | | N/A | | | | 1.00% | | | | N/A | |
| |
| |
| Class R Shares |
| 2011 | | | N/A | | | | 1.38% | | | | N/A | | | | 1.63% | | | | N/A | |
| 2011 | | | N/A | | | | 1.49% | | | | N/A | | | | 1.60% | | | | N/A | |
2010(4) | | | N/A | | | | 1.52% | | | | N/A | | | | 1.57% | | | | N/A | |
2009(6) | | | N/A | | | | 1.53% | | | | N/A | | | | 1.54% | | | | N/A | |
| |
| |
| Class S Shares |
| 2011 | | | 1.31% | | | | 1.13% | | | | 1.79%(1) | | | | 1.38% | | | | 1.69% | |
| 2011 | | | 1.34% | | | | 1.24% | | | | N/A | | | | 1.35% | | | | 2.12%(2) | |
2010(3) | | | 1.65% | | | | N/A | | | | N/A | | | | N/A | | | | N/A | |
2010(4) | | | N/A | | | | 1.27% | | | | N/A | | | | 1.32% | | | | N/A | |
2009(5) | | | 2.32% | | | | N/A | | | | N/A | | | | N/A | | | | N/A | |
2009(6) | | | N/A | | | | 1.28% | | | | N/A | | | | 1.29% | | | | N/A | |
| |
| |
| Class T Shares |
| 2011 | | | 1.06% | | | | 0.88% | | | | 4.81%(1) | | | | 1.13% | | | | 1.44% | |
| 2011 | | | 1.05% | | | | 0.99% | | | | N/A | | | | 1.10% | | | | 1.86%(2) | |
2010(3) | | | 1.29% | | | | N/A | | | | N/A | | | | N/A | | | | N/A | |
2010(4) | | | N/A | | | | 1.03% | | | | N/A | | | | 1.08% | | | | N/A | |
2009(8) | | | 4.70% | | | | N/A | | | | N/A | | | | N/A | | | | N/A | |
2009(9) | | | N/A | | | | 1.11% | | | | N/A | | | | 1.11% | | | | N/A | |
| 2008 | | | N/A | | | | 1.07% | | | | N/A | | | | 1.03% | | | | N/A | |
| 2007 | | | N/A | | | | 0.86% | | | | N/A | | | | 1.01% | | | | N/A | |
| 2006 | | | N/A | | | | 0.93% | | | | N/A | | | | 1.01% | | | | N/A | |
| |
| |
| | | |
(1)
| | Period from December 15, 2011 (inception date) through December 31, 2011. |
| (2) | | Period from July 30, 2010 (inception date) through June 30, 2011. |
| (3) | | Period from August 1, 2009 through June 30, 2010. The Fund changed its fiscal year end from July 31 to June 30. |
| (4) | | Period from November 1, 2009 through June 30, 2010. The Fund changed its fiscal year end from October 31 to June 30. |
| (5) | | Period from December 31, 2008 (inception date) through July 31, 2009. |
| (6) | | Period from July 6, 2009 (inception date) through October 31, 2009. |
| (7) | | Period from February 16, 2010 (inception date) through June 30, 2010. |
| (8) | | Period from July 6, 2009 (inception date) through July 31, 2009. |
| (9) | | Period from November 1, 2008 through October 31, 2009. |
110 | DECEMBER 31, 2011
| |
| 7. | Capital Share Transactions |
| | | | | | | | | | | | | | | | | | | | | | | | | | | | | | | | | | | | | | | |
For the six-month period ended December 31, 2011
| | Perkins Large Cap
| | | Perkins Mid Cap
| | | Perkins Select
| | | Perkins Small Cap
| | | Perkins Value Plus
| | | |
(unaudited) and the fiscal year ended June 30, 2011 (all
| | Value Fund | | | Value Fund | | | Value Fund | | | Value Fund | | | Income Fund | | | |
| numbers in thousands) | | 2011 | | | 2011 | | | 2011 | | | 2011 | | | 2011(1) | | | 2011 | | | 2011 | | | 2011 | | | 2011(2) | | | |
| |
| Transactions in Fund Shares – Class A Shares: | | | | | | | | | | | | | | | | | | | | | | | | | | | | | | | | | | | | | | |
| Shares sold | | | 60 | | | | 123 | | | | 6,915 | | | | 20,242 | | | | 1 | | | | 1,424 | | | | 7,511 | | | | 26 | | | | 426 | | | |
| Reinvested dividends and distributions | | | 10 | | | | 1 | | | | 3,931 | | | | 296 | | | | – | | | | 686 | | | | 184 | | | | 24 | | | | 10 | | | |
| Shares repurchased | | | (27) | | | | (108) | | | | (11,573) | | | | (16,221) | | | | – | | | | (2,897) | | | | (2,855) | | | | (43) | | | | – | | | |
| Net Increase/(Decrease) in Fund Shares | | | 43 | | | | 16 | | | | (727) | | | | 4,317 | | | | 1 | | | | (787) | | | | 4,840 | | | | 7 | | | | 436 | | | |
| Shares Outstanding, Beginning of Period | | | 159 | | | | 143 | | | | 57,429 | | | | 53,112 | | | | – | | | | 8,970 | | | | 4,130 | | | | 436 | | | | – | | | |
| Shares Outstanding, End of Period | | | 202 | | | | 159 | | | | 56,702 | | | | 57,429 | | | | 1 | | | | 8,183 | | | | 8,970 | | | | 443 | | | | 436 | | | |
| Transactions in Fund Shares – Class C Shares: | | | | | | | | | | | | | | | | | | | | | | | | | | | | | | | | | | | | | | |
| Shares sold | | | 35 | | | | 142 | | | | 976 | | | | 3,381 | | | | 1 | | | | 65 | | | | 229 | | | | 47 | | | | 370 | | | |
| Reinvested dividends and distributions | | | 6 | | | | 3 | | | | 554 | | | | 2 | | | | – | | | | 112 | | | | 24 | | | | 19 | | | | 7 | | | |
| Shares repurchased | | | (87) | | | | (61) | | | | (1,361) | | | | (1,950) | | | | – | | | | (167) | | | | (345) | | | | (4) | | | | (7) | | | |
| Net Increase/(Decrease) in Fund Shares | | | (46) | | | | 84 | | | | 169 | | | | 1,433 | | | | 1 | | | | 10 | | | | (92) | | | | 62 | | | | 370 | | | |
| Shares Outstanding, Beginning of Period | | | 200 | | | | 116 | | | | 10,314 | | | | 8,881 | | | | – | | | | 1,198 | | | | 1,290 | | | | 370 | | | | – | | | |
| Shares Outstanding, End of Period | | | 154 | | | | 200 | | | | 10,483 | | | | 10,314 | | | | 1 | | | | 1,208 | | | | 1,198 | | | | 432 | | | | 370 | | | |
| Transactions in Fund Shares – Class D Shares: | | | | | | | | | | | | | | | | | | | | | | | | | | | | | | | | | | | | | | |
| Shares sold | | | 370 | | | | 1,056 | | | | 788 | | | | 3,145 | | | | 40 | | | | 97 | | | | 379 | | | | 467 | | | | 1,175 | | | |
| Reinvested dividends and distributions | | | 80 | | | | 11 | | | | 3,358 | | | | 315 | | | | – | | | | 440 | | | | 101 | | | | 66 | | | | 18 | | | |
| Shares repurchased | | | (272) | | | | (218) | | | | (2,595) | | | | (5,730) | | | | – | | | | (330) | | | | (757) | | | | (150) | | | | (61) | | | |
| Net Increase/(Decrease) in Fund Shares | | | 178 | | | | 849 | | | | 1,551 | | | | (2,270) | | | | 40 | | | | 207 | | | | (277) | | | | 383 | | | | 1,132 | | | |
| Shares Outstanding, Beginning of Period | | | 1,060 | | | | 211 | | | | 39,504 | | | | 41,774 | | | | – | | | | 3,462 | | | | 3,739 | | | | 1,132 | | | | – | | | |
| Shares Outstanding, End of Period | | | 1,238 | | | | 1,060 | | | | 41,055 | | | | 39,504 | | | | 40 | | | | 3,669 | | | | 3,462 | | | | 1,515 | | | | 1,132 | �� | | |
| Transactions in Fund Shares – Class I Shares: | | | | | | | | | | | | | | | | | | | | | | | | | | | | | | | | | | | | | | |
| Shares sold | | | 855 | | | | 2,407 | | | | 22,263 | | | | 57,218 | | | | 5,078 | | | | 7,487 | | | | 40,230 | | | | 29 | | | | 721 | | | |
| Reinvested dividends and distributions | | | 539 | | | | 203 | | | | 11,353 | | | | 928 | | | | – | | | | 5,615 | | | | 946 | | | | 39 | | | | 16 | | | |
| Shares repurchased | | | (618) | | | | (661) | | | | (20,237) | | | | (31,925) | | | | – | | | | (8,949) | | | | (13,886) | | | | (22) | | | | (32) | | | |
| Net Increase/(Decrease) in Fund Shares | | | 776 | | | | 1,949 | | | | 13,379 | | | | 26,221 | | | | 5,078 | | | | 4,153 | | | | 27,290 | | | | 46 | | | | 705 | | | |
| Shares Outstanding, Beginning of Period | | | 7,927 | | | | 5,978 | | | | 142,779 | | | | 116,558 | | | | – | | | | 52,670 | | | | 25,380 | | | | 705 | | | | – | | | |
| Shares Outstanding, End of Period | | | 8,703 | | | | 7,927 | | | | 156,158 | | | | 142,779 | | | | 5,078 | | | | 56,823 | | | | 52,670 | | | | 751 | | | | 705 | | | |
| Transactions in Fund Shares – Class L Shares: | | | | | | | | | | | | | | | | | | | | | | | | | | | | | | | | | | | | | | |
| Shares sold | | | N/A | | | | N/A | | | | 109 | | | | 482 | | | | N/A | | | | 405 | | | | 1,999 | | | | N/A | | | | N/A | | | |
| Reinvested dividends and distributions | | | N/A | | | | N/A | | | | 206 | | | | 23 | | | | N/A | | | | 1,592 | | | | 544 | | | | N/A | | | | N/A | | | |
| Shares repurchased | | | N/A | | | | N/A | | | | (434) | | | | (1,072) | | | | N/A | | | | (1,331) | | | | (20,694) | | | | N/A | | | | N/A | | | |
| Net Increase/(Decrease) in Fund Shares | | | N/A | | | | N/A | | | | (119) | | | | (567) | | | | N/A | | | | 666 | | | | (18,151) | | | | N/A | | | | N/A | | | |
| Shares Outstanding, Beginning of Period | | | N/A | | | | N/A | | | | 2,659 | | | | 3,226 | | | | N/A | | | | 12,847 | | | | 30,998 | | | | N/A | | | | N/A | | | |
| Shares Outstanding, End of Period | | | N/A | | | | N/A | | | | 2,540 | | | | 2,659 | | | | N/A | | | | 13,513 | | | | 12,847 | | | | N/A | | | | N/A | | | |
| Transactions in Fund Shares – Class R Shares: | | | | | | | | | | | | | | | | | | | | | | | | | | | | | | | | | | | | | | |
| Shares sold | | | N/A | | | | N/A | | | | 1,244 | | | | 3,742 | | | | N/A | | | | 225 | | | | 1,431 | | | | N/A | | | | N/A | | | |
| Reinvested dividends and distributions | | | N/A | | | | N/A | | | | 522 | | | | 22 | | | | N/A | | | | 171 | | | | 26 | | | | N/A | | | | N/A | | | |
| Shares repurchased | | | N/A | | | | N/A | | | | (1,540) | | | | (2,004) | | | | N/A | | | | (273) | | | | (937) | | | | N/A | | | | N/A | | | |
| Net Increase/(Decrease) in Fund Shares | | | N/A | | | | N/A | | | | 226 | | | | 1,760 | | | | N/A | | | | 123 | | | | 520 | | | | N/A | | | | N/A | | | |
| Shares Outstanding, Beginning of Period | | | N/A | | | | N/A | | | | 7,232 | | | | 5,472 | | | | N/A | | | | 1,550 | | | | 1,030 | | | | N/A | | | | N/A | | | |
| Shares Outstanding, End of Period | | | N/A | | | | N/A | | | | 7,458 | | | | 7,232 | | | | N/A | | | | 1,673 | | | | 1,550 | | | | N/A | | | | N/A | | | |
| Transactions in Fund Shares – Class S Shares: | | | | | | | | | | | | | | | | | | | | | | | | | | | | | | | | | | | | | | |
| Shares sold | | | – | | | | 1 | | | | 6,075 | | | | 16,525 | | | | 1 | | | | 529 | | | | 2,690 | | | | – | | | | 334 | | | |
| Reinvested dividends and distributions | | | 3 | | | | 1 | | | | 3,106 | | | | 188 | | | | – | | | | 539 | | | | 100 | | | | 17 | | | | 8 | | | |
| Shares repurchased | | | – | | | | (4) | | | | (6,192) | | | | (11,351) | | | | – | | | | (855) | | | | (965) | | | | – | | | | – | | | |
| Net Increase/(Decrease) in Fund Shares | | | 3 | | | | (2) | | | | 2,989 | | | | 5,362 | | | | 1 | | | | 213 | | | | 1,825 | | | | 17 | | | | 342 | | | |
| Shares Outstanding, Beginning of Period | | | 48 | | | | 50 | | | | 35,306 | | | | 29,944 | | | | – | | | | 4,289 | | | | 2,464 | | | | 342 | | | | – | | | |
| Shares Outstanding, End of Period | | | 51 | | | | 48 | | | | 38,295 | | | | 35,306 | | | | 1 | | | | 4,502 | | | | 4,289 | | | | 359 | | | | 342 | | | |
Janus Value Funds | 111
Notes to Financial Statements (unaudited) (continued)
| | | | | | | | | | | | | | | | | | | | | | | | | | | | | | | | | | | | | | | |
For the six-month period ended December 31, 2011
| | Perkins Large Cap
| | | Perkins Mid Cap
| | | Perkins Select
| | | Perkins Small Cap
| | | Perkins Value Plus
| | | |
(unaudited) and the fiscal year ended June 30, 2011 (all
| | Value Fund | | | Value Fund | | | Value Fund | | | Value Fund | | | Income Fund | | | |
| numbers in thousands) | | 2011 | | | 2011 | | | 2011 | | | 2011 | | | 2011(1) | | | 2011 | | | 2011 | | | 2011 | | | 2011(2) | | | |
| |
| Transactions in Fund Shares – Class T Shares: | | | | | | | | | | | | | | | | | | | | | | | | | | | | | | | | | | | | | | |
| Shares sold | | | 38 | | | | 126 | | | | 23,474 | | | | 74,154 | | | | 21 | | | | 2,472 | | | | 17,272 | | | | 31 | | | | 450 | | | |
| Reinvested dividends and distributions | | | 11 | | | | 3 | | | | 26,055 | | | | 2,351 | | | | – | | | | 5,817 | | | | 1,505 | | | | 22 | | | | 10 | | | |
| Shares repurchased | | | (26) | | | | (23) | | | | (53,597) | | | | (105,939) | | | | – | | | | (10,232) | | | | (16,645) | | | | (80) | | | | (9) | | | |
| Net Increase/(Decrease) in Fund Shares | | | 23 | | | | 106 | | | | (4,068) | | | | (29,434) | | | | 21 | | | | (1,943) | | | | 2,132 | | | | (27) | | | | 451 | | | |
| Shares Outstanding, Beginning of Period | | | 157 | | | | 51 | | | | 328,987 | | | | 358,421 | | | | – | | | | 50,441 | | | | 48,309 | | | | 451 | | | | – | | | |
| Shares Outstanding, End of Period | | | 180 | | | | 157 | | | | 324,919 | | | | 328,987 | | | | 21 | | | | 48,498 | | | | 50,441 | | | | 424 | | | | 451 | | | |
| | | |
| (1) | | Period from December 15, 2011 (inception date) through December 31, 2011. |
| (2) | | Period from July 30, 2010 (inception date) through June 30, 2011. |
112 | DECEMBER 31, 2011
| |
| 8. | Purchases and Sales of Investment Securities |
For the period ended December 31, 2011, the aggregate cost of purchases and proceeds from sales of investment securities (excluding any short-term securities, short-term options contracts, and in-kind transactions) was as follows:
| | | | | | | | | | | | | | | |
| | | | | | | Purchases of Long-
| | Proceeds from Sales
| | |
| | | Purchases of
| | Proceeds from Sales
| | Term U.S. Government
| | of Long-Term U.S.
| | |
| Fund | | Securities | | of Securities | | Obligations | | Government Obligations | | |
| |
| Perkins Large Cap Value Fund | | $ | 29,429,867 | | $ | 27,523,211 | | $ | – | | $ | – | | |
| Perkins Mid Cap Value Fund | | | 3,373,803,722 | | | 4,229,239,964 | | | – | | | – | | |
| Perkins Select Value Fund | | | 36,911,298 | | | – | | | – | | | – | | |
| Perkins Small Cap Value Fund | | | 808,249,684 | | | 1,025,781,663 | | | – | | | – | | |
| Perkins Value Plus Income Fund | | | 17,416,606 | | | 12,945,728 | | | 6,597,729 | | | 7,331,137 | | |
| |
| |
| |
| 9. | New Accounting Pronouncements |
In May 2011, the FASB issued Accounting Standards Update, “Amendments to Achieve Common Fair Value Measurement and Disclosure Requirements.” The Accounting Standards Update requires disclosures about amounts and reasons for all transfers in and out of Level 1 and Level 2 fair value measurements. In addition, the Accounting Standards Update will require reporting entities to disclose the following information for fair value measurements categorized with Level 3 of the fair value hierarchy: quantitative information about the unobservable inputs used in the fair value measurement, the valuation processes used by the reporting entity, and a narrative description of the sensitivity of the fair value measurement to changes in unobservable inputs and the interrelationships between those unobservable inputs. This disclosure is effective for fiscal years beginning after December 15, 2011, and for interim periods within those fiscal years. The adoption of this Accounting Standards Update did not have any impact on the Funds’ financial position or the results of its operations.
Management has evaluated whether any other events or transactions occurred subsequent to December 31, 2011 and through the date of issuance of the Funds’ financial statements and determined that there were no material events or transactions that would require recognition or disclosure in the Funds’ financial statements.
Janus Value Funds | 113
Additional Information (unaudited)
Proxy Voting Policies and Voting Record
A description of the policies and procedures that the Funds use to determine how to vote proxies relating to their portfolio securities is available without charge: (i) upon request, by calling 1-800-525-0020 (toll free); (ii) on the Funds’ website at janus.com/proxyvoting; and (iii) on the SEC’s website at http://www.sec.gov. Additionally, information regarding each Fund’s proxy voting record for the most recent twelve-month period ended June 30 is also available, free of charge, through janus.com/proxyvoting and from the SEC’s website at http://www.sec.gov.
Quarterly Portfolio Holdings
The Funds file their complete portfolio holdings (schedule of investments) with the SEC for the first and third quarters of each fiscal year on Form N-Q within 60 days of the end of such fiscal quarter. The Funds’ Form N-Q: (i) is available on the SEC’s website at http://www.sec.gov; (ii) may be reviewed and copied at the SEC’s Public Reference Room in Washington, D.C. (information on the Public Reference Room may be obtained by calling 1-800-SEC-0330); and (iii) is available without charge, upon request, by calling Janus at 1-800-525-0020 (toll free).
APPROVAL OF ADVISORY AGREEMENTS DURING THE PERIOD
The Trustees of Janus Investment Fund, none of whom has ever been affiliated with Janus Capital and each of whom serves as an “independent” Trustee (the “Trustees”), oversee the management of each Fund and, as required by law, determine annually whether to continue the investment advisory agreement for each Fund and the subadvisory agreements for the nine Funds that utilize subadvisers.
In connection with their most recent consideration of those agreements for each Fund, the Trustees received and reviewed a substantial amount of information provided by Janus Capital and the respective subadvisers in response to requests of the Trustees and their independent legal counsel. They also received and reviewed a considerable amount of information and analysis provided by, and at the request of, their independent fee consultant. Throughout their consideration of the agreements, the Trustees were advised by their independent legal counsel. The Trustees met with management to consider the agreements, and also met separately in executive session with their independent legal counsel and their independent fee consultant.
At a meeting held on December 8, 2011, based on the Trustees’ evaluation of the information provided by Janus Capital, the subadvisers and the independent fee consultant, as well as other information, the Trustees determined that the overall arrangements between each Fund and Janus Capital and each subadviser, as applicable, were fair and reasonable in light of the nature, extent and quality of the services provided by Janus Capital, its affiliates and the subadvisers, the fees charged for those services, and other matters that the Trustees considered relevant in the exercise of their business judgment. At that meeting, the Trustees unanimously approved the continuation of the investment advisory agreement for each Fund, and the subadvisory agreement for each subadvised Fund, for the period from February 1, 2012 through February 1, 2013, subject to earlier termination as provided for in each agreement.
In considering the continuation of those agreements, the Trustees reviewed and analyzed various factors that they determined were relevant, including the factors described below, none of which by itself was considered dispositive. However, the material factors and conclusions that formed the basis for the Trustees’ determination to approve the continuation of the agreements are discussed separately below.
Nature, Extent and Quality of Services
The Trustees reviewed the nature, extent and quality of the services provided by Janus Capital and the subadvisers to the Funds, taking into account the investment objective and strategy of each Fund and the knowledge the Trustees gained from their regular meetings with management on at least a quarterly basis and their ongoing review of information related to the Funds. In addition, the Trustees reviewed the resources and key personnel of Janus Capital and each subadviser, particularly noting those employees who provide investment and risk management services to the Funds. The Trustees also considered other services provided to the Funds by Janus Capital or the subadvisers, such as managing the execution of portfolio transactions and the selection of broker-dealers for those transactions. The Trustees considered Janus Capital’s role as administrator to the Funds, noting that Janus Capital does not receive a fee for its services but is reimbursed for its out-of-pocket costs. The Trustees considered the role of Janus Capital in monitoring adherence to the Funds’ investment restrictions, providing support services for the Trustees and Trustee committees, communicating with shareholders and overseeing the activities of other service providers, including monitoring compliance with various policies and procedures of the Funds and with applicable securities laws and regulations.
114 | DECEMBER 31, 2011
The Trustees concluded that the nature, extent and quality of the services provided by Janus Capital or the subadviser to each Fund were appropriate and consistent with the terms of the respective advisory and subadvisory agreements, and that, taking into account steps taken to address those Funds whose performance lagged that of their peers for certain periods, the quality of those services had been consistent with or superior to quality norms in the industry and the Funds were likely to benefit from the continued provision of those services. They also concluded that Janus Capital and each subadviser had sufficient personnel, with the appropriate education and experience, to serve the Funds effectively and had demonstrated its continuing ability to attract well-qualified personnel.
Performance of the Funds
The Trustees considered the performance results of each Fund over various time periods. They reviewed information comparing each Fund’s performance with the performance of comparable funds and peer groups identified by Lipper, and with the Fund’s benchmark index. They concluded that the performance of various Funds was good to very good under current market conditions. Although the performance of other Funds lagged that of their peers for certain periods, the Trustees also concluded that Janus Capital had taken or was taking appropriate steps to address those instances of under-performance.
Costs of Services Provided
The Trustees examined information regarding the fees and expenses of each Fund in comparison to similar information for other comparable funds as provided by Lipper. They also reviewed an analysis of that information provided by their independent fee consultant and noted that the rate of management (investment advisory and any administration) fees for most of the Funds, after applicable contractual expense limitations, was below the mean management fee rate of the respective peer group of funds selected by Lipper.
The Trustees considered the methodology used by Janus Capital and each subadviser in determining compensation payable to portfolio managers, the competitive environment for investment management talent and the competitive market for mutual funds in different distribution channels. They concluded that the compensation methodology provided a good alignment of the interests of the portfolio managers with the interests of Fund shareholders.
The Trustees also reviewed management fees charged by Janus Capital and each subadviser to their separate account clients and to non-affiliated funds subadvised by Janus Capital or by a subadviser (for which Janus Capital provides only portfolio management services). Although in most instances subadvisory and separate account fee rates for various investment strategies were lower than management fee rates for Funds having a similar strategy, the Trustees noted that, under the terms of the management agreements with the Funds, Janus Capital performs significant additional services for the Funds that it does not provide to those other clients, including administration services, oversight of the Funds’ other service providers, trustee support, regulatory compliance and numerous other services, and that, in serving the Funds, Janus Capital assumes many legal risks that it does not assume in servicing its other clients. Moreover, they noted that the spread between the average fee rates charged to the Funds and the fee rates that Janus Capital charged to its separate account clients was smaller than the average spread for such fee rates of other advisers, based on publicly available data and research conducted by the Trustees’ independent fee consultant.
The Trustees reviewed information on the profitability to Janus Capital and its affiliates of their relationships with each Fund, as well as an explanation of the methodology utilized in allocating various expenses of Janus Capital and its affiliates among the Funds and other clients. The Trustees also reviewed the financial statements and corporate structure of Janus Capital’s parent company. In their review, the Trustees considered whether Janus Capital and each subadviser receive adequate incentives to manage the Funds effectively. The Trustees recognized that profitability comparisons among fund managers are difficult because very little comparative information is publicly available and the profitability of any fund manager is affected by numerous factors, including the organizational structure of the particular fund manager, the types of funds and other accounts it manages, possible other lines of business, the methodology for allocating expenses and the fund manager’s capital structure and cost of capital. However, taking into account those factors and the analysis provided by the Trustees’ independent fee consultant, and based on the information available, the Trustees concluded that Janus Capital’s profitability with respect to each Fund in relation to the services rendered was not unreasonable.
The Trustees concluded that the management fees and other compensation payable by each Fund to Janus Capital and its affiliates, as well as the fees paid by Janus Capital to the subadvisers of subadvised Funds, were reasonable in relation to the nature, extent and quality of the services provided, taking into account the fees charged by other advisers for managing comparable mutual funds with similar strategies, the fees Janus Capital and the subadvisers charge to other clients, and, as applicable, the impact of fund performance on fees
Janus Value Funds | 115
Additional Information (unaudited) (continued)
payable by the Funds. The Trustees also concluded that the overall expense ratio of each Fund was reasonable, taking into account the size of the Fund, the quality of services provided by Janus Capital and any subadviser, the investment performance of the Fund and any expense limitations agreed to by Janus Capital.
Economies of Scale
The Trustees considered information about the potential for Janus Capital to realize economies of scale as the assets of the Funds increase. They noted that, although many Funds pay advisory fees at a fixed rate as a percentage of net assets, without any breakpoints, the actual management fee rate paid by most of the Funds, after any contractual expense limitations, was below the mean management fee rate of the Fund’s peer group identified by Lipper; and, for those Funds whose expenses are being reduced by the contractual expense limitations of Janus Capital, Janus Capital is subsidizing the Funds because they have not reached adequate scale. Moreover, as the assets of many of the Funds have declined in the past few years, certain Funds have benefited from having advisory fee rates that have remained constant rather than increasing as assets declined. In addition, performance fee structures have been implemented for various Funds that have caused or will cause the effective rate of advisory fees payable by such a Fund to vary depending on the investment performance of the Fund relative to its benchmark index over the measurement period; and a few Funds have fee schedules with breakpoints and reduced fee rates above certain asset levels. The Trustees also noted that the Funds share directly in economies of scale through the lower charges of third-party service providers that are based in part on the combined scale of all of the Funds. Based on all of the information they reviewed, including research and analysis conducted by the Trustees’ independent fee consultant, the Trustees concluded that the current fee structure of each Fund was reasonable and that the current rates of fees do reflect a sharing between Janus Capital and the Fund of economies of scale at the current asset level of the Fund.
Other Benefits to Janus Capital
The Trustees also considered benefits that accrue to Janus Capital and its affiliates from their relationships with the Funds. They recognized that two affiliates of Janus Capital separately serve the Funds as transfer agent and distributor, respectively, and the transfer agent receives compensation directly from the non-money market funds for services provided. The Trustees also considered Janus Capital’s past and proposed use of commissions paid by the Funds on their portfolio brokerage transactions to obtain proprietary and third-party research products and services benefiting the Fund and/or other clients of Janus Capital. The Trustees concluded that Janus Capital’s use of these types of client commission arrangements to obtain proprietary and third-party research products and services was consistent with regulatory requirements and guidelines and was likely to benefit each Fund. The Trustees also concluded that, other than the services provided by Janus Capital and its affiliates pursuant to the agreements and the fees to be paid by each Fund therefor, the Funds and Janus Capital may potentially benefit from their relationship with each other in other ways. They concluded that Janus Capital benefits from the receipt of research products and services acquired through commissions paid on portfolio transactions of the Funds and that the Funds benefit from Janus Capital’s receipt of those products and services as well as research products and services acquired through commissions paid by other clients of Janus Capital. They further concluded that success of any Fund could attract other business to Janus Capital or other Janus funds, and that the success of Janus Capital could enhance Janus Capital’s ability to serve the Funds.
After full consideration of the above factors, as well as other factors, the Trustees, each of whom is an independent Trustee, concluded at their December 8, 2011 meeting that the proposed continuation of the investment advisory agreement and, if applicable, the subadvisory agreement for each Fund for another year was in the best interest of the respective Funds and their shareholders.
FOR PERKINS SELECT VALUE FUND
The Trustees of Janus Investment Fund, each of whom serves as an “independent” Trustee (the “Trustees”), and none of whom has ever been affiliated with Janus Capital or Perkins Investment Management LLC (“Perkins”), the investment adviser and subadviser, respectively, of Perkins Select Value Fund (the “New Fund”), considered the proposed investment advisory agreement and subadvisory agreement for the New Fund at a meeting held on September 14, 2011. In the course of their consideration of those agreements, the Trustees met in executive session and were advised by their independent legal counsel. The Trustees received and reviewed a substantial amount of information provided by Janus Capital and Perkins in response to requests of the Trustees and their counsel, and also considered information provided by their independent fee consultant. Throughout their consideration of the agreement, the Trustees were advised by their independent legal counsel. The Trustees met with management to consider the agreement, and also met separately with their independent legal counsel. Based on the Trustees’ evaluation of information provided to them, as well as other information, including information
116 | DECEMBER 31, 2011
previously provided to them by Janus Capital in connection with their consideration of the continuation of other investment advisory agreements entered into with Janus Capital on behalf of other Funds, the Trustees unanimously approved the investment advisory agreement and subadvisory agreement for the New Fund for an initial term through February 1, 2013, subject to earlier termination as provided for in each agreement.
In considering the agreements and reaching their conclusions, the Trustees reviewed and analyzed various factors that they determined were relevant, including the factors described below, none of which by itself was considered dispositive.
Nature, Extent and Quality of Services
The Trustees reviewed the nature, extent, and quality of the services to be provided by Janus Capital and Perkins, taking into account the investment objective and strategy of the New Fund. In addition, the Trustees reviewed the resources and key personnel of Janus Capital and Perkins that will be providing investment and risk management services to the New Fund. The Trustees also considered other services provided to the New Fund by Janus Capital, such as managing the execution of portfolio transactions and the selection of broker-dealers for those transactions, and the involvement of Perkins in trade executions and the broker selection process. The Trustees considered Janus Capital’s role as administrator to the New Fund, noting that Janus Capital does not receive a fee for its services but is reimbursed for its out-of-pocket costs. The Trustees considered the role of each of Janus Capital and Perkins in monitoring adherence to the New Fund’s investment restrictions, providing support services for the Trustees and Trustee committees, communicating with shareholders and overseeing the activities of other service providers, including monitoring compliance with various Fund policies and procedures and with applicable securities laws and regulations.
The Trustees concluded that the nature, extent, and quality of the services to be provided by Janus Capital and Perkins were appropriate and consistent with the terms of the proposed investment advisory agreement and subadvisory agreement. They also concluded that each of Janus Capital and Perkins had sufficient personnel, with the appropriate education and experience, to serve the New Fund effectively.
Costs of Services Provided
The Trustees noted the information regarding the proposed fees and expenses of the New Fund in comparison to similar information for other comparable funds. The Trustees noted that they had previously reviewed management fees charged by Janus Capital and Perkins to their separate account clients and to non-affiliated funds subadvised by Janus Capital (for which Janus Capital provides only portfolio management services). The Trustees noted servicing that is provided by Janus Capital for the New Fund relative to those other clients, including regulatory compliance and administration services, and that, in serving the New Fund, Janus Capital assumes many legal risks that it does not assume in servicing its other clients.
The Trustees concluded that the advisory fee paid by the New Fund and the subadvisory fee payable by Janus Capital to Perkins was reasonable in relation to the nature, extent and quality of the services to be provided, taking into account the fees charged by other advisers for managing comparable mutual funds with similar strategies, the fees Janus Capital and Perkins charges to other clients, and the expense limitation agreement agreed to by Janus Capital.
Economies of Scale
The Trustees considered information about the potential for Janus Capital and Perkins to realize economies of scale as the assets of the New Fund increases. The Trustees noted that the New Fund is part of the overall Janus funds complex, which means, among other things, that the New Fund may share directly in economies of scale through the lower charges of third-party service providers that are based in part on the combined scale of all of the Janus funds.
Other Benefits to Janus Capital
The Trustees also considered benefits that accrue to Janus Capital, Perkins, and their affiliates from their relationship with the New Fund. They recognized that two affiliates of Janus Capital separately serve the New Fund as transfer agent and distributor, respectively. They also considered Janus Capital’s proposed use of commissions to be paid by the New Fund on its portfolio brokerage transactions to obtain proprietary and third-party research products and services benefiting the New Fund and/or other clients of Janus Capital. The Trustees concluded that Janus Capital’s use of these types of client commission arrangements to obtain proprietary and third-party research products and services was consistent with regulatory requirements and guidelines and was likely to benefit the New Fund. The Trustees also concluded that, other than the services provided by Janus Capital and its affiliates pursuant to the agreements and the fees to be paid by the New Fund therefor, the New Fund, Janus Capital, and Perkins may potentially benefit from their relationship with each other in other ways. They concluded that Janus Capital and Perkins may benefit from the receipt of research products and services acquired through commissions paid on portfolio transactions of the
Janus Value Funds | 117
Additional Information (unaudited) (continued)
New Fund, and that the New Fund benefits from Janus Capital’s receipt of those products and services, as well as research products and services acquired through commissions paid by other clients of Janus Capital. They further concluded that success of the New Fund could attract other business to Janus Capital, Perkins, or other Funds, and that the success of Janus Capital and Perkins could enhance Janus Capital’s and Perkins’ ability to serve the New Fund.
After full consideration of the above factors, as well as other factors, all of the Trustees, all of whom are independent Trustees, concluded that approval of the New Fund’s agreements were in the best interest of the New Fund and its shareholders.
118 | DECEMBER 31, 2011
Explanations of Charts, Tables and
Financial Statements (unaudited)
Performance overview graphs compare the performance of a hypothetical $10,000 investment in each Fund (from inception) with one or more widely used market indices. The hypothetical example does not represent the returns of any particular investment.
When comparing the performance of a Fund with an index, keep in mind that market indices do not include brokerage commissions that would be incurred if you purchased the individual securities in the index. They also do not include taxes payable on dividends and interest or operating expenses incurred if you maintained a Fund invested in the index.
Average annual total returns are also quoted for each Fund. Average annual total return is calculated by taking the growth or decline in value of an investment over a period of time, including reinvestment of dividends and distributions, then calculating the annual compounded percentage rate that would have produced the same result had the rate of growth been constant throughout the period. Average annual total return does not reflect the deduction of taxes that a shareholder would pay on Fund distributions or redemptions of Fund shares.
Pursuant to federal securities rules, expense ratios shown in the performance chart reflect subsidized and unsubsidized ratios for the prior fiscal year. The total annual fund operating expenses ratio is gross of any fee waivers, reflecting a Fund’s unsubsidized expense ratio. The net annual fund operating expenses ratio (if applicable) includes contractual waivers of Janus Capital and reflects a Fund’s subsidized expense ratio. Both the total annual fund operating expenses ratio and net annual fund operating expenses ratio are based on average net assets as of the fiscal year ended June 30, 2011 for all Funds except Perkins Select Value Fund, which are estimated for the fiscal year. The ratios also include expenses indirectly incurred by a Fund as a result of investing in other investment companies or pooled investments, which are not reflected in the “Financial Highlights” of this report. As a result, these ratios may be higher or lower than those shown in the “Financial Highlights” in this report. All expenses are shown without the effect of expense offset arrangements. Pursuant to such arrangements, credits realized as a result of uninvested cash balances are used to reduce custodian and transfer agent expenses.
| |
| 2. | Schedules of Investments |
Following the performance overview section is each Fund’s Schedule of Investments. This schedule reports the industry concentrations and types of securities held in each Fund on the last day of the reporting period. Securities are usually listed by type (common stock, corporate bonds, U.S. Government obligations, etc.) and by industry classification (banking, communications, insurance, etc.). Holdings are subject to change without notice.
The value of each security is quoted as of the last day of the reporting period. The value of securities denominated in foreign currencies is converted into U.S. dollars.
If a Fund invests in foreign securities, it will also provide a summary of investments by country. This summary reports each Fund’s exposure to different countries by providing the percentage of securities invested in each country. The country of each security represents the country in which the company is incorporated. Each Fund’s Schedule of Investments relies upon the industry group and country classifications published by Bloomberg L.P.
2a. Futures
A table listing futures contracts follows each Fund’s Schedule of Investments (if applicable). Futures contracts are contracts that obligate the buyer to receive and the seller to deliver an instrument or money at a specified price on a specified date. Futures are used to hedge against adverse movements in securities prices, currency risk or interest rates.
The table provides the name of the contract, number of contracts held, the expiration date, the principal amount, value and the amount of unrealized gain or loss. The amount of unrealized gain or loss reflects the marked-to-market amount for the last day of the reporting period.
2b. Options
A table listing written options contracts follows each Fund’s Schedule of Investments (if applicable). Written options contracts are contracts that obligate a Fund to sell or purchase an underlying security at a fixed price, upon exercise of the option. Options are used to hedge against adverse movements in securities prices, currency risk or interest rates.
The table provides the name of the contract, number of contracts held, the expiration date, exercise price, value and premiums received.
| |
| 3. | Statements of Assets and Liabilities |
These statements are often referred to as the “balance sheets.” It lists the assets and liabilities of the Funds on the last day of the reporting period.
The Funds’ assets are calculated by adding the value of the securities owned, the receivable for securities sold but not yet settled, the receivable for dividends declared but
Janus Value Funds | 119
Explanations of Charts, Tables and
Financial Statements (unaudited) (continued)
not yet received on stocks owned and the receivable for Fund shares sold to investors but not yet settled. The Funds’ liabilities include payables for securities purchased but not yet settled, Fund shares redeemed but not yet paid and expenses owed but not yet paid. Additionally, there may be other assets and liabilities such as unrealized gain or loss on forward currency contracts.
The section entitled “Net Assets Consist of” breaks down the components of the Funds’ net assets. Because the Funds must distribute substantially all earnings, you will notice that a significant portion of net assets is shareholder capital.
The last section of this statement reports the net asset value (“NAV”) per share on the last day of the reporting period. The NAV is calculated by dividing the Funds’ net assets (assets minus liabilities) by the number of shares outstanding.
| |
| 4. | Statements of Operations |
These statements detail the Funds’ income, expenses, gains and losses on securities and currency transactions, and appreciation or depreciation of current Fund holdings.
The first section in this statement, entitled “Investment Income,” reports the dividends earned from stocks and interest earned from interest-bearing securities in the Funds.
The next section reports the expenses incurred by the Funds, including the advisory fee paid to the investment adviser, transfer agent fees and expenses, and printing and postage for mailing statements, financial reports and prospectuses. Expense offsets and expense reimbursements, if any, are also shown.
The last section lists the increase or decrease in the value of securities held in the Funds. The Funds will realize a gain (or loss) when they sell their position in a particular security. An unrealized gain (or loss) refers to the change in net appreciation or depreciation of the Funds during the reporting period. “Net Realized and Unrealized Gain/(Loss) on Investments” is affected both by changes in the market value of Fund holdings and by gains (or losses) realized during the reporting period.
| |
| 5. | Statements of Changes in Net Assets |
These statements report the increase or decrease in the Funds’ net assets during the reporting period. Changes in the Funds’ net assets are attributable to investment operations, dividends, distributions and capital share transactions. This is important to investors because it shows exactly what caused the Funds’ net asset size to change during the period.
The first section summarizes the information from the Statements of Operations regarding changes in net assets due to the Funds’ investment performance. The Funds’ net assets may also change as a result of dividend and capital gains distributions to investors. If investors receive their dividends in cash, money is taken out of the Funds to pay the distribution. If investors reinvest their dividends, the Funds’ net assets will not be affected. If you compare each Fund’s “Net Decrease from Dividends and Distributions” to the “Reinvested dividends and distributions,” you will notice that dividend distributions had little effect on each Fund’s net assets. This is because the majority of Janus investors reinvest their distributions.
The reinvestment of dividends is included under “Capital Share Transactions.” “Capital Shares” refers to the money investors contribute to the Funds through purchases or withdrawals via redemptions. The Funds’ net assets will increase and decrease in value as investors purchase and redeem shares from the Funds.
This schedule provides a per-share breakdown of the components that affect each Fund’s NAV for current and past reporting periods. Not only does this table provide you with total return, it also reports total distributions, asset size, expense ratios and portfolio turnover rate.
The first line in the table reflects the NAV per share at the beginning of the reporting period. The next line reports the net investment income per share, which comprises dividends and interest income earned on securities held by the Funds. Following is the total of gains/(losses), realized and unrealized. Dividends and distributions are then subtracted to arrive at the NAV per share at the end of the period. The next line reflects the average annual total return reported the last day of the period. The total return may include adjustments in accordance with generally accepted accounting principles. As a result, the total return may differ from the total return reflected for shareholder transactions.
Also included are the expense ratios, or the percentage of average net assets that were used to cover operating expenses during the period. Expense ratios vary across the Funds within the Trust for a number of reasons, including the differences in management fees, the frequency of dividend payments and the extent of foreign investments, which entail greater transaction costs.
The Funds’ expenses may be reduced through expense-reduction arrangements. These arrangements may include the use of balance credits or transfer agent fee offsets. The Statements of Operations reflect total expenses before any such offset, the amount of the offset and the net expenses. The expense ratios listed in the Financial
120 | DECEMBER 31, 2011
Highlights reflect total expenses prior to any expense offset (gross expense ratio) and after the expense offsets (net expense ratio). Both expense ratios reflect expenses after waivers (reimbursements), if applicable.
The ratio of net investment income/(loss) summarizes the income earned less expenses, divided by the average net assets of a Fund during the reporting period. Don’t confuse this ratio with a Fund’s yield. The net investment income ratio is not a true measure of a Fund’s yield because it doesn’t take into account the dividends distributed to the Fund’s investors.
The next figure is the portfolio turnover rate, which measures the buying and selling activity in a Fund. Portfolio turnover is affected by market conditions, changes in the asset size of a Fund, fluctuating volume of shareholder purchase and redemption orders, the nature of the Fund’s investments and the investment style and/or outlook of the portfolio managers. A 100% rate implies that an amount equal to the value of the entire portfolio was replaced once during the fiscal year; a 50% rate means that an amount equal to the value of half the portfolio is traded in a year; and a 200% rate means that an amount equal to the value of the entire portfolio is traded every six months.
Janus Value Funds | 121
Janus provides access to a wide range of investment disciplines.
Alternative
Janus alternative funds seek to deliver strong risk-adjusted returns over a full market cycle with lower correlation to equity markets than traditional investments.
Asset Allocation
Janus’ asset allocation funds utilize our fundamental, bottom-up research to balance risk over the long term. From fund options that meet investors’ risk tolerance and objectives to a method that incorporates non-traditional investment choices to seek non-correlated sources of risk and return, Janus’ asset allocation funds aim to allocate risk more effectively.
Fixed Income
Janus fixed income funds attempt to provide less risk relative to equities while seeking to deliver a competitive total return through high current income and appreciation. Janus money market funds seek capital preservation and liquidity with current income as a secondary objective.
Global & International
Janus global and international funds seek to leverage Janus’ research capabilities by taking advantage of inefficiencies in foreign markets, where accurate information and analytical insight are often at a premium.
Growth & Core
Janus growth funds focus on companies believed to be the leaders in their respective industries, with solid management teams, expanding market share, margins and efficiencies. Janus core funds seek investments in more stable and predictable companies. Our core funds look for a strategic combination of steady growth and, for certain funds, some degree of income.
Mathematical
Our mathematical funds seek to outperform their respective indices while maintaining a risk profile equal to or lower than the index itself. Managed by INTECH (a Janus subsidiary), these funds use a mathematical process in an attempt to build a more “efficient” portfolio than the index.
Value
Our value funds, managed by Perkins (a Janus subsidiary), seek to identify companies with favorable reward to risk characteristics by conducting rigorous downside analysis before determining upside potential.
For more information about our funds, contact your investment professional or go to janus.com/advisor/mutual-funds (or janus.com/allfunds if you hold Shares directly with Janus).
Please consider the charges, risks, expenses and investment objectives carefully before investing. For a prospectus or, if available, a summary prospectus containing this and other information, please call Janus at 877.33JANUS (52687) (or 800.525.3713 if you hold Shares directly with Janus); or download the file from janus.com/info (or janus.com/reports if you hold Shares directly with Janus). Read it carefully before you invest or send money.
Funds distributed by Janus Distributors LLC (02/12)
Investment products offered are: NOT FDIC-INSURED MAY LOSE VALUE NO BANK GUARANTEE
| |
| C-0112-127 | 125-24-93007 02-12 |
Item 2 — Code of Ethics
| | | | Not applicable to semiannual reports. |
Item 3 — Audit Committee Financial Expert
| | | | Not applicable to semiannual reports. |
Item 4 — Principal Accountant Fees and Services
| | | | Not applicable to semiannual reports. |
Item 5 — Audit Committee of Listed Registrants
Item 6 — Investments
| | (a) | | Please see Schedule of Investments contained in the Reports to Shareholders included under Item 1 of this Form N-CSR. |
| | (b) | | Using credible information that is available to the public, the Funds have not divested from any securities of any issuers that conduct or have direct investments in certain business operations in Sudan or Iran in accordance with Section 13(c) of the Investment Company Act of 1940. |
Item 7 — Disclosure of Proxy Voting Policies and Procedures for Closed-End Management Investment Companies
Item 8 — Portfolio Managers of Closed-End Management Investment Companies
Item 9 — Purchases of Equity Securities by Closed-End Management Investment Company and Affiliated Purchasers
Item 10 — Submission of Matters to a Vote of Security Holders
| | | | There have been no material changes to the procedures by which shareholders may recommend nominees to the Registrant’s Board of Trustees. |
Item 11 — Controls and Procedures
| | (a) | | The Registrant’s Principal Executive Officer and Principal Financial Officer have evaluated the Registrant’s disclosure controls and procedures (as defined in Rule 30a-3(c) under the Investment Company Act of 1940, as amended) within 90 days of this filing and have concluded that the Registrant’s disclosure controls and procedures were effective, as of that date. |
| |
| | (b) | | There have been no changes in the Registrant’s internal control over financial reporting (as defined in Rule 30a-3(d) under the Investment Company Act of 1940, as amended) that occurred during the Registrant’s second fiscal quarter of the period covered by this report that have materially affected, or are reasonably likely to materially affect, the Registrant’s internal control over financial reporting. |
Item 12 — Exhibits
| | | | | |
|
| | | (a)(1) | | Not applicable because the Registrant has posted its Code of Ethics (as defined in Item 2(b) of Form N-CSR) on its website pursuant to paragraph (f)(2) of Item 2 of Form N-CSR. |
| | | (a)(2) | | Separate certifications for the Registrant’s Principal Executive Officer and Principal Financial Officer, as required by Section 302 of the Sarbanes-Oxley Act of 2002 and Rule 30a-2(a) under the Investment Company Act of 1940, as amended, are attached as Ex99.CERT. |
| | | (a)(3) | | Not applicable to open-end companies. |
| | (b) | | A certification for the Registrant’s Principal Executive Officer and Principal Financial Officer, as required by Rule 30a-2(b) under the Investment Company Act of 1940, as amended, is attached as Ex99.906CERT. The certification furnished pursuant to this paragraph is not deemed to be “filed” for purposes of Section 18 of the Securities Exchange Act of 1934, as amended, or otherwise subject to the liability of that section. Such certification is not deemed to be incorporated by reference into any filing under |
| | | | the Securities Act of 1933, as amended, or the Securities Exchange Act of 1934, as amended, except to the extent that the Registrant specifically incorporates it by reference. |
Signatures
Pursuant to the requirements of the Securities Exchange Act of 1934, as amended, and the Investment Company Act of 1940, as amended, the Registrant has duly caused this report to be signed on its behalf by the undersigned, thereunto duly authorized.
Janus Investment Fund
| | | | | |
|
| By: | | /s/ Robin C. Beery | | |
| | | Robin C. Beery, | | |
| | | President and Chief Executive Officer of Janus Investment Fund | | |
| | | (Principal Executive Officer) | | |
| | | | | |
| Date: | | February 29, 2012 | | |
Pursuant to the requirements of the Securities Exchange Act of 1934, as amended, and the Investment Company Act of 1940, as amended, this report has been signed below by the following persons on behalf of the Registrant and in the capacities and on the dates indicated.
| | | | | |
|
| By: | | /s/ Robin C. Beery | | |
| | | Robin C. Beery, | | |
| | | President and Chief Executive Officer of Janus Investment Fund | | |
| | | (Principal Executive Officer) | | |
| | | | | |
| Date: | | February 29, 2012 | | |
| | | | | |
|
| By: | | /s/ Jesper Nergaard | | |
| | | Jesper Nergaard, | | |
| | | Vice President, Chief Financial Officer, Treasurer and Principal | | |
| | | Accounting Officer of Janus Investment Fund | | |
| | | (Principal Accounting Officer and Principal Financial Officer) | | |
| | | | | |
| Date: | | February 29, 2012 | | |